Broadview Heights, OH Map & Demographics
Broadview Heights Map
Broadview Heights Overview
$58,712
PER CAPITA INCOME
$119,991
AVG FAMILY INCOME
$97,902
AVG HOUSEHOLD INCOME
30.4%
WAGE / INCOME GAP [ % ]
69.6¢/ $1
WAGE / INCOME GAP [ $ ]
0.44
INEQUALITY / GINI INDEX
19,815
TOTAL POPULATION
9,440
MALE POPULATION
10,375
FEMALE POPULATION
90.99
MALES / 100 FEMALES
109.90
FEMALES / 100 MALES
45.0
MEDIAN AGE
2.9
AVG FAMILY SIZE
2.3
AVG HOUSEHOLD SIZE
10,720
LABOR FORCE [ PEOPLE ]
66.2%
PERCENT IN LABOR FORCE
1.6%
UNEMPLOYMENT RATE
Broadview Heights Zip Codes
Income in Broadview Heights
Income Overview in Broadview Heights
Per Capita Income in Broadview Heights is $58,712, while median incomes of families and households are $119,991 and $97,902 respectively.
| Characteristic | Number | Measure |
| Per Capita Income | 19,815 | $58,712 |
| Median Family Income | 5,469 | $119,991 |
| Mean Family Income | 5,469 | $165,170 |
| Median Household Income | 8,396 | $97,902 |
| Mean Household Income | 8,396 | $137,688 |
| Income Deficit | 5,469 | $0 |
| Wage / Income Gap (%) | 19,815 | 30.38% |
| Wage / Income Gap ($) | 19,815 | 69.62¢ per $1 |
| Gini / Inequality Index | 19,815 | 0.44 |
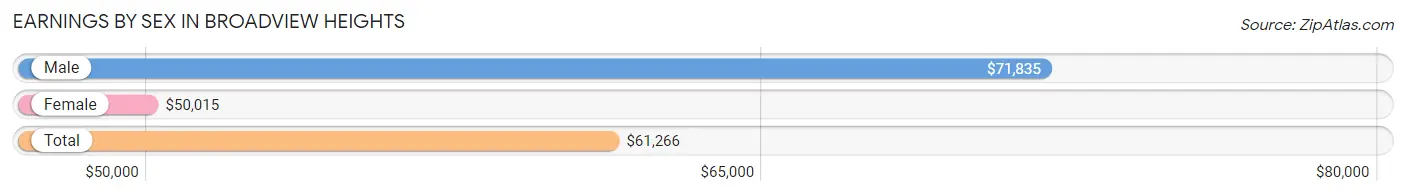
Earnings by Sex in Broadview Heights
Average Earnings in Broadview Heights are $61,266, $71,835 for men and $50,015 for women, a difference of 30.4%.
| Sex | Number | Average Earnings |
| Male | 5,723 (50.0%) | $71,835 |
| Female | 5,716 (50.0%) | $50,015 |
| Total | 11,439 (100.0%) | $61,266 |
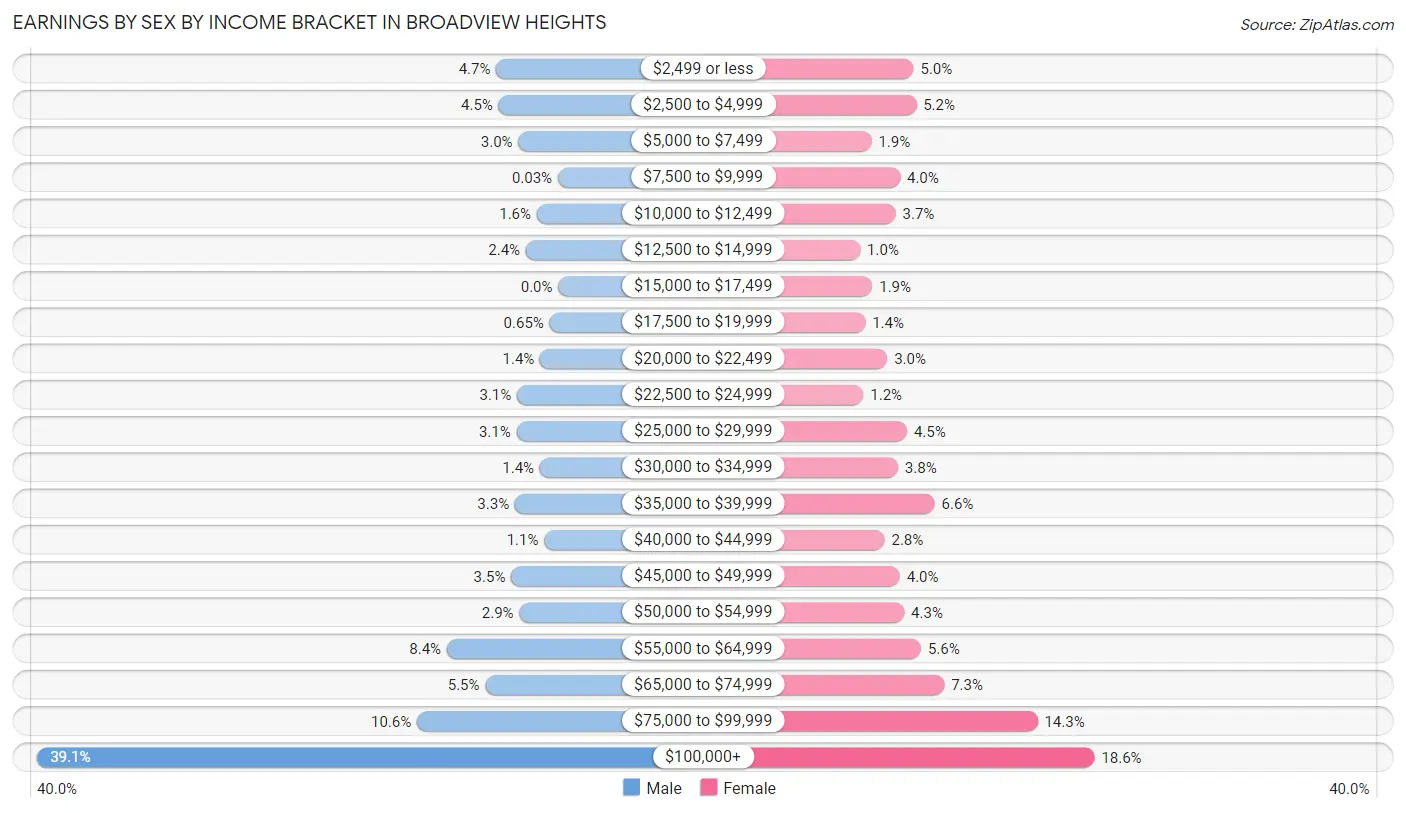
Earnings by Sex by Income Bracket in Broadview Heights
The most common earnings brackets in Broadview Heights are $100,000+ for men (2,235 | 39.1%) and $100,000+ for women (1,061 | 18.6%).
| Income | Male | Female |
| $2,499 or less | 266 (4.6%) | 286 (5.0%) |
| $2,500 to $4,999 | 256 (4.5%) | 297 (5.2%) |
| $5,000 to $7,499 | 171 (3.0%) | 106 (1.8%) |
| $7,500 to $9,999 | 2 (0.0%) | 228 (4.0%) |
| $10,000 to $12,499 | 92 (1.6%) | 209 (3.7%) |
| $12,500 to $14,999 | 139 (2.4%) | 57 (1.0%) |
| $15,000 to $17,499 | 0 (0.0%) | 109 (1.9%) |
| $17,500 to $19,999 | 37 (0.6%) | 79 (1.4%) |
| $20,000 to $22,499 | 78 (1.4%) | 173 (3.0%) |
| $22,500 to $24,999 | 177 (3.1%) | 71 (1.2%) |
| $25,000 to $29,999 | 179 (3.1%) | 258 (4.5%) |
| $30,000 to $34,999 | 79 (1.4%) | 219 (3.8%) |
| $35,000 to $39,999 | 186 (3.3%) | 376 (6.6%) |
| $40,000 to $44,999 | 60 (1.1%) | 162 (2.8%) |
| $45,000 to $49,999 | 202 (3.5%) | 227 (4.0%) |
| $50,000 to $54,999 | 167 (2.9%) | 246 (4.3%) |
| $55,000 to $64,999 | 478 (8.4%) | 318 (5.6%) |
| $65,000 to $74,999 | 313 (5.5%) | 417 (7.3%) |
| $75,000 to $99,999 | 606 (10.6%) | 817 (14.3%) |
| $100,000+ | 2,235 (39.1%) | 1,061 (18.6%) |
| Total | 5,723 (100.0%) | 5,716 (100.0%) |
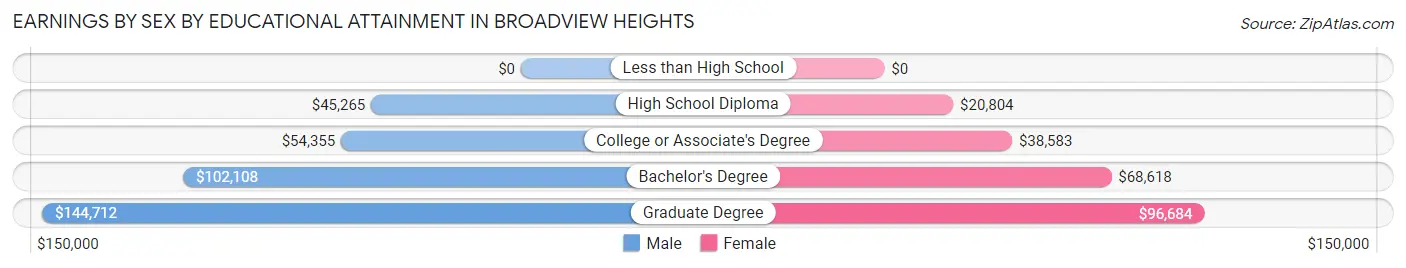
Earnings by Sex by Educational Attainment in Broadview Heights
Average earnings in Broadview Heights are $86,200 for men and $61,095 for women, a difference of 29.1%. Men with an educational attainment of graduate degree enjoy the highest average annual earnings of $144,712, while those with high school diploma education earn the least with $45,265. Women with an educational attainment of graduate degree earn the most with the average annual earnings of $96,684, while those with high school diploma education have the smallest earnings of $20,804.
| Educational Attainment | Male Income | Female Income |
| Less than High School | - | - |
| High School Diploma | $45,265 | $20,804 |
| College or Associate's Degree | $54,355 | $38,583 |
| Bachelor's Degree | $102,108 | $68,618 |
| Graduate Degree | $144,712 | $96,684 |
| Total | $86,200 | $61,095 |
Family Income in Broadview Heights
Family Income Brackets in Broadview Heights
According to the Broadview Heights family income data, there are 1,400 families falling into the $200,000+ income range, which is the most common income bracket and makes up 25.6% of all families. Conversely, the less than $10,000 income bracket is the least frequent group with only 16 families (0.3%) belonging to this category.
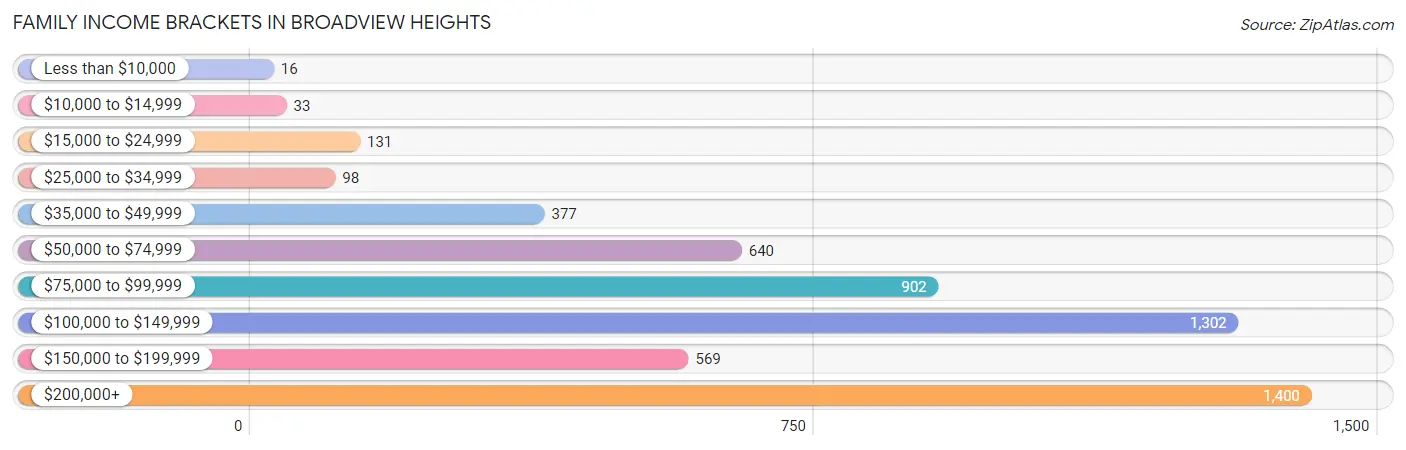
| Income Bracket | # Families | % Families |
| Less than $10,000 | 16 | 0.3% |
| $10,000 to $14,999 | 33 | 0.6% |
| $15,000 to $24,999 | 131 | 2.4% |
| $25,000 to $34,999 | 98 | 1.8% |
| $35,000 to $49,999 | 377 | 6.9% |
| $50,000 to $74,999 | 640 | 11.7% |
| $75,000 to $99,999 | 902 | 16.5% |
| $100,000 to $149,999 | 1,302 | 23.8% |
| $150,000 to $199,999 | 569 | 10.4% |
| $200,000+ | 1,400 | 25.6% |
Family Income by Famaliy Size in Broadview Heights
3-person families (1,156 | 21.1%) account for the highest median family income in Broadview Heights with $149,375 per family, while 3-person families (1,156 | 21.1%) have the highest median income of $49,792 per family member.
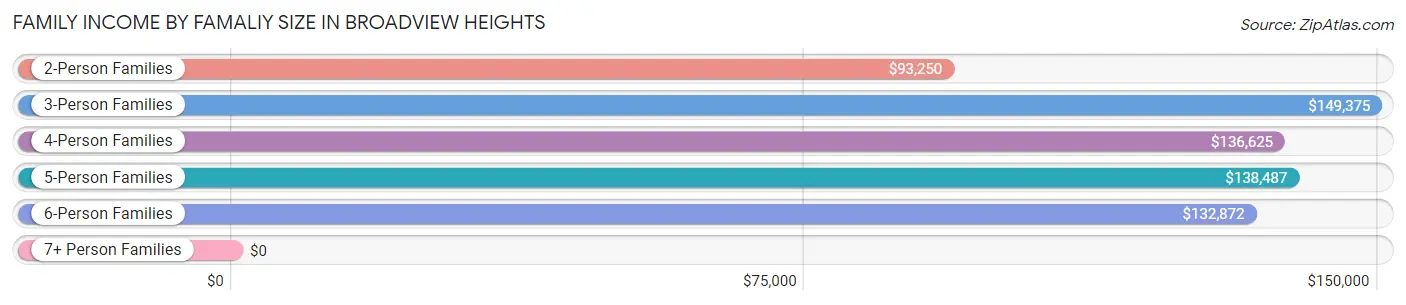
| Income Bracket | # Families | Median Income |
| 2-Person Families | 2,858 (52.3%) | $93,250 |
| 3-Person Families | 1,156 (21.1%) | $149,375 |
| 4-Person Families | 977 (17.9%) | $136,625 |
| 5-Person Families | 303 (5.5%) | $138,487 |
| 6-Person Families | 105 (1.9%) | $132,872 |
| 7+ Person Families | 70 (1.3%) | $0 |
| Total | 5,469 (100.0%) | $119,991 |
Family Income by Number of Earners in Broadview Heights
The median family income in Broadview Heights is $119,991, with families comprising 2 earners (2,345) having the highest median family income of $170,301, while families with no earners (788) have the lowest median family income of $49,226, accounting for 42.9% and 14.4% of families, respectively.
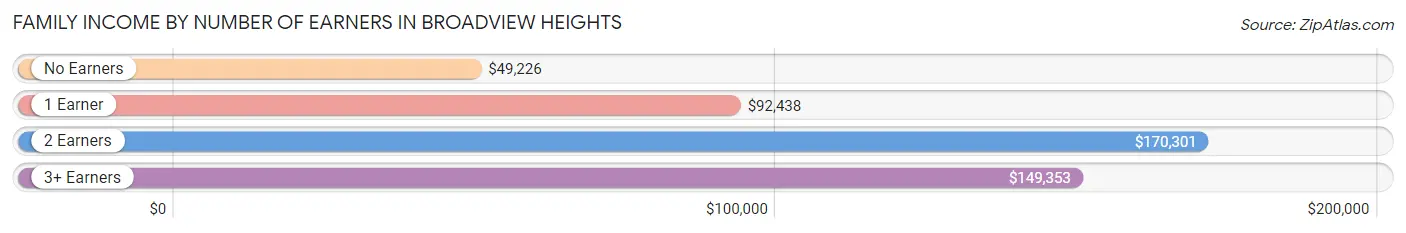
| Number of Earners | # Families | Median Income |
| No Earners | 788 (14.4%) | $49,226 |
| 1 Earner | 1,663 (30.4%) | $92,438 |
| 2 Earners | 2,345 (42.9%) | $170,301 |
| 3+ Earners | 673 (12.3%) | $149,353 |
| Total | 5,469 (100.0%) | $119,991 |
Household Income in Broadview Heights
Household Income Brackets in Broadview Heights
With 1,662 households falling in the category, the $200,000+ income range is the most frequent in Broadview Heights, accounting for 19.8% of all households. In contrast, only 126 households (1.5%) fall into the less than $10,000 income bracket, making it the least populous group.
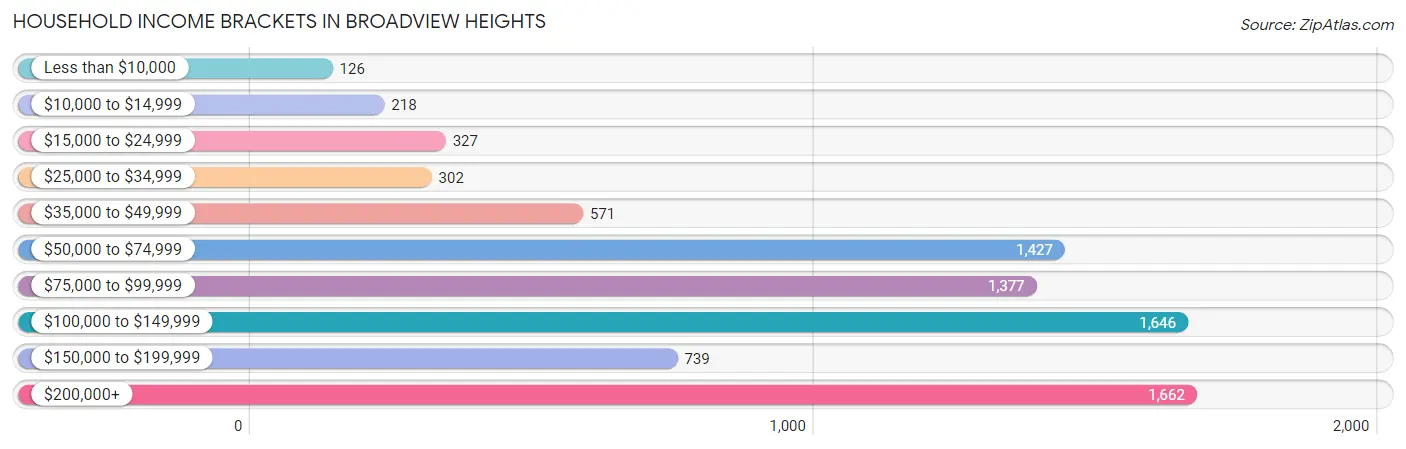
| Income Bracket | # Households | % Households |
| Less than $10,000 | 126 | 1.5% |
| $10,000 to $14,999 | 218 | 2.6% |
| $15,000 to $24,999 | 327 | 3.9% |
| $25,000 to $34,999 | 302 | 3.6% |
| $35,000 to $49,999 | 571 | 6.8% |
| $50,000 to $74,999 | 1,427 | 17.0% |
| $75,000 to $99,999 | 1,377 | 16.4% |
| $100,000 to $149,999 | 1,646 | 19.6% |
| $150,000 to $199,999 | 739 | 8.8% |
| $200,000+ | 1,662 | 19.8% |
Household Income by Householder Age in Broadview Heights
The median household income in Broadview Heights is $97,902, with the highest median household income of $120,364 found in the 45 to 64 years age bracket for the primary householder. A total of 3,741 households (44.6%) fall into this category. Meanwhile, the 15 to 24 years age bracket for the primary householder has the lowest median household income of $0, with 193 households (2.3%) in this group.
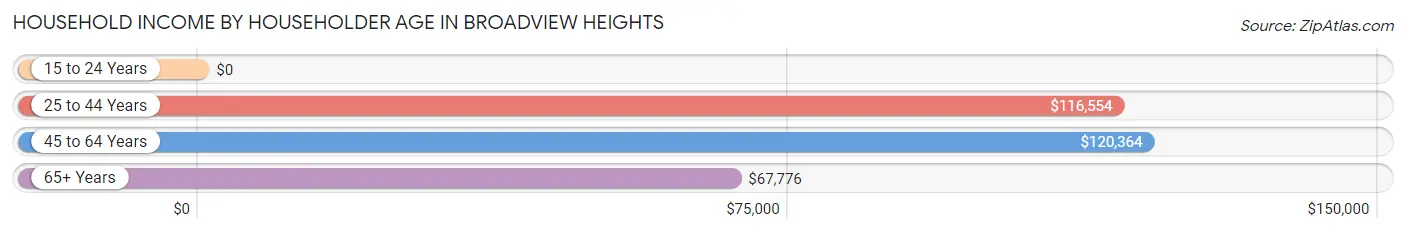
| Income Bracket | # Households | Median Income |
| 15 to 24 Years | 193 (2.3%) | $0 |
| 25 to 44 Years | 2,144 (25.5%) | $116,554 |
| 45 to 64 Years | 3,741 (44.6%) | $120,364 |
| 65+ Years | 2,318 (27.6%) | $67,776 |
| Total | 8,396 (100.0%) | $97,902 |
Poverty in Broadview Heights
Income Below Poverty by Sex and Age in Broadview Heights
With 2.5% poverty level for males and 4.2% for females among the residents of Broadview Heights, under 5 year old males and 75 year old and over females are the most vulnerable to poverty, with 77 males (14.7%) and 103 females (13.7%) in their respective age groups living below the poverty level.
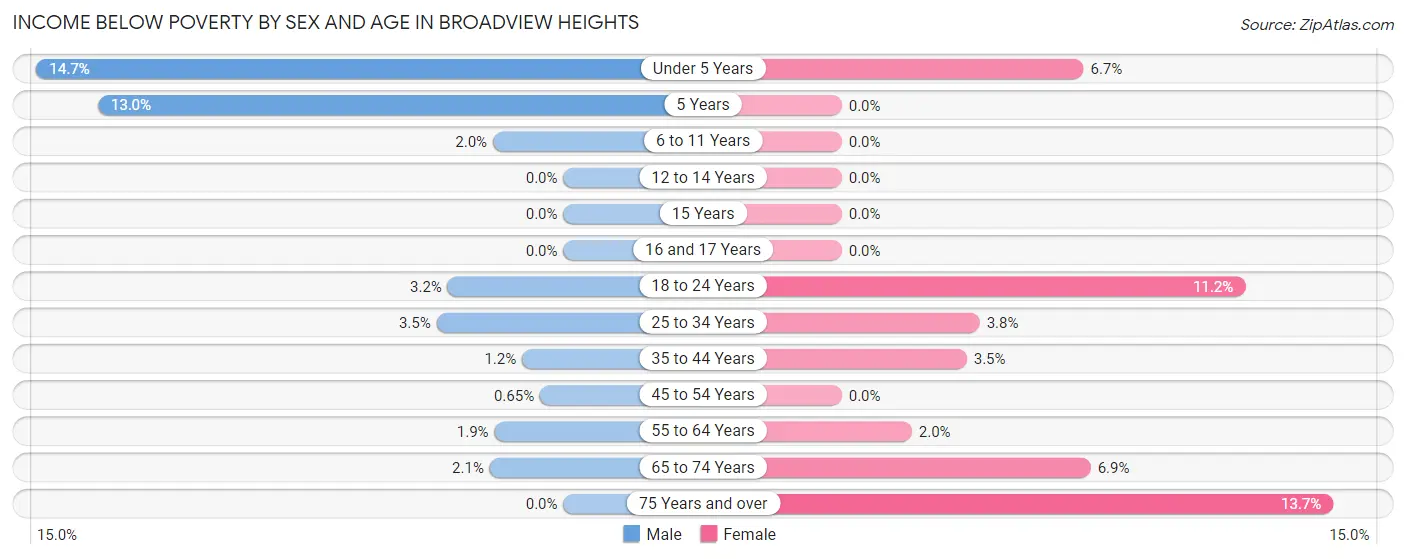
| Age Bracket | Male | Female |
| Under 5 Years | 77 (14.7%) | 45 (6.7%) |
| 5 Years | 14 (13.0%) | 0 (0.0%) |
| 6 to 11 Years | 13 (2.0%) | 0 (0.0%) |
| 12 to 14 Years | 0 (0.0%) | 0 (0.0%) |
| 15 Years | 0 (0.0%) | 0 (0.0%) |
| 16 and 17 Years | 0 (0.0%) | 0 (0.0%) |
| 18 to 24 Years | 24 (3.2%) | 84 (11.2%) |
| 25 to 34 Years | 37 (3.5%) | 42 (3.8%) |
| 35 to 44 Years | 13 (1.1%) | 36 (3.5%) |
| 45 to 54 Years | 8 (0.6%) | 0 (0.0%) |
| 55 to 64 Years | 30 (1.9%) | 29 (1.9%) |
| 65 to 74 Years | 23 (2.1%) | 95 (6.9%) |
| 75 Years and over | 0 (0.0%) | 103 (13.7%) |
| Total | 239 (2.5%) | 434 (4.2%) |
Income Above Poverty by Sex and Age in Broadview Heights
According to the poverty statistics in Broadview Heights, males aged 12 to 14 years and females aged 5 years are the age groups that are most secure financially, with 100.0% of males and 100.0% of females in these age groups living above the poverty line.
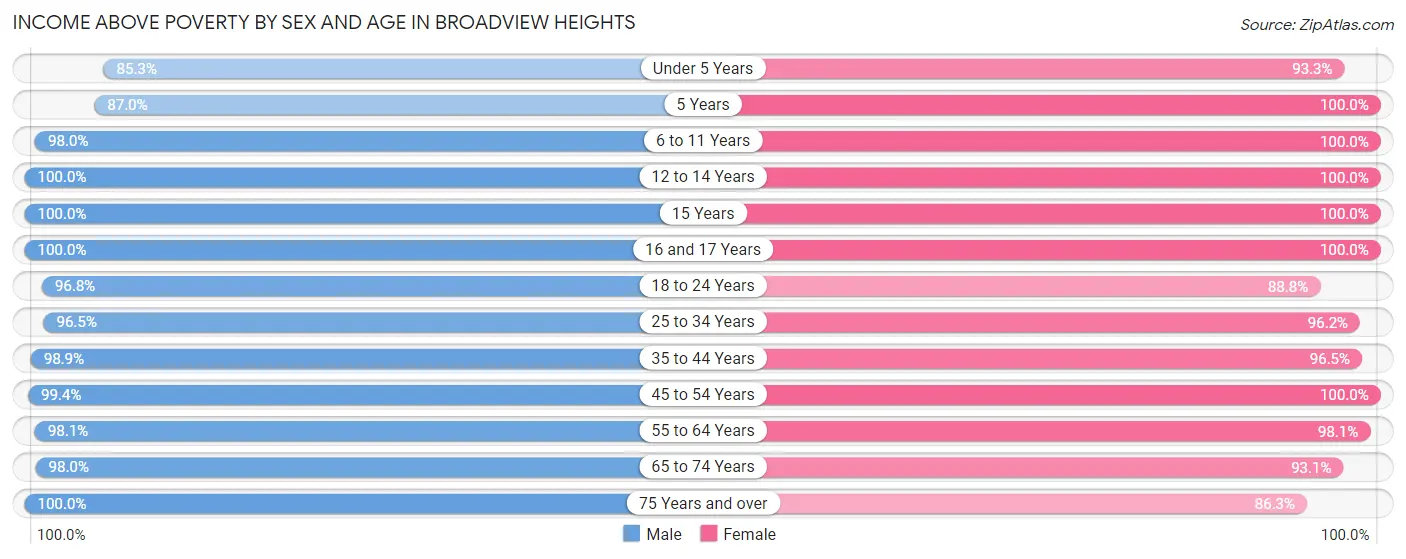
| Age Bracket | Male | Female |
| Under 5 Years | 448 (85.3%) | 624 (93.3%) |
| 5 Years | 94 (87.0%) | 144 (100.0%) |
| 6 to 11 Years | 650 (98.0%) | 531 (100.0%) |
| 12 to 14 Years | 442 (100.0%) | 330 (100.0%) |
| 15 Years | 100 (100.0%) | 110 (100.0%) |
| 16 and 17 Years | 233 (100.0%) | 254 (100.0%) |
| 18 to 24 Years | 721 (96.8%) | 664 (88.8%) |
| 25 to 34 Years | 1,012 (96.5%) | 1,053 (96.2%) |
| 35 to 44 Years | 1,114 (98.9%) | 998 (96.5%) |
| 45 to 54 Years | 1,217 (99.4%) | 1,769 (100.0%) |
| 55 to 64 Years | 1,530 (98.1%) | 1,455 (98.1%) |
| 65 to 74 Years | 1,101 (98.0%) | 1,275 (93.1%) |
| 75 Years and over | 498 (100.0%) | 650 (86.3%) |
| Total | 9,160 (97.5%) | 9,857 (95.8%) |
Income Below Poverty Among Married-Couple Families in Broadview Heights
The poverty statistics for married-couple families in Broadview Heights show that 0.6% or 29 of the total 4,519 families live below the poverty line. Families with 3 or 4 children have the highest poverty rate of 6.1%, comprising of 12 families. On the other hand, families with 1 or 2 children have the lowest poverty rate of 0.0%, which includes 0 families.
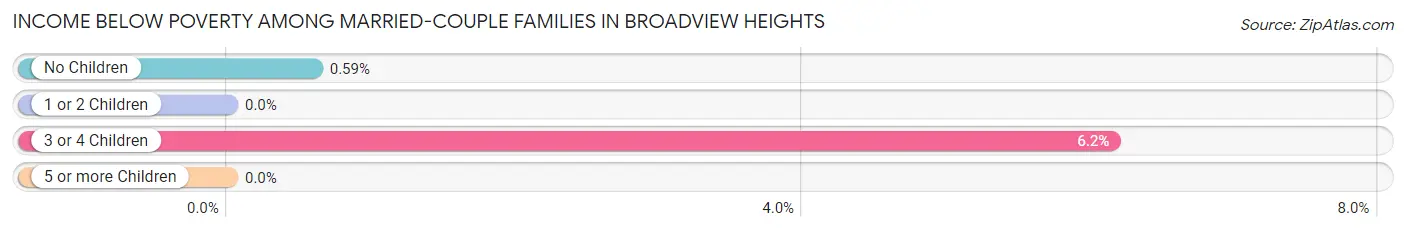
| Children | Above Poverty | Below Poverty |
| No Children | 2,886 (99.4%) | 17 (0.6%) |
| 1 or 2 Children | 1,351 (100.0%) | 0 (0.0%) |
| 3 or 4 Children | 183 (93.9%) | 12 (6.1%) |
| 5 or more Children | 70 (100.0%) | 0 (0.0%) |
| Total | 4,490 (99.4%) | 29 (0.6%) |
Income Below Poverty Among Single-Parent Households in Broadview Heights
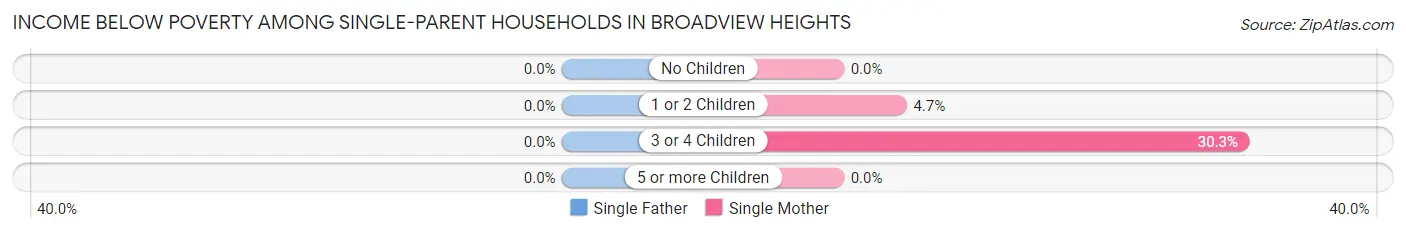
| Children | Single Father | Single Mother |
| No Children | 0 (0.0%) | 0 (0.0%) |
| 1 or 2 Children | 0 (0.0%) | 17 (4.7%) |
| 3 or 4 Children | 0 (0.0%) | 23 (30.3%) |
| 5 or more Children | 0 (0.0%) | 0 (0.0%) |
| Total | 0 (0.0%) | 40 (6.5%) |
Income Below Poverty Among Married-Couple vs Single-Parent Households in Broadview Heights
The poverty data for Broadview Heights shows that 29 of the married-couple family households (0.6%) and 40 of the single-parent households (4.2%) are living below the poverty level. Within the married-couple family households, those with 3 or 4 children have the highest poverty rate, with 12 households (6.1%) falling below the poverty line. Among the single-parent households, those with 3 or 4 children have the highest poverty rate, with 23 household (26.4%) living below poverty.
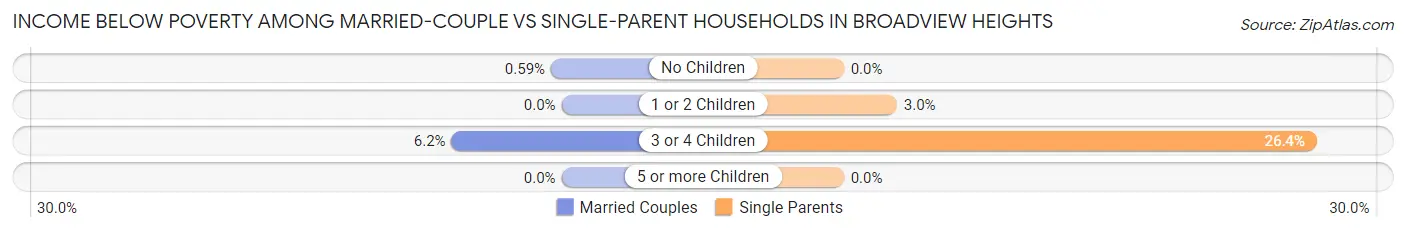
| Children | Married-Couple Families | Single-Parent Households |
| No Children | 17 (0.6%) | 0 (0.0%) |
| 1 or 2 Children | 0 (0.0%) | 17 (3.0%) |
| 3 or 4 Children | 12 (6.1%) | 23 (26.4%) |
| 5 or more Children | 0 (0.0%) | 0 (0.0%) |
| Total | 29 (0.6%) | 40 (4.2%) |
Race in Broadview Heights
The most populous races in Broadview Heights are White / Caucasian (17,235 | 87.0%), Asian (1,157 | 5.8%), and Two or more Races (699 | 3.5%).
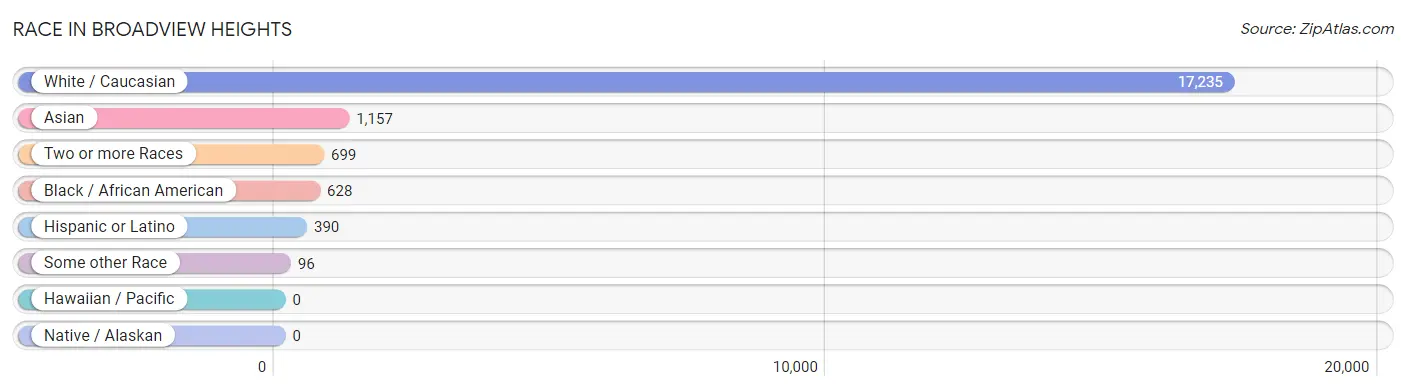
| Race | # Population | % Population |
| Asian | 1,157 | 5.8% |
| Black / African American | 628 | 3.2% |
| Hawaiian / Pacific | 0 | 0.0% |
| Hispanic or Latino | 390 | 2.0% |
| Native / Alaskan | 0 | 0.0% |
| White / Caucasian | 17,235 | 87.0% |
| Two or more Races | 699 | 3.5% |
| Some other Race | 96 | 0.5% |
| Total | 19,815 | 100.0% |
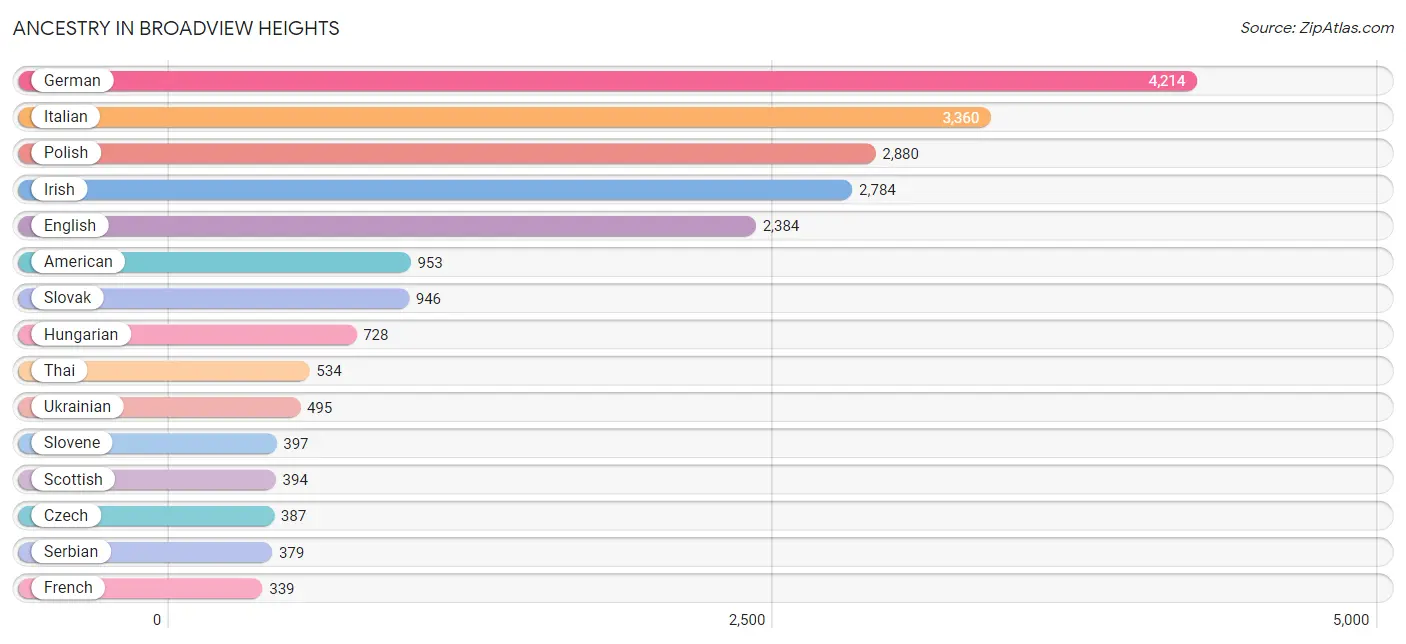
Ancestry in Broadview Heights
The most populous ancestries reported in Broadview Heights are German (4,214 | 21.3%), Italian (3,360 | 17.0%), Polish (2,880 | 14.5%), Irish (2,784 | 14.1%), and English (2,384 | 12.0%), together accounting for 78.8% of all Broadview Heights residents.
| Ancestry | # Population | % Population |
| American | 953 | 4.8% |
| Arab | 246 | 1.2% |
| Argentinean | 11 | 0.1% |
| Armenian | 14 | 0.1% |
| Austrian | 89 | 0.4% |
| Belgian | 46 | 0.2% |
| Bhutanese | 50 | 0.3% |
| Blackfeet | 9 | 0.1% |
| British | 62 | 0.3% |
| Bulgarian | 45 | 0.2% |
| Burmese | 113 | 0.6% |
| Carpatho Rusyn | 120 | 0.6% |
| Central American | 53 | 0.3% |
| Cherokee | 35 | 0.2% |
| Colombian | 25 | 0.1% |
| Croatian | 171 | 0.9% |
| Czech | 387 | 1.9% |
| Czechoslovakian | 74 | 0.4% |
| Dutch | 267 | 1.3% |
| Eastern European | 199 | 1.0% |
| Egyptian | 112 | 0.6% |
| English | 2,384 | 12.0% |
| European | 194 | 1.0% |
| French | 339 | 1.7% |
| French Canadian | 123 | 0.6% |
| German | 4,214 | 21.3% |
| Greek | 96 | 0.5% |
| Hungarian | 728 | 3.7% |
| Indian (Asian) | 211 | 1.1% |
| Irish | 2,784 | 14.1% |
| Italian | 3,360 | 17.0% |
| Jamaican | 28 | 0.1% |
| Korean | 286 | 1.4% |
| Laotian | 46 | 0.2% |
| Latvian | 13 | 0.1% |
| Lebanese | 123 | 0.6% |
| Lithuanian | 37 | 0.2% |
| Macedonian | 118 | 0.6% |
| Mexican | 25 | 0.1% |
| Native Hawaiian | 15 | 0.1% |
| Norwegian | 167 | 0.8% |
| Panamanian | 16 | 0.1% |
| Polish | 2,880 | 14.5% |
| Portuguese | 22 | 0.1% |
| Puerto Rican | 207 | 1.0% |
| Romanian | 63 | 0.3% |
| Russian | 133 | 0.7% |
| Salvadoran | 37 | 0.2% |
| Scandinavian | 19 | 0.1% |
| Scotch-Irish | 140 | 0.7% |
| Scottish | 394 | 2.0% |
| Serbian | 379 | 1.9% |
| Slavic | 23 | 0.1% |
| Slovak | 946 | 4.8% |
| Slovene | 397 | 2.0% |
| South American | 52 | 0.3% |
| Spaniard | 31 | 0.2% |
| Spanish | 22 | 0.1% |
| Subsaharan African | 111 | 0.6% |
| Sudanese | 111 | 0.6% |
| Swedish | 143 | 0.7% |
| Swiss | 91 | 0.5% |
| Thai | 534 | 2.7% |
| Ukrainian | 495 | 2.5% |
| Venezuelan | 16 | 0.1% |
| Welsh | 118 | 0.6% | View All 66 Rows |
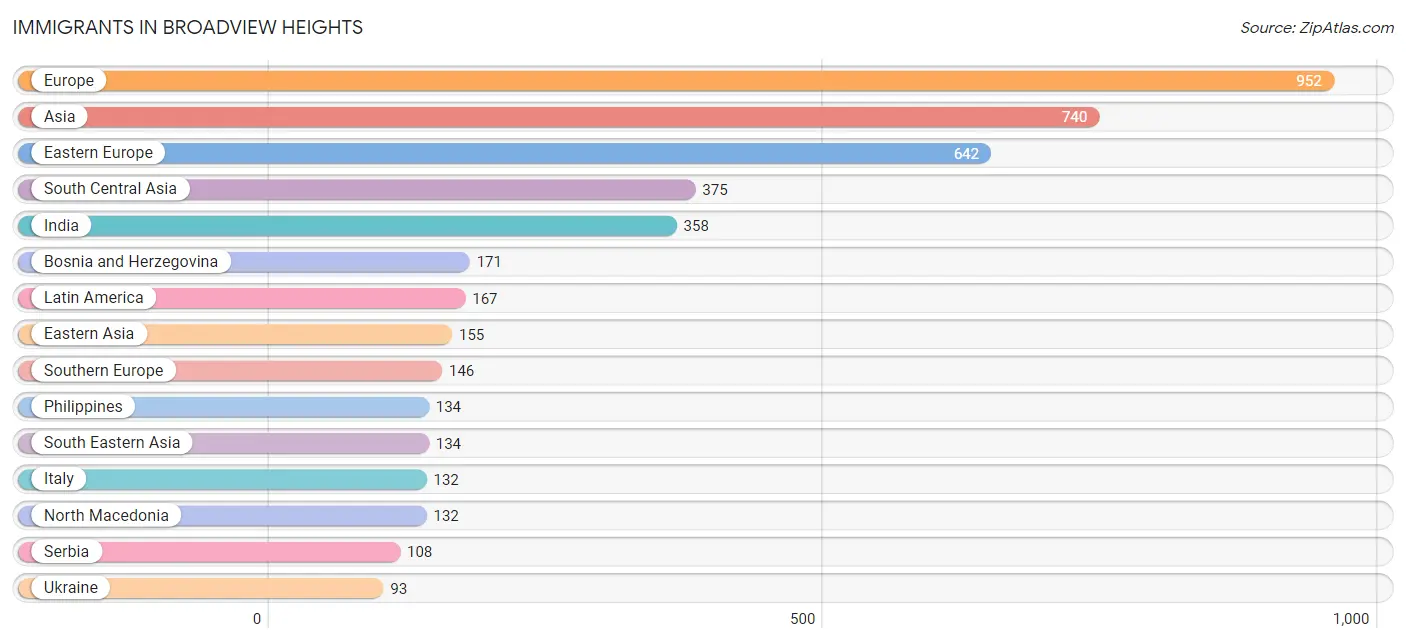
Immigrants in Broadview Heights
The most numerous immigrant groups reported in Broadview Heights came from Europe (952 | 4.8%), Asia (740 | 3.7%), Eastern Europe (642 | 3.2%), South Central Asia (375 | 1.9%), and India (358 | 1.8%), together accounting for 15.5% of all Broadview Heights residents.
| Immigration Origin | # Population | % Population |
| Africa | 44 | 0.2% |
| Argentina | 11 | 0.1% |
| Asia | 740 | 3.7% |
| Bangladesh | 12 | 0.1% |
| Belgium | 12 | 0.1% |
| Bosnia and Herzegovina | 171 | 0.9% |
| Brazil | 16 | 0.1% |
| Bulgaria | 45 | 0.2% |
| Canada | 21 | 0.1% |
| Caribbean | 28 | 0.1% |
| Central America | 71 | 0.4% |
| China | 83 | 0.4% |
| Colombia | 25 | 0.1% |
| Eastern Asia | 155 | 0.8% |
| Eastern Europe | 642 | 3.2% |
| Egypt | 44 | 0.2% |
| El Salvador | 37 | 0.2% |
| Europe | 952 | 4.8% |
| Germany | 62 | 0.3% |
| Greece | 14 | 0.1% |
| Hong Kong | 21 | 0.1% |
| Hungary | 27 | 0.1% |
| India | 358 | 1.8% |
| Ireland | 76 | 0.4% |
| Italy | 132 | 0.7% |
| Jamaica | 28 | 0.1% |
| Korea | 72 | 0.4% |
| Kuwait | 35 | 0.2% |
| Latin America | 167 | 0.8% |
| Lebanon | 41 | 0.2% |
| Mexico | 18 | 0.1% |
| Netherlands | 14 | 0.1% |
| North Macedonia | 132 | 0.7% |
| Northern Africa | 44 | 0.2% |
| Northern Europe | 76 | 0.4% |
| Pakistan | 5 | 0.0% |
| Panama | 16 | 0.1% |
| Philippines | 134 | 0.7% |
| Poland | 20 | 0.1% |
| Romania | 33 | 0.2% |
| Serbia | 108 | 0.5% |
| South America | 68 | 0.3% |
| South Central Asia | 375 | 1.9% |
| South Eastern Asia | 134 | 0.7% |
| Southern Europe | 146 | 0.7% |
| Ukraine | 93 | 0.5% |
| Venezuela | 16 | 0.1% |
| Western Asia | 76 | 0.4% |
| Western Europe | 88 | 0.4% | View All 49 Rows |
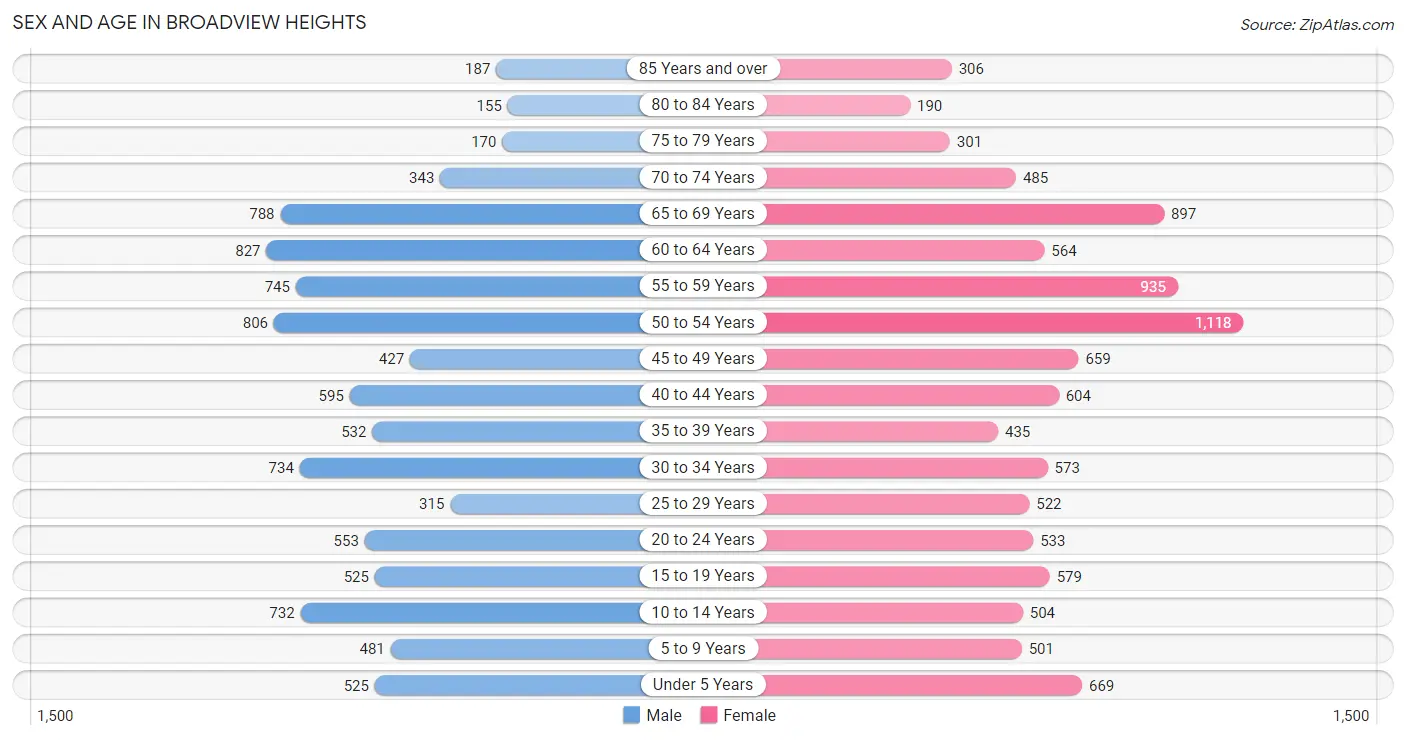
Sex and Age in Broadview Heights
Sex and Age in Broadview Heights
The most populous age groups in Broadview Heights are 60 to 64 Years (827 | 8.8%) for men and 50 to 54 Years (1,118 | 10.8%) for women.
| Age Bracket | Male | Female |
| Under 5 Years | 525 (5.6%) | 669 (6.5%) |
| 5 to 9 Years | 481 (5.1%) | 501 (4.8%) |
| 10 to 14 Years | 732 (7.7%) | 504 (4.9%) |
| 15 to 19 Years | 525 (5.6%) | 579 (5.6%) |
| 20 to 24 Years | 553 (5.9%) | 533 (5.1%) |
| 25 to 29 Years | 315 (3.3%) | 522 (5.0%) |
| 30 to 34 Years | 734 (7.8%) | 573 (5.5%) |
| 35 to 39 Years | 532 (5.6%) | 435 (4.2%) |
| 40 to 44 Years | 595 (6.3%) | 604 (5.8%) |
| 45 to 49 Years | 427 (4.5%) | 659 (6.4%) |
| 50 to 54 Years | 806 (8.5%) | 1,118 (10.8%) |
| 55 to 59 Years | 745 (7.9%) | 935 (9.0%) |
| 60 to 64 Years | 827 (8.8%) | 564 (5.4%) |
| 65 to 69 Years | 788 (8.4%) | 897 (8.6%) |
| 70 to 74 Years | 343 (3.6%) | 485 (4.7%) |
| 75 to 79 Years | 170 (1.8%) | 301 (2.9%) |
| 80 to 84 Years | 155 (1.6%) | 190 (1.8%) |
| 85 Years and over | 187 (2.0%) | 306 (2.9%) |
| Total | 9,440 (100.0%) | 10,375 (100.0%) |
Families and Households in Broadview Heights
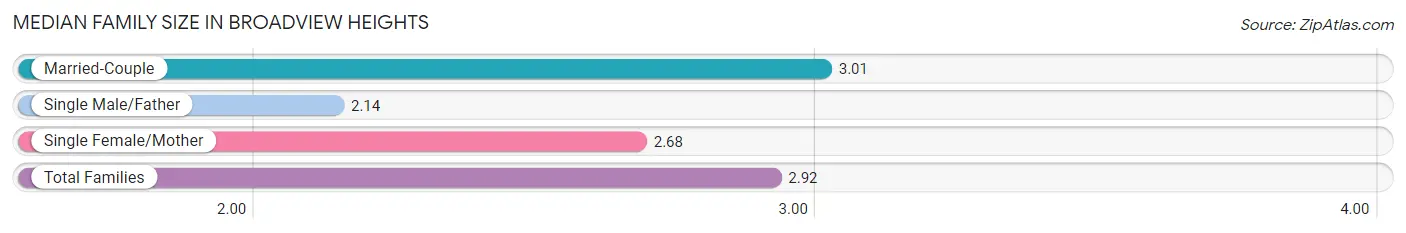
Median Family Size in Broadview Heights
The median family size in Broadview Heights is 2.92 persons per family, with married-couple families (4,519 | 82.6%) accounting for the largest median family size of 3.01 persons per family. On the other hand, single male/father families (334 | 6.1%) represent the smallest median family size with 2.14 persons per family.
| Family Type | # Families | Family Size |
| Married-Couple | 4,519 (82.6%) | 3.01 |
| Single Male/Father | 334 (6.1%) | 2.14 |
| Single Female/Mother | 616 (11.3%) | 2.68 |
| Total Families | 5,469 (100.0%) | 2.92 |
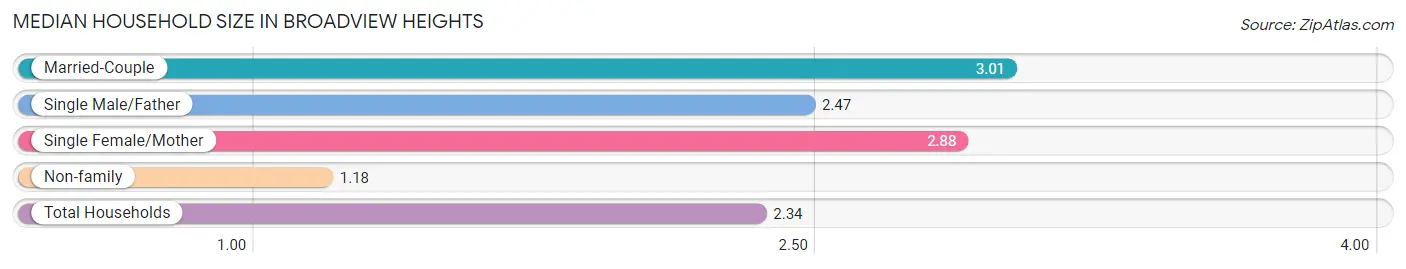
Median Household Size in Broadview Heights
The median household size in Broadview Heights is 2.34 persons per household, with married-couple households (4,519 | 53.8%) accounting for the largest median household size of 3.01 persons per household. non-family households (2,927 | 34.9%) represent the smallest median household size with 1.18 persons per household.
| Household Type | # Households | Household Size |
| Married-Couple | 4,519 (53.8%) | 3.01 |
| Single Male/Father | 334 (4.0%) | 2.47 |
| Single Female/Mother | 616 (7.3%) | 2.88 |
| Non-family | 2,927 (34.9%) | 1.18 |
| Total Households | 8,396 (100.0%) | 2.34 |
Household Size by Marriage Status in Broadview Heights
Out of a total of 8,396 households in Broadview Heights, 5,469 (65.1%) are family households, while 2,927 (34.9%) are nonfamily households. The most numerous type of family households are 2-person households, comprising 2,654, and the most common type of nonfamily households are 1-person households, comprising 2,454.
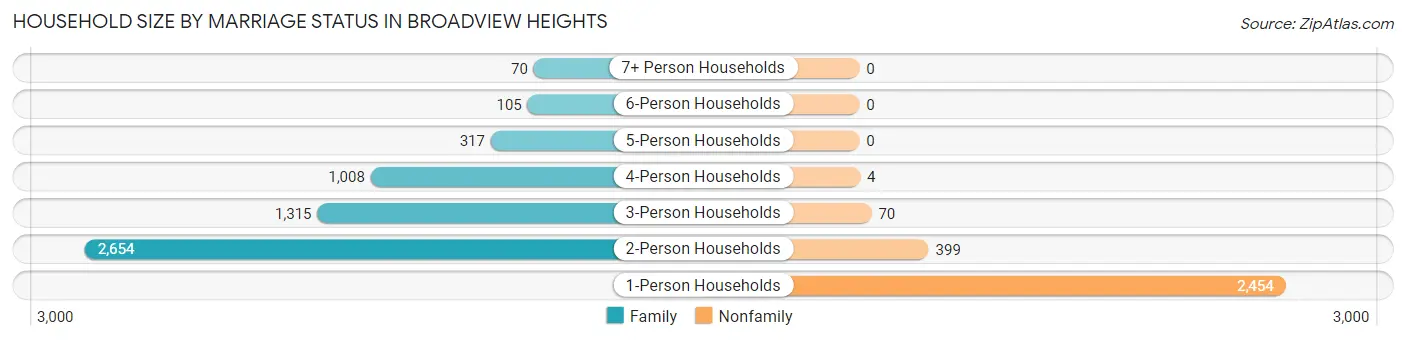
| Household Size | Family Households | Nonfamily Households |
| 1-Person Households | - | 2,454 (29.2%) |
| 2-Person Households | 2,654 (31.6%) | 399 (4.8%) |
| 3-Person Households | 1,315 (15.7%) | 70 (0.8%) |
| 4-Person Households | 1,008 (12.0%) | 4 (0.1%) |
| 5-Person Households | 317 (3.8%) | 0 (0.0%) |
| 6-Person Households | 105 (1.3%) | 0 (0.0%) |
| 7+ Person Households | 70 (0.8%) | 0 (0.0%) |
| Total | 5,469 (65.1%) | 2,927 (34.9%) |
Female Fertility in Broadview Heights
Fertility by Age in Broadview Heights
Average fertility rate in Broadview Heights is 32.0 births per 1,000 women. Women in the age bracket of 20 to 34 years have the highest fertility rate with 48.0 births per 1,000 women. Women in the age bracket of 20 to 34 years acount for 61.4% of all women with births.
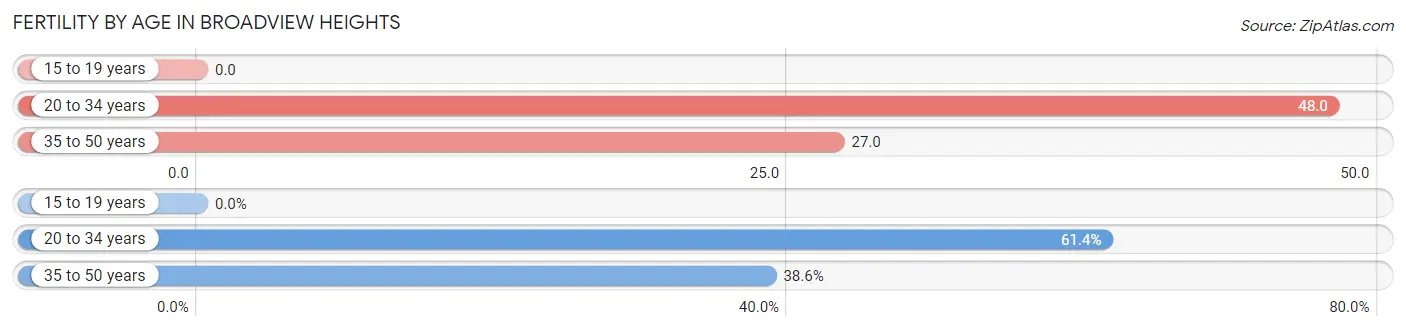
| Age Bracket | Women with Births | Births / 1,000 Women |
| 15 to 19 years | 0 (0.0%) | 0.0 |
| 20 to 34 years | 78 (61.4%) | 48.0 |
| 35 to 50 years | 49 (38.6%) | 27.0 |
| Total | 127 (100.0%) | 32.0 |
Fertility by Age by Marriage Status in Broadview Heights
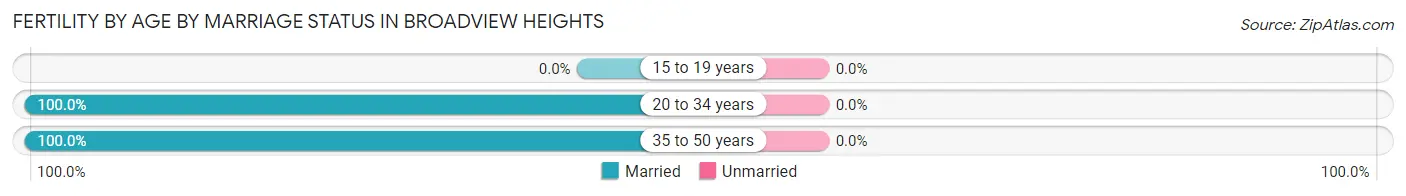
| Age Bracket | Married | Unmarried |
| 15 to 19 years | 0 (0.0%) | 0 (0.0%) |
| 20 to 34 years | 78 (100.0%) | 0 (0.0%) |
| 35 to 50 years | 49 (100.0%) | 0 (0.0%) |
| Total | 127 (100.0%) | 0 (0.0%) |
Fertility by Education in Broadview Heights
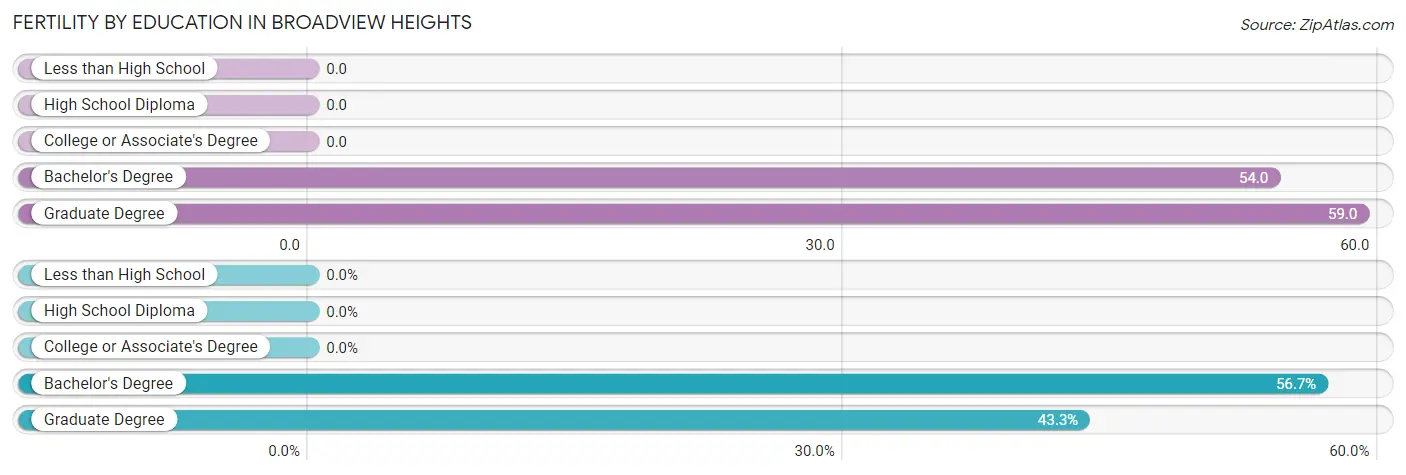
| Educational Attainment | Women with Births | Births / 1,000 Women |
| Less than High School | 0 (0.0%) | 0.0 |
| High School Diploma | 0 (0.0%) | 0.0 |
| College or Associate's Degree | 0 (0.0%) | 0.0 |
| Bachelor's Degree | 72 (56.7%) | 54.0 |
| Graduate Degree | 55 (43.3%) | 59.0 |
| Total | 127 (100.0%) | 32.0 |
Fertility by Education by Marriage Status in Broadview Heights
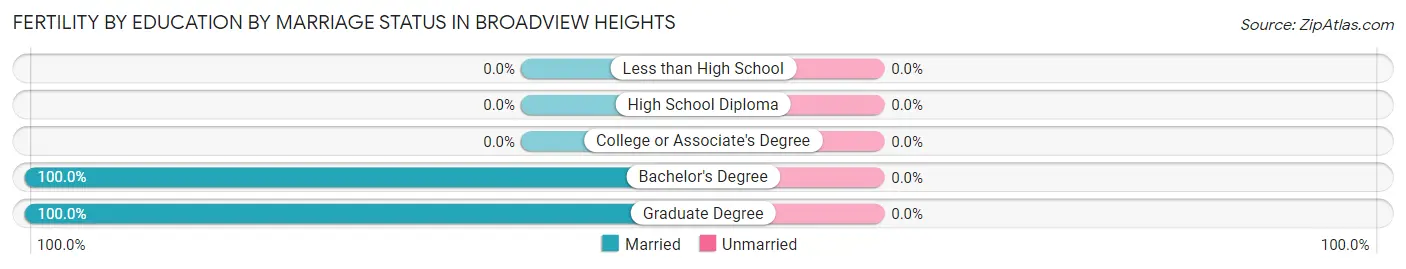
| Educational Attainment | Married | Unmarried |
| Less than High School | 0 (0.0%) | 0 (0.0%) |
| High School Diploma | 0 (0.0%) | 0 (0.0%) |
| College or Associate's Degree | 0 (0.0%) | 0 (0.0%) |
| Bachelor's Degree | 72 (100.0%) | 0 (0.0%) |
| Graduate Degree | 55 (100.0%) | 0 (0.0%) |
| Total | 127 (100.0%) | 0 (0.0%) |
Employment Characteristics in Broadview Heights
Employment by Class of Employer in Broadview Heights
Among the 10,317 employed individuals in Broadview Heights, private company employees (6,813 | 66.0%), not-for-profit organizations (1,386 | 13.4%), and local government employees (750 | 7.3%) make up the most common classes of employment.
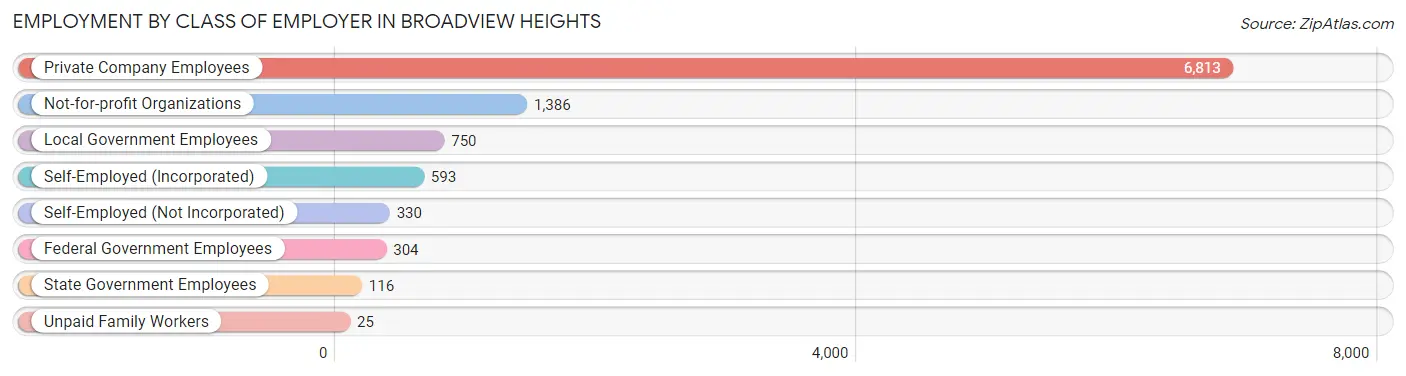
| Employer Class | # Employees | % Employees |
| Private Company Employees | 6,813 | 66.0% |
| Self-Employed (Incorporated) | 593 | 5.8% |
| Self-Employed (Not Incorporated) | 330 | 3.2% |
| Not-for-profit Organizations | 1,386 | 13.4% |
| Local Government Employees | 750 | 7.3% |
| State Government Employees | 116 | 1.1% |
| Federal Government Employees | 304 | 2.9% |
| Unpaid Family Workers | 25 | 0.2% |
| Total | 10,317 | 100.0% |
Employment Status by Age in Broadview Heights
According to the labor force statistics for Broadview Heights, out of the total population over 16 years of age (16,193), 66.2% or 10,720 individuals are in the labor force, with 1.6% or 172 of them unemployed. The age group with the highest labor force participation rate is 30 to 34 years, with 92.7% or 1,212 individuals in the labor force. Within the labor force, the 16 to 19 years age range has the highest percentage of unemployed individuals, with 13.8% or 51 of them being unemployed.
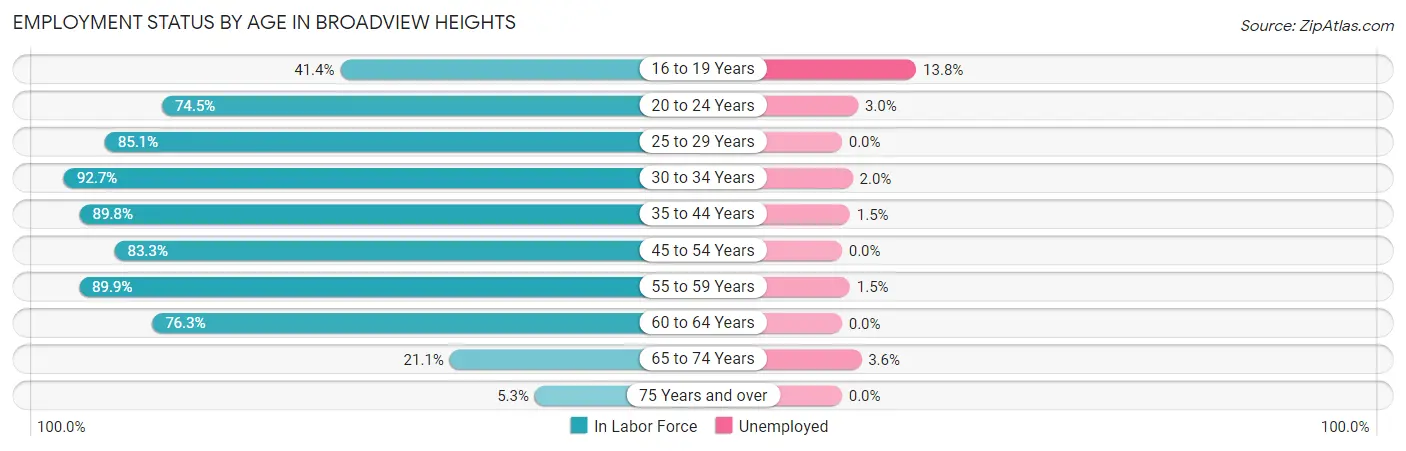
| Age Bracket | In Labor Force | Unemployed |
| 16 to 19 Years | 370 (41.4%) | 51 (13.8%) |
| 20 to 24 Years | 809 (74.5%) | 24 (3.0%) |
| 25 to 29 Years | 712 (85.1%) | 0 (0.0%) |
| 30 to 34 Years | 1,212 (92.7%) | 24 (2.0%) |
| 35 to 44 Years | 1,945 (89.8%) | 29 (1.5%) |
| 45 to 54 Years | 2,507 (83.3%) | 0 (0.0%) |
| 55 to 59 Years | 1,510 (89.9%) | 23 (1.5%) |
| 60 to 64 Years | 1,061 (76.3%) | 0 (0.0%) |
| 65 to 74 Years | 530 (21.1%) | 19 (3.6%) |
| 75 Years and over | 69 (5.3%) | 0 (0.0%) |
| Total | 10,720 (66.2%) | 172 (1.6%) |
Employment Status by Educational Attainment in Broadview Heights
According to labor force statistics for Broadview Heights, 86.1% of individuals (8,947) out of the total population between 25 and 64 years of age (10,391) are in the labor force, with 0.9% or 81 of them being unemployed. The group with the highest labor force participation rate are those with the educational attainment of college / associate degree, with 88.3% or 2,140 individuals in the labor force. Within the labor force, individuals with bachelor's degree or higher education have the highest percentage of unemployment, with 1.1% or 63 of them being unemployed.
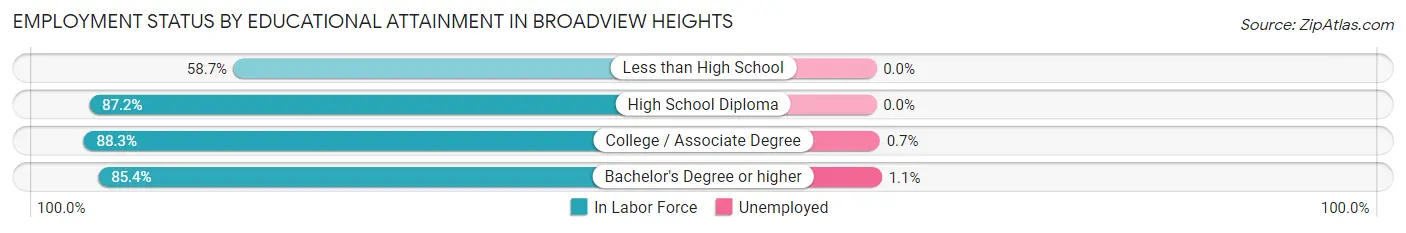
| Educational Attainment | In Labor Force | Unemployed |
| Less than High School | 37 (58.7%) | 0 (0.0%) |
| High School Diploma | 1,063 (87.2%) | 0 (0.0%) |
| College / Associate Degree | 2,140 (88.3%) | 17 (0.7%) |
| Bachelor's Degree or higher | 5,709 (85.4%) | 74 (1.1%) |
| Total | 8,947 (86.1%) | 94 (0.9%) |
Employment Occupations by Sex in Broadview Heights
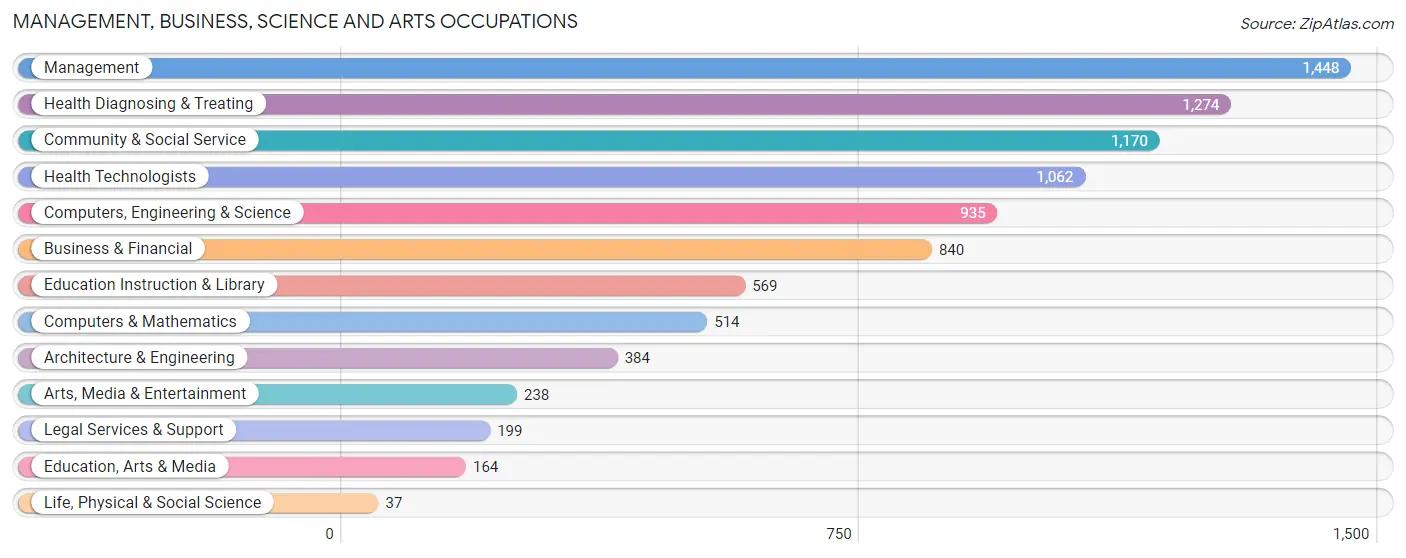
Management, Business, Science and Arts Occupations
The most common Management, Business, Science and Arts occupations in Broadview Heights are Management (1,448 | 13.7%), Health Diagnosing & Treating (1,274 | 12.1%), Community & Social Service (1,170 | 11.1%), Health Technologists (1,062 | 10.1%), and Computers, Engineering & Science (935 | 8.9%).
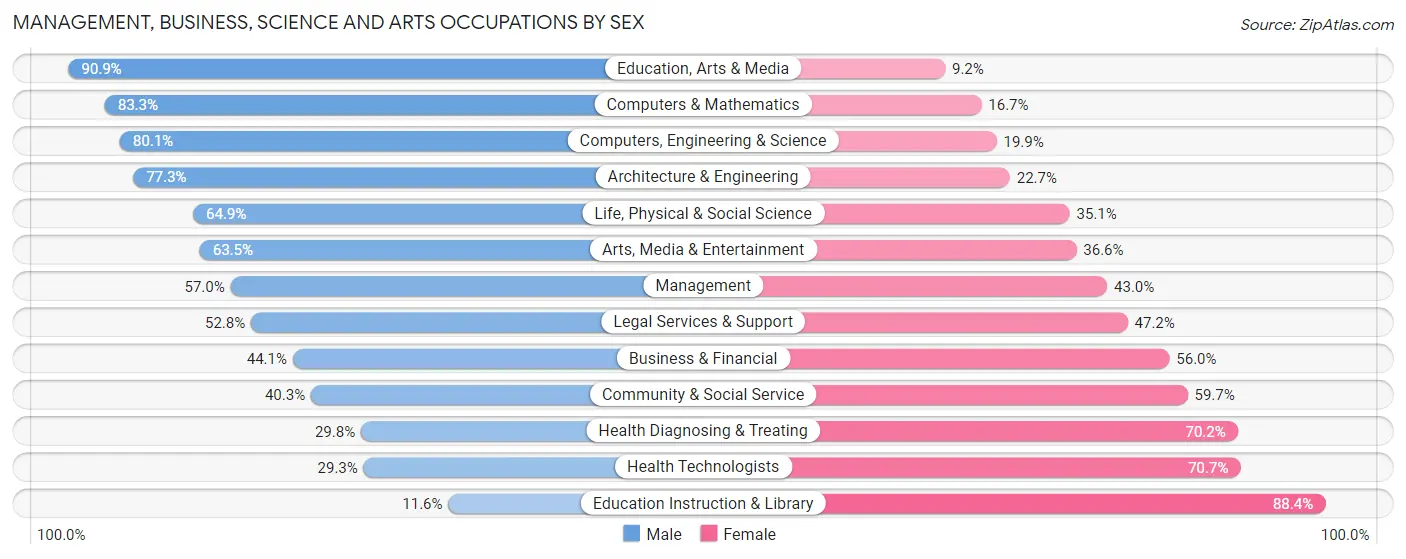
Management, Business, Science and Arts Occupations by Sex
Within the Management, Business, Science and Arts occupations in Broadview Heights, the most male-oriented occupations are Education, Arts & Media (90.8%), Computers & Mathematics (83.3%), and Computers, Engineering & Science (80.1%), while the most female-oriented occupations are Education Instruction & Library (88.4%), Health Technologists (70.7%), and Health Diagnosing & Treating (70.2%).
| Occupation | Male | Female |
| Management | 826 (57.0%) | 622 (43.0%) |
| Business & Financial | 370 (44.1%) | 470 (55.9%) |
| Computers, Engineering & Science | 749 (80.1%) | 186 (19.9%) |
| Computers & Mathematics | 428 (83.3%) | 86 (16.7%) |
| Architecture & Engineering | 297 (77.3%) | 87 (22.7%) |
| Life, Physical & Social Science | 24 (64.9%) | 13 (35.1%) |
| Community & Social Service | 471 (40.3%) | 699 (59.7%) |
| Education, Arts & Media | 149 (90.8%) | 15 (9.1%) |
| Legal Services & Support | 105 (52.8%) | 94 (47.2%) |
| Education Instruction & Library | 66 (11.6%) | 503 (88.4%) |
| Arts, Media & Entertainment | 151 (63.4%) | 87 (36.5%) |
| Health Diagnosing & Treating | 380 (29.8%) | 894 (70.2%) |
| Health Technologists | 311 (29.3%) | 751 (70.7%) |
| Total (Category) | 2,796 (49.3%) | 2,871 (50.7%) |
| Total (Overall) | 5,364 (50.8%) | 5,190 (49.2%) |
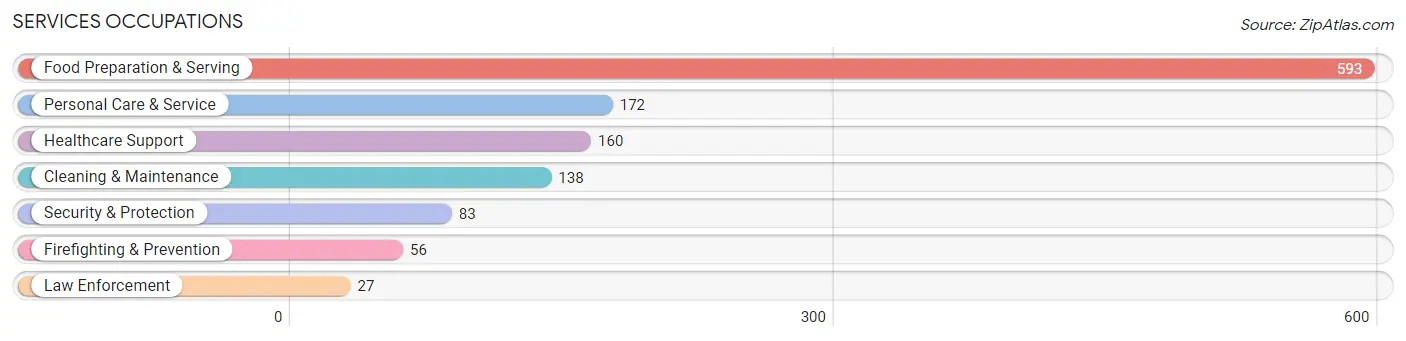
Services Occupations
The most common Services occupations in Broadview Heights are Food Preparation & Serving (593 | 5.6%), Personal Care & Service (172 | 1.6%), Healthcare Support (160 | 1.5%), Cleaning & Maintenance (138 | 1.3%), and Security & Protection (83 | 0.8%).
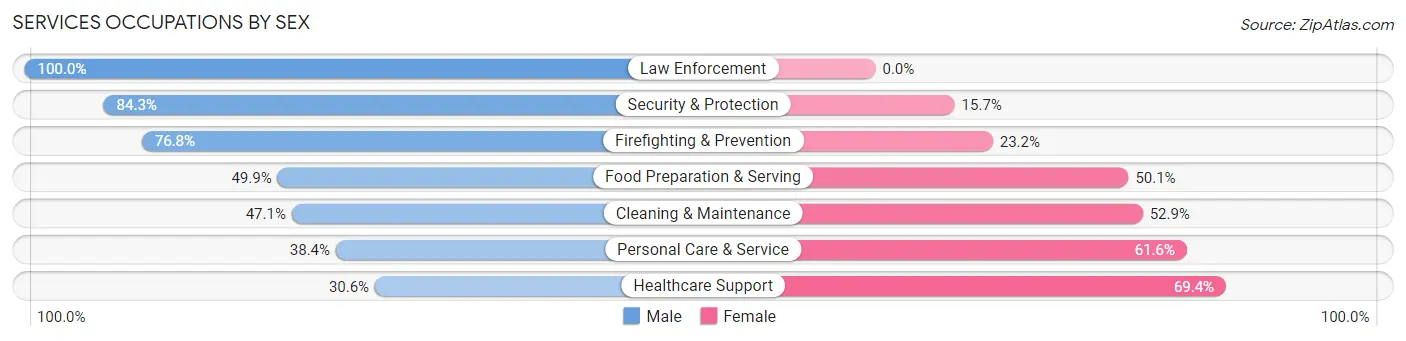
Services Occupations by Sex
Within the Services occupations in Broadview Heights, the most male-oriented occupations are Law Enforcement (100.0%), Security & Protection (84.3%), and Firefighting & Prevention (76.8%), while the most female-oriented occupations are Healthcare Support (69.4%), Personal Care & Service (61.6%), and Cleaning & Maintenance (52.9%).
| Occupation | Male | Female |
| Healthcare Support | 49 (30.6%) | 111 (69.4%) |
| Security & Protection | 70 (84.3%) | 13 (15.7%) |
| Firefighting & Prevention | 43 (76.8%) | 13 (23.2%) |
| Law Enforcement | 27 (100.0%) | 0 (0.0%) |
| Food Preparation & Serving | 296 (49.9%) | 297 (50.1%) |
| Cleaning & Maintenance | 65 (47.1%) | 73 (52.9%) |
| Personal Care & Service | 66 (38.4%) | 106 (61.6%) |
| Total (Category) | 546 (47.6%) | 600 (52.4%) |
| Total (Overall) | 5,364 (50.8%) | 5,190 (49.2%) |
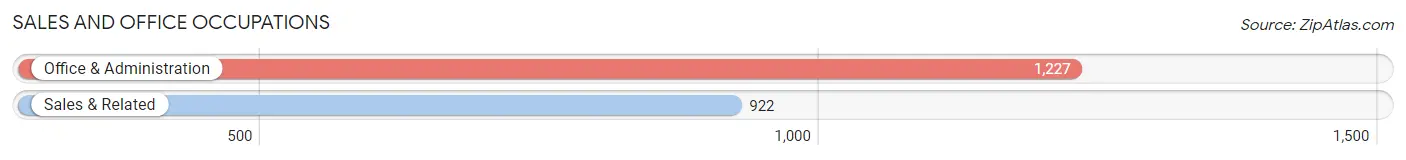
Sales and Office Occupations
The most common Sales and Office occupations in Broadview Heights are Office & Administration (1,227 | 11.6%), and Sales & Related (922 | 8.7%).
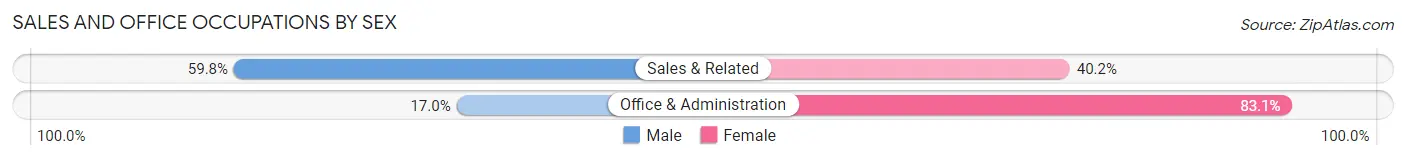
Sales and Office Occupations by Sex
| Occupation | Male | Female |
| Sales & Related | 551 (59.8%) | 371 (40.2%) |
| Office & Administration | 208 (17.0%) | 1,019 (83.1%) |
| Total (Category) | 759 (35.3%) | 1,390 (64.7%) |
| Total (Overall) | 5,364 (50.8%) | 5,190 (49.2%) |
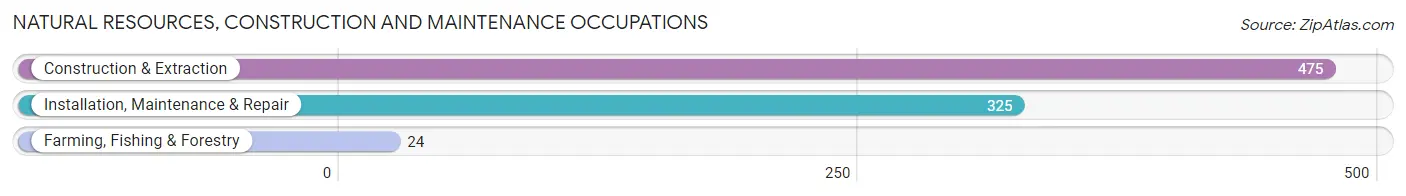
Natural Resources, Construction and Maintenance Occupations
The most common Natural Resources, Construction and Maintenance occupations in Broadview Heights are Construction & Extraction (475 | 4.5%), Installation, Maintenance & Repair (325 | 3.1%), and Farming, Fishing & Forestry (24 | 0.2%).
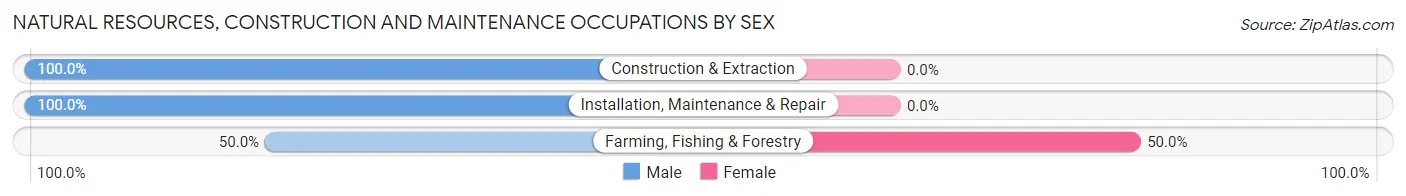
Natural Resources, Construction and Maintenance Occupations by Sex
| Occupation | Male | Female |
| Farming, Fishing & Forestry | 12 (50.0%) | 12 (50.0%) |
| Construction & Extraction | 475 (100.0%) | 0 (0.0%) |
| Installation, Maintenance & Repair | 325 (100.0%) | 0 (0.0%) |
| Total (Category) | 812 (98.5%) | 12 (1.5%) |
| Total (Overall) | 5,364 (50.8%) | 5,190 (49.2%) |
Production, Transportation and Moving Occupations
The most common Production, Transportation and Moving occupations in Broadview Heights are Transportation (374 | 3.5%), Production (273 | 2.6%), and Material Moving (121 | 1.1%).
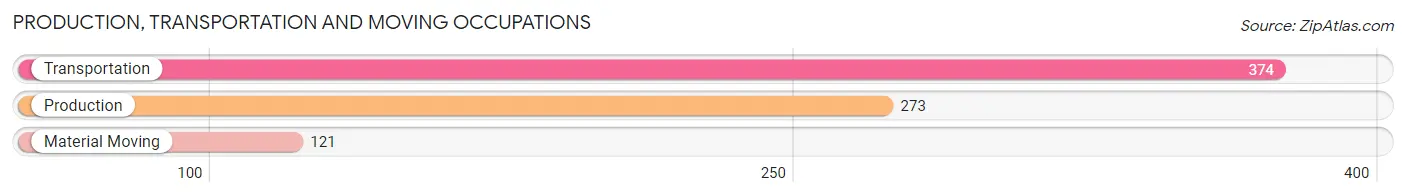
Production, Transportation and Moving Occupations by Sex
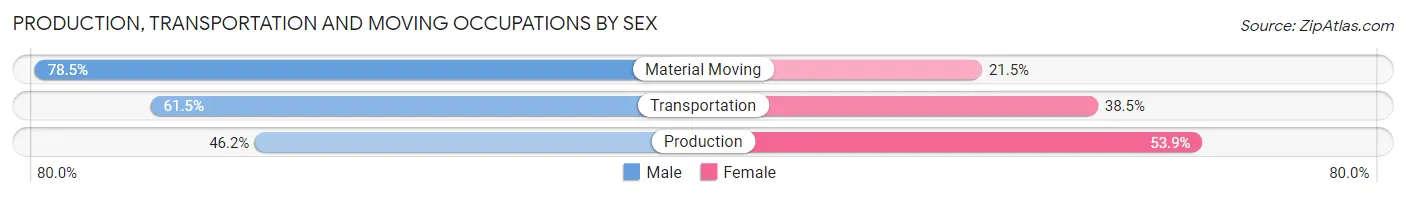
| Occupation | Male | Female |
| Production | 126 (46.2%) | 147 (53.8%) |
| Transportation | 230 (61.5%) | 144 (38.5%) |
| Material Moving | 95 (78.5%) | 26 (21.5%) |
| Total (Category) | 451 (58.7%) | 317 (41.3%) |
| Total (Overall) | 5,364 (50.8%) | 5,190 (49.2%) |
Employment Industries by Sex in Broadview Heights
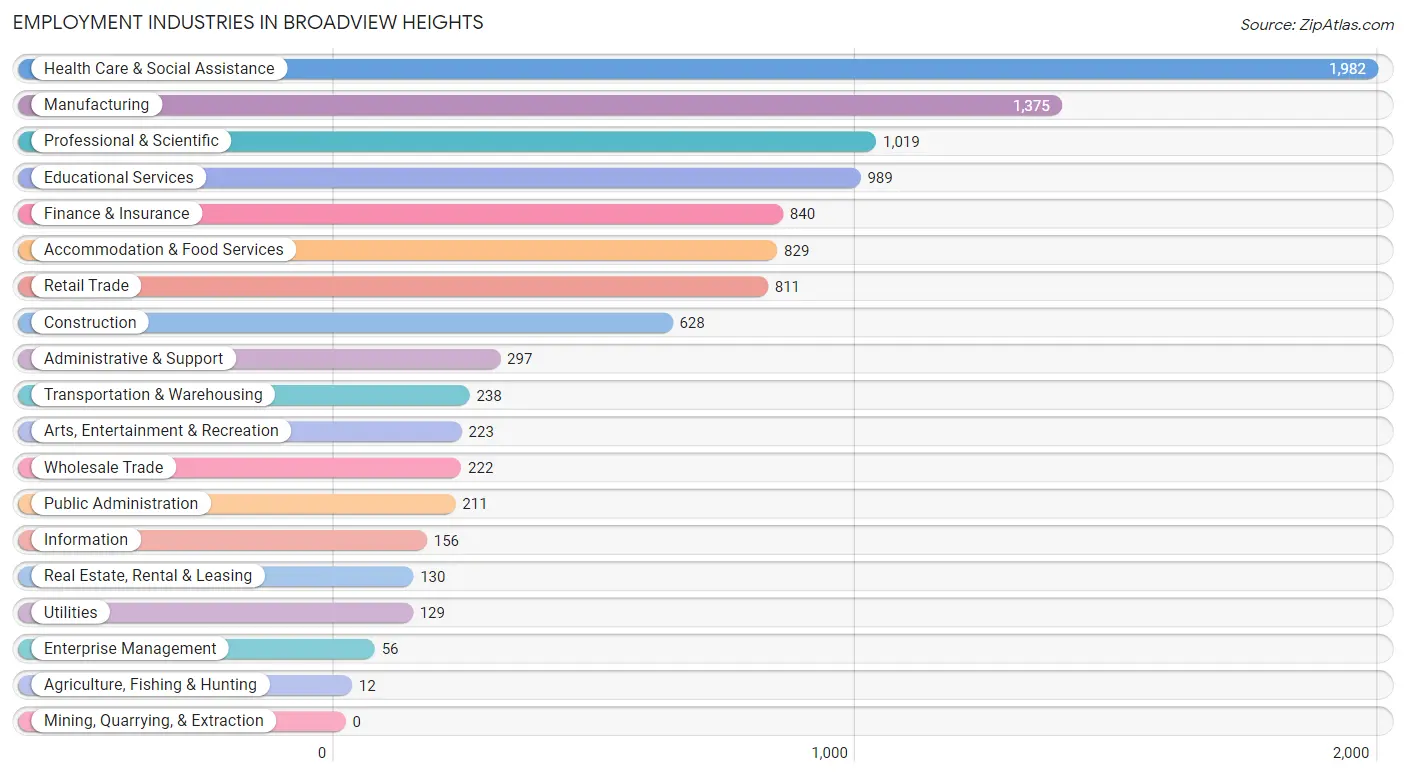
Employment Industries in Broadview Heights
The major employment industries in Broadview Heights include Health Care & Social Assistance (1,982 | 18.8%), Manufacturing (1,375 | 13.0%), Professional & Scientific (1,019 | 9.7%), Educational Services (989 | 9.4%), and Finance & Insurance (840 | 8.0%).
Employment Industries by Sex in Broadview Heights
The Broadview Heights industries that see more men than women are Agriculture, Fishing & Hunting (100.0%), Utilities (100.0%), and Construction (89.5%), whereas the industries that tend to have a higher number of women are Educational Services (83.4%), Enterprise Management (78.6%), and Administrative & Support (77.1%).
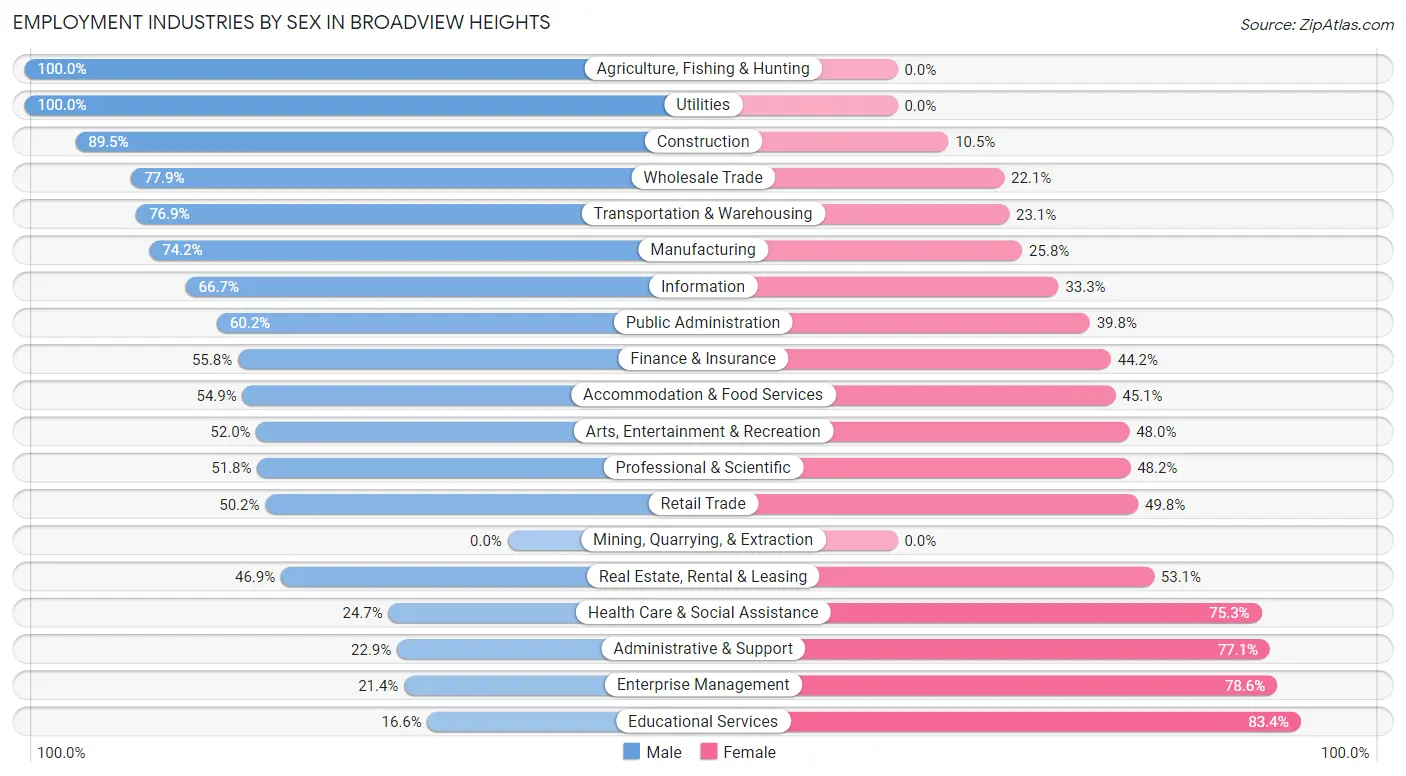
| Industry | Male | Female |
| Agriculture, Fishing & Hunting | 12 (100.0%) | 0 (0.0%) |
| Mining, Quarrying, & Extraction | 0 (0.0%) | 0 (0.0%) |
| Construction | 562 (89.5%) | 66 (10.5%) |
| Manufacturing | 1,020 (74.2%) | 355 (25.8%) |
| Wholesale Trade | 173 (77.9%) | 49 (22.1%) |
| Retail Trade | 407 (50.2%) | 404 (49.8%) |
| Transportation & Warehousing | 183 (76.9%) | 55 (23.1%) |
| Utilities | 129 (100.0%) | 0 (0.0%) |
| Information | 104 (66.7%) | 52 (33.3%) |
| Finance & Insurance | 469 (55.8%) | 371 (44.2%) |
| Real Estate, Rental & Leasing | 61 (46.9%) | 69 (53.1%) |
| Professional & Scientific | 528 (51.8%) | 491 (48.2%) |
| Enterprise Management | 12 (21.4%) | 44 (78.6%) |
| Administrative & Support | 68 (22.9%) | 229 (77.1%) |
| Educational Services | 164 (16.6%) | 825 (83.4%) |
| Health Care & Social Assistance | 489 (24.7%) | 1,493 (75.3%) |
| Arts, Entertainment & Recreation | 116 (52.0%) | 107 (48.0%) |
| Accommodation & Food Services | 455 (54.9%) | 374 (45.1%) |
| Public Administration | 127 (60.2%) | 84 (39.8%) |
| Total | 5,364 (50.8%) | 5,190 (49.2%) |
Education in Broadview Heights
School Enrollment in Broadview Heights
The most common levels of schooling among the 4,445 students in Broadview Heights are middle school (1,107 | 24.9%), high school (918 | 20.6%), and elementary school (704 | 15.8%).
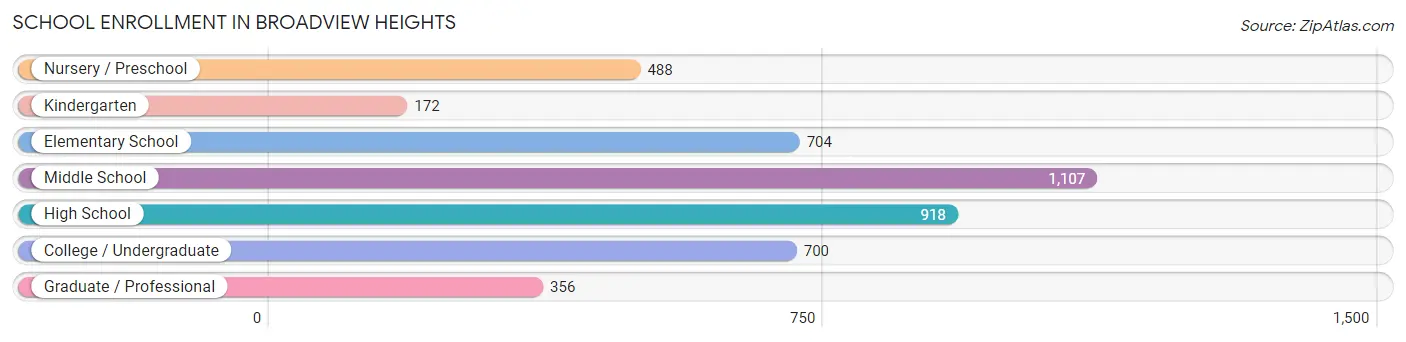
| School Level | # Students | % Students |
| Nursery / Preschool | 488 | 11.0% |
| Kindergarten | 172 | 3.9% |
| Elementary School | 704 | 15.8% |
| Middle School | 1,107 | 24.9% |
| High School | 918 | 20.6% |
| College / Undergraduate | 700 | 15.8% |
| Graduate / Professional | 356 | 8.0% |
| Total | 4,445 | 100.0% |
School Enrollment by Age by Funding Source in Broadview Heights
Out of a total of 4,445 students who are enrolled in schools in Broadview Heights, 1,178 (26.5%) attend a private institution, while the remaining 3,267 (73.5%) are enrolled in public schools. The age group of 3 to 4 year olds has the highest likelihood of being enrolled in private schools, with 255 (75.9% in the age bracket) enrolled. Conversely, the age group of 25 to 34 year olds has the lowest likelihood of being enrolled in a private school, with 190 (100.0% in the age bracket) attending a public institution.
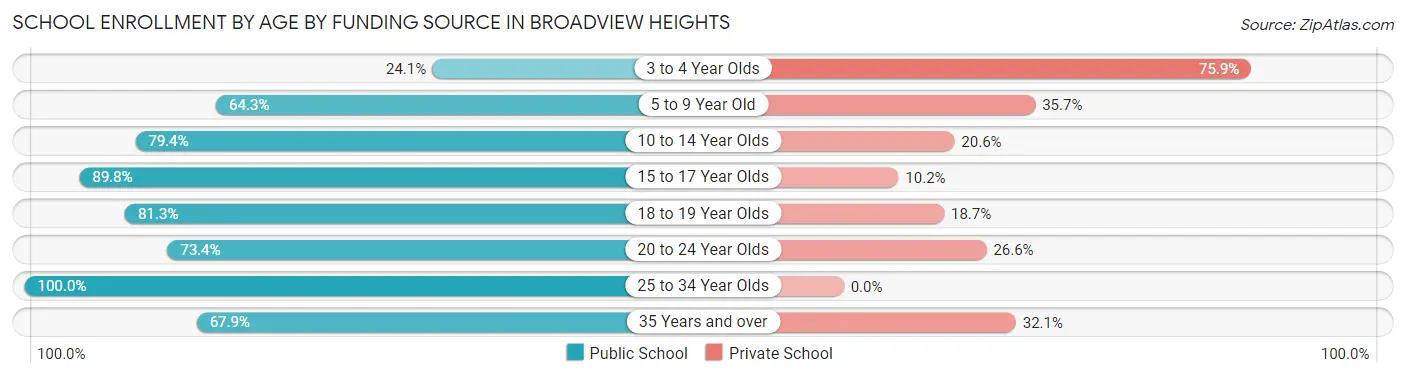
| Age Bracket | Public School | Private School |
| 3 to 4 Year Olds | 81 (24.1%) | 255 (75.9%) |
| 5 to 9 Year Old | 604 (64.3%) | 335 (35.7%) |
| 10 to 14 Year Olds | 981 (79.4%) | 255 (20.6%) |
| 15 to 17 Year Olds | 626 (89.8%) | 71 (10.2%) |
| 18 to 19 Year Olds | 326 (81.3%) | 75 (18.7%) |
| 20 to 24 Year Olds | 243 (73.4%) | 88 (26.6%) |
| 25 to 34 Year Olds | 190 (100.0%) | 0 (0.0%) |
| 35 Years and over | 214 (67.9%) | 101 (32.1%) |
| Total | 3,267 (73.5%) | 1,178 (26.5%) |
Educational Attainment by Field of Study in Broadview Heights
Business (1,978 | 23.4%), science & technology (1,392 | 16.5%), bio, nature & agricultural (842 | 10.0%), education (776 | 9.2%), and engineering (699 | 8.3%) are the most common fields of study among 8,461 individuals in Broadview Heights who have obtained a bachelor's degree or higher.
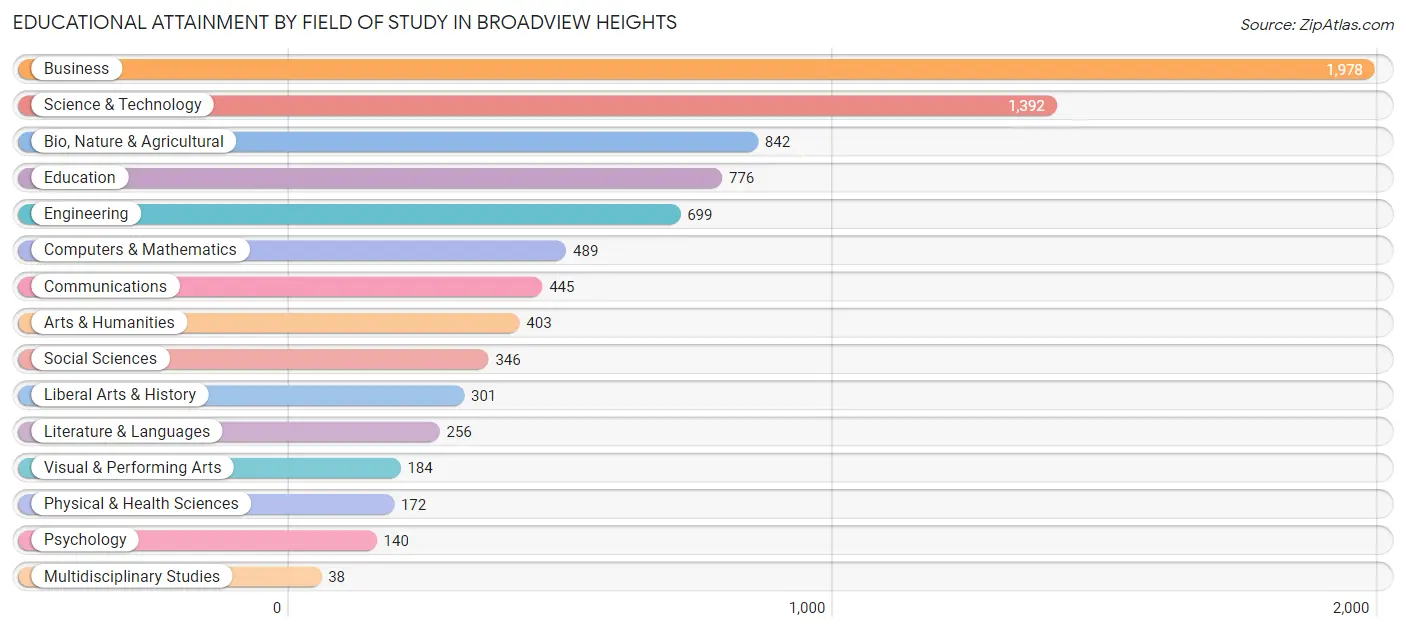
| Field of Study | # Graduates | % Graduates |
| Computers & Mathematics | 489 | 5.8% |
| Bio, Nature & Agricultural | 842 | 10.0% |
| Physical & Health Sciences | 172 | 2.0% |
| Psychology | 140 | 1.7% |
| Social Sciences | 346 | 4.1% |
| Engineering | 699 | 8.3% |
| Multidisciplinary Studies | 38 | 0.4% |
| Science & Technology | 1,392 | 16.5% |
| Business | 1,978 | 23.4% |
| Education | 776 | 9.2% |
| Literature & Languages | 256 | 3.0% |
| Liberal Arts & History | 301 | 3.6% |
| Visual & Performing Arts | 184 | 2.2% |
| Communications | 445 | 5.3% |
| Arts & Humanities | 403 | 4.8% |
| Total | 8,461 | 100.0% |
Transportation & Commute in Broadview Heights
Vehicle Availability by Sex in Broadview Heights
The most prevalent vehicle ownership categories in Broadview Heights are males with 2 vehicles (2,816, accounting for 53.2%) and females with 2 vehicles (2,312, making up 56.1%).
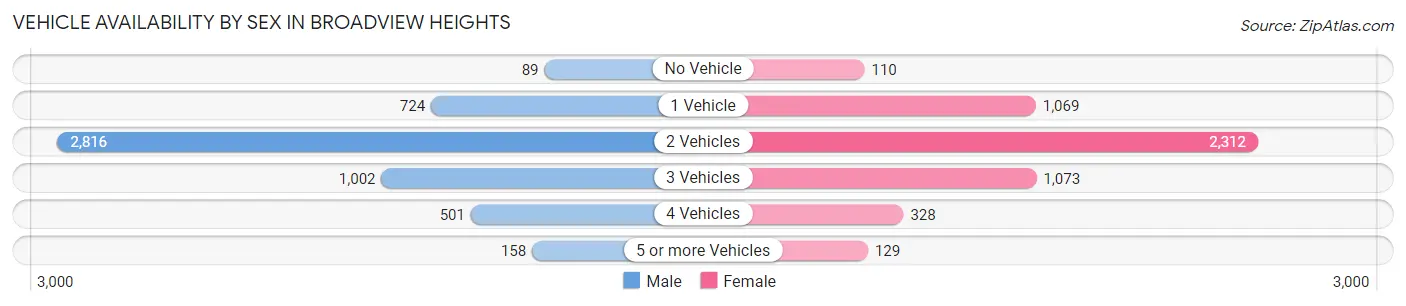
| Vehicles Available | Male | Female |
| No Vehicle | 89 (1.7%) | 110 (2.2%) |
| 1 Vehicle | 724 (13.7%) | 1,069 (21.3%) |
| 2 Vehicles | 2,816 (53.2%) | 2,312 (46.1%) |
| 3 Vehicles | 1,002 (18.9%) | 1,073 (21.4%) |
| 4 Vehicles | 501 (9.5%) | 328 (6.5%) |
| 5 or more Vehicles | 158 (3.0%) | 129 (2.6%) |
| Total | 5,290 (100.0%) | 5,021 (100.0%) |
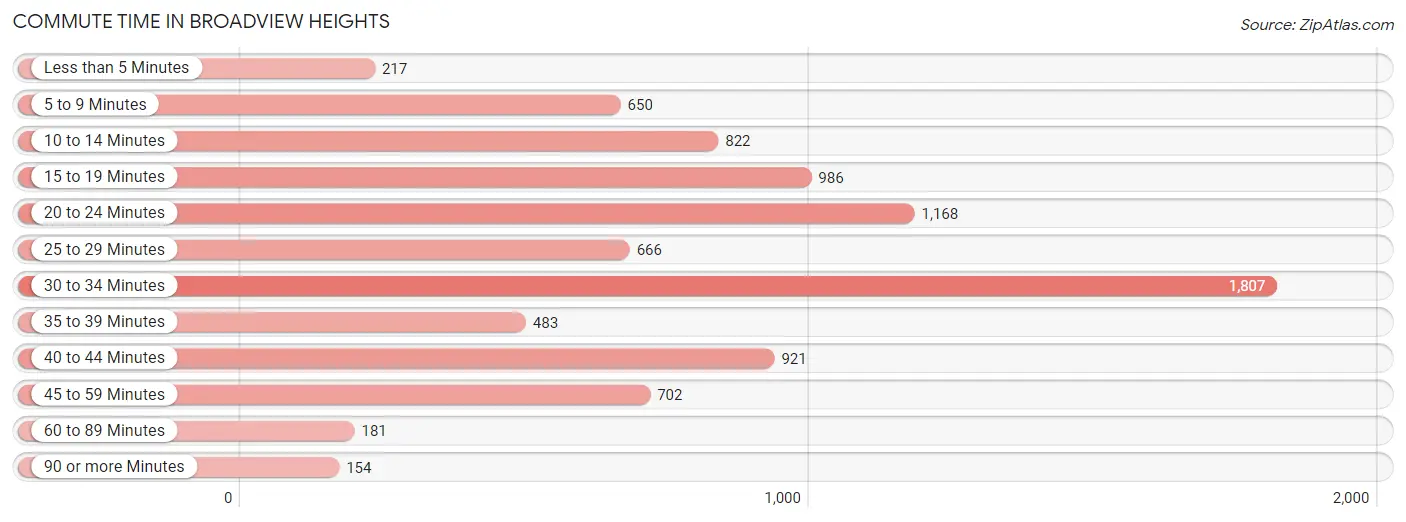
Commute Time in Broadview Heights
The most frequently occuring commute durations in Broadview Heights are 30 to 34 minutes (1,807 commuters, 20.6%), 20 to 24 minutes (1,168 commuters, 13.3%), and 15 to 19 minutes (986 commuters, 11.3%).
| Commute Time | # Commuters | % Commuters |
| Less than 5 Minutes | 217 | 2.5% |
| 5 to 9 Minutes | 650 | 7.4% |
| 10 to 14 Minutes | 822 | 9.4% |
| 15 to 19 Minutes | 986 | 11.3% |
| 20 to 24 Minutes | 1,168 | 13.3% |
| 25 to 29 Minutes | 666 | 7.6% |
| 30 to 34 Minutes | 1,807 | 20.6% |
| 35 to 39 Minutes | 483 | 5.5% |
| 40 to 44 Minutes | 921 | 10.5% |
| 45 to 59 Minutes | 702 | 8.0% |
| 60 to 89 Minutes | 181 | 2.1% |
| 90 or more Minutes | 154 | 1.8% |
Commute Time by Sex in Broadview Heights
The most common commute times in Broadview Heights are 30 to 34 minutes (985 commuters, 21.4%) for males and 30 to 34 minutes (822 commuters, 19.7%) for females.
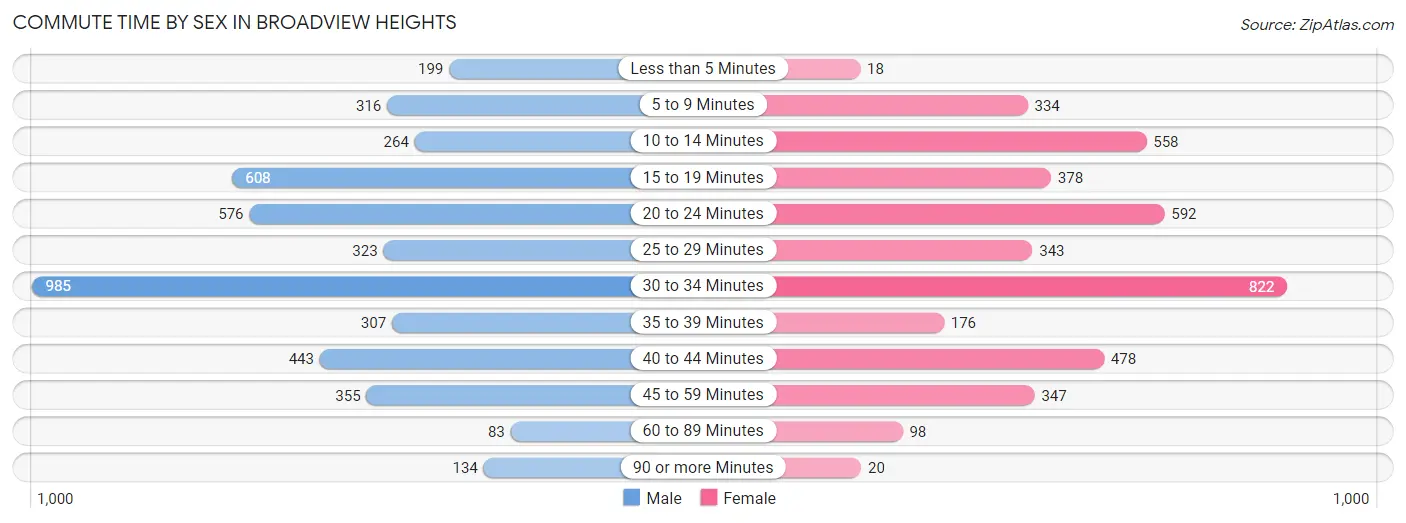
| Commute Time | Male | Female |
| Less than 5 Minutes | 199 (4.3%) | 18 (0.4%) |
| 5 to 9 Minutes | 316 (6.9%) | 334 (8.0%) |
| 10 to 14 Minutes | 264 (5.8%) | 558 (13.4%) |
| 15 to 19 Minutes | 608 (13.2%) | 378 (9.1%) |
| 20 to 24 Minutes | 576 (12.5%) | 592 (14.2%) |
| 25 to 29 Minutes | 323 (7.0%) | 343 (8.2%) |
| 30 to 34 Minutes | 985 (21.4%) | 822 (19.7%) |
| 35 to 39 Minutes | 307 (6.7%) | 176 (4.2%) |
| 40 to 44 Minutes | 443 (9.7%) | 478 (11.5%) |
| 45 to 59 Minutes | 355 (7.7%) | 347 (8.3%) |
| 60 to 89 Minutes | 83 (1.8%) | 98 (2.4%) |
| 90 or more Minutes | 134 (2.9%) | 20 (0.5%) |
Time of Departure to Work by Sex in Broadview Heights
The most frequent times of departure to work in Broadview Heights are 7:00 AM to 7:29 AM (719, 15.7%) for males and 7:00 AM to 7:29 AM (852, 20.5%) for females.
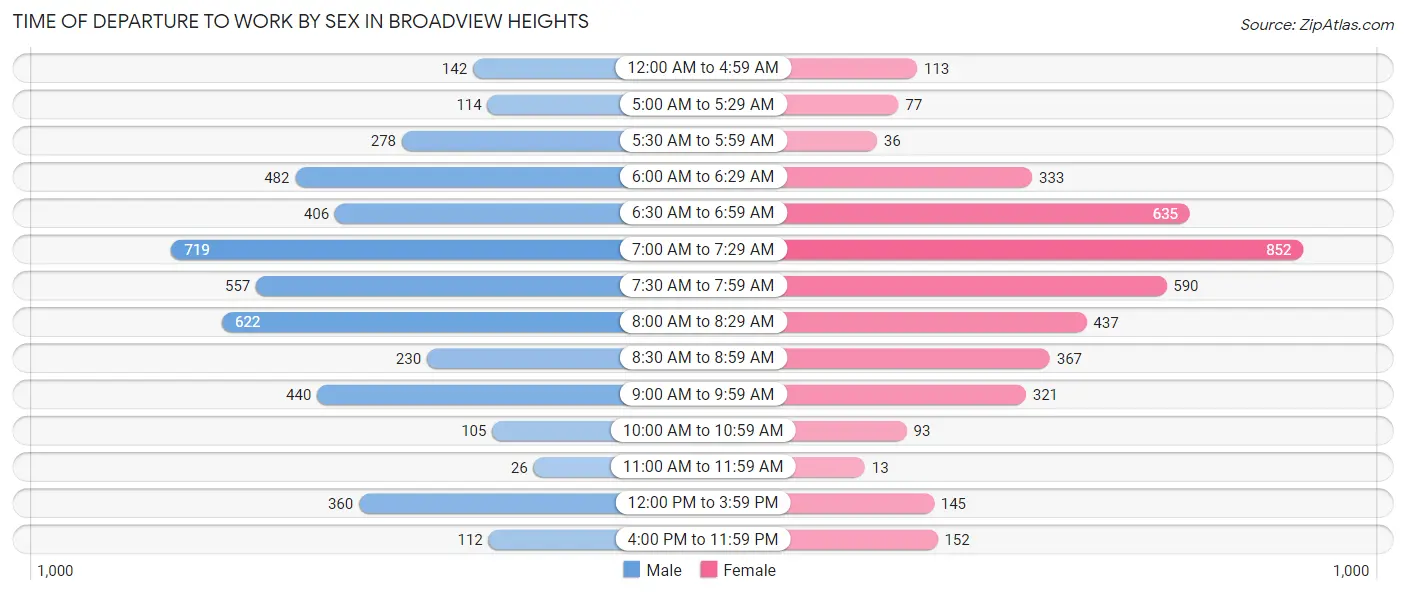
| Time of Departure | Male | Female |
| 12:00 AM to 4:59 AM | 142 (3.1%) | 113 (2.7%) |
| 5:00 AM to 5:29 AM | 114 (2.5%) | 77 (1.8%) |
| 5:30 AM to 5:59 AM | 278 (6.0%) | 36 (0.9%) |
| 6:00 AM to 6:29 AM | 482 (10.5%) | 333 (8.0%) |
| 6:30 AM to 6:59 AM | 406 (8.8%) | 635 (15.2%) |
| 7:00 AM to 7:29 AM | 719 (15.7%) | 852 (20.5%) |
| 7:30 AM to 7:59 AM | 557 (12.1%) | 590 (14.2%) |
| 8:00 AM to 8:29 AM | 622 (13.5%) | 437 (10.5%) |
| 8:30 AM to 8:59 AM | 230 (5.0%) | 367 (8.8%) |
| 9:00 AM to 9:59 AM | 440 (9.6%) | 321 (7.7%) |
| 10:00 AM to 10:59 AM | 105 (2.3%) | 93 (2.2%) |
| 11:00 AM to 11:59 AM | 26 (0.6%) | 13 (0.3%) |
| 12:00 PM to 3:59 PM | 360 (7.8%) | 145 (3.5%) |
| 4:00 PM to 11:59 PM | 112 (2.4%) | 152 (3.6%) |
| Total | 4,593 (100.0%) | 4,164 (100.0%) |
Housing Occupancy in Broadview Heights
Occupancy by Ownership in Broadview Heights
Of the total 8,396 dwellings in Broadview Heights, owner-occupied units account for 6,987 (83.2%), while renter-occupied units make up 1,409 (16.8%).
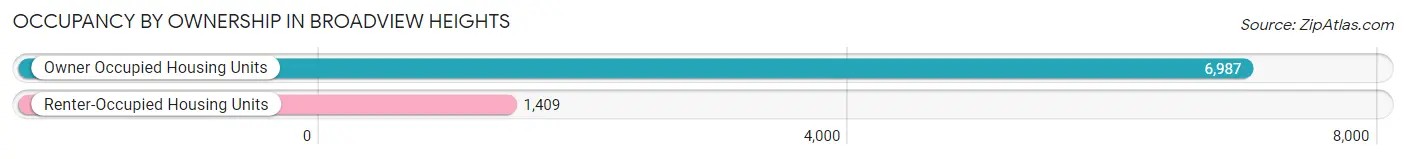
| Occupancy | # Housing Units | % Housing Units |
| Owner Occupied Housing Units | 6,987 | 83.2% |
| Renter-Occupied Housing Units | 1,409 | 16.8% |
| Total Occupied Housing Units | 8,396 | 100.0% |
Occupancy by Household Size in Broadview Heights
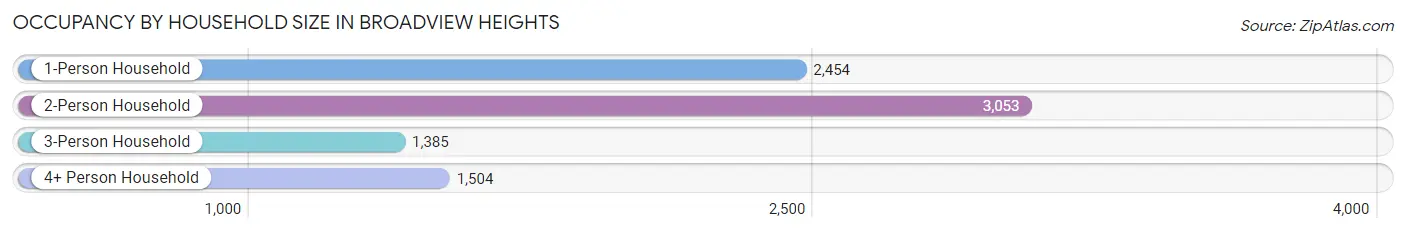
| Household Size | # Housing Units | % Housing Units |
| 1-Person Household | 2,454 | 29.2% |
| 2-Person Household | 3,053 | 36.4% |
| 3-Person Household | 1,385 | 16.5% |
| 4+ Person Household | 1,504 | 17.9% |
| Total Housing Units | 8,396 | 100.0% |
Occupancy by Ownership by Household Size in Broadview Heights
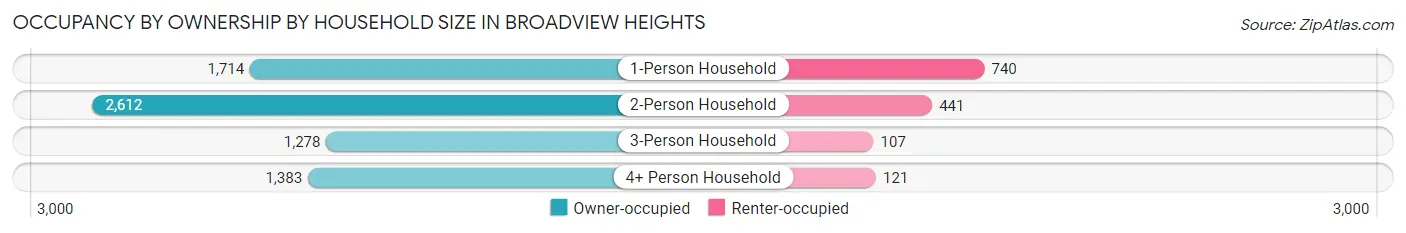
| Household Size | Owner-occupied | Renter-occupied |
| 1-Person Household | 1,714 (69.9%) | 740 (30.1%) |
| 2-Person Household | 2,612 (85.6%) | 441 (14.4%) |
| 3-Person Household | 1,278 (92.3%) | 107 (7.7%) |
| 4+ Person Household | 1,383 (91.9%) | 121 (8.1%) |
| Total Housing Units | 6,987 (83.2%) | 1,409 (16.8%) |
Occupancy by Educational Attainment in Broadview Heights
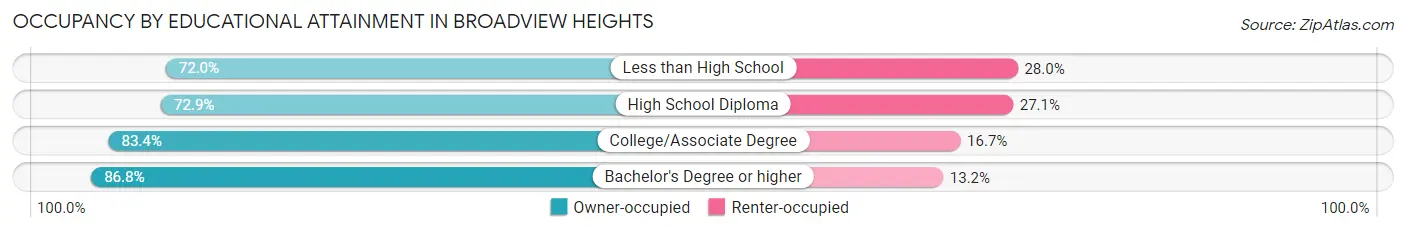
| Household Size | Owner-occupied | Renter-occupied |
| Less than High School | 131 (72.0%) | 51 (28.0%) |
| High School Diploma | 1,107 (72.9%) | 411 (27.1%) |
| College/Associate Degree | 1,497 (83.4%) | 299 (16.7%) |
| Bachelor's Degree or higher | 4,252 (86.8%) | 648 (13.2%) |
Occupancy by Age of Householder in Broadview Heights
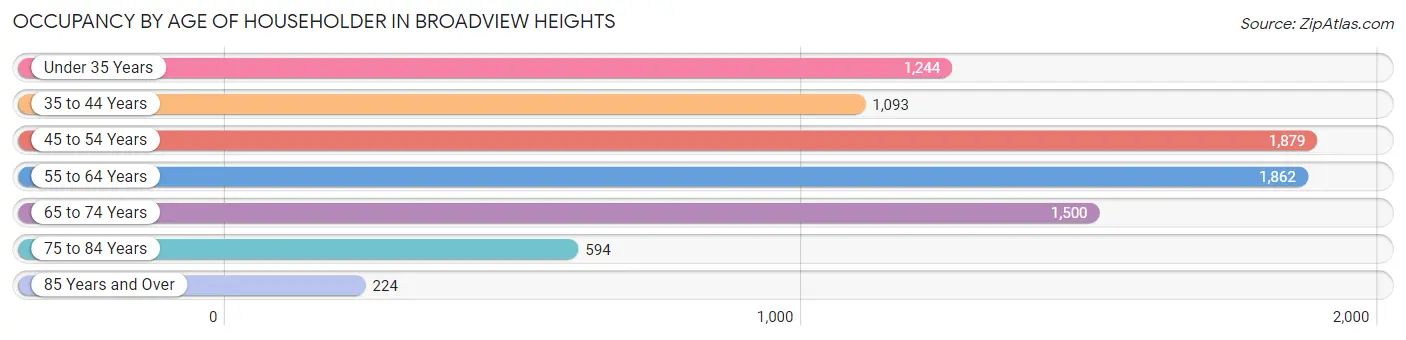
| Age Bracket | # Households | % Households |
| Under 35 Years | 1,244 | 14.8% |
| 35 to 44 Years | 1,093 | 13.0% |
| 45 to 54 Years | 1,879 | 22.4% |
| 55 to 64 Years | 1,862 | 22.2% |
| 65 to 74 Years | 1,500 | 17.9% |
| 75 to 84 Years | 594 | 7.1% |
| 85 Years and Over | 224 | 2.7% |
| Total | 8,396 | 100.0% |
Housing Finances in Broadview Heights
Median Income by Occupancy in Broadview Heights
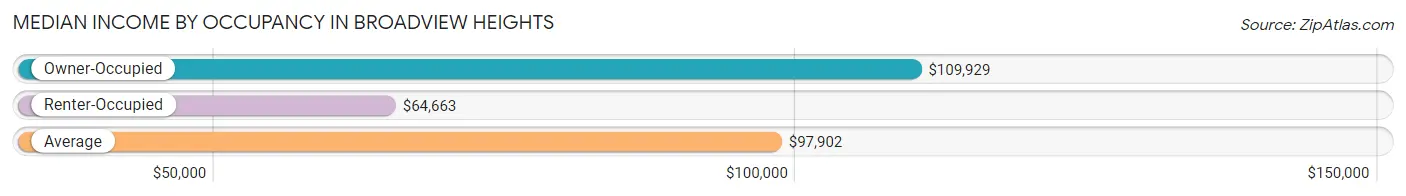
| Occupancy Type | # Households | Median Income |
| Owner-Occupied | 6,987 (83.2%) | $109,929 |
| Renter-Occupied | 1,409 (16.8%) | $64,663 |
| Average | 8,396 (100.0%) | $97,902 |
Occupancy by Householder Income Bracket in Broadview Heights
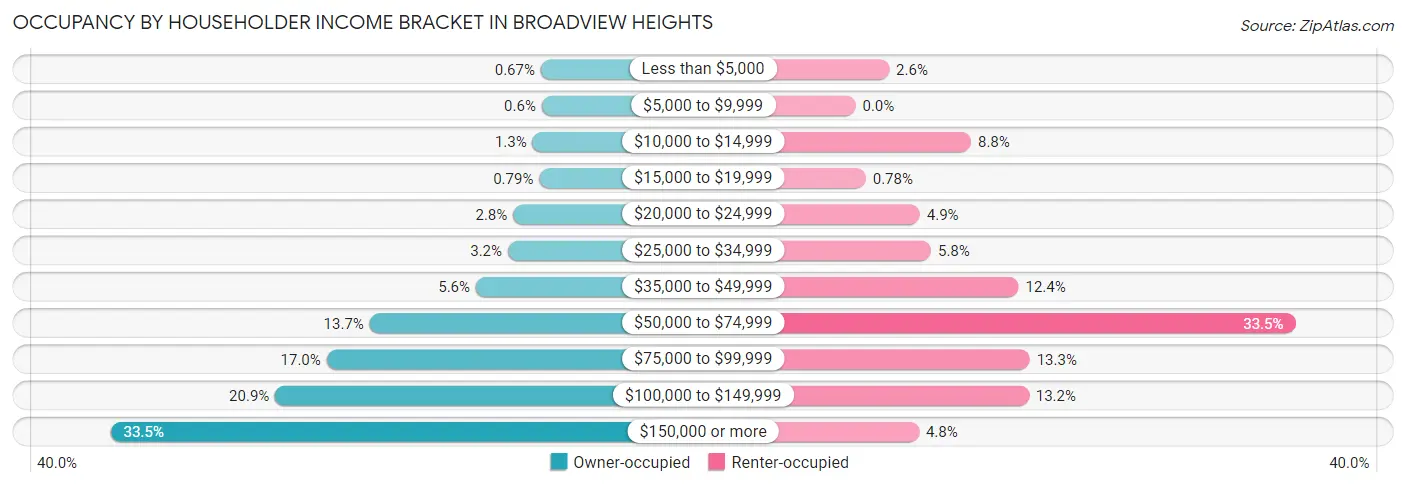
| Income Bracket | Owner-occupied | Renter-occupied |
| Less than $5,000 | 47 (0.7%) | 36 (2.6%) |
| $5,000 to $9,999 | 42 (0.6%) | 0 (0.0%) |
| $10,000 to $14,999 | 91 (1.3%) | 124 (8.8%) |
| $15,000 to $19,999 | 55 (0.8%) | 11 (0.8%) |
| $20,000 to $24,999 | 194 (2.8%) | 69 (4.9%) |
| $25,000 to $34,999 | 222 (3.2%) | 81 (5.8%) |
| $35,000 to $49,999 | 393 (5.6%) | 175 (12.4%) |
| $50,000 to $74,999 | 958 (13.7%) | 472 (33.5%) |
| $75,000 to $99,999 | 1,187 (17.0%) | 187 (13.3%) |
| $100,000 to $149,999 | 1,461 (20.9%) | 186 (13.2%) |
| $150,000 or more | 2,337 (33.5%) | 68 (4.8%) |
| Total | 6,987 (100.0%) | 1,409 (100.0%) |
Monthly Housing Cost Tiers in Broadview Heights
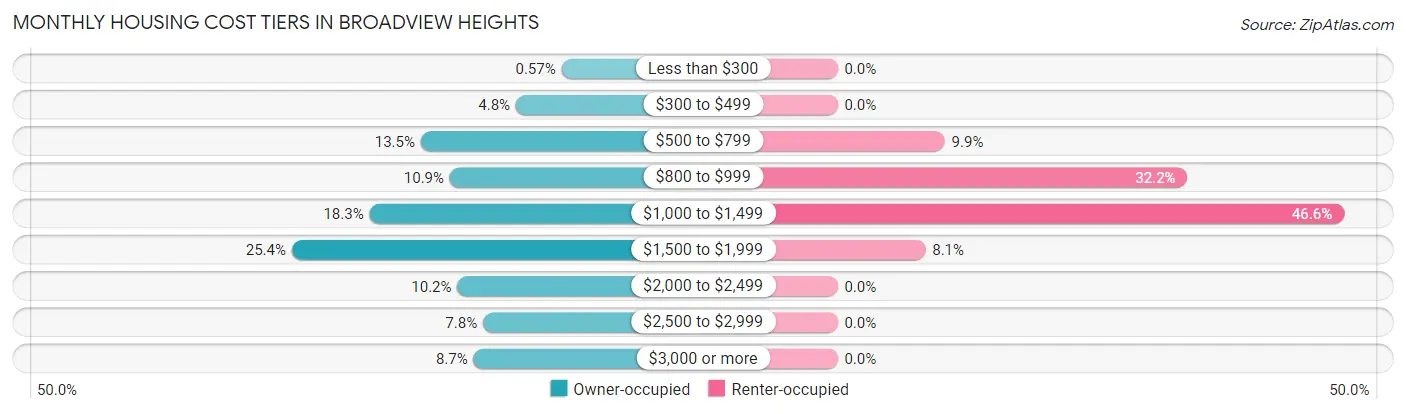
| Monthly Cost | Owner-occupied | Renter-occupied |
| Less than $300 | 40 (0.6%) | 0 (0.0%) |
| $300 to $499 | 333 (4.8%) | 0 (0.0%) |
| $500 to $799 | 945 (13.5%) | 139 (9.9%) |
| $800 to $999 | 758 (10.8%) | 454 (32.2%) |
| $1,000 to $1,499 | 1,275 (18.2%) | 657 (46.6%) |
| $1,500 to $1,999 | 1,775 (25.4%) | 114 (8.1%) |
| $2,000 to $2,499 | 710 (10.2%) | 0 (0.0%) |
| $2,500 to $2,999 | 545 (7.8%) | 0 (0.0%) |
| $3,000 or more | 606 (8.7%) | 0 (0.0%) |
| Total | 6,987 (100.0%) | 1,409 (100.0%) |
Physical Housing Characteristics in Broadview Heights
Housing Structures in Broadview Heights
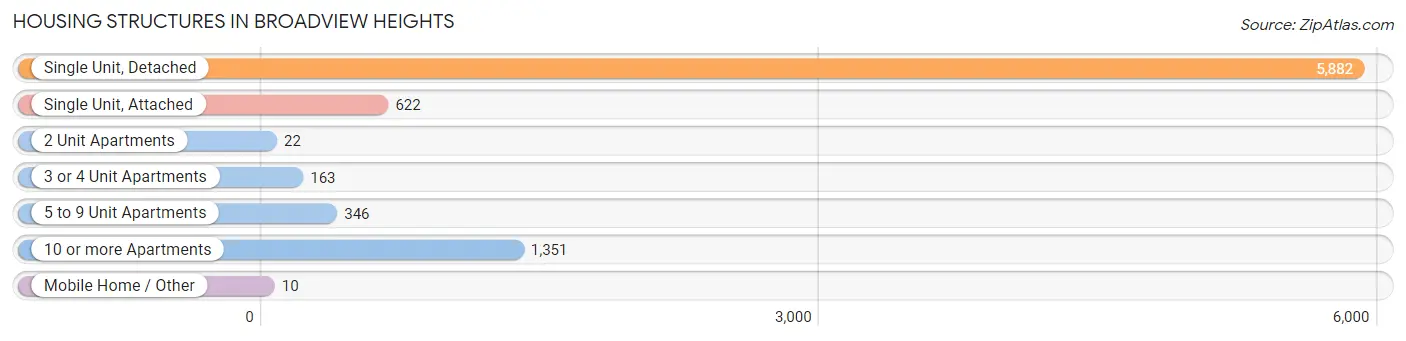
| Structure Type | # Housing Units | % Housing Units |
| Single Unit, Detached | 5,882 | 70.1% |
| Single Unit, Attached | 622 | 7.4% |
| 2 Unit Apartments | 22 | 0.3% |
| 3 or 4 Unit Apartments | 163 | 1.9% |
| 5 to 9 Unit Apartments | 346 | 4.1% |
| 10 or more Apartments | 1,351 | 16.1% |
| Mobile Home / Other | 10 | 0.1% |
| Total | 8,396 | 100.0% |
Housing Structures by Occupancy in Broadview Heights
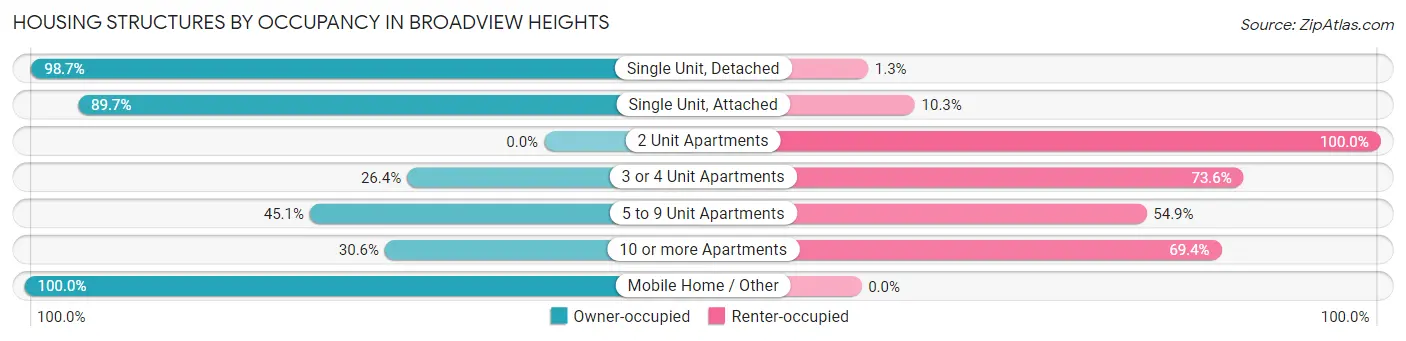
| Structure Type | Owner-occupied | Renter-occupied |
| Single Unit, Detached | 5,806 (98.7%) | 76 (1.3%) |
| Single Unit, Attached | 558 (89.7%) | 64 (10.3%) |
| 2 Unit Apartments | 0 (0.0%) | 22 (100.0%) |
| 3 or 4 Unit Apartments | 43 (26.4%) | 120 (73.6%) |
| 5 to 9 Unit Apartments | 156 (45.1%) | 190 (54.9%) |
| 10 or more Apartments | 414 (30.6%) | 937 (69.4%) |
| Mobile Home / Other | 10 (100.0%) | 0 (0.0%) |
| Total | 6,987 (83.2%) | 1,409 (16.8%) |
Housing Structures by Number of Rooms in Broadview Heights
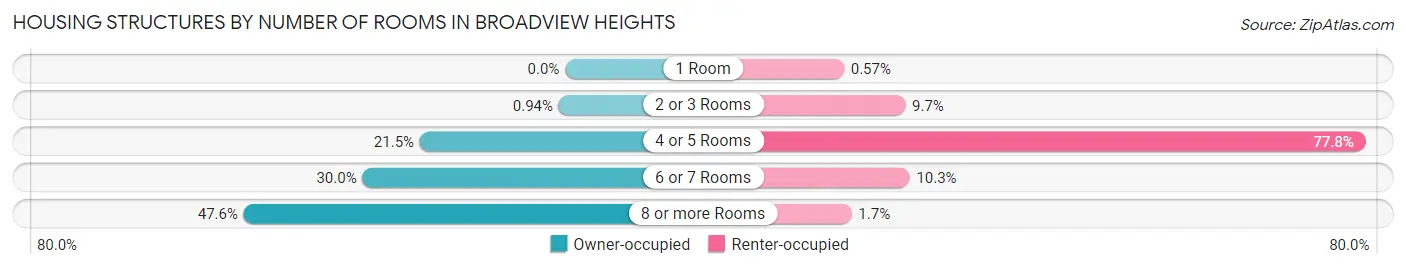
| Number of Rooms | Owner-occupied | Renter-occupied |
| 1 Room | 0 (0.0%) | 8 (0.6%) |
| 2 or 3 Rooms | 66 (0.9%) | 136 (9.7%) |
| 4 or 5 Rooms | 1,502 (21.5%) | 1,096 (77.8%) |
| 6 or 7 Rooms | 2,096 (30.0%) | 145 (10.3%) |
| 8 or more Rooms | 3,323 (47.6%) | 24 (1.7%) |
| Total | 6,987 (100.0%) | 1,409 (100.0%) |
Housing Structure by Heating Type in Broadview Heights
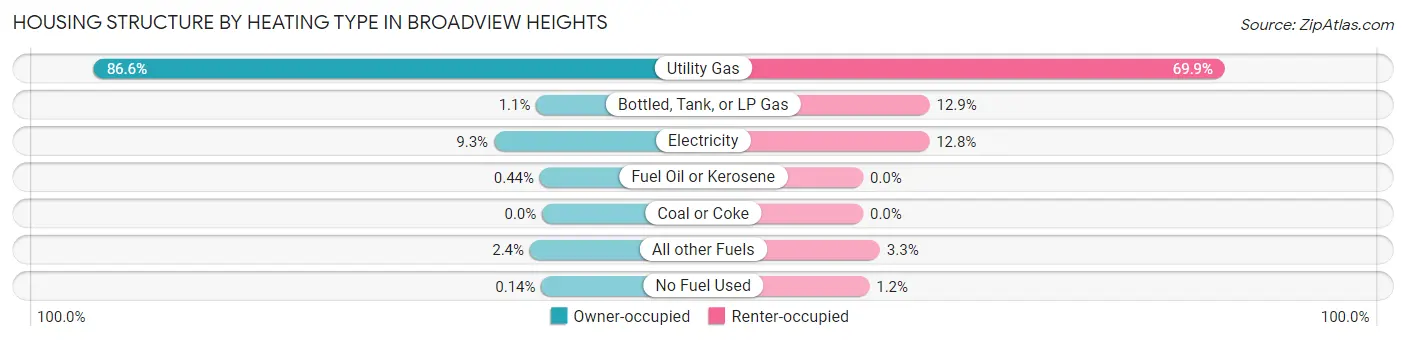
| Heating Type | Owner-occupied | Renter-occupied |
| Utility Gas | 6,053 (86.6%) | 985 (69.9%) |
| Bottled, Tank, or LP Gas | 78 (1.1%) | 181 (12.9%) |
| Electricity | 650 (9.3%) | 180 (12.8%) |
| Fuel Oil or Kerosene | 31 (0.4%) | 0 (0.0%) |
| Coal or Coke | 0 (0.0%) | 0 (0.0%) |
| All other Fuels | 165 (2.4%) | 46 (3.3%) |
| No Fuel Used | 10 (0.1%) | 17 (1.2%) |
| Total | 6,987 (100.0%) | 1,409 (100.0%) |
Household Vehicle Usage in Broadview Heights
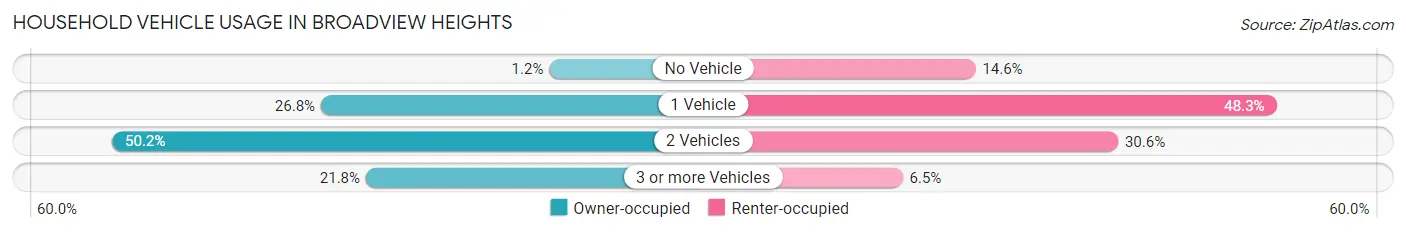
| Vehicles per Household | Owner-occupied | Renter-occupied |
| No Vehicle | 86 (1.2%) | 206 (14.6%) |
| 1 Vehicle | 1,873 (26.8%) | 681 (48.3%) |
| 2 Vehicles | 3,507 (50.2%) | 431 (30.6%) |
| 3 or more Vehicles | 1,521 (21.8%) | 91 (6.5%) |
| Total | 6,987 (100.0%) | 1,409 (100.0%) |
Real Estate & Mortgages in Broadview Heights
Real Estate and Mortgage Overview in Broadview Heights
| Characteristic | Without Mortgage | With Mortgage |
| Housing Units | 2,510 | 4,477 |
| Median Property Value | $253,100 | $286,900 |
| Median Household Income | $83,879 | $1,824 |
| Monthly Housing Costs | $832 | $593 |
| Real Estate Taxes | $5,485 | $0 |
Property Value by Mortgage Status in Broadview Heights
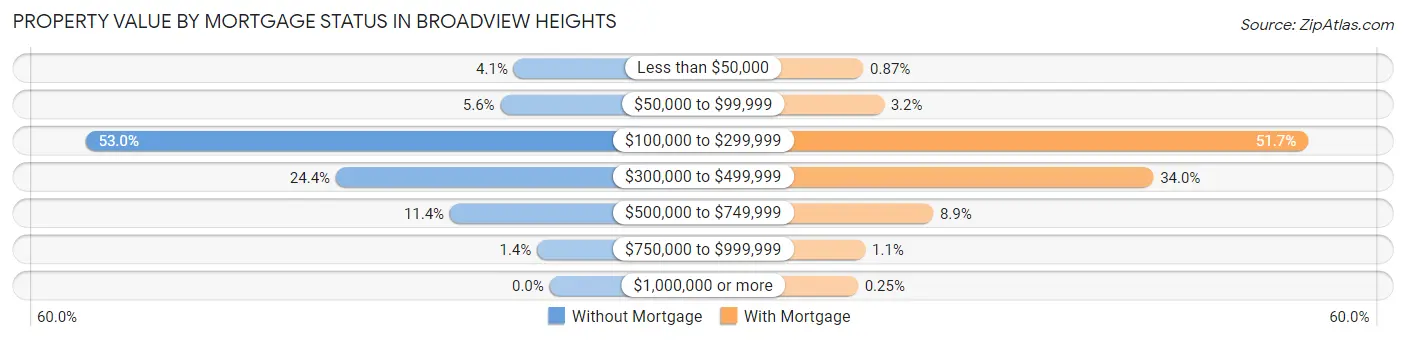
| Property Value | Without Mortgage | With Mortgage |
| Less than $50,000 | 103 (4.1%) | 39 (0.9%) |
| $50,000 to $99,999 | 141 (5.6%) | 144 (3.2%) |
| $100,000 to $299,999 | 1,331 (53.0%) | 2,315 (51.7%) |
| $300,000 to $499,999 | 613 (24.4%) | 1,523 (34.0%) |
| $500,000 to $749,999 | 286 (11.4%) | 396 (8.8%) |
| $750,000 to $999,999 | 36 (1.4%) | 49 (1.1%) |
| $1,000,000 or more | 0 (0.0%) | 11 (0.3%) |
| Total | 2,510 (100.0%) | 4,477 (100.0%) |
Household Income by Mortgage Status in Broadview Heights
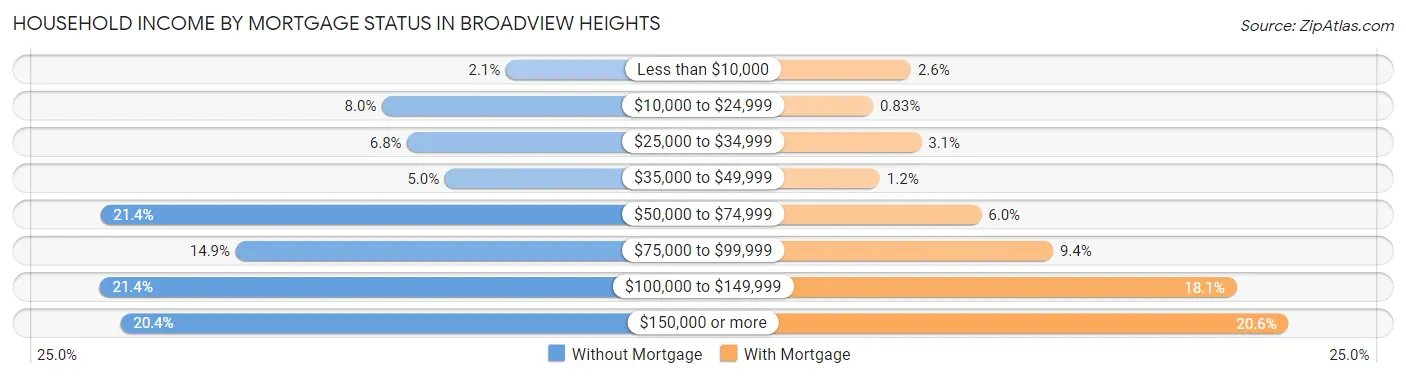
| Household Income | Without Mortgage | With Mortgage |
| Less than $10,000 | 52 (2.1%) | 118 (2.6%) |
| $10,000 to $24,999 | 200 (8.0%) | 37 (0.8%) |
| $25,000 to $34,999 | 170 (6.8%) | 140 (3.1%) |
| $35,000 to $49,999 | 125 (5.0%) | 52 (1.2%) |
| $50,000 to $74,999 | 537 (21.4%) | 268 (6.0%) |
| $75,000 to $99,999 | 375 (14.9%) | 421 (9.4%) |
| $100,000 to $149,999 | 538 (21.4%) | 812 (18.1%) |
| $150,000 or more | 513 (20.4%) | 923 (20.6%) |
| Total | 2,510 (100.0%) | 4,477 (100.0%) |
Property Value to Household Income Ratio in Broadview Heights
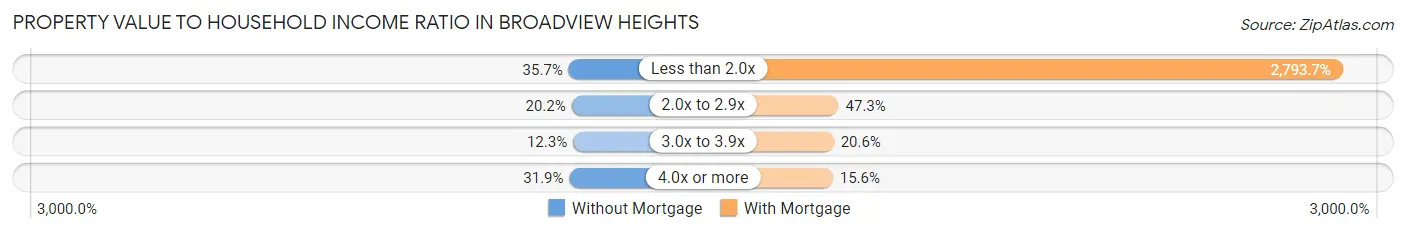
| Value-to-Income Ratio | Without Mortgage | With Mortgage |
| Less than 2.0x | 896 (35.7%) | 125,072 (2,793.7%) |
| 2.0x to 2.9x | 506 (20.2%) | 2,119 (47.3%) |
| 3.0x to 3.9x | 308 (12.3%) | 924 (20.6%) |
| 4.0x or more | 800 (31.9%) | 700 (15.6%) |
| Total | 2,510 (100.0%) | 4,477 (100.0%) |
Real Estate Taxes by Mortgage Status in Broadview Heights
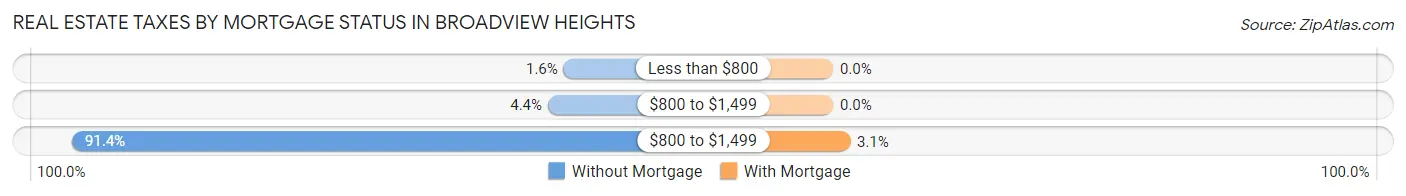
| Property Taxes | Without Mortgage | With Mortgage |
| Less than $800 | 39 (1.5%) | 0 (0.0%) |
| $800 to $1,499 | 111 (4.4%) | 0 (0.0%) |
| $800 to $1,499 | 2,293 (91.3%) | 139 (3.1%) |
| Total | 2,510 (100.0%) | 4,477 (100.0%) |
Health & Disability in Broadview Heights
Health Insurance Coverage by Age in Broadview Heights
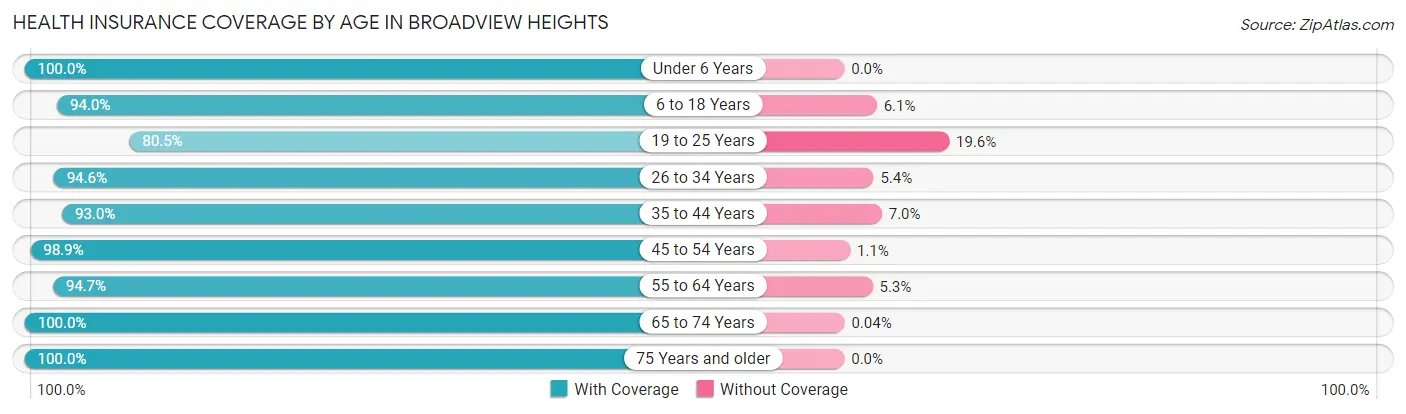
| Age Bracket | With Coverage | Without Coverage |
| Under 6 Years | 1,446 (100.0%) | 0 (0.0%) |
| 6 to 18 Years | 2,685 (94.0%) | 173 (6.0%) |
| 19 to 25 Years | 1,156 (80.4%) | 281 (19.6%) |
| 26 to 34 Years | 1,896 (94.6%) | 109 (5.4%) |
| 35 to 44 Years | 2,010 (93.0%) | 151 (7.0%) |
| 45 to 54 Years | 2,962 (98.9%) | 32 (1.1%) |
| 55 to 64 Years | 2,884 (94.7%) | 160 (5.3%) |
| 65 to 74 Years | 2,493 (100.0%) | 1 (0.0%) |
| 75 Years and older | 1,251 (100.0%) | 0 (0.0%) |
| Total | 18,783 (95.4%) | 907 (4.6%) |
Health Insurance Coverage by Citizenship Status in Broadview Heights
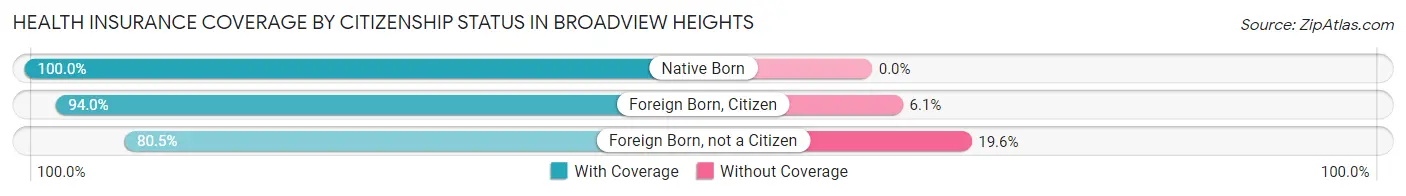
| Citizenship Status | With Coverage | Without Coverage |
| Native Born | 1,446 (100.0%) | 0 (0.0%) |
| Foreign Born, Citizen | 2,685 (94.0%) | 173 (6.0%) |
| Foreign Born, not a Citizen | 1,156 (80.4%) | 281 (19.6%) |
Health Insurance Coverage by Household Income in Broadview Heights
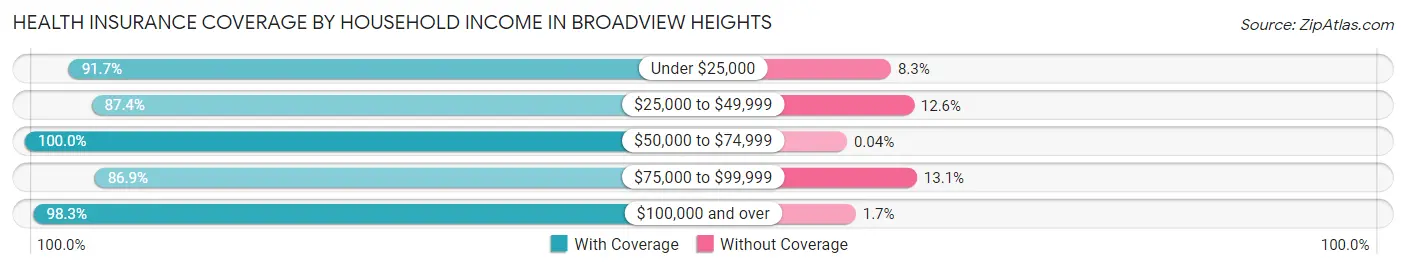
| Household Income | With Coverage | Without Coverage |
| Under $25,000 | 898 (91.7%) | 81 (8.3%) |
| $25,000 to $49,999 | 1,197 (87.4%) | 172 (12.6%) |
| $50,000 to $74,999 | 2,497 (100.0%) | 1 (0.0%) |
| $75,000 to $99,999 | 3,042 (86.9%) | 460 (13.1%) |
| $100,000 and over | 11,127 (98.3%) | 191 (1.7%) |
Public vs Private Health Insurance Coverage by Age in Broadview Heights
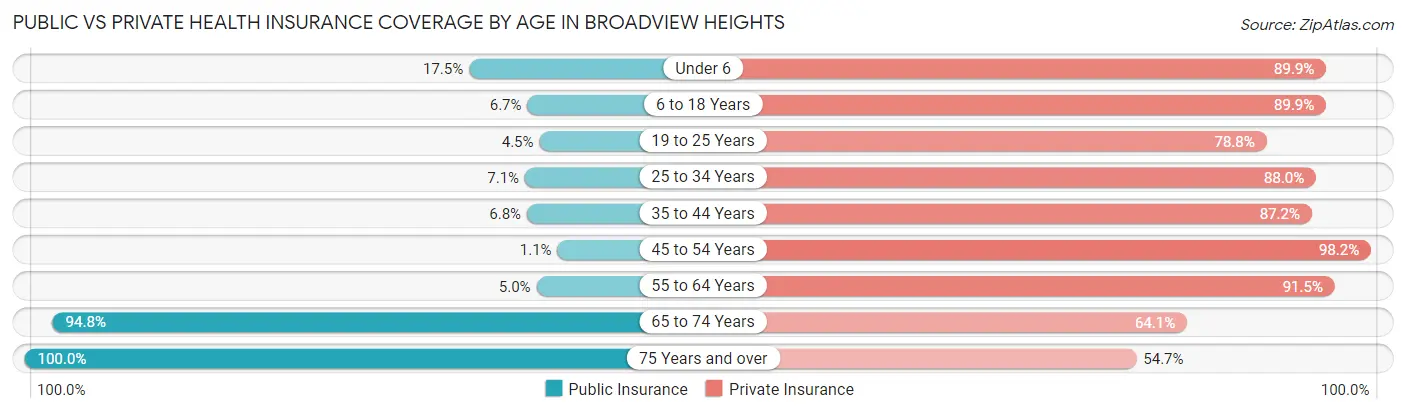
| Age Bracket | Public Insurance | Private Insurance |
| Under 6 | 253 (17.5%) | 1,300 (89.9%) |
| 6 to 18 Years | 191 (6.7%) | 2,569 (89.9%) |
| 19 to 25 Years | 64 (4.4%) | 1,133 (78.8%) |
| 25 to 34 Years | 143 (7.1%) | 1,765 (88.0%) |
| 35 to 44 Years | 146 (6.8%) | 1,885 (87.2%) |
| 45 to 54 Years | 33 (1.1%) | 2,941 (98.2%) |
| 55 to 64 Years | 152 (5.0%) | 2,785 (91.5%) |
| 65 to 74 Years | 2,364 (94.8%) | 1,598 (64.1%) |
| 75 Years and over | 1,251 (100.0%) | 684 (54.7%) |
| Total | 4,597 (23.4%) | 16,660 (84.6%) |
Disability Status by Sex by Age in Broadview Heights
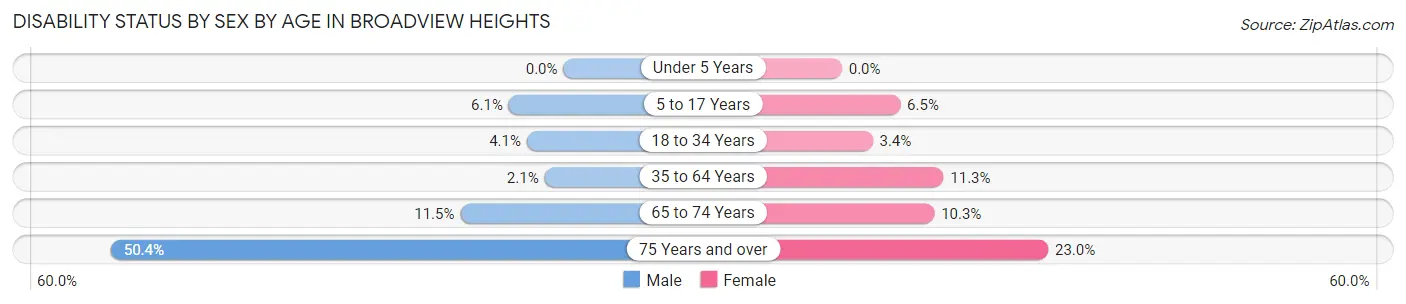
| Age Bracket | Male | Female |
| Under 5 Years | 0 (0.0%) | 0 (0.0%) |
| 5 to 17 Years | 94 (6.1%) | 89 (6.5%) |
| 18 to 34 Years | 73 (4.1%) | 63 (3.4%) |
| 35 to 64 Years | 82 (2.1%) | 485 (11.3%) |
| 65 to 74 Years | 129 (11.5%) | 141 (10.3%) |
| 75 Years and over | 251 (50.4%) | 173 (23.0%) |
Disability Class by Sex by Age in Broadview Heights
Disability Class: Hearing Difficulty
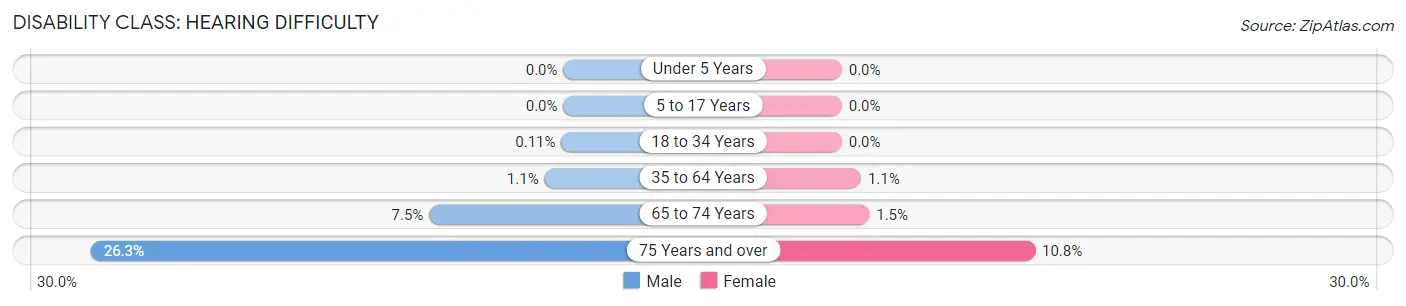
| Age Bracket | Male | Female |
| Under 5 Years | 0 (0.0%) | 0 (0.0%) |
| 5 to 17 Years | 0 (0.0%) | 0 (0.0%) |
| 18 to 34 Years | 2 (0.1%) | 0 (0.0%) |
| 35 to 64 Years | 41 (1.1%) | 46 (1.1%) |
| 65 to 74 Years | 84 (7.5%) | 21 (1.5%) |
| 75 Years and over | 131 (26.3%) | 81 (10.8%) |
Disability Class: Vision Difficulty
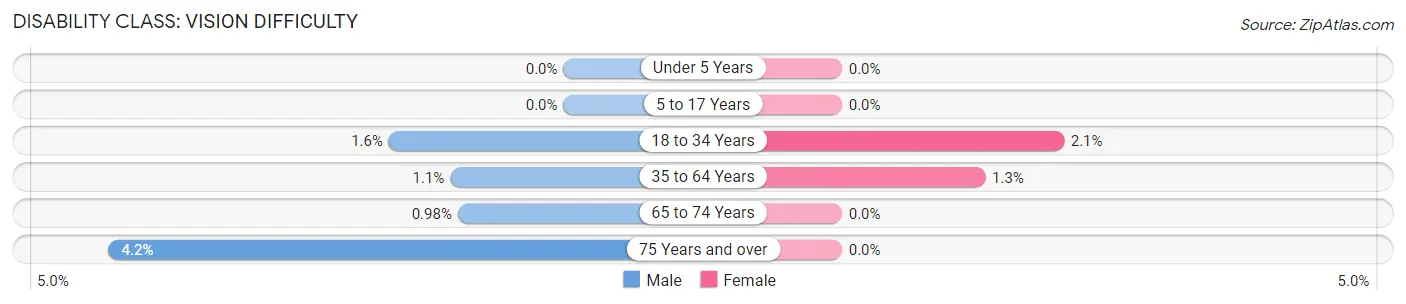
| Age Bracket | Male | Female |
| Under 5 Years | 0 (0.0%) | 0 (0.0%) |
| 5 to 17 Years | 0 (0.0%) | 0 (0.0%) |
| 18 to 34 Years | 29 (1.6%) | 38 (2.1%) |
| 35 to 64 Years | 41 (1.1%) | 57 (1.3%) |
| 65 to 74 Years | 11 (1.0%) | 0 (0.0%) |
| 75 Years and over | 21 (4.2%) | 0 (0.0%) |
Disability Class: Cognitive Difficulty
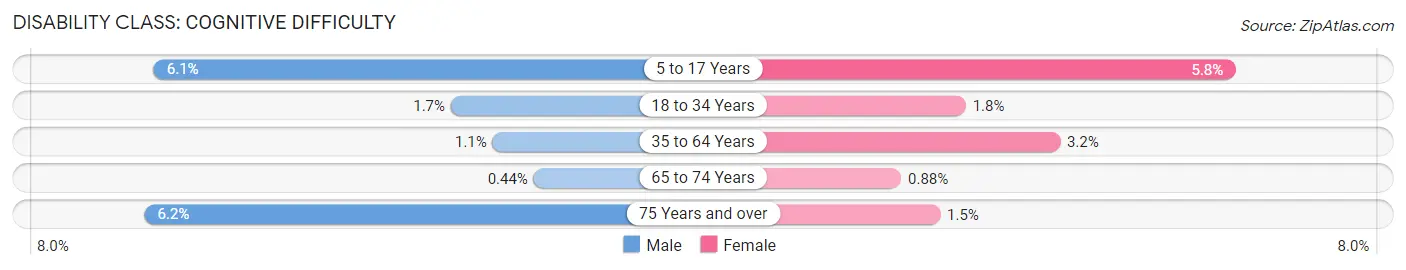
| Age Bracket | Male | Female |
| 5 to 17 Years | 94 (6.1%) | 80 (5.8%) |
| 18 to 34 Years | 30 (1.7%) | 34 (1.8%) |
| 35 to 64 Years | 41 (1.1%) | 139 (3.2%) |
| 65 to 74 Years | 5 (0.4%) | 12 (0.9%) |
| 75 Years and over | 31 (6.2%) | 11 (1.5%) |
Disability Class: Ambulatory Difficulty
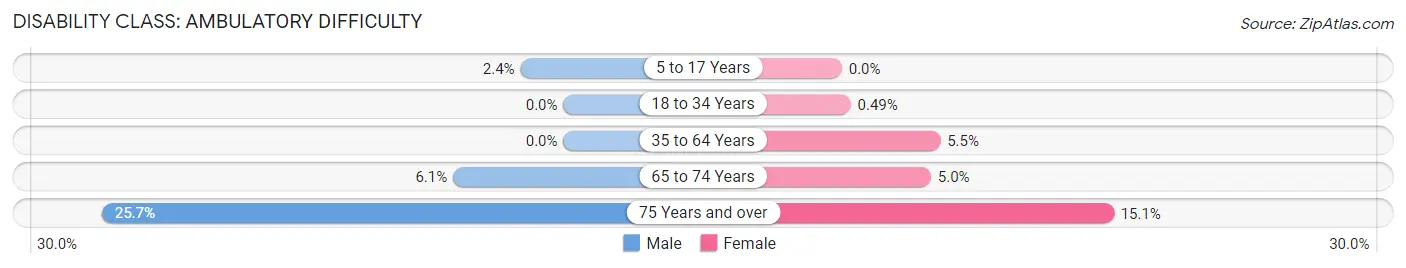
| Age Bracket | Male | Female |
| 5 to 17 Years | 37 (2.4%) | 0 (0.0%) |
| 18 to 34 Years | 0 (0.0%) | 9 (0.5%) |
| 35 to 64 Years | 0 (0.0%) | 235 (5.5%) |
| 65 to 74 Years | 69 (6.1%) | 68 (5.0%) |
| 75 Years and over | 128 (25.7%) | 114 (15.1%) |
Disability Class: Self-Care Difficulty
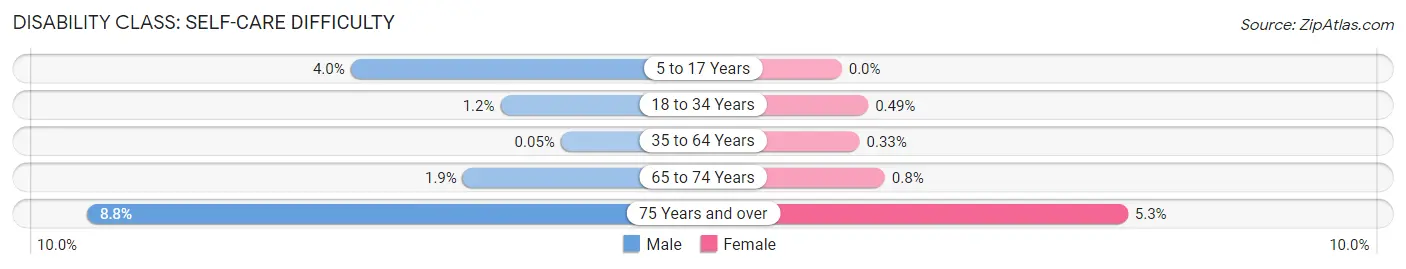
| Age Bracket | Male | Female |
| 5 to 17 Years | 61 (4.0%) | 0 (0.0%) |
| 18 to 34 Years | 21 (1.2%) | 9 (0.5%) |
| 35 to 64 Years | 2 (0.1%) | 14 (0.3%) |
| 65 to 74 Years | 21 (1.9%) | 11 (0.8%) |
| 75 Years and over | 44 (8.8%) | 40 (5.3%) |
Technology Access in Broadview Heights
Computing Device Access in Broadview Heights
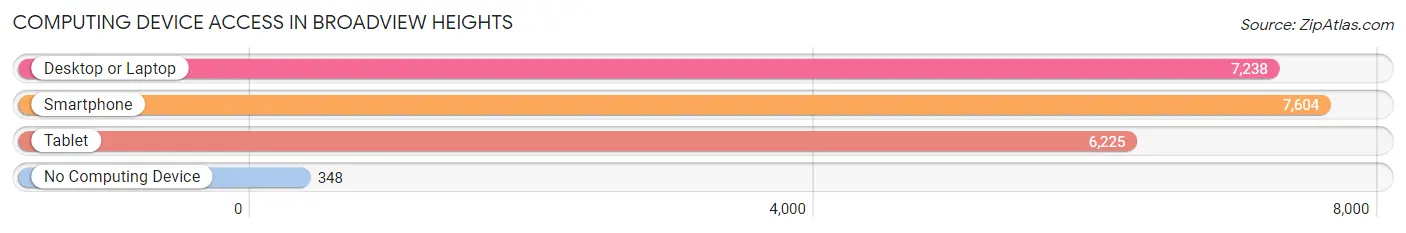
| Device Type | # Households | % Households |
| Desktop or Laptop | 7,238 | 86.2% |
| Smartphone | 7,604 | 90.6% |
| Tablet | 6,225 | 74.1% |
| No Computing Device | 348 | 4.1% |
| Total | 8,396 | 100.0% |
Internet Access in Broadview Heights
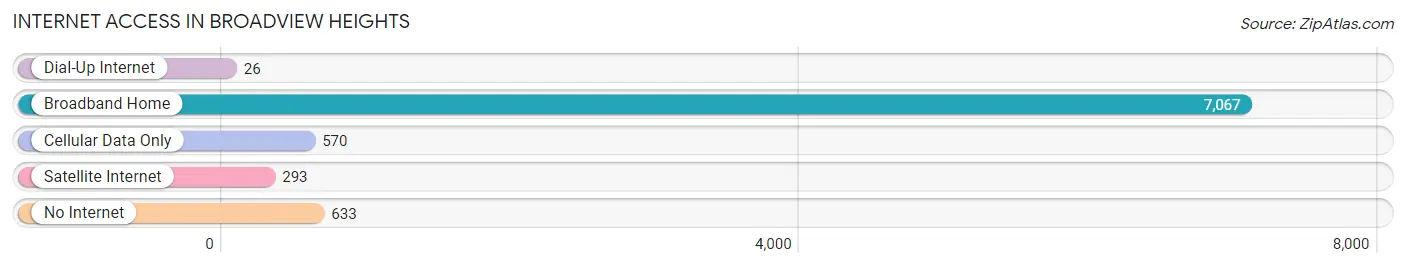
| Internet Type | # Households | % Households |
| Dial-Up Internet | 26 | 0.3% |
| Broadband Home | 7,067 | 84.2% |
| Cellular Data Only | 570 | 6.8% |
| Satellite Internet | 293 | 3.5% |
| No Internet | 633 | 7.5% |
| Total | 8,396 | 100.0% |
Broadview Heights Summary
History
The city of Broadview Heights, Ohio is located in Cuyahoga County and is a suburb of Cleveland. The city was founded in the early 19th century and was originally known as Middletown Township. The city was officially incorporated in 1945 and was named after the nearby Broadview Farm. The city has a rich history of industry and agriculture, and has been home to many notable people throughout its history.
The first settlers in the area were the Middletown Township settlers, who arrived in the early 19th century. The settlers were mostly of German and Irish descent and were attracted to the area due to its fertile soil and abundant natural resources. The settlers established farms and businesses, and the area quickly grew in population.
In the late 19th century, the city began to experience a period of industrial growth. The city was home to several factories, including the Cleveland-based Standard Oil Company. The city also became home to several railroads, which helped to further spur economic growth.
In the early 20th century, the city experienced a period of rapid growth. The population increased from 1,000 in 1900 to over 10,000 by the mid-1920s. The city was also home to several notable people, including former President William Howard Taft, who was born in the city in 1857.
Geography
Broadview Heights is located in Cuyahoga County, Ohio, and is a suburb of Cleveland. The city is situated on the western edge of the Cuyahoga Valley National Park, and is bordered by the cities of North Royalton, Brecksville, and Independence. The city covers an area of 8.3 square miles and has a population of 19,400 as of the 2010 census.
The city is located in the Great Lakes region of the United States and is situated on the western edge of the Cuyahoga Valley National Park. The city is located on the Cuyahoga River and is surrounded by several small lakes and ponds. The city is also home to several parks, including the Broadview Heights Nature Preserve and the Broadview Heights Recreation Center.
Economy
Broadview Heights is a thriving city with a strong economy. The city is home to several large businesses, including the Cleveland-based Standard Oil Company, which is one of the largest employers in the city. The city is also home to several small businesses, including restaurants, retail stores, and professional services.
The city is also home to several educational institutions, including the Cuyahoga Community College, which is the largest community college in the state of Ohio. The city is also home to several hospitals, including the Cleveland Clinic, which is one of the largest hospitals in the state.
Demographics
As of the 2010 census, the city of Broadview Heights had a population of 19,400. The population is predominantly white, with a small percentage of African Americans, Asians, and Hispanics. The median household income in the city is $68,000, and the median home value is $220,000. The city has a low unemployment rate of 4.2%, and the poverty rate is 8.2%. The city is also home to several educational institutions, including the Cuyahoga Community College, which is the largest community college in the state of Ohio.
Common Questions
What is Per Capita Income in Broadview Heights?
Per Capita income in Broadview Heights is $58,712.
What is the Median Family Income in Broadview Heights?
Median Family Income in Broadview Heights is $119,991.
What is the Median Household income in Broadview Heights?
Median Household Income in Broadview Heights is $97,902.
What is Income or Wage Gap in Broadview Heights?
Income or Wage Gap in Broadview Heights is 30.4%.
Women in Broadview Heights earn 69.6 cents for every dollar earned by a man.
What is Inequality or Gini Index in Broadview Heights?
Inequality or Gini Index in Broadview Heights is 0.44.
What is the Total Population of Broadview Heights?
Total Population of Broadview Heights is 19,815.
What is the Total Male Population of Broadview Heights?
Total Male Population of Broadview Heights is 9,440.
What is the Total Female Population of Broadview Heights?
Total Female Population of Broadview Heights is 10,375.
What is the Ratio of Males per 100 Females in Broadview Heights?
There are 90.99 Males per 100 Females in Broadview Heights.
What is the Ratio of Females per 100 Males in Broadview Heights?
There are 109.90 Females per 100 Males in Broadview Heights.
What is the Median Population Age in Broadview Heights?
Median Population Age in Broadview Heights is 45.0 Years.
What is the Average Family Size in Broadview Heights
Average Family Size in Broadview Heights is 2.9 People.
What is the Average Household Size in Broadview Heights
Average Household Size in Broadview Heights is 2.3 People.
How Large is the Labor Force in Broadview Heights?
There are 10,720 People in the Labor Forcein in Broadview Heights.
What is the Percentage of People in the Labor Force in Broadview Heights?
66.2% of People are in the Labor Force in Broadview Heights.
What is the Unemployment Rate in Broadview Heights?
Unemployment Rate in Broadview Heights is 1.6%.