Crown Point, IN Map & Demographics
Crown Point Map
Crown Point Overview
$40,068
PER CAPITA INCOME
$102,821
AVG FAMILY INCOME
$92,810
AVG HOUSEHOLD INCOME
40.1%
WAGE / INCOME GAP [ % ]
59.9¢/ $1
WAGE / INCOME GAP [ $ ]
$6,579
FAMILY INCOME DEFICIT
0.39
INEQUALITY / GINI INDEX
33,735
TOTAL POPULATION
16,833
MALE POPULATION
16,902
FEMALE POPULATION
99.59
MALES / 100 FEMALES
100.41
FEMALES / 100 MALES
39.4
MEDIAN AGE
3.2
AVG FAMILY SIZE
2.7
AVG HOUSEHOLD SIZE
16,158
LABOR FORCE [ PEOPLE ]
62.0%
PERCENT IN LABOR FORCE
4.3%
UNEMPLOYMENT RATE
Crown Point Zip Codes
Crown Point Area Codes
Income in Crown Point
Income Overview in Crown Point
Per Capita Income in Crown Point is $40,068, while median incomes of families and households are $102,821 and $92,810 respectively.
| Characteristic | Number | Measure |
| Per Capita Income | 33,735 | $40,068 |
| Median Family Income | 8,682 | $102,821 |
| Mean Family Income | 8,682 | $123,020 |
| Median Household Income | 12,119 | $92,810 |
| Mean Household Income | 12,119 | $109,713 |
| Income Deficit | 8,682 | $6,579 |
| Wage / Income Gap (%) | 33,735 | 40.12% |
| Wage / Income Gap ($) | 33,735 | 59.88¢ per $1 |
| Gini / Inequality Index | 33,735 | 0.39 |
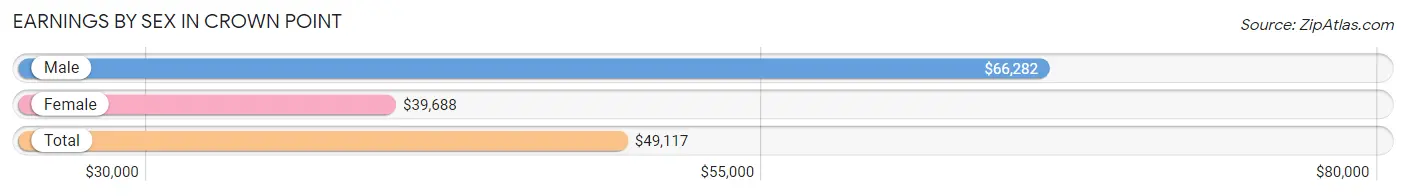
Earnings by Sex in Crown Point
Average Earnings in Crown Point are $49,117, $66,282 for men and $39,688 for women, a difference of 40.1%.
| Sex | Number | Average Earnings |
| Male | 9,054 (53.7%) | $66,282 |
| Female | 7,818 (46.3%) | $39,688 |
| Total | 16,872 (100.0%) | $49,117 |
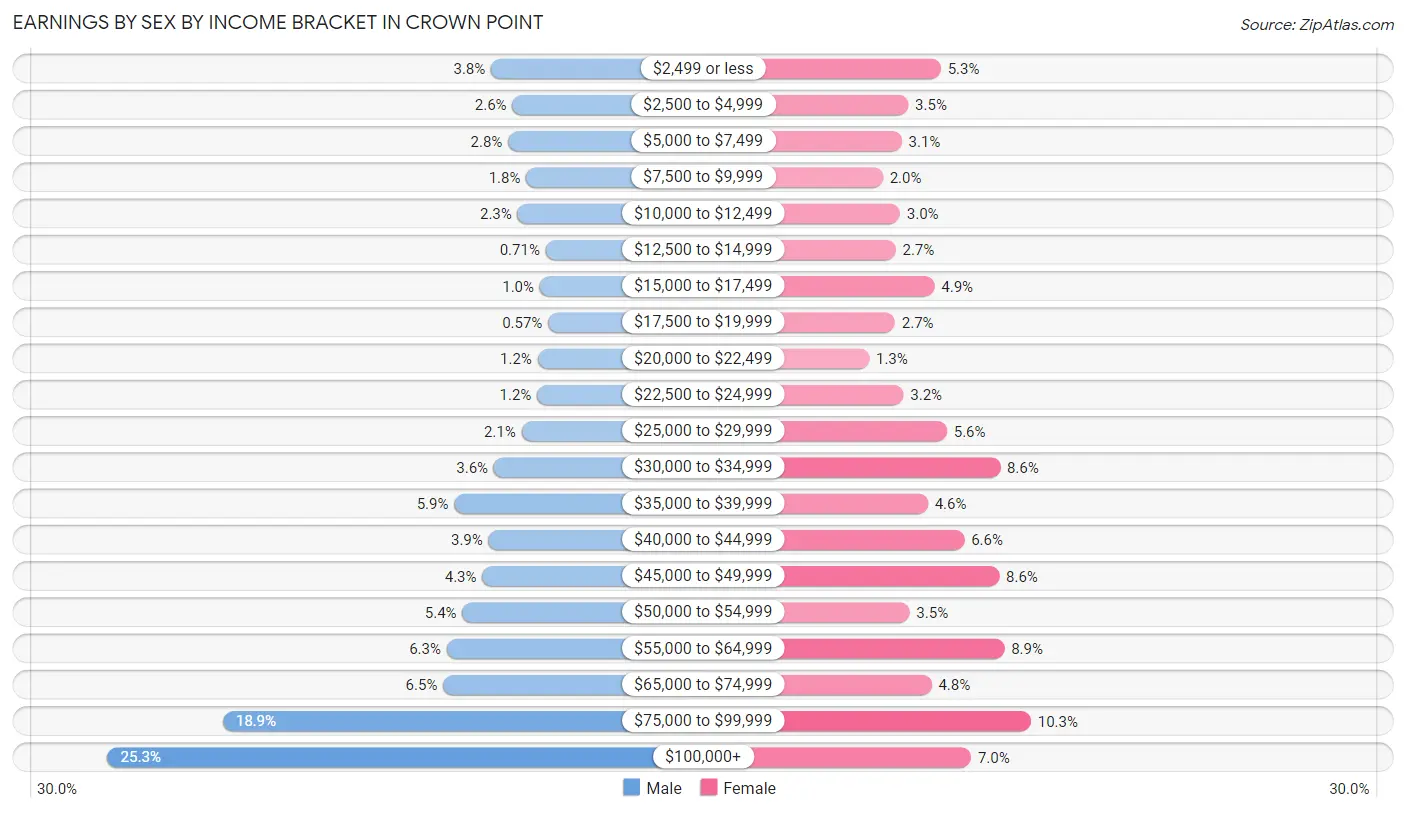
Earnings by Sex by Income Bracket in Crown Point
The most common earnings brackets in Crown Point are $100,000+ for men (2,293 | 25.3%) and $75,000 to $99,999 for women (808 | 10.3%).
| Income | Male | Female |
| $2,499 or less | 342 (3.8%) | 413 (5.3%) |
| $2,500 to $4,999 | 234 (2.6%) | 270 (3.5%) |
| $5,000 to $7,499 | 255 (2.8%) | 241 (3.1%) |
| $7,500 to $9,999 | 163 (1.8%) | 158 (2.0%) |
| $10,000 to $12,499 | 207 (2.3%) | 233 (3.0%) |
| $12,500 to $14,999 | 64 (0.7%) | 214 (2.7%) |
| $15,000 to $17,499 | 94 (1.0%) | 385 (4.9%) |
| $17,500 to $19,999 | 52 (0.6%) | 211 (2.7%) |
| $20,000 to $22,499 | 105 (1.2%) | 98 (1.3%) |
| $22,500 to $24,999 | 108 (1.2%) | 249 (3.2%) |
| $25,000 to $29,999 | 187 (2.1%) | 439 (5.6%) |
| $30,000 to $34,999 | 328 (3.6%) | 673 (8.6%) |
| $35,000 to $39,999 | 530 (5.9%) | 356 (4.5%) |
| $40,000 to $44,999 | 355 (3.9%) | 516 (6.6%) |
| $45,000 to $49,999 | 387 (4.3%) | 669 (8.6%) |
| $50,000 to $54,999 | 488 (5.4%) | 275 (3.5%) |
| $55,000 to $64,999 | 568 (6.3%) | 692 (8.8%) |
| $65,000 to $74,999 | 586 (6.5%) | 372 (4.8%) |
| $75,000 to $99,999 | 1,708 (18.9%) | 808 (10.3%) |
| $100,000+ | 2,293 (25.3%) | 546 (7.0%) |
| Total | 9,054 (100.0%) | 7,818 (100.0%) |
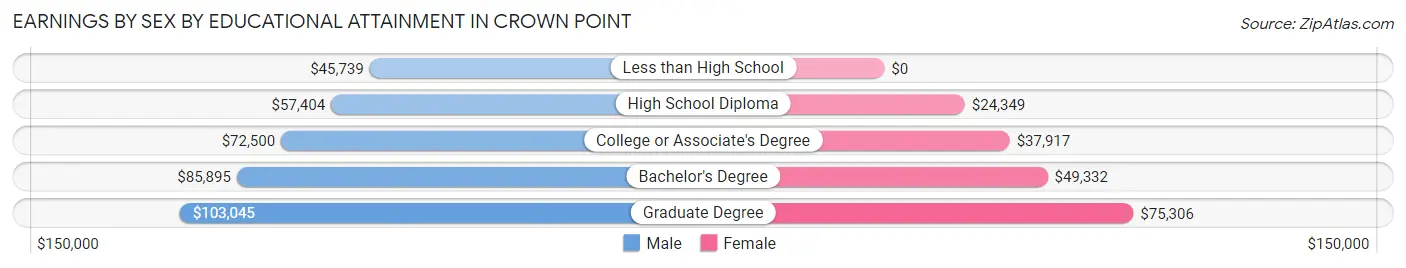
Earnings by Sex by Educational Attainment in Crown Point
Average earnings in Crown Point are $72,443 for men and $41,102 for women, a difference of 43.3%. Men with an educational attainment of graduate degree enjoy the highest average annual earnings of $103,045, while those with less than high school education earn the least with $45,739. Women with an educational attainment of graduate degree earn the most with the average annual earnings of $75,306, while those with high school diploma education have the smallest earnings of $24,349.
| Educational Attainment | Male Income | Female Income |
| Less than High School | $45,739 | $0 |
| High School Diploma | $57,404 | $24,349 |
| College or Associate's Degree | $72,500 | $37,917 |
| Bachelor's Degree | $85,895 | $49,332 |
| Graduate Degree | $103,045 | $75,306 |
| Total | $72,443 | $41,102 |
Family Income in Crown Point
Family Income Brackets in Crown Point
According to the Crown Point family income data, there are 2,362 families falling into the $100,000 to $149,999 income range, which is the most common income bracket and makes up 27.2% of all families. Conversely, the $10,000 to $14,999 income bracket is the least frequent group with only 52 families (0.6%) belonging to this category.
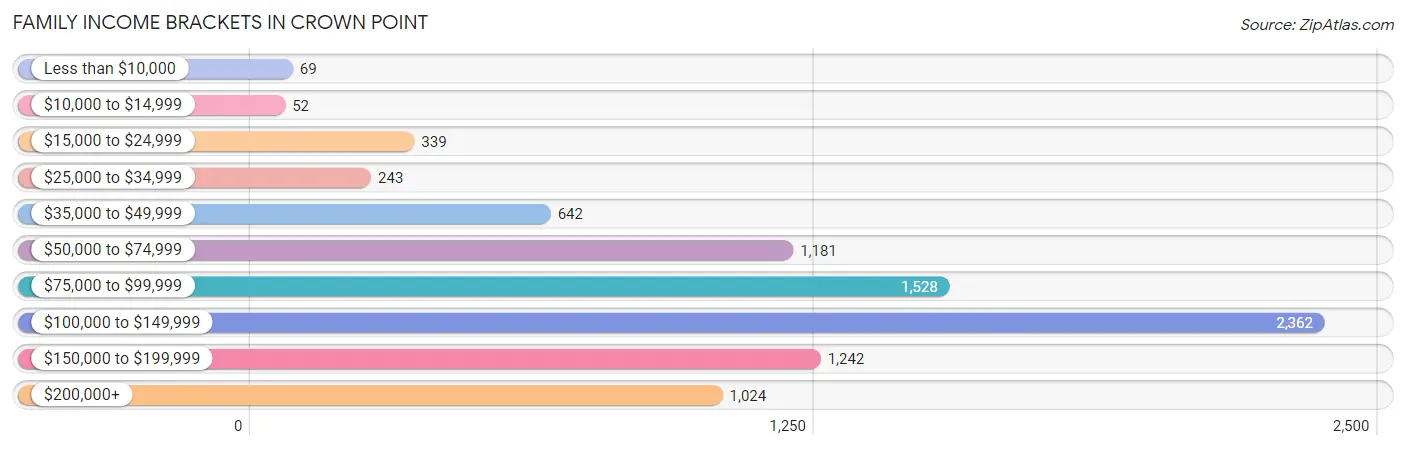
| Income Bracket | # Families | % Families |
| Less than $10,000 | 69 | 0.8% |
| $10,000 to $14,999 | 52 | 0.6% |
| $15,000 to $24,999 | 339 | 3.9% |
| $25,000 to $34,999 | 243 | 2.8% |
| $35,000 to $49,999 | 642 | 7.4% |
| $50,000 to $74,999 | 1,181 | 13.6% |
| $75,000 to $99,999 | 1,528 | 17.6% |
| $100,000 to $149,999 | 2,362 | 27.2% |
| $150,000 to $199,999 | 1,242 | 14.3% |
| $200,000+ | 1,024 | 11.8% |
Family Income by Famaliy Size in Crown Point
7+ person families (50 | 0.6%) account for the highest median family income in Crown Point with $173,289 per family, while 2-person families (3,815 | 43.9%) have the highest median income of $48,408 per family member.
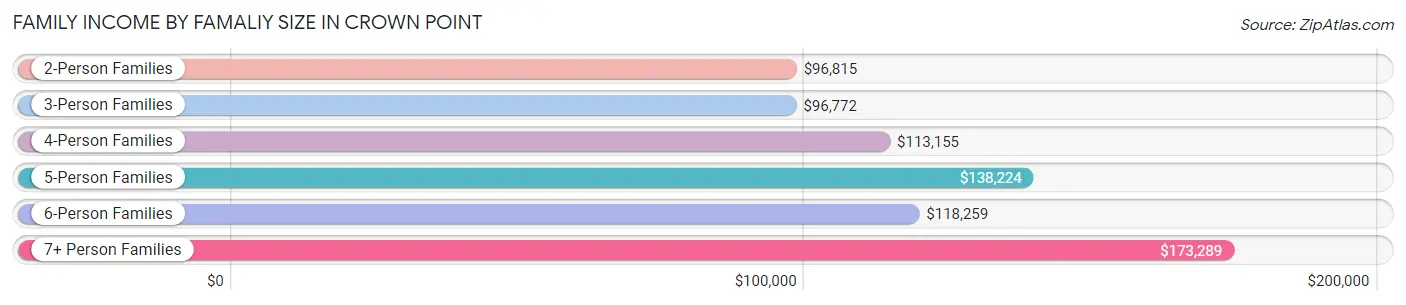
| Income Bracket | # Families | Median Income |
| 2-Person Families | 3,815 (43.9%) | $96,815 |
| 3-Person Families | 1,883 (21.7%) | $96,772 |
| 4-Person Families | 1,882 (21.7%) | $113,155 |
| 5-Person Families | 849 (9.8%) | $138,224 |
| 6-Person Families | 203 (2.3%) | $118,259 |
| 7+ Person Families | 50 (0.6%) | $173,289 |
| Total | 8,682 (100.0%) | $102,821 |
Family Income by Number of Earners in Crown Point
The median family income in Crown Point is $102,821, with families comprising 3+ earners (907) having the highest median family income of $137,991, while families with no earners (1,419) have the lowest median family income of $52,185, accounting for 10.4% and 16.3% of families, respectively.
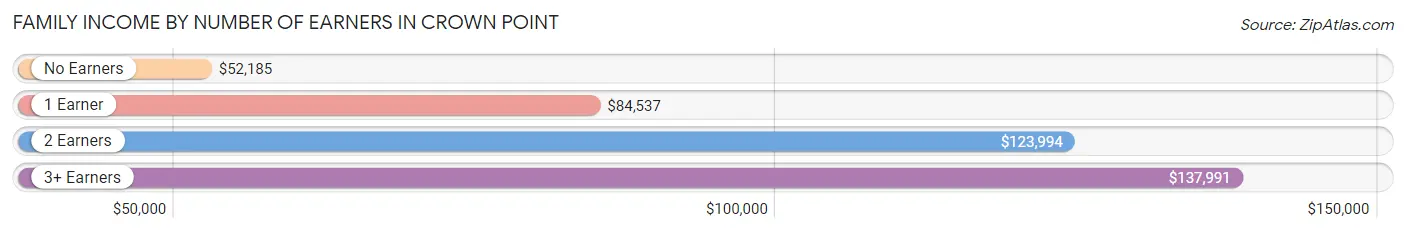
| Number of Earners | # Families | Median Income |
| No Earners | 1,419 (16.3%) | $52,185 |
| 1 Earner | 2,350 (27.1%) | $84,537 |
| 2 Earners | 4,006 (46.1%) | $123,994 |
| 3+ Earners | 907 (10.4%) | $137,991 |
| Total | 8,682 (100.0%) | $102,821 |
Household Income in Crown Point
Household Income Brackets in Crown Point
With 2,933 households falling in the category, the $100,000 to $149,999 income range is the most frequent in Crown Point, accounting for 24.2% of all households. In contrast, only 182 households (1.5%) fall into the $10,000 to $14,999 income bracket, making it the least populous group.
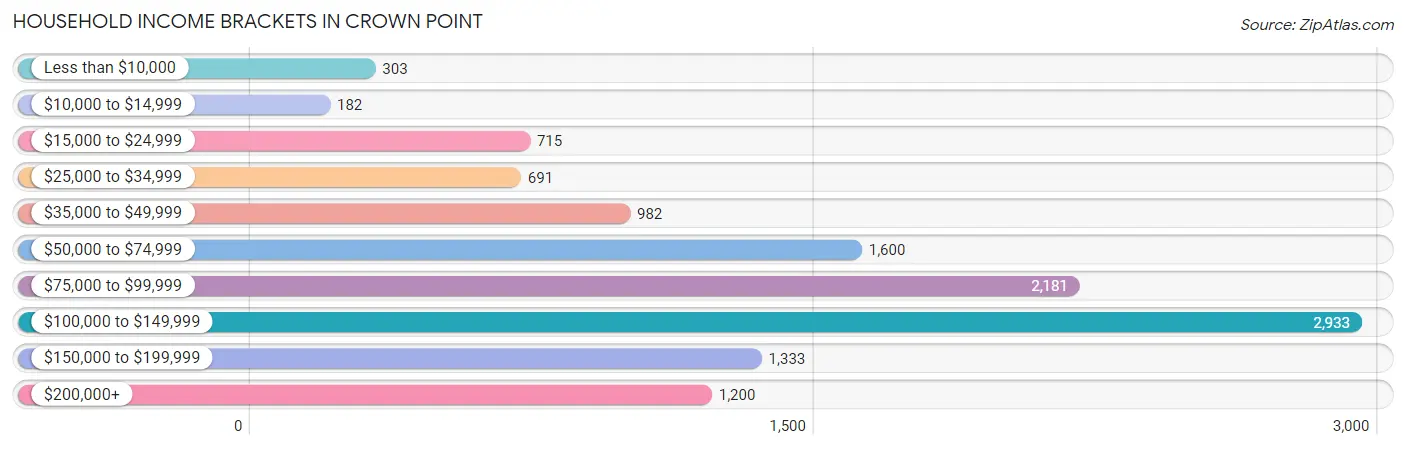
| Income Bracket | # Households | % Households |
| Less than $10,000 | 303 | 2.5% |
| $10,000 to $14,999 | 182 | 1.5% |
| $15,000 to $24,999 | 715 | 5.9% |
| $25,000 to $34,999 | 691 | 5.7% |
| $35,000 to $49,999 | 982 | 8.1% |
| $50,000 to $74,999 | 1,600 | 13.2% |
| $75,000 to $99,999 | 2,181 | 18.0% |
| $100,000 to $149,999 | 2,933 | 24.2% |
| $150,000 to $199,999 | 1,333 | 11.0% |
| $200,000+ | 1,200 | 9.9% |
Household Income by Householder Age in Crown Point
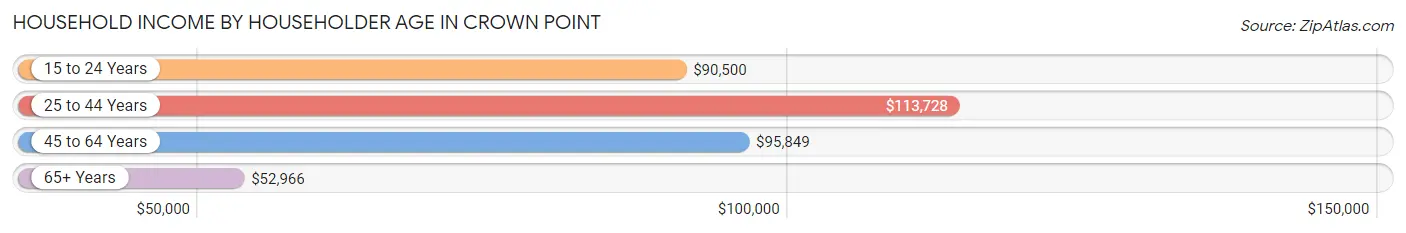
The median household income in Crown Point is $92,810, with the highest median household income of $113,728 found in the 25 to 44 years age bracket for the primary householder. A total of 4,010 households (33.1%) fall into this category. Meanwhile, the 65+ years age bracket for the primary householder has the lowest median household income of $52,966, with 3,475 households (28.7%) in this group.
| Income Bracket | # Households | Median Income |
| 15 to 24 Years | 128 (1.1%) | $90,500 |
| 25 to 44 Years | 4,010 (33.1%) | $113,728 |
| 45 to 64 Years | 4,506 (37.2%) | $95,849 |
| 65+ Years | 3,475 (28.7%) | $52,966 |
| Total | 12,119 (100.0%) | $92,810 |
Poverty in Crown Point
Income Below Poverty by Sex and Age in Crown Point
With 5.8% poverty level for males and 6.4% for females among the residents of Crown Point, 15 year old males and 12 to 14 year old females are the most vulnerable to poverty, with 202 males (51.9%) and 329 females (33.6%) in their respective age groups living below the poverty level.
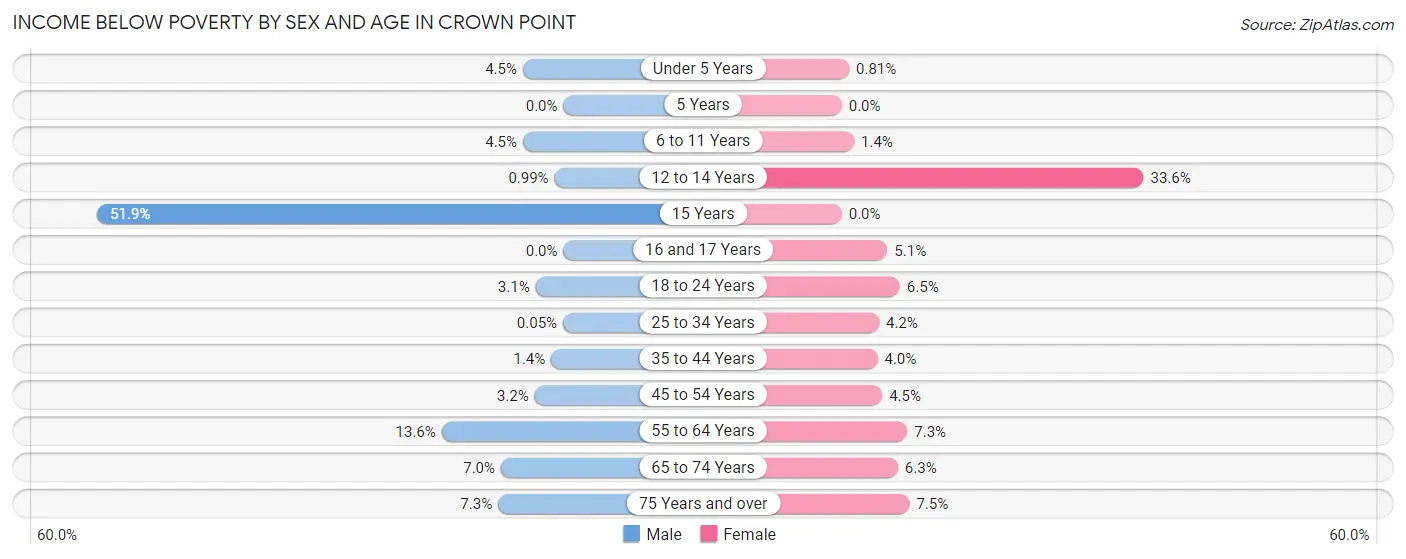
| Age Bracket | Male | Female |
| Under 5 Years | 65 (4.5%) | 6 (0.8%) |
| 5 Years | 0 (0.0%) | 0 (0.0%) |
| 6 to 11 Years | 50 (4.5%) | 22 (1.4%) |
| 12 to 14 Years | 7 (1.0%) | 329 (33.6%) |
| 15 Years | 202 (51.9%) | 0 (0.0%) |
| 16 and 17 Years | 0 (0.0%) | 12 (5.1%) |
| 18 to 24 Years | 29 (3.1%) | 50 (6.5%) |
| 25 to 34 Years | 1 (0.1%) | 92 (4.2%) |
| 35 to 44 Years | 31 (1.4%) | 89 (4.0%) |
| 45 to 54 Years | 56 (3.2%) | 83 (4.5%) |
| 55 to 64 Years | 302 (13.6%) | 155 (7.3%) |
| 65 to 74 Years | 101 (7.0%) | 95 (6.2%) |
| 75 Years and over | 72 (7.3%) | 128 (7.5%) |
| Total | 916 (5.8%) | 1,061 (6.4%) |
Income Above Poverty by Sex and Age in Crown Point
According to the poverty statistics in Crown Point, males aged 5 years and females aged 5 years are the age groups that are most secure financially, with 100.0% of males and 100.0% of females in these age groups living above the poverty line.
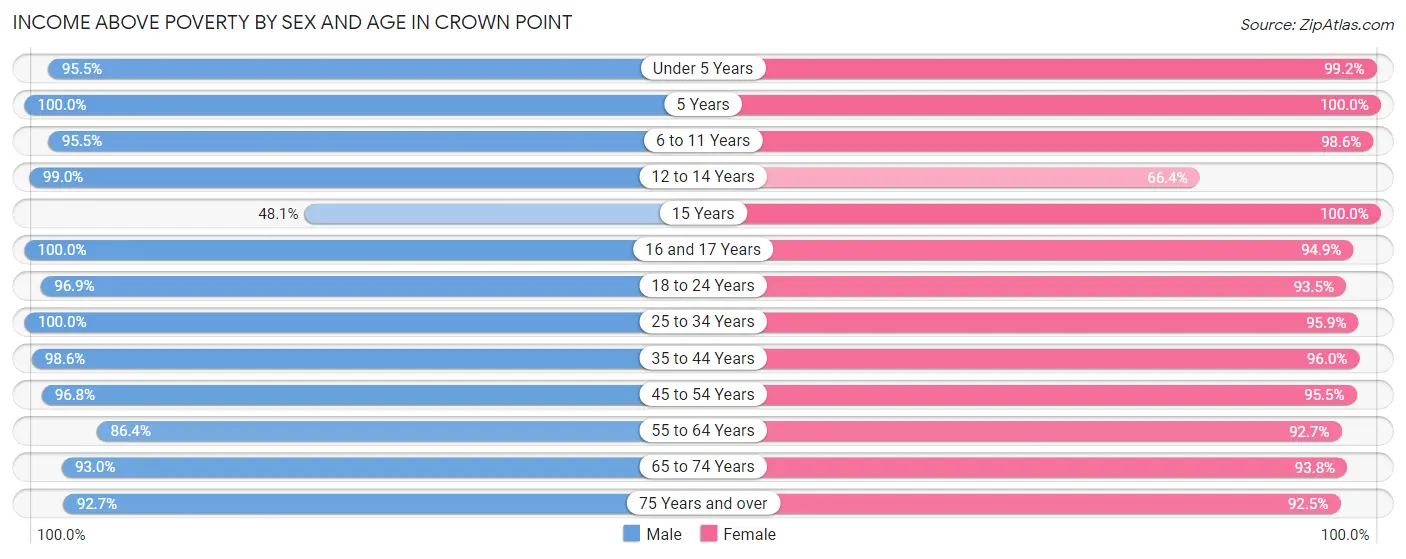
| Age Bracket | Male | Female |
| Under 5 Years | 1,372 (95.5%) | 738 (99.2%) |
| 5 Years | 180 (100.0%) | 355 (100.0%) |
| 6 to 11 Years | 1,058 (95.5%) | 1,581 (98.6%) |
| 12 to 14 Years | 701 (99.0%) | 650 (66.4%) |
| 15 Years | 187 (48.1%) | 140 (100.0%) |
| 16 and 17 Years | 327 (100.0%) | 224 (94.9%) |
| 18 to 24 Years | 905 (96.9%) | 723 (93.5%) |
| 25 to 34 Years | 2,074 (100.0%) | 2,127 (95.9%) |
| 35 to 44 Years | 2,246 (98.6%) | 2,149 (96.0%) |
| 45 to 54 Years | 1,691 (96.8%) | 1,763 (95.5%) |
| 55 to 64 Years | 1,925 (86.4%) | 1,969 (92.7%) |
| 65 to 74 Years | 1,350 (93.0%) | 1,426 (93.8%) |
| 75 Years and over | 917 (92.7%) | 1,570 (92.5%) |
| Total | 14,933 (94.2%) | 15,415 (93.6%) |
Income Below Poverty Among Married-Couple Families in Crown Point
The poverty statistics for married-couple families in Crown Point show that 1.0% or 67 of the total 6,938 families live below the poverty line. Families with no children have the highest poverty rate of 1.5%, comprising of 57 families. On the other hand, families with 3 or 4 children have the lowest poverty rate of 0.0%, which includes 0 families.
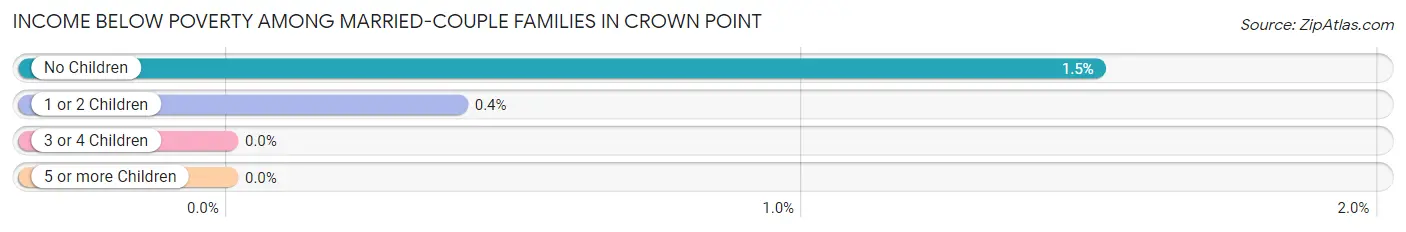
| Children | Above Poverty | Below Poverty |
| No Children | 3,726 (98.5%) | 57 (1.5%) |
| 1 or 2 Children | 2,475 (99.6%) | 10 (0.4%) |
| 3 or 4 Children | 670 (100.0%) | 0 (0.0%) |
| 5 or more Children | 0 (0.0%) | 0 (0.0%) |
| Total | 6,871 (99.0%) | 67 (1.0%) |
Income Below Poverty Among Single-Parent Households in Crown Point
According to the poverty data in Crown Point, 39.6% or 297 single-father households and 6.7% or 66 single-mother households are living below the poverty line. Among single-father households, those with 1 or 2 children have the highest poverty rate, with 247 households (48.1%) experiencing poverty. Likewise, among single-mother households, those with 3 or 4 children have the highest poverty rate, with 6 households (15.0%) falling below the poverty line.
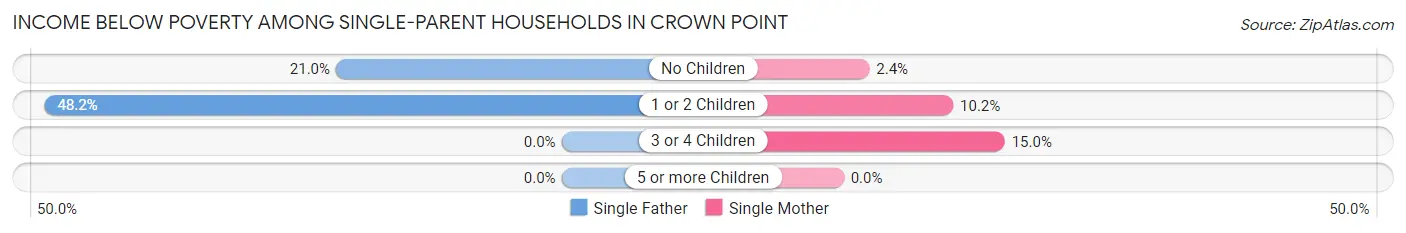
| Children | Single Father | Single Mother |
| No Children | 50 (21.0%) | 11 (2.4%) |
| 1 or 2 Children | 247 (48.1%) | 49 (10.2%) |
| 3 or 4 Children | 0 (0.0%) | 6 (15.0%) |
| 5 or more Children | 0 (0.0%) | 0 (0.0%) |
| Total | 297 (39.6%) | 66 (6.7%) |
Income Below Poverty Among Married-Couple vs Single-Parent Households in Crown Point
The poverty data for Crown Point shows that 67 of the married-couple family households (1.0%) and 363 of the single-parent households (20.8%) are living below the poverty level. Within the married-couple family households, those with no children have the highest poverty rate, with 57 households (1.5%) falling below the poverty line. Among the single-parent households, those with 1 or 2 children have the highest poverty rate, with 296 household (29.8%) living below poverty.
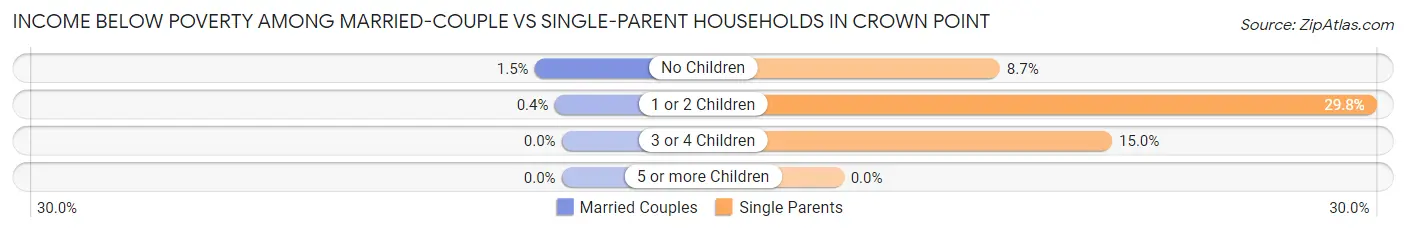
| Children | Married-Couple Families | Single-Parent Households |
| No Children | 57 (1.5%) | 61 (8.7%) |
| 1 or 2 Children | 10 (0.4%) | 296 (29.8%) |
| 3 or 4 Children | 0 (0.0%) | 6 (15.0%) |
| 5 or more Children | 0 (0.0%) | 0 (0.0%) |
| Total | 67 (1.0%) | 363 (20.8%) |
Race in Crown Point
The most populous races in Crown Point are White / Caucasian (27,368 | 81.1%), Hispanic or Latino (4,078 | 12.1%), and Black / African American (2,687 | 8.0%).
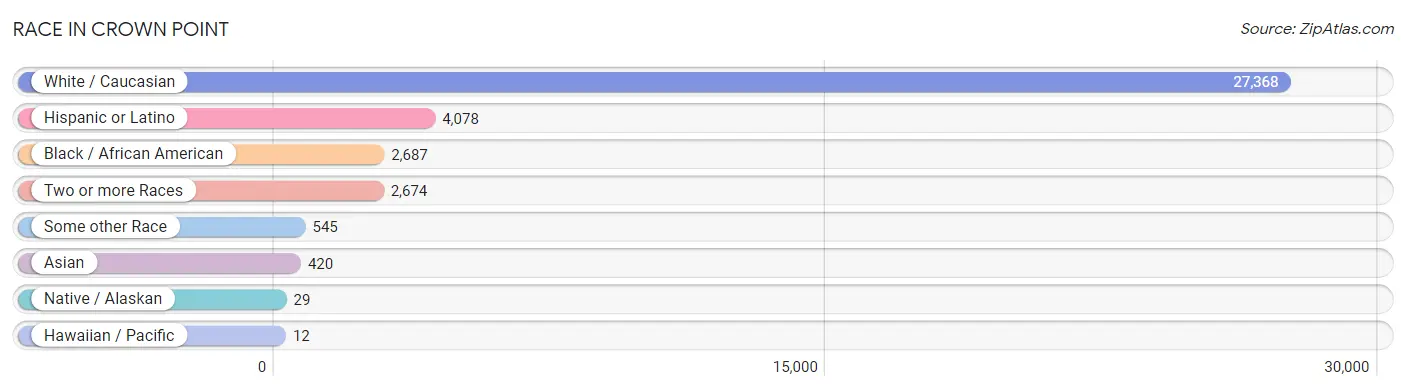
| Race | # Population | % Population |
| Asian | 420 | 1.2% |
| Black / African American | 2,687 | 8.0% |
| Hawaiian / Pacific | 12 | 0.0% |
| Hispanic or Latino | 4,078 | 12.1% |
| Native / Alaskan | 29 | 0.1% |
| White / Caucasian | 27,368 | 81.1% |
| Two or more Races | 2,674 | 7.9% |
| Some other Race | 545 | 1.6% |
| Total | 33,735 | 100.0% |
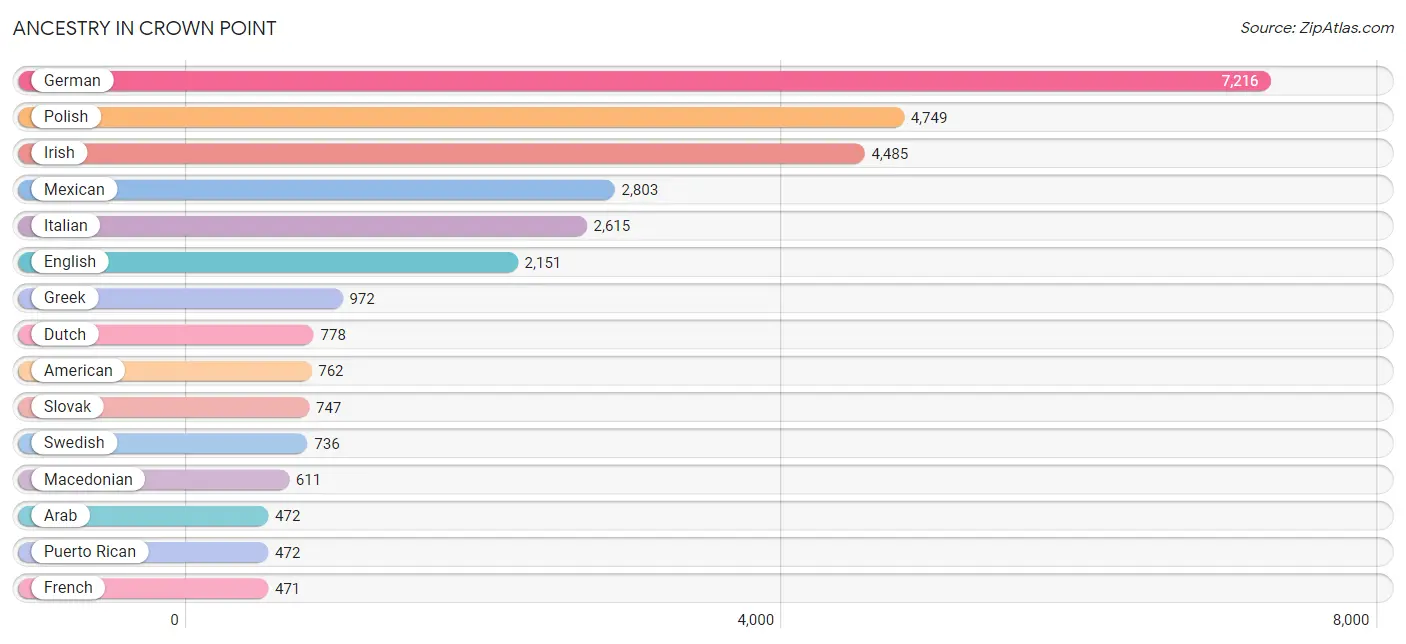
Ancestry in Crown Point
The most populous ancestries reported in Crown Point are German (7,216 | 21.4%), Polish (4,749 | 14.1%), Irish (4,485 | 13.3%), Mexican (2,803 | 8.3%), and Italian (2,615 | 7.7%), together accounting for 64.8% of all Crown Point residents.
| Ancestry | # Population | % Population |
| Albanian | 12 | 0.0% |
| American | 762 | 2.3% |
| Arab | 472 | 1.4% |
| Armenian | 34 | 0.1% |
| Austrian | 51 | 0.2% |
| Belgian | 18 | 0.1% |
| Bhutanese | 20 | 0.1% |
| Blackfeet | 5 | 0.0% |
| British | 111 | 0.3% |
| Bulgarian | 40 | 0.1% |
| Burmese | 176 | 0.5% |
| Central American Indian | 15 | 0.0% |
| Cherokee | 35 | 0.1% |
| Chippewa | 13 | 0.0% |
| Colombian | 21 | 0.1% |
| Croatian | 287 | 0.9% |
| Cuban | 108 | 0.3% |
| Czech | 430 | 1.3% |
| Danish | 56 | 0.2% |
| Dutch | 778 | 2.3% |
| Eastern European | 59 | 0.2% |
| Ecuadorian | 9 | 0.0% |
| Egyptian | 49 | 0.2% |
| English | 2,151 | 6.4% |
| European | 436 | 1.3% |
| Finnish | 77 | 0.2% |
| French | 471 | 1.4% |
| French Canadian | 48 | 0.1% |
| German | 7,216 | 21.4% |
| Greek | 972 | 2.9% |
| Guamanian / Chamorro | 9 | 0.0% |
| Hungarian | 296 | 0.9% |
| Indian (Asian) | 10 | 0.0% |
| Irish | 4,485 | 13.3% |
| Italian | 2,615 | 7.7% |
| Korean | 343 | 1.0% |
| Lithuanian | 200 | 0.6% |
| Luxembourger | 45 | 0.1% |
| Macedonian | 611 | 1.8% |
| Mexican | 2,803 | 8.3% |
| Mexican American Indian | 22 | 0.1% |
| Native Hawaiian | 3 | 0.0% |
| Nigerian | 16 | 0.1% |
| Northern European | 36 | 0.1% |
| Norwegian | 95 | 0.3% |
| Pakistani | 41 | 0.1% |
| Palestinian | 59 | 0.2% |
| Pennsylvania German | 9 | 0.0% |
| Peruvian | 40 | 0.1% |
| Polish | 4,749 | 14.1% |
| Puerto Rican | 472 | 1.4% |
| Romanian | 365 | 1.1% |
| Russian | 207 | 0.6% |
| Scandinavian | 26 | 0.1% |
| Scotch-Irish | 335 | 1.0% |
| Scottish | 448 | 1.3% |
| Serbian | 412 | 1.2% |
| Sioux | 44 | 0.1% |
| Slavic | 13 | 0.0% |
| Slovak | 747 | 2.2% |
| South American | 70 | 0.2% |
| Spaniard | 243 | 0.7% |
| Spanish | 345 | 1.0% |
| Subsaharan African | 16 | 0.1% |
| Swedish | 736 | 2.2% |
| Swiss | 35 | 0.1% |
| Syrian | 74 | 0.2% |
| Thai | 40 | 0.1% |
| Ukrainian | 74 | 0.2% |
| Welsh | 129 | 0.4% | View All 70 Rows |
Immigrants in Crown Point
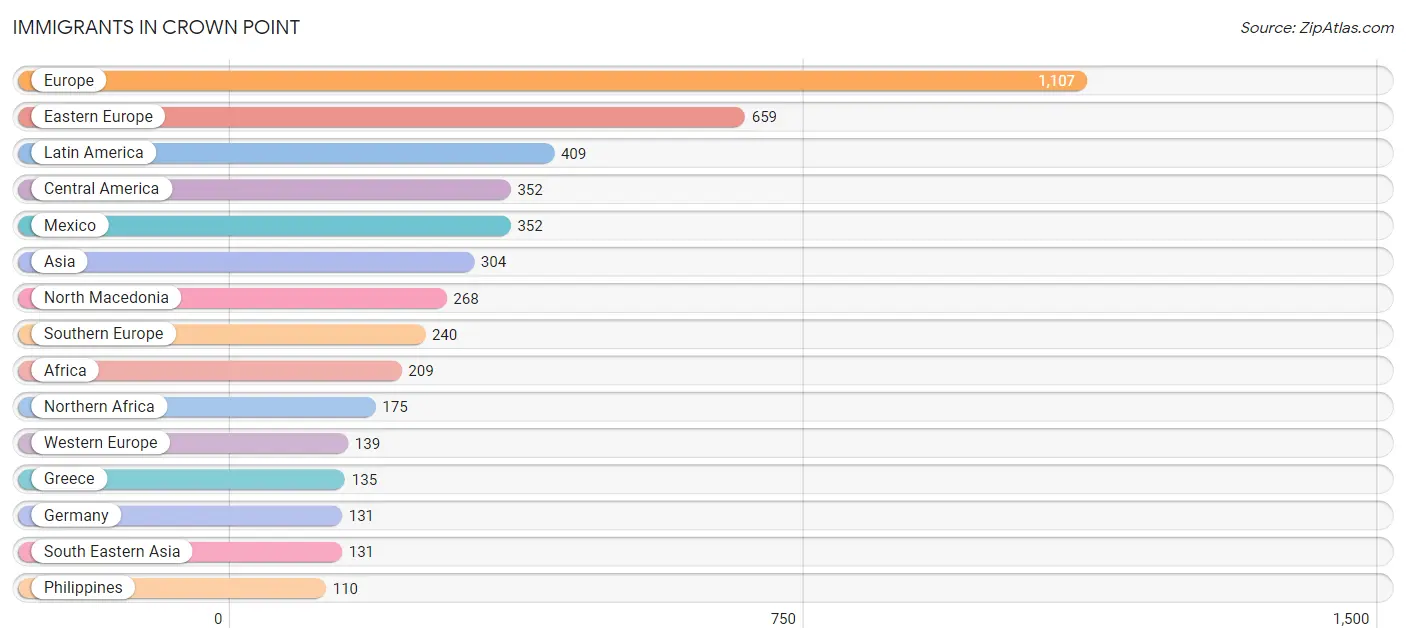
The most numerous immigrant groups reported in Crown Point came from Europe (1,107 | 3.3%), Eastern Europe (659 | 1.9%), Latin America (409 | 1.2%), Central America (352 | 1.0%), and Mexico (352 | 1.0%), together accounting for 8.5% of all Crown Point residents.
| Immigration Origin | # Population | % Population |
| Africa | 209 | 0.6% |
| Asia | 304 | 0.9% |
| Bosnia and Herzegovina | 45 | 0.1% |
| Bulgaria | 18 | 0.1% |
| Canada | 62 | 0.2% |
| Caribbean | 10 | 0.0% |
| Central America | 352 | 1.0% |
| Colombia | 7 | 0.0% |
| Croatia | 69 | 0.2% |
| Cuba | 10 | 0.0% |
| Czechoslovakia | 85 | 0.3% |
| Eastern Asia | 72 | 0.2% |
| Eastern Europe | 659 | 1.9% |
| Egypt | 49 | 0.2% |
| Europe | 1,107 | 3.3% |
| France | 8 | 0.0% |
| Germany | 131 | 0.4% |
| Greece | 135 | 0.4% |
| India | 13 | 0.0% |
| Italy | 12 | 0.0% |
| Japan | 11 | 0.0% |
| Korea | 61 | 0.2% |
| Latin America | 409 | 1.2% |
| Malaysia | 10 | 0.0% |
| Mexico | 352 | 1.0% |
| Nigeria | 16 | 0.1% |
| North Macedonia | 268 | 0.8% |
| Northern Africa | 175 | 0.5% |
| Northern Europe | 11 | 0.0% |
| Pakistan | 51 | 0.2% |
| Peru | 40 | 0.1% |
| Philippines | 110 | 0.3% |
| Poland | 28 | 0.1% |
| Russia | 59 | 0.2% |
| Serbia | 36 | 0.1% |
| South Africa | 18 | 0.1% |
| South America | 47 | 0.1% |
| South Central Asia | 64 | 0.2% |
| South Eastern Asia | 131 | 0.4% |
| Southern Europe | 240 | 0.7% |
| Spain | 93 | 0.3% |
| Syria | 34 | 0.1% |
| Thailand | 11 | 0.0% |
| Turkey | 3 | 0.0% |
| Ukraine | 17 | 0.1% |
| Western Africa | 16 | 0.1% |
| Western Asia | 37 | 0.1% |
| Western Europe | 139 | 0.4% | View All 48 Rows |
Sex and Age in Crown Point
Sex and Age in Crown Point
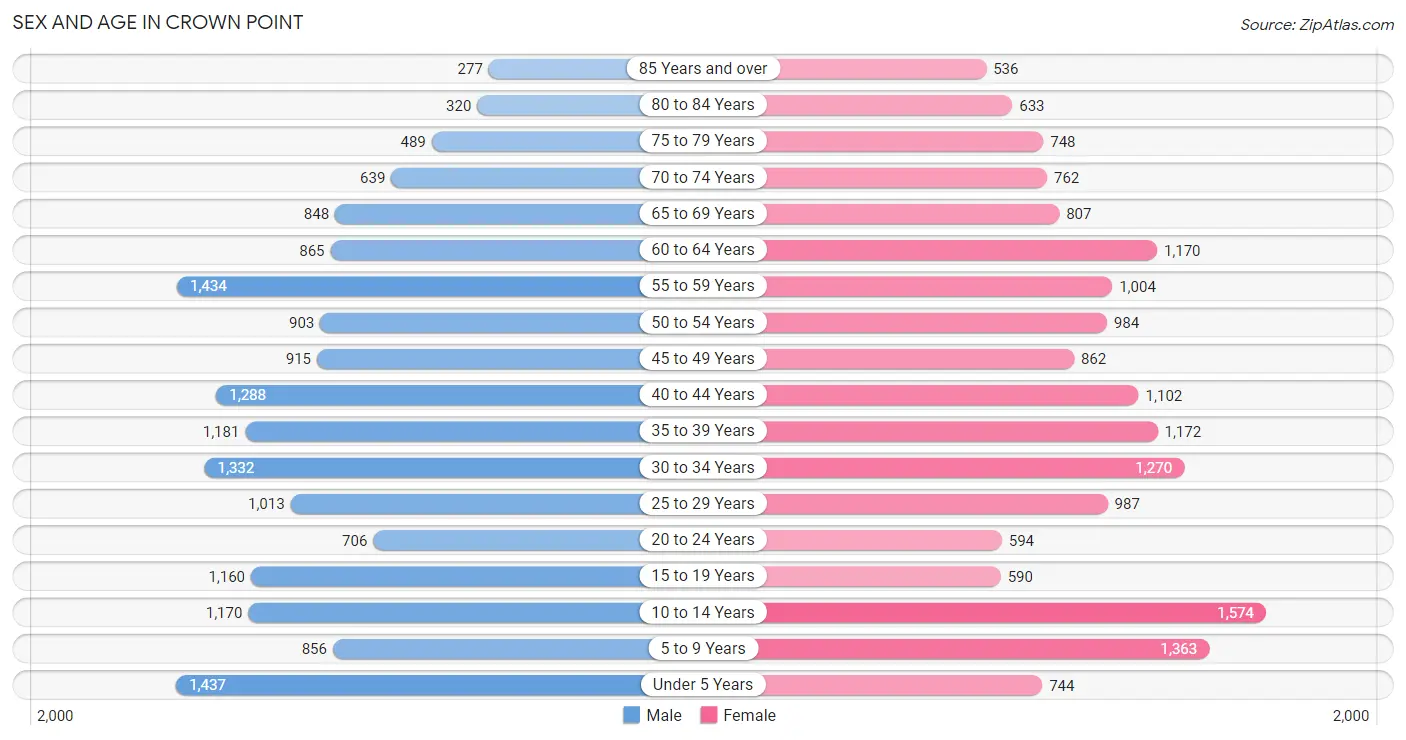
The most populous age groups in Crown Point are Under 5 Years (1,437 | 8.5%) for men and 10 to 14 Years (1,574 | 9.3%) for women.
| Age Bracket | Male | Female |
| Under 5 Years | 1,437 (8.5%) | 744 (4.4%) |
| 5 to 9 Years | 856 (5.1%) | 1,363 (8.1%) |
| 10 to 14 Years | 1,170 (7.0%) | 1,574 (9.3%) |
| 15 to 19 Years | 1,160 (6.9%) | 590 (3.5%) |
| 20 to 24 Years | 706 (4.2%) | 594 (3.5%) |
| 25 to 29 Years | 1,013 (6.0%) | 987 (5.8%) |
| 30 to 34 Years | 1,332 (7.9%) | 1,270 (7.5%) |
| 35 to 39 Years | 1,181 (7.0%) | 1,172 (6.9%) |
| 40 to 44 Years | 1,288 (7.6%) | 1,102 (6.5%) |
| 45 to 49 Years | 915 (5.4%) | 862 (5.1%) |
| 50 to 54 Years | 903 (5.4%) | 984 (5.8%) |
| 55 to 59 Years | 1,434 (8.5%) | 1,004 (5.9%) |
| 60 to 64 Years | 865 (5.1%) | 1,170 (6.9%) |
| 65 to 69 Years | 848 (5.0%) | 807 (4.8%) |
| 70 to 74 Years | 639 (3.8%) | 762 (4.5%) |
| 75 to 79 Years | 489 (2.9%) | 748 (4.4%) |
| 80 to 84 Years | 320 (1.9%) | 633 (3.7%) |
| 85 Years and over | 277 (1.7%) | 536 (3.2%) |
| Total | 16,833 (100.0%) | 16,902 (100.0%) |
Families and Households in Crown Point
Median Family Size in Crown Point
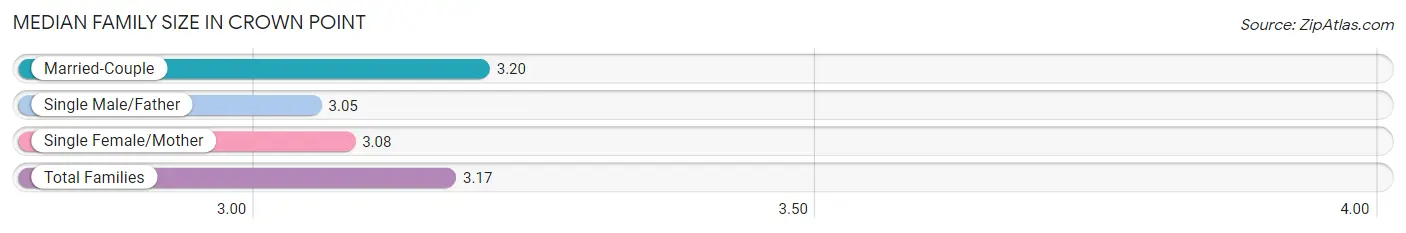
The median family size in Crown Point is 3.17 persons per family, with married-couple families (6,938 | 79.9%) accounting for the largest median family size of 3.2 persons per family. On the other hand, single male/father families (751 | 8.6%) represent the smallest median family size with 3.05 persons per family.
| Family Type | # Families | Family Size |
| Married-Couple | 6,938 (79.9%) | 3.20 |
| Single Male/Father | 751 (8.6%) | 3.05 |
| Single Female/Mother | 993 (11.4%) | 3.08 |
| Total Families | 8,682 (100.0%) | 3.17 |
Median Household Size in Crown Point
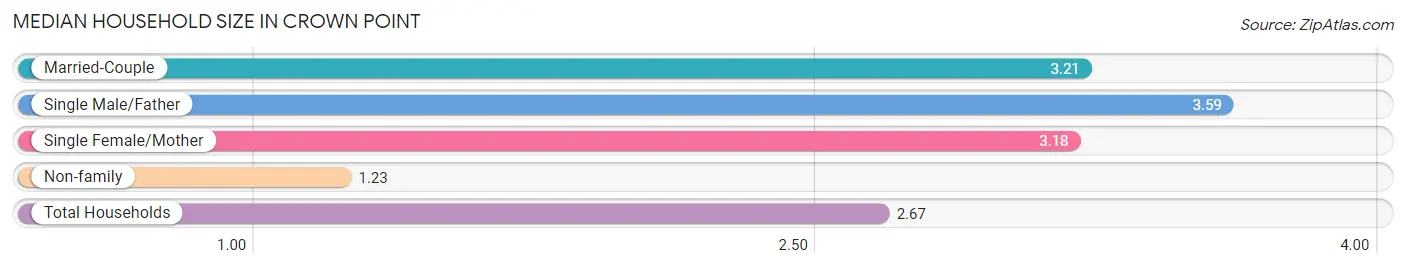
The median household size in Crown Point is 2.67 persons per household, with single male/father households (751 | 6.2%) accounting for the largest median household size of 3.59 persons per household. non-family households (3,437 | 28.4%) represent the smallest median household size with 1.23 persons per household.
| Household Type | # Households | Household Size |
| Married-Couple | 6,938 (57.3%) | 3.21 |
| Single Male/Father | 751 (6.2%) | 3.59 |
| Single Female/Mother | 993 (8.2%) | 3.18 |
| Non-family | 3,437 (28.4%) | 1.23 |
| Total Households | 12,119 (100.0%) | 2.67 |
Household Size by Marriage Status in Crown Point
Out of a total of 12,119 households in Crown Point, 8,682 (71.6%) are family households, while 3,437 (28.4%) are nonfamily households. The most numerous type of family households are 2-person households, comprising 3,641, and the most common type of nonfamily households are 1-person households, comprising 2,790.
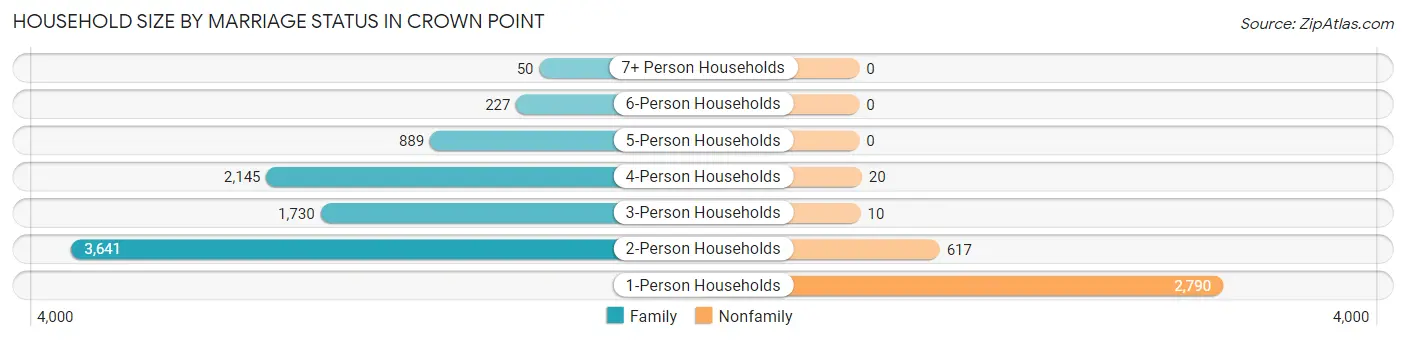
| Household Size | Family Households | Nonfamily Households |
| 1-Person Households | - | 2,790 (23.0%) |
| 2-Person Households | 3,641 (30.0%) | 617 (5.1%) |
| 3-Person Households | 1,730 (14.3%) | 10 (0.1%) |
| 4-Person Households | 2,145 (17.7%) | 20 (0.2%) |
| 5-Person Households | 889 (7.3%) | 0 (0.0%) |
| 6-Person Households | 227 (1.9%) | 0 (0.0%) |
| 7+ Person Households | 50 (0.4%) | 0 (0.0%) |
| Total | 8,682 (71.6%) | 3,437 (28.4%) |
Female Fertility in Crown Point
Fertility by Age in Crown Point
Average fertility rate in Crown Point is 74.0 births per 1,000 women. Women in the age bracket of 20 to 34 years have the highest fertility rate with 110.0 births per 1,000 women. Women in the age bracket of 20 to 34 years acount for 63.6% of all women with births.
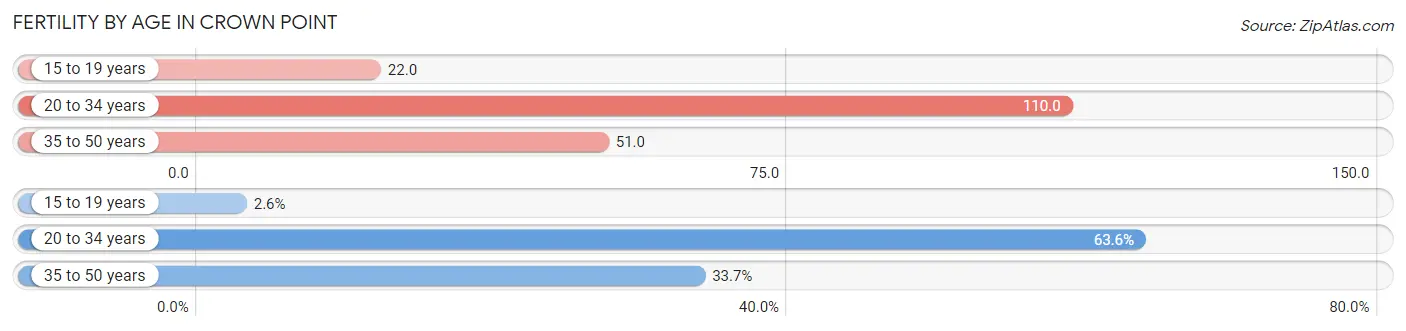
| Age Bracket | Women with Births | Births / 1,000 Women |
| 15 to 19 years | 13 (2.6%) | 22.0 |
| 20 to 34 years | 315 (63.6%) | 110.0 |
| 35 to 50 years | 167 (33.7%) | 51.0 |
| Total | 495 (100.0%) | 74.0 |
Fertility by Age by Marriage Status in Crown Point
85.7% of women with births (495) in Crown Point are married. The highest percentage of unmarried women with births falls into 15 to 19 years age bracket with 100.0% of them unmarried at the time of birth, while the lowest percentage of unmarried women with births belong to 35 to 50 years age bracket with 5.4% of them unmarried.
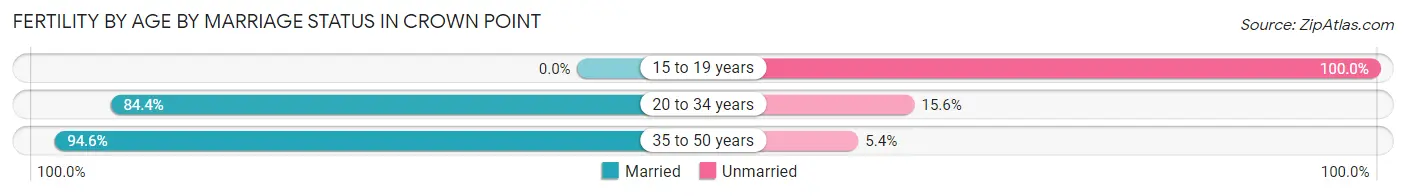
| Age Bracket | Married | Unmarried |
| 15 to 19 years | 0 (0.0%) | 13 (100.0%) |
| 20 to 34 years | 266 (84.4%) | 49 (15.6%) |
| 35 to 50 years | 158 (94.6%) | 9 (5.4%) |
| Total | 424 (85.7%) | 71 (14.3%) |
Fertility by Education in Crown Point
Average fertility rate in Crown Point is 74.0 births per 1,000 women. Women with the education attainment of graduate degree have the highest fertility rate of 159.0 births per 1,000 women, while women with the education attainment of less than high school have the lowest fertility at 40.0 births per 1,000 women. Women with the education attainment of college or associate's degree represent 34.5% of all women with births.
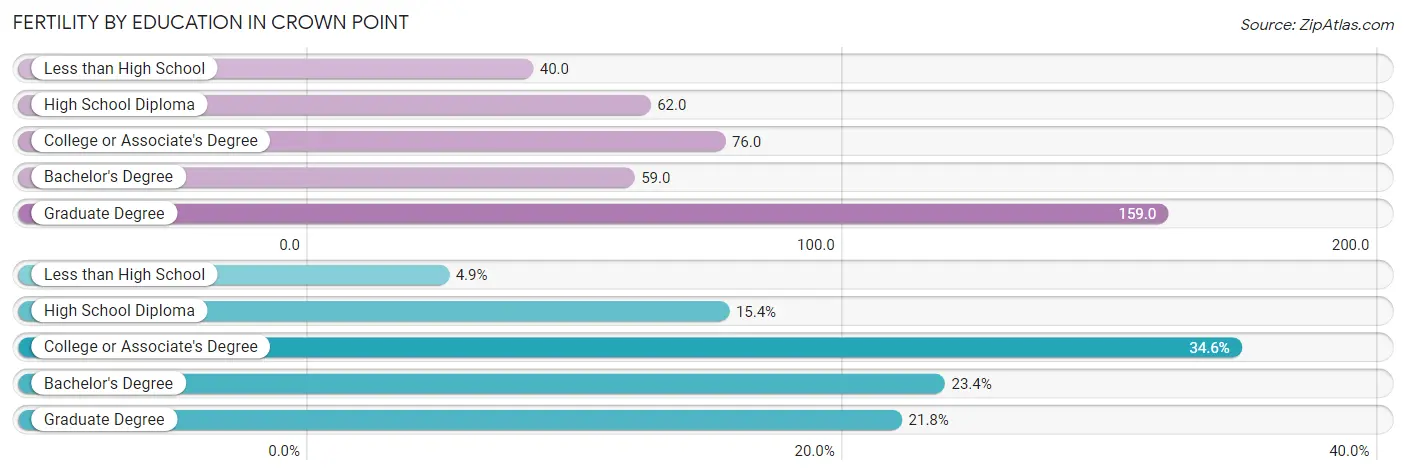
| Educational Attainment | Women with Births | Births / 1,000 Women |
| Less than High School | 24 (4.9%) | 40.0 |
| High School Diploma | 76 (15.3%) | 62.0 |
| College or Associate's Degree | 171 (34.5%) | 76.0 |
| Bachelor's Degree | 116 (23.4%) | 59.0 |
| Graduate Degree | 108 (21.8%) | 159.0 |
| Total | 495 (100.0%) | 74.0 |
Fertility by Education by Marriage Status in Crown Point
14.3% of women with births in Crown Point are unmarried. Women with the educational attainment of bachelor's degree are most likely to be married with 100.0% of them married at childbirth, while women with the educational attainment of less than high school are least likely to be married with 100.0% of them unmarried at childbirth.
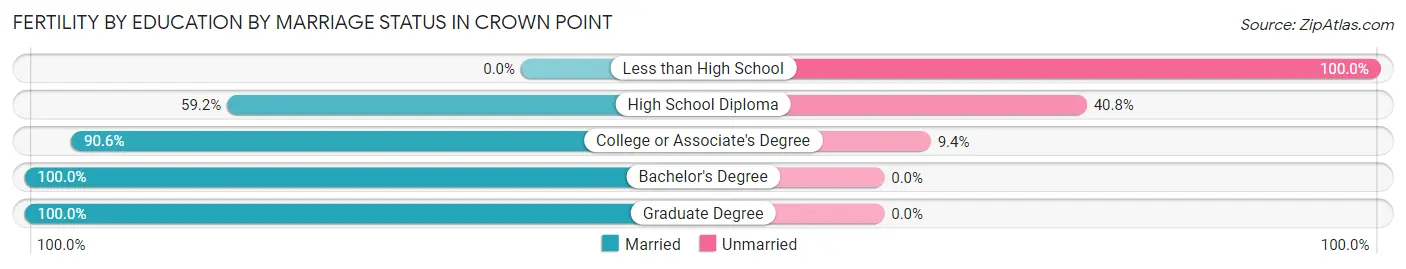
| Educational Attainment | Married | Unmarried |
| Less than High School | 0 (0.0%) | 24 (100.0%) |
| High School Diploma | 45 (59.2%) | 31 (40.8%) |
| College or Associate's Degree | 155 (90.6%) | 16 (9.4%) |
| Bachelor's Degree | 116 (100.0%) | 0 (0.0%) |
| Graduate Degree | 108 (100.0%) | 0 (0.0%) |
| Total | 424 (85.7%) | 71 (14.3%) |
Employment Characteristics in Crown Point
Employment by Class of Employer in Crown Point
Among the 15,075 employed individuals in Crown Point, private company employees (10,793 | 71.6%), local government employees (1,397 | 9.3%), and not-for-profit organizations (1,268 | 8.4%) make up the most common classes of employment.
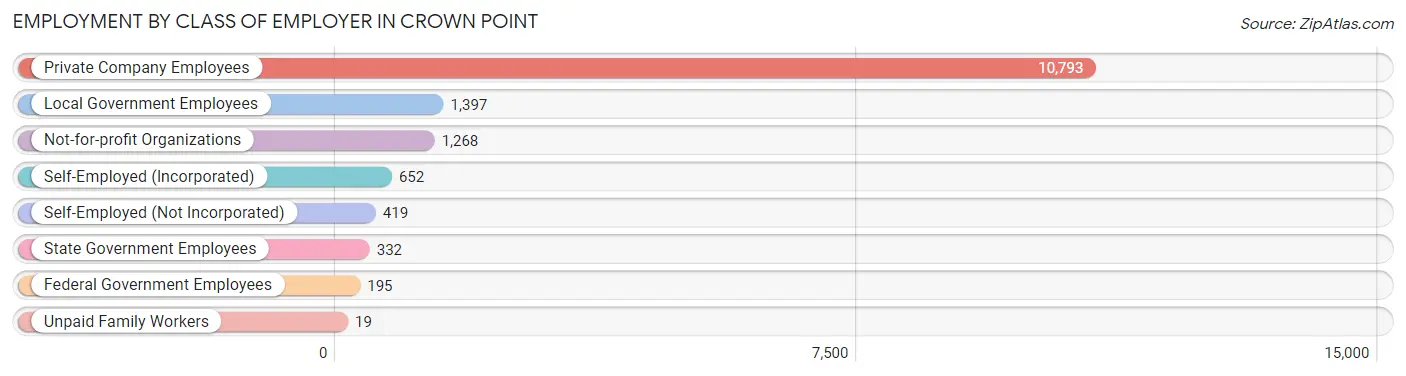
| Employer Class | # Employees | % Employees |
| Private Company Employees | 10,793 | 71.6% |
| Self-Employed (Incorporated) | 652 | 4.3% |
| Self-Employed (Not Incorporated) | 419 | 2.8% |
| Not-for-profit Organizations | 1,268 | 8.4% |
| Local Government Employees | 1,397 | 9.3% |
| State Government Employees | 332 | 2.2% |
| Federal Government Employees | 195 | 1.3% |
| Unpaid Family Workers | 19 | 0.1% |
| Total | 15,075 | 100.0% |
Employment Status by Age in Crown Point
According to the labor force statistics for Crown Point, out of the total population over 16 years of age (26,062), 62.0% or 16,158 individuals are in the labor force, with 4.3% or 695 of them unemployed. The age group with the highest labor force participation rate is 45 to 54 years, with 90.7% or 3,323 individuals in the labor force. Within the labor force, the 16 to 19 years age range has the highest percentage of unemployed individuals, with 27.1% or 140 of them being unemployed.
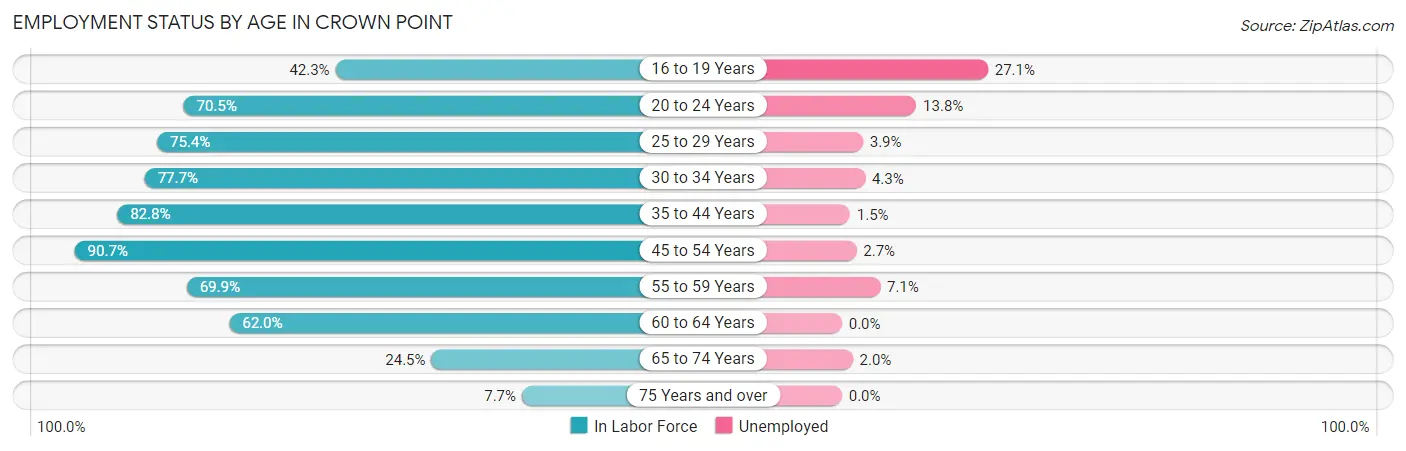
| Age Bracket | In Labor Force | Unemployed |
| 16 to 19 Years | 516 (42.3%) | 140 (27.1%) |
| 20 to 24 Years | 916 (70.5%) | 126 (13.8%) |
| 25 to 29 Years | 1,508 (75.4%) | 59 (3.9%) |
| 30 to 34 Years | 2,022 (77.7%) | 87 (4.3%) |
| 35 to 44 Years | 3,927 (82.8%) | 59 (1.5%) |
| 45 to 54 Years | 3,323 (90.7%) | 90 (2.7%) |
| 55 to 59 Years | 1,704 (69.9%) | 121 (7.1%) |
| 60 to 64 Years | 1,262 (62.0%) | 0 (0.0%) |
| 65 to 74 Years | 749 (24.5%) | 15 (2.0%) |
| 75 Years and over | 231 (7.7%) | 0 (0.0%) |
| Total | 16,158 (62.0%) | 695 (4.3%) |
Employment Status by Educational Attainment in Crown Point
According to labor force statistics for Crown Point, 78.6% of individuals (13,741) out of the total population between 25 and 64 years of age (17,482) are in the labor force, with 3.0% or 412 of them being unemployed. The group with the highest labor force participation rate are those with the educational attainment of bachelor's degree or higher, with 87.6% or 5,394 individuals in the labor force. Within the labor force, individuals with bachelor's degree or higher education have the highest percentage of unemployment, with 3.7% or 200 of them being unemployed.
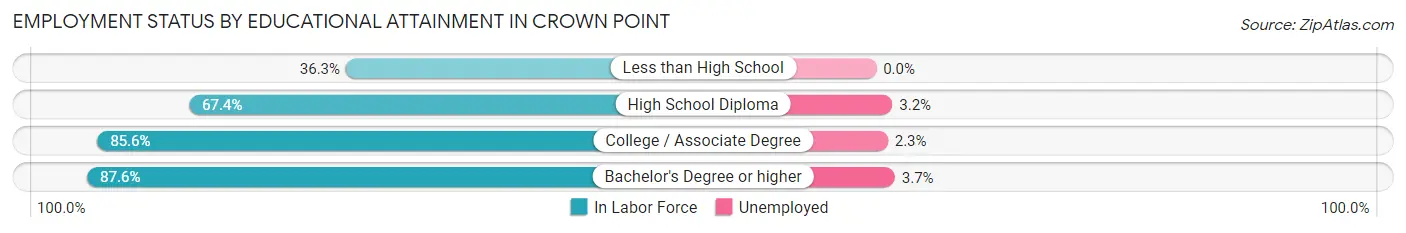
| Educational Attainment | In Labor Force | Unemployed |
| Less than High School | 365 (36.3%) | 0 (0.0%) |
| High School Diploma | 3,150 (67.4%) | 150 (3.2%) |
| College / Associate Degree | 4,832 (85.6%) | 130 (2.3%) |
| Bachelor's Degree or higher | 5,394 (87.6%) | 228 (3.7%) |
| Total | 13,741 (78.6%) | 524 (3.0%) |
Employment Occupations by Sex in Crown Point
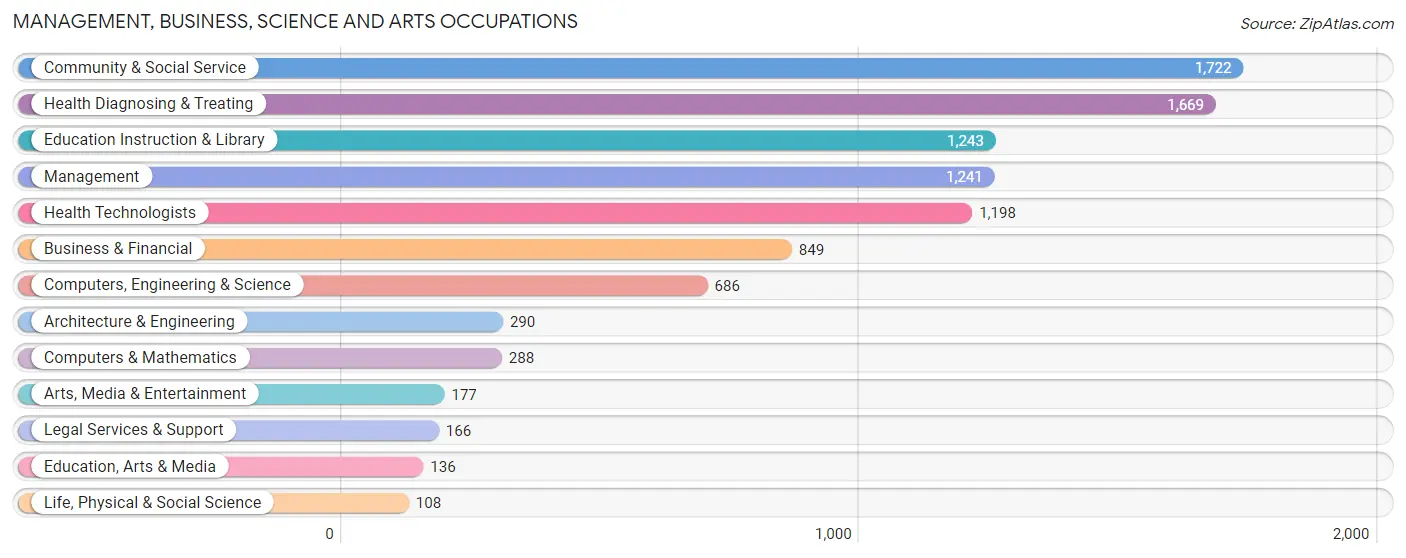
Management, Business, Science and Arts Occupations
The most common Management, Business, Science and Arts occupations in Crown Point are Community & Social Service (1,722 | 11.2%), Health Diagnosing & Treating (1,669 | 10.8%), Education Instruction & Library (1,243 | 8.1%), Management (1,241 | 8.0%), and Health Technologists (1,198 | 7.8%).
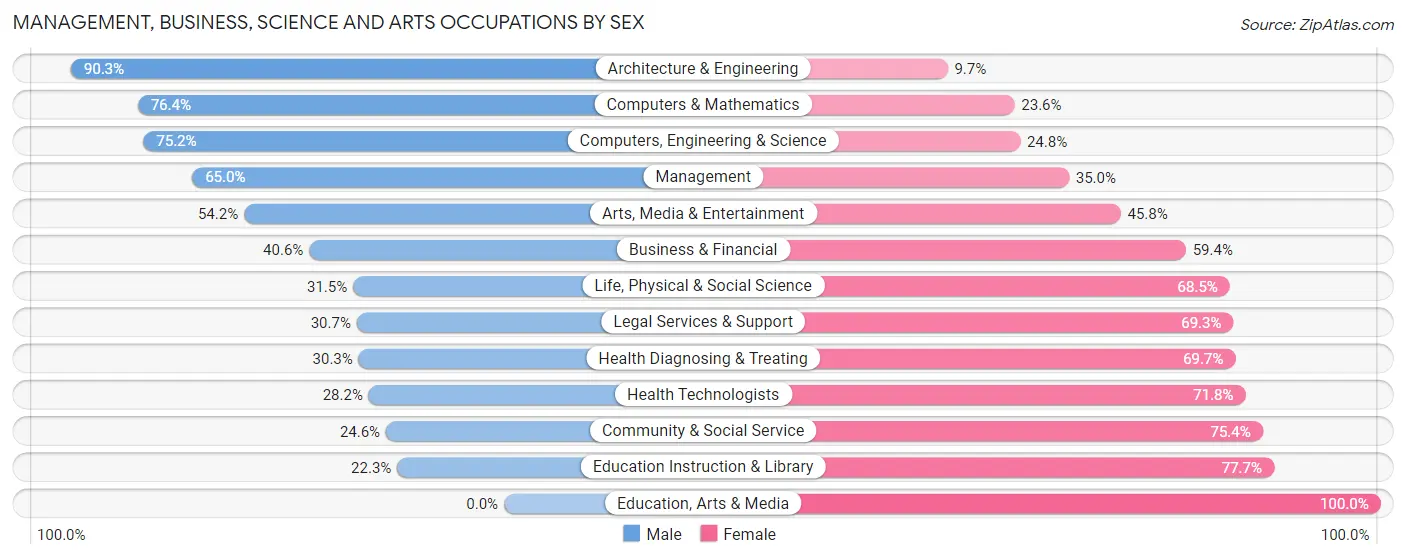
Management, Business, Science and Arts Occupations by Sex
Within the Management, Business, Science and Arts occupations in Crown Point, the most male-oriented occupations are Architecture & Engineering (90.3%), Computers & Mathematics (76.4%), and Computers, Engineering & Science (75.2%), while the most female-oriented occupations are Education, Arts & Media (100.0%), Education Instruction & Library (77.7%), and Community & Social Service (75.4%).
| Occupation | Male | Female |
| Management | 807 (65.0%) | 434 (35.0%) |
| Business & Financial | 345 (40.6%) | 504 (59.4%) |
| Computers, Engineering & Science | 516 (75.2%) | 170 (24.8%) |
| Computers & Mathematics | 220 (76.4%) | 68 (23.6%) |
| Architecture & Engineering | 262 (90.3%) | 28 (9.7%) |
| Life, Physical & Social Science | 34 (31.5%) | 74 (68.5%) |
| Community & Social Service | 424 (24.6%) | 1,298 (75.4%) |
| Education, Arts & Media | 0 (0.0%) | 136 (100.0%) |
| Legal Services & Support | 51 (30.7%) | 115 (69.3%) |
| Education Instruction & Library | 277 (22.3%) | 966 (77.7%) |
| Arts, Media & Entertainment | 96 (54.2%) | 81 (45.8%) |
| Health Diagnosing & Treating | 506 (30.3%) | 1,163 (69.7%) |
| Health Technologists | 338 (28.2%) | 860 (71.8%) |
| Total (Category) | 2,598 (42.1%) | 3,569 (57.9%) |
| Total (Overall) | 8,214 (53.2%) | 7,218 (46.8%) |
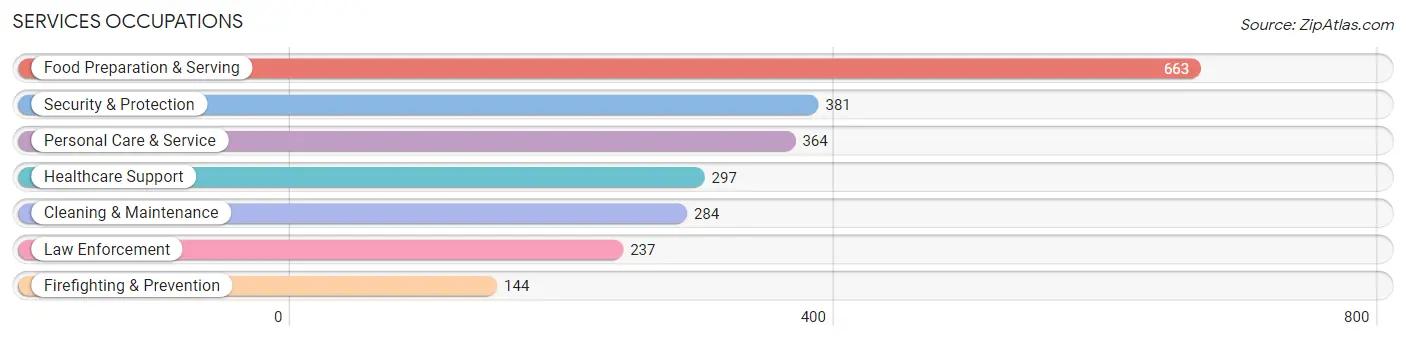
Services Occupations
The most common Services occupations in Crown Point are Food Preparation & Serving (663 | 4.3%), Security & Protection (381 | 2.5%), Personal Care & Service (364 | 2.4%), Healthcare Support (297 | 1.9%), and Cleaning & Maintenance (284 | 1.8%).
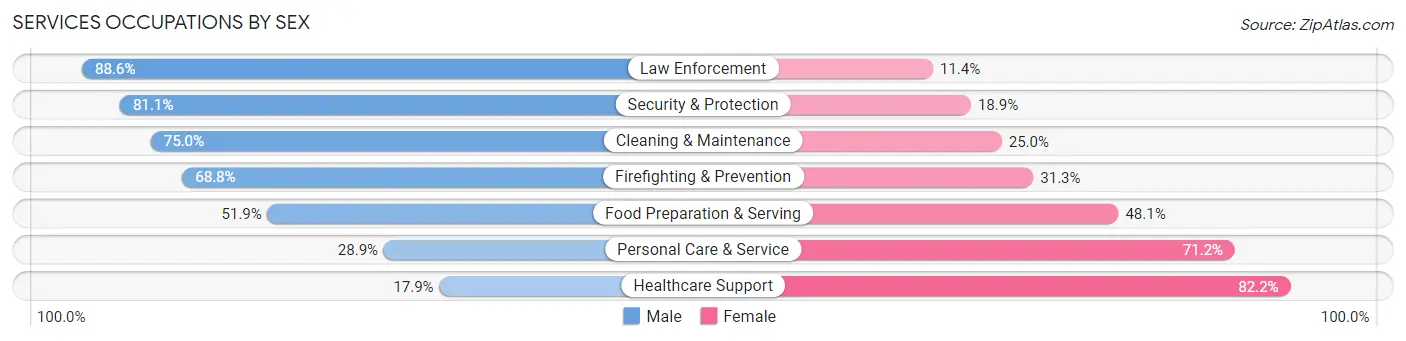
Services Occupations by Sex
Within the Services occupations in Crown Point, the most male-oriented occupations are Law Enforcement (88.6%), Security & Protection (81.1%), and Cleaning & Maintenance (75.0%), while the most female-oriented occupations are Healthcare Support (82.2%), Personal Care & Service (71.2%), and Food Preparation & Serving (48.1%).
| Occupation | Male | Female |
| Healthcare Support | 53 (17.8%) | 244 (82.2%) |
| Security & Protection | 309 (81.1%) | 72 (18.9%) |
| Firefighting & Prevention | 99 (68.8%) | 45 (31.2%) |
| Law Enforcement | 210 (88.6%) | 27 (11.4%) |
| Food Preparation & Serving | 344 (51.9%) | 319 (48.1%) |
| Cleaning & Maintenance | 213 (75.0%) | 71 (25.0%) |
| Personal Care & Service | 105 (28.8%) | 259 (71.2%) |
| Total (Category) | 1,024 (51.5%) | 965 (48.5%) |
| Total (Overall) | 8,214 (53.2%) | 7,218 (46.8%) |
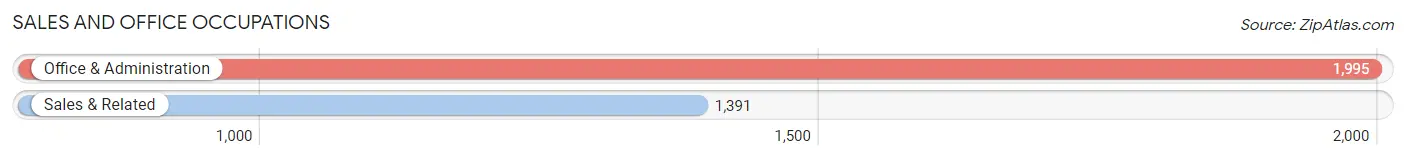
Sales and Office Occupations
The most common Sales and Office occupations in Crown Point are Office & Administration (1,995 | 12.9%), and Sales & Related (1,391 | 9.0%).
Sales and Office Occupations by Sex
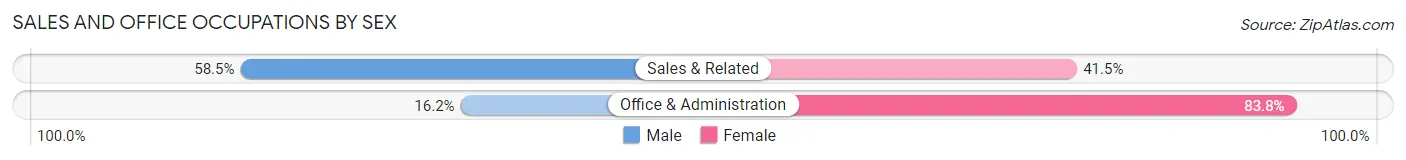
| Occupation | Male | Female |
| Sales & Related | 814 (58.5%) | 577 (41.5%) |
| Office & Administration | 323 (16.2%) | 1,672 (83.8%) |
| Total (Category) | 1,137 (33.6%) | 2,249 (66.4%) |
| Total (Overall) | 8,214 (53.2%) | 7,218 (46.8%) |
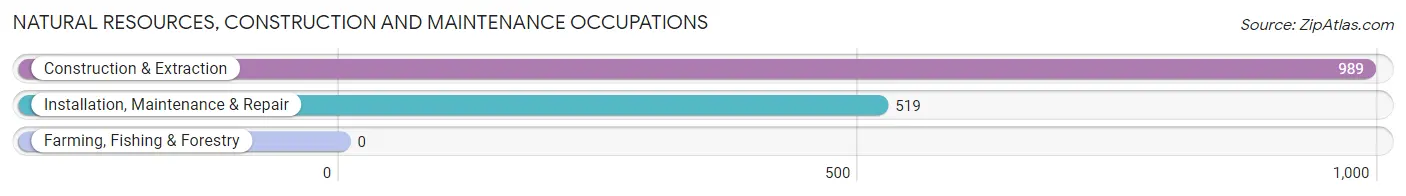
Natural Resources, Construction and Maintenance Occupations
The most common Natural Resources, Construction and Maintenance occupations in Crown Point are Construction & Extraction (989 | 6.4%), and Installation, Maintenance & Repair (519 | 3.4%).
Natural Resources, Construction and Maintenance Occupations by Sex
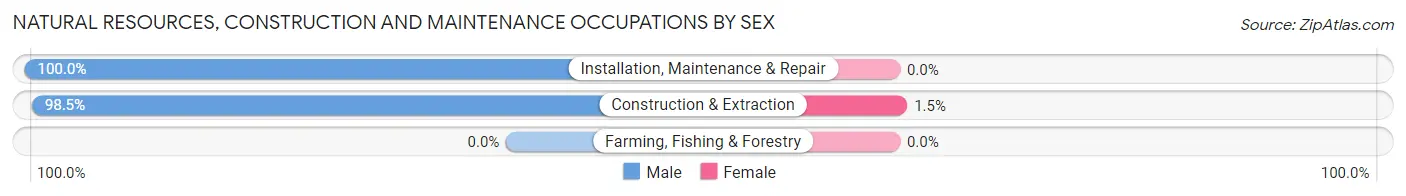
| Occupation | Male | Female |
| Farming, Fishing & Forestry | 0 (0.0%) | 0 (0.0%) |
| Construction & Extraction | 974 (98.5%) | 15 (1.5%) |
| Installation, Maintenance & Repair | 519 (100.0%) | 0 (0.0%) |
| Total (Category) | 1,493 (99.0%) | 15 (1.0%) |
| Total (Overall) | 8,214 (53.2%) | 7,218 (46.8%) |
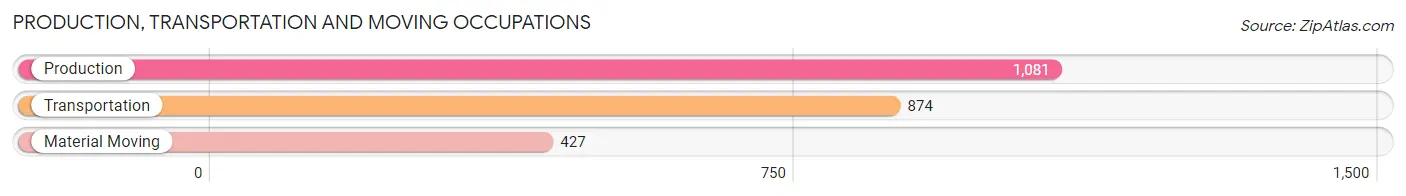
Production, Transportation and Moving Occupations
The most common Production, Transportation and Moving occupations in Crown Point are Production (1,081 | 7.0%), Transportation (874 | 5.7%), and Material Moving (427 | 2.8%).
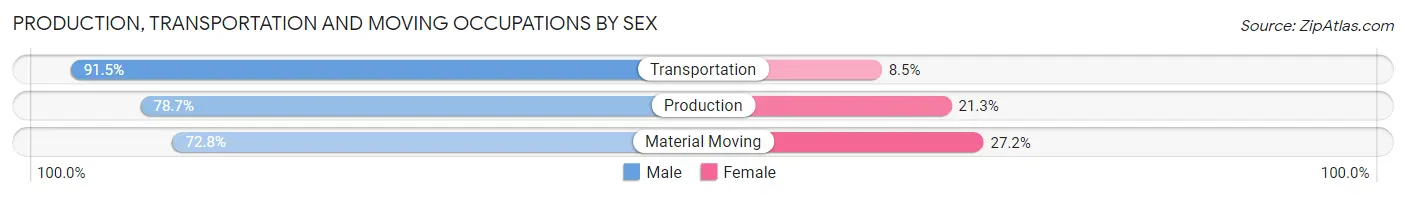
Production, Transportation and Moving Occupations by Sex
| Occupation | Male | Female |
| Production | 851 (78.7%) | 230 (21.3%) |
| Transportation | 800 (91.5%) | 74 (8.5%) |
| Material Moving | 311 (72.8%) | 116 (27.2%) |
| Total (Category) | 1,962 (82.4%) | 420 (17.6%) |
| Total (Overall) | 8,214 (53.2%) | 7,218 (46.8%) |
Employment Industries by Sex in Crown Point
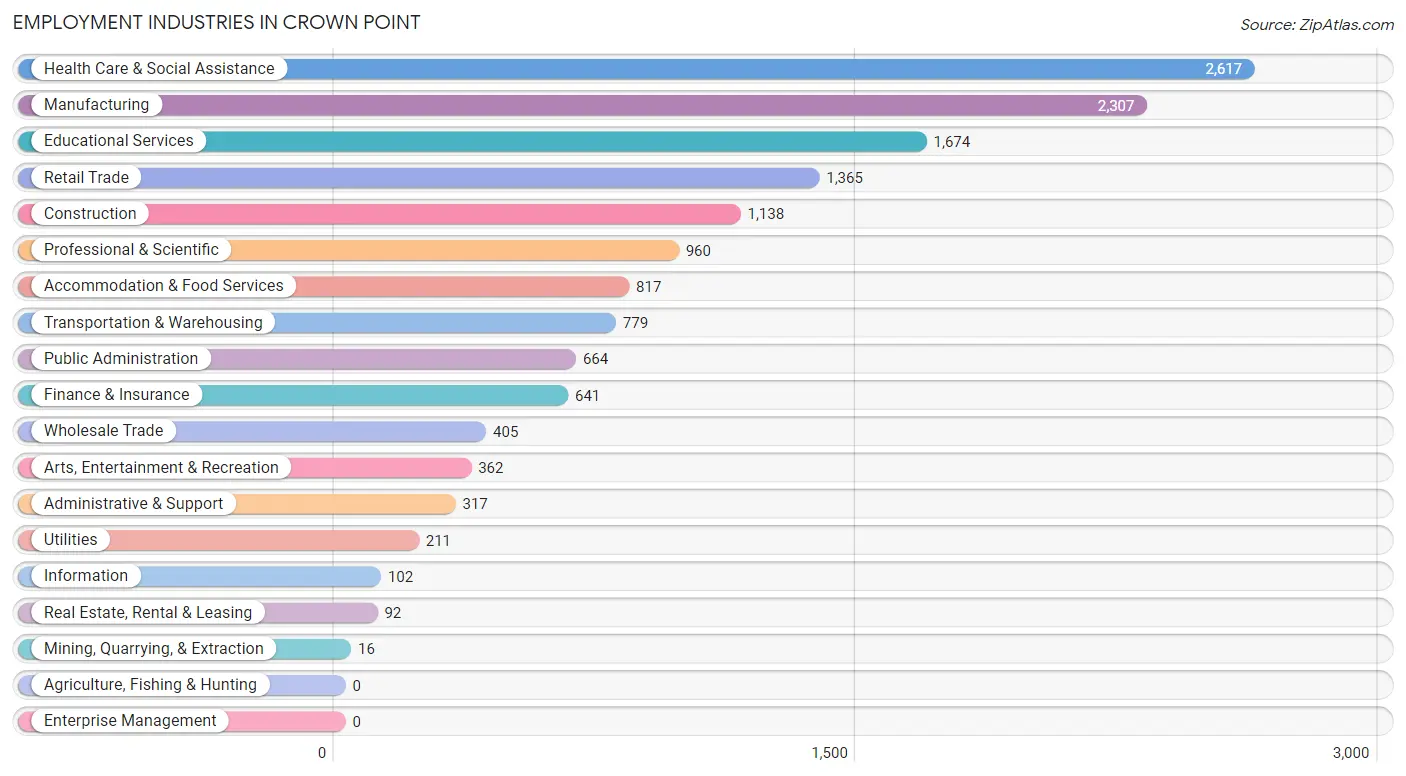
Employment Industries in Crown Point
The major employment industries in Crown Point include Health Care & Social Assistance (2,617 | 17.0%), Manufacturing (2,307 | 14.9%), Educational Services (1,674 | 10.8%), Retail Trade (1,365 | 8.8%), and Construction (1,138 | 7.4%).
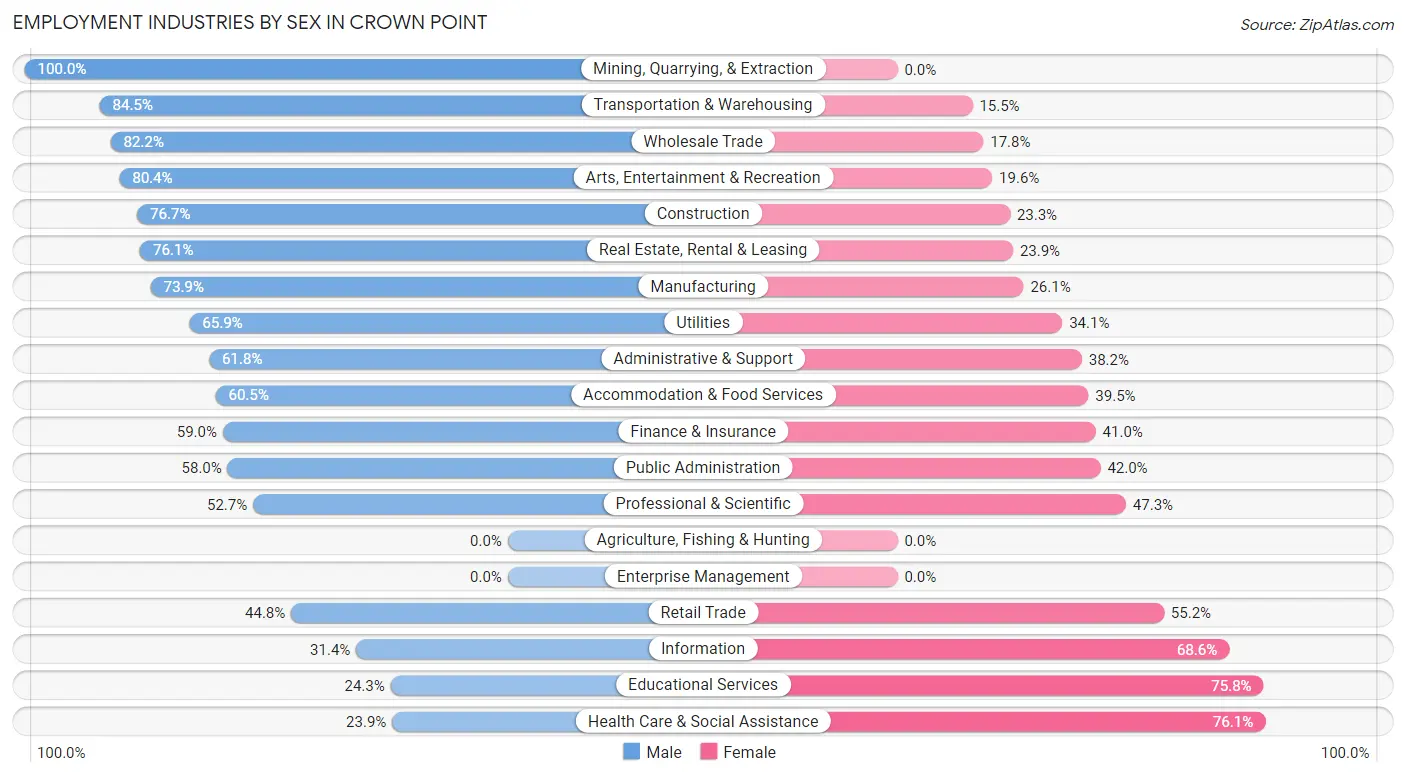
Employment Industries by Sex in Crown Point
The Crown Point industries that see more men than women are Mining, Quarrying, & Extraction (100.0%), Transportation & Warehousing (84.5%), and Wholesale Trade (82.2%), whereas the industries that tend to have a higher number of women are Health Care & Social Assistance (76.1%), Educational Services (75.7%), and Information (68.6%).
| Industry | Male | Female |
| Agriculture, Fishing & Hunting | 0 (0.0%) | 0 (0.0%) |
| Mining, Quarrying, & Extraction | 16 (100.0%) | 0 (0.0%) |
| Construction | 873 (76.7%) | 265 (23.3%) |
| Manufacturing | 1,705 (73.9%) | 602 (26.1%) |
| Wholesale Trade | 333 (82.2%) | 72 (17.8%) |
| Retail Trade | 612 (44.8%) | 753 (55.2%) |
| Transportation & Warehousing | 658 (84.5%) | 121 (15.5%) |
| Utilities | 139 (65.9%) | 72 (34.1%) |
| Information | 32 (31.4%) | 70 (68.6%) |
| Finance & Insurance | 378 (59.0%) | 263 (41.0%) |
| Real Estate, Rental & Leasing | 70 (76.1%) | 22 (23.9%) |
| Professional & Scientific | 506 (52.7%) | 454 (47.3%) |
| Enterprise Management | 0 (0.0%) | 0 (0.0%) |
| Administrative & Support | 196 (61.8%) | 121 (38.2%) |
| Educational Services | 406 (24.2%) | 1,268 (75.7%) |
| Health Care & Social Assistance | 626 (23.9%) | 1,991 (76.1%) |
| Arts, Entertainment & Recreation | 291 (80.4%) | 71 (19.6%) |
| Accommodation & Food Services | 494 (60.5%) | 323 (39.5%) |
| Public Administration | 385 (58.0%) | 279 (42.0%) |
| Total | 8,214 (53.2%) | 7,218 (46.8%) |
Education in Crown Point
School Enrollment in Crown Point
The most common levels of schooling among the 8,068 students in Crown Point are middle school (2,260 | 28.0%), elementary school (1,692 | 21.0%), and high school (1,379 | 17.1%).
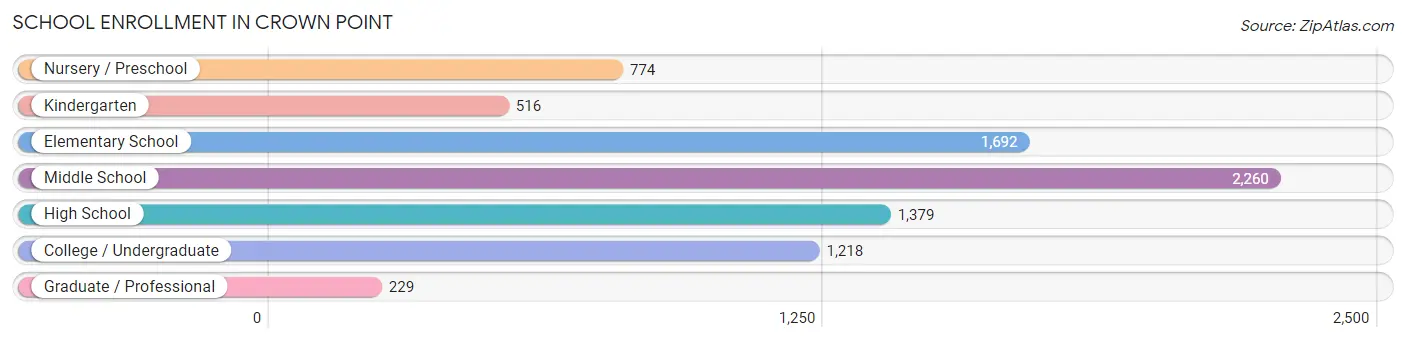
| School Level | # Students | % Students |
| Nursery / Preschool | 774 | 9.6% |
| Kindergarten | 516 | 6.4% |
| Elementary School | 1,692 | 21.0% |
| Middle School | 2,260 | 28.0% |
| High School | 1,379 | 17.1% |
| College / Undergraduate | 1,218 | 15.1% |
| Graduate / Professional | 229 | 2.8% |
| Total | 8,068 | 100.0% |
School Enrollment by Age by Funding Source in Crown Point
Out of a total of 8,068 students who are enrolled in schools in Crown Point, 984 (12.2%) attend a private institution, while the remaining 7,084 (87.8%) are enrolled in public schools. The age group of 5 to 9 year old has the highest likelihood of being enrolled in private schools, with 480 (22.8% in the age bracket) enrolled. Conversely, the age group of 15 to 17 year olds has the lowest likelihood of being enrolled in a private school, with 1,057 (97.8% in the age bracket) attending a public institution.
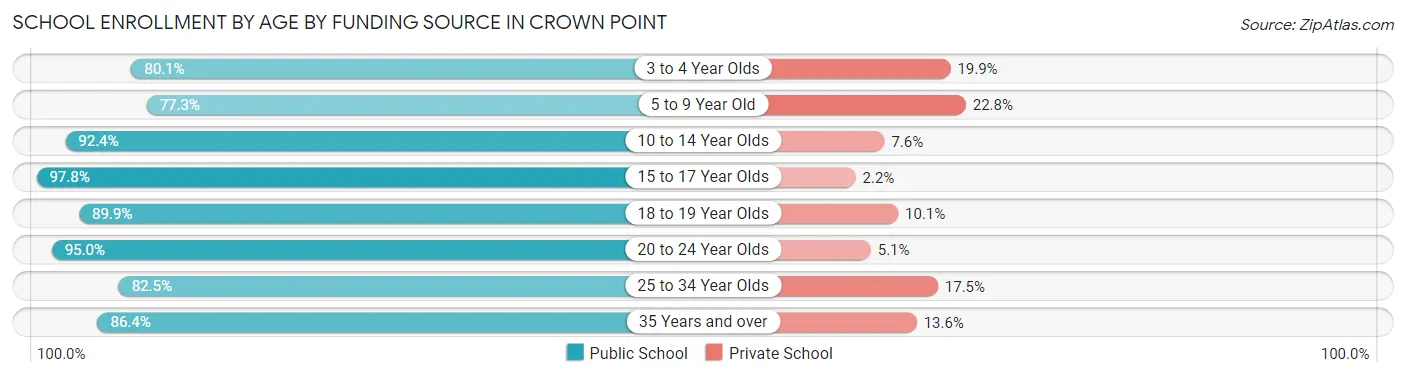
| Age Bracket | Public School | Private School |
| 3 to 4 Year Olds | 435 (80.1%) | 108 (19.9%) |
| 5 to 9 Year Old | 1,630 (77.2%) | 480 (22.8%) |
| 10 to 14 Year Olds | 2,479 (92.4%) | 204 (7.6%) |
| 15 to 17 Year Olds | 1,057 (97.8%) | 24 (2.2%) |
| 18 to 19 Year Olds | 319 (89.9%) | 36 (10.1%) |
| 20 to 24 Year Olds | 583 (95.0%) | 31 (5.1%) |
| 25 to 34 Year Olds | 235 (82.5%) | 50 (17.5%) |
| 35 Years and over | 343 (86.4%) | 54 (13.6%) |
| Total | 7,084 (87.8%) | 984 (12.2%) |
Educational Attainment by Field of Study in Crown Point
Business (1,880 | 21.7%), education (1,571 | 18.2%), science & technology (1,376 | 15.9%), arts & humanities (767 | 8.9%), and liberal arts & history (480 | 5.6%) are the most common fields of study among 8,649 individuals in Crown Point who have obtained a bachelor's degree or higher.
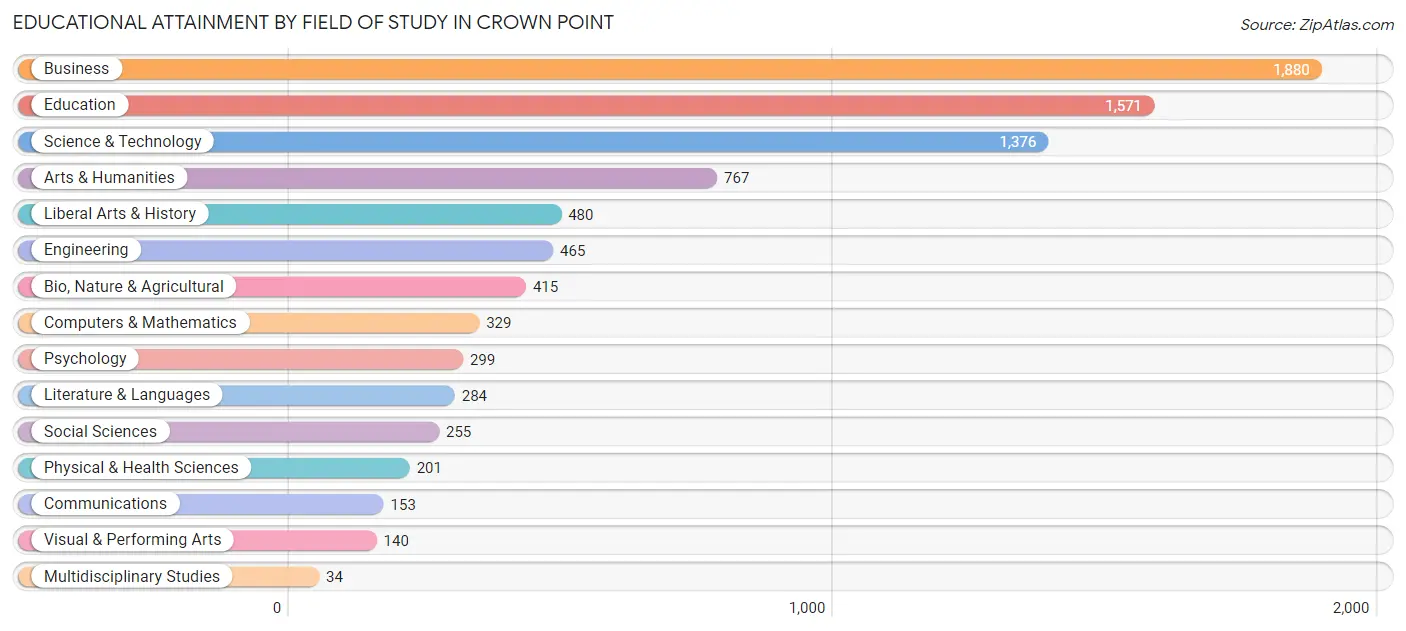
| Field of Study | # Graduates | % Graduates |
| Computers & Mathematics | 329 | 3.8% |
| Bio, Nature & Agricultural | 415 | 4.8% |
| Physical & Health Sciences | 201 | 2.3% |
| Psychology | 299 | 3.5% |
| Social Sciences | 255 | 2.9% |
| Engineering | 465 | 5.4% |
| Multidisciplinary Studies | 34 | 0.4% |
| Science & Technology | 1,376 | 15.9% |
| Business | 1,880 | 21.7% |
| Education | 1,571 | 18.2% |
| Literature & Languages | 284 | 3.3% |
| Liberal Arts & History | 480 | 5.6% |
| Visual & Performing Arts | 140 | 1.6% |
| Communications | 153 | 1.8% |
| Arts & Humanities | 767 | 8.9% |
| Total | 8,649 | 100.0% |
Transportation & Commute in Crown Point
Vehicle Availability by Sex in Crown Point
The most prevalent vehicle ownership categories in Crown Point are males with 2 vehicles (4,028, accounting for 49.5%) and females with 2 vehicles (3,279, making up 58.1%).
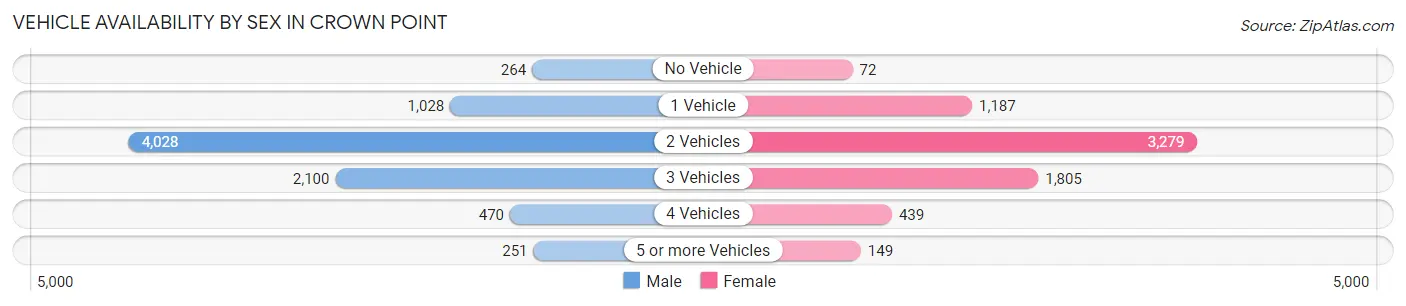
| Vehicles Available | Male | Female |
| No Vehicle | 264 (3.2%) | 72 (1.0%) |
| 1 Vehicle | 1,028 (12.6%) | 1,187 (17.1%) |
| 2 Vehicles | 4,028 (49.5%) | 3,279 (47.3%) |
| 3 Vehicles | 2,100 (25.8%) | 1,805 (26.0%) |
| 4 Vehicles | 470 (5.8%) | 439 (6.3%) |
| 5 or more Vehicles | 251 (3.1%) | 149 (2.1%) |
| Total | 8,141 (100.0%) | 6,931 (100.0%) |
Commute Time in Crown Point
The most frequently occuring commute durations in Crown Point are 10 to 14 minutes (1,812 commuters, 13.1%), 5 to 9 minutes (1,736 commuters, 12.5%), and 15 to 19 minutes (1,676 commuters, 12.1%).
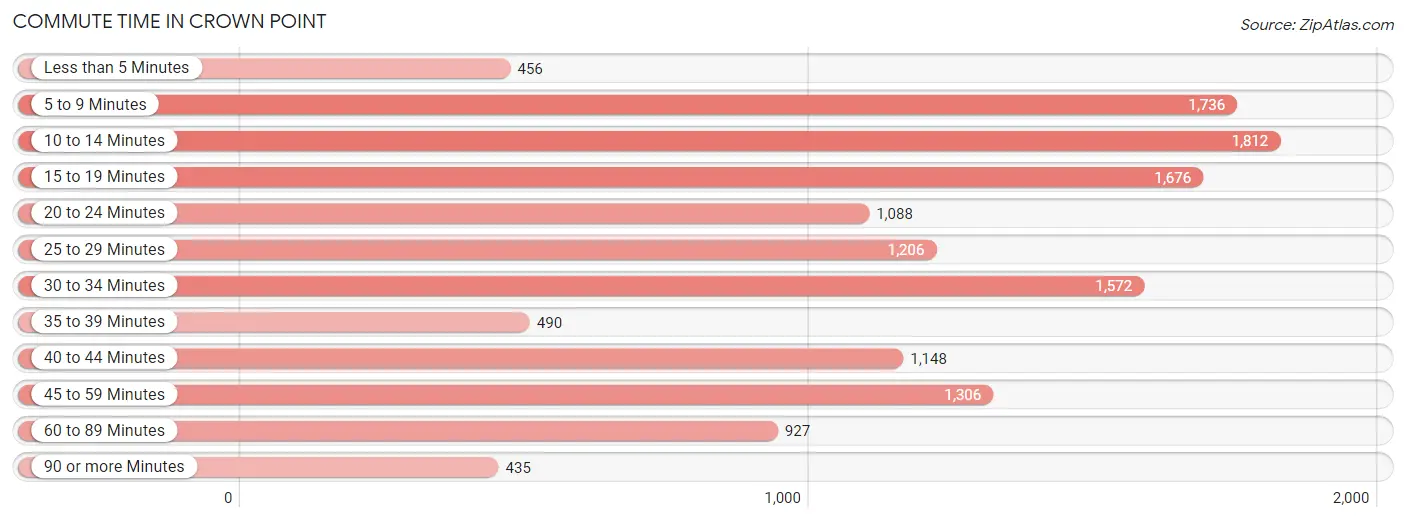
| Commute Time | # Commuters | % Commuters |
| Less than 5 Minutes | 456 | 3.3% |
| 5 to 9 Minutes | 1,736 | 12.5% |
| 10 to 14 Minutes | 1,812 | 13.1% |
| 15 to 19 Minutes | 1,676 | 12.1% |
| 20 to 24 Minutes | 1,088 | 7.9% |
| 25 to 29 Minutes | 1,206 | 8.7% |
| 30 to 34 Minutes | 1,572 | 11.4% |
| 35 to 39 Minutes | 490 | 3.5% |
| 40 to 44 Minutes | 1,148 | 8.3% |
| 45 to 59 Minutes | 1,306 | 9.4% |
| 60 to 89 Minutes | 927 | 6.7% |
| 90 or more Minutes | 435 | 3.1% |
Commute Time by Sex in Crown Point
The most common commute times in Crown Point are 15 to 19 minutes (981 commuters, 13.0%) for males and 5 to 9 minutes (1,040 commuters, 16.5%) for females.
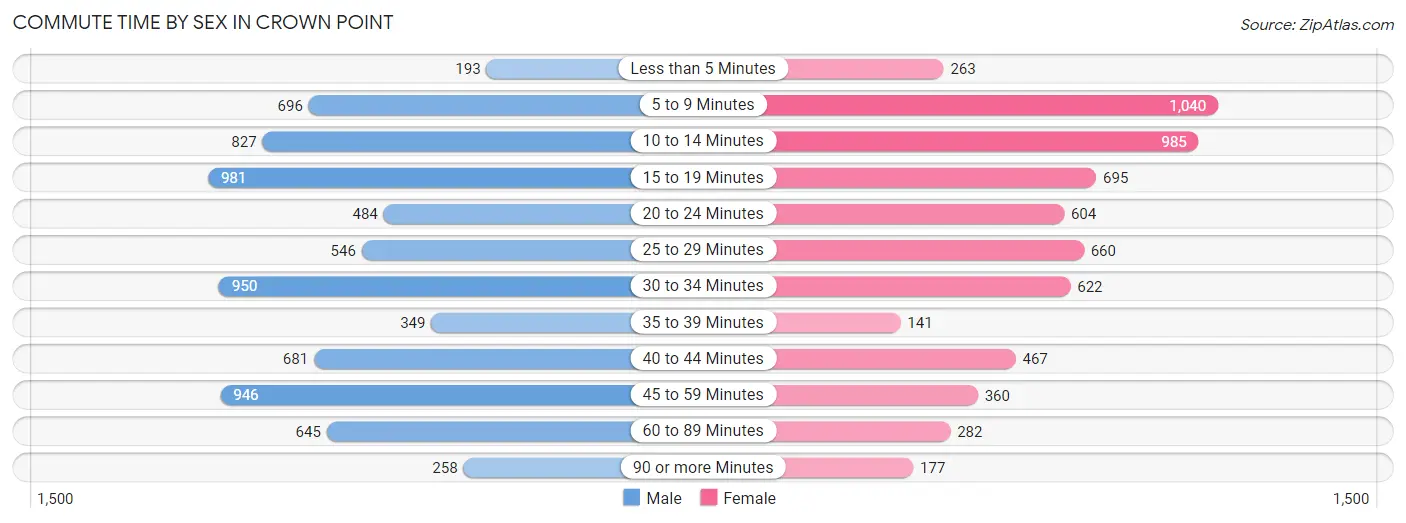
| Commute Time | Male | Female |
| Less than 5 Minutes | 193 (2.5%) | 263 (4.2%) |
| 5 to 9 Minutes | 696 (9.2%) | 1,040 (16.5%) |
| 10 to 14 Minutes | 827 (10.9%) | 985 (15.6%) |
| 15 to 19 Minutes | 981 (13.0%) | 695 (11.0%) |
| 20 to 24 Minutes | 484 (6.4%) | 604 (9.6%) |
| 25 to 29 Minutes | 546 (7.2%) | 660 (10.5%) |
| 30 to 34 Minutes | 950 (12.6%) | 622 (9.9%) |
| 35 to 39 Minutes | 349 (4.6%) | 141 (2.2%) |
| 40 to 44 Minutes | 681 (9.0%) | 467 (7.4%) |
| 45 to 59 Minutes | 946 (12.5%) | 360 (5.7%) |
| 60 to 89 Minutes | 645 (8.5%) | 282 (4.5%) |
| 90 or more Minutes | 258 (3.4%) | 177 (2.8%) |
Time of Departure to Work by Sex in Crown Point
The most frequent times of departure to work in Crown Point are 6:30 AM to 6:59 AM (937, 12.4%) for males and 7:00 AM to 7:29 AM (1,164, 18.5%) for females.
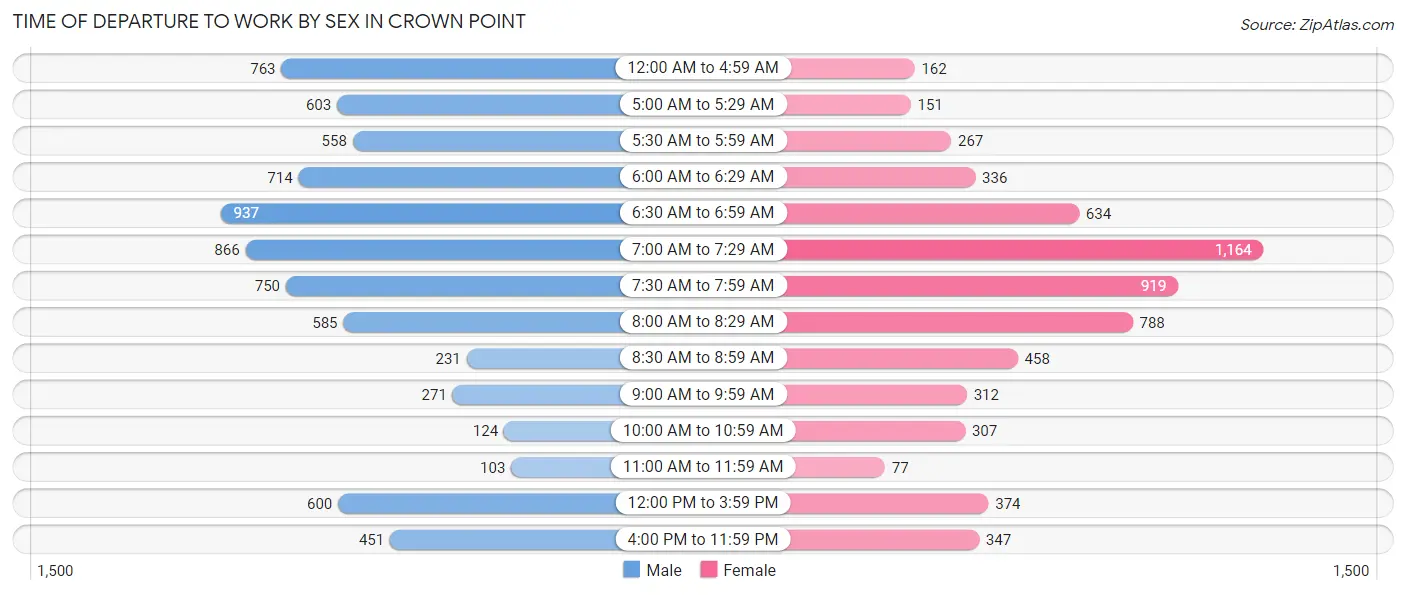
| Time of Departure | Male | Female |
| 12:00 AM to 4:59 AM | 763 (10.1%) | 162 (2.6%) |
| 5:00 AM to 5:29 AM | 603 (8.0%) | 151 (2.4%) |
| 5:30 AM to 5:59 AM | 558 (7.4%) | 267 (4.2%) |
| 6:00 AM to 6:29 AM | 714 (9.5%) | 336 (5.3%) |
| 6:30 AM to 6:59 AM | 937 (12.4%) | 634 (10.1%) |
| 7:00 AM to 7:29 AM | 866 (11.5%) | 1,164 (18.5%) |
| 7:30 AM to 7:59 AM | 750 (9.9%) | 919 (14.6%) |
| 8:00 AM to 8:29 AM | 585 (7.7%) | 788 (12.5%) |
| 8:30 AM to 8:59 AM | 231 (3.1%) | 458 (7.3%) |
| 9:00 AM to 9:59 AM | 271 (3.6%) | 312 (5.0%) |
| 10:00 AM to 10:59 AM | 124 (1.6%) | 307 (4.9%) |
| 11:00 AM to 11:59 AM | 103 (1.4%) | 77 (1.2%) |
| 12:00 PM to 3:59 PM | 600 (7.9%) | 374 (5.9%) |
| 4:00 PM to 11:59 PM | 451 (6.0%) | 347 (5.5%) |
| Total | 7,556 (100.0%) | 6,296 (100.0%) |
Housing Occupancy in Crown Point
Occupancy by Ownership in Crown Point
Of the total 12,119 dwellings in Crown Point, owner-occupied units account for 10,434 (86.1%), while renter-occupied units make up 1,685 (13.9%).
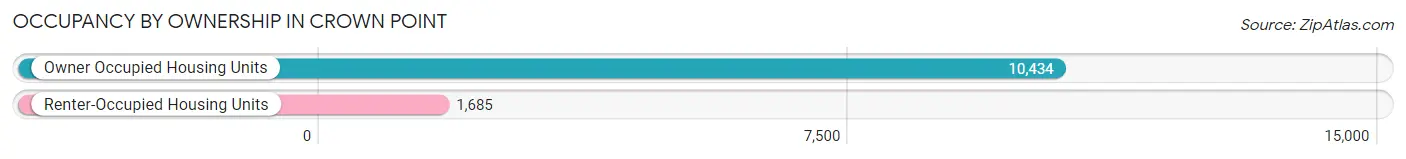
| Occupancy | # Housing Units | % Housing Units |
| Owner Occupied Housing Units | 10,434 | 86.1% |
| Renter-Occupied Housing Units | 1,685 | 13.9% |
| Total Occupied Housing Units | 12,119 | 100.0% |
Occupancy by Household Size in Crown Point
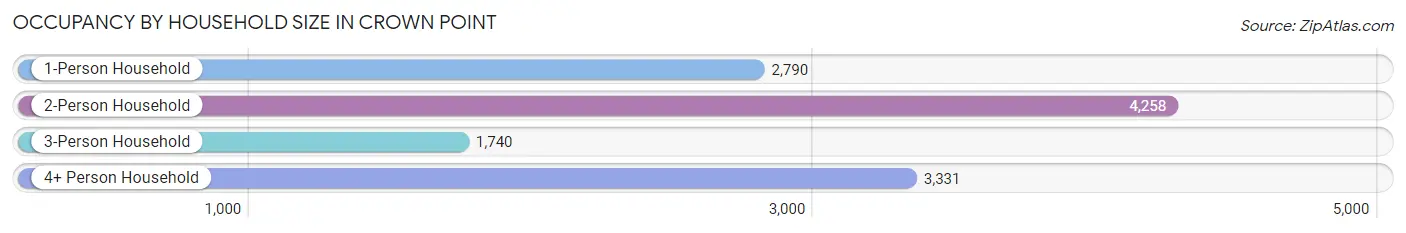
| Household Size | # Housing Units | % Housing Units |
| 1-Person Household | 2,790 | 23.0% |
| 2-Person Household | 4,258 | 35.1% |
| 3-Person Household | 1,740 | 14.4% |
| 4+ Person Household | 3,331 | 27.5% |
| Total Housing Units | 12,119 | 100.0% |
Occupancy by Ownership by Household Size in Crown Point
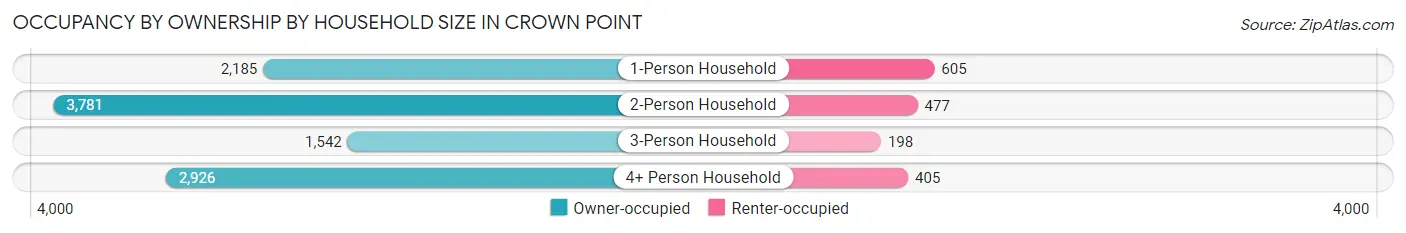
| Household Size | Owner-occupied | Renter-occupied |
| 1-Person Household | 2,185 (78.3%) | 605 (21.7%) |
| 2-Person Household | 3,781 (88.8%) | 477 (11.2%) |
| 3-Person Household | 1,542 (88.6%) | 198 (11.4%) |
| 4+ Person Household | 2,926 (87.8%) | 405 (12.2%) |
| Total Housing Units | 10,434 (86.1%) | 1,685 (13.9%) |
Occupancy by Educational Attainment in Crown Point
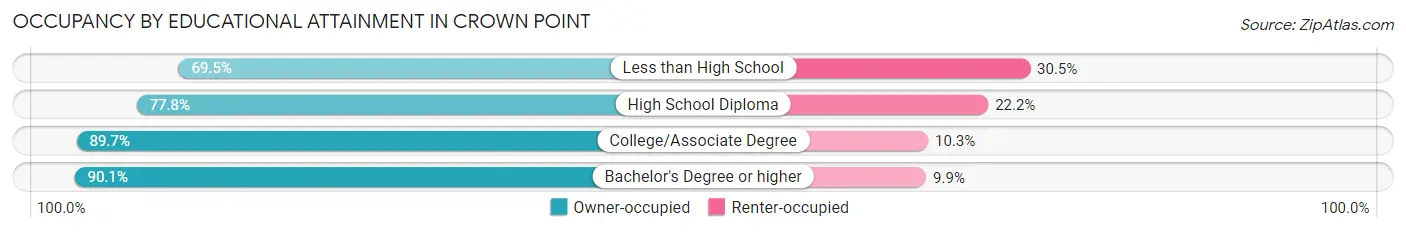
| Household Size | Owner-occupied | Renter-occupied |
| Less than High School | 469 (69.5%) | 206 (30.5%) |
| High School Diploma | 2,081 (77.8%) | 594 (22.2%) |
| College/Associate Degree | 3,695 (89.7%) | 424 (10.3%) |
| Bachelor's Degree or higher | 4,189 (90.1%) | 461 (9.9%) |
Occupancy by Age of Householder in Crown Point
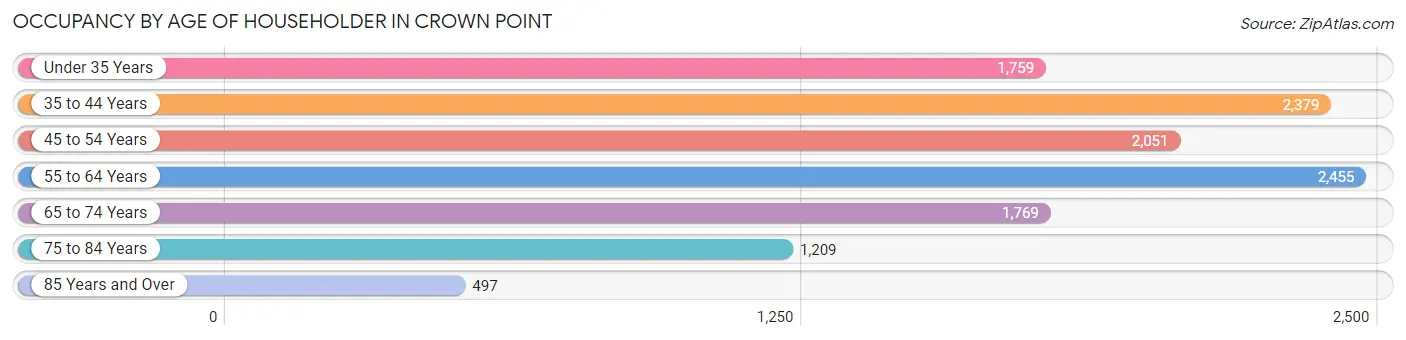
| Age Bracket | # Households | % Households |
| Under 35 Years | 1,759 | 14.5% |
| 35 to 44 Years | 2,379 | 19.6% |
| 45 to 54 Years | 2,051 | 16.9% |
| 55 to 64 Years | 2,455 | 20.3% |
| 65 to 74 Years | 1,769 | 14.6% |
| 75 to 84 Years | 1,209 | 10.0% |
| 85 Years and Over | 497 | 4.1% |
| Total | 12,119 | 100.0% |
Housing Finances in Crown Point
Median Income by Occupancy in Crown Point
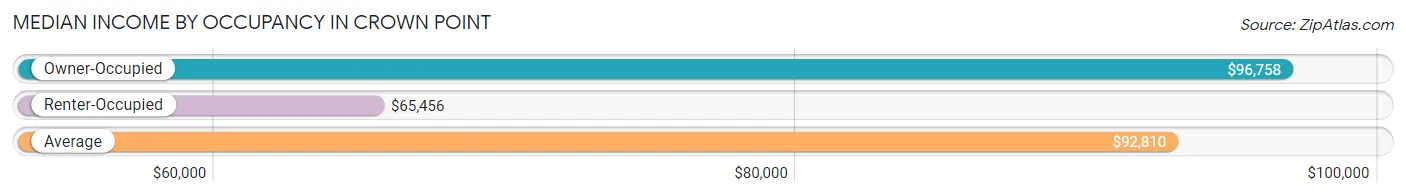
| Occupancy Type | # Households | Median Income |
| Owner-Occupied | 10,434 (86.1%) | $96,758 |
| Renter-Occupied | 1,685 (13.9%) | $65,456 |
| Average | 12,119 (100.0%) | $92,810 |
Occupancy by Householder Income Bracket in Crown Point
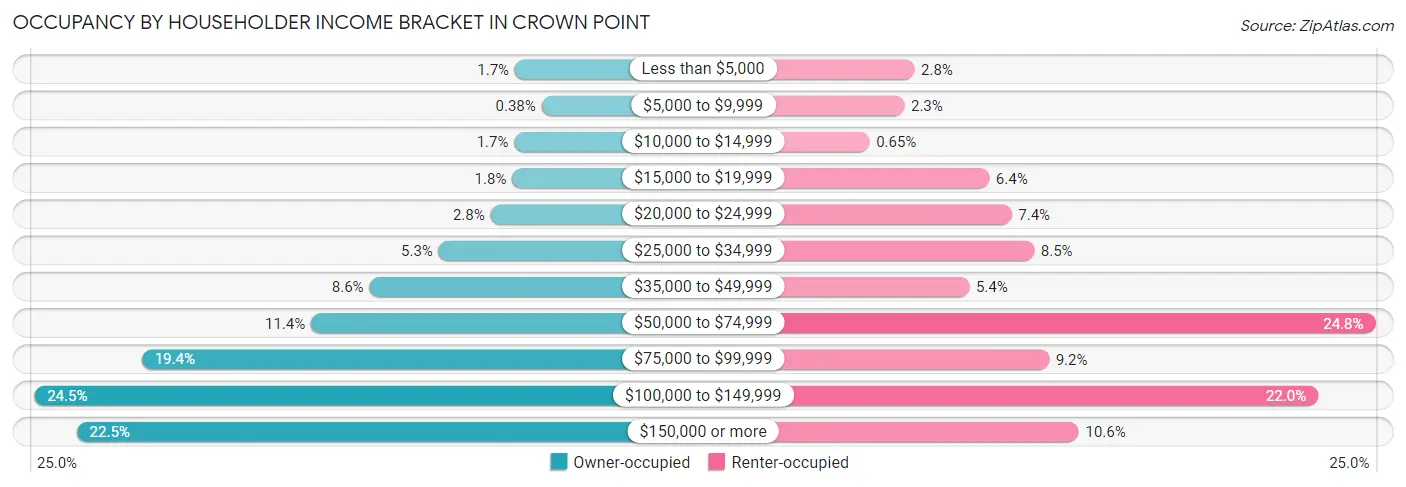
| Income Bracket | Owner-occupied | Renter-occupied |
| Less than $5,000 | 172 (1.7%) | 47 (2.8%) |
| $5,000 to $9,999 | 40 (0.4%) | 39 (2.3%) |
| $10,000 to $14,999 | 175 (1.7%) | 11 (0.6%) |
| $15,000 to $19,999 | 186 (1.8%) | 107 (6.4%) |
| $20,000 to $24,999 | 293 (2.8%) | 125 (7.4%) |
| $25,000 to $34,999 | 551 (5.3%) | 143 (8.5%) |
| $35,000 to $49,999 | 895 (8.6%) | 91 (5.4%) |
| $50,000 to $74,999 | 1,185 (11.4%) | 417 (24.7%) |
| $75,000 to $99,999 | 2,026 (19.4%) | 155 (9.2%) |
| $100,000 to $149,999 | 2,561 (24.5%) | 371 (22.0%) |
| $150,000 or more | 2,350 (22.5%) | 179 (10.6%) |
| Total | 10,434 (100.0%) | 1,685 (100.0%) |
Monthly Housing Cost Tiers in Crown Point
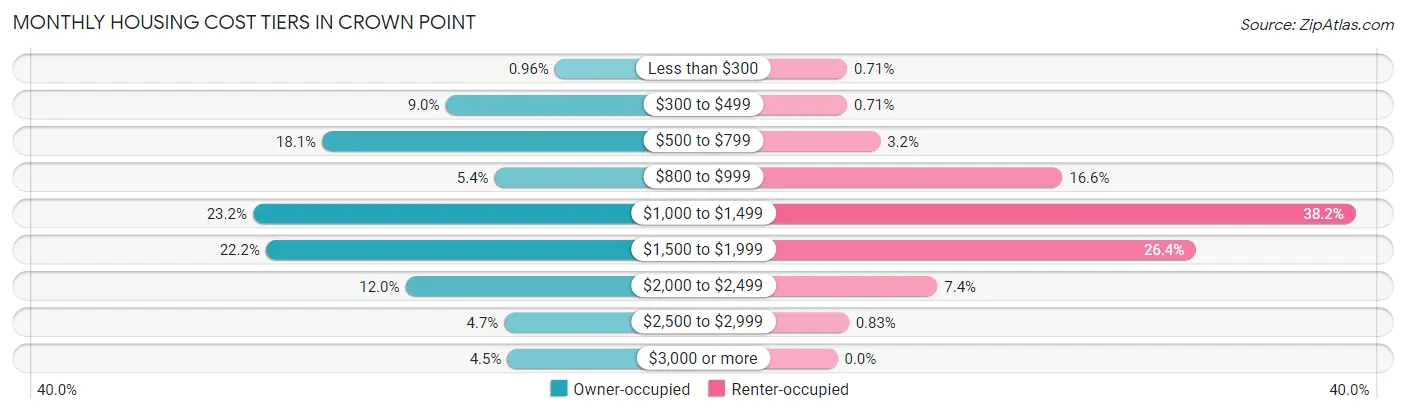
| Monthly Cost | Owner-occupied | Renter-occupied |
| Less than $300 | 100 (1.0%) | 12 (0.7%) |
| $300 to $499 | 940 (9.0%) | 12 (0.7%) |
| $500 to $799 | 1,889 (18.1%) | 53 (3.2%) |
| $800 to $999 | 563 (5.4%) | 279 (16.6%) |
| $1,000 to $1,499 | 2,421 (23.2%) | 643 (38.2%) |
| $1,500 to $1,999 | 2,321 (22.2%) | 445 (26.4%) |
| $2,000 to $2,499 | 1,248 (12.0%) | 124 (7.4%) |
| $2,500 to $2,999 | 488 (4.7%) | 14 (0.8%) |
| $3,000 or more | 464 (4.4%) | 0 (0.0%) |
| Total | 10,434 (100.0%) | 1,685 (100.0%) |
Physical Housing Characteristics in Crown Point
Housing Structures in Crown Point
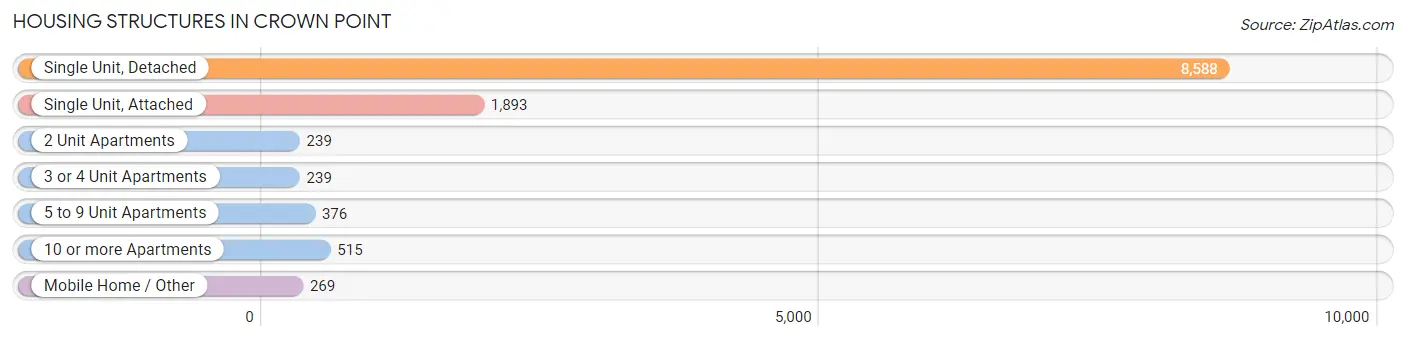
| Structure Type | # Housing Units | % Housing Units |
| Single Unit, Detached | 8,588 | 70.9% |
| Single Unit, Attached | 1,893 | 15.6% |
| 2 Unit Apartments | 239 | 2.0% |
| 3 or 4 Unit Apartments | 239 | 2.0% |
| 5 to 9 Unit Apartments | 376 | 3.1% |
| 10 or more Apartments | 515 | 4.3% |
| Mobile Home / Other | 269 | 2.2% |
| Total | 12,119 | 100.0% |
Housing Structures by Occupancy in Crown Point
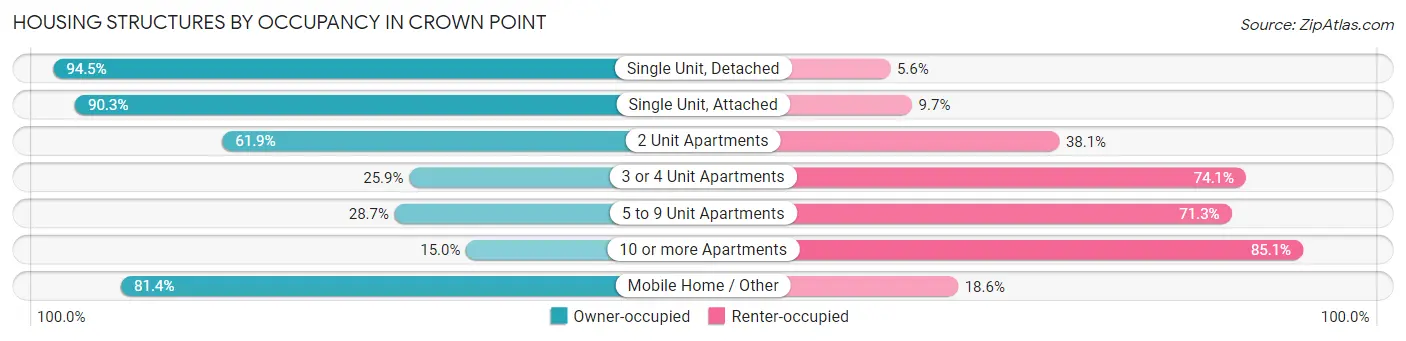
| Structure Type | Owner-occupied | Renter-occupied |
| Single Unit, Detached | 8,111 (94.5%) | 477 (5.6%) |
| Single Unit, Attached | 1,709 (90.3%) | 184 (9.7%) |
| 2 Unit Apartments | 148 (61.9%) | 91 (38.1%) |
| 3 or 4 Unit Apartments | 62 (25.9%) | 177 (74.1%) |
| 5 to 9 Unit Apartments | 108 (28.7%) | 268 (71.3%) |
| 10 or more Apartments | 77 (14.9%) | 438 (85.1%) |
| Mobile Home / Other | 219 (81.4%) | 50 (18.6%) |
| Total | 10,434 (86.1%) | 1,685 (13.9%) |
Housing Structures by Number of Rooms in Crown Point
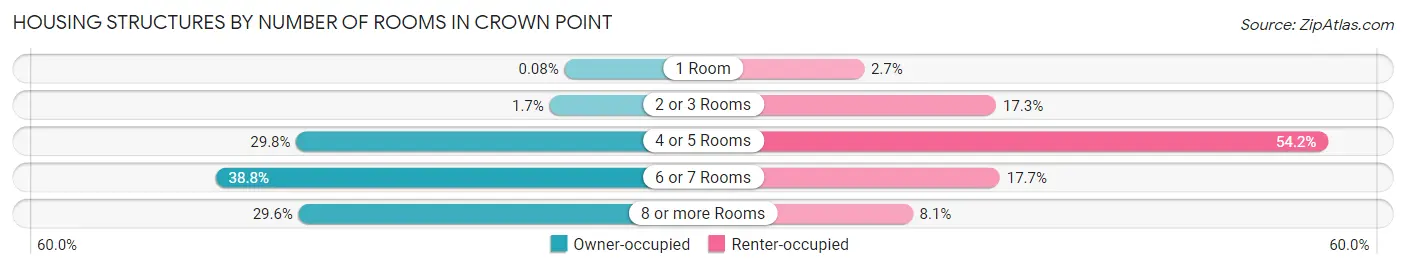
| Number of Rooms | Owner-occupied | Renter-occupied |
| 1 Room | 8 (0.1%) | 45 (2.7%) |
| 2 or 3 Rooms | 180 (1.7%) | 292 (17.3%) |
| 4 or 5 Rooms | 3,113 (29.8%) | 913 (54.2%) |
| 6 or 7 Rooms | 4,047 (38.8%) | 299 (17.7%) |
| 8 or more Rooms | 3,086 (29.6%) | 136 (8.1%) |
| Total | 10,434 (100.0%) | 1,685 (100.0%) |
Housing Structure by Heating Type in Crown Point
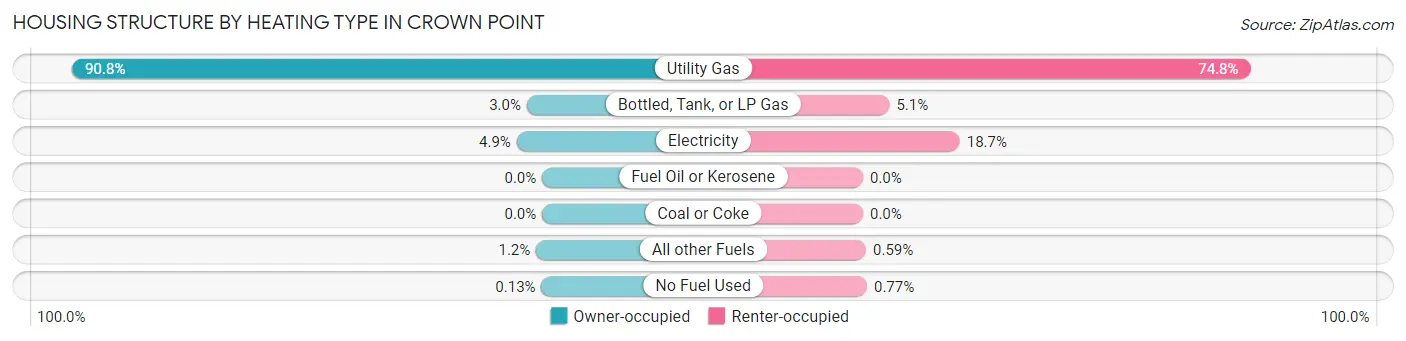
| Heating Type | Owner-occupied | Renter-occupied |
| Utility Gas | 9,478 (90.8%) | 1,261 (74.8%) |
| Bottled, Tank, or LP Gas | 309 (3.0%) | 86 (5.1%) |
| Electricity | 512 (4.9%) | 315 (18.7%) |
| Fuel Oil or Kerosene | 0 (0.0%) | 0 (0.0%) |
| Coal or Coke | 0 (0.0%) | 0 (0.0%) |
| All other Fuels | 121 (1.2%) | 10 (0.6%) |
| No Fuel Used | 14 (0.1%) | 13 (0.8%) |
| Total | 10,434 (100.0%) | 1,685 (100.0%) |
Household Vehicle Usage in Crown Point
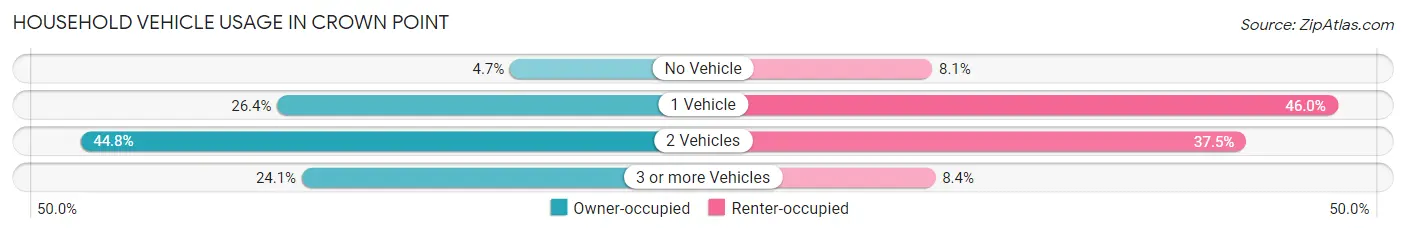
| Vehicles per Household | Owner-occupied | Renter-occupied |
| No Vehicle | 488 (4.7%) | 137 (8.1%) |
| 1 Vehicle | 2,756 (26.4%) | 775 (46.0%) |
| 2 Vehicles | 4,674 (44.8%) | 631 (37.4%) |
| 3 or more Vehicles | 2,516 (24.1%) | 142 (8.4%) |
| Total | 10,434 (100.0%) | 1,685 (100.0%) |
Real Estate & Mortgages in Crown Point
Real Estate and Mortgage Overview in Crown Point
| Characteristic | Without Mortgage | With Mortgage |
| Housing Units | 2,962 | 7,472 |
| Median Property Value | $228,000 | $262,000 |
| Median Household Income | $65,938 | $2,012 |
| Monthly Housing Costs | $559 | $464 |
| Real Estate Taxes | $2,400 | $55 |
Property Value by Mortgage Status in Crown Point
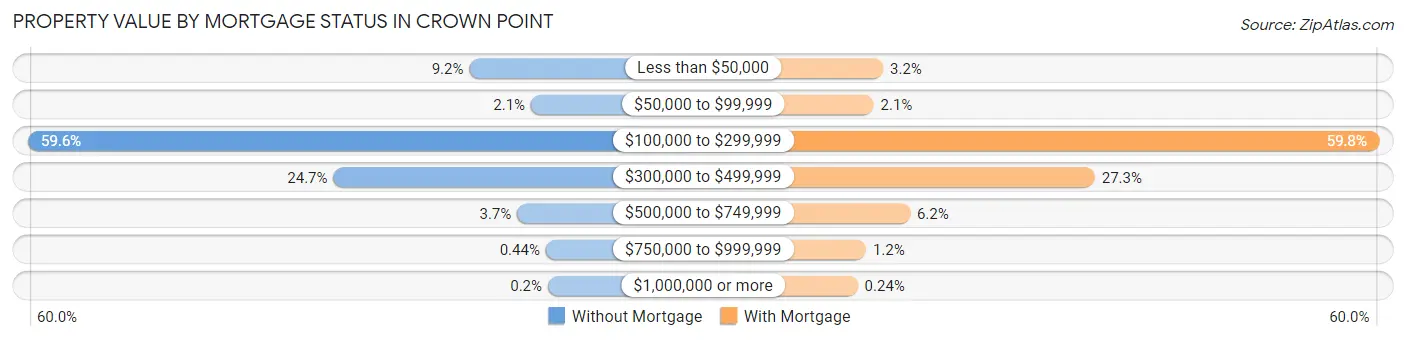
| Property Value | Without Mortgage | With Mortgage |
| Less than $50,000 | 272 (9.2%) | 235 (3.2%) |
| $50,000 to $99,999 | 63 (2.1%) | 154 (2.1%) |
| $100,000 to $299,999 | 1,766 (59.6%) | 4,468 (59.8%) |
| $300,000 to $499,999 | 732 (24.7%) | 2,043 (27.3%) |
| $500,000 to $749,999 | 110 (3.7%) | 465 (6.2%) |
| $750,000 to $999,999 | 13 (0.4%) | 89 (1.2%) |
| $1,000,000 or more | 6 (0.2%) | 18 (0.2%) |
| Total | 2,962 (100.0%) | 7,472 (100.0%) |
Household Income by Mortgage Status in Crown Point
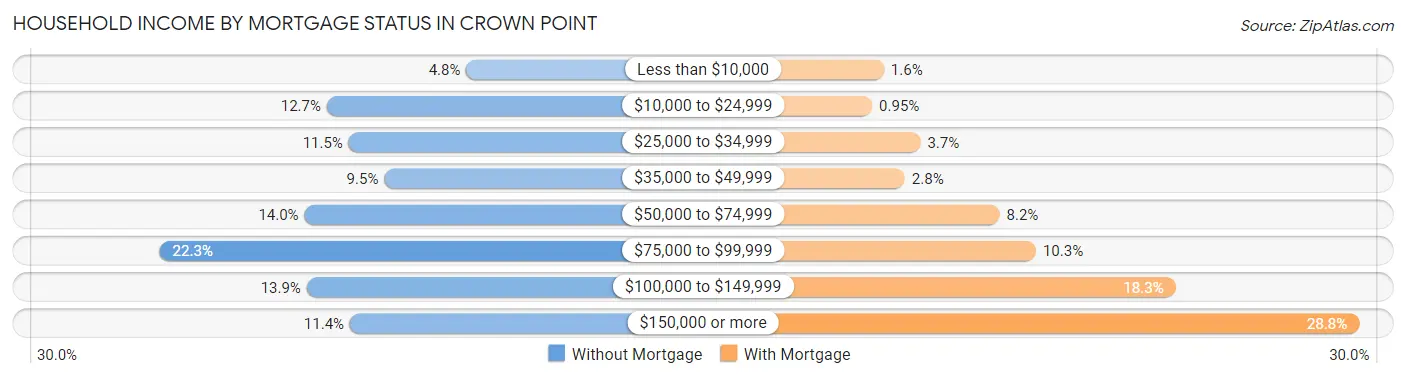
| Household Income | Without Mortgage | With Mortgage |
| Less than $10,000 | 141 (4.8%) | 121 (1.6%) |
| $10,000 to $24,999 | 377 (12.7%) | 71 (0.9%) |
| $25,000 to $34,999 | 340 (11.5%) | 277 (3.7%) |
| $35,000 to $49,999 | 280 (9.5%) | 211 (2.8%) |
| $50,000 to $74,999 | 415 (14.0%) | 615 (8.2%) |
| $75,000 to $99,999 | 660 (22.3%) | 770 (10.3%) |
| $100,000 to $149,999 | 411 (13.9%) | 1,366 (18.3%) |
| $150,000 or more | 338 (11.4%) | 2,150 (28.8%) |
| Total | 2,962 (100.0%) | 7,472 (100.0%) |
Property Value to Household Income Ratio in Crown Point
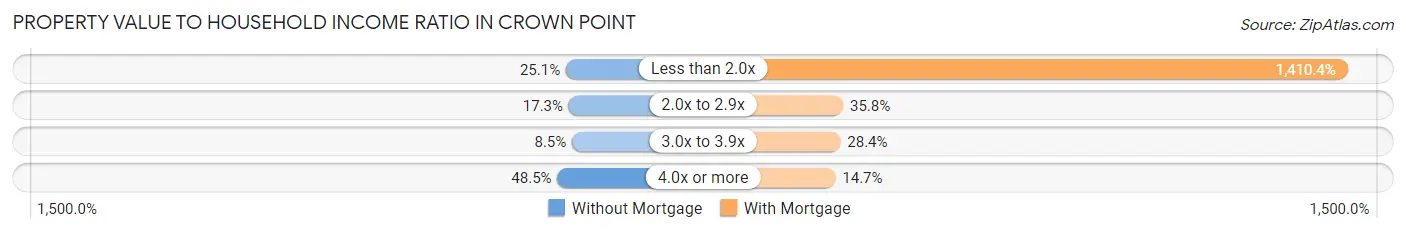
| Value-to-Income Ratio | Without Mortgage | With Mortgage |
| Less than 2.0x | 744 (25.1%) | 105,381 (1,410.4%) |
| 2.0x to 2.9x | 513 (17.3%) | 2,675 (35.8%) |
| 3.0x to 3.9x | 253 (8.5%) | 2,121 (28.4%) |
| 4.0x or more | 1,436 (48.5%) | 1,101 (14.7%) |
| Total | 2,962 (100.0%) | 7,472 (100.0%) |
Real Estate Taxes by Mortgage Status in Crown Point
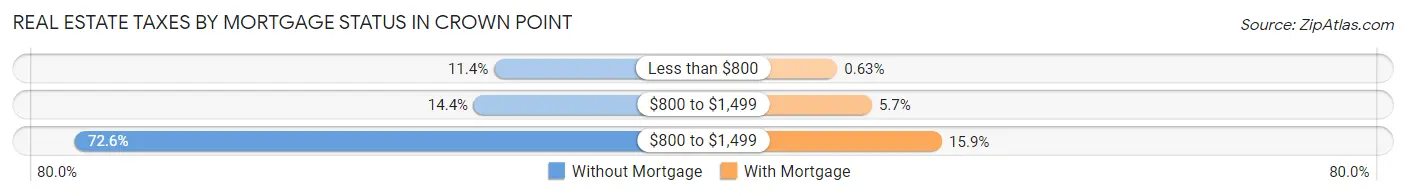
| Property Taxes | Without Mortgage | With Mortgage |
| Less than $800 | 338 (11.4%) | 47 (0.6%) |
| $800 to $1,499 | 425 (14.3%) | 425 (5.7%) |
| $800 to $1,499 | 2,151 (72.6%) | 1,191 (15.9%) |
| Total | 2,962 (100.0%) | 7,472 (100.0%) |
Health & Disability in Crown Point
Health Insurance Coverage by Age in Crown Point
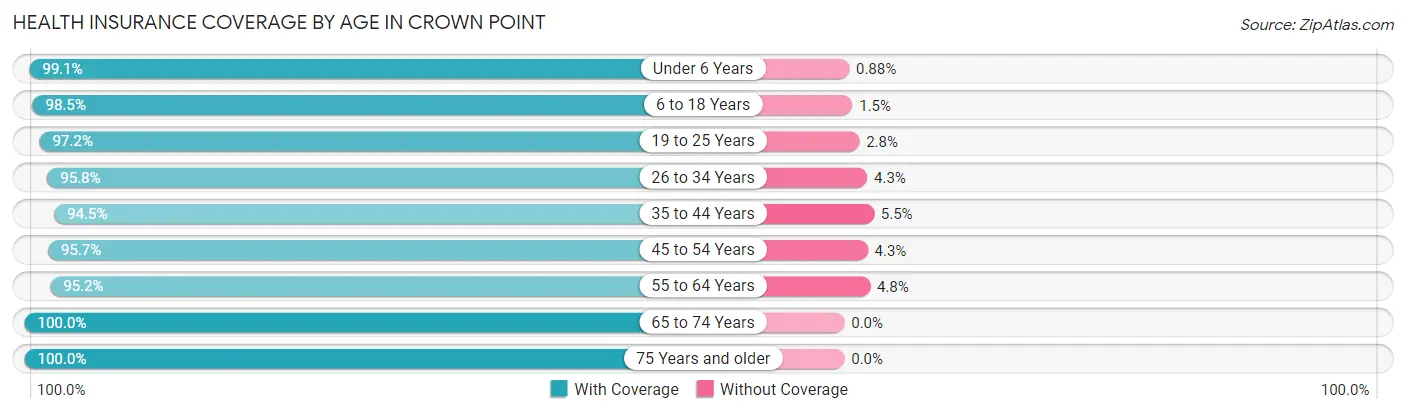
| Age Bracket | With Coverage | Without Coverage |
| Under 6 Years | 2,692 (99.1%) | 24 (0.9%) |
| 6 to 18 Years | 5,636 (98.5%) | 85 (1.5%) |
| 19 to 25 Years | 1,711 (97.2%) | 49 (2.8%) |
| 26 to 34 Years | 3,827 (95.8%) | 170 (4.3%) |
| 35 to 44 Years | 4,266 (94.5%) | 249 (5.5%) |
| 45 to 54 Years | 3,437 (95.7%) | 156 (4.3%) |
| 55 to 64 Years | 4,143 (95.2%) | 208 (4.8%) |
| 65 to 74 Years | 2,972 (100.0%) | 0 (0.0%) |
| 75 Years and older | 2,687 (100.0%) | 0 (0.0%) |
| Total | 31,371 (97.1%) | 941 (2.9%) |
Health Insurance Coverage by Citizenship Status in Crown Point
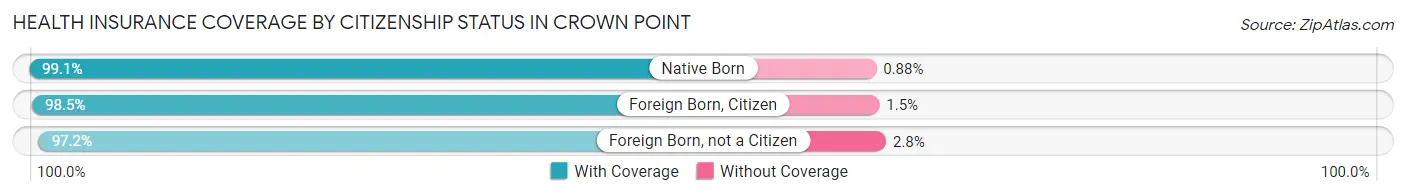
| Citizenship Status | With Coverage | Without Coverage |
| Native Born | 2,692 (99.1%) | 24 (0.9%) |
| Foreign Born, Citizen | 5,636 (98.5%) | 85 (1.5%) |
| Foreign Born, not a Citizen | 1,711 (97.2%) | 49 (2.8%) |
Health Insurance Coverage by Household Income in Crown Point
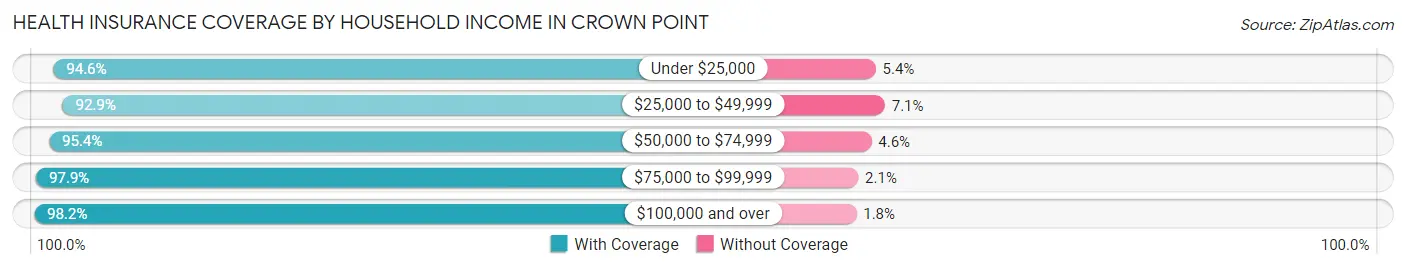
| Household Income | With Coverage | Without Coverage |
| Under $25,000 | 1,420 (94.6%) | 81 (5.4%) |
| $25,000 to $49,999 | 3,221 (92.9%) | 247 (7.1%) |
| $50,000 to $74,999 | 3,547 (95.4%) | 171 (4.6%) |
| $75,000 to $99,999 | 6,153 (97.9%) | 134 (2.1%) |
| $100,000 and over | 17,009 (98.2%) | 308 (1.8%) |
Public vs Private Health Insurance Coverage by Age in Crown Point
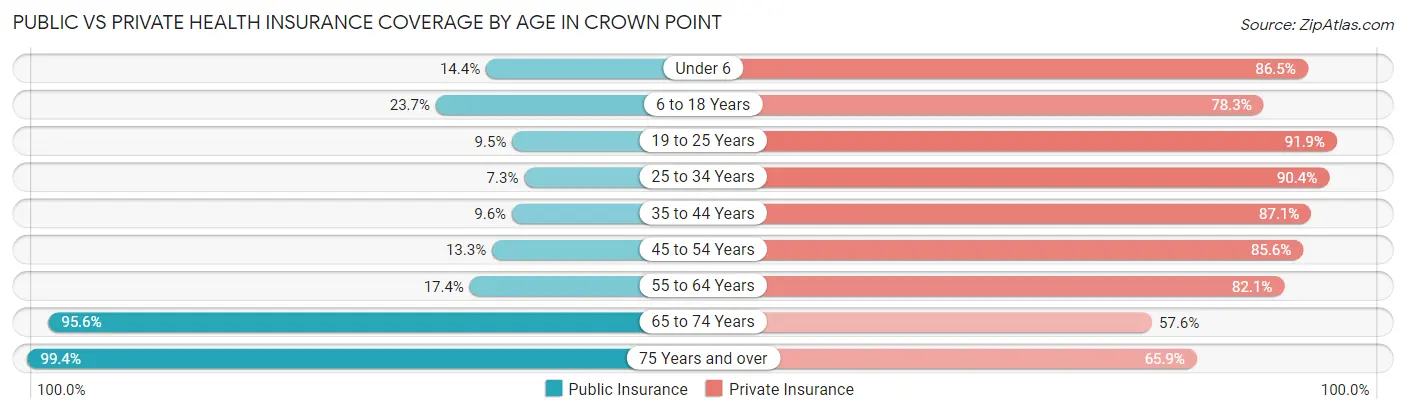
| Age Bracket | Public Insurance | Private Insurance |
| Under 6 | 390 (14.4%) | 2,348 (86.5%) |
| 6 to 18 Years | 1,354 (23.7%) | 4,478 (78.3%) |
| 19 to 25 Years | 167 (9.5%) | 1,617 (91.9%) |
| 25 to 34 Years | 290 (7.3%) | 3,615 (90.4%) |
| 35 to 44 Years | 431 (9.6%) | 3,933 (87.1%) |
| 45 to 54 Years | 476 (13.3%) | 3,076 (85.6%) |
| 55 to 64 Years | 756 (17.4%) | 3,572 (82.1%) |
| 65 to 74 Years | 2,841 (95.6%) | 1,712 (57.6%) |
| 75 Years and over | 2,672 (99.4%) | 1,770 (65.9%) |
| Total | 9,377 (29.0%) | 26,121 (80.8%) |
Disability Status by Sex by Age in Crown Point
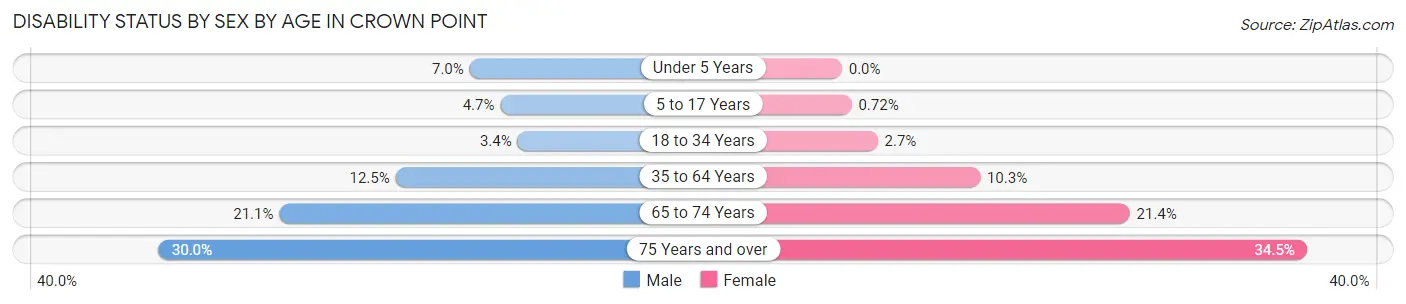
| Age Bracket | Male | Female |
| Under 5 Years | 100 (7.0%) | 0 (0.0%) |
| 5 to 17 Years | 128 (4.7%) | 24 (0.7%) |
| 18 to 34 Years | 102 (3.4%) | 79 (2.7%) |
| 35 to 64 Years | 779 (12.5%) | 637 (10.3%) |
| 65 to 74 Years | 306 (21.1%) | 325 (21.4%) |
| 75 Years and over | 297 (30.0%) | 586 (34.5%) |
Disability Class by Sex by Age in Crown Point
Disability Class: Hearing Difficulty
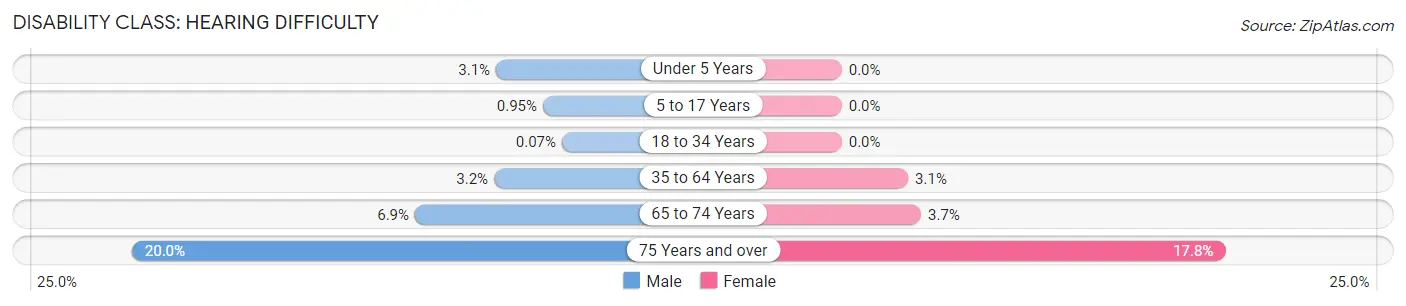
| Age Bracket | Male | Female |
| Under 5 Years | 45 (3.1%) | 0 (0.0%) |
| 5 to 17 Years | 26 (0.9%) | 0 (0.0%) |
| 18 to 34 Years | 2 (0.1%) | 0 (0.0%) |
| 35 to 64 Years | 201 (3.2%) | 191 (3.1%) |
| 65 to 74 Years | 100 (6.9%) | 56 (3.7%) |
| 75 Years and over | 198 (20.0%) | 302 (17.8%) |
Disability Class: Vision Difficulty
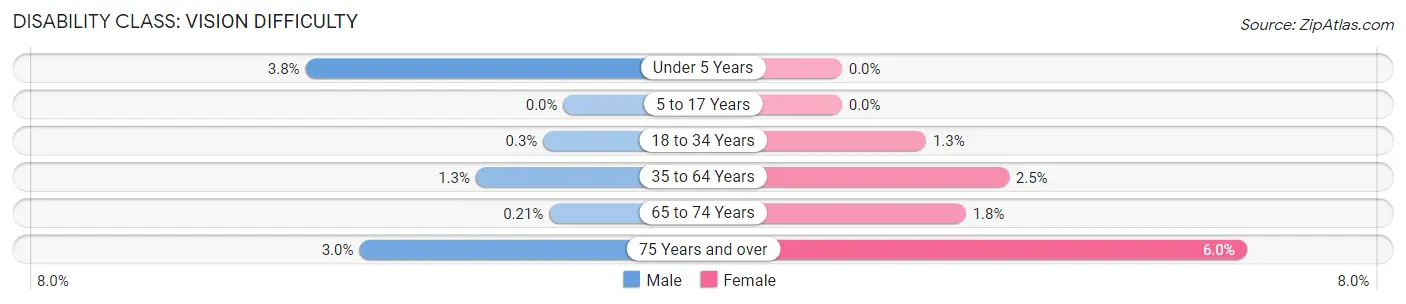
| Age Bracket | Male | Female |
| Under 5 Years | 55 (3.8%) | 0 (0.0%) |
| 5 to 17 Years | 0 (0.0%) | 0 (0.0%) |
| 18 to 34 Years | 9 (0.3%) | 37 (1.3%) |
| 35 to 64 Years | 81 (1.3%) | 154 (2.5%) |
| 65 to 74 Years | 3 (0.2%) | 28 (1.8%) |
| 75 Years and over | 30 (3.0%) | 102 (6.0%) |
Disability Class: Cognitive Difficulty
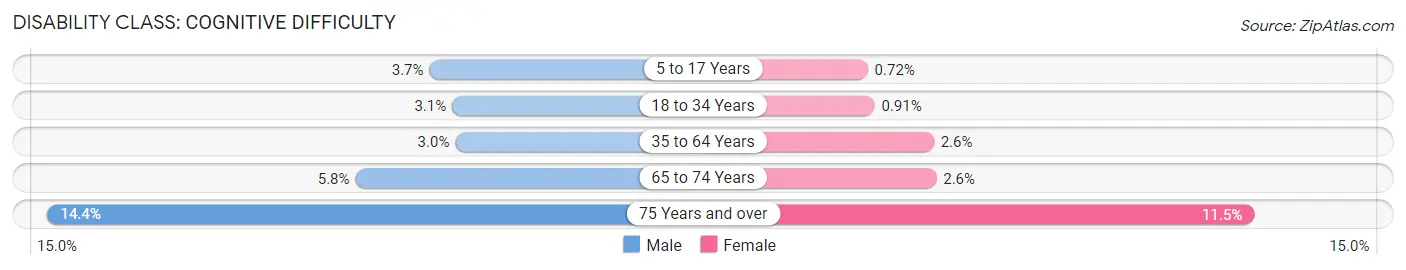
| Age Bracket | Male | Female |
| 5 to 17 Years | 102 (3.7%) | 24 (0.7%) |
| 18 to 34 Years | 93 (3.1%) | 27 (0.9%) |
| 35 to 64 Years | 188 (3.0%) | 159 (2.6%) |
| 65 to 74 Years | 84 (5.8%) | 40 (2.6%) |
| 75 Years and over | 142 (14.4%) | 195 (11.5%) |
Disability Class: Ambulatory Difficulty
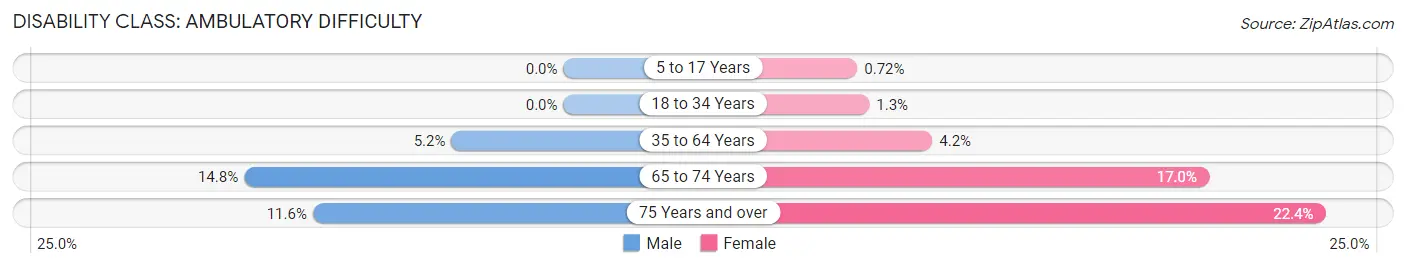
| Age Bracket | Male | Female |
| 5 to 17 Years | 0 (0.0%) | 24 (0.7%) |
| 18 to 34 Years | 0 (0.0%) | 38 (1.3%) |
| 35 to 64 Years | 325 (5.2%) | 261 (4.2%) |
| 65 to 74 Years | 215 (14.8%) | 259 (17.0%) |
| 75 Years and over | 115 (11.6%) | 381 (22.4%) |
Disability Class: Self-Care Difficulty
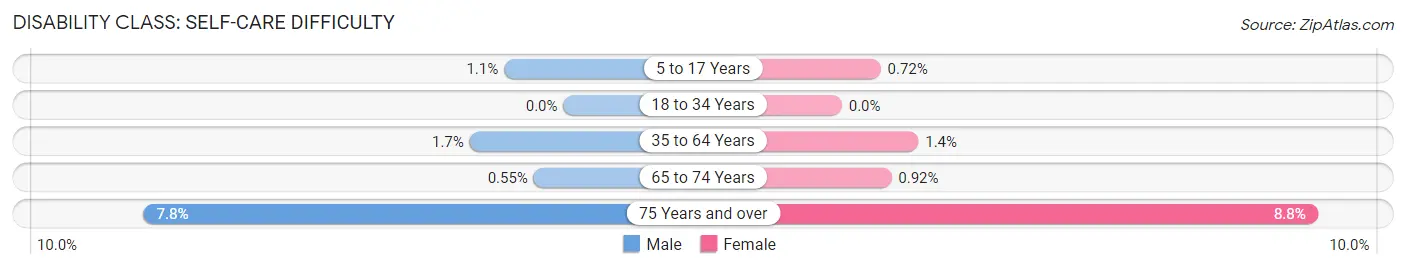
| Age Bracket | Male | Female |
| 5 to 17 Years | 30 (1.1%) | 24 (0.7%) |
| 18 to 34 Years | 0 (0.0%) | 0 (0.0%) |
| 35 to 64 Years | 109 (1.7%) | 88 (1.4%) |
| 65 to 74 Years | 8 (0.5%) | 14 (0.9%) |
| 75 Years and over | 77 (7.8%) | 150 (8.8%) |
Technology Access in Crown Point
Computing Device Access in Crown Point
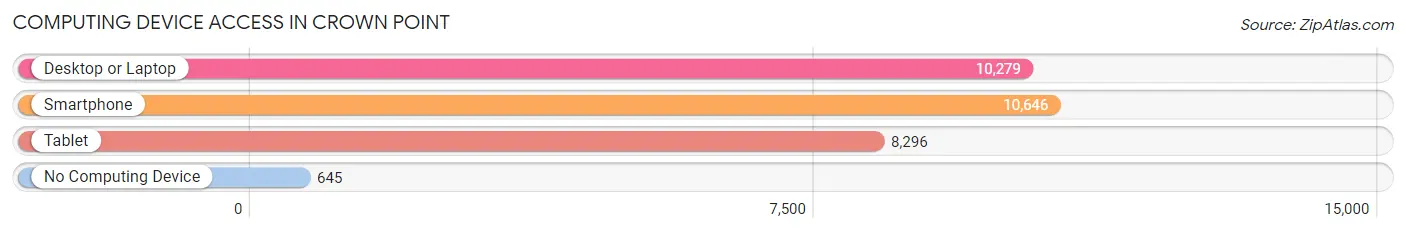
| Device Type | # Households | % Households |
| Desktop or Laptop | 10,279 | 84.8% |
| Smartphone | 10,646 | 87.8% |
| Tablet | 8,296 | 68.4% |
| No Computing Device | 645 | 5.3% |
| Total | 12,119 | 100.0% |
Internet Access in Crown Point
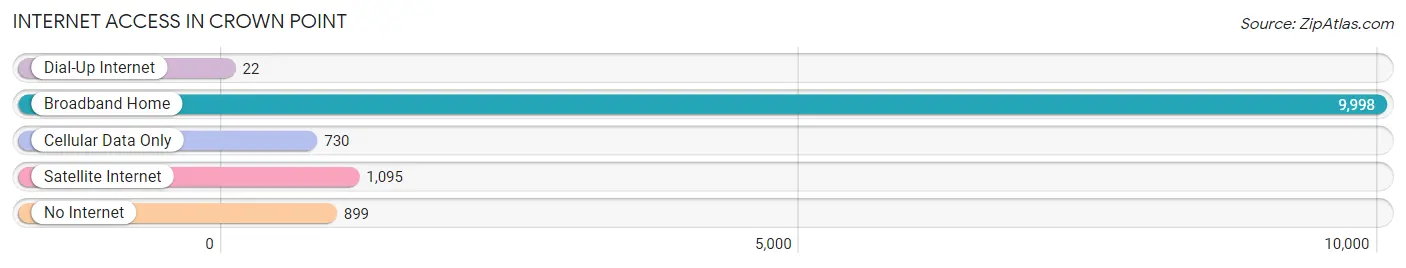
| Internet Type | # Households | % Households |
| Dial-Up Internet | 22 | 0.2% |
| Broadband Home | 9,998 | 82.5% |
| Cellular Data Only | 730 | 6.0% |
| Satellite Internet | 1,095 | 9.0% |
| No Internet | 899 | 7.4% |
| Total | 12,119 | 100.0% |
Crown Point Summary
Crown Point, Indiana is a city located in Lake County, Indiana, United States. The population was 27,317 at the 2010 census. The city is the county seat of Lake County. It is part of the Chicago metropolitan area.
History
Crown Point was founded in 1834 by Solon Robinson, a newspaper editor from Ohio. He named the city after Crown Point, New York, where he had previously lived. The first non-Native American settlers arrived in what is now Crown Point in 1834. In 1837, Lake County was incorporated, with Crown Point as its county seat.
The city quickly grew, and by 1849 it had a population of over 1,000. In 1852, the county courthouse was built, and the city continued to grow. By the late 19th century, Crown Point had become an important industrial center, with several factories and mills.
In the early 20th century, Crown Point was a popular tourist destination, with several resorts and amusement parks. The city also had a vibrant nightlife, with several bars and nightclubs.
Geography
Crown Point is located at 41°22′15″N 87°19′54″W (41.3708, -87.3317). According to the 2010 census, the city has a total area of 10.1 square miles (26.1 km2), of which 9.9 square miles (25.6 km2) is land and 0.2 square miles (0.5 km2) is water.
Economy
Crown Point's economy is largely based on manufacturing and retail. The city is home to several factories and industrial parks, including the Crown Point Industrial Park, which is home to several large companies, including the Crown Point Steel Company.
The city also has a vibrant retail sector, with several shopping centers and malls. The city is also home to several restaurants, bars, and other entertainment venues.
Demographics
As of the 2010 census, there were 27,317 people, 10,717 households, and 7,072 families residing in the city. The population density was 2,743.3 people per square mile (1,058.2/km2). There were 11,541 housing units at an average density of 1,164.3 per square mile (449.2/km2). The racial makeup of the city was 87.2% White, 5.3% African American, 0.3% Native American, 1.3% Asian, 0.1% Pacific Islander, 3.7% from other races, and 2.2% from two or more races. Hispanic or Latino of any race were 8.7% of the population.
There were 10,717 households, out of which 32.2% had children under the age of 18 living with them, 48.2% were married couples living together, 13.7% had a female householder with no husband present, and 33.2% were non-families. 28.2% of all households were made up of individuals, and 11.2% had someone living alone who was 65 years of age or older. The average household size was 2.51 and the average family size was 3.09.
In the city, the population was spread out, with 25.7% under the age of 18, 8.7% from 18 to 24, 29.2% from 25 to 44, 22.2% from 45 to 64, and 14.2% who were 65 years of age or older. The median age was 36 years. For every 100 females, there were 93.2 males. For every 100 females age 18 and over, there were 89.7 males.
The median income for a household in the city was $45,906, and the median income for a family was $54,902. Males had a median income of $41,890 versus $27,945 for females. The per capita income for the city was $21,945. About 6.2% of families and 8.3% of the population were below the poverty line, including 11.2% of those under age 18 and 6.2% of those age 65 or over.
Common Questions
What is Per Capita Income in Crown Point?
Per Capita income in Crown Point is $40,068.
What is the Median Family Income in Crown Point?
Median Family Income in Crown Point is $102,821.
What is the Median Household income in Crown Point?
Median Household Income in Crown Point is $92,810.
What is Income or Wage Gap in Crown Point?
Income or Wage Gap in Crown Point is 40.1%.
Women in Crown Point earn 59.9 cents for every dollar earned by a man.
What is Family Income Deficit in Crown Point?
Family Income Deficit in Crown Point is $6,579.
Families that are below poverty line in Crown Point earn $6,579 less on average than the poverty threshold level.
What is Inequality or Gini Index in Crown Point?
Inequality or Gini Index in Crown Point is 0.39.
What is the Total Population of Crown Point?
Total Population of Crown Point is 33,735.
What is the Total Male Population of Crown Point?
Total Male Population of Crown Point is 16,833.
What is the Total Female Population of Crown Point?
Total Female Population of Crown Point is 16,902.
What is the Ratio of Males per 100 Females in Crown Point?
There are 99.59 Males per 100 Females in Crown Point.
What is the Ratio of Females per 100 Males in Crown Point?
There are 100.41 Females per 100 Males in Crown Point.
What is the Median Population Age in Crown Point?
Median Population Age in Crown Point is 39.4 Years.
What is the Average Family Size in Crown Point
Average Family Size in Crown Point is 3.2 People.
What is the Average Household Size in Crown Point
Average Household Size in Crown Point is 2.7 People.
How Large is the Labor Force in Crown Point?
There are 16,158 People in the Labor Forcein in Crown Point.
What is the Percentage of People in the Labor Force in Crown Point?
62.0% of People are in the Labor Force in Crown Point.
What is the Unemployment Rate in Crown Point?
Unemployment Rate in Crown Point is 4.3%.