La Grange, IL Map & Demographics
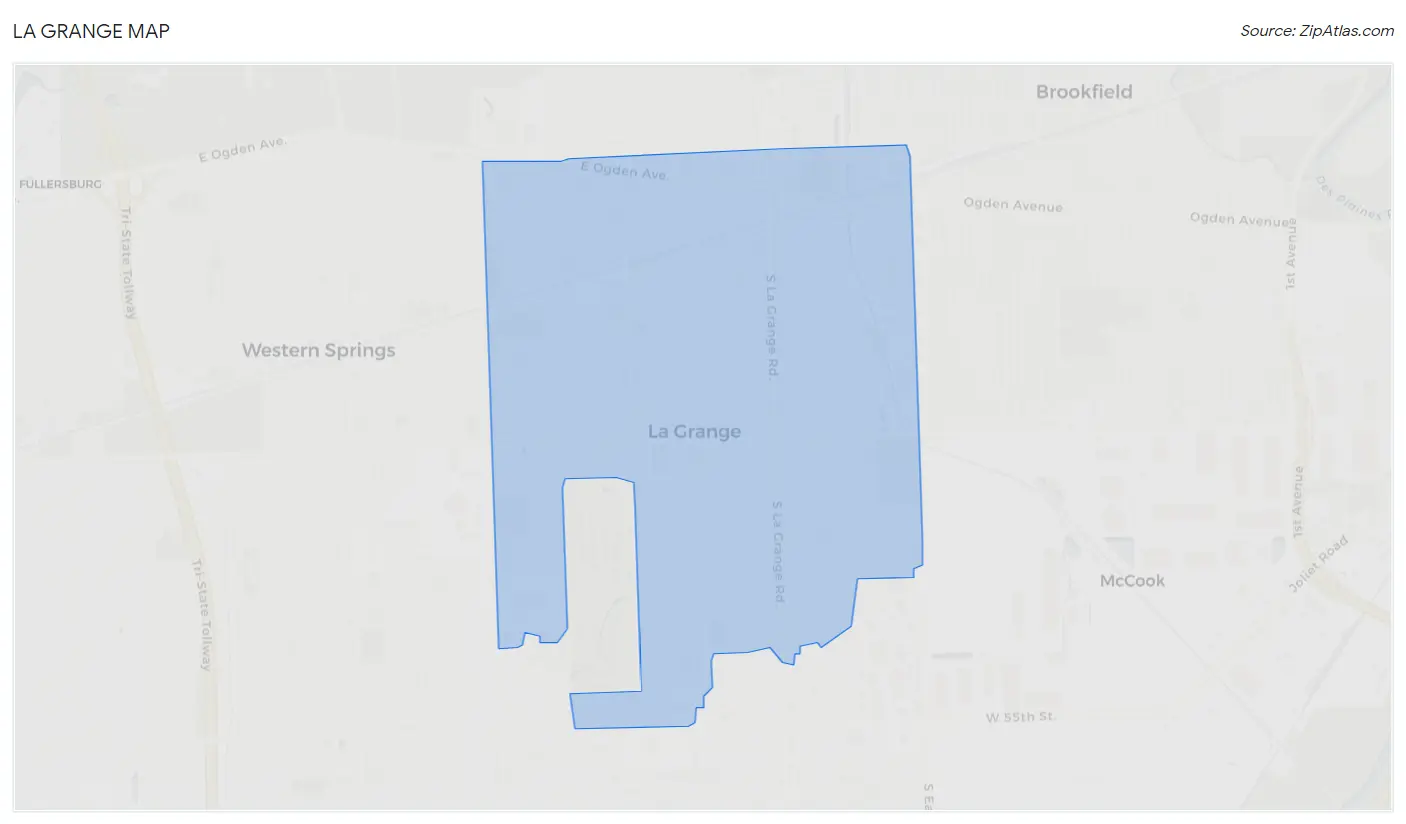
La Grange Map
La Grange Overview
$71,259
PER CAPITA INCOME
$175,905
AVG FAMILY INCOME
$141,235
AVG HOUSEHOLD INCOME
56.6%
WAGE / INCOME GAP [ % ]
43.4¢/ $1
WAGE / INCOME GAP [ $ ]
$9,970
FAMILY INCOME DEFICIT
0.47
INEQUALITY / GINI INDEX
16,128
TOTAL POPULATION
7,881
MALE POPULATION
8,247
FEMALE POPULATION
95.56
MALES / 100 FEMALES
104.64
FEMALES / 100 MALES
42.4
MEDIAN AGE
3.3
AVG FAMILY SIZE
2.7
AVG HOUSEHOLD SIZE
8,109
LABOR FORCE [ PEOPLE ]
66.4%
PERCENT IN LABOR FORCE
2.0%
UNEMPLOYMENT RATE
La Grange Zip Codes
Income in La Grange
Income Overview in La Grange
Per Capita Income in La Grange is $71,259, while median incomes of families and households are $175,905 and $141,235 respectively.
| Characteristic | Number | Measure |
| Per Capita Income | 16,128 | $71,259 |
| Median Family Income | 4,287 | $175,905 |
| Mean Family Income | 4,287 | $233,571 |
| Median Household Income | 5,791 | $141,235 |
| Mean Household Income | 5,791 | $195,938 |
| Income Deficit | 4,287 | $9,970 |
| Wage / Income Gap (%) | 16,128 | 56.58% |
| Wage / Income Gap ($) | 16,128 | 43.42¢ per $1 |
| Gini / Inequality Index | 16,128 | 0.47 |
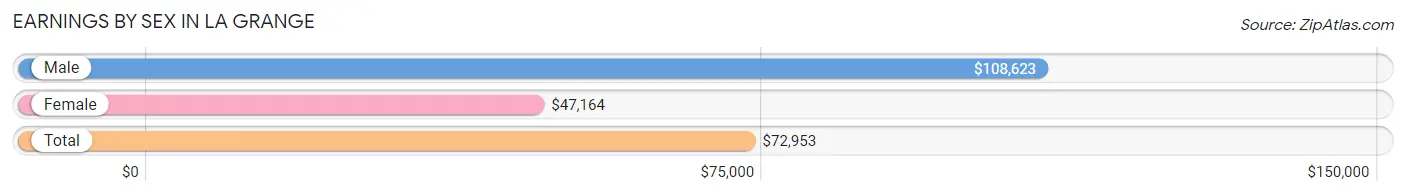
Earnings by Sex in La Grange
Average Earnings in La Grange are $72,953, $108,623 for men and $47,164 for women, a difference of 56.6%.
| Sex | Number | Average Earnings |
| Male | 4,285 (50.4%) | $108,623 |
| Female | 4,216 (49.6%) | $47,164 |
| Total | 8,501 (100.0%) | $72,953 |
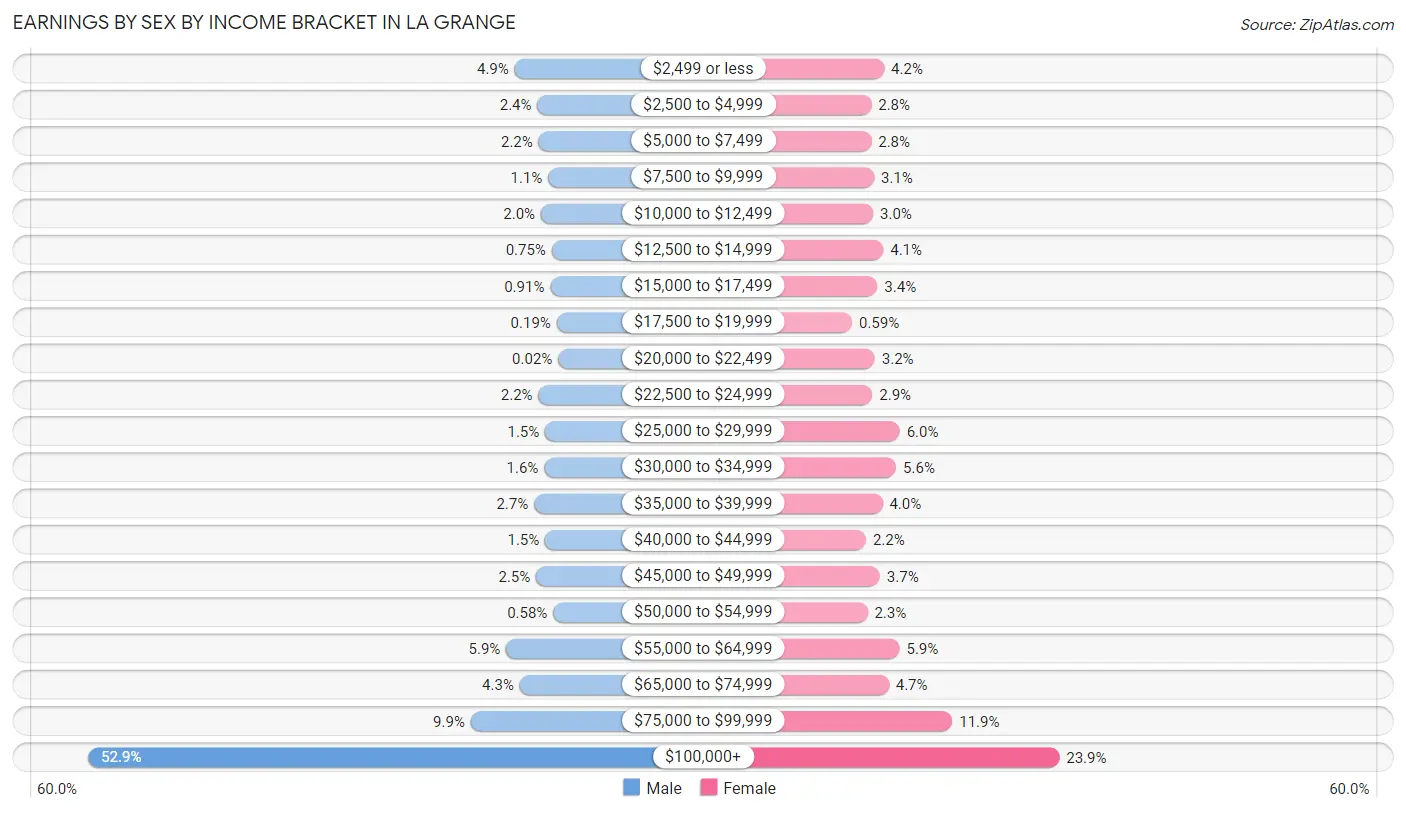
Earnings by Sex by Income Bracket in La Grange
The most common earnings brackets in La Grange are $100,000+ for men (2,265 | 52.9%) and $100,000+ for women (1,007 | 23.9%).
| Income | Male | Female |
| $2,499 or less | 211 (4.9%) | 177 (4.2%) |
| $2,500 to $4,999 | 101 (2.4%) | 116 (2.8%) |
| $5,000 to $7,499 | 95 (2.2%) | 116 (2.8%) |
| $7,500 to $9,999 | 49 (1.1%) | 129 (3.1%) |
| $10,000 to $12,499 | 84 (2.0%) | 125 (3.0%) |
| $12,500 to $14,999 | 32 (0.7%) | 173 (4.1%) |
| $15,000 to $17,499 | 39 (0.9%) | 145 (3.4%) |
| $17,500 to $19,999 | 8 (0.2%) | 25 (0.6%) |
| $20,000 to $22,499 | 1 (0.0%) | 133 (3.2%) |
| $22,500 to $24,999 | 96 (2.2%) | 121 (2.9%) |
| $25,000 to $29,999 | 64 (1.5%) | 251 (5.9%) |
| $30,000 to $34,999 | 68 (1.6%) | 234 (5.6%) |
| $35,000 to $39,999 | 117 (2.7%) | 169 (4.0%) |
| $40,000 to $44,999 | 64 (1.5%) | 91 (2.2%) |
| $45,000 to $49,999 | 107 (2.5%) | 157 (3.7%) |
| $50,000 to $54,999 | 25 (0.6%) | 98 (2.3%) |
| $55,000 to $64,999 | 251 (5.9%) | 250 (5.9%) |
| $65,000 to $74,999 | 186 (4.3%) | 199 (4.7%) |
| $75,000 to $99,999 | 422 (9.9%) | 500 (11.9%) |
| $100,000+ | 2,265 (52.9%) | 1,007 (23.9%) |
| Total | 4,285 (100.0%) | 4,216 (100.0%) |
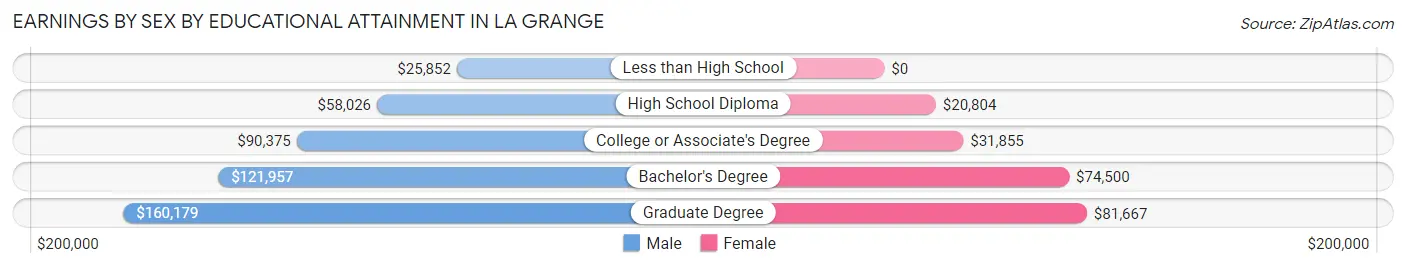
Earnings by Sex by Educational Attainment in La Grange
Average earnings in La Grange are $117,266 for men and $56,108 for women, a difference of 52.1%. Men with an educational attainment of graduate degree enjoy the highest average annual earnings of $160,179, while those with less than high school education earn the least with $25,852. Women with an educational attainment of graduate degree earn the most with the average annual earnings of $81,667, while those with high school diploma education have the smallest earnings of $20,804.
| Educational Attainment | Male Income | Female Income |
| Less than High School | $25,852 | $0 |
| High School Diploma | $58,026 | $20,804 |
| College or Associate's Degree | $90,375 | $31,855 |
| Bachelor's Degree | $121,957 | $74,500 |
| Graduate Degree | $160,179 | $81,667 |
| Total | $117,266 | $56,108 |
Family Income in La Grange
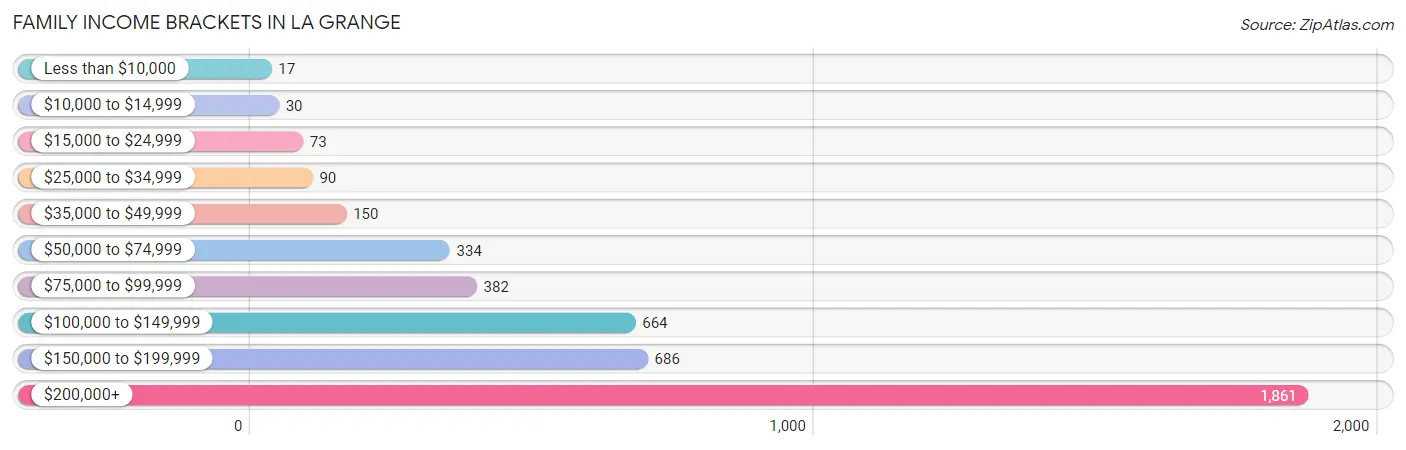
Family Income Brackets in La Grange
According to the La Grange family income data, there are 1,861 families falling into the $200,000+ income range, which is the most common income bracket and makes up 43.4% of all families. Conversely, the less than $10,000 income bracket is the least frequent group with only 17 families (0.4%) belonging to this category.
| Income Bracket | # Families | % Families |
| Less than $10,000 | 17 | 0.4% |
| $10,000 to $14,999 | 30 | 0.7% |
| $15,000 to $24,999 | 73 | 1.7% |
| $25,000 to $34,999 | 90 | 2.1% |
| $35,000 to $49,999 | 150 | 3.5% |
| $50,000 to $74,999 | 334 | 7.8% |
| $75,000 to $99,999 | 382 | 8.9% |
| $100,000 to $149,999 | 664 | 15.5% |
| $150,000 to $199,999 | 686 | 16.0% |
| $200,000+ | 1,861 | 43.4% |
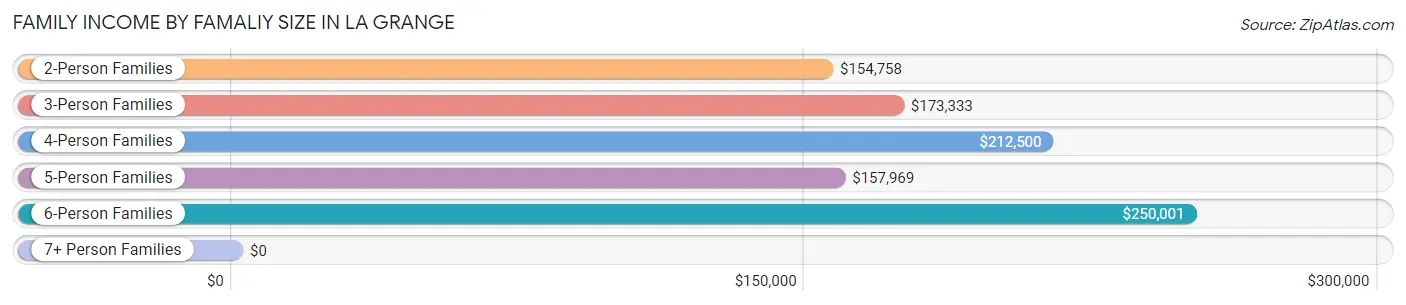
Family Income by Famaliy Size in La Grange
6-person families (119 | 2.8%) account for the highest median family income in La Grange with $250,001 per family, while 2-person families (1,706 | 39.8%) have the highest median income of $77,379 per family member.
| Income Bracket | # Families | Median Income |
| 2-Person Families | 1,706 (39.8%) | $154,758 |
| 3-Person Families | 904 (21.1%) | $173,333 |
| 4-Person Families | 992 (23.1%) | $212,500 |
| 5-Person Families | 545 (12.7%) | $157,969 |
| 6-Person Families | 119 (2.8%) | $250,001 |
| 7+ Person Families | 21 (0.5%) | $0 |
| Total | 4,287 (100.0%) | $175,905 |
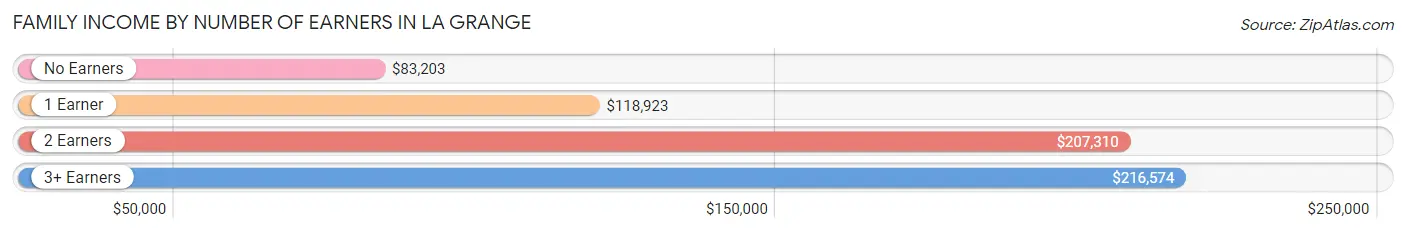
Family Income by Number of Earners in La Grange
The median family income in La Grange is $175,905, with families comprising 3+ earners (472) having the highest median family income of $216,574, while families with no earners (427) have the lowest median family income of $83,203, accounting for 11.0% and 10.0% of families, respectively.
| Number of Earners | # Families | Median Income |
| No Earners | 427 (10.0%) | $83,203 |
| 1 Earner | 1,034 (24.1%) | $118,923 |
| 2 Earners | 2,354 (54.9%) | $207,310 |
| 3+ Earners | 472 (11.0%) | $216,574 |
| Total | 4,287 (100.0%) | $175,905 |
Household Income in La Grange
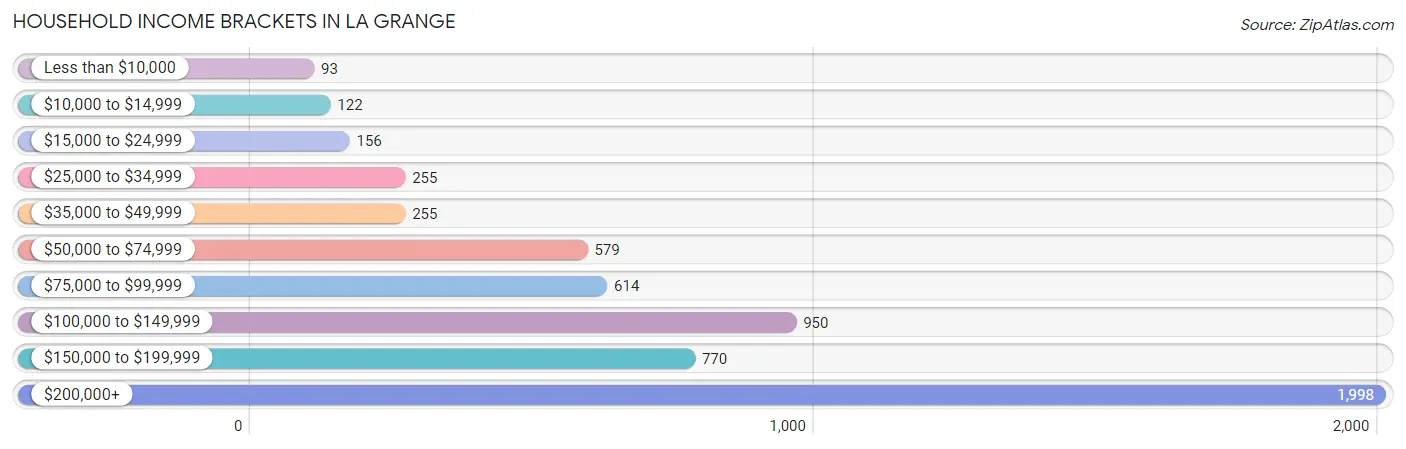
Household Income Brackets in La Grange
With 1,998 households falling in the category, the $200,000+ income range is the most frequent in La Grange, accounting for 34.5% of all households. In contrast, only 93 households (1.6%) fall into the less than $10,000 income bracket, making it the least populous group.
| Income Bracket | # Households | % Households |
| Less than $10,000 | 93 | 1.6% |
| $10,000 to $14,999 | 122 | 2.1% |
| $15,000 to $24,999 | 156 | 2.7% |
| $25,000 to $34,999 | 255 | 4.4% |
| $35,000 to $49,999 | 255 | 4.4% |
| $50,000 to $74,999 | 579 | 10.0% |
| $75,000 to $99,999 | 614 | 10.6% |
| $100,000 to $149,999 | 950 | 16.4% |
| $150,000 to $199,999 | 770 | 13.3% |
| $200,000+ | 1,998 | 34.5% |
Household Income by Householder Age in La Grange
The median household income in La Grange is $141,235, with the highest median household income of $187,125 found in the 25 to 44 years age bracket for the primary householder. A total of 1,477 households (25.5%) fall into this category. Meanwhile, the 15 to 24 years age bracket for the primary householder has the lowest median household income of $0, with 92 households (1.6%) in this group.
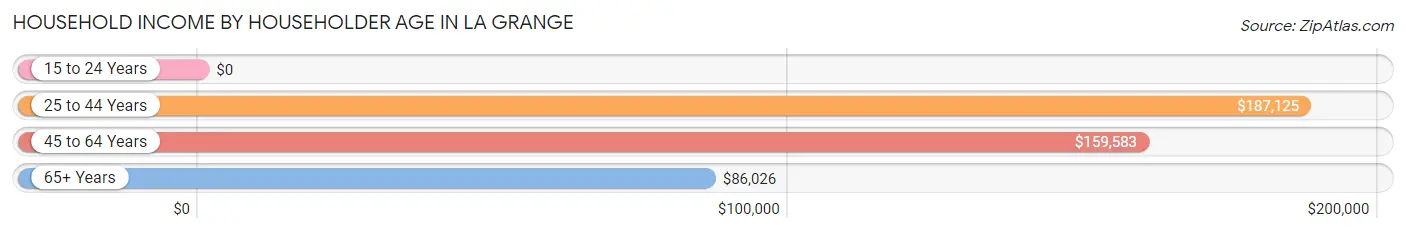
| Income Bracket | # Households | Median Income |
| 15 to 24 Years | 92 (1.6%) | $0 |
| 25 to 44 Years | 1,477 (25.5%) | $187,125 |
| 45 to 64 Years | 2,574 (44.5%) | $159,583 |
| 65+ Years | 1,648 (28.5%) | $86,026 |
| Total | 5,791 (100.0%) | $141,235 |
Poverty in La Grange
Income Below Poverty by Sex and Age in La Grange
With 4.5% poverty level for males and 4.3% for females among the residents of La Grange, 18 to 24 year old males and 35 to 44 year old females are the most vulnerable to poverty, with 84 males (20.8%) and 118 females (9.9%) in their respective age groups living below the poverty level.
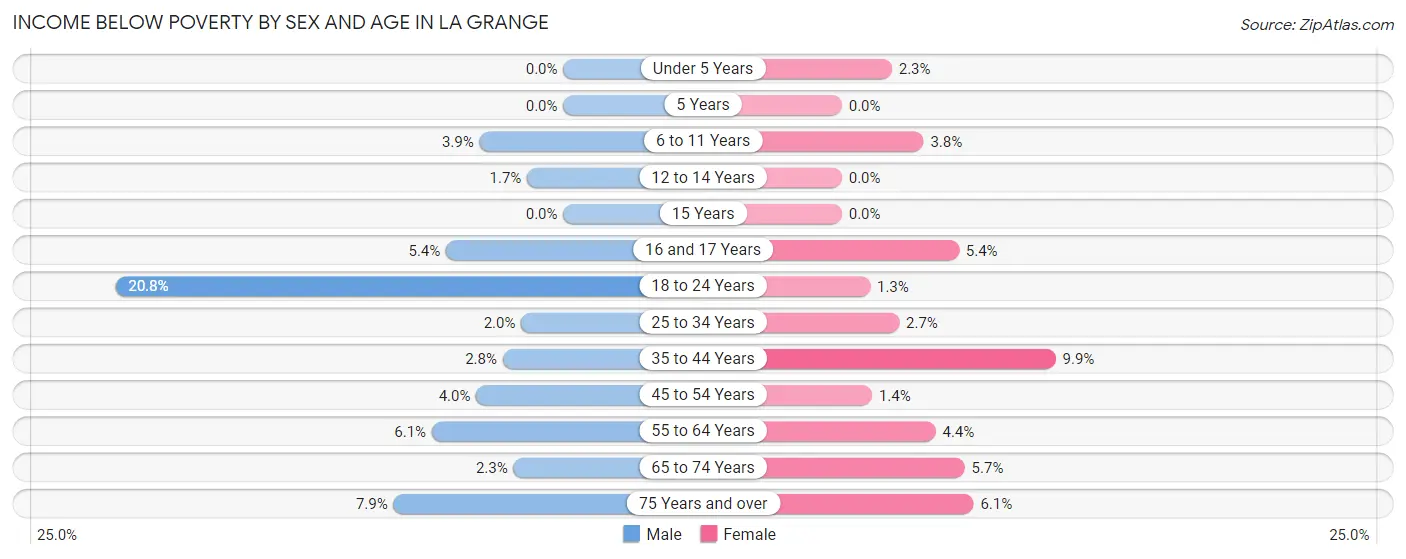
| Age Bracket | Male | Female |
| Under 5 Years | 0 (0.0%) | 10 (2.3%) |
| 5 Years | 0 (0.0%) | 0 (0.0%) |
| 6 to 11 Years | 33 (3.9%) | 34 (3.8%) |
| 12 to 14 Years | 7 (1.7%) | 0 (0.0%) |
| 15 Years | 0 (0.0%) | 0 (0.0%) |
| 16 and 17 Years | 23 (5.4%) | 14 (5.4%) |
| 18 to 24 Years | 84 (20.8%) | 6 (1.3%) |
| 25 to 34 Years | 9 (1.9%) | 13 (2.7%) |
| 35 to 44 Years | 30 (2.8%) | 118 (9.9%) |
| 45 to 54 Years | 55 (4.0%) | 16 (1.4%) |
| 55 to 64 Years | 59 (6.1%) | 56 (4.3%) |
| 65 to 74 Years | 17 (2.3%) | 41 (5.7%) |
| 75 Years and over | 32 (7.9%) | 39 (6.1%) |
| Total | 349 (4.5%) | 347 (4.3%) |
Income Above Poverty by Sex and Age in La Grange
According to the poverty statistics in La Grange, males aged under 5 years and females aged 5 years are the age groups that are most secure financially, with 100.0% of males and 100.0% of females in these age groups living above the poverty line.
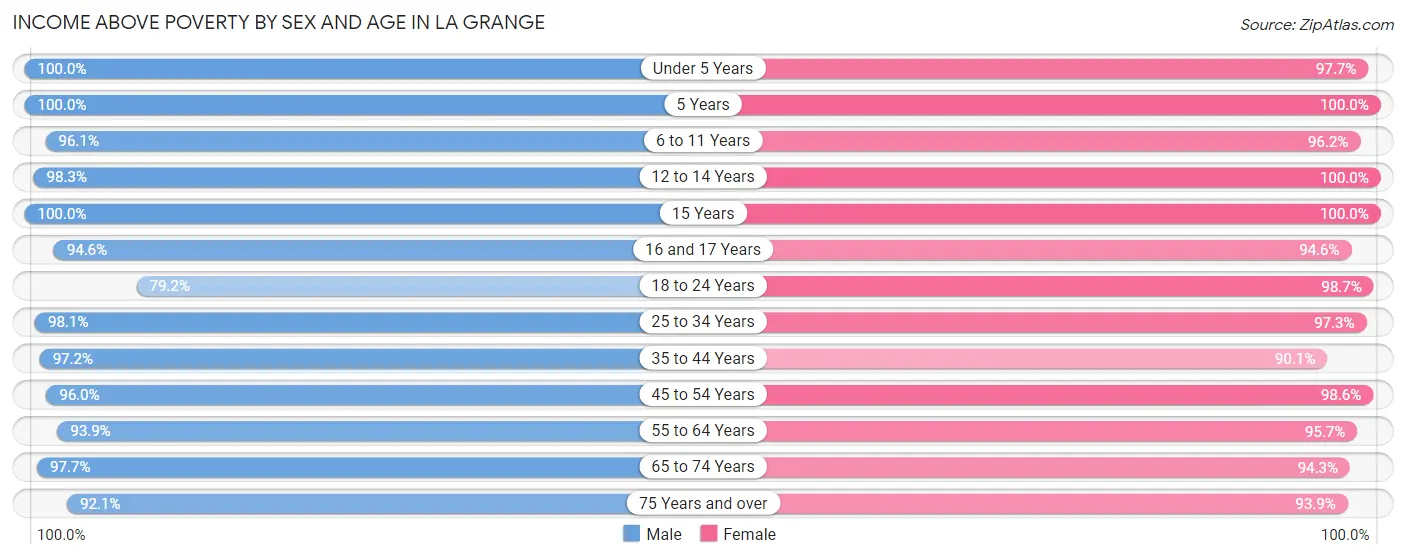
| Age Bracket | Male | Female |
| Under 5 Years | 522 (100.0%) | 421 (97.7%) |
| 5 Years | 67 (100.0%) | 90 (100.0%) |
| 6 to 11 Years | 816 (96.1%) | 864 (96.2%) |
| 12 to 14 Years | 409 (98.3%) | 374 (100.0%) |
| 15 Years | 125 (100.0%) | 143 (100.0%) |
| 16 and 17 Years | 400 (94.6%) | 244 (94.6%) |
| 18 to 24 Years | 320 (79.2%) | 451 (98.7%) |
| 25 to 34 Years | 452 (98.1%) | 475 (97.3%) |
| 35 to 44 Years | 1,037 (97.2%) | 1,072 (90.1%) |
| 45 to 54 Years | 1,307 (96.0%) | 1,126 (98.6%) |
| 55 to 64 Years | 908 (93.9%) | 1,232 (95.7%) |
| 65 to 74 Years | 718 (97.7%) | 678 (94.3%) |
| 75 Years and over | 374 (92.1%) | 599 (93.9%) |
| Total | 7,455 (95.5%) | 7,769 (95.7%) |
Income Below Poverty Among Married-Couple Families in La Grange
The poverty statistics for married-couple families in La Grange show that 1.4% or 52 of the total 3,625 families live below the poverty line. Families with no children have the highest poverty rate of 1.6%, comprising of 27 families. On the other hand, families with 3 or 4 children have the lowest poverty rate of 1.2%, which includes 7 families.
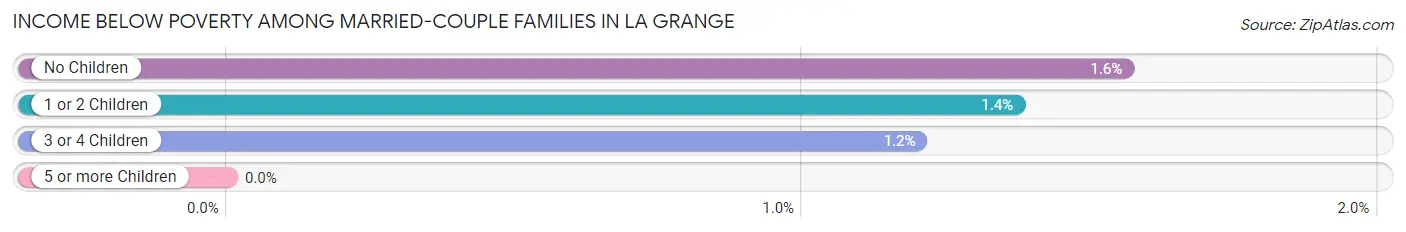
| Children | Above Poverty | Below Poverty |
| No Children | 1,705 (98.4%) | 27 (1.6%) |
| 1 or 2 Children | 1,292 (98.6%) | 18 (1.4%) |
| 3 or 4 Children | 576 (98.8%) | 7 (1.2%) |
| 5 or more Children | 0 (0.0%) | 0 (0.0%) |
| Total | 3,573 (98.6%) | 52 (1.4%) |
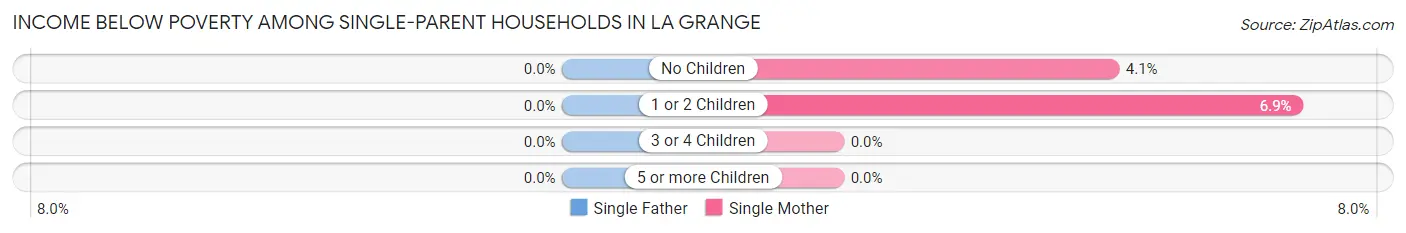
Income Below Poverty Among Single-Parent Households in La Grange
| Children | Single Father | Single Mother |
| No Children | 0 (0.0%) | 12 (4.1%) |
| 1 or 2 Children | 0 (0.0%) | 17 (6.9%) |
| 3 or 4 Children | 0 (0.0%) | 0 (0.0%) |
| 5 or more Children | 0 (0.0%) | 0 (0.0%) |
| Total | 0 (0.0%) | 29 (5.4%) |
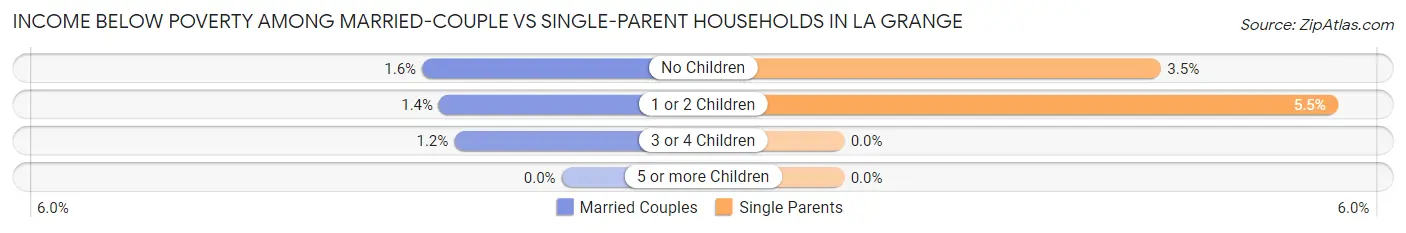
Income Below Poverty Among Married-Couple vs Single-Parent Households in La Grange
The poverty data for La Grange shows that 52 of the married-couple family households (1.4%) and 29 of the single-parent households (4.4%) are living below the poverty level. Within the married-couple family households, those with no children have the highest poverty rate, with 27 households (1.6%) falling below the poverty line. Among the single-parent households, those with 1 or 2 children have the highest poverty rate, with 17 household (5.5%) living below poverty.
| Children | Married-Couple Families | Single-Parent Households |
| No Children | 27 (1.6%) | 12 (3.5%) |
| 1 or 2 Children | 18 (1.4%) | 17 (5.5%) |
| 3 or 4 Children | 7 (1.2%) | 0 (0.0%) |
| 5 or more Children | 0 (0.0%) | 0 (0.0%) |
| Total | 52 (1.4%) | 29 (4.4%) |
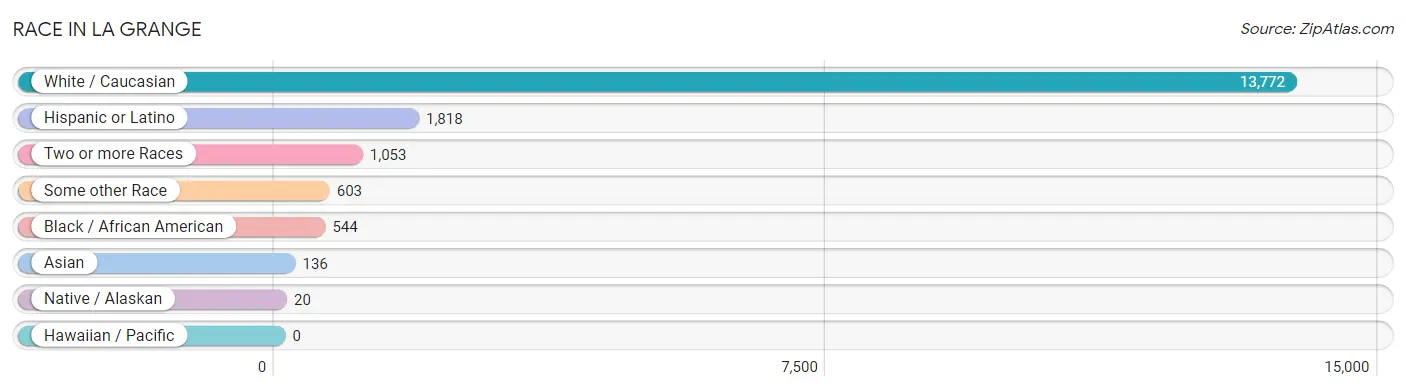
Race in La Grange
The most populous races in La Grange are White / Caucasian (13,772 | 85.4%), Hispanic or Latino (1,818 | 11.3%), and Two or more Races (1,053 | 6.5%).
| Race | # Population | % Population |
| Asian | 136 | 0.8% |
| Black / African American | 544 | 3.4% |
| Hawaiian / Pacific | 0 | 0.0% |
| Hispanic or Latino | 1,818 | 11.3% |
| Native / Alaskan | 20 | 0.1% |
| White / Caucasian | 13,772 | 85.4% |
| Two or more Races | 1,053 | 6.5% |
| Some other Race | 603 | 3.7% |
| Total | 16,128 | 100.0% |
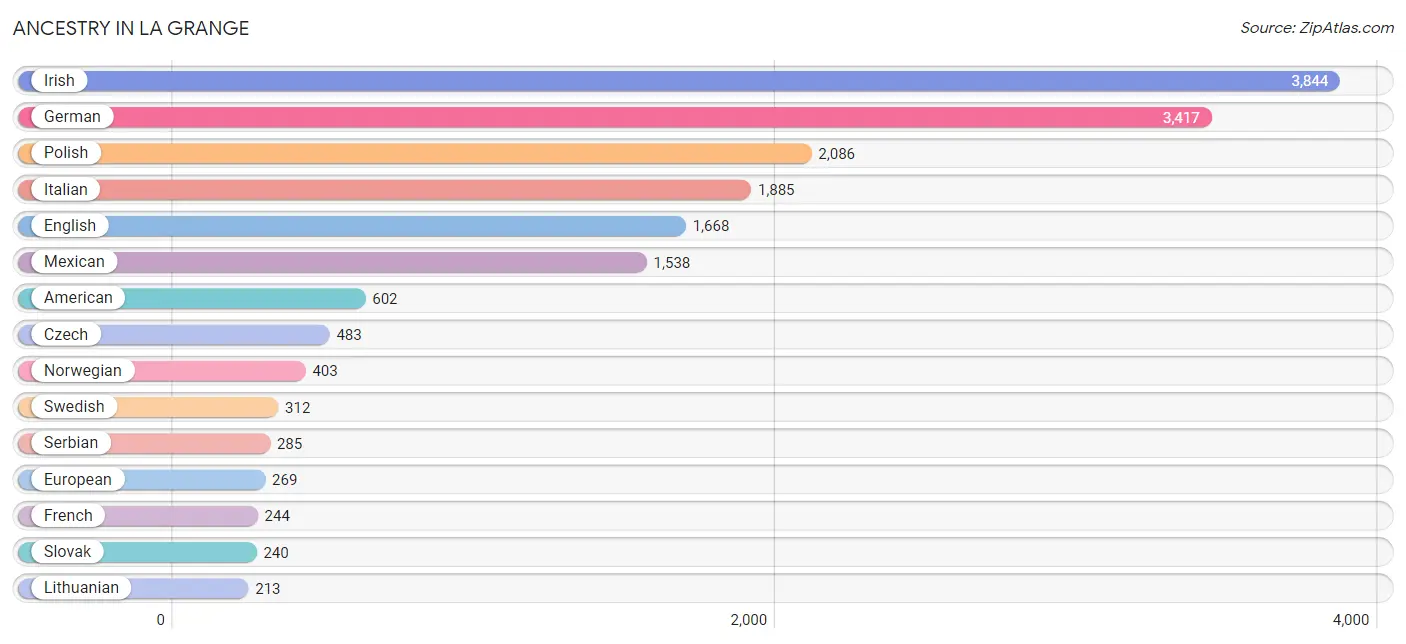
Ancestry in La Grange
The most populous ancestries reported in La Grange are Irish (3,844 | 23.8%), German (3,417 | 21.2%), Polish (2,086 | 12.9%), Italian (1,885 | 11.7%), and English (1,668 | 10.3%), together accounting for 80.0% of all La Grange residents.
| Ancestry | # Population | % Population |
| African | 13 | 0.1% |
| American | 602 | 3.7% |
| Arab | 149 | 0.9% |
| Austrian | 31 | 0.2% |
| Belgian | 38 | 0.2% |
| Brazilian | 40 | 0.3% |
| British | 33 | 0.2% |
| Burmese | 48 | 0.3% |
| Canadian | 37 | 0.2% |
| Central American | 5 | 0.0% |
| Central American Indian | 20 | 0.1% |
| Cherokee | 10 | 0.1% |
| Cheyenne | 12 | 0.1% |
| Choctaw | 22 | 0.1% |
| Colombian | 83 | 0.5% |
| Costa Rican | 5 | 0.0% |
| Croatian | 119 | 0.7% |
| Cuban | 21 | 0.1% |
| Czech | 483 | 3.0% |
| Czechoslovakian | 24 | 0.2% |
| Danish | 46 | 0.3% |
| Dutch | 114 | 0.7% |
| Eastern European | 94 | 0.6% |
| Ecuadorian | 23 | 0.1% |
| English | 1,668 | 10.3% |
| European | 269 | 1.7% |
| French | 244 | 1.5% |
| French Canadian | 22 | 0.1% |
| German | 3,417 | 21.2% |
| Greek | 160 | 1.0% |
| Haitian | 65 | 0.4% |
| Hungarian | 17 | 0.1% |
| Indian (Asian) | 202 | 1.3% |
| Irish | 3,844 | 23.8% |
| Italian | 1,885 | 11.7% |
| Jamaican | 16 | 0.1% |
| Korean | 106 | 0.7% |
| Latvian | 16 | 0.1% |
| Lebanese | 27 | 0.2% |
| Lithuanian | 213 | 1.3% |
| Luxembourger | 28 | 0.2% |
| Macedonian | 59 | 0.4% |
| Mexican | 1,538 | 9.5% |
| Nigerian | 6 | 0.0% |
| Northern European | 11 | 0.1% |
| Norwegian | 403 | 2.5% |
| Okinawan | 24 | 0.2% |
| Palestinian | 96 | 0.6% |
| Peruvian | 11 | 0.1% |
| Polish | 2,086 | 12.9% |
| Portuguese | 14 | 0.1% |
| Puerto Rican | 120 | 0.7% |
| Russian | 124 | 0.8% |
| Samoan | 19 | 0.1% |
| Scandinavian | 35 | 0.2% |
| Scotch-Irish | 43 | 0.3% |
| Scottish | 207 | 1.3% |
| Serbian | 285 | 1.8% |
| Slovak | 240 | 1.5% |
| Slovene | 132 | 0.8% |
| South American | 117 | 0.7% |
| Spanish | 17 | 0.1% |
| Subsaharan African | 19 | 0.1% |
| Swedish | 312 | 1.9% |
| Swiss | 63 | 0.4% |
| Thai | 110 | 0.7% |
| Turkish | 19 | 0.1% |
| Ukrainian | 36 | 0.2% |
| Welsh | 46 | 0.3% | View All 69 Rows |
Immigrants in La Grange
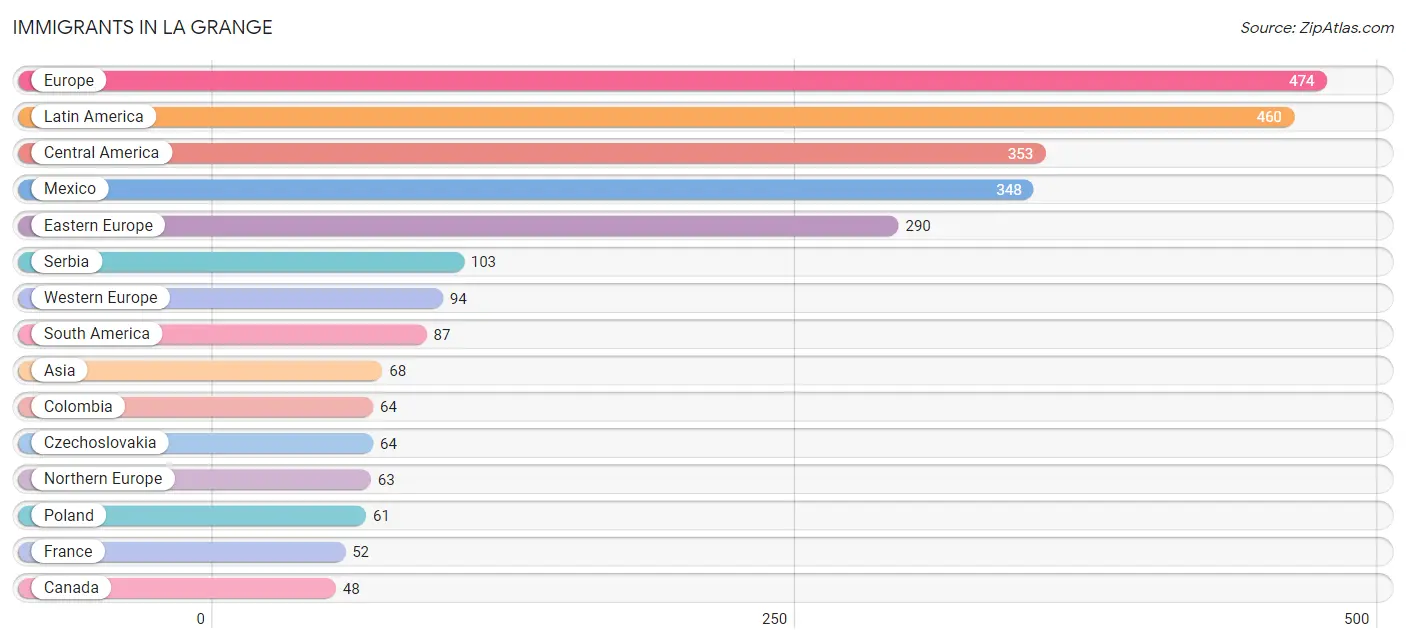
The most numerous immigrant groups reported in La Grange came from Europe (474 | 2.9%), Latin America (460 | 2.9%), Central America (353 | 2.2%), Mexico (348 | 2.2%), and Eastern Europe (290 | 1.8%), together accounting for 11.9% of all La Grange residents.
| Immigration Origin | # Population | % Population |
| Asia | 68 | 0.4% |
| Belarus | 9 | 0.1% |
| Canada | 48 | 0.3% |
| Caribbean | 20 | 0.1% |
| Central America | 353 | 2.2% |
| China | 21 | 0.1% |
| Colombia | 64 | 0.4% |
| Costa Rica | 5 | 0.0% |
| Cuba | 11 | 0.1% |
| Czechoslovakia | 64 | 0.4% |
| Eastern Asia | 47 | 0.3% |
| Eastern Europe | 290 | 1.8% |
| Ecuador | 23 | 0.1% |
| England | 11 | 0.1% |
| Europe | 474 | 2.9% |
| France | 52 | 0.3% |
| Germany | 30 | 0.2% |
| Haiti | 9 | 0.1% |
| Ireland | 42 | 0.3% |
| Israel | 9 | 0.1% |
| Italy | 27 | 0.2% |
| Korea | 26 | 0.2% |
| Latin America | 460 | 2.9% |
| Latvia | 8 | 0.1% |
| Lithuania | 25 | 0.2% |
| Mexico | 348 | 2.2% |
| Netherlands | 12 | 0.1% |
| Northern Europe | 63 | 0.4% |
| Philippines | 8 | 0.1% |
| Poland | 61 | 0.4% |
| Russia | 10 | 0.1% |
| Serbia | 103 | 0.6% |
| South America | 87 | 0.5% |
| South Eastern Asia | 8 | 0.1% |
| Southern Europe | 27 | 0.2% |
| Ukraine | 1 | 0.0% |
| Western Asia | 13 | 0.1% |
| Western Europe | 94 | 0.6% | View All 38 Rows |
Sex and Age in La Grange
Sex and Age in La Grange
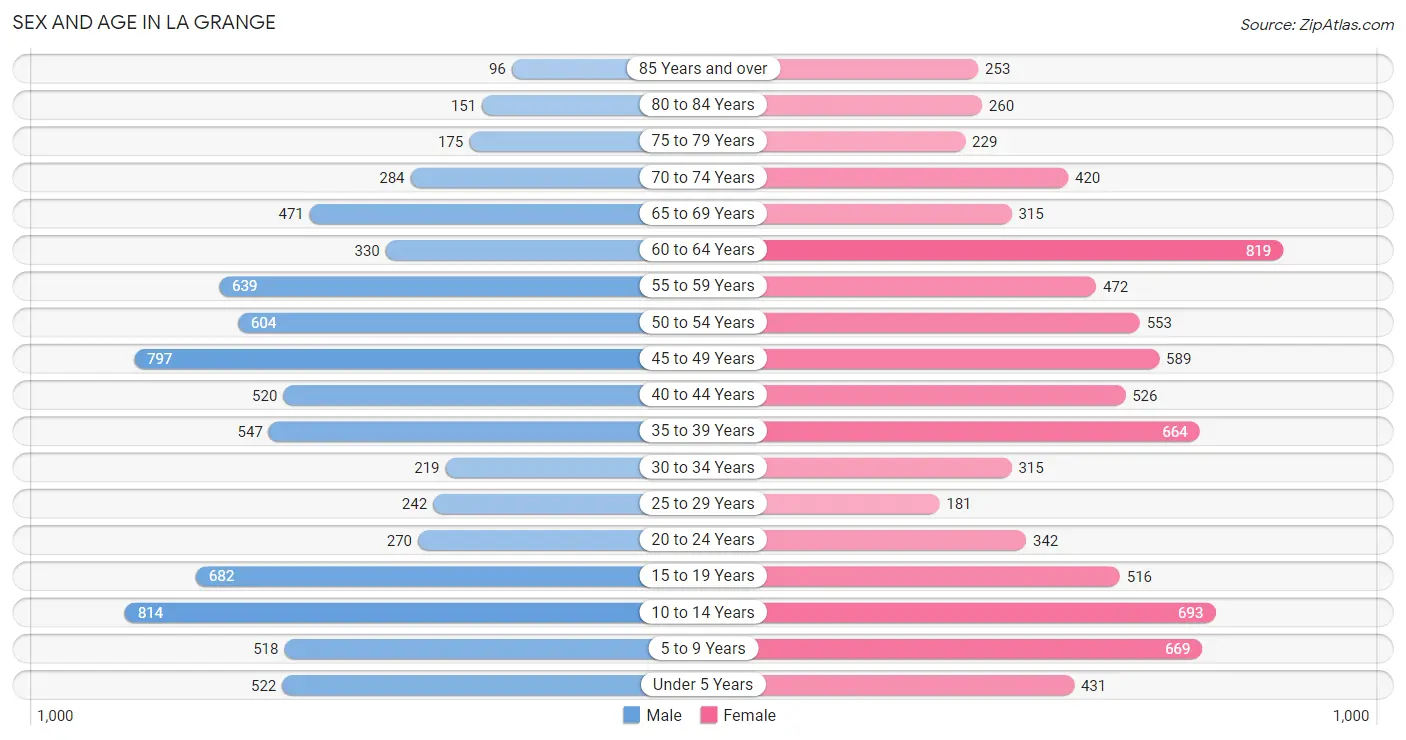
The most populous age groups in La Grange are 10 to 14 Years (814 | 10.3%) for men and 60 to 64 Years (819 | 9.9%) for women.
| Age Bracket | Male | Female |
| Under 5 Years | 522 (6.6%) | 431 (5.2%) |
| 5 to 9 Years | 518 (6.6%) | 669 (8.1%) |
| 10 to 14 Years | 814 (10.3%) | 693 (8.4%) |
| 15 to 19 Years | 682 (8.6%) | 516 (6.3%) |
| 20 to 24 Years | 270 (3.4%) | 342 (4.2%) |
| 25 to 29 Years | 242 (3.1%) | 181 (2.2%) |
| 30 to 34 Years | 219 (2.8%) | 315 (3.8%) |
| 35 to 39 Years | 547 (6.9%) | 664 (8.1%) |
| 40 to 44 Years | 520 (6.6%) | 526 (6.4%) |
| 45 to 49 Years | 797 (10.1%) | 589 (7.1%) |
| 50 to 54 Years | 604 (7.7%) | 553 (6.7%) |
| 55 to 59 Years | 639 (8.1%) | 472 (5.7%) |
| 60 to 64 Years | 330 (4.2%) | 819 (9.9%) |
| 65 to 69 Years | 471 (6.0%) | 315 (3.8%) |
| 70 to 74 Years | 284 (3.6%) | 420 (5.1%) |
| 75 to 79 Years | 175 (2.2%) | 229 (2.8%) |
| 80 to 84 Years | 151 (1.9%) | 260 (3.2%) |
| 85 Years and over | 96 (1.2%) | 253 (3.1%) |
| Total | 7,881 (100.0%) | 8,247 (100.0%) |
Families and Households in La Grange
Median Family Size in La Grange
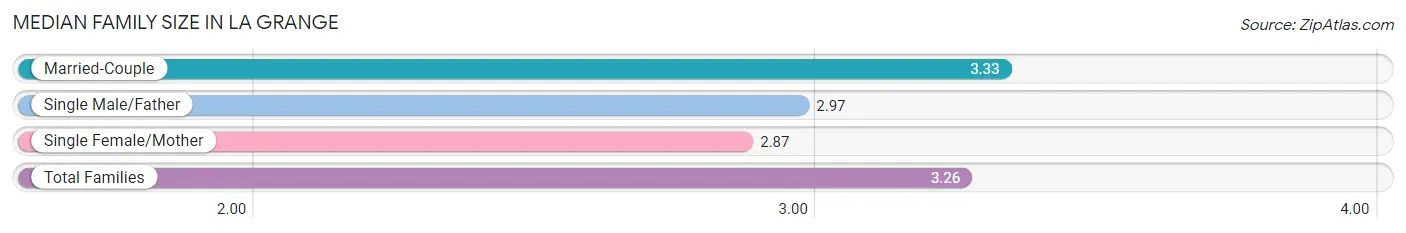
The median family size in La Grange is 3.26 persons per family, with married-couple families (3,625 | 84.6%) accounting for the largest median family size of 3.33 persons per family. On the other hand, single female/mother families (541 | 12.6%) represent the smallest median family size with 2.87 persons per family.
| Family Type | # Families | Family Size |
| Married-Couple | 3,625 (84.6%) | 3.33 |
| Single Male/Father | 121 (2.8%) | 2.97 |
| Single Female/Mother | 541 (12.6%) | 2.87 |
| Total Families | 4,287 (100.0%) | 3.26 |
Median Household Size in La Grange
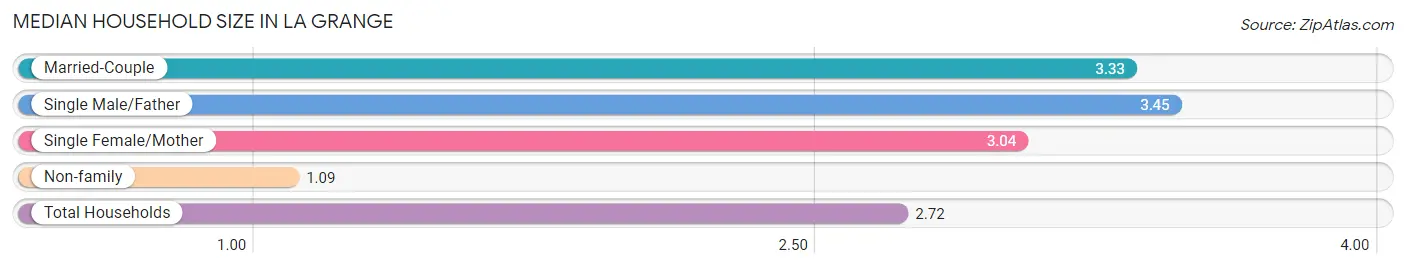
The median household size in La Grange is 2.72 persons per household, with single male/father households (121 | 2.1%) accounting for the largest median household size of 3.45 persons per household. non-family households (1,504 | 26.0%) represent the smallest median household size with 1.09 persons per household.
| Household Type | # Households | Household Size |
| Married-Couple | 3,625 (62.6%) | 3.33 |
| Single Male/Father | 121 (2.1%) | 3.45 |
| Single Female/Mother | 541 (9.3%) | 3.04 |
| Non-family | 1,504 (26.0%) | 1.09 |
| Total Households | 5,791 (100.0%) | 2.72 |
Household Size by Marriage Status in La Grange
Out of a total of 5,791 households in La Grange, 4,287 (74.0%) are family households, while 1,504 (26.0%) are nonfamily households. The most numerous type of family households are 2-person households, comprising 1,664, and the most common type of nonfamily households are 1-person households, comprising 1,397.
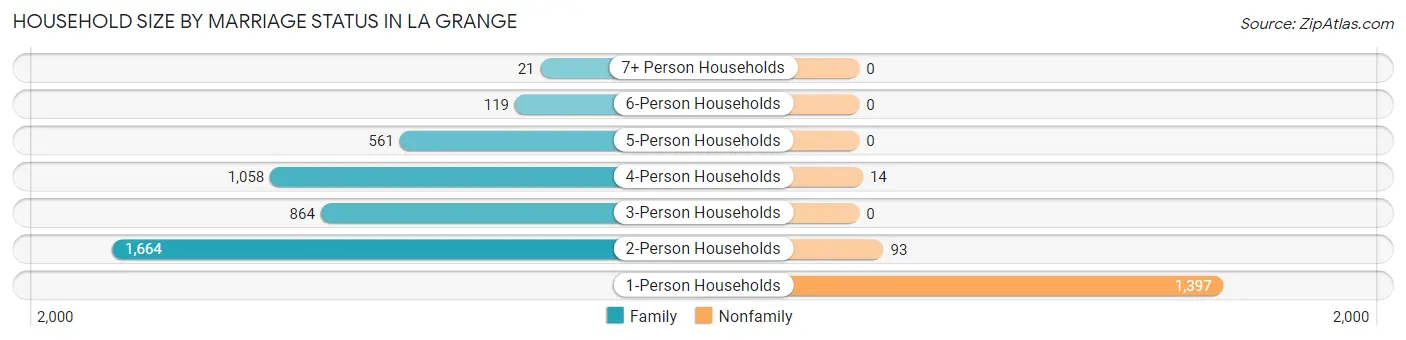
| Household Size | Family Households | Nonfamily Households |
| 1-Person Households | - | 1,397 (24.1%) |
| 2-Person Households | 1,664 (28.7%) | 93 (1.6%) |
| 3-Person Households | 864 (14.9%) | 0 (0.0%) |
| 4-Person Households | 1,058 (18.3%) | 14 (0.2%) |
| 5-Person Households | 561 (9.7%) | 0 (0.0%) |
| 6-Person Households | 119 (2.1%) | 0 (0.0%) |
| 7+ Person Households | 21 (0.4%) | 0 (0.0%) |
| Total | 4,287 (74.0%) | 1,504 (26.0%) |
Female Fertility in La Grange
Fertility by Age in La Grange
Average fertility rate in La Grange is 61.0 births per 1,000 women. Women in the age bracket of 20 to 34 years have the highest fertility rate with 98.0 births per 1,000 women. Women in the age bracket of 35 to 50 years acount for 45.3% of all women with births.
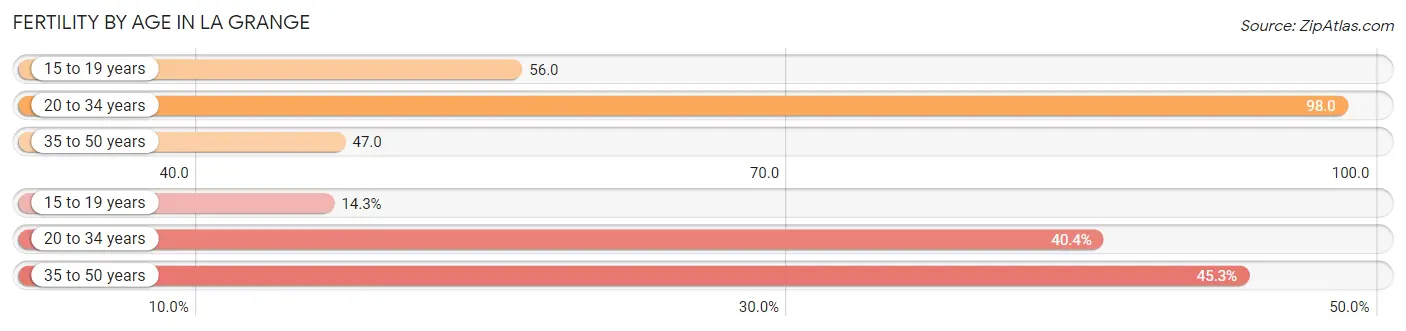
| Age Bracket | Women with Births | Births / 1,000 Women |
| 15 to 19 years | 29 (14.3%) | 56.0 |
| 20 to 34 years | 82 (40.4%) | 98.0 |
| 35 to 50 years | 92 (45.3%) | 47.0 |
| Total | 203 (100.0%) | 61.0 |
Fertility by Age by Marriage Status in La Grange
85.7% of women with births (203) in La Grange are married. The highest percentage of unmarried women with births falls into 15 to 19 years age bracket with 100.0% of them unmarried at the time of birth, while the lowest percentage of unmarried women with births belong to 20 to 34 years age bracket with 0.0% of them unmarried.
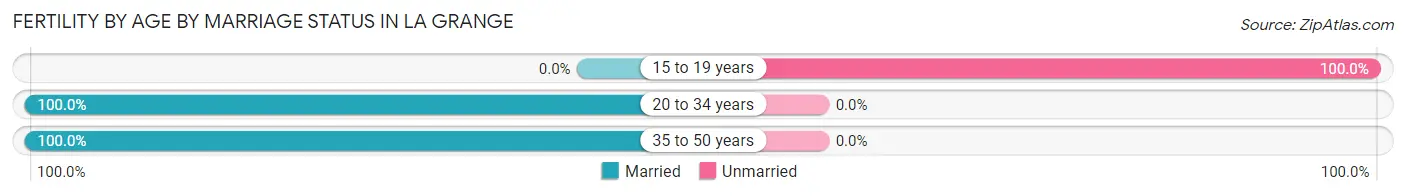
| Age Bracket | Married | Unmarried |
| 15 to 19 years | 0 (0.0%) | 29 (100.0%) |
| 20 to 34 years | 82 (100.0%) | 0 (0.0%) |
| 35 to 50 years | 92 (100.0%) | 0 (0.0%) |
| Total | 174 (85.7%) | 29 (14.3%) |
Fertility by Education in La Grange
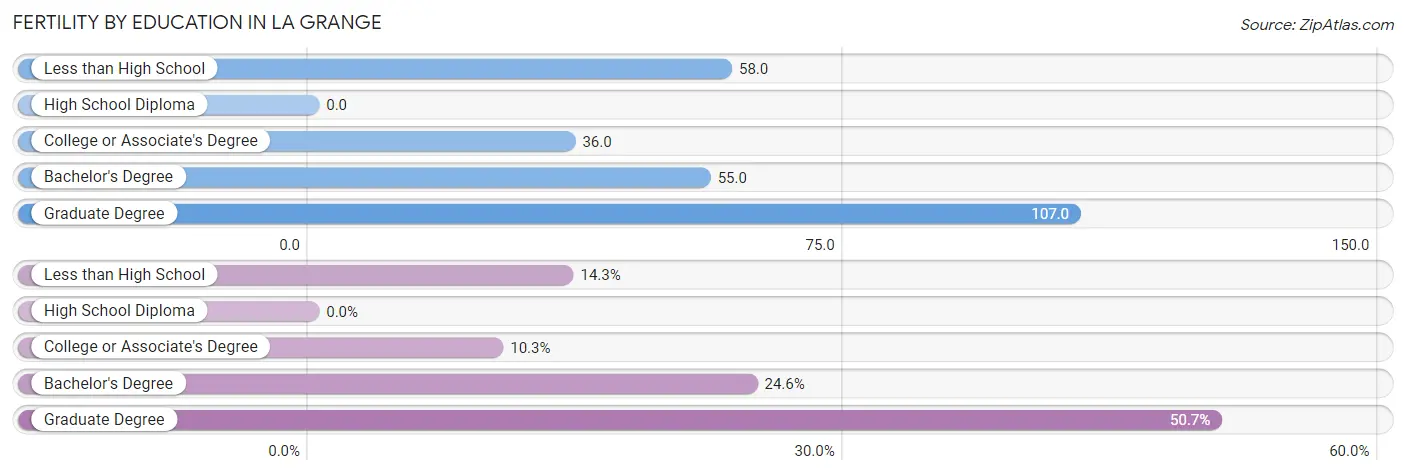
| Educational Attainment | Women with Births | Births / 1,000 Women |
| Less than High School | 29 (14.3%) | 58.0 |
| High School Diploma | 0 (0.0%) | 0.0 |
| College or Associate's Degree | 21 (10.3%) | 36.0 |
| Bachelor's Degree | 50 (24.6%) | 55.0 |
| Graduate Degree | 103 (50.7%) | 107.0 |
| Total | 203 (100.0%) | 61.0 |
Fertility by Education by Marriage Status in La Grange
14.3% of women with births in La Grange are unmarried. Women with the educational attainment of college or associate's degree are most likely to be married with 100.0% of them married at childbirth, while women with the educational attainment of less than high school are least likely to be married with 100.0% of them unmarried at childbirth.
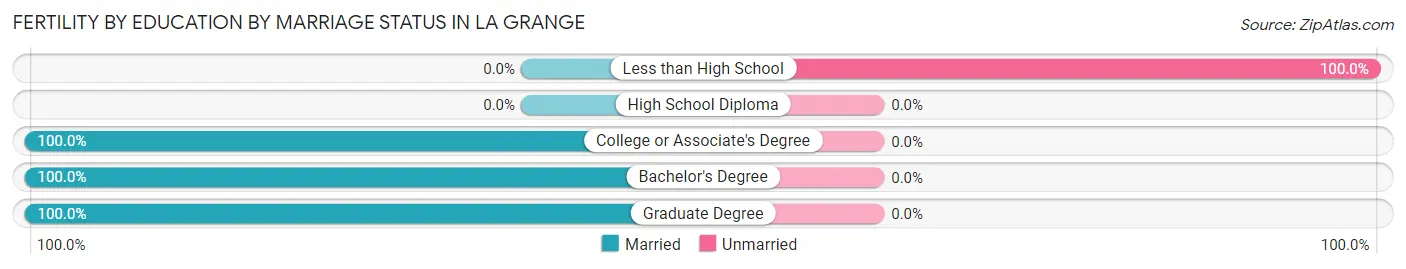
| Educational Attainment | Married | Unmarried |
| Less than High School | 0 (0.0%) | 29 (100.0%) |
| High School Diploma | 0 (0.0%) | 0 (0.0%) |
| College or Associate's Degree | 21 (100.0%) | 0 (0.0%) |
| Bachelor's Degree | 50 (100.0%) | 0 (0.0%) |
| Graduate Degree | 103 (100.0%) | 0 (0.0%) |
| Total | 174 (85.7%) | 29 (14.3%) |
Employment Characteristics in La Grange
Employment by Class of Employer in La Grange
Among the 7,750 employed individuals in La Grange, private company employees (5,242 | 67.6%), local government employees (677 | 8.7%), and not-for-profit organizations (668 | 8.6%) make up the most common classes of employment.
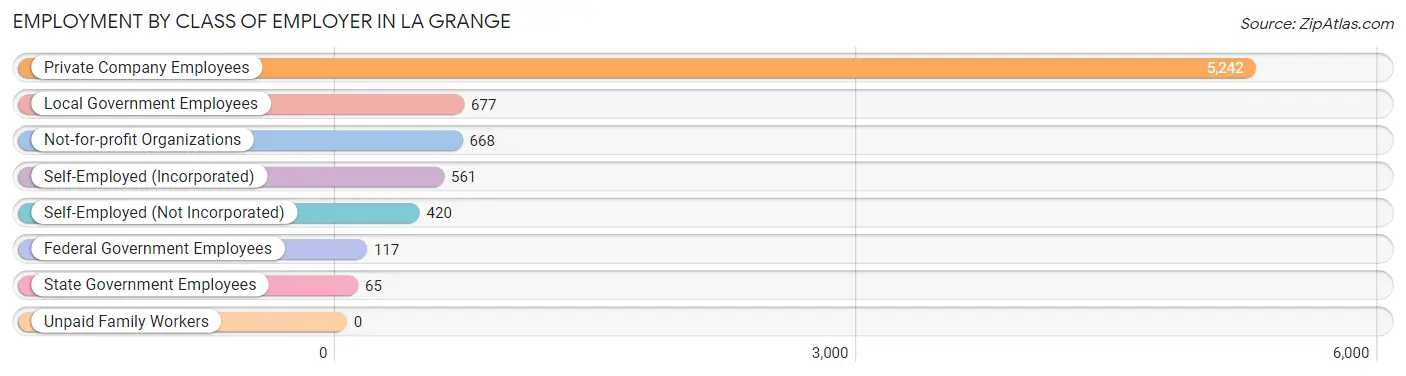
| Employer Class | # Employees | % Employees |
| Private Company Employees | 5,242 | 67.6% |
| Self-Employed (Incorporated) | 561 | 7.2% |
| Self-Employed (Not Incorporated) | 420 | 5.4% |
| Not-for-profit Organizations | 668 | 8.6% |
| Local Government Employees | 677 | 8.7% |
| State Government Employees | 65 | 0.8% |
| Federal Government Employees | 117 | 1.5% |
| Unpaid Family Workers | 0 | 0.0% |
| Total | 7,750 | 100.0% |
Employment Status by Age in La Grange
According to the labor force statistics for La Grange, out of the total population over 16 years of age (12,213), 66.4% or 8,109 individuals are in the labor force, with 2.0% or 162 of them unemployed. The age group with the highest labor force participation rate is 25 to 29 years, with 87.9% or 372 individuals in the labor force. Within the labor force, the 75 years and over age range has the highest percentage of unemployed individuals, with 13.7% or 10 of them being unemployed.
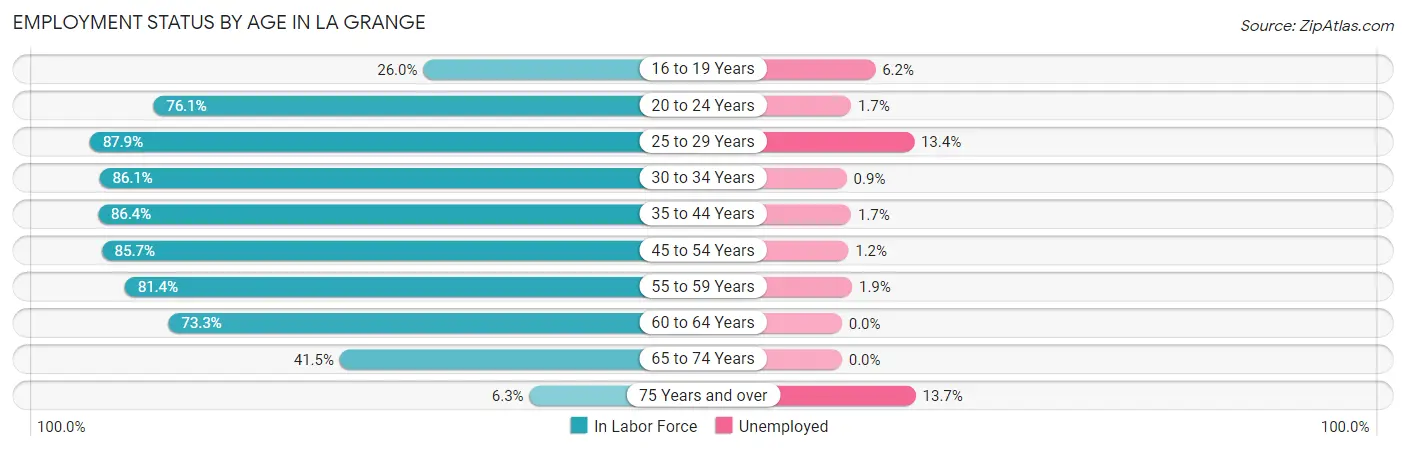
| Age Bracket | In Labor Force | Unemployed |
| 16 to 19 Years | 242 (26.0%) | 15 (6.2%) |
| 20 to 24 Years | 466 (76.1%) | 8 (1.7%) |
| 25 to 29 Years | 372 (87.9%) | 50 (13.4%) |
| 30 to 34 Years | 460 (86.1%) | 4 (0.9%) |
| 35 to 44 Years | 1,950 (86.4%) | 33 (1.7%) |
| 45 to 54 Years | 2,179 (85.7%) | 26 (1.2%) |
| 55 to 59 Years | 904 (81.4%) | 17 (1.9%) |
| 60 to 64 Years | 842 (73.3%) | 0 (0.0%) |
| 65 to 74 Years | 618 (41.5%) | 0 (0.0%) |
| 75 Years and over | 73 (6.3%) | 10 (13.7%) |
| Total | 8,109 (66.4%) | 162 (2.0%) |
Employment Status by Educational Attainment in La Grange
According to labor force statistics for La Grange, 83.6% of individuals (6,702) out of the total population between 25 and 64 years of age (8,017) are in the labor force, with 2.0% or 134 of them being unemployed. The group with the highest labor force participation rate are those with the educational attainment of bachelor's degree or higher, with 88.9% or 4,657 individuals in the labor force. Within the labor force, individuals with high school diploma education have the highest percentage of unemployment, with 2.4% or 16 of them being unemployed.
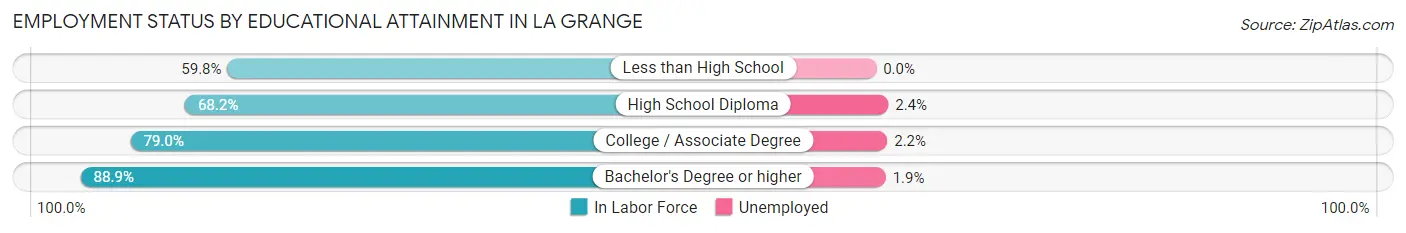
| Educational Attainment | In Labor Force | Unemployed |
| Less than High School | 116 (59.8%) | 0 (0.0%) |
| High School Diploma | 672 (68.2%) | 24 (2.4%) |
| College / Associate Degree | 1,262 (79.0%) | 35 (2.2%) |
| Bachelor's Degree or higher | 4,657 (88.9%) | 100 (1.9%) |
| Total | 6,702 (83.6%) | 160 (2.0%) |
Employment Occupations by Sex in La Grange
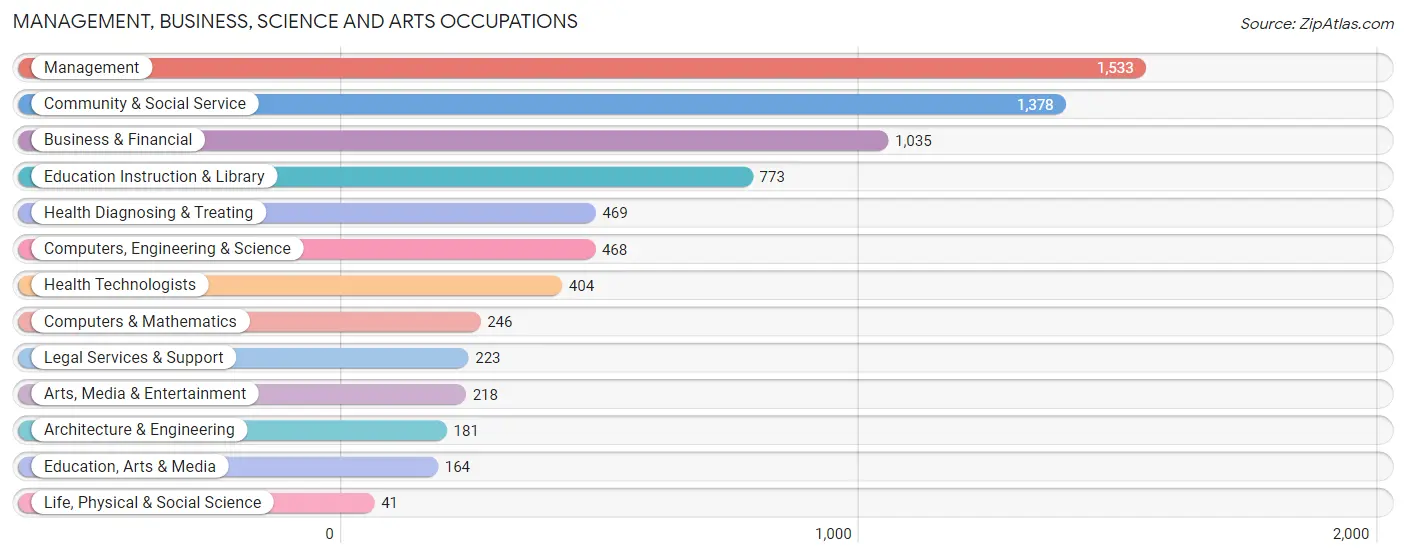
Management, Business, Science and Arts Occupations
The most common Management, Business, Science and Arts occupations in La Grange are Management (1,533 | 19.3%), Community & Social Service (1,378 | 17.3%), Business & Financial (1,035 | 13.0%), Education Instruction & Library (773 | 9.7%), and Health Diagnosing & Treating (469 | 5.9%).
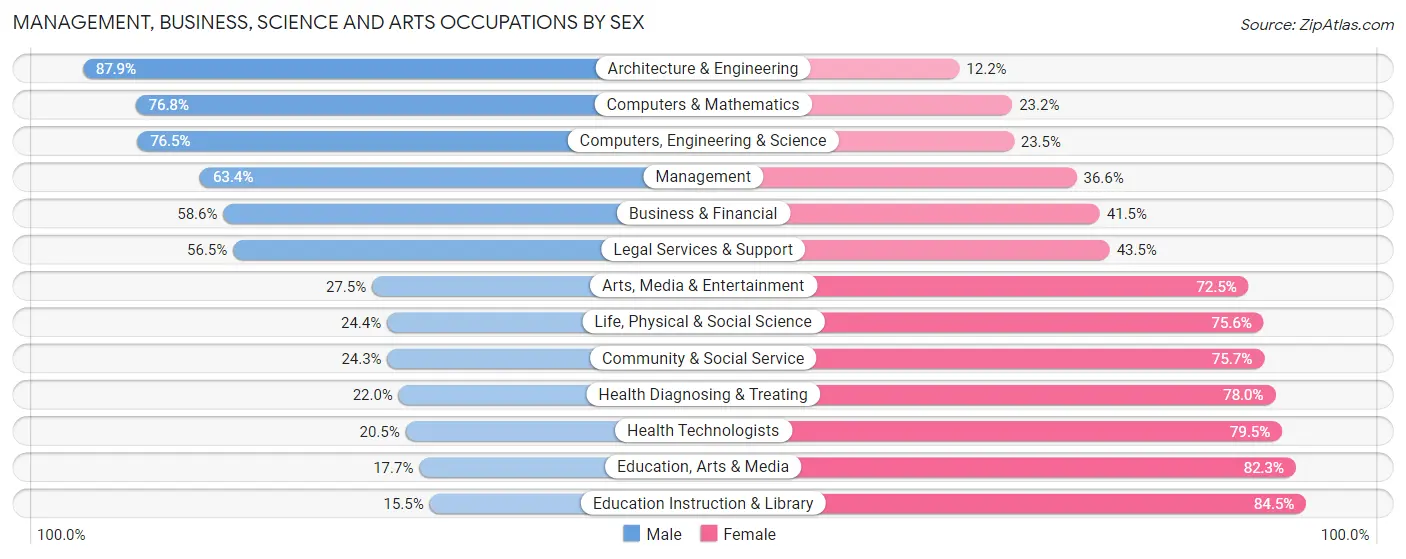
Management, Business, Science and Arts Occupations by Sex
Within the Management, Business, Science and Arts occupations in La Grange, the most male-oriented occupations are Architecture & Engineering (87.8%), Computers & Mathematics (76.8%), and Computers, Engineering & Science (76.5%), while the most female-oriented occupations are Education Instruction & Library (84.5%), Education, Arts & Media (82.3%), and Health Technologists (79.5%).
| Occupation | Male | Female |
| Management | 972 (63.4%) | 561 (36.6%) |
| Business & Financial | 606 (58.6%) | 429 (41.4%) |
| Computers, Engineering & Science | 358 (76.5%) | 110 (23.5%) |
| Computers & Mathematics | 189 (76.8%) | 57 (23.2%) |
| Architecture & Engineering | 159 (87.8%) | 22 (12.1%) |
| Life, Physical & Social Science | 10 (24.4%) | 31 (75.6%) |
| Community & Social Service | 335 (24.3%) | 1,043 (75.7%) |
| Education, Arts & Media | 29 (17.7%) | 135 (82.3%) |
| Legal Services & Support | 126 (56.5%) | 97 (43.5%) |
| Education Instruction & Library | 120 (15.5%) | 653 (84.5%) |
| Arts, Media & Entertainment | 60 (27.5%) | 158 (72.5%) |
| Health Diagnosing & Treating | 103 (22.0%) | 366 (78.0%) |
| Health Technologists | 83 (20.5%) | 321 (79.5%) |
| Total (Category) | 2,374 (48.6%) | 2,509 (51.4%) |
| Total (Overall) | 4,038 (50.8%) | 3,903 (49.1%) |
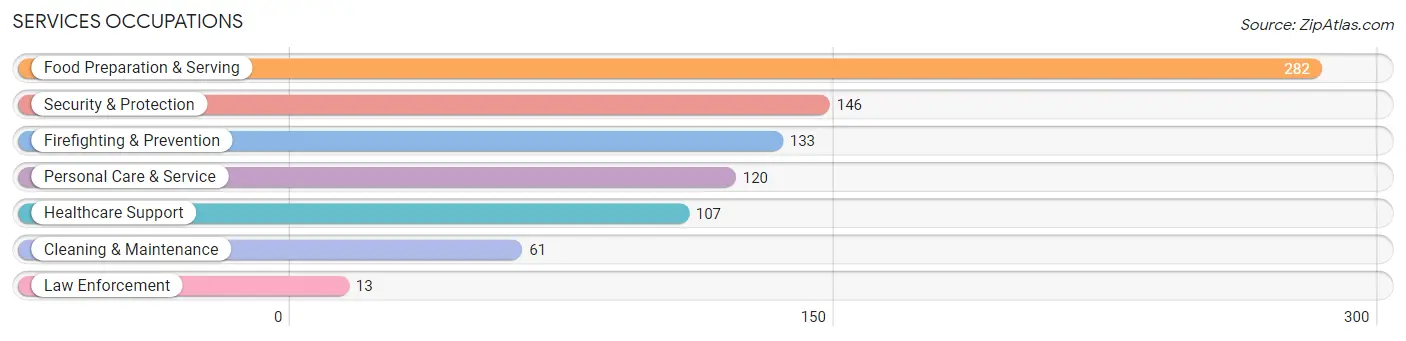
Services Occupations
The most common Services occupations in La Grange are Food Preparation & Serving (282 | 3.5%), Security & Protection (146 | 1.8%), Firefighting & Prevention (133 | 1.7%), Personal Care & Service (120 | 1.5%), and Healthcare Support (107 | 1.3%).
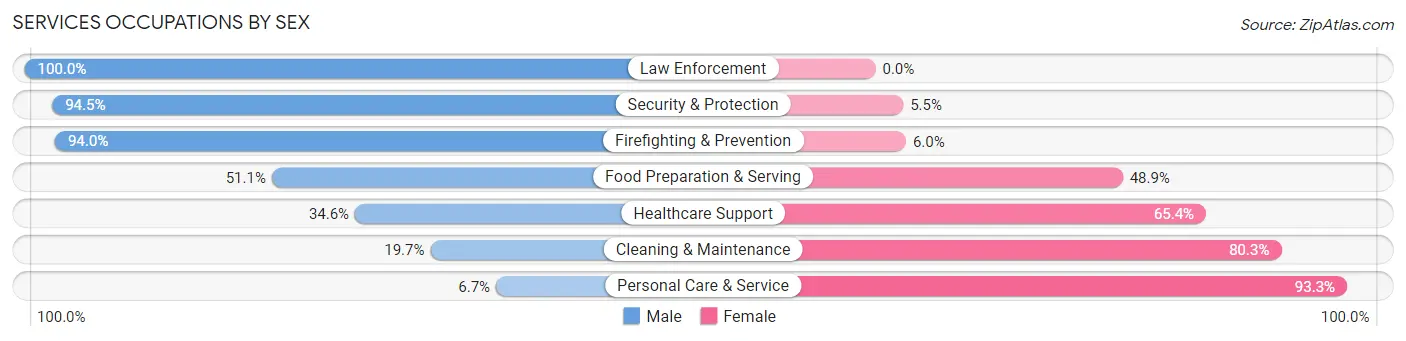
Services Occupations by Sex
Within the Services occupations in La Grange, the most male-oriented occupations are Law Enforcement (100.0%), Security & Protection (94.5%), and Firefighting & Prevention (94.0%), while the most female-oriented occupations are Personal Care & Service (93.3%), Cleaning & Maintenance (80.3%), and Healthcare Support (65.4%).
| Occupation | Male | Female |
| Healthcare Support | 37 (34.6%) | 70 (65.4%) |
| Security & Protection | 138 (94.5%) | 8 (5.5%) |
| Firefighting & Prevention | 125 (94.0%) | 8 (6.0%) |
| Law Enforcement | 13 (100.0%) | 0 (0.0%) |
| Food Preparation & Serving | 144 (51.1%) | 138 (48.9%) |
| Cleaning & Maintenance | 12 (19.7%) | 49 (80.3%) |
| Personal Care & Service | 8 (6.7%) | 112 (93.3%) |
| Total (Category) | 339 (47.3%) | 377 (52.6%) |
| Total (Overall) | 4,038 (50.8%) | 3,903 (49.1%) |
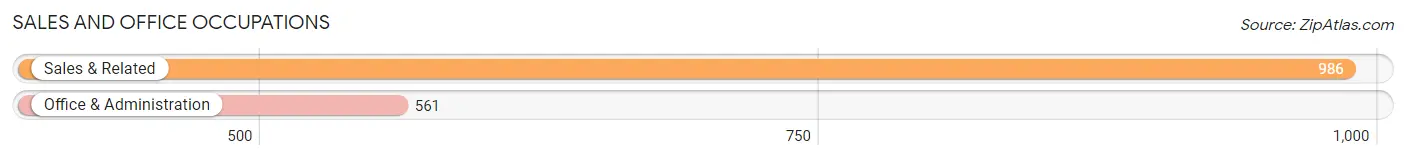
Sales and Office Occupations
The most common Sales and Office occupations in La Grange are Sales & Related (986 | 12.4%), and Office & Administration (561 | 7.1%).
Sales and Office Occupations by Sex
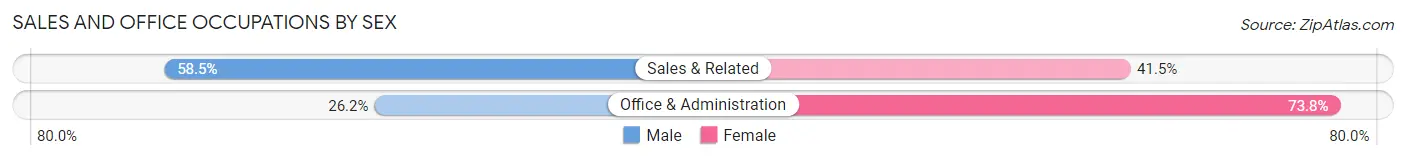
| Occupation | Male | Female |
| Sales & Related | 577 (58.5%) | 409 (41.5%) |
| Office & Administration | 147 (26.2%) | 414 (73.8%) |
| Total (Category) | 724 (46.8%) | 823 (53.2%) |
| Total (Overall) | 4,038 (50.8%) | 3,903 (49.1%) |
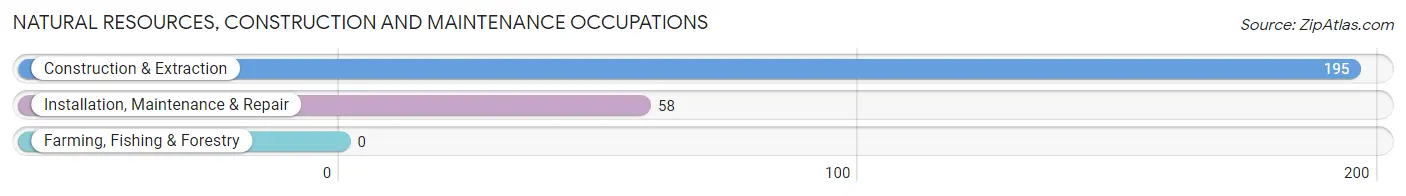
Natural Resources, Construction and Maintenance Occupations
The most common Natural Resources, Construction and Maintenance occupations in La Grange are Construction & Extraction (195 | 2.5%), and Installation, Maintenance & Repair (58 | 0.7%).
Natural Resources, Construction and Maintenance Occupations by Sex
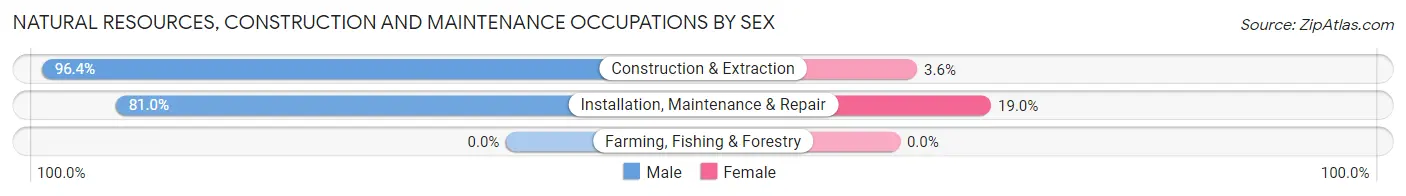
| Occupation | Male | Female |
| Farming, Fishing & Forestry | 0 (0.0%) | 0 (0.0%) |
| Construction & Extraction | 188 (96.4%) | 7 (3.6%) |
| Installation, Maintenance & Repair | 47 (81.0%) | 11 (19.0%) |
| Total (Category) | 235 (92.9%) | 18 (7.1%) |
| Total (Overall) | 4,038 (50.8%) | 3,903 (49.1%) |
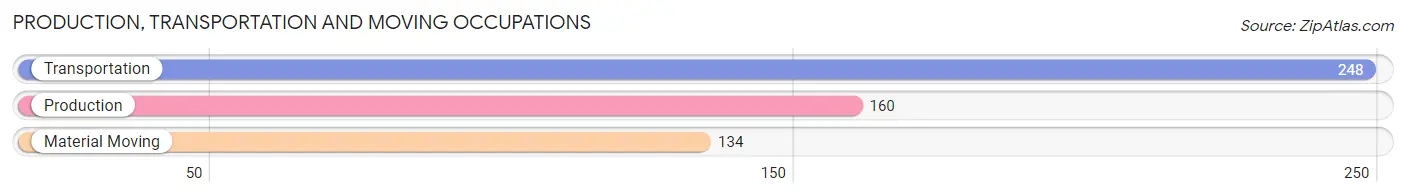
Production, Transportation and Moving Occupations
The most common Production, Transportation and Moving occupations in La Grange are Transportation (248 | 3.1%), Production (160 | 2.0%), and Material Moving (134 | 1.7%).
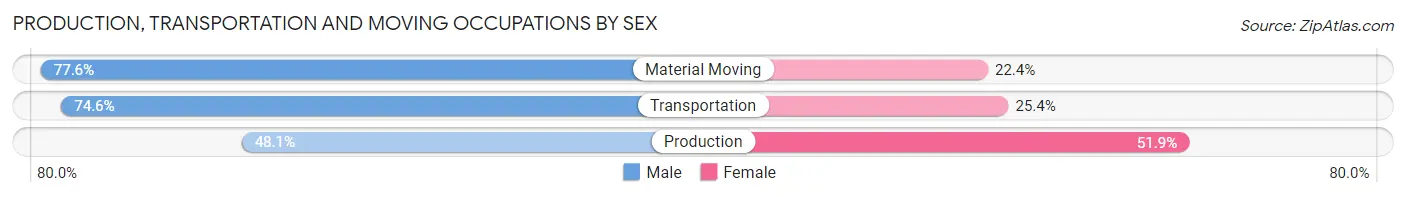
Production, Transportation and Moving Occupations by Sex
| Occupation | Male | Female |
| Production | 77 (48.1%) | 83 (51.9%) |
| Transportation | 185 (74.6%) | 63 (25.4%) |
| Material Moving | 104 (77.6%) | 30 (22.4%) |
| Total (Category) | 366 (67.5%) | 176 (32.5%) |
| Total (Overall) | 4,038 (50.8%) | 3,903 (49.1%) |
Employment Industries by Sex in La Grange
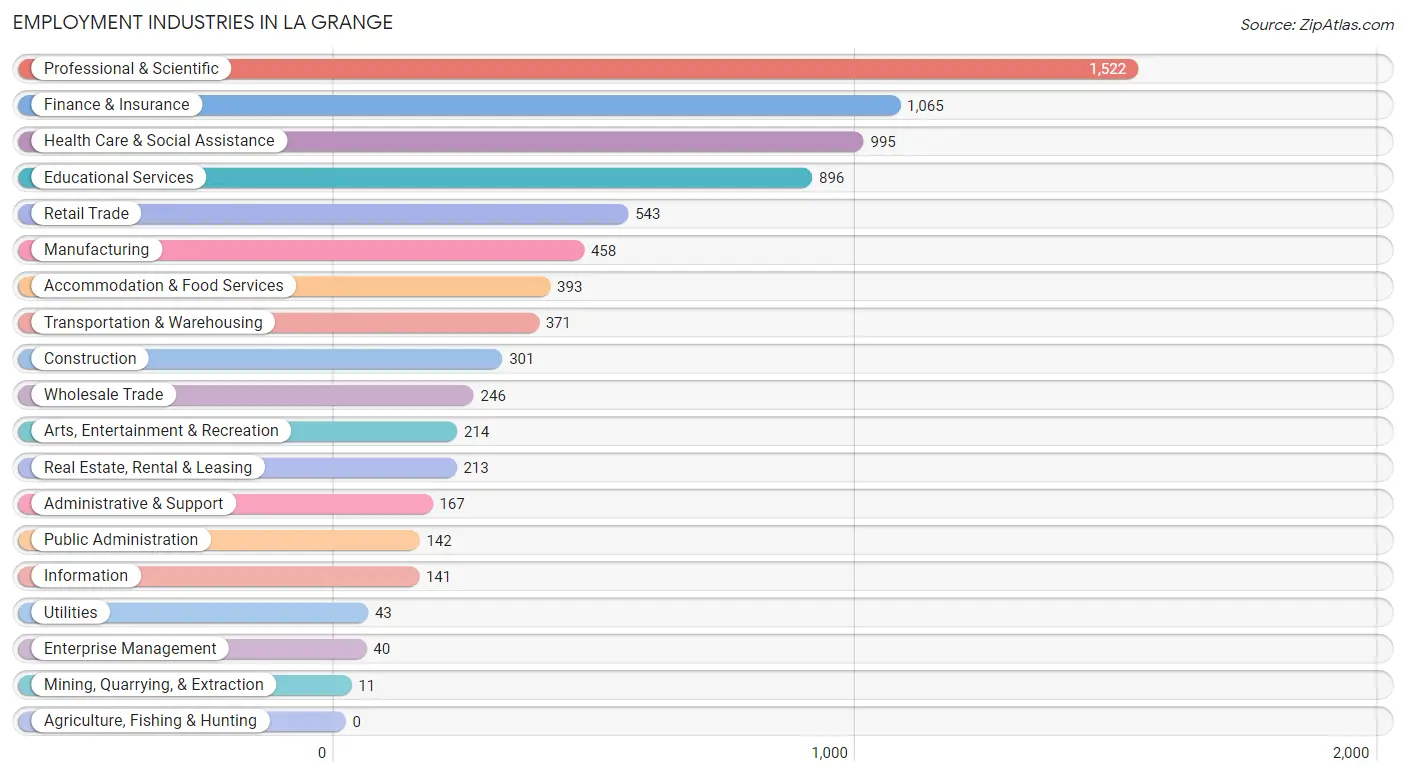
Employment Industries in La Grange
The major employment industries in La Grange include Professional & Scientific (1,522 | 19.2%), Finance & Insurance (1,065 | 13.4%), Health Care & Social Assistance (995 | 12.5%), Educational Services (896 | 11.3%), and Retail Trade (543 | 6.8%).
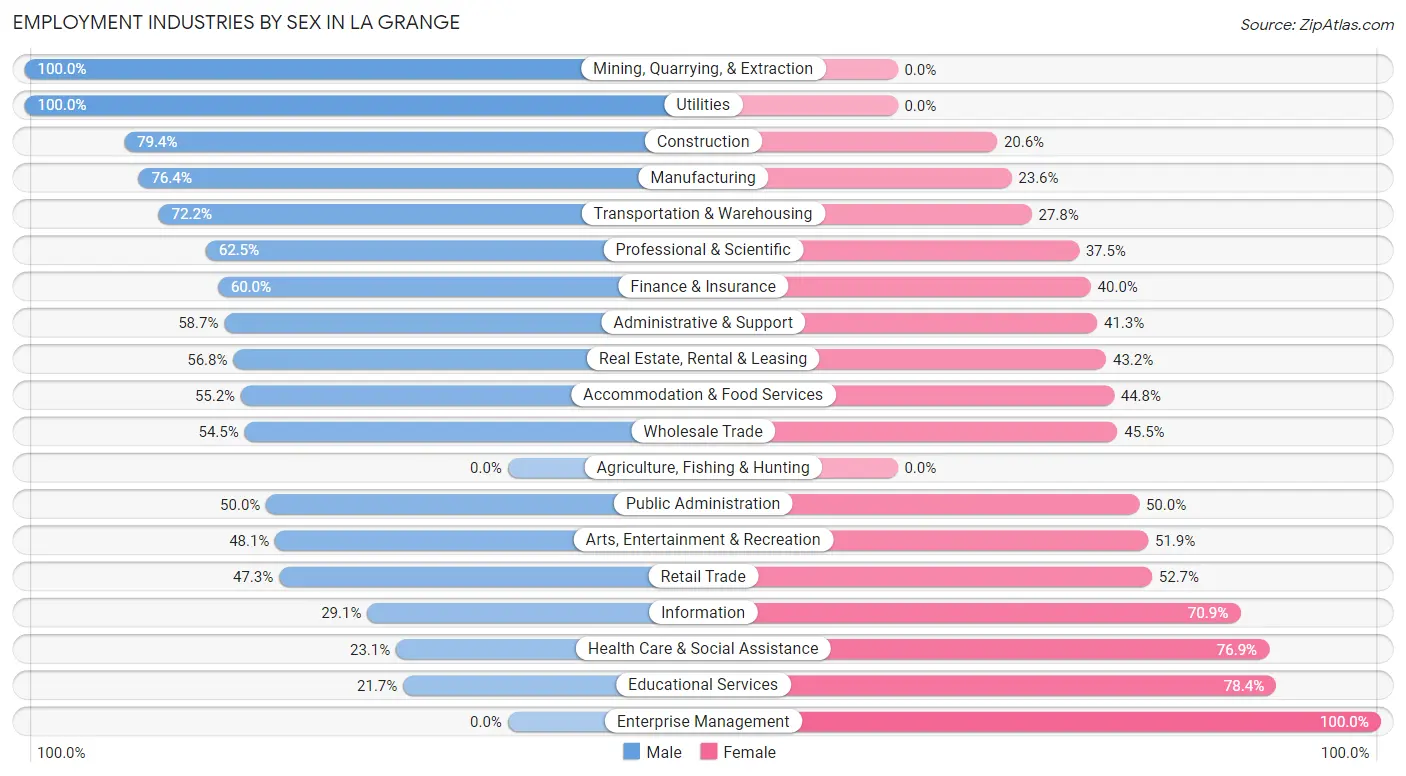
Employment Industries by Sex in La Grange
The La Grange industries that see more men than women are Mining, Quarrying, & Extraction (100.0%), Utilities (100.0%), and Construction (79.4%), whereas the industries that tend to have a higher number of women are Enterprise Management (100.0%), Educational Services (78.3%), and Health Care & Social Assistance (76.9%).
| Industry | Male | Female |
| Agriculture, Fishing & Hunting | 0 (0.0%) | 0 (0.0%) |
| Mining, Quarrying, & Extraction | 11 (100.0%) | 0 (0.0%) |
| Construction | 239 (79.4%) | 62 (20.6%) |
| Manufacturing | 350 (76.4%) | 108 (23.6%) |
| Wholesale Trade | 134 (54.5%) | 112 (45.5%) |
| Retail Trade | 257 (47.3%) | 286 (52.7%) |
| Transportation & Warehousing | 268 (72.2%) | 103 (27.8%) |
| Utilities | 43 (100.0%) | 0 (0.0%) |
| Information | 41 (29.1%) | 100 (70.9%) |
| Finance & Insurance | 639 (60.0%) | 426 (40.0%) |
| Real Estate, Rental & Leasing | 121 (56.8%) | 92 (43.2%) |
| Professional & Scientific | 951 (62.5%) | 571 (37.5%) |
| Enterprise Management | 0 (0.0%) | 40 (100.0%) |
| Administrative & Support | 98 (58.7%) | 69 (41.3%) |
| Educational Services | 194 (21.6%) | 702 (78.3%) |
| Health Care & Social Assistance | 230 (23.1%) | 765 (76.9%) |
| Arts, Entertainment & Recreation | 103 (48.1%) | 111 (51.9%) |
| Accommodation & Food Services | 217 (55.2%) | 176 (44.8%) |
| Public Administration | 71 (50.0%) | 71 (50.0%) |
| Total | 4,038 (50.8%) | 3,903 (49.1%) |
Education in La Grange
School Enrollment in La Grange
The most common levels of schooling among the 4,581 students in La Grange are middle school (1,269 | 27.7%), high school (1,210 | 26.4%), and elementary school (1,066 | 23.3%).
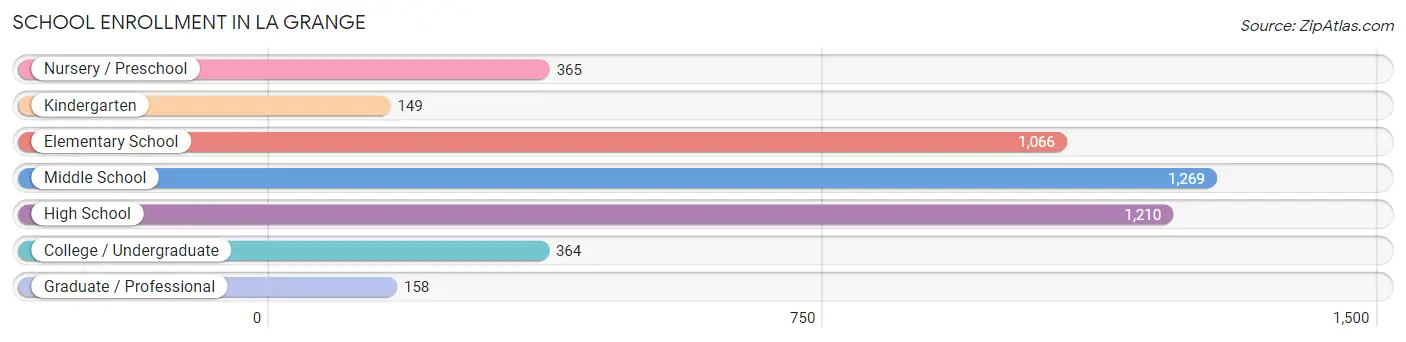
| School Level | # Students | % Students |
| Nursery / Preschool | 365 | 8.0% |
| Kindergarten | 149 | 3.3% |
| Elementary School | 1,066 | 23.3% |
| Middle School | 1,269 | 27.7% |
| High School | 1,210 | 26.4% |
| College / Undergraduate | 364 | 8.0% |
| Graduate / Professional | 158 | 3.5% |
| Total | 4,581 | 100.0% |
School Enrollment by Age by Funding Source in La Grange
Out of a total of 4,581 students who are enrolled in schools in La Grange, 751 (16.4%) attend a private institution, while the remaining 3,830 (83.6%) are enrolled in public schools. The age group of 3 to 4 year olds has the highest likelihood of being enrolled in private schools, with 202 (67.1% in the age bracket) enrolled. Conversely, the age group of 25 to 34 year olds has the lowest likelihood of being enrolled in a private school, with 49 (100.0% in the age bracket) attending a public institution.
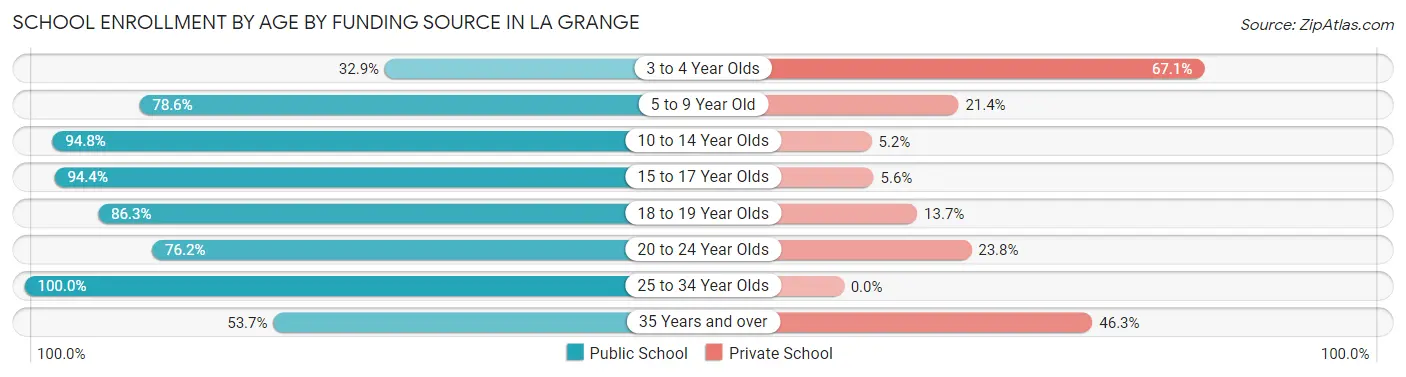
| Age Bracket | Public School | Private School |
| 3 to 4 Year Olds | 99 (32.9%) | 202 (67.1%) |
| 5 to 9 Year Old | 912 (78.6%) | 248 (21.4%) |
| 10 to 14 Year Olds | 1,407 (94.8%) | 77 (5.2%) |
| 15 to 17 Year Olds | 881 (94.4%) | 52 (5.6%) |
| 18 to 19 Year Olds | 208 (86.3%) | 33 (13.7%) |
| 20 to 24 Year Olds | 170 (76.2%) | 53 (23.8%) |
| 25 to 34 Year Olds | 49 (100.0%) | 0 (0.0%) |
| 35 Years and over | 102 (53.7%) | 88 (46.3%) |
| Total | 3,830 (83.6%) | 751 (16.4%) |
Educational Attainment by Field of Study in La Grange
Business (1,775 | 25.0%), education (901 | 12.7%), social sciences (767 | 10.8%), science & technology (757 | 10.7%), and communications (499 | 7.0%) are the most common fields of study among 7,101 individuals in La Grange who have obtained a bachelor's degree or higher.
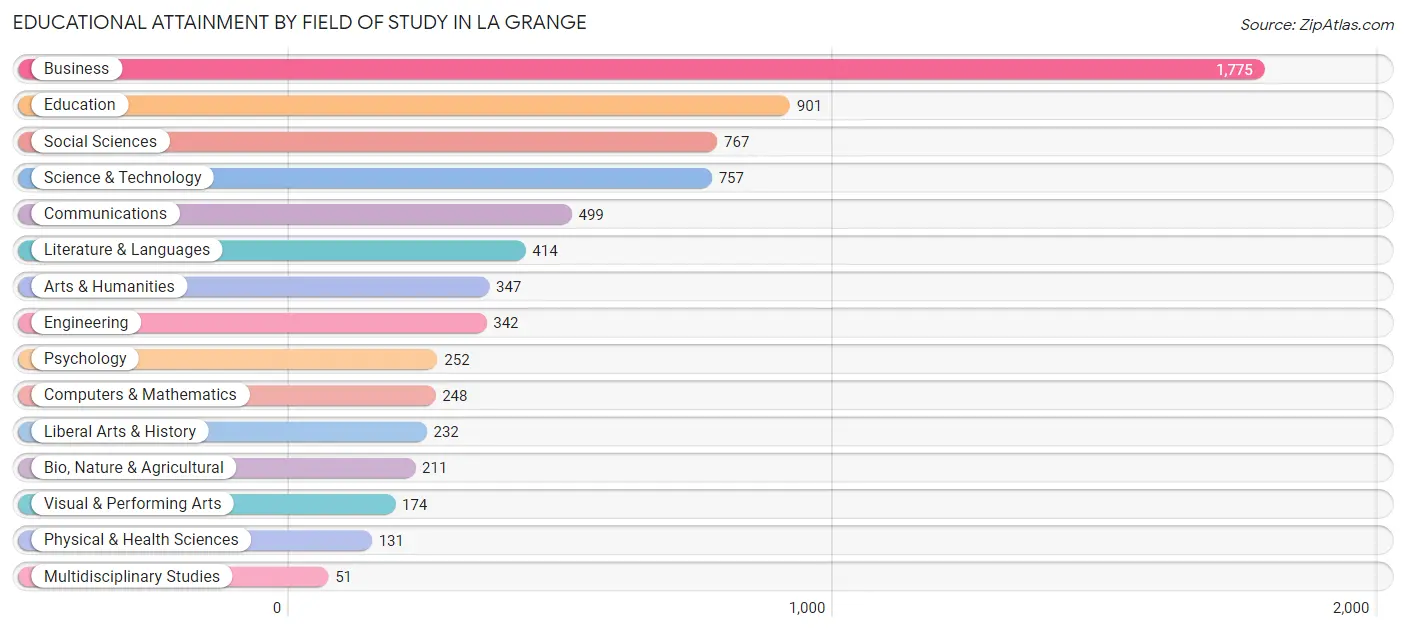
| Field of Study | # Graduates | % Graduates |
| Computers & Mathematics | 248 | 3.5% |
| Bio, Nature & Agricultural | 211 | 3.0% |
| Physical & Health Sciences | 131 | 1.8% |
| Psychology | 252 | 3.5% |
| Social Sciences | 767 | 10.8% |
| Engineering | 342 | 4.8% |
| Multidisciplinary Studies | 51 | 0.7% |
| Science & Technology | 757 | 10.7% |
| Business | 1,775 | 25.0% |
| Education | 901 | 12.7% |
| Literature & Languages | 414 | 5.8% |
| Liberal Arts & History | 232 | 3.3% |
| Visual & Performing Arts | 174 | 2.5% |
| Communications | 499 | 7.0% |
| Arts & Humanities | 347 | 4.9% |
| Total | 7,101 | 100.0% |
Transportation & Commute in La Grange
Vehicle Availability by Sex in La Grange
The most prevalent vehicle ownership categories in La Grange are males with 2 vehicles (2,318, accounting for 58.7%) and females with 2 vehicles (2,139, making up 61.2%).
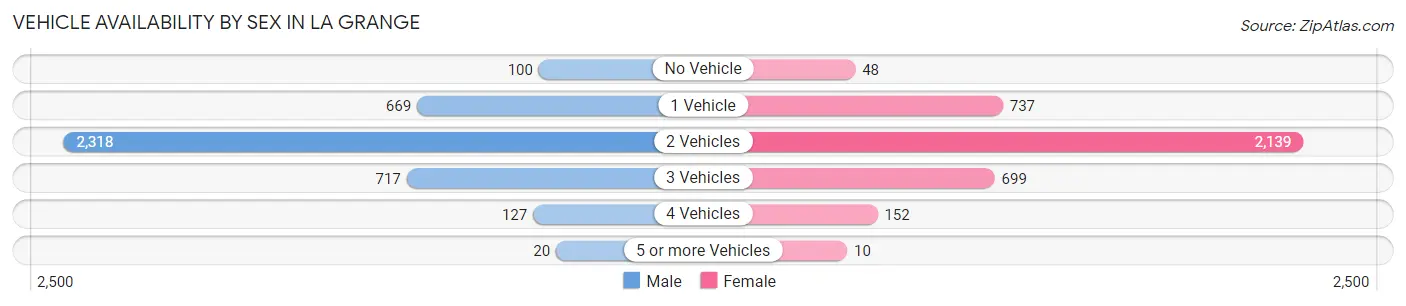
| Vehicles Available | Male | Female |
| No Vehicle | 100 (2.5%) | 48 (1.3%) |
| 1 Vehicle | 669 (16.9%) | 737 (19.5%) |
| 2 Vehicles | 2,318 (58.7%) | 2,139 (56.5%) |
| 3 Vehicles | 717 (18.1%) | 699 (18.5%) |
| 4 Vehicles | 127 (3.2%) | 152 (4.0%) |
| 5 or more Vehicles | 20 (0.5%) | 10 (0.3%) |
| Total | 3,951 (100.0%) | 3,785 (100.0%) |
Commute Time in La Grange
The most frequently occuring commute durations in La Grange are 30 to 34 minutes (960 commuters, 15.9%), 45 to 59 minutes (793 commuters, 13.1%), and 20 to 24 minutes (791 commuters, 13.1%).
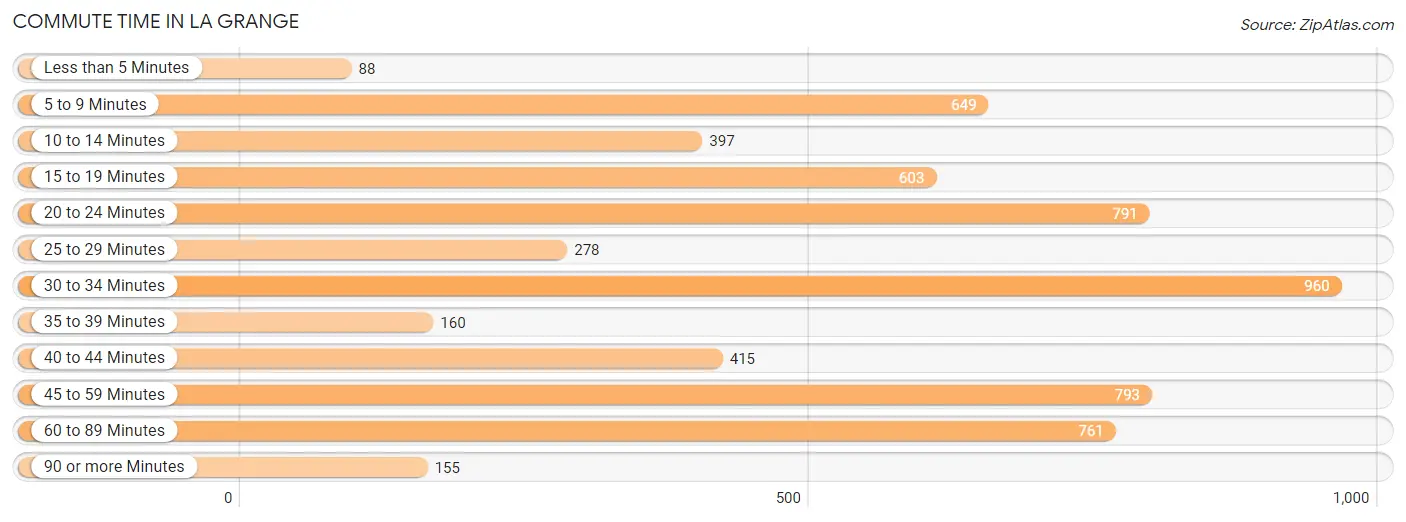
| Commute Time | # Commuters | % Commuters |
| Less than 5 Minutes | 88 | 1.5% |
| 5 to 9 Minutes | 649 | 10.7% |
| 10 to 14 Minutes | 397 | 6.6% |
| 15 to 19 Minutes | 603 | 10.0% |
| 20 to 24 Minutes | 791 | 13.1% |
| 25 to 29 Minutes | 278 | 4.6% |
| 30 to 34 Minutes | 960 | 15.9% |
| 35 to 39 Minutes | 160 | 2.6% |
| 40 to 44 Minutes | 415 | 6.9% |
| 45 to 59 Minutes | 793 | 13.1% |
| 60 to 89 Minutes | 761 | 12.6% |
| 90 or more Minutes | 155 | 2.6% |
Commute Time by Sex in La Grange
The most common commute times in La Grange are 30 to 34 minutes (624 commuters, 20.1%) for males and 20 to 24 minutes (438 commuters, 14.8%) for females.
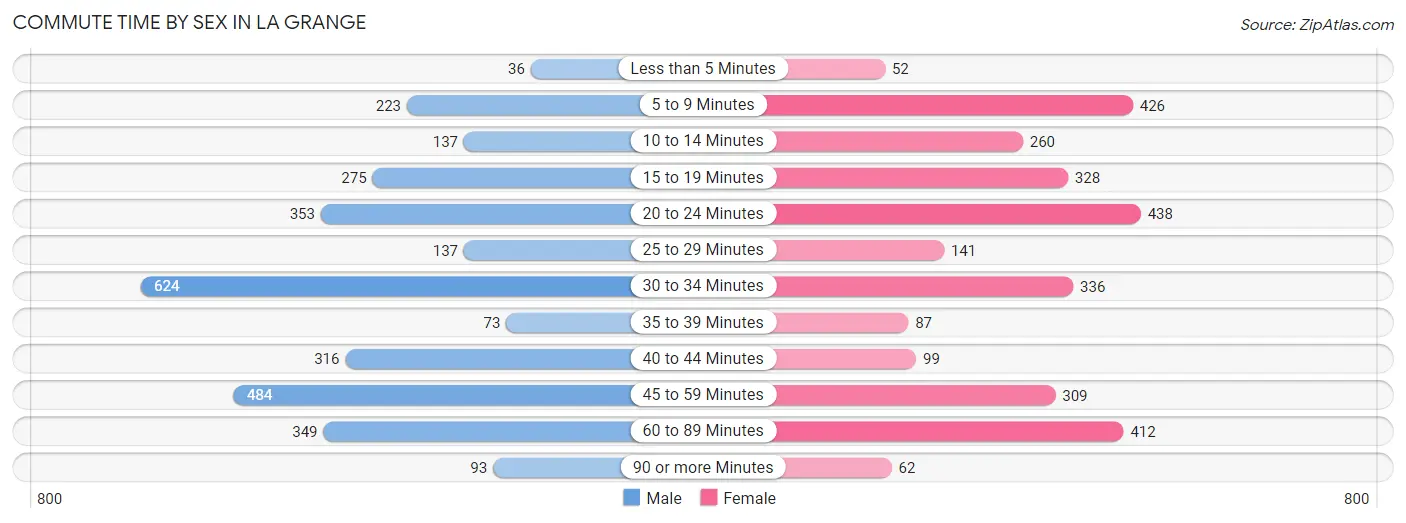
| Commute Time | Male | Female |
| Less than 5 Minutes | 36 (1.2%) | 52 (1.8%) |
| 5 to 9 Minutes | 223 (7.2%) | 426 (14.4%) |
| 10 to 14 Minutes | 137 (4.4%) | 260 (8.8%) |
| 15 to 19 Minutes | 275 (8.9%) | 328 (11.1%) |
| 20 to 24 Minutes | 353 (11.4%) | 438 (14.8%) |
| 25 to 29 Minutes | 137 (4.4%) | 141 (4.8%) |
| 30 to 34 Minutes | 624 (20.1%) | 336 (11.4%) |
| 35 to 39 Minutes | 73 (2.4%) | 87 (2.9%) |
| 40 to 44 Minutes | 316 (10.2%) | 99 (3.4%) |
| 45 to 59 Minutes | 484 (15.6%) | 309 (10.5%) |
| 60 to 89 Minutes | 349 (11.3%) | 412 (14.0%) |
| 90 or more Minutes | 93 (3.0%) | 62 (2.1%) |
Time of Departure to Work by Sex in La Grange
The most frequent times of departure to work in La Grange are 7:00 AM to 7:29 AM (607, 19.6%) for males and 7:30 AM to 7:59 AM (523, 17.7%) for females.
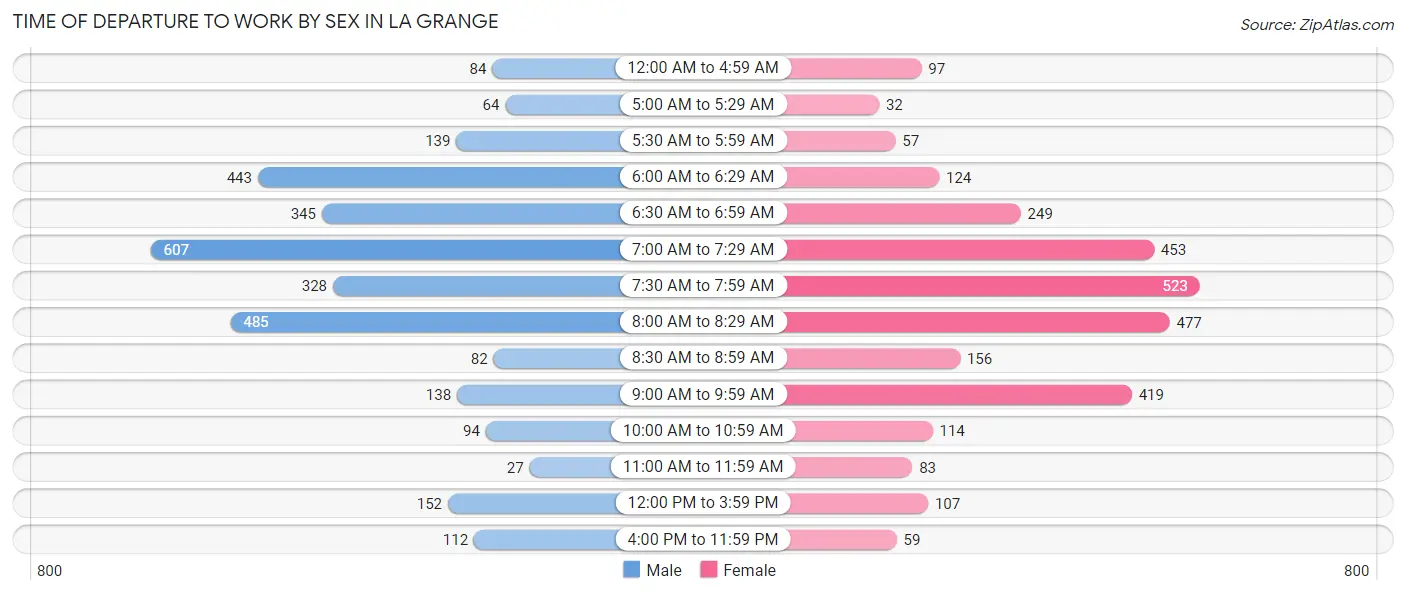
| Time of Departure | Male | Female |
| 12:00 AM to 4:59 AM | 84 (2.7%) | 97 (3.3%) |
| 5:00 AM to 5:29 AM | 64 (2.1%) | 32 (1.1%) |
| 5:30 AM to 5:59 AM | 139 (4.5%) | 57 (1.9%) |
| 6:00 AM to 6:29 AM | 443 (14.3%) | 124 (4.2%) |
| 6:30 AM to 6:59 AM | 345 (11.1%) | 249 (8.4%) |
| 7:00 AM to 7:29 AM | 607 (19.6%) | 453 (15.4%) |
| 7:30 AM to 7:59 AM | 328 (10.6%) | 523 (17.7%) |
| 8:00 AM to 8:29 AM | 485 (15.7%) | 477 (16.2%) |
| 8:30 AM to 8:59 AM | 82 (2.6%) | 156 (5.3%) |
| 9:00 AM to 9:59 AM | 138 (4.4%) | 419 (14.2%) |
| 10:00 AM to 10:59 AM | 94 (3.0%) | 114 (3.9%) |
| 11:00 AM to 11:59 AM | 27 (0.9%) | 83 (2.8%) |
| 12:00 PM to 3:59 PM | 152 (4.9%) | 107 (3.6%) |
| 4:00 PM to 11:59 PM | 112 (3.6%) | 59 (2.0%) |
| Total | 3,100 (100.0%) | 2,950 (100.0%) |
Housing Occupancy in La Grange
Occupancy by Ownership in La Grange
Of the total 5,791 dwellings in La Grange, owner-occupied units account for 4,756 (82.1%), while renter-occupied units make up 1,035 (17.9%).
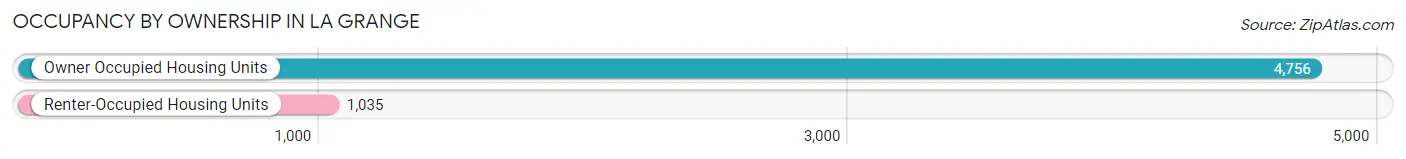
| Occupancy | # Housing Units | % Housing Units |
| Owner Occupied Housing Units | 4,756 | 82.1% |
| Renter-Occupied Housing Units | 1,035 | 17.9% |
| Total Occupied Housing Units | 5,791 | 100.0% |
Occupancy by Household Size in La Grange
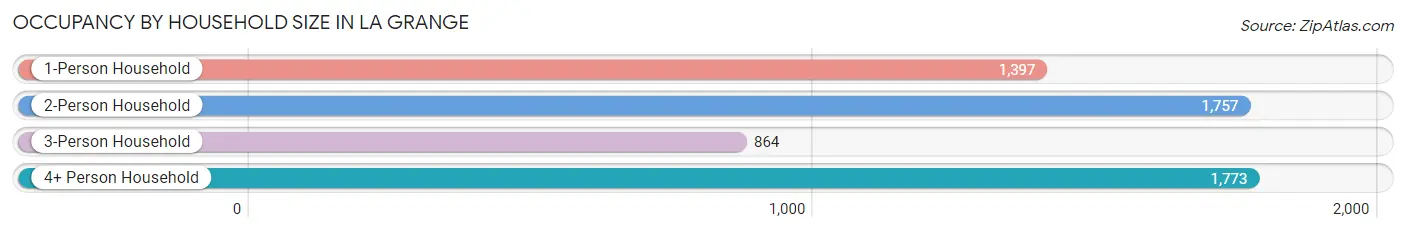
| Household Size | # Housing Units | % Housing Units |
| 1-Person Household | 1,397 | 24.1% |
| 2-Person Household | 1,757 | 30.3% |
| 3-Person Household | 864 | 14.9% |
| 4+ Person Household | 1,773 | 30.6% |
| Total Housing Units | 5,791 | 100.0% |
Occupancy by Ownership by Household Size in La Grange
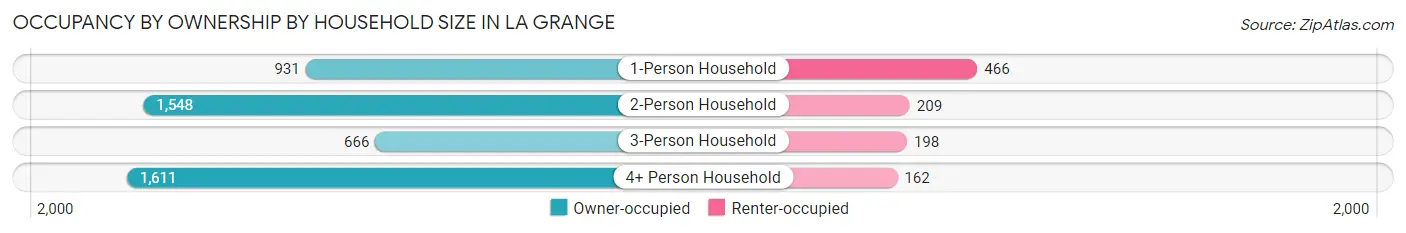
| Household Size | Owner-occupied | Renter-occupied |
| 1-Person Household | 931 (66.6%) | 466 (33.4%) |
| 2-Person Household | 1,548 (88.1%) | 209 (11.9%) |
| 3-Person Household | 666 (77.1%) | 198 (22.9%) |
| 4+ Person Household | 1,611 (90.9%) | 162 (9.1%) |
| Total Housing Units | 4,756 (82.1%) | 1,035 (17.9%) |
Occupancy by Educational Attainment in La Grange
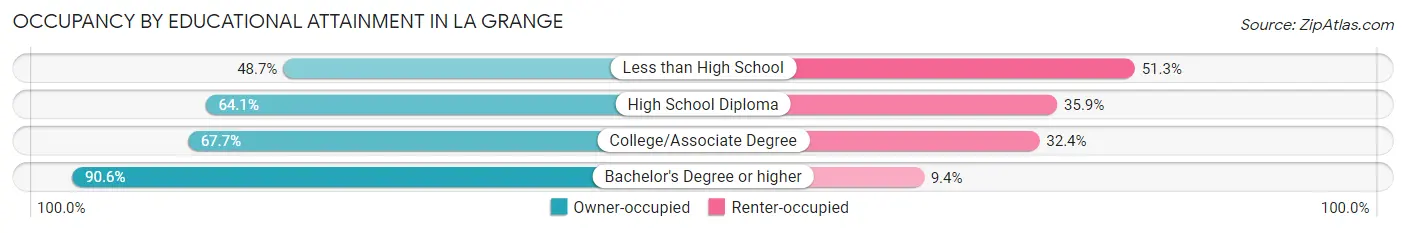
| Household Size | Owner-occupied | Renter-occupied |
| Less than High School | 77 (48.7%) | 81 (51.3%) |
| High School Diploma | 345 (64.1%) | 193 (35.9%) |
| College/Associate Degree | 828 (67.6%) | 396 (32.4%) |
| Bachelor's Degree or higher | 3,506 (90.6%) | 365 (9.4%) |
Occupancy by Age of Householder in La Grange
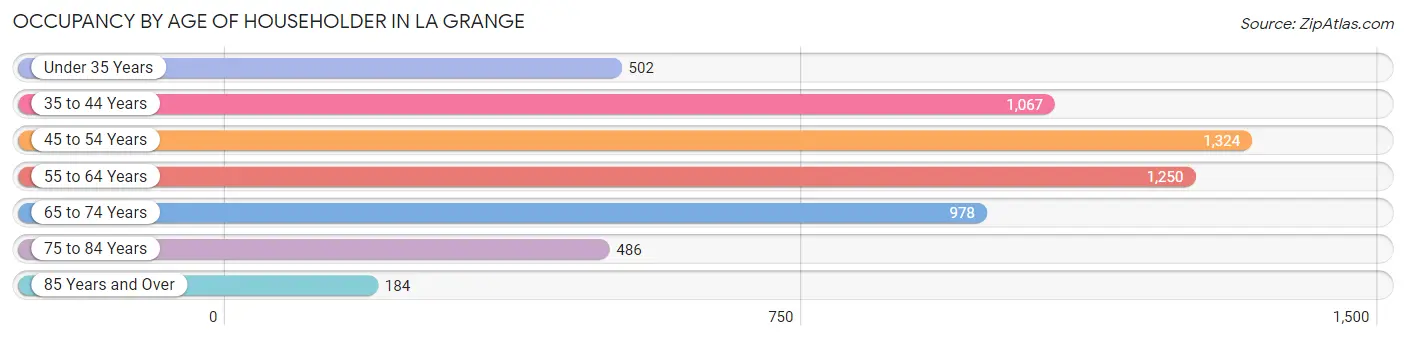
| Age Bracket | # Households | % Households |
| Under 35 Years | 502 | 8.7% |
| 35 to 44 Years | 1,067 | 18.4% |
| 45 to 54 Years | 1,324 | 22.9% |
| 55 to 64 Years | 1,250 | 21.6% |
| 65 to 74 Years | 978 | 16.9% |
| 75 to 84 Years | 486 | 8.4% |
| 85 Years and Over | 184 | 3.2% |
| Total | 5,791 | 100.0% |
Housing Finances in La Grange
Median Income by Occupancy in La Grange
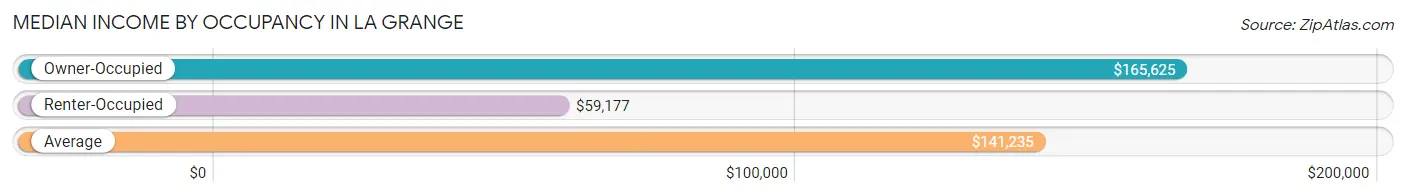
| Occupancy Type | # Households | Median Income |
| Owner-Occupied | 4,756 (82.1%) | $165,625 |
| Renter-Occupied | 1,035 (17.9%) | $59,177 |
| Average | 5,791 (100.0%) | $141,235 |
Occupancy by Householder Income Bracket in La Grange
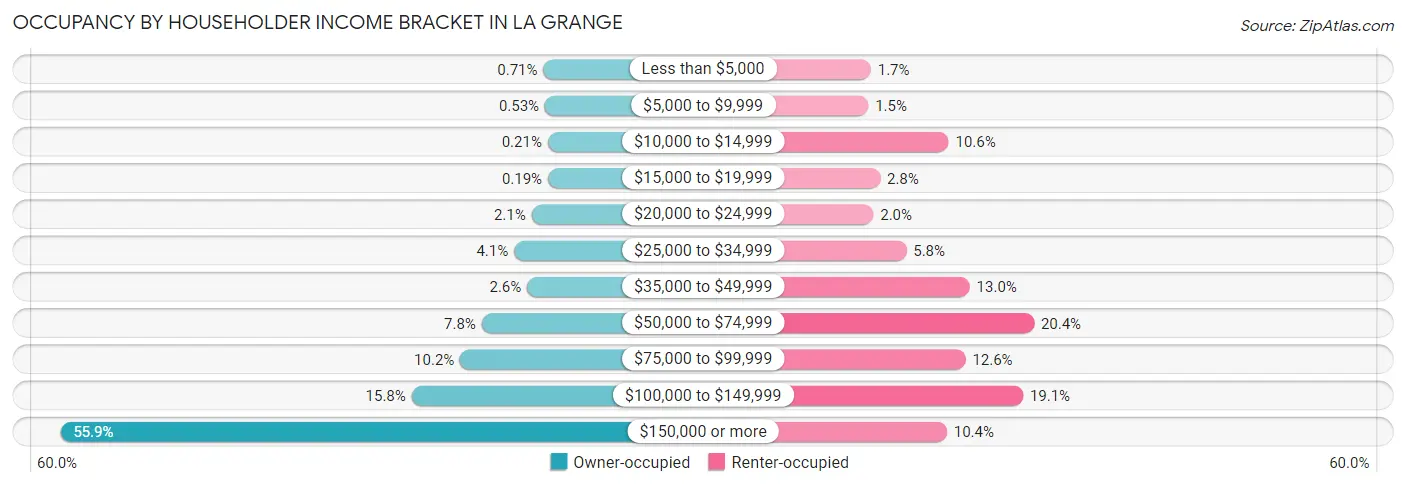
| Income Bracket | Owner-occupied | Renter-occupied |
| Less than $5,000 | 34 (0.7%) | 18 (1.7%) |
| $5,000 to $9,999 | 25 (0.5%) | 15 (1.5%) |
| $10,000 to $14,999 | 10 (0.2%) | 110 (10.6%) |
| $15,000 to $19,999 | 9 (0.2%) | 29 (2.8%) |
| $20,000 to $24,999 | 98 (2.1%) | 21 (2.0%) |
| $25,000 to $34,999 | 193 (4.1%) | 60 (5.8%) |
| $35,000 to $49,999 | 122 (2.6%) | 135 (13.0%) |
| $50,000 to $74,999 | 369 (7.8%) | 211 (20.4%) |
| $75,000 to $99,999 | 486 (10.2%) | 130 (12.6%) |
| $100,000 to $149,999 | 750 (15.8%) | 198 (19.1%) |
| $150,000 or more | 2,660 (55.9%) | 108 (10.4%) |
| Total | 4,756 (100.0%) | 1,035 (100.0%) |
Monthly Housing Cost Tiers in La Grange
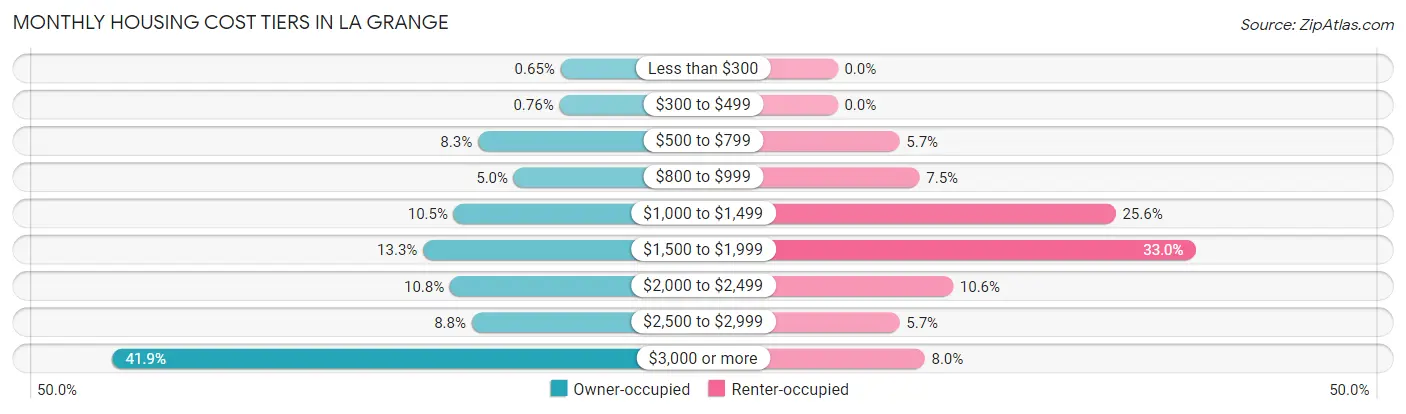
| Monthly Cost | Owner-occupied | Renter-occupied |
| Less than $300 | 31 (0.6%) | 0 (0.0%) |
| $300 to $499 | 36 (0.8%) | 0 (0.0%) |
| $500 to $799 | 393 (8.3%) | 59 (5.7%) |
| $800 to $999 | 236 (5.0%) | 78 (7.5%) |
| $1,000 to $1,499 | 499 (10.5%) | 265 (25.6%) |
| $1,500 to $1,999 | 633 (13.3%) | 341 (33.0%) |
| $2,000 to $2,499 | 515 (10.8%) | 110 (10.6%) |
| $2,500 to $2,999 | 420 (8.8%) | 59 (5.7%) |
| $3,000 or more | 1,993 (41.9%) | 83 (8.0%) |
| Total | 4,756 (100.0%) | 1,035 (100.0%) |
Physical Housing Characteristics in La Grange
Housing Structures in La Grange
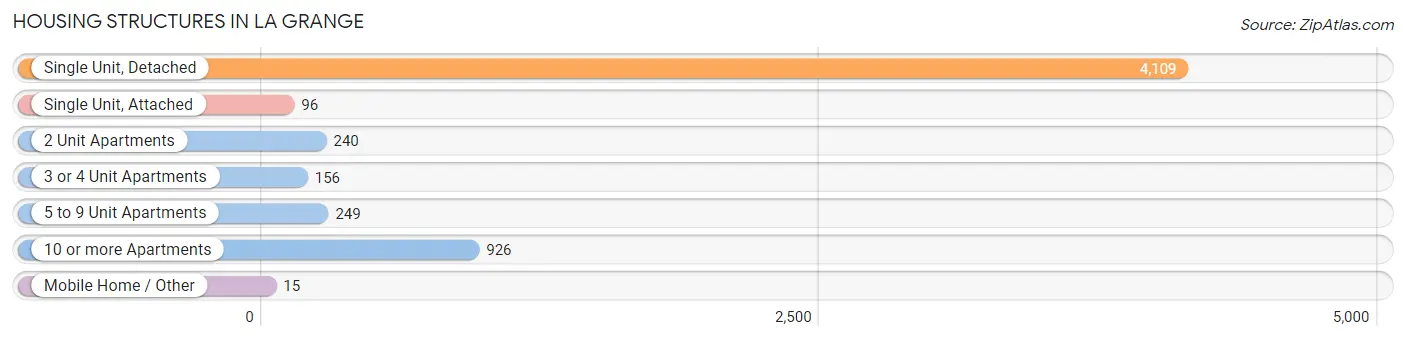
| Structure Type | # Housing Units | % Housing Units |
| Single Unit, Detached | 4,109 | 71.0% |
| Single Unit, Attached | 96 | 1.7% |
| 2 Unit Apartments | 240 | 4.1% |
| 3 or 4 Unit Apartments | 156 | 2.7% |
| 5 to 9 Unit Apartments | 249 | 4.3% |
| 10 or more Apartments | 926 | 16.0% |
| Mobile Home / Other | 15 | 0.3% |
| Total | 5,791 | 100.0% |
Housing Structures by Occupancy in La Grange
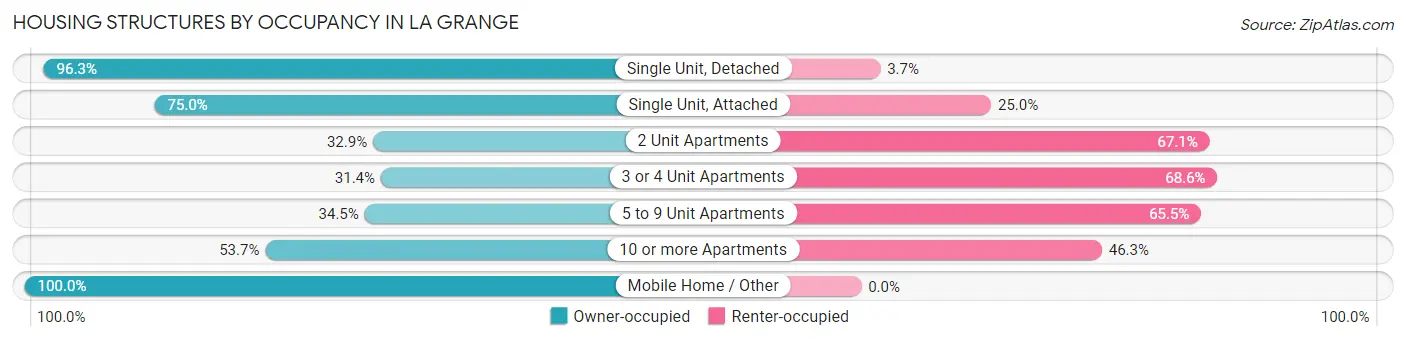
| Structure Type | Owner-occupied | Renter-occupied |
| Single Unit, Detached | 3,958 (96.3%) | 151 (3.7%) |
| Single Unit, Attached | 72 (75.0%) | 24 (25.0%) |
| 2 Unit Apartments | 79 (32.9%) | 161 (67.1%) |
| 3 or 4 Unit Apartments | 49 (31.4%) | 107 (68.6%) |
| 5 to 9 Unit Apartments | 86 (34.5%) | 163 (65.5%) |
| 10 or more Apartments | 497 (53.7%) | 429 (46.3%) |
| Mobile Home / Other | 15 (100.0%) | 0 (0.0%) |
| Total | 4,756 (82.1%) | 1,035 (17.9%) |
Housing Structures by Number of Rooms in La Grange
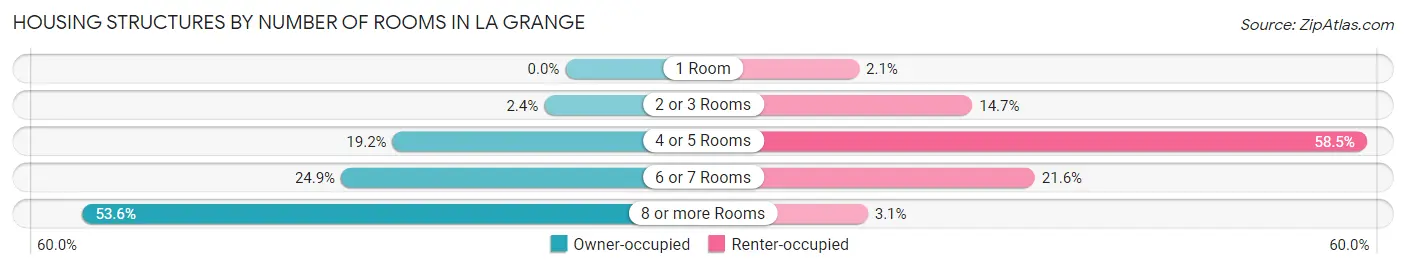
| Number of Rooms | Owner-occupied | Renter-occupied |
| 1 Room | 0 (0.0%) | 22 (2.1%) |
| 2 or 3 Rooms | 112 (2.4%) | 152 (14.7%) |
| 4 or 5 Rooms | 912 (19.2%) | 605 (58.5%) |
| 6 or 7 Rooms | 1,184 (24.9%) | 224 (21.6%) |
| 8 or more Rooms | 2,548 (53.6%) | 32 (3.1%) |
| Total | 4,756 (100.0%) | 1,035 (100.0%) |
Housing Structure by Heating Type in La Grange
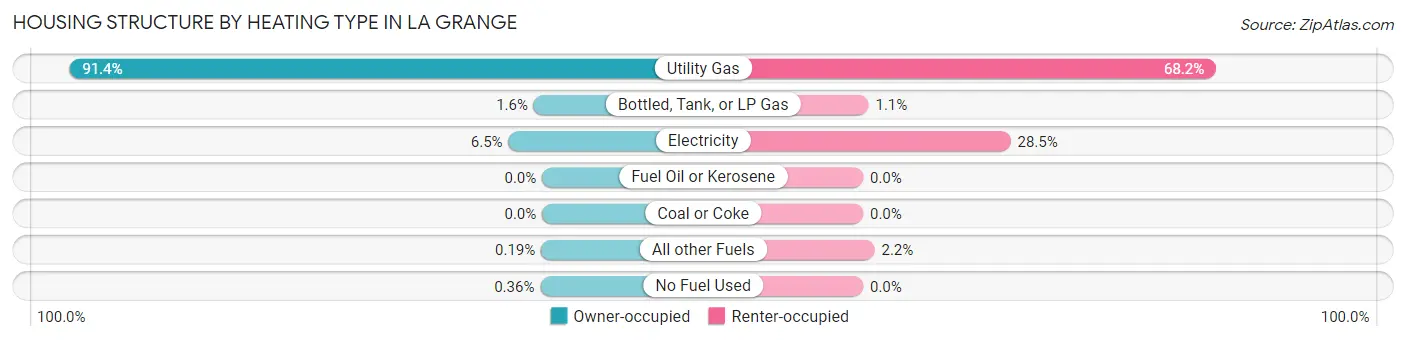
| Heating Type | Owner-occupied | Renter-occupied |
| Utility Gas | 4,345 (91.4%) | 706 (68.2%) |
| Bottled, Tank, or LP Gas | 76 (1.6%) | 11 (1.1%) |
| Electricity | 309 (6.5%) | 295 (28.5%) |
| Fuel Oil or Kerosene | 0 (0.0%) | 0 (0.0%) |
| Coal or Coke | 0 (0.0%) | 0 (0.0%) |
| All other Fuels | 9 (0.2%) | 23 (2.2%) |
| No Fuel Used | 17 (0.4%) | 0 (0.0%) |
| Total | 4,756 (100.0%) | 1,035 (100.0%) |
Household Vehicle Usage in La Grange
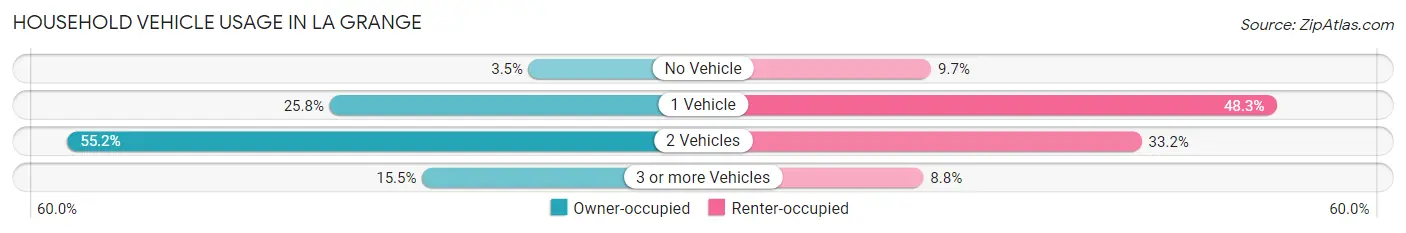
| Vehicles per Household | Owner-occupied | Renter-occupied |
| No Vehicle | 167 (3.5%) | 100 (9.7%) |
| 1 Vehicle | 1,228 (25.8%) | 500 (48.3%) |
| 2 Vehicles | 2,626 (55.2%) | 344 (33.2%) |
| 3 or more Vehicles | 735 (15.4%) | 91 (8.8%) |
| Total | 4,756 (100.0%) | 1,035 (100.0%) |
Real Estate & Mortgages in La Grange
Real Estate and Mortgage Overview in La Grange
| Characteristic | Without Mortgage | With Mortgage |
| Housing Units | 1,573 | 3,183 |
| Median Property Value | $422,000 | $620,500 |
| Median Household Income | $91,607 | $2,162 |
| Monthly Housing Costs | $1,179 | $1,942 |
| Real Estate Taxes | $8,551 | $18 |
Property Value by Mortgage Status in La Grange
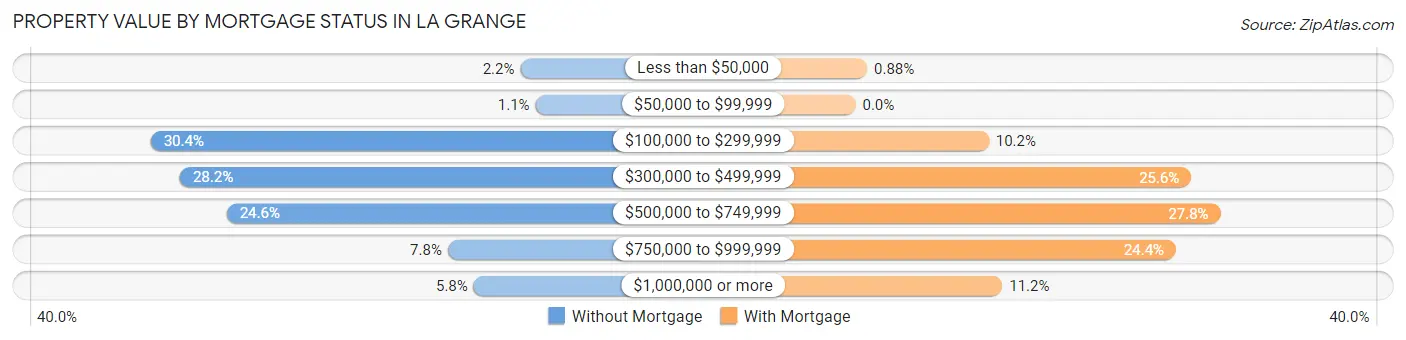
| Property Value | Without Mortgage | With Mortgage |
| Less than $50,000 | 35 (2.2%) | 28 (0.9%) |
| $50,000 to $99,999 | 17 (1.1%) | 0 (0.0%) |
| $100,000 to $299,999 | 478 (30.4%) | 323 (10.2%) |
| $300,000 to $499,999 | 443 (28.2%) | 814 (25.6%) |
| $500,000 to $749,999 | 387 (24.6%) | 885 (27.8%) |
| $750,000 to $999,999 | 122 (7.8%) | 777 (24.4%) |
| $1,000,000 or more | 91 (5.8%) | 356 (11.2%) |
| Total | 1,573 (100.0%) | 3,183 (100.0%) |
Household Income by Mortgage Status in La Grange
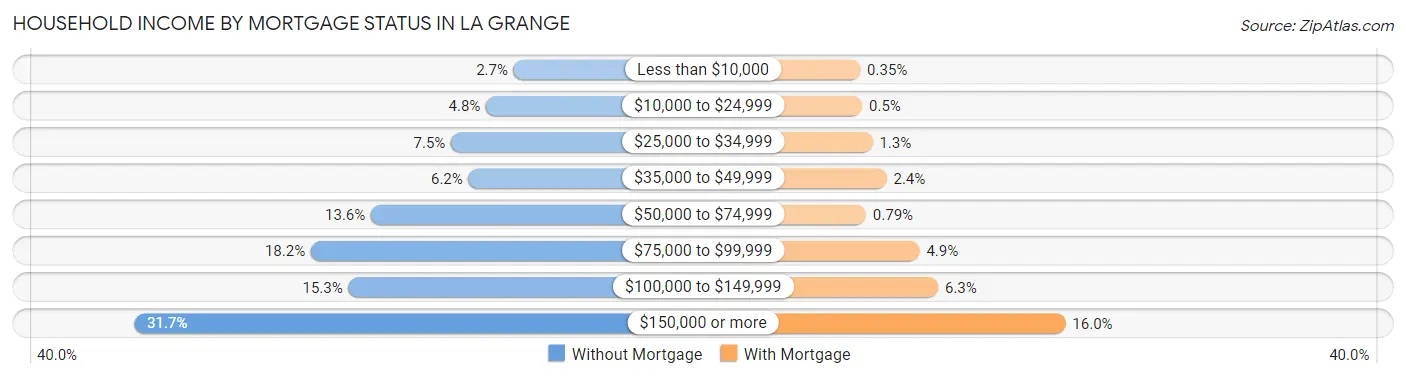
| Household Income | Without Mortgage | With Mortgage |
| Less than $10,000 | 43 (2.7%) | 11 (0.4%) |
| $10,000 to $24,999 | 76 (4.8%) | 16 (0.5%) |
| $25,000 to $34,999 | 118 (7.5%) | 41 (1.3%) |
| $35,000 to $49,999 | 97 (6.2%) | 75 (2.4%) |
| $50,000 to $74,999 | 214 (13.6%) | 25 (0.8%) |
| $75,000 to $99,999 | 286 (18.2%) | 155 (4.9%) |
| $100,000 to $149,999 | 241 (15.3%) | 200 (6.3%) |
| $150,000 or more | 498 (31.7%) | 509 (16.0%) |
| Total | 1,573 (100.0%) | 3,183 (100.0%) |
Property Value to Household Income Ratio in La Grange
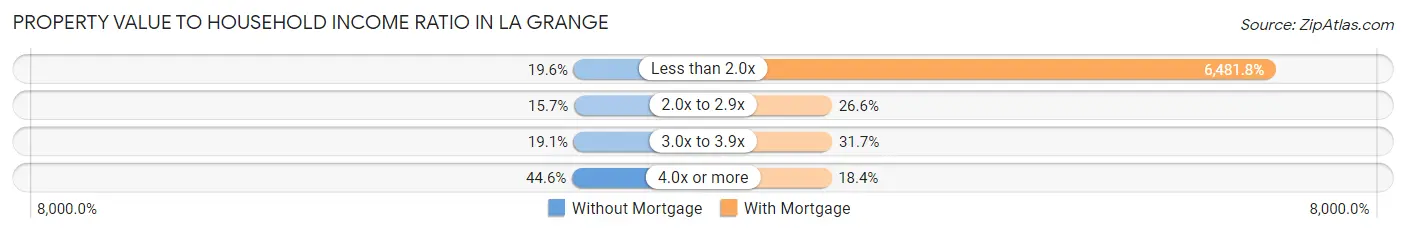
| Value-to-Income Ratio | Without Mortgage | With Mortgage |
| Less than 2.0x | 308 (19.6%) | 206,316 (6,481.8%) |
| 2.0x to 2.9x | 247 (15.7%) | 847 (26.6%) |
| 3.0x to 3.9x | 300 (19.1%) | 1,008 (31.7%) |
| 4.0x or more | 702 (44.6%) | 585 (18.4%) |
| Total | 1,573 (100.0%) | 3,183 (100.0%) |
Real Estate Taxes by Mortgage Status in La Grange
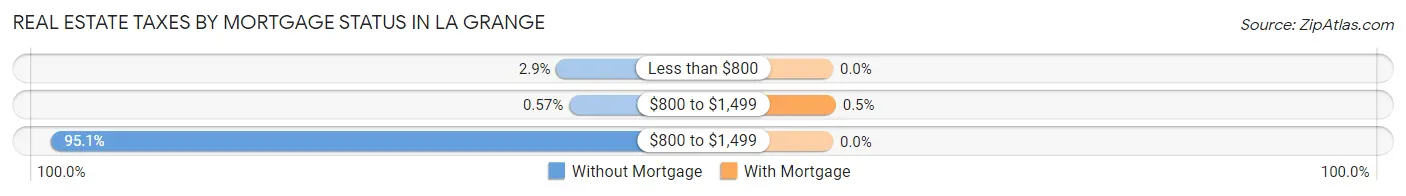
| Property Taxes | Without Mortgage | With Mortgage |
| Less than $800 | 45 (2.9%) | 0 (0.0%) |
| $800 to $1,499 | 9 (0.6%) | 16 (0.5%) |
| $800 to $1,499 | 1,496 (95.1%) | 0 (0.0%) |
| Total | 1,573 (100.0%) | 3,183 (100.0%) |
Health & Disability in La Grange
Health Insurance Coverage by Age in La Grange
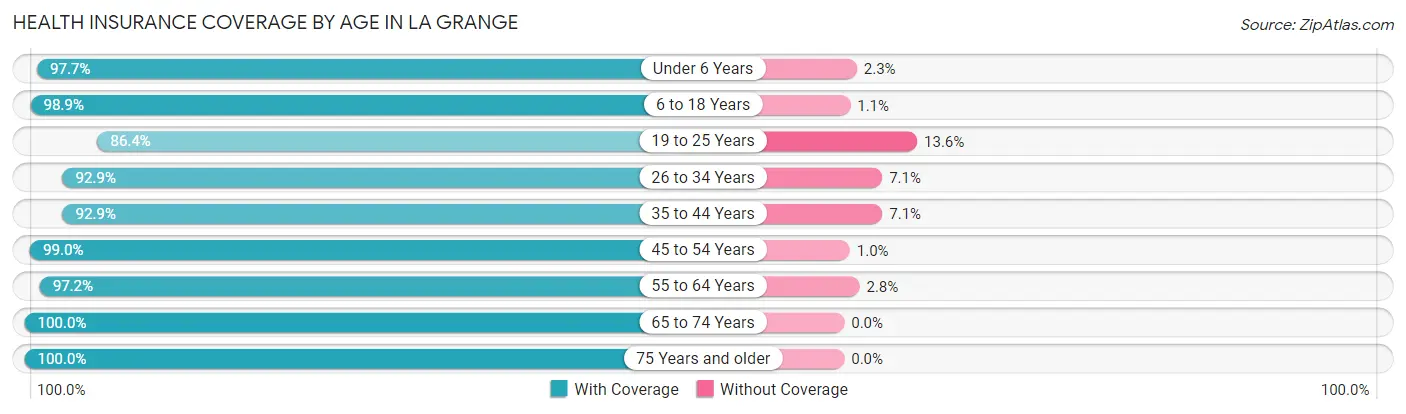
| Age Bracket | With Coverage | Without Coverage |
| Under 6 Years | 1,084 (97.7%) | 26 (2.3%) |
| 6 to 18 Years | 3,633 (98.9%) | 41 (1.1%) |
| 19 to 25 Years | 668 (86.4%) | 105 (13.6%) |
| 26 to 34 Years | 789 (92.9%) | 60 (7.1%) |
| 35 to 44 Years | 2,097 (92.9%) | 160 (7.1%) |
| 45 to 54 Years | 2,478 (99.0%) | 26 (1.0%) |
| 55 to 64 Years | 2,191 (97.2%) | 64 (2.8%) |
| 65 to 74 Years | 1,454 (100.0%) | 0 (0.0%) |
| 75 Years and older | 1,044 (100.0%) | 0 (0.0%) |
| Total | 15,438 (97.0%) | 482 (3.0%) |
Health Insurance Coverage by Citizenship Status in La Grange
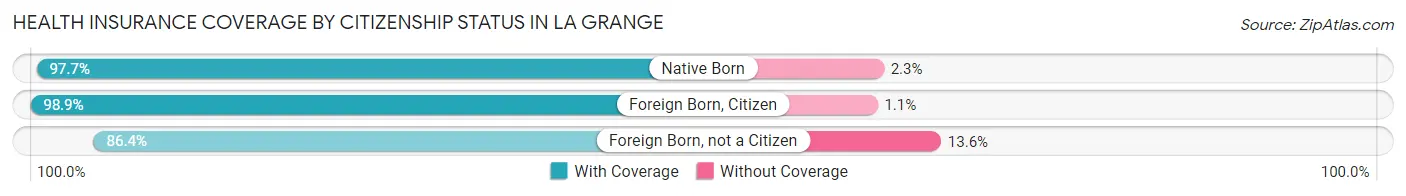
| Citizenship Status | With Coverage | Without Coverage |
| Native Born | 1,084 (97.7%) | 26 (2.3%) |
| Foreign Born, Citizen | 3,633 (98.9%) | 41 (1.1%) |
| Foreign Born, not a Citizen | 668 (86.4%) | 105 (13.6%) |
Health Insurance Coverage by Household Income in La Grange
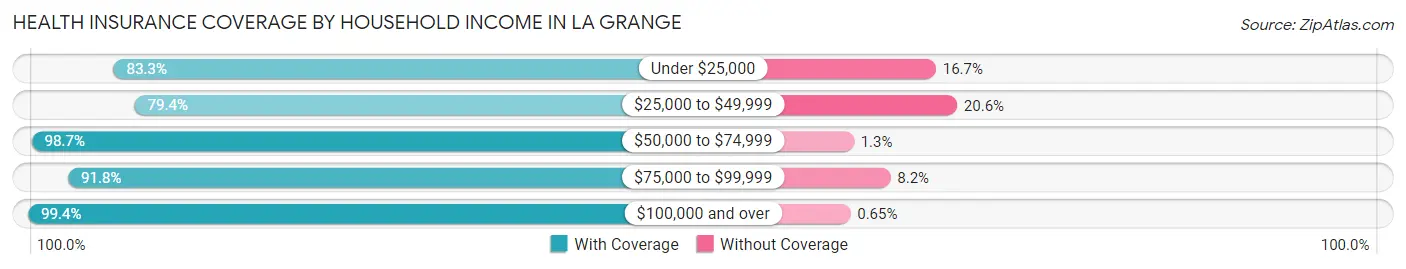
| Household Income | With Coverage | Without Coverage |
| Under $25,000 | 510 (83.3%) | 102 (16.7%) |
| $25,000 to $49,999 | 731 (79.4%) | 190 (20.6%) |
| $50,000 to $74,999 | 1,438 (98.7%) | 19 (1.3%) |
| $75,000 to $99,999 | 1,069 (91.8%) | 95 (8.2%) |
| $100,000 and over | 11,548 (99.4%) | 76 (0.6%) |
Public vs Private Health Insurance Coverage by Age in La Grange
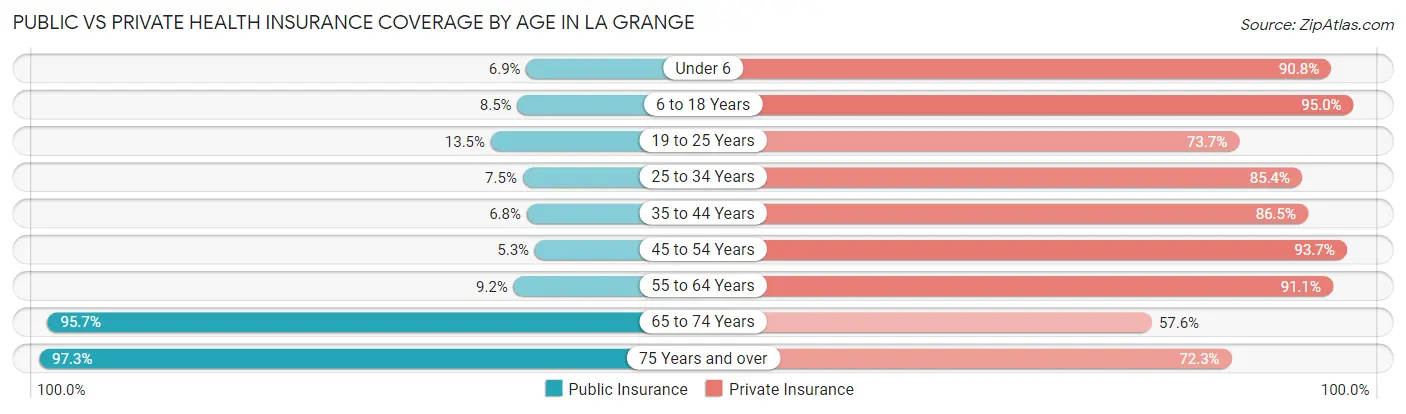
| Age Bracket | Public Insurance | Private Insurance |
| Under 6 | 76 (6.9%) | 1,008 (90.8%) |
| 6 to 18 Years | 313 (8.5%) | 3,489 (95.0%) |
| 19 to 25 Years | 104 (13.5%) | 570 (73.7%) |
| 25 to 34 Years | 64 (7.5%) | 725 (85.4%) |
| 35 to 44 Years | 153 (6.8%) | 1,952 (86.5%) |
| 45 to 54 Years | 132 (5.3%) | 2,346 (93.7%) |
| 55 to 64 Years | 208 (9.2%) | 2,055 (91.1%) |
| 65 to 74 Years | 1,392 (95.7%) | 837 (57.6%) |
| 75 Years and over | 1,016 (97.3%) | 755 (72.3%) |
| Total | 3,458 (21.7%) | 13,737 (86.3%) |
Disability Status by Sex by Age in La Grange
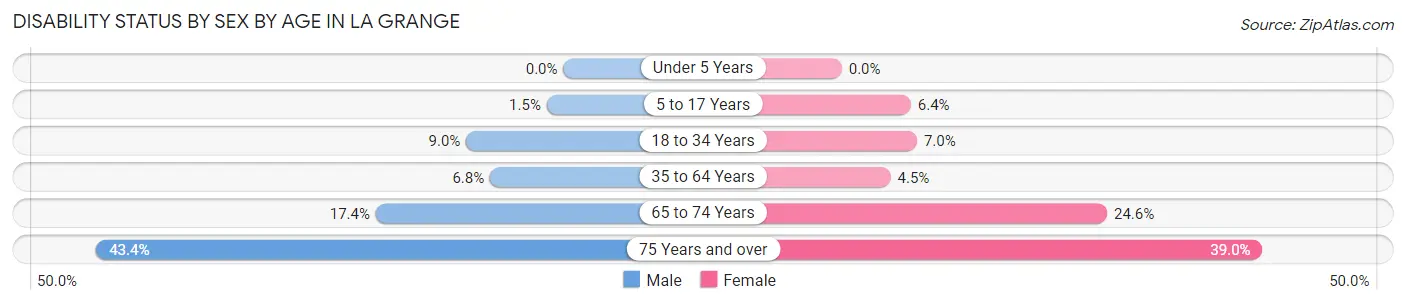
| Age Bracket | Male | Female |
| Under 5 Years | 0 (0.0%) | 0 (0.0%) |
| 5 to 17 Years | 29 (1.5%) | 113 (6.4%) |
| 18 to 34 Years | 78 (9.0%) | 66 (7.0%) |
| 35 to 64 Years | 231 (6.8%) | 164 (4.5%) |
| 65 to 74 Years | 128 (17.4%) | 177 (24.6%) |
| 75 Years and over | 176 (43.3%) | 249 (39.0%) |
Disability Class by Sex by Age in La Grange
Disability Class: Hearing Difficulty
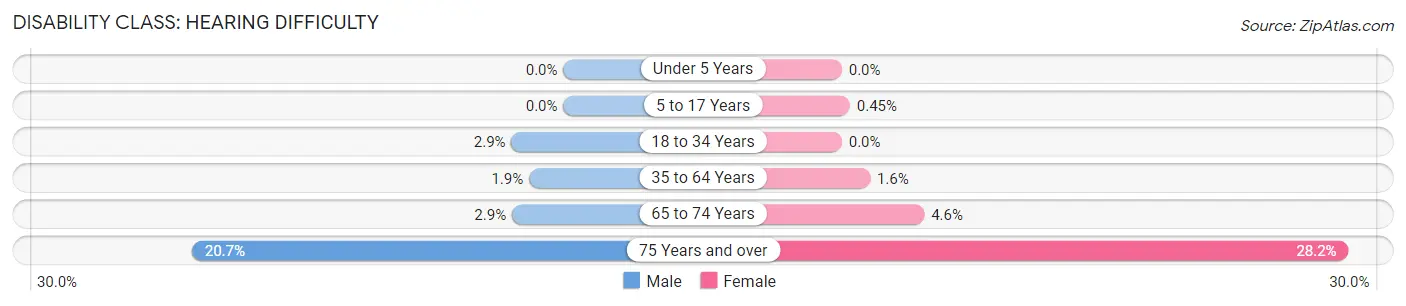
| Age Bracket | Male | Female |
| Under 5 Years | 0 (0.0%) | 0 (0.0%) |
| 5 to 17 Years | 0 (0.0%) | 8 (0.4%) |
| 18 to 34 Years | 25 (2.9%) | 0 (0.0%) |
| 35 to 64 Years | 65 (1.9%) | 57 (1.6%) |
| 65 to 74 Years | 21 (2.9%) | 33 (4.6%) |
| 75 Years and over | 84 (20.7%) | 180 (28.2%) |
Disability Class: Vision Difficulty
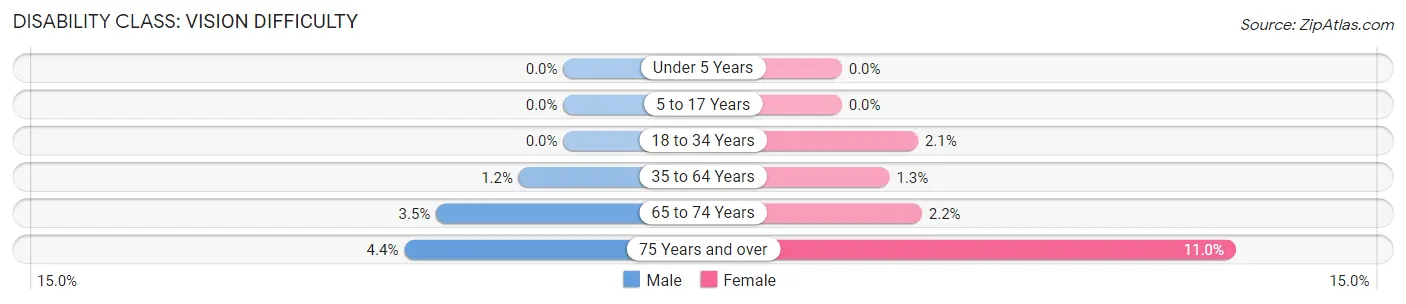
| Age Bracket | Male | Female |
| Under 5 Years | 0 (0.0%) | 0 (0.0%) |
| 5 to 17 Years | 0 (0.0%) | 0 (0.0%) |
| 18 to 34 Years | 0 (0.0%) | 20 (2.1%) |
| 35 to 64 Years | 42 (1.2%) | 48 (1.3%) |
| 65 to 74 Years | 26 (3.5%) | 16 (2.2%) |
| 75 Years and over | 18 (4.4%) | 70 (11.0%) |
Disability Class: Cognitive Difficulty
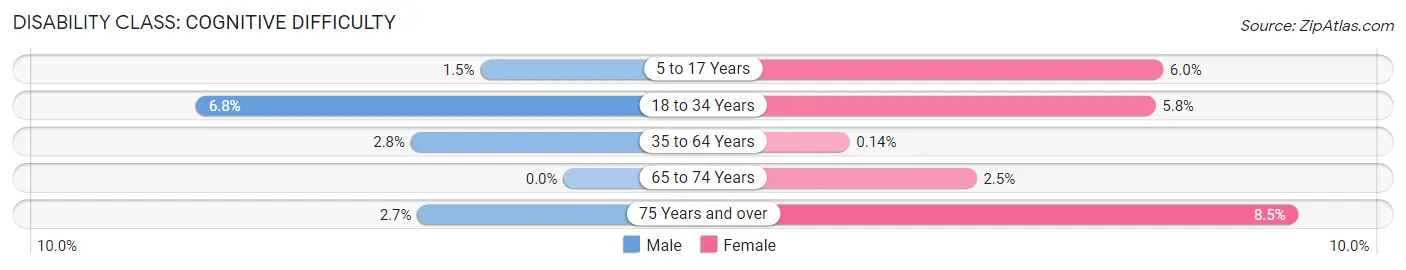
| Age Bracket | Male | Female |
| 5 to 17 Years | 29 (1.5%) | 105 (6.0%) |
| 18 to 34 Years | 59 (6.8%) | 55 (5.8%) |
| 35 to 64 Years | 96 (2.8%) | 5 (0.1%) |
| 65 to 74 Years | 0 (0.0%) | 18 (2.5%) |
| 75 Years and over | 11 (2.7%) | 54 (8.5%) |
Disability Class: Ambulatory Difficulty
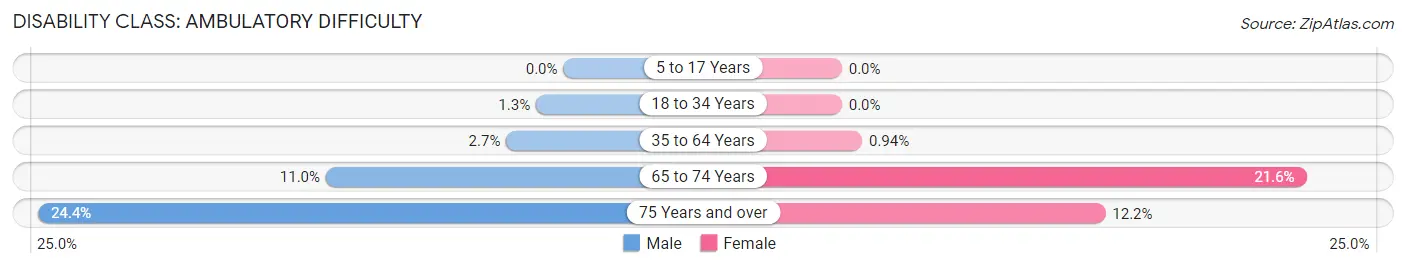
| Age Bracket | Male | Female |
| 5 to 17 Years | 0 (0.0%) | 0 (0.0%) |
| 18 to 34 Years | 11 (1.3%) | 0 (0.0%) |
| 35 to 64 Years | 90 (2.6%) | 34 (0.9%) |
| 65 to 74 Years | 81 (11.0%) | 155 (21.6%) |
| 75 Years and over | 99 (24.4%) | 78 (12.2%) |
Disability Class: Self-Care Difficulty
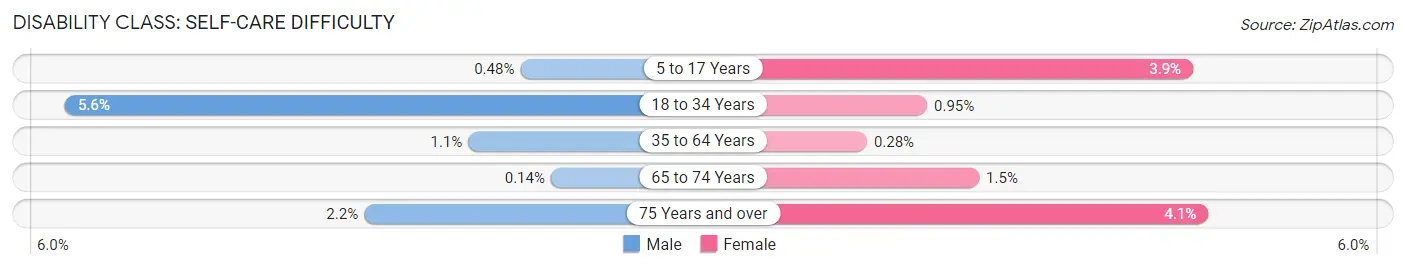
| Age Bracket | Male | Female |
| 5 to 17 Years | 9 (0.5%) | 69 (3.9%) |
| 18 to 34 Years | 48 (5.6%) | 9 (0.9%) |
| 35 to 64 Years | 36 (1.1%) | 10 (0.3%) |
| 65 to 74 Years | 1 (0.1%) | 11 (1.5%) |
| 75 Years and over | 9 (2.2%) | 26 (4.1%) |
Technology Access in La Grange
Computing Device Access in La Grange
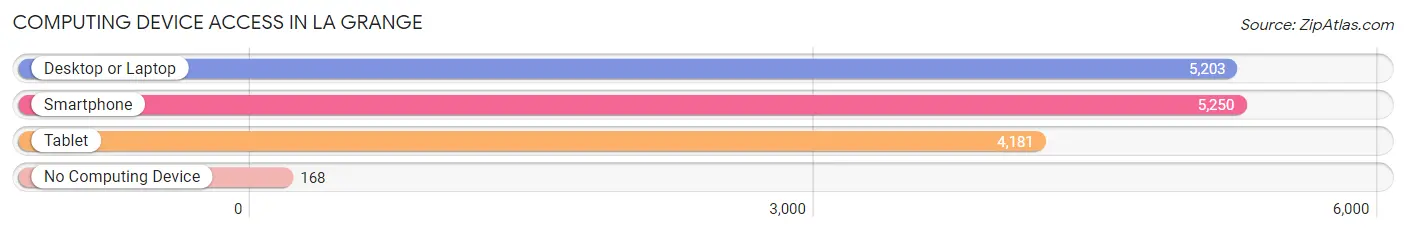
| Device Type | # Households | % Households |
| Desktop or Laptop | 5,203 | 89.8% |
| Smartphone | 5,250 | 90.7% |
| Tablet | 4,181 | 72.2% |
| No Computing Device | 168 | 2.9% |
| Total | 5,791 | 100.0% |
Internet Access in La Grange
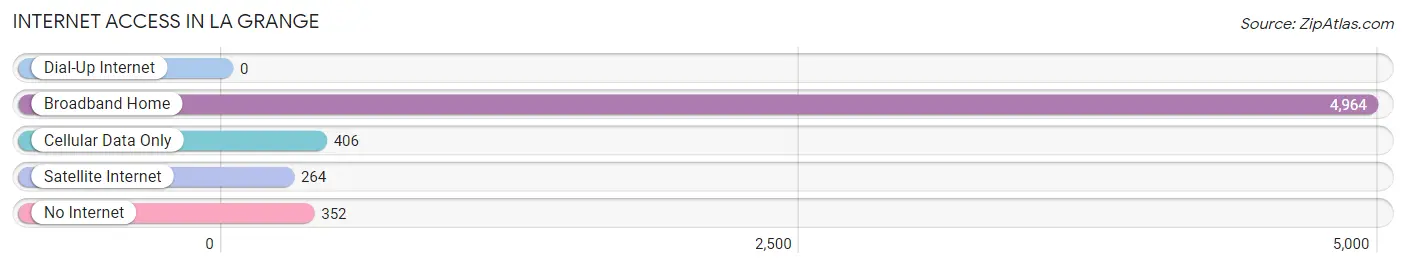
| Internet Type | # Households | % Households |
| Dial-Up Internet | 0 | 0.0% |
| Broadband Home | 4,964 | 85.7% |
| Cellular Data Only | 406 | 7.0% |
| Satellite Internet | 264 | 4.6% |
| No Internet | 352 | 6.1% |
| Total | 5,791 | 100.0% |
La Grange Summary
La Grange, Illinois is a village located in Cook County, Illinois, United States. It is situated approximately 13 miles west of downtown Chicago. The population of La Grange was 15,608 at the 2010 census.
History
La Grange was founded in 1879 by Franklin Dwight Cossitt, a wealthy merchant from Chicago. Cossitt purchased the land that would become La Grange and began to develop it into a residential community. He named the village after the French phrase meaning “the barn”, which was a reference to the large barns that were built in the area.
The village was incorporated in 1882 and quickly grew in population. By the turn of the century, La Grange had become a popular destination for wealthy Chicagoans looking to escape the hustle and bustle of the city. The village was known for its large estates and beautiful homes.
In the early 1900s, La Grange began to experience a period of growth and development. The village was connected to the Chicago Loop via the Chicago, Burlington & Quincy Railroad in 1907. This allowed for easy access to the city and helped to spur further growth.
In the 1920s, La Grange experienced a period of rapid growth. The population increased from 4,000 in 1920 to over 10,000 by 1930. This growth was largely due to the influx of new residents from Chicago.
Geography
La Grange is located in Cook County, Illinois, approximately 13 miles west of downtown Chicago. The village is situated on the Des Plaines River and is bordered by the villages of Brookfield, Western Springs, and Countryside.
The village has a total area of 3.3 square miles, all of which is land. La Grange is located at an elevation of 645 feet above sea level.
Economy
La Grange has a diverse economy that is largely driven by the service sector. The village is home to a variety of businesses, including retail stores, restaurants, and professional services.
The village is also home to several large employers, including La Grange Memorial Hospital, La Grange Country Club, and La Grange Park District.
Demographics
As of the 2010 census, the population of La Grange was 15,608. The racial makeup of the village was 87.3% White, 5.2% African American, 0.3% Native American, 3.2% Asian, and 3.9% from other races. Hispanic or Latino of any race were 8.3% of the population.
The median household income in La Grange was $76,837 in 2017. The median age of residents was 43.7 years.
Conclusion
La Grange, Illinois is a village located in Cook County, Illinois, approximately 13 miles west of downtown Chicago. The village was founded in 1879 by Franklin Dwight Cossitt and has since grown to a population of 15,608. La Grange has a diverse economy that is largely driven by the service sector and is home to several large employers. The village has a median household income of $76,837 and a median age of 43.7 years.
Common Questions
What is Per Capita Income in La Grange?
Per Capita income in La Grange is $71,259.
What is the Median Family Income in La Grange?
Median Family Income in La Grange is $175,905.
What is the Median Household income in La Grange?
Median Household Income in La Grange is $141,235.
What is Income or Wage Gap in La Grange?
Income or Wage Gap in La Grange is 56.6%.
Women in La Grange earn 43.4 cents for every dollar earned by a man.
What is Family Income Deficit in La Grange?
Family Income Deficit in La Grange is $9,970.
Families that are below poverty line in La Grange earn $9,970 less on average than the poverty threshold level.
What is Inequality or Gini Index in La Grange?
Inequality or Gini Index in La Grange is 0.47.
What is the Total Population of La Grange?
Total Population of La Grange is 16,128.
What is the Total Male Population of La Grange?
Total Male Population of La Grange is 7,881.
What is the Total Female Population of La Grange?
Total Female Population of La Grange is 8,247.
What is the Ratio of Males per 100 Females in La Grange?
There are 95.56 Males per 100 Females in La Grange.
What is the Ratio of Females per 100 Males in La Grange?
There are 104.64 Females per 100 Males in La Grange.
What is the Median Population Age in La Grange?
Median Population Age in La Grange is 42.4 Years.
What is the Average Family Size in La Grange
Average Family Size in La Grange is 3.3 People.
What is the Average Household Size in La Grange
Average Household Size in La Grange is 2.7 People.
How Large is the Labor Force in La Grange?
There are 8,109 People in the Labor Forcein in La Grange.
What is the Percentage of People in the Labor Force in La Grange?
66.4% of People are in the Labor Force in La Grange.
What is the Unemployment Rate in La Grange?
Unemployment Rate in La Grange is 2.0%.