Corvallis, MT Map & Demographics
Corvallis Map
Corvallis Overview
$26,503
PER CAPITA INCOME
$80,288
AVG FAMILY INCOME
$62,034
AVG HOUSEHOLD INCOME
0.33
INEQUALITY / GINI INDEX
1,396
TOTAL POPULATION
800
MALE POPULATION
596
FEMALE POPULATION
134.23
MALES / 100 FEMALES
74.50
FEMALES / 100 MALES
38.6
MEDIAN AGE
2.7
AVG FAMILY SIZE
2.4
AVG HOUSEHOLD SIZE
817
LABOR FORCE [ PEOPLE ]
73.1%
PERCENT IN LABOR FORCE
7.5%
UNEMPLOYMENT RATE
Corvallis Zip Codes
Corvallis Area Codes
Income in Corvallis
Income Overview in Corvallis
Per Capita Income in Corvallis is $26,503, while median incomes of families and households are $80,288 and $62,034 respectively.
| Characteristic | Number | Measure |
| Per Capita Income | 1,396 | $26,503 |
| Median Family Income | 448 | $80,288 |
| Mean Family Income | 448 | $77,881 |
| Median Household Income | 574 | $62,034 |
| Mean Household Income | 574 | $67,902 |
| Income Deficit | 448 | $0 |
| Wage / Income Gap (%) | 1,396 | 0.00% |
| Wage / Income Gap ($) | 1,396 | 100.00¢ per $1 |
| Gini / Inequality Index | 1,396 | 0.33 |
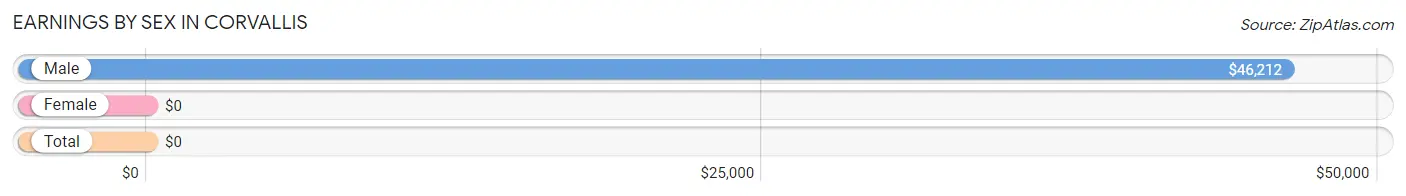
Earnings by Sex in Corvallis
| Sex | Number | Average Earnings |
| Male | 430 (55.0%) | $46,212 |
| Female | 352 (45.0%) | $0 |
| Total | 782 (100.0%) | $0 |
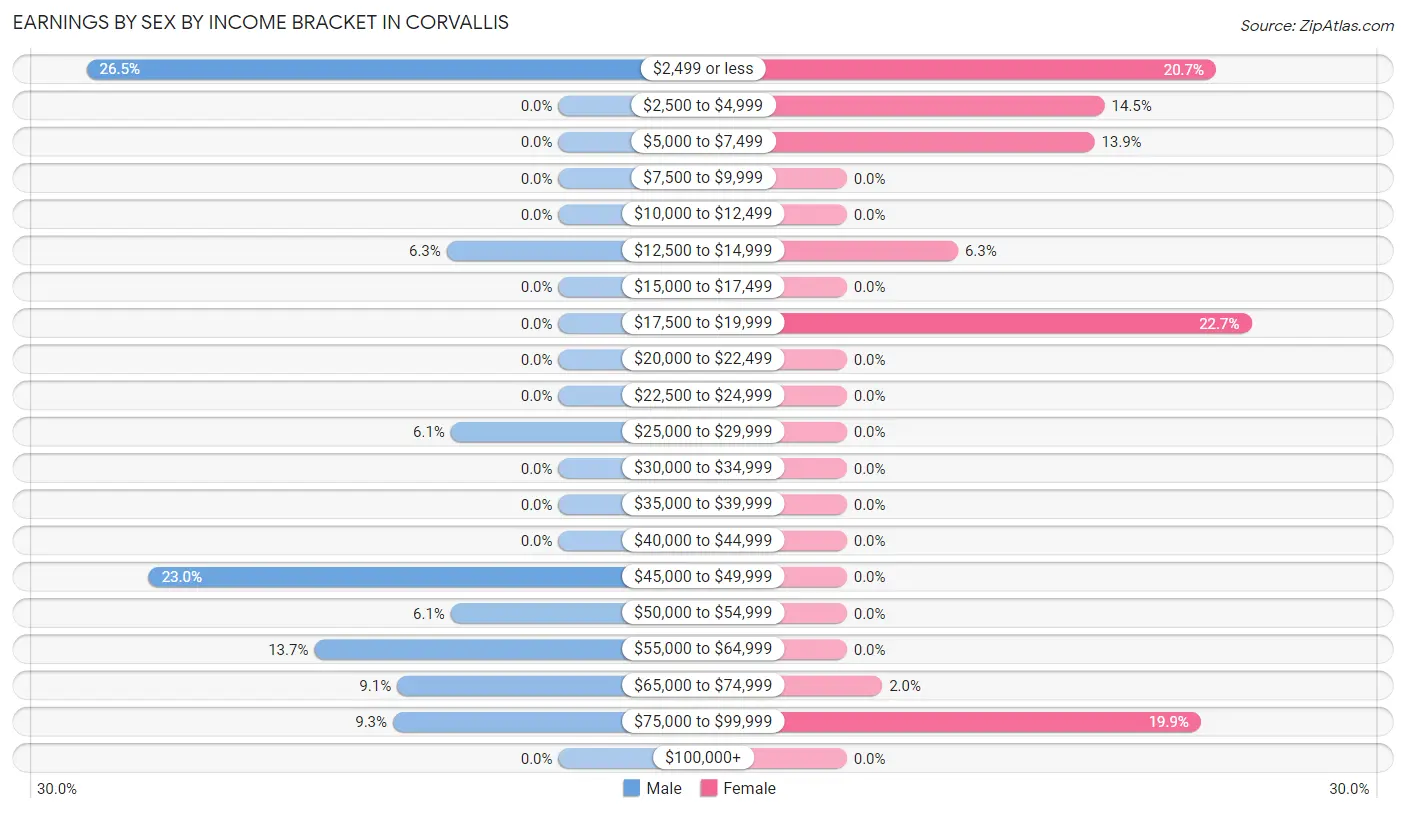
Earnings by Sex by Income Bracket in Corvallis
The most common earnings brackets in Corvallis are $2,499 or less for men (114 | 26.5%) and $17,500 to $19,999 for women (80 | 22.7%).
| Income | Male | Female |
| $2,499 or less | 114 (26.5%) | 73 (20.7%) |
| $2,500 to $4,999 | 0 (0.0%) | 51 (14.5%) |
| $5,000 to $7,499 | 0 (0.0%) | 49 (13.9%) |
| $7,500 to $9,999 | 0 (0.0%) | 0 (0.0%) |
| $10,000 to $12,499 | 0 (0.0%) | 0 (0.0%) |
| $12,500 to $14,999 | 27 (6.3%) | 22 (6.2%) |
| $15,000 to $17,499 | 0 (0.0%) | 0 (0.0%) |
| $17,500 to $19,999 | 0 (0.0%) | 80 (22.7%) |
| $20,000 to $22,499 | 0 (0.0%) | 0 (0.0%) |
| $22,500 to $24,999 | 0 (0.0%) | 0 (0.0%) |
| $25,000 to $29,999 | 26 (6.0%) | 0 (0.0%) |
| $30,000 to $34,999 | 0 (0.0%) | 0 (0.0%) |
| $35,000 to $39,999 | 0 (0.0%) | 0 (0.0%) |
| $40,000 to $44,999 | 0 (0.0%) | 0 (0.0%) |
| $45,000 to $49,999 | 99 (23.0%) | 0 (0.0%) |
| $50,000 to $54,999 | 26 (6.0%) | 0 (0.0%) |
| $55,000 to $64,999 | 59 (13.7%) | 0 (0.0%) |
| $65,000 to $74,999 | 39 (9.1%) | 7 (2.0%) |
| $75,000 to $99,999 | 40 (9.3%) | 70 (19.9%) |
| $100,000+ | 0 (0.0%) | 0 (0.0%) |
| Total | 430 (100.0%) | 352 (100.0%) |
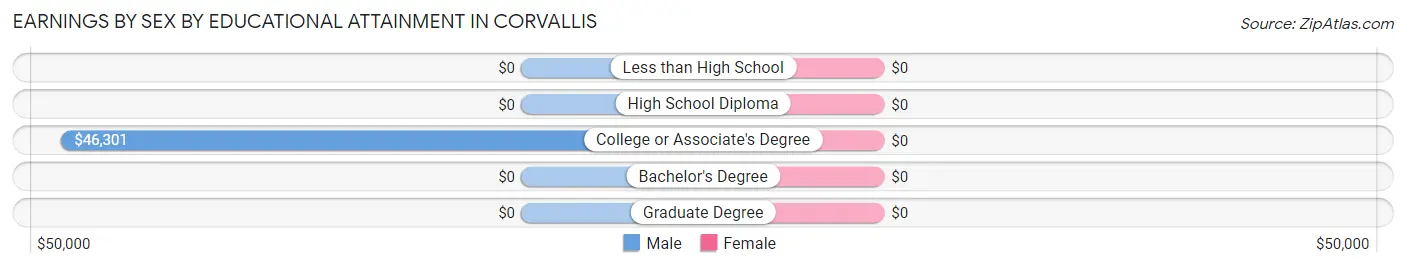
Earnings by Sex by Educational Attainment in Corvallis
| Educational Attainment | Male Income | Female Income |
| Less than High School | - | - |
| High School Diploma | - | - |
| College or Associate's Degree | $46,301 | $0 |
| Bachelor's Degree | - | - |
| Graduate Degree | - | - |
| Total | $46,540 | $0 |
Family Income in Corvallis
Family Income Brackets in Corvallis
According to the Corvallis family income data, there are 118 families falling into the $75,000 to $99,999 income range, which is the most common income bracket and makes up 26.3% of all families.
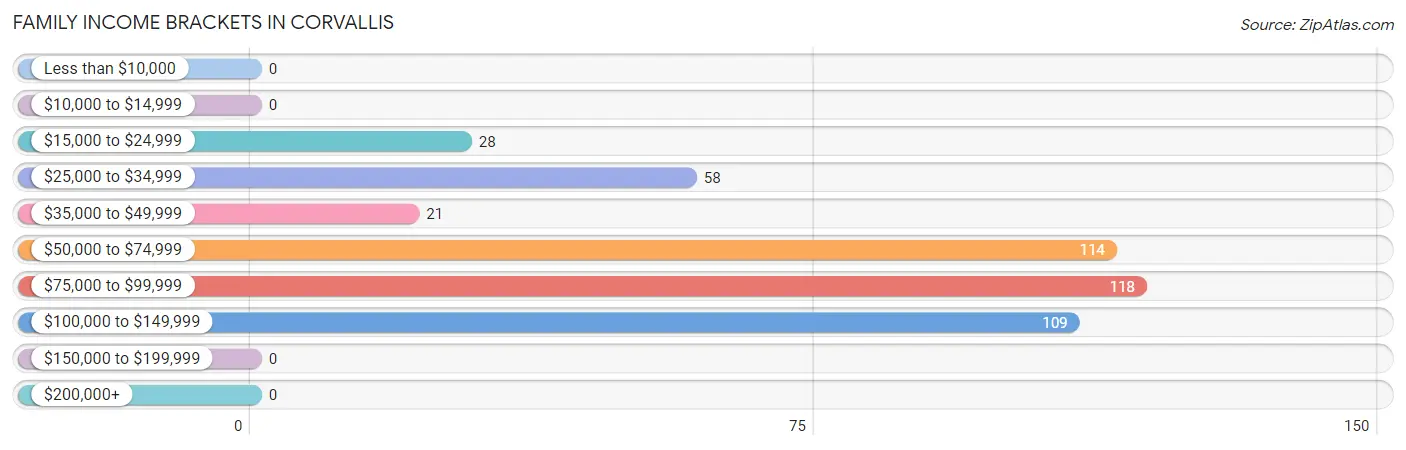
| Income Bracket | # Families | % Families |
| Less than $10,000 | 0 | 0.0% |
| $10,000 to $14,999 | 0 | 0.0% |
| $15,000 to $24,999 | 28 | 6.3% |
| $25,000 to $34,999 | 58 | 12.9% |
| $35,000 to $49,999 | 21 | 4.7% |
| $50,000 to $74,999 | 114 | 25.4% |
| $75,000 to $99,999 | 118 | 26.3% |
| $100,000 to $149,999 | 109 | 24.3% |
| $150,000 to $199,999 | 0 | 0.0% |
| $200,000+ | 0 | 0.0% |
Family Income by Famaliy Size in Corvallis
2-person families (146 | 32.6%) account for the highest median family income in Corvallis with $59,423 per family, while 2-person families (146 | 32.6%) have the highest median income of $29,712 per family member.
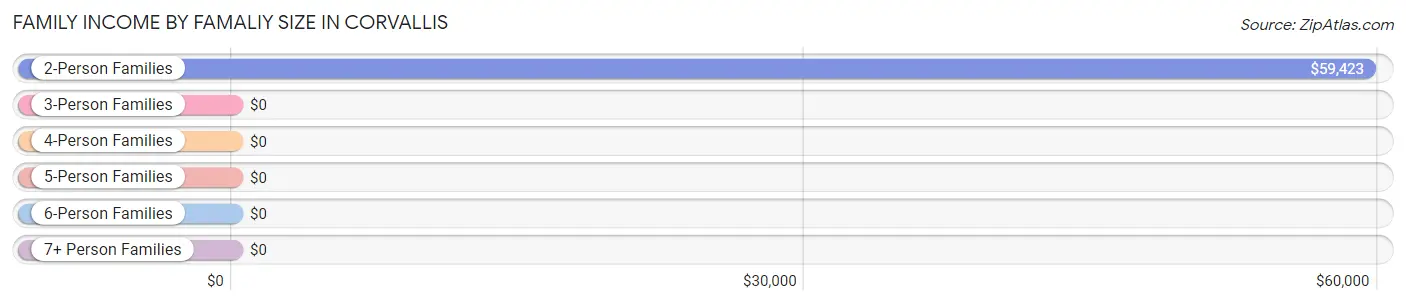
| Income Bracket | # Families | Median Income |
| 2-Person Families | 146 (32.6%) | $59,423 |
| 3-Person Families | 35 (7.8%) | $0 |
| 4-Person Families | 241 (53.8%) | $0 |
| 5-Person Families | 26 (5.8%) | $0 |
| 6-Person Families | 0 (0.0%) | $0 |
| 7+ Person Families | 0 (0.0%) | $0 |
| Total | 448 (100.0%) | $80,288 |
Family Income by Number of Earners in Corvallis
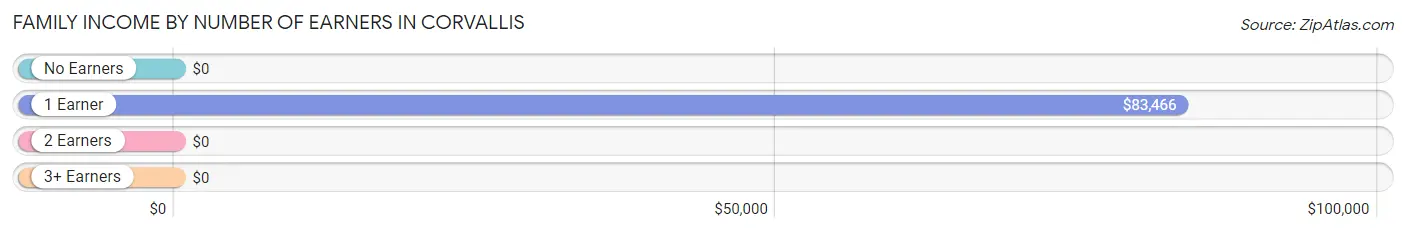
| Number of Earners | # Families | Median Income |
| No Earners | 21 (4.7%) | $0 |
| 1 Earner | 150 (33.5%) | $83,466 |
| 2 Earners | 277 (61.8%) | $0 |
| 3+ Earners | 0 (0.0%) | $0 |
| Total | 448 (100.0%) | $80,288 |
Household Income in Corvallis
Household Income Brackets in Corvallis
With 146 households falling in the category, the $50,000 to $74,999 income range is the most frequent in Corvallis, accounting for 25.4% of all households.
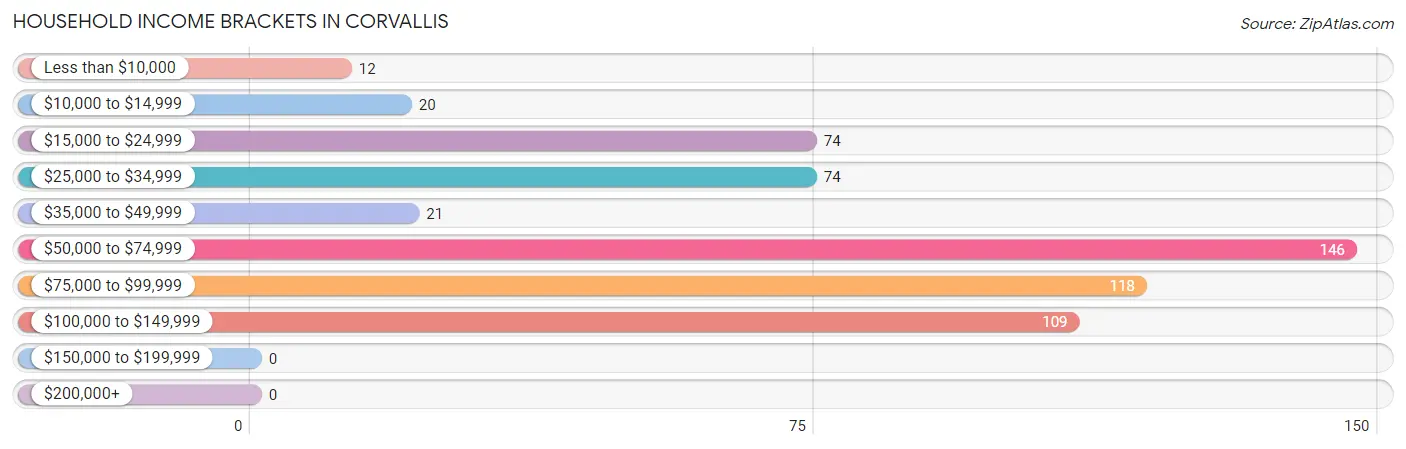
| Income Bracket | # Households | % Households |
| Less than $10,000 | 12 | 2.1% |
| $10,000 to $14,999 | 20 | 3.5% |
| $15,000 to $24,999 | 74 | 12.9% |
| $25,000 to $34,999 | 74 | 12.9% |
| $35,000 to $49,999 | 21 | 3.7% |
| $50,000 to $74,999 | 146 | 25.4% |
| $75,000 to $99,999 | 118 | 20.6% |
| $100,000 to $149,999 | 109 | 19.0% |
| $150,000 to $199,999 | 0 | 0.0% |
| $200,000+ | 0 | 0.0% |
Household Income by Householder Age in Corvallis
The median household income in Corvallis is $62,034, with the highest median household income of $69,813 found in the 25 to 44 years age bracket for the primary householder. A total of 201 households (35.0%) fall into this category. Meanwhile, the 15 to 24 years age bracket for the primary householder has the lowest median household income of $0, with 26 households (4.5%) in this group.
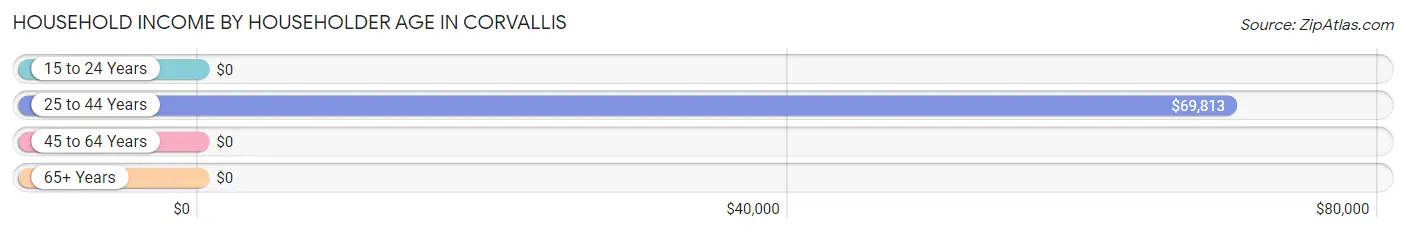
| Income Bracket | # Households | Median Income |
| 15 to 24 Years | 26 (4.5%) | $0 |
| 25 to 44 Years | 201 (35.0%) | $69,813 |
| 45 to 64 Years | 137 (23.9%) | $0 |
| 65+ Years | 210 (36.6%) | $0 |
| Total | 574 (100.0%) | $62,034 |
Poverty in Corvallis
Income Below Poverty by Sex and Age in Corvallis
With 16.9% poverty level for males and 21.6% for females among the residents of Corvallis, 18 to 24 year old males and under 5 year old females are the most vulnerable to poverty, with 26 males (100.0%) and 18 females (100.0%) in their respective age groups living below the poverty level.
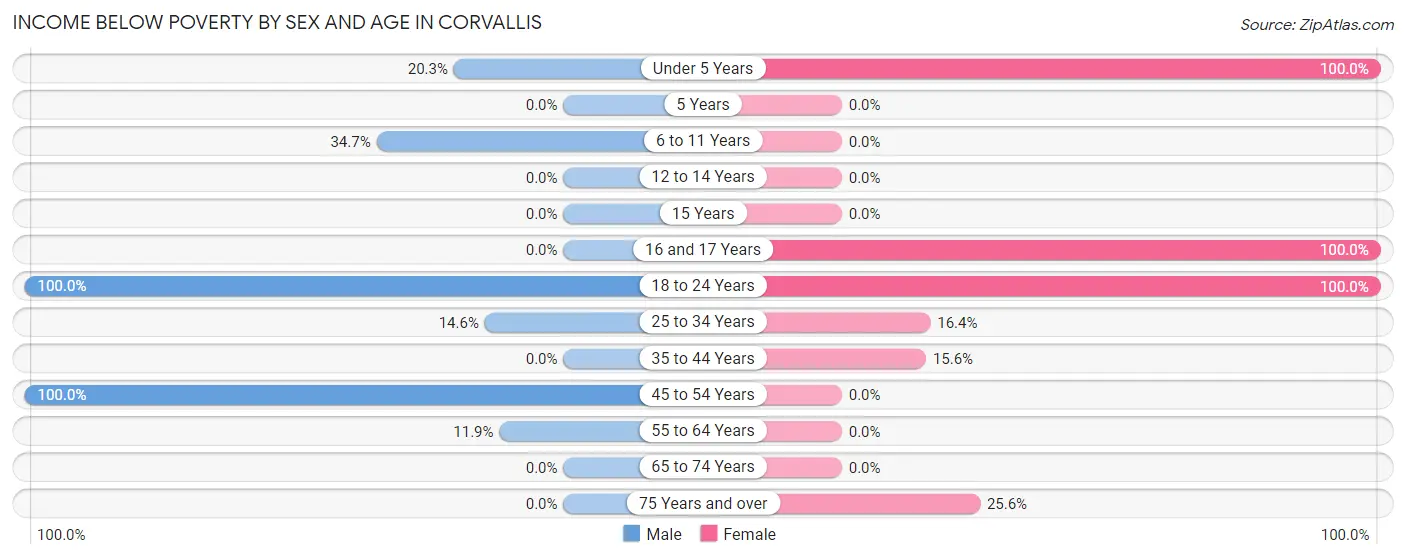
| Age Bracket | Male | Female |
| Under 5 Years | 25 (20.3%) | 18 (100.0%) |
| 5 Years | 0 (0.0%) | 0 (0.0%) |
| 6 to 11 Years | 17 (34.7%) | 0 (0.0%) |
| 12 to 14 Years | 0 (0.0%) | 0 (0.0%) |
| 15 Years | 0 (0.0%) | 0 (0.0%) |
| 16 and 17 Years | 0 (0.0%) | 9 (100.0%) |
| 18 to 24 Years | 26 (100.0%) | 44 (100.0%) |
| 25 to 34 Years | 27 (14.6%) | 23 (16.4%) |
| 35 to 44 Years | 0 (0.0%) | 15 (15.6%) |
| 45 to 54 Years | 28 (100.0%) | 0 (0.0%) |
| 55 to 64 Years | 12 (11.9%) | 0 (0.0%) |
| 65 to 74 Years | 0 (0.0%) | 0 (0.0%) |
| 75 Years and over | 0 (0.0%) | 20 (25.6%) |
| Total | 135 (16.9%) | 129 (21.6%) |
Income Above Poverty by Sex and Age in Corvallis
According to the poverty statistics in Corvallis, males aged 5 years and females aged 6 to 11 years are the age groups that are most secure financially, with 100.0% of males and 100.0% of females in these age groups living above the poverty line.
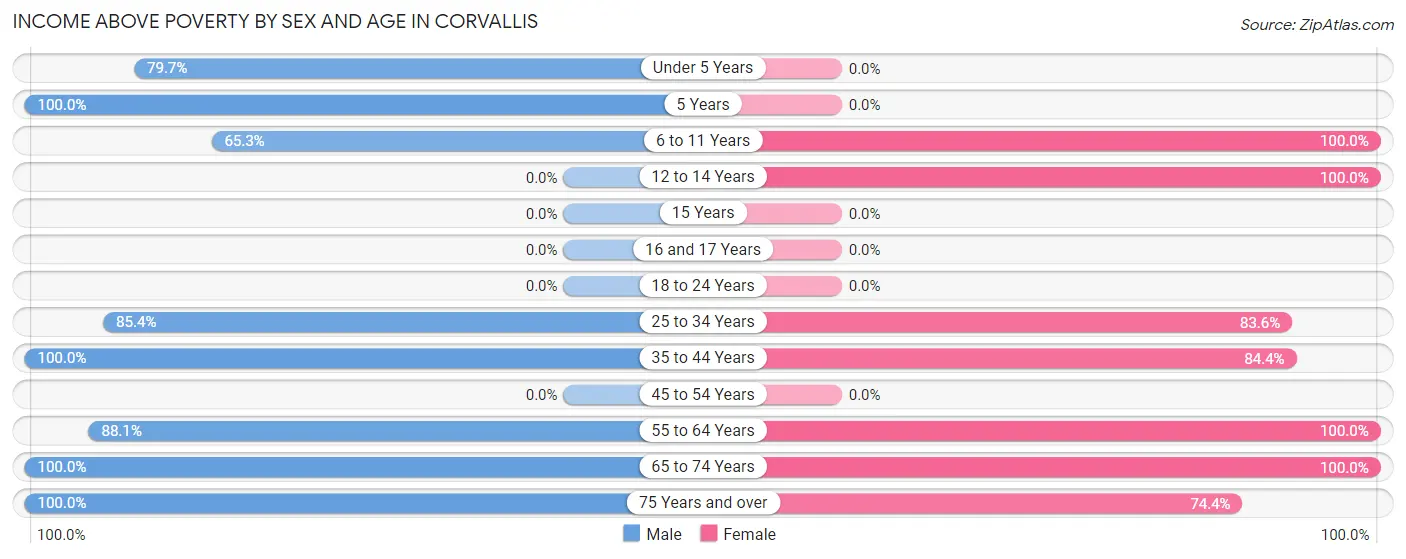
| Age Bracket | Male | Female |
| Under 5 Years | 98 (79.7%) | 0 (0.0%) |
| 5 Years | 32 (100.0%) | 0 (0.0%) |
| 6 to 11 Years | 32 (65.3%) | 52 (100.0%) |
| 12 to 14 Years | 0 (0.0%) | 4 (100.0%) |
| 15 Years | 0 (0.0%) | 0 (0.0%) |
| 16 and 17 Years | 0 (0.0%) | 0 (0.0%) |
| 18 to 24 Years | 0 (0.0%) | 0 (0.0%) |
| 25 to 34 Years | 158 (85.4%) | 117 (83.6%) |
| 35 to 44 Years | 39 (100.0%) | 81 (84.4%) |
| 45 to 54 Years | 0 (0.0%) | 0 (0.0%) |
| 55 to 64 Years | 89 (88.1%) | 127 (100.0%) |
| 65 to 74 Years | 195 (100.0%) | 28 (100.0%) |
| 75 Years and over | 22 (100.0%) | 58 (74.4%) |
| Total | 665 (83.1%) | 467 (78.4%) |
Income Below Poverty Among Married-Couple Families in Corvallis
The poverty statistics for married-couple families in Corvallis show that 23.5% or 54 of the total 230 families live below the poverty line. Families with 3 or 4 children have the highest poverty rate of 100.0%, comprising of 26 families. On the other hand, families with no children have the lowest poverty rate of 0.0%, which includes 0 families.
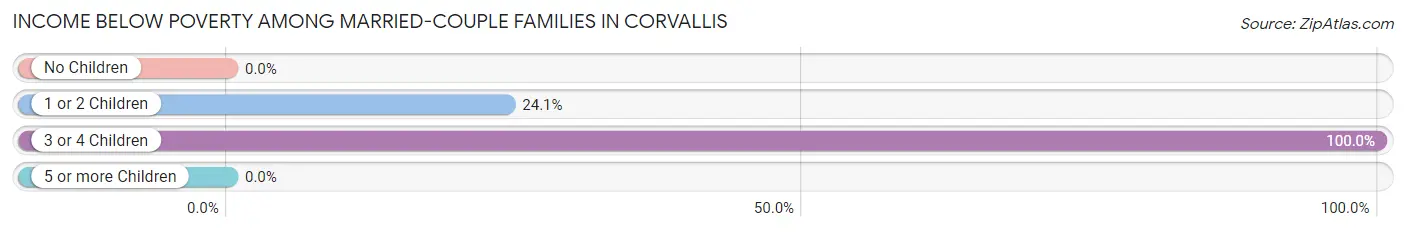
| Children | Above Poverty | Below Poverty |
| No Children | 88 (100.0%) | 0 (0.0%) |
| 1 or 2 Children | 88 (75.9%) | 28 (24.1%) |
| 3 or 4 Children | 0 (0.0%) | 26 (100.0%) |
| 5 or more Children | 0 (0.0%) | 0 (0.0%) |
| Total | 176 (76.5%) | 54 (23.5%) |
Income Below Poverty Among Single-Parent Households in Corvallis
| Children | Single Father | Single Mother |
| No Children | 0 (0.0%) | 0 (0.0%) |
| 1 or 2 Children | 0 (0.0%) | 0 (0.0%) |
| 3 or 4 Children | 0 (0.0%) | 0 (0.0%) |
| 5 or more Children | 0 (0.0%) | 0 (0.0%) |
| Total | 0 (0.0%) | 0 (0.0%) |
Income Below Poverty Among Married-Couple vs Single-Parent Households in Corvallis
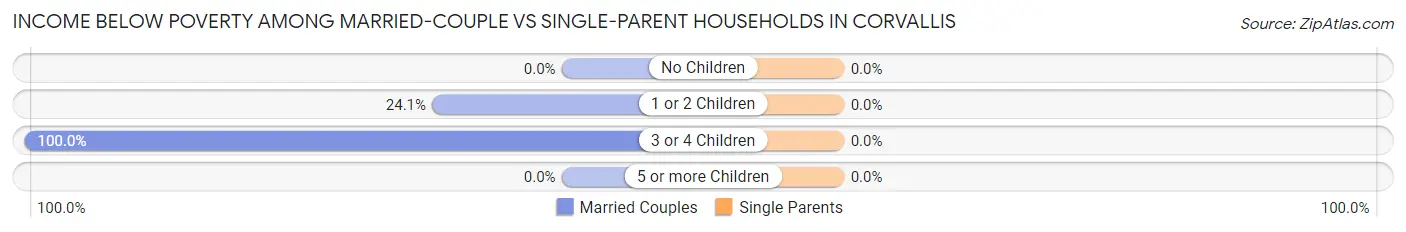
| Children | Married-Couple Families | Single-Parent Households |
| No Children | 0 (0.0%) | 0 (0.0%) |
| 1 or 2 Children | 28 (24.1%) | 0 (0.0%) |
| 3 or 4 Children | 26 (100.0%) | 0 (0.0%) |
| 5 or more Children | 0 (0.0%) | 0 (0.0%) |
| Total | 54 (23.5%) | 0 (0.0%) |
Race in Corvallis
The most populous races in Corvallis are White / Caucasian (1,316 | 94.3%), Hispanic or Latino (50 | 3.6%), and Two or more Races (31 | 2.2%).
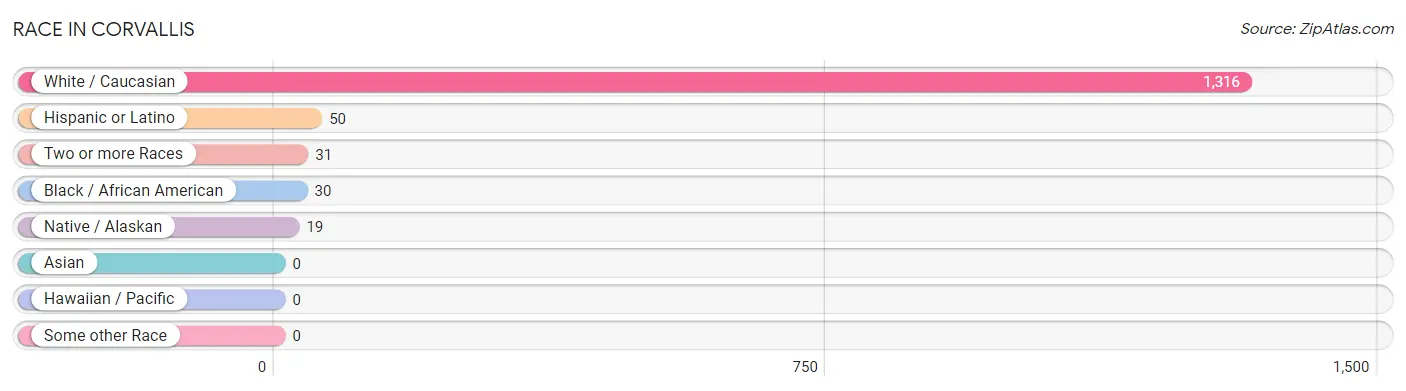
| Race | # Population | % Population |
| Asian | 0 | 0.0% |
| Black / African American | 30 | 2.1% |
| Hawaiian / Pacific | 0 | 0.0% |
| Hispanic or Latino | 50 | 3.6% |
| Native / Alaskan | 19 | 1.4% |
| White / Caucasian | 1,316 | 94.3% |
| Two or more Races | 31 | 2.2% |
| Some other Race | 0 | 0.0% |
| Total | 1,396 | 100.0% |
Ancestry in Corvallis
The most populous ancestries reported in Corvallis are Irish (440 | 31.5%), Italian (324 | 23.2%), English (286 | 20.5%), German (168 | 12.0%), and Celtic (114 | 8.2%), together accounting for 95.4% of all Corvallis residents.
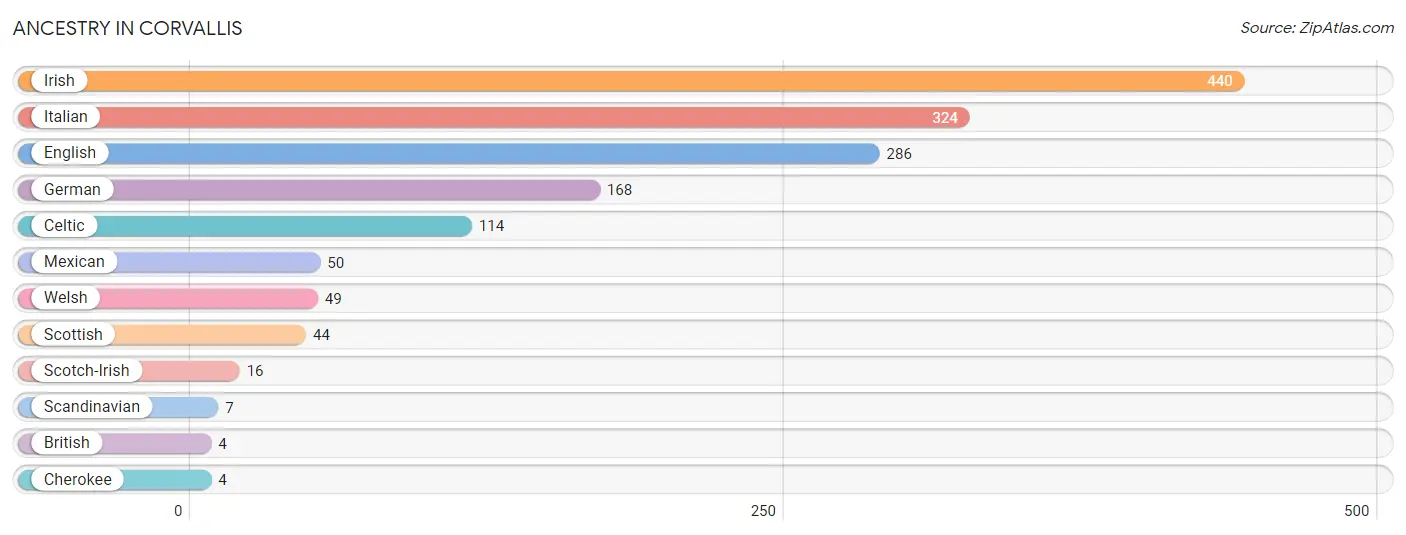
| Ancestry | # Population | % Population |
| British | 4 | 0.3% |
| Celtic | 114 | 8.2% |
| Cherokee | 4 | 0.3% |
| English | 286 | 20.5% |
| German | 168 | 12.0% |
| Irish | 440 | 31.5% |
| Italian | 324 | 23.2% |
| Mexican | 50 | 3.6% |
| Scandinavian | 7 | 0.5% |
| Scotch-Irish | 16 | 1.1% |
| Scottish | 44 | 3.2% |
| Welsh | 49 | 3.5% | View All 12 Rows |
Immigrants in Corvallis

| Immigration Origin | # Population | % Population | View All 0 Rows |
Sex and Age in Corvallis
Sex and Age in Corvallis
The most populous age groups in Corvallis are 30 to 34 Years (158 | 19.8%) for men and 55 to 59 Years (97 | 16.3%) for women.
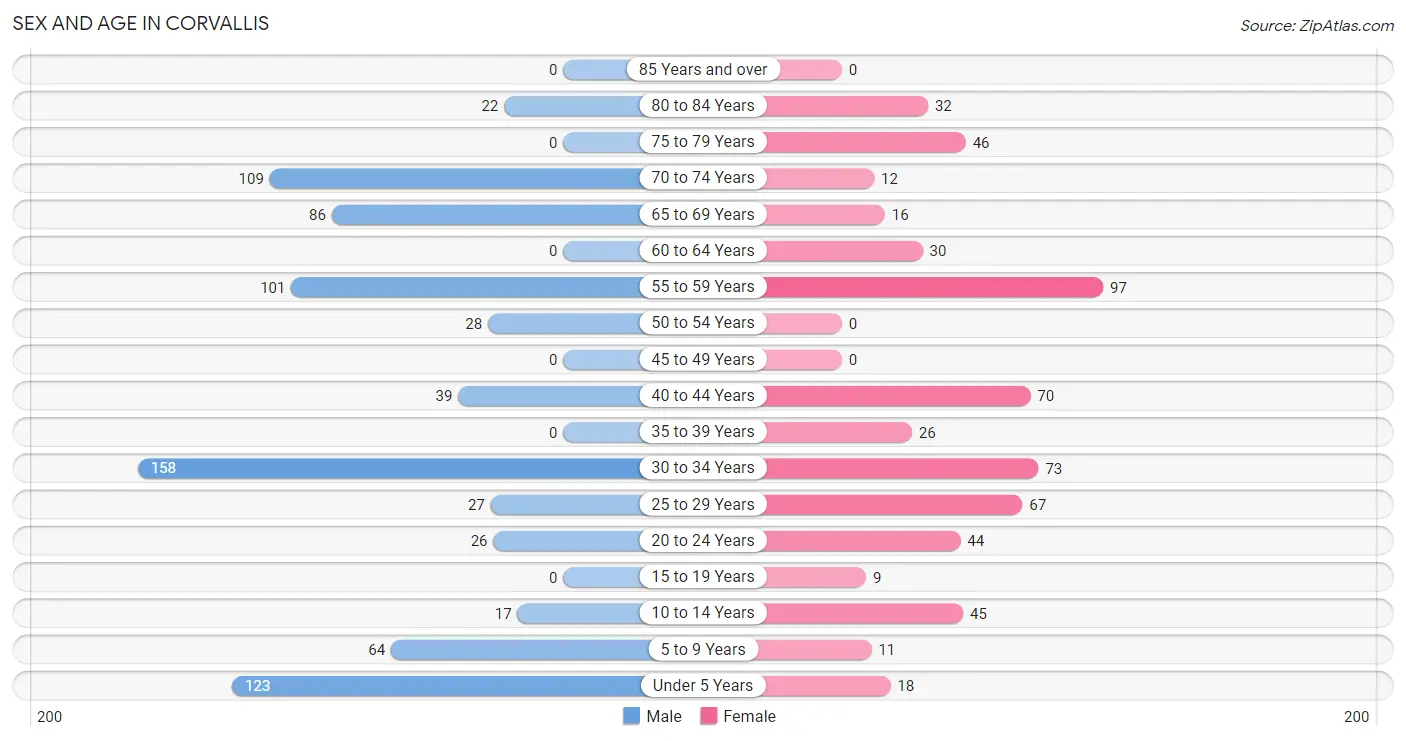
| Age Bracket | Male | Female |
| Under 5 Years | 123 (15.4%) | 18 (3.0%) |
| 5 to 9 Years | 64 (8.0%) | 11 (1.8%) |
| 10 to 14 Years | 17 (2.1%) | 45 (7.5%) |
| 15 to 19 Years | 0 (0.0%) | 9 (1.5%) |
| 20 to 24 Years | 26 (3.3%) | 44 (7.4%) |
| 25 to 29 Years | 27 (3.4%) | 67 (11.2%) |
| 30 to 34 Years | 158 (19.8%) | 73 (12.2%) |
| 35 to 39 Years | 0 (0.0%) | 26 (4.4%) |
| 40 to 44 Years | 39 (4.9%) | 70 (11.7%) |
| 45 to 49 Years | 0 (0.0%) | 0 (0.0%) |
| 50 to 54 Years | 28 (3.5%) | 0 (0.0%) |
| 55 to 59 Years | 101 (12.6%) | 97 (16.3%) |
| 60 to 64 Years | 0 (0.0%) | 30 (5.0%) |
| 65 to 69 Years | 86 (10.7%) | 16 (2.7%) |
| 70 to 74 Years | 109 (13.6%) | 12 (2.0%) |
| 75 to 79 Years | 0 (0.0%) | 46 (7.7%) |
| 80 to 84 Years | 22 (2.8%) | 32 (5.4%) |
| 85 Years and over | 0 (0.0%) | 0 (0.0%) |
| Total | 800 (100.0%) | 596 (100.0%) |
Families and Households in Corvallis
Median Family Size in Corvallis
The median family size in Corvallis is 2.71 persons per family, with single male/father families (109 | 24.3%) accounting for the largest median family size of 2.97 persons per family. On the other hand, single female/mother families (109 | 24.3%) represent the smallest median family size with 2.56 persons per family.
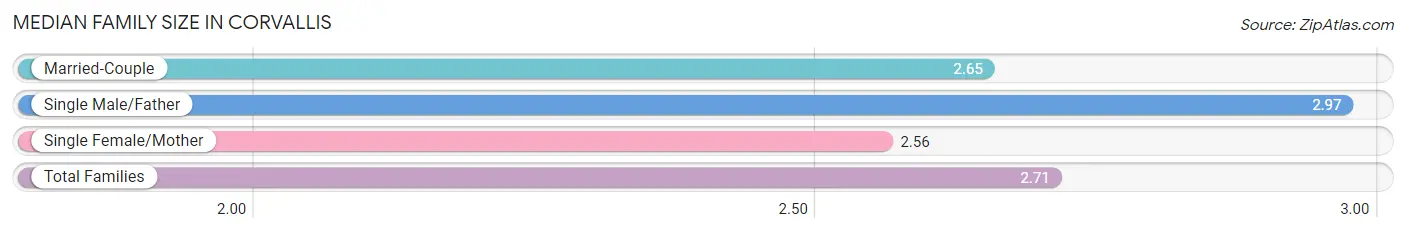
| Family Type | # Families | Family Size |
| Married-Couple | 230 (51.3%) | 2.65 |
| Single Male/Father | 109 (24.3%) | 2.97 |
| Single Female/Mother | 109 (24.3%) | 2.56 |
| Total Families | 448 (100.0%) | 2.71 |
Median Household Size in Corvallis
The median household size in Corvallis is 2.43 persons per household, with single male/father households (109 | 19.0%) accounting for the largest median household size of 2.97 persons per household. non-family households (126 | 22.0%) represent the smallest median household size with 1.17 persons per household.
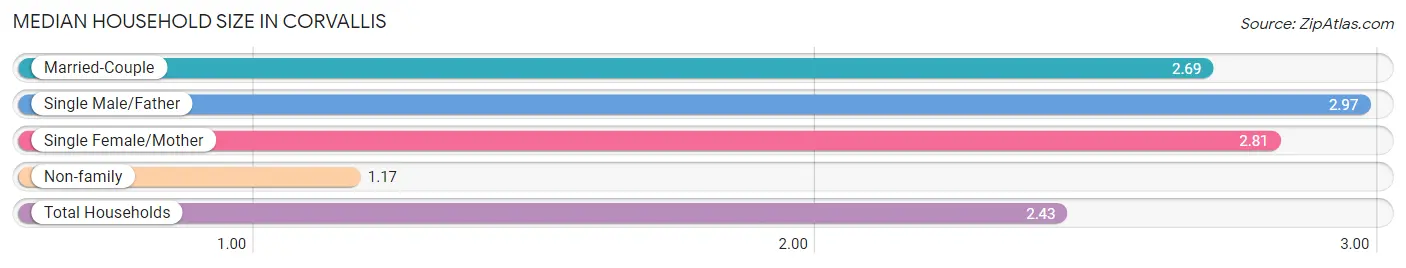
| Household Type | # Households | Household Size |
| Married-Couple | 230 (40.1%) | 2.69 |
| Single Male/Father | 109 (19.0%) | 2.97 |
| Single Female/Mother | 109 (19.0%) | 2.81 |
| Non-family | 126 (22.0%) | 1.17 |
| Total Households | 574 (100.0%) | 2.43 |
Household Size by Marriage Status in Corvallis
Out of a total of 574 households in Corvallis, 448 (78.0%) are family households, while 126 (22.0%) are nonfamily households. The most numerous type of family households are 4-person households, comprising 225, and the most common type of nonfamily households are 1-person households, comprising 103.
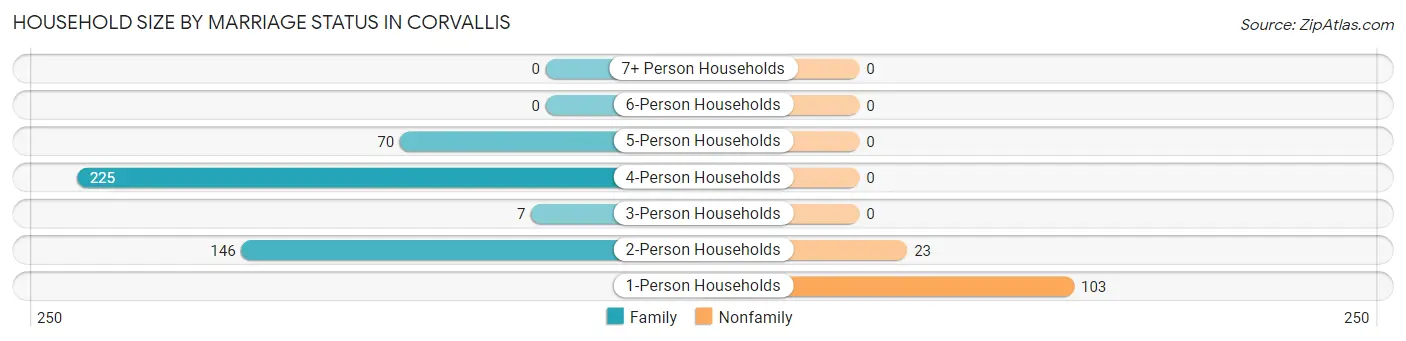
| Household Size | Family Households | Nonfamily Households |
| 1-Person Households | - | 103 (17.9%) |
| 2-Person Households | 146 (25.4%) | 23 (4.0%) |
| 3-Person Households | 7 (1.2%) | 0 (0.0%) |
| 4-Person Households | 225 (39.2%) | 0 (0.0%) |
| 5-Person Households | 70 (12.2%) | 0 (0.0%) |
| 6-Person Households | 0 (0.0%) | 0 (0.0%) |
| 7+ Person Households | 0 (0.0%) | 0 (0.0%) |
| Total | 448 (78.0%) | 126 (22.0%) |
Female Fertility in Corvallis
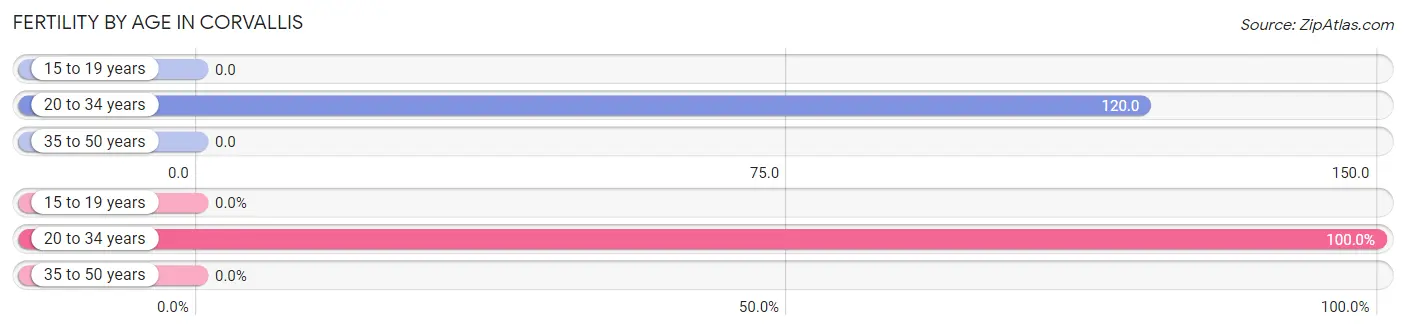
Fertility by Age in Corvallis
Average fertility rate in Corvallis is 76.0 births per 1,000 women. Women in the age bracket of 20 to 34 years have the highest fertility rate with 120.0 births per 1,000 women. Women in the age bracket of 20 to 34 years acount for 100.0% of all women with births.
| Age Bracket | Women with Births | Births / 1,000 Women |
| 15 to 19 years | 0 (0.0%) | 0.0 |
| 20 to 34 years | 22 (100.0%) | 120.0 |
| 35 to 50 years | 0 (0.0%) | 0.0 |
| Total | 22 (100.0%) | 76.0 |
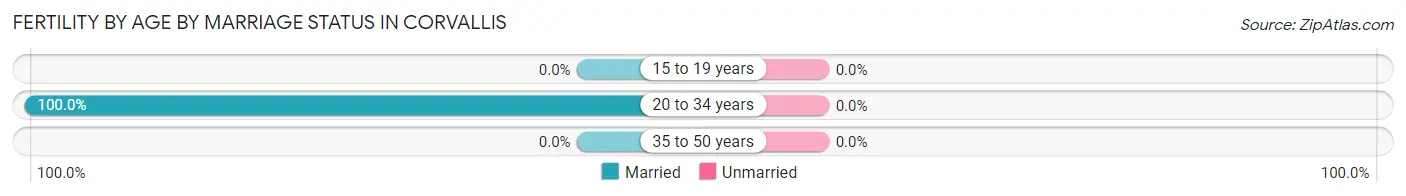
Fertility by Age by Marriage Status in Corvallis
| Age Bracket | Married | Unmarried |
| 15 to 19 years | 0 (0.0%) | 0 (0.0%) |
| 20 to 34 years | 22 (100.0%) | 0 (0.0%) |
| 35 to 50 years | 0 (0.0%) | 0 (0.0%) |
| Total | 22 (100.0%) | 0 (0.0%) |
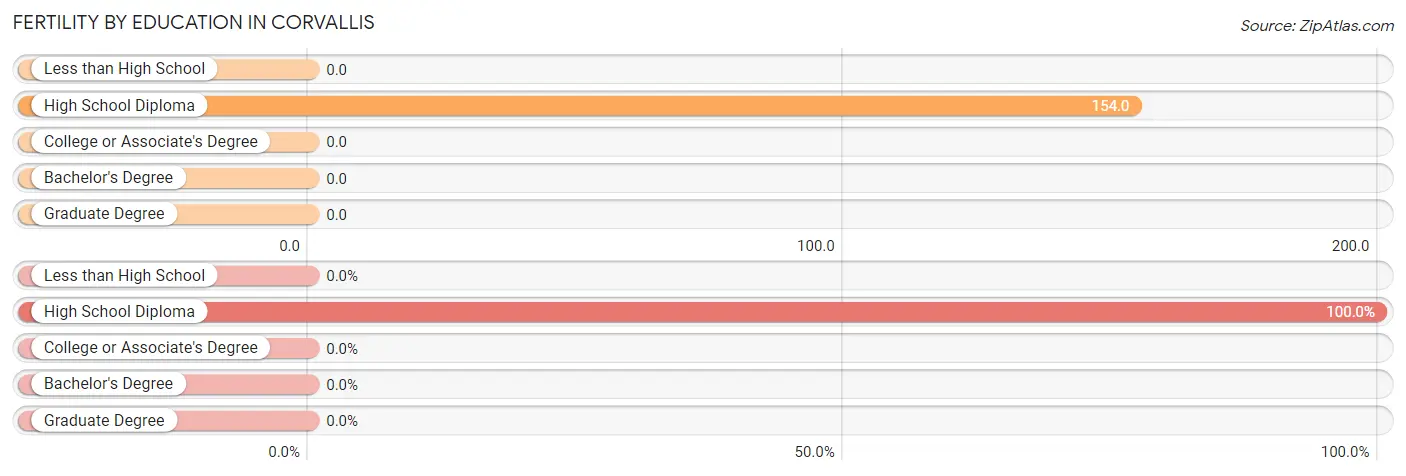
Fertility by Education in Corvallis
| Educational Attainment | Women with Births | Births / 1,000 Women |
| Less than High School | 0 (0.0%) | 0.0 |
| High School Diploma | 22 (100.0%) | 154.0 |
| College or Associate's Degree | 0 (0.0%) | 0.0 |
| Bachelor's Degree | 0 (0.0%) | 0.0 |
| Graduate Degree | 0 (0.0%) | 0.0 |
| Total | 22 (100.0%) | 76.0 |
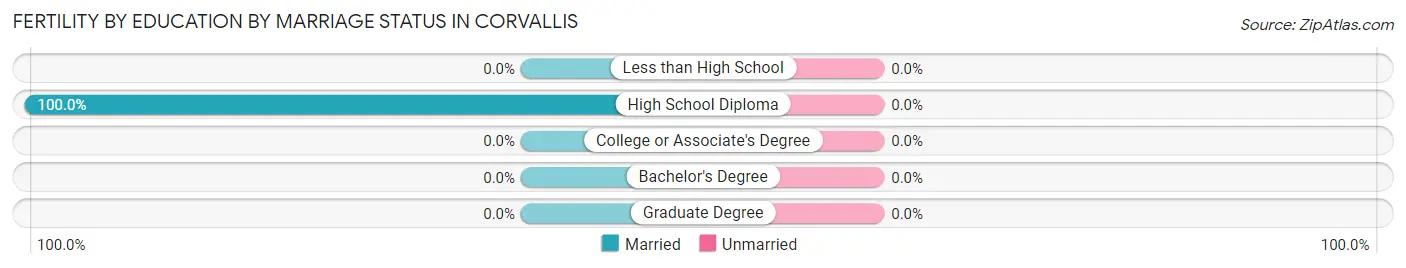
Fertility by Education by Marriage Status in Corvallis
| Educational Attainment | Married | Unmarried |
| Less than High School | 0 (0.0%) | 0 (0.0%) |
| High School Diploma | 22 (100.0%) | 0 (0.0%) |
| College or Associate's Degree | 0 (0.0%) | 0 (0.0%) |
| Bachelor's Degree | 0 (0.0%) | 0 (0.0%) |
| Graduate Degree | 0 (0.0%) | 0 (0.0%) |
| Total | 22 (100.0%) | 0 (0.0%) |
Employment Characteristics in Corvallis
Employment by Class of Employer in Corvallis
Among the 756 employed individuals in Corvallis, private company employees (575 | 76.1%), local government employees (74 | 9.8%), and self-employed (not incorporated) (73 | 9.7%) make up the most common classes of employment.
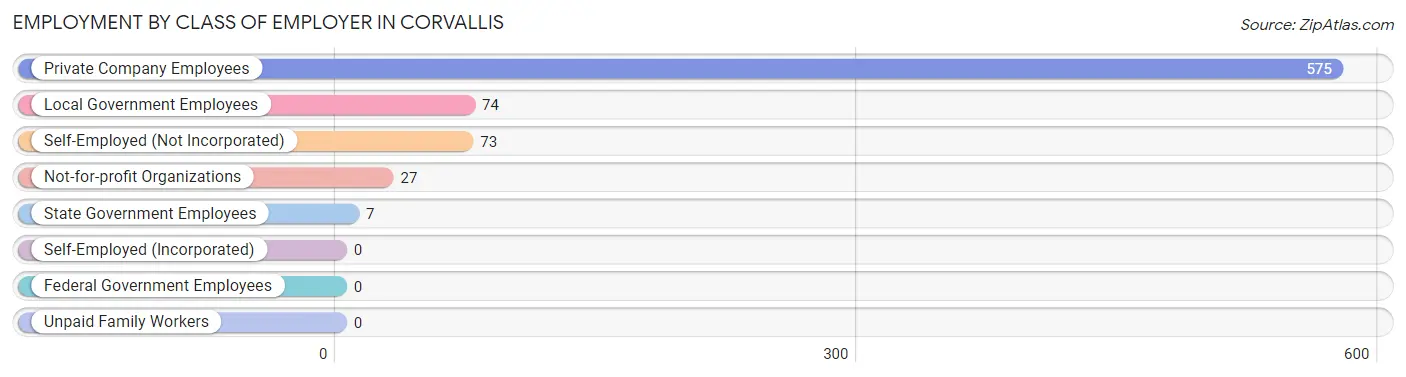
| Employer Class | # Employees | % Employees |
| Private Company Employees | 575 | 76.1% |
| Self-Employed (Incorporated) | 0 | 0.0% |
| Self-Employed (Not Incorporated) | 73 | 9.7% |
| Not-for-profit Organizations | 27 | 3.6% |
| Local Government Employees | 74 | 9.8% |
| State Government Employees | 7 | 0.9% |
| Federal Government Employees | 0 | 0.0% |
| Unpaid Family Workers | 0 | 0.0% |
| Total | 756 | 100.0% |
Employment Status by Age in Corvallis
According to the labor force statistics for Corvallis, out of the total population over 16 years of age (1,118), 73.1% or 817 individuals are in the labor force, with 7.5% or 61 of them unemployed. The age group with the highest labor force participation rate is 20 to 24 years, with 100.0% or 70 individuals in the labor force. Within the labor force, the 55 to 59 years age range has the highest percentage of unemployed individuals, with 22.3% or 35 of them being unemployed.
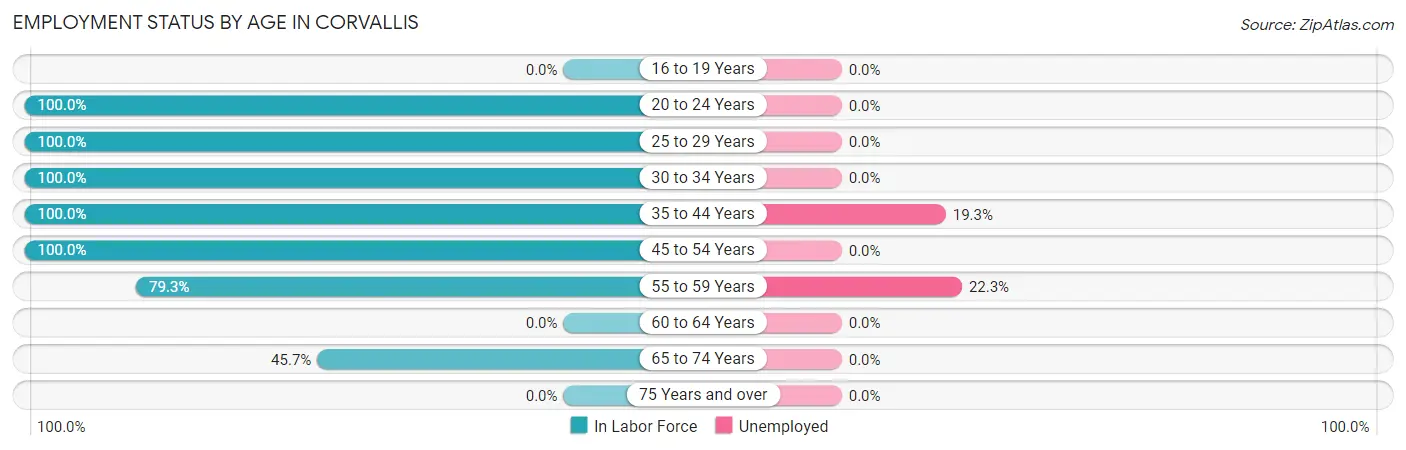
| Age Bracket | In Labor Force | Unemployed |
| 16 to 19 Years | 0 (0.0%) | 0 (0.0%) |
| 20 to 24 Years | 70 (100.0%) | 0 (0.0%) |
| 25 to 29 Years | 94 (100.0%) | 0 (0.0%) |
| 30 to 34 Years | 231 (100.0%) | 0 (0.0%) |
| 35 to 44 Years | 135 (100.0%) | 26 (19.3%) |
| 45 to 54 Years | 28 (100.0%) | 0 (0.0%) |
| 55 to 59 Years | 157 (79.3%) | 35 (22.3%) |
| 60 to 64 Years | 0 (0.0%) | 0 (0.0%) |
| 65 to 74 Years | 102 (45.7%) | 0 (0.0%) |
| 75 Years and over | 0 (0.0%) | 0 (0.0%) |
| Total | 817 (73.1%) | 61 (7.5%) |
Employment Status by Educational Attainment in Corvallis
According to labor force statistics for Corvallis, 90.1% of individuals (645) out of the total population between 25 and 64 years of age (716) are in the labor force, with 9.5% or 61 of them being unemployed. The group with the highest labor force participation rate are those with the educational attainment of high school diploma, with 100.0% or 204 individuals in the labor force. Within the labor force, individuals with less than high school education have the highest percentage of unemployment, with 100.0% or 35 of them being unemployed.
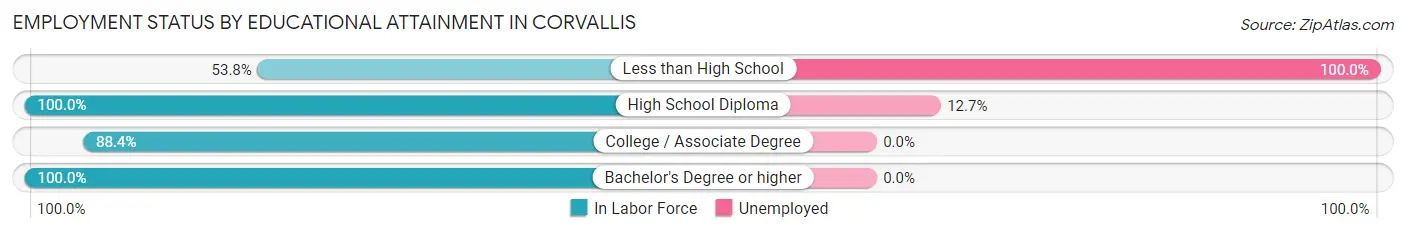
| Educational Attainment | In Labor Force | Unemployed |
| Less than High School | 35 (53.8%) | 65 (100.0%) |
| High School Diploma | 204 (100.0%) | 26 (12.7%) |
| College / Associate Degree | 311 (88.4%) | 0 (0.0%) |
| Bachelor's Degree or higher | 95 (100.0%) | 0 (0.0%) |
| Total | 645 (90.1%) | 68 (9.5%) |
Employment Occupations by Sex in Corvallis
Management, Business, Science and Arts Occupations
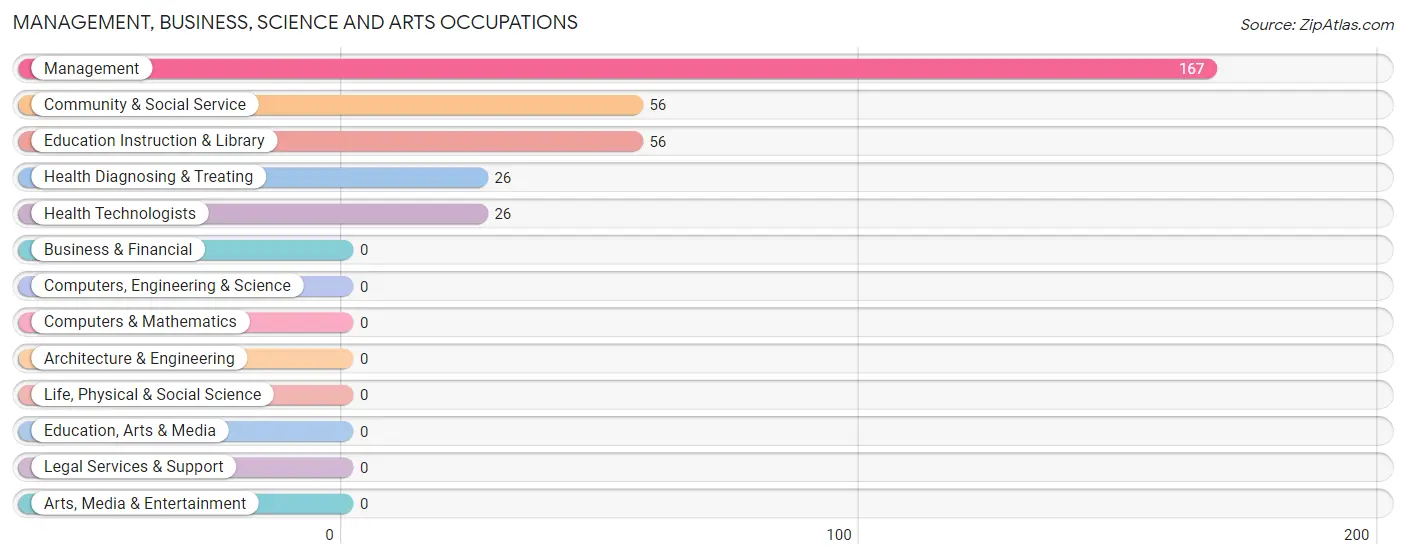
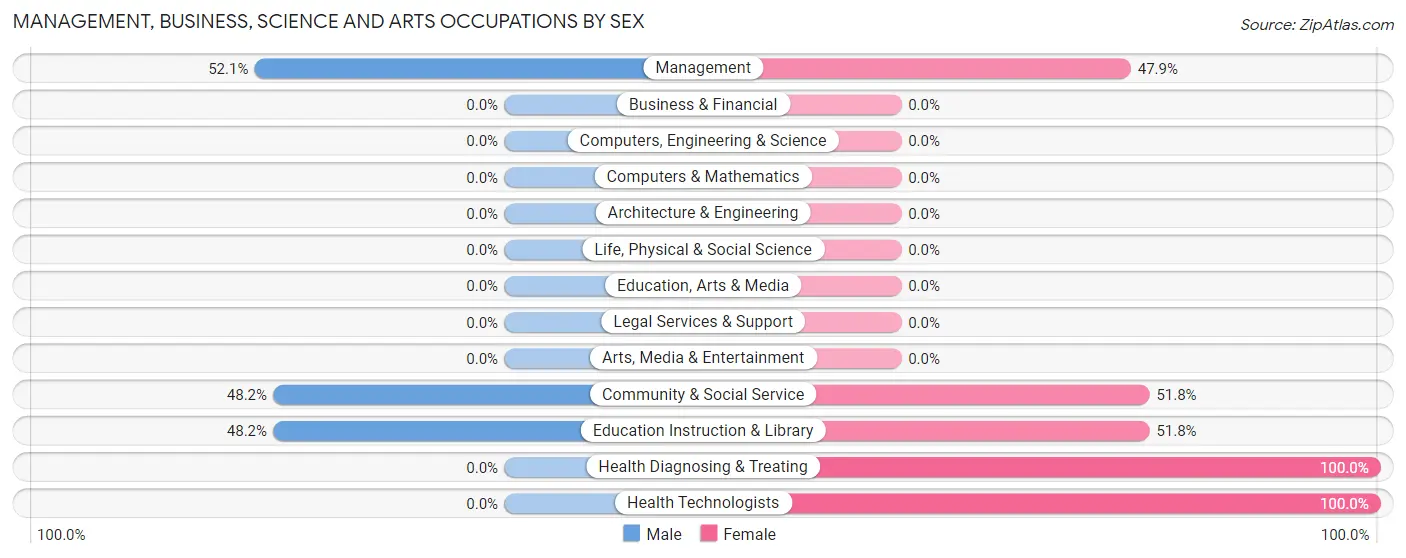
The most common Management, Business, Science and Arts occupations in Corvallis are Management (167 | 22.1%), Community & Social Service (56 | 7.4%), Education Instruction & Library (56 | 7.4%), Health Diagnosing & Treating (26 | 3.4%), and Health Technologists (26 | 3.4%).
Management, Business, Science and Arts Occupations by Sex
Within the Management, Business, Science and Arts occupations in Corvallis, the most male-oriented occupations are Management (52.1%), Community & Social Service (48.2%), and Education Instruction & Library (48.2%), while the most female-oriented occupations are Health Diagnosing & Treating (100.0%), Health Technologists (100.0%), and Community & Social Service (51.8%).
| Occupation | Male | Female |
| Management | 87 (52.1%) | 80 (47.9%) |
| Business & Financial | 0 (0.0%) | 0 (0.0%) |
| Computers, Engineering & Science | 0 (0.0%) | 0 (0.0%) |
| Computers & Mathematics | 0 (0.0%) | 0 (0.0%) |
| Architecture & Engineering | 0 (0.0%) | 0 (0.0%) |
| Life, Physical & Social Science | 0 (0.0%) | 0 (0.0%) |
| Community & Social Service | 27 (48.2%) | 29 (51.8%) |
| Education, Arts & Media | 0 (0.0%) | 0 (0.0%) |
| Legal Services & Support | 0 (0.0%) | 0 (0.0%) |
| Education Instruction & Library | 27 (48.2%) | 29 (51.8%) |
| Arts, Media & Entertainment | 0 (0.0%) | 0 (0.0%) |
| Health Diagnosing & Treating | 0 (0.0%) | 26 (100.0%) |
| Health Technologists | 0 (0.0%) | 26 (100.0%) |
| Total (Category) | 114 (45.8%) | 135 (54.2%) |
| Total (Overall) | 430 (56.9%) | 326 (43.1%) |
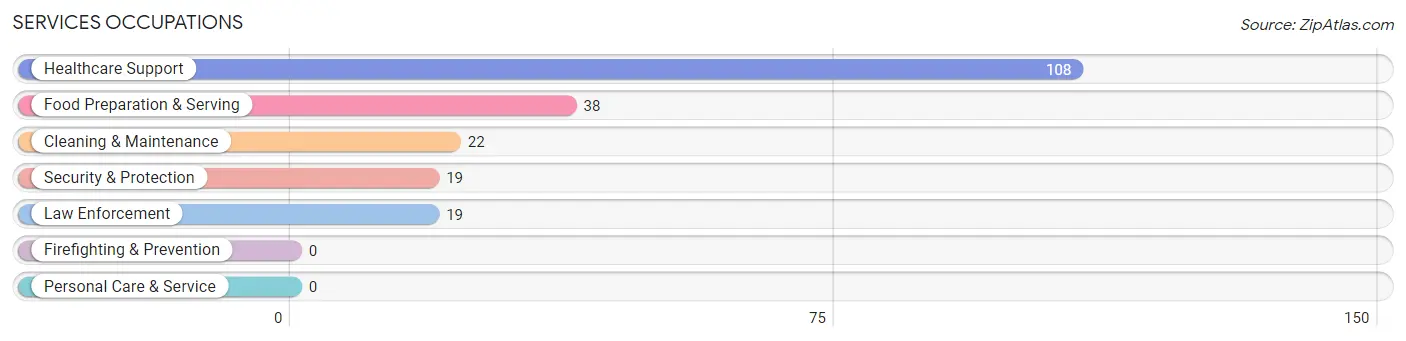
Services Occupations
The most common Services occupations in Corvallis are Healthcare Support (108 | 14.3%), Food Preparation & Serving (38 | 5.0%), Cleaning & Maintenance (22 | 2.9%), Security & Protection (19 | 2.5%), and Law Enforcement (19 | 2.5%).
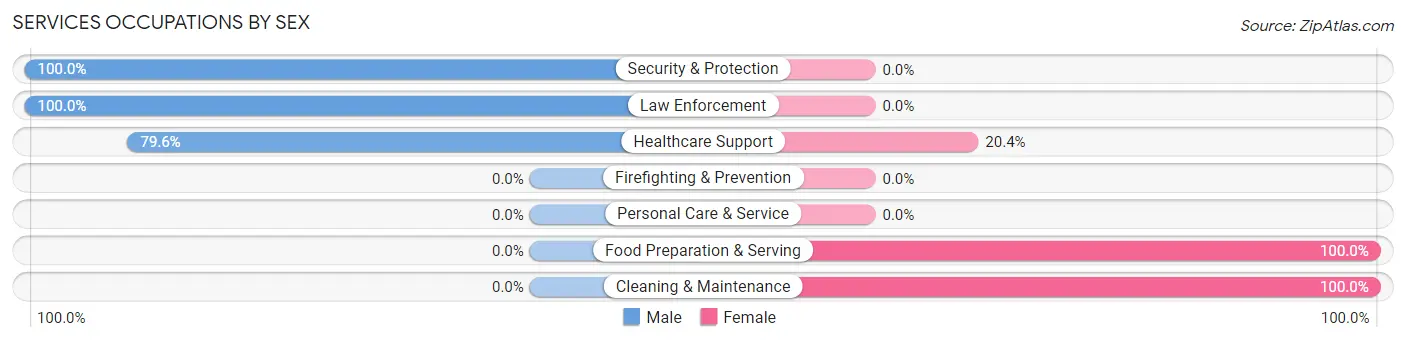
Services Occupations by Sex
Within the Services occupations in Corvallis, the most male-oriented occupations are Security & Protection (100.0%), Law Enforcement (100.0%), and Healthcare Support (79.6%), while the most female-oriented occupations are Food Preparation & Serving (100.0%), Cleaning & Maintenance (100.0%), and Healthcare Support (20.4%).
| Occupation | Male | Female |
| Healthcare Support | 86 (79.6%) | 22 (20.4%) |
| Security & Protection | 19 (100.0%) | 0 (0.0%) |
| Firefighting & Prevention | 0 (0.0%) | 0 (0.0%) |
| Law Enforcement | 19 (100.0%) | 0 (0.0%) |
| Food Preparation & Serving | 0 (0.0%) | 38 (100.0%) |
| Cleaning & Maintenance | 0 (0.0%) | 22 (100.0%) |
| Personal Care & Service | 0 (0.0%) | 0 (0.0%) |
| Total (Category) | 105 (56.1%) | 82 (43.9%) |
| Total (Overall) | 430 (56.9%) | 326 (43.1%) |
Sales and Office Occupations
The most common Sales and Office occupations in Corvallis are , and Sales & Related (65 | 8.6%).
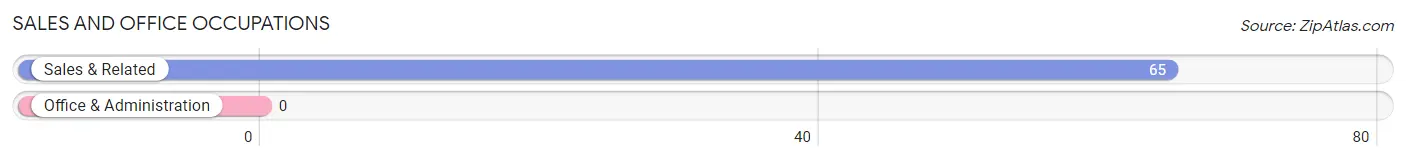
Sales and Office Occupations by Sex
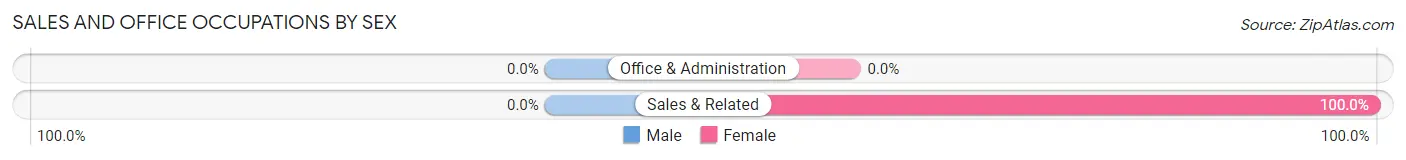
| Occupation | Male | Female |
| Sales & Related | 0 (0.0%) | 65 (100.0%) |
| Office & Administration | 0 (0.0%) | 0 (0.0%) |
| Total (Category) | 0 (0.0%) | 65 (100.0%) |
| Total (Overall) | 430 (56.9%) | 326 (43.1%) |
Natural Resources, Construction and Maintenance Occupations
The most common Natural Resources, Construction and Maintenance occupations in Corvallis are , and Construction & Extraction (139 | 18.4%).
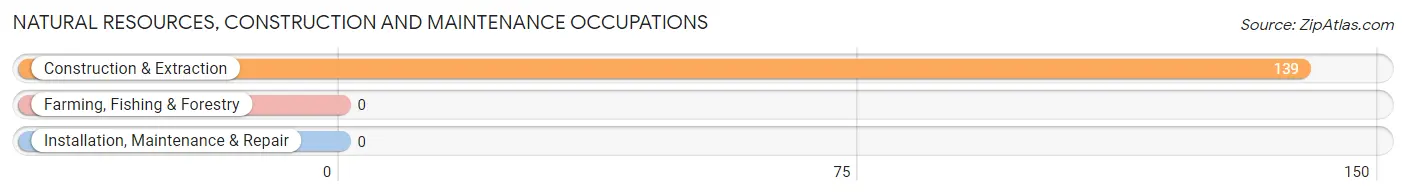
Natural Resources, Construction and Maintenance Occupations by Sex
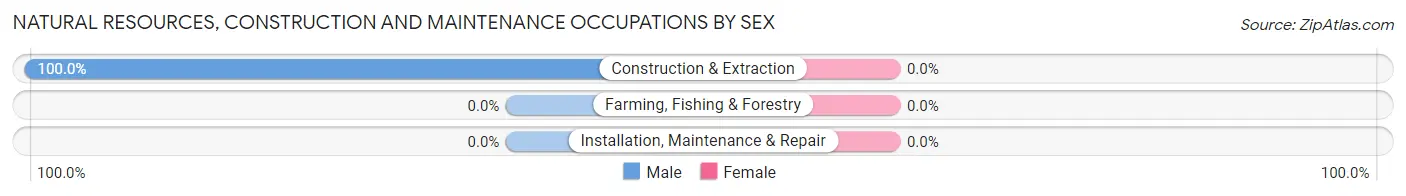
| Occupation | Male | Female |
| Farming, Fishing & Forestry | 0 (0.0%) | 0 (0.0%) |
| Construction & Extraction | 139 (100.0%) | 0 (0.0%) |
| Installation, Maintenance & Repair | 0 (0.0%) | 0 (0.0%) |
| Total (Category) | 139 (100.0%) | 0 (0.0%) |
| Total (Overall) | 430 (56.9%) | 326 (43.1%) |
Production, Transportation and Moving Occupations
The most common Production, Transportation and Moving occupations in Corvallis are Production (96 | 12.7%), and Transportation (20 | 2.6%).
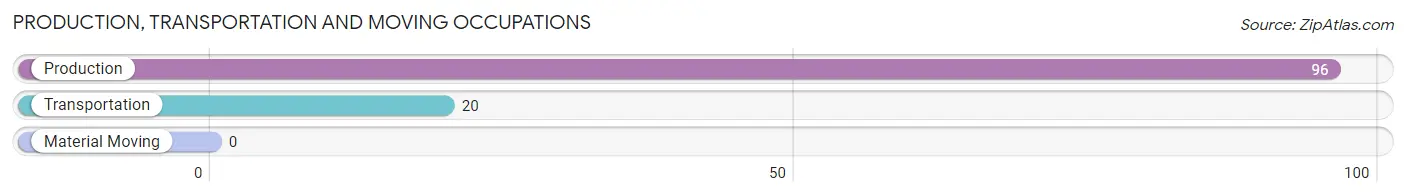
Production, Transportation and Moving Occupations by Sex
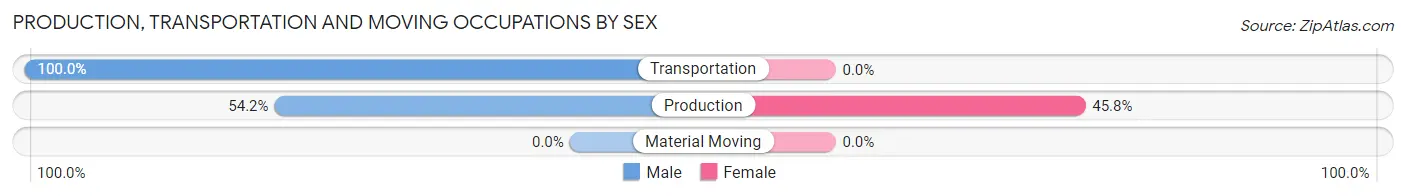
| Occupation | Male | Female |
| Production | 52 (54.2%) | 44 (45.8%) |
| Transportation | 20 (100.0%) | 0 (0.0%) |
| Material Moving | 0 (0.0%) | 0 (0.0%) |
| Total (Category) | 72 (62.1%) | 44 (37.9%) |
| Total (Overall) | 430 (56.9%) | 326 (43.1%) |
Employment Industries by Sex in Corvallis
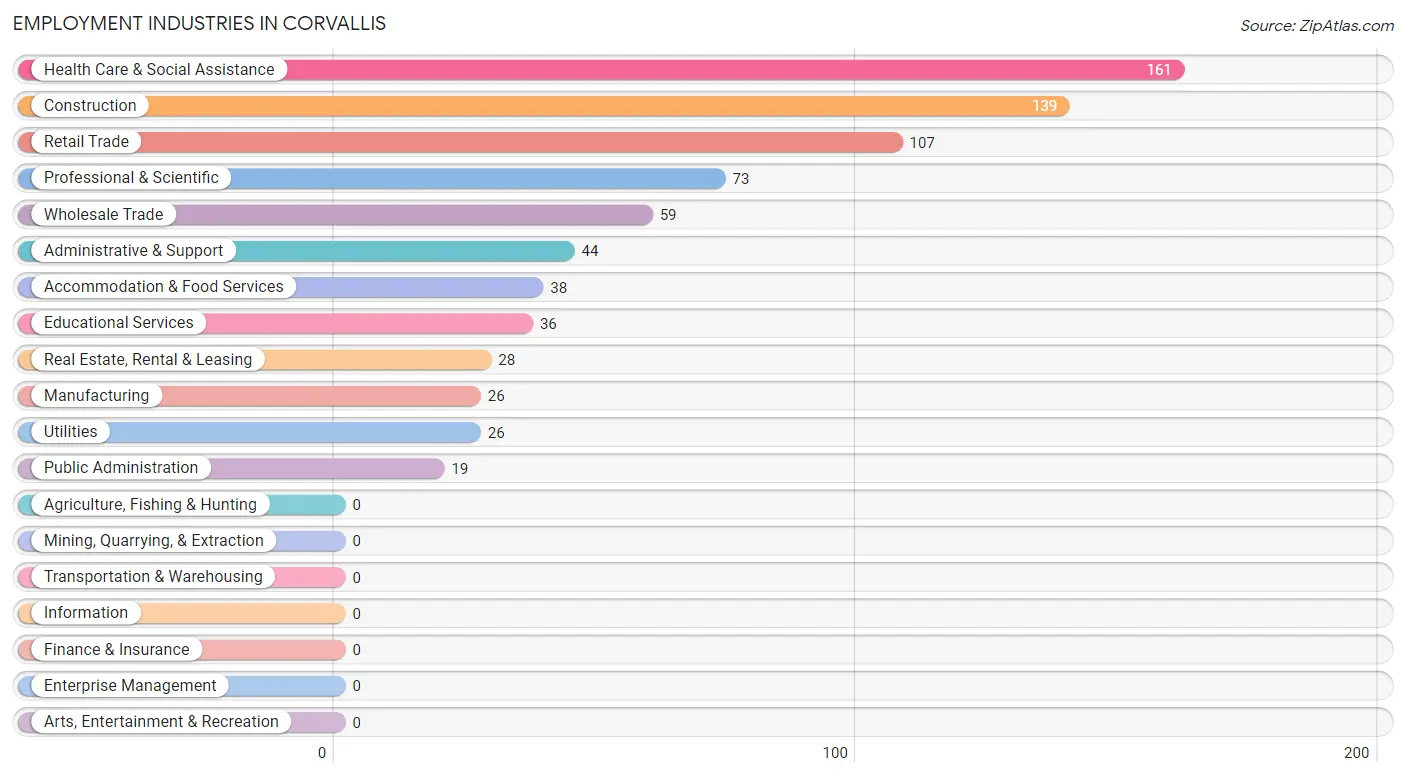
Employment Industries in Corvallis
The major employment industries in Corvallis include Health Care & Social Assistance (161 | 21.3%), Construction (139 | 18.4%), Retail Trade (107 | 14.1%), Professional & Scientific (73 | 9.7%), and Wholesale Trade (59 | 7.8%).
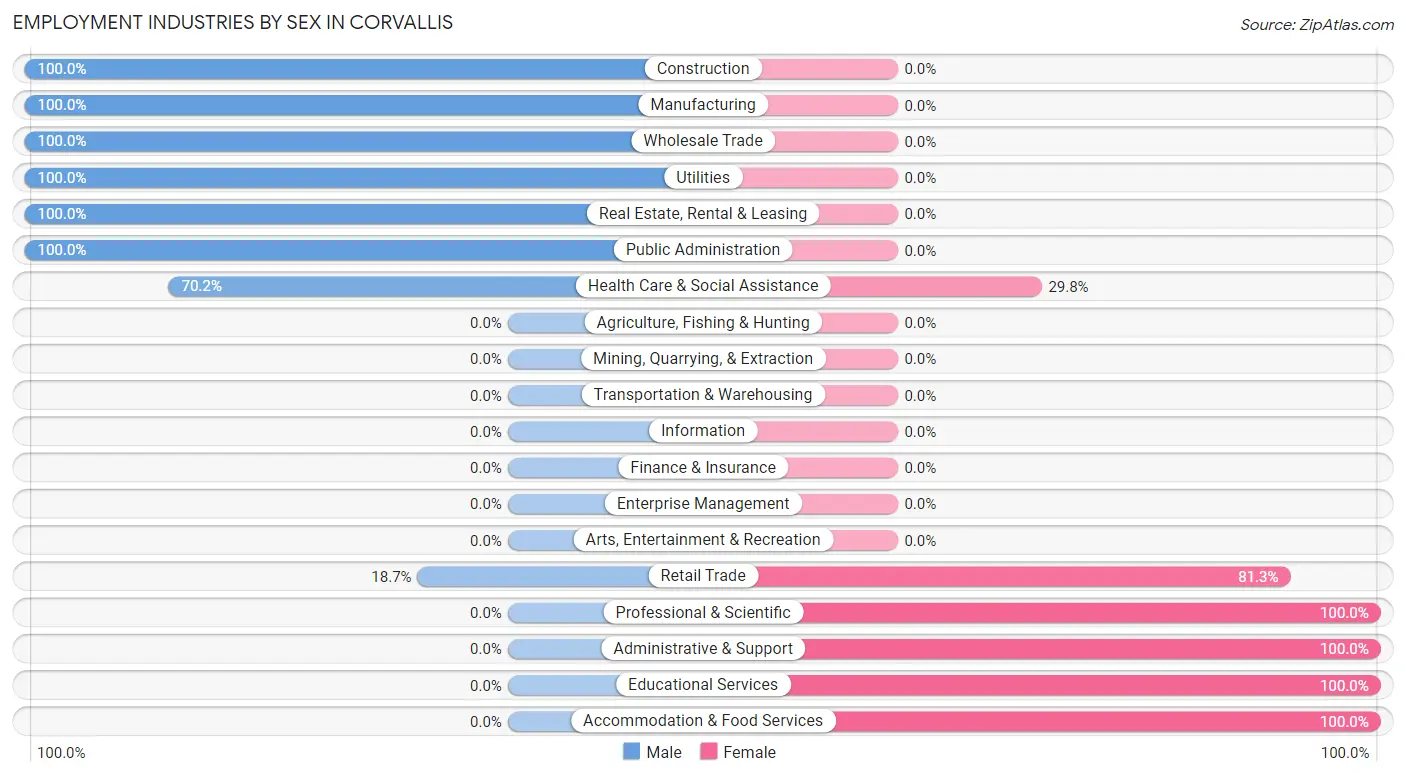
Employment Industries by Sex in Corvallis
The Corvallis industries that see more men than women are Construction (100.0%), Manufacturing (100.0%), and Wholesale Trade (100.0%), whereas the industries that tend to have a higher number of women are Professional & Scientific (100.0%), Administrative & Support (100.0%), and Educational Services (100.0%).
| Industry | Male | Female |
| Agriculture, Fishing & Hunting | 0 (0.0%) | 0 (0.0%) |
| Mining, Quarrying, & Extraction | 0 (0.0%) | 0 (0.0%) |
| Construction | 139 (100.0%) | 0 (0.0%) |
| Manufacturing | 26 (100.0%) | 0 (0.0%) |
| Wholesale Trade | 59 (100.0%) | 0 (0.0%) |
| Retail Trade | 20 (18.7%) | 87 (81.3%) |
| Transportation & Warehousing | 0 (0.0%) | 0 (0.0%) |
| Utilities | 26 (100.0%) | 0 (0.0%) |
| Information | 0 (0.0%) | 0 (0.0%) |
| Finance & Insurance | 0 (0.0%) | 0 (0.0%) |
| Real Estate, Rental & Leasing | 28 (100.0%) | 0 (0.0%) |
| Professional & Scientific | 0 (0.0%) | 73 (100.0%) |
| Enterprise Management | 0 (0.0%) | 0 (0.0%) |
| Administrative & Support | 0 (0.0%) | 44 (100.0%) |
| Educational Services | 0 (0.0%) | 36 (100.0%) |
| Health Care & Social Assistance | 113 (70.2%) | 48 (29.8%) |
| Arts, Entertainment & Recreation | 0 (0.0%) | 0 (0.0%) |
| Accommodation & Food Services | 0 (0.0%) | 38 (100.0%) |
| Public Administration | 19 (100.0%) | 0 (0.0%) |
| Total | 430 (56.9%) | 326 (43.1%) |
Education in Corvallis
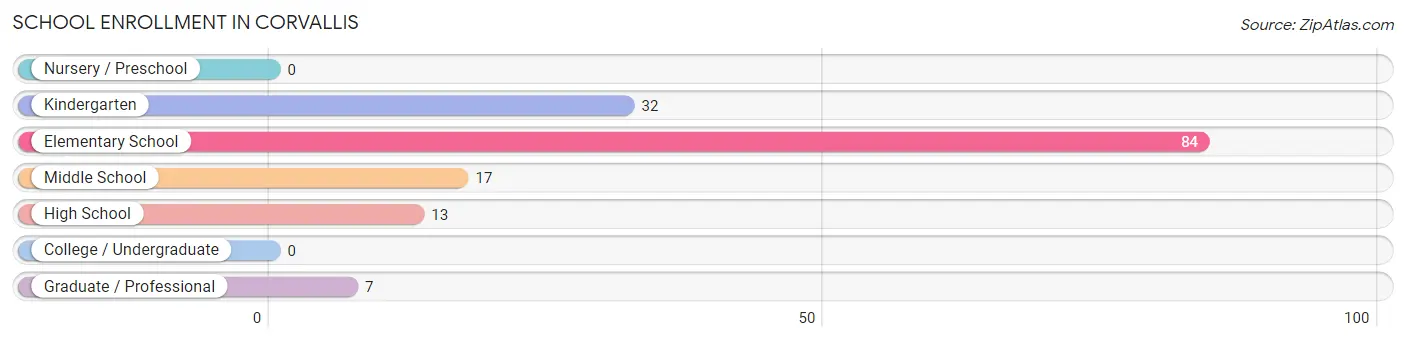
School Enrollment in Corvallis
The most common levels of schooling among the 153 students in Corvallis are elementary school (84 | 54.9%), kindergarten (32 | 20.9%), and middle school (17 | 11.1%).
| School Level | # Students | % Students |
| Nursery / Preschool | 0 | 0.0% |
| Kindergarten | 32 | 20.9% |
| Elementary School | 84 | 54.9% |
| Middle School | 17 | 11.1% |
| High School | 13 | 8.5% |
| College / Undergraduate | 0 | 0.0% |
| Graduate / Professional | 7 | 4.6% |
| Total | 153 | 100.0% |
School Enrollment by Age by Funding Source in Corvallis
Out of a total of 153 students who are enrolled in schools in Corvallis, 21 (13.7%) attend a private institution, while the remaining 132 (86.3%) are enrolled in public schools. The age group of 10 to 14 year olds has the highest likelihood of being enrolled in private schools, with 21 (33.9% in the age bracket) enrolled. Conversely, the age group of 5 to 9 year old has the lowest likelihood of being enrolled in a private school, with 75 (100.0% in the age bracket) attending a public institution.
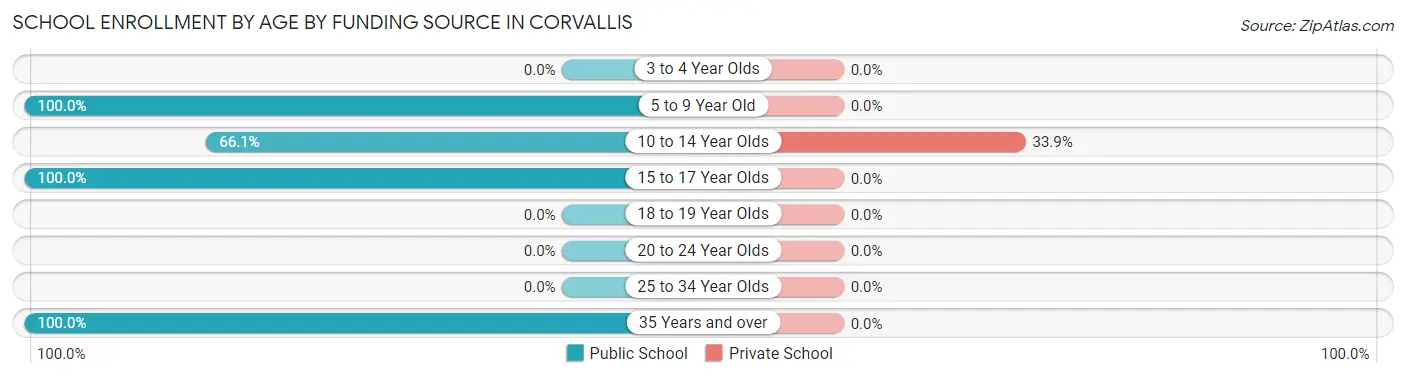
| Age Bracket | Public School | Private School |
| 3 to 4 Year Olds | 0 (0.0%) | 0 (0.0%) |
| 5 to 9 Year Old | 75 (100.0%) | 0 (0.0%) |
| 10 to 14 Year Olds | 41 (66.1%) | 21 (33.9%) |
| 15 to 17 Year Olds | 9 (100.0%) | 0 (0.0%) |
| 18 to 19 Year Olds | 0 (0.0%) | 0 (0.0%) |
| 20 to 24 Year Olds | 0 (0.0%) | 0 (0.0%) |
| 25 to 34 Year Olds | 0 (0.0%) | 0 (0.0%) |
| 35 Years and over | 7 (100.0%) | 0 (0.0%) |
| Total | 132 (86.3%) | 21 (13.7%) |
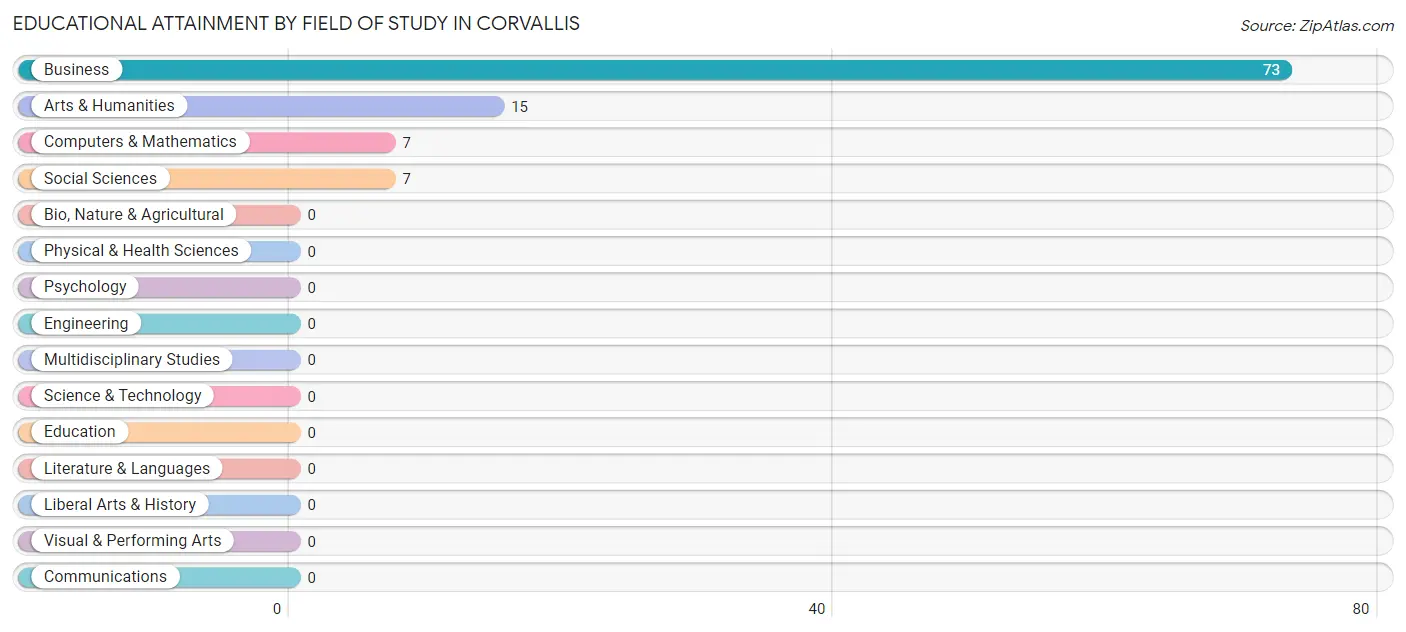
Educational Attainment by Field of Study in Corvallis
Business (73 | 71.6%), arts & humanities (15 | 14.7%), computers & mathematics (7 | 6.9%), and social sciences (7 | 6.9%) are the most common fields of study among 102 individuals in Corvallis who have obtained a bachelor's degree or higher.
| Field of Study | # Graduates | % Graduates |
| Computers & Mathematics | 7 | 6.9% |
| Bio, Nature & Agricultural | 0 | 0.0% |
| Physical & Health Sciences | 0 | 0.0% |
| Psychology | 0 | 0.0% |
| Social Sciences | 7 | 6.9% |
| Engineering | 0 | 0.0% |
| Multidisciplinary Studies | 0 | 0.0% |
| Science & Technology | 0 | 0.0% |
| Business | 73 | 71.6% |
| Education | 0 | 0.0% |
| Literature & Languages | 0 | 0.0% |
| Liberal Arts & History | 0 | 0.0% |
| Visual & Performing Arts | 0 | 0.0% |
| Communications | 0 | 0.0% |
| Arts & Humanities | 15 | 14.7% |
| Total | 102 | 100.0% |
Transportation & Commute in Corvallis
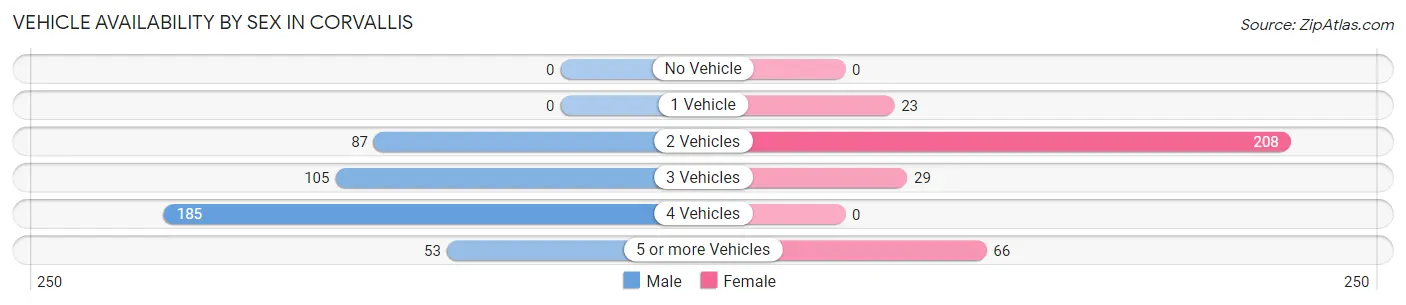
Vehicle Availability by Sex in Corvallis
The most prevalent vehicle ownership categories in Corvallis are males with 4 vehicles (185, accounting for 43.0%) and females with 4 vehicles (0, making up 56.8%).
| Vehicles Available | Male | Female |
| No Vehicle | 0 (0.0%) | 0 (0.0%) |
| 1 Vehicle | 0 (0.0%) | 23 (7.1%) |
| 2 Vehicles | 87 (20.2%) | 208 (63.8%) |
| 3 Vehicles | 105 (24.4%) | 29 (8.9%) |
| 4 Vehicles | 185 (43.0%) | 0 (0.0%) |
| 5 or more Vehicles | 53 (12.3%) | 66 (20.3%) |
| Total | 430 (100.0%) | 326 (100.0%) |
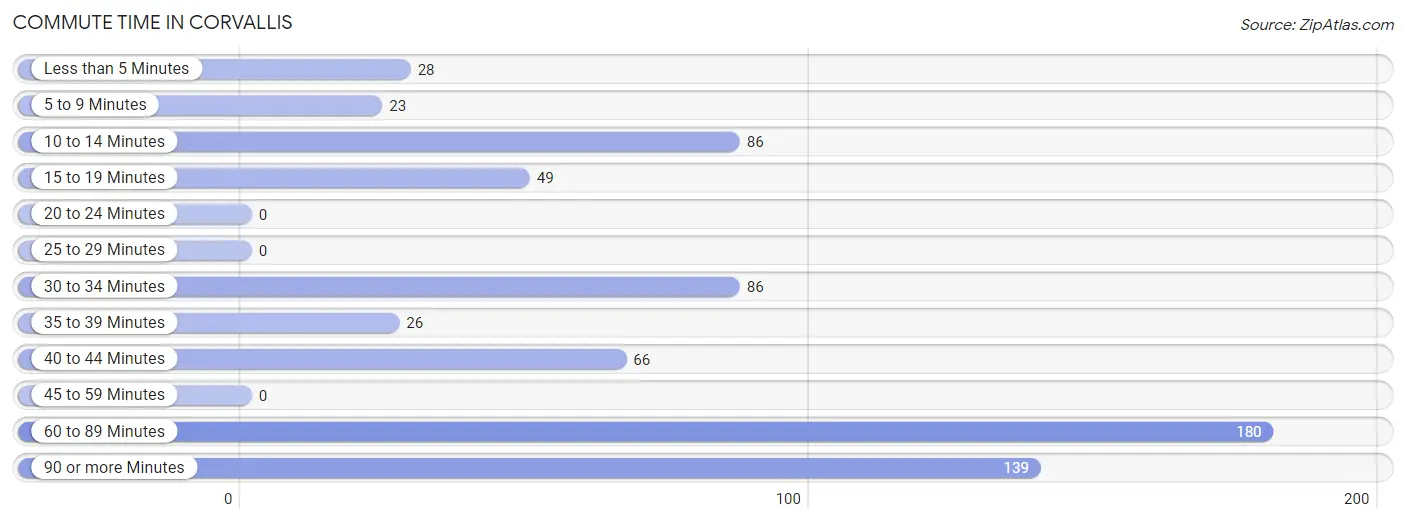
Commute Time in Corvallis
The most frequently occuring commute durations in Corvallis are 60 to 89 minutes (180 commuters, 26.4%), 90 or more minutes (139 commuters, 20.3%), and 10 to 14 minutes (86 commuters, 12.6%).
| Commute Time | # Commuters | % Commuters |
| Less than 5 Minutes | 28 | 4.1% |
| 5 to 9 Minutes | 23 | 3.4% |
| 10 to 14 Minutes | 86 | 12.6% |
| 15 to 19 Minutes | 49 | 7.2% |
| 20 to 24 Minutes | 0 | 0.0% |
| 25 to 29 Minutes | 0 | 0.0% |
| 30 to 34 Minutes | 86 | 12.6% |
| 35 to 39 Minutes | 26 | 3.8% |
| 40 to 44 Minutes | 66 | 9.7% |
| 45 to 59 Minutes | 0 | 0.0% |
| 60 to 89 Minutes | 180 | 26.4% |
| 90 or more Minutes | 139 | 20.3% |
Commute Time by Sex in Corvallis
The most common commute times in Corvallis are 60 to 89 minutes (158 commuters, 36.7%) for males and 90 or more minutes (119 commuters, 47.0%) for females.
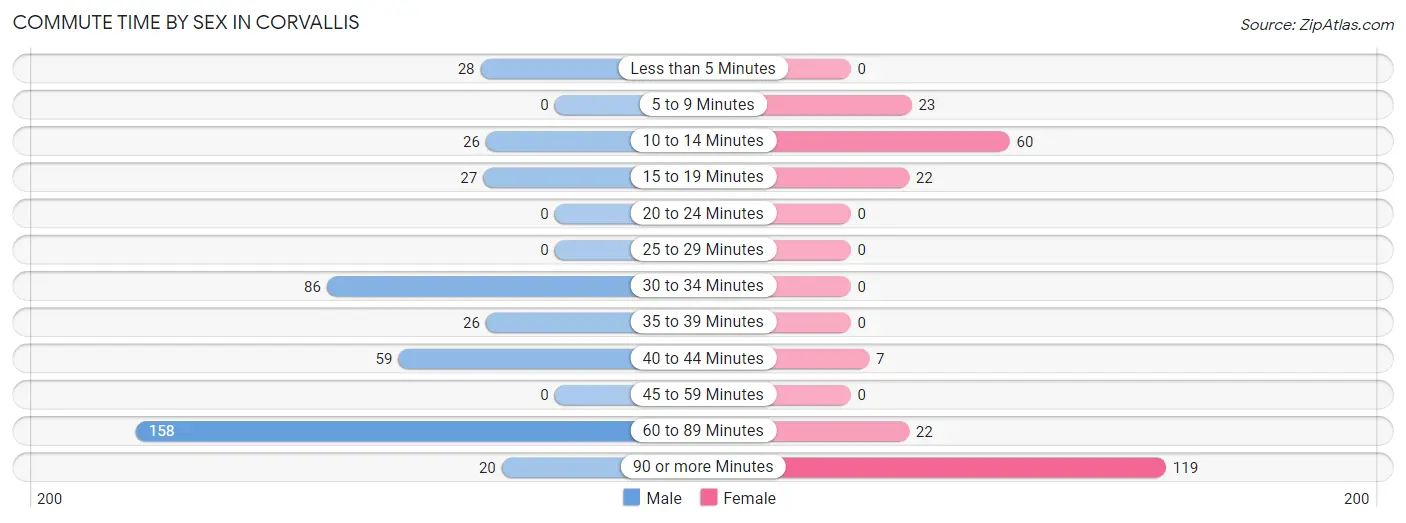
| Commute Time | Male | Female |
| Less than 5 Minutes | 28 (6.5%) | 0 (0.0%) |
| 5 to 9 Minutes | 0 (0.0%) | 23 (9.1%) |
| 10 to 14 Minutes | 26 (6.0%) | 60 (23.7%) |
| 15 to 19 Minutes | 27 (6.3%) | 22 (8.7%) |
| 20 to 24 Minutes | 0 (0.0%) | 0 (0.0%) |
| 25 to 29 Minutes | 0 (0.0%) | 0 (0.0%) |
| 30 to 34 Minutes | 86 (20.0%) | 0 (0.0%) |
| 35 to 39 Minutes | 26 (6.0%) | 0 (0.0%) |
| 40 to 44 Minutes | 59 (13.7%) | 7 (2.8%) |
| 45 to 59 Minutes | 0 (0.0%) | 0 (0.0%) |
| 60 to 89 Minutes | 158 (36.7%) | 22 (8.7%) |
| 90 or more Minutes | 20 (4.6%) | 119 (47.0%) |
Time of Departure to Work by Sex in Corvallis
The most frequent times of departure to work in Corvallis are 6:00 AM to 6:29 AM (139, 32.3%) for males and 12:00 AM to 4:59 AM (119, 47.0%) for females.
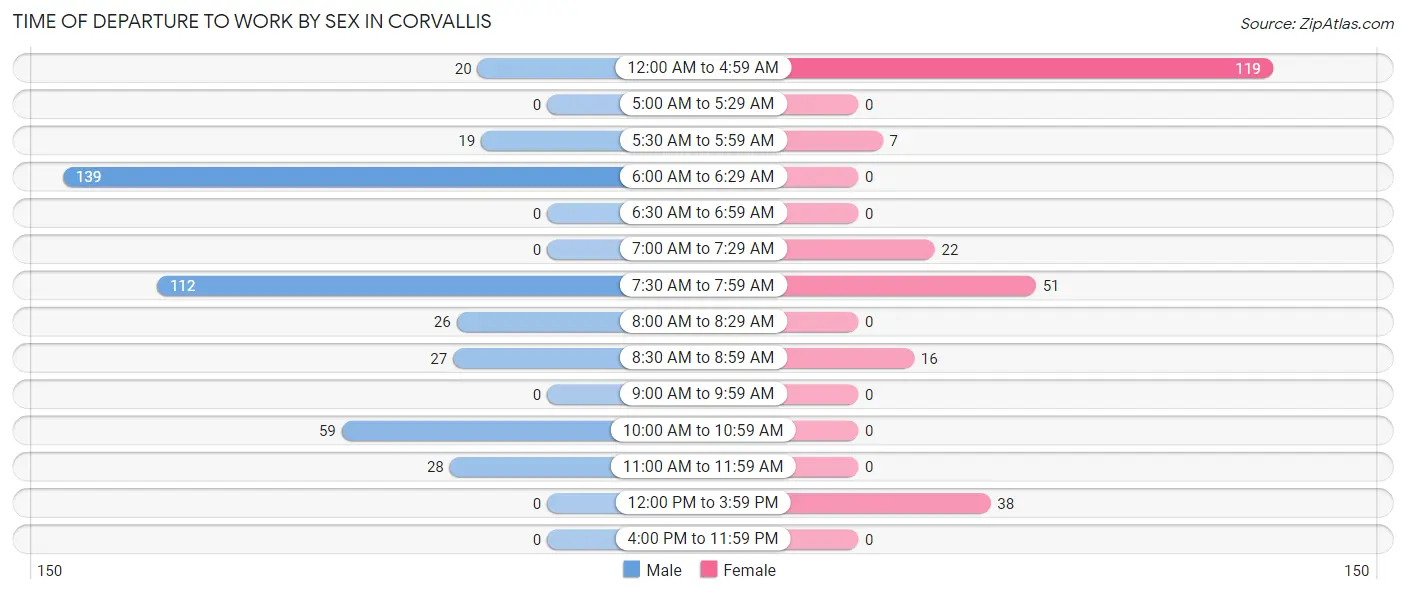
| Time of Departure | Male | Female |
| 12:00 AM to 4:59 AM | 20 (4.6%) | 119 (47.0%) |
| 5:00 AM to 5:29 AM | 0 (0.0%) | 0 (0.0%) |
| 5:30 AM to 5:59 AM | 19 (4.4%) | 7 (2.8%) |
| 6:00 AM to 6:29 AM | 139 (32.3%) | 0 (0.0%) |
| 6:30 AM to 6:59 AM | 0 (0.0%) | 0 (0.0%) |
| 7:00 AM to 7:29 AM | 0 (0.0%) | 22 (8.7%) |
| 7:30 AM to 7:59 AM | 112 (26.1%) | 51 (20.2%) |
| 8:00 AM to 8:29 AM | 26 (6.0%) | 0 (0.0%) |
| 8:30 AM to 8:59 AM | 27 (6.3%) | 16 (6.3%) |
| 9:00 AM to 9:59 AM | 0 (0.0%) | 0 (0.0%) |
| 10:00 AM to 10:59 AM | 59 (13.7%) | 0 (0.0%) |
| 11:00 AM to 11:59 AM | 28 (6.5%) | 0 (0.0%) |
| 12:00 PM to 3:59 PM | 0 (0.0%) | 38 (15.0%) |
| 4:00 PM to 11:59 PM | 0 (0.0%) | 0 (0.0%) |
| Total | 430 (100.0%) | 253 (100.0%) |
Housing Occupancy in Corvallis
Occupancy by Ownership in Corvallis
Of the total 574 dwellings in Corvallis, owner-occupied units account for 362 (63.1%), while renter-occupied units make up 212 (36.9%).
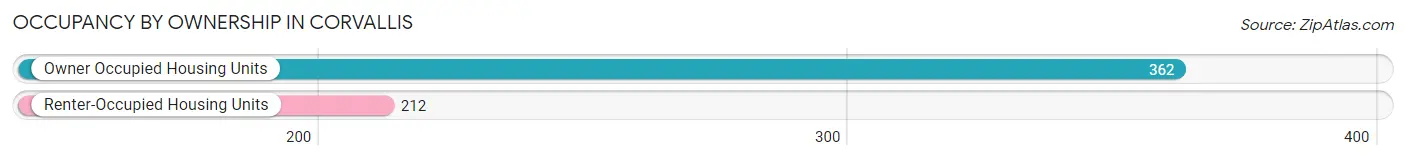
| Occupancy | # Housing Units | % Housing Units |
| Owner Occupied Housing Units | 362 | 63.1% |
| Renter-Occupied Housing Units | 212 | 36.9% |
| Total Occupied Housing Units | 574 | 100.0% |
Occupancy by Household Size in Corvallis
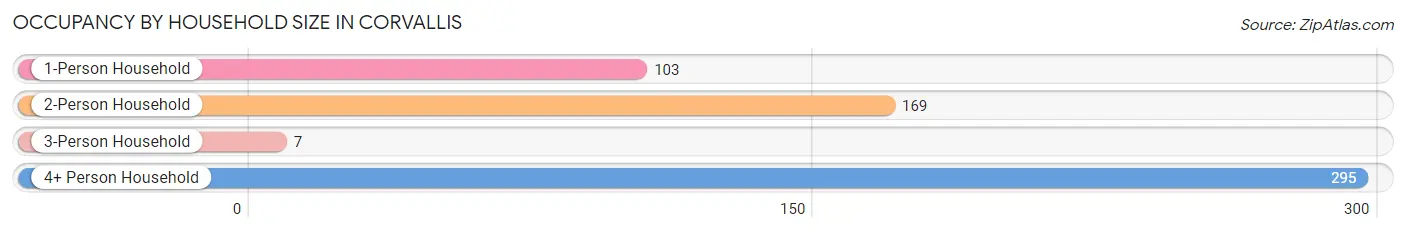
| Household Size | # Housing Units | % Housing Units |
| 1-Person Household | 103 | 17.9% |
| 2-Person Household | 169 | 29.4% |
| 3-Person Household | 7 | 1.2% |
| 4+ Person Household | 295 | 51.4% |
| Total Housing Units | 574 | 100.0% |
Occupancy by Ownership by Household Size in Corvallis
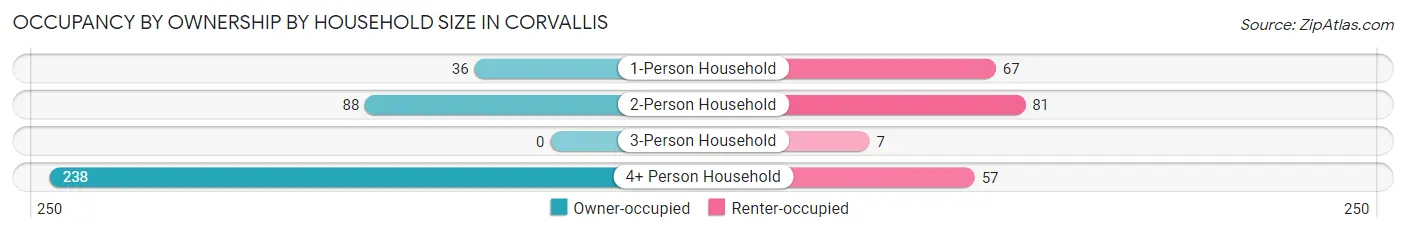
| Household Size | Owner-occupied | Renter-occupied |
| 1-Person Household | 36 (34.9%) | 67 (65.0%) |
| 2-Person Household | 88 (52.1%) | 81 (47.9%) |
| 3-Person Household | 0 (0.0%) | 7 (100.0%) |
| 4+ Person Household | 238 (80.7%) | 57 (19.3%) |
| Total Housing Units | 362 (63.1%) | 212 (36.9%) |
Occupancy by Educational Attainment in Corvallis
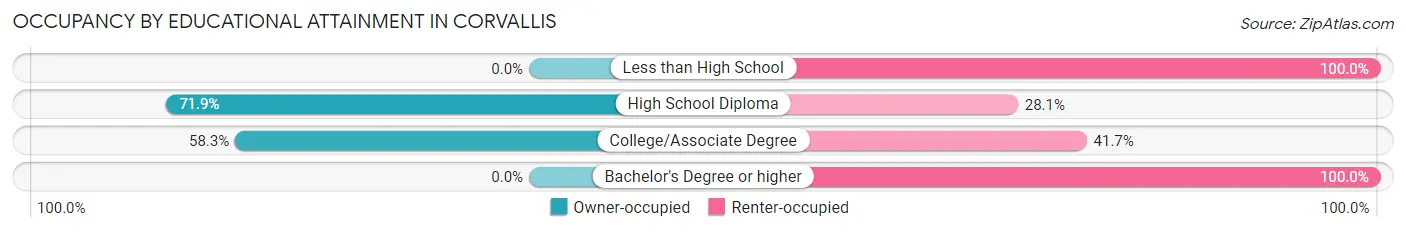
| Household Size | Owner-occupied | Renter-occupied |
| Less than High School | 0 (0.0%) | 35 (100.0%) |
| High School Diploma | 274 (71.9%) | 107 (28.1%) |
| College/Associate Degree | 88 (58.3%) | 63 (41.7%) |
| Bachelor's Degree or higher | 0 (0.0%) | 7 (100.0%) |
Occupancy by Age of Householder in Corvallis
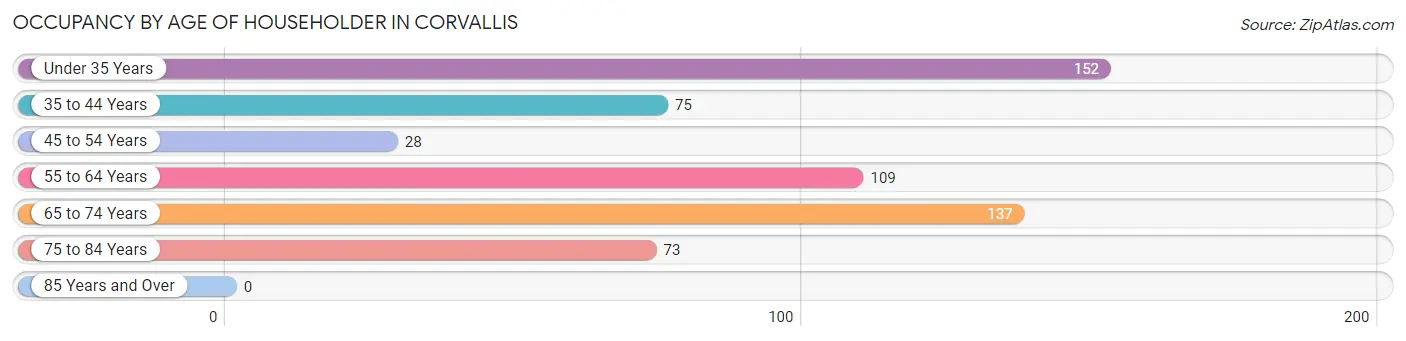
| Age Bracket | # Households | % Households |
| Under 35 Years | 152 | 26.5% |
| 35 to 44 Years | 75 | 13.1% |
| 45 to 54 Years | 28 | 4.9% |
| 55 to 64 Years | 109 | 19.0% |
| 65 to 74 Years | 137 | 23.9% |
| 75 to 84 Years | 73 | 12.7% |
| 85 Years and Over | 0 | 0.0% |
| Total | 574 | 100.0% |
Housing Finances in Corvallis
Median Income by Occupancy in Corvallis
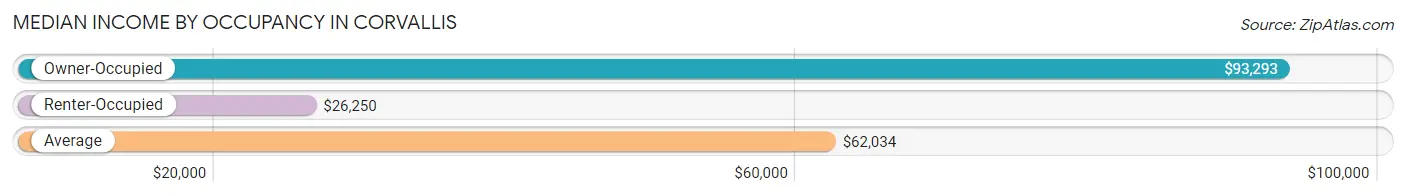
| Occupancy Type | # Households | Median Income |
| Owner-Occupied | 362 (63.1%) | $93,293 |
| Renter-Occupied | 212 (36.9%) | $26,250 |
| Average | 574 (100.0%) | $62,034 |
Occupancy by Householder Income Bracket in Corvallis
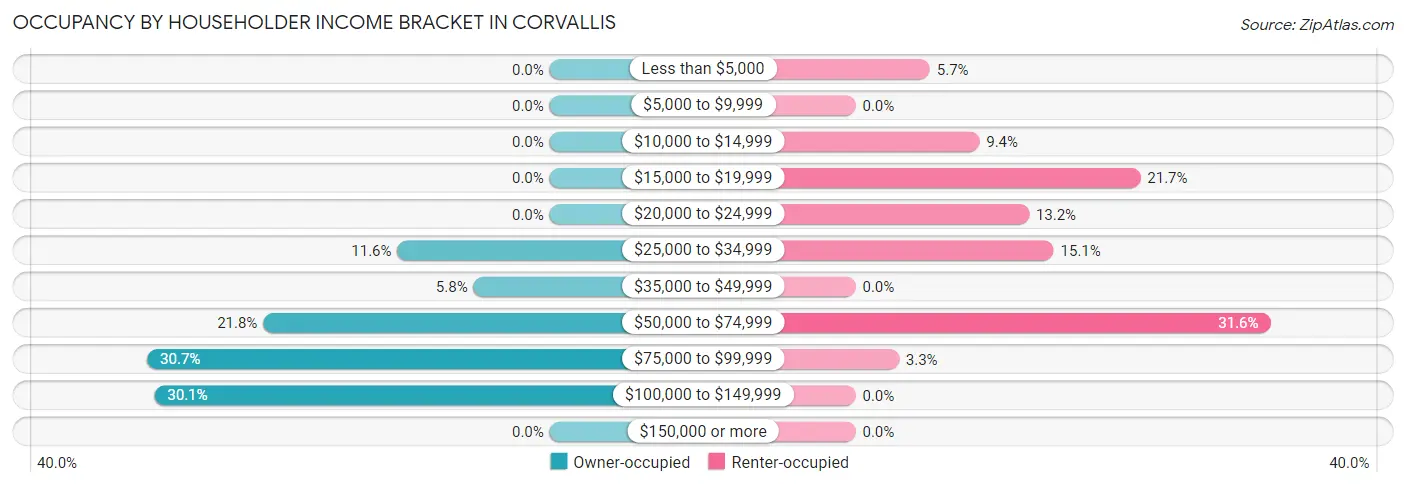
| Income Bracket | Owner-occupied | Renter-occupied |
| Less than $5,000 | 0 (0.0%) | 12 (5.7%) |
| $5,000 to $9,999 | 0 (0.0%) | 0 (0.0%) |
| $10,000 to $14,999 | 0 (0.0%) | 20 (9.4%) |
| $15,000 to $19,999 | 0 (0.0%) | 46 (21.7%) |
| $20,000 to $24,999 | 0 (0.0%) | 28 (13.2%) |
| $25,000 to $34,999 | 42 (11.6%) | 32 (15.1%) |
| $35,000 to $49,999 | 21 (5.8%) | 0 (0.0%) |
| $50,000 to $74,999 | 79 (21.8%) | 67 (31.6%) |
| $75,000 to $99,999 | 111 (30.7%) | 7 (3.3%) |
| $100,000 to $149,999 | 109 (30.1%) | 0 (0.0%) |
| $150,000 or more | 0 (0.0%) | 0 (0.0%) |
| Total | 362 (100.0%) | 212 (100.0%) |
Monthly Housing Cost Tiers in Corvallis
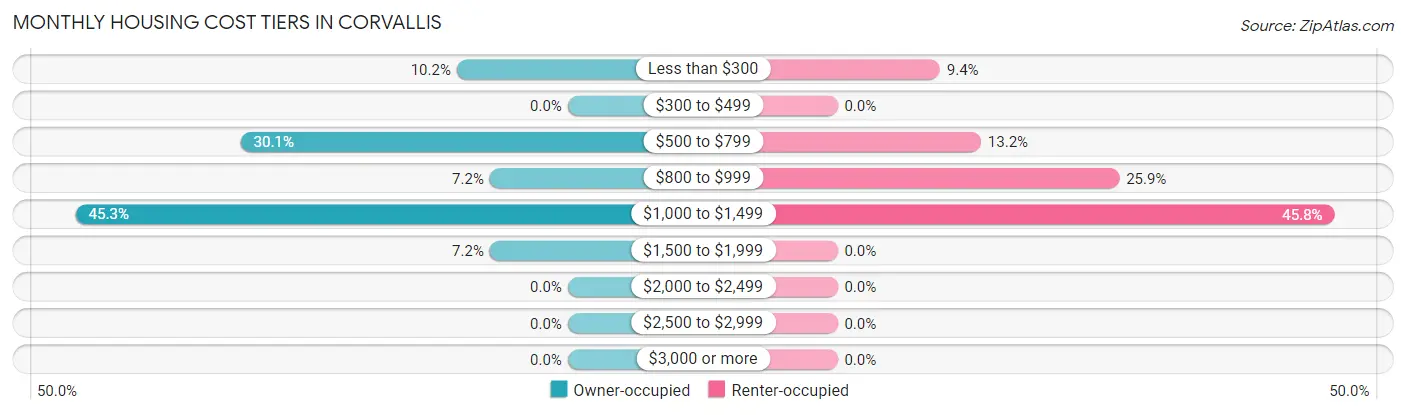
| Monthly Cost | Owner-occupied | Renter-occupied |
| Less than $300 | 37 (10.2%) | 20 (9.4%) |
| $300 to $499 | 0 (0.0%) | 0 (0.0%) |
| $500 to $799 | 109 (30.1%) | 28 (13.2%) |
| $800 to $999 | 26 (7.2%) | 55 (25.9%) |
| $1,000 to $1,499 | 164 (45.3%) | 97 (45.8%) |
| $1,500 to $1,999 | 26 (7.2%) | 0 (0.0%) |
| $2,000 to $2,499 | 0 (0.0%) | 0 (0.0%) |
| $2,500 to $2,999 | 0 (0.0%) | 0 (0.0%) |
| $3,000 or more | 0 (0.0%) | 0 (0.0%) |
| Total | 362 (100.0%) | 212 (100.0%) |
Physical Housing Characteristics in Corvallis
Housing Structures in Corvallis
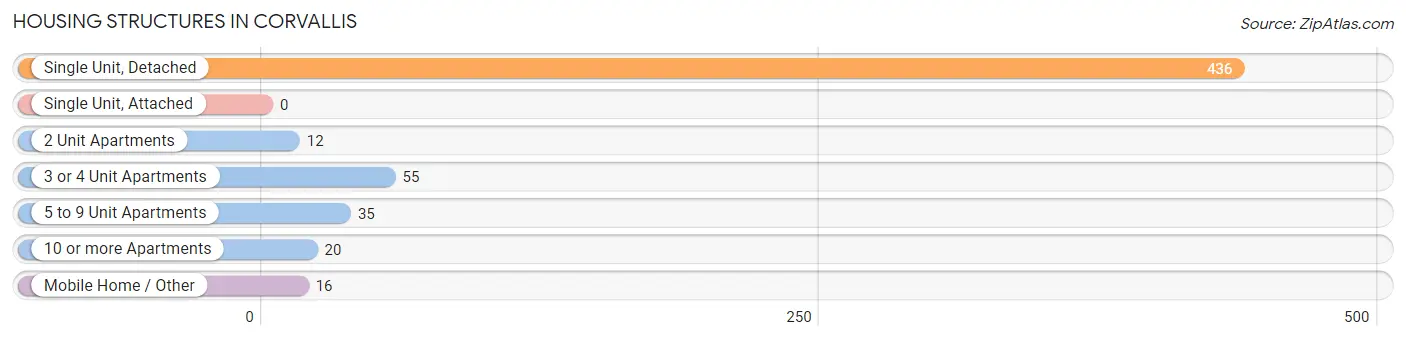
| Structure Type | # Housing Units | % Housing Units |
| Single Unit, Detached | 436 | 76.0% |
| Single Unit, Attached | 0 | 0.0% |
| 2 Unit Apartments | 12 | 2.1% |
| 3 or 4 Unit Apartments | 55 | 9.6% |
| 5 to 9 Unit Apartments | 35 | 6.1% |
| 10 or more Apartments | 20 | 3.5% |
| Mobile Home / Other | 16 | 2.8% |
| Total | 574 | 100.0% |
Housing Structures by Occupancy in Corvallis
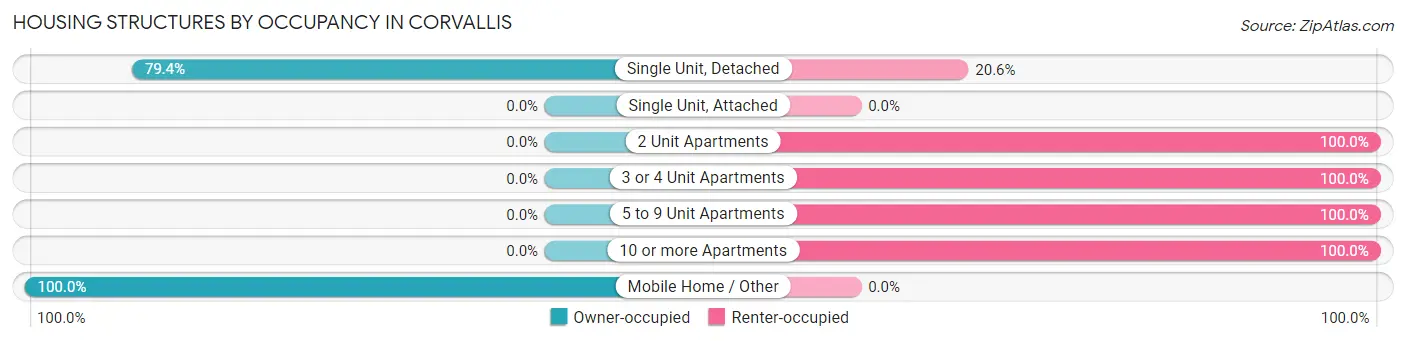
| Structure Type | Owner-occupied | Renter-occupied |
| Single Unit, Detached | 346 (79.4%) | 90 (20.6%) |
| Single Unit, Attached | 0 (0.0%) | 0 (0.0%) |
| 2 Unit Apartments | 0 (0.0%) | 12 (100.0%) |
| 3 or 4 Unit Apartments | 0 (0.0%) | 55 (100.0%) |
| 5 to 9 Unit Apartments | 0 (0.0%) | 35 (100.0%) |
| 10 or more Apartments | 0 (0.0%) | 20 (100.0%) |
| Mobile Home / Other | 16 (100.0%) | 0 (0.0%) |
| Total | 362 (63.1%) | 212 (36.9%) |
Housing Structures by Number of Rooms in Corvallis
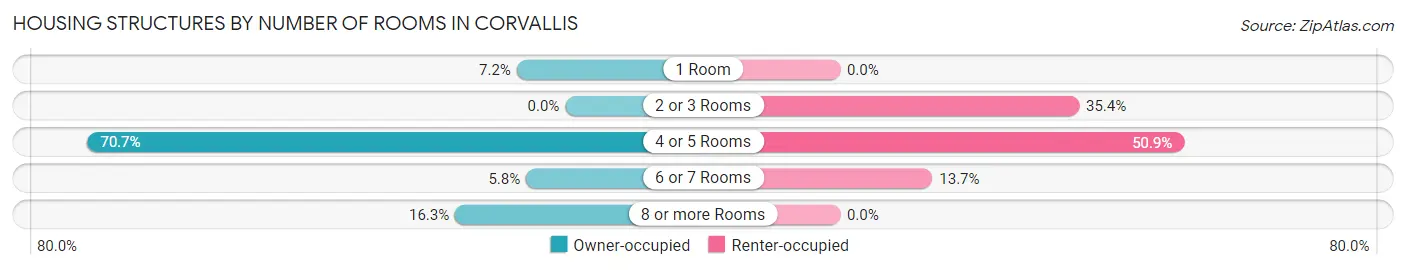
| Number of Rooms | Owner-occupied | Renter-occupied |
| 1 Room | 26 (7.2%) | 0 (0.0%) |
| 2 or 3 Rooms | 0 (0.0%) | 75 (35.4%) |
| 4 or 5 Rooms | 256 (70.7%) | 108 (50.9%) |
| 6 or 7 Rooms | 21 (5.8%) | 29 (13.7%) |
| 8 or more Rooms | 59 (16.3%) | 0 (0.0%) |
| Total | 362 (100.0%) | 212 (100.0%) |
Housing Structure by Heating Type in Corvallis
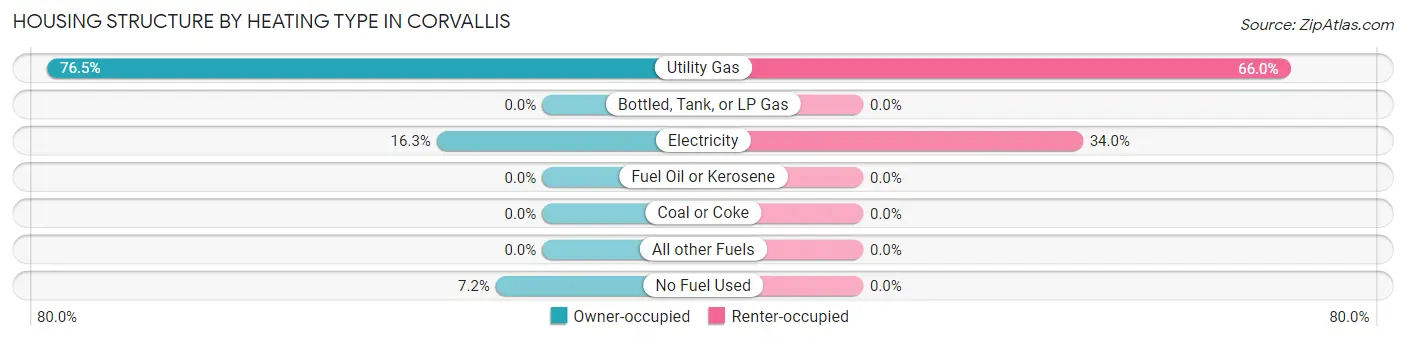
| Heating Type | Owner-occupied | Renter-occupied |
| Utility Gas | 277 (76.5%) | 140 (66.0%) |
| Bottled, Tank, or LP Gas | 0 (0.0%) | 0 (0.0%) |
| Electricity | 59 (16.3%) | 72 (34.0%) |
| Fuel Oil or Kerosene | 0 (0.0%) | 0 (0.0%) |
| Coal or Coke | 0 (0.0%) | 0 (0.0%) |
| All other Fuels | 0 (0.0%) | 0 (0.0%) |
| No Fuel Used | 26 (7.2%) | 0 (0.0%) |
| Total | 362 (100.0%) | 212 (100.0%) |
Household Vehicle Usage in Corvallis
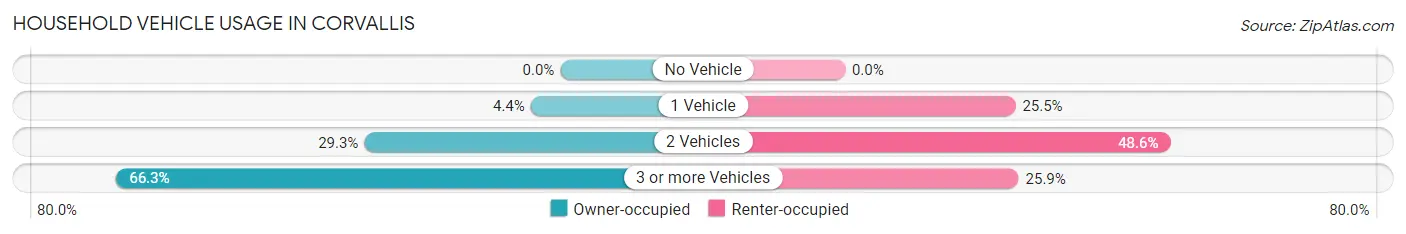
| Vehicles per Household | Owner-occupied | Renter-occupied |
| No Vehicle | 0 (0.0%) | 0 (0.0%) |
| 1 Vehicle | 16 (4.4%) | 54 (25.5%) |
| 2 Vehicles | 106 (29.3%) | 103 (48.6%) |
| 3 or more Vehicles | 240 (66.3%) | 55 (25.9%) |
| Total | 362 (100.0%) | 212 (100.0%) |
Real Estate & Mortgages in Corvallis
Real Estate and Mortgage Overview in Corvallis
| Characteristic | Without Mortgage | With Mortgage |
| Housing Units | 146 | 216 |
| Median Property Value | $333,000 | $198,300 |
| Median Household Income | $128,326 | $0 |
| Monthly Housing Costs | $533 | $0 |
| Real Estate Taxes | $1,165 | $0 |
Property Value by Mortgage Status in Corvallis
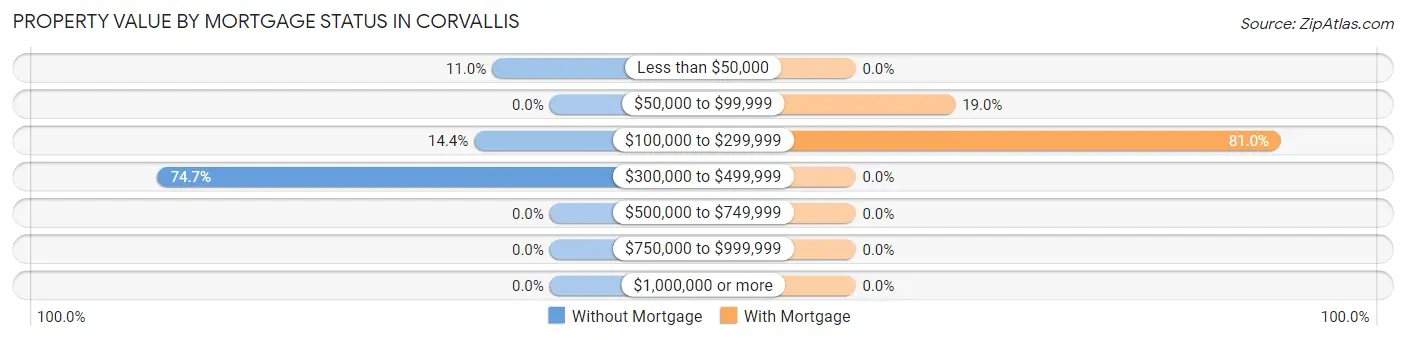
| Property Value | Without Mortgage | With Mortgage |
| Less than $50,000 | 16 (11.0%) | 0 (0.0%) |
| $50,000 to $99,999 | 0 (0.0%) | 41 (19.0%) |
| $100,000 to $299,999 | 21 (14.4%) | 175 (81.0%) |
| $300,000 to $499,999 | 109 (74.7%) | 0 (0.0%) |
| $500,000 to $749,999 | 0 (0.0%) | 0 (0.0%) |
| $750,000 to $999,999 | 0 (0.0%) | 0 (0.0%) |
| $1,000,000 or more | 0 (0.0%) | 0 (0.0%) |
| Total | 146 (100.0%) | 216 (100.0%) |
Household Income by Mortgage Status in Corvallis
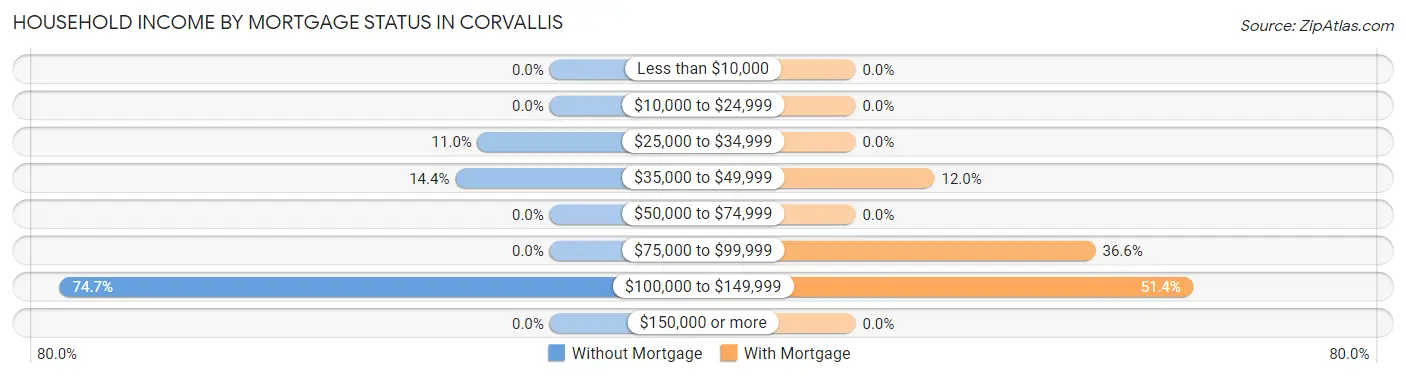
| Household Income | Without Mortgage | With Mortgage |
| Less than $10,000 | 0 (0.0%) | 0 (0.0%) |
| $10,000 to $24,999 | 0 (0.0%) | 0 (0.0%) |
| $25,000 to $34,999 | 16 (11.0%) | 0 (0.0%) |
| $35,000 to $49,999 | 21 (14.4%) | 26 (12.0%) |
| $50,000 to $74,999 | 0 (0.0%) | 0 (0.0%) |
| $75,000 to $99,999 | 0 (0.0%) | 79 (36.6%) |
| $100,000 to $149,999 | 109 (74.7%) | 111 (51.4%) |
| $150,000 or more | 0 (0.0%) | 0 (0.0%) |
| Total | 146 (100.0%) | 216 (100.0%) |
Property Value to Household Income Ratio in Corvallis
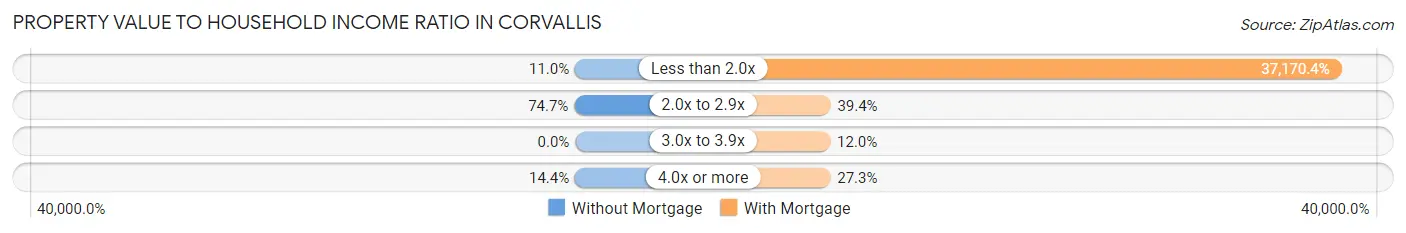
| Value-to-Income Ratio | Without Mortgage | With Mortgage |
| Less than 2.0x | 16 (11.0%) | 80,288 (37,170.4%) |
| 2.0x to 2.9x | 109 (74.7%) | 85 (39.4%) |
| 3.0x to 3.9x | 0 (0.0%) | 26 (12.0%) |
| 4.0x or more | 21 (14.4%) | 59 (27.3%) |
| Total | 146 (100.0%) | 216 (100.0%) |
Real Estate Taxes by Mortgage Status in Corvallis
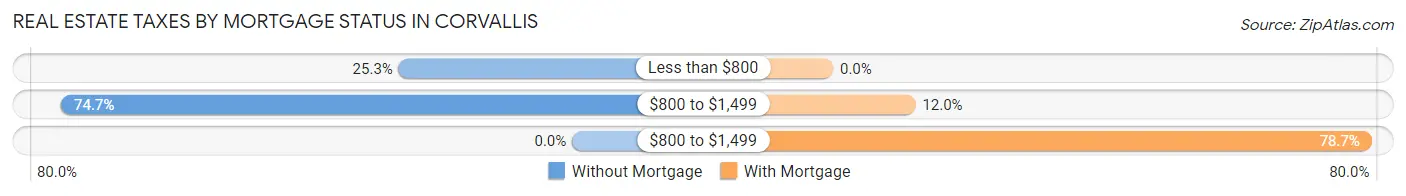
| Property Taxes | Without Mortgage | With Mortgage |
| Less than $800 | 37 (25.3%) | 0 (0.0%) |
| $800 to $1,499 | 109 (74.7%) | 26 (12.0%) |
| $800 to $1,499 | 0 (0.0%) | 170 (78.7%) |
| Total | 146 (100.0%) | 216 (100.0%) |
Health & Disability in Corvallis
Health Insurance Coverage by Age in Corvallis
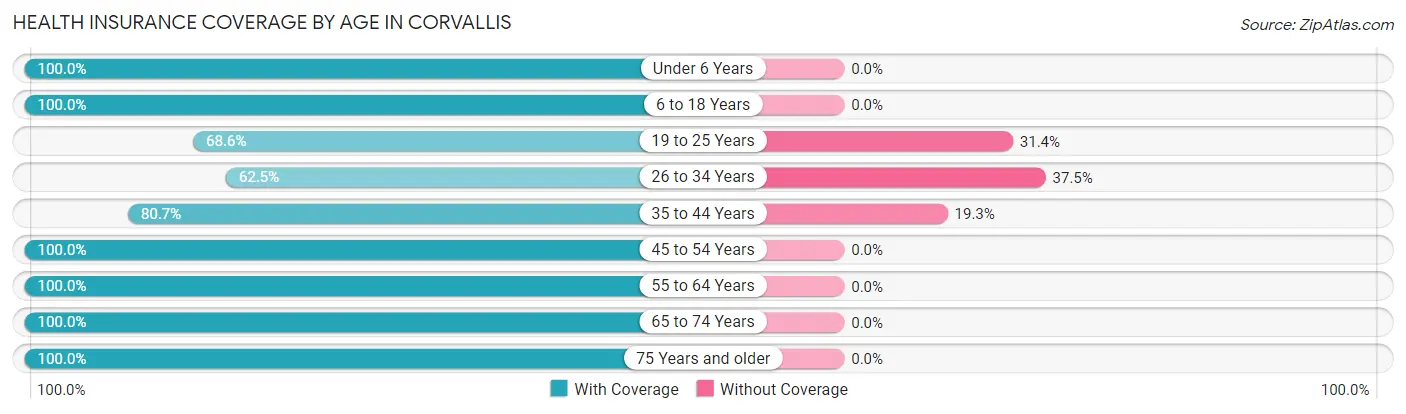
| Age Bracket | With Coverage | Without Coverage |
| Under 6 Years | 173 (100.0%) | 0 (0.0%) |
| 6 to 18 Years | 114 (100.0%) | 0 (0.0%) |
| 19 to 25 Years | 48 (68.6%) | 22 (31.4%) |
| 26 to 34 Years | 203 (62.5%) | 122 (37.5%) |
| 35 to 44 Years | 109 (80.7%) | 26 (19.3%) |
| 45 to 54 Years | 28 (100.0%) | 0 (0.0%) |
| 55 to 64 Years | 228 (100.0%) | 0 (0.0%) |
| 65 to 74 Years | 223 (100.0%) | 0 (0.0%) |
| 75 Years and older | 100 (100.0%) | 0 (0.0%) |
| Total | 1,226 (87.8%) | 170 (12.2%) |
Health Insurance Coverage by Citizenship Status in Corvallis
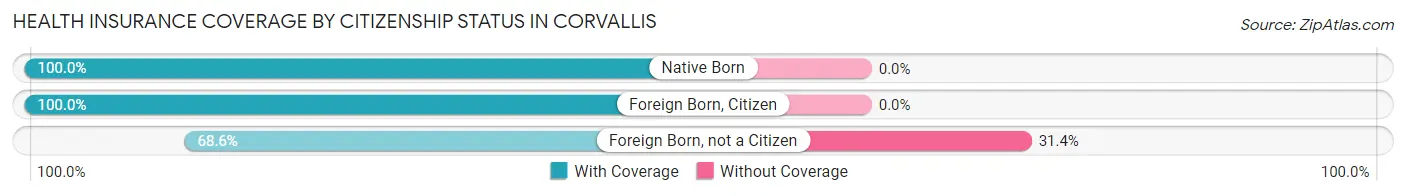
| Citizenship Status | With Coverage | Without Coverage |
| Native Born | 173 (100.0%) | 0 (0.0%) |
| Foreign Born, Citizen | 114 (100.0%) | 0 (0.0%) |
| Foreign Born, not a Citizen | 48 (68.6%) | 22 (31.4%) |
Health Insurance Coverage by Household Income in Corvallis
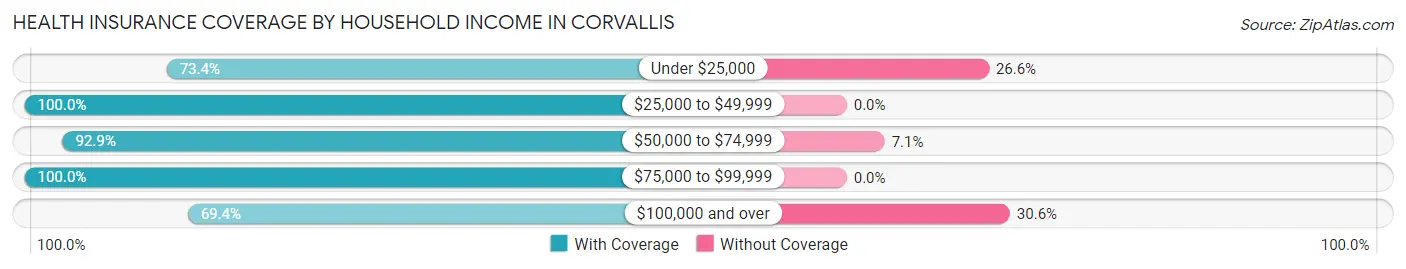
| Household Income | With Coverage | Without Coverage |
| Under $25,000 | 124 (73.4%) | 45 (26.6%) |
| $25,000 to $49,999 | 231 (100.0%) | 0 (0.0%) |
| $50,000 to $74,999 | 340 (92.9%) | 26 (7.1%) |
| $75,000 to $99,999 | 306 (100.0%) | 0 (0.0%) |
| $100,000 and over | 225 (69.4%) | 99 (30.6%) |
Public vs Private Health Insurance Coverage by Age in Corvallis
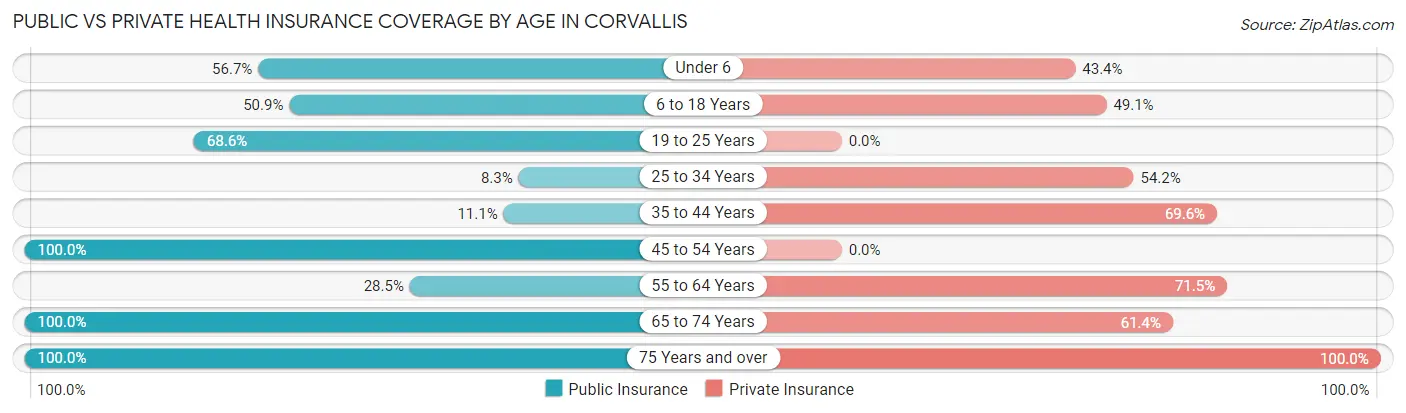
| Age Bracket | Public Insurance | Private Insurance |
| Under 6 | 98 (56.7%) | 75 (43.3%) |
| 6 to 18 Years | 58 (50.9%) | 56 (49.1%) |
| 19 to 25 Years | 48 (68.6%) | 0 (0.0%) |
| 25 to 34 Years | 27 (8.3%) | 176 (54.1%) |
| 35 to 44 Years | 15 (11.1%) | 94 (69.6%) |
| 45 to 54 Years | 28 (100.0%) | 0 (0.0%) |
| 55 to 64 Years | 65 (28.5%) | 163 (71.5%) |
| 65 to 74 Years | 223 (100.0%) | 137 (61.4%) |
| 75 Years and over | 100 (100.0%) | 100 (100.0%) |
| Total | 662 (47.4%) | 801 (57.4%) |
Disability Status by Sex by Age in Corvallis
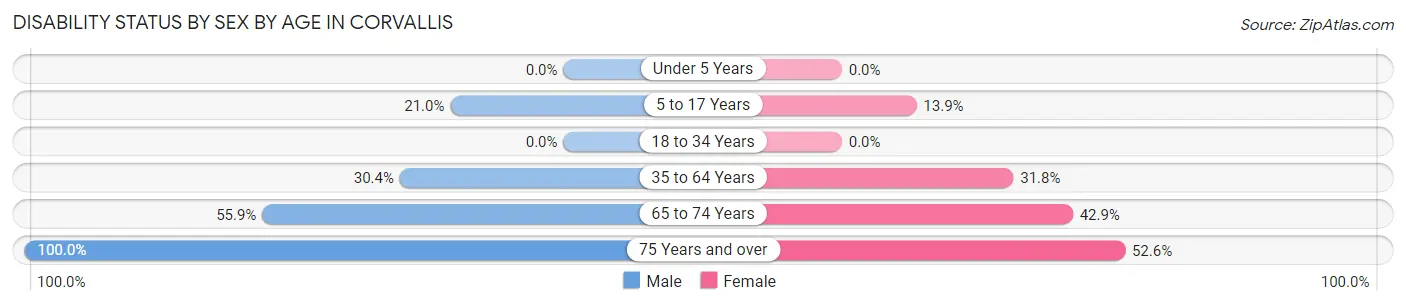
| Age Bracket | Male | Female |
| Under 5 Years | 0 (0.0%) | 0 (0.0%) |
| 5 to 17 Years | 17 (21.0%) | 9 (13.9%) |
| 18 to 34 Years | 0 (0.0%) | 0 (0.0%) |
| 35 to 64 Years | 51 (30.4%) | 71 (31.8%) |
| 65 to 74 Years | 109 (55.9%) | 12 (42.9%) |
| 75 Years and over | 22 (100.0%) | 41 (52.6%) |
Disability Class by Sex by Age in Corvallis
Disability Class: Hearing Difficulty
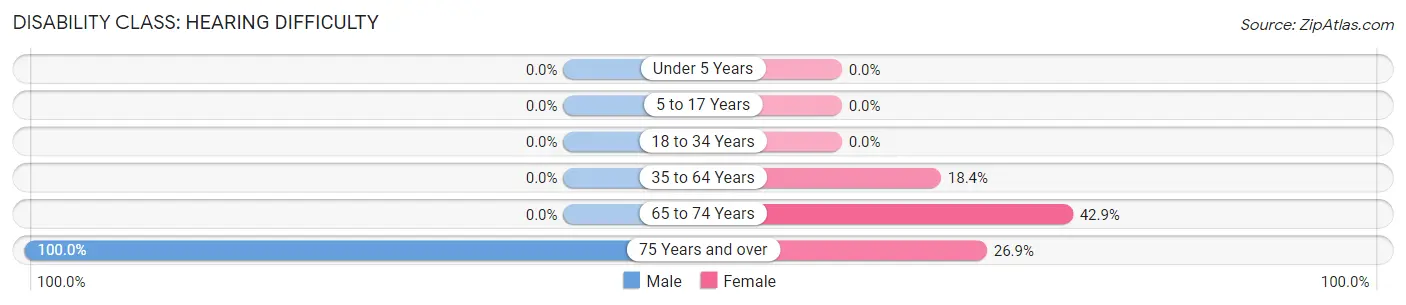
| Age Bracket | Male | Female |
| Under 5 Years | 0 (0.0%) | 0 (0.0%) |
| 5 to 17 Years | 0 (0.0%) | 0 (0.0%) |
| 18 to 34 Years | 0 (0.0%) | 0 (0.0%) |
| 35 to 64 Years | 0 (0.0%) | 41 (18.4%) |
| 65 to 74 Years | 0 (0.0%) | 12 (42.9%) |
| 75 Years and over | 22 (100.0%) | 21 (26.9%) |
Disability Class: Vision Difficulty
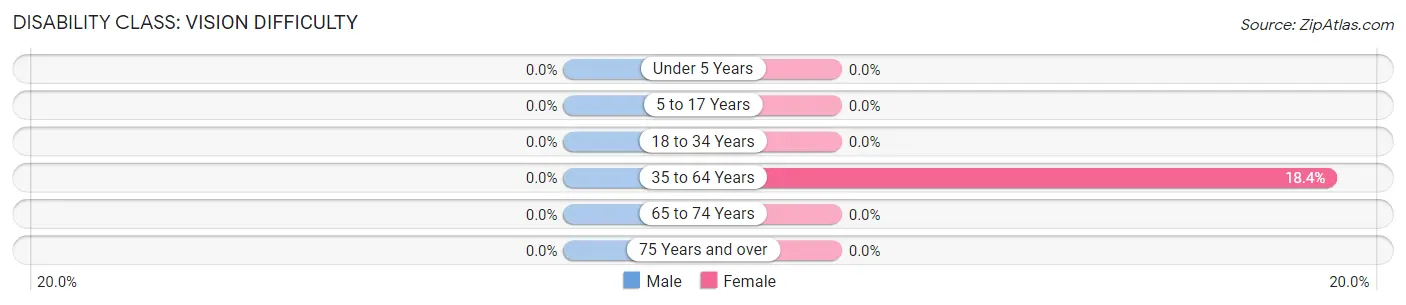
| Age Bracket | Male | Female |
| Under 5 Years | 0 (0.0%) | 0 (0.0%) |
| 5 to 17 Years | 0 (0.0%) | 0 (0.0%) |
| 18 to 34 Years | 0 (0.0%) | 0 (0.0%) |
| 35 to 64 Years | 0 (0.0%) | 41 (18.4%) |
| 65 to 74 Years | 0 (0.0%) | 0 (0.0%) |
| 75 Years and over | 0 (0.0%) | 0 (0.0%) |
Disability Class: Cognitive Difficulty
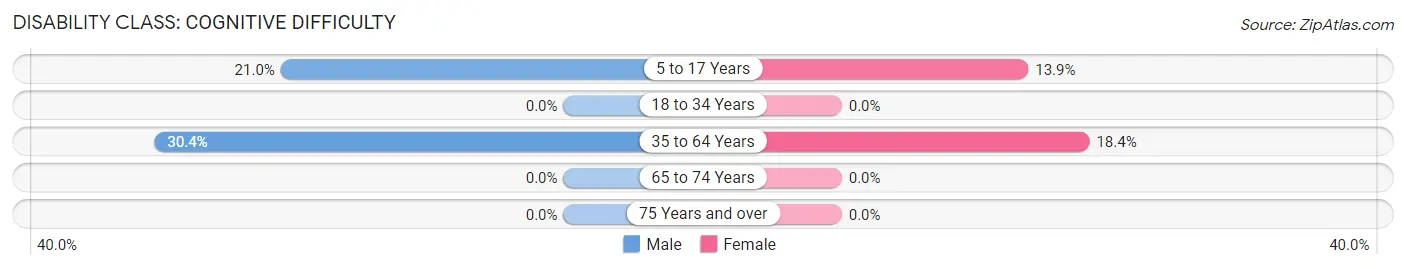
| Age Bracket | Male | Female |
| 5 to 17 Years | 17 (21.0%) | 9 (13.9%) |
| 18 to 34 Years | 0 (0.0%) | 0 (0.0%) |
| 35 to 64 Years | 51 (30.4%) | 41 (18.4%) |
| 65 to 74 Years | 0 (0.0%) | 0 (0.0%) |
| 75 Years and over | 0 (0.0%) | 0 (0.0%) |
Disability Class: Ambulatory Difficulty
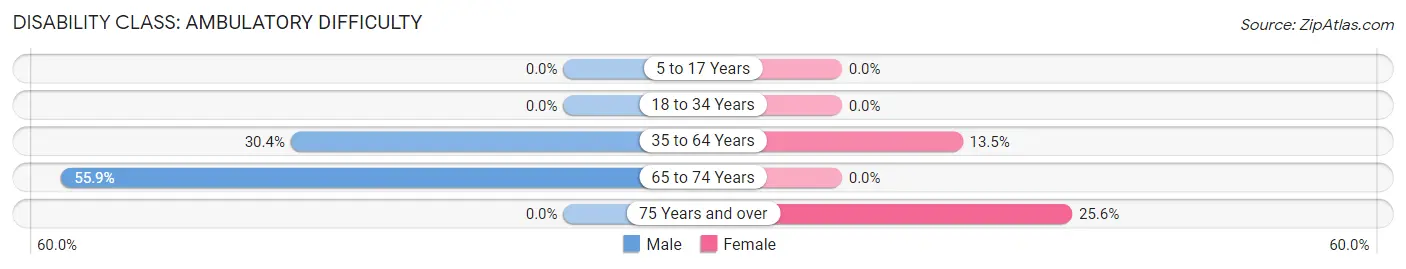
| Age Bracket | Male | Female |
| 5 to 17 Years | 0 (0.0%) | 0 (0.0%) |
| 18 to 34 Years | 0 (0.0%) | 0 (0.0%) |
| 35 to 64 Years | 51 (30.4%) | 30 (13.5%) |
| 65 to 74 Years | 109 (55.9%) | 0 (0.0%) |
| 75 Years and over | 0 (0.0%) | 20 (25.6%) |
Disability Class: Self-Care Difficulty
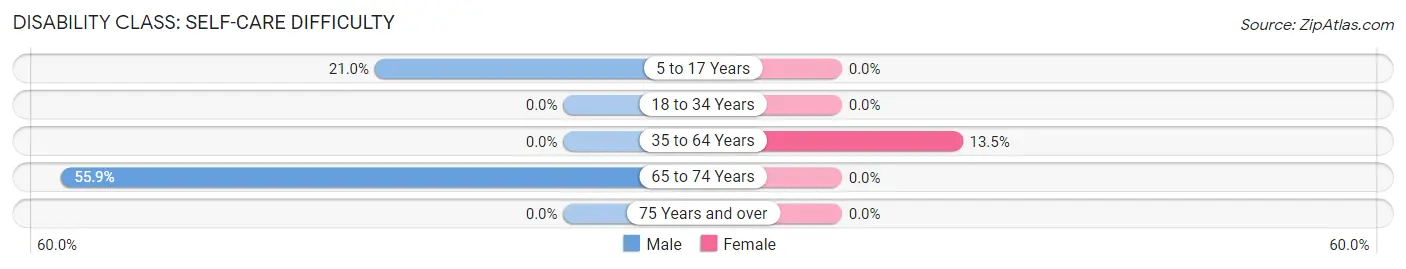
| Age Bracket | Male | Female |
| 5 to 17 Years | 17 (21.0%) | 0 (0.0%) |
| 18 to 34 Years | 0 (0.0%) | 0 (0.0%) |
| 35 to 64 Years | 0 (0.0%) | 30 (13.5%) |
| 65 to 74 Years | 109 (55.9%) | 0 (0.0%) |
| 75 Years and over | 0 (0.0%) | 0 (0.0%) |
Technology Access in Corvallis
Computing Device Access in Corvallis
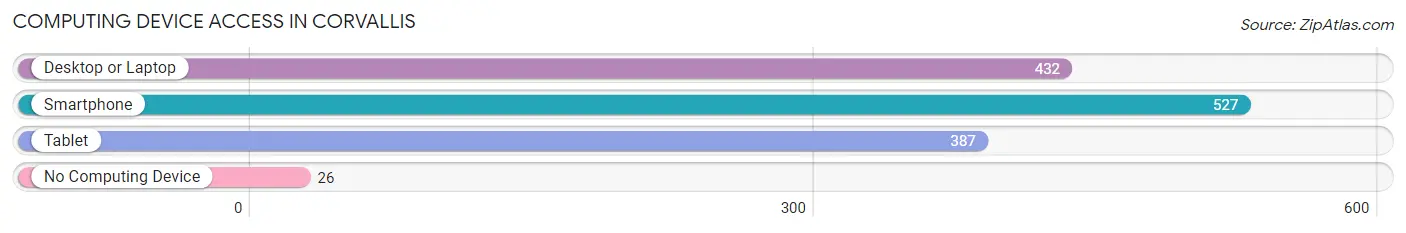
| Device Type | # Households | % Households |
| Desktop or Laptop | 432 | 75.3% |
| Smartphone | 527 | 91.8% |
| Tablet | 387 | 67.4% |
| No Computing Device | 26 | 4.5% |
| Total | 574 | 100.0% |
Internet Access in Corvallis
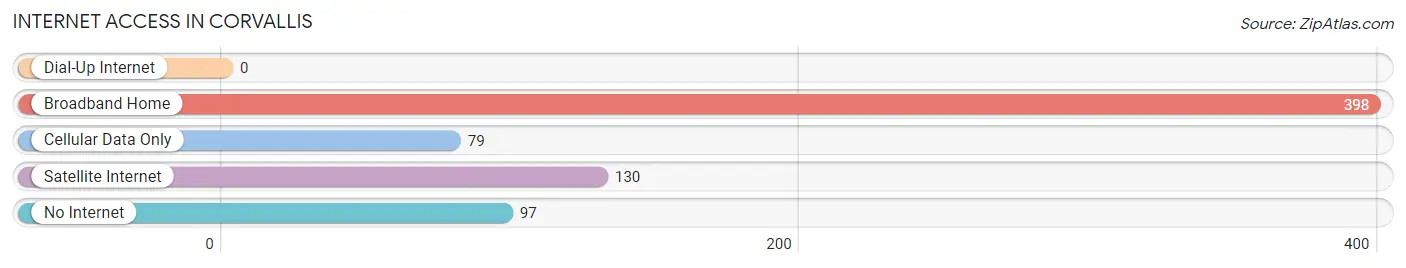
| Internet Type | # Households | % Households |
| Dial-Up Internet | 0 | 0.0% |
| Broadband Home | 398 | 69.3% |
| Cellular Data Only | 79 | 13.8% |
| Satellite Internet | 130 | 22.7% |
| No Internet | 97 | 16.9% |
| Total | 574 | 100.0% |
Corvallis Summary
Corvallis, Montana is a small town located in Ravalli County, Montana. It is situated in the Bitterroot Valley, which is a major agricultural region in the state. The town has a population of approximately 1,500 people and is located about 30 miles south of Missoula.
History
Corvallis was founded in 1864 by a group of settlers from the Oregon Territory. The town was named after the nearby Corvallis Creek, which was named after the city of Corvallis, Oregon. The town was originally a trading post and a stop on the stagecoach route between Missoula and Bitterroot Valley.
In the late 1800s, Corvallis became a major agricultural center in the Bitterroot Valley. The town was home to several large farms and ranches, and the area was known for its production of wheat, barley, oats, and hay. The town also had a large lumber industry, and the local sawmill was one of the largest in the state.
In the early 1900s, Corvallis began to experience a population decline as many of the local farms and ranches were sold off or abandoned. The town also suffered from a lack of economic development, and the population continued to decline until the 1950s.
In the 1950s, Corvallis began to experience a resurgence in population and economic activity. The town was home to several new businesses, including a lumber mill, a grain elevator, and a feed store. The town also experienced a population boom, and the population grew from 1,000 in 1950 to 1,500 in 2000.
Geography
Corvallis is located in the Bitterroot Valley, which is a major agricultural region in the state. The town is situated in the foothills of the Bitterroot Mountains, and the surrounding area is characterized by rolling hills and open fields. The town is located about 30 miles south of Missoula and is situated along the Bitterroot River.
The climate in Corvallis is semi-arid, with hot summers and cold winters. The average annual temperature is around 50 degrees Fahrenheit, and the average annual precipitation is around 15 inches.
Economy
The economy of Corvallis is largely based on agriculture and tourism. The town is home to several large farms and ranches, and the area is known for its production of wheat, barley, oats, and hay. The town also has a large lumber industry, and the local sawmill is one of the largest in the state.
In addition to agriculture and lumber, Corvallis is also home to several small businesses, including restaurants, retail stores, and service providers. The town is also home to several tourist attractions, including the Corvallis Historical Museum and the Corvallis Country Club.
Demographics
As of the 2010 census, the population of Corvallis was 1,500. The racial makeup of the town was 95.3% White, 0.7% Native American, 0.3% Asian, 0.2% African American, and 3.5% from other races. The median household income was $37,500, and the median age was 41.7 years. The town had a poverty rate of 11.3%.
Common Questions
What is Per Capita Income in Corvallis?
Per Capita income in Corvallis is $26,503.
What is the Median Family Income in Corvallis?
Median Family Income in Corvallis is $80,288.
What is the Median Household income in Corvallis?
Median Household Income in Corvallis is $62,034.
What is Inequality or Gini Index in Corvallis?
Inequality or Gini Index in Corvallis is 0.33.
What is the Total Population of Corvallis?
Total Population of Corvallis is 1,396.
What is the Total Male Population of Corvallis?
Total Male Population of Corvallis is 800.
What is the Total Female Population of Corvallis?
Total Female Population of Corvallis is 596.
What is the Ratio of Males per 100 Females in Corvallis?
There are 134.23 Males per 100 Females in Corvallis.
What is the Ratio of Females per 100 Males in Corvallis?
There are 74.50 Females per 100 Males in Corvallis.
What is the Median Population Age in Corvallis?
Median Population Age in Corvallis is 38.6 Years.
What is the Average Family Size in Corvallis
Average Family Size in Corvallis is 2.7 People.
What is the Average Household Size in Corvallis
Average Household Size in Corvallis is 2.4 People.
How Large is the Labor Force in Corvallis?
There are 817 People in the Labor Forcein in Corvallis.
What is the Percentage of People in the Labor Force in Corvallis?
73.1% of People are in the Labor Force in Corvallis.
What is the Unemployment Rate in Corvallis?
Unemployment Rate in Corvallis is 7.5%.