Concord, NC Map & Demographics
Concord Map
Concord Overview
$39,148
PER CAPITA INCOME
$98,417
AVG FAMILY INCOME
$83,480
AVG HOUSEHOLD INCOME
27.2%
WAGE / INCOME GAP [ % ]
72.8¢/ $1
WAGE / INCOME GAP [ $ ]
$9,065
FAMILY INCOME DEFICIT
0.44
INEQUALITY / GINI INDEX
105,335
TOTAL POPULATION
51,379
MALE POPULATION
53,956
FEMALE POPULATION
95.22
MALES / 100 FEMALES
105.02
FEMALES / 100 MALES
37.3
MEDIAN AGE
3.5
AVG FAMILY SIZE
2.9
AVG HOUSEHOLD SIZE
56,631
LABOR FORCE [ PEOPLE ]
69.4%
PERCENT IN LABOR FORCE
4.7%
UNEMPLOYMENT RATE
Income in Concord
Income Overview in Concord
Per Capita Income in Concord is $39,148, while median incomes of families and households are $98,417 and $83,480 respectively.
| Characteristic | Number | Measure |
| Per Capita Income | 105,335 | $39,148 |
| Median Family Income | 25,471 | $98,417 |
| Mean Family Income | 25,471 | $126,215 |
| Median Household Income | 36,205 | $83,480 |
| Mean Household Income | 36,205 | $107,281 |
| Income Deficit | 25,471 | $9,065 |
| Wage / Income Gap (%) | 105,335 | 27.17% |
| Wage / Income Gap ($) | 105,335 | 72.83¢ per $1 |
| Gini / Inequality Index | 105,335 | 0.44 |
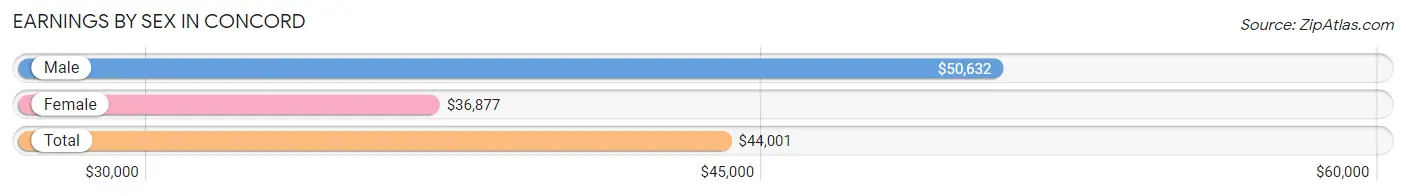
Earnings by Sex in Concord
Average Earnings in Concord are $44,001, $50,632 for men and $36,877 for women, a difference of 27.2%.
| Sex | Number | Average Earnings |
| Male | 29,882 (51.5%) | $50,632 |
| Female | 28,141 (48.5%) | $36,877 |
| Total | 58,023 (100.0%) | $44,001 |
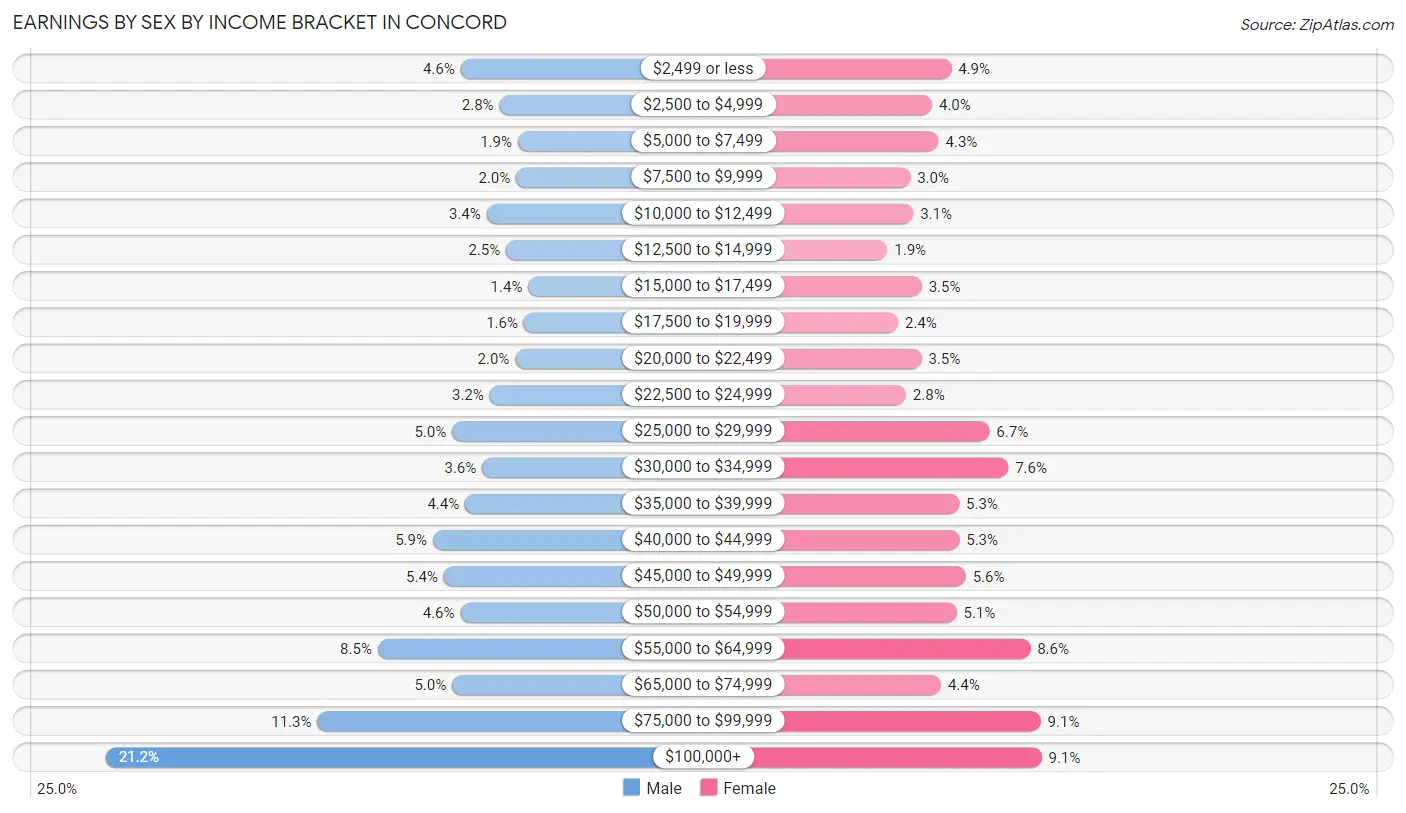
Earnings by Sex by Income Bracket in Concord
The most common earnings brackets in Concord are $100,000+ for men (6,336 | 21.2%) and $100,000+ for women (2,567 | 9.1%).
| Income | Male | Female |
| $2,499 or less | 1,369 (4.6%) | 1,375 (4.9%) |
| $2,500 to $4,999 | 825 (2.8%) | 1,122 (4.0%) |
| $5,000 to $7,499 | 567 (1.9%) | 1,209 (4.3%) |
| $7,500 to $9,999 | 593 (2.0%) | 836 (3.0%) |
| $10,000 to $12,499 | 1,003 (3.4%) | 875 (3.1%) |
| $12,500 to $14,999 | 731 (2.5%) | 534 (1.9%) |
| $15,000 to $17,499 | 420 (1.4%) | 987 (3.5%) |
| $17,500 to $19,999 | 483 (1.6%) | 674 (2.4%) |
| $20,000 to $22,499 | 605 (2.0%) | 985 (3.5%) |
| $22,500 to $24,999 | 962 (3.2%) | 780 (2.8%) |
| $25,000 to $29,999 | 1,489 (5.0%) | 1,881 (6.7%) |
| $30,000 to $34,999 | 1,068 (3.6%) | 2,127 (7.6%) |
| $35,000 to $39,999 | 1,306 (4.4%) | 1,481 (5.3%) |
| $40,000 to $44,999 | 1,757 (5.9%) | 1,482 (5.3%) |
| $45,000 to $49,999 | 1,606 (5.4%) | 1,568 (5.6%) |
| $50,000 to $54,999 | 1,373 (4.6%) | 1,447 (5.1%) |
| $55,000 to $64,999 | 2,529 (8.5%) | 2,416 (8.6%) |
| $65,000 to $74,999 | 1,487 (5.0%) | 1,240 (4.4%) |
| $75,000 to $99,999 | 3,373 (11.3%) | 2,555 (9.1%) |
| $100,000+ | 6,336 (21.2%) | 2,567 (9.1%) |
| Total | 29,882 (100.0%) | 28,141 (100.0%) |
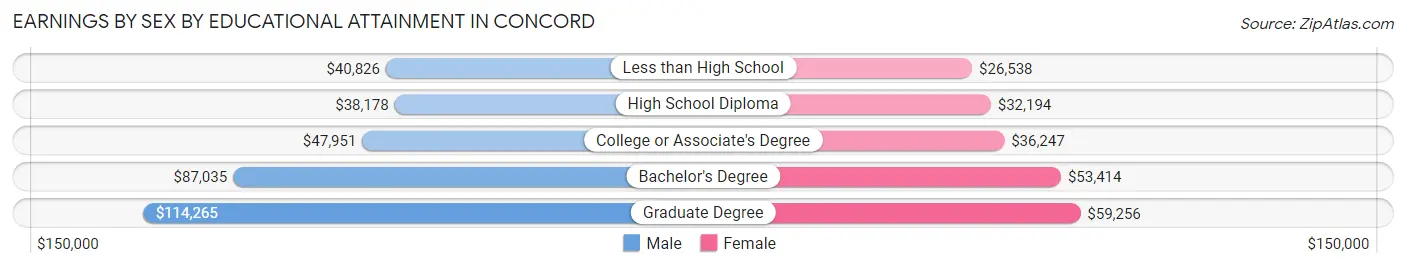
Earnings by Sex by Educational Attainment in Concord
Average earnings in Concord are $57,756 for men and $42,474 for women, a difference of 26.5%. Men with an educational attainment of graduate degree enjoy the highest average annual earnings of $114,265, while those with high school diploma education earn the least with $38,178. Women with an educational attainment of graduate degree earn the most with the average annual earnings of $59,256, while those with less than high school education have the smallest earnings of $26,538.
| Educational Attainment | Male Income | Female Income |
| Less than High School | $40,826 | $26,538 |
| High School Diploma | $38,178 | $32,194 |
| College or Associate's Degree | $47,951 | $36,247 |
| Bachelor's Degree | $87,035 | $53,414 |
| Graduate Degree | $114,265 | $59,256 |
| Total | $57,756 | $42,474 |
Family Income in Concord
Family Income Brackets in Concord
According to the Concord family income data, there are 5,451 families falling into the $100,000 to $149,999 income range, which is the most common income bracket and makes up 21.4% of all families. Conversely, the $10,000 to $14,999 income bracket is the least frequent group with only 382 families (1.5%) belonging to this category.
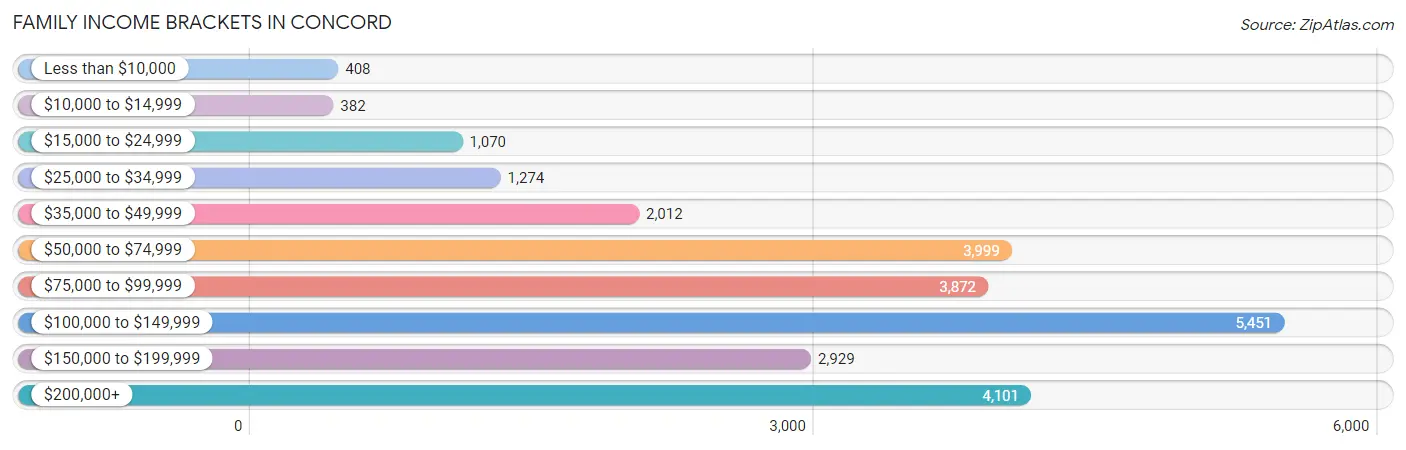
| Income Bracket | # Families | % Families |
| Less than $10,000 | 408 | 1.6% |
| $10,000 to $14,999 | 382 | 1.5% |
| $15,000 to $24,999 | 1,070 | 4.2% |
| $25,000 to $34,999 | 1,274 | 5.0% |
| $35,000 to $49,999 | 2,012 | 7.9% |
| $50,000 to $74,999 | 3,999 | 15.7% |
| $75,000 to $99,999 | 3,872 | 15.2% |
| $100,000 to $149,999 | 5,451 | 21.4% |
| $150,000 to $199,999 | 2,929 | 11.5% |
| $200,000+ | 4,101 | 16.1% |
Family Income by Famaliy Size in Concord
7+ person families (282 | 1.1%) account for the highest median family income in Concord with $250,001 per family, while 2-person families (11,656 | 45.8%) have the highest median income of $40,402 per family member.
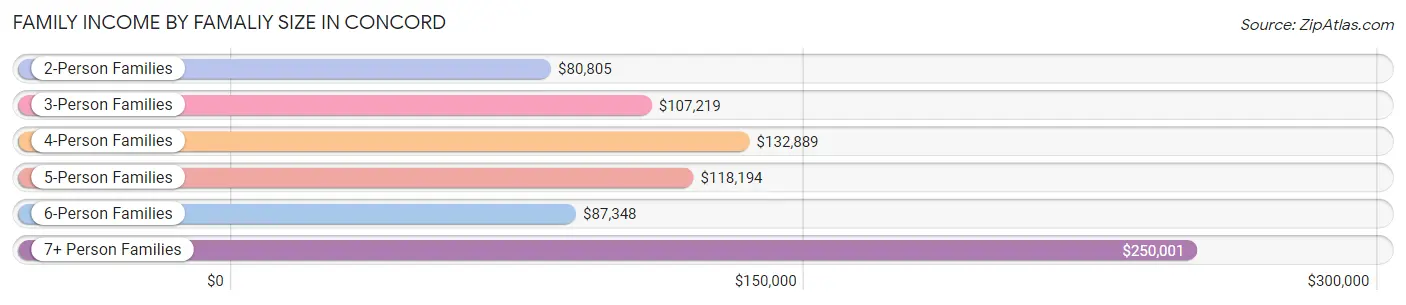
| Income Bracket | # Families | Median Income |
| 2-Person Families | 11,656 (45.8%) | $80,805 |
| 3-Person Families | 5,368 (21.1%) | $107,219 |
| 4-Person Families | 5,318 (20.9%) | $132,889 |
| 5-Person Families | 2,116 (8.3%) | $118,194 |
| 6-Person Families | 731 (2.9%) | $87,348 |
| 7+ Person Families | 282 (1.1%) | $250,001 |
| Total | 25,471 (100.0%) | $98,417 |
Family Income by Number of Earners in Concord
The median family income in Concord is $98,417, with families comprising 3+ earners (2,654) having the highest median family income of $149,643, while families with no earners (2,770) have the lowest median family income of $53,396, accounting for 10.4% and 10.9% of families, respectively.
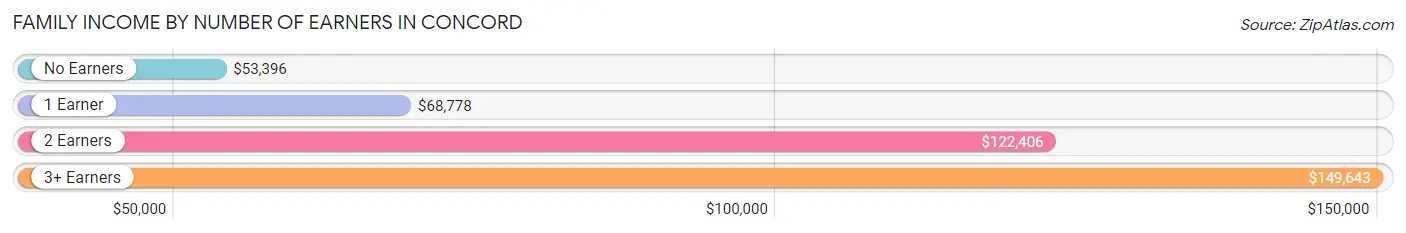
| Number of Earners | # Families | Median Income |
| No Earners | 2,770 (10.9%) | $53,396 |
| 1 Earner | 8,554 (33.6%) | $68,778 |
| 2 Earners | 11,493 (45.1%) | $122,406 |
| 3+ Earners | 2,654 (10.4%) | $149,643 |
| Total | 25,471 (100.0%) | $98,417 |
Household Income in Concord
Household Income Brackets in Concord
With 6,807 households falling in the category, the $100,000 to $149,999 income range is the most frequent in Concord, accounting for 18.8% of all households. In contrast, only 869 households (2.4%) fall into the $10,000 to $14,999 income bracket, making it the least populous group.
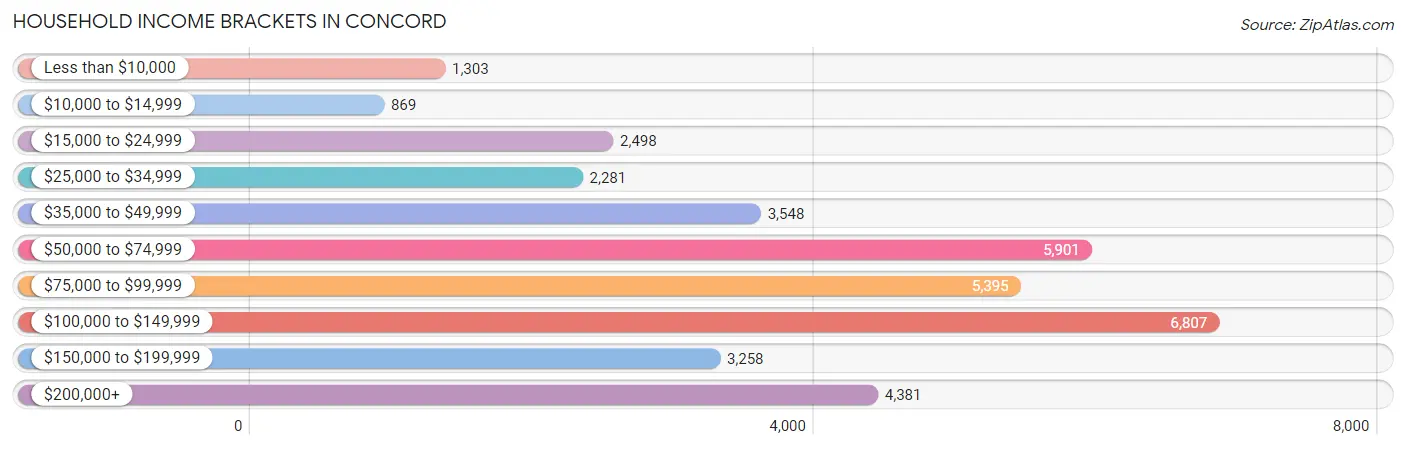
| Income Bracket | # Households | % Households |
| Less than $10,000 | 1,303 | 3.6% |
| $10,000 to $14,999 | 869 | 2.4% |
| $15,000 to $24,999 | 2,498 | 6.9% |
| $25,000 to $34,999 | 2,281 | 6.3% |
| $35,000 to $49,999 | 3,548 | 9.8% |
| $50,000 to $74,999 | 5,901 | 16.3% |
| $75,000 to $99,999 | 5,395 | 14.9% |
| $100,000 to $149,999 | 6,807 | 18.8% |
| $150,000 to $199,999 | 3,258 | 9.0% |
| $200,000+ | 4,381 | 12.1% |
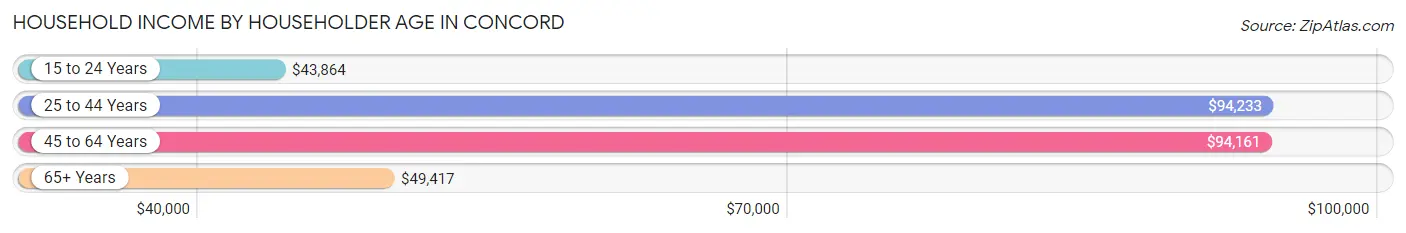
Household Income by Householder Age in Concord
The median household income in Concord is $83,480, with the highest median household income of $94,233 found in the 25 to 44 years age bracket for the primary householder. A total of 13,307 households (36.7%) fall into this category. Meanwhile, the 15 to 24 years age bracket for the primary householder has the lowest median household income of $43,864, with 1,074 households (3.0%) in this group.
| Income Bracket | # Households | Median Income |
| 15 to 24 Years | 1,074 (3.0%) | $43,864 |
| 25 to 44 Years | 13,307 (36.7%) | $94,233 |
| 45 to 64 Years | 14,270 (39.4%) | $94,161 |
| 65+ Years | 7,554 (20.9%) | $49,417 |
| Total | 36,205 (100.0%) | $83,480 |
Poverty in Concord
Income Below Poverty by Sex and Age in Concord
With 6.6% poverty level for males and 8.4% for females among the residents of Concord, 5 year old males and 18 to 24 year old females are the most vulnerable to poverty, with 160 males (25.5%) and 843 females (18.2%) in their respective age groups living below the poverty level.
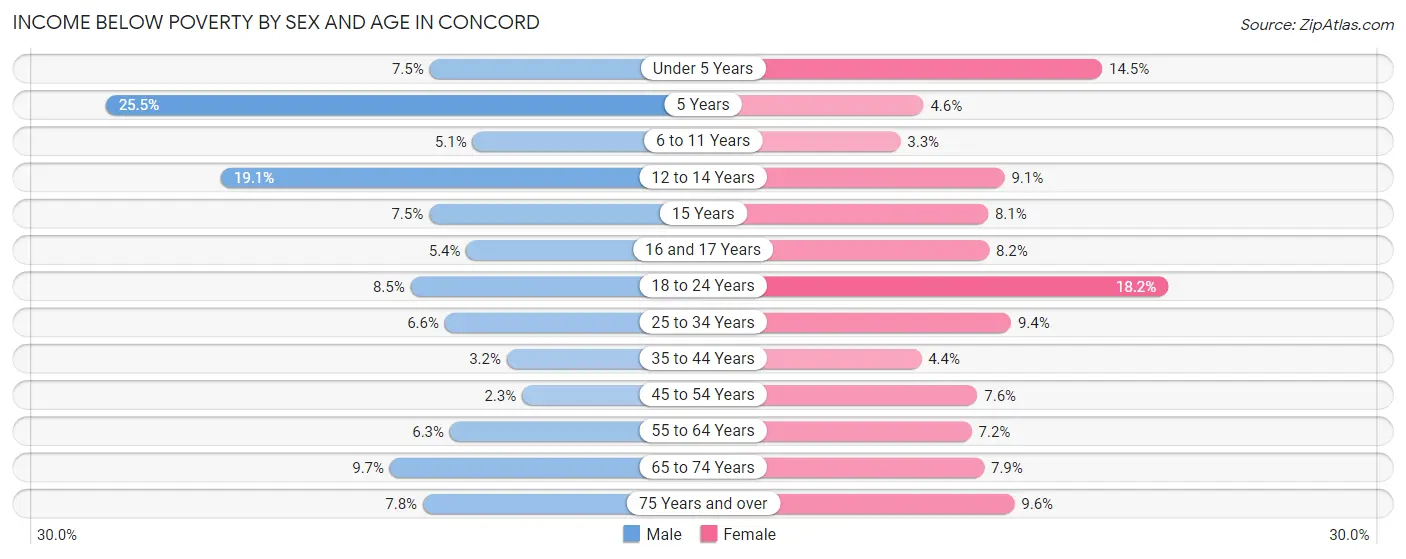
| Age Bracket | Male | Female |
| Under 5 Years | 281 (7.4%) | 382 (14.5%) |
| 5 Years | 160 (25.5%) | 22 (4.5%) |
| 6 to 11 Years | 243 (5.1%) | 148 (3.3%) |
| 12 to 14 Years | 460 (19.1%) | 185 (9.1%) |
| 15 Years | 88 (7.5%) | 72 (8.1%) |
| 16 and 17 Years | 76 (5.4%) | 127 (8.2%) |
| 18 to 24 Years | 377 (8.5%) | 843 (18.2%) |
| 25 to 34 Years | 436 (6.6%) | 645 (9.4%) |
| 35 to 44 Years | 232 (3.2%) | 364 (4.4%) |
| 45 to 54 Years | 158 (2.3%) | 592 (7.5%) |
| 55 to 64 Years | 379 (6.3%) | 454 (7.2%) |
| 65 to 74 Years | 313 (9.7%) | 334 (7.9%) |
| 75 Years and over | 155 (7.8%) | 288 (9.6%) |
| Total | 3,358 (6.6%) | 4,456 (8.4%) |
Income Above Poverty by Sex and Age in Concord
According to the poverty statistics in Concord, males aged 45 to 54 years and females aged 6 to 11 years are the age groups that are most secure financially, with 97.7% of males and 96.7% of females in these age groups living above the poverty line.
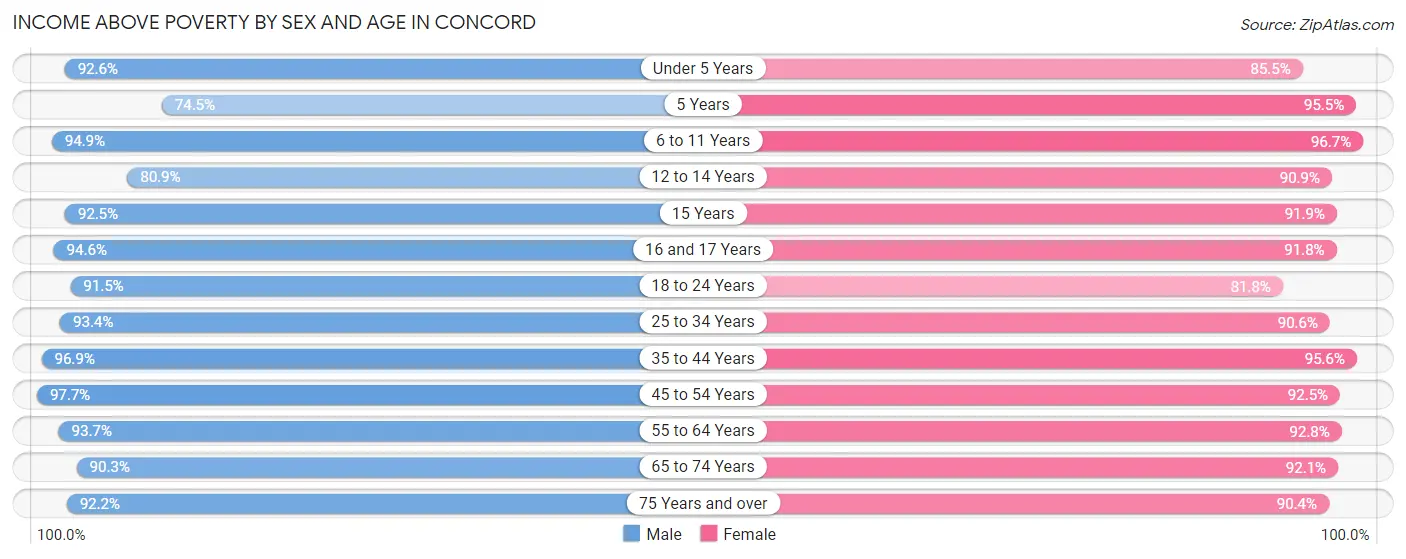
| Age Bracket | Male | Female |
| Under 5 Years | 3,489 (92.5%) | 2,254 (85.5%) |
| 5 Years | 468 (74.5%) | 462 (95.5%) |
| 6 to 11 Years | 4,556 (94.9%) | 4,386 (96.7%) |
| 12 to 14 Years | 1,952 (80.9%) | 1,857 (90.9%) |
| 15 Years | 1,089 (92.5%) | 812 (91.9%) |
| 16 and 17 Years | 1,331 (94.6%) | 1,422 (91.8%) |
| 18 to 24 Years | 4,054 (91.5%) | 3,797 (81.8%) |
| 25 to 34 Years | 6,172 (93.4%) | 6,199 (90.6%) |
| 35 to 44 Years | 7,138 (96.9%) | 7,872 (95.6%) |
| 45 to 54 Years | 6,699 (97.7%) | 7,253 (92.4%) |
| 55 to 64 Years | 5,620 (93.7%) | 5,826 (92.8%) |
| 65 to 74 Years | 2,928 (90.3%) | 3,884 (92.1%) |
| 75 Years and over | 1,827 (92.2%) | 2,709 (90.4%) |
| Total | 47,323 (93.4%) | 48,733 (91.6%) |
Income Below Poverty Among Married-Couple Families in Concord
The poverty statistics for married-couple families in Concord show that 2.1% or 397 of the total 18,858 families live below the poverty line. Families with 3 or 4 children have the highest poverty rate of 4.5%, comprising of 80 families. On the other hand, families with 5 or more children have the lowest poverty rate of 0.0%, which includes 0 families.
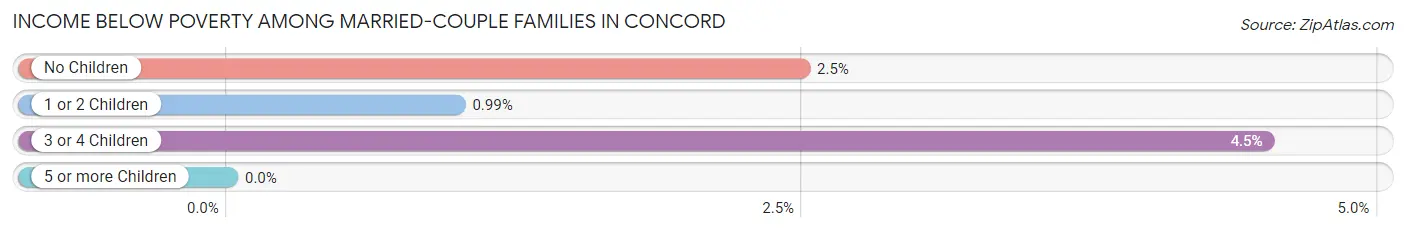
| Children | Above Poverty | Below Poverty |
| No Children | 9,664 (97.5%) | 247 (2.5%) |
| 1 or 2 Children | 7,019 (99.0%) | 70 (1.0%) |
| 3 or 4 Children | 1,695 (95.5%) | 80 (4.5%) |
| 5 or more Children | 83 (100.0%) | 0 (0.0%) |
| Total | 18,461 (97.9%) | 397 (2.1%) |
Income Below Poverty Among Single-Parent Households in Concord
According to the poverty data in Concord, 2.4% or 37 single-father households and 19.3% or 981 single-mother households are living below the poverty line. Among single-father households, those with 1 or 2 children have the highest poverty rate, with 35 households (6.5%) experiencing poverty. Likewise, among single-mother households, those with 1 or 2 children have the highest poverty rate, with 806 households (24.4%) falling below the poverty line.
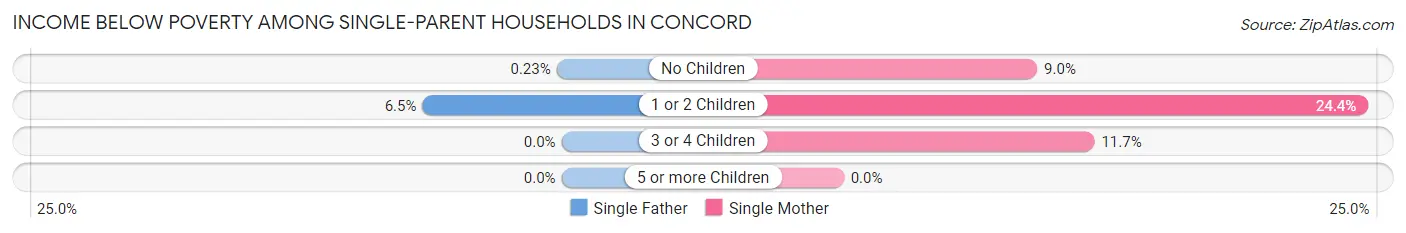
| Children | Single Father | Single Mother |
| No Children | 2 (0.2%) | 116 (9.0%) |
| 1 or 2 Children | 35 (6.5%) | 806 (24.4%) |
| 3 or 4 Children | 0 (0.0%) | 59 (11.7%) |
| 5 or more Children | 0 (0.0%) | 0 (0.0%) |
| Total | 37 (2.4%) | 981 (19.3%) |
Income Below Poverty Among Married-Couple vs Single-Parent Households in Concord
The poverty data for Concord shows that 397 of the married-couple family households (2.1%) and 1,018 of the single-parent households (15.4%) are living below the poverty level. Within the married-couple family households, those with 3 or 4 children have the highest poverty rate, with 80 households (4.5%) falling below the poverty line. Among the single-parent households, those with 1 or 2 children have the highest poverty rate, with 841 household (21.9%) living below poverty.
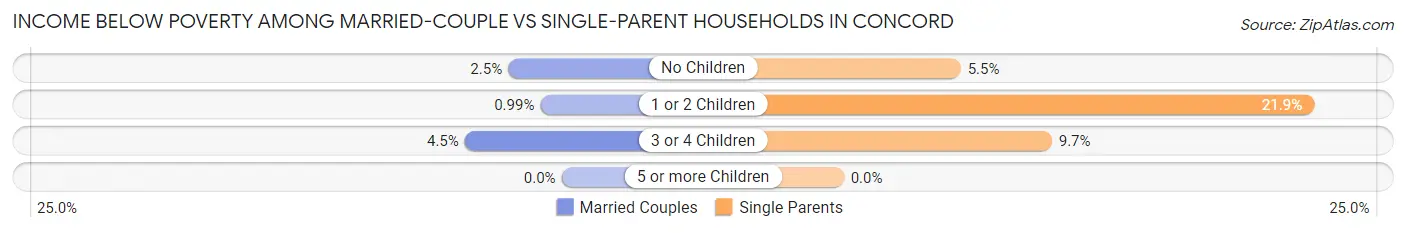
| Children | Married-Couple Families | Single-Parent Households |
| No Children | 247 (2.5%) | 118 (5.4%) |
| 1 or 2 Children | 70 (1.0%) | 841 (21.9%) |
| 3 or 4 Children | 80 (4.5%) | 59 (9.7%) |
| 5 or more Children | 0 (0.0%) | 0 (0.0%) |
| Total | 397 (2.1%) | 1,018 (15.4%) |
Race in Concord
The most populous races in Concord are White / Caucasian (61,338 | 58.2%), Black / African American (23,368 | 22.2%), and Hispanic or Latino (14,606 | 13.9%).
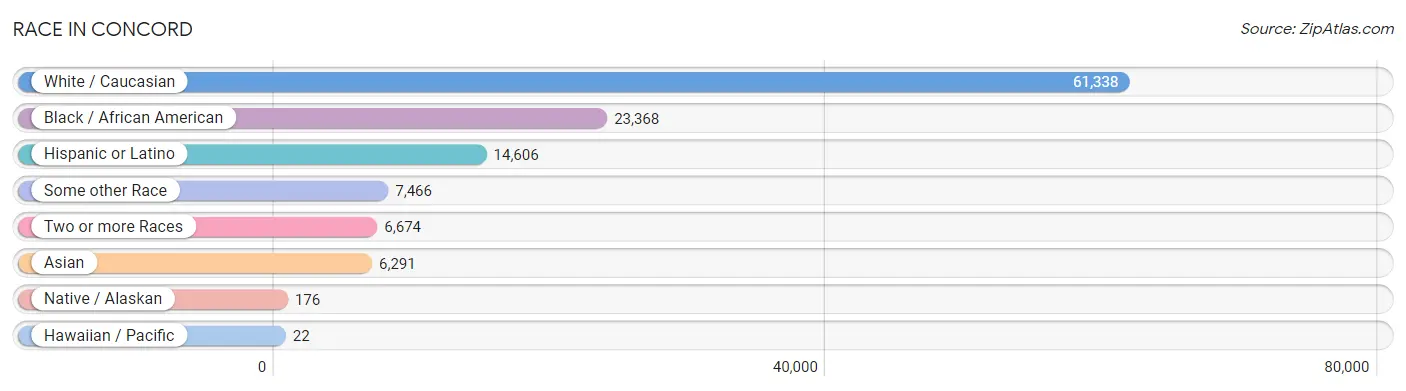
| Race | # Population | % Population |
| Asian | 6,291 | 6.0% |
| Black / African American | 23,368 | 22.2% |
| Hawaiian / Pacific | 22 | 0.0% |
| Hispanic or Latino | 14,606 | 13.9% |
| Native / Alaskan | 176 | 0.2% |
| White / Caucasian | 61,338 | 58.2% |
| Two or more Races | 6,674 | 6.3% |
| Some other Race | 7,466 | 7.1% |
| Total | 105,335 | 100.0% |
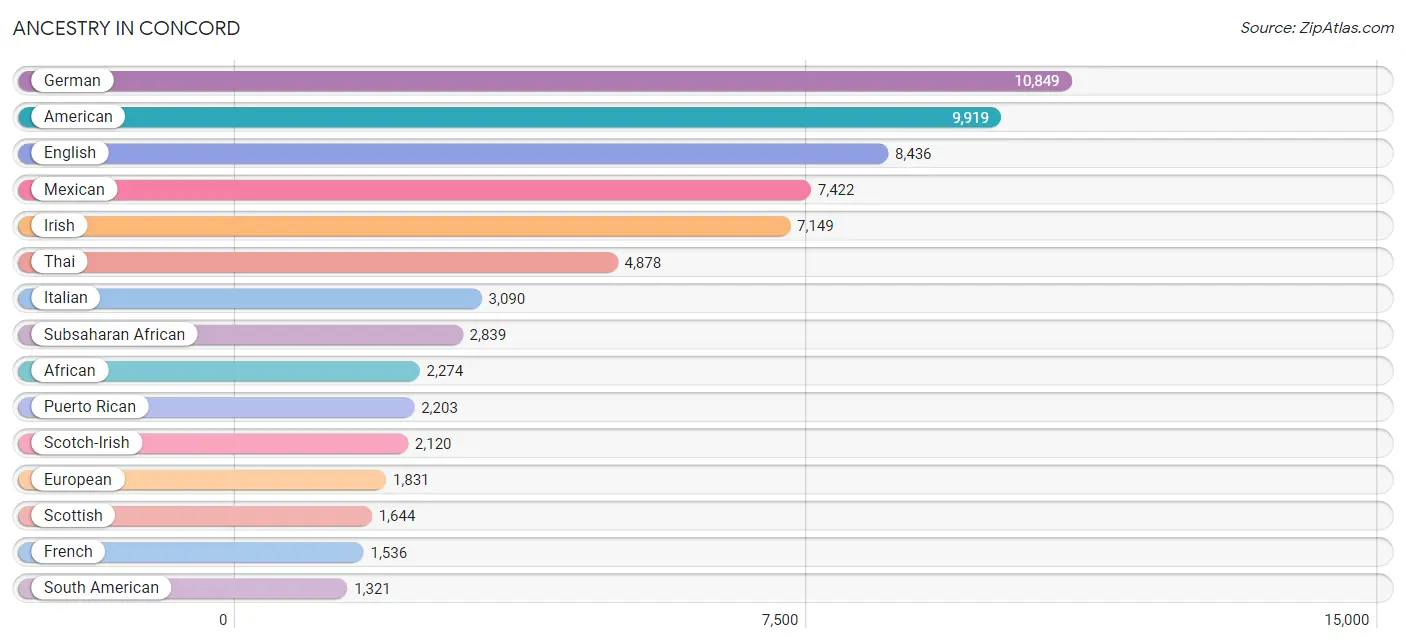
Ancestry in Concord
The most populous ancestries reported in Concord are German (10,849 | 10.3%), American (9,919 | 9.4%), English (8,436 | 8.0%), Mexican (7,422 | 7.0%), and Irish (7,149 | 6.8%), together accounting for 41.6% of all Concord residents.
| Ancestry | # Population | % Population |
| African | 2,274 | 2.2% |
| American | 9,919 | 9.4% |
| Arab | 292 | 0.3% |
| Argentinean | 48 | 0.1% |
| Australian | 16 | 0.0% |
| Austrian | 27 | 0.0% |
| Basque | 7 | 0.0% |
| Belgian | 14 | 0.0% |
| Bhutanese | 184 | 0.2% |
| Bolivian | 142 | 0.1% |
| Brazilian | 22 | 0.0% |
| British | 673 | 0.6% |
| Burmese | 179 | 0.2% |
| Cajun | 17 | 0.0% |
| Canadian | 37 | 0.0% |
| Celtic | 71 | 0.1% |
| Central American | 1,206 | 1.1% |
| Central American Indian | 111 | 0.1% |
| Cherokee | 207 | 0.2% |
| Colombian | 197 | 0.2% |
| Costa Rican | 30 | 0.0% |
| Croatian | 20 | 0.0% |
| Cuban | 418 | 0.4% |
| Czech | 187 | 0.2% |
| Czechoslovakian | 78 | 0.1% |
| Danish | 64 | 0.1% |
| Delaware | 22 | 0.0% |
| Dominican | 665 | 0.6% |
| Dutch | 617 | 0.6% |
| Eastern European | 77 | 0.1% |
| Ecuadorian | 184 | 0.2% |
| Egyptian | 52 | 0.1% |
| English | 8,436 | 8.0% |
| Estonian | 9 | 0.0% |
| Ethiopian | 59 | 0.1% |
| European | 1,831 | 1.7% |
| Finnish | 54 | 0.1% |
| French | 1,536 | 1.5% |
| French American Indian | 12 | 0.0% |
| French Canadian | 270 | 0.3% |
| German | 10,849 | 10.3% |
| Ghanaian | 70 | 0.1% |
| Greek | 487 | 0.5% |
| Guamanian / Chamorro | 48 | 0.1% |
| Guatemalan | 346 | 0.3% |
| Haitian | 480 | 0.5% |
| Honduran | 164 | 0.2% |
| Hungarian | 199 | 0.2% |
| Indian (Asian) | 452 | 0.4% |
| Iranian | 65 | 0.1% |
| Irish | 7,149 | 6.8% |
| Italian | 3,090 | 2.9% |
| Jamaican | 438 | 0.4% |
| Japanese | 147 | 0.1% |
| Kenyan | 27 | 0.0% |
| Korean | 349 | 0.3% |
| Latvian | 11 | 0.0% |
| Lebanese | 38 | 0.0% |
| Liberian | 83 | 0.1% |
| Lithuanian | 90 | 0.1% |
| Lumbee | 6 | 0.0% |
| Malaysian | 73 | 0.1% |
| Mexican | 7,422 | 7.0% |
| Mexican American Indian | 17 | 0.0% |
| Native Hawaiian | 57 | 0.1% |
| Nicaraguan | 219 | 0.2% |
| Nigerian | 191 | 0.2% |
| Northern European | 32 | 0.0% |
| Norwegian | 281 | 0.3% |
| Osage | 17 | 0.0% |
| Pakistani | 16 | 0.0% |
| Panamanian | 107 | 0.1% |
| Pennsylvania German | 15 | 0.0% |
| Peruvian | 331 | 0.3% |
| Polish | 1,293 | 1.2% |
| Portuguese | 71 | 0.1% |
| Puerto Rican | 2,203 | 2.1% |
| Romanian | 38 | 0.0% |
| Russian | 199 | 0.2% |
| Salvadoran | 340 | 0.3% |
| Samoan | 63 | 0.1% |
| Scandinavian | 188 | 0.2% |
| Scotch-Irish | 2,120 | 2.0% |
| Scottish | 1,644 | 1.6% |
| Serbian | 24 | 0.0% |
| Sioux | 80 | 0.1% |
| Slavic | 41 | 0.0% |
| Slovak | 243 | 0.2% |
| Slovene | 8 | 0.0% |
| South African | 14 | 0.0% |
| South American | 1,321 | 1.3% |
| Spaniard | 279 | 0.3% |
| Spanish | 378 | 0.4% |
| Sri Lankan | 447 | 0.4% |
| Subsaharan African | 2,839 | 2.7% |
| Swedish | 737 | 0.7% |
| Swiss | 146 | 0.1% |
| Syrian | 182 | 0.2% |
| Thai | 4,878 | 4.6% |
| Trinidadian and Tobagonian | 115 | 0.1% |
| Ugandan | 100 | 0.1% |
| Ukrainian | 127 | 0.1% |
| Venezuelan | 419 | 0.4% |
| Welsh | 580 | 0.5% |
| West Indian | 52 | 0.1% | View All 105 Rows |
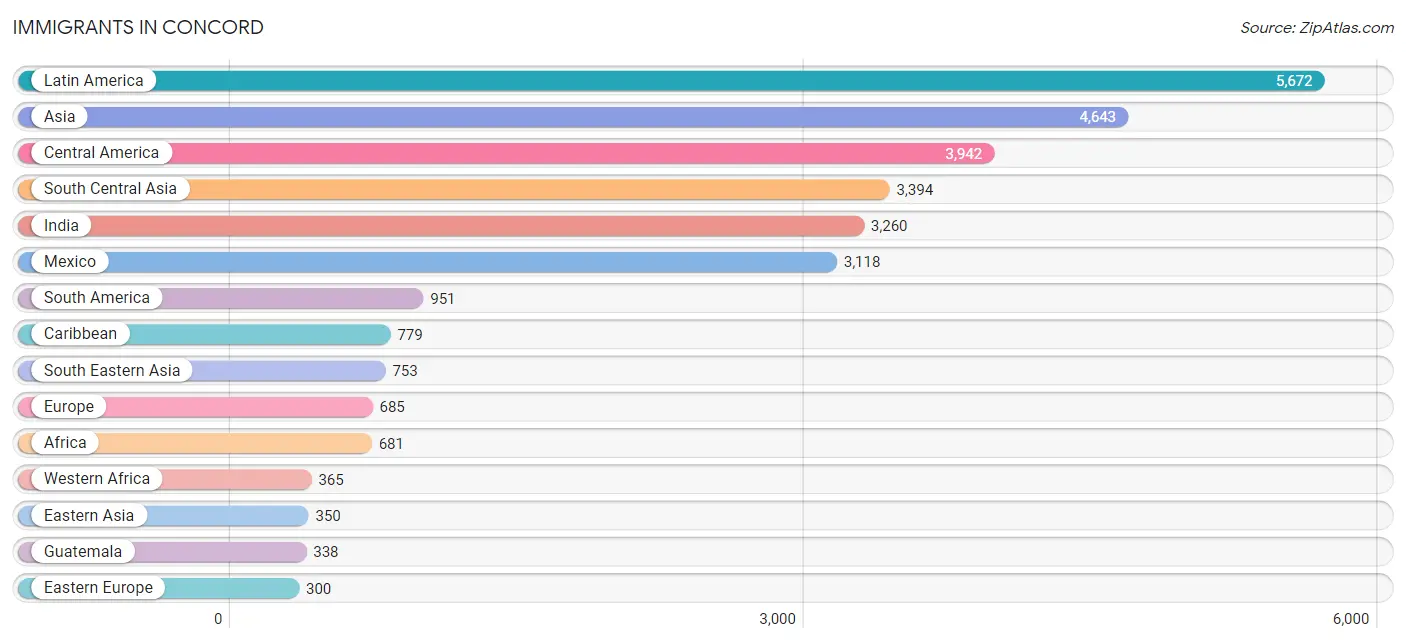
Immigrants in Concord
The most numerous immigrant groups reported in Concord came from Latin America (5,672 | 5.4%), Asia (4,643 | 4.4%), Central America (3,942 | 3.7%), South Central Asia (3,394 | 3.2%), and India (3,260 | 3.1%), together accounting for 19.8% of all Concord residents.
| Immigration Origin | # Population | % Population |
| Africa | 681 | 0.6% |
| Argentina | 15 | 0.0% |
| Asia | 4,643 | 4.4% |
| Australia | 14 | 0.0% |
| Barbados | 16 | 0.0% |
| Belgium | 14 | 0.0% |
| Bolivia | 142 | 0.1% |
| Cambodia | 85 | 0.1% |
| Cameroon | 79 | 0.1% |
| Canada | 62 | 0.1% |
| Caribbean | 779 | 0.7% |
| Central America | 3,942 | 3.7% |
| China | 249 | 0.2% |
| Colombia | 298 | 0.3% |
| Costa Rica | 20 | 0.0% |
| Cuba | 75 | 0.1% |
| Czechoslovakia | 36 | 0.0% |
| Denmark | 1 | 0.0% |
| Dominican Republic | 194 | 0.2% |
| Eastern Africa | 198 | 0.2% |
| Eastern Asia | 350 | 0.3% |
| Eastern Europe | 300 | 0.3% |
| Ecuador | 184 | 0.2% |
| Egypt | 12 | 0.0% |
| El Salvador | 99 | 0.1% |
| England | 96 | 0.1% |
| Ethiopia | 57 | 0.1% |
| Europe | 685 | 0.6% |
| France | 37 | 0.0% |
| Germany | 69 | 0.1% |
| Ghana | 72 | 0.1% |
| Guatemala | 338 | 0.3% |
| Haiti | 175 | 0.2% |
| Honduras | 172 | 0.2% |
| Hong Kong | 17 | 0.0% |
| India | 3,260 | 3.1% |
| Indonesia | 109 | 0.1% |
| Iran | 22 | 0.0% |
| Ireland | 23 | 0.0% |
| Italy | 50 | 0.1% |
| Jamaica | 235 | 0.2% |
| Jordan | 8 | 0.0% |
| Kenya | 28 | 0.0% |
| Korea | 101 | 0.1% |
| Kuwait | 19 | 0.0% |
| Laos | 73 | 0.1% |
| Latin America | 5,672 | 5.4% |
| Liberia | 195 | 0.2% |
| Mexico | 3,118 | 3.0% |
| Middle Africa | 79 | 0.1% |
| Nepal | 112 | 0.1% |
| Nicaragua | 150 | 0.1% |
| Nigeria | 98 | 0.1% |
| Northern Africa | 12 | 0.0% |
| Northern Europe | 215 | 0.2% |
| Norway | 12 | 0.0% |
| Oceania | 23 | 0.0% |
| Panama | 45 | 0.0% |
| Peru | 175 | 0.2% |
| Philippines | 221 | 0.2% |
| Poland | 33 | 0.0% |
| Romania | 115 | 0.1% |
| Russia | 58 | 0.1% |
| Scotland | 2 | 0.0% |
| South America | 951 | 0.9% |
| South Central Asia | 3,394 | 3.2% |
| South Eastern Asia | 753 | 0.7% |
| Southern Europe | 50 | 0.1% |
| Syria | 57 | 0.1% |
| Taiwan | 19 | 0.0% |
| Thailand | 16 | 0.0% |
| Trinidad and Tobago | 52 | 0.1% |
| Uganda | 100 | 0.1% |
| Ukraine | 58 | 0.1% |
| Venezuela | 137 | 0.1% |
| Vietnam | 249 | 0.2% |
| Western Africa | 365 | 0.4% |
| Western Asia | 84 | 0.1% |
| Western Europe | 120 | 0.1% | View All 79 Rows |
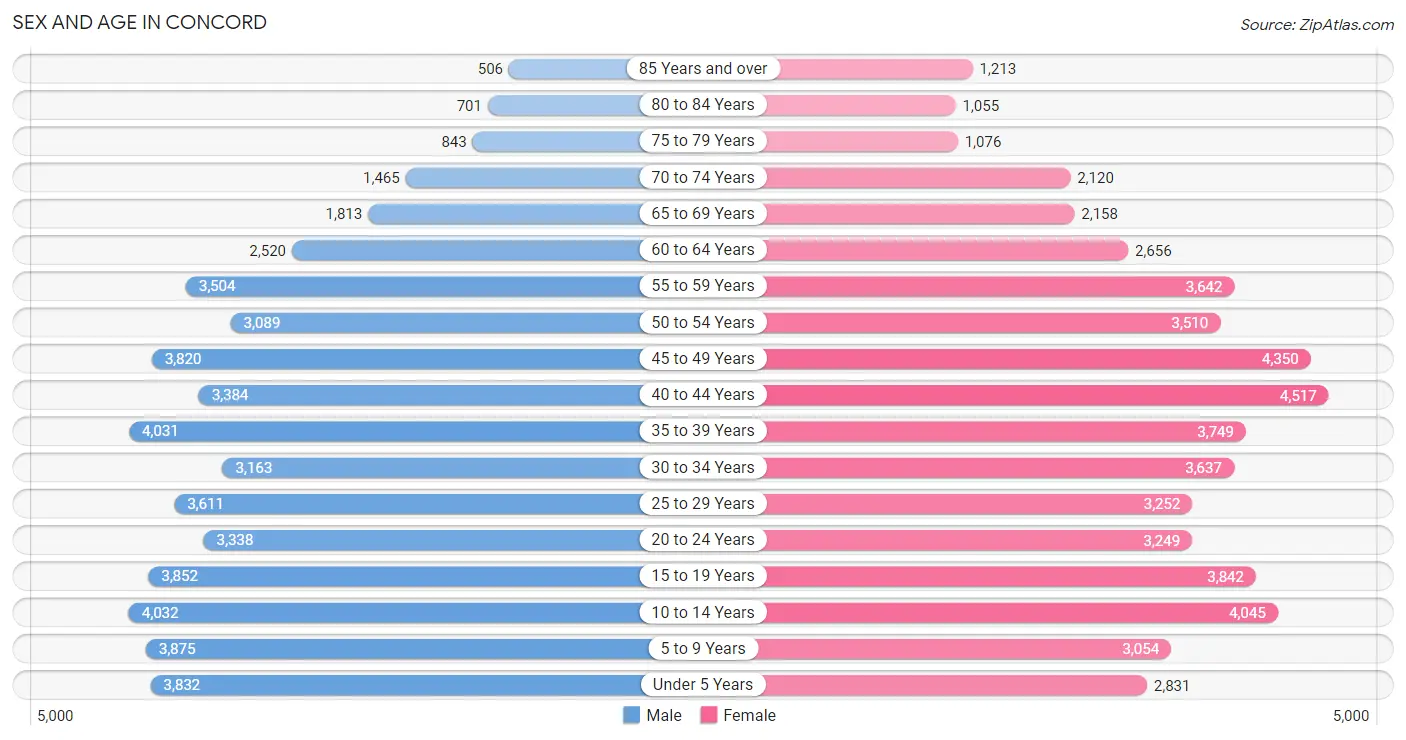
Sex and Age in Concord
Sex and Age in Concord
The most populous age groups in Concord are 10 to 14 Years (4,032 | 7.9%) for men and 40 to 44 Years (4,517 | 8.4%) for women.
| Age Bracket | Male | Female |
| Under 5 Years | 3,832 (7.5%) | 2,831 (5.2%) |
| 5 to 9 Years | 3,875 (7.5%) | 3,054 (5.7%) |
| 10 to 14 Years | 4,032 (7.9%) | 4,045 (7.5%) |
| 15 to 19 Years | 3,852 (7.5%) | 3,842 (7.1%) |
| 20 to 24 Years | 3,338 (6.5%) | 3,249 (6.0%) |
| 25 to 29 Years | 3,611 (7.0%) | 3,252 (6.0%) |
| 30 to 34 Years | 3,163 (6.2%) | 3,637 (6.7%) |
| 35 to 39 Years | 4,031 (7.9%) | 3,749 (7.0%) |
| 40 to 44 Years | 3,384 (6.6%) | 4,517 (8.4%) |
| 45 to 49 Years | 3,820 (7.4%) | 4,350 (8.1%) |
| 50 to 54 Years | 3,089 (6.0%) | 3,510 (6.5%) |
| 55 to 59 Years | 3,504 (6.8%) | 3,642 (6.8%) |
| 60 to 64 Years | 2,520 (4.9%) | 2,656 (4.9%) |
| 65 to 69 Years | 1,813 (3.5%) | 2,158 (4.0%) |
| 70 to 74 Years | 1,465 (2.9%) | 2,120 (3.9%) |
| 75 to 79 Years | 843 (1.6%) | 1,076 (2.0%) |
| 80 to 84 Years | 701 (1.4%) | 1,055 (2.0%) |
| 85 Years and over | 506 (1.0%) | 1,213 (2.2%) |
| Total | 51,379 (100.0%) | 53,956 (100.0%) |
Families and Households in Concord
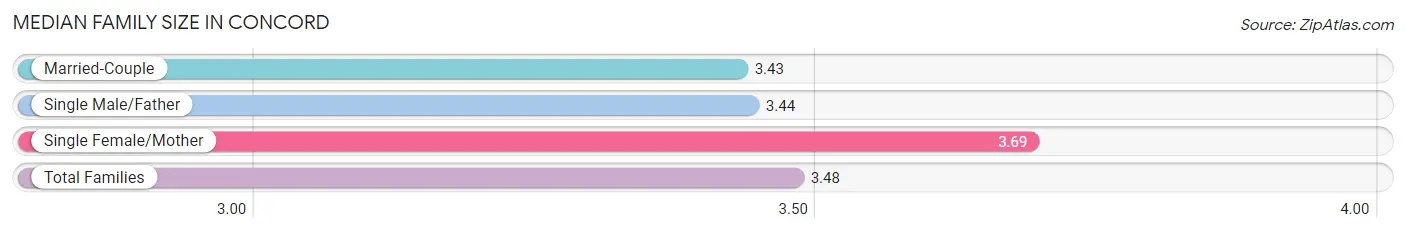
Median Family Size in Concord
The median family size in Concord is 3.48 persons per family, with single female/mother families (5,093 | 20.0%) accounting for the largest median family size of 3.69 persons per family. On the other hand, married-couple families (18,858 | 74.0%) represent the smallest median family size with 3.43 persons per family.
| Family Type | # Families | Family Size |
| Married-Couple | 18,858 (74.0%) | 3.43 |
| Single Male/Father | 1,520 (6.0%) | 3.44 |
| Single Female/Mother | 5,093 (20.0%) | 3.69 |
| Total Families | 25,471 (100.0%) | 3.48 |
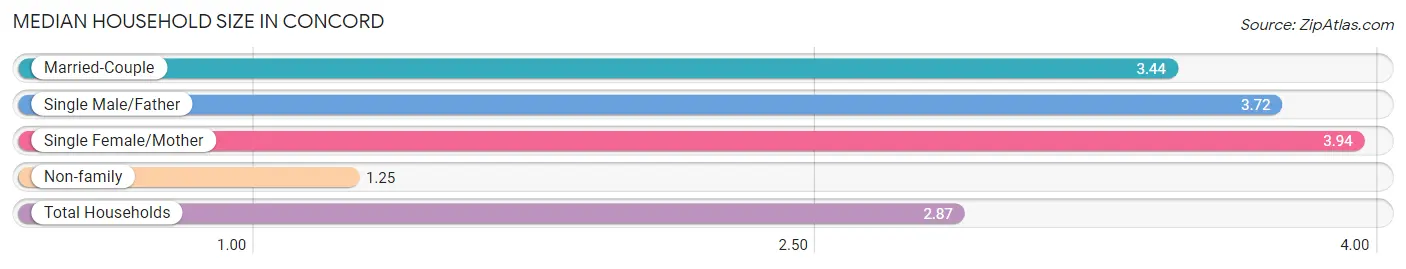
Median Household Size in Concord
The median household size in Concord is 2.87 persons per household, with single female/mother households (5,093 | 14.1%) accounting for the largest median household size of 3.94 persons per household. non-family households (10,734 | 29.6%) represent the smallest median household size with 1.25 persons per household.
| Household Type | # Households | Household Size |
| Married-Couple | 18,858 (52.1%) | 3.44 |
| Single Male/Father | 1,520 (4.2%) | 3.72 |
| Single Female/Mother | 5,093 (14.1%) | 3.94 |
| Non-family | 10,734 (29.6%) | 1.25 |
| Total Households | 36,205 (100.0%) | 2.87 |
Household Size by Marriage Status in Concord
Out of a total of 36,205 households in Concord, 25,471 (70.4%) are family households, while 10,734 (29.6%) are nonfamily households. The most numerous type of family households are 2-person households, comprising 11,155, and the most common type of nonfamily households are 1-person households, comprising 8,896.
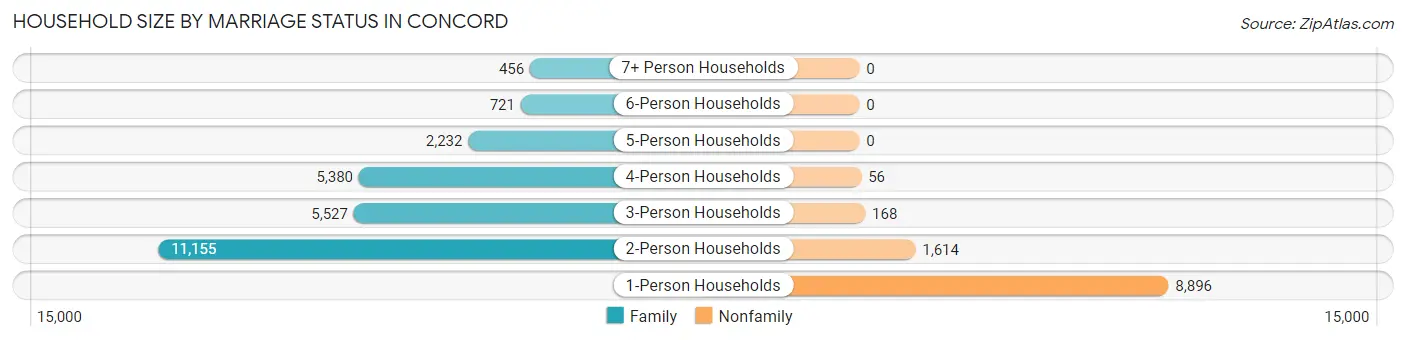
| Household Size | Family Households | Nonfamily Households |
| 1-Person Households | - | 8,896 (24.6%) |
| 2-Person Households | 11,155 (30.8%) | 1,614 (4.5%) |
| 3-Person Households | 5,527 (15.3%) | 168 (0.5%) |
| 4-Person Households | 5,380 (14.9%) | 56 (0.2%) |
| 5-Person Households | 2,232 (6.2%) | 0 (0.0%) |
| 6-Person Households | 721 (2.0%) | 0 (0.0%) |
| 7+ Person Households | 456 (1.3%) | 0 (0.0%) |
| Total | 25,471 (70.4%) | 10,734 (29.6%) |
Female Fertility in Concord
Fertility by Age in Concord
Average fertility rate in Concord is 39.0 births per 1,000 women. Women in the age bracket of 20 to 34 years have the highest fertility rate with 84.0 births per 1,000 women. Women in the age bracket of 20 to 34 years acount for 79.5% of all women with births.
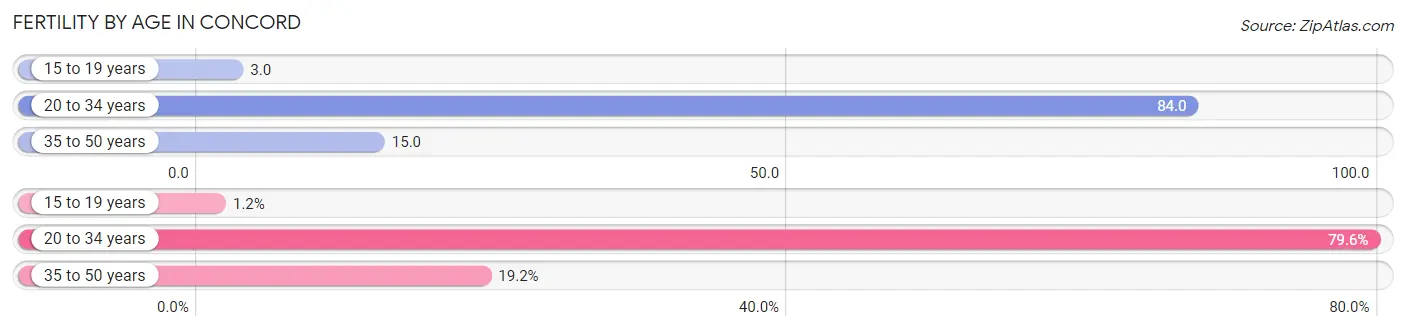
| Age Bracket | Women with Births | Births / 1,000 Women |
| 15 to 19 years | 13 (1.2%) | 3.0 |
| 20 to 34 years | 848 (79.5%) | 84.0 |
| 35 to 50 years | 205 (19.2%) | 15.0 |
| Total | 1,066 (100.0%) | 39.0 |
Fertility by Age by Marriage Status in Concord
77.7% of women with births (1,066) in Concord are married. The highest percentage of unmarried women with births falls into 15 to 19 years age bracket with 100.0% of them unmarried at the time of birth, while the lowest percentage of unmarried women with births belong to 35 to 50 years age bracket with 5.8% of them unmarried.
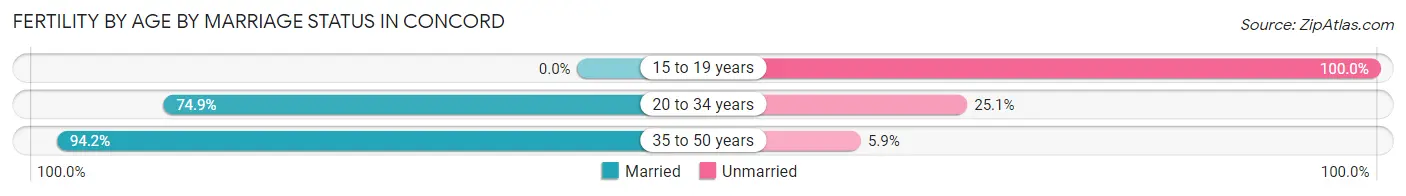
| Age Bracket | Married | Unmarried |
| 15 to 19 years | 0 (0.0%) | 13 (100.0%) |
| 20 to 34 years | 635 (74.9%) | 213 (25.1%) |
| 35 to 50 years | 193 (94.2%) | 12 (5.9%) |
| Total | 828 (77.7%) | 238 (22.3%) |
Fertility by Education in Concord
Average fertility rate in Concord is 39.0 births per 1,000 women. Women with the education attainment of bachelor's degree have the highest fertility rate of 62.0 births per 1,000 women, while women with the education attainment of less than high school have the lowest fertility at 3.0 births per 1,000 women. Women with the education attainment of bachelor's degree represent 43.1% of all women with births.
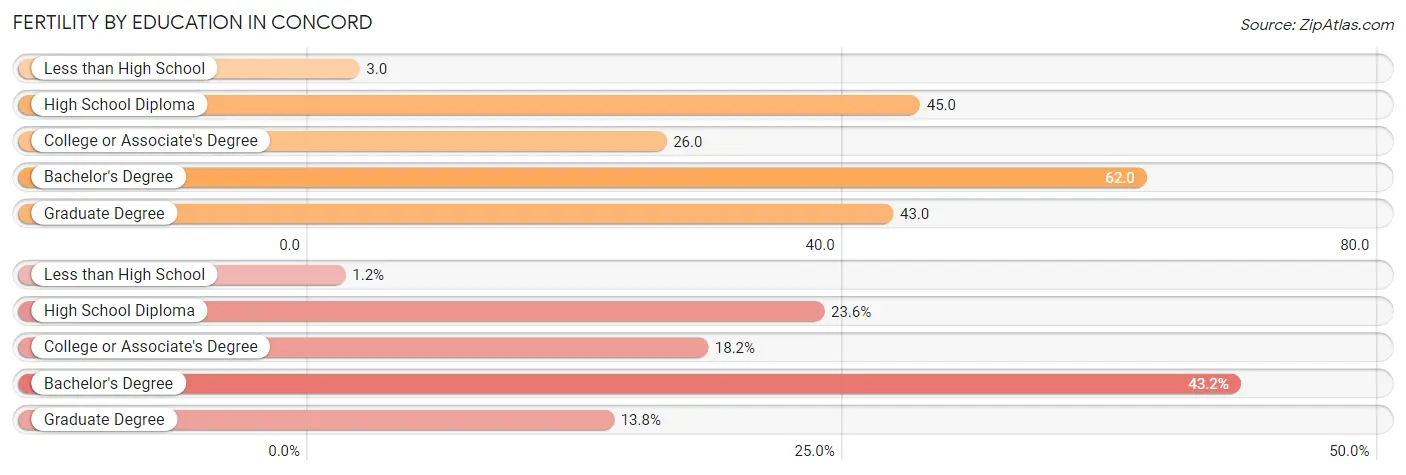
| Educational Attainment | Women with Births | Births / 1,000 Women |
| Less than High School | 13 (1.2%) | 3.0 |
| High School Diploma | 252 (23.6%) | 45.0 |
| College or Associate's Degree | 194 (18.2%) | 26.0 |
| Bachelor's Degree | 460 (43.1%) | 62.0 |
| Graduate Degree | 147 (13.8%) | 43.0 |
| Total | 1,066 (100.0%) | 39.0 |
Fertility by Education by Marriage Status in Concord
22.3% of women with births in Concord are unmarried. Women with the educational attainment of graduate degree are most likely to be married with 100.0% of them married at childbirth, while women with the educational attainment of less than high school are least likely to be married with 100.0% of them unmarried at childbirth.
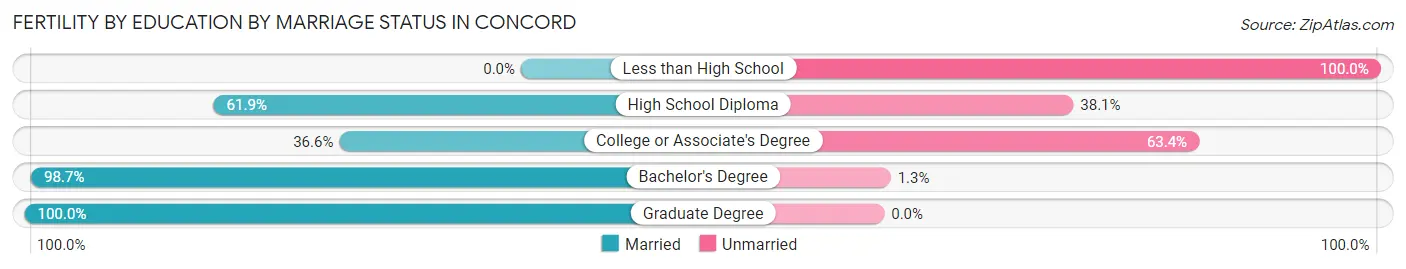
| Educational Attainment | Married | Unmarried |
| Less than High School | 0 (0.0%) | 13 (100.0%) |
| High School Diploma | 156 (61.9%) | 96 (38.1%) |
| College or Associate's Degree | 71 (36.6%) | 123 (63.4%) |
| Bachelor's Degree | 454 (98.7%) | 6 (1.3%) |
| Graduate Degree | 147 (100.0%) | 0 (0.0%) |
| Total | 828 (77.7%) | 238 (22.3%) |
Employment Characteristics in Concord
Employment by Class of Employer in Concord
Among the 53,175 employed individuals in Concord, private company employees (37,839 | 71.2%), not-for-profit organizations (3,944 | 7.4%), and local government employees (3,539 | 6.7%) make up the most common classes of employment.
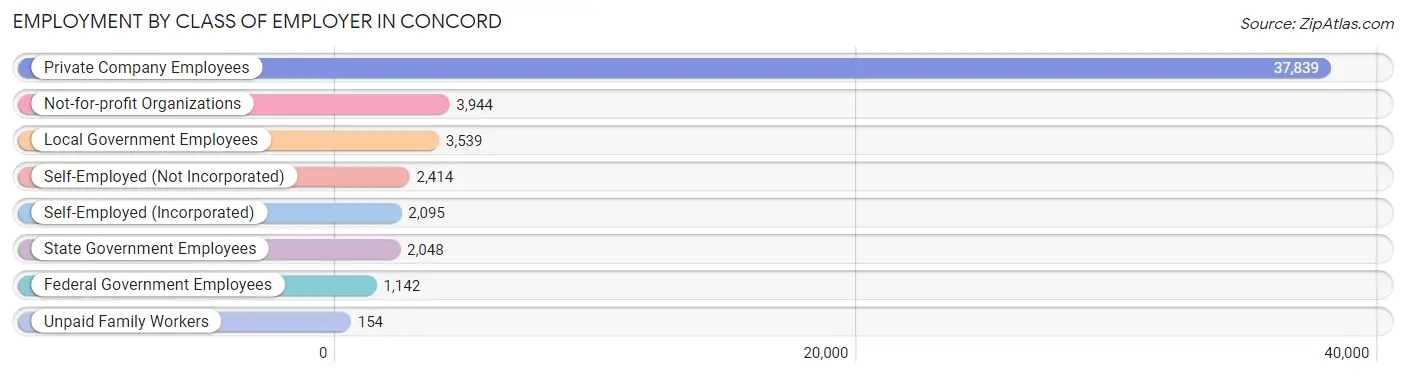
| Employer Class | # Employees | % Employees |
| Private Company Employees | 37,839 | 71.2% |
| Self-Employed (Incorporated) | 2,095 | 3.9% |
| Self-Employed (Not Incorporated) | 2,414 | 4.5% |
| Not-for-profit Organizations | 3,944 | 7.4% |
| Local Government Employees | 3,539 | 6.7% |
| State Government Employees | 2,048 | 3.8% |
| Federal Government Employees | 1,142 | 2.1% |
| Unpaid Family Workers | 154 | 0.3% |
| Total | 53,175 | 100.0% |
Employment Status by Age in Concord
According to the labor force statistics for Concord, out of the total population over 16 years of age (81,601), 69.4% or 56,631 individuals are in the labor force, with 4.7% or 2,662 of them unemployed. The age group with the highest labor force participation rate is 35 to 44 years, with 89.8% or 14,082 individuals in the labor force. Within the labor force, the 16 to 19 years age range has the highest percentage of unemployed individuals, with 15.8% or 423 of them being unemployed.
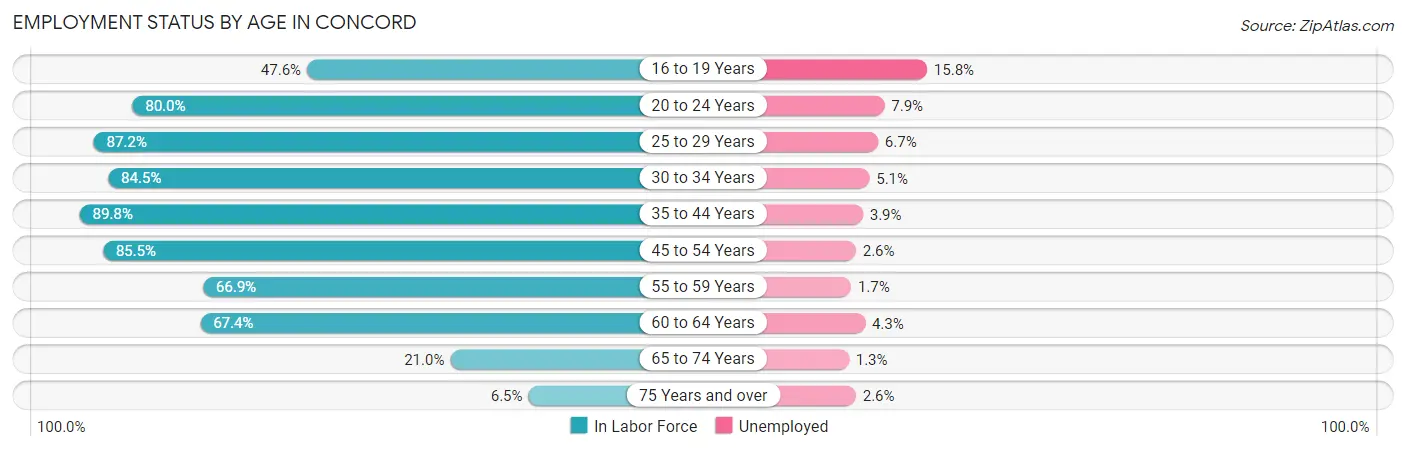
| Age Bracket | In Labor Force | Unemployed |
| 16 to 19 Years | 2,679 (47.6%) | 423 (15.8%) |
| 20 to 24 Years | 5,270 (80.0%) | 416 (7.9%) |
| 25 to 29 Years | 5,985 (87.2%) | 401 (6.7%) |
| 30 to 34 Years | 5,746 (84.5%) | 293 (5.1%) |
| 35 to 44 Years | 14,082 (89.8%) | 549 (3.9%) |
| 45 to 54 Years | 12,627 (85.5%) | 328 (2.6%) |
| 55 to 59 Years | 4,781 (66.9%) | 81 (1.7%) |
| 60 to 64 Years | 3,489 (67.4%) | 150 (4.3%) |
| 65 to 74 Years | 1,587 (21.0%) | 21 (1.3%) |
| 75 Years and over | 351 (6.5%) | 9 (2.6%) |
| Total | 56,631 (69.4%) | 2,662 (4.7%) |
Employment Status by Educational Attainment in Concord
According to labor force statistics for Concord, 82.8% of individuals (46,728) out of the total population between 25 and 64 years of age (56,435) are in the labor force, with 3.8% or 1,776 of them being unemployed. The group with the highest labor force participation rate are those with the educational attainment of bachelor's degree or higher, with 86.8% or 21,295 individuals in the labor force. Within the labor force, individuals with high school diploma education have the highest percentage of unemployment, with 8.3% or 746 of them being unemployed.
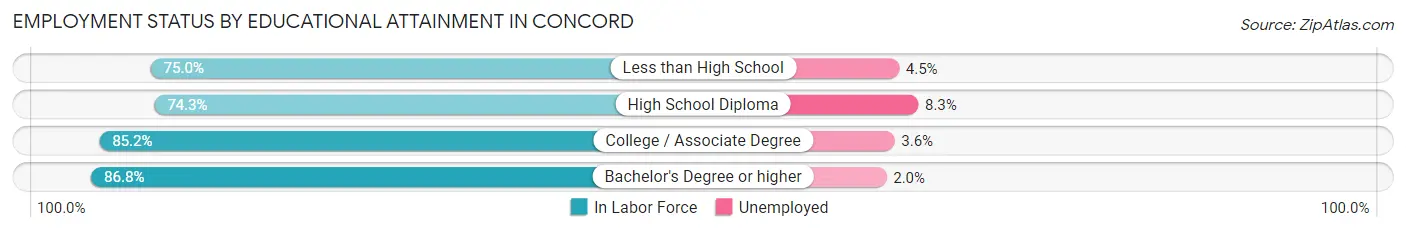
| Educational Attainment | In Labor Force | Unemployed |
| Less than High School | 3,305 (75.0%) | 198 (4.5%) |
| High School Diploma | 8,990 (74.3%) | 1,004 (8.3%) |
| College / Associate Degree | 13,117 (85.2%) | 554 (3.6%) |
| Bachelor's Degree or higher | 21,295 (86.8%) | 491 (2.0%) |
| Total | 46,728 (82.8%) | 2,145 (3.8%) |
Employment Occupations by Sex in Concord
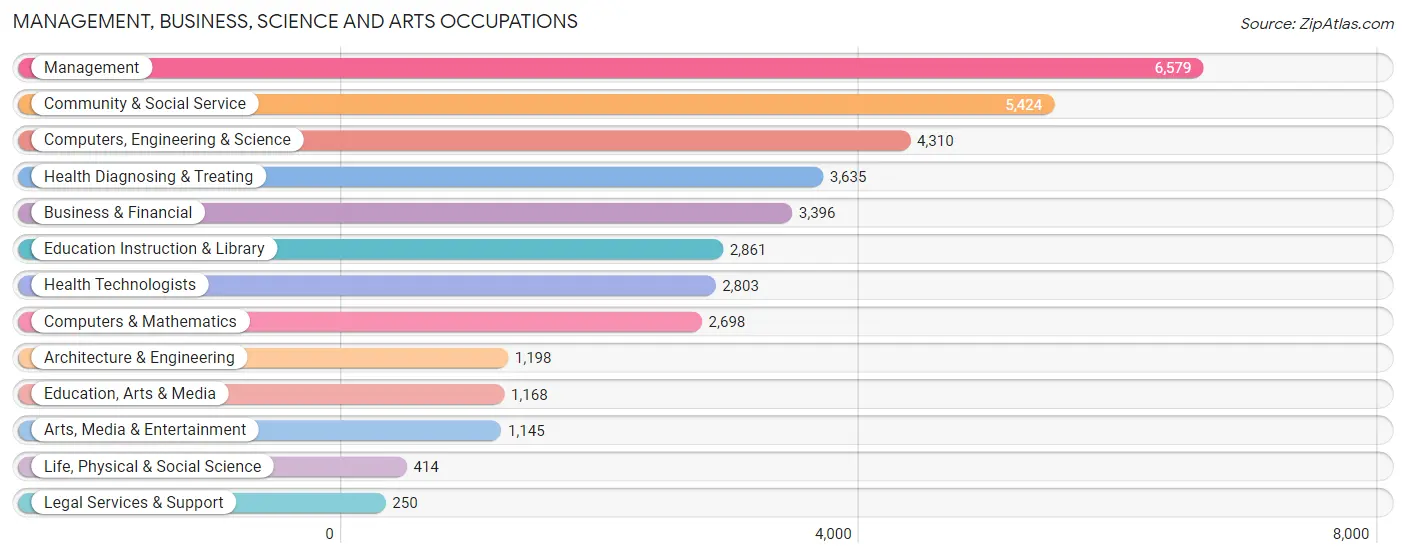
Management, Business, Science and Arts Occupations
The most common Management, Business, Science and Arts occupations in Concord are Management (6,579 | 12.2%), Community & Social Service (5,424 | 10.1%), Computers, Engineering & Science (4,310 | 8.0%), Health Diagnosing & Treating (3,635 | 6.8%), and Business & Financial (3,396 | 6.3%).
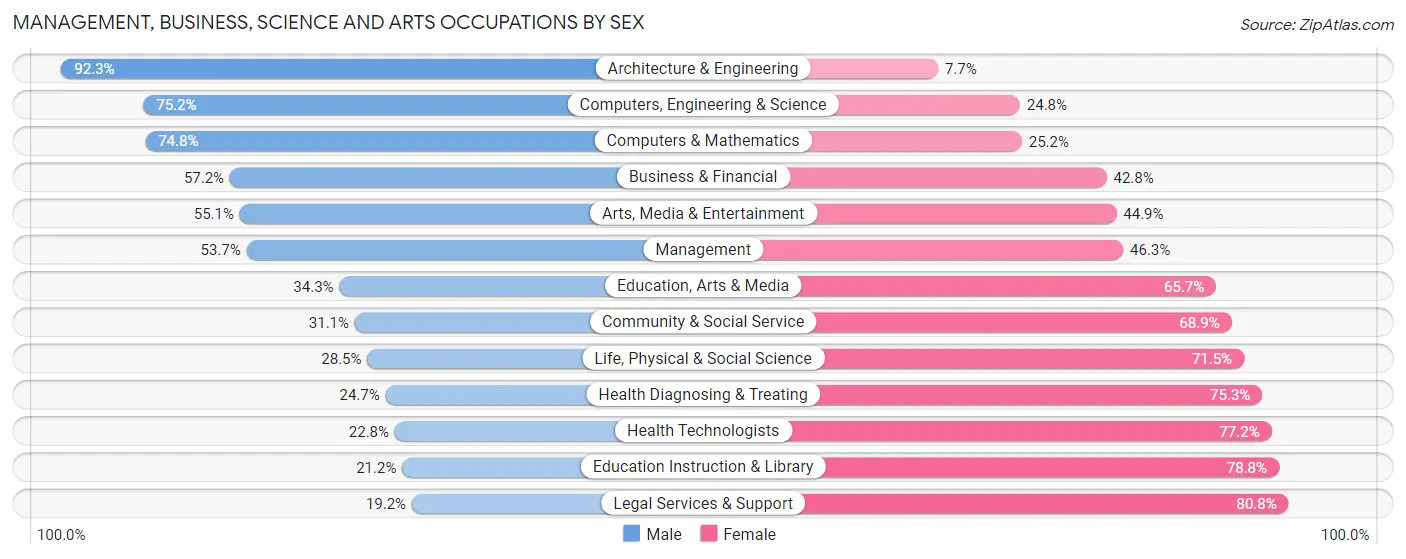
Management, Business, Science and Arts Occupations by Sex
Within the Management, Business, Science and Arts occupations in Concord, the most male-oriented occupations are Architecture & Engineering (92.3%), Computers, Engineering & Science (75.2%), and Computers & Mathematics (74.8%), while the most female-oriented occupations are Legal Services & Support (80.8%), Education Instruction & Library (78.8%), and Health Technologists (77.2%).
| Occupation | Male | Female |
| Management | 3,533 (53.7%) | 3,046 (46.3%) |
| Business & Financial | 1,941 (57.2%) | 1,455 (42.8%) |
| Computers, Engineering & Science | 3,243 (75.2%) | 1,067 (24.8%) |
| Computers & Mathematics | 2,019 (74.8%) | 679 (25.2%) |
| Architecture & Engineering | 1,106 (92.3%) | 92 (7.7%) |
| Life, Physical & Social Science | 118 (28.5%) | 296 (71.5%) |
| Community & Social Service | 1,687 (31.1%) | 3,737 (68.9%) |
| Education, Arts & Media | 401 (34.3%) | 767 (65.7%) |
| Legal Services & Support | 48 (19.2%) | 202 (80.8%) |
| Education Instruction & Library | 607 (21.2%) | 2,254 (78.8%) |
| Arts, Media & Entertainment | 631 (55.1%) | 514 (44.9%) |
| Health Diagnosing & Treating | 898 (24.7%) | 2,737 (75.3%) |
| Health Technologists | 638 (22.8%) | 2,165 (77.2%) |
| Total (Category) | 11,302 (48.4%) | 12,042 (51.6%) |
| Total (Overall) | 27,969 (52.0%) | 25,766 (47.9%) |
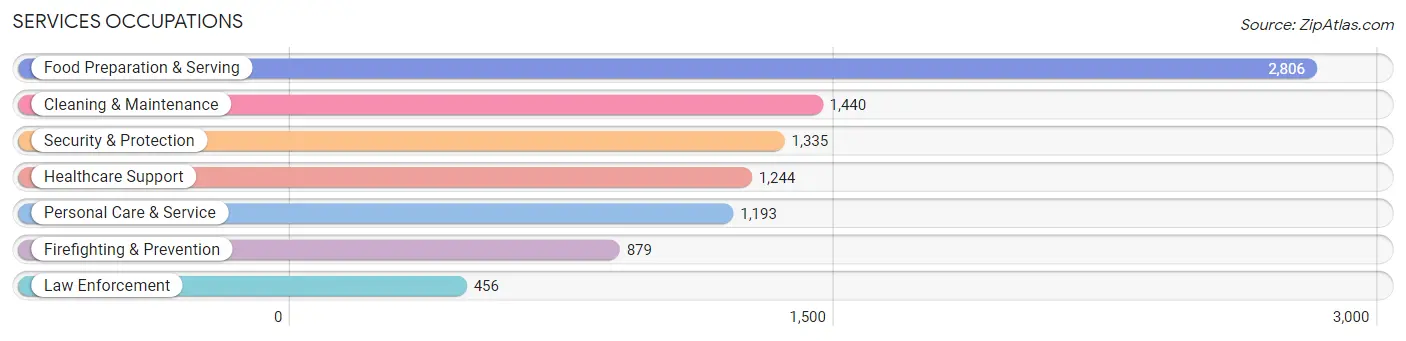
Services Occupations
The most common Services occupations in Concord are Food Preparation & Serving (2,806 | 5.2%), Cleaning & Maintenance (1,440 | 2.7%), Security & Protection (1,335 | 2.5%), Healthcare Support (1,244 | 2.3%), and Personal Care & Service (1,193 | 2.2%).
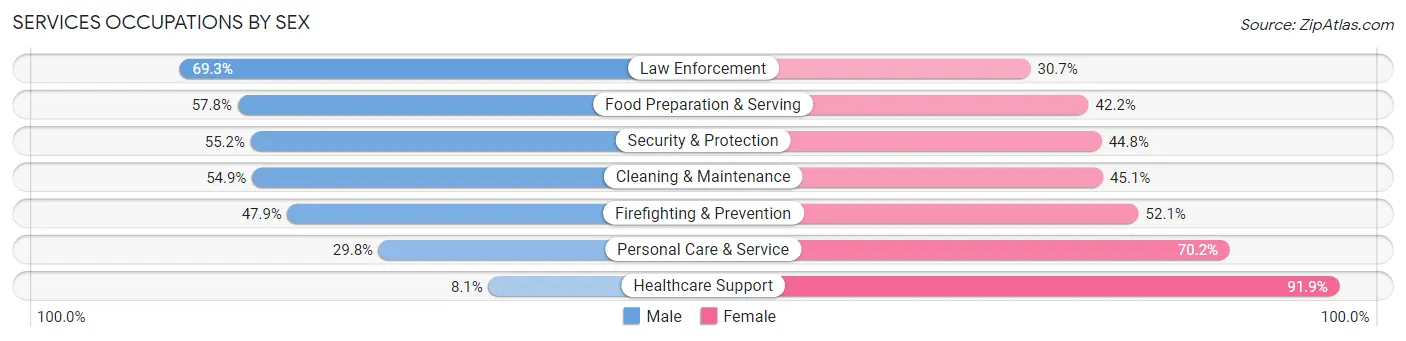
Services Occupations by Sex
Within the Services occupations in Concord, the most male-oriented occupations are Law Enforcement (69.3%), Food Preparation & Serving (57.8%), and Security & Protection (55.2%), while the most female-oriented occupations are Healthcare Support (91.9%), Personal Care & Service (70.2%), and Firefighting & Prevention (52.1%).
| Occupation | Male | Female |
| Healthcare Support | 101 (8.1%) | 1,143 (91.9%) |
| Security & Protection | 737 (55.2%) | 598 (44.8%) |
| Firefighting & Prevention | 421 (47.9%) | 458 (52.1%) |
| Law Enforcement | 316 (69.3%) | 140 (30.7%) |
| Food Preparation & Serving | 1,622 (57.8%) | 1,184 (42.2%) |
| Cleaning & Maintenance | 791 (54.9%) | 649 (45.1%) |
| Personal Care & Service | 356 (29.8%) | 837 (70.2%) |
| Total (Category) | 3,607 (45.0%) | 4,411 (55.0%) |
| Total (Overall) | 27,969 (52.0%) | 25,766 (47.9%) |
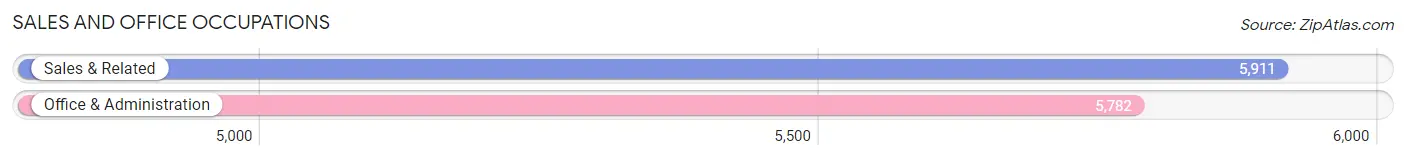
Sales and Office Occupations
The most common Sales and Office occupations in Concord are Sales & Related (5,911 | 11.0%), and Office & Administration (5,782 | 10.8%).
Sales and Office Occupations by Sex
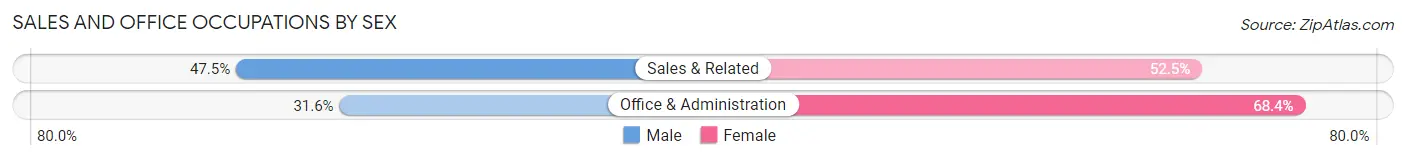
| Occupation | Male | Female |
| Sales & Related | 2,806 (47.5%) | 3,105 (52.5%) |
| Office & Administration | 1,825 (31.6%) | 3,957 (68.4%) |
| Total (Category) | 4,631 (39.6%) | 7,062 (60.4%) |
| Total (Overall) | 27,969 (52.0%) | 25,766 (47.9%) |
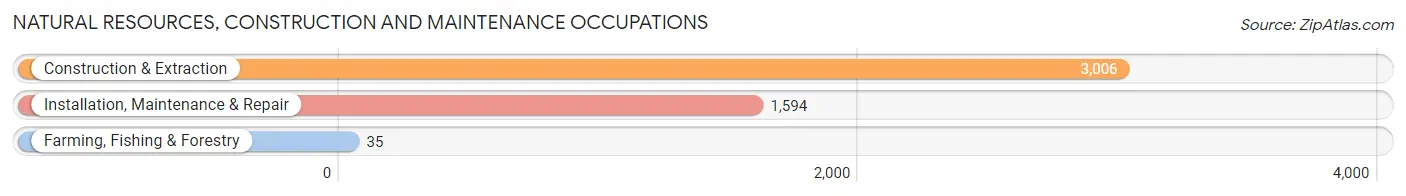
Natural Resources, Construction and Maintenance Occupations
The most common Natural Resources, Construction and Maintenance occupations in Concord are Construction & Extraction (3,006 | 5.6%), Installation, Maintenance & Repair (1,594 | 3.0%), and Farming, Fishing & Forestry (35 | 0.1%).
Natural Resources, Construction and Maintenance Occupations by Sex
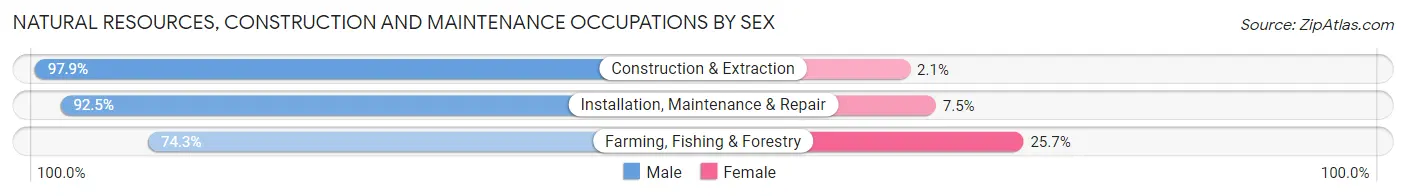
| Occupation | Male | Female |
| Farming, Fishing & Forestry | 26 (74.3%) | 9 (25.7%) |
| Construction & Extraction | 2,942 (97.9%) | 64 (2.1%) |
| Installation, Maintenance & Repair | 1,475 (92.5%) | 119 (7.5%) |
| Total (Category) | 4,443 (95.9%) | 192 (4.1%) |
| Total (Overall) | 27,969 (52.0%) | 25,766 (47.9%) |
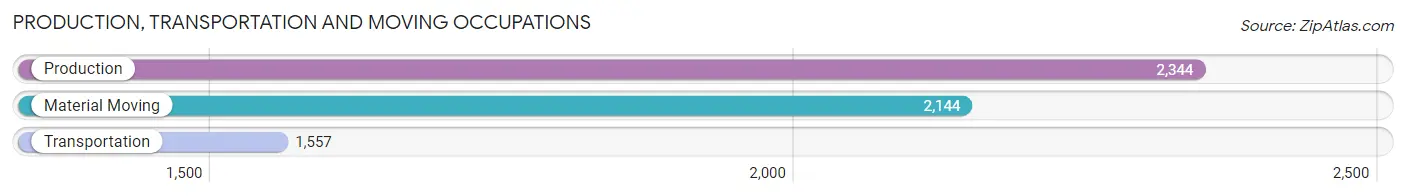
Production, Transportation and Moving Occupations
The most common Production, Transportation and Moving occupations in Concord are Production (2,344 | 4.4%), Material Moving (2,144 | 4.0%), and Transportation (1,557 | 2.9%).
Production, Transportation and Moving Occupations by Sex
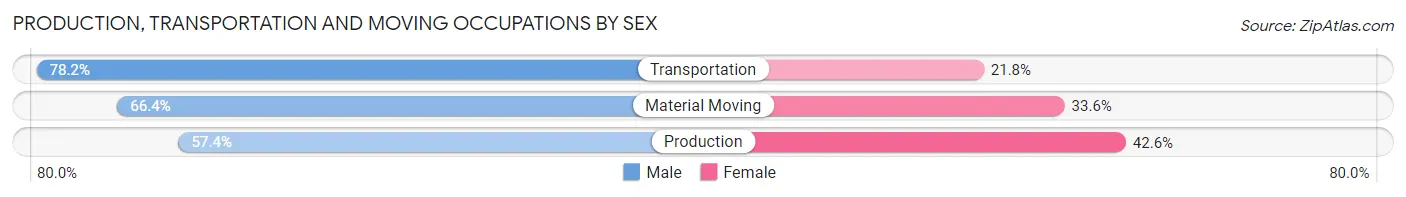
| Occupation | Male | Female |
| Production | 1,345 (57.4%) | 999 (42.6%) |
| Transportation | 1,218 (78.2%) | 339 (21.8%) |
| Material Moving | 1,423 (66.4%) | 721 (33.6%) |
| Total (Category) | 3,986 (65.9%) | 2,059 (34.1%) |
| Total (Overall) | 27,969 (52.0%) | 25,766 (47.9%) |
Employment Industries by Sex in Concord
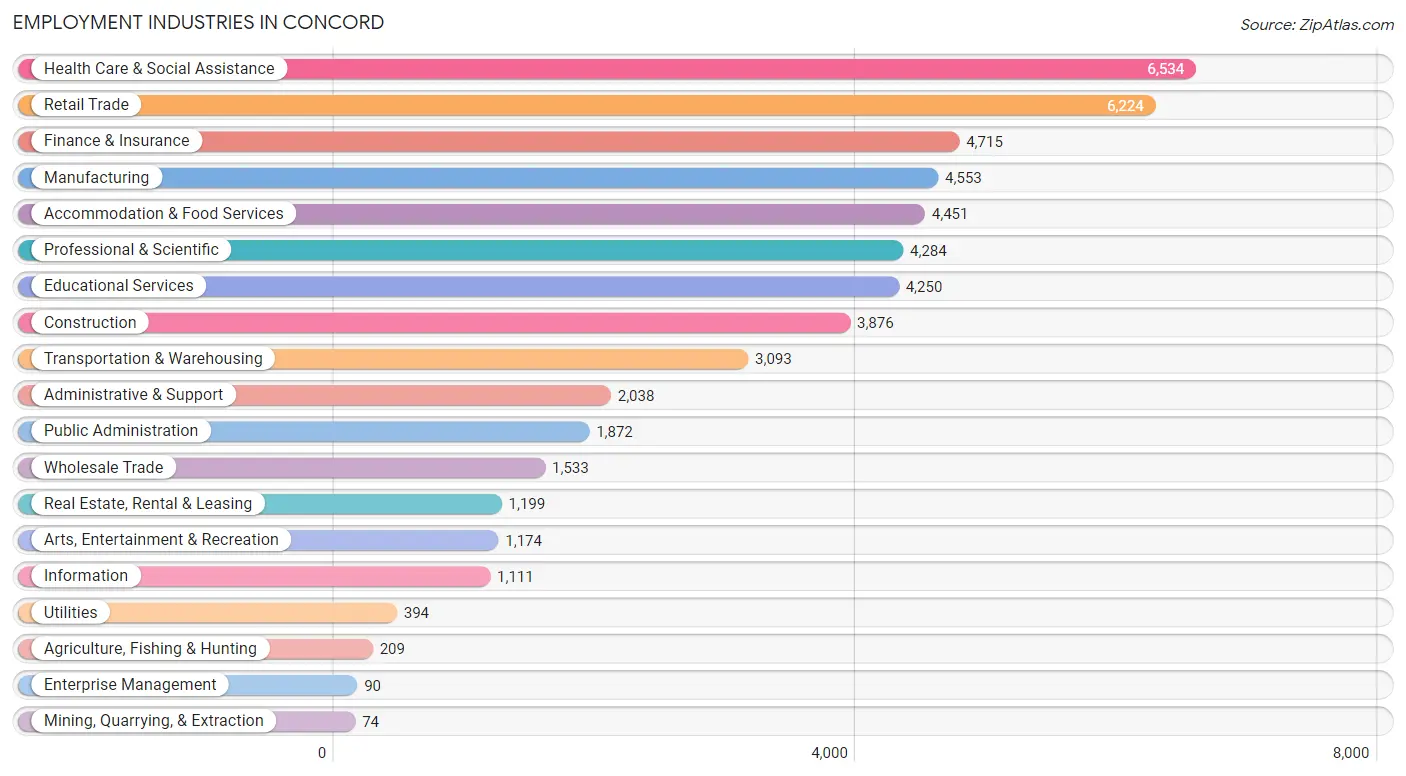
Employment Industries in Concord
The major employment industries in Concord include Health Care & Social Assistance (6,534 | 12.2%), Retail Trade (6,224 | 11.6%), Finance & Insurance (4,715 | 8.8%), Manufacturing (4,553 | 8.5%), and Accommodation & Food Services (4,451 | 8.3%).
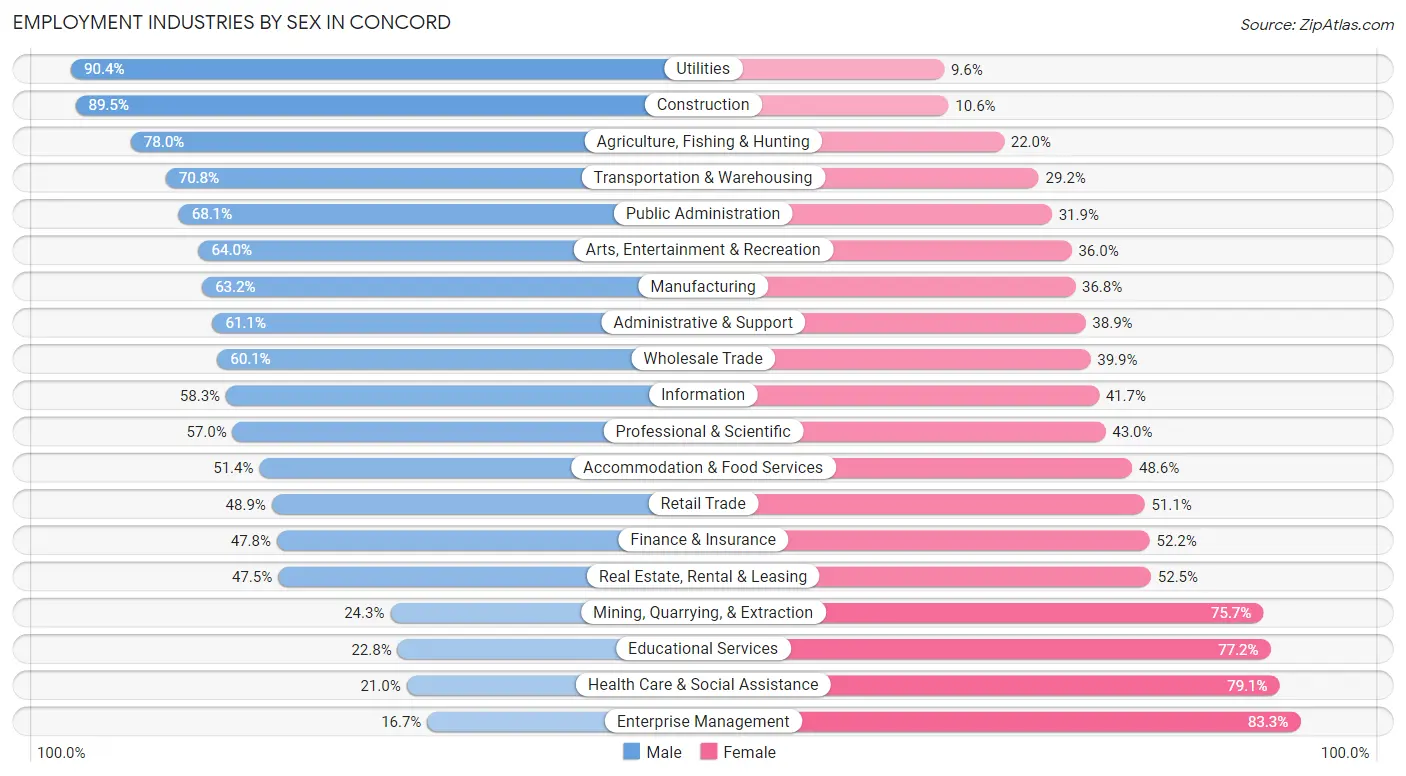
Employment Industries by Sex in Concord
The Concord industries that see more men than women are Utilities (90.4%), Construction (89.4%), and Agriculture, Fishing & Hunting (78.0%), whereas the industries that tend to have a higher number of women are Enterprise Management (83.3%), Health Care & Social Assistance (79.0%), and Educational Services (77.2%).
| Industry | Male | Female |
| Agriculture, Fishing & Hunting | 163 (78.0%) | 46 (22.0%) |
| Mining, Quarrying, & Extraction | 18 (24.3%) | 56 (75.7%) |
| Construction | 3,467 (89.4%) | 409 (10.5%) |
| Manufacturing | 2,879 (63.2%) | 1,674 (36.8%) |
| Wholesale Trade | 921 (60.1%) | 612 (39.9%) |
| Retail Trade | 3,041 (48.9%) | 3,183 (51.1%) |
| Transportation & Warehousing | 2,189 (70.8%) | 904 (29.2%) |
| Utilities | 356 (90.4%) | 38 (9.6%) |
| Information | 648 (58.3%) | 463 (41.7%) |
| Finance & Insurance | 2,254 (47.8%) | 2,461 (52.2%) |
| Real Estate, Rental & Leasing | 570 (47.5%) | 629 (52.5%) |
| Professional & Scientific | 2,440 (57.0%) | 1,844 (43.0%) |
| Enterprise Management | 15 (16.7%) | 75 (83.3%) |
| Administrative & Support | 1,245 (61.1%) | 793 (38.9%) |
| Educational Services | 970 (22.8%) | 3,280 (77.2%) |
| Health Care & Social Assistance | 1,369 (20.9%) | 5,165 (79.0%) |
| Arts, Entertainment & Recreation | 751 (64.0%) | 423 (36.0%) |
| Accommodation & Food Services | 2,289 (51.4%) | 2,162 (48.6%) |
| Public Administration | 1,274 (68.1%) | 598 (31.9%) |
| Total | 27,969 (52.0%) | 25,766 (47.9%) |
Education in Concord
School Enrollment in Concord
The most common levels of schooling among the 27,473 students in Concord are high school (7,048 | 25.7%), middle school (6,020 | 21.9%), and elementary school (5,800 | 21.1%).
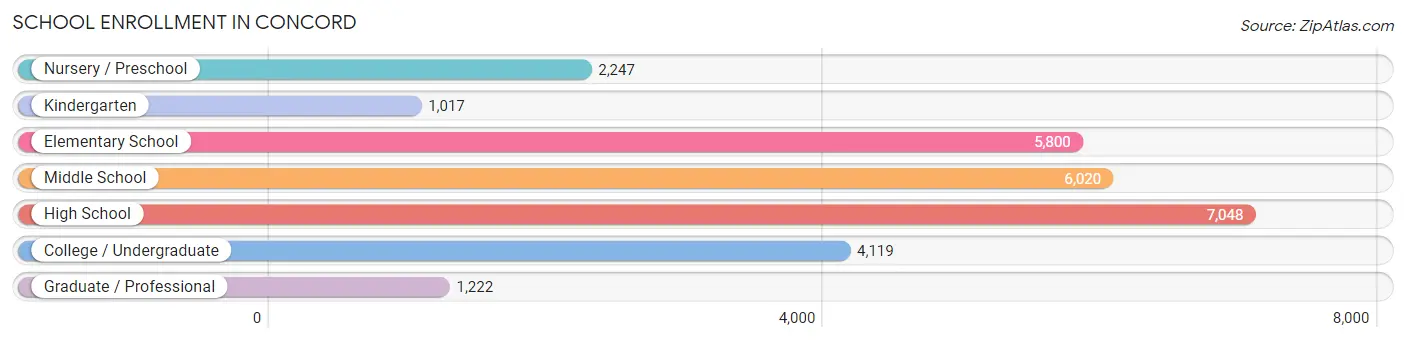
| School Level | # Students | % Students |
| Nursery / Preschool | 2,247 | 8.2% |
| Kindergarten | 1,017 | 3.7% |
| Elementary School | 5,800 | 21.1% |
| Middle School | 6,020 | 21.9% |
| High School | 7,048 | 25.7% |
| College / Undergraduate | 4,119 | 15.0% |
| Graduate / Professional | 1,222 | 4.4% |
| Total | 27,473 | 100.0% |
School Enrollment by Age by Funding Source in Concord
Out of a total of 27,473 students who are enrolled in schools in Concord, 3,654 (13.3%) attend a private institution, while the remaining 23,819 (86.7%) are enrolled in public schools. The age group of 3 to 4 year olds has the highest likelihood of being enrolled in private schools, with 993 (53.9% in the age bracket) enrolled. Conversely, the age group of 10 to 14 year olds has the lowest likelihood of being enrolled in a private school, with 7,456 (93.8% in the age bracket) attending a public institution.
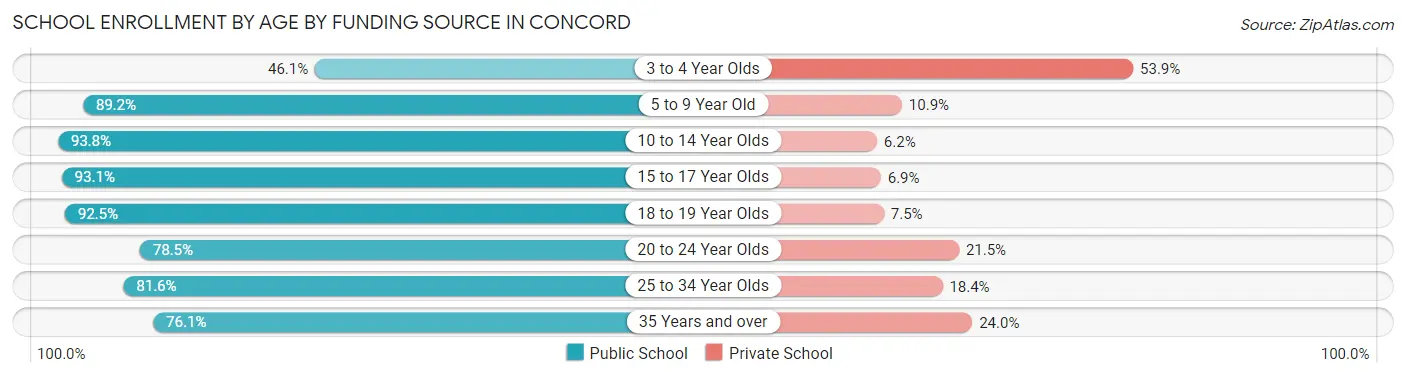
| Age Bracket | Public School | Private School |
| 3 to 4 Year Olds | 849 (46.1%) | 993 (53.9%) |
| 5 to 9 Year Old | 5,613 (89.1%) | 683 (10.8%) |
| 10 to 14 Year Olds | 7,456 (93.8%) | 492 (6.2%) |
| 15 to 17 Year Olds | 4,390 (93.1%) | 326 (6.9%) |
| 18 to 19 Year Olds | 1,802 (92.5%) | 146 (7.5%) |
| 20 to 24 Year Olds | 1,419 (78.5%) | 388 (21.5%) |
| 25 to 34 Year Olds | 1,122 (81.6%) | 253 (18.4%) |
| 35 Years and over | 1,172 (76.0%) | 369 (23.9%) |
| Total | 23,819 (86.7%) | 3,654 (13.3%) |
Educational Attainment by Field of Study in Concord
Business (6,285 | 20.8%), science & technology (3,727 | 12.3%), education (2,992 | 9.9%), arts & humanities (2,513 | 8.3%), and engineering (2,188 | 7.2%) are the most common fields of study among 30,265 individuals in Concord who have obtained a bachelor's degree or higher.
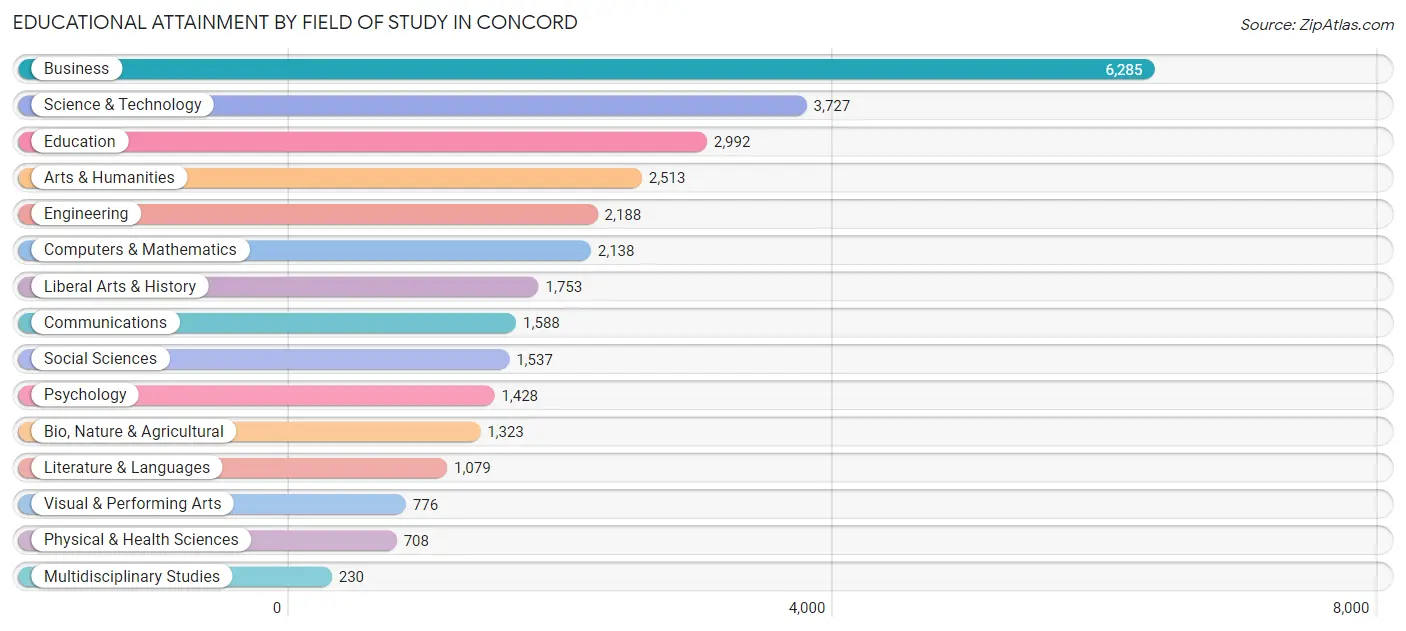
| Field of Study | # Graduates | % Graduates |
| Computers & Mathematics | 2,138 | 7.1% |
| Bio, Nature & Agricultural | 1,323 | 4.4% |
| Physical & Health Sciences | 708 | 2.3% |
| Psychology | 1,428 | 4.7% |
| Social Sciences | 1,537 | 5.1% |
| Engineering | 2,188 | 7.2% |
| Multidisciplinary Studies | 230 | 0.8% |
| Science & Technology | 3,727 | 12.3% |
| Business | 6,285 | 20.8% |
| Education | 2,992 | 9.9% |
| Literature & Languages | 1,079 | 3.6% |
| Liberal Arts & History | 1,753 | 5.8% |
| Visual & Performing Arts | 776 | 2.6% |
| Communications | 1,588 | 5.2% |
| Arts & Humanities | 2,513 | 8.3% |
| Total | 30,265 | 100.0% |
Transportation & Commute in Concord
Vehicle Availability by Sex in Concord
The most prevalent vehicle ownership categories in Concord are males with 2 vehicles (12,985, accounting for 46.6%) and females with 2 vehicles (10,278, making up 51.4%).
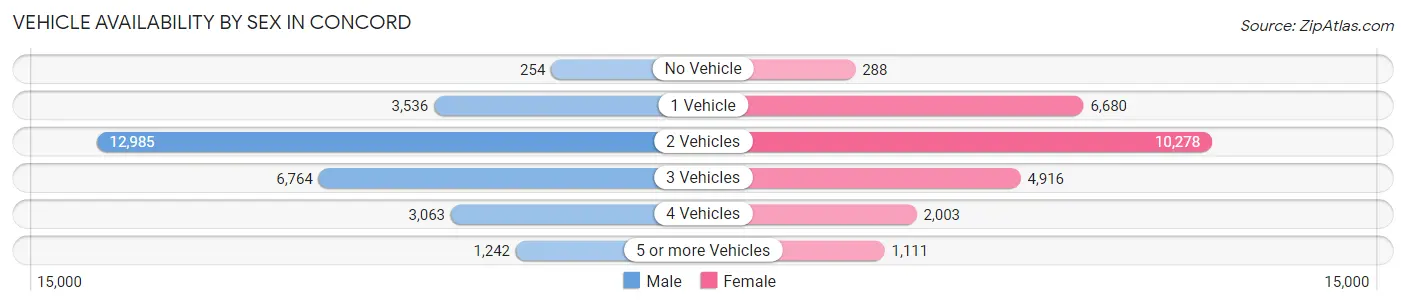
| Vehicles Available | Male | Female |
| No Vehicle | 254 (0.9%) | 288 (1.1%) |
| 1 Vehicle | 3,536 (12.7%) | 6,680 (26.4%) |
| 2 Vehicles | 12,985 (46.6%) | 10,278 (40.7%) |
| 3 Vehicles | 6,764 (24.3%) | 4,916 (19.5%) |
| 4 Vehicles | 3,063 (11.0%) | 2,003 (7.9%) |
| 5 or more Vehicles | 1,242 (4.5%) | 1,111 (4.4%) |
| Total | 27,844 (100.0%) | 25,276 (100.0%) |
Commute Time in Concord
The most frequently occuring commute durations in Concord are 15 to 19 minutes (7,471 commuters, 16.4%), 30 to 34 minutes (7,301 commuters, 16.0%), and 20 to 24 minutes (5,771 commuters, 12.7%).
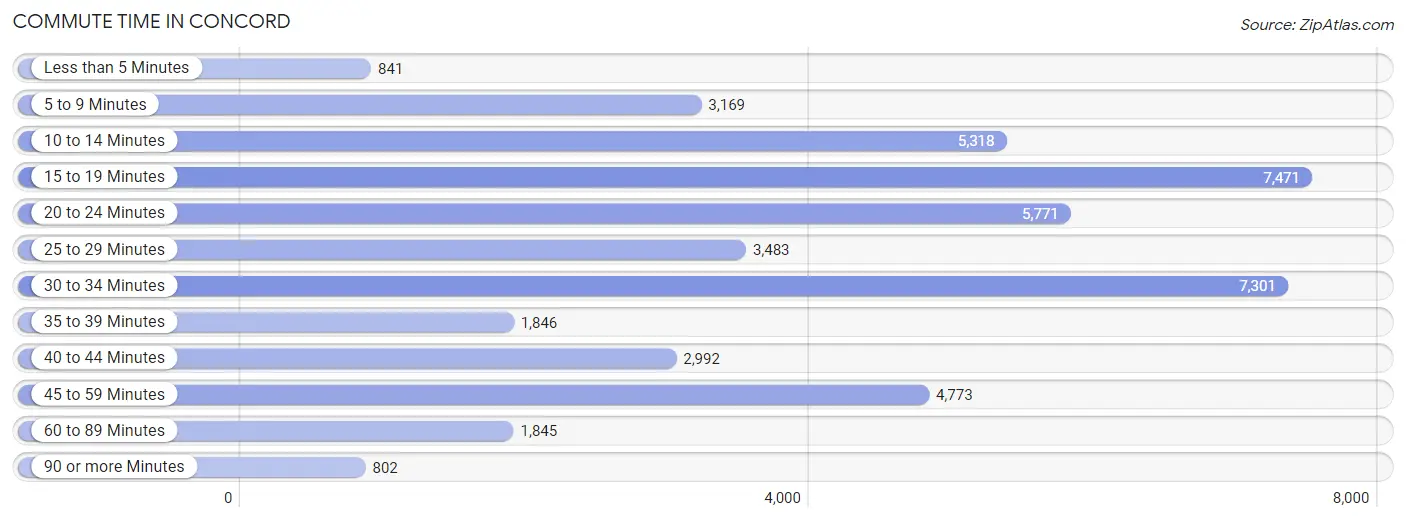
| Commute Time | # Commuters | % Commuters |
| Less than 5 Minutes | 841 | 1.8% |
| 5 to 9 Minutes | 3,169 | 7.0% |
| 10 to 14 Minutes | 5,318 | 11.7% |
| 15 to 19 Minutes | 7,471 | 16.4% |
| 20 to 24 Minutes | 5,771 | 12.7% |
| 25 to 29 Minutes | 3,483 | 7.6% |
| 30 to 34 Minutes | 7,301 | 16.0% |
| 35 to 39 Minutes | 1,846 | 4.1% |
| 40 to 44 Minutes | 2,992 | 6.6% |
| 45 to 59 Minutes | 4,773 | 10.5% |
| 60 to 89 Minutes | 1,845 | 4.0% |
| 90 or more Minutes | 802 | 1.8% |
Commute Time by Sex in Concord
The most common commute times in Concord are 30 to 34 minutes (3,942 commuters, 16.4%) for males and 15 to 19 minutes (3,960 commuters, 18.3%) for females.
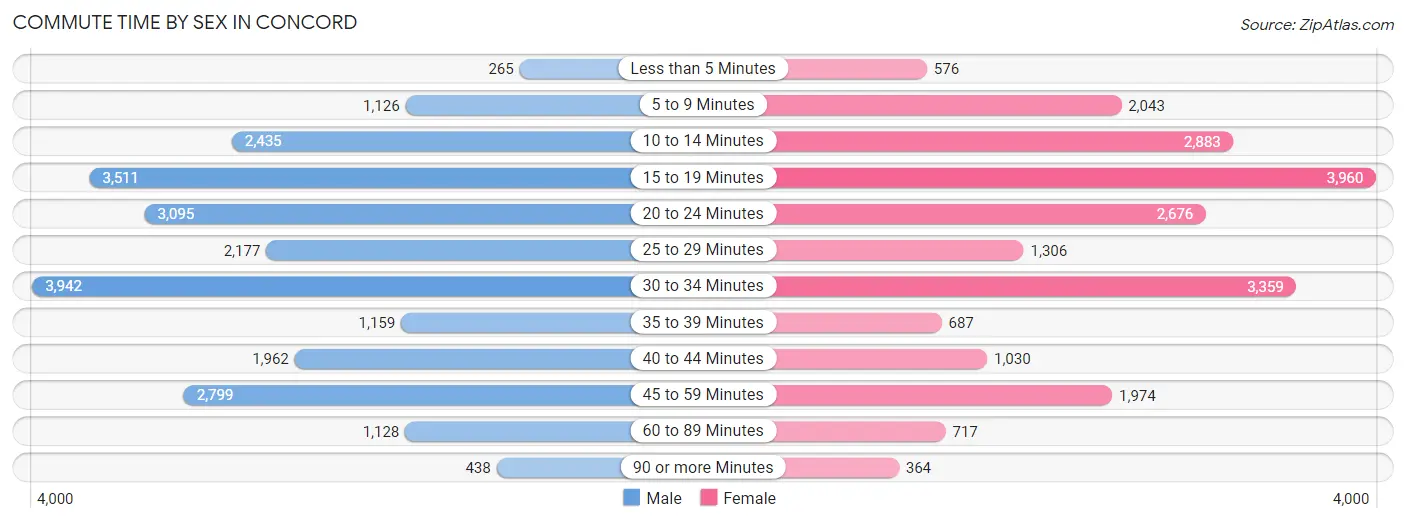
| Commute Time | Male | Female |
| Less than 5 Minutes | 265 (1.1%) | 576 (2.7%) |
| 5 to 9 Minutes | 1,126 (4.7%) | 2,043 (9.5%) |
| 10 to 14 Minutes | 2,435 (10.1%) | 2,883 (13.4%) |
| 15 to 19 Minutes | 3,511 (14.6%) | 3,960 (18.3%) |
| 20 to 24 Minutes | 3,095 (12.9%) | 2,676 (12.4%) |
| 25 to 29 Minutes | 2,177 (9.1%) | 1,306 (6.0%) |
| 30 to 34 Minutes | 3,942 (16.4%) | 3,359 (15.6%) |
| 35 to 39 Minutes | 1,159 (4.8%) | 687 (3.2%) |
| 40 to 44 Minutes | 1,962 (8.2%) | 1,030 (4.8%) |
| 45 to 59 Minutes | 2,799 (11.6%) | 1,974 (9.1%) |
| 60 to 89 Minutes | 1,128 (4.7%) | 717 (3.3%) |
| 90 or more Minutes | 438 (1.8%) | 364 (1.7%) |
Time of Departure to Work by Sex in Concord
The most frequent times of departure to work in Concord are 7:00 AM to 7:29 AM (3,545, 14.7%) for males and 7:30 AM to 7:59 AM (3,491, 16.2%) for females.
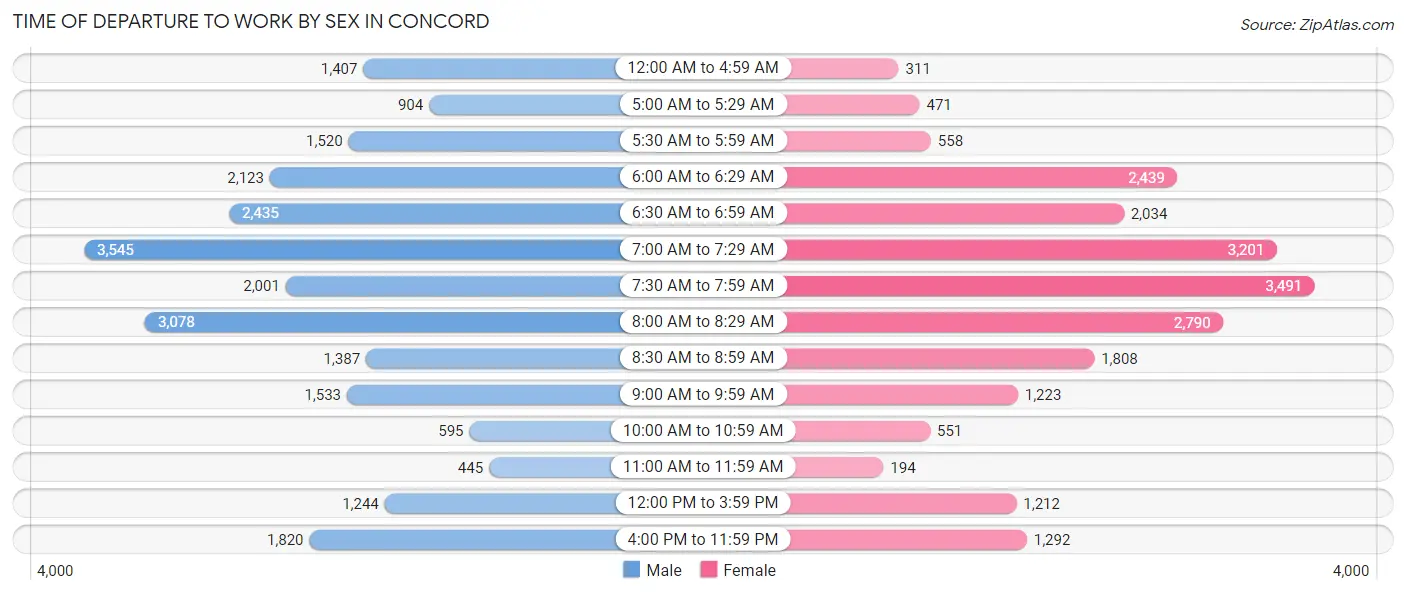
| Time of Departure | Male | Female |
| 12:00 AM to 4:59 AM | 1,407 (5.9%) | 311 (1.4%) |
| 5:00 AM to 5:29 AM | 904 (3.8%) | 471 (2.2%) |
| 5:30 AM to 5:59 AM | 1,520 (6.3%) | 558 (2.6%) |
| 6:00 AM to 6:29 AM | 2,123 (8.8%) | 2,439 (11.3%) |
| 6:30 AM to 6:59 AM | 2,435 (10.1%) | 2,034 (9.4%) |
| 7:00 AM to 7:29 AM | 3,545 (14.7%) | 3,201 (14.8%) |
| 7:30 AM to 7:59 AM | 2,001 (8.3%) | 3,491 (16.2%) |
| 8:00 AM to 8:29 AM | 3,078 (12.8%) | 2,790 (12.9%) |
| 8:30 AM to 8:59 AM | 1,387 (5.8%) | 1,808 (8.4%) |
| 9:00 AM to 9:59 AM | 1,533 (6.4%) | 1,223 (5.7%) |
| 10:00 AM to 10:59 AM | 595 (2.5%) | 551 (2.5%) |
| 11:00 AM to 11:59 AM | 445 (1.8%) | 194 (0.9%) |
| 12:00 PM to 3:59 PM | 1,244 (5.2%) | 1,212 (5.6%) |
| 4:00 PM to 11:59 PM | 1,820 (7.6%) | 1,292 (6.0%) |
| Total | 24,037 (100.0%) | 21,575 (100.0%) |
Housing Occupancy in Concord
Occupancy by Ownership in Concord
Of the total 36,205 dwellings in Concord, owner-occupied units account for 25,112 (69.4%), while renter-occupied units make up 11,093 (30.6%).
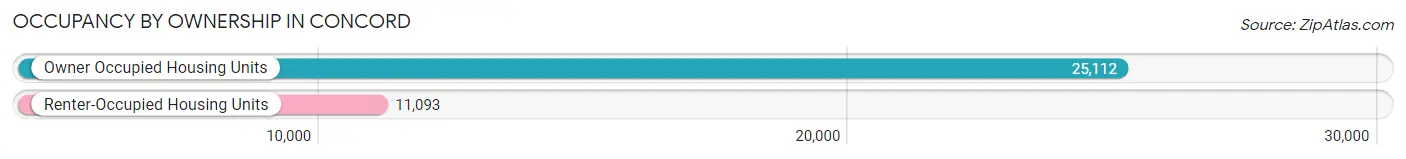
| Occupancy | # Housing Units | % Housing Units |
| Owner Occupied Housing Units | 25,112 | 69.4% |
| Renter-Occupied Housing Units | 11,093 | 30.6% |
| Total Occupied Housing Units | 36,205 | 100.0% |
Occupancy by Household Size in Concord
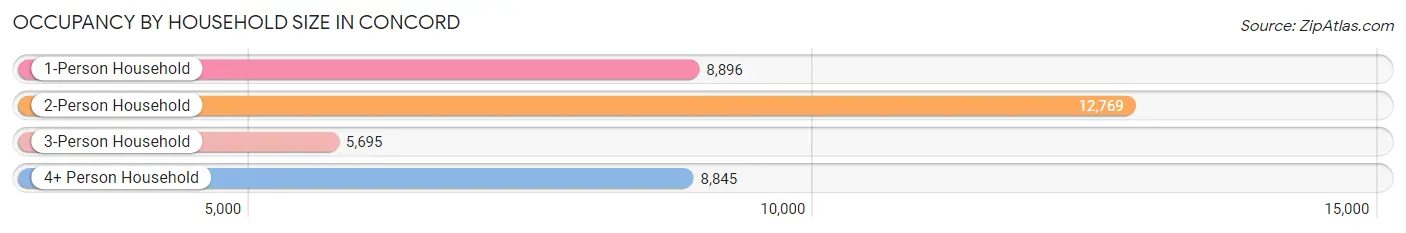
| Household Size | # Housing Units | % Housing Units |
| 1-Person Household | 8,896 | 24.6% |
| 2-Person Household | 12,769 | 35.3% |
| 3-Person Household | 5,695 | 15.7% |
| 4+ Person Household | 8,845 | 24.4% |
| Total Housing Units | 36,205 | 100.0% |
Occupancy by Ownership by Household Size in Concord
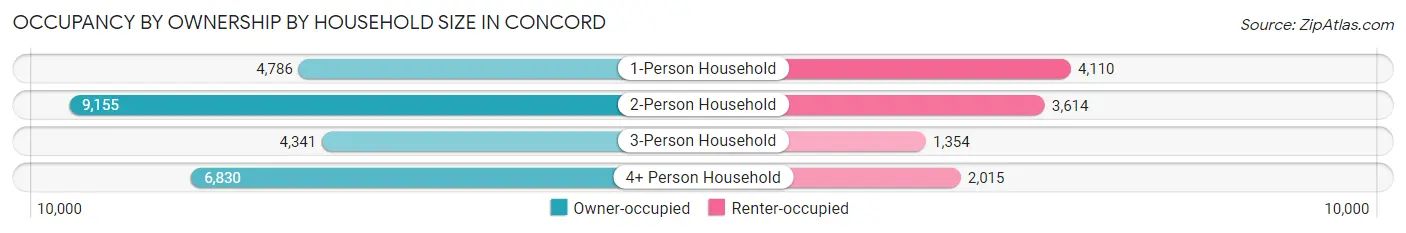
| Household Size | Owner-occupied | Renter-occupied |
| 1-Person Household | 4,786 (53.8%) | 4,110 (46.2%) |
| 2-Person Household | 9,155 (71.7%) | 3,614 (28.3%) |
| 3-Person Household | 4,341 (76.2%) | 1,354 (23.8%) |
| 4+ Person Household | 6,830 (77.2%) | 2,015 (22.8%) |
| Total Housing Units | 25,112 (69.4%) | 11,093 (30.6%) |
Occupancy by Educational Attainment in Concord
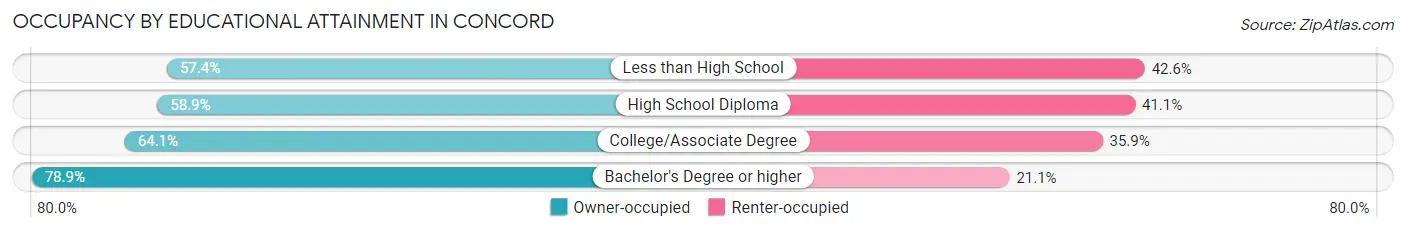
| Household Size | Owner-occupied | Renter-occupied |
| Less than High School | 1,290 (57.4%) | 957 (42.6%) |
| High School Diploma | 4,108 (58.9%) | 2,862 (41.1%) |
| College/Associate Degree | 6,808 (64.1%) | 3,815 (35.9%) |
| Bachelor's Degree or higher | 12,906 (78.9%) | 3,459 (21.1%) |
Occupancy by Age of Householder in Concord
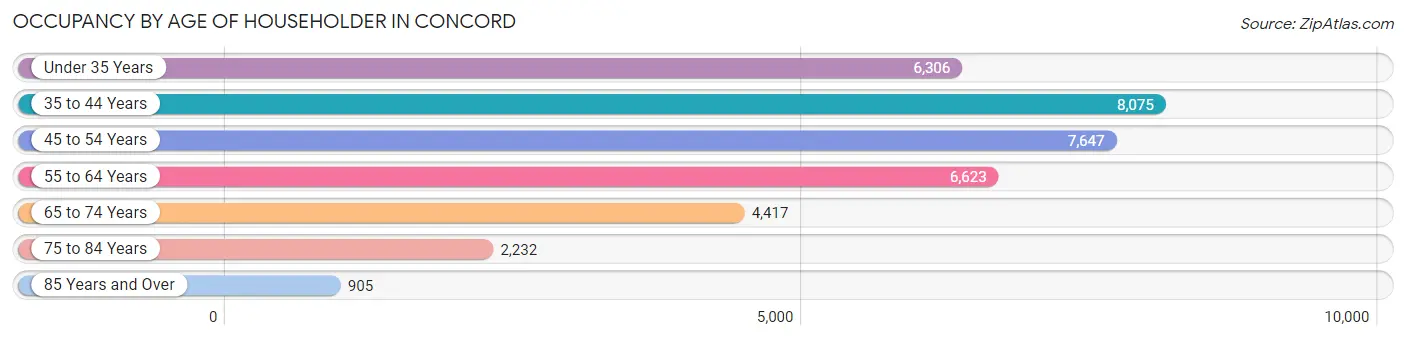
| Age Bracket | # Households | % Households |
| Under 35 Years | 6,306 | 17.4% |
| 35 to 44 Years | 8,075 | 22.3% |
| 45 to 54 Years | 7,647 | 21.1% |
| 55 to 64 Years | 6,623 | 18.3% |
| 65 to 74 Years | 4,417 | 12.2% |
| 75 to 84 Years | 2,232 | 6.2% |
| 85 Years and Over | 905 | 2.5% |
| Total | 36,205 | 100.0% |
Housing Finances in Concord
Median Income by Occupancy in Concord
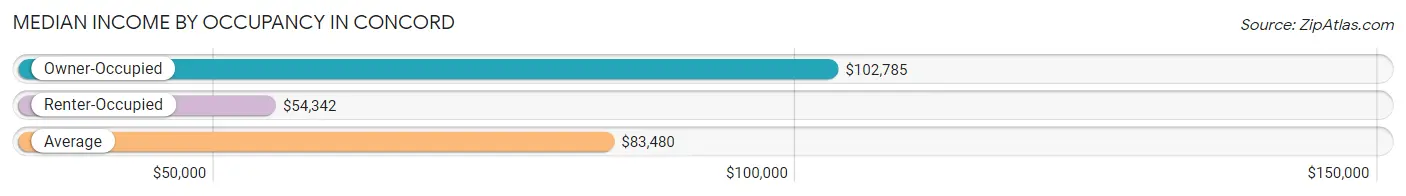
| Occupancy Type | # Households | Median Income |
| Owner-Occupied | 25,112 (69.4%) | $102,785 |
| Renter-Occupied | 11,093 (30.6%) | $54,342 |
| Average | 36,205 (100.0%) | $83,480 |
Occupancy by Householder Income Bracket in Concord
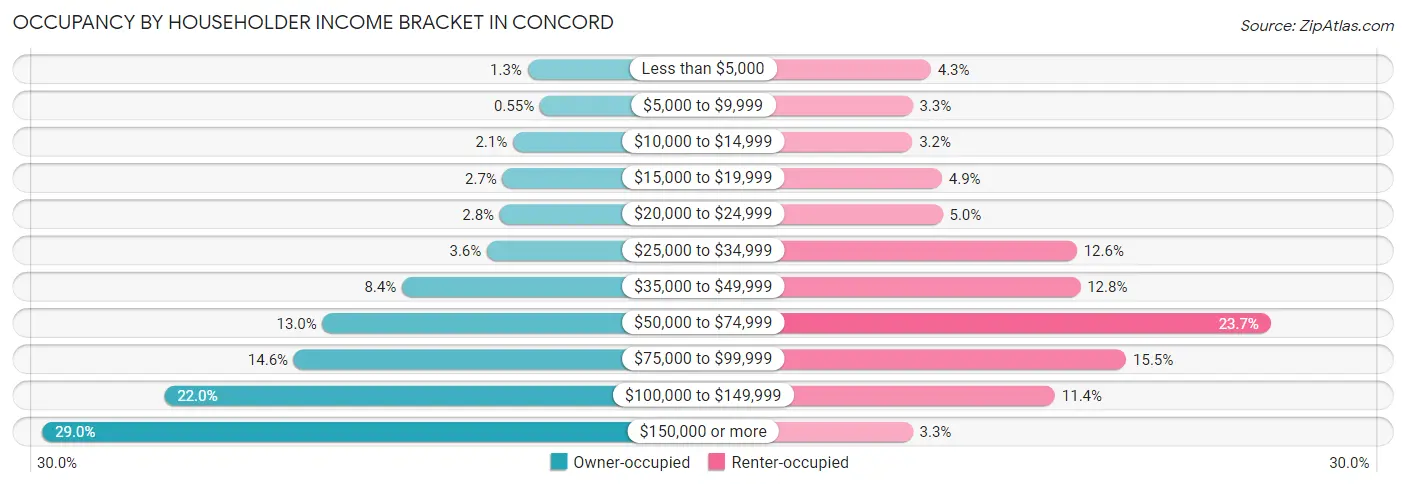
| Income Bracket | Owner-occupied | Renter-occupied |
| Less than $5,000 | 315 (1.3%) | 477 (4.3%) |
| $5,000 to $9,999 | 139 (0.5%) | 361 (3.3%) |
| $10,000 to $14,999 | 524 (2.1%) | 359 (3.2%) |
| $15,000 to $19,999 | 672 (2.7%) | 547 (4.9%) |
| $20,000 to $24,999 | 712 (2.8%) | 551 (5.0%) |
| $25,000 to $34,999 | 897 (3.6%) | 1,402 (12.6%) |
| $35,000 to $49,999 | 2,116 (8.4%) | 1,424 (12.8%) |
| $50,000 to $74,999 | 3,257 (13.0%) | 2,631 (23.7%) |
| $75,000 to $99,999 | 3,668 (14.6%) | 1,715 (15.5%) |
| $100,000 to $149,999 | 5,529 (22.0%) | 1,264 (11.4%) |
| $150,000 or more | 7,283 (29.0%) | 362 (3.3%) |
| Total | 25,112 (100.0%) | 11,093 (100.0%) |
Monthly Housing Cost Tiers in Concord
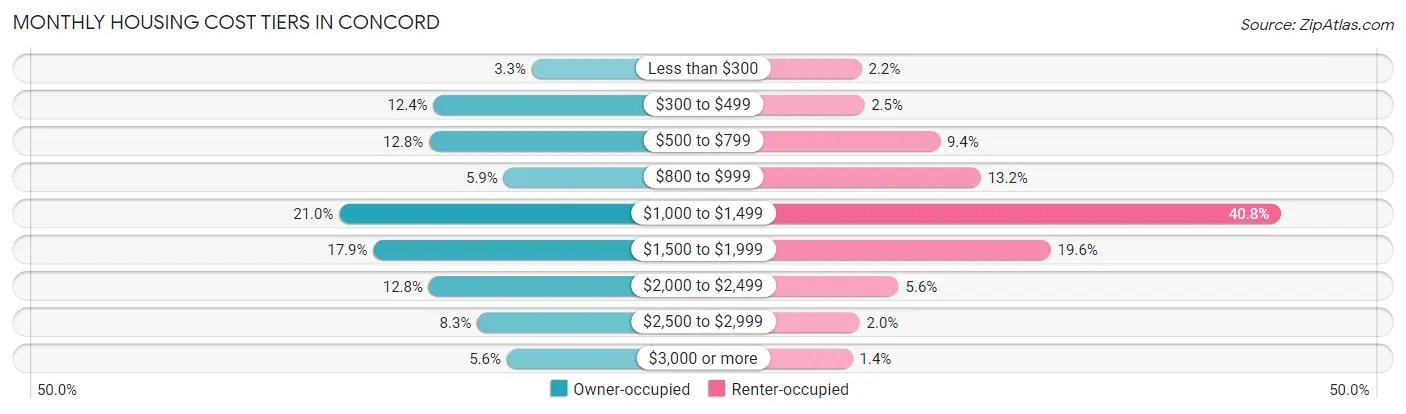
| Monthly Cost | Owner-occupied | Renter-occupied |
| Less than $300 | 832 (3.3%) | 246 (2.2%) |
| $300 to $499 | 3,104 (12.4%) | 274 (2.5%) |
| $500 to $799 | 3,205 (12.8%) | 1,047 (9.4%) |
| $800 to $999 | 1,481 (5.9%) | 1,463 (13.2%) |
| $1,000 to $1,499 | 5,282 (21.0%) | 4,529 (40.8%) |
| $1,500 to $1,999 | 4,495 (17.9%) | 2,178 (19.6%) |
| $2,000 to $2,499 | 3,211 (12.8%) | 625 (5.6%) |
| $2,500 to $2,999 | 2,092 (8.3%) | 226 (2.0%) |
| $3,000 or more | 1,410 (5.6%) | 155 (1.4%) |
| Total | 25,112 (100.0%) | 11,093 (100.0%) |
Physical Housing Characteristics in Concord
Housing Structures in Concord
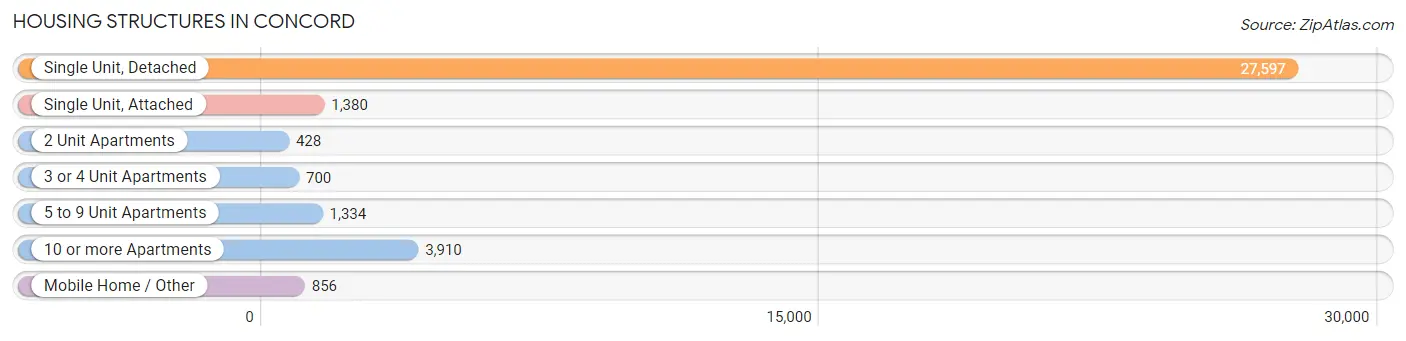
| Structure Type | # Housing Units | % Housing Units |
| Single Unit, Detached | 27,597 | 76.2% |
| Single Unit, Attached | 1,380 | 3.8% |
| 2 Unit Apartments | 428 | 1.2% |
| 3 or 4 Unit Apartments | 700 | 1.9% |
| 5 to 9 Unit Apartments | 1,334 | 3.7% |
| 10 or more Apartments | 3,910 | 10.8% |
| Mobile Home / Other | 856 | 2.4% |
| Total | 36,205 | 100.0% |
Housing Structures by Occupancy in Concord
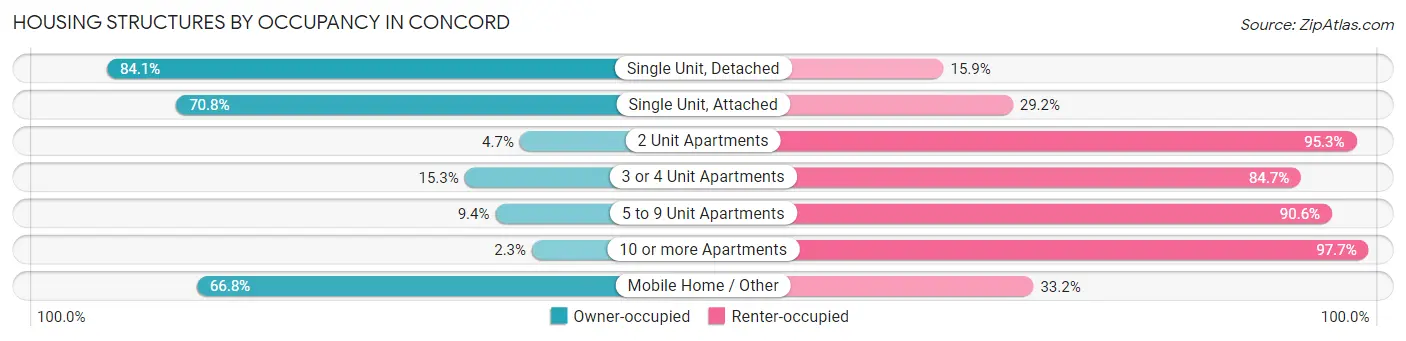
| Structure Type | Owner-occupied | Renter-occupied |
| Single Unit, Detached | 23,220 (84.1%) | 4,377 (15.9%) |
| Single Unit, Attached | 977 (70.8%) | 403 (29.2%) |
| 2 Unit Apartments | 20 (4.7%) | 408 (95.3%) |
| 3 or 4 Unit Apartments | 107 (15.3%) | 593 (84.7%) |
| 5 to 9 Unit Apartments | 125 (9.4%) | 1,209 (90.6%) |
| 10 or more Apartments | 91 (2.3%) | 3,819 (97.7%) |
| Mobile Home / Other | 572 (66.8%) | 284 (33.2%) |
| Total | 25,112 (69.4%) | 11,093 (30.6%) |
Housing Structures by Number of Rooms in Concord
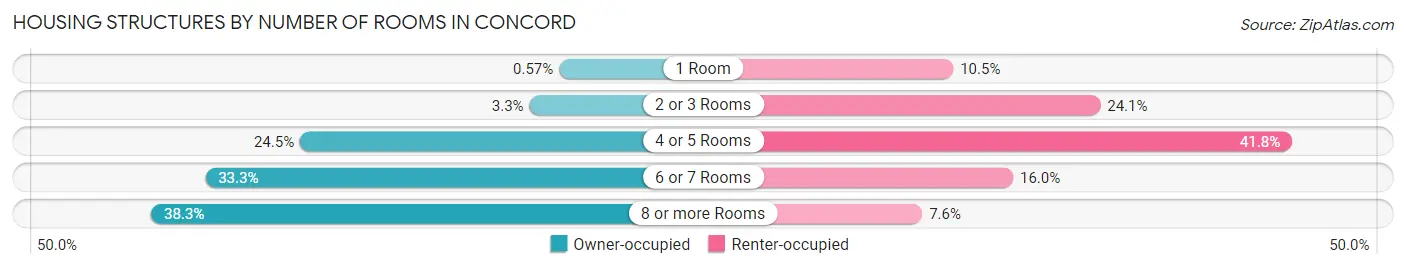
| Number of Rooms | Owner-occupied | Renter-occupied |
| 1 Room | 142 (0.6%) | 1,163 (10.5%) |
| 2 or 3 Rooms | 831 (3.3%) | 2,671 (24.1%) |
| 4 or 5 Rooms | 6,159 (24.5%) | 4,639 (41.8%) |
| 6 or 7 Rooms | 8,361 (33.3%) | 1,776 (16.0%) |
| 8 or more Rooms | 9,619 (38.3%) | 844 (7.6%) |
| Total | 25,112 (100.0%) | 11,093 (100.0%) |
Housing Structure by Heating Type in Concord
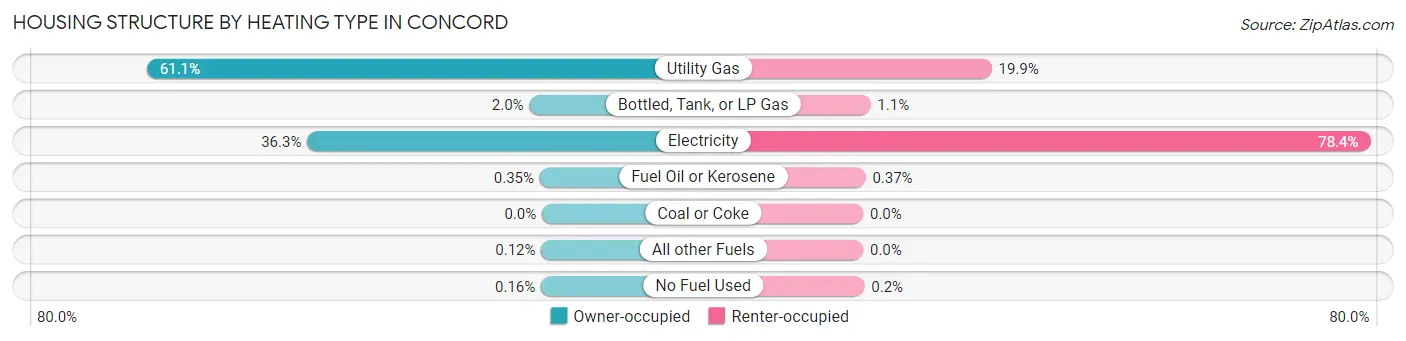
| Heating Type | Owner-occupied | Renter-occupied |
| Utility Gas | 15,340 (61.1%) | 2,204 (19.9%) |
| Bottled, Tank, or LP Gas | 493 (2.0%) | 127 (1.1%) |
| Electricity | 9,119 (36.3%) | 8,699 (78.4%) |
| Fuel Oil or Kerosene | 88 (0.4%) | 41 (0.4%) |
| Coal or Coke | 0 (0.0%) | 0 (0.0%) |
| All other Fuels | 31 (0.1%) | 0 (0.0%) |
| No Fuel Used | 41 (0.2%) | 22 (0.2%) |
| Total | 25,112 (100.0%) | 11,093 (100.0%) |
Household Vehicle Usage in Concord
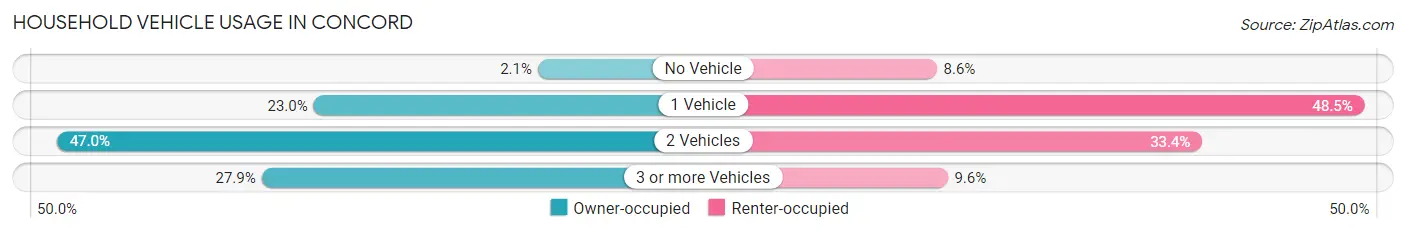
| Vehicles per Household | Owner-occupied | Renter-occupied |
| No Vehicle | 524 (2.1%) | 950 (8.6%) |
| 1 Vehicle | 5,784 (23.0%) | 5,381 (48.5%) |
| 2 Vehicles | 11,802 (47.0%) | 3,700 (33.4%) |
| 3 or more Vehicles | 7,002 (27.9%) | 1,062 (9.6%) |
| Total | 25,112 (100.0%) | 11,093 (100.0%) |
Real Estate & Mortgages in Concord
Real Estate and Mortgage Overview in Concord
| Characteristic | Without Mortgage | With Mortgage |
| Housing Units | 7,337 | 17,775 |
| Median Property Value | $226,800 | $311,600 |
| Median Household Income | $64,210 | $6,029 |
| Monthly Housing Costs | $495 | $1,402 |
| Real Estate Taxes | $2,072 | $322 |
Property Value by Mortgage Status in Concord
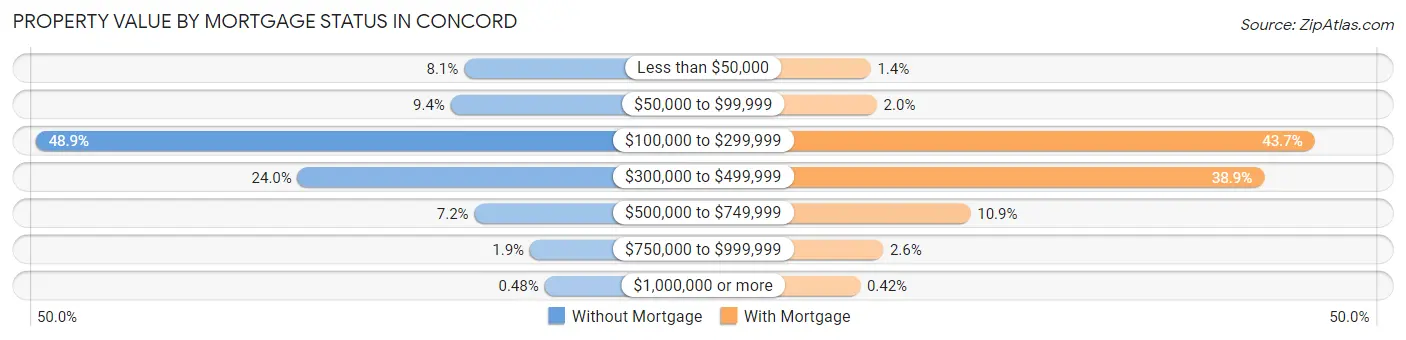
| Property Value | Without Mortgage | With Mortgage |
| Less than $50,000 | 597 (8.1%) | 253 (1.4%) |
| $50,000 to $99,999 | 691 (9.4%) | 357 (2.0%) |
| $100,000 to $299,999 | 3,591 (48.9%) | 7,769 (43.7%) |
| $300,000 to $499,999 | 1,761 (24.0%) | 6,914 (38.9%) |
| $500,000 to $749,999 | 525 (7.2%) | 1,943 (10.9%) |
| $750,000 to $999,999 | 137 (1.9%) | 464 (2.6%) |
| $1,000,000 or more | 35 (0.5%) | 75 (0.4%) |
| Total | 7,337 (100.0%) | 17,775 (100.0%) |
Household Income by Mortgage Status in Concord
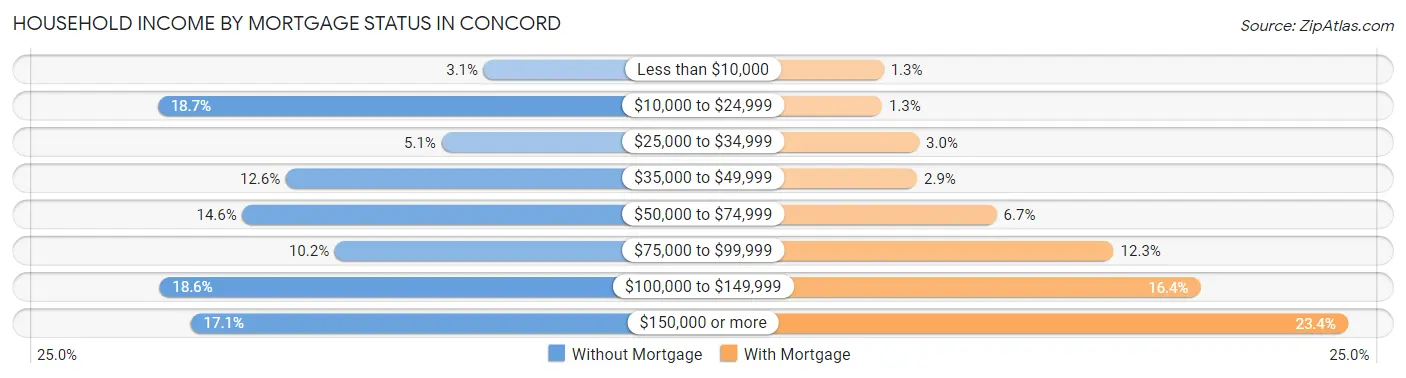
| Household Income | Without Mortgage | With Mortgage |
| Less than $10,000 | 230 (3.1%) | 239 (1.3%) |
| $10,000 to $24,999 | 1,369 (18.7%) | 224 (1.3%) |
| $25,000 to $34,999 | 377 (5.1%) | 539 (3.0%) |
| $35,000 to $49,999 | 921 (12.6%) | 520 (2.9%) |
| $50,000 to $74,999 | 1,073 (14.6%) | 1,195 (6.7%) |
| $75,000 to $99,999 | 750 (10.2%) | 2,184 (12.3%) |
| $100,000 to $149,999 | 1,363 (18.6%) | 2,918 (16.4%) |
| $150,000 or more | 1,254 (17.1%) | 4,166 (23.4%) |
| Total | 7,337 (100.0%) | 17,775 (100.0%) |
Property Value to Household Income Ratio in Concord
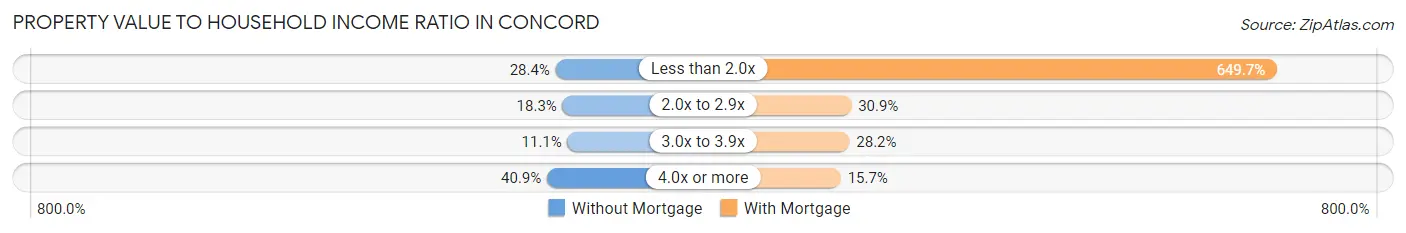
| Value-to-Income Ratio | Without Mortgage | With Mortgage |
| Less than 2.0x | 2,084 (28.4%) | 115,491 (649.7%) |
| 2.0x to 2.9x | 1,343 (18.3%) | 5,498 (30.9%) |
| 3.0x to 3.9x | 814 (11.1%) | 5,019 (28.2%) |
| 4.0x or more | 2,998 (40.9%) | 2,781 (15.7%) |
| Total | 7,337 (100.0%) | 17,775 (100.0%) |
Real Estate Taxes by Mortgage Status in Concord
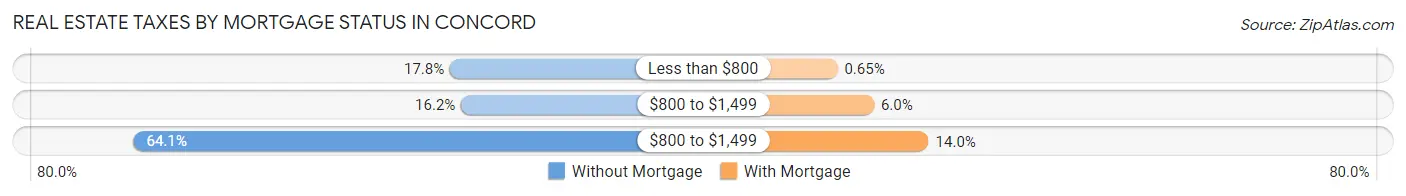
| Property Taxes | Without Mortgage | With Mortgage |
| Less than $800 | 1,308 (17.8%) | 115 (0.6%) |
| $800 to $1,499 | 1,189 (16.2%) | 1,063 (6.0%) |
| $800 to $1,499 | 4,701 (64.1%) | 2,484 (14.0%) |
| Total | 7,337 (100.0%) | 17,775 (100.0%) |
Health & Disability in Concord
Health Insurance Coverage by Age in Concord
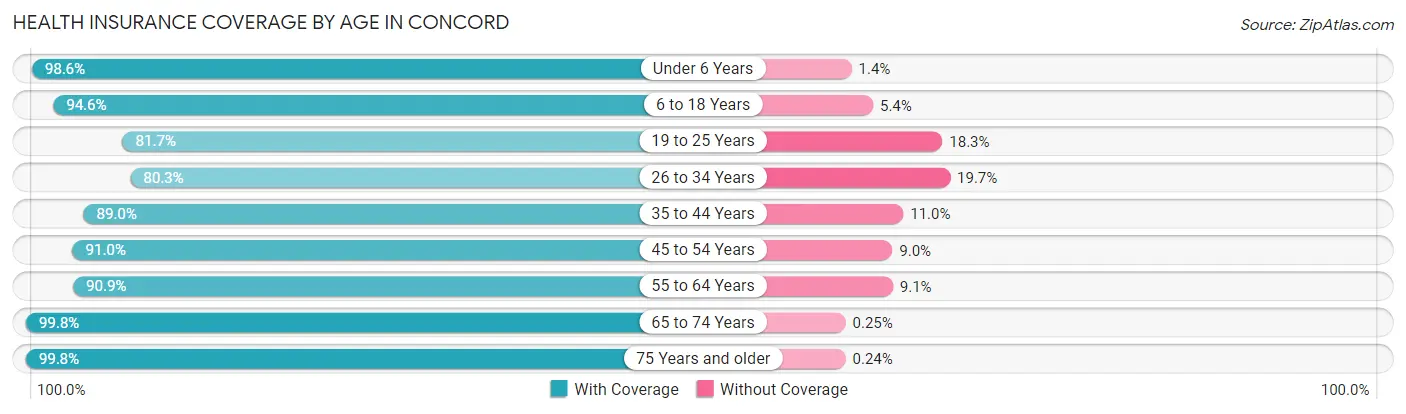
| Age Bracket | With Coverage | Without Coverage |
| Under 6 Years | 7,667 (98.6%) | 106 (1.4%) |
| 6 to 18 Years | 19,586 (94.6%) | 1,110 (5.4%) |
| 19 to 25 Years | 6,706 (81.7%) | 1,501 (18.3%) |
| 26 to 34 Years | 9,990 (80.3%) | 2,455 (19.7%) |
| 35 to 44 Years | 13,840 (89.0%) | 1,710 (11.0%) |
| 45 to 54 Years | 13,384 (91.0%) | 1,318 (9.0%) |
| 55 to 64 Years | 11,159 (90.9%) | 1,112 (9.1%) |
| 65 to 74 Years | 7,440 (99.8%) | 19 (0.3%) |
| 75 Years and older | 4,967 (99.8%) | 12 (0.2%) |
| Total | 94,739 (91.0%) | 9,343 (9.0%) |
Health Insurance Coverage by Citizenship Status in Concord
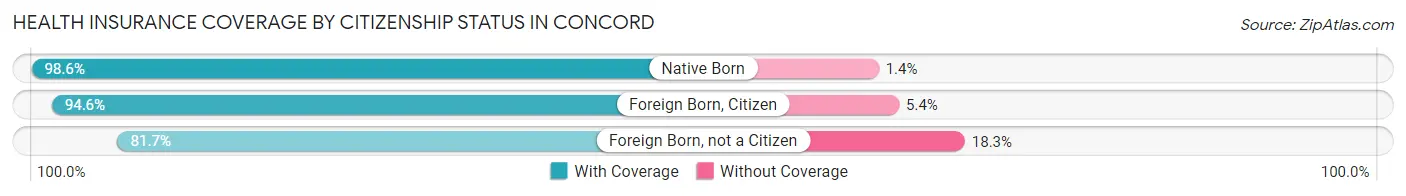
| Citizenship Status | With Coverage | Without Coverage |
| Native Born | 7,667 (98.6%) | 106 (1.4%) |
| Foreign Born, Citizen | 19,586 (94.6%) | 1,110 (5.4%) |
| Foreign Born, not a Citizen | 6,706 (81.7%) | 1,501 (18.3%) |
Health Insurance Coverage by Household Income in Concord
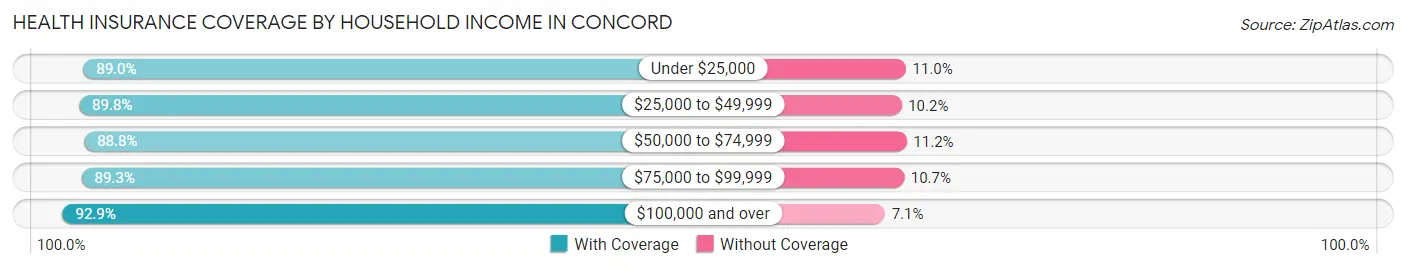
| Household Income | With Coverage | Without Coverage |
| Under $25,000 | 7,587 (89.0%) | 939 (11.0%) |
| $25,000 to $49,999 | 11,965 (89.8%) | 1,359 (10.2%) |
| $50,000 to $74,999 | 14,051 (88.8%) | 1,766 (11.2%) |
| $75,000 to $99,999 | 14,439 (89.3%) | 1,727 (10.7%) |
| $100,000 and over | 46,366 (92.9%) | 3,549 (7.1%) |
Public vs Private Health Insurance Coverage by Age in Concord
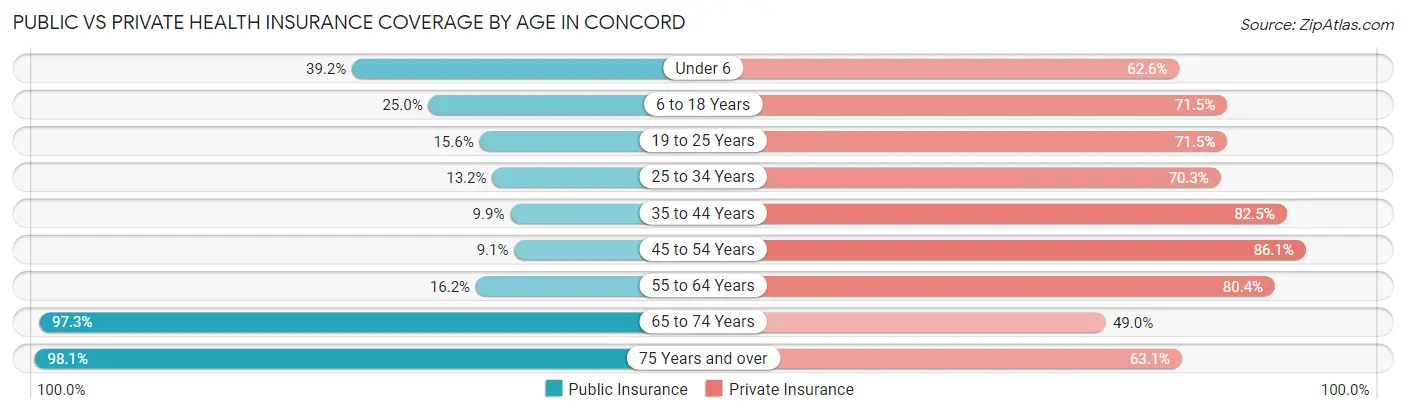
| Age Bracket | Public Insurance | Private Insurance |
| Under 6 | 3,048 (39.2%) | 4,869 (62.6%) |
| 6 to 18 Years | 5,181 (25.0%) | 14,797 (71.5%) |
| 19 to 25 Years | 1,278 (15.6%) | 5,871 (71.5%) |
| 25 to 34 Years | 1,641 (13.2%) | 8,751 (70.3%) |
| 35 to 44 Years | 1,534 (9.9%) | 12,834 (82.5%) |
| 45 to 54 Years | 1,339 (9.1%) | 12,658 (86.1%) |
| 55 to 64 Years | 1,990 (16.2%) | 9,864 (80.4%) |
| 65 to 74 Years | 7,259 (97.3%) | 3,658 (49.0%) |
| 75 Years and over | 4,886 (98.1%) | 3,143 (63.1%) |
| Total | 28,156 (27.1%) | 76,445 (73.5%) |
Disability Status by Sex by Age in Concord
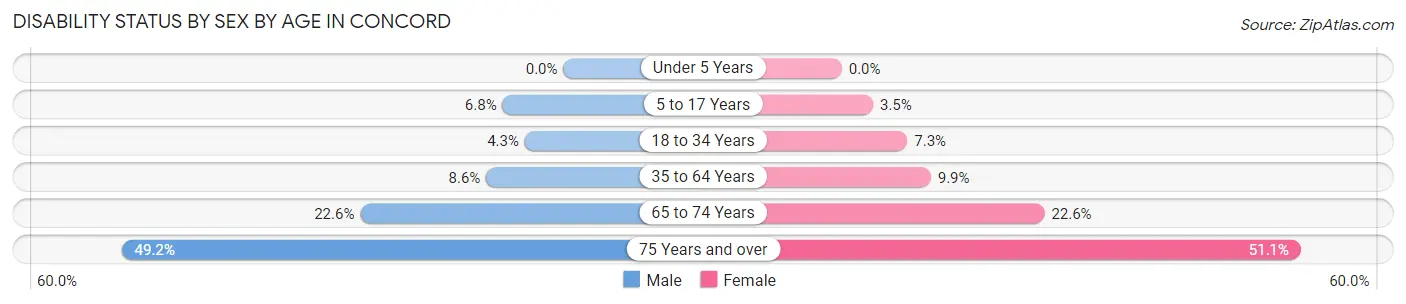
| Age Bracket | Male | Female |
| Under 5 Years | 0 (0.0%) | 0 (0.0%) |
| 5 to 17 Years | 711 (6.8%) | 332 (3.5%) |
| 18 to 34 Years | 474 (4.3%) | 832 (7.3%) |
| 35 to 64 Years | 1,734 (8.6%) | 2,213 (9.9%) |
| 65 to 74 Years | 733 (22.6%) | 952 (22.6%) |
| 75 Years and over | 975 (49.2%) | 1,532 (51.1%) |
Disability Class by Sex by Age in Concord
Disability Class: Hearing Difficulty
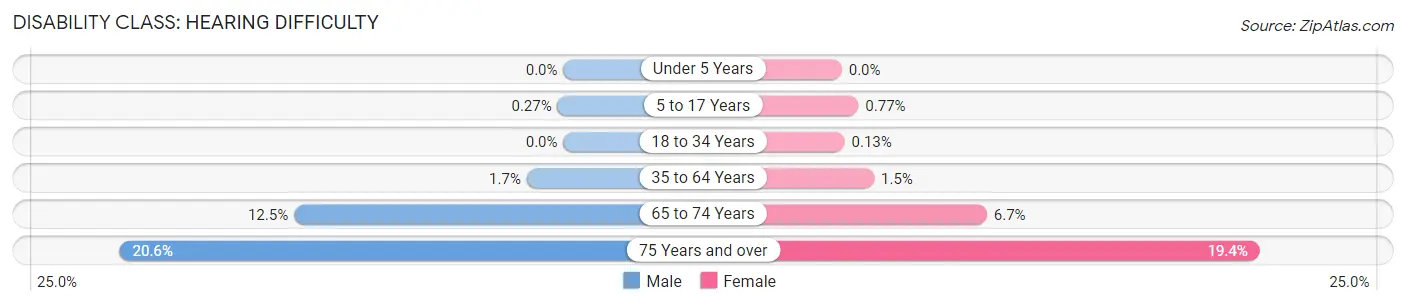
| Age Bracket | Male | Female |
| Under 5 Years | 0 (0.0%) | 0 (0.0%) |
| 5 to 17 Years | 28 (0.3%) | 73 (0.8%) |
| 18 to 34 Years | 0 (0.0%) | 15 (0.1%) |
| 35 to 64 Years | 343 (1.7%) | 334 (1.5%) |
| 65 to 74 Years | 405 (12.5%) | 284 (6.7%) |
| 75 Years and over | 408 (20.6%) | 581 (19.4%) |
Disability Class: Vision Difficulty
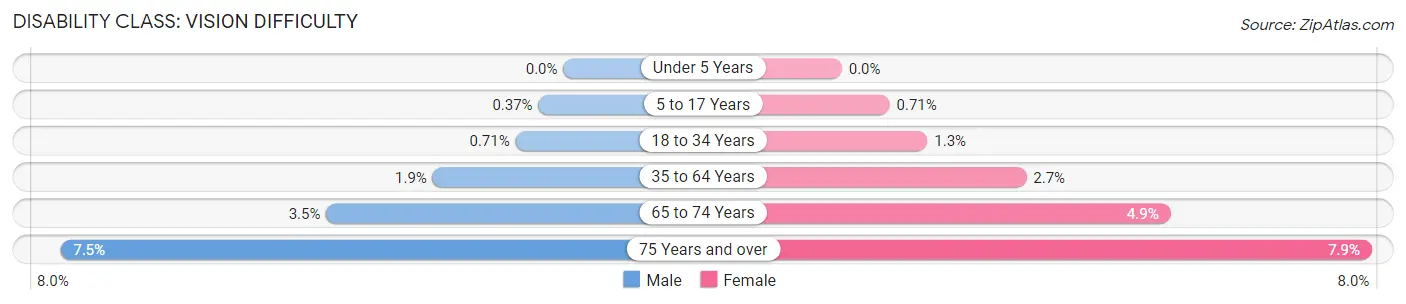
| Age Bracket | Male | Female |
| Under 5 Years | 0 (0.0%) | 0 (0.0%) |
| 5 to 17 Years | 39 (0.4%) | 68 (0.7%) |
| 18 to 34 Years | 78 (0.7%) | 145 (1.3%) |
| 35 to 64 Years | 391 (1.9%) | 613 (2.7%) |
| 65 to 74 Years | 114 (3.5%) | 206 (4.9%) |
| 75 Years and over | 148 (7.5%) | 236 (7.9%) |
Disability Class: Cognitive Difficulty
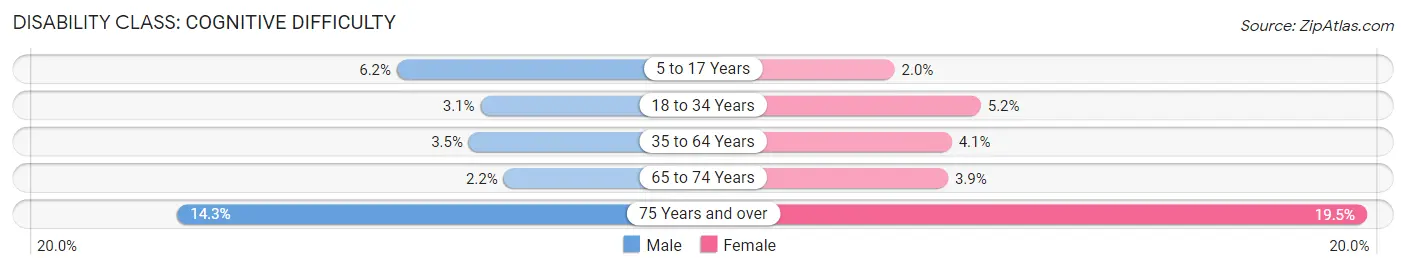
| Age Bracket | Male | Female |
| 5 to 17 Years | 648 (6.2%) | 187 (2.0%) |
| 18 to 34 Years | 340 (3.1%) | 588 (5.2%) |
| 35 to 64 Years | 708 (3.5%) | 911 (4.1%) |
| 65 to 74 Years | 72 (2.2%) | 166 (3.9%) |
| 75 Years and over | 284 (14.3%) | 584 (19.5%) |
Disability Class: Ambulatory Difficulty
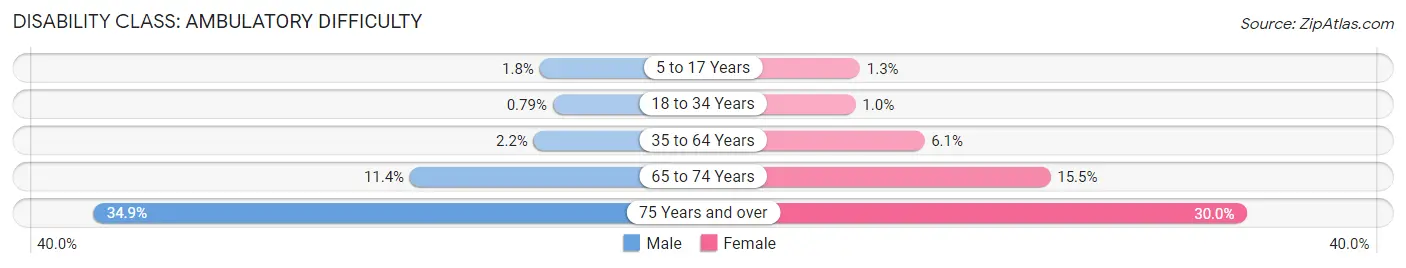
| Age Bracket | Male | Female |
| 5 to 17 Years | 185 (1.8%) | 128 (1.3%) |
| 18 to 34 Years | 87 (0.8%) | 115 (1.0%) |
| 35 to 64 Years | 445 (2.2%) | 1,366 (6.1%) |
| 65 to 74 Years | 369 (11.4%) | 653 (15.5%) |
| 75 Years and over | 691 (34.9%) | 900 (30.0%) |
Disability Class: Self-Care Difficulty
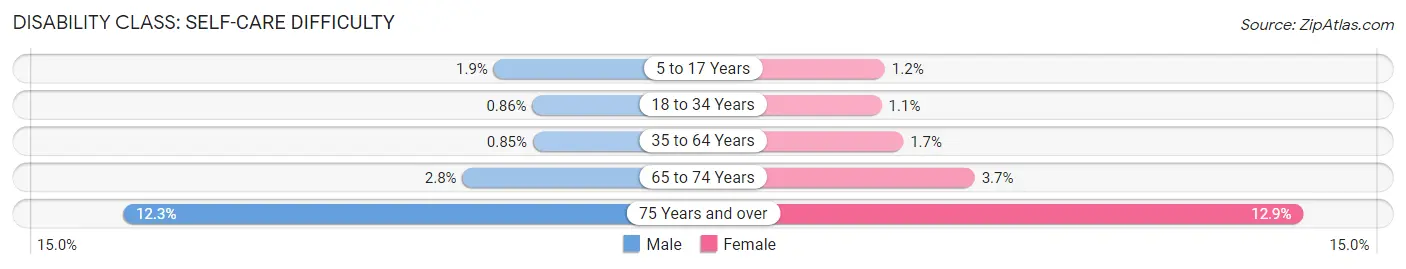
| Age Bracket | Male | Female |
| 5 to 17 Years | 204 (1.9%) | 114 (1.2%) |
| 18 to 34 Years | 95 (0.9%) | 126 (1.1%) |
| 35 to 64 Years | 172 (0.9%) | 381 (1.7%) |
| 65 to 74 Years | 91 (2.8%) | 156 (3.7%) |
| 75 Years and over | 243 (12.3%) | 385 (12.9%) |
Technology Access in Concord
Computing Device Access in Concord
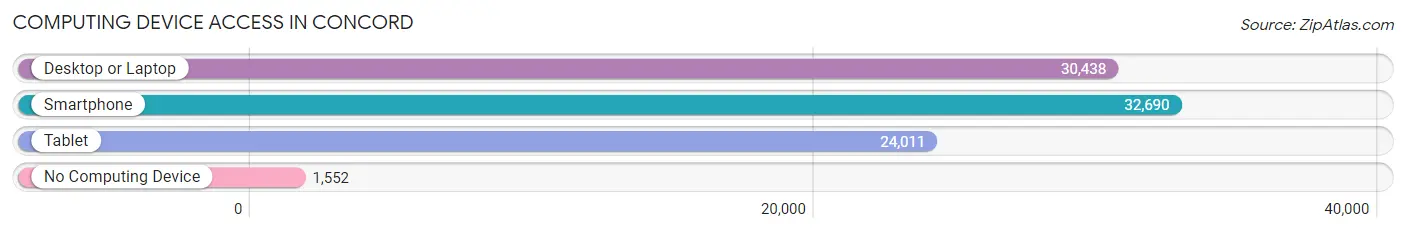
| Device Type | # Households | % Households |
| Desktop or Laptop | 30,438 | 84.1% |
| Smartphone | 32,690 | 90.3% |
| Tablet | 24,011 | 66.3% |
| No Computing Device | 1,552 | 4.3% |
| Total | 36,205 | 100.0% |
Internet Access in Concord
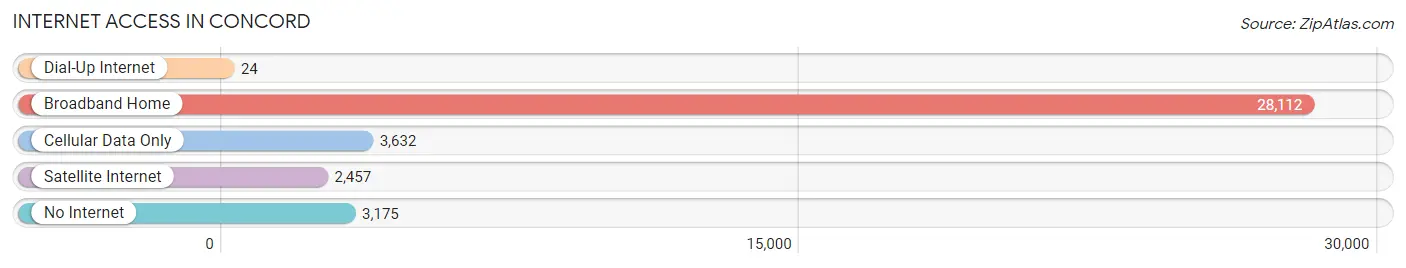
| Internet Type | # Households | % Households |
| Dial-Up Internet | 24 | 0.1% |
| Broadband Home | 28,112 | 77.6% |
| Cellular Data Only | 3,632 | 10.0% |
| Satellite Internet | 2,457 | 6.8% |
| No Internet | 3,175 | 8.8% |
| Total | 36,205 | 100.0% |
Concord Summary
Concord, North Carolina is a city located in Cabarrus County, North Carolina. It is the county seat and the largest city in the county. The city is located in the Piedmont region of North Carolina, approximately 20 miles northeast of Charlotte. The city is home to approximately 90,000 people, making it the 17th largest city in the state.
Geography
Concord is located in the Piedmont region of North Carolina, approximately 20 miles northeast of Charlotte. The city is situated on the banks of the Rocky River, which flows through the city and into the nearby Lake Norman. The city is surrounded by rolling hills and is located at the foothills of the Uwharrie Mountains. The city has a total area of 33.2 square miles, of which 32.9 square miles is land and 0.3 square miles is water.
History
The area that is now Concord was first settled in 1750 by German and Scots-Irish immigrants. The city was officially incorporated in 1806 and was named after the city of Concord, Massachusetts. The city quickly grew and became a major center for the textile industry. The city was also home to several Confederate military camps during the Civil War. After the war, the city continued to grow and by the early 1900s, it had become a major center for the furniture industry.
Economy
Concord is home to a diverse economy, with a variety of industries represented. The city is home to several major employers, including Atrium Health, Cabarrus County Schools, and the City of Concord. The city is also home to several major manufacturing companies, including Continental Tire, Corning, and Honeywell. The city is also home to several retail and service businesses, including several major shopping centers.
Demographics
As of the 2020 census, Concord had a population of 90,521. The racial makeup of the city was 73.2% White, 17.3% African American, 0.4% Native American, 4.2% Asian, and 4.9% from other races. The median household income was $54,945 and the median family income was $63,945. The city has a poverty rate of 13.3%.
Conclusion
Concord, North Carolina is a city located in Cabarrus County, North Carolina. It is the county seat and the largest city in the county. The city is located in the Piedmont region of North Carolina, approximately 20 miles northeast of Charlotte. The city is home to approximately 90,000 people, making it the 17th largest city in the state. The city has a diverse economy, with a variety of industries represented. The city is home to several major employers, including Atrium Health, Cabarrus County Schools, and the City of Concord. The city is also home to several major manufacturing companies, including Continental Tire, Corning, and Honeywell. The city is also home to several retail and service businesses, including several major shopping centers. As of the 2020 census, Concord had a population of 90,521. The racial makeup of the city was 73.2% White, 17.3% African American, 0.4% Native American, 4.2% Asian, and 4.9% from other races. The median household income was $54,945 and the median family income was $63,945. The city has a poverty rate of 13.3%.
Common Questions
What is Per Capita Income in Concord?
Per Capita income in Concord is $39,148.
What is the Median Family Income in Concord?
Median Family Income in Concord is $98,417.
What is the Median Household income in Concord?
Median Household Income in Concord is $83,480.
What is Income or Wage Gap in Concord?
Income or Wage Gap in Concord is 27.2%.
Women in Concord earn 72.8 cents for every dollar earned by a man.
What is Family Income Deficit in Concord?
Family Income Deficit in Concord is $9,065.
Families that are below poverty line in Concord earn $9,065 less on average than the poverty threshold level.
What is Inequality or Gini Index in Concord?
Inequality or Gini Index in Concord is 0.44.
What is the Total Population of Concord?
Total Population of Concord is 105,335.
What is the Total Male Population of Concord?
Total Male Population of Concord is 51,379.
What is the Total Female Population of Concord?
Total Female Population of Concord is 53,956.
What is the Ratio of Males per 100 Females in Concord?
There are 95.22 Males per 100 Females in Concord.
What is the Ratio of Females per 100 Males in Concord?
There are 105.02 Females per 100 Males in Concord.
What is the Median Population Age in Concord?
Median Population Age in Concord is 37.3 Years.
What is the Average Family Size in Concord
Average Family Size in Concord is 3.5 People.
What is the Average Household Size in Concord
Average Household Size in Concord is 2.9 People.
How Large is the Labor Force in Concord?
There are 56,631 People in the Labor Forcein in Concord.
What is the Percentage of People in the Labor Force in Concord?
69.4% of People are in the Labor Force in Concord.
What is the Unemployment Rate in Concord?
Unemployment Rate in Concord is 4.7%.