Mattawan, MI Map & Demographics
Mattawan Map
Mattawan Overview
$31,765
PER CAPITA INCOME
$80,278
AVG FAMILY INCOME
$75,317
AVG HOUSEHOLD INCOME
21.2%
WAGE / INCOME GAP [ % ]
78.8¢/ $1
WAGE / INCOME GAP [ $ ]
0.39
INEQUALITY / GINI INDEX
2,566
TOTAL POPULATION
1,295
MALE POPULATION
1,271
FEMALE POPULATION
101.89
MALES / 100 FEMALES
98.15
FEMALES / 100 MALES
35.8
MEDIAN AGE
2.9
AVG FAMILY SIZE
2.5
AVG HOUSEHOLD SIZE
1,505
LABOR FORCE [ PEOPLE ]
76.5%
PERCENT IN LABOR FORCE
7.6%
UNEMPLOYMENT RATE
Mattawan Zip Codes
Mattawan Area Codes
Income in Mattawan
Income Overview in Mattawan
Per Capita Income in Mattawan is $31,765, while median incomes of families and households are $80,278 and $75,317 respectively.
| Characteristic | Number | Measure |
| Per Capita Income | 2,566 | $31,765 |
| Median Family Income | 702 | $80,278 |
| Mean Family Income | 702 | $91,893 |
| Median Household Income | 1,021 | $75,317 |
| Mean Household Income | 1,021 | $79,972 |
| Income Deficit | 702 | $0 |
| Wage / Income Gap (%) | 2,566 | 21.19% |
| Wage / Income Gap ($) | 2,566 | 78.81¢ per $1 |
| Gini / Inequality Index | 2,566 | 0.39 |
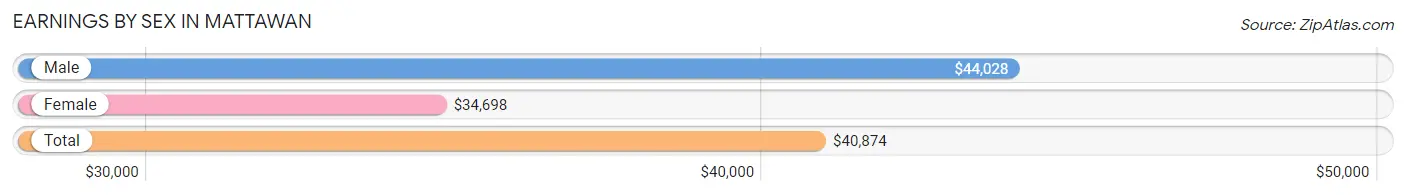
Earnings by Sex in Mattawan
Average Earnings in Mattawan are $40,874, $44,028 for men and $34,698 for women, a difference of 21.2%.
| Sex | Number | Average Earnings |
| Male | 761 (49.9%) | $44,028 |
| Female | 763 (50.1%) | $34,698 |
| Total | 1,524 (100.0%) | $40,874 |
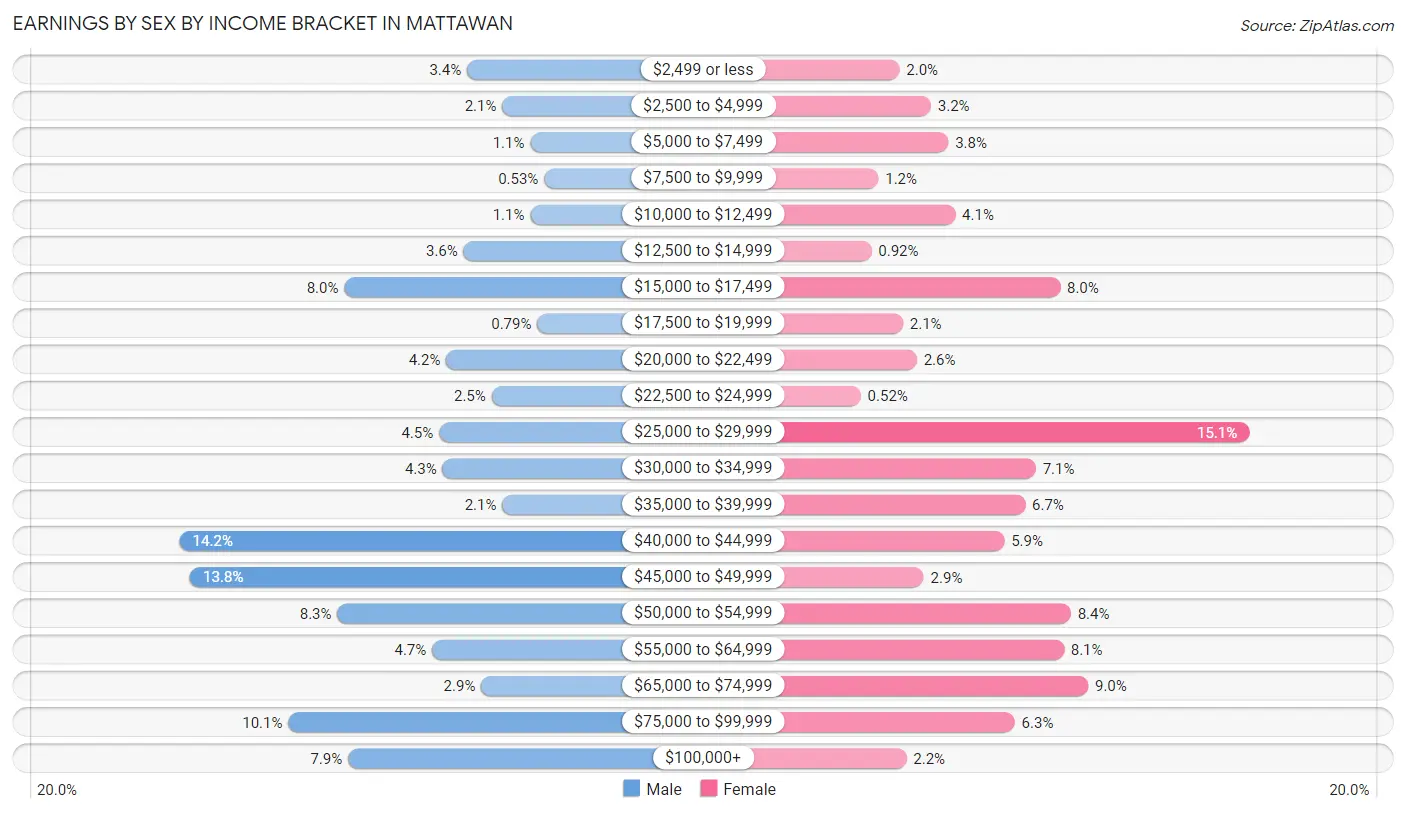
Earnings by Sex by Income Bracket in Mattawan
The most common earnings brackets in Mattawan are $40,000 to $44,999 for men (108 | 14.2%) and $25,000 to $29,999 for women (115 | 15.1%).
| Income | Male | Female |
| $2,499 or less | 26 (3.4%) | 15 (2.0%) |
| $2,500 to $4,999 | 16 (2.1%) | 24 (3.2%) |
| $5,000 to $7,499 | 8 (1.1%) | 29 (3.8%) |
| $7,500 to $9,999 | 4 (0.5%) | 9 (1.2%) |
| $10,000 to $12,499 | 8 (1.1%) | 31 (4.1%) |
| $12,500 to $14,999 | 27 (3.5%) | 7 (0.9%) |
| $15,000 to $17,499 | 61 (8.0%) | 61 (8.0%) |
| $17,500 to $19,999 | 6 (0.8%) | 16 (2.1%) |
| $20,000 to $22,499 | 32 (4.2%) | 20 (2.6%) |
| $22,500 to $24,999 | 19 (2.5%) | 4 (0.5%) |
| $25,000 to $29,999 | 34 (4.5%) | 115 (15.1%) |
| $30,000 to $34,999 | 33 (4.3%) | 54 (7.1%) |
| $35,000 to $39,999 | 16 (2.1%) | 51 (6.7%) |
| $40,000 to $44,999 | 108 (14.2%) | 45 (5.9%) |
| $45,000 to $49,999 | 105 (13.8%) | 22 (2.9%) |
| $50,000 to $54,999 | 63 (8.3%) | 64 (8.4%) |
| $55,000 to $64,999 | 36 (4.7%) | 62 (8.1%) |
| $65,000 to $74,999 | 22 (2.9%) | 69 (9.0%) |
| $75,000 to $99,999 | 77 (10.1%) | 48 (6.3%) |
| $100,000+ | 60 (7.9%) | 17 (2.2%) |
| Total | 761 (100.0%) | 763 (100.0%) |
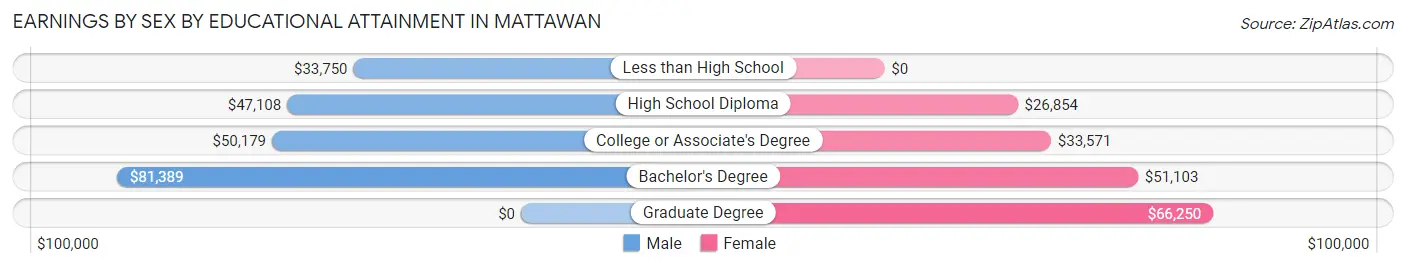
Earnings by Sex by Educational Attainment in Mattawan
Average earnings in Mattawan are $47,208 for men and $34,353 for women, a difference of 27.2%. Men with an educational attainment of bachelor's degree enjoy the highest average annual earnings of $81,389, while those with less than high school education earn the least with $33,750. Women with an educational attainment of graduate degree earn the most with the average annual earnings of $66,250, while those with high school diploma education have the smallest earnings of $26,854.
| Educational Attainment | Male Income | Female Income |
| Less than High School | $33,750 | $0 |
| High School Diploma | $47,108 | $26,854 |
| College or Associate's Degree | $50,179 | $33,571 |
| Bachelor's Degree | $81,389 | $51,103 |
| Graduate Degree | - | - |
| Total | $47,208 | $34,353 |
Family Income in Mattawan
Family Income Brackets in Mattawan
According to the Mattawan family income data, there are 192 families falling into the $100,000 to $149,999 income range, which is the most common income bracket and makes up 27.4% of all families. Conversely, the $10,000 to $14,999 income bracket is the least frequent group with only 6 families (0.9%) belonging to this category.
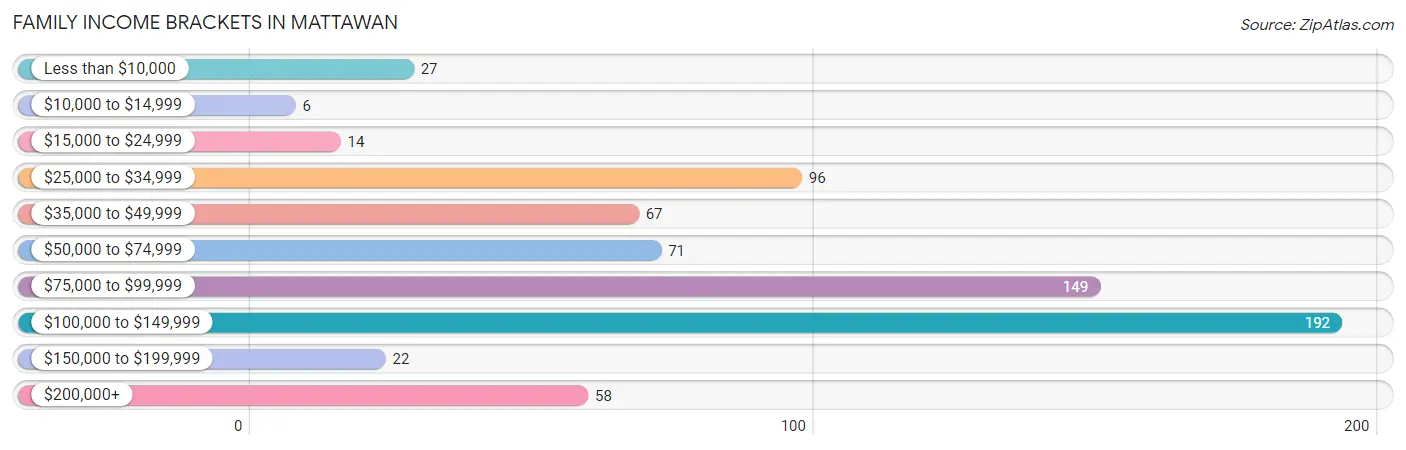
| Income Bracket | # Families | % Families |
| Less than $10,000 | 27 | 3.8% |
| $10,000 to $14,999 | 6 | 0.9% |
| $15,000 to $24,999 | 14 | 2.0% |
| $25,000 to $34,999 | 96 | 13.7% |
| $35,000 to $49,999 | 67 | 9.5% |
| $50,000 to $74,999 | 71 | 10.1% |
| $75,000 to $99,999 | 149 | 21.2% |
| $100,000 to $149,999 | 192 | 27.4% |
| $150,000 to $199,999 | 22 | 3.1% |
| $200,000+ | 58 | 8.3% |
Family Income by Famaliy Size in Mattawan
5-person families (42 | 6.0%) account for the highest median family income in Mattawan with $220,114 per family, while 5-person families (42 | 6.0%) have the highest median income of $44,023 per family member.
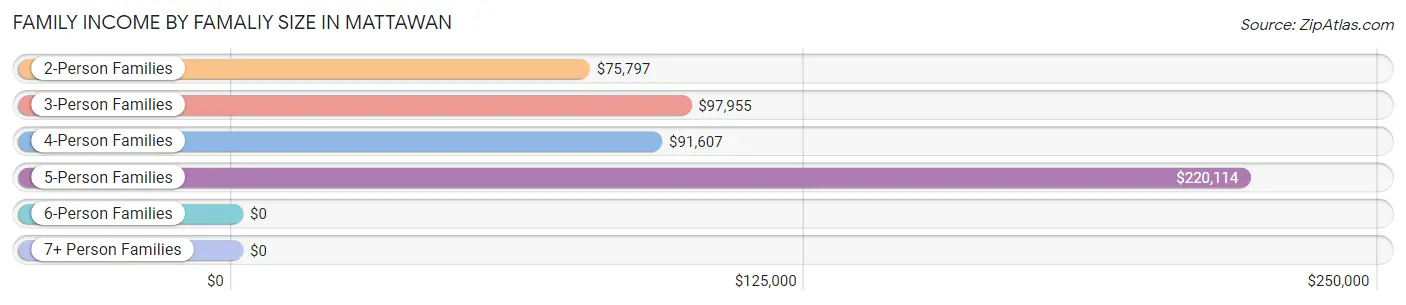
| Income Bracket | # Families | Median Income |
| 2-Person Families | 384 (54.7%) | $75,797 |
| 3-Person Families | 166 (23.6%) | $97,955 |
| 4-Person Families | 87 (12.4%) | $91,607 |
| 5-Person Families | 42 (6.0%) | $220,114 |
| 6-Person Families | 5 (0.7%) | $0 |
| 7+ Person Families | 18 (2.6%) | $0 |
| Total | 702 (100.0%) | $80,278 |
Family Income by Number of Earners in Mattawan
The median family income in Mattawan is $80,278, with families comprising 3+ earners (68) having the highest median family income of $133,900, while families with 1 earner (218) have the lowest median family income of $33,984, accounting for 9.7% and 31.0% of families, respectively.
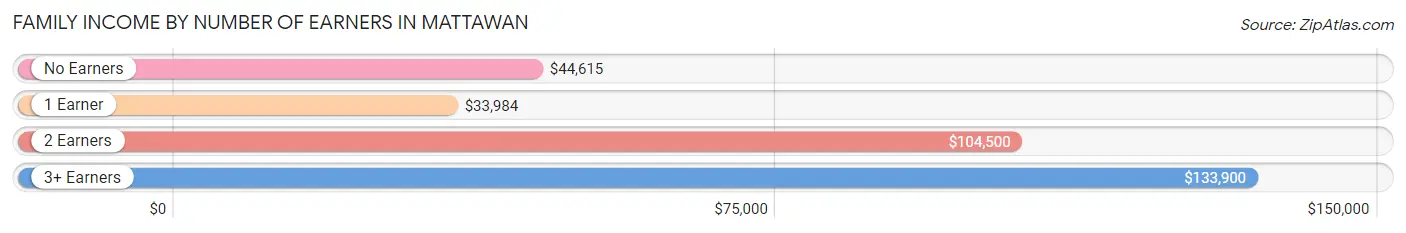
| Number of Earners | # Families | Median Income |
| No Earners | 62 (8.8%) | $44,615 |
| 1 Earner | 218 (31.0%) | $33,984 |
| 2 Earners | 354 (50.4%) | $104,500 |
| 3+ Earners | 68 (9.7%) | $133,900 |
| Total | 702 (100.0%) | $80,278 |
Household Income in Mattawan
Household Income Brackets in Mattawan
With 235 households falling in the category, the $100,000 to $149,999 income range is the most frequent in Mattawan, accounting for 23.0% of all households. In contrast, only 22 households (2.1%) fall into the $10,000 to $14,999 income bracket, making it the least populous group.
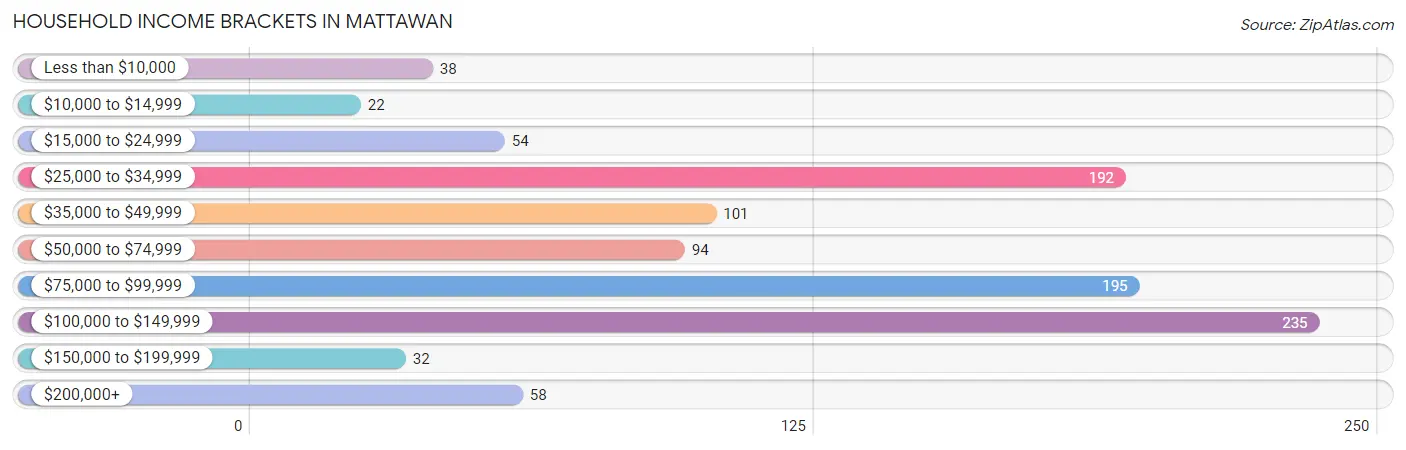
| Income Bracket | # Households | % Households |
| Less than $10,000 | 38 | 3.7% |
| $10,000 to $14,999 | 22 | 2.2% |
| $15,000 to $24,999 | 54 | 5.3% |
| $25,000 to $34,999 | 192 | 18.8% |
| $35,000 to $49,999 | 101 | 9.9% |
| $50,000 to $74,999 | 94 | 9.2% |
| $75,000 to $99,999 | 195 | 19.1% |
| $100,000 to $149,999 | 235 | 23.0% |
| $150,000 to $199,999 | 32 | 3.1% |
| $200,000+ | 58 | 5.7% |
Household Income by Householder Age in Mattawan
The median household income in Mattawan is $75,317, with the highest median household income of $83,875 found in the 25 to 44 years age bracket for the primary householder. A total of 383 households (37.5%) fall into this category. Meanwhile, the 65+ years age bracket for the primary householder has the lowest median household income of $44,792, with 221 households (21.6%) in this group.
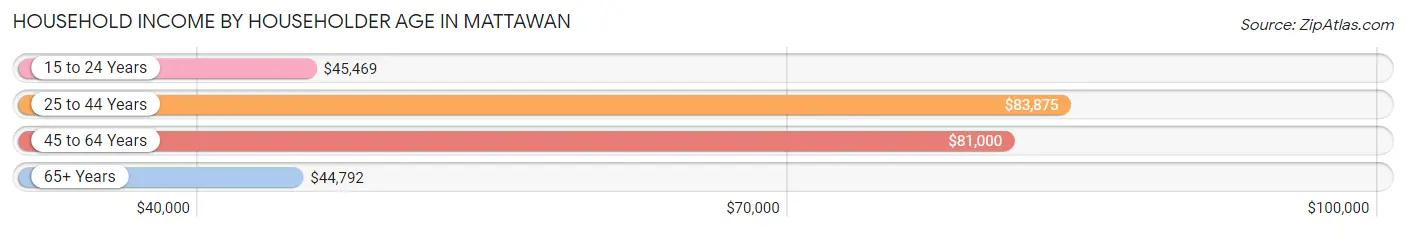
| Income Bracket | # Households | Median Income |
| 15 to 24 Years | 29 (2.8%) | $45,469 |
| 25 to 44 Years | 383 (37.5%) | $83,875 |
| 45 to 64 Years | 388 (38.0%) | $81,000 |
| 65+ Years | 221 (21.6%) | $44,792 |
| Total | 1,021 (100.0%) | $75,317 |
Poverty in Mattawan
Income Below Poverty by Sex and Age in Mattawan
With 9.5% poverty level for males and 9.0% for females among the residents of Mattawan, 15 year old males and 5 year old females are the most vulnerable to poverty, with 15 males (71.4%) and 8 females (38.1%) in their respective age groups living below the poverty level.
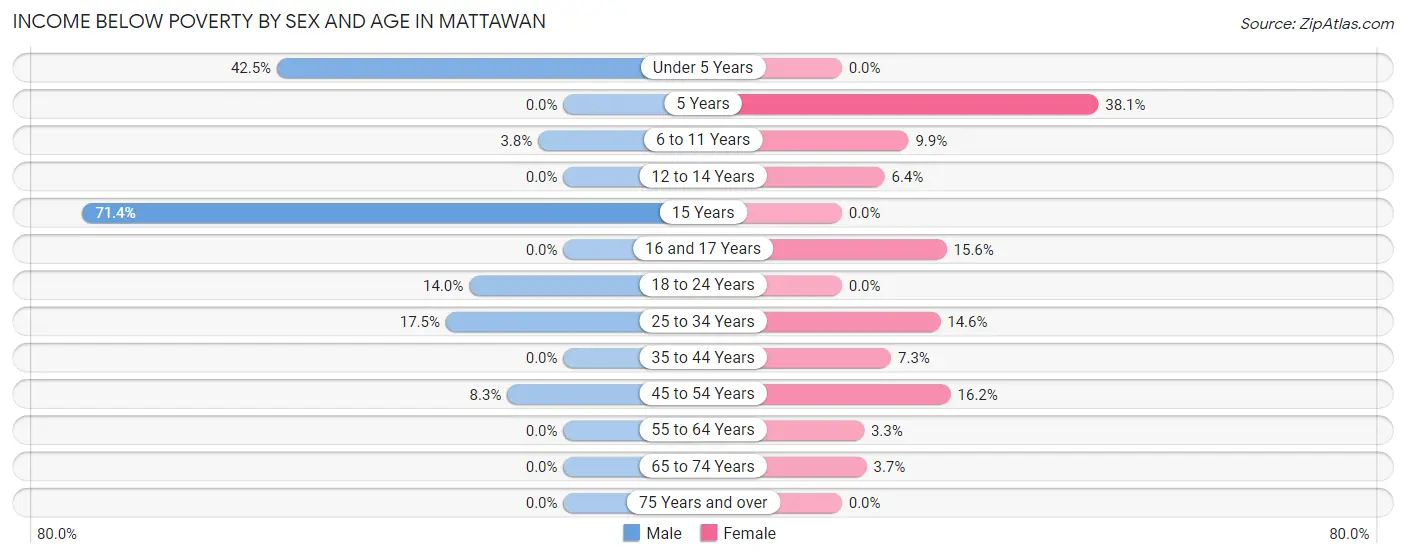
| Age Bracket | Male | Female |
| Under 5 Years | 37 (42.5%) | 0 (0.0%) |
| 5 Years | 0 (0.0%) | 8 (38.1%) |
| 6 to 11 Years | 5 (3.8%) | 10 (9.9%) |
| 12 to 14 Years | 0 (0.0%) | 4 (6.4%) |
| 15 Years | 15 (71.4%) | 0 (0.0%) |
| 16 and 17 Years | 0 (0.0%) | 7 (15.6%) |
| 18 to 24 Years | 21 (14.0%) | 0 (0.0%) |
| 25 to 34 Years | 33 (17.5%) | 24 (14.6%) |
| 35 to 44 Years | 0 (0.0%) | 15 (7.3%) |
| 45 to 54 Years | 12 (8.3%) | 37 (16.2%) |
| 55 to 64 Years | 0 (0.0%) | 5 (3.3%) |
| 65 to 74 Years | 0 (0.0%) | 4 (3.7%) |
| 75 Years and over | 0 (0.0%) | 0 (0.0%) |
| Total | 123 (9.5%) | 114 (9.0%) |
Income Above Poverty by Sex and Age in Mattawan
According to the poverty statistics in Mattawan, males aged 5 years and females aged under 5 years are the age groups that are most secure financially, with 100.0% of males and 100.0% of females in these age groups living above the poverty line.
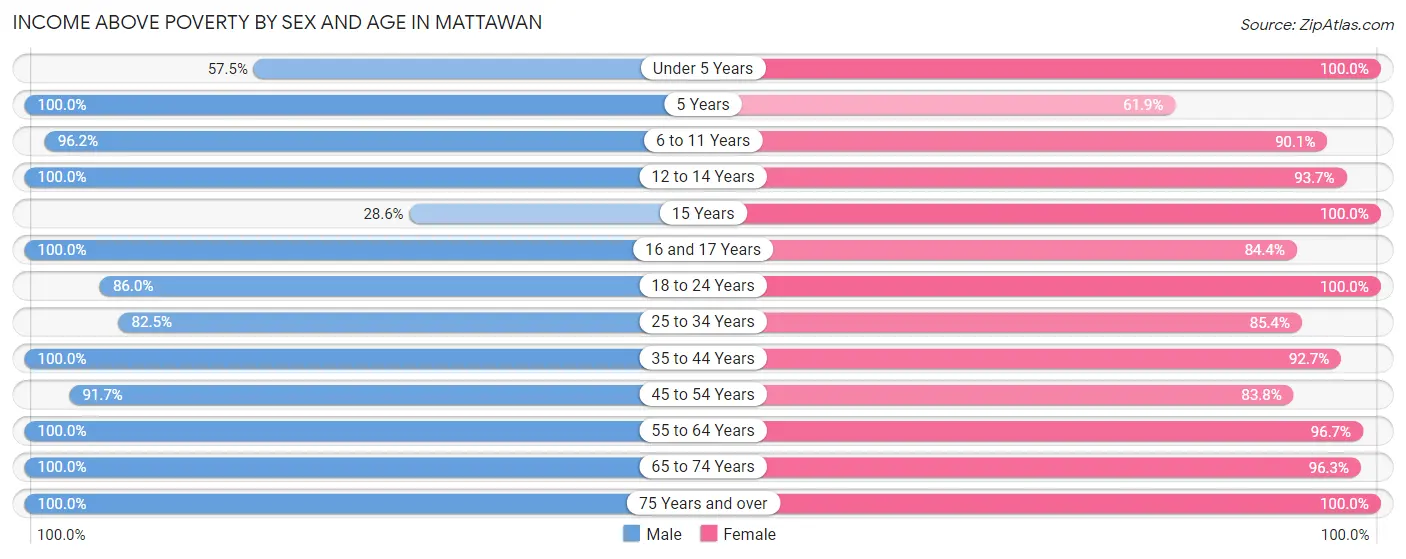
| Age Bracket | Male | Female |
| Under 5 Years | 50 (57.5%) | 55 (100.0%) |
| 5 Years | 25 (100.0%) | 13 (61.9%) |
| 6 to 11 Years | 128 (96.2%) | 91 (90.1%) |
| 12 to 14 Years | 80 (100.0%) | 59 (93.6%) |
| 15 Years | 6 (28.6%) | 13 (100.0%) |
| 16 and 17 Years | 8 (100.0%) | 38 (84.4%) |
| 18 to 24 Years | 129 (86.0%) | 64 (100.0%) |
| 25 to 34 Years | 156 (82.5%) | 140 (85.4%) |
| 35 to 44 Years | 195 (100.0%) | 190 (92.7%) |
| 45 to 54 Years | 132 (91.7%) | 192 (83.8%) |
| 55 to 64 Years | 128 (100.0%) | 147 (96.7%) |
| 65 to 74 Years | 95 (100.0%) | 105 (96.3%) |
| 75 Years and over | 40 (100.0%) | 50 (100.0%) |
| Total | 1,172 (90.5%) | 1,157 (91.0%) |
Income Below Poverty Among Married-Couple Families in Mattawan
The poverty statistics for married-couple families in Mattawan show that 1.3% or 7 of the total 523 families live below the poverty line. Families with 1 or 2 children have the highest poverty rate of 4.7%, comprising of 7 families. On the other hand, families with no children have the lowest poverty rate of 0.0%, which includes 0 families.
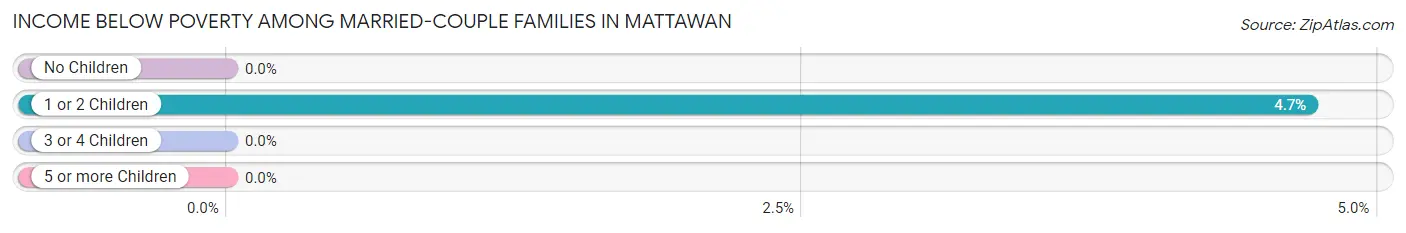
| Children | Above Poverty | Below Poverty |
| No Children | 313 (100.0%) | 0 (0.0%) |
| 1 or 2 Children | 142 (95.3%) | 7 (4.7%) |
| 3 or 4 Children | 47 (100.0%) | 0 (0.0%) |
| 5 or more Children | 14 (100.0%) | 0 (0.0%) |
| Total | 516 (98.7%) | 7 (1.3%) |
Income Below Poverty Among Single-Parent Households in Mattawan
According to the poverty data in Mattawan, 11.8% or 6 single-father households and 24.2% or 31 single-mother households are living below the poverty line. Among single-father households, those with 1 or 2 children have the highest poverty rate, with 6 households (26.1%) experiencing poverty. Likewise, among single-mother households, those with 3 or 4 children have the highest poverty rate, with 10 households (90.9%) falling below the poverty line.
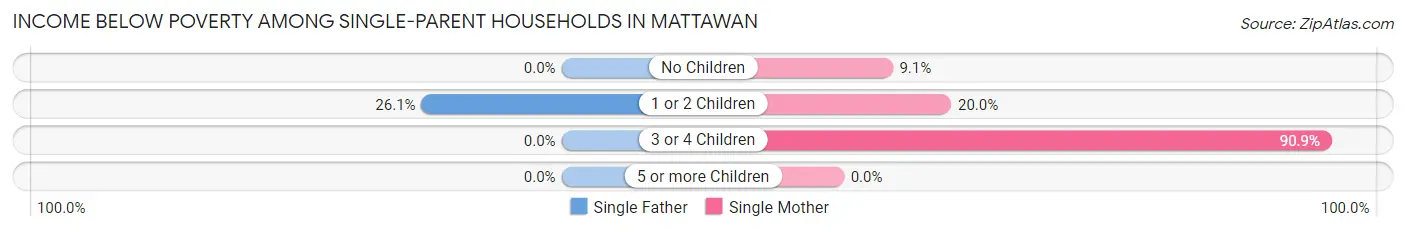
| Children | Single Father | Single Mother |
| No Children | 0 (0.0%) | 2 (9.1%) |
| 1 or 2 Children | 6 (26.1%) | 19 (20.0%) |
| 3 or 4 Children | 0 (0.0%) | 10 (90.9%) |
| 5 or more Children | 0 (0.0%) | 0 (0.0%) |
| Total | 6 (11.8%) | 31 (24.2%) |
Income Below Poverty Among Married-Couple vs Single-Parent Households in Mattawan
The poverty data for Mattawan shows that 7 of the married-couple family households (1.3%) and 37 of the single-parent households (20.7%) are living below the poverty level. Within the married-couple family households, those with 1 or 2 children have the highest poverty rate, with 7 households (4.7%) falling below the poverty line. Among the single-parent households, those with 3 or 4 children have the highest poverty rate, with 10 household (90.9%) living below poverty.
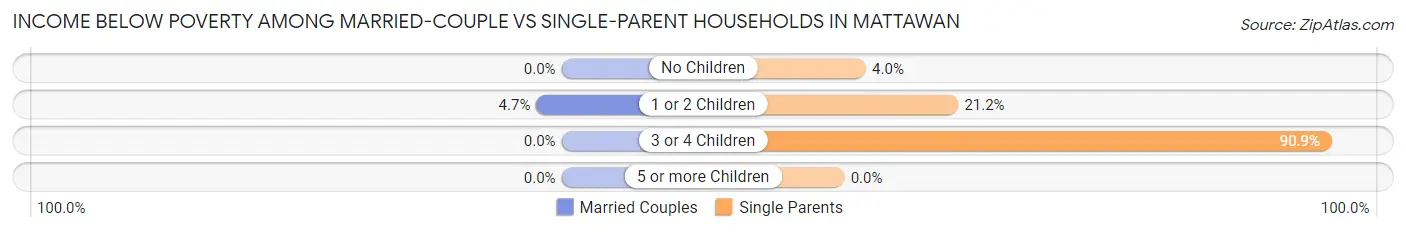
| Children | Married-Couple Families | Single-Parent Households |
| No Children | 0 (0.0%) | 2 (4.0%) |
| 1 or 2 Children | 7 (4.7%) | 25 (21.2%) |
| 3 or 4 Children | 0 (0.0%) | 10 (90.9%) |
| 5 or more Children | 0 (0.0%) | 0 (0.0%) |
| Total | 7 (1.3%) | 37 (20.7%) |
Race in Mattawan
The most populous races in Mattawan are White / Caucasian (2,230 | 86.9%), Hispanic or Latino (302 | 11.8%), and Two or more Races (256 | 10.0%).
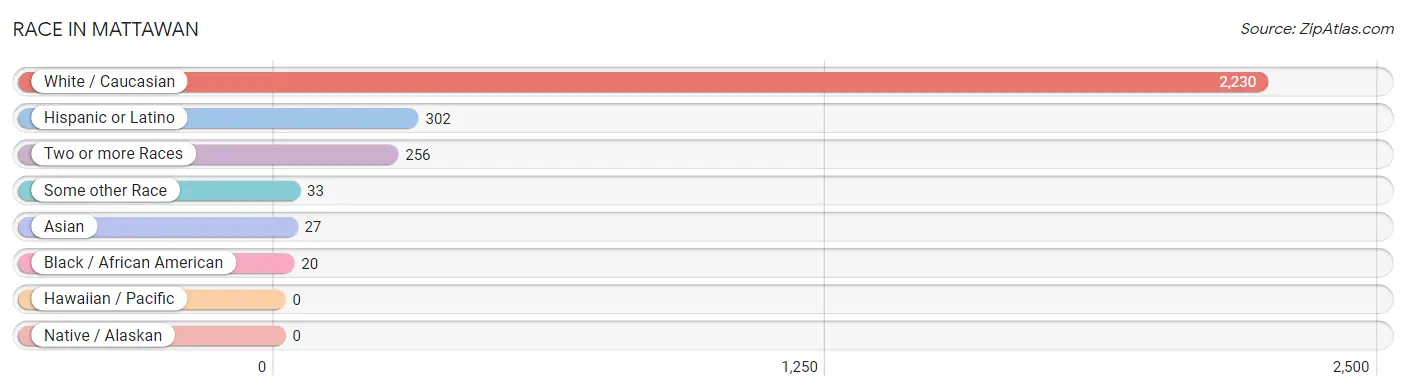
| Race | # Population | % Population |
| Asian | 27 | 1.1% |
| Black / African American | 20 | 0.8% |
| Hawaiian / Pacific | 0 | 0.0% |
| Hispanic or Latino | 302 | 11.8% |
| Native / Alaskan | 0 | 0.0% |
| White / Caucasian | 2,230 | 86.9% |
| Two or more Races | 256 | 10.0% |
| Some other Race | 33 | 1.3% |
| Total | 2,566 | 100.0% |
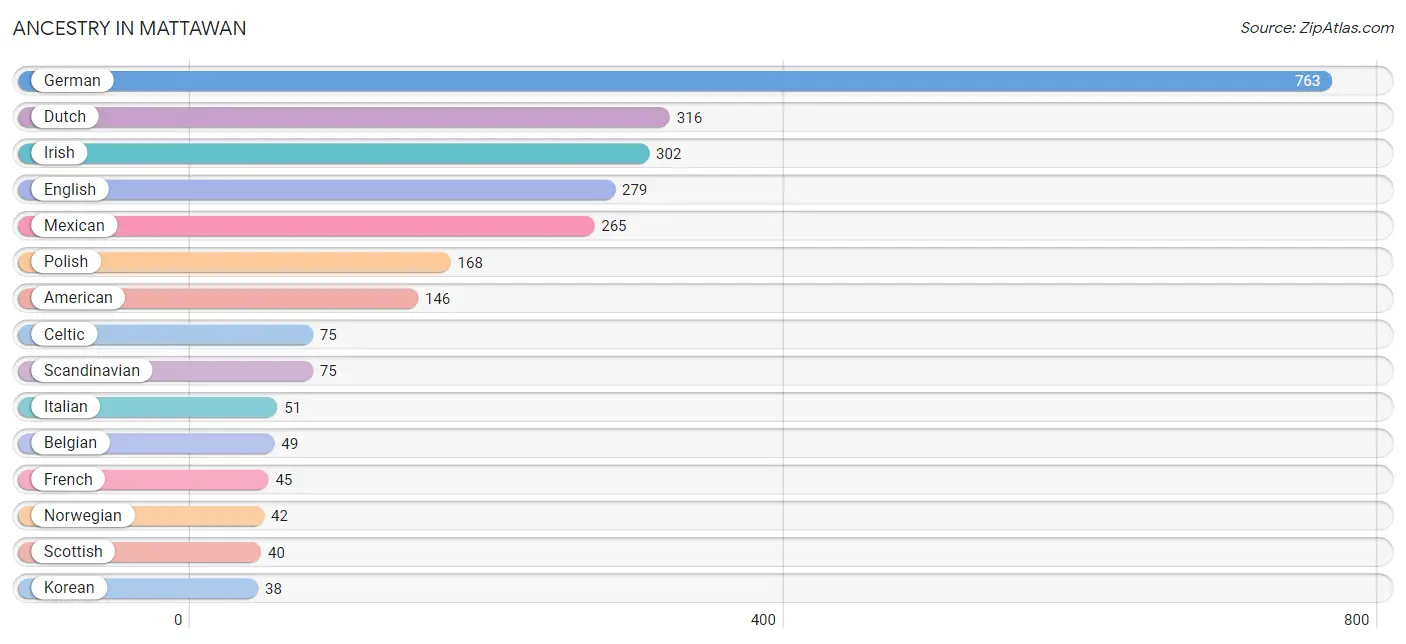
Ancestry in Mattawan
The most populous ancestries reported in Mattawan are German (763 | 29.7%), Dutch (316 | 12.3%), Irish (302 | 11.8%), English (279 | 10.9%), and Mexican (265 | 10.3%), together accounting for 75.0% of all Mattawan residents.
| Ancestry | # Population | % Population |
| African | 25 | 1.0% |
| American | 146 | 5.7% |
| Apache | 5 | 0.2% |
| Belgian | 49 | 1.9% |
| British | 6 | 0.2% |
| Celtic | 75 | 2.9% |
| Central American | 3 | 0.1% |
| Central American Indian | 3 | 0.1% |
| Colombian | 18 | 0.7% |
| Comanche | 5 | 0.2% |
| Croatian | 5 | 0.2% |
| Cuban | 4 | 0.2% |
| Czech | 19 | 0.7% |
| Dutch | 316 | 12.3% |
| English | 279 | 10.9% |
| European | 22 | 0.9% |
| Finnish | 6 | 0.2% |
| French | 45 | 1.8% |
| German | 763 | 29.7% |
| Guatemalan | 3 | 0.1% |
| Hungarian | 6 | 0.2% |
| Irish | 302 | 11.8% |
| Iroquois | 5 | 0.2% |
| Italian | 51 | 2.0% |
| Korean | 38 | 1.5% |
| Luxembourger | 4 | 0.2% |
| Mexican | 265 | 10.3% |
| Northern European | 4 | 0.2% |
| Norwegian | 42 | 1.6% |
| Polish | 168 | 6.6% |
| Portuguese | 6 | 0.2% |
| Potawatomi | 1 | 0.0% |
| Russian | 6 | 0.2% |
| Scandinavian | 75 | 2.9% |
| Scotch-Irish | 8 | 0.3% |
| Scottish | 40 | 1.6% |
| South American | 18 | 0.7% |
| Spaniard | 12 | 0.5% |
| Subsaharan African | 25 | 1.0% |
| Swedish | 4 | 0.2% |
| Swiss | 6 | 0.2% |
| Thai | 6 | 0.2% |
| Ukrainian | 5 | 0.2% |
| Welsh | 8 | 0.3% | View All 44 Rows |
Immigrants in Mattawan
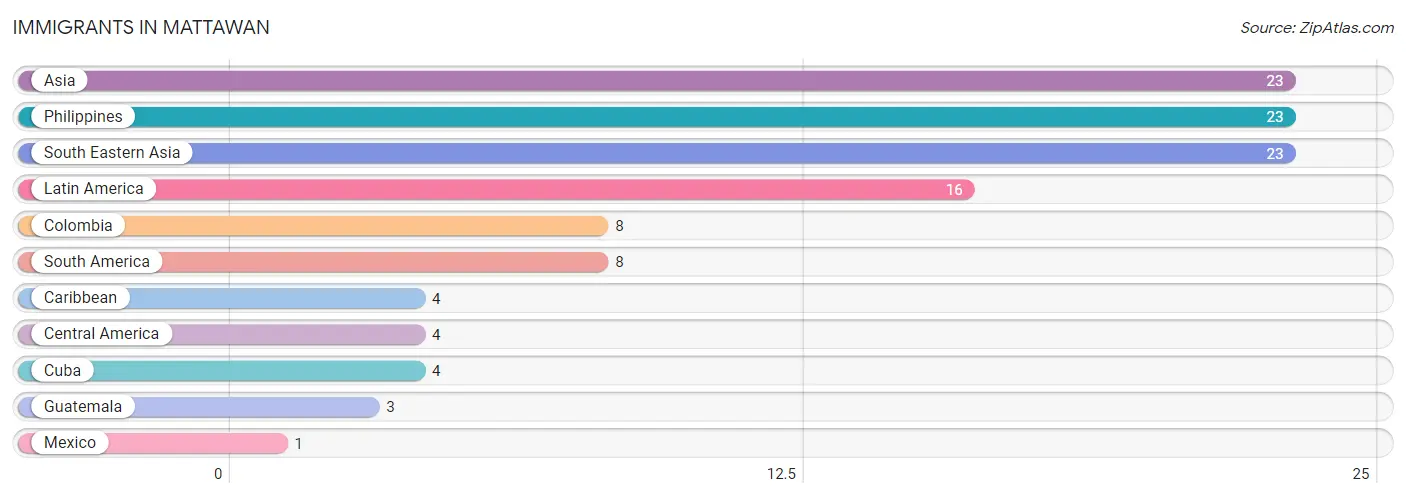
The most numerous immigrant groups reported in Mattawan came from Asia (23 | 0.9%), Philippines (23 | 0.9%), South Eastern Asia (23 | 0.9%), Latin America (16 | 0.6%), and Colombia (8 | 0.3%), together accounting for 3.6% of all Mattawan residents.
| Immigration Origin | # Population | % Population |
| Asia | 23 | 0.9% |
| Caribbean | 4 | 0.2% |
| Central America | 4 | 0.2% |
| Colombia | 8 | 0.3% |
| Cuba | 4 | 0.2% |
| Guatemala | 3 | 0.1% |
| Latin America | 16 | 0.6% |
| Mexico | 1 | 0.0% |
| Philippines | 23 | 0.9% |
| South America | 8 | 0.3% |
| South Eastern Asia | 23 | 0.9% | View All 11 Rows |
Sex and Age in Mattawan
Sex and Age in Mattawan
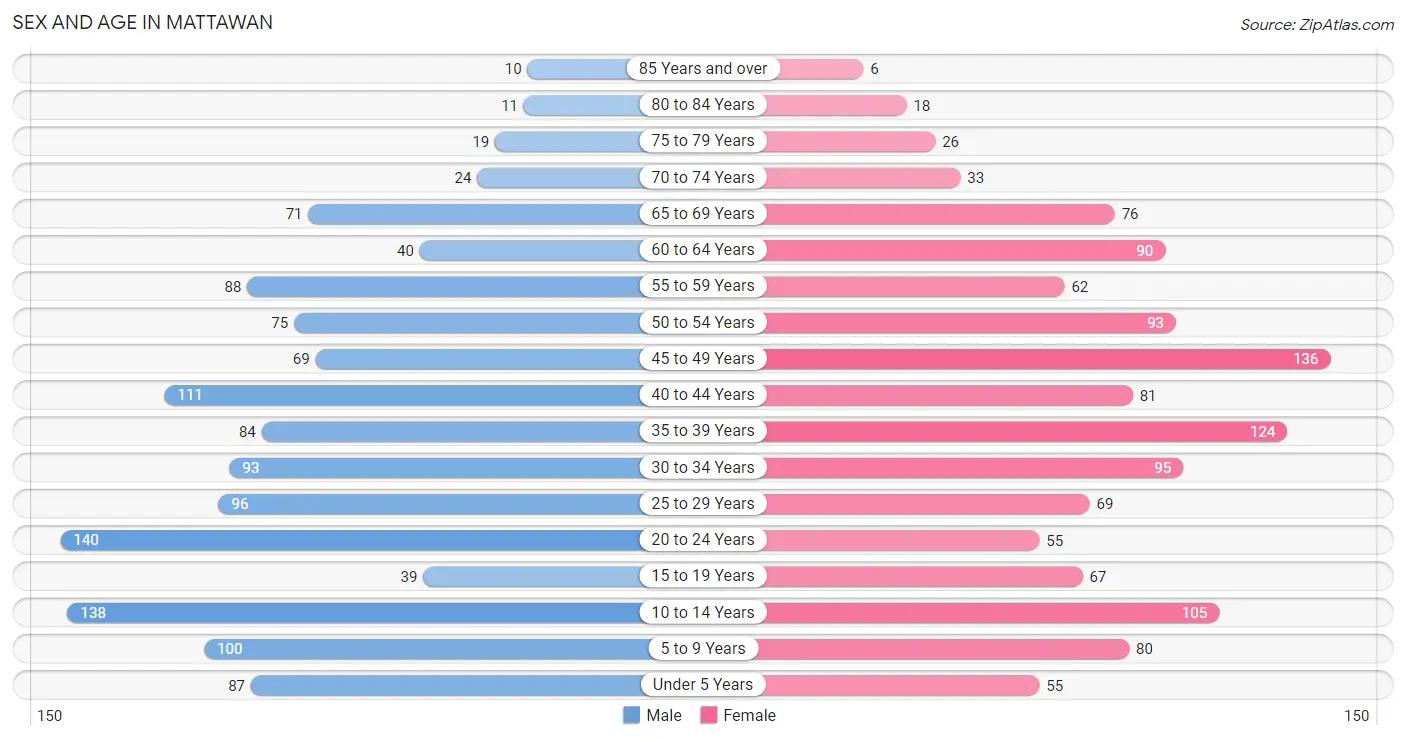
The most populous age groups in Mattawan are 20 to 24 Years (140 | 10.8%) for men and 45 to 49 Years (136 | 10.7%) for women.
| Age Bracket | Male | Female |
| Under 5 Years | 87 (6.7%) | 55 (4.3%) |
| 5 to 9 Years | 100 (7.7%) | 80 (6.3%) |
| 10 to 14 Years | 138 (10.7%) | 105 (8.3%) |
| 15 to 19 Years | 39 (3.0%) | 67 (5.3%) |
| 20 to 24 Years | 140 (10.8%) | 55 (4.3%) |
| 25 to 29 Years | 96 (7.4%) | 69 (5.4%) |
| 30 to 34 Years | 93 (7.2%) | 95 (7.5%) |
| 35 to 39 Years | 84 (6.5%) | 124 (9.8%) |
| 40 to 44 Years | 111 (8.6%) | 81 (6.4%) |
| 45 to 49 Years | 69 (5.3%) | 136 (10.7%) |
| 50 to 54 Years | 75 (5.8%) | 93 (7.3%) |
| 55 to 59 Years | 88 (6.8%) | 62 (4.9%) |
| 60 to 64 Years | 40 (3.1%) | 90 (7.1%) |
| 65 to 69 Years | 71 (5.5%) | 76 (6.0%) |
| 70 to 74 Years | 24 (1.8%) | 33 (2.6%) |
| 75 to 79 Years | 19 (1.5%) | 26 (2.1%) |
| 80 to 84 Years | 11 (0.9%) | 18 (1.4%) |
| 85 Years and over | 10 (0.8%) | 6 (0.5%) |
| Total | 1,295 (100.0%) | 1,271 (100.0%) |
Families and Households in Mattawan
Median Family Size in Mattawan
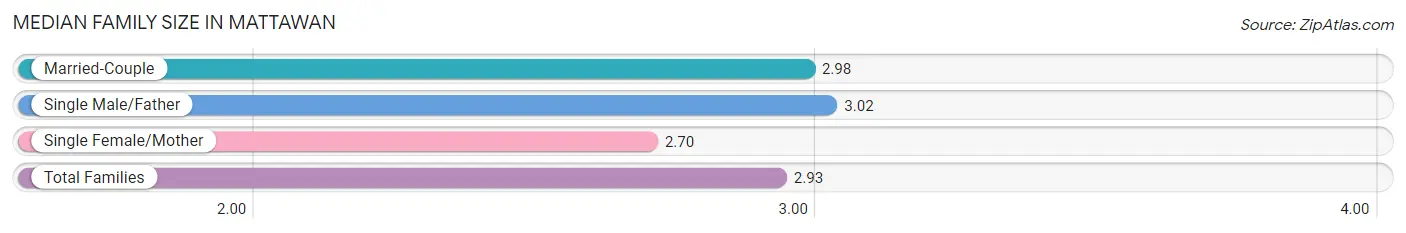
The median family size in Mattawan is 2.93 persons per family, with single male/father families (51 | 7.3%) accounting for the largest median family size of 3.02 persons per family. On the other hand, single female/mother families (128 | 18.2%) represent the smallest median family size with 2.70 persons per family.
| Family Type | # Families | Family Size |
| Married-Couple | 523 (74.5%) | 2.98 |
| Single Male/Father | 51 (7.3%) | 3.02 |
| Single Female/Mother | 128 (18.2%) | 2.70 |
| Total Families | 702 (100.0%) | 2.93 |
Median Household Size in Mattawan
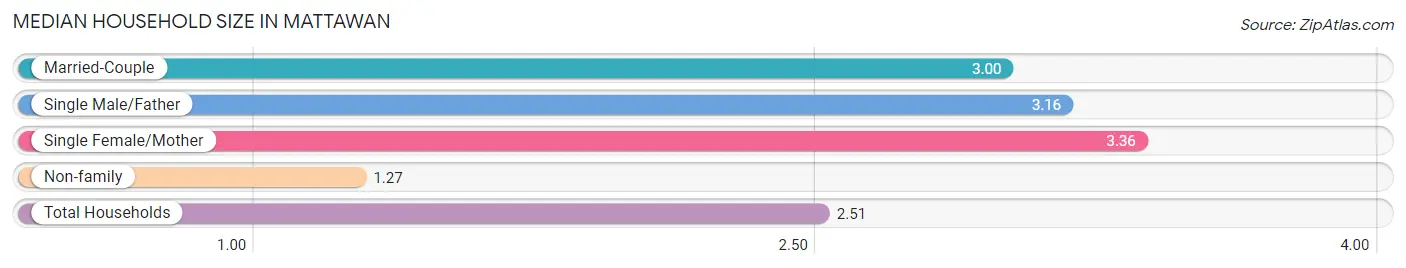
The median household size in Mattawan is 2.51 persons per household, with single female/mother households (128 | 12.5%) accounting for the largest median household size of 3.36 persons per household. non-family households (319 | 31.2%) represent the smallest median household size with 1.27 persons per household.
| Household Type | # Households | Household Size |
| Married-Couple | 523 (51.2%) | 3.00 |
| Single Male/Father | 51 (5.0%) | 3.16 |
| Single Female/Mother | 128 (12.5%) | 3.36 |
| Non-family | 319 (31.2%) | 1.27 |
| Total Households | 1,021 (100.0%) | 2.51 |
Household Size by Marriage Status in Mattawan
Out of a total of 1,021 households in Mattawan, 702 (68.8%) are family households, while 319 (31.2%) are nonfamily households. The most numerous type of family households are 2-person households, comprising 341, and the most common type of nonfamily households are 1-person households, comprising 238.
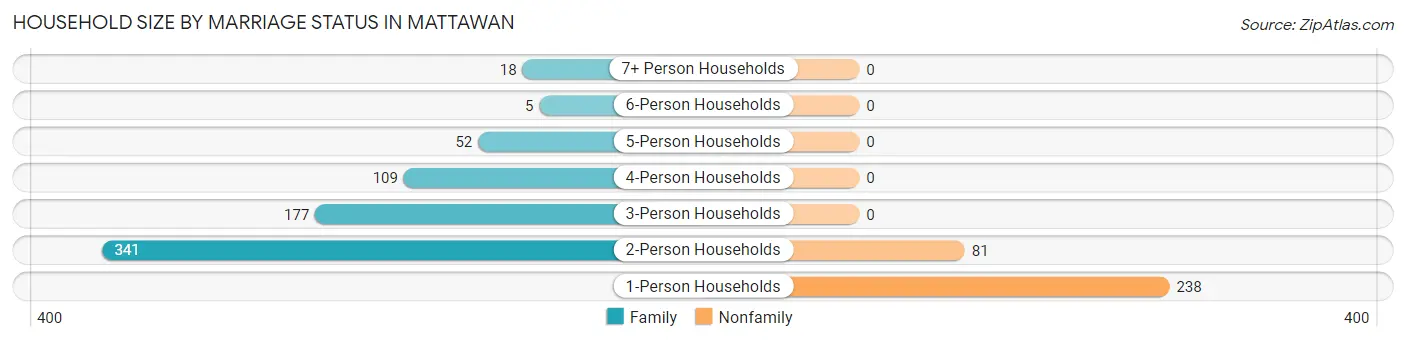
| Household Size | Family Households | Nonfamily Households |
| 1-Person Households | - | 238 (23.3%) |
| 2-Person Households | 341 (33.4%) | 81 (7.9%) |
| 3-Person Households | 177 (17.3%) | 0 (0.0%) |
| 4-Person Households | 109 (10.7%) | 0 (0.0%) |
| 5-Person Households | 52 (5.1%) | 0 (0.0%) |
| 6-Person Households | 5 (0.5%) | 0 (0.0%) |
| 7+ Person Households | 18 (1.8%) | 0 (0.0%) |
| Total | 702 (68.8%) | 319 (31.2%) |
Female Fertility in Mattawan
Fertility by Age in Mattawan
Average fertility rate in Mattawan is 56.0 births per 1,000 women. Women in the age bracket of 20 to 34 years have the highest fertility rate with 137.0 births per 1,000 women. Women in the age bracket of 20 to 34 years acount for 83.3% of all women with births.
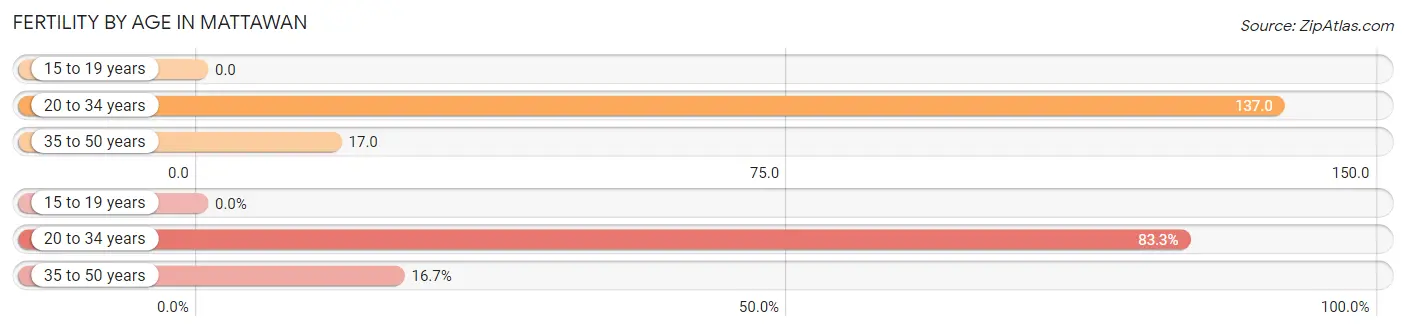
| Age Bracket | Women with Births | Births / 1,000 Women |
| 15 to 19 years | 0 (0.0%) | 0.0 |
| 20 to 34 years | 30 (83.3%) | 137.0 |
| 35 to 50 years | 6 (16.7%) | 17.0 |
| Total | 36 (100.0%) | 56.0 |
Fertility by Age by Marriage Status in Mattawan
50.0% of women with births (36) in Mattawan are married. The highest percentage of unmarried women with births falls into 20 to 34 years age bracket with 60.0% of them unmarried at the time of birth, while the lowest percentage of unmarried women with births belong to 35 to 50 years age bracket with 0.0% of them unmarried.
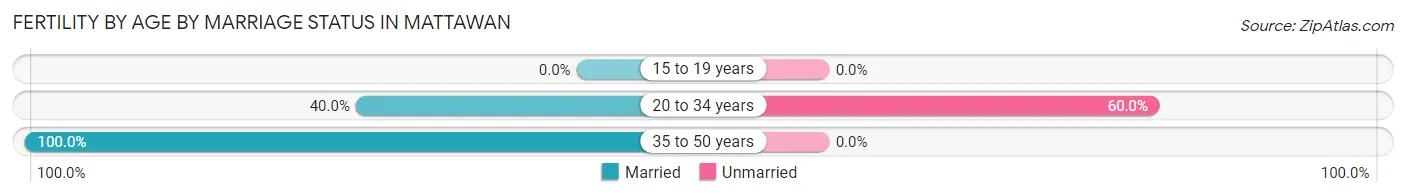
| Age Bracket | Married | Unmarried |
| 15 to 19 years | 0 (0.0%) | 0 (0.0%) |
| 20 to 34 years | 12 (40.0%) | 18 (60.0%) |
| 35 to 50 years | 6 (100.0%) | 0 (0.0%) |
| Total | 18 (50.0%) | 18 (50.0%) |
Fertility by Education in Mattawan
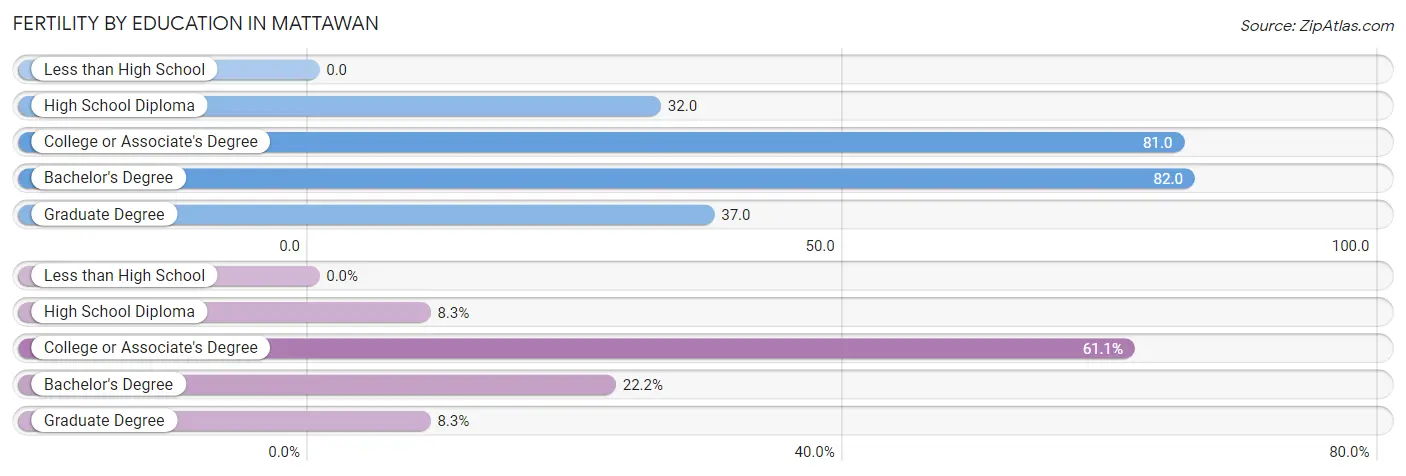
| Educational Attainment | Women with Births | Births / 1,000 Women |
| Less than High School | 0 (0.0%) | 0.0 |
| High School Diploma | 3 (8.3%) | 32.0 |
| College or Associate's Degree | 22 (61.1%) | 81.0 |
| Bachelor's Degree | 8 (22.2%) | 82.0 |
| Graduate Degree | 3 (8.3%) | 37.0 |
| Total | 36 (100.0%) | 56.0 |
Fertility by Education by Marriage Status in Mattawan
50.0% of women with births in Mattawan are unmarried. Women with the educational attainment of high school diploma are most likely to be married with 100.0% of them married at childbirth, while women with the educational attainment of bachelor's degree are least likely to be married with 100.0% of them unmarried at childbirth.
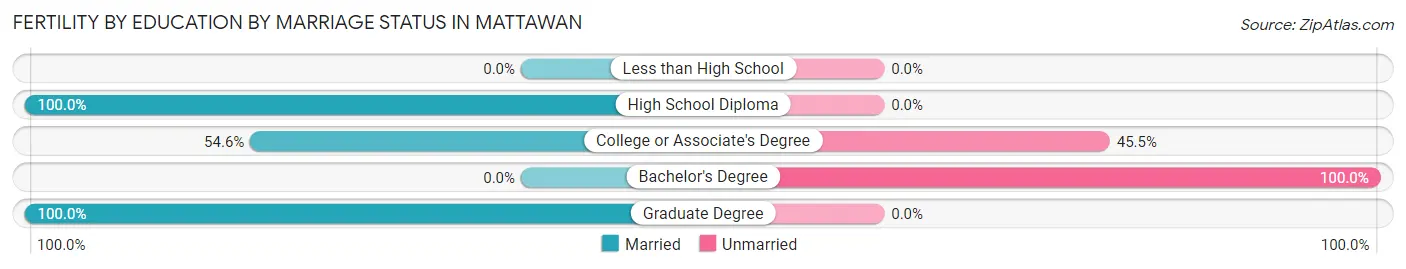
| Educational Attainment | Married | Unmarried |
| Less than High School | 0 (0.0%) | 0 (0.0%) |
| High School Diploma | 3 (100.0%) | 0 (0.0%) |
| College or Associate's Degree | 12 (54.5%) | 10 (45.5%) |
| Bachelor's Degree | 0 (0.0%) | 8 (100.0%) |
| Graduate Degree | 3 (100.0%) | 0 (0.0%) |
| Total | 18 (50.0%) | 18 (50.0%) |
Employment Characteristics in Mattawan
Employment by Class of Employer in Mattawan
Among the 1,378 employed individuals in Mattawan, private company employees (1,071 | 77.7%), not-for-profit organizations (103 | 7.5%), and self-employed (not incorporated) (60 | 4.3%) make up the most common classes of employment.
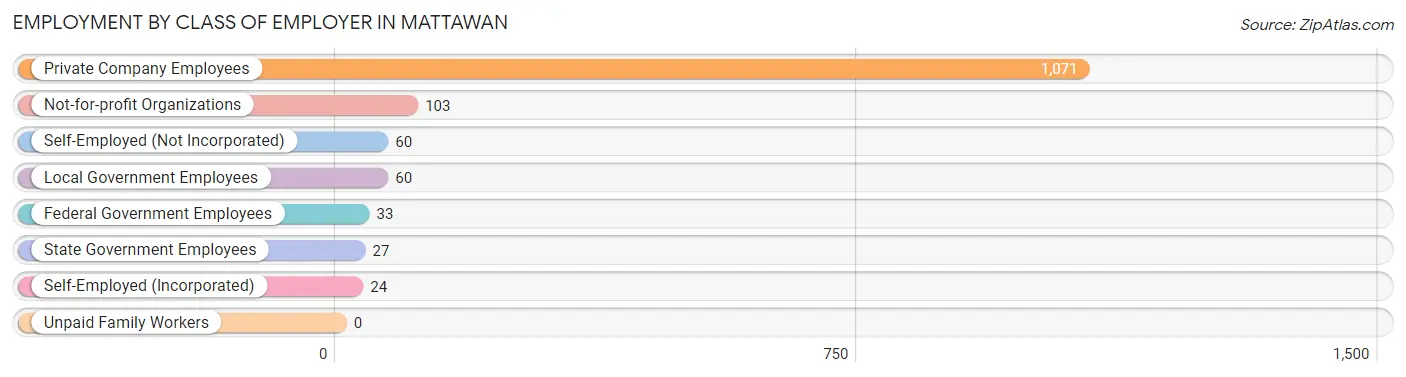
| Employer Class | # Employees | % Employees |
| Private Company Employees | 1,071 | 77.7% |
| Self-Employed (Incorporated) | 24 | 1.7% |
| Self-Employed (Not Incorporated) | 60 | 4.3% |
| Not-for-profit Organizations | 103 | 7.5% |
| Local Government Employees | 60 | 4.3% |
| State Government Employees | 27 | 2.0% |
| Federal Government Employees | 33 | 2.4% |
| Unpaid Family Workers | 0 | 0.0% |
| Total | 1,378 | 100.0% |
Employment Status by Age in Mattawan
According to the labor force statistics for Mattawan, out of the total population over 16 years of age (1,967), 76.5% or 1,505 individuals are in the labor force, with 7.6% or 114 of them unemployed. The age group with the highest labor force participation rate is 25 to 29 years, with 96.4% or 159 individuals in the labor force. Within the labor force, the 16 to 19 years age range has the highest percentage of unemployed individuals, with 21.9% or 7 of them being unemployed.
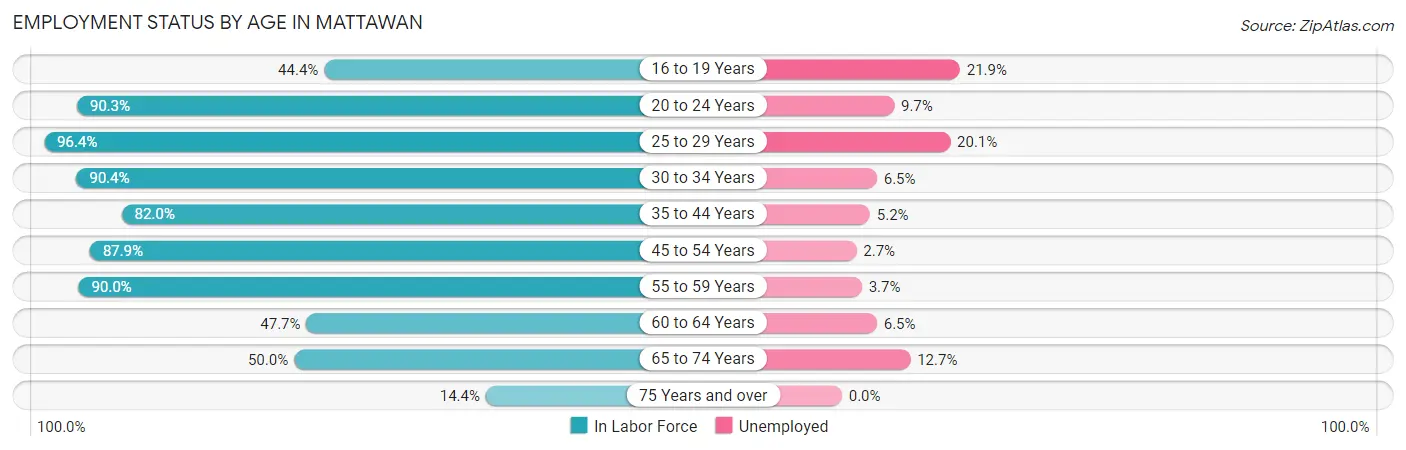
| Age Bracket | In Labor Force | Unemployed |
| 16 to 19 Years | 32 (44.4%) | 7 (21.9%) |
| 20 to 24 Years | 176 (90.3%) | 17 (9.7%) |
| 25 to 29 Years | 159 (96.4%) | 32 (20.1%) |
| 30 to 34 Years | 170 (90.4%) | 11 (6.5%) |
| 35 to 44 Years | 328 (82.0%) | 17 (5.2%) |
| 45 to 54 Years | 328 (87.9%) | 9 (2.7%) |
| 55 to 59 Years | 135 (90.0%) | 5 (3.7%) |
| 60 to 64 Years | 62 (47.7%) | 4 (6.5%) |
| 65 to 74 Years | 102 (50.0%) | 13 (12.7%) |
| 75 Years and over | 13 (14.4%) | 0 (0.0%) |
| Total | 1,505 (76.5%) | 114 (7.6%) |
Employment Status by Educational Attainment in Mattawan
According to labor force statistics for Mattawan, 84.1% of individuals (1,182) out of the total population between 25 and 64 years of age (1,406) are in the labor force, with 6.6% or 78 of them being unemployed. The group with the highest labor force participation rate are those with the educational attainment of college / associate degree, with 87.5% or 509 individuals in the labor force. Within the labor force, individuals with less than high school education have the highest percentage of unemployment, with 43.4% or 33 of them being unemployed.
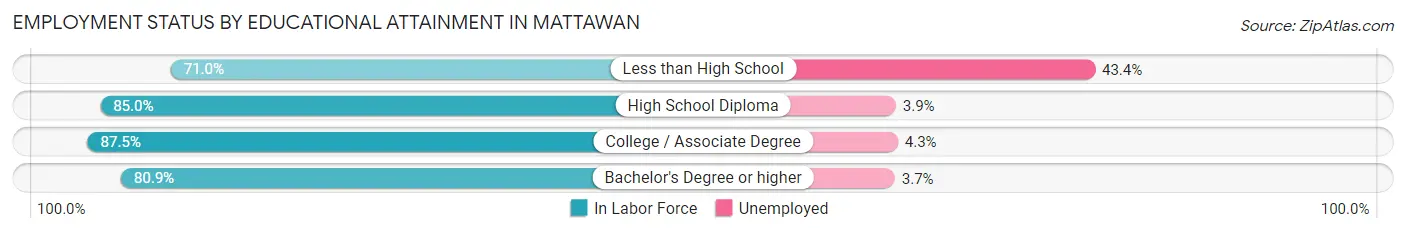
| Educational Attainment | In Labor Force | Unemployed |
| Less than High School | 76 (71.0%) | 46 (43.4%) |
| High School Diploma | 356 (85.0%) | 16 (3.9%) |
| College / Associate Degree | 509 (87.5%) | 25 (4.3%) |
| Bachelor's Degree or higher | 241 (80.9%) | 11 (3.7%) |
| Total | 1,182 (84.1%) | 93 (6.6%) |
Employment Occupations by Sex in Mattawan
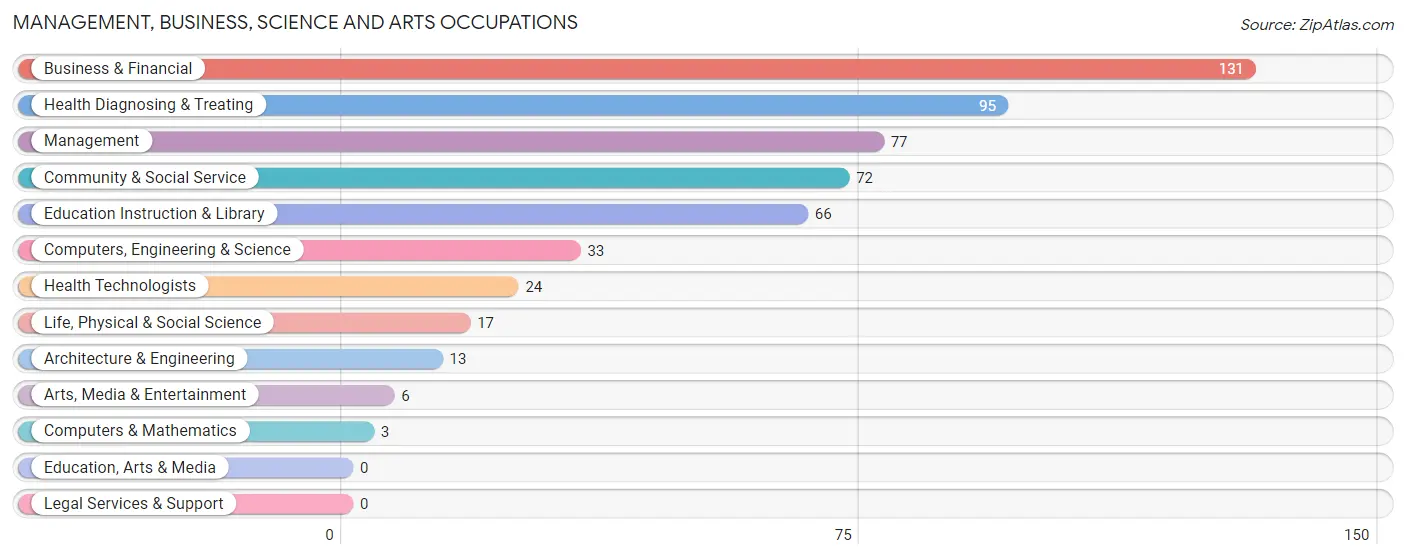
Management, Business, Science and Arts Occupations
The most common Management, Business, Science and Arts occupations in Mattawan are Business & Financial (131 | 9.4%), Health Diagnosing & Treating (95 | 6.8%), Management (77 | 5.5%), Community & Social Service (72 | 5.2%), and Education Instruction & Library (66 | 4.8%).
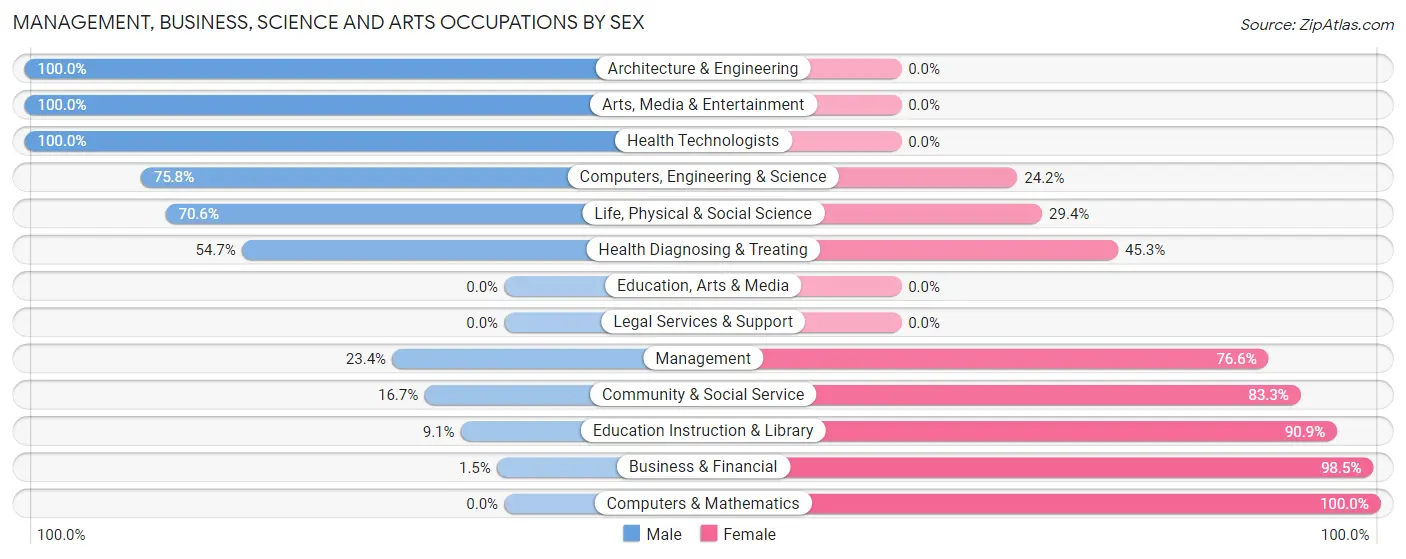
Management, Business, Science and Arts Occupations by Sex
Within the Management, Business, Science and Arts occupations in Mattawan, the most male-oriented occupations are Architecture & Engineering (100.0%), Arts, Media & Entertainment (100.0%), and Health Technologists (100.0%), while the most female-oriented occupations are Computers & Mathematics (100.0%), Business & Financial (98.5%), and Education Instruction & Library (90.9%).
| Occupation | Male | Female |
| Management | 18 (23.4%) | 59 (76.6%) |
| Business & Financial | 2 (1.5%) | 129 (98.5%) |
| Computers, Engineering & Science | 25 (75.8%) | 8 (24.2%) |
| Computers & Mathematics | 0 (0.0%) | 3 (100.0%) |
| Architecture & Engineering | 13 (100.0%) | 0 (0.0%) |
| Life, Physical & Social Science | 12 (70.6%) | 5 (29.4%) |
| Community & Social Service | 12 (16.7%) | 60 (83.3%) |
| Education, Arts & Media | 0 (0.0%) | 0 (0.0%) |
| Legal Services & Support | 0 (0.0%) | 0 (0.0%) |
| Education Instruction & Library | 6 (9.1%) | 60 (90.9%) |
| Arts, Media & Entertainment | 6 (100.0%) | 0 (0.0%) |
| Health Diagnosing & Treating | 52 (54.7%) | 43 (45.3%) |
| Health Technologists | 24 (100.0%) | 0 (0.0%) |
| Total (Category) | 109 (26.7%) | 299 (73.3%) |
| Total (Overall) | 715 (51.4%) | 675 (48.6%) |
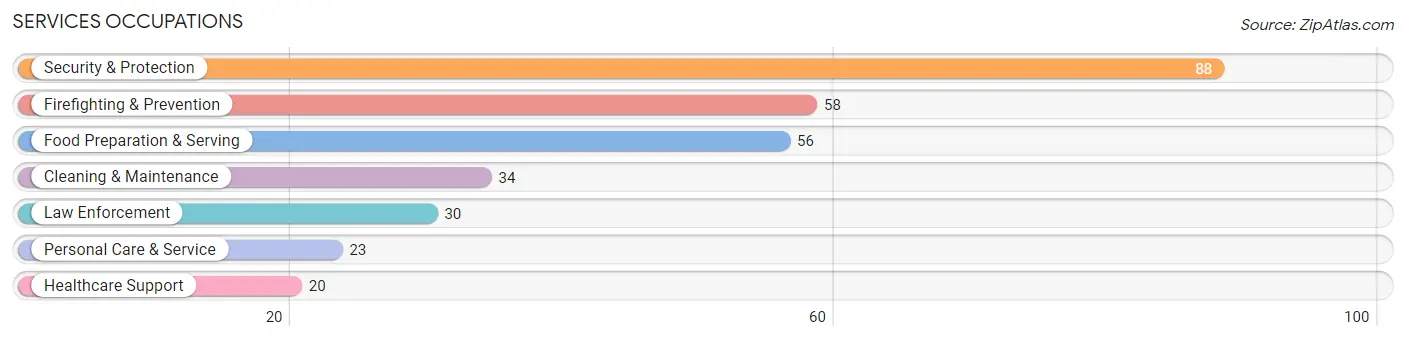
Services Occupations
The most common Services occupations in Mattawan are Security & Protection (88 | 6.3%), Firefighting & Prevention (58 | 4.2%), Food Preparation & Serving (56 | 4.0%), Cleaning & Maintenance (34 | 2.5%), and Law Enforcement (30 | 2.2%).
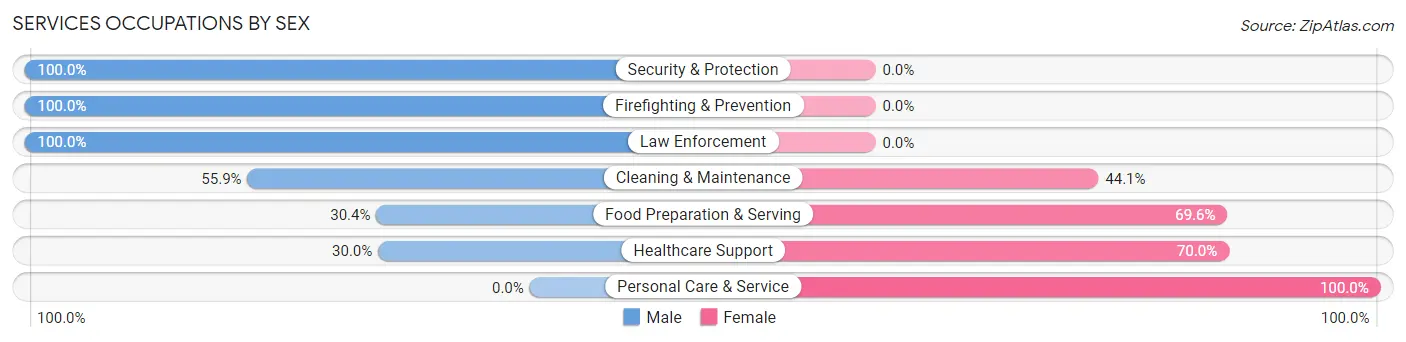
Services Occupations by Sex
Within the Services occupations in Mattawan, the most male-oriented occupations are Security & Protection (100.0%), Firefighting & Prevention (100.0%), and Law Enforcement (100.0%), while the most female-oriented occupations are Personal Care & Service (100.0%), Healthcare Support (70.0%), and Food Preparation & Serving (69.6%).
| Occupation | Male | Female |
| Healthcare Support | 6 (30.0%) | 14 (70.0%) |
| Security & Protection | 88 (100.0%) | 0 (0.0%) |
| Firefighting & Prevention | 58 (100.0%) | 0 (0.0%) |
| Law Enforcement | 30 (100.0%) | 0 (0.0%) |
| Food Preparation & Serving | 17 (30.4%) | 39 (69.6%) |
| Cleaning & Maintenance | 19 (55.9%) | 15 (44.1%) |
| Personal Care & Service | 0 (0.0%) | 23 (100.0%) |
| Total (Category) | 130 (58.8%) | 91 (41.2%) |
| Total (Overall) | 715 (51.4%) | 675 (48.6%) |
Sales and Office Occupations
The most common Sales and Office occupations in Mattawan are Office & Administration (185 | 13.3%), and Sales & Related (72 | 5.2%).
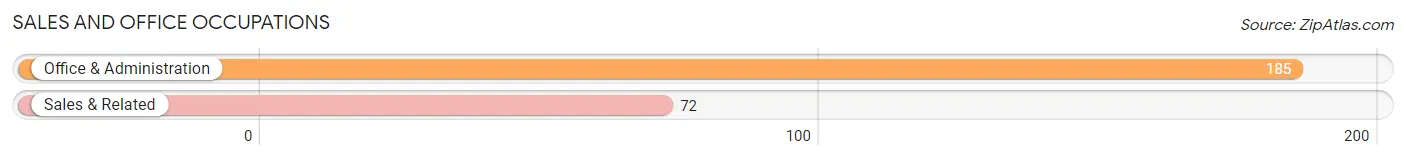
Sales and Office Occupations by Sex

| Occupation | Male | Female |
| Sales & Related | 36 (50.0%) | 36 (50.0%) |
| Office & Administration | 70 (37.8%) | 115 (62.2%) |
| Total (Category) | 106 (41.2%) | 151 (58.8%) |
| Total (Overall) | 715 (51.4%) | 675 (48.6%) |
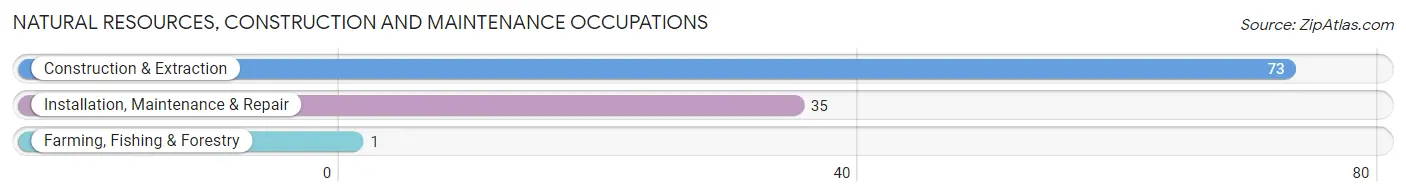
Natural Resources, Construction and Maintenance Occupations
The most common Natural Resources, Construction and Maintenance occupations in Mattawan are Construction & Extraction (73 | 5.2%), Installation, Maintenance & Repair (35 | 2.5%), and Farming, Fishing & Forestry (1 | 0.1%).
Natural Resources, Construction and Maintenance Occupations by Sex
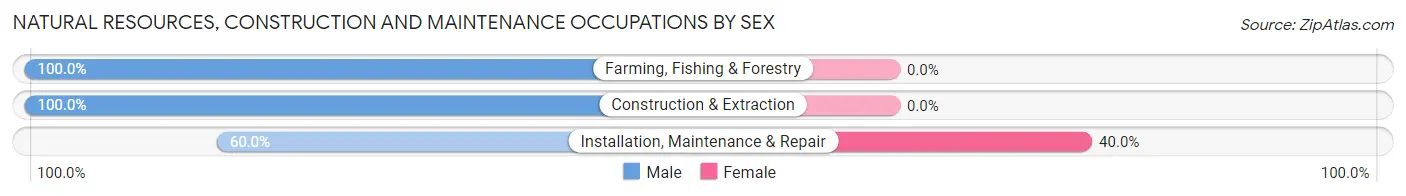
| Occupation | Male | Female |
| Farming, Fishing & Forestry | 1 (100.0%) | 0 (0.0%) |
| Construction & Extraction | 73 (100.0%) | 0 (0.0%) |
| Installation, Maintenance & Repair | 21 (60.0%) | 14 (40.0%) |
| Total (Category) | 95 (87.2%) | 14 (12.8%) |
| Total (Overall) | 715 (51.4%) | 675 (48.6%) |
Production, Transportation and Moving Occupations
The most common Production, Transportation and Moving occupations in Mattawan are Production (283 | 20.4%), Material Moving (59 | 4.2%), and Transportation (53 | 3.8%).
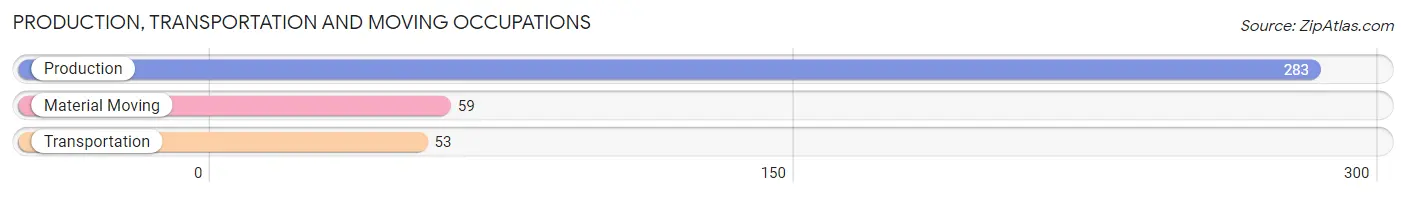
Production, Transportation and Moving Occupations by Sex
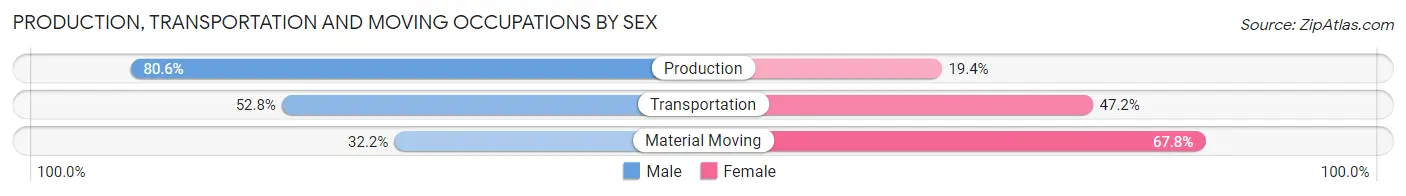
| Occupation | Male | Female |
| Production | 228 (80.6%) | 55 (19.4%) |
| Transportation | 28 (52.8%) | 25 (47.2%) |
| Material Moving | 19 (32.2%) | 40 (67.8%) |
| Total (Category) | 275 (69.6%) | 120 (30.4%) |
| Total (Overall) | 715 (51.4%) | 675 (48.6%) |
Employment Industries by Sex in Mattawan
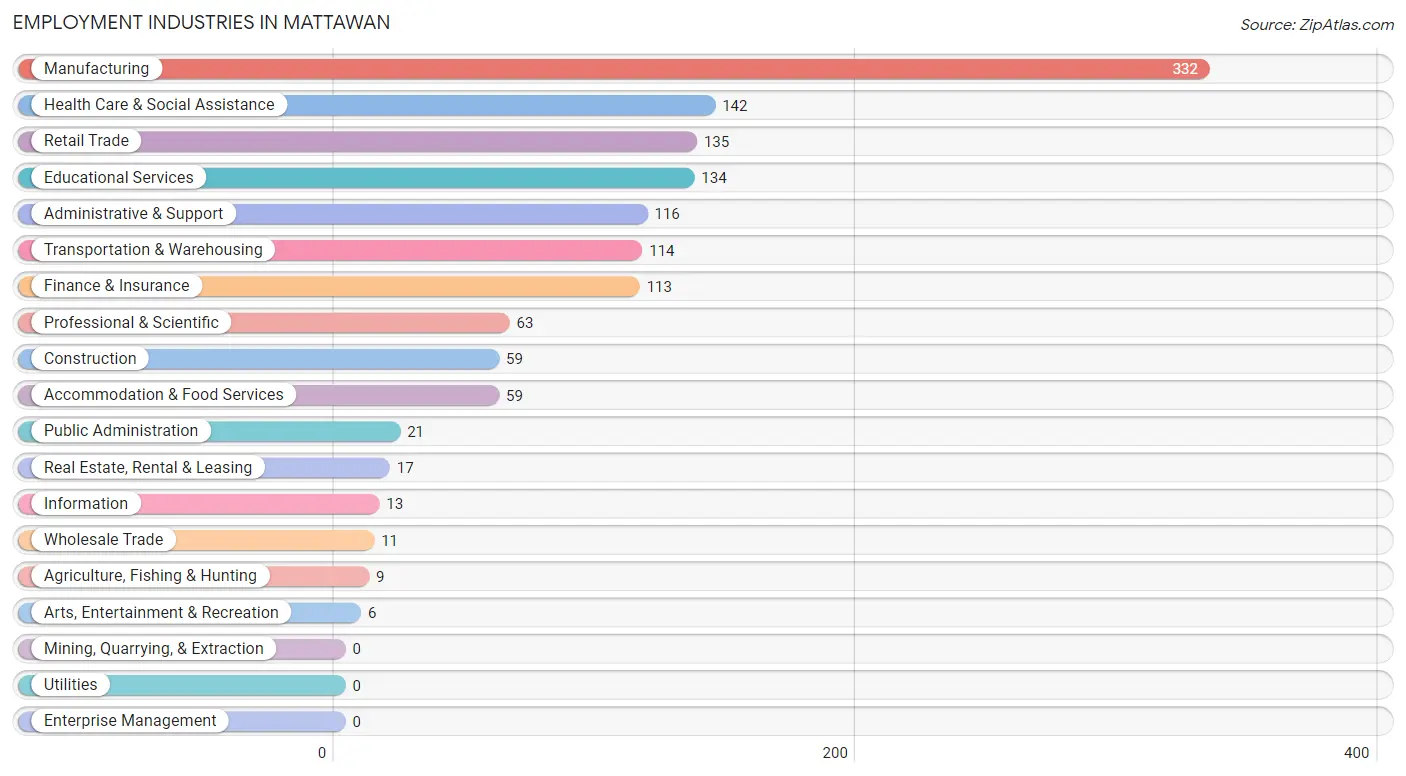
Employment Industries in Mattawan
The major employment industries in Mattawan include Manufacturing (332 | 23.9%), Health Care & Social Assistance (142 | 10.2%), Retail Trade (135 | 9.7%), Educational Services (134 | 9.6%), and Administrative & Support (116 | 8.4%).
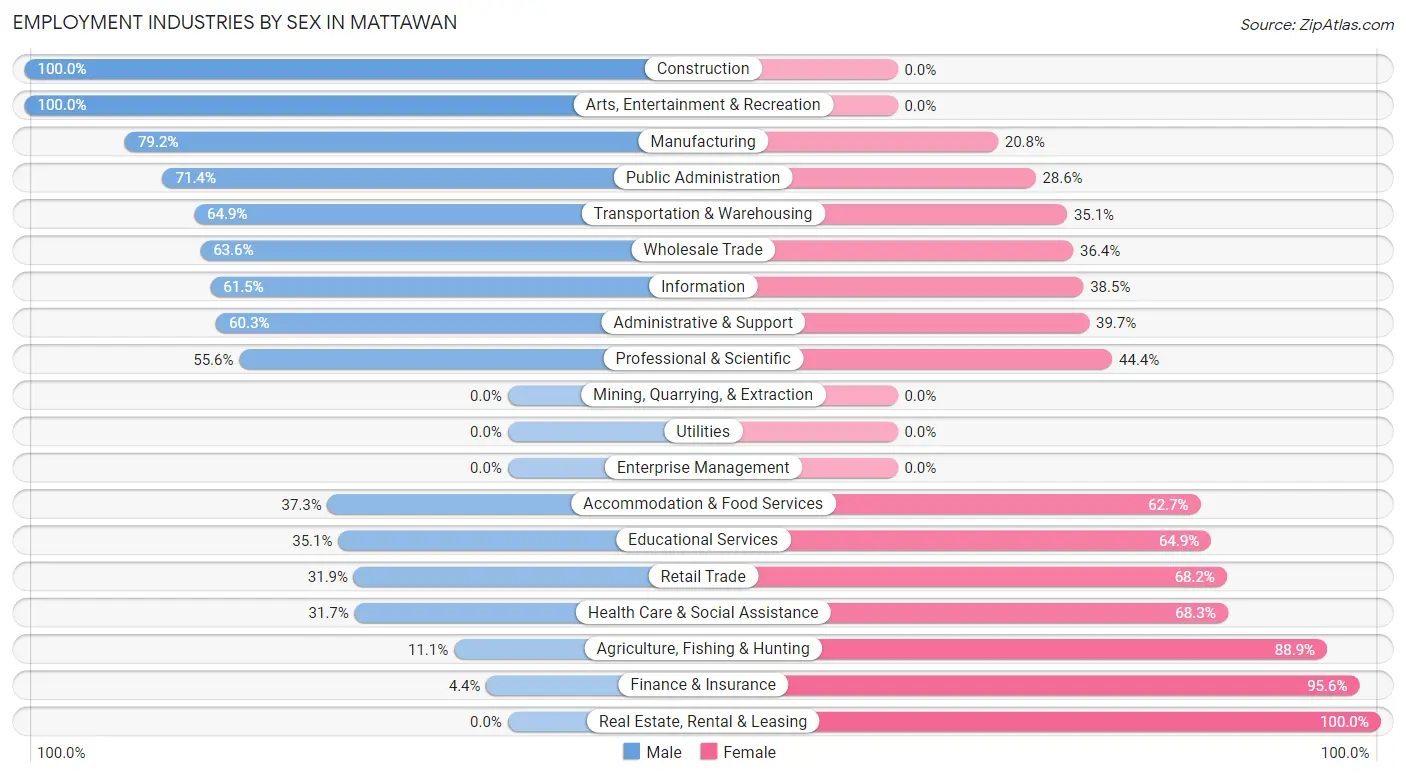
Employment Industries by Sex in Mattawan
The Mattawan industries that see more men than women are Construction (100.0%), Arts, Entertainment & Recreation (100.0%), and Manufacturing (79.2%), whereas the industries that tend to have a higher number of women are Real Estate, Rental & Leasing (100.0%), Finance & Insurance (95.6%), and Agriculture, Fishing & Hunting (88.9%).
| Industry | Male | Female |
| Agriculture, Fishing & Hunting | 1 (11.1%) | 8 (88.9%) |
| Mining, Quarrying, & Extraction | 0 (0.0%) | 0 (0.0%) |
| Construction | 59 (100.0%) | 0 (0.0%) |
| Manufacturing | 263 (79.2%) | 69 (20.8%) |
| Wholesale Trade | 7 (63.6%) | 4 (36.4%) |
| Retail Trade | 43 (31.9%) | 92 (68.1%) |
| Transportation & Warehousing | 74 (64.9%) | 40 (35.1%) |
| Utilities | 0 (0.0%) | 0 (0.0%) |
| Information | 8 (61.5%) | 5 (38.5%) |
| Finance & Insurance | 5 (4.4%) | 108 (95.6%) |
| Real Estate, Rental & Leasing | 0 (0.0%) | 17 (100.0%) |
| Professional & Scientific | 35 (55.6%) | 28 (44.4%) |
| Enterprise Management | 0 (0.0%) | 0 (0.0%) |
| Administrative & Support | 70 (60.3%) | 46 (39.7%) |
| Educational Services | 47 (35.1%) | 87 (64.9%) |
| Health Care & Social Assistance | 45 (31.7%) | 97 (68.3%) |
| Arts, Entertainment & Recreation | 6 (100.0%) | 0 (0.0%) |
| Accommodation & Food Services | 22 (37.3%) | 37 (62.7%) |
| Public Administration | 15 (71.4%) | 6 (28.6%) |
| Total | 715 (51.4%) | 675 (48.6%) |
Education in Mattawan
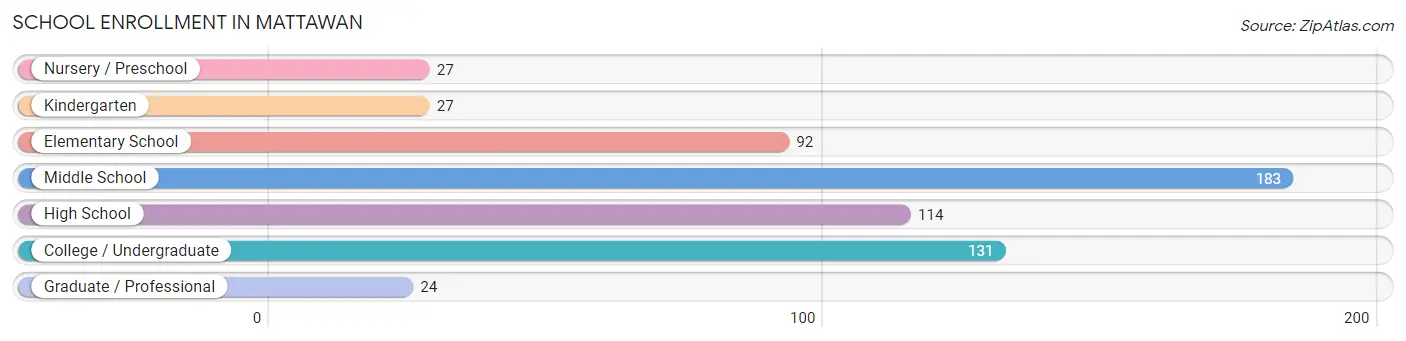
School Enrollment in Mattawan
The most common levels of schooling among the 598 students in Mattawan are middle school (183 | 30.6%), college / undergraduate (131 | 21.9%), and high school (114 | 19.1%).
| School Level | # Students | % Students |
| Nursery / Preschool | 27 | 4.5% |
| Kindergarten | 27 | 4.5% |
| Elementary School | 92 | 15.4% |
| Middle School | 183 | 30.6% |
| High School | 114 | 19.1% |
| College / Undergraduate | 131 | 21.9% |
| Graduate / Professional | 24 | 4.0% |
| Total | 598 | 100.0% |
School Enrollment by Age by Funding Source in Mattawan
Out of a total of 598 students who are enrolled in schools in Mattawan, 31 (5.2%) attend a private institution, while the remaining 567 (94.8%) are enrolled in public schools. The age group of 3 to 4 year olds has the highest likelihood of being enrolled in private schools, with 10 (58.8% in the age bracket) enrolled. Conversely, the age group of 15 to 17 year olds has the lowest likelihood of being enrolled in a private school, with 87 (100.0% in the age bracket) attending a public institution.
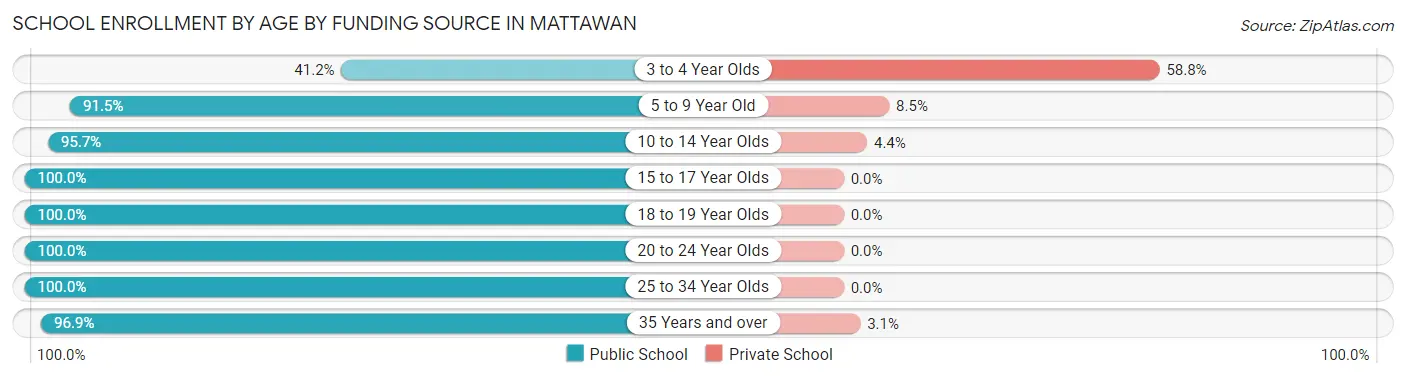
| Age Bracket | Public School | Private School |
| 3 to 4 Year Olds | 7 (41.2%) | 10 (58.8%) |
| 5 to 9 Year Old | 108 (91.5%) | 10 (8.5%) |
| 10 to 14 Year Olds | 198 (95.7%) | 9 (4.3%) |
| 15 to 17 Year Olds | 87 (100.0%) | 0 (0.0%) |
| 18 to 19 Year Olds | 16 (100.0%) | 0 (0.0%) |
| 20 to 24 Year Olds | 23 (100.0%) | 0 (0.0%) |
| 25 to 34 Year Olds | 65 (100.0%) | 0 (0.0%) |
| 35 Years and over | 63 (96.9%) | 2 (3.1%) |
| Total | 567 (94.8%) | 31 (5.2%) |
Educational Attainment by Field of Study in Mattawan
Business (80 | 20.2%), education (77 | 19.4%), bio, nature & agricultural (49 | 12.4%), arts & humanities (33 | 8.3%), and engineering (29 | 7.3%) are the most common fields of study among 396 individuals in Mattawan who have obtained a bachelor's degree or higher.
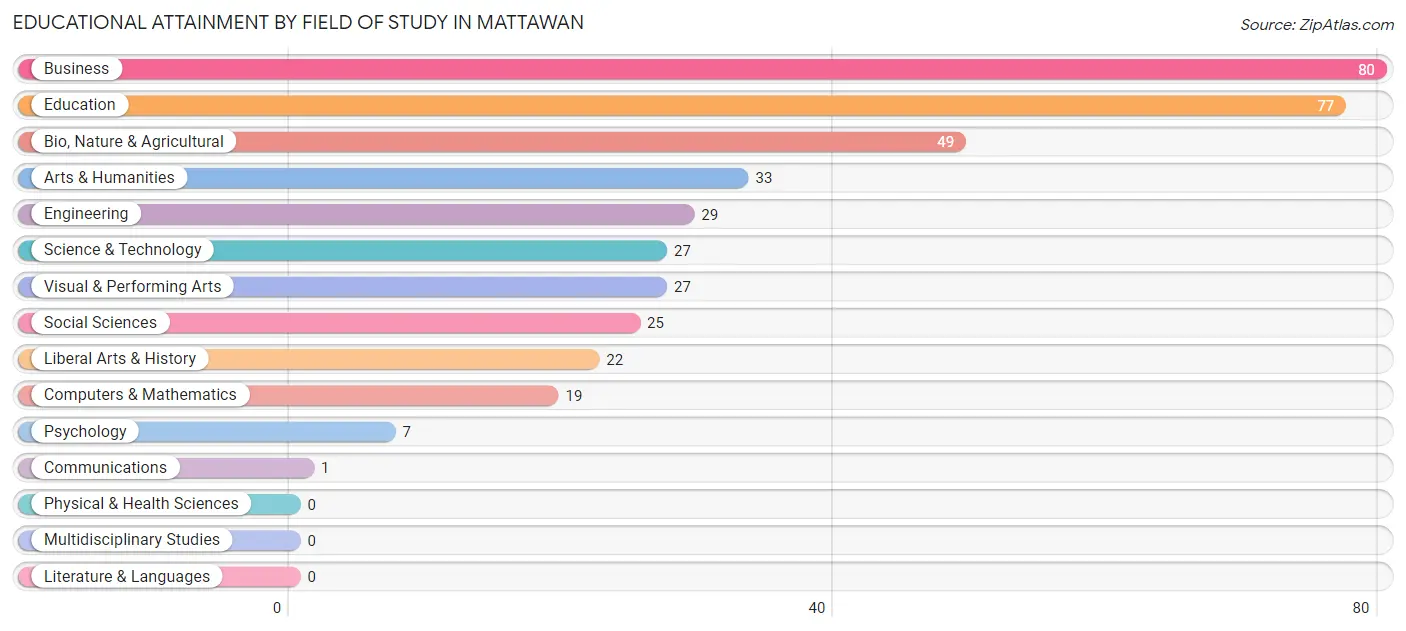
| Field of Study | # Graduates | % Graduates |
| Computers & Mathematics | 19 | 4.8% |
| Bio, Nature & Agricultural | 49 | 12.4% |
| Physical & Health Sciences | 0 | 0.0% |
| Psychology | 7 | 1.8% |
| Social Sciences | 25 | 6.3% |
| Engineering | 29 | 7.3% |
| Multidisciplinary Studies | 0 | 0.0% |
| Science & Technology | 27 | 6.8% |
| Business | 80 | 20.2% |
| Education | 77 | 19.4% |
| Literature & Languages | 0 | 0.0% |
| Liberal Arts & History | 22 | 5.6% |
| Visual & Performing Arts | 27 | 6.8% |
| Communications | 1 | 0.3% |
| Arts & Humanities | 33 | 8.3% |
| Total | 396 | 100.0% |
Transportation & Commute in Mattawan
Vehicle Availability by Sex in Mattawan
The most prevalent vehicle ownership categories in Mattawan are males with 2 vehicles (395, accounting for 55.2%) and females with 2 vehicles (293, making up 59.6%).
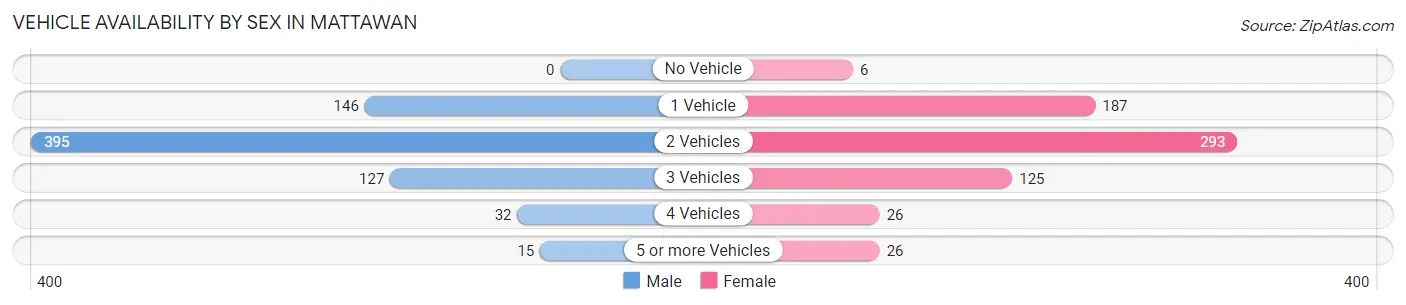
| Vehicles Available | Male | Female |
| No Vehicle | 0 (0.0%) | 6 (0.9%) |
| 1 Vehicle | 146 (20.4%) | 187 (28.2%) |
| 2 Vehicles | 395 (55.2%) | 293 (44.2%) |
| 3 Vehicles | 127 (17.8%) | 125 (18.9%) |
| 4 Vehicles | 32 (4.5%) | 26 (3.9%) |
| 5 or more Vehicles | 15 (2.1%) | 26 (3.9%) |
| Total | 715 (100.0%) | 663 (100.0%) |
Commute Time in Mattawan
The most frequently occuring commute durations in Mattawan are 15 to 19 minutes (212 commuters, 17.2%), 5 to 9 minutes (205 commuters, 16.7%), and 30 to 34 minutes (170 commuters, 13.8%).
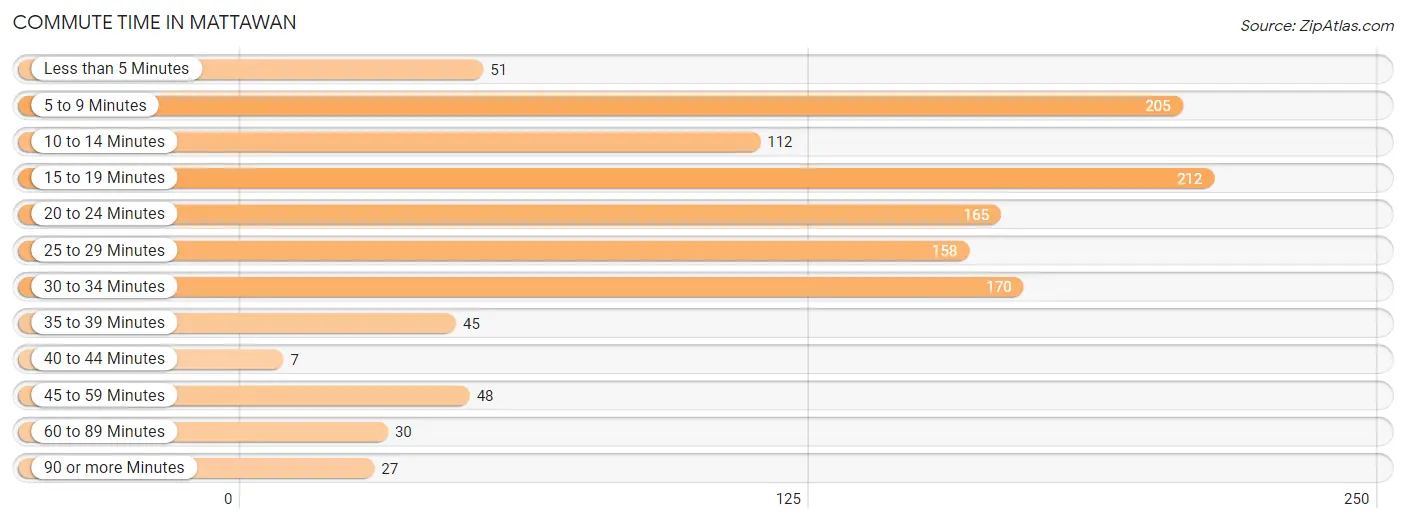
| Commute Time | # Commuters | % Commuters |
| Less than 5 Minutes | 51 | 4.2% |
| 5 to 9 Minutes | 205 | 16.7% |
| 10 to 14 Minutes | 112 | 9.1% |
| 15 to 19 Minutes | 212 | 17.2% |
| 20 to 24 Minutes | 165 | 13.4% |
| 25 to 29 Minutes | 158 | 12.9% |
| 30 to 34 Minutes | 170 | 13.8% |
| 35 to 39 Minutes | 45 | 3.7% |
| 40 to 44 Minutes | 7 | 0.6% |
| 45 to 59 Minutes | 48 | 3.9% |
| 60 to 89 Minutes | 30 | 2.4% |
| 90 or more Minutes | 27 | 2.2% |
Commute Time by Sex in Mattawan
The most common commute times in Mattawan are 15 to 19 minutes (144 commuters, 20.5%) for males and 5 to 9 minutes (113 commuters, 21.4%) for females.
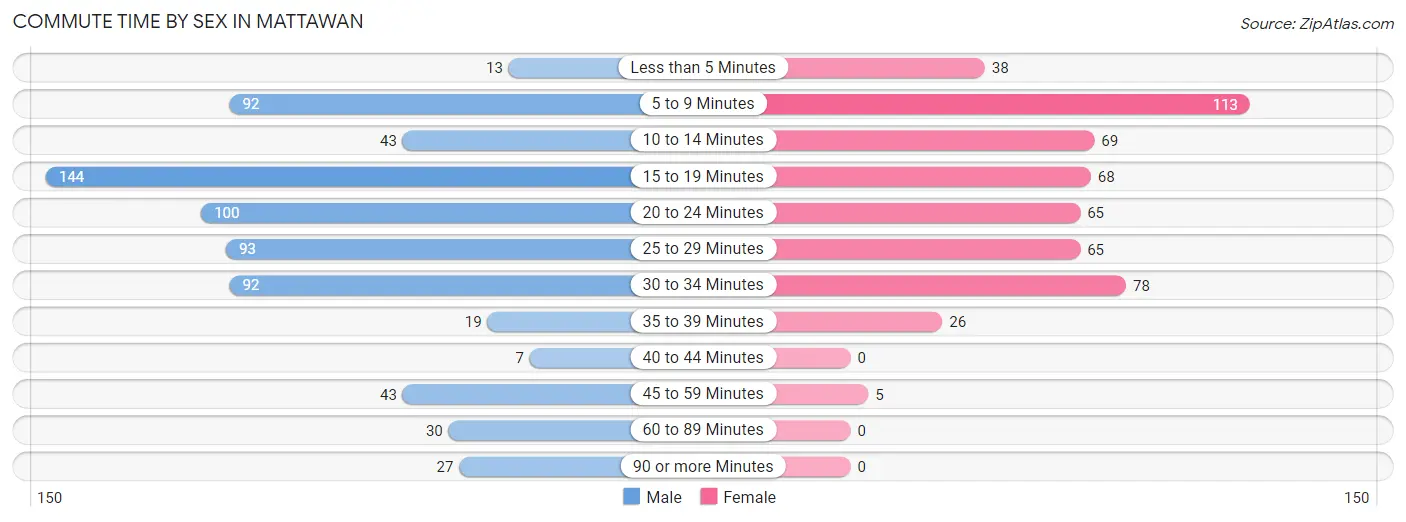
| Commute Time | Male | Female |
| Less than 5 Minutes | 13 (1.8%) | 38 (7.2%) |
| 5 to 9 Minutes | 92 (13.1%) | 113 (21.4%) |
| 10 to 14 Minutes | 43 (6.1%) | 69 (13.1%) |
| 15 to 19 Minutes | 144 (20.5%) | 68 (12.9%) |
| 20 to 24 Minutes | 100 (14.2%) | 65 (12.3%) |
| 25 to 29 Minutes | 93 (13.2%) | 65 (12.3%) |
| 30 to 34 Minutes | 92 (13.1%) | 78 (14.8%) |
| 35 to 39 Minutes | 19 (2.7%) | 26 (4.9%) |
| 40 to 44 Minutes | 7 (1.0%) | 0 (0.0%) |
| 45 to 59 Minutes | 43 (6.1%) | 5 (0.9%) |
| 60 to 89 Minutes | 30 (4.3%) | 0 (0.0%) |
| 90 or more Minutes | 27 (3.8%) | 0 (0.0%) |
Time of Departure to Work by Sex in Mattawan
The most frequent times of departure to work in Mattawan are 4:00 PM to 11:59 PM (158, 22.5%) for males and 8:00 AM to 8:29 AM (118, 22.4%) for females.
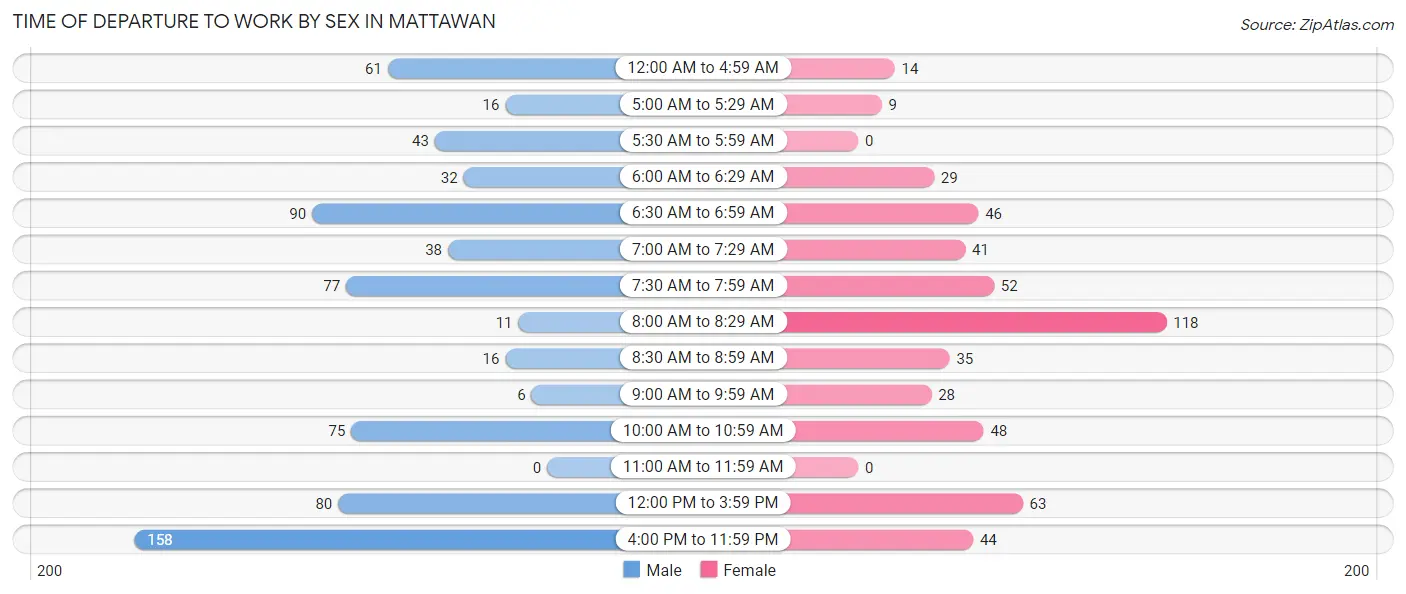
| Time of Departure | Male | Female |
| 12:00 AM to 4:59 AM | 61 (8.7%) | 14 (2.7%) |
| 5:00 AM to 5:29 AM | 16 (2.3%) | 9 (1.7%) |
| 5:30 AM to 5:59 AM | 43 (6.1%) | 0 (0.0%) |
| 6:00 AM to 6:29 AM | 32 (4.5%) | 29 (5.5%) |
| 6:30 AM to 6:59 AM | 90 (12.8%) | 46 (8.7%) |
| 7:00 AM to 7:29 AM | 38 (5.4%) | 41 (7.8%) |
| 7:30 AM to 7:59 AM | 77 (11.0%) | 52 (9.9%) |
| 8:00 AM to 8:29 AM | 11 (1.6%) | 118 (22.4%) |
| 8:30 AM to 8:59 AM | 16 (2.3%) | 35 (6.6%) |
| 9:00 AM to 9:59 AM | 6 (0.9%) | 28 (5.3%) |
| 10:00 AM to 10:59 AM | 75 (10.7%) | 48 (9.1%) |
| 11:00 AM to 11:59 AM | 0 (0.0%) | 0 (0.0%) |
| 12:00 PM to 3:59 PM | 80 (11.4%) | 63 (11.9%) |
| 4:00 PM to 11:59 PM | 158 (22.5%) | 44 (8.4%) |
| Total | 703 (100.0%) | 527 (100.0%) |
Housing Occupancy in Mattawan
Occupancy by Ownership in Mattawan
Of the total 1,021 dwellings in Mattawan, owner-occupied units account for 756 (74.1%), while renter-occupied units make up 265 (26.0%).
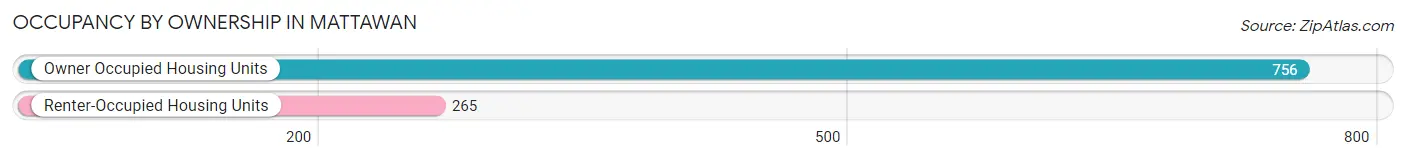
| Occupancy | # Housing Units | % Housing Units |
| Owner Occupied Housing Units | 756 | 74.1% |
| Renter-Occupied Housing Units | 265 | 26.0% |
| Total Occupied Housing Units | 1,021 | 100.0% |
Occupancy by Household Size in Mattawan
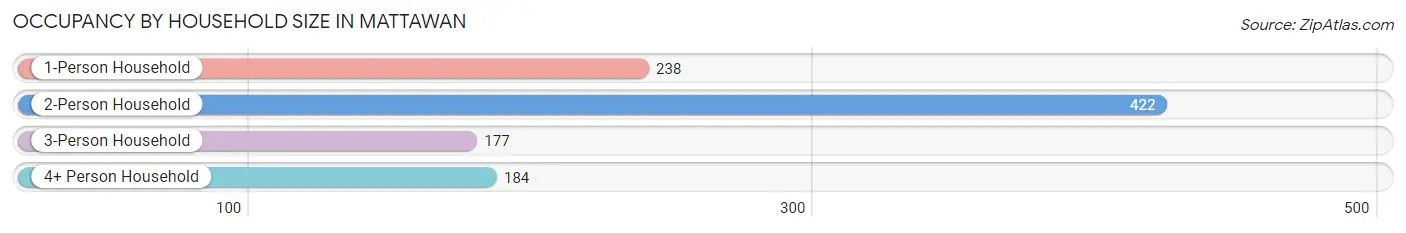
| Household Size | # Housing Units | % Housing Units |
| 1-Person Household | 238 | 23.3% |
| 2-Person Household | 422 | 41.3% |
| 3-Person Household | 177 | 17.3% |
| 4+ Person Household | 184 | 18.0% |
| Total Housing Units | 1,021 | 100.0% |
Occupancy by Ownership by Household Size in Mattawan
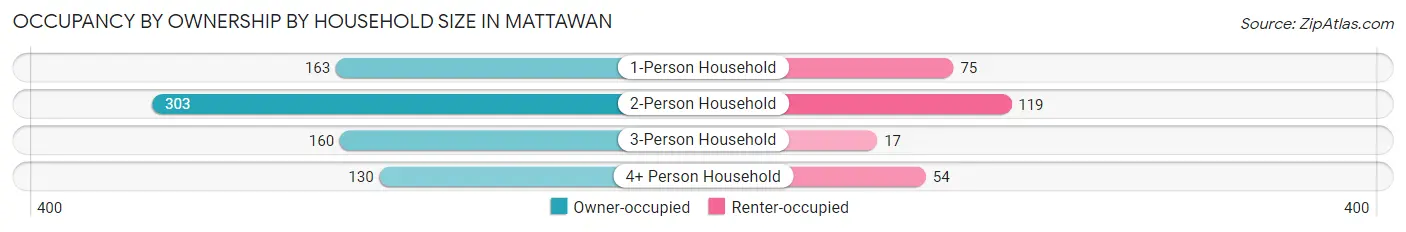
| Household Size | Owner-occupied | Renter-occupied |
| 1-Person Household | 163 (68.5%) | 75 (31.5%) |
| 2-Person Household | 303 (71.8%) | 119 (28.2%) |
| 3-Person Household | 160 (90.4%) | 17 (9.6%) |
| 4+ Person Household | 130 (70.7%) | 54 (29.3%) |
| Total Housing Units | 756 (74.1%) | 265 (26.0%) |
Occupancy by Educational Attainment in Mattawan
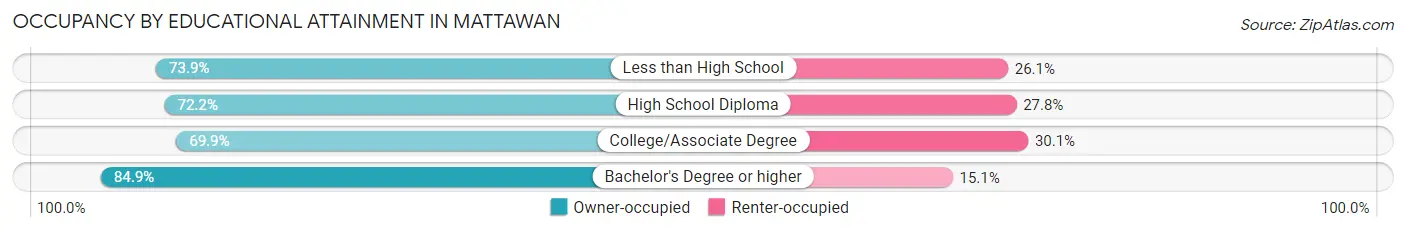
| Household Size | Owner-occupied | Renter-occupied |
| Less than High School | 34 (73.9%) | 12 (26.1%) |
| High School Diploma | 242 (72.2%) | 93 (27.8%) |
| College/Associate Degree | 295 (69.9%) | 127 (30.1%) |
| Bachelor's Degree or higher | 185 (84.9%) | 33 (15.1%) |
Occupancy by Age of Householder in Mattawan
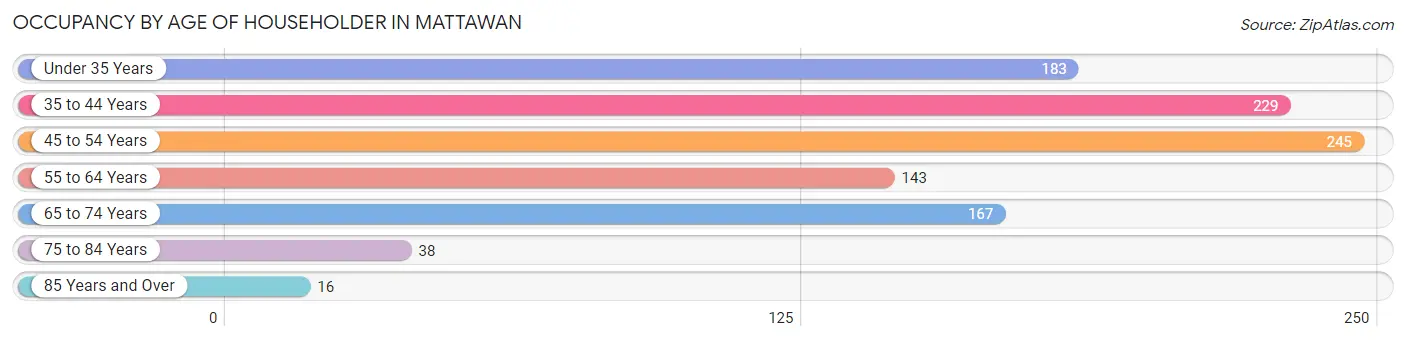
| Age Bracket | # Households | % Households |
| Under 35 Years | 183 | 17.9% |
| 35 to 44 Years | 229 | 22.4% |
| 45 to 54 Years | 245 | 24.0% |
| 55 to 64 Years | 143 | 14.0% |
| 65 to 74 Years | 167 | 16.4% |
| 75 to 84 Years | 38 | 3.7% |
| 85 Years and Over | 16 | 1.6% |
| Total | 1,021 | 100.0% |
Housing Finances in Mattawan
Median Income by Occupancy in Mattawan
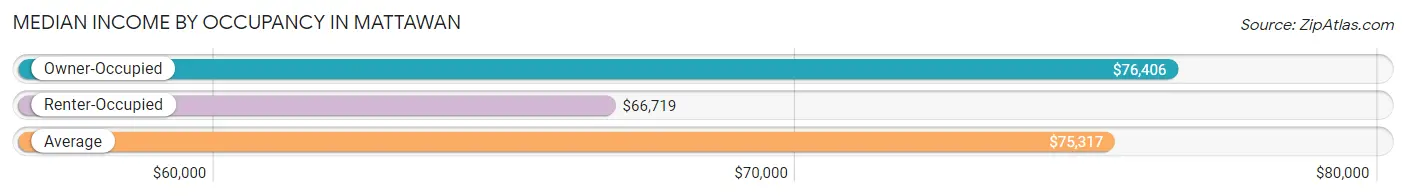
| Occupancy Type | # Households | Median Income |
| Owner-Occupied | 756 (74.1%) | $76,406 |
| Renter-Occupied | 265 (26.0%) | $66,719 |
| Average | 1,021 (100.0%) | $75,317 |
Occupancy by Householder Income Bracket in Mattawan
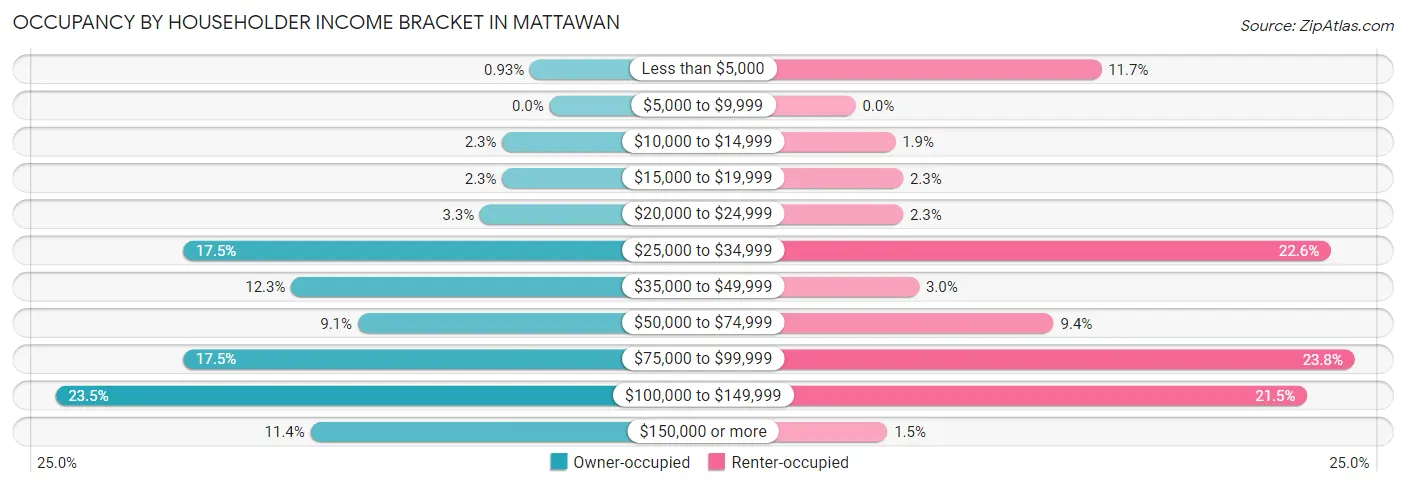
| Income Bracket | Owner-occupied | Renter-occupied |
| Less than $5,000 | 7 (0.9%) | 31 (11.7%) |
| $5,000 to $9,999 | 0 (0.0%) | 0 (0.0%) |
| $10,000 to $14,999 | 17 (2.2%) | 5 (1.9%) |
| $15,000 to $19,999 | 17 (2.2%) | 6 (2.3%) |
| $20,000 to $24,999 | 25 (3.3%) | 6 (2.3%) |
| $25,000 to $34,999 | 132 (17.5%) | 60 (22.6%) |
| $35,000 to $49,999 | 93 (12.3%) | 8 (3.0%) |
| $50,000 to $74,999 | 69 (9.1%) | 25 (9.4%) |
| $75,000 to $99,999 | 132 (17.5%) | 63 (23.8%) |
| $100,000 to $149,999 | 178 (23.5%) | 57 (21.5%) |
| $150,000 or more | 86 (11.4%) | 4 (1.5%) |
| Total | 756 (100.0%) | 265 (100.0%) |
Monthly Housing Cost Tiers in Mattawan
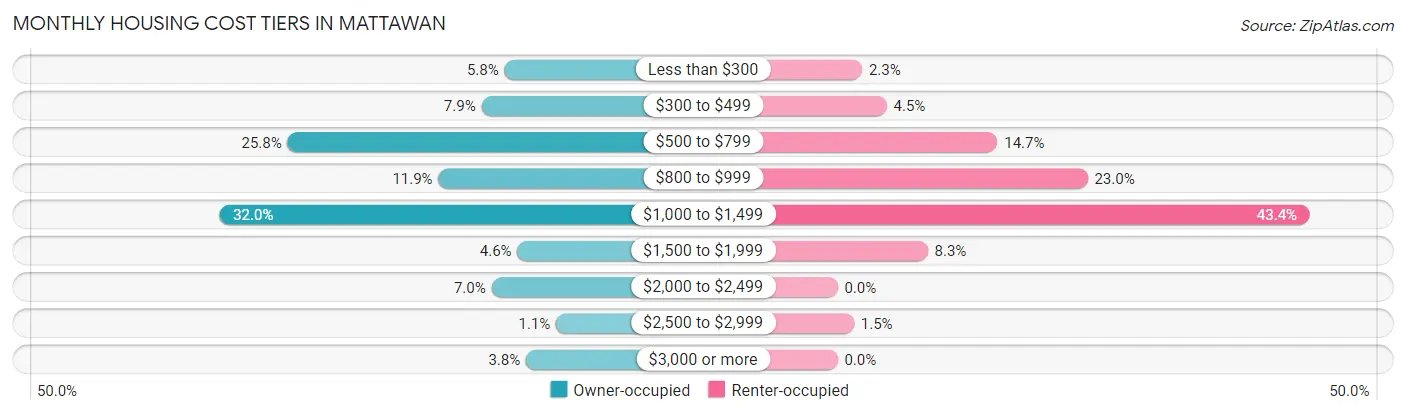
| Monthly Cost | Owner-occupied | Renter-occupied |
| Less than $300 | 44 (5.8%) | 6 (2.3%) |
| $300 to $499 | 60 (7.9%) | 12 (4.5%) |
| $500 to $799 | 195 (25.8%) | 39 (14.7%) |
| $800 to $999 | 90 (11.9%) | 61 (23.0%) |
| $1,000 to $1,499 | 242 (32.0%) | 115 (43.4%) |
| $1,500 to $1,999 | 35 (4.6%) | 22 (8.3%) |
| $2,000 to $2,499 | 53 (7.0%) | 0 (0.0%) |
| $2,500 to $2,999 | 8 (1.1%) | 4 (1.5%) |
| $3,000 or more | 29 (3.8%) | 0 (0.0%) |
| Total | 756 (100.0%) | 265 (100.0%) |
Physical Housing Characteristics in Mattawan
Housing Structures in Mattawan
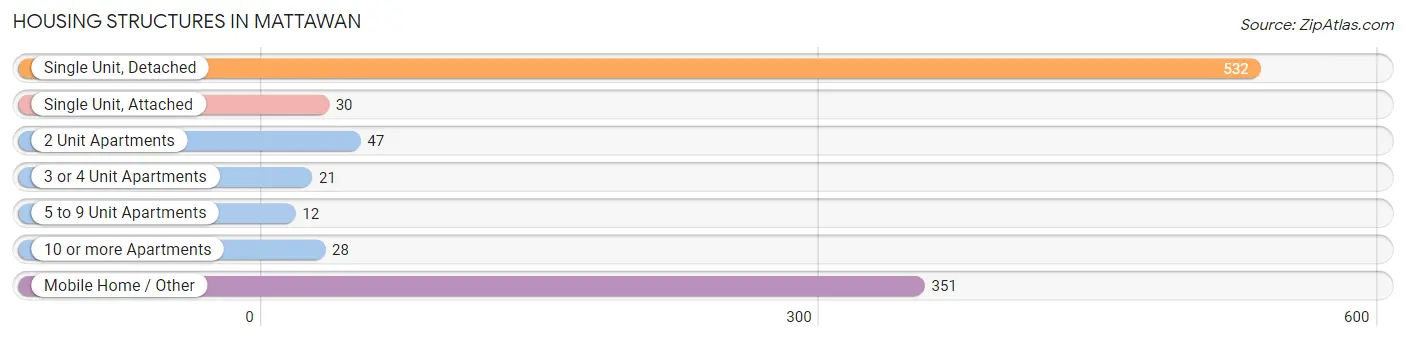
| Structure Type | # Housing Units | % Housing Units |
| Single Unit, Detached | 532 | 52.1% |
| Single Unit, Attached | 30 | 2.9% |
| 2 Unit Apartments | 47 | 4.6% |
| 3 or 4 Unit Apartments | 21 | 2.1% |
| 5 to 9 Unit Apartments | 12 | 1.2% |
| 10 or more Apartments | 28 | 2.7% |
| Mobile Home / Other | 351 | 34.4% |
| Total | 1,021 | 100.0% |
Housing Structures by Occupancy in Mattawan
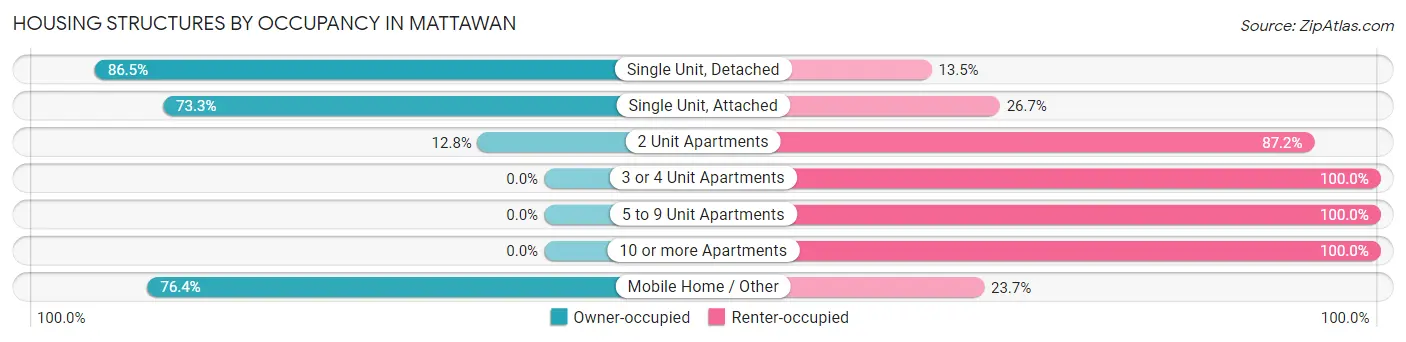
| Structure Type | Owner-occupied | Renter-occupied |
| Single Unit, Detached | 460 (86.5%) | 72 (13.5%) |
| Single Unit, Attached | 22 (73.3%) | 8 (26.7%) |
| 2 Unit Apartments | 6 (12.8%) | 41 (87.2%) |
| 3 or 4 Unit Apartments | 0 (0.0%) | 21 (100.0%) |
| 5 to 9 Unit Apartments | 0 (0.0%) | 12 (100.0%) |
| 10 or more Apartments | 0 (0.0%) | 28 (100.0%) |
| Mobile Home / Other | 268 (76.3%) | 83 (23.6%) |
| Total | 756 (74.1%) | 265 (26.0%) |
Housing Structures by Number of Rooms in Mattawan
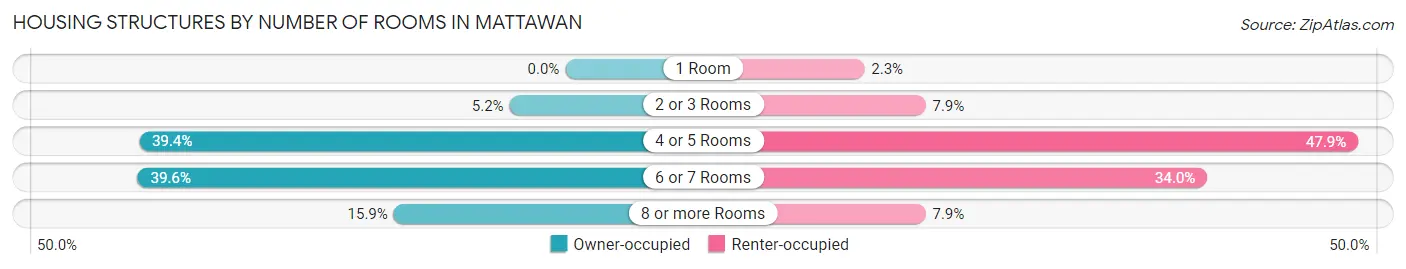
| Number of Rooms | Owner-occupied | Renter-occupied |
| 1 Room | 0 (0.0%) | 6 (2.3%) |
| 2 or 3 Rooms | 39 (5.2%) | 21 (7.9%) |
| 4 or 5 Rooms | 298 (39.4%) | 127 (47.9%) |
| 6 or 7 Rooms | 299 (39.6%) | 90 (34.0%) |
| 8 or more Rooms | 120 (15.9%) | 21 (7.9%) |
| Total | 756 (100.0%) | 265 (100.0%) |
Housing Structure by Heating Type in Mattawan
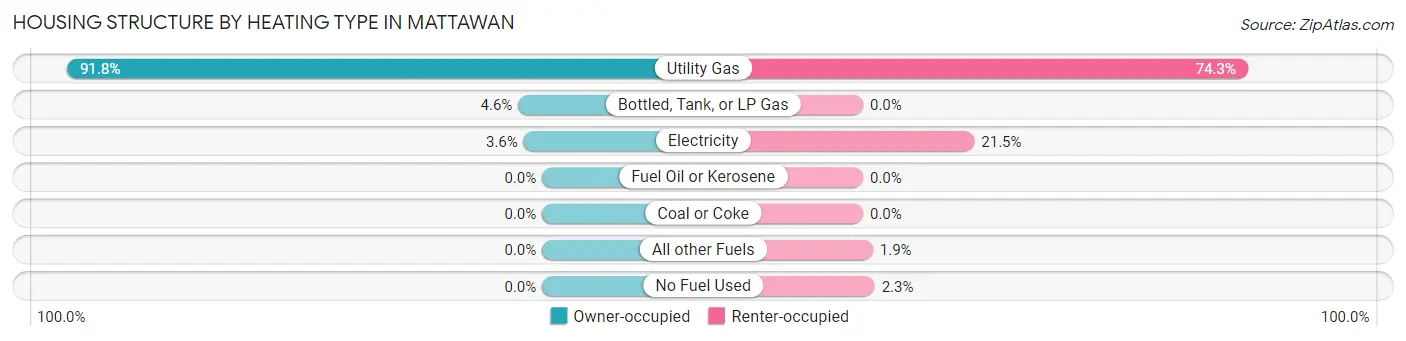
| Heating Type | Owner-occupied | Renter-occupied |
| Utility Gas | 694 (91.8%) | 197 (74.3%) |
| Bottled, Tank, or LP Gas | 35 (4.6%) | 0 (0.0%) |
| Electricity | 27 (3.6%) | 57 (21.5%) |
| Fuel Oil or Kerosene | 0 (0.0%) | 0 (0.0%) |
| Coal or Coke | 0 (0.0%) | 0 (0.0%) |
| All other Fuels | 0 (0.0%) | 5 (1.9%) |
| No Fuel Used | 0 (0.0%) | 6 (2.3%) |
| Total | 756 (100.0%) | 265 (100.0%) |
Household Vehicle Usage in Mattawan
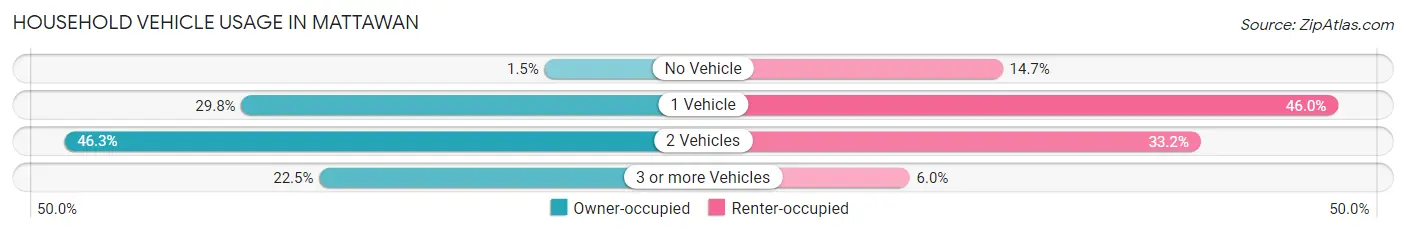
| Vehicles per Household | Owner-occupied | Renter-occupied |
| No Vehicle | 11 (1.5%) | 39 (14.7%) |
| 1 Vehicle | 225 (29.8%) | 122 (46.0%) |
| 2 Vehicles | 350 (46.3%) | 88 (33.2%) |
| 3 or more Vehicles | 170 (22.5%) | 16 (6.0%) |
| Total | 756 (100.0%) | 265 (100.0%) |
Real Estate & Mortgages in Mattawan
Real Estate and Mortgage Overview in Mattawan
| Characteristic | Without Mortgage | With Mortgage |
| Housing Units | 307 | 449 |
| Median Property Value | - | - |
| Median Household Income | $46,719 | $74 |
| Monthly Housing Costs | $672 | $29 |
| Real Estate Taxes | $2,012 | $45 |
Property Value by Mortgage Status in Mattawan
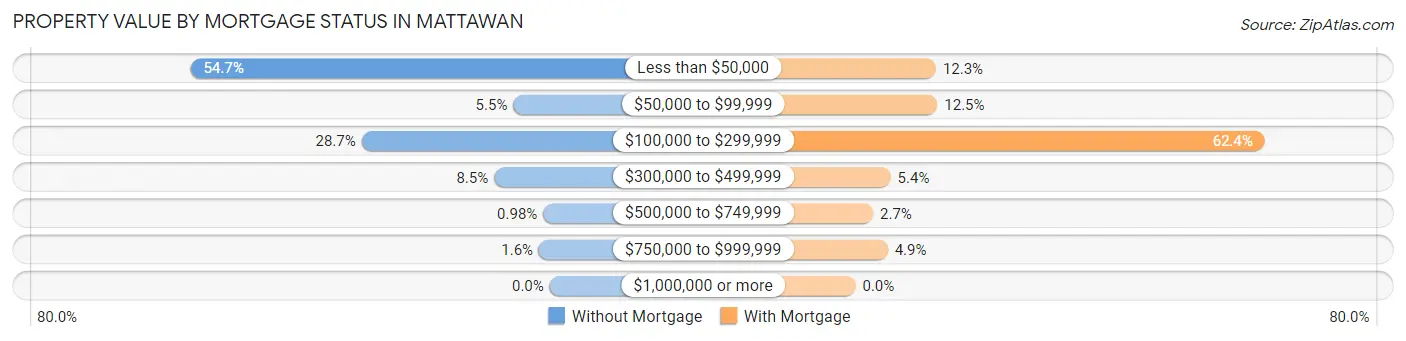
| Property Value | Without Mortgage | With Mortgage |
| Less than $50,000 | 168 (54.7%) | 55 (12.2%) |
| $50,000 to $99,999 | 17 (5.5%) | 56 (12.5%) |
| $100,000 to $299,999 | 88 (28.7%) | 280 (62.4%) |
| $300,000 to $499,999 | 26 (8.5%) | 24 (5.3%) |
| $500,000 to $749,999 | 3 (1.0%) | 12 (2.7%) |
| $750,000 to $999,999 | 5 (1.6%) | 22 (4.9%) |
| $1,000,000 or more | 0 (0.0%) | 0 (0.0%) |
| Total | 307 (100.0%) | 449 (100.0%) |
Household Income by Mortgage Status in Mattawan
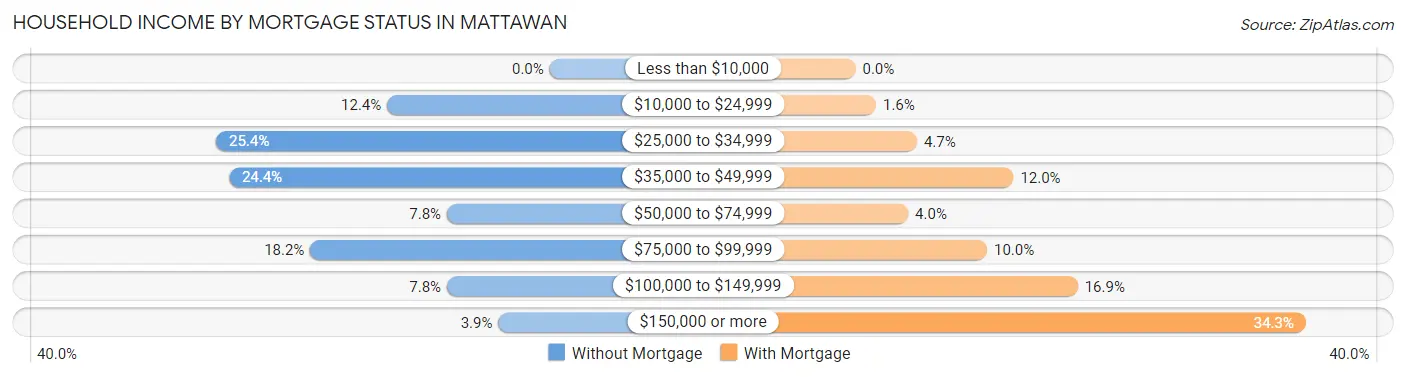
| Household Income | Without Mortgage | With Mortgage |
| Less than $10,000 | 0 (0.0%) | 0 (0.0%) |
| $10,000 to $24,999 | 38 (12.4%) | 7 (1.6%) |
| $25,000 to $34,999 | 78 (25.4%) | 21 (4.7%) |
| $35,000 to $49,999 | 75 (24.4%) | 54 (12.0%) |
| $50,000 to $74,999 | 24 (7.8%) | 18 (4.0%) |
| $75,000 to $99,999 | 56 (18.2%) | 45 (10.0%) |
| $100,000 to $149,999 | 24 (7.8%) | 76 (16.9%) |
| $150,000 or more | 12 (3.9%) | 154 (34.3%) |
| Total | 307 (100.0%) | 449 (100.0%) |
Property Value to Household Income Ratio in Mattawan
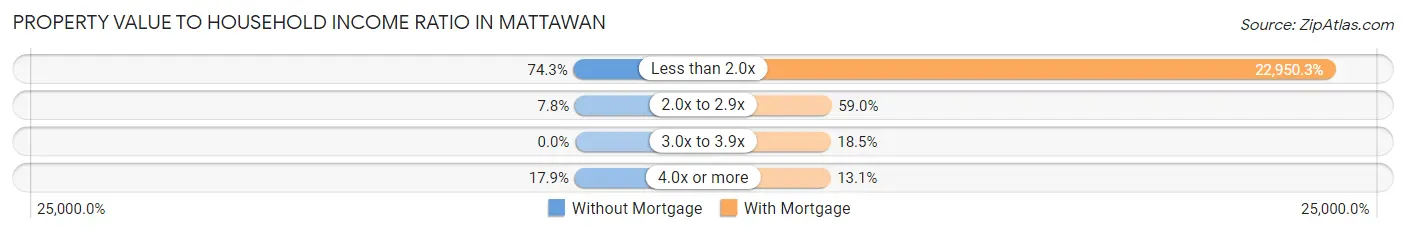
| Value-to-Income Ratio | Without Mortgage | With Mortgage |
| Less than 2.0x | 228 (74.3%) | 103,047 (22,950.3%) |
| 2.0x to 2.9x | 24 (7.8%) | 265 (59.0%) |
| 3.0x to 3.9x | 0 (0.0%) | 83 (18.5%) |
| 4.0x or more | 55 (17.9%) | 59 (13.1%) |
| Total | 307 (100.0%) | 449 (100.0%) |
Real Estate Taxes by Mortgage Status in Mattawan
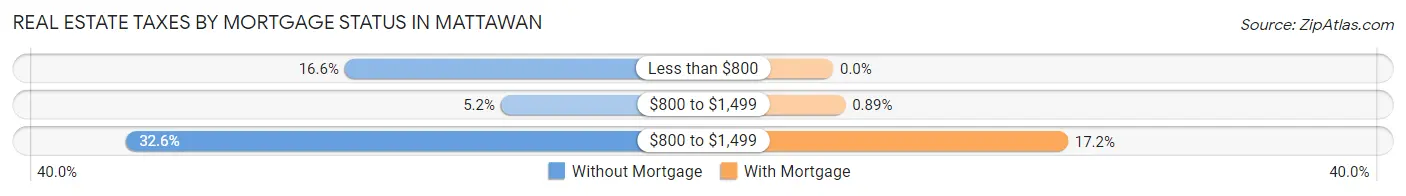
| Property Taxes | Without Mortgage | With Mortgage |
| Less than $800 | 51 (16.6%) | 0 (0.0%) |
| $800 to $1,499 | 16 (5.2%) | 4 (0.9%) |
| $800 to $1,499 | 100 (32.6%) | 77 (17.2%) |
| Total | 307 (100.0%) | 449 (100.0%) |
Health & Disability in Mattawan
Health Insurance Coverage by Age in Mattawan
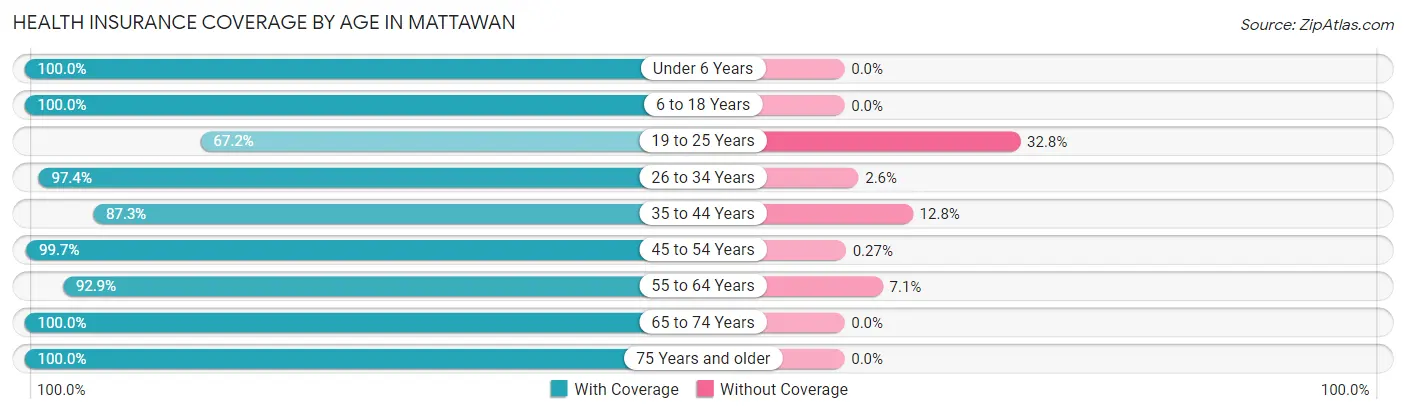
| Age Bracket | With Coverage | Without Coverage |
| Under 6 Years | 188 (100.0%) | 0 (0.0%) |
| 6 to 18 Years | 480 (100.0%) | 0 (0.0%) |
| 19 to 25 Years | 164 (67.2%) | 80 (32.8%) |
| 26 to 34 Years | 299 (97.4%) | 8 (2.6%) |
| 35 to 44 Years | 349 (87.3%) | 51 (12.8%) |
| 45 to 54 Years | 372 (99.7%) | 1 (0.3%) |
| 55 to 64 Years | 260 (92.9%) | 20 (7.1%) |
| 65 to 74 Years | 204 (100.0%) | 0 (0.0%) |
| 75 Years and older | 90 (100.0%) | 0 (0.0%) |
| Total | 2,406 (93.8%) | 160 (6.2%) |
Health Insurance Coverage by Citizenship Status in Mattawan
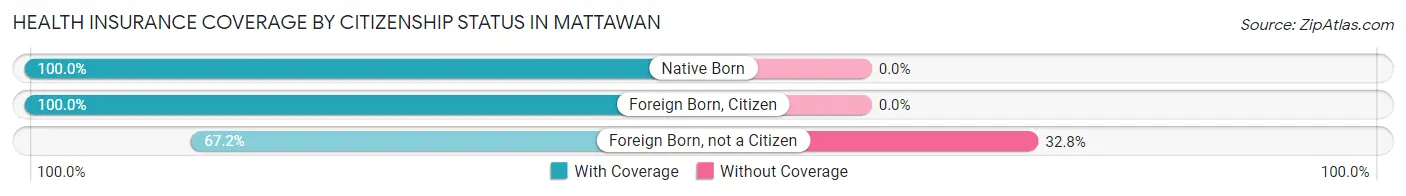
| Citizenship Status | With Coverage | Without Coverage |
| Native Born | 188 (100.0%) | 0 (0.0%) |
| Foreign Born, Citizen | 480 (100.0%) | 0 (0.0%) |
| Foreign Born, not a Citizen | 164 (67.2%) | 80 (32.8%) |
Health Insurance Coverage by Household Income in Mattawan
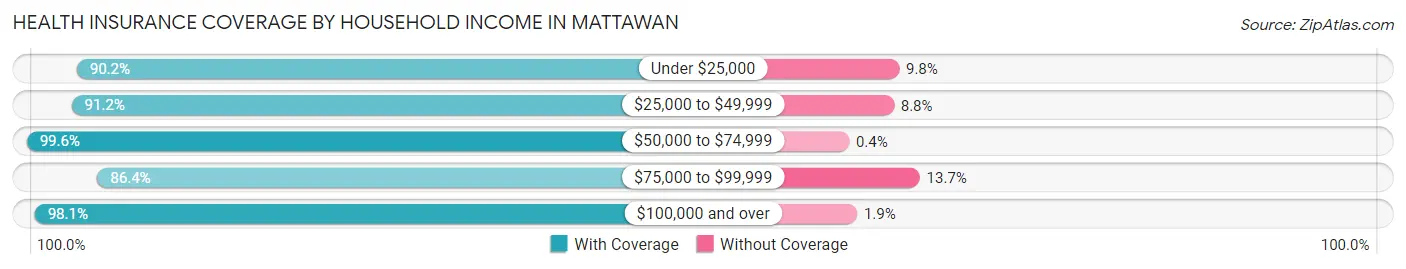
| Household Income | With Coverage | Without Coverage |
| Under $25,000 | 175 (90.2%) | 19 (9.8%) |
| $25,000 to $49,999 | 508 (91.2%) | 49 (8.8%) |
| $50,000 to $74,999 | 249 (99.6%) | 1 (0.4%) |
| $75,000 to $99,999 | 449 (86.4%) | 71 (13.7%) |
| $100,000 and over | 1,025 (98.1%) | 20 (1.9%) |
Public vs Private Health Insurance Coverage by Age in Mattawan
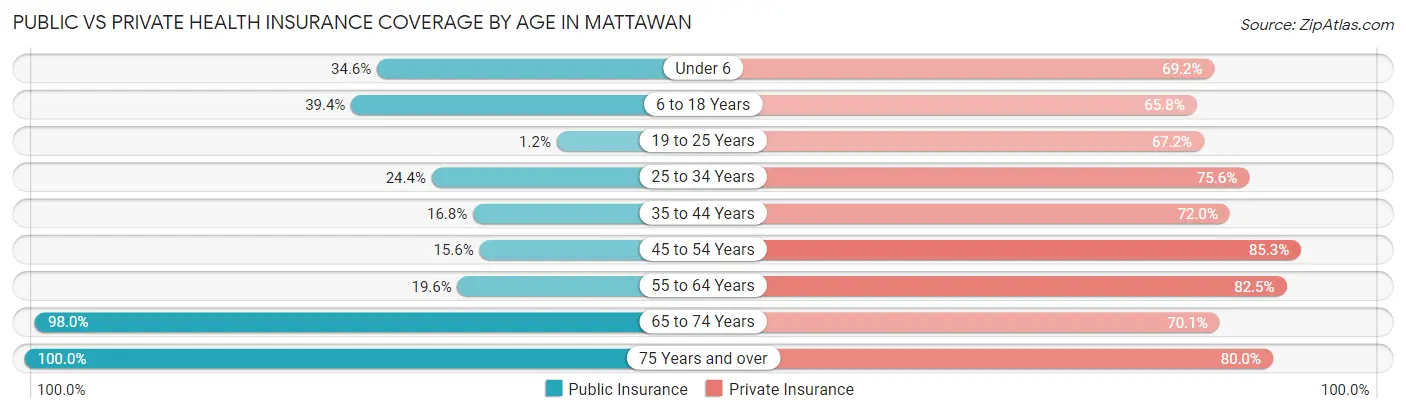
| Age Bracket | Public Insurance | Private Insurance |
| Under 6 | 65 (34.6%) | 130 (69.2%) |
| 6 to 18 Years | 189 (39.4%) | 316 (65.8%) |
| 19 to 25 Years | 3 (1.2%) | 164 (67.2%) |
| 25 to 34 Years | 75 (24.4%) | 232 (75.6%) |
| 35 to 44 Years | 67 (16.8%) | 288 (72.0%) |
| 45 to 54 Years | 58 (15.5%) | 318 (85.3%) |
| 55 to 64 Years | 55 (19.6%) | 231 (82.5%) |
| 65 to 74 Years | 200 (98.0%) | 143 (70.1%) |
| 75 Years and over | 90 (100.0%) | 72 (80.0%) |
| Total | 802 (31.2%) | 1,894 (73.8%) |
Disability Status by Sex by Age in Mattawan
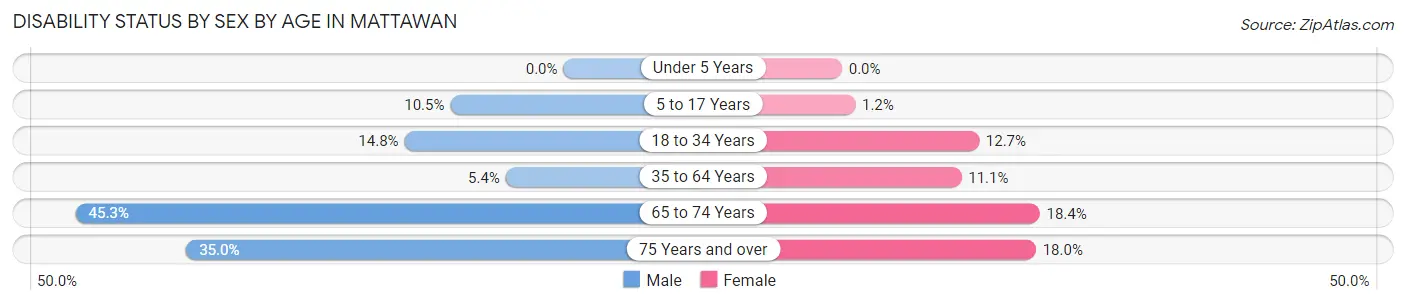
| Age Bracket | Male | Female |
| Under 5 Years | 0 (0.0%) | 0 (0.0%) |
| 5 to 17 Years | 28 (10.5%) | 3 (1.2%) |
| 18 to 34 Years | 50 (14.7%) | 29 (12.7%) |
| 35 to 64 Years | 25 (5.3%) | 65 (11.1%) |
| 65 to 74 Years | 43 (45.3%) | 20 (18.3%) |
| 75 Years and over | 14 (35.0%) | 9 (18.0%) |
Disability Class by Sex by Age in Mattawan
Disability Class: Hearing Difficulty
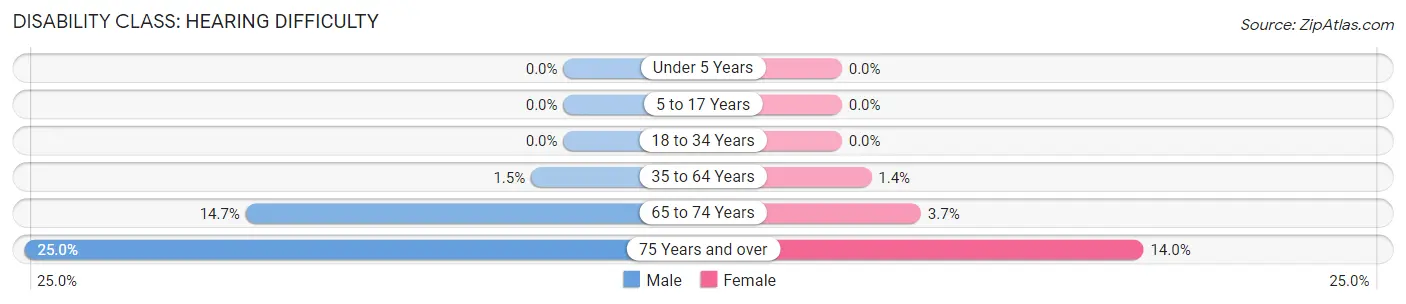
| Age Bracket | Male | Female |
| Under 5 Years | 0 (0.0%) | 0 (0.0%) |
| 5 to 17 Years | 0 (0.0%) | 0 (0.0%) |
| 18 to 34 Years | 0 (0.0%) | 0 (0.0%) |
| 35 to 64 Years | 7 (1.5%) | 8 (1.4%) |
| 65 to 74 Years | 14 (14.7%) | 4 (3.7%) |
| 75 Years and over | 10 (25.0%) | 7 (14.0%) |
Disability Class: Vision Difficulty
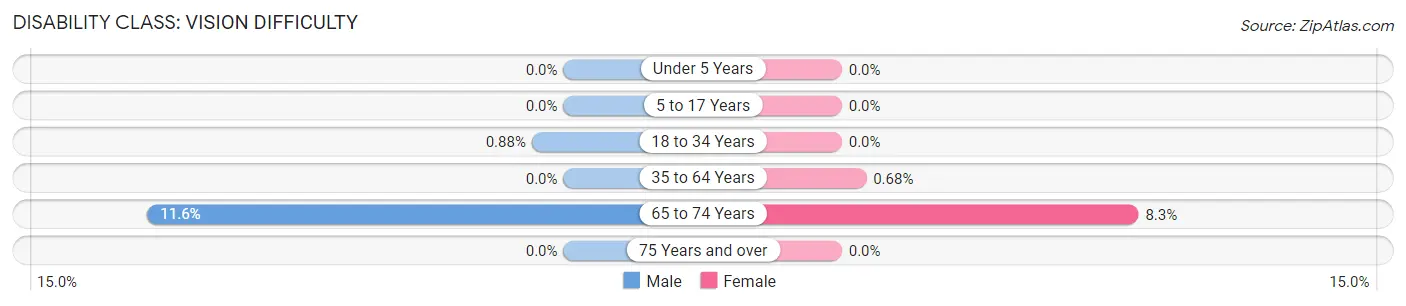
| Age Bracket | Male | Female |
| Under 5 Years | 0 (0.0%) | 0 (0.0%) |
| 5 to 17 Years | 0 (0.0%) | 0 (0.0%) |
| 18 to 34 Years | 3 (0.9%) | 0 (0.0%) |
| 35 to 64 Years | 0 (0.0%) | 4 (0.7%) |
| 65 to 74 Years | 11 (11.6%) | 9 (8.3%) |
| 75 Years and over | 0 (0.0%) | 0 (0.0%) |
Disability Class: Cognitive Difficulty
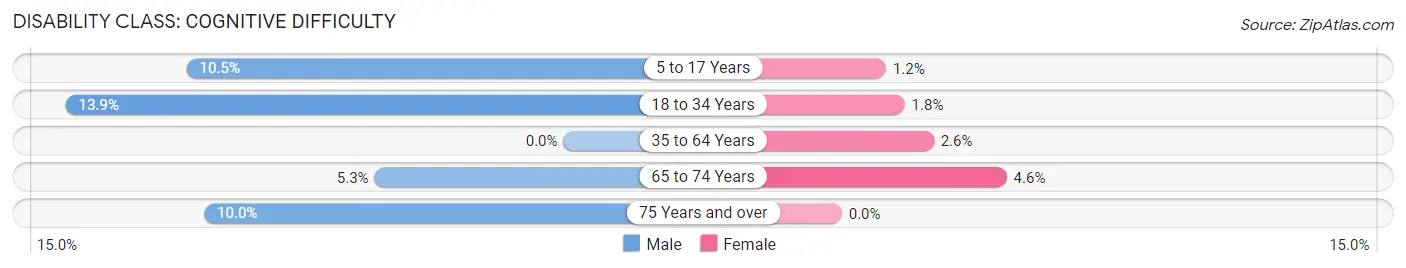
| Age Bracket | Male | Female |
| 5 to 17 Years | 28 (10.5%) | 3 (1.2%) |
| 18 to 34 Years | 47 (13.9%) | 4 (1.8%) |
| 35 to 64 Years | 0 (0.0%) | 15 (2.6%) |
| 65 to 74 Years | 5 (5.3%) | 5 (4.6%) |
| 75 Years and over | 4 (10.0%) | 0 (0.0%) |
Disability Class: Ambulatory Difficulty
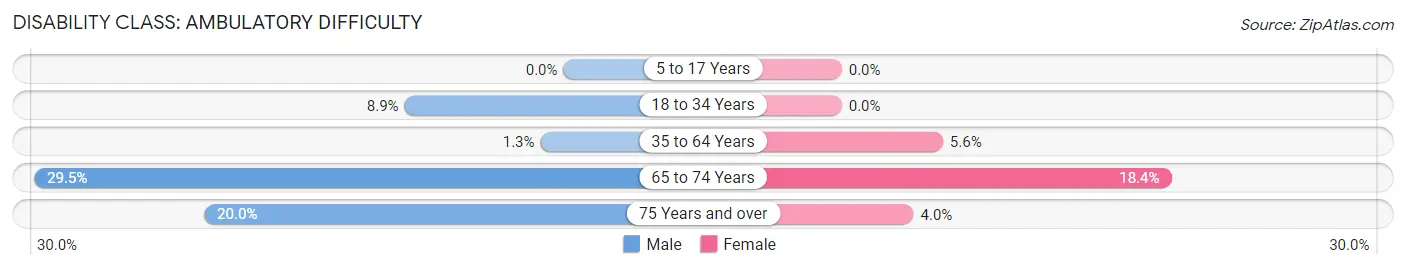
| Age Bracket | Male | Female |
| 5 to 17 Years | 0 (0.0%) | 0 (0.0%) |
| 18 to 34 Years | 30 (8.8%) | 0 (0.0%) |
| 35 to 64 Years | 6 (1.3%) | 33 (5.6%) |
| 65 to 74 Years | 28 (29.5%) | 20 (18.3%) |
| 75 Years and over | 8 (20.0%) | 2 (4.0%) |
Disability Class: Self-Care Difficulty
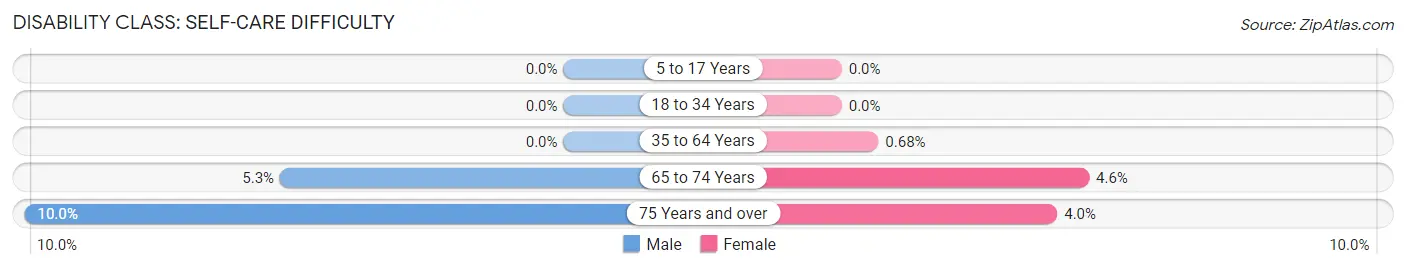
| Age Bracket | Male | Female |
| 5 to 17 Years | 0 (0.0%) | 0 (0.0%) |
| 18 to 34 Years | 0 (0.0%) | 0 (0.0%) |
| 35 to 64 Years | 0 (0.0%) | 4 (0.7%) |
| 65 to 74 Years | 5 (5.3%) | 5 (4.6%) |
| 75 Years and over | 4 (10.0%) | 2 (4.0%) |
Technology Access in Mattawan
Computing Device Access in Mattawan
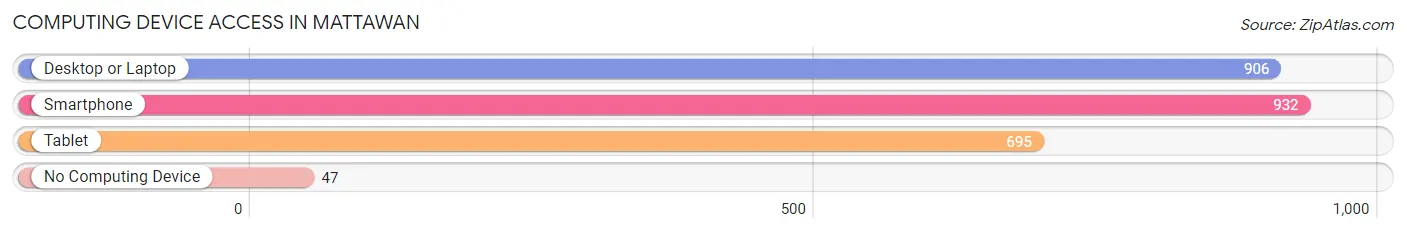
| Device Type | # Households | % Households |
| Desktop or Laptop | 906 | 88.7% |
| Smartphone | 932 | 91.3% |
| Tablet | 695 | 68.1% |
| No Computing Device | 47 | 4.6% |
| Total | 1,021 | 100.0% |
Internet Access in Mattawan
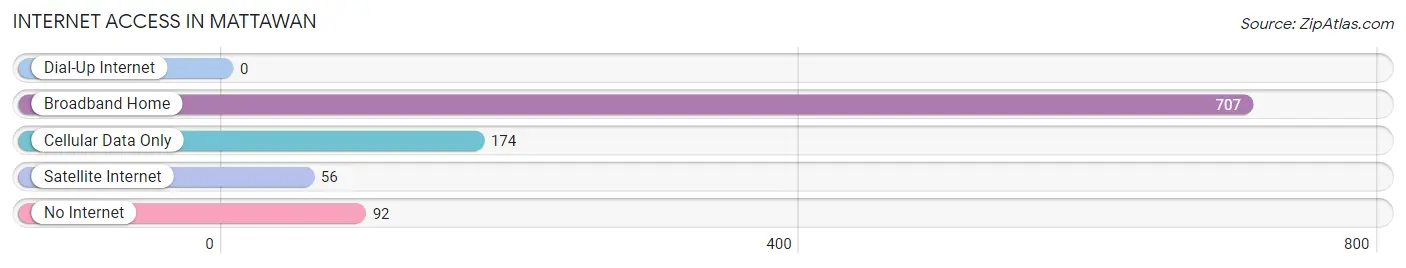
| Internet Type | # Households | % Households |
| Dial-Up Internet | 0 | 0.0% |
| Broadband Home | 707 | 69.3% |
| Cellular Data Only | 174 | 17.0% |
| Satellite Internet | 56 | 5.5% |
| No Internet | 92 | 9.0% |
| Total | 1,021 | 100.0% |
Mattawan Summary
Mattawan, Michigan is a small village located in Van Buren County, Michigan. It is situated in the southwestern corner of the state, approximately 20 miles east of Kalamazoo and 40 miles west of Battle Creek. The village is part of the Kalamazoo-Portage Metropolitan Statistical Area and has a population of approximately 4,000 people.
History
The area that is now Mattawan was first settled in 1837 by a group of settlers from New York. The village was originally known as “Mattawan Station” and was named after the Mattawan River, which runs through the area. The village was officially incorporated in 1867.
In the late 19th century, Mattawan was a thriving agricultural community. The village was home to several large farms, as well as a number of small businesses. The village also had a railroad station, which allowed for easy transportation of goods and people.
In the early 20th century, Mattawan began to experience a period of growth and development. The village was home to several factories, including a paper mill, a canning factory, and a furniture factory. The village also had a number of stores, including a grocery store, a hardware store, and a drug store.
Geography
Mattawan is located in the southwestern corner of Michigan, approximately 20 miles east of Kalamazoo and 40 miles west of Battle Creek. The village is situated on the banks of the Mattawan River, which runs through the area. The village is surrounded by rolling hills and farmland.
The climate in Mattawan is typical of the Midwest, with hot summers and cold winters. The average temperature in the summer is around 75 degrees Fahrenheit, while the average temperature in the winter is around 25 degrees Fahrenheit.
Economy
The economy of Mattawan is largely based on agriculture and manufacturing. The village is home to several large farms, as well as a number of small businesses. The village also has a number of factories, including a paper mill, a canning factory, and a furniture factory.
The village also has a number of stores, including a grocery store, a hardware store, and a drug store. The village also has a number of restaurants, including a pizza parlor, a Mexican restaurant, and a Chinese restaurant.
Demographics
As of the 2010 census, the population of Mattawan was 4,039. The racial makeup of the village was 94.3% White, 1.2% African American, 0.3% Native American, 0.7% Asian, 0.1% Pacific Islander, 1.2% from other races, and 2.3% from two or more races. Hispanic or Latino of any race were 3.2% of the population.
The median household income in Mattawan was $50,945, and the median family income was $60,917. The per capita income for the village was $24,945. About 5.3% of families and 7.2% of the population were below the poverty line, including 8.3% of those under age 18 and 5.2% of those age 65 or over.
Common Questions
What is Per Capita Income in Mattawan?
Per Capita income in Mattawan is $31,765.
What is the Median Family Income in Mattawan?
Median Family Income in Mattawan is $80,278.
What is the Median Household income in Mattawan?
Median Household Income in Mattawan is $75,317.
What is Income or Wage Gap in Mattawan?
Income or Wage Gap in Mattawan is 21.2%.
Women in Mattawan earn 78.8 cents for every dollar earned by a man.
What is Inequality or Gini Index in Mattawan?
Inequality or Gini Index in Mattawan is 0.39.
What is the Total Population of Mattawan?
Total Population of Mattawan is 2,566.
What is the Total Male Population of Mattawan?
Total Male Population of Mattawan is 1,295.
What is the Total Female Population of Mattawan?
Total Female Population of Mattawan is 1,271.
What is the Ratio of Males per 100 Females in Mattawan?
There are 101.89 Males per 100 Females in Mattawan.
What is the Ratio of Females per 100 Males in Mattawan?
There are 98.15 Females per 100 Males in Mattawan.
What is the Median Population Age in Mattawan?
Median Population Age in Mattawan is 35.8 Years.
What is the Average Family Size in Mattawan
Average Family Size in Mattawan is 2.9 People.
What is the Average Household Size in Mattawan
Average Household Size in Mattawan is 2.5 People.
How Large is the Labor Force in Mattawan?
There are 1,505 People in the Labor Forcein in Mattawan.
What is the Percentage of People in the Labor Force in Mattawan?
76.5% of People are in the Labor Force in Mattawan.
What is the Unemployment Rate in Mattawan?
Unemployment Rate in Mattawan is 7.6%.