Macon, MO Map & Demographics
Macon Map
Macon Overview
$26,781
PER CAPITA INCOME
$75,858
AVG FAMILY INCOME
$50,101
AVG HOUSEHOLD INCOME
33.4%
WAGE / INCOME GAP [ % ]
66.6¢/ $1
WAGE / INCOME GAP [ $ ]
0.40
INEQUALITY / GINI INDEX
5,452
TOTAL POPULATION
2,651
MALE POPULATION
2,801
FEMALE POPULATION
94.64
MALES / 100 FEMALES
105.66
FEMALES / 100 MALES
41.3
MEDIAN AGE
3.0
AVG FAMILY SIZE
2.3
AVG HOUSEHOLD SIZE
2,600
LABOR FORCE [ PEOPLE ]
59.9%
PERCENT IN LABOR FORCE
2.7%
UNEMPLOYMENT RATE
Macon Zip Codes
Macon Area Codes
Income in Macon
Income Overview in Macon
Per Capita Income in Macon is $26,781, while median incomes of families and households are $75,858 and $50,101 respectively.
| Characteristic | Number | Measure |
| Per Capita Income | 5,452 | $26,781 |
| Median Family Income | 1,336 | $75,858 |
| Mean Family Income | 1,336 | $78,103 |
| Median Household Income | 2,323 | $50,101 |
| Mean Household Income | 2,323 | $60,346 |
| Income Deficit | 1,336 | $0 |
| Wage / Income Gap (%) | 5,452 | 33.39% |
| Wage / Income Gap ($) | 5,452 | 66.61¢ per $1 |
| Gini / Inequality Index | 5,452 | 0.40 |
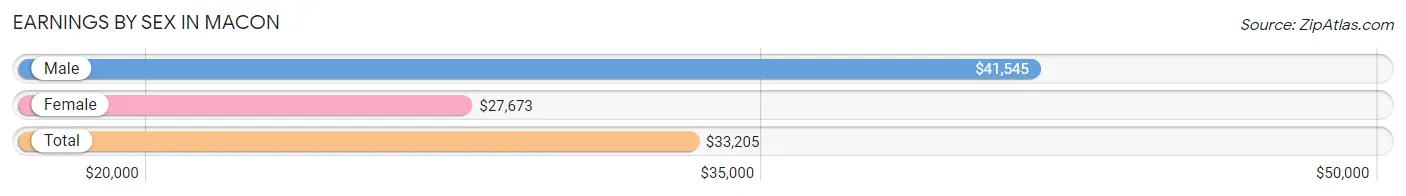
Earnings by Sex in Macon
Average Earnings in Macon are $33,205, $41,545 for men and $27,673 for women, a difference of 33.4%.
| Sex | Number | Average Earnings |
| Male | 1,318 (47.9%) | $41,545 |
| Female | 1,431 (52.1%) | $27,673 |
| Total | 2,749 (100.0%) | $33,205 |
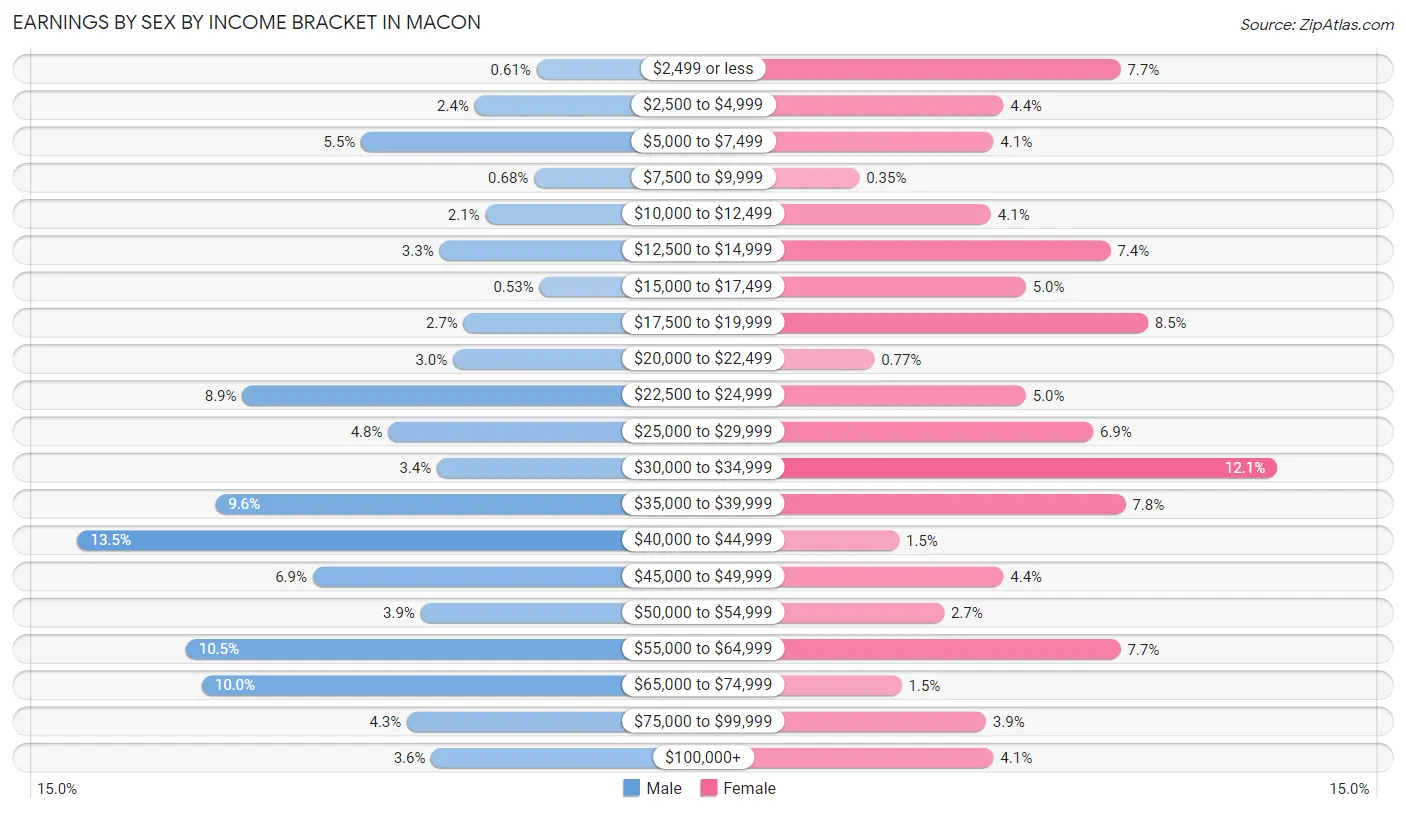
Earnings by Sex by Income Bracket in Macon
The most common earnings brackets in Macon are $40,000 to $44,999 for men (178 | 13.5%) and $30,000 to $34,999 for women (173 | 12.1%).
| Income | Male | Female |
| $2,499 or less | 8 (0.6%) | 110 (7.7%) |
| $2,500 to $4,999 | 31 (2.4%) | 63 (4.4%) |
| $5,000 to $7,499 | 73 (5.5%) | 59 (4.1%) |
| $7,500 to $9,999 | 9 (0.7%) | 5 (0.4%) |
| $10,000 to $12,499 | 27 (2.1%) | 58 (4.1%) |
| $12,500 to $14,999 | 44 (3.3%) | 106 (7.4%) |
| $15,000 to $17,499 | 7 (0.5%) | 72 (5.0%) |
| $17,500 to $19,999 | 35 (2.7%) | 121 (8.5%) |
| $20,000 to $22,499 | 39 (3.0%) | 11 (0.8%) |
| $22,500 to $24,999 | 117 (8.9%) | 72 (5.0%) |
| $25,000 to $29,999 | 63 (4.8%) | 99 (6.9%) |
| $30,000 to $34,999 | 45 (3.4%) | 173 (12.1%) |
| $35,000 to $39,999 | 127 (9.6%) | 112 (7.8%) |
| $40,000 to $44,999 | 178 (13.5%) | 21 (1.5%) |
| $45,000 to $49,999 | 91 (6.9%) | 63 (4.4%) |
| $50,000 to $54,999 | 51 (3.9%) | 39 (2.7%) |
| $55,000 to $64,999 | 138 (10.5%) | 110 (7.7%) |
| $65,000 to $74,999 | 132 (10.0%) | 22 (1.5%) |
| $75,000 to $99,999 | 56 (4.3%) | 56 (3.9%) |
| $100,000+ | 47 (3.6%) | 59 (4.1%) |
| Total | 1,318 (100.0%) | 1,431 (100.0%) |
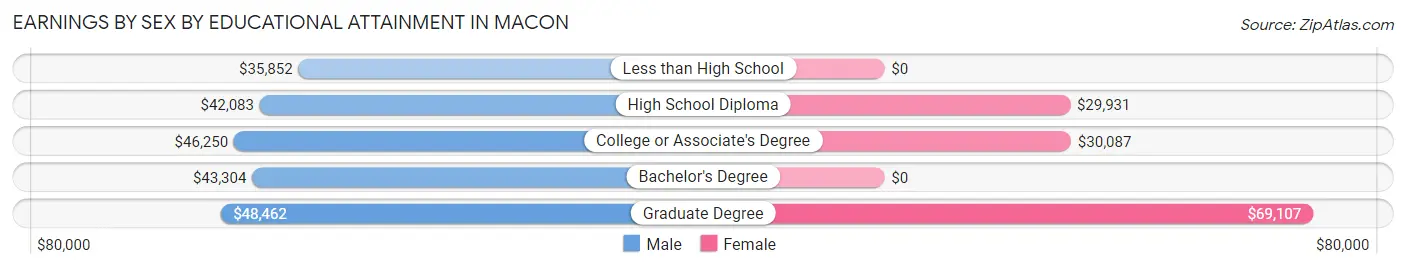
Earnings by Sex by Educational Attainment in Macon
Average earnings in Macon are $43,648 for men and $30,508 for women, a difference of 30.1%. Men with an educational attainment of graduate degree enjoy the highest average annual earnings of $48,462, while those with less than high school education earn the least with $35,852. Women with an educational attainment of graduate degree earn the most with the average annual earnings of $69,107, while those with high school diploma education have the smallest earnings of $29,931.
| Educational Attainment | Male Income | Female Income |
| Less than High School | $35,852 | $0 |
| High School Diploma | $42,083 | $29,931 |
| College or Associate's Degree | $46,250 | $30,087 |
| Bachelor's Degree | $43,304 | $0 |
| Graduate Degree | $48,462 | $69,107 |
| Total | $43,648 | $30,508 |
Family Income in Macon
Family Income Brackets in Macon
According to the Macon family income data, there are 318 families falling into the $75,000 to $99,999 income range, which is the most common income bracket and makes up 23.8% of all families. Conversely, the less than $10,000 income bracket is the least frequent group with only 13 families (1.0%) belonging to this category.
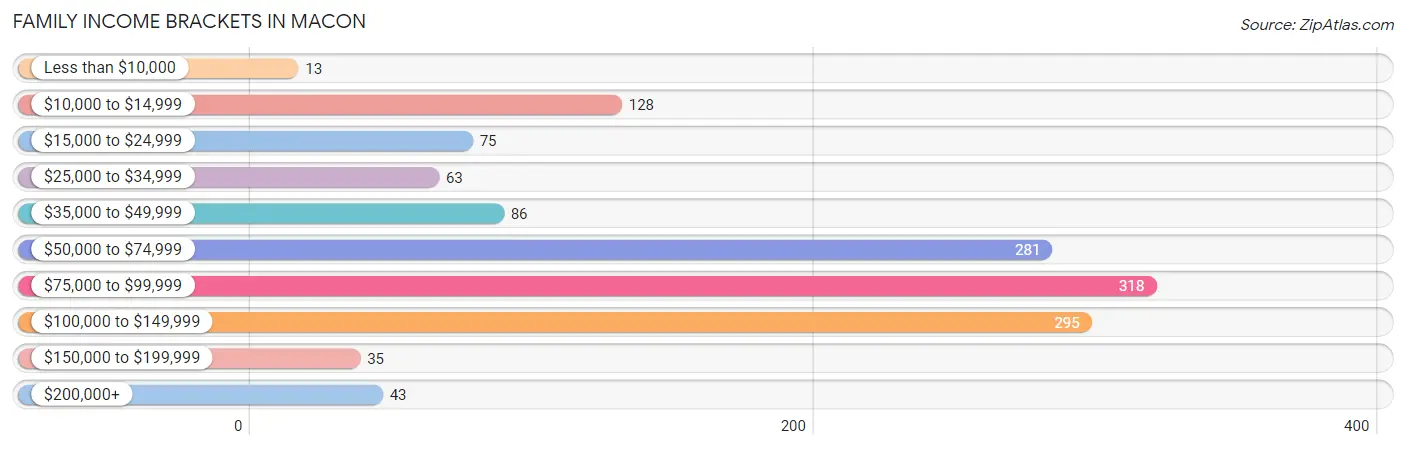
| Income Bracket | # Families | % Families |
| Less than $10,000 | 13 | 1.0% |
| $10,000 to $14,999 | 128 | 9.6% |
| $15,000 to $24,999 | 75 | 5.6% |
| $25,000 to $34,999 | 63 | 4.7% |
| $35,000 to $49,999 | 86 | 6.4% |
| $50,000 to $74,999 | 281 | 21.0% |
| $75,000 to $99,999 | 318 | 23.8% |
| $100,000 to $149,999 | 295 | 22.1% |
| $150,000 to $199,999 | 35 | 2.6% |
| $200,000+ | 43 | 3.2% |
Family Income by Famaliy Size in Macon
3-person families (297 | 22.2%) account for the highest median family income in Macon with $88,542 per family, while 2-person families (688 | 51.5%) have the highest median income of $38,125 per family member.
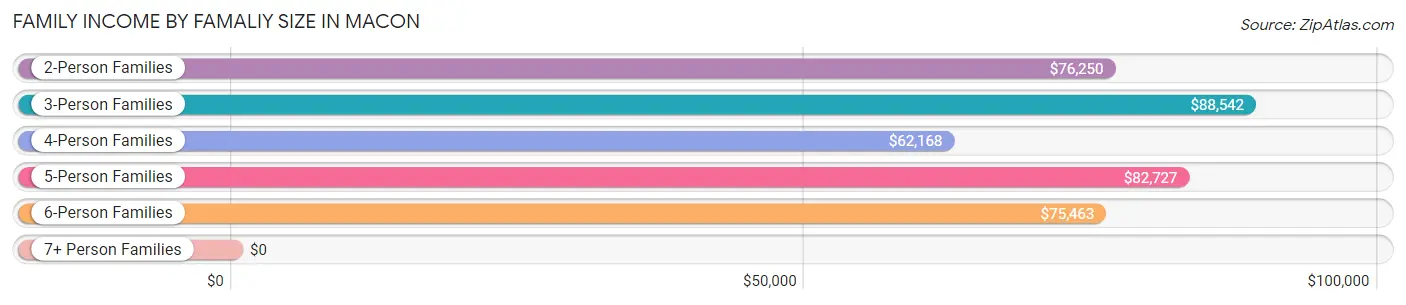
| Income Bracket | # Families | Median Income |
| 2-Person Families | 688 (51.5%) | $76,250 |
| 3-Person Families | 297 (22.2%) | $88,542 |
| 4-Person Families | 187 (14.0%) | $62,168 |
| 5-Person Families | 120 (9.0%) | $82,727 |
| 6-Person Families | 44 (3.3%) | $75,463 |
| 7+ Person Families | 0 (0.0%) | $0 |
| Total | 1,336 (100.0%) | $75,858 |
Family Income by Number of Earners in Macon
The median family income in Macon is $75,858, with families comprising 3+ earners (90) having the highest median family income of $97,375, while families with 1 earner (519) have the lowest median family income of $44,872, accounting for 6.7% and 38.9% of families, respectively.
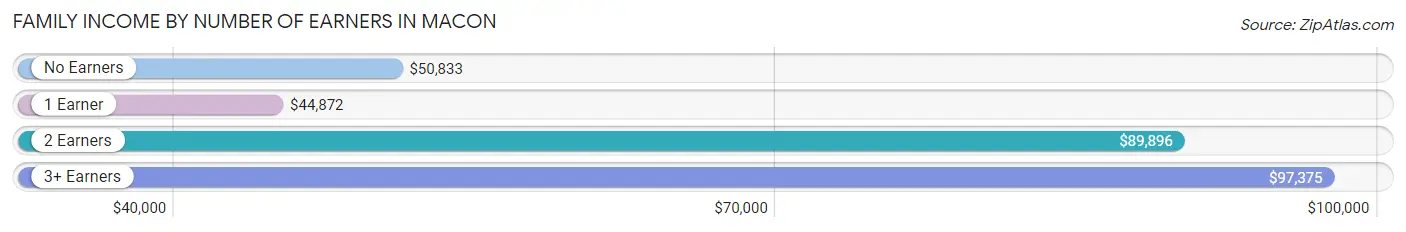
| Number of Earners | # Families | Median Income |
| No Earners | 190 (14.2%) | $50,833 |
| 1 Earner | 519 (38.9%) | $44,872 |
| 2 Earners | 537 (40.2%) | $89,896 |
| 3+ Earners | 90 (6.7%) | $97,375 |
| Total | 1,336 (100.0%) | $75,858 |
Household Income in Macon
Household Income Brackets in Macon
With 407 households falling in the category, the $50,000 to $74,999 income range is the most frequent in Macon, accounting for 17.5% of all households. In contrast, only 39 households (1.7%) fall into the less than $10,000 income bracket, making it the least populous group.
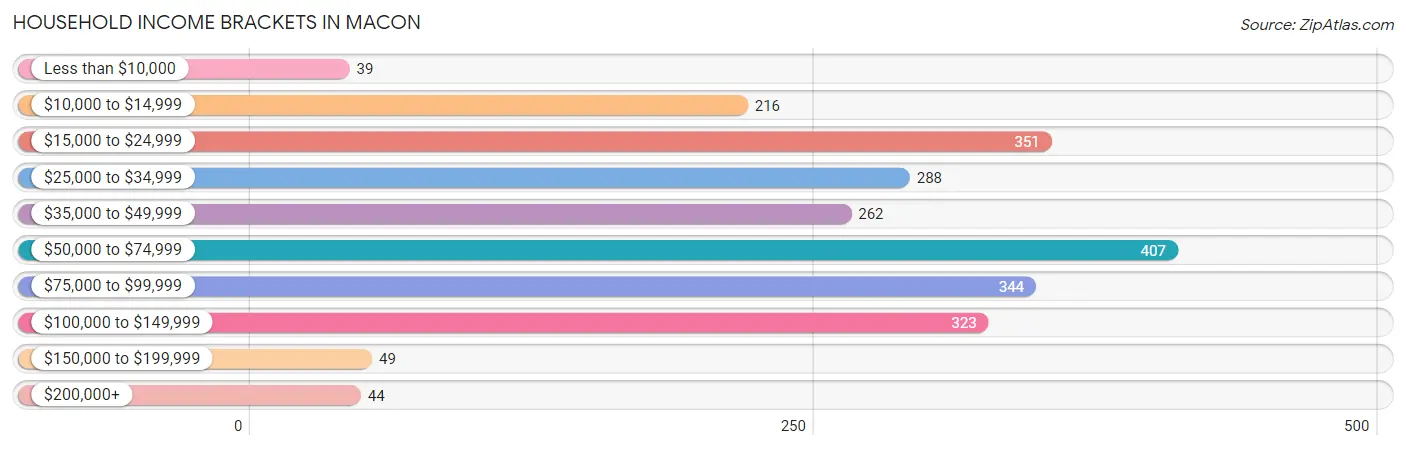
| Income Bracket | # Households | % Households |
| Less than $10,000 | 39 | 1.7% |
| $10,000 to $14,999 | 216 | 9.3% |
| $15,000 to $24,999 | 351 | 15.1% |
| $25,000 to $34,999 | 288 | 12.4% |
| $35,000 to $49,999 | 262 | 11.3% |
| $50,000 to $74,999 | 407 | 17.5% |
| $75,000 to $99,999 | 344 | 14.8% |
| $100,000 to $149,999 | 323 | 13.9% |
| $150,000 to $199,999 | 49 | 2.1% |
| $200,000+ | 44 | 1.9% |
Household Income by Householder Age in Macon
The median household income in Macon is $50,101, with the highest median household income of $60,807 found in the 45 to 64 years age bracket for the primary householder. A total of 951 households (40.9%) fall into this category. Meanwhile, the 15 to 24 years age bracket for the primary householder has the lowest median household income of $0, with 81 households (3.5%) in this group.
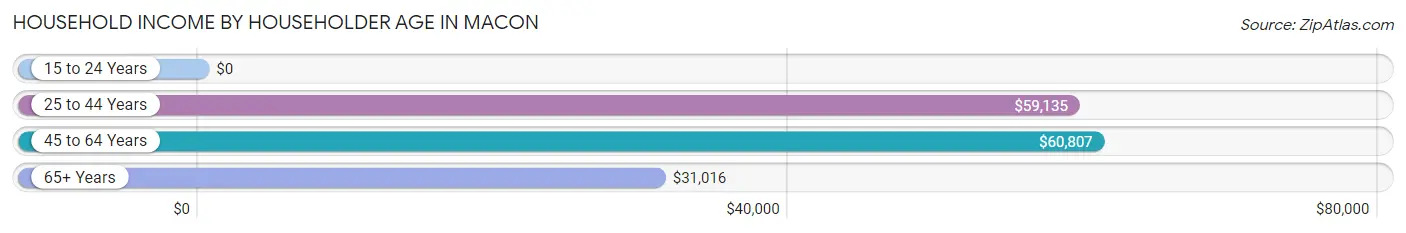
| Income Bracket | # Households | Median Income |
| 15 to 24 Years | 81 (3.5%) | $0 |
| 25 to 44 Years | 601 (25.9%) | $59,135 |
| 45 to 64 Years | 951 (40.9%) | $60,807 |
| 65+ Years | 690 (29.7%) | $31,016 |
| Total | 2,323 (100.0%) | $50,101 |
Poverty in Macon
Income Below Poverty by Sex and Age in Macon
With 13.0% poverty level for males and 15.3% for females among the residents of Macon, 5 year old males and 55 to 64 year old females are the most vulnerable to poverty, with 30 males (56.6%) and 84 females (22.4%) in their respective age groups living below the poverty level.
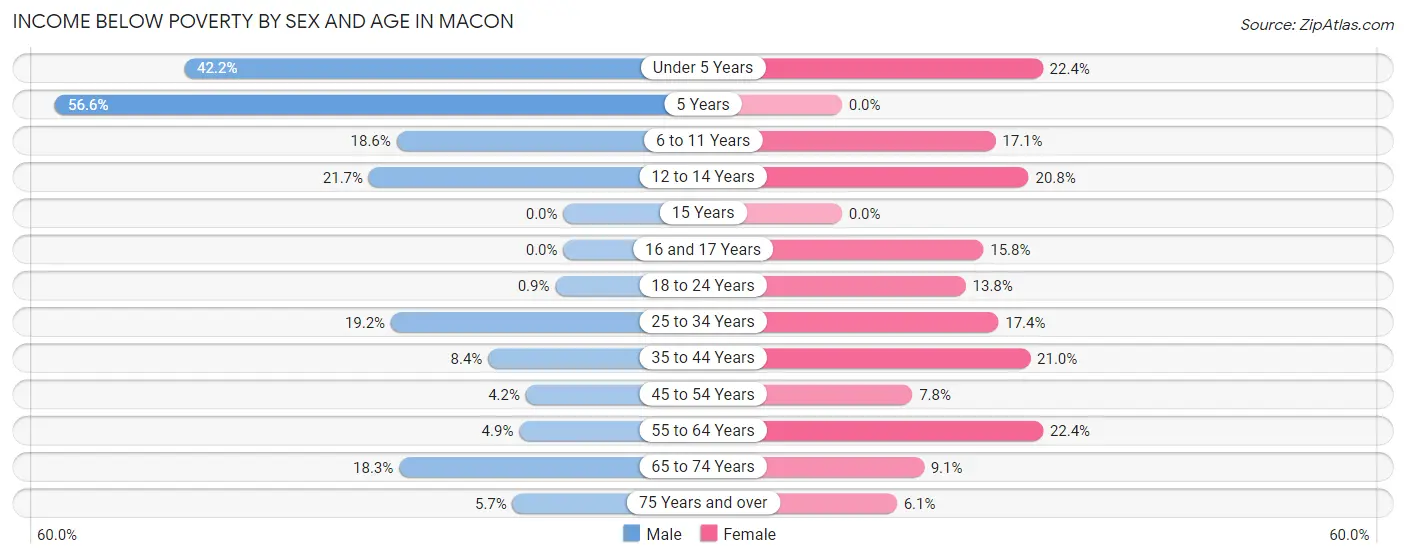
| Age Bracket | Male | Female |
| Under 5 Years | 49 (42.2%) | 34 (22.4%) |
| 5 Years | 30 (56.6%) | 0 (0.0%) |
| 6 to 11 Years | 44 (18.6%) | 33 (17.1%) |
| 12 to 14 Years | 34 (21.7%) | 26 (20.8%) |
| 15 Years | 0 (0.0%) | 0 (0.0%) |
| 16 and 17 Years | 0 (0.0%) | 29 (15.8%) |
| 18 to 24 Years | 2 (0.9%) | 20 (13.8%) |
| 25 to 34 Years | 48 (19.2%) | 53 (17.4%) |
| 35 to 44 Years | 22 (8.4%) | 69 (21.0%) |
| 45 to 54 Years | 13 (4.2%) | 25 (7.8%) |
| 55 to 64 Years | 20 (4.9%) | 84 (22.4%) |
| 65 to 74 Years | 60 (18.3%) | 26 (9.1%) |
| 75 Years and over | 7 (5.7%) | 17 (6.1%) |
| Total | 329 (13.0%) | 416 (15.3%) |
Income Above Poverty by Sex and Age in Macon
According to the poverty statistics in Macon, males aged 15 years and females aged 15 years are the age groups that are most secure financially, with 100.0% of males and 100.0% of females in these age groups living above the poverty line.
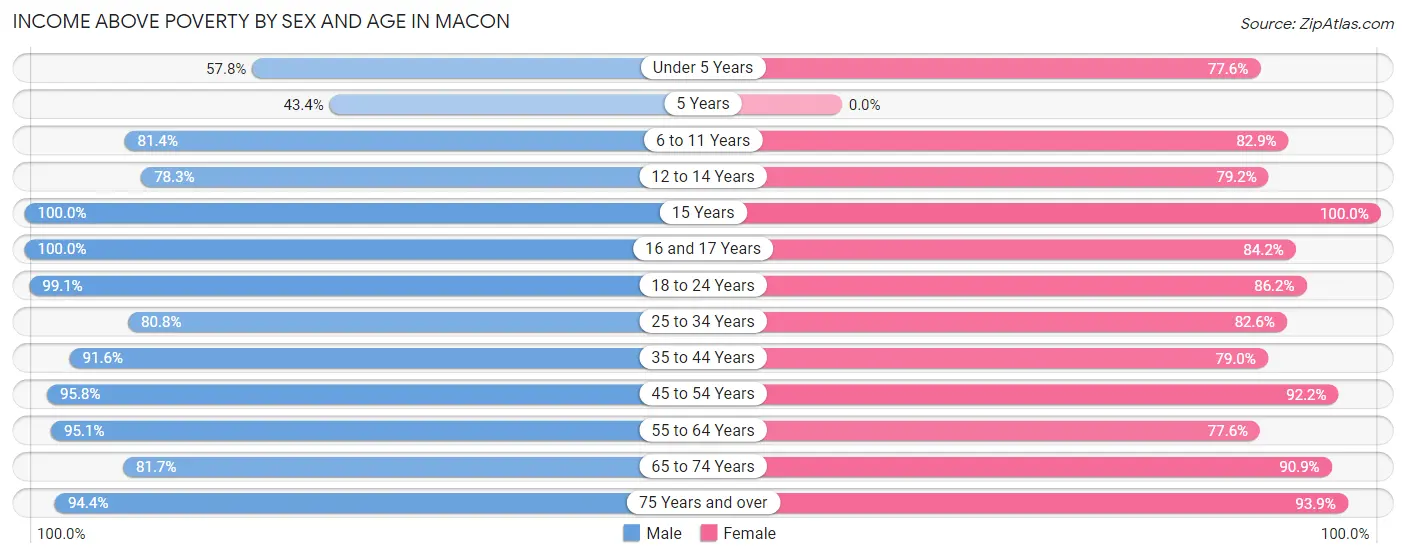
| Age Bracket | Male | Female |
| Under 5 Years | 67 (57.8%) | 118 (77.6%) |
| 5 Years | 23 (43.4%) | 0 (0.0%) |
| 6 to 11 Years | 193 (81.4%) | 160 (82.9%) |
| 12 to 14 Years | 123 (78.3%) | 99 (79.2%) |
| 15 Years | 36 (100.0%) | 31 (100.0%) |
| 16 and 17 Years | 26 (100.0%) | 155 (84.2%) |
| 18 to 24 Years | 219 (99.1%) | 125 (86.2%) |
| 25 to 34 Years | 202 (80.8%) | 251 (82.6%) |
| 35 to 44 Years | 241 (91.6%) | 260 (79.0%) |
| 45 to 54 Years | 298 (95.8%) | 294 (92.2%) |
| 55 to 64 Years | 387 (95.1%) | 291 (77.6%) |
| 65 to 74 Years | 268 (81.7%) | 259 (90.9%) |
| 75 Years and over | 117 (94.4%) | 261 (93.9%) |
| Total | 2,200 (87.0%) | 2,304 (84.7%) |
Income Below Poverty Among Married-Couple Families in Macon
The poverty statistics for married-couple families in Macon show that 3.4% or 35 of the total 1,041 families live below the poverty line. Families with no children have the highest poverty rate of 5.6%, comprising of 31 families. On the other hand, families with 1 or 2 children have the lowest poverty rate of 0.0%, which includes 0 families.
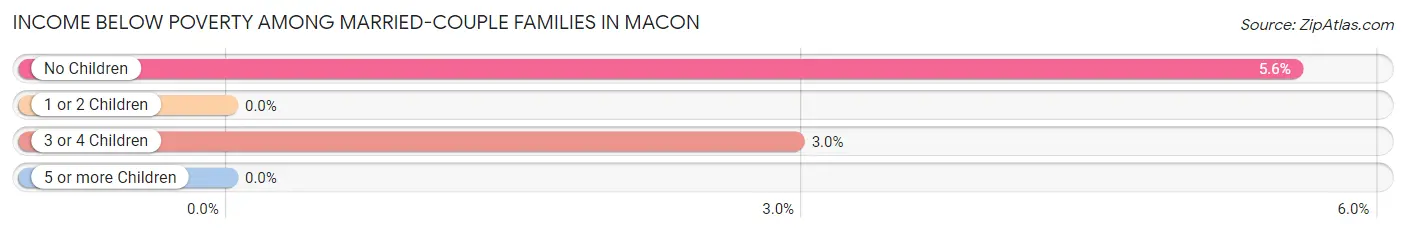
| Children | Above Poverty | Below Poverty |
| No Children | 527 (94.4%) | 31 (5.6%) |
| 1 or 2 Children | 348 (100.0%) | 0 (0.0%) |
| 3 or 4 Children | 131 (97.0%) | 4 (3.0%) |
| 5 or more Children | 0 (0.0%) | 0 (0.0%) |
| Total | 1,006 (96.6%) | 35 (3.4%) |
Income Below Poverty Among Single-Parent Households in Macon
According to the poverty data in Macon, 26.6% or 17 single-father households and 61.9% or 143 single-mother households are living below the poverty line. Among single-father households, those with 1 or 2 children have the highest poverty rate, with 17 households (30.9%) experiencing poverty. Likewise, among single-mother households, those with 1 or 2 children have the highest poverty rate, with 118 households (82.5%) falling below the poverty line.
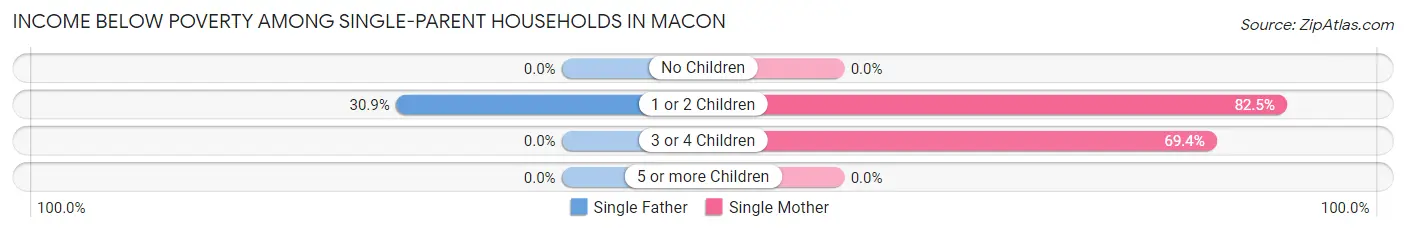
| Children | Single Father | Single Mother |
| No Children | 0 (0.0%) | 0 (0.0%) |
| 1 or 2 Children | 17 (30.9%) | 118 (82.5%) |
| 3 or 4 Children | 0 (0.0%) | 25 (69.4%) |
| 5 or more Children | 0 (0.0%) | 0 (0.0%) |
| Total | 17 (26.6%) | 143 (61.9%) |
Income Below Poverty Among Married-Couple vs Single-Parent Households in Macon
The poverty data for Macon shows that 35 of the married-couple family households (3.4%) and 160 of the single-parent households (54.2%) are living below the poverty level. Within the married-couple family households, those with no children have the highest poverty rate, with 31 households (5.6%) falling below the poverty line. Among the single-parent households, those with 3 or 4 children have the highest poverty rate, with 25 household (69.4%) living below poverty.
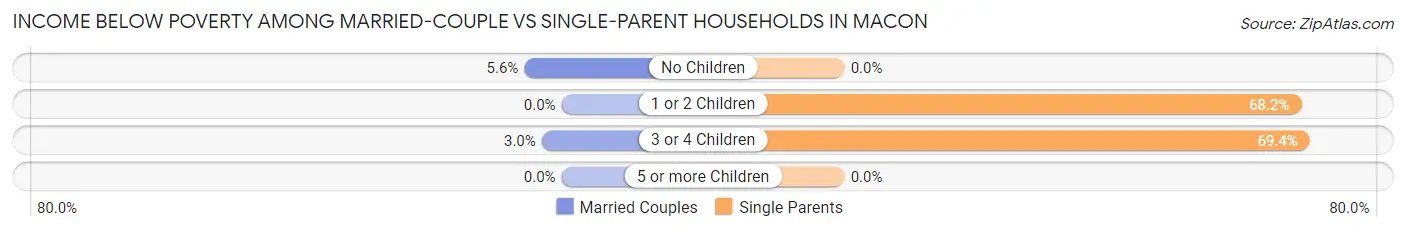
| Children | Married-Couple Families | Single-Parent Households |
| No Children | 31 (5.6%) | 0 (0.0%) |
| 1 or 2 Children | 0 (0.0%) | 135 (68.2%) |
| 3 or 4 Children | 4 (3.0%) | 25 (69.4%) |
| 5 or more Children | 0 (0.0%) | 0 (0.0%) |
| Total | 35 (3.4%) | 160 (54.2%) |
Race in Macon
The most populous races in Macon are White / Caucasian (4,718 | 86.5%), Two or more Races (376 | 6.9%), and Black / African American (233 | 4.3%).
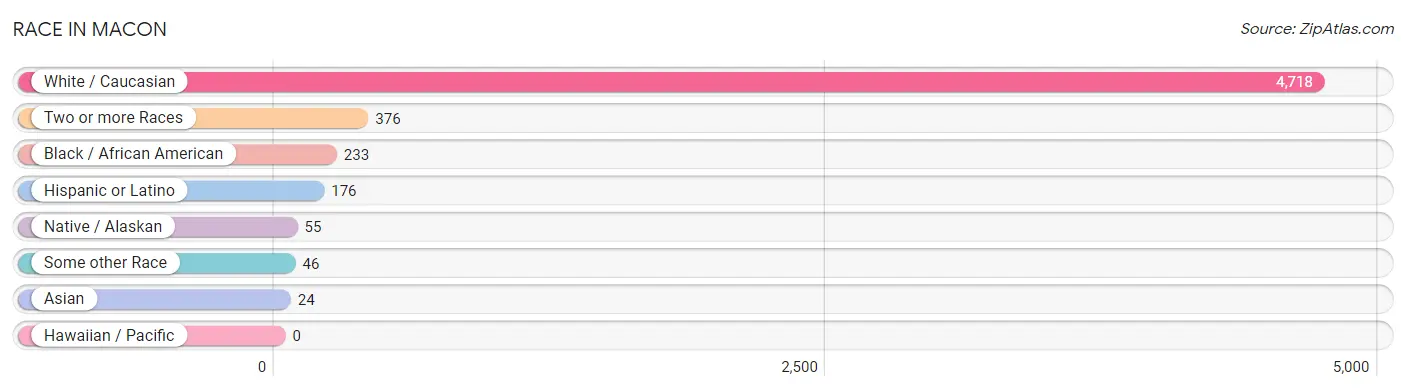
| Race | # Population | % Population |
| Asian | 24 | 0.4% |
| Black / African American | 233 | 4.3% |
| Hawaiian / Pacific | 0 | 0.0% |
| Hispanic or Latino | 176 | 3.2% |
| Native / Alaskan | 55 | 1.0% |
| White / Caucasian | 4,718 | 86.5% |
| Two or more Races | 376 | 6.9% |
| Some other Race | 46 | 0.8% |
| Total | 5,452 | 100.0% |
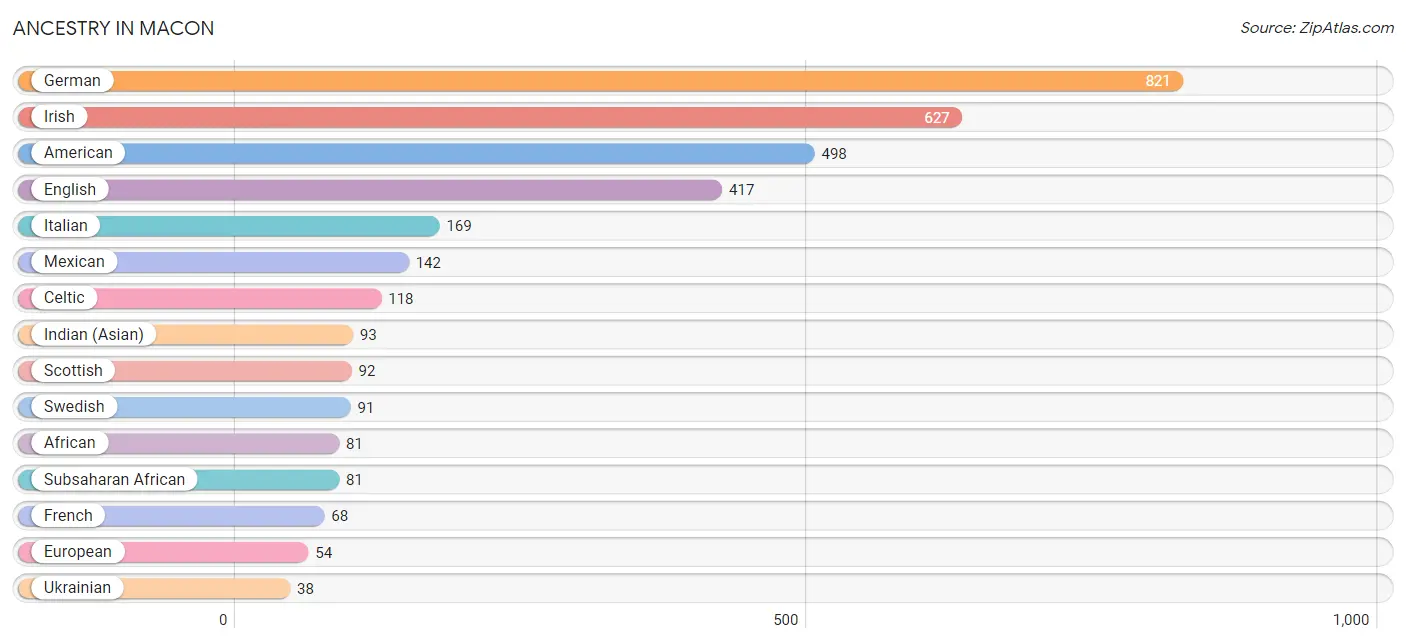
Ancestry in Macon
The most populous ancestries reported in Macon are German (821 | 15.1%), Irish (627 | 11.5%), American (498 | 9.1%), English (417 | 7.6%), and Italian (169 | 3.1%), together accounting for 46.4% of all Macon residents.
| Ancestry | # Population | % Population |
| African | 81 | 1.5% |
| American | 498 | 9.1% |
| Austrian | 7 | 0.1% |
| Blackfeet | 6 | 0.1% |
| Celtic | 118 | 2.2% |
| Central American | 34 | 0.6% |
| Cherokee | 9 | 0.2% |
| Chippewa | 2 | 0.0% |
| Choctaw | 3 | 0.1% |
| Danish | 7 | 0.1% |
| Dutch | 28 | 0.5% |
| English | 417 | 7.6% |
| European | 54 | 1.0% |
| French | 68 | 1.3% |
| German | 821 | 15.1% |
| Indian (Asian) | 93 | 1.7% |
| Irish | 627 | 11.5% |
| Iroquois | 30 | 0.5% |
| Italian | 169 | 3.1% |
| Mexican | 142 | 2.6% |
| Norwegian | 7 | 0.1% |
| Pennsylvania German | 10 | 0.2% |
| Salvadoran | 34 | 0.6% |
| Scotch-Irish | 5 | 0.1% |
| Scottish | 92 | 1.7% |
| Subsaharan African | 81 | 1.5% |
| Swedish | 91 | 1.7% |
| Thai | 26 | 0.5% |
| Ukrainian | 38 | 0.7% |
| Welsh | 17 | 0.3% | View All 30 Rows |
Immigrants in Macon
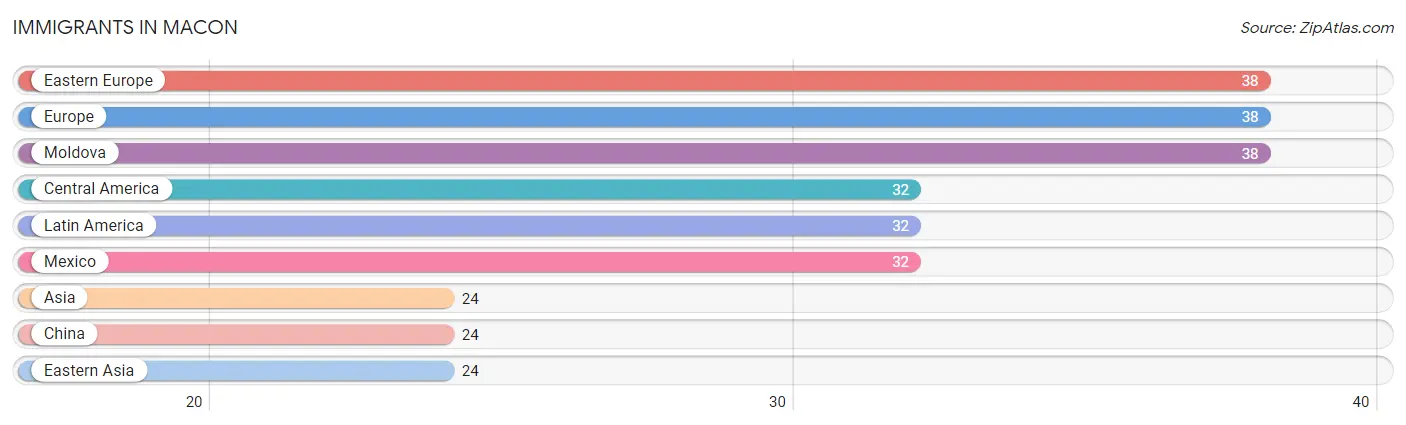
The most numerous immigrant groups reported in Macon came from Eastern Europe (38 | 0.7%), Europe (38 | 0.7%), Moldova (38 | 0.7%), Central America (32 | 0.6%), and Latin America (32 | 0.6%), together accounting for 3.3% of all Macon residents.
| Immigration Origin | # Population | % Population |
| Asia | 24 | 0.4% |
| Central America | 32 | 0.6% |
| China | 24 | 0.4% |
| Eastern Asia | 24 | 0.4% |
| Eastern Europe | 38 | 0.7% |
| Europe | 38 | 0.7% |
| Latin America | 32 | 0.6% |
| Mexico | 32 | 0.6% |
| Moldova | 38 | 0.7% | View All 9 Rows |
Sex and Age in Macon
Sex and Age in Macon
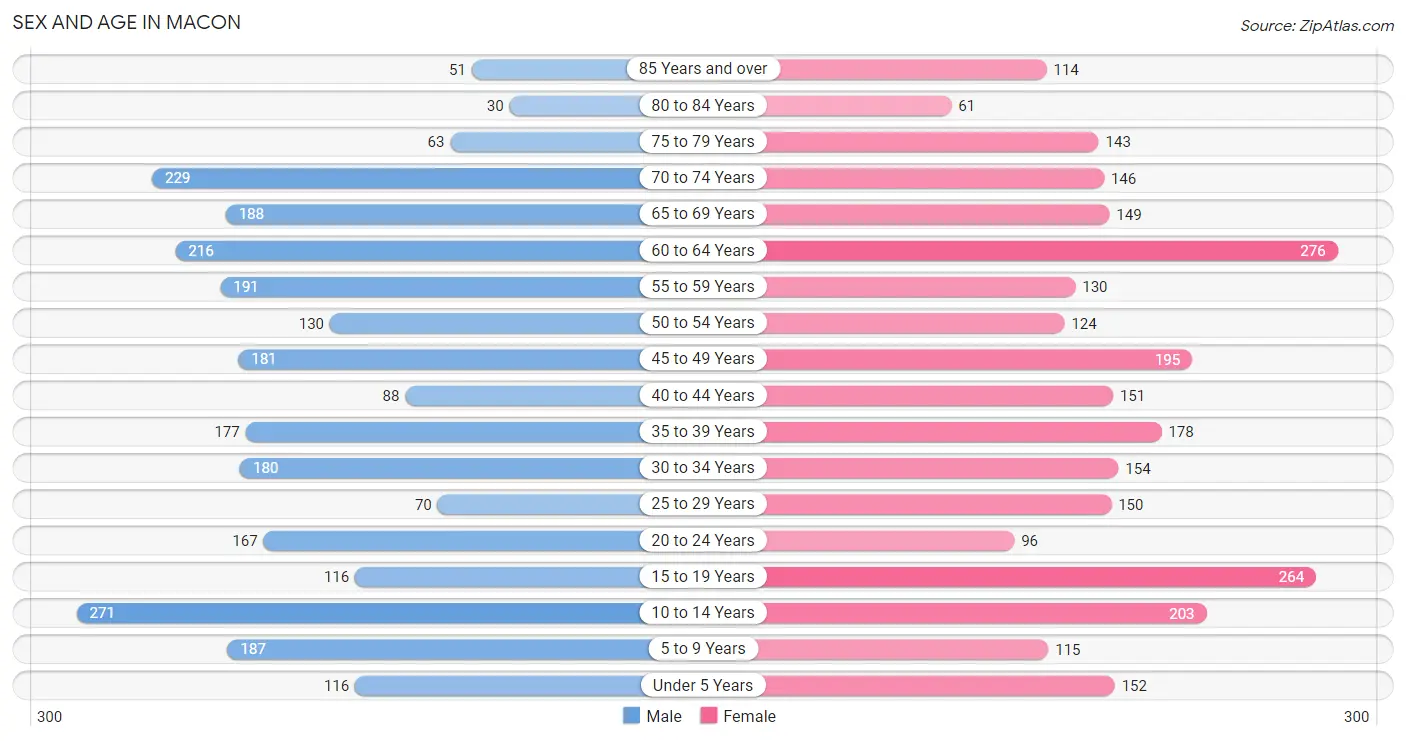
The most populous age groups in Macon are 10 to 14 Years (271 | 10.2%) for men and 60 to 64 Years (276 | 9.9%) for women.
| Age Bracket | Male | Female |
| Under 5 Years | 116 (4.4%) | 152 (5.4%) |
| 5 to 9 Years | 187 (7.0%) | 115 (4.1%) |
| 10 to 14 Years | 271 (10.2%) | 203 (7.2%) |
| 15 to 19 Years | 116 (4.4%) | 264 (9.4%) |
| 20 to 24 Years | 167 (6.3%) | 96 (3.4%) |
| 25 to 29 Years | 70 (2.6%) | 150 (5.4%) |
| 30 to 34 Years | 180 (6.8%) | 154 (5.5%) |
| 35 to 39 Years | 177 (6.7%) | 178 (6.4%) |
| 40 to 44 Years | 88 (3.3%) | 151 (5.4%) |
| 45 to 49 Years | 181 (6.8%) | 195 (7.0%) |
| 50 to 54 Years | 130 (4.9%) | 124 (4.4%) |
| 55 to 59 Years | 191 (7.2%) | 130 (4.6%) |
| 60 to 64 Years | 216 (8.2%) | 276 (9.9%) |
| 65 to 69 Years | 188 (7.1%) | 149 (5.3%) |
| 70 to 74 Years | 229 (8.6%) | 146 (5.2%) |
| 75 to 79 Years | 63 (2.4%) | 143 (5.1%) |
| 80 to 84 Years | 30 (1.1%) | 61 (2.2%) |
| 85 Years and over | 51 (1.9%) | 114 (4.1%) |
| Total | 2,651 (100.0%) | 2,801 (100.0%) |
Families and Households in Macon
Median Family Size in Macon
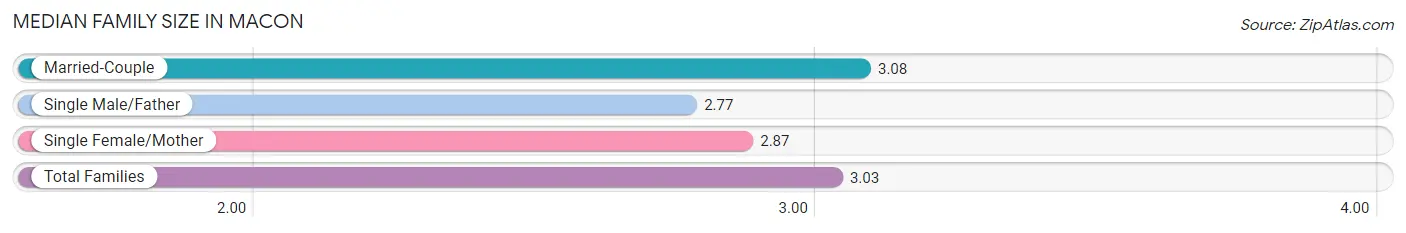
The median family size in Macon is 3.03 persons per family, with married-couple families (1,041 | 77.9%) accounting for the largest median family size of 3.08 persons per family. On the other hand, single male/father families (64 | 4.8%) represent the smallest median family size with 2.77 persons per family.
| Family Type | # Families | Family Size |
| Married-Couple | 1,041 (77.9%) | 3.08 |
| Single Male/Father | 64 (4.8%) | 2.77 |
| Single Female/Mother | 231 (17.3%) | 2.87 |
| Total Families | 1,336 (100.0%) | 3.03 |
Median Household Size in Macon
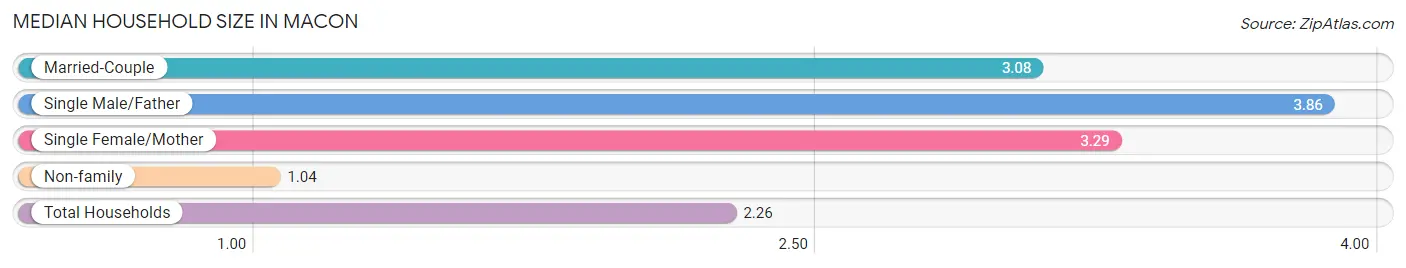
The median household size in Macon is 2.26 persons per household, with single male/father households (64 | 2.8%) accounting for the largest median household size of 3.86 persons per household. non-family households (987 | 42.5%) represent the smallest median household size with 1.04 persons per household.
| Household Type | # Households | Household Size |
| Married-Couple | 1,041 (44.8%) | 3.08 |
| Single Male/Father | 64 (2.8%) | 3.86 |
| Single Female/Mother | 231 (9.9%) | 3.29 |
| Non-family | 987 (42.5%) | 1.04 |
| Total Households | 2,323 (100.0%) | 2.26 |
Household Size by Marriage Status in Macon
Out of a total of 2,323 households in Macon, 1,336 (57.5%) are family households, while 987 (42.5%) are nonfamily households. The most numerous type of family households are 2-person households, comprising 660, and the most common type of nonfamily households are 1-person households, comprising 958.
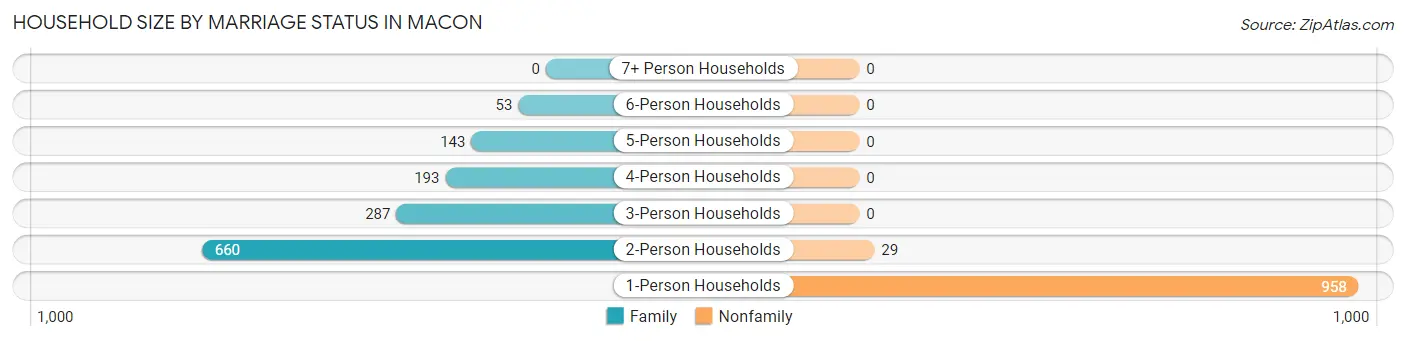
| Household Size | Family Households | Nonfamily Households |
| 1-Person Households | - | 958 (41.2%) |
| 2-Person Households | 660 (28.4%) | 29 (1.3%) |
| 3-Person Households | 287 (12.3%) | 0 (0.0%) |
| 4-Person Households | 193 (8.3%) | 0 (0.0%) |
| 5-Person Households | 143 (6.2%) | 0 (0.0%) |
| 6-Person Households | 53 (2.3%) | 0 (0.0%) |
| 7+ Person Households | 0 (0.0%) | 0 (0.0%) |
| Total | 1,336 (57.5%) | 987 (42.5%) |
Female Fertility in Macon
Fertility by Age in Macon
Average fertility rate in Macon is 80.0 births per 1,000 women. Women in the age bracket of 20 to 34 years have the highest fertility rate with 195.0 births per 1,000 women. Women in the age bracket of 20 to 34 years acount for 79.6% of all women with births.
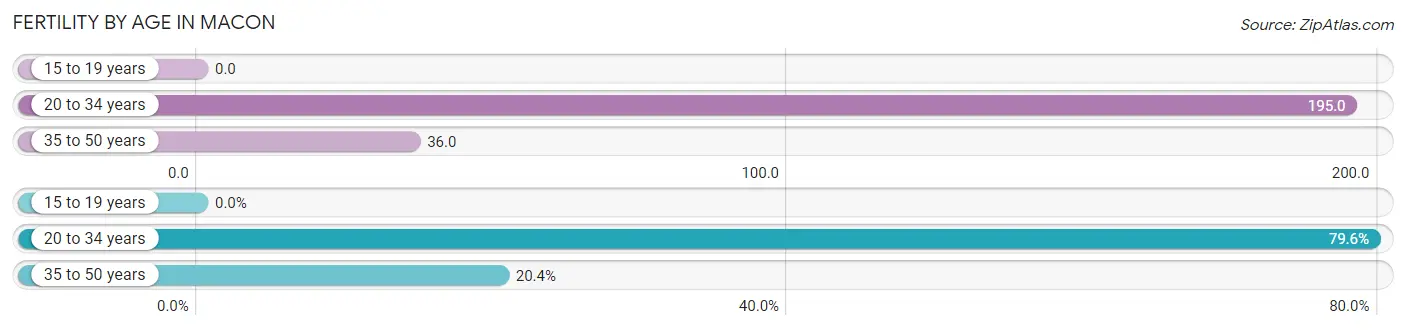
| Age Bracket | Women with Births | Births / 1,000 Women |
| 15 to 19 years | 0 (0.0%) | 0.0 |
| 20 to 34 years | 78 (79.6%) | 195.0 |
| 35 to 50 years | 20 (20.4%) | 36.0 |
| Total | 98 (100.0%) | 80.0 |
Fertility by Age by Marriage Status in Macon
54.1% of women with births (98) in Macon are married. The highest percentage of unmarried women with births falls into 35 to 50 years age bracket with 55.0% of them unmarried at the time of birth, while the lowest percentage of unmarried women with births belong to 20 to 34 years age bracket with 43.6% of them unmarried.
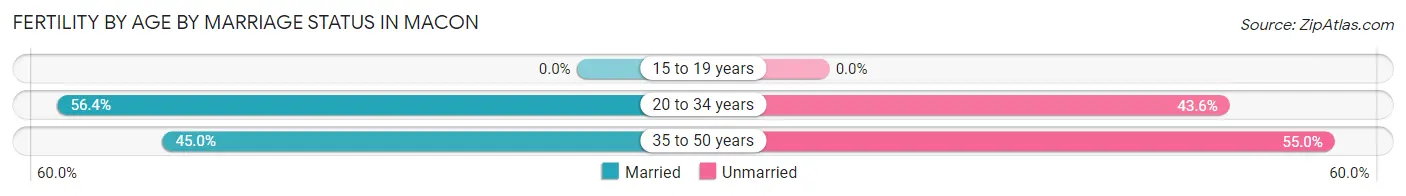
| Age Bracket | Married | Unmarried |
| 15 to 19 years | 0 (0.0%) | 0 (0.0%) |
| 20 to 34 years | 44 (56.4%) | 34 (43.6%) |
| 35 to 50 years | 9 (45.0%) | 11 (55.0%) |
| Total | 53 (54.1%) | 45 (45.9%) |
Fertility by Education in Macon
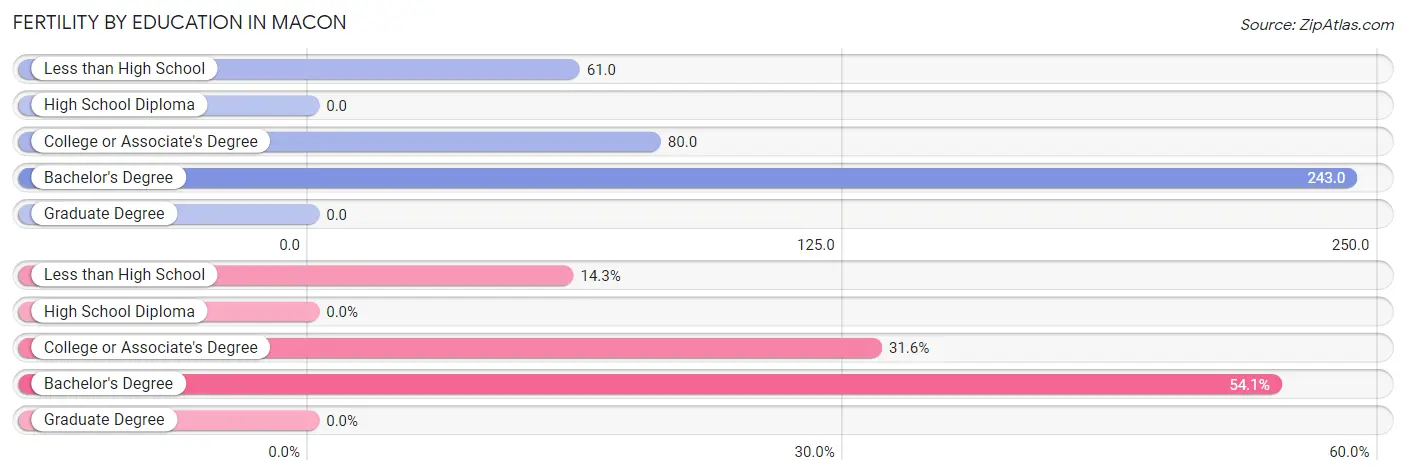
| Educational Attainment | Women with Births | Births / 1,000 Women |
| Less than High School | 14 (14.3%) | 61.0 |
| High School Diploma | 0 (0.0%) | 0.0 |
| College or Associate's Degree | 31 (31.6%) | 80.0 |
| Bachelor's Degree | 53 (54.1%) | 243.0 |
| Graduate Degree | 0 (0.0%) | 0.0 |
| Total | 98 (100.0%) | 80.0 |
Fertility by Education by Marriage Status in Macon
45.9% of women with births in Macon are unmarried. Women with the educational attainment of bachelor's degree are most likely to be married with 100.0% of them married at childbirth, while women with the educational attainment of less than high school are least likely to be married with 100.0% of them unmarried at childbirth.
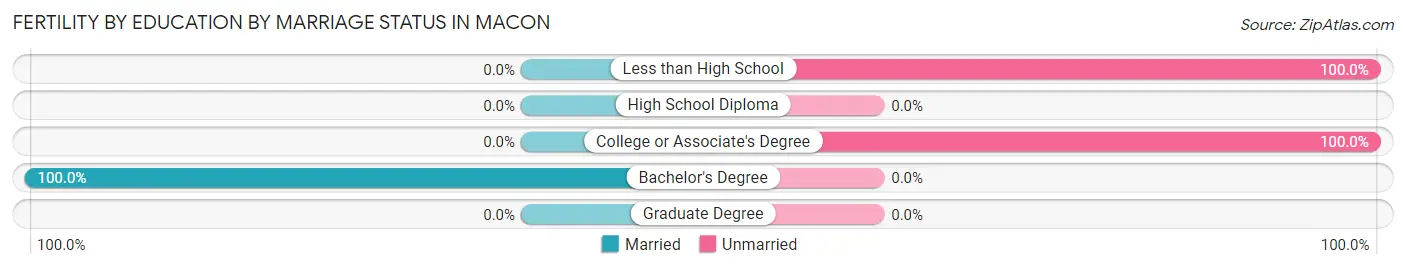
| Educational Attainment | Married | Unmarried |
| Less than High School | 0 (0.0%) | 14 (100.0%) |
| High School Diploma | 0 (0.0%) | 0 (0.0%) |
| College or Associate's Degree | 0 (0.0%) | 31 (100.0%) |
| Bachelor's Degree | 53 (100.0%) | 0 (0.0%) |
| Graduate Degree | 0 (0.0%) | 0 (0.0%) |
| Total | 53 (54.1%) | 45 (45.9%) |
Employment Characteristics in Macon
Employment by Class of Employer in Macon
Among the 2,520 employed individuals in Macon, private company employees (1,515 | 60.1%), state government employees (278 | 11.0%), and local government employees (243 | 9.6%) make up the most common classes of employment.
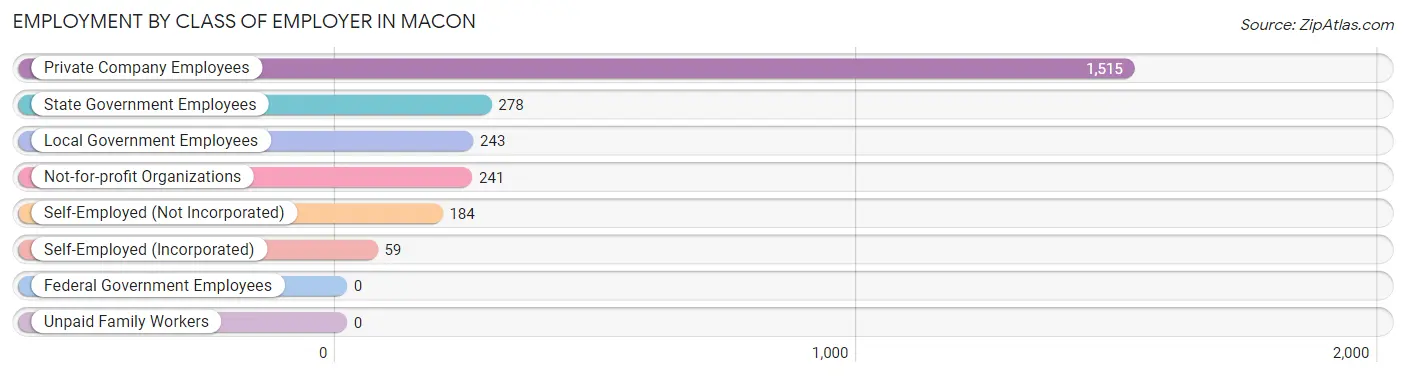
| Employer Class | # Employees | % Employees |
| Private Company Employees | 1,515 | 60.1% |
| Self-Employed (Incorporated) | 59 | 2.3% |
| Self-Employed (Not Incorporated) | 184 | 7.3% |
| Not-for-profit Organizations | 241 | 9.6% |
| Local Government Employees | 243 | 9.6% |
| State Government Employees | 278 | 11.0% |
| Federal Government Employees | 0 | 0.0% |
| Unpaid Family Workers | 0 | 0.0% |
| Total | 2,520 | 100.0% |
Employment Status by Age in Macon
According to the labor force statistics for Macon, out of the total population over 16 years of age (4,341), 59.9% or 2,600 individuals are in the labor force, with 2.7% or 70 of them unemployed. The age group with the highest labor force participation rate is 45 to 54 years, with 92.4% or 582 individuals in the labor force. Within the labor force, the 20 to 24 years age range has the highest percentage of unemployed individuals, with 10.8% or 23 of them being unemployed.
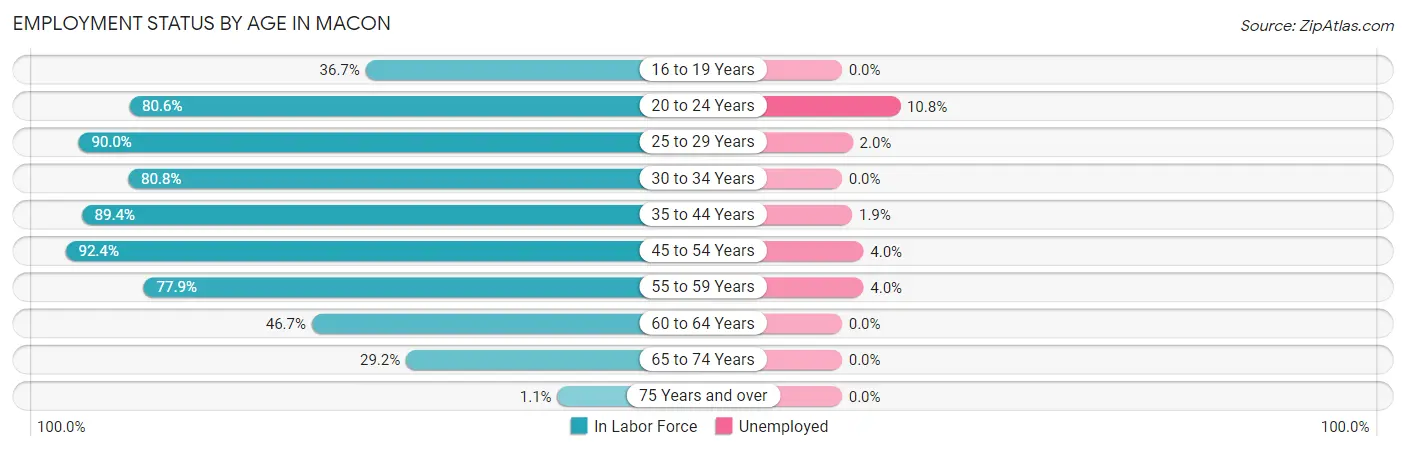
| Age Bracket | In Labor Force | Unemployed |
| 16 to 19 Years | 115 (36.7%) | 0 (0.0%) |
| 20 to 24 Years | 212 (80.6%) | 23 (10.8%) |
| 25 to 29 Years | 198 (90.0%) | 4 (2.0%) |
| 30 to 34 Years | 270 (80.8%) | 0 (0.0%) |
| 35 to 44 Years | 531 (89.4%) | 10 (1.9%) |
| 45 to 54 Years | 582 (92.4%) | 23 (4.0%) |
| 55 to 59 Years | 250 (77.9%) | 10 (4.0%) |
| 60 to 64 Years | 230 (46.7%) | 0 (0.0%) |
| 65 to 74 Years | 208 (29.2%) | 0 (0.0%) |
| 75 Years and over | 5 (1.1%) | 0 (0.0%) |
| Total | 2,600 (59.9%) | 70 (2.7%) |
Employment Status by Educational Attainment in Macon
According to labor force statistics for Macon, 79.5% of individuals (2,060) out of the total population between 25 and 64 years of age (2,591) are in the labor force, with 2.3% or 47 of them being unemployed. The group with the highest labor force participation rate are those with the educational attainment of bachelor's degree or higher, with 93.4% or 509 individuals in the labor force. Within the labor force, individuals with bachelor's degree or higher education have the highest percentage of unemployment, with 4.5% or 23 of them being unemployed.
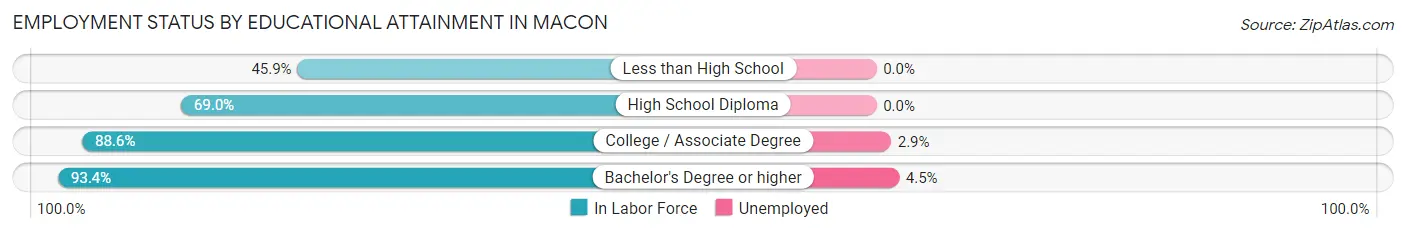
| Educational Attainment | In Labor Force | Unemployed |
| Less than High School | 83 (45.9%) | 0 (0.0%) |
| High School Diploma | 646 (69.0%) | 0 (0.0%) |
| College / Associate Degree | 823 (88.6%) | 27 (2.9%) |
| Bachelor's Degree or higher | 509 (93.4%) | 25 (4.5%) |
| Total | 2,060 (79.5%) | 60 (2.3%) |
Employment Occupations by Sex in Macon
Management, Business, Science and Arts Occupations
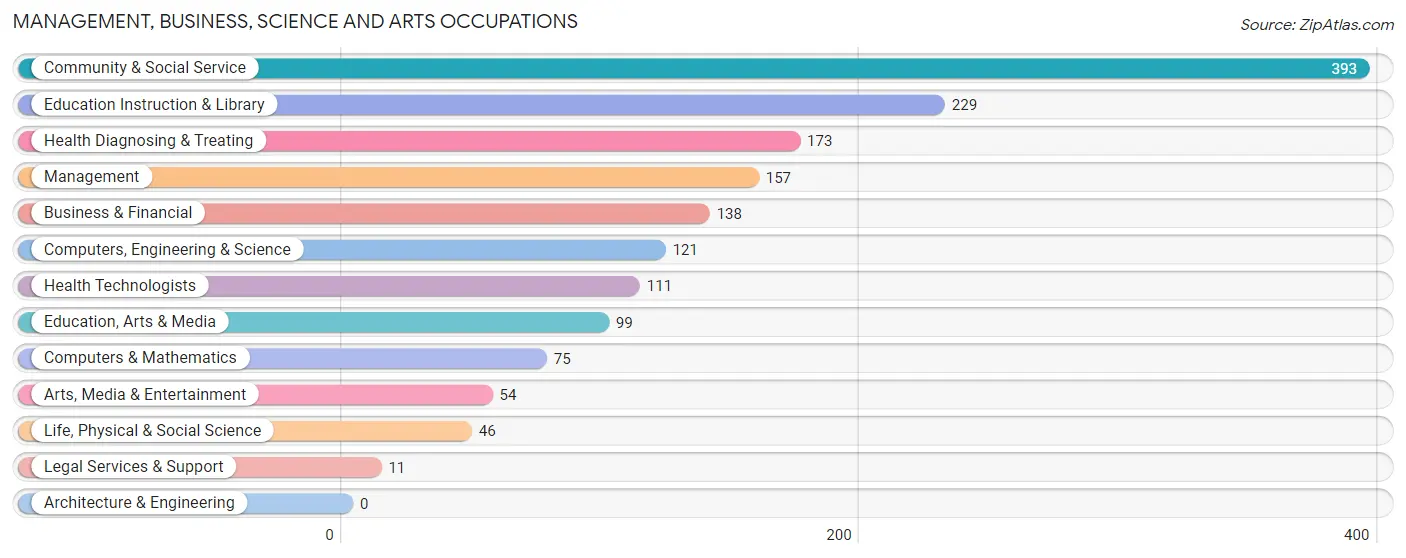
The most common Management, Business, Science and Arts occupations in Macon are Community & Social Service (393 | 15.5%), Education Instruction & Library (229 | 9.0%), Health Diagnosing & Treating (173 | 6.8%), Management (157 | 6.2%), and Business & Financial (138 | 5.4%).
Management, Business, Science and Arts Occupations by Sex
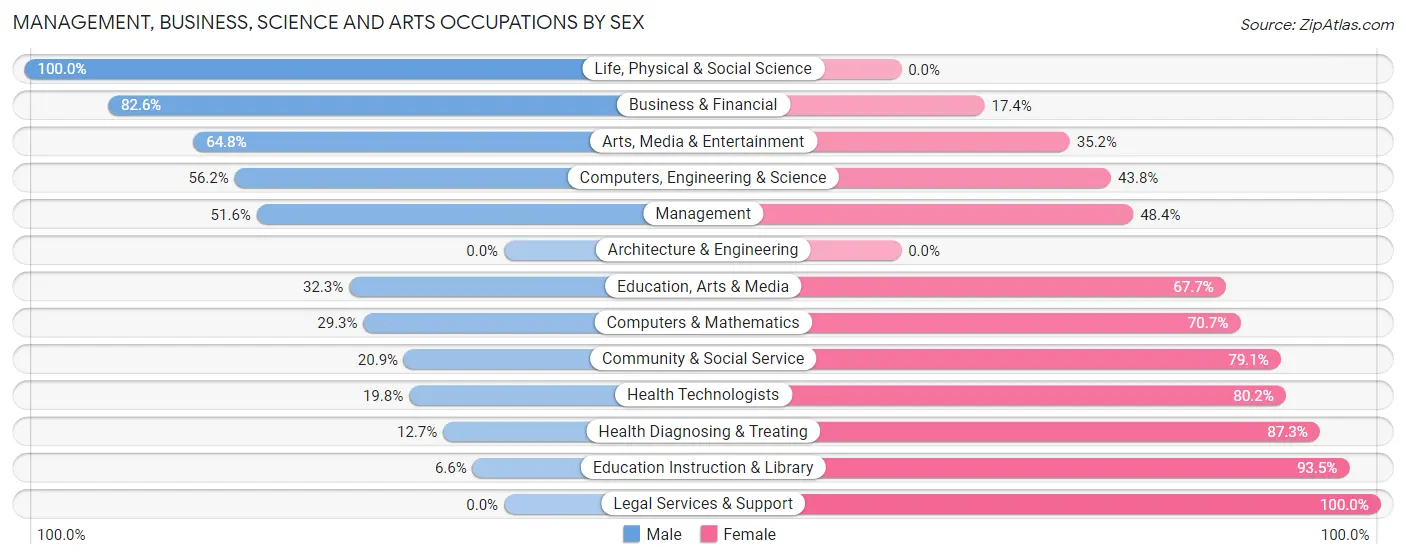
Within the Management, Business, Science and Arts occupations in Macon, the most male-oriented occupations are Life, Physical & Social Science (100.0%), Business & Financial (82.6%), and Arts, Media & Entertainment (64.8%), while the most female-oriented occupations are Legal Services & Support (100.0%), Education Instruction & Library (93.4%), and Health Diagnosing & Treating (87.3%).
| Occupation | Male | Female |
| Management | 81 (51.6%) | 76 (48.4%) |
| Business & Financial | 114 (82.6%) | 24 (17.4%) |
| Computers, Engineering & Science | 68 (56.2%) | 53 (43.8%) |
| Computers & Mathematics | 22 (29.3%) | 53 (70.7%) |
| Architecture & Engineering | 0 (0.0%) | 0 (0.0%) |
| Life, Physical & Social Science | 46 (100.0%) | 0 (0.0%) |
| Community & Social Service | 82 (20.9%) | 311 (79.1%) |
| Education, Arts & Media | 32 (32.3%) | 67 (67.7%) |
| Legal Services & Support | 0 (0.0%) | 11 (100.0%) |
| Education Instruction & Library | 15 (6.6%) | 214 (93.4%) |
| Arts, Media & Entertainment | 35 (64.8%) | 19 (35.2%) |
| Health Diagnosing & Treating | 22 (12.7%) | 151 (87.3%) |
| Health Technologists | 22 (19.8%) | 89 (80.2%) |
| Total (Category) | 367 (37.4%) | 615 (62.6%) |
| Total (Overall) | 1,210 (47.8%) | 1,321 (52.2%) |
Services Occupations
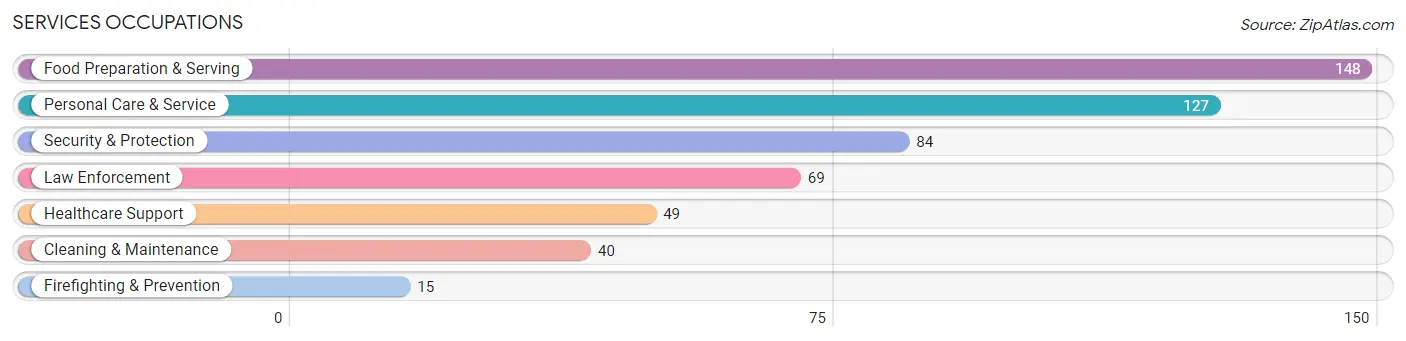
The most common Services occupations in Macon are Food Preparation & Serving (148 | 5.9%), Personal Care & Service (127 | 5.0%), Security & Protection (84 | 3.3%), Law Enforcement (69 | 2.7%), and Healthcare Support (49 | 1.9%).
Services Occupations by Sex
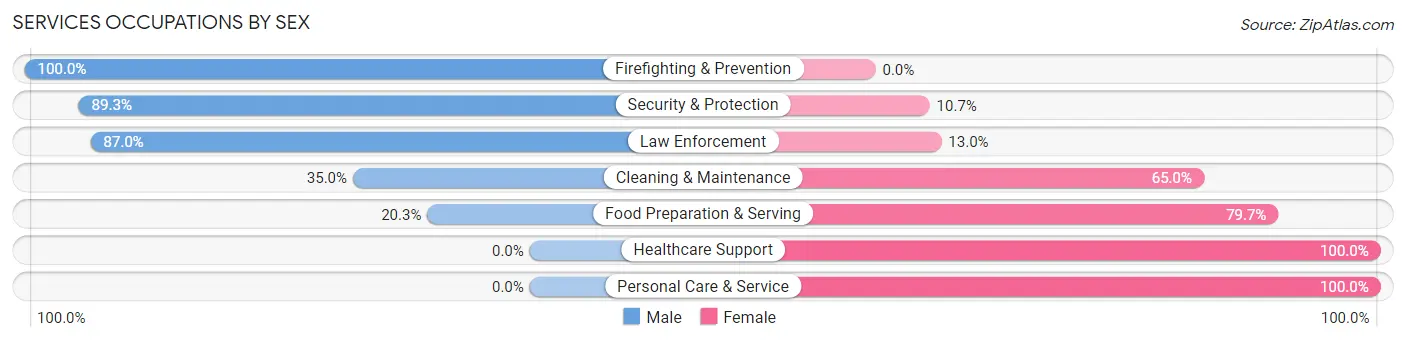
Within the Services occupations in Macon, the most male-oriented occupations are Firefighting & Prevention (100.0%), Security & Protection (89.3%), and Law Enforcement (87.0%), while the most female-oriented occupations are Healthcare Support (100.0%), Personal Care & Service (100.0%), and Food Preparation & Serving (79.7%).
| Occupation | Male | Female |
| Healthcare Support | 0 (0.0%) | 49 (100.0%) |
| Security & Protection | 75 (89.3%) | 9 (10.7%) |
| Firefighting & Prevention | 15 (100.0%) | 0 (0.0%) |
| Law Enforcement | 60 (87.0%) | 9 (13.0%) |
| Food Preparation & Serving | 30 (20.3%) | 118 (79.7%) |
| Cleaning & Maintenance | 14 (35.0%) | 26 (65.0%) |
| Personal Care & Service | 0 (0.0%) | 127 (100.0%) |
| Total (Category) | 119 (26.6%) | 329 (73.4%) |
| Total (Overall) | 1,210 (47.8%) | 1,321 (52.2%) |
Sales and Office Occupations
The most common Sales and Office occupations in Macon are Sales & Related (258 | 10.2%), and Office & Administration (216 | 8.5%).

Sales and Office Occupations by Sex
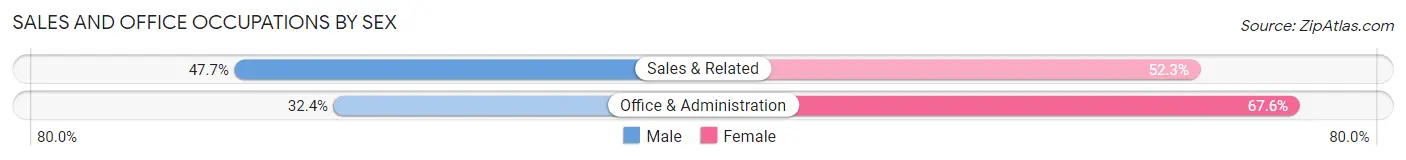
| Occupation | Male | Female |
| Sales & Related | 123 (47.7%) | 135 (52.3%) |
| Office & Administration | 70 (32.4%) | 146 (67.6%) |
| Total (Category) | 193 (40.7%) | 281 (59.3%) |
| Total (Overall) | 1,210 (47.8%) | 1,321 (52.2%) |
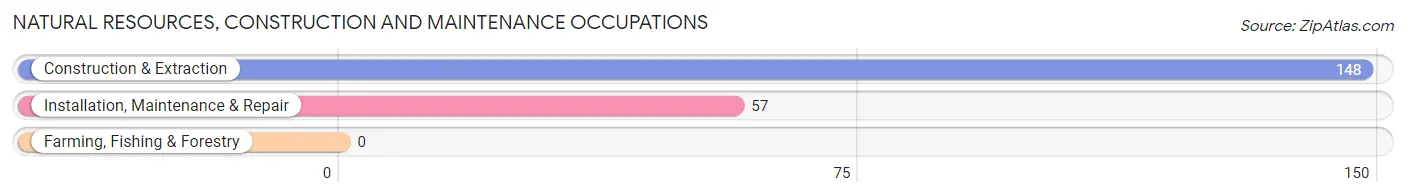
Natural Resources, Construction and Maintenance Occupations
The most common Natural Resources, Construction and Maintenance occupations in Macon are Construction & Extraction (148 | 5.9%), and Installation, Maintenance & Repair (57 | 2.2%).
Natural Resources, Construction and Maintenance Occupations by Sex
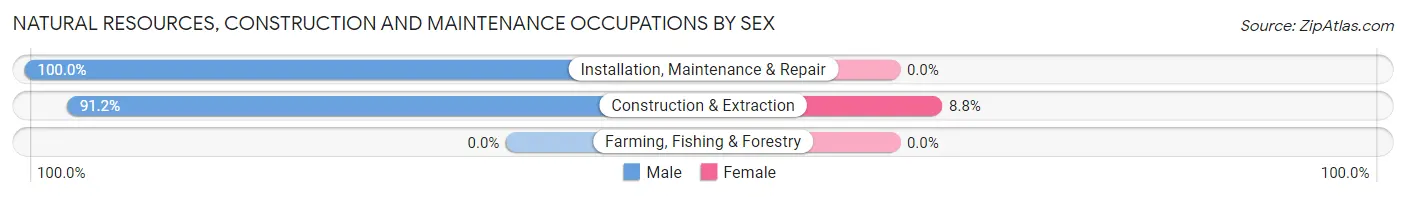
| Occupation | Male | Female |
| Farming, Fishing & Forestry | 0 (0.0%) | 0 (0.0%) |
| Construction & Extraction | 135 (91.2%) | 13 (8.8%) |
| Installation, Maintenance & Repair | 57 (100.0%) | 0 (0.0%) |
| Total (Category) | 192 (93.7%) | 13 (6.3%) |
| Total (Overall) | 1,210 (47.8%) | 1,321 (52.2%) |
Production, Transportation and Moving Occupations
The most common Production, Transportation and Moving occupations in Macon are Production (208 | 8.2%), Material Moving (118 | 4.7%), and Transportation (96 | 3.8%).
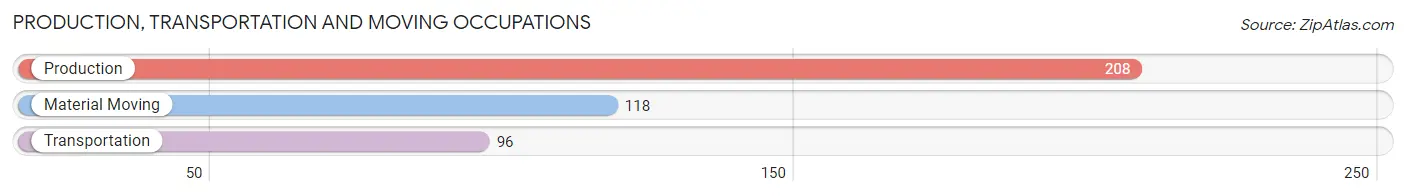
Production, Transportation and Moving Occupations by Sex
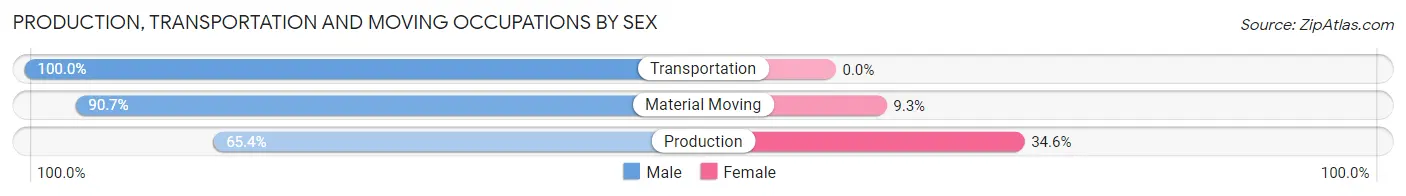
| Occupation | Male | Female |
| Production | 136 (65.4%) | 72 (34.6%) |
| Transportation | 96 (100.0%) | 0 (0.0%) |
| Material Moving | 107 (90.7%) | 11 (9.3%) |
| Total (Category) | 339 (80.3%) | 83 (19.7%) |
| Total (Overall) | 1,210 (47.8%) | 1,321 (52.2%) |
Employment Industries by Sex in Macon
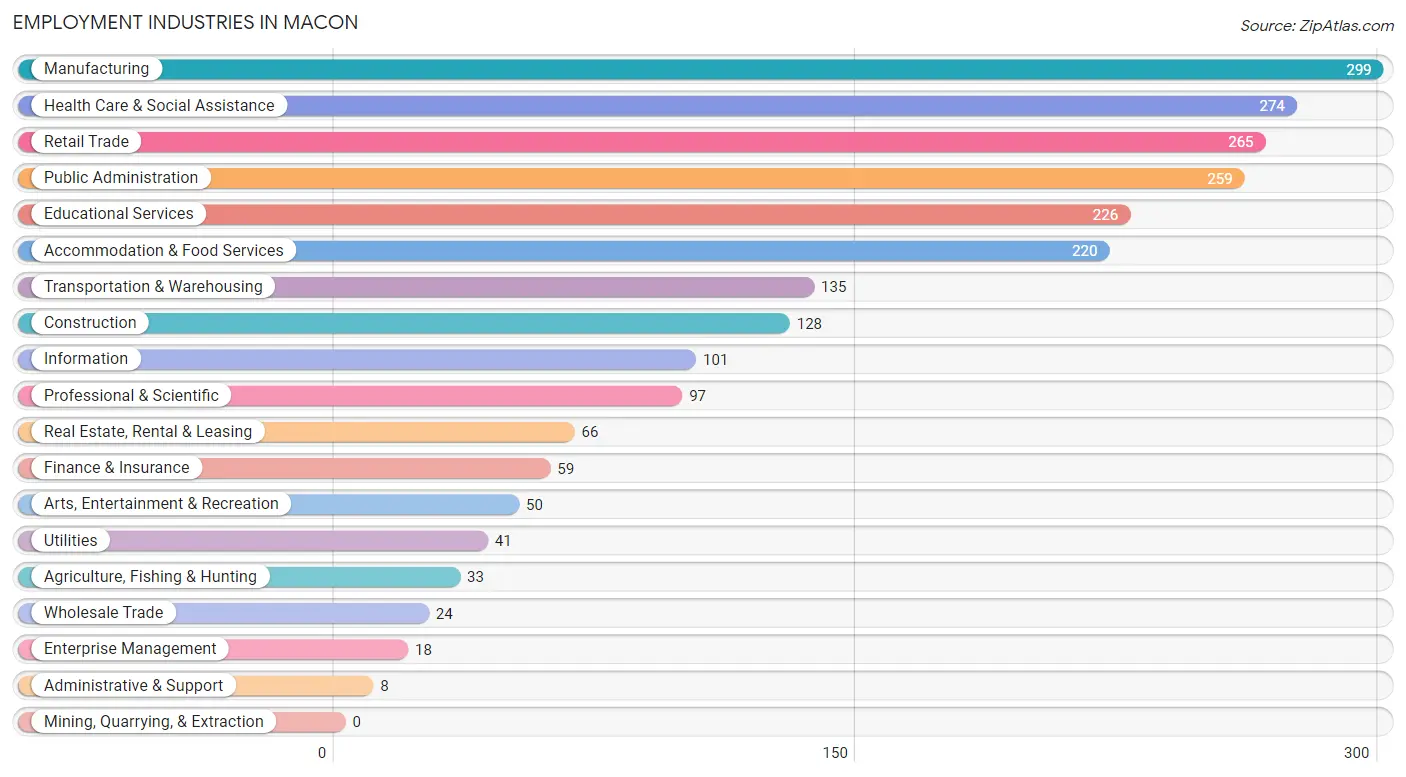
Employment Industries in Macon
The major employment industries in Macon include Manufacturing (299 | 11.8%), Health Care & Social Assistance (274 | 10.8%), Retail Trade (265 | 10.5%), Public Administration (259 | 10.2%), and Educational Services (226 | 8.9%).
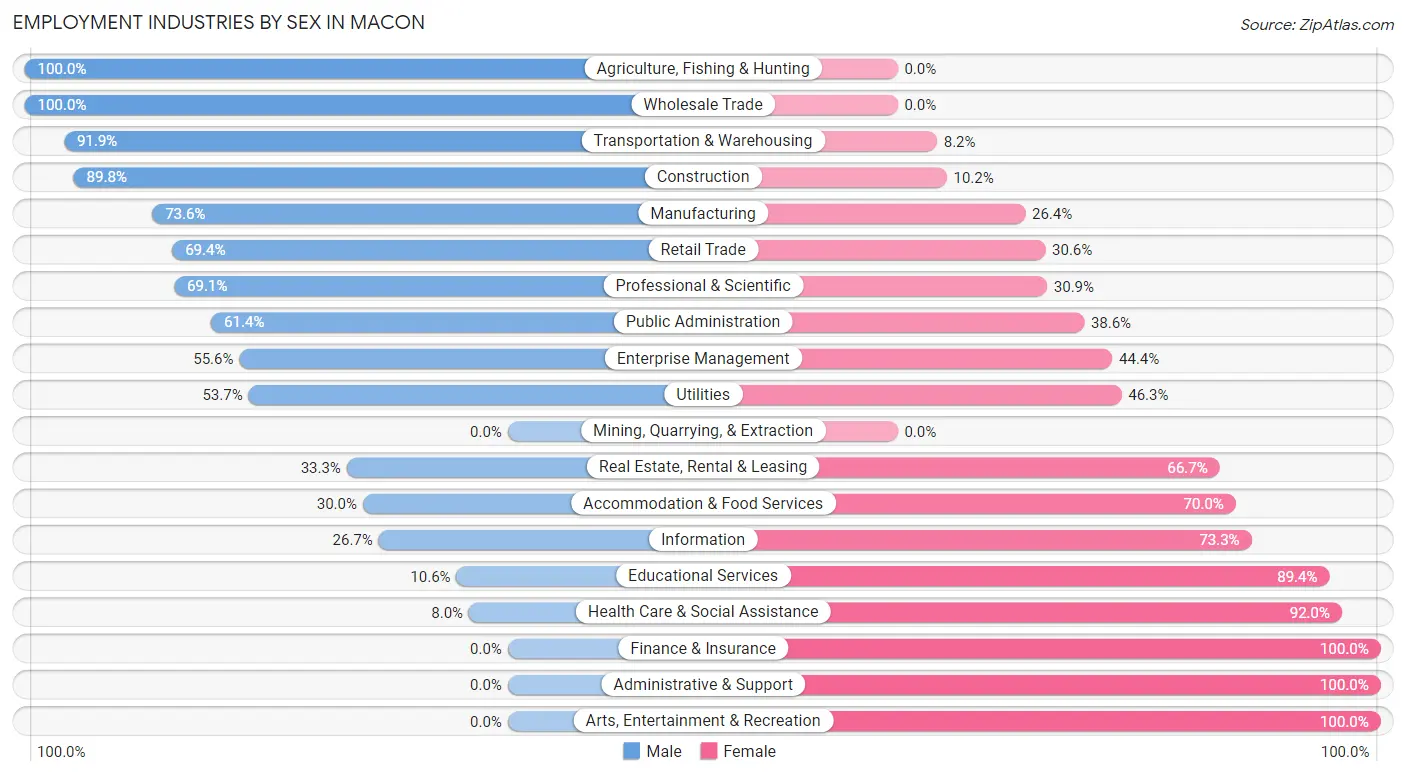
Employment Industries by Sex in Macon
The Macon industries that see more men than women are Agriculture, Fishing & Hunting (100.0%), Wholesale Trade (100.0%), and Transportation & Warehousing (91.8%), whereas the industries that tend to have a higher number of women are Finance & Insurance (100.0%), Administrative & Support (100.0%), and Arts, Entertainment & Recreation (100.0%).
| Industry | Male | Female |
| Agriculture, Fishing & Hunting | 33 (100.0%) | 0 (0.0%) |
| Mining, Quarrying, & Extraction | 0 (0.0%) | 0 (0.0%) |
| Construction | 115 (89.8%) | 13 (10.2%) |
| Manufacturing | 220 (73.6%) | 79 (26.4%) |
| Wholesale Trade | 24 (100.0%) | 0 (0.0%) |
| Retail Trade | 184 (69.4%) | 81 (30.6%) |
| Transportation & Warehousing | 124 (91.8%) | 11 (8.2%) |
| Utilities | 22 (53.7%) | 19 (46.3%) |
| Information | 27 (26.7%) | 74 (73.3%) |
| Finance & Insurance | 0 (0.0%) | 59 (100.0%) |
| Real Estate, Rental & Leasing | 22 (33.3%) | 44 (66.7%) |
| Professional & Scientific | 67 (69.1%) | 30 (30.9%) |
| Enterprise Management | 10 (55.6%) | 8 (44.4%) |
| Administrative & Support | 0 (0.0%) | 8 (100.0%) |
| Educational Services | 24 (10.6%) | 202 (89.4%) |
| Health Care & Social Assistance | 22 (8.0%) | 252 (92.0%) |
| Arts, Entertainment & Recreation | 0 (0.0%) | 50 (100.0%) |
| Accommodation & Food Services | 66 (30.0%) | 154 (70.0%) |
| Public Administration | 159 (61.4%) | 100 (38.6%) |
| Total | 1,210 (47.8%) | 1,321 (52.2%) |
Education in Macon
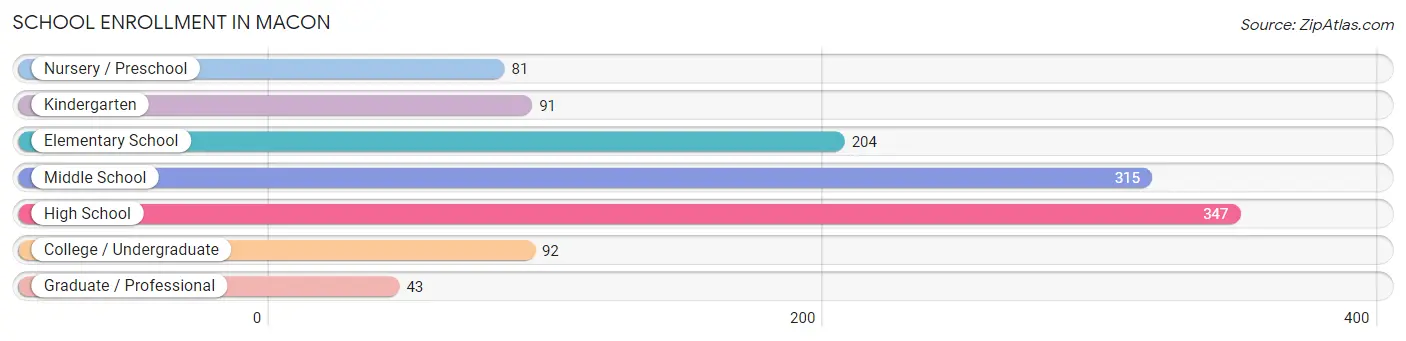
School Enrollment in Macon
The most common levels of schooling among the 1,173 students in Macon are high school (347 | 29.6%), middle school (315 | 26.9%), and elementary school (204 | 17.4%).
| School Level | # Students | % Students |
| Nursery / Preschool | 81 | 6.9% |
| Kindergarten | 91 | 7.8% |
| Elementary School | 204 | 17.4% |
| Middle School | 315 | 26.9% |
| High School | 347 | 29.6% |
| College / Undergraduate | 92 | 7.8% |
| Graduate / Professional | 43 | 3.7% |
| Total | 1,173 | 100.0% |
School Enrollment by Age by Funding Source in Macon
Out of a total of 1,173 students who are enrolled in schools in Macon, 218 (18.6%) attend a private institution, while the remaining 955 (81.4%) are enrolled in public schools. The age group of 25 to 34 year olds has the highest likelihood of being enrolled in private schools, with 11 (73.3% in the age bracket) enrolled. Conversely, the age group of 18 to 19 year olds has the lowest likelihood of being enrolled in a private school, with 80 (100.0% in the age bracket) attending a public institution.
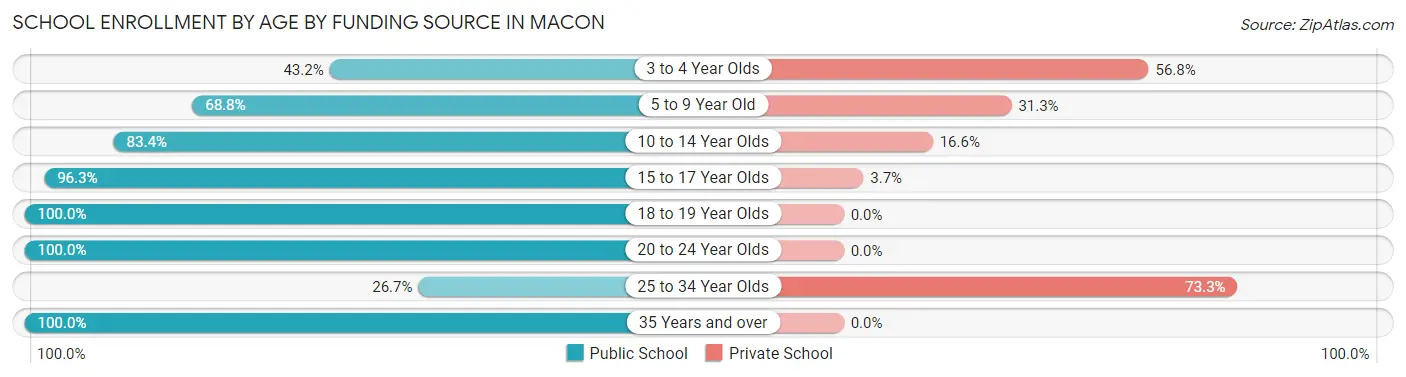
| Age Bracket | Public School | Private School |
| 3 to 4 Year Olds | 35 (43.2%) | 46 (56.8%) |
| 5 to 9 Year Old | 176 (68.8%) | 80 (31.2%) |
| 10 to 14 Year Olds | 362 (83.4%) | 72 (16.6%) |
| 15 to 17 Year Olds | 237 (96.3%) | 9 (3.7%) |
| 18 to 19 Year Olds | 80 (100.0%) | 0 (0.0%) |
| 20 to 24 Year Olds | 31 (100.0%) | 0 (0.0%) |
| 25 to 34 Year Olds | 4 (26.7%) | 11 (73.3%) |
| 35 Years and over | 30 (100.0%) | 0 (0.0%) |
| Total | 955 (81.4%) | 218 (18.6%) |
Educational Attainment by Field of Study in Macon
Education (209 | 27.1%), arts & humanities (82 | 10.6%), business (77 | 10.0%), liberal arts & history (72 | 9.3%), and science & technology (61 | 7.9%) are the most common fields of study among 770 individuals in Macon who have obtained a bachelor's degree or higher.
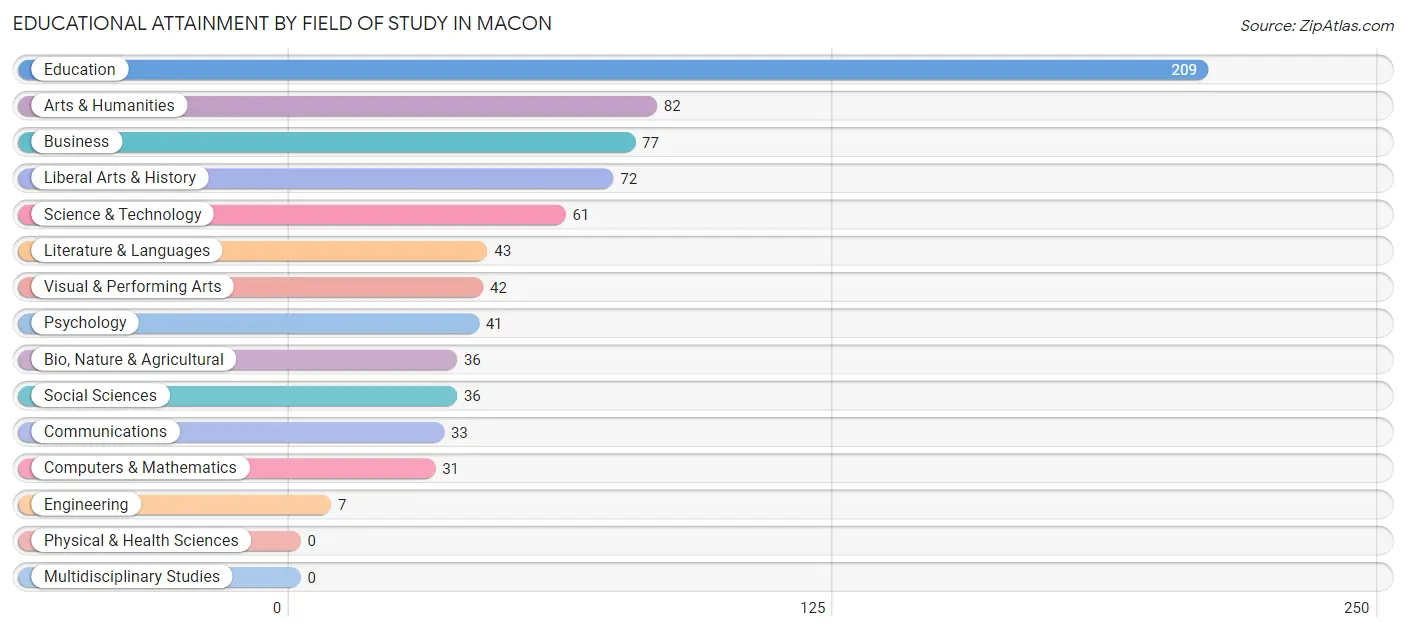
| Field of Study | # Graduates | % Graduates |
| Computers & Mathematics | 31 | 4.0% |
| Bio, Nature & Agricultural | 36 | 4.7% |
| Physical & Health Sciences | 0 | 0.0% |
| Psychology | 41 | 5.3% |
| Social Sciences | 36 | 4.7% |
| Engineering | 7 | 0.9% |
| Multidisciplinary Studies | 0 | 0.0% |
| Science & Technology | 61 | 7.9% |
| Business | 77 | 10.0% |
| Education | 209 | 27.1% |
| Literature & Languages | 43 | 5.6% |
| Liberal Arts & History | 72 | 9.3% |
| Visual & Performing Arts | 42 | 5.4% |
| Communications | 33 | 4.3% |
| Arts & Humanities | 82 | 10.6% |
| Total | 770 | 100.0% |
Transportation & Commute in Macon
Vehicle Availability by Sex in Macon
The most prevalent vehicle ownership categories in Macon are males with 2 vehicles (452, accounting for 37.4%) and females with 2 vehicles (380, making up 34.5%).
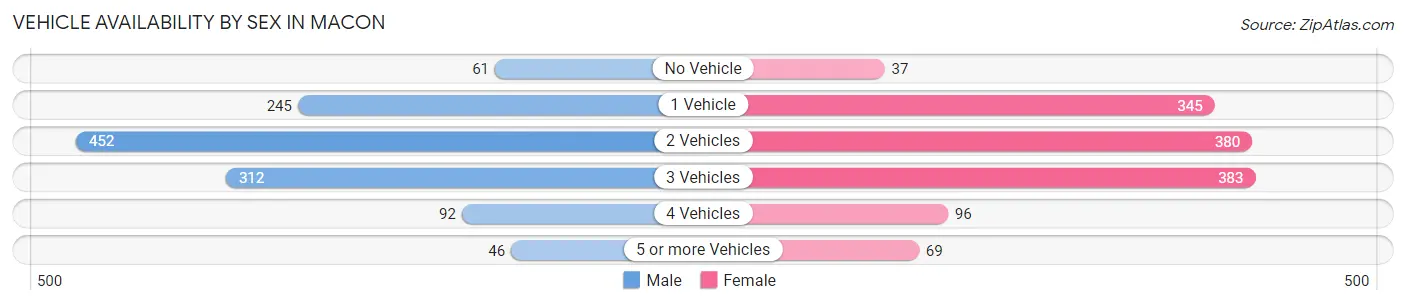
| Vehicles Available | Male | Female |
| No Vehicle | 61 (5.1%) | 37 (2.8%) |
| 1 Vehicle | 245 (20.3%) | 345 (26.3%) |
| 2 Vehicles | 452 (37.4%) | 380 (29.0%) |
| 3 Vehicles | 312 (25.8%) | 383 (29.2%) |
| 4 Vehicles | 92 (7.6%) | 96 (7.3%) |
| 5 or more Vehicles | 46 (3.8%) | 69 (5.3%) |
| Total | 1,208 (100.0%) | 1,310 (100.0%) |
Commute Time in Macon
The most frequently occuring commute durations in Macon are 5 to 9 minutes (746 commuters, 30.8%), less than 5 minutes (347 commuters, 14.3%), and 10 to 14 minutes (277 commuters, 11.5%).
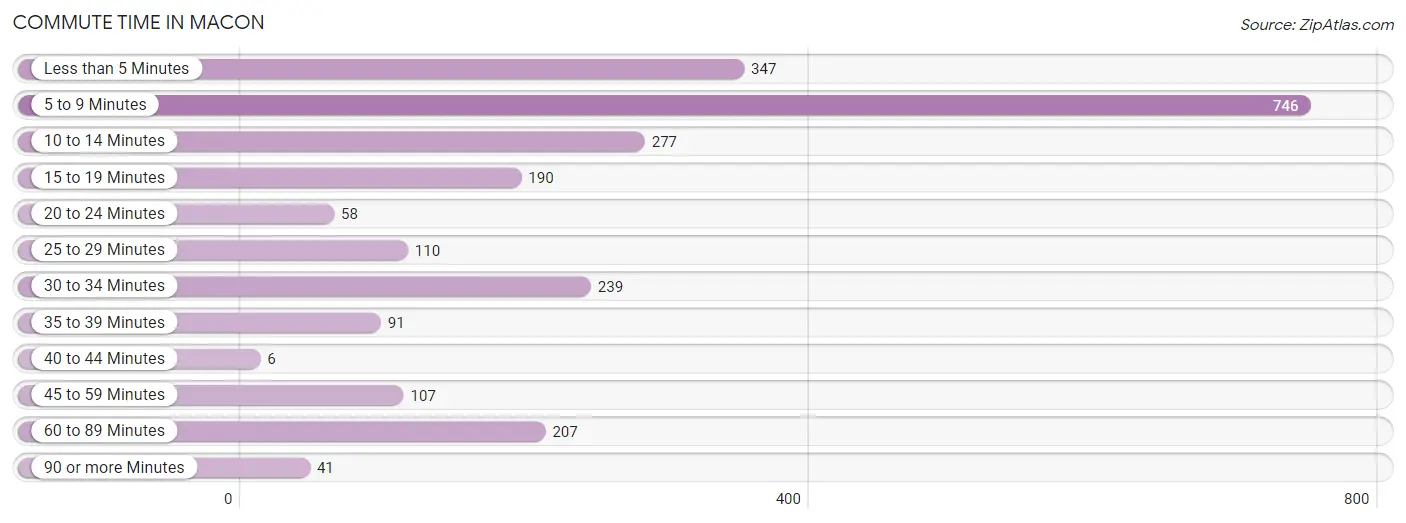
| Commute Time | # Commuters | % Commuters |
| Less than 5 Minutes | 347 | 14.3% |
| 5 to 9 Minutes | 746 | 30.8% |
| 10 to 14 Minutes | 277 | 11.5% |
| 15 to 19 Minutes | 190 | 7.9% |
| 20 to 24 Minutes | 58 | 2.4% |
| 25 to 29 Minutes | 110 | 4.5% |
| 30 to 34 Minutes | 239 | 9.9% |
| 35 to 39 Minutes | 91 | 3.8% |
| 40 to 44 Minutes | 6 | 0.3% |
| 45 to 59 Minutes | 107 | 4.4% |
| 60 to 89 Minutes | 207 | 8.6% |
| 90 or more Minutes | 41 | 1.7% |
Commute Time by Sex in Macon
The most common commute times in Macon are 5 to 9 minutes (293 commuters, 25.8%) for males and 5 to 9 minutes (453 commuters, 35.3%) for females.
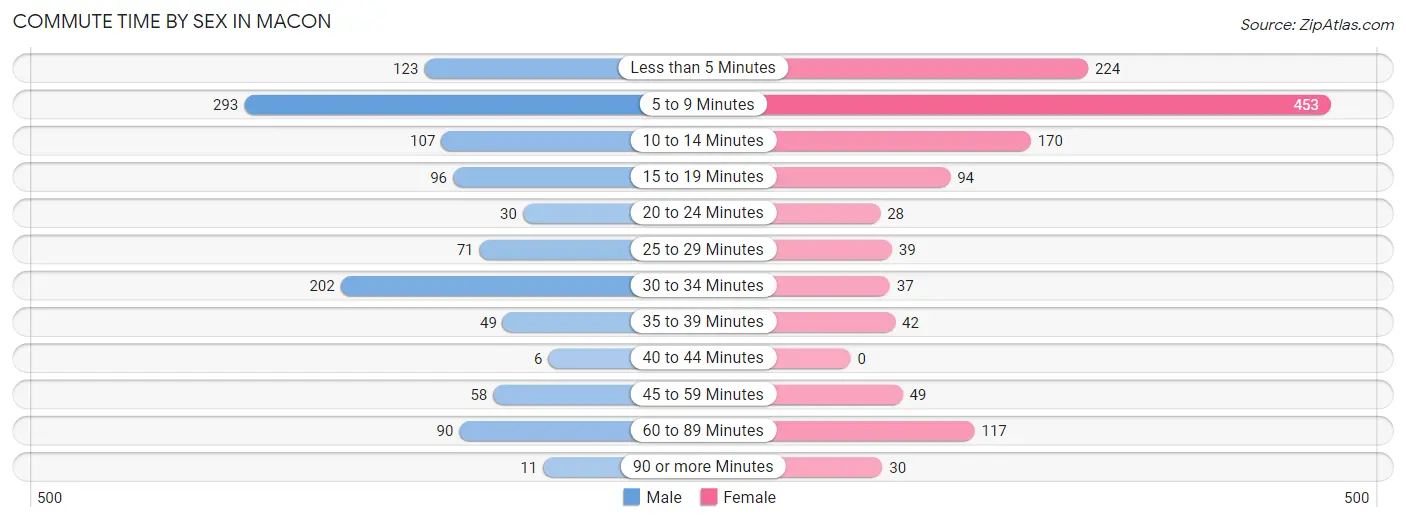
| Commute Time | Male | Female |
| Less than 5 Minutes | 123 (10.8%) | 224 (17.5%) |
| 5 to 9 Minutes | 293 (25.8%) | 453 (35.3%) |
| 10 to 14 Minutes | 107 (9.4%) | 170 (13.3%) |
| 15 to 19 Minutes | 96 (8.5%) | 94 (7.3%) |
| 20 to 24 Minutes | 30 (2.6%) | 28 (2.2%) |
| 25 to 29 Minutes | 71 (6.2%) | 39 (3.0%) |
| 30 to 34 Minutes | 202 (17.8%) | 37 (2.9%) |
| 35 to 39 Minutes | 49 (4.3%) | 42 (3.3%) |
| 40 to 44 Minutes | 6 (0.5%) | 0 (0.0%) |
| 45 to 59 Minutes | 58 (5.1%) | 49 (3.8%) |
| 60 to 89 Minutes | 90 (7.9%) | 117 (9.1%) |
| 90 or more Minutes | 11 (1.0%) | 30 (2.3%) |
Time of Departure to Work by Sex in Macon
The most frequent times of departure to work in Macon are 7:30 AM to 7:59 AM (242, 21.3%) for males and 7:30 AM to 7:59 AM (395, 30.8%) for females.
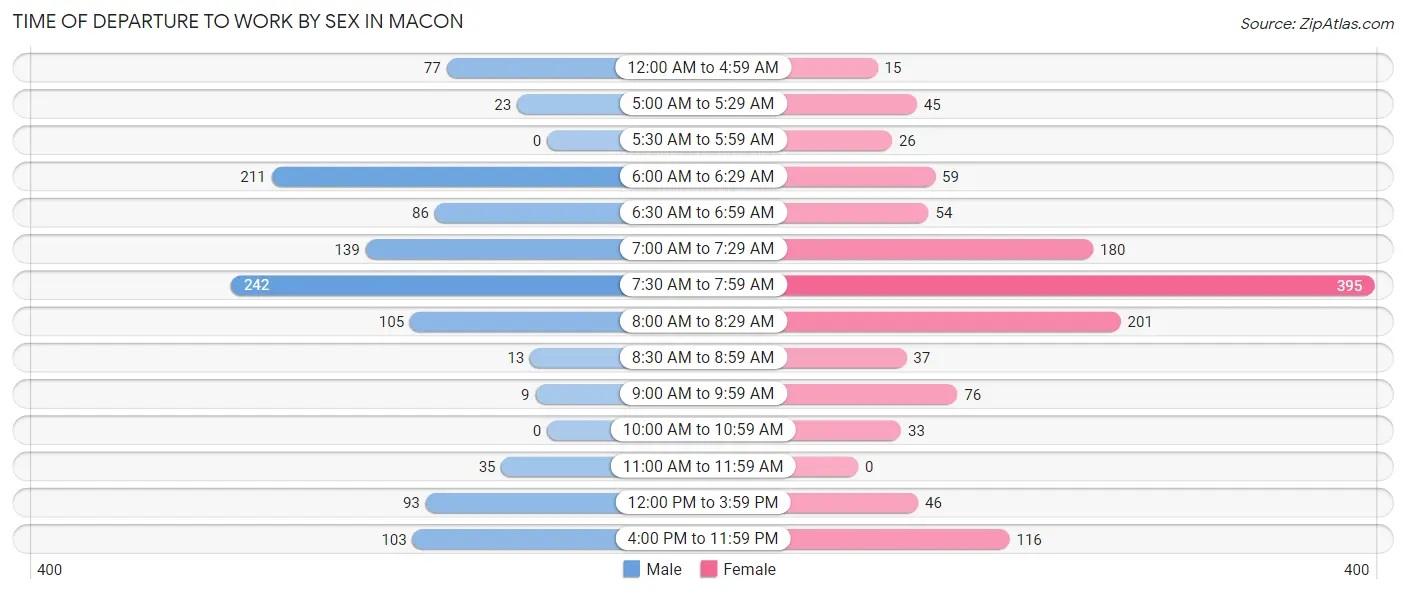
| Time of Departure | Male | Female |
| 12:00 AM to 4:59 AM | 77 (6.8%) | 15 (1.2%) |
| 5:00 AM to 5:29 AM | 23 (2.0%) | 45 (3.5%) |
| 5:30 AM to 5:59 AM | 0 (0.0%) | 26 (2.0%) |
| 6:00 AM to 6:29 AM | 211 (18.6%) | 59 (4.6%) |
| 6:30 AM to 6:59 AM | 86 (7.6%) | 54 (4.2%) |
| 7:00 AM to 7:29 AM | 139 (12.2%) | 180 (14.0%) |
| 7:30 AM to 7:59 AM | 242 (21.3%) | 395 (30.8%) |
| 8:00 AM to 8:29 AM | 105 (9.2%) | 201 (15.7%) |
| 8:30 AM to 8:59 AM | 13 (1.1%) | 37 (2.9%) |
| 9:00 AM to 9:59 AM | 9 (0.8%) | 76 (5.9%) |
| 10:00 AM to 10:59 AM | 0 (0.0%) | 33 (2.6%) |
| 11:00 AM to 11:59 AM | 35 (3.1%) | 0 (0.0%) |
| 12:00 PM to 3:59 PM | 93 (8.2%) | 46 (3.6%) |
| 4:00 PM to 11:59 PM | 103 (9.1%) | 116 (9.0%) |
| Total | 1,136 (100.0%) | 1,283 (100.0%) |
Housing Occupancy in Macon
Occupancy by Ownership in Macon
Of the total 2,323 dwellings in Macon, owner-occupied units account for 1,503 (64.7%), while renter-occupied units make up 820 (35.3%).
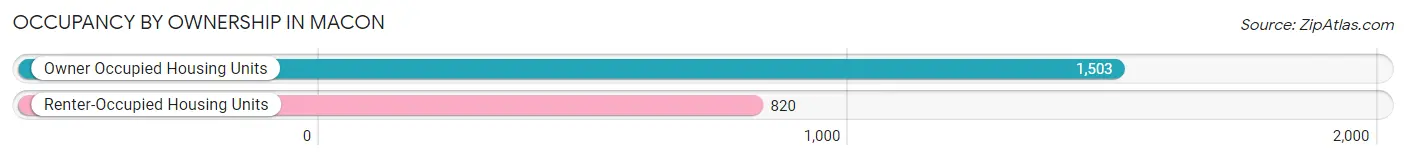
| Occupancy | # Housing Units | % Housing Units |
| Owner Occupied Housing Units | 1,503 | 64.7% |
| Renter-Occupied Housing Units | 820 | 35.3% |
| Total Occupied Housing Units | 2,323 | 100.0% |
Occupancy by Household Size in Macon
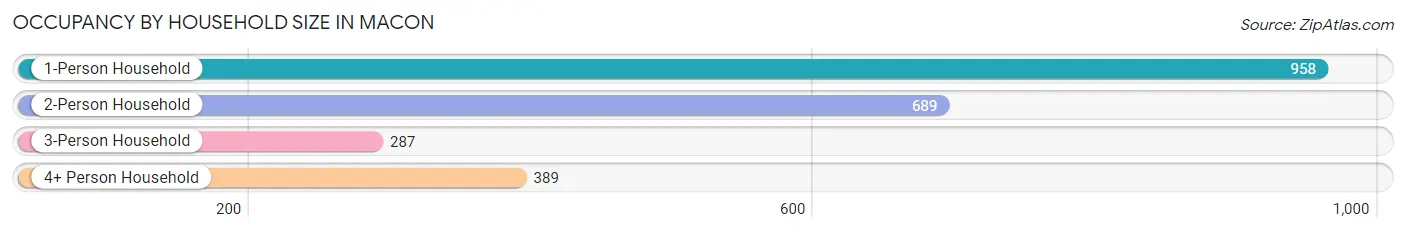
| Household Size | # Housing Units | % Housing Units |
| 1-Person Household | 958 | 41.2% |
| 2-Person Household | 689 | 29.7% |
| 3-Person Household | 287 | 12.3% |
| 4+ Person Household | 389 | 16.8% |
| Total Housing Units | 2,323 | 100.0% |
Occupancy by Ownership by Household Size in Macon
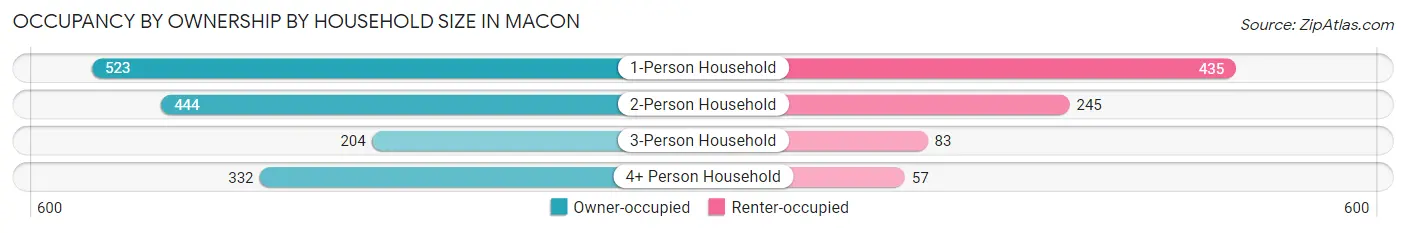
| Household Size | Owner-occupied | Renter-occupied |
| 1-Person Household | 523 (54.6%) | 435 (45.4%) |
| 2-Person Household | 444 (64.4%) | 245 (35.6%) |
| 3-Person Household | 204 (71.1%) | 83 (28.9%) |
| 4+ Person Household | 332 (85.4%) | 57 (14.6%) |
| Total Housing Units | 1,503 (64.7%) | 820 (35.3%) |
Occupancy by Educational Attainment in Macon
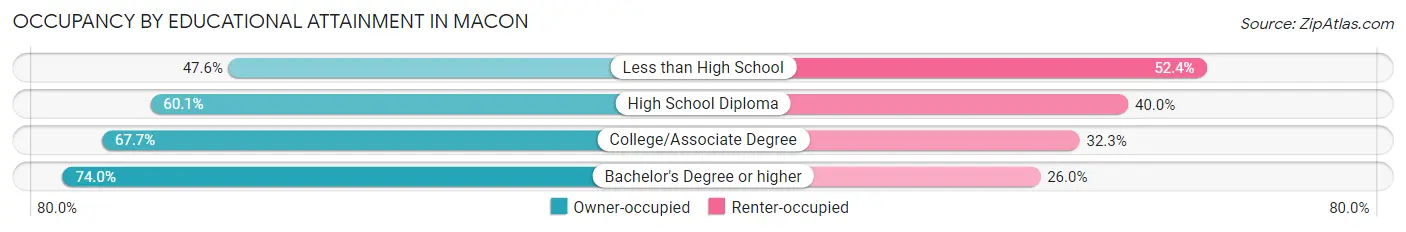
| Household Size | Owner-occupied | Renter-occupied |
| Less than High School | 90 (47.6%) | 99 (52.4%) |
| High School Diploma | 481 (60.1%) | 320 (40.0%) |
| College/Associate Degree | 588 (67.7%) | 280 (32.3%) |
| Bachelor's Degree or higher | 344 (74.0%) | 121 (26.0%) |
Occupancy by Age of Householder in Macon
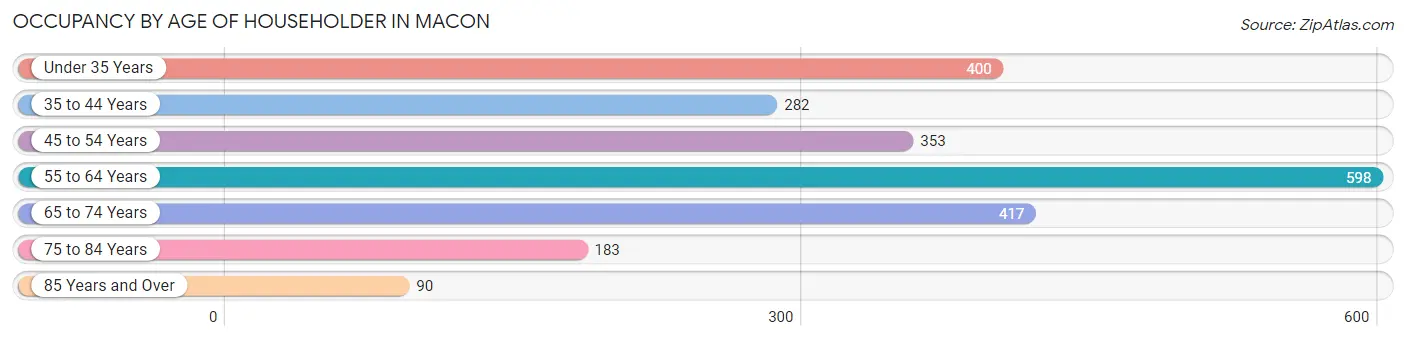
| Age Bracket | # Households | % Households |
| Under 35 Years | 400 | 17.2% |
| 35 to 44 Years | 282 | 12.1% |
| 45 to 54 Years | 353 | 15.2% |
| 55 to 64 Years | 598 | 25.7% |
| 65 to 74 Years | 417 | 17.9% |
| 75 to 84 Years | 183 | 7.9% |
| 85 Years and Over | 90 | 3.9% |
| Total | 2,323 | 100.0% |
Housing Finances in Macon
Median Income by Occupancy in Macon
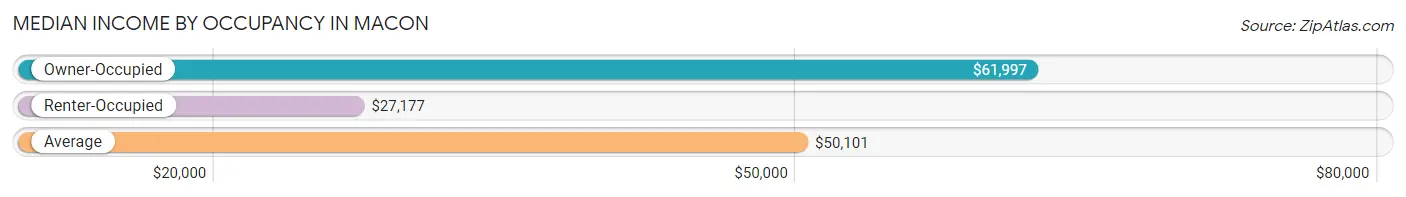
| Occupancy Type | # Households | Median Income |
| Owner-Occupied | 1,503 (64.7%) | $61,997 |
| Renter-Occupied | 820 (35.3%) | $27,177 |
| Average | 2,323 (100.0%) | $50,101 |
Occupancy by Householder Income Bracket in Macon
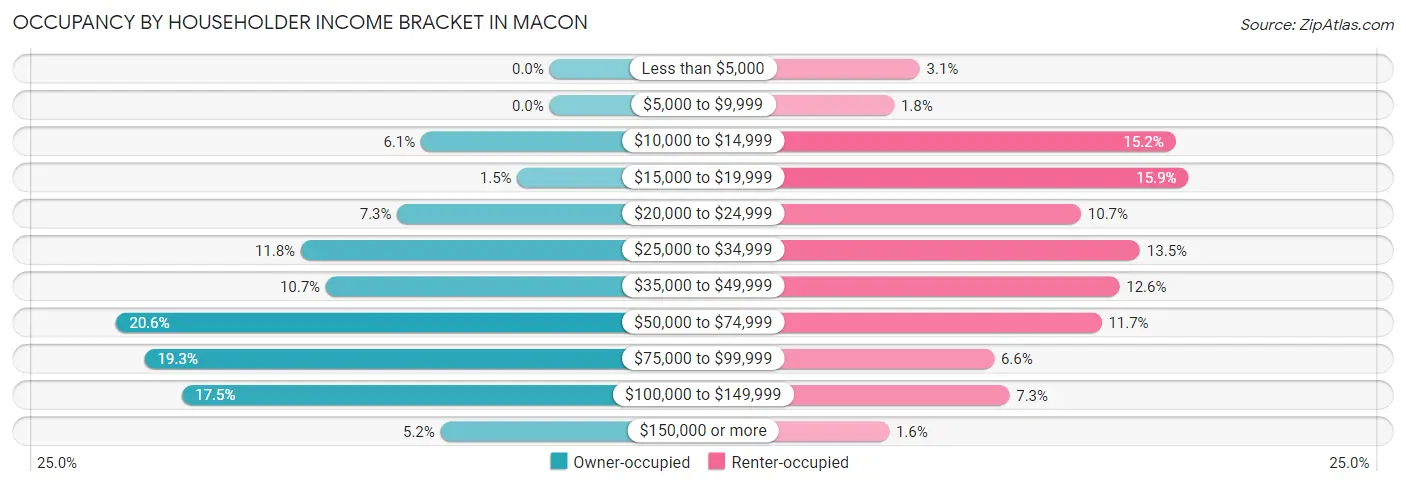
| Income Bracket | Owner-occupied | Renter-occupied |
| Less than $5,000 | 0 (0.0%) | 25 (3.0%) |
| $5,000 to $9,999 | 0 (0.0%) | 15 (1.8%) |
| $10,000 to $14,999 | 92 (6.1%) | 125 (15.2%) |
| $15,000 to $19,999 | 23 (1.5%) | 130 (15.9%) |
| $20,000 to $24,999 | 109 (7.2%) | 88 (10.7%) |
| $25,000 to $34,999 | 178 (11.8%) | 111 (13.5%) |
| $35,000 to $49,999 | 160 (10.6%) | 103 (12.6%) |
| $50,000 to $74,999 | 310 (20.6%) | 96 (11.7%) |
| $75,000 to $99,999 | 290 (19.3%) | 54 (6.6%) |
| $100,000 to $149,999 | 263 (17.5%) | 60 (7.3%) |
| $150,000 or more | 78 (5.2%) | 13 (1.6%) |
| Total | 1,503 (100.0%) | 820 (100.0%) |
Monthly Housing Cost Tiers in Macon
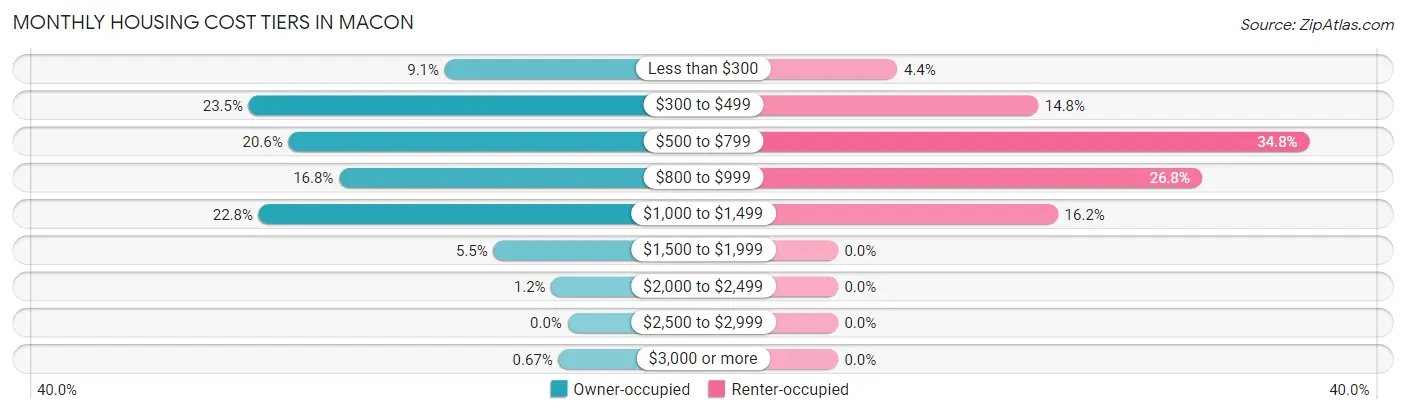
| Monthly Cost | Owner-occupied | Renter-occupied |
| Less than $300 | 136 (9.0%) | 36 (4.4%) |
| $300 to $499 | 353 (23.5%) | 121 (14.8%) |
| $500 to $799 | 309 (20.6%) | 285 (34.8%) |
| $800 to $999 | 253 (16.8%) | 220 (26.8%) |
| $1,000 to $1,499 | 342 (22.8%) | 133 (16.2%) |
| $1,500 to $1,999 | 82 (5.5%) | 0 (0.0%) |
| $2,000 to $2,499 | 18 (1.2%) | 0 (0.0%) |
| $2,500 to $2,999 | 0 (0.0%) | 0 (0.0%) |
| $3,000 or more | 10 (0.7%) | 0 (0.0%) |
| Total | 1,503 (100.0%) | 820 (100.0%) |
Physical Housing Characteristics in Macon
Housing Structures in Macon
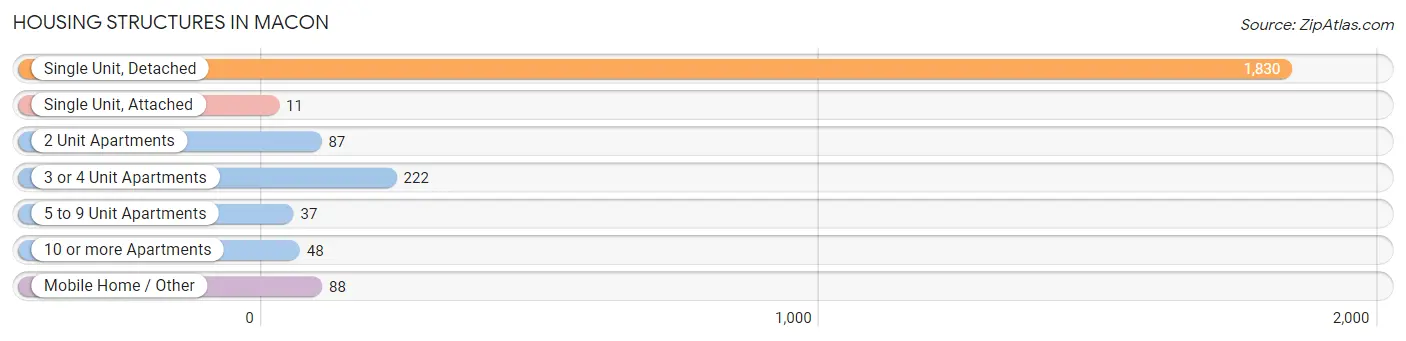
| Structure Type | # Housing Units | % Housing Units |
| Single Unit, Detached | 1,830 | 78.8% |
| Single Unit, Attached | 11 | 0.5% |
| 2 Unit Apartments | 87 | 3.7% |
| 3 or 4 Unit Apartments | 222 | 9.6% |
| 5 to 9 Unit Apartments | 37 | 1.6% |
| 10 or more Apartments | 48 | 2.1% |
| Mobile Home / Other | 88 | 3.8% |
| Total | 2,323 | 100.0% |
Housing Structures by Occupancy in Macon
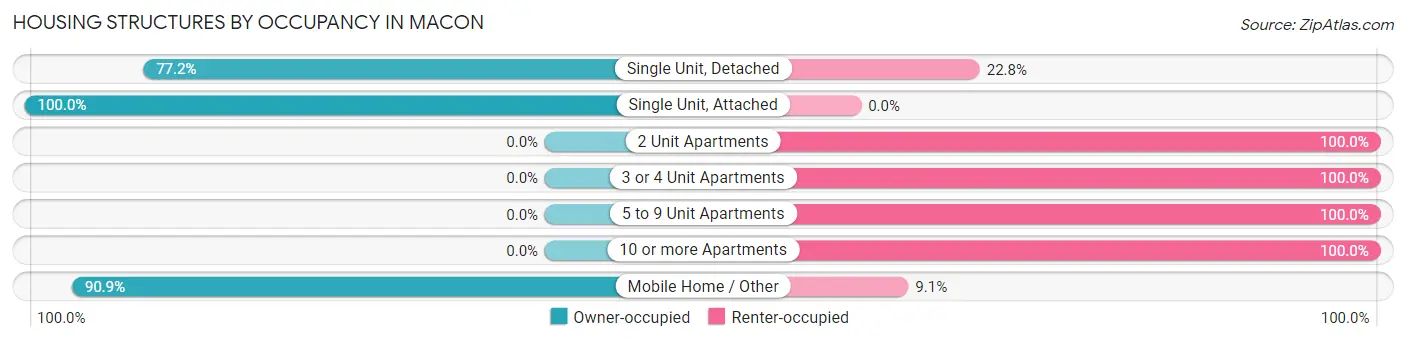
| Structure Type | Owner-occupied | Renter-occupied |
| Single Unit, Detached | 1,412 (77.2%) | 418 (22.8%) |
| Single Unit, Attached | 11 (100.0%) | 0 (0.0%) |
| 2 Unit Apartments | 0 (0.0%) | 87 (100.0%) |
| 3 or 4 Unit Apartments | 0 (0.0%) | 222 (100.0%) |
| 5 to 9 Unit Apartments | 0 (0.0%) | 37 (100.0%) |
| 10 or more Apartments | 0 (0.0%) | 48 (100.0%) |
| Mobile Home / Other | 80 (90.9%) | 8 (9.1%) |
| Total | 1,503 (64.7%) | 820 (35.3%) |
Housing Structures by Number of Rooms in Macon
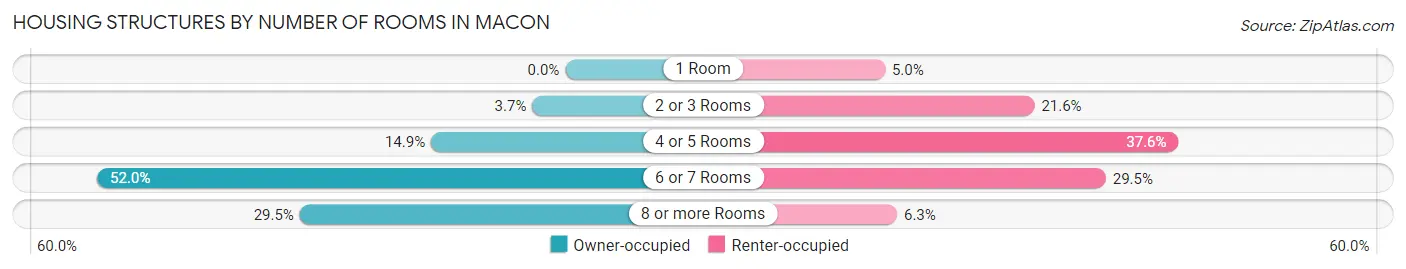
| Number of Rooms | Owner-occupied | Renter-occupied |
| 1 Room | 0 (0.0%) | 41 (5.0%) |
| 2 or 3 Rooms | 55 (3.7%) | 177 (21.6%) |
| 4 or 5 Rooms | 224 (14.9%) | 308 (37.6%) |
| 6 or 7 Rooms | 781 (52.0%) | 242 (29.5%) |
| 8 or more Rooms | 443 (29.5%) | 52 (6.3%) |
| Total | 1,503 (100.0%) | 820 (100.0%) |
Housing Structure by Heating Type in Macon
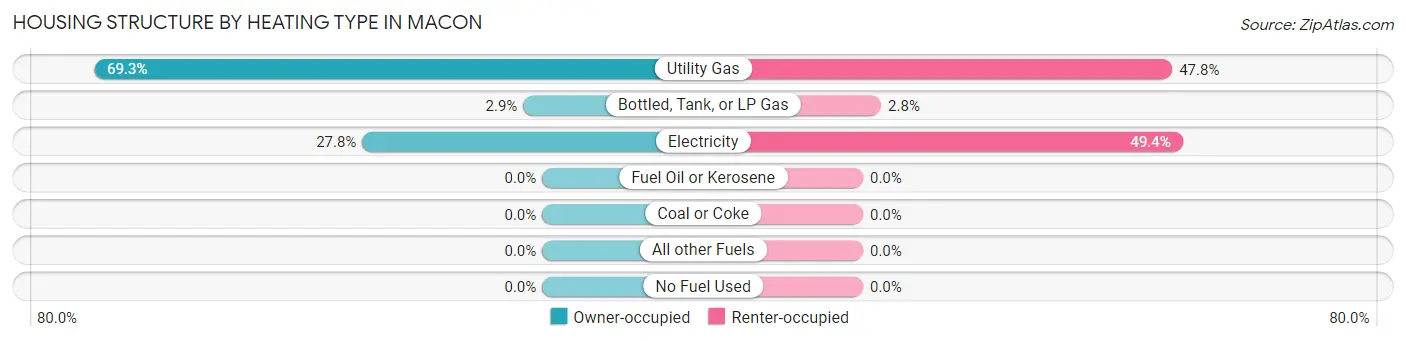
| Heating Type | Owner-occupied | Renter-occupied |
| Utility Gas | 1,041 (69.3%) | 392 (47.8%) |
| Bottled, Tank, or LP Gas | 44 (2.9%) | 23 (2.8%) |
| Electricity | 418 (27.8%) | 405 (49.4%) |
| Fuel Oil or Kerosene | 0 (0.0%) | 0 (0.0%) |
| Coal or Coke | 0 (0.0%) | 0 (0.0%) |
| All other Fuels | 0 (0.0%) | 0 (0.0%) |
| No Fuel Used | 0 (0.0%) | 0 (0.0%) |
| Total | 1,503 (100.0%) | 820 (100.0%) |
Household Vehicle Usage in Macon
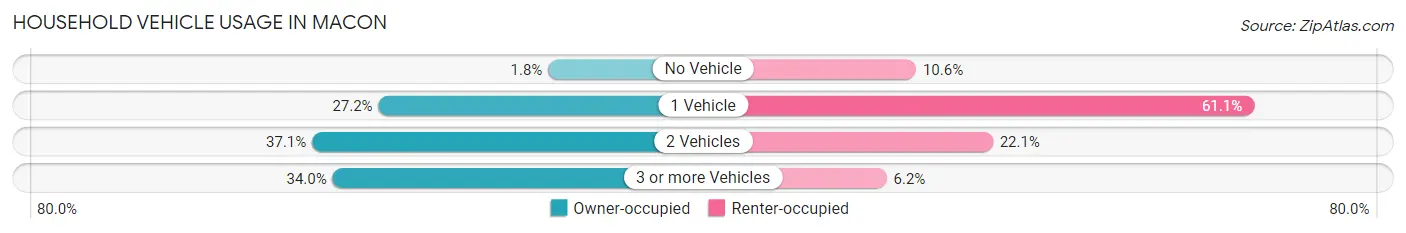
| Vehicles per Household | Owner-occupied | Renter-occupied |
| No Vehicle | 27 (1.8%) | 87 (10.6%) |
| 1 Vehicle | 408 (27.2%) | 501 (61.1%) |
| 2 Vehicles | 557 (37.1%) | 181 (22.1%) |
| 3 or more Vehicles | 511 (34.0%) | 51 (6.2%) |
| Total | 1,503 (100.0%) | 820 (100.0%) |
Real Estate & Mortgages in Macon
Real Estate and Mortgage Overview in Macon
| Characteristic | Without Mortgage | With Mortgage |
| Housing Units | 670 | 833 |
| Median Property Value | $111,700 | $108,000 |
| Median Household Income | $51,300 | $30 |
| Monthly Housing Costs | $430 | $10 |
| Real Estate Taxes | $1,124 | $24 |
Property Value by Mortgage Status in Macon
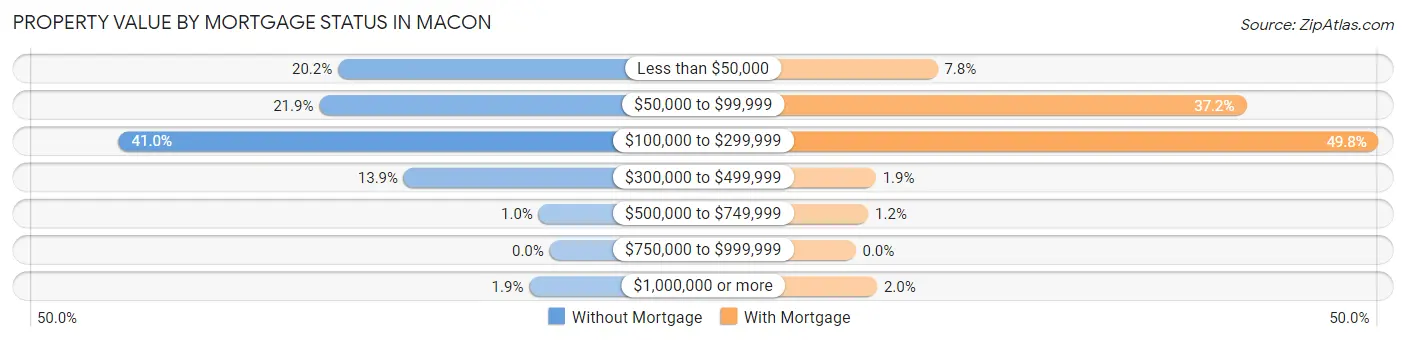
| Property Value | Without Mortgage | With Mortgage |
| Less than $50,000 | 135 (20.2%) | 65 (7.8%) |
| $50,000 to $99,999 | 147 (21.9%) | 310 (37.2%) |
| $100,000 to $299,999 | 275 (41.0%) | 415 (49.8%) |
| $300,000 to $499,999 | 93 (13.9%) | 16 (1.9%) |
| $500,000 to $749,999 | 7 (1.0%) | 10 (1.2%) |
| $750,000 to $999,999 | 0 (0.0%) | 0 (0.0%) |
| $1,000,000 or more | 13 (1.9%) | 17 (2.0%) |
| Total | 670 (100.0%) | 833 (100.0%) |
Household Income by Mortgage Status in Macon
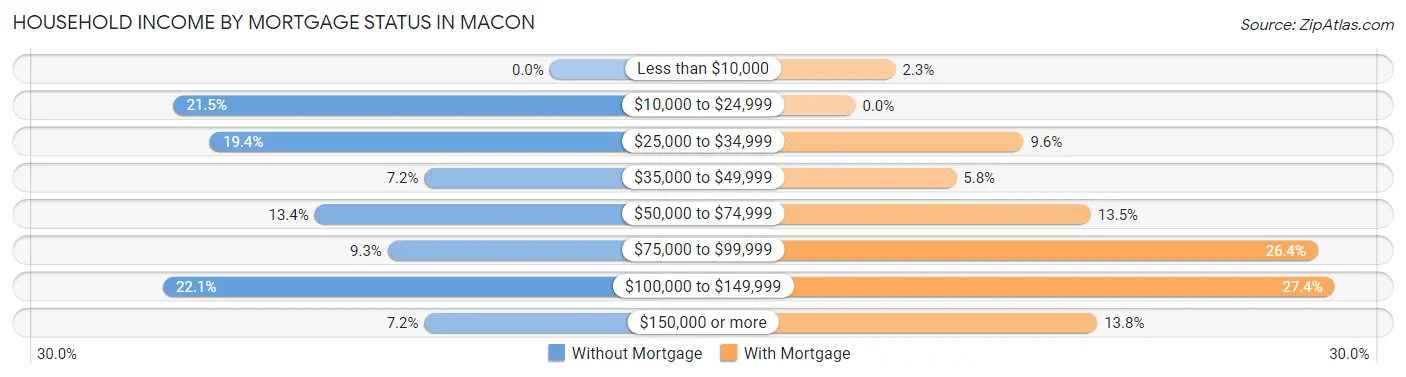
| Household Income | Without Mortgage | With Mortgage |
| Less than $10,000 | 0 (0.0%) | 19 (2.3%) |
| $10,000 to $24,999 | 144 (21.5%) | 0 (0.0%) |
| $25,000 to $34,999 | 130 (19.4%) | 80 (9.6%) |
| $35,000 to $49,999 | 48 (7.2%) | 48 (5.8%) |
| $50,000 to $74,999 | 90 (13.4%) | 112 (13.5%) |
| $75,000 to $99,999 | 62 (9.2%) | 220 (26.4%) |
| $100,000 to $149,999 | 148 (22.1%) | 228 (27.4%) |
| $150,000 or more | 48 (7.2%) | 115 (13.8%) |
| Total | 670 (100.0%) | 833 (100.0%) |
Property Value to Household Income Ratio in Macon
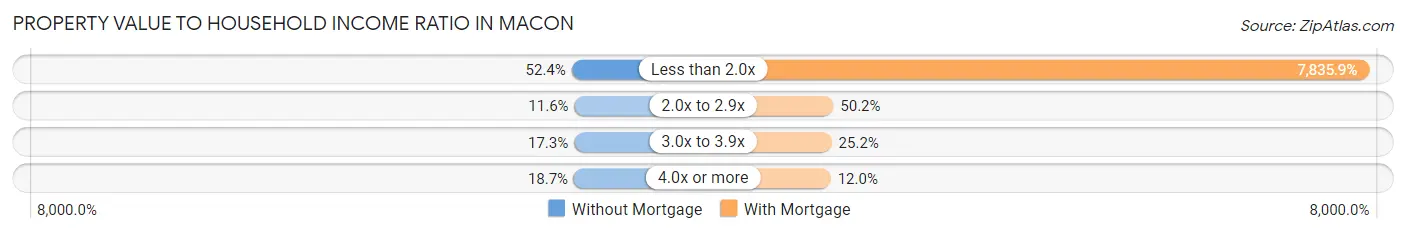
| Value-to-Income Ratio | Without Mortgage | With Mortgage |
| Less than 2.0x | 351 (52.4%) | 65,273 (7,835.9%) |
| 2.0x to 2.9x | 78 (11.6%) | 418 (50.2%) |
| 3.0x to 3.9x | 116 (17.3%) | 210 (25.2%) |
| 4.0x or more | 125 (18.7%) | 100 (12.0%) |
| Total | 670 (100.0%) | 833 (100.0%) |
Real Estate Taxes by Mortgage Status in Macon
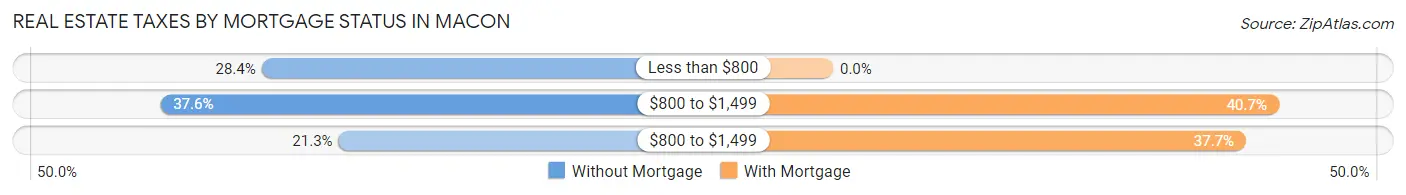
| Property Taxes | Without Mortgage | With Mortgage |
| Less than $800 | 190 (28.4%) | 0 (0.0%) |
| $800 to $1,499 | 252 (37.6%) | 339 (40.7%) |
| $800 to $1,499 | 143 (21.3%) | 314 (37.7%) |
| Total | 670 (100.0%) | 833 (100.0%) |
Health & Disability in Macon
Health Insurance Coverage by Age in Macon
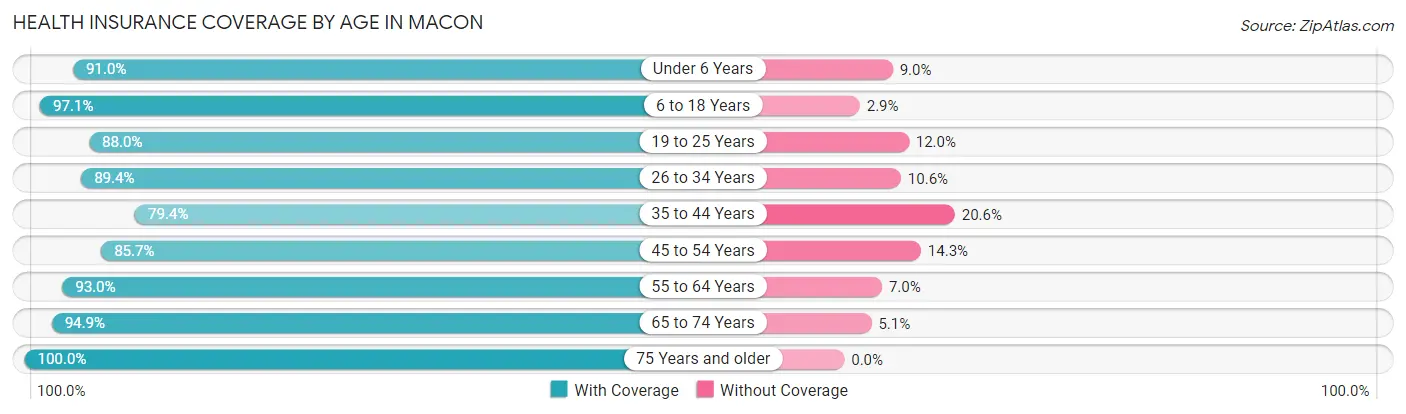
| Age Bracket | With Coverage | Without Coverage |
| Under 6 Years | 292 (91.0%) | 29 (9.0%) |
| 6 to 18 Years | 1,009 (97.1%) | 30 (2.9%) |
| 19 to 25 Years | 300 (88.0%) | 41 (12.0%) |
| 26 to 34 Years | 483 (89.4%) | 57 (10.6%) |
| 35 to 44 Years | 470 (79.4%) | 122 (20.6%) |
| 45 to 54 Years | 540 (85.7%) | 90 (14.3%) |
| 55 to 64 Years | 727 (93.0%) | 55 (7.0%) |
| 65 to 74 Years | 582 (94.9%) | 31 (5.1%) |
| 75 Years and older | 402 (100.0%) | 0 (0.0%) |
| Total | 4,805 (91.3%) | 455 (8.6%) |
Health Insurance Coverage by Citizenship Status in Macon
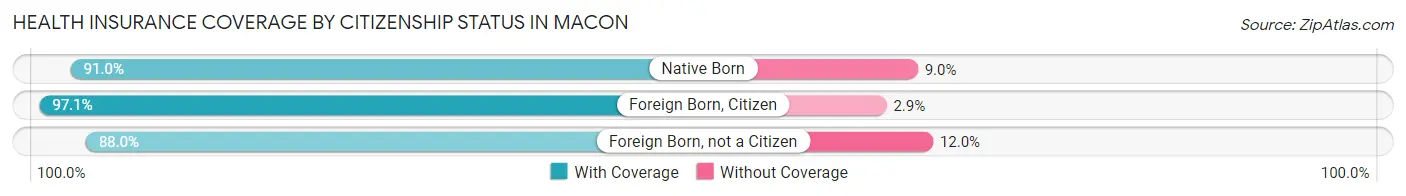
| Citizenship Status | With Coverage | Without Coverage |
| Native Born | 292 (91.0%) | 29 (9.0%) |
| Foreign Born, Citizen | 1,009 (97.1%) | 30 (2.9%) |
| Foreign Born, not a Citizen | 300 (88.0%) | 41 (12.0%) |
Health Insurance Coverage by Household Income in Macon
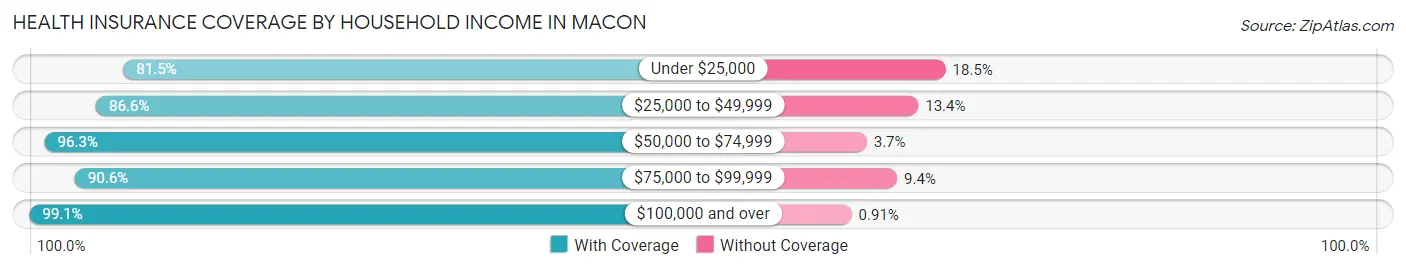
| Household Income | With Coverage | Without Coverage |
| Under $25,000 | 695 (81.5%) | 158 (18.5%) |
| $25,000 to $49,999 | 899 (86.6%) | 139 (13.4%) |
| $50,000 to $74,999 | 1,004 (96.3%) | 39 (3.7%) |
| $75,000 to $99,999 | 999 (90.6%) | 104 (9.4%) |
| $100,000 and over | 1,196 (99.1%) | 11 (0.9%) |
Public vs Private Health Insurance Coverage by Age in Macon
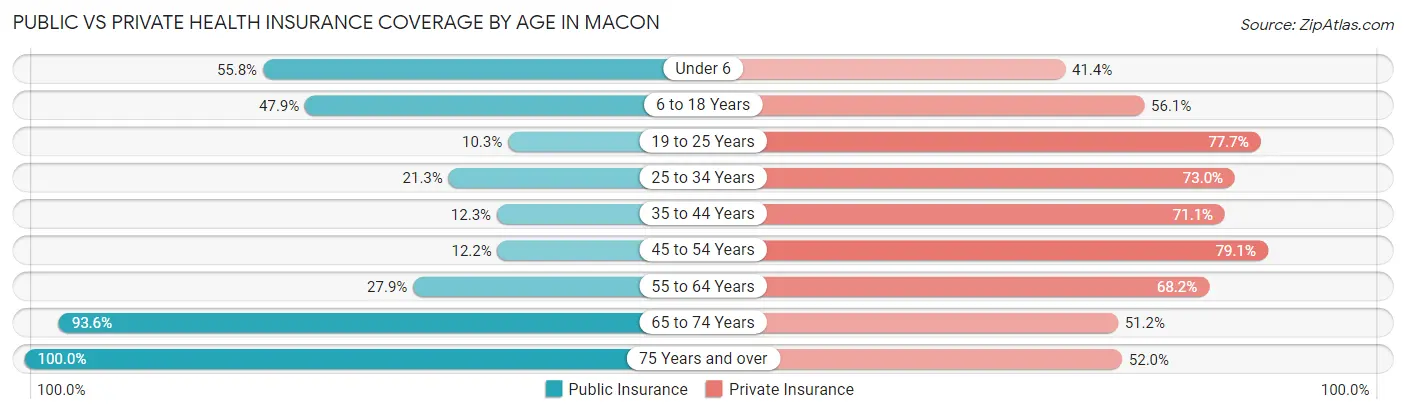
| Age Bracket | Public Insurance | Private Insurance |
| Under 6 | 179 (55.8%) | 133 (41.4%) |
| 6 to 18 Years | 498 (47.9%) | 583 (56.1%) |
| 19 to 25 Years | 35 (10.3%) | 265 (77.7%) |
| 25 to 34 Years | 115 (21.3%) | 394 (73.0%) |
| 35 to 44 Years | 73 (12.3%) | 421 (71.1%) |
| 45 to 54 Years | 77 (12.2%) | 498 (79.0%) |
| 55 to 64 Years | 218 (27.9%) | 533 (68.2%) |
| 65 to 74 Years | 574 (93.6%) | 314 (51.2%) |
| 75 Years and over | 402 (100.0%) | 209 (52.0%) |
| Total | 2,171 (41.3%) | 3,350 (63.7%) |
Disability Status by Sex by Age in Macon
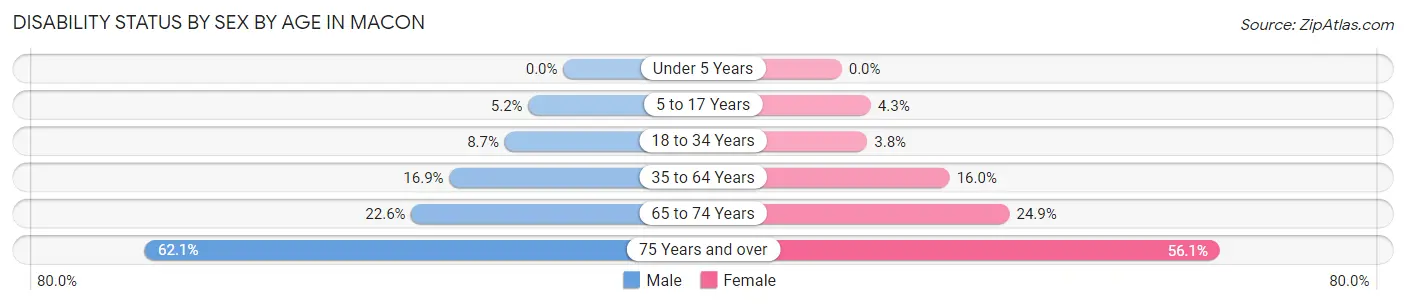
| Age Bracket | Male | Female |
| Under 5 Years | 0 (0.0%) | 0 (0.0%) |
| 5 to 17 Years | 27 (5.2%) | 23 (4.3%) |
| 18 to 34 Years | 41 (8.7%) | 17 (3.8%) |
| 35 to 64 Years | 166 (16.9%) | 164 (16.0%) |
| 65 to 74 Years | 74 (22.6%) | 71 (24.9%) |
| 75 Years and over | 77 (62.1%) | 156 (56.1%) |
Disability Class by Sex by Age in Macon
Disability Class: Hearing Difficulty
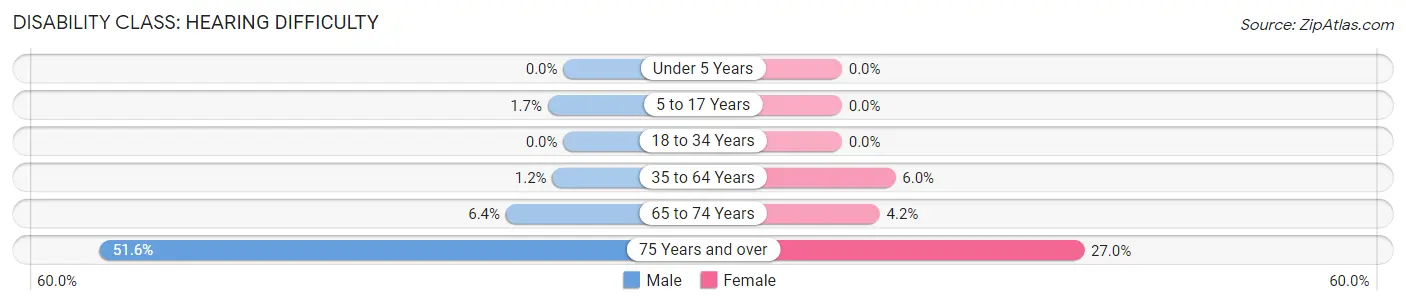
| Age Bracket | Male | Female |
| Under 5 Years | 0 (0.0%) | 0 (0.0%) |
| 5 to 17 Years | 9 (1.7%) | 0 (0.0%) |
| 18 to 34 Years | 0 (0.0%) | 0 (0.0%) |
| 35 to 64 Years | 12 (1.2%) | 61 (6.0%) |
| 65 to 74 Years | 21 (6.4%) | 12 (4.2%) |
| 75 Years and over | 64 (51.6%) | 75 (27.0%) |
Disability Class: Vision Difficulty
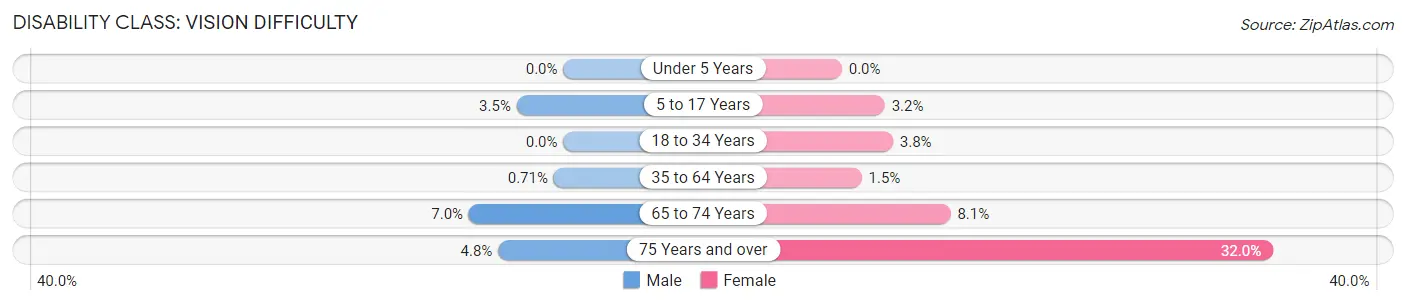
| Age Bracket | Male | Female |
| Under 5 Years | 0 (0.0%) | 0 (0.0%) |
| 5 to 17 Years | 18 (3.5%) | 17 (3.2%) |
| 18 to 34 Years | 0 (0.0%) | 17 (3.8%) |
| 35 to 64 Years | 7 (0.7%) | 15 (1.5%) |
| 65 to 74 Years | 23 (7.0%) | 23 (8.1%) |
| 75 Years and over | 6 (4.8%) | 89 (32.0%) |
Disability Class: Cognitive Difficulty
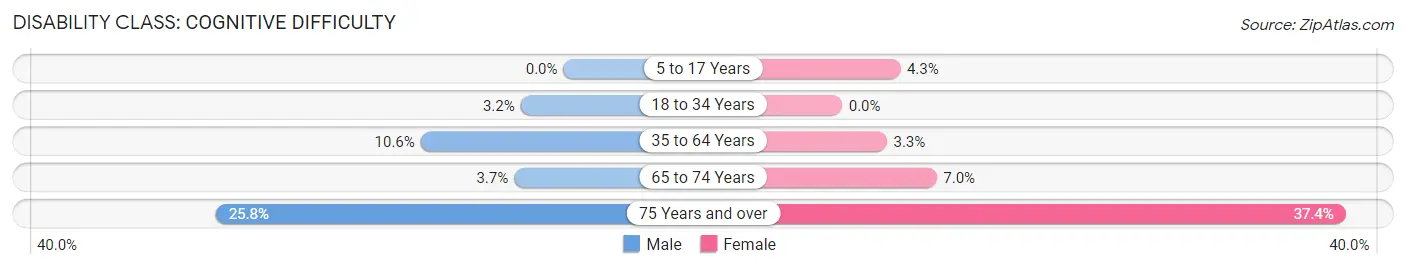
| Age Bracket | Male | Female |
| 5 to 17 Years | 0 (0.0%) | 23 (4.3%) |
| 18 to 34 Years | 15 (3.2%) | 0 (0.0%) |
| 35 to 64 Years | 104 (10.6%) | 34 (3.3%) |
| 65 to 74 Years | 12 (3.7%) | 20 (7.0%) |
| 75 Years and over | 32 (25.8%) | 104 (37.4%) |
Disability Class: Ambulatory Difficulty
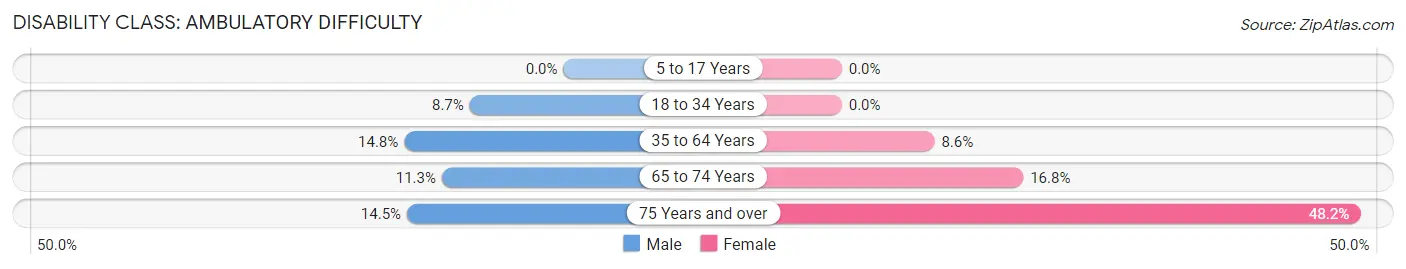
| Age Bracket | Male | Female |
| 5 to 17 Years | 0 (0.0%) | 0 (0.0%) |
| 18 to 34 Years | 41 (8.7%) | 0 (0.0%) |
| 35 to 64 Years | 145 (14.8%) | 88 (8.6%) |
| 65 to 74 Years | 37 (11.3%) | 48 (16.8%) |
| 75 Years and over | 18 (14.5%) | 134 (48.2%) |
Disability Class: Self-Care Difficulty
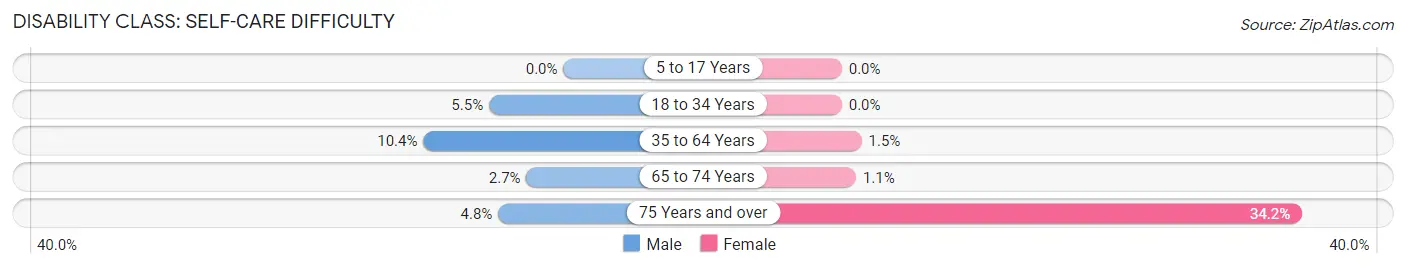
| Age Bracket | Male | Female |
| 5 to 17 Years | 0 (0.0%) | 0 (0.0%) |
| 18 to 34 Years | 26 (5.5%) | 0 (0.0%) |
| 35 to 64 Years | 102 (10.4%) | 15 (1.5%) |
| 65 to 74 Years | 9 (2.7%) | 3 (1.1%) |
| 75 Years and over | 6 (4.8%) | 95 (34.2%) |
Technology Access in Macon
Computing Device Access in Macon
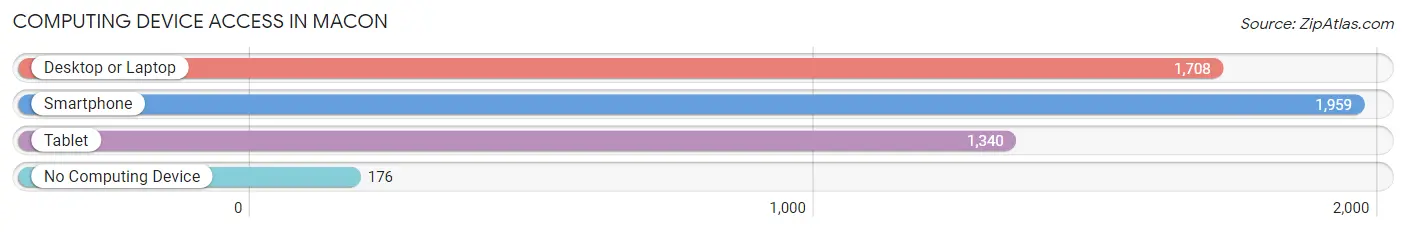
| Device Type | # Households | % Households |
| Desktop or Laptop | 1,708 | 73.5% |
| Smartphone | 1,959 | 84.3% |
| Tablet | 1,340 | 57.7% |
| No Computing Device | 176 | 7.6% |
| Total | 2,323 | 100.0% |
Internet Access in Macon
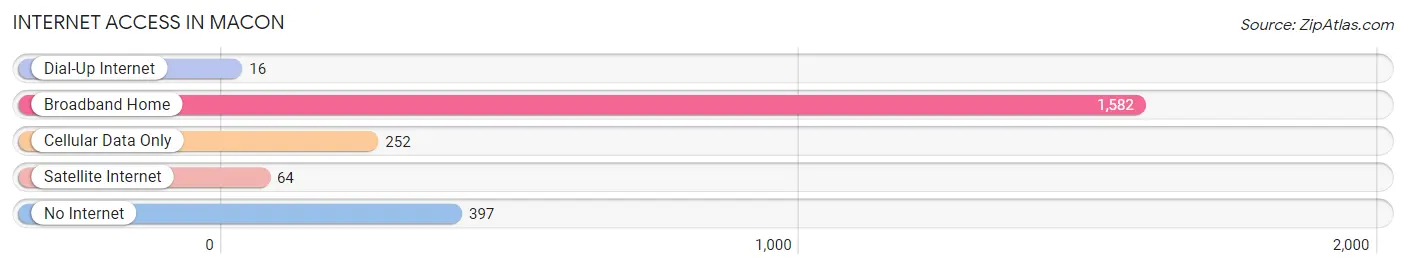
| Internet Type | # Households | % Households |
| Dial-Up Internet | 16 | 0.7% |
| Broadband Home | 1,582 | 68.1% |
| Cellular Data Only | 252 | 10.8% |
| Satellite Internet | 64 | 2.8% |
| No Internet | 397 | 17.1% |
| Total | 2,323 | 100.0% |
Macon Summary
Macon, Missouri is a small city located in Macon County in the north-central part of the state. It is the county seat and the largest city in the county. The city is situated on the banks of the Chariton River and is surrounded by rolling hills and farmland. The population of Macon was 5,717 at the 2010 census.
History
Macon was founded in 1831 by a group of settlers from Kentucky and Tennessee. The city was named after Nathaniel Macon, a prominent politician from North Carolina. The city was incorporated in 1837 and quickly became an important trading center for the surrounding area. The city was also a major stop on the Hannibal and St. Joseph Railroad, which connected the city to St. Louis and other major cities in the Midwest.
In the late 19th century, Macon was a major center for the production of tobacco. The city was home to several tobacco warehouses and factories, and the city was known as the “Tobacco Capital of the World”. The tobacco industry declined in the early 20th century, but Macon still remains an important agricultural center.
Geography
Macon is located at the intersection of U.S. Route 36 and Missouri Route 3. The city is situated on the banks of the Chariton River and is surrounded by rolling hills and farmland. The city is located approximately 70 miles northeast of Kansas City and 90 miles west of St. Louis.
The climate in Macon is typical of the Midwest, with hot summers and cold winters. The average temperature in July is 81°F and the average temperature in January is 28°F. The city receives an average of 40 inches of precipitation per year.
Economy
Macon’s economy is largely based on agriculture. The city is home to several large farms and is a major producer of corn, soybeans, and wheat. The city is also home to several manufacturing companies, including a furniture factory and a plastics factory.
The city is also home to several retail stores, restaurants, and other businesses. The city is served by the Macon County Airport, which offers flights to St. Louis and other major cities in the Midwest.
Demographics
As of the 2010 census, the population of Macon was 5,717. The racial makeup of the city was 95.3% White, 1.2% African American, 0.3% Native American, 0.4% Asian, 0.1% Pacific Islander, 0.7% from other races, and 1.9% from two or more races. Hispanic or Latino of any race were 2.2% of the population.
The median income for a household in Macon was $35,938 and the median income for a family was $45,938. The per capita income for the city was $19,938. About 11.2% of families and 14.2% of the population were below the poverty line, including 19.2% of those under age 18 and 8.2% of those age 65 or over.
Macon is a small city with a rich history and a strong agricultural economy. The city is home to several large farms and manufacturing companies, and is a major producer of corn, soybeans, and wheat. The city is also home to several retail stores, restaurants, and other businesses. The population of Macon is diverse, with a mix of races and ethnicities. The city is a great place to live and work, and offers a variety of activities and attractions for residents and visitors alike.
Common Questions
What is Per Capita Income in Macon?
Per Capita income in Macon is $26,781.
What is the Median Family Income in Macon?
Median Family Income in Macon is $75,858.
What is the Median Household income in Macon?
Median Household Income in Macon is $50,101.
What is Income or Wage Gap in Macon?
Income or Wage Gap in Macon is 33.4%.
Women in Macon earn 66.6 cents for every dollar earned by a man.
What is Inequality or Gini Index in Macon?
Inequality or Gini Index in Macon is 0.40.
What is the Total Population of Macon?
Total Population of Macon is 5,452.
What is the Total Male Population of Macon?
Total Male Population of Macon is 2,651.
What is the Total Female Population of Macon?
Total Female Population of Macon is 2,801.
What is the Ratio of Males per 100 Females in Macon?
There are 94.64 Males per 100 Females in Macon.
What is the Ratio of Females per 100 Males in Macon?
There are 105.66 Females per 100 Males in Macon.
What is the Median Population Age in Macon?
Median Population Age in Macon is 41.3 Years.
What is the Average Family Size in Macon
Average Family Size in Macon is 3.0 People.
What is the Average Household Size in Macon
Average Household Size in Macon is 2.3 People.
How Large is the Labor Force in Macon?
There are 2,600 People in the Labor Forcein in Macon.
What is the Percentage of People in the Labor Force in Macon?
59.9% of People are in the Labor Force in Macon.
What is the Unemployment Rate in Macon?
Unemployment Rate in Macon is 2.7%.