Allendale, SC Map & Demographics
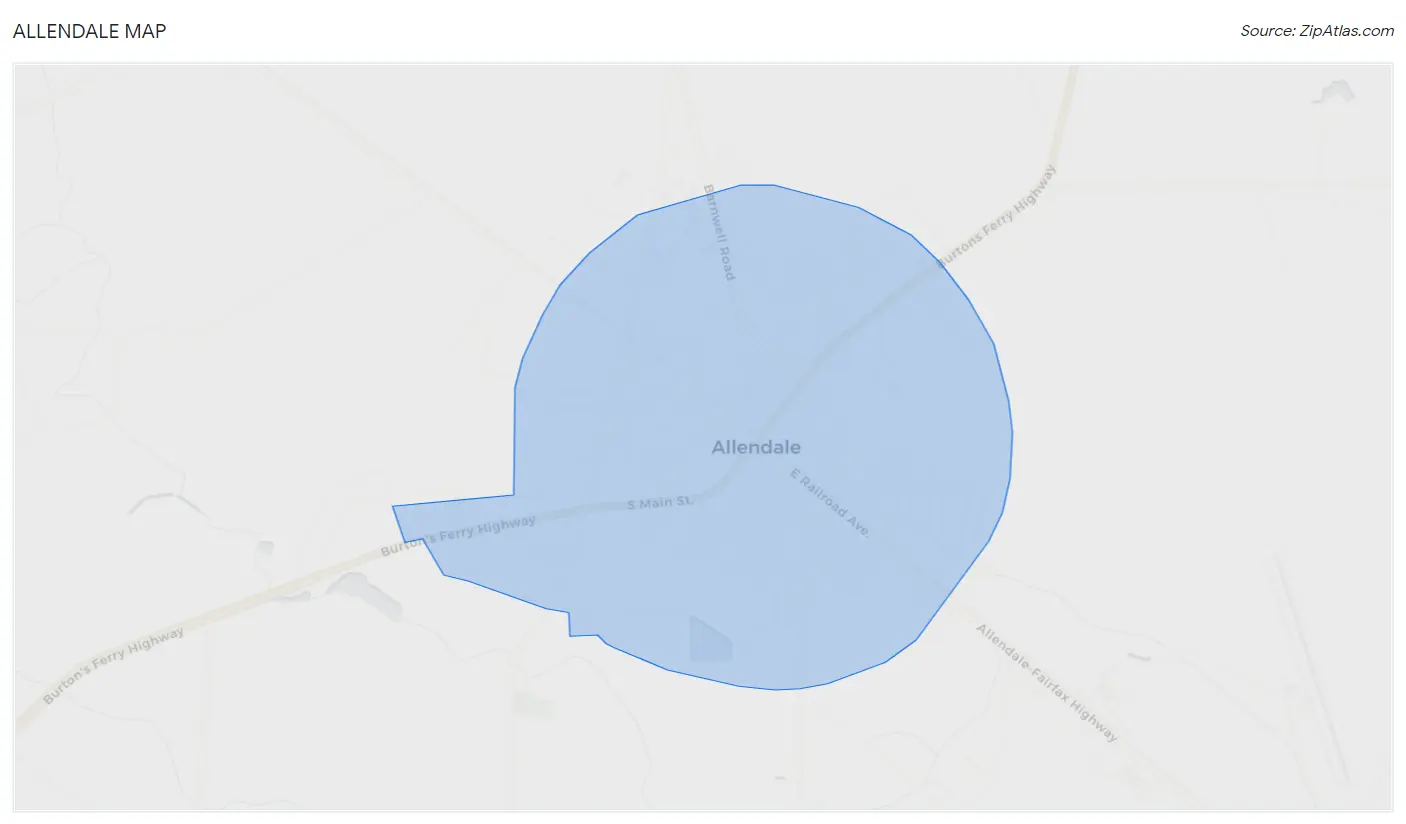
Allendale Map
Allendale Overview
$15,033
PER CAPITA INCOME
$44,970
AVG FAMILY INCOME
$19,921
AVG HOUSEHOLD INCOME
47.0%
WAGE / INCOME GAP [ % ]
53.0¢/ $1
WAGE / INCOME GAP [ $ ]
0.47
INEQUALITY / GINI INDEX
2,702
TOTAL POPULATION
1,318
MALE POPULATION
1,384
FEMALE POPULATION
95.23
MALES / 100 FEMALES
105.01
FEMALES / 100 MALES
39.6
MEDIAN AGE
3.2
AVG FAMILY SIZE
2.3
AVG HOUSEHOLD SIZE
845
LABOR FORCE [ PEOPLE ]
41.8%
PERCENT IN LABOR FORCE
9.2%
UNEMPLOYMENT RATE
Allendale Zip Codes
Allendale Area Codes
Income in Allendale
Income Overview in Allendale
Per Capita Income in Allendale is $15,033, while median incomes of families and households are $44,970 and $19,921 respectively.
| Characteristic | Number | Measure |
| Per Capita Income | 2,702 | $15,033 |
| Median Family Income | 599 | $44,970 |
| Mean Family Income | 599 | $49,288 |
| Median Household Income | 1,156 | $19,921 |
| Mean Household Income | 1,156 | $35,945 |
| Income Deficit | 599 | $0 |
| Wage / Income Gap (%) | 2,702 | 47.00% |
| Wage / Income Gap ($) | 2,702 | 53.00¢ per $1 |
| Gini / Inequality Index | 2,702 | 0.47 |
Earnings by Sex in Allendale
Average Earnings in Allendale are $23,710, $38,719 for men and $20,521 for women, a difference of 47.0%.
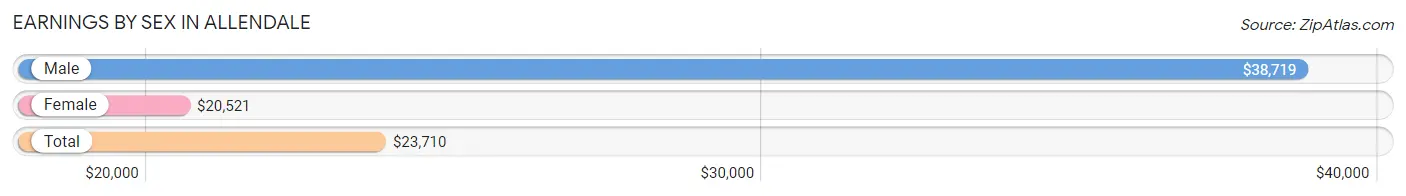
| Sex | Number | Average Earnings |
| Male | 465 (51.6%) | $38,719 |
| Female | 436 (48.4%) | $20,521 |
| Total | 901 (100.0%) | $23,710 |
Earnings by Sex by Income Bracket in Allendale
The most common earnings brackets in Allendale are $35,000 to $39,999 for men (72 | 15.5%) and $20,000 to $22,499 for women (96 | 22.0%).
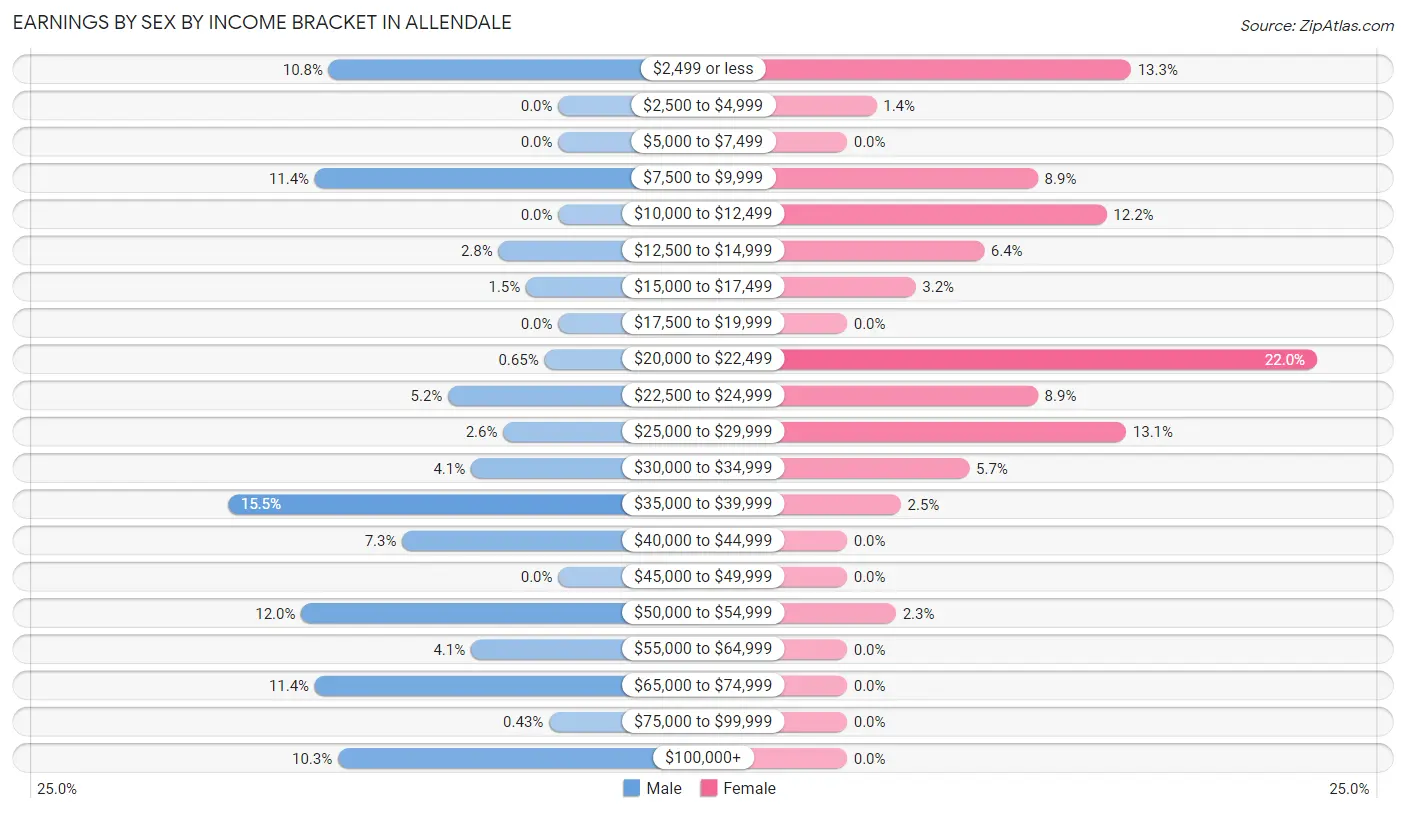
| Income | Male | Female |
| $2,499 or less | 50 (10.7%) | 58 (13.3%) |
| $2,500 to $4,999 | 0 (0.0%) | 6 (1.4%) |
| $5,000 to $7,499 | 0 (0.0%) | 0 (0.0%) |
| $7,500 to $9,999 | 53 (11.4%) | 39 (8.9%) |
| $10,000 to $12,499 | 0 (0.0%) | 53 (12.2%) |
| $12,500 to $14,999 | 13 (2.8%) | 28 (6.4%) |
| $15,000 to $17,499 | 7 (1.5%) | 14 (3.2%) |
| $17,500 to $19,999 | 0 (0.0%) | 0 (0.0%) |
| $20,000 to $22,499 | 3 (0.6%) | 96 (22.0%) |
| $22,500 to $24,999 | 24 (5.2%) | 39 (8.9%) |
| $25,000 to $29,999 | 12 (2.6%) | 57 (13.1%) |
| $30,000 to $34,999 | 19 (4.1%) | 25 (5.7%) |
| $35,000 to $39,999 | 72 (15.5%) | 11 (2.5%) |
| $40,000 to $44,999 | 34 (7.3%) | 0 (0.0%) |
| $45,000 to $49,999 | 0 (0.0%) | 0 (0.0%) |
| $50,000 to $54,999 | 56 (12.0%) | 10 (2.3%) |
| $55,000 to $64,999 | 19 (4.1%) | 0 (0.0%) |
| $65,000 to $74,999 | 53 (11.4%) | 0 (0.0%) |
| $75,000 to $99,999 | 2 (0.4%) | 0 (0.0%) |
| $100,000+ | 48 (10.3%) | 0 (0.0%) |
| Total | 465 (100.0%) | 436 (100.0%) |
Earnings by Sex by Educational Attainment in Allendale
Average earnings in Allendale are $38,719 for men and $21,289 for women, a difference of 45.0%. Men with an educational attainment of high school diploma enjoy the highest average annual earnings of $40,294, while those with less than high school education earn the least with $2,499. Women with an educational attainment of college or associate's degree earn the most with the average annual earnings of $28,886, while those with less than high school education have the smallest earnings of $16,250.
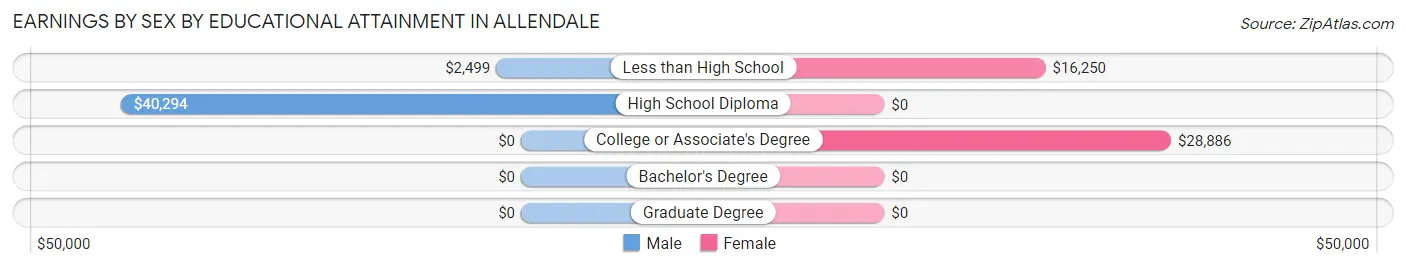
| Educational Attainment | Male Income | Female Income |
| Less than High School | $2,499 | $16,250 |
| High School Diploma | $40,294 | $0 |
| College or Associate's Degree | - | - |
| Bachelor's Degree | - | - |
| Graduate Degree | - | - |
| Total | $38,719 | $21,289 |
Family Income in Allendale
Family Income Brackets in Allendale
According to the Allendale family income data, there are 150 families falling into the $75,000 to $99,999 income range, which is the most common income bracket and makes up 25.0% of all families.
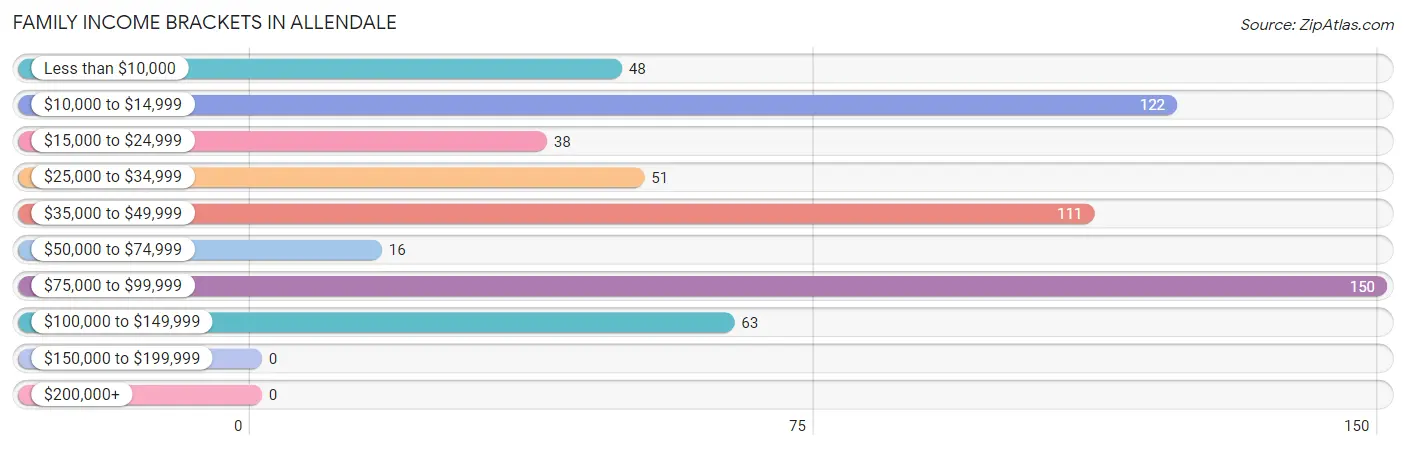
| Income Bracket | # Families | % Families |
| Less than $10,000 | 48 | 8.0% |
| $10,000 to $14,999 | 122 | 20.4% |
| $15,000 to $24,999 | 38 | 6.3% |
| $25,000 to $34,999 | 51 | 8.5% |
| $35,000 to $49,999 | 111 | 18.5% |
| $50,000 to $74,999 | 16 | 2.7% |
| $75,000 to $99,999 | 150 | 25.0% |
| $100,000 to $149,999 | 63 | 10.5% |
| $150,000 to $199,999 | 0 | 0.0% |
| $200,000+ | 0 | 0.0% |
Family Income by Famaliy Size in Allendale
| Income Bracket | # Families | Median Income |
| 2-Person Families | 301 (50.2%) | $0 |
| 3-Person Families | 79 (13.2%) | $0 |
| 4-Person Families | 69 (11.5%) | $0 |
| 5-Person Families | 3 (0.5%) | $0 |
| 6-Person Families | 87 (14.5%) | $0 |
| 7+ Person Families | 60 (10.0%) | $0 |
| Total | 599 (100.0%) | $44,970 |
Family Income by Number of Earners in Allendale
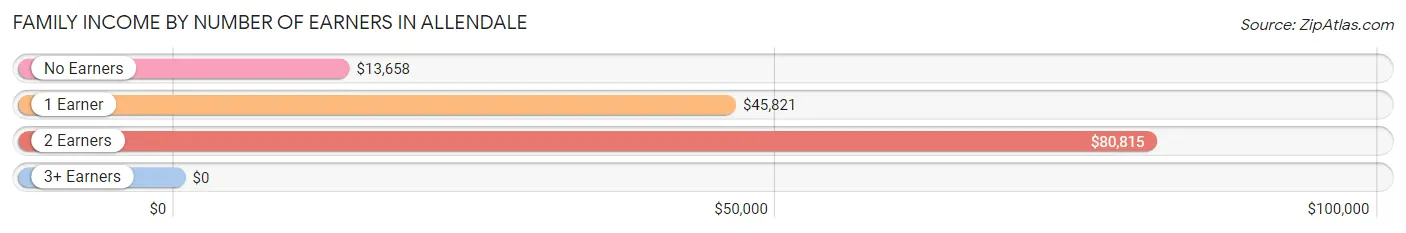
| Number of Earners | # Families | Median Income |
| No Earners | 167 (27.9%) | $13,658 |
| 1 Earner | 241 (40.2%) | $45,821 |
| 2 Earners | 191 (31.9%) | $80,815 |
| 3+ Earners | 0 (0.0%) | $0 |
| Total | 599 (100.0%) | $44,970 |
Household Income in Allendale
Household Income Brackets in Allendale
With 252 households falling in the category, the $15,000 to $24,999 income range is the most frequent in Allendale, accounting for 21.8% of all households.
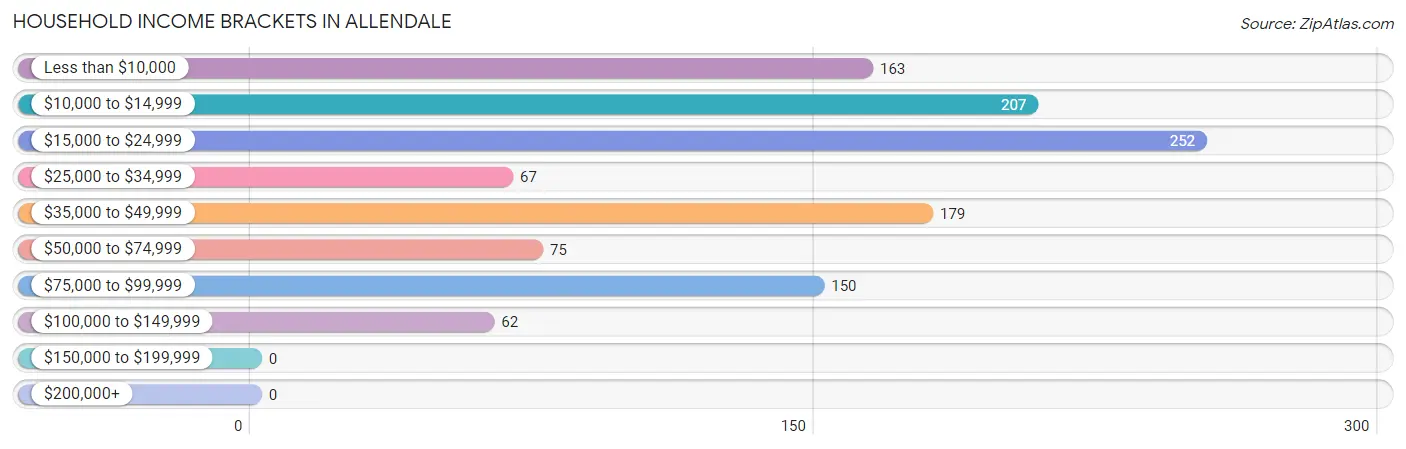
| Income Bracket | # Households | % Households |
| Less than $10,000 | 163 | 14.1% |
| $10,000 to $14,999 | 207 | 17.9% |
| $15,000 to $24,999 | 252 | 21.8% |
| $25,000 to $34,999 | 67 | 5.8% |
| $35,000 to $49,999 | 179 | 15.5% |
| $50,000 to $74,999 | 75 | 6.5% |
| $75,000 to $99,999 | 150 | 13.0% |
| $100,000 to $149,999 | 62 | 5.4% |
| $150,000 to $199,999 | 0 | 0.0% |
| $200,000+ | 0 | 0.0% |
Household Income by Householder Age in Allendale
The median household income in Allendale is $19,921, with the highest median household income of $35,977 found in the 45 to 64 years age bracket for the primary householder. A total of 415 households (35.9%) fall into this category. Meanwhile, the 25 to 44 years age bracket for the primary householder has the lowest median household income of $0, with 211 households (18.2%) in this group.
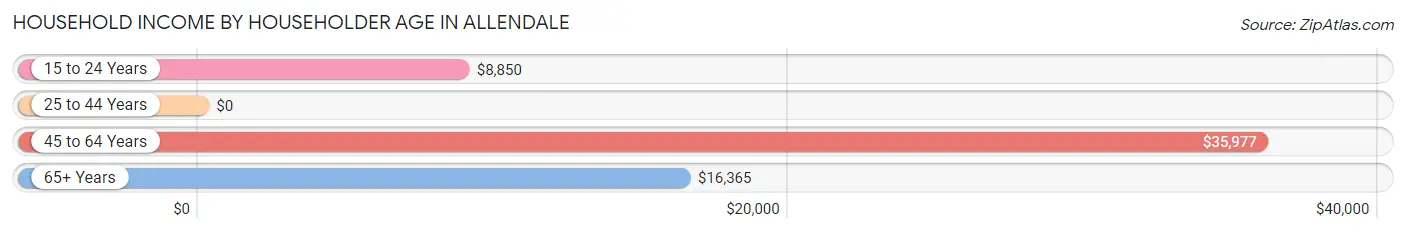
| Income Bracket | # Households | Median Income |
| 15 to 24 Years | 79 (6.8%) | $8,850 |
| 25 to 44 Years | 211 (18.2%) | $0 |
| 45 to 64 Years | 415 (35.9%) | $35,977 |
| 65+ Years | 451 (39.0%) | $16,365 |
| Total | 1,156 (100.0%) | $19,921 |
Poverty in Allendale
Income Below Poverty by Sex and Age in Allendale
With 36.3% poverty level for males and 50.1% for females among the residents of Allendale, 12 to 14 year old males and 15 year old females are the most vulnerable to poverty, with 155 males (100.0%) and 10 females (100.0%) in their respective age groups living below the poverty level.
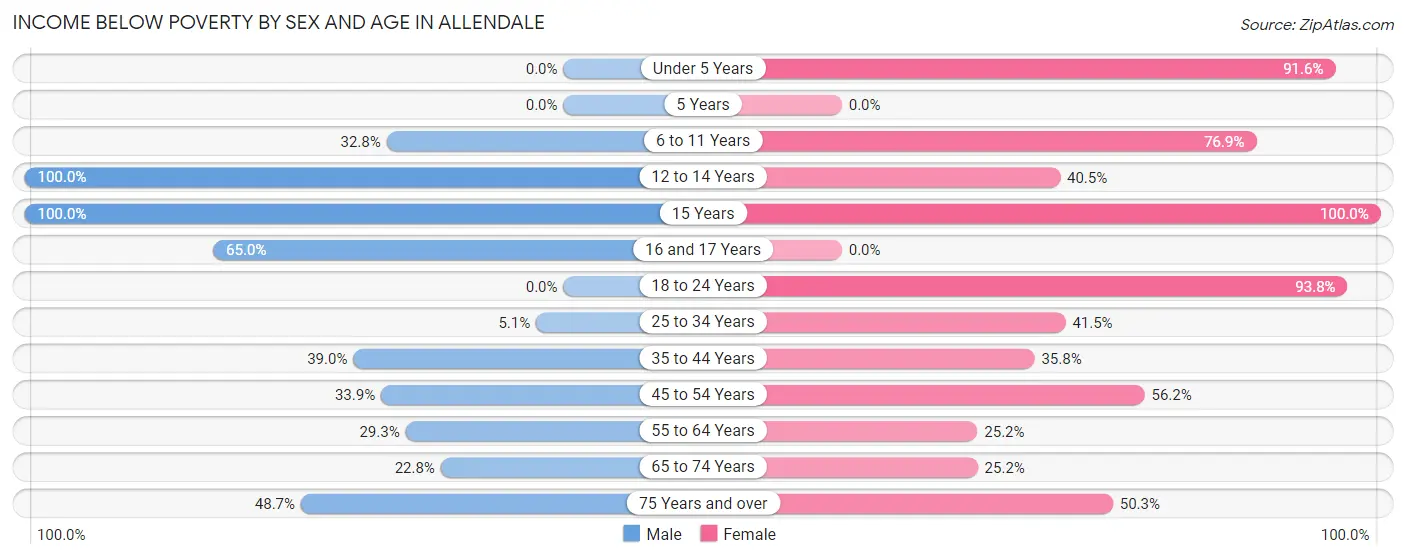
| Age Bracket | Male | Female |
| Under 5 Years | 0 (0.0%) | 87 (91.6%) |
| 5 Years | 0 (0.0%) | 0 (0.0%) |
| 6 to 11 Years | 42 (32.8%) | 90 (76.9%) |
| 12 to 14 Years | 155 (100.0%) | 32 (40.5%) |
| 15 Years | 1 (100.0%) | 10 (100.0%) |
| 16 and 17 Years | 39 (65.0%) | 0 (0.0%) |
| 18 to 24 Years | 0 (0.0%) | 137 (93.8%) |
| 25 to 34 Years | 7 (5.1%) | 44 (41.5%) |
| 35 to 44 Years | 39 (39.0%) | 49 (35.8%) |
| 45 to 54 Years | 88 (33.9%) | 59 (56.2%) |
| 55 to 64 Years | 46 (29.3%) | 39 (25.2%) |
| 65 to 74 Years | 23 (22.8%) | 58 (25.2%) |
| 75 Years and over | 38 (48.7%) | 85 (50.3%) |
| Total | 478 (36.3%) | 690 (50.1%) |
Income Above Poverty by Sex and Age in Allendale
According to the poverty statistics in Allendale, males aged under 5 years and females aged 5 years are the age groups that are most secure financially, with 100.0% of males and 100.0% of females in these age groups living above the poverty line.
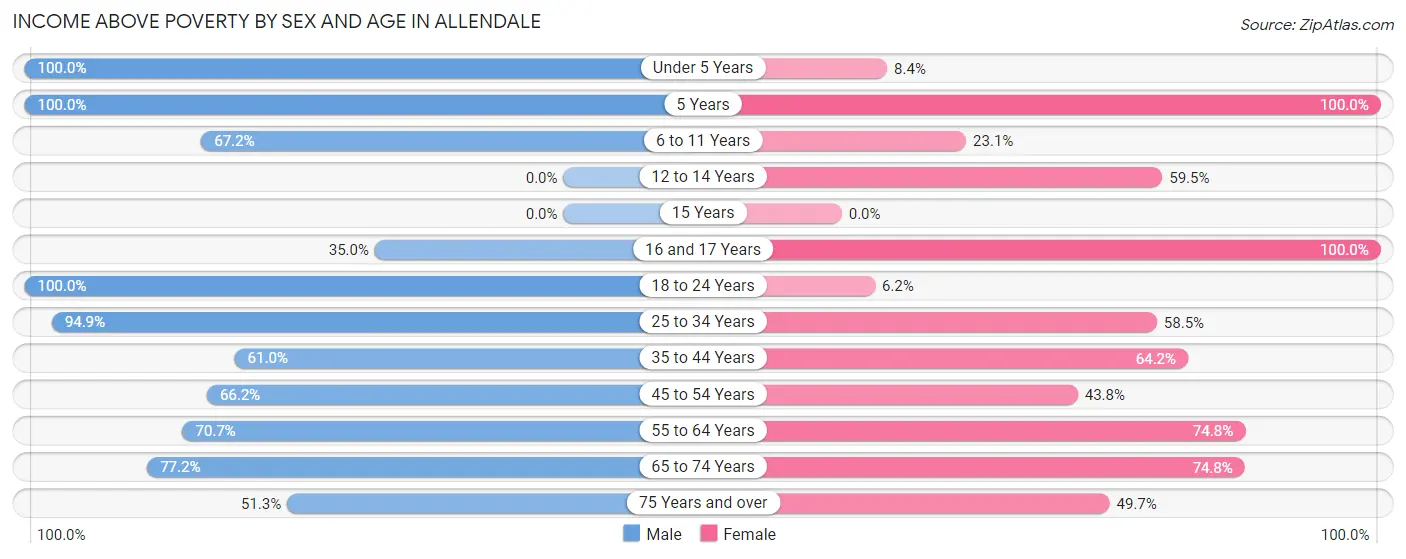
| Age Bracket | Male | Female |
| Under 5 Years | 69 (100.0%) | 8 (8.4%) |
| 5 Years | 19 (100.0%) | 8 (100.0%) |
| 6 to 11 Years | 86 (67.2%) | 27 (23.1%) |
| 12 to 14 Years | 0 (0.0%) | 47 (59.5%) |
| 15 Years | 0 (0.0%) | 0 (0.0%) |
| 16 and 17 Years | 21 (35.0%) | 21 (100.0%) |
| 18 to 24 Years | 52 (100.0%) | 9 (6.2%) |
| 25 to 34 Years | 131 (94.9%) | 62 (58.5%) |
| 35 to 44 Years | 61 (61.0%) | 88 (64.2%) |
| 45 to 54 Years | 172 (66.1%) | 46 (43.8%) |
| 55 to 64 Years | 111 (70.7%) | 116 (74.8%) |
| 65 to 74 Years | 78 (77.2%) | 172 (74.8%) |
| 75 Years and over | 40 (51.3%) | 84 (49.7%) |
| Total | 840 (63.7%) | 688 (49.9%) |
Income Below Poverty Among Married-Couple Families in Allendale
The poverty statistics for married-couple families in Allendale show that 9.1% or 26 of the total 287 families live below the poverty line. Families with no children have the highest poverty rate of 12.0%, comprising of 26 families. On the other hand, families with 1 or 2 children have the lowest poverty rate of 0.0%, which includes 0 families.
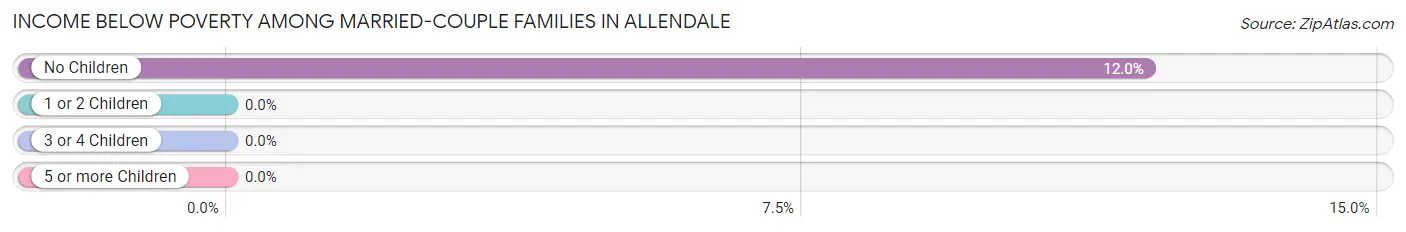
| Children | Above Poverty | Below Poverty |
| No Children | 191 (88.0%) | 26 (12.0%) |
| 1 or 2 Children | 3 (100.0%) | 0 (0.0%) |
| 3 or 4 Children | 67 (100.0%) | 0 (0.0%) |
| 5 or more Children | 0 (0.0%) | 0 (0.0%) |
| Total | 261 (90.9%) | 26 (9.1%) |
Income Below Poverty Among Single-Parent Households in Allendale
According to the poverty data in Allendale, 85.5% or 71 single-father households and 59.8% or 137 single-mother households are living below the poverty line. Among single-father households, those with 1 or 2 children have the highest poverty rate, with 26 households (100.0%) experiencing poverty. Likewise, among single-mother households, those with 3 or 4 children have the highest poverty rate, with 22 households (100.0%) falling below the poverty line.
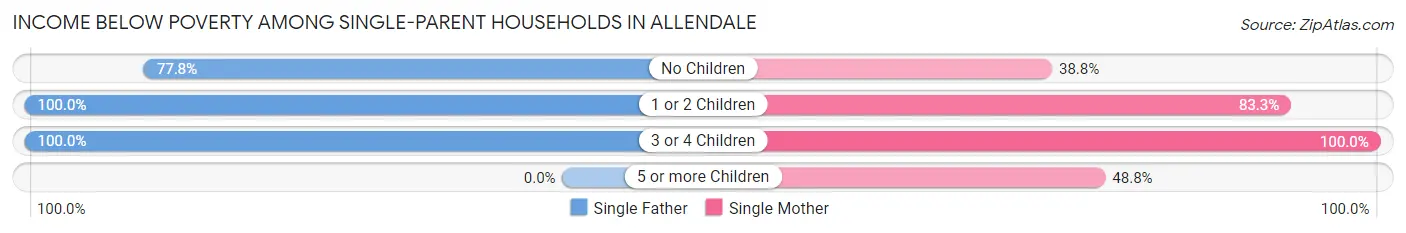
| Children | Single Father | Single Mother |
| No Children | 42 (77.8%) | 26 (38.8%) |
| 1 or 2 Children | 26 (100.0%) | 50 (83.3%) |
| 3 or 4 Children | 3 (100.0%) | 22 (100.0%) |
| 5 or more Children | 0 (0.0%) | 39 (48.7%) |
| Total | 71 (85.5%) | 137 (59.8%) |
Income Below Poverty Among Married-Couple vs Single-Parent Households in Allendale
The poverty data for Allendale shows that 26 of the married-couple family households (9.1%) and 208 of the single-parent households (66.7%) are living below the poverty level. Within the married-couple family households, those with no children have the highest poverty rate, with 26 households (12.0%) falling below the poverty line. Among the single-parent households, those with 3 or 4 children have the highest poverty rate, with 25 household (100.0%) living below poverty.
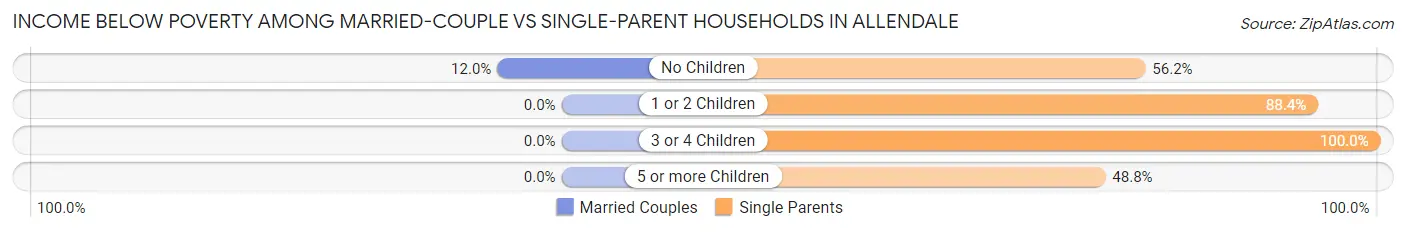
| Children | Married-Couple Families | Single-Parent Households |
| No Children | 26 (12.0%) | 68 (56.2%) |
| 1 or 2 Children | 0 (0.0%) | 76 (88.4%) |
| 3 or 4 Children | 0 (0.0%) | 25 (100.0%) |
| 5 or more Children | 0 (0.0%) | 39 (48.7%) |
| Total | 26 (9.1%) | 208 (66.7%) |
Race in Allendale
The most populous races in Allendale are Black / African American (2,174 | 80.5%), White / Caucasian (349 | 12.9%), and Hispanic or Latino (202 | 7.5%).
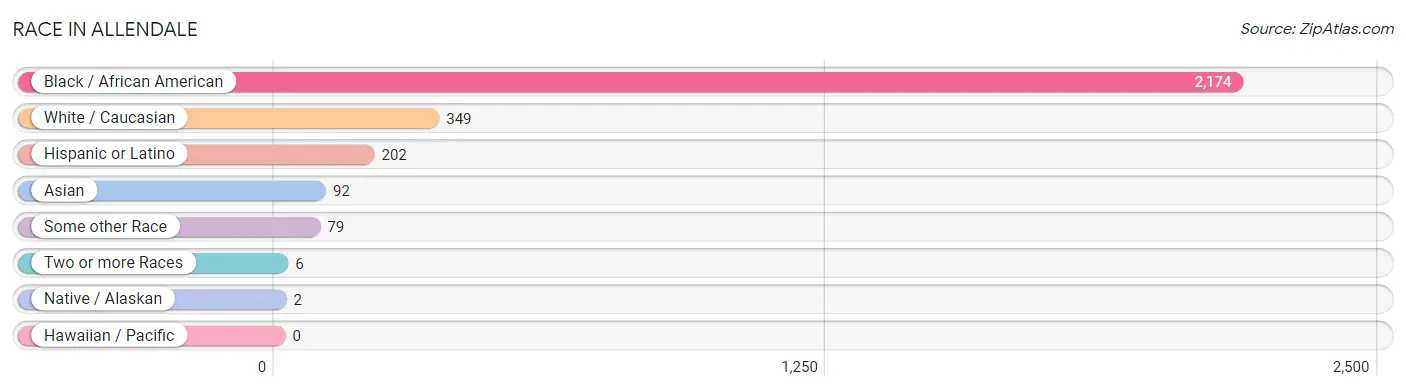
| Race | # Population | % Population |
| Asian | 92 | 3.4% |
| Black / African American | 2,174 | 80.5% |
| Hawaiian / Pacific | 0 | 0.0% |
| Hispanic or Latino | 202 | 7.5% |
| Native / Alaskan | 2 | 0.1% |
| White / Caucasian | 349 | 12.9% |
| Two or more Races | 6 | 0.2% |
| Some other Race | 79 | 2.9% |
| Total | 2,702 | 100.0% |
Ancestry in Allendale
The most populous ancestries reported in Allendale are American (230 | 8.5%), Mexican (142 | 5.3%), Celtic (89 | 3.3%), Korean (86 | 3.2%), and Central American (60 | 2.2%), together accounting for 22.5% of all Allendale residents.
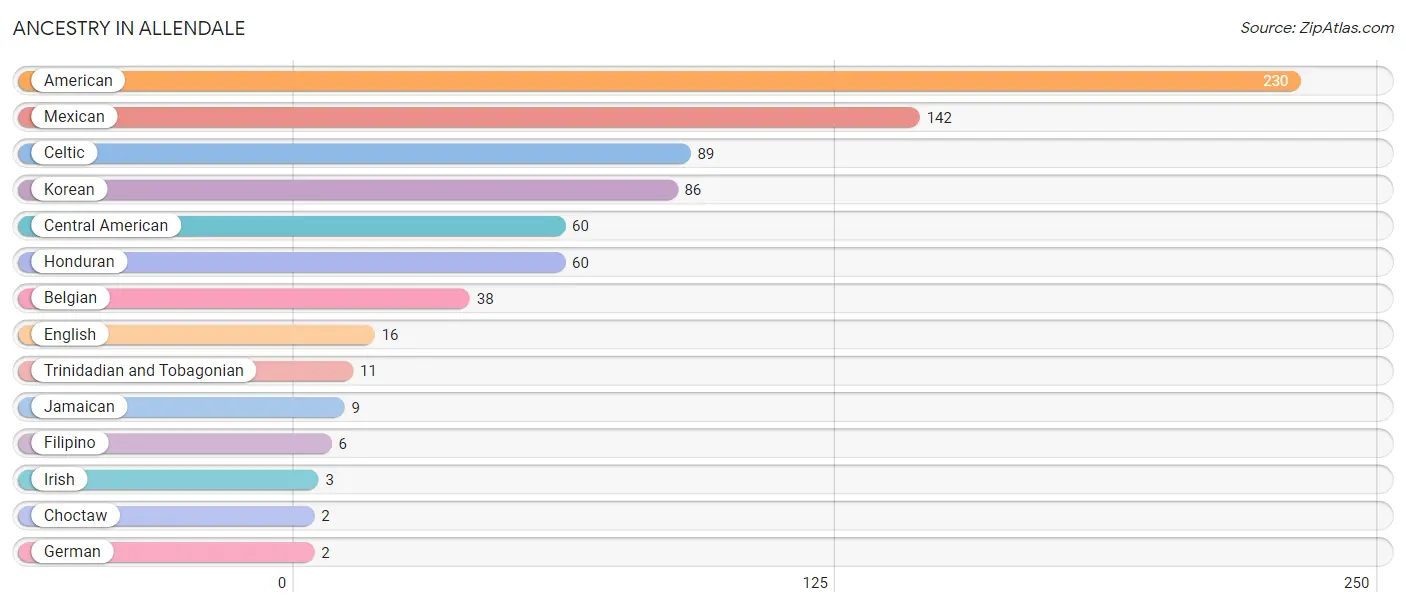
| Ancestry | # Population | % Population |
| American | 230 | 8.5% |
| Belgian | 38 | 1.4% |
| Celtic | 89 | 3.3% |
| Central American | 60 | 2.2% |
| Choctaw | 2 | 0.1% |
| English | 16 | 0.6% |
| Filipino | 6 | 0.2% |
| German | 2 | 0.1% |
| Honduran | 60 | 2.2% |
| Irish | 3 | 0.1% |
| Jamaican | 9 | 0.3% |
| Korean | 86 | 3.2% |
| Mexican | 142 | 5.3% |
| Trinidadian and Tobagonian | 11 | 0.4% | View All 14 Rows |
Immigrants in Allendale
The most numerous immigrant groups reported in Allendale came from Caribbean (11 | 0.4%), Latin America (11 | 0.4%), Trinidad and Tobago (11 | 0.4%), Asia (6 | 0.2%), and China (6 | 0.2%), together accounting for 1.7% of all Allendale residents.
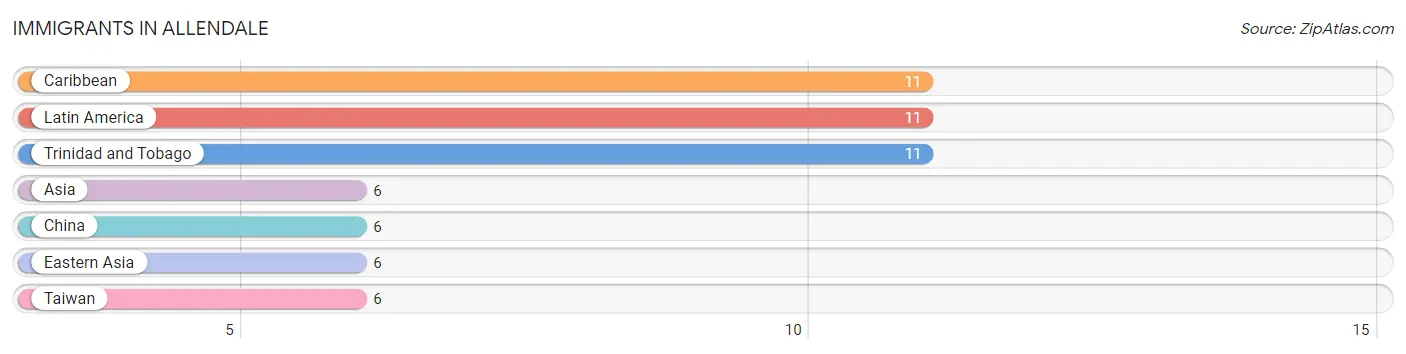
| Immigration Origin | # Population | % Population |
| Asia | 6 | 0.2% |
| Caribbean | 11 | 0.4% |
| China | 6 | 0.2% |
| Eastern Asia | 6 | 0.2% |
| Latin America | 11 | 0.4% |
| Taiwan | 6 | 0.2% |
| Trinidad and Tobago | 11 | 0.4% | View All 7 Rows |
Sex and Age in Allendale
Sex and Age in Allendale
The most populous age groups in Allendale are 10 to 14 Years (173 | 13.1%) for men and 65 to 69 Years (166 | 12.0%) for women.
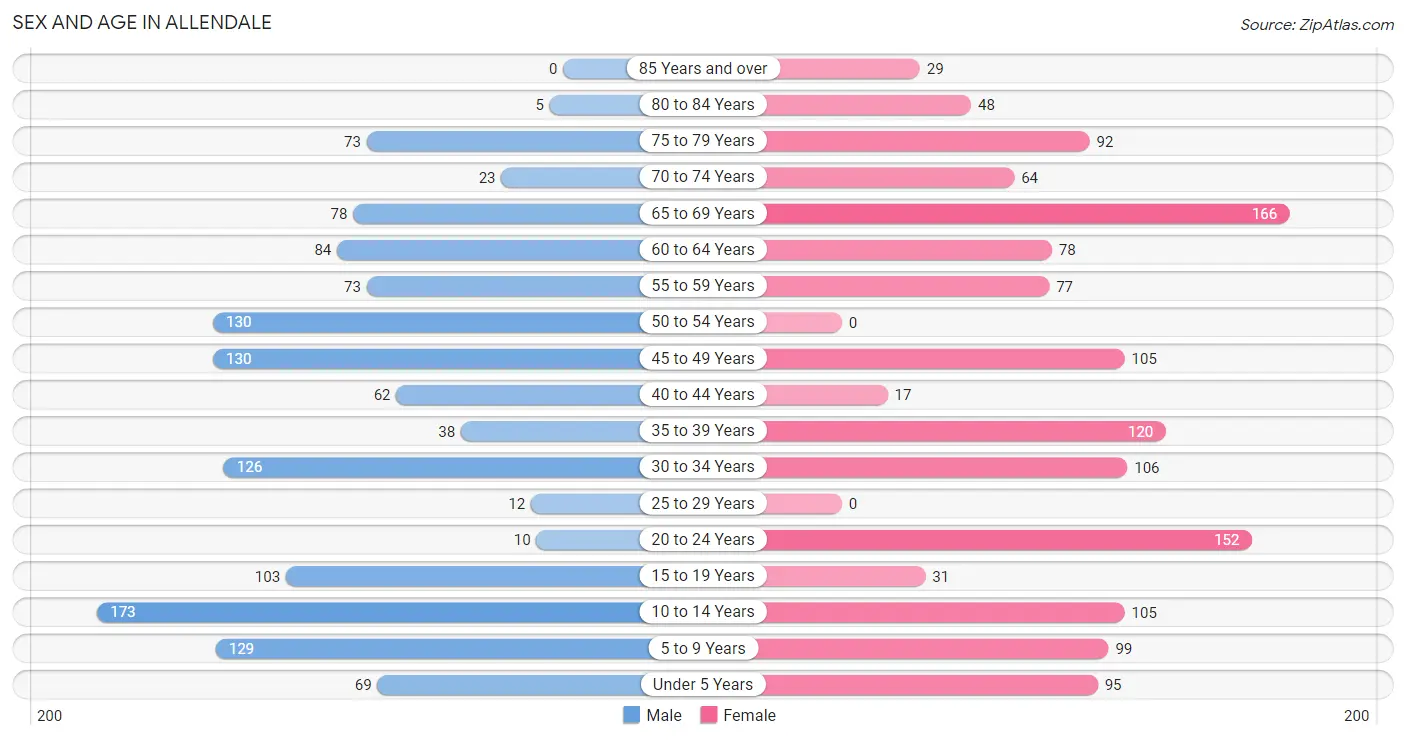
| Age Bracket | Male | Female |
| Under 5 Years | 69 (5.2%) | 95 (6.9%) |
| 5 to 9 Years | 129 (9.8%) | 99 (7.1%) |
| 10 to 14 Years | 173 (13.1%) | 105 (7.6%) |
| 15 to 19 Years | 103 (7.8%) | 31 (2.2%) |
| 20 to 24 Years | 10 (0.8%) | 152 (11.0%) |
| 25 to 29 Years | 12 (0.9%) | 0 (0.0%) |
| 30 to 34 Years | 126 (9.6%) | 106 (7.7%) |
| 35 to 39 Years | 38 (2.9%) | 120 (8.7%) |
| 40 to 44 Years | 62 (4.7%) | 17 (1.2%) |
| 45 to 49 Years | 130 (9.9%) | 105 (7.6%) |
| 50 to 54 Years | 130 (9.9%) | 0 (0.0%) |
| 55 to 59 Years | 73 (5.5%) | 77 (5.6%) |
| 60 to 64 Years | 84 (6.4%) | 78 (5.6%) |
| 65 to 69 Years | 78 (5.9%) | 166 (12.0%) |
| 70 to 74 Years | 23 (1.8%) | 64 (4.6%) |
| 75 to 79 Years | 73 (5.5%) | 92 (6.7%) |
| 80 to 84 Years | 5 (0.4%) | 48 (3.5%) |
| 85 Years and over | 0 (0.0%) | 29 (2.1%) |
| Total | 1,318 (100.0%) | 1,384 (100.0%) |
Families and Households in Allendale
Median Family Size in Allendale
The median family size in Allendale is 3.23 persons per family, with single female/mother families (229 | 38.2%) accounting for the largest median family size of 4.41 persons per family. On the other hand, married-couple families (287 | 47.9%) represent the smallest median family size with 2.35 persons per family.
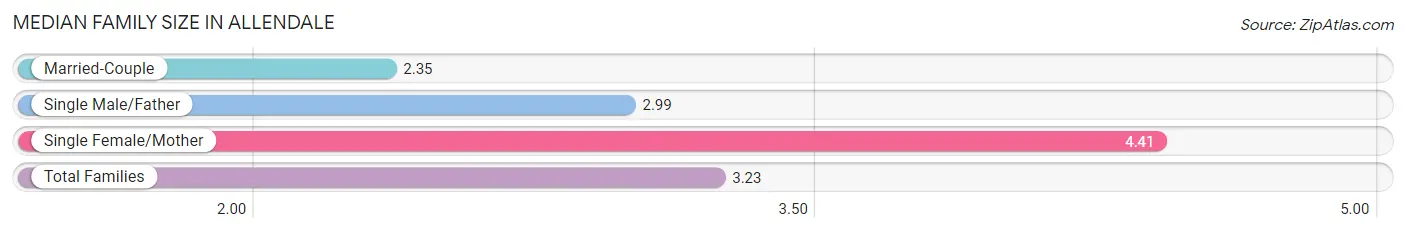
| Family Type | # Families | Family Size |
| Married-Couple | 287 (47.9%) | 2.35 |
| Single Male/Father | 83 (13.9%) | 2.99 |
| Single Female/Mother | 229 (38.2%) | 4.41 |
| Total Families | 599 (100.0%) | 3.23 |
Median Household Size in Allendale
The median household size in Allendale is 2.28 persons per household, with single female/mother households (229 | 19.8%) accounting for the largest median household size of 4.41 persons per household. non-family households (557 | 48.2%) represent the smallest median household size with 1.20 persons per household.
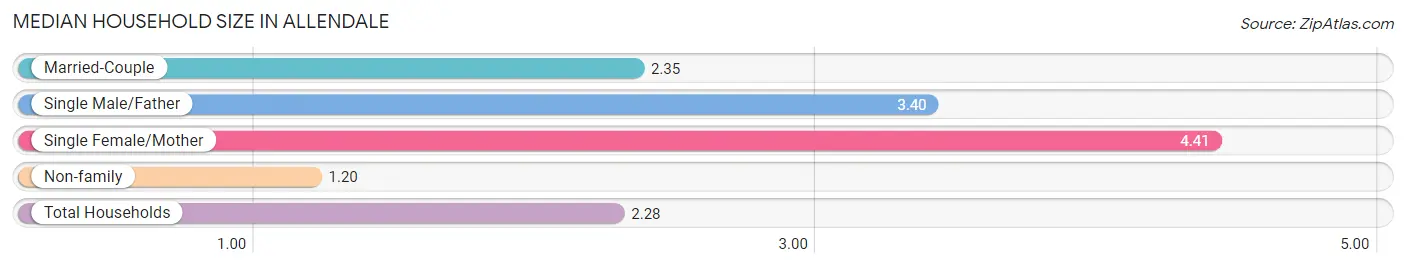
| Household Type | # Households | Household Size |
| Married-Couple | 287 (24.8%) | 2.35 |
| Single Male/Father | 83 (7.2%) | 3.40 |
| Single Female/Mother | 229 (19.8%) | 4.41 |
| Non-family | 557 (48.2%) | 1.20 |
| Total Households | 1,156 (100.0%) | 2.28 |
Household Size by Marriage Status in Allendale
Out of a total of 1,156 households in Allendale, 599 (51.8%) are family households, while 557 (48.2%) are nonfamily households. The most numerous type of family households are 2-person households, comprising 301, and the most common type of nonfamily households are 1-person households, comprising 446.
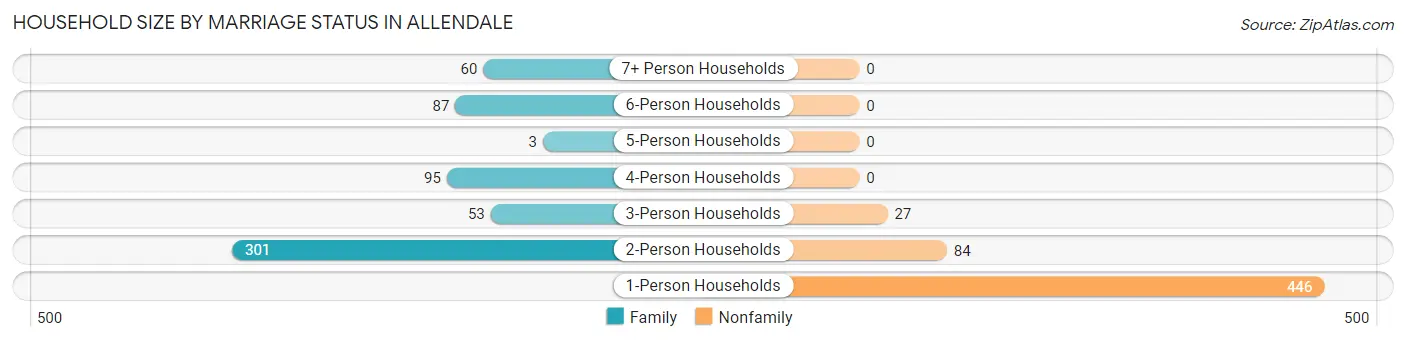
| Household Size | Family Households | Nonfamily Households |
| 1-Person Households | - | 446 (38.6%) |
| 2-Person Households | 301 (26.0%) | 84 (7.3%) |
| 3-Person Households | 53 (4.6%) | 27 (2.3%) |
| 4-Person Households | 95 (8.2%) | 0 (0.0%) |
| 5-Person Households | 3 (0.3%) | 0 (0.0%) |
| 6-Person Households | 87 (7.5%) | 0 (0.0%) |
| 7+ Person Households | 60 (5.2%) | 0 (0.0%) |
| Total | 599 (51.8%) | 557 (48.2%) |
Female Fertility in Allendale
Fertility by Age in Allendale
Average fertility rate in Allendale is 113.0 births per 1,000 women. Women in the age bracket of 15 to 19 years have the highest fertility rate with 677.0 births per 1,000 women. Women in the age bracket of 35 to 50 years acount for 65.0% of all women with births.
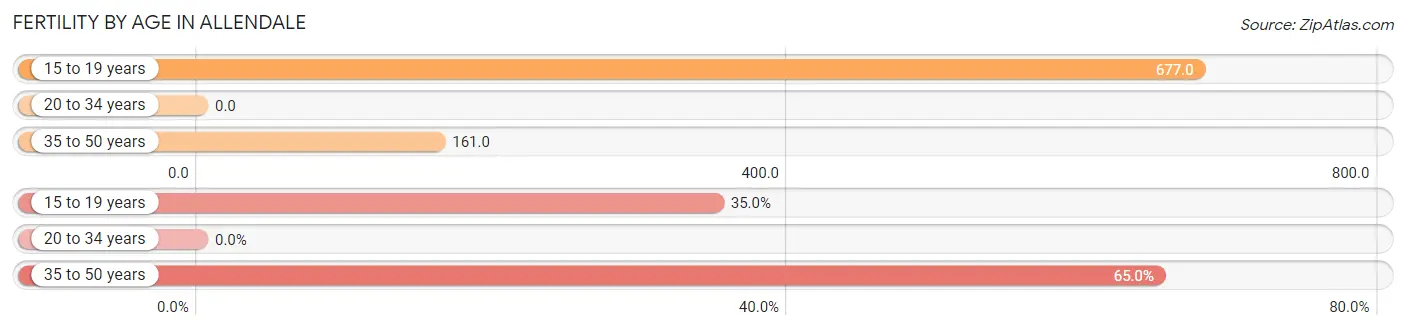
| Age Bracket | Women with Births | Births / 1,000 Women |
| 15 to 19 years | 21 (35.0%) | 677.0 |
| 20 to 34 years | 0 (0.0%) | 0.0 |
| 35 to 50 years | 39 (65.0%) | 161.0 |
| Total | 60 (100.0%) | 113.0 |
Fertility by Age by Marriage Status in Allendale
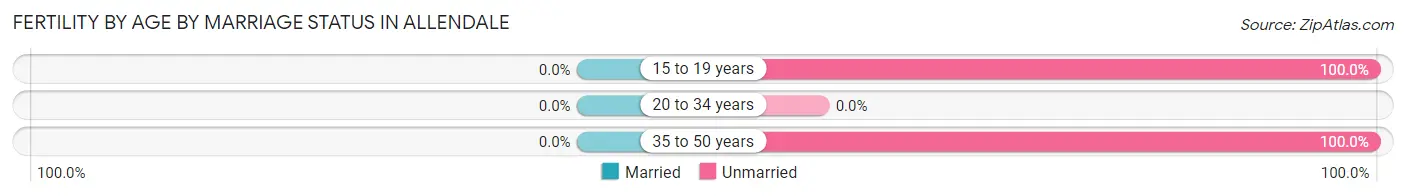
| Age Bracket | Married | Unmarried |
| 15 to 19 years | 0 (0.0%) | 21 (100.0%) |
| 20 to 34 years | 0 (0.0%) | 0 (0.0%) |
| 35 to 50 years | 0 (0.0%) | 39 (100.0%) |
| Total | 0 (0.0%) | 60 (100.0%) |
Fertility by Education in Allendale
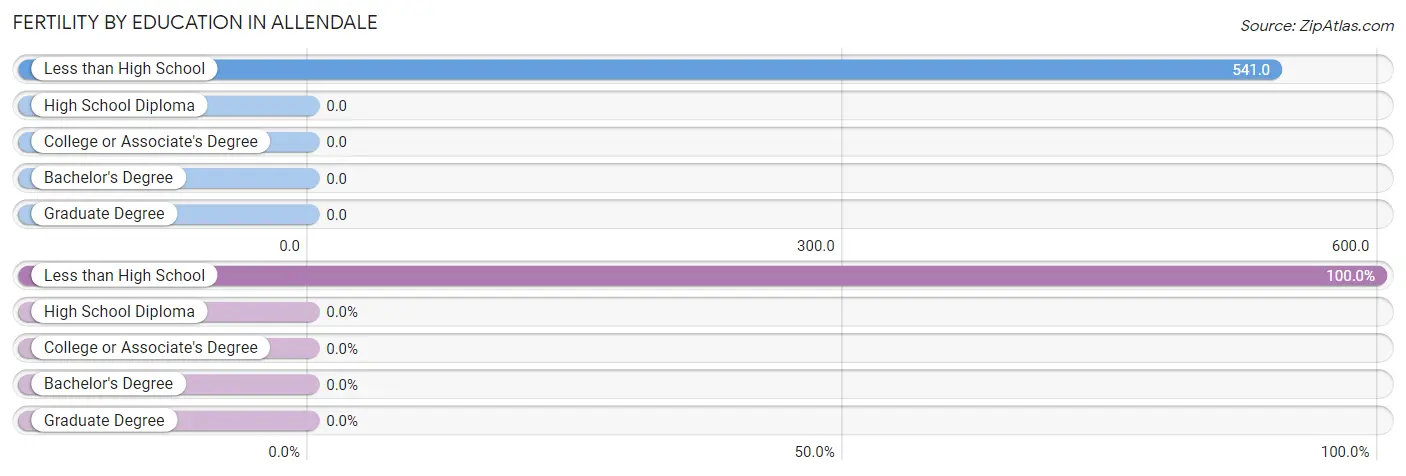
| Educational Attainment | Women with Births | Births / 1,000 Women |
| Less than High School | 60 (100.0%) | 541.0 |
| High School Diploma | 0 (0.0%) | 0.0 |
| College or Associate's Degree | 0 (0.0%) | 0.0 |
| Bachelor's Degree | 0 (0.0%) | 0.0 |
| Graduate Degree | 0 (0.0%) | 0.0 |
| Total | 60 (100.0%) | 113.0 |
Fertility by Education by Marriage Status in Allendale
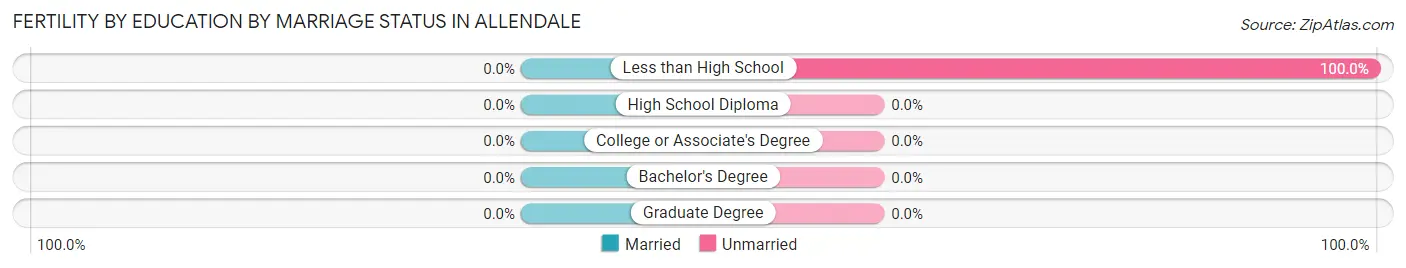
| Educational Attainment | Married | Unmarried |
| Less than High School | 0 (0.0%) | 60 (100.0%) |
| High School Diploma | 0 (0.0%) | 0 (0.0%) |
| College or Associate's Degree | 0 (0.0%) | 0 (0.0%) |
| Bachelor's Degree | 0 (0.0%) | 0 (0.0%) |
| Graduate Degree | 0 (0.0%) | 0 (0.0%) |
| Total | 0 (0.0%) | 60 (100.0%) |
Employment Characteristics in Allendale
Employment by Class of Employer in Allendale
Among the 767 employed individuals in Allendale, private company employees (425 | 55.4%), state government employees (178 | 23.2%), and not-for-profit organizations (87 | 11.3%) make up the most common classes of employment.
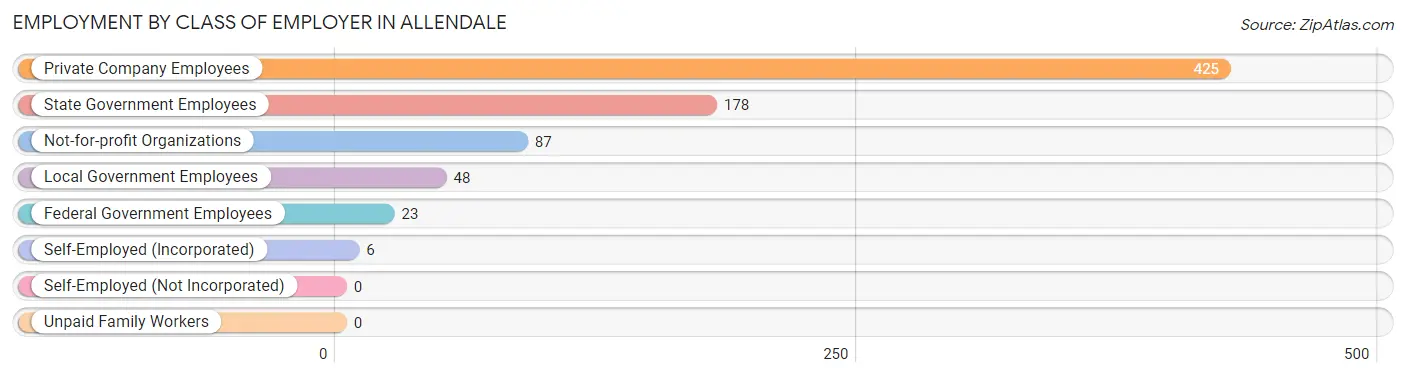
| Employer Class | # Employees | % Employees |
| Private Company Employees | 425 | 55.4% |
| Self-Employed (Incorporated) | 6 | 0.8% |
| Self-Employed (Not Incorporated) | 0 | 0.0% |
| Not-for-profit Organizations | 87 | 11.3% |
| Local Government Employees | 48 | 6.3% |
| State Government Employees | 178 | 23.2% |
| Federal Government Employees | 23 | 3.0% |
| Unpaid Family Workers | 0 | 0.0% |
| Total | 767 | 100.0% |
Employment Status by Age in Allendale
According to the labor force statistics for Allendale, out of the total population over 16 years of age (2,021), 41.8% or 845 individuals are in the labor force, with 9.2% or 78 of them unemployed. The age group with the highest labor force participation rate is 25 to 29 years, with 100.0% or 12 individuals in the labor force. Within the labor force, the 16 to 19 years age range has the highest percentage of unemployed individuals, with 100.0% or 13 of them being unemployed.
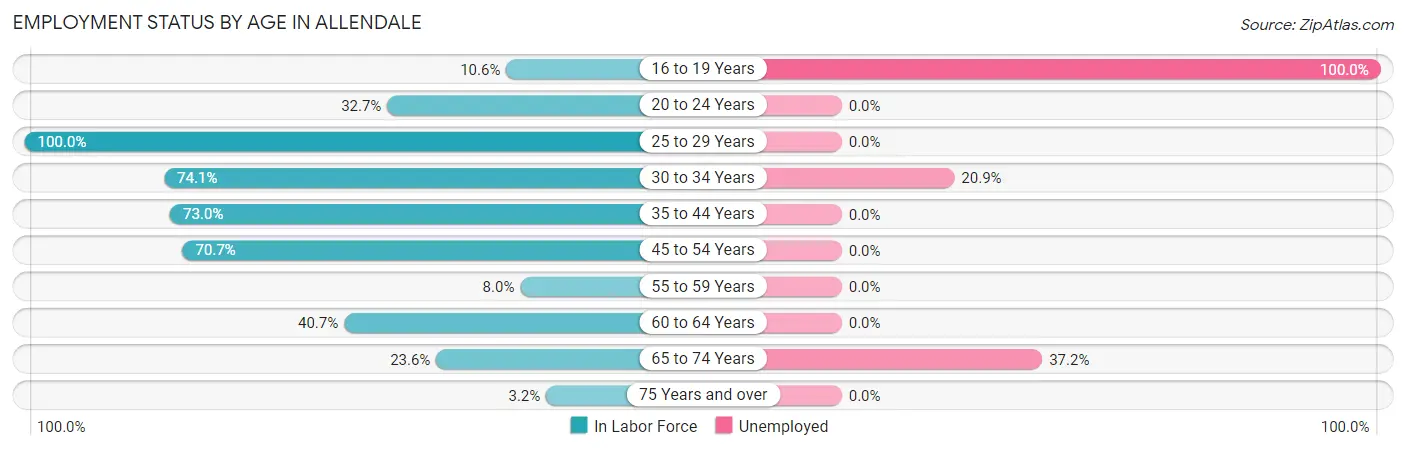
| Age Bracket | In Labor Force | Unemployed |
| 16 to 19 Years | 13 (10.6%) | 13 (100.0%) |
| 20 to 24 Years | 53 (32.7%) | 0 (0.0%) |
| 25 to 29 Years | 12 (100.0%) | 0 (0.0%) |
| 30 to 34 Years | 172 (74.1%) | 36 (20.9%) |
| 35 to 44 Years | 173 (73.0%) | 0 (0.0%) |
| 45 to 54 Years | 258 (70.7%) | 0 (0.0%) |
| 55 to 59 Years | 12 (8.0%) | 0 (0.0%) |
| 60 to 64 Years | 66 (40.7%) | 0 (0.0%) |
| 65 to 74 Years | 78 (23.6%) | 29 (37.2%) |
| 75 Years and over | 8 (3.2%) | 0 (0.0%) |
| Total | 845 (41.8%) | 78 (9.2%) |
Employment Status by Educational Attainment in Allendale
According to labor force statistics for Allendale, 59.8% of individuals (692) out of the total population between 25 and 64 years of age (1,158) are in the labor force, with 5.2% or 36 of them being unemployed. The group with the highest labor force participation rate are those with the educational attainment of high school diploma, with 62.0% or 258 individuals in the labor force. Within the labor force, individuals with less than high school education have the highest percentage of unemployment, with 12.7% or 14 of them being unemployed.
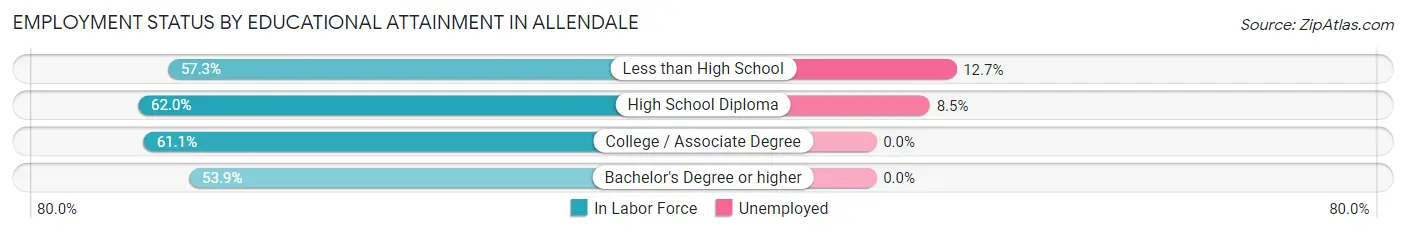
| Educational Attainment | In Labor Force | Unemployed |
| Less than High School | 110 (57.3%) | 24 (12.7%) |
| High School Diploma | 258 (62.0%) | 35 (8.5%) |
| College / Associate Degree | 242 (61.1%) | 0 (0.0%) |
| Bachelor's Degree or higher | 83 (53.9%) | 0 (0.0%) |
| Total | 692 (59.8%) | 60 (5.2%) |
Employment Occupations by Sex in Allendale
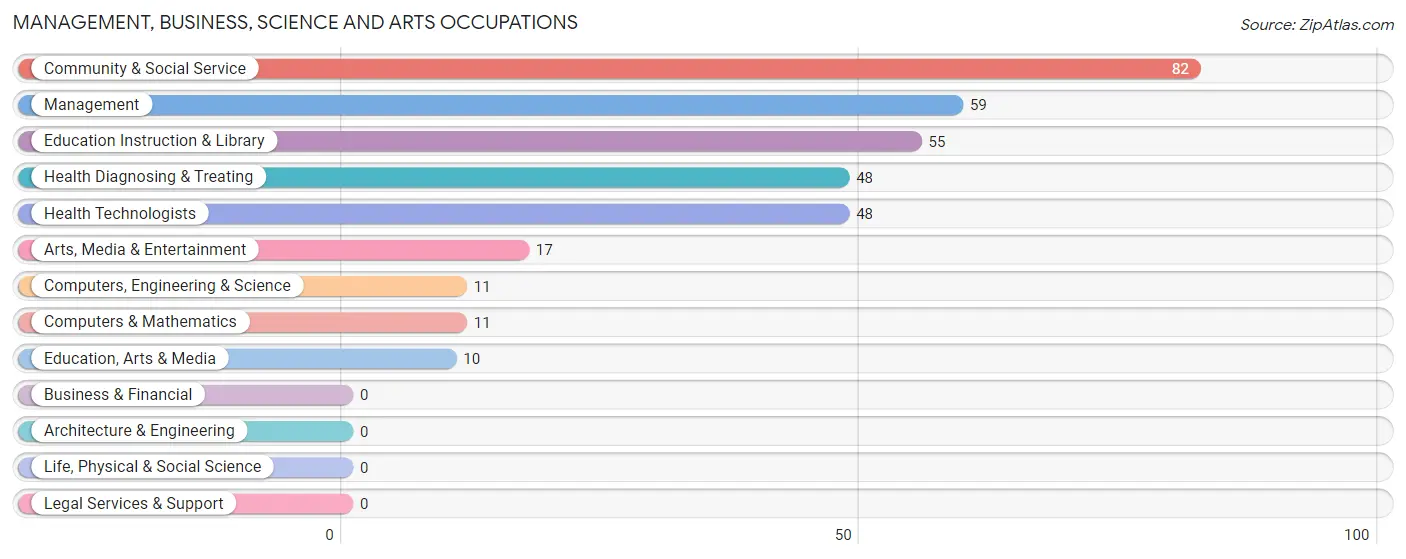
Management, Business, Science and Arts Occupations
The most common Management, Business, Science and Arts occupations in Allendale are Community & Social Service (82 | 10.7%), Management (59 | 7.7%), Education Instruction & Library (55 | 7.2%), Health Diagnosing & Treating (48 | 6.3%), and Health Technologists (48 | 6.3%).
Management, Business, Science and Arts Occupations by Sex
Within the Management, Business, Science and Arts occupations in Allendale, the most male-oriented occupations are Arts, Media & Entertainment (100.0%), Health Diagnosing & Treating (100.0%), and Health Technologists (100.0%), while the most female-oriented occupations are Computers, Engineering & Science (100.0%), Computers & Mathematics (100.0%), and Education, Arts & Media (100.0%).
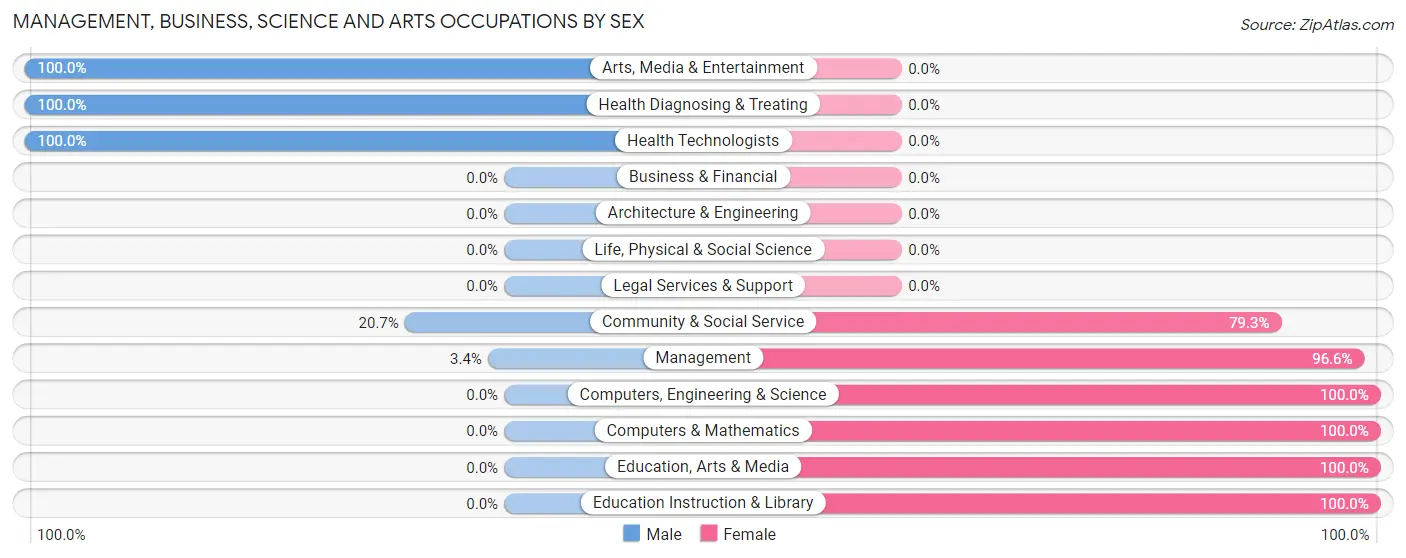
| Occupation | Male | Female |
| Management | 2 (3.4%) | 57 (96.6%) |
| Business & Financial | 0 (0.0%) | 0 (0.0%) |
| Computers, Engineering & Science | 0 (0.0%) | 11 (100.0%) |
| Computers & Mathematics | 0 (0.0%) | 11 (100.0%) |
| Architecture & Engineering | 0 (0.0%) | 0 (0.0%) |
| Life, Physical & Social Science | 0 (0.0%) | 0 (0.0%) |
| Community & Social Service | 17 (20.7%) | 65 (79.3%) |
| Education, Arts & Media | 0 (0.0%) | 10 (100.0%) |
| Legal Services & Support | 0 (0.0%) | 0 (0.0%) |
| Education Instruction & Library | 0 (0.0%) | 55 (100.0%) |
| Arts, Media & Entertainment | 17 (100.0%) | 0 (0.0%) |
| Health Diagnosing & Treating | 48 (100.0%) | 0 (0.0%) |
| Health Technologists | 48 (100.0%) | 0 (0.0%) |
| Total (Category) | 67 (33.5%) | 133 (66.5%) |
| Total (Overall) | 409 (53.3%) | 358 (46.7%) |
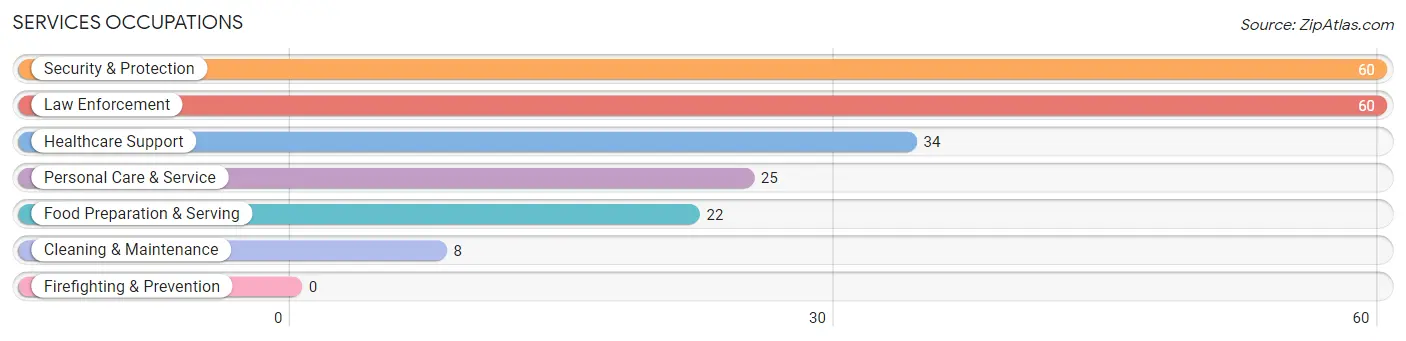
Services Occupations
The most common Services occupations in Allendale are Security & Protection (60 | 7.8%), Law Enforcement (60 | 7.8%), Healthcare Support (34 | 4.4%), Personal Care & Service (25 | 3.3%), and Food Preparation & Serving (22 | 2.9%).
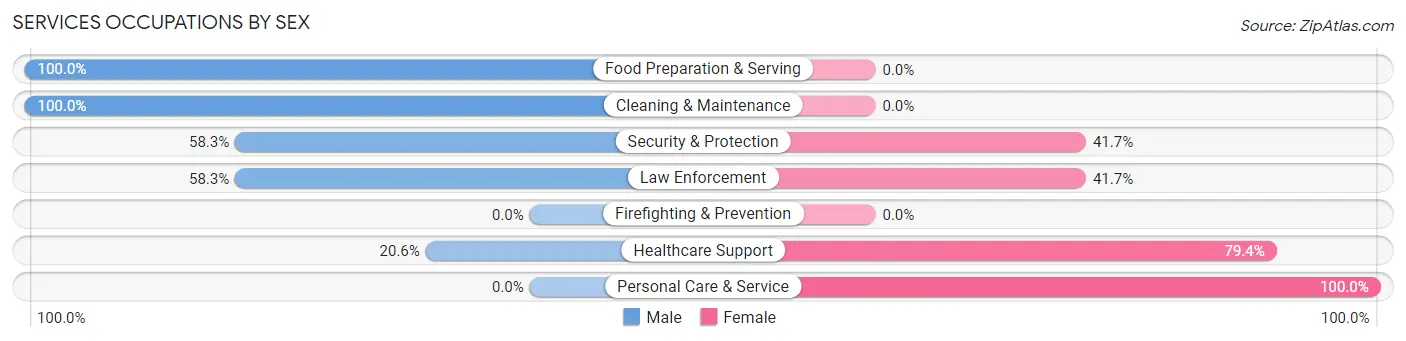
Services Occupations by Sex
Within the Services occupations in Allendale, the most male-oriented occupations are Food Preparation & Serving (100.0%), Cleaning & Maintenance (100.0%), and Security & Protection (58.3%), while the most female-oriented occupations are Personal Care & Service (100.0%), Healthcare Support (79.4%), and Security & Protection (41.7%).
| Occupation | Male | Female |
| Healthcare Support | 7 (20.6%) | 27 (79.4%) |
| Security & Protection | 35 (58.3%) | 25 (41.7%) |
| Firefighting & Prevention | 0 (0.0%) | 0 (0.0%) |
| Law Enforcement | 35 (58.3%) | 25 (41.7%) |
| Food Preparation & Serving | 22 (100.0%) | 0 (0.0%) |
| Cleaning & Maintenance | 8 (100.0%) | 0 (0.0%) |
| Personal Care & Service | 0 (0.0%) | 25 (100.0%) |
| Total (Category) | 72 (48.3%) | 77 (51.7%) |
| Total (Overall) | 409 (53.3%) | 358 (46.7%) |
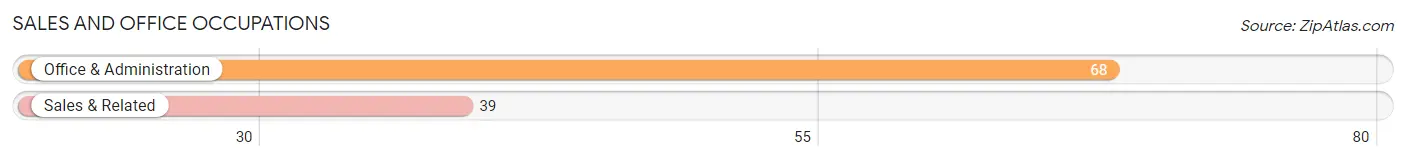
Sales and Office Occupations
The most common Sales and Office occupations in Allendale are Office & Administration (68 | 8.9%), and Sales & Related (39 | 5.1%).
Sales and Office Occupations by Sex
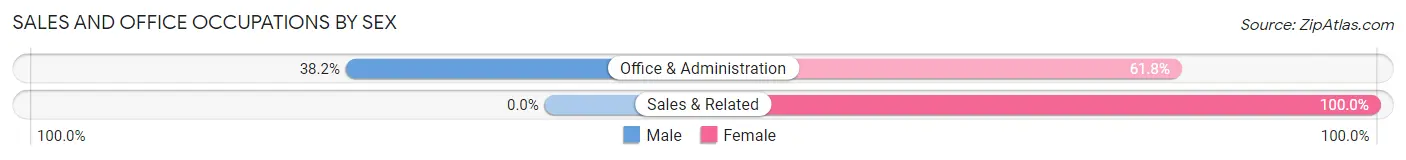
| Occupation | Male | Female |
| Sales & Related | 0 (0.0%) | 39 (100.0%) |
| Office & Administration | 26 (38.2%) | 42 (61.8%) |
| Total (Category) | 26 (24.3%) | 81 (75.7%) |
| Total (Overall) | 409 (53.3%) | 358 (46.7%) |
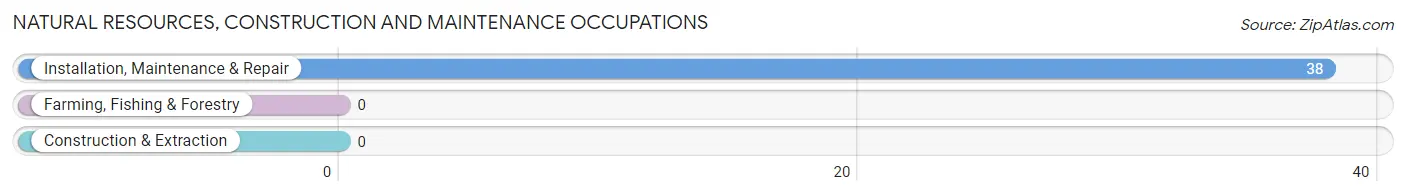
Natural Resources, Construction and Maintenance Occupations
The most common Natural Resources, Construction and Maintenance occupations in Allendale are , and Installation, Maintenance & Repair (38 | 5.0%).
Natural Resources, Construction and Maintenance Occupations by Sex
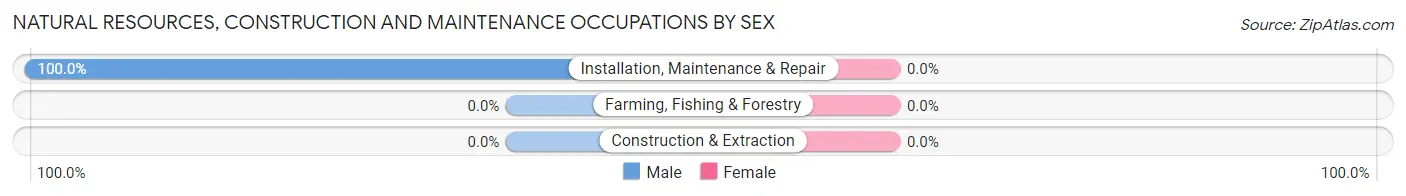
| Occupation | Male | Female |
| Farming, Fishing & Forestry | 0 (0.0%) | 0 (0.0%) |
| Construction & Extraction | 0 (0.0%) | 0 (0.0%) |
| Installation, Maintenance & Repair | 38 (100.0%) | 0 (0.0%) |
| Total (Category) | 38 (100.0%) | 0 (0.0%) |
| Total (Overall) | 409 (53.3%) | 358 (46.7%) |
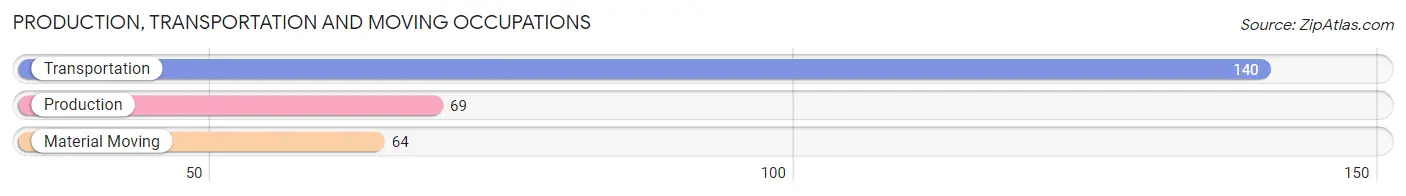
Production, Transportation and Moving Occupations
The most common Production, Transportation and Moving occupations in Allendale are Transportation (140 | 18.2%), Production (69 | 9.0%), and Material Moving (64 | 8.3%).
Production, Transportation and Moving Occupations by Sex
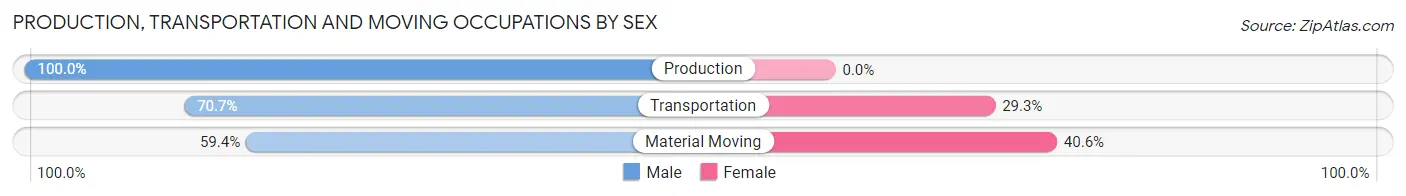
| Occupation | Male | Female |
| Production | 69 (100.0%) | 0 (0.0%) |
| Transportation | 99 (70.7%) | 41 (29.3%) |
| Material Moving | 38 (59.4%) | 26 (40.6%) |
| Total (Category) | 206 (75.5%) | 67 (24.5%) |
| Total (Overall) | 409 (53.3%) | 358 (46.7%) |
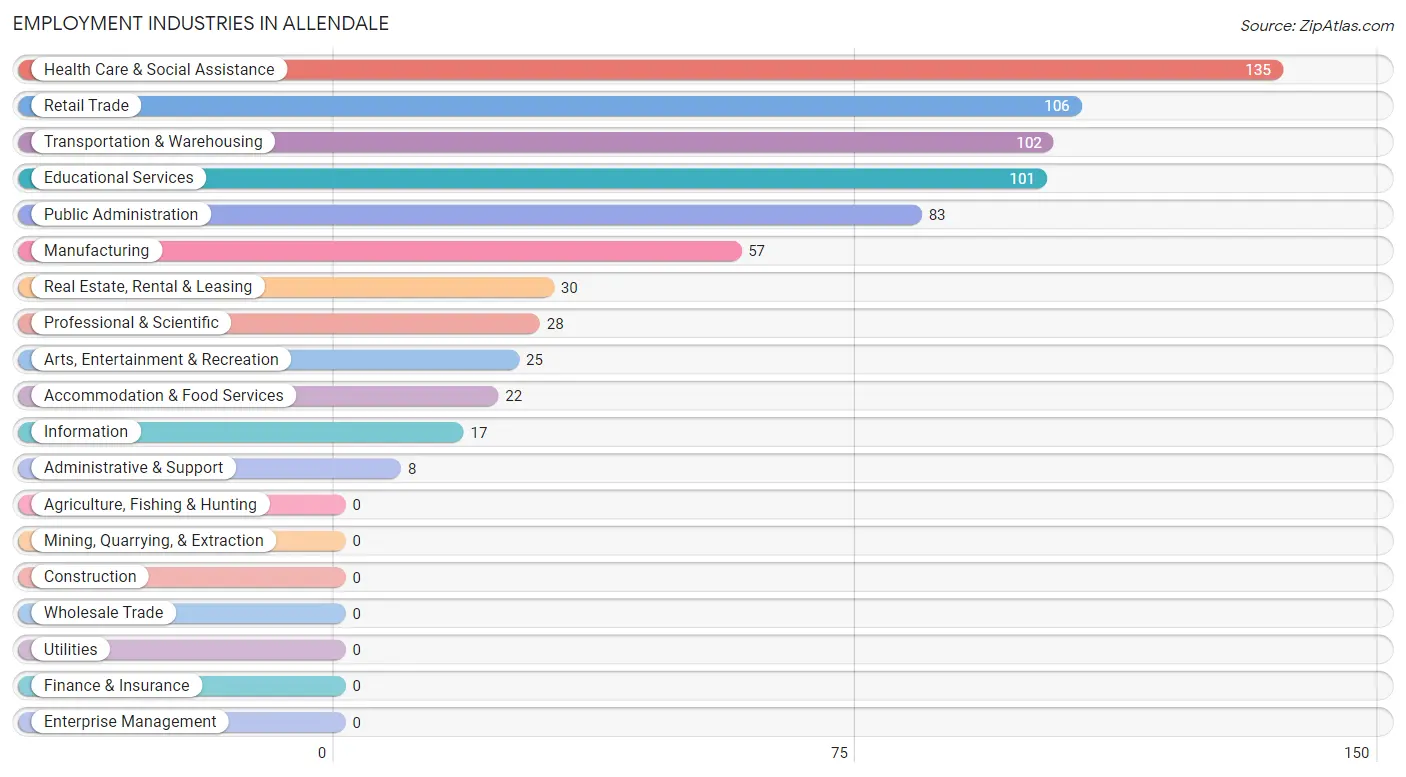
Employment Industries by Sex in Allendale
Employment Industries in Allendale
The major employment industries in Allendale include Health Care & Social Assistance (135 | 17.6%), Retail Trade (106 | 13.8%), Transportation & Warehousing (102 | 13.3%), Educational Services (101 | 13.2%), and Public Administration (83 | 10.8%).
Employment Industries by Sex in Allendale
The Allendale industries that see more men than women are Manufacturing (100.0%), Information (100.0%), and Administrative & Support (100.0%), whereas the industries that tend to have a higher number of women are Professional & Scientific (100.0%), Educational Services (100.0%), and Arts, Entertainment & Recreation (100.0%).
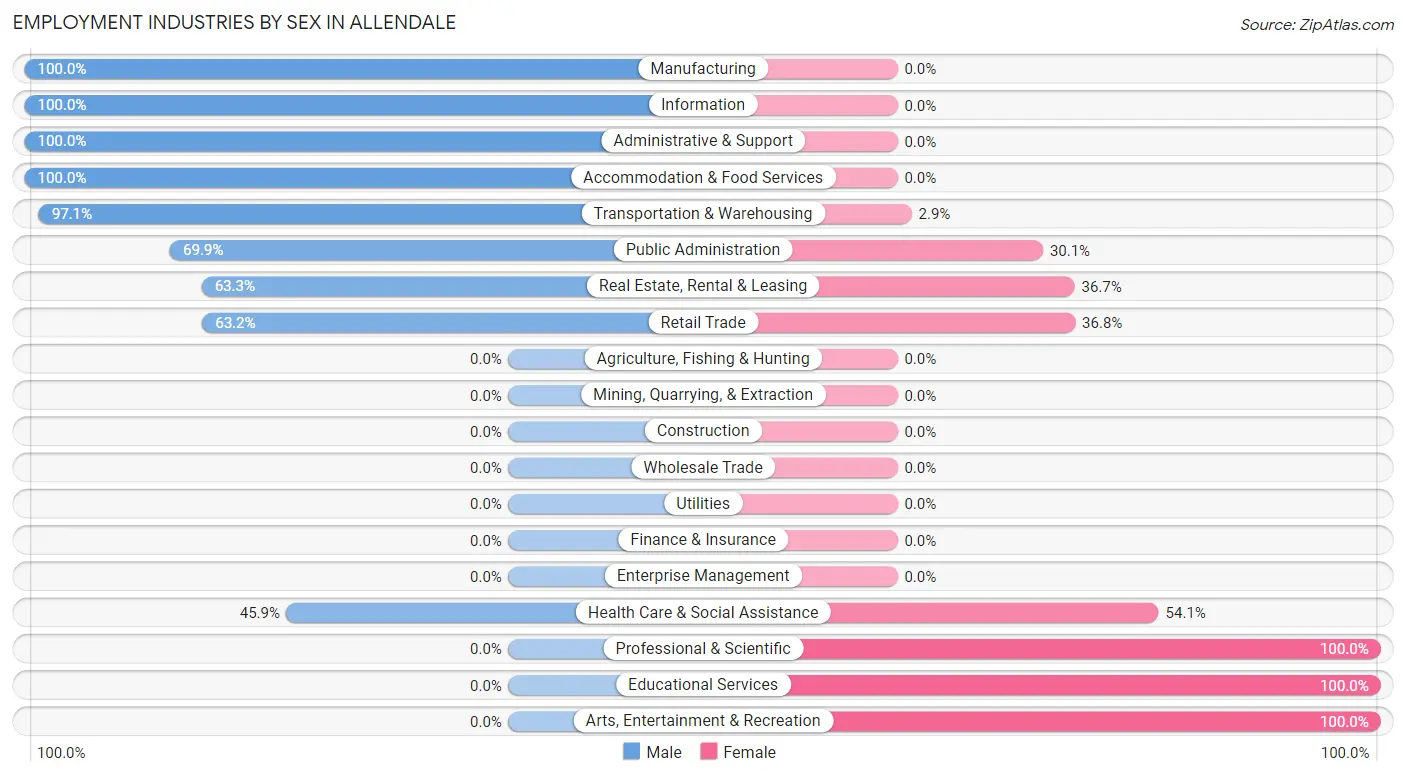
| Industry | Male | Female |
| Agriculture, Fishing & Hunting | 0 (0.0%) | 0 (0.0%) |
| Mining, Quarrying, & Extraction | 0 (0.0%) | 0 (0.0%) |
| Construction | 0 (0.0%) | 0 (0.0%) |
| Manufacturing | 57 (100.0%) | 0 (0.0%) |
| Wholesale Trade | 0 (0.0%) | 0 (0.0%) |
| Retail Trade | 67 (63.2%) | 39 (36.8%) |
| Transportation & Warehousing | 99 (97.1%) | 3 (2.9%) |
| Utilities | 0 (0.0%) | 0 (0.0%) |
| Information | 17 (100.0%) | 0 (0.0%) |
| Finance & Insurance | 0 (0.0%) | 0 (0.0%) |
| Real Estate, Rental & Leasing | 19 (63.3%) | 11 (36.7%) |
| Professional & Scientific | 0 (0.0%) | 28 (100.0%) |
| Enterprise Management | 0 (0.0%) | 0 (0.0%) |
| Administrative & Support | 8 (100.0%) | 0 (0.0%) |
| Educational Services | 0 (0.0%) | 101 (100.0%) |
| Health Care & Social Assistance | 62 (45.9%) | 73 (54.1%) |
| Arts, Entertainment & Recreation | 0 (0.0%) | 25 (100.0%) |
| Accommodation & Food Services | 22 (100.0%) | 0 (0.0%) |
| Public Administration | 58 (69.9%) | 25 (30.1%) |
| Total | 409 (53.3%) | 358 (46.7%) |
Education in Allendale
School Enrollment in Allendale
The most common levels of schooling among the 694 students in Allendale are elementary school (214 | 30.8%), high school (210 | 30.3%), and middle school (166 | 23.9%).
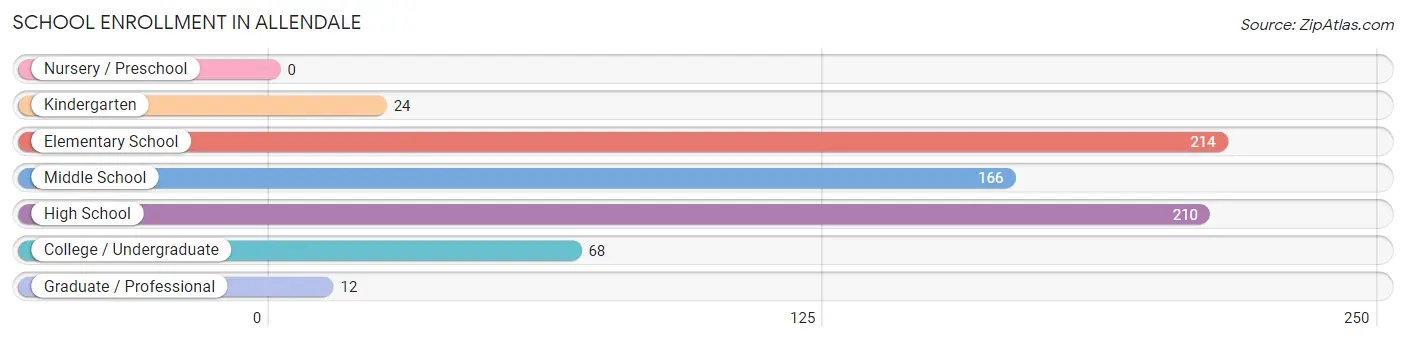
| School Level | # Students | % Students |
| Nursery / Preschool | 0 | 0.0% |
| Kindergarten | 24 | 3.5% |
| Elementary School | 214 | 30.8% |
| Middle School | 166 | 23.9% |
| High School | 210 | 30.3% |
| College / Undergraduate | 68 | 9.8% |
| Graduate / Professional | 12 | 1.7% |
| Total | 694 | 100.0% |
School Enrollment by Age by Funding Source in Allendale
Out of a total of 694 students who are enrolled in schools in Allendale, 84 (12.1%) attend a private institution, while the remaining 610 (87.9%) are enrolled in public schools. The age group of 20 to 24 year olds has the highest likelihood of being enrolled in private schools, with 25 (42.4% in the age bracket) enrolled. Conversely, the age group of 18 to 19 year olds has the lowest likelihood of being enrolled in a private school, with 42 (100.0% in the age bracket) attending a public institution.
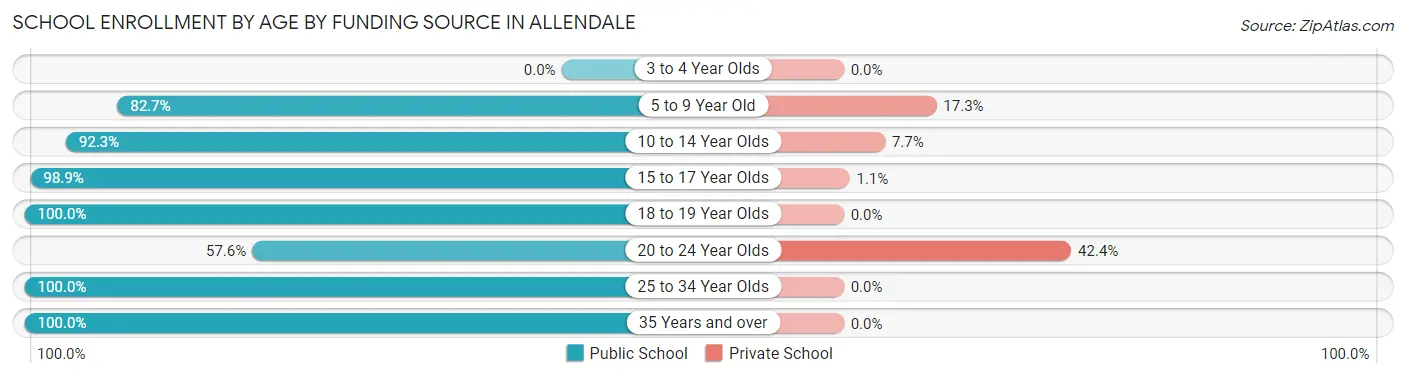
| Age Bracket | Public School | Private School |
| 3 to 4 Year Olds | 0 (0.0%) | 0 (0.0%) |
| 5 to 9 Year Old | 182 (82.7%) | 38 (17.3%) |
| 10 to 14 Year Olds | 240 (92.3%) | 20 (7.7%) |
| 15 to 17 Year Olds | 91 (98.9%) | 1 (1.1%) |
| 18 to 19 Year Olds | 42 (100.0%) | 0 (0.0%) |
| 20 to 24 Year Olds | 34 (57.6%) | 25 (42.4%) |
| 25 to 34 Year Olds | 12 (100.0%) | 0 (0.0%) |
| 35 Years and over | 9 (100.0%) | 0 (0.0%) |
| Total | 610 (87.9%) | 84 (12.1%) |
Educational Attainment by Field of Study in Allendale
Social sciences (58 | 29.4%), liberal arts & history (48 | 24.4%), bio, nature & agricultural (26 | 13.2%), science & technology (23 | 11.7%), and education (17 | 8.6%) are the most common fields of study among 197 individuals in Allendale who have obtained a bachelor's degree or higher.
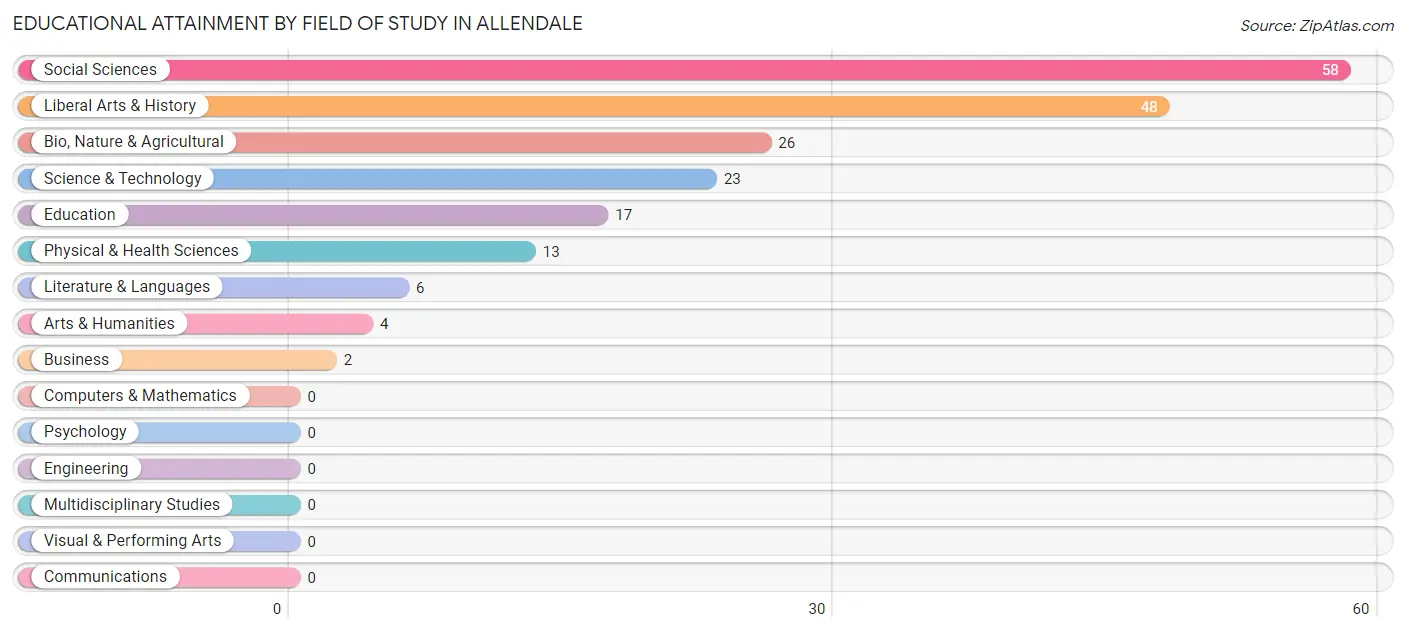
| Field of Study | # Graduates | % Graduates |
| Computers & Mathematics | 0 | 0.0% |
| Bio, Nature & Agricultural | 26 | 13.2% |
| Physical & Health Sciences | 13 | 6.6% |
| Psychology | 0 | 0.0% |
| Social Sciences | 58 | 29.4% |
| Engineering | 0 | 0.0% |
| Multidisciplinary Studies | 0 | 0.0% |
| Science & Technology | 23 | 11.7% |
| Business | 2 | 1.0% |
| Education | 17 | 8.6% |
| Literature & Languages | 6 | 3.0% |
| Liberal Arts & History | 48 | 24.4% |
| Visual & Performing Arts | 0 | 0.0% |
| Communications | 0 | 0.0% |
| Arts & Humanities | 4 | 2.0% |
| Total | 197 | 100.0% |
Transportation & Commute in Allendale
Vehicle Availability by Sex in Allendale
The most prevalent vehicle ownership categories in Allendale are males with 2 vehicles (152, accounting for 41.1%) and females with 2 vehicles (103, making up 42.5%).
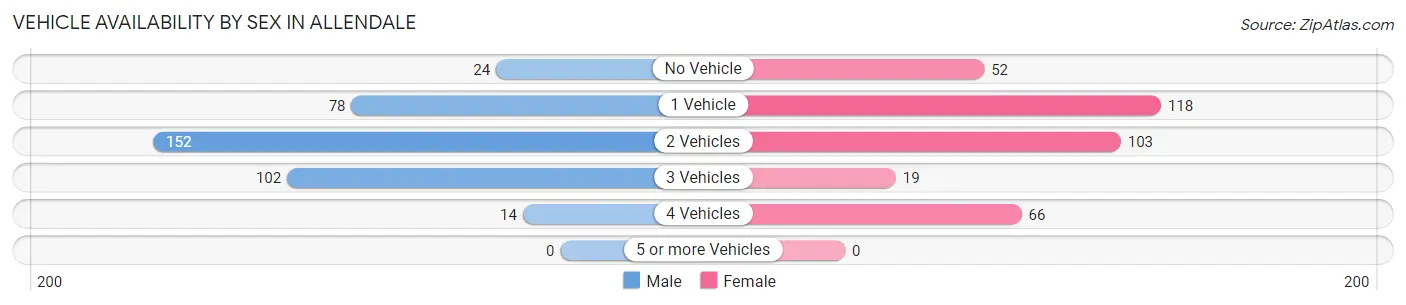
| Vehicles Available | Male | Female |
| No Vehicle | 24 (6.5%) | 52 (14.5%) |
| 1 Vehicle | 78 (21.1%) | 118 (33.0%) |
| 2 Vehicles | 152 (41.1%) | 103 (28.8%) |
| 3 Vehicles | 102 (27.6%) | 19 (5.3%) |
| 4 Vehicles | 14 (3.8%) | 66 (18.4%) |
| 5 or more Vehicles | 0 (0.0%) | 0 (0.0%) |
| Total | 370 (100.0%) | 358 (100.0%) |
Commute Time in Allendale
The most frequently occuring commute durations in Allendale are 5 to 9 minutes (198 commuters, 25.8%), 10 to 14 minutes (143 commuters, 18.6%), and 90 or more minutes (91 commuters, 11.9%).
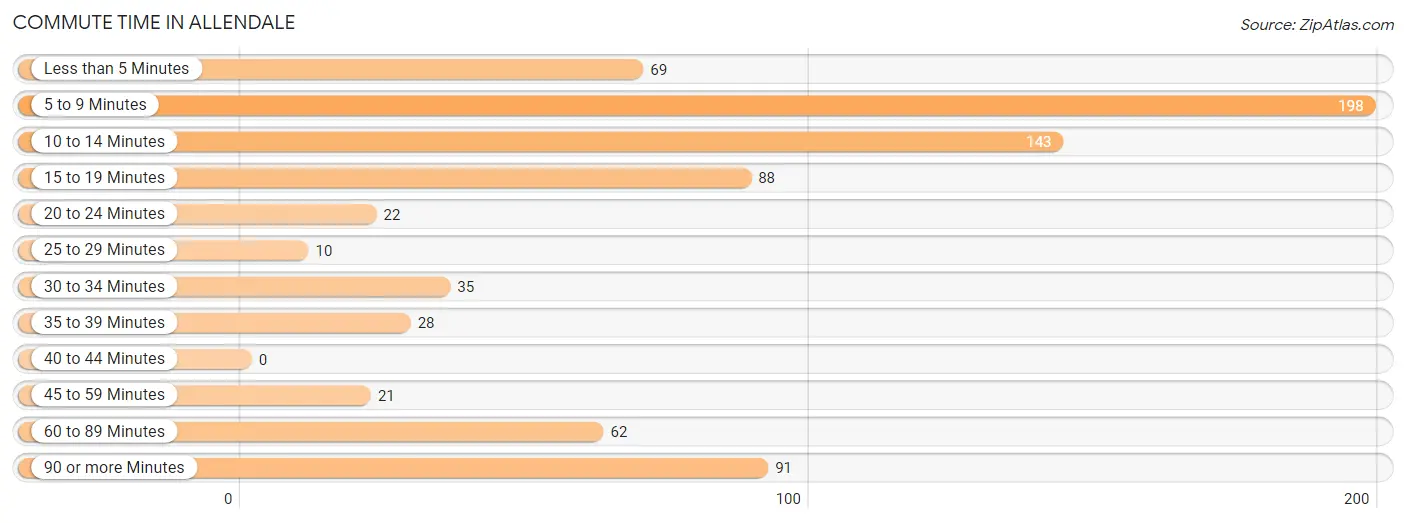
| Commute Time | # Commuters | % Commuters |
| Less than 5 Minutes | 69 | 9.0% |
| 5 to 9 Minutes | 198 | 25.8% |
| 10 to 14 Minutes | 143 | 18.6% |
| 15 to 19 Minutes | 88 | 11.5% |
| 20 to 24 Minutes | 22 | 2.9% |
| 25 to 29 Minutes | 10 | 1.3% |
| 30 to 34 Minutes | 35 | 4.6% |
| 35 to 39 Minutes | 28 | 3.6% |
| 40 to 44 Minutes | 0 | 0.0% |
| 45 to 59 Minutes | 21 | 2.7% |
| 60 to 89 Minutes | 62 | 8.1% |
| 90 or more Minutes | 91 | 11.9% |
Commute Time by Sex in Allendale
The most common commute times in Allendale are 5 to 9 minutes (79 commuters, 19.3%) for males and 5 to 9 minutes (119 commuters, 33.2%) for females.
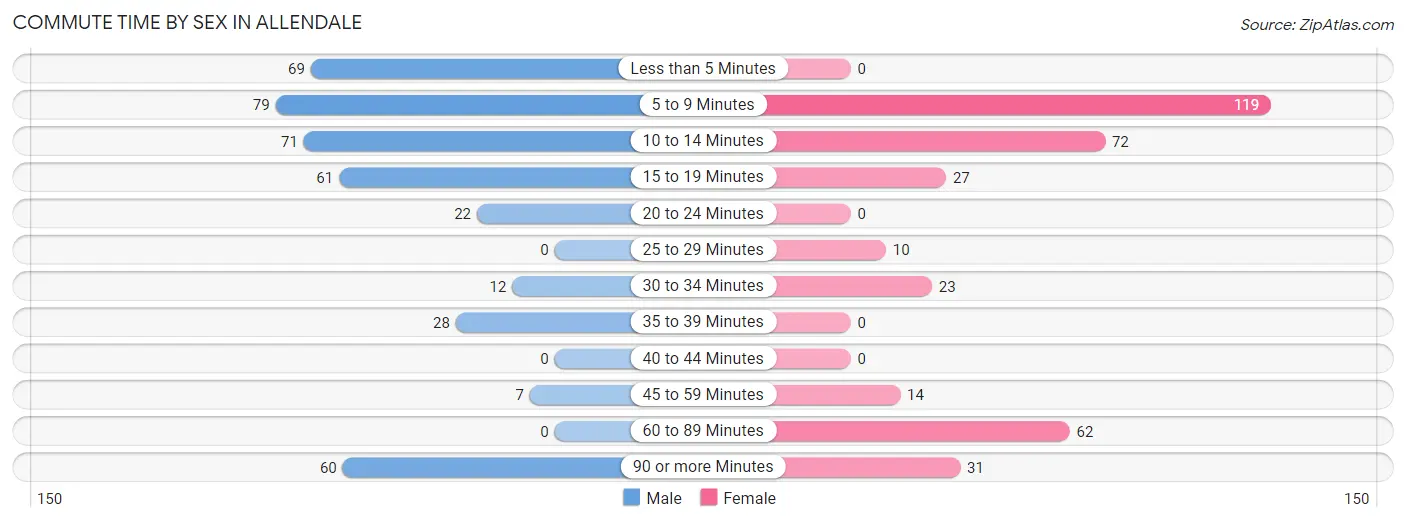
| Commute Time | Male | Female |
| Less than 5 Minutes | 69 (16.9%) | 0 (0.0%) |
| 5 to 9 Minutes | 79 (19.3%) | 119 (33.2%) |
| 10 to 14 Minutes | 71 (17.4%) | 72 (20.1%) |
| 15 to 19 Minutes | 61 (14.9%) | 27 (7.5%) |
| 20 to 24 Minutes | 22 (5.4%) | 0 (0.0%) |
| 25 to 29 Minutes | 0 (0.0%) | 10 (2.8%) |
| 30 to 34 Minutes | 12 (2.9%) | 23 (6.4%) |
| 35 to 39 Minutes | 28 (6.9%) | 0 (0.0%) |
| 40 to 44 Minutes | 0 (0.0%) | 0 (0.0%) |
| 45 to 59 Minutes | 7 (1.7%) | 14 (3.9%) |
| 60 to 89 Minutes | 0 (0.0%) | 62 (17.3%) |
| 90 or more Minutes | 60 (14.7%) | 31 (8.7%) |
Time of Departure to Work by Sex in Allendale
The most frequent times of departure to work in Allendale are 12:00 AM to 4:59 AM (94, 23.0%) for males and 7:00 AM to 7:29 AM (104, 29.0%) for females.
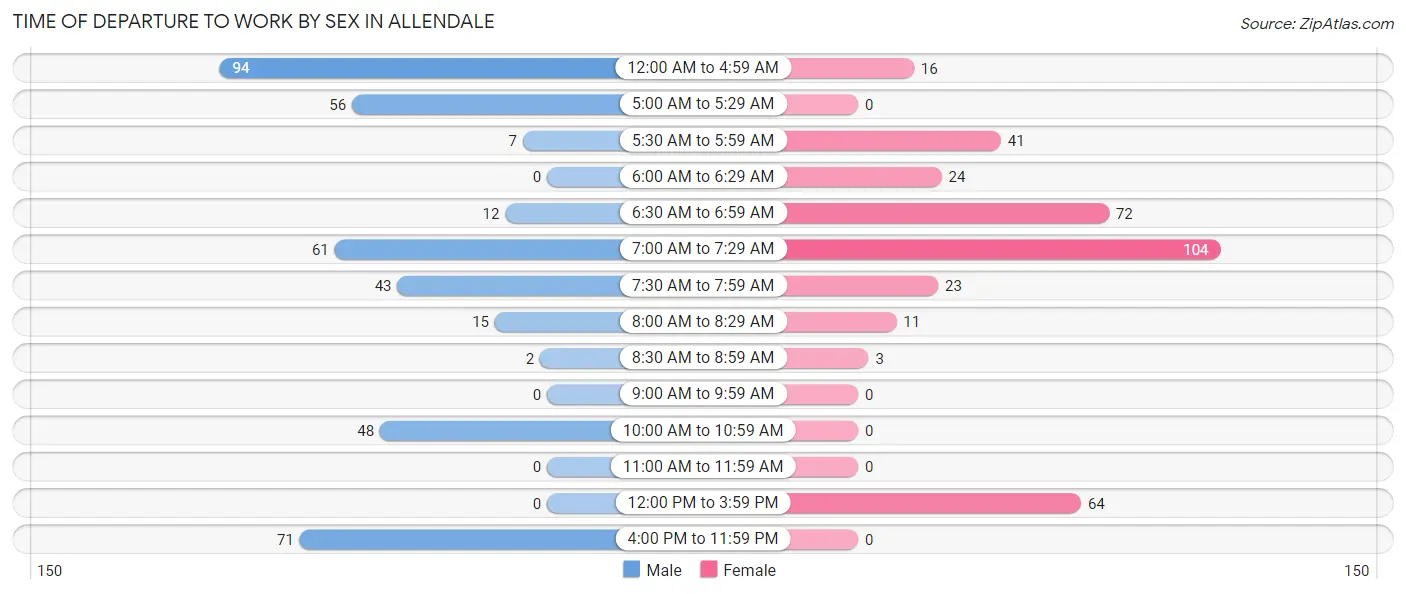
| Time of Departure | Male | Female |
| 12:00 AM to 4:59 AM | 94 (23.0%) | 16 (4.5%) |
| 5:00 AM to 5:29 AM | 56 (13.7%) | 0 (0.0%) |
| 5:30 AM to 5:59 AM | 7 (1.7%) | 41 (11.5%) |
| 6:00 AM to 6:29 AM | 0 (0.0%) | 24 (6.7%) |
| 6:30 AM to 6:59 AM | 12 (2.9%) | 72 (20.1%) |
| 7:00 AM to 7:29 AM | 61 (14.9%) | 104 (29.0%) |
| 7:30 AM to 7:59 AM | 43 (10.5%) | 23 (6.4%) |
| 8:00 AM to 8:29 AM | 15 (3.7%) | 11 (3.1%) |
| 8:30 AM to 8:59 AM | 2 (0.5%) | 3 (0.8%) |
| 9:00 AM to 9:59 AM | 0 (0.0%) | 0 (0.0%) |
| 10:00 AM to 10:59 AM | 48 (11.7%) | 0 (0.0%) |
| 11:00 AM to 11:59 AM | 0 (0.0%) | 0 (0.0%) |
| 12:00 PM to 3:59 PM | 0 (0.0%) | 64 (17.9%) |
| 4:00 PM to 11:59 PM | 71 (17.4%) | 0 (0.0%) |
| Total | 409 (100.0%) | 358 (100.0%) |
Housing Occupancy in Allendale
Occupancy by Ownership in Allendale
Of the total 1,156 dwellings in Allendale, owner-occupied units account for 758 (65.6%), while renter-occupied units make up 398 (34.4%).
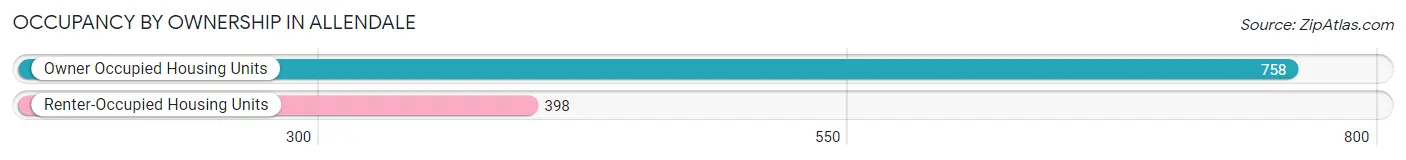
| Occupancy | # Housing Units | % Housing Units |
| Owner Occupied Housing Units | 758 | 65.6% |
| Renter-Occupied Housing Units | 398 | 34.4% |
| Total Occupied Housing Units | 1,156 | 100.0% |
Occupancy by Household Size in Allendale
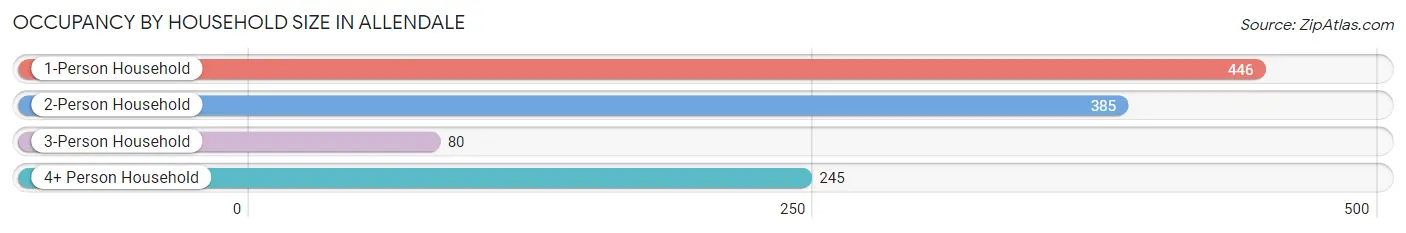
| Household Size | # Housing Units | % Housing Units |
| 1-Person Household | 446 | 38.6% |
| 2-Person Household | 385 | 33.3% |
| 3-Person Household | 80 | 6.9% |
| 4+ Person Household | 245 | 21.2% |
| Total Housing Units | 1,156 | 100.0% |
Occupancy by Ownership by Household Size in Allendale
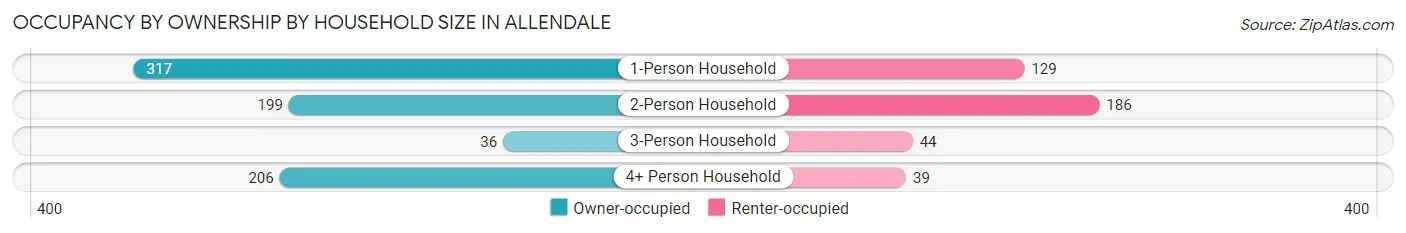
| Household Size | Owner-occupied | Renter-occupied |
| 1-Person Household | 317 (71.1%) | 129 (28.9%) |
| 2-Person Household | 199 (51.7%) | 186 (48.3%) |
| 3-Person Household | 36 (45.0%) | 44 (55.0%) |
| 4+ Person Household | 206 (84.1%) | 39 (15.9%) |
| Total Housing Units | 758 (65.6%) | 398 (34.4%) |
Occupancy by Educational Attainment in Allendale
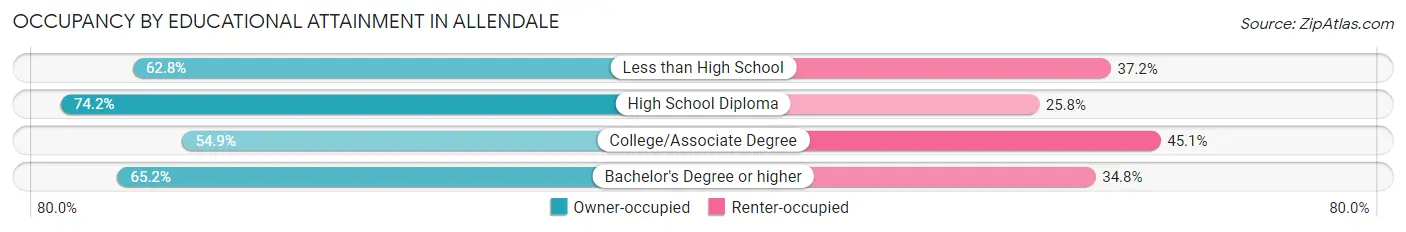
| Household Size | Owner-occupied | Renter-occupied |
| Less than High School | 125 (62.8%) | 74 (37.2%) |
| High School Diploma | 348 (74.2%) | 121 (25.8%) |
| College/Associate Degree | 178 (54.9%) | 146 (45.1%) |
| Bachelor's Degree or higher | 107 (65.2%) | 57 (34.8%) |
Occupancy by Age of Householder in Allendale
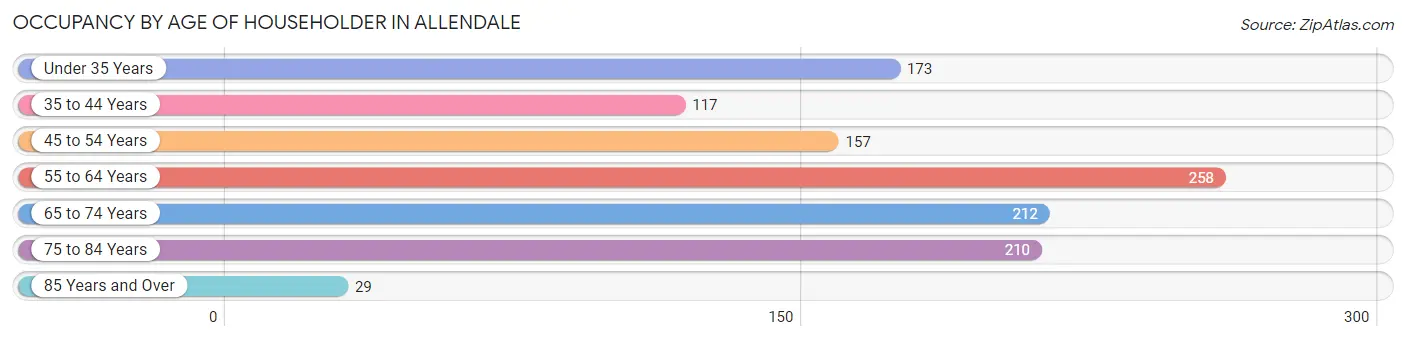
| Age Bracket | # Households | % Households |
| Under 35 Years | 173 | 15.0% |
| 35 to 44 Years | 117 | 10.1% |
| 45 to 54 Years | 157 | 13.6% |
| 55 to 64 Years | 258 | 22.3% |
| 65 to 74 Years | 212 | 18.3% |
| 75 to 84 Years | 210 | 18.2% |
| 85 Years and Over | 29 | 2.5% |
| Total | 1,156 | 100.0% |
Housing Finances in Allendale
Median Income by Occupancy in Allendale
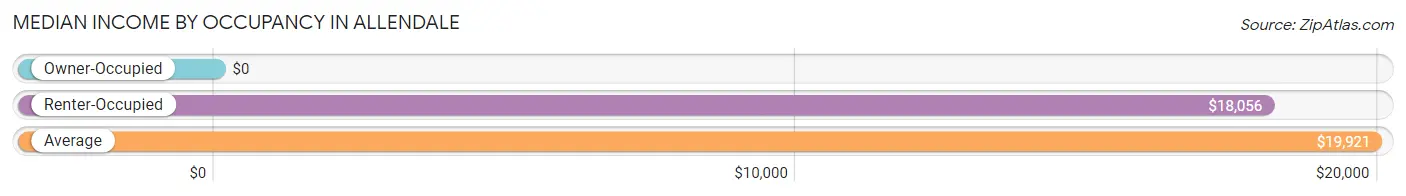
| Occupancy Type | # Households | Median Income |
| Owner-Occupied | 758 (65.6%) | $0 |
| Renter-Occupied | 398 (34.4%) | $18,056 |
| Average | 1,156 (100.0%) | $19,921 |
Occupancy by Householder Income Bracket in Allendale
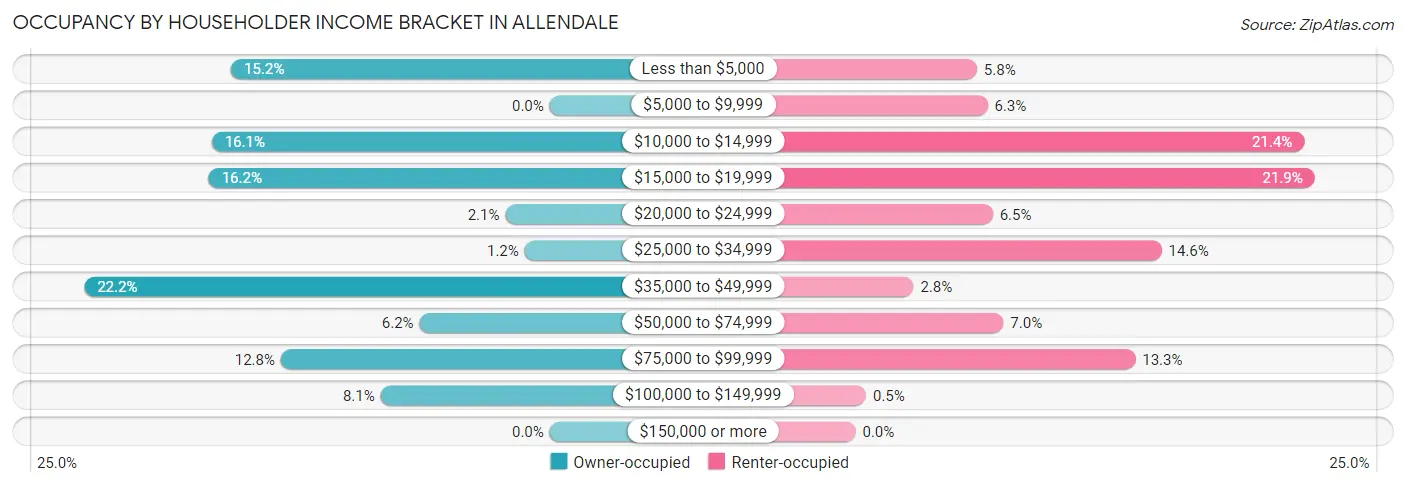
| Income Bracket | Owner-occupied | Renter-occupied |
| Less than $5,000 | 115 (15.2%) | 23 (5.8%) |
| $5,000 to $9,999 | 0 (0.0%) | 25 (6.3%) |
| $10,000 to $14,999 | 122 (16.1%) | 85 (21.4%) |
| $15,000 to $19,999 | 123 (16.2%) | 87 (21.9%) |
| $20,000 to $24,999 | 16 (2.1%) | 26 (6.5%) |
| $25,000 to $34,999 | 9 (1.2%) | 58 (14.6%) |
| $35,000 to $49,999 | 168 (22.2%) | 11 (2.8%) |
| $50,000 to $74,999 | 47 (6.2%) | 28 (7.0%) |
| $75,000 to $99,999 | 97 (12.8%) | 53 (13.3%) |
| $100,000 to $149,999 | 61 (8.1%) | 2 (0.5%) |
| $150,000 or more | 0 (0.0%) | 0 (0.0%) |
| Total | 758 (100.0%) | 398 (100.0%) |
Monthly Housing Cost Tiers in Allendale
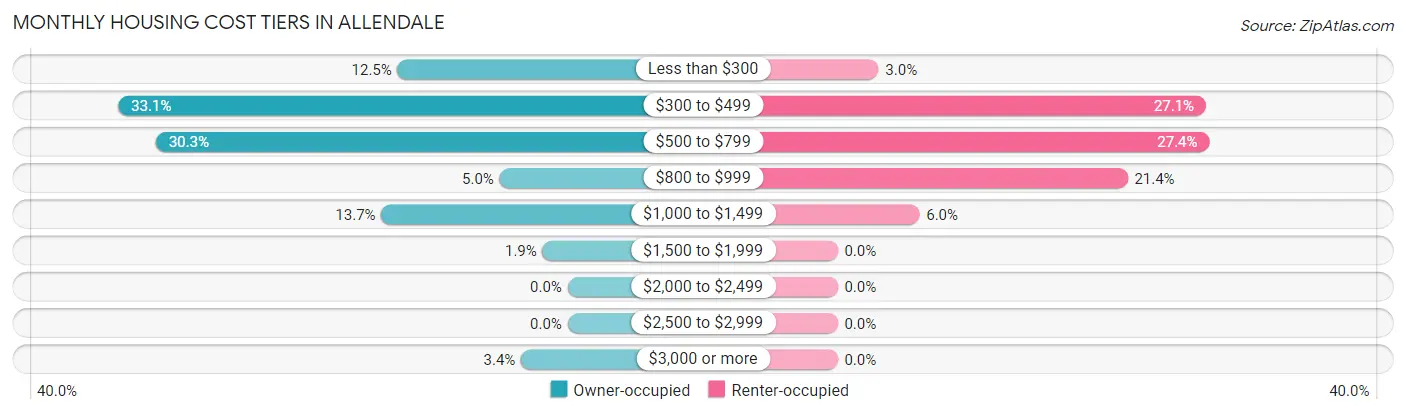
| Monthly Cost | Owner-occupied | Renter-occupied |
| Less than $300 | 95 (12.5%) | 12 (3.0%) |
| $300 to $499 | 251 (33.1%) | 108 (27.1%) |
| $500 to $799 | 230 (30.3%) | 109 (27.4%) |
| $800 to $999 | 38 (5.0%) | 85 (21.4%) |
| $1,000 to $1,499 | 104 (13.7%) | 24 (6.0%) |
| $1,500 to $1,999 | 14 (1.8%) | 0 (0.0%) |
| $2,000 to $2,499 | 0 (0.0%) | 0 (0.0%) |
| $2,500 to $2,999 | 0 (0.0%) | 0 (0.0%) |
| $3,000 or more | 26 (3.4%) | 0 (0.0%) |
| Total | 758 (100.0%) | 398 (100.0%) |
Physical Housing Characteristics in Allendale
Housing Structures in Allendale
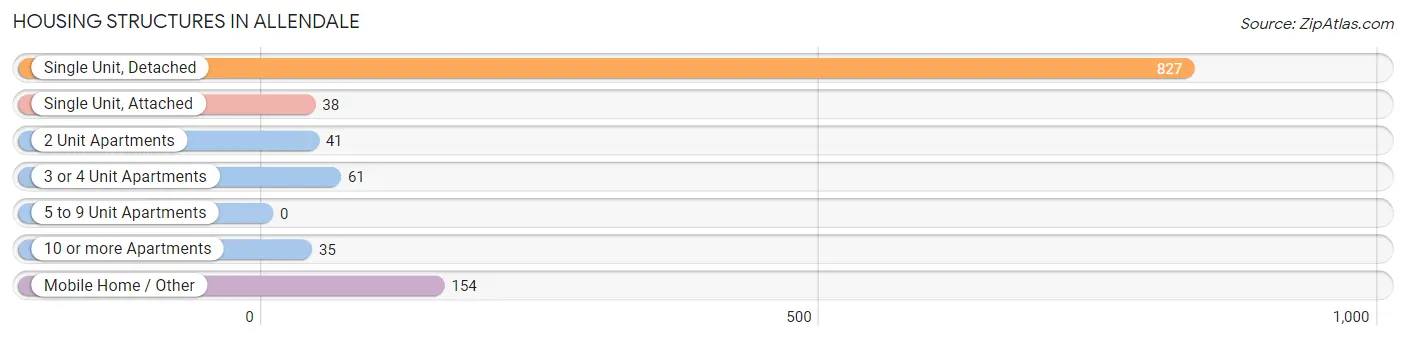
| Structure Type | # Housing Units | % Housing Units |
| Single Unit, Detached | 827 | 71.5% |
| Single Unit, Attached | 38 | 3.3% |
| 2 Unit Apartments | 41 | 3.5% |
| 3 or 4 Unit Apartments | 61 | 5.3% |
| 5 to 9 Unit Apartments | 0 | 0.0% |
| 10 or more Apartments | 35 | 3.0% |
| Mobile Home / Other | 154 | 13.3% |
| Total | 1,156 | 100.0% |
Housing Structures by Occupancy in Allendale
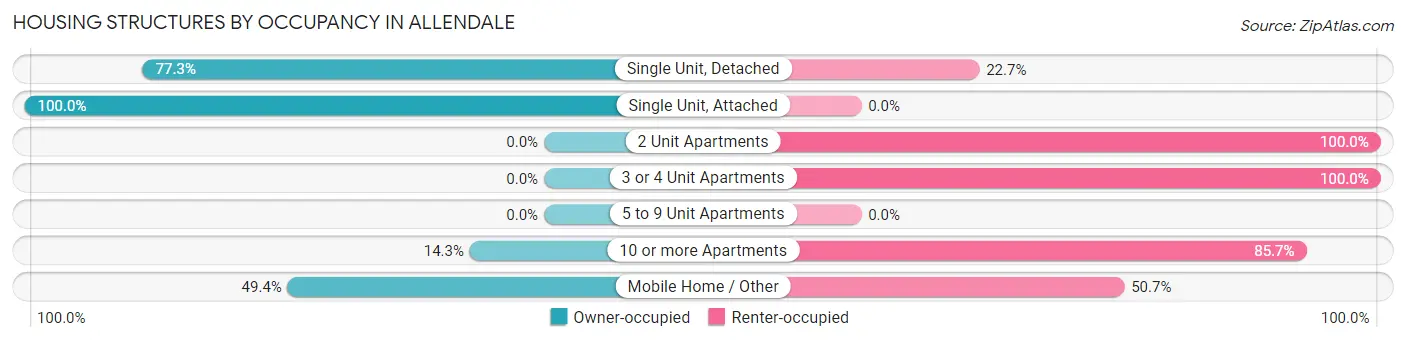
| Structure Type | Owner-occupied | Renter-occupied |
| Single Unit, Detached | 639 (77.3%) | 188 (22.7%) |
| Single Unit, Attached | 38 (100.0%) | 0 (0.0%) |
| 2 Unit Apartments | 0 (0.0%) | 41 (100.0%) |
| 3 or 4 Unit Apartments | 0 (0.0%) | 61 (100.0%) |
| 5 to 9 Unit Apartments | 0 (0.0%) | 0 (0.0%) |
| 10 or more Apartments | 5 (14.3%) | 30 (85.7%) |
| Mobile Home / Other | 76 (49.3%) | 78 (50.6%) |
| Total | 758 (65.6%) | 398 (34.4%) |
Housing Structures by Number of Rooms in Allendale
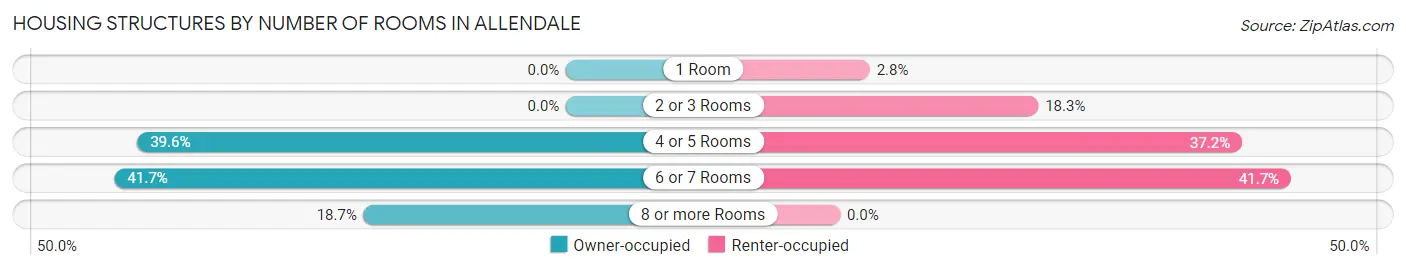
| Number of Rooms | Owner-occupied | Renter-occupied |
| 1 Room | 0 (0.0%) | 11 (2.8%) |
| 2 or 3 Rooms | 0 (0.0%) | 73 (18.3%) |
| 4 or 5 Rooms | 300 (39.6%) | 148 (37.2%) |
| 6 or 7 Rooms | 316 (41.7%) | 166 (41.7%) |
| 8 or more Rooms | 142 (18.7%) | 0 (0.0%) |
| Total | 758 (100.0%) | 398 (100.0%) |
Housing Structure by Heating Type in Allendale
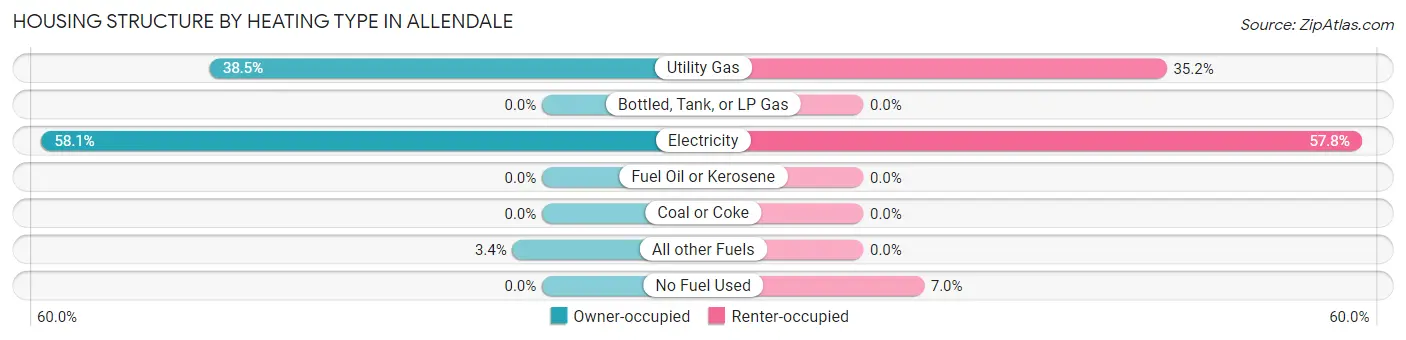
| Heating Type | Owner-occupied | Renter-occupied |
| Utility Gas | 292 (38.5%) | 140 (35.2%) |
| Bottled, Tank, or LP Gas | 0 (0.0%) | 0 (0.0%) |
| Electricity | 440 (58.1%) | 230 (57.8%) |
| Fuel Oil or Kerosene | 0 (0.0%) | 0 (0.0%) |
| Coal or Coke | 0 (0.0%) | 0 (0.0%) |
| All other Fuels | 26 (3.4%) | 0 (0.0%) |
| No Fuel Used | 0 (0.0%) | 28 (7.0%) |
| Total | 758 (100.0%) | 398 (100.0%) |
Household Vehicle Usage in Allendale
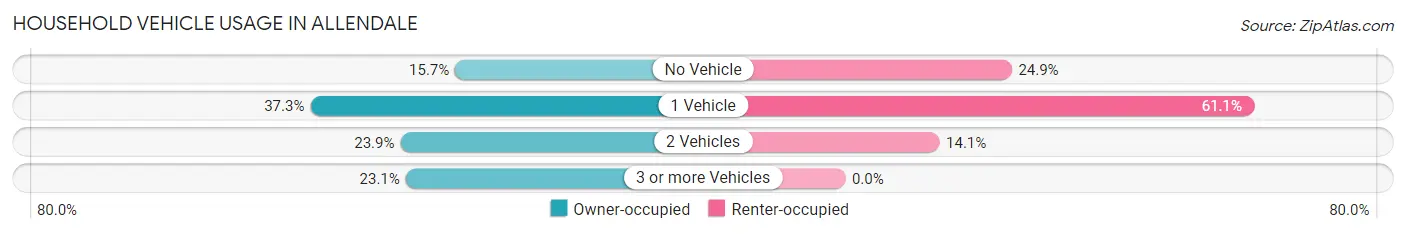
| Vehicles per Household | Owner-occupied | Renter-occupied |
| No Vehicle | 119 (15.7%) | 99 (24.9%) |
| 1 Vehicle | 283 (37.3%) | 243 (61.1%) |
| 2 Vehicles | 181 (23.9%) | 56 (14.1%) |
| 3 or more Vehicles | 175 (23.1%) | 0 (0.0%) |
| Total | 758 (100.0%) | 398 (100.0%) |
Real Estate & Mortgages in Allendale
Real Estate and Mortgage Overview in Allendale
| Characteristic | Without Mortgage | With Mortgage |
| Housing Units | 514 | 244 |
| Median Property Value | $43,200 | $71,700 |
| Median Household Income | - | - |
| Monthly Housing Costs | $440 | $26 |
| Real Estate Taxes | $573 | $44 |
Property Value by Mortgage Status in Allendale
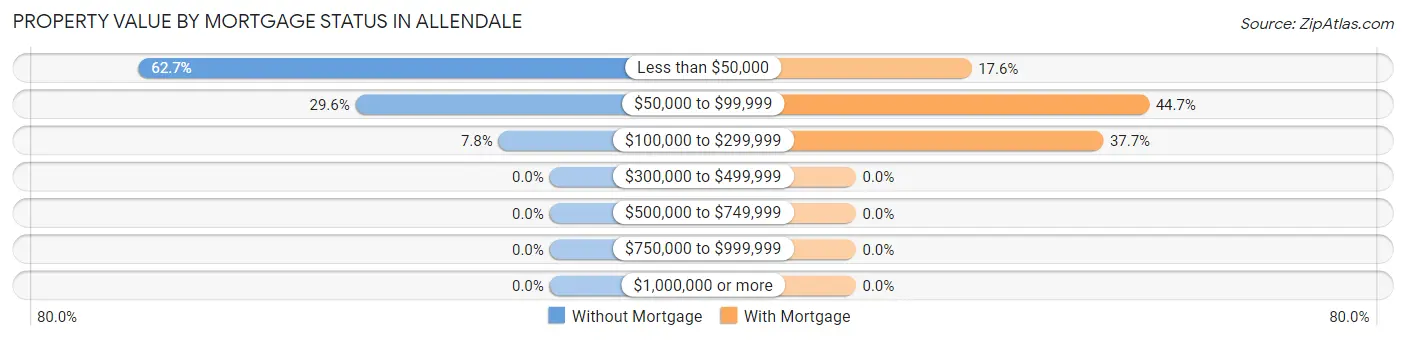
| Property Value | Without Mortgage | With Mortgage |
| Less than $50,000 | 322 (62.6%) | 43 (17.6%) |
| $50,000 to $99,999 | 152 (29.6%) | 109 (44.7%) |
| $100,000 to $299,999 | 40 (7.8%) | 92 (37.7%) |
| $300,000 to $499,999 | 0 (0.0%) | 0 (0.0%) |
| $500,000 to $749,999 | 0 (0.0%) | 0 (0.0%) |
| $750,000 to $999,999 | 0 (0.0%) | 0 (0.0%) |
| $1,000,000 or more | 0 (0.0%) | 0 (0.0%) |
| Total | 514 (100.0%) | 244 (100.0%) |
Household Income by Mortgage Status in Allendale
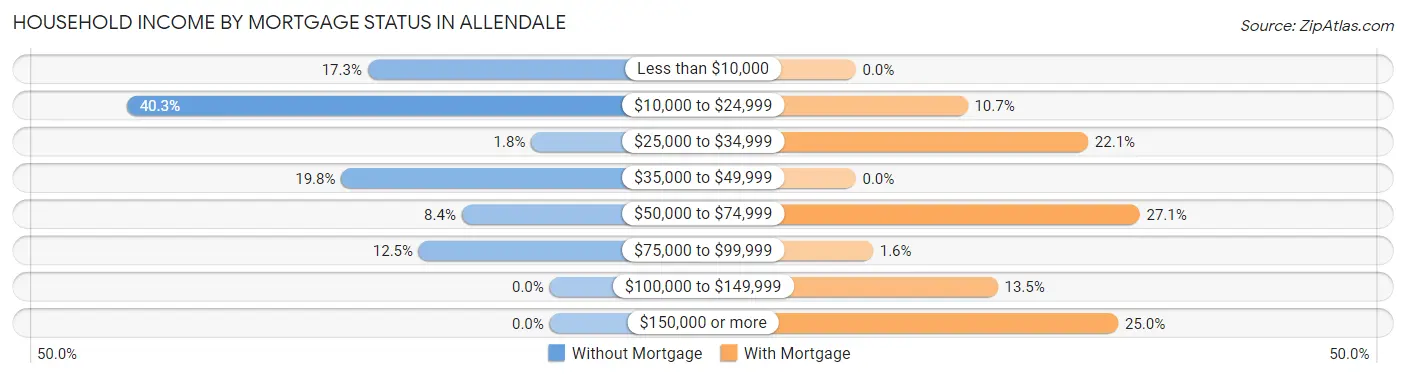
| Household Income | Without Mortgage | With Mortgage |
| Less than $10,000 | 89 (17.3%) | 0 (0.0%) |
| $10,000 to $24,999 | 207 (40.3%) | 26 (10.7%) |
| $25,000 to $34,999 | 9 (1.8%) | 54 (22.1%) |
| $35,000 to $49,999 | 102 (19.8%) | 0 (0.0%) |
| $50,000 to $74,999 | 43 (8.4%) | 66 (27.1%) |
| $75,000 to $99,999 | 64 (12.4%) | 4 (1.6%) |
| $100,000 to $149,999 | 0 (0.0%) | 33 (13.5%) |
| $150,000 or more | 0 (0.0%) | 61 (25.0%) |
| Total | 514 (100.0%) | 244 (100.0%) |
Property Value to Household Income Ratio in Allendale
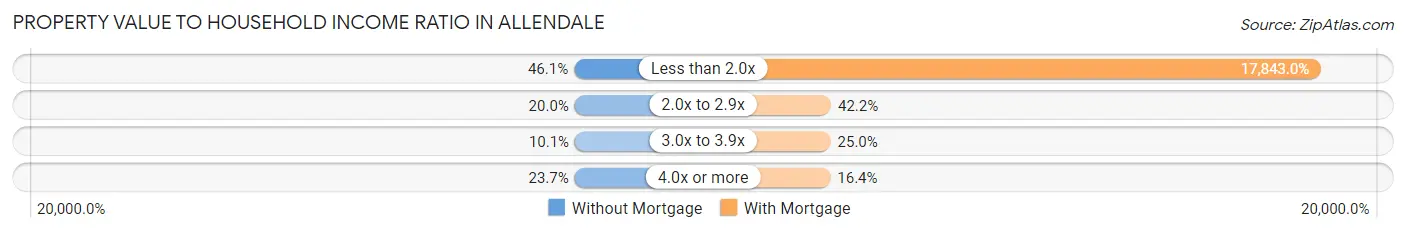
| Value-to-Income Ratio | Without Mortgage | With Mortgage |
| Less than 2.0x | 237 (46.1%) | 43,537 (17,843.0%) |
| 2.0x to 2.9x | 103 (20.0%) | 103 (42.2%) |
| 3.0x to 3.9x | 52 (10.1%) | 61 (25.0%) |
| 4.0x or more | 122 (23.7%) | 40 (16.4%) |
| Total | 514 (100.0%) | 244 (100.0%) |
Real Estate Taxes by Mortgage Status in Allendale
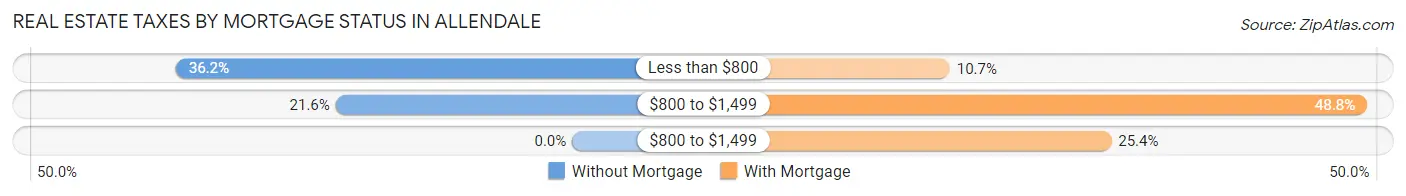
| Property Taxes | Without Mortgage | With Mortgage |
| Less than $800 | 186 (36.2%) | 26 (10.7%) |
| $800 to $1,499 | 111 (21.6%) | 119 (48.8%) |
| $800 to $1,499 | 0 (0.0%) | 62 (25.4%) |
| Total | 514 (100.0%) | 244 (100.0%) |
Health & Disability in Allendale
Health Insurance Coverage by Age in Allendale
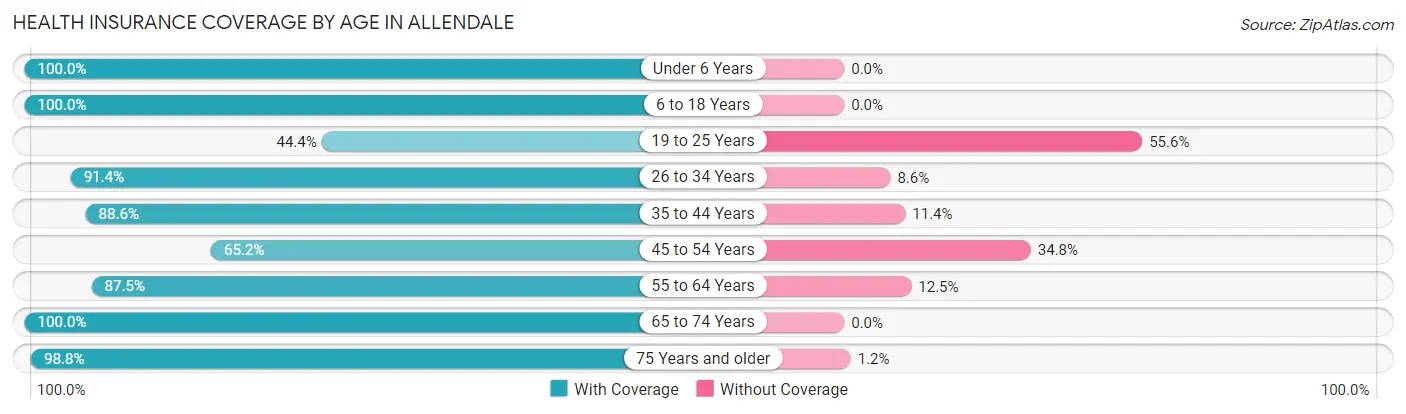
| Age Bracket | With Coverage | Without Coverage |
| Under 6 Years | 191 (100.0%) | 0 (0.0%) |
| 6 to 18 Years | 613 (100.0%) | 0 (0.0%) |
| 19 to 25 Years | 72 (44.4%) | 90 (55.6%) |
| 26 to 34 Years | 223 (91.4%) | 21 (8.6%) |
| 35 to 44 Years | 210 (88.6%) | 27 (11.4%) |
| 45 to 54 Years | 238 (65.2%) | 127 (34.8%) |
| 55 to 64 Years | 273 (87.5%) | 39 (12.5%) |
| 65 to 74 Years | 331 (100.0%) | 0 (0.0%) |
| 75 Years and older | 244 (98.8%) | 3 (1.2%) |
| Total | 2,395 (88.6%) | 307 (11.4%) |
Health Insurance Coverage by Citizenship Status in Allendale
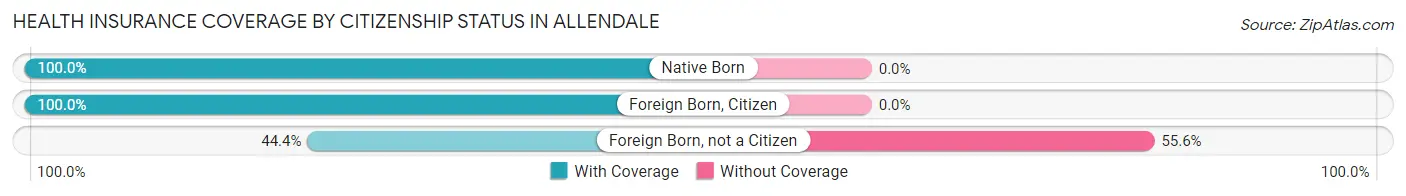
| Citizenship Status | With Coverage | Without Coverage |
| Native Born | 191 (100.0%) | 0 (0.0%) |
| Foreign Born, Citizen | 613 (100.0%) | 0 (0.0%) |
| Foreign Born, not a Citizen | 72 (44.4%) | 90 (55.6%) |
Health Insurance Coverage by Household Income in Allendale
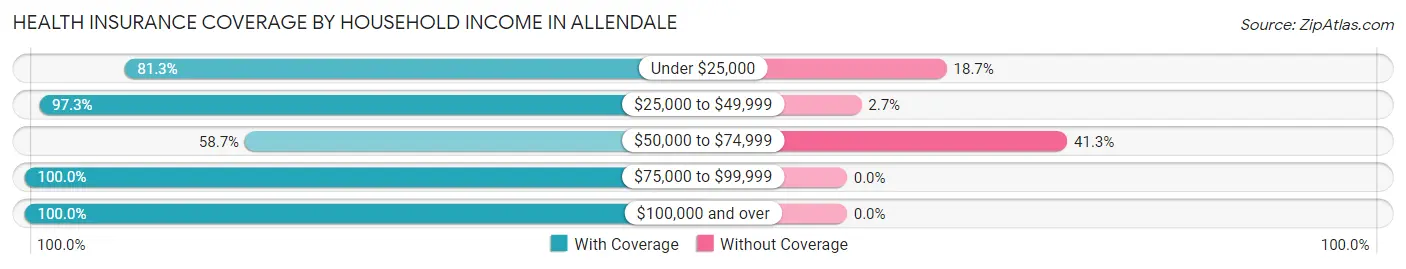
| Household Income | With Coverage | Without Coverage |
| Under $25,000 | 865 (81.3%) | 199 (18.7%) |
| $25,000 to $49,999 | 570 (97.3%) | 16 (2.7%) |
| $50,000 to $74,999 | 101 (58.7%) | 71 (41.3%) |
| $75,000 to $99,999 | 601 (100.0%) | 0 (0.0%) |
| $100,000 and over | 215 (100.0%) | 0 (0.0%) |
Public vs Private Health Insurance Coverage by Age in Allendale
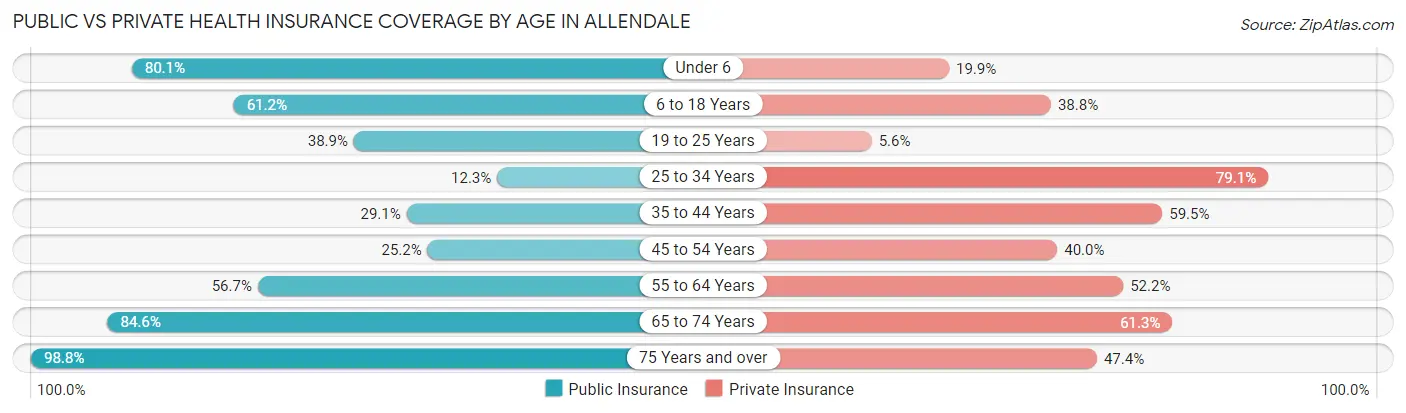
| Age Bracket | Public Insurance | Private Insurance |
| Under 6 | 153 (80.1%) | 38 (19.9%) |
| 6 to 18 Years | 375 (61.2%) | 238 (38.8%) |
| 19 to 25 Years | 63 (38.9%) | 9 (5.6%) |
| 25 to 34 Years | 30 (12.3%) | 193 (79.1%) |
| 35 to 44 Years | 69 (29.1%) | 141 (59.5%) |
| 45 to 54 Years | 92 (25.2%) | 146 (40.0%) |
| 55 to 64 Years | 177 (56.7%) | 163 (52.2%) |
| 65 to 74 Years | 280 (84.6%) | 203 (61.3%) |
| 75 Years and over | 244 (98.8%) | 117 (47.4%) |
| Total | 1,483 (54.9%) | 1,248 (46.2%) |
Disability Status by Sex by Age in Allendale
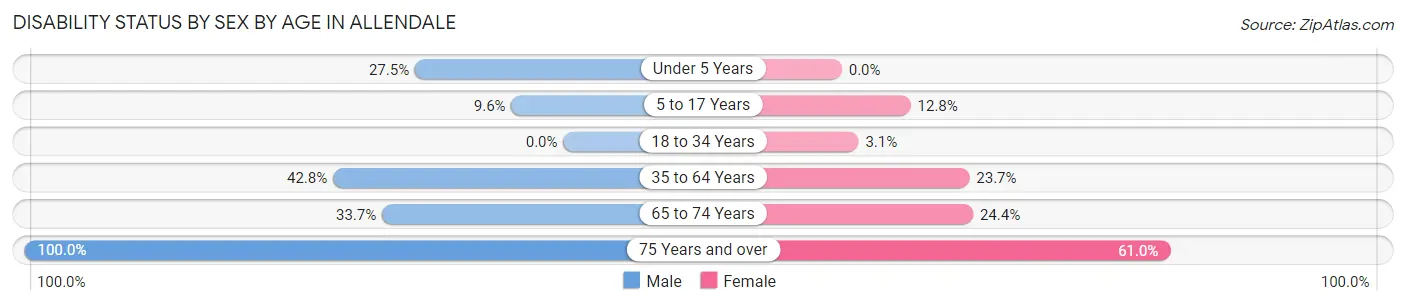
| Age Bracket | Male | Female |
| Under 5 Years | 19 (27.5%) | 0 (0.0%) |
| 5 to 17 Years | 35 (9.6%) | 30 (12.8%) |
| 18 to 34 Years | 0 (0.0%) | 8 (3.1%) |
| 35 to 64 Years | 221 (42.7%) | 94 (23.7%) |
| 65 to 74 Years | 34 (33.7%) | 56 (24.3%) |
| 75 Years and over | 78 (100.0%) | 103 (61.0%) |
Disability Class by Sex by Age in Allendale
Disability Class: Hearing Difficulty
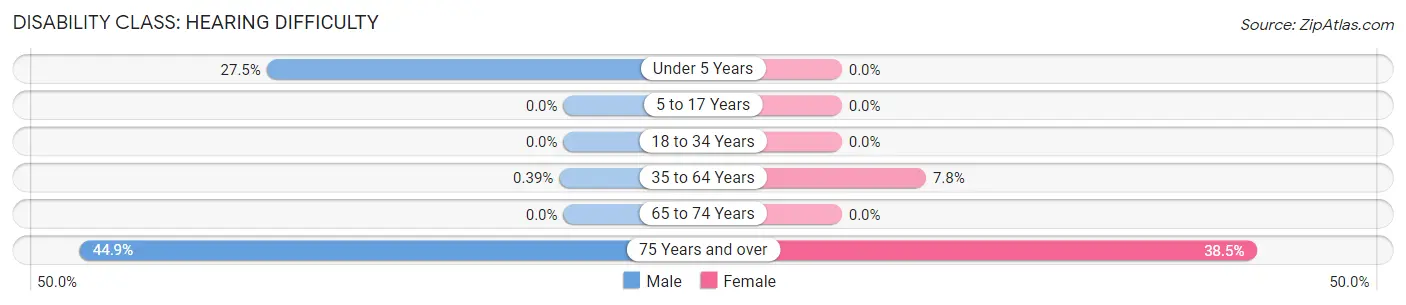
| Age Bracket | Male | Female |
| Under 5 Years | 19 (27.5%) | 0 (0.0%) |
| 5 to 17 Years | 0 (0.0%) | 0 (0.0%) |
| 18 to 34 Years | 0 (0.0%) | 0 (0.0%) |
| 35 to 64 Years | 2 (0.4%) | 31 (7.8%) |
| 65 to 74 Years | 0 (0.0%) | 0 (0.0%) |
| 75 Years and over | 35 (44.9%) | 65 (38.5%) |
Disability Class: Vision Difficulty
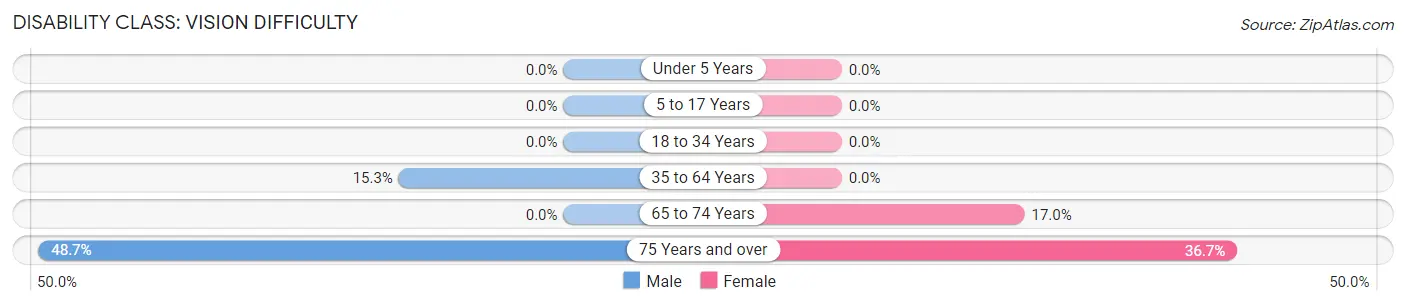
| Age Bracket | Male | Female |
| Under 5 Years | 0 (0.0%) | 0 (0.0%) |
| 5 to 17 Years | 0 (0.0%) | 0 (0.0%) |
| 18 to 34 Years | 0 (0.0%) | 0 (0.0%) |
| 35 to 64 Years | 79 (15.3%) | 0 (0.0%) |
| 65 to 74 Years | 0 (0.0%) | 39 (17.0%) |
| 75 Years and over | 38 (48.7%) | 62 (36.7%) |
Disability Class: Cognitive Difficulty
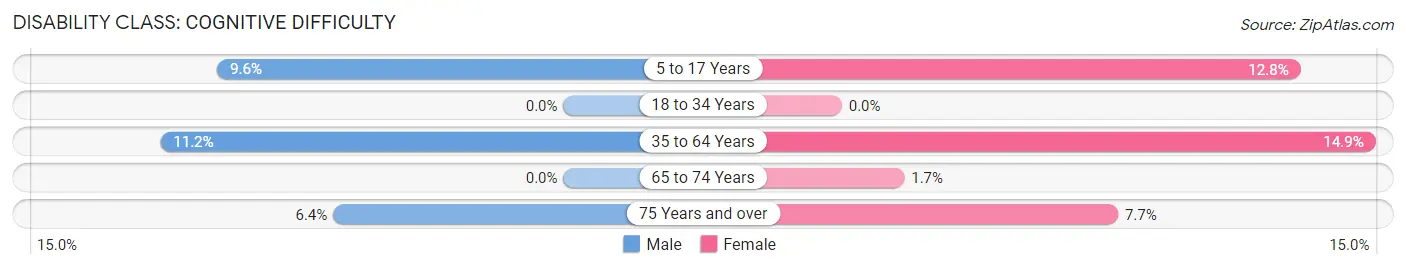
| Age Bracket | Male | Female |
| 5 to 17 Years | 35 (9.6%) | 30 (12.8%) |
| 18 to 34 Years | 0 (0.0%) | 0 (0.0%) |
| 35 to 64 Years | 58 (11.2%) | 59 (14.9%) |
| 65 to 74 Years | 0 (0.0%) | 4 (1.7%) |
| 75 Years and over | 5 (6.4%) | 13 (7.7%) |
Disability Class: Ambulatory Difficulty
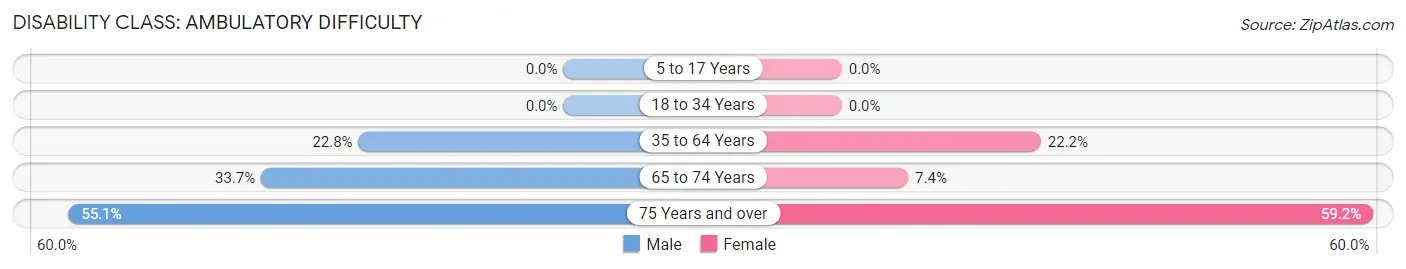
| Age Bracket | Male | Female |
| 5 to 17 Years | 0 (0.0%) | 0 (0.0%) |
| 18 to 34 Years | 0 (0.0%) | 0 (0.0%) |
| 35 to 64 Years | 118 (22.8%) | 88 (22.2%) |
| 65 to 74 Years | 34 (33.7%) | 17 (7.4%) |
| 75 Years and over | 43 (55.1%) | 100 (59.2%) |
Disability Class: Self-Care Difficulty
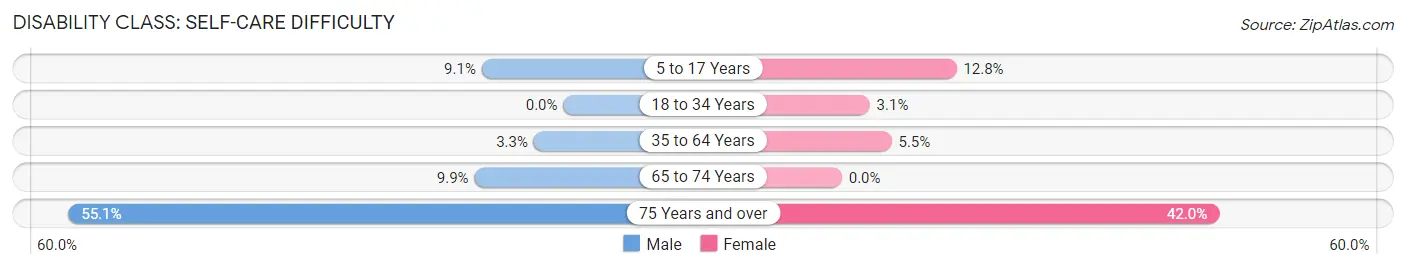
| Age Bracket | Male | Female |
| 5 to 17 Years | 33 (9.1%) | 30 (12.8%) |
| 18 to 34 Years | 0 (0.0%) | 8 (3.1%) |
| 35 to 64 Years | 17 (3.3%) | 22 (5.5%) |
| 65 to 74 Years | 10 (9.9%) | 0 (0.0%) |
| 75 Years and over | 43 (55.1%) | 71 (42.0%) |
Technology Access in Allendale
Computing Device Access in Allendale
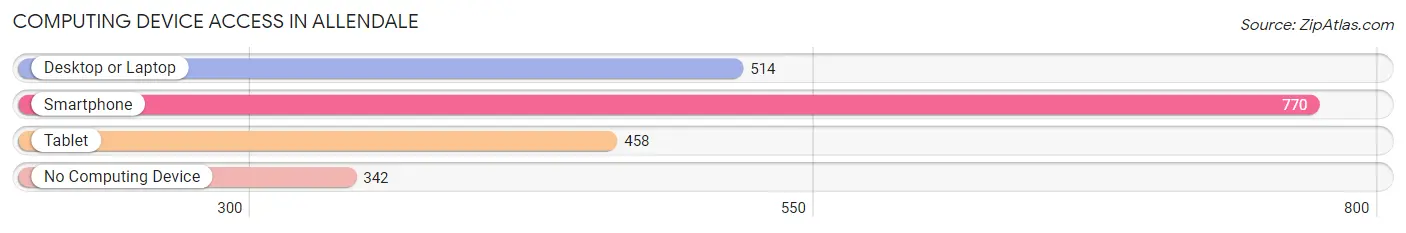
| Device Type | # Households | % Households |
| Desktop or Laptop | 514 | 44.5% |
| Smartphone | 770 | 66.6% |
| Tablet | 458 | 39.6% |
| No Computing Device | 342 | 29.6% |
| Total | 1,156 | 100.0% |
Internet Access in Allendale
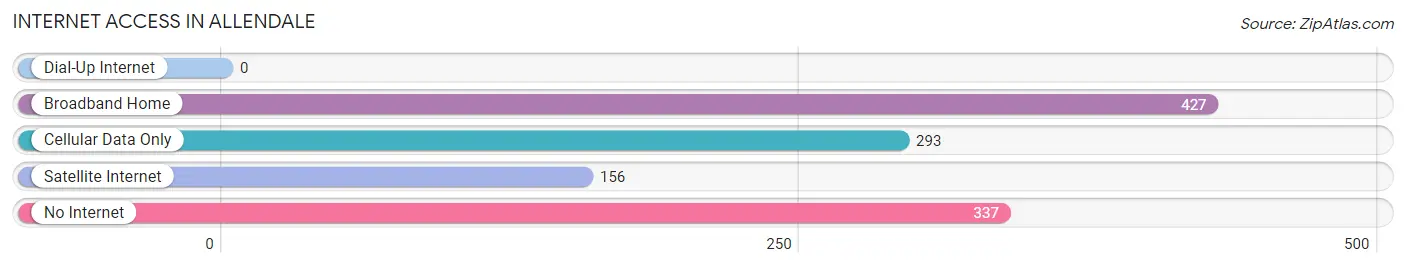
| Internet Type | # Households | % Households |
| Dial-Up Internet | 0 | 0.0% |
| Broadband Home | 427 | 36.9% |
| Cellular Data Only | 293 | 25.4% |
| Satellite Internet | 156 | 13.5% |
| No Internet | 337 | 29.1% |
| Total | 1,156 | 100.0% |
Allendale Summary
Allendale is a small town located in the Lowcountry region of South Carolina. It is situated in the northern part of the state, near the border with Georgia. The town is part of Allendale County, which is one of the 46 counties in the state. Allendale is the county seat of Allendale County and is home to a population of approximately 4,000 people.
History
Allendale was founded in 1785 by a group of settlers from the British Isles. The town was named after the Earl of Allendale, who was a prominent figure in the British government at the time. The town was originally a trading post and was used as a stopover for travelers heading to and from the nearby Savannah River.
In the early 1800s, Allendale became a major cotton-producing area. The town was also home to a number of plantations, which were owned by wealthy planters. The town was also home to a number of churches, schools, and other businesses.
In the late 1800s, Allendale began to experience a decline in its economy. This was due to the decline in the cotton industry and the rise of the railroad industry. The town was also affected by the Civil War, which caused a great deal of destruction in the area.
In the early 1900s, Allendale began to experience a resurgence in its economy. This was due to the development of the railroad industry and the growth of the timber industry. The town was also home to a number of manufacturing plants, which provided jobs for many of the town’s residents.
Geography
Allendale is located in the northern part of South Carolina, near the border with Georgia. The town is situated in the Lowcountry region of the state, which is characterized by its flat terrain and sandy soil. The town is located on the Savannah River, which is a major waterway in the region.
The town is located in Allendale County, which is one of the 46 counties in the state. The county is bordered by the states of Georgia and North Carolina. The town is located approximately 50 miles from the state capital of Columbia.
Economy
Allendale’s economy is largely based on agriculture and manufacturing. The town is home to a number of farms, which produce a variety of crops, including cotton, soybeans, corn, and peanuts. The town is also home to a number of manufacturing plants, which produce a variety of products, including furniture, textiles, and paper products.
The town is also home to a number of businesses, which provide services to the local community. These businesses include restaurants, retail stores, and medical facilities.
Demographics
As of the 2010 census, the population of Allendale was 4,000. The town has a population that is predominantly African American, with approximately 75% of the population being African American. The town also has a small Hispanic population, with approximately 5% of the population being Hispanic. The town also has a small white population, with approximately 20% of the population being white.
The median household income in Allendale is approximately $30,000. The town has a poverty rate of approximately 25%, which is higher than the national average. The town also has a high unemployment rate, with approximately 10% of the population being unemployed.
Common Questions
What is Per Capita Income in Allendale?
Per Capita income in Allendale is $15,033.
What is the Median Family Income in Allendale?
Median Family Income in Allendale is $44,970.
What is the Median Household income in Allendale?
Median Household Income in Allendale is $19,921.
What is Income or Wage Gap in Allendale?
Income or Wage Gap in Allendale is 47.0%.
Women in Allendale earn 53.0 cents for every dollar earned by a man.
What is Inequality or Gini Index in Allendale?
Inequality or Gini Index in Allendale is 0.47.
What is the Total Population of Allendale?
Total Population of Allendale is 2,702.
What is the Total Male Population of Allendale?
Total Male Population of Allendale is 1,318.
What is the Total Female Population of Allendale?
Total Female Population of Allendale is 1,384.
What is the Ratio of Males per 100 Females in Allendale?
There are 95.23 Males per 100 Females in Allendale.
What is the Ratio of Females per 100 Males in Allendale?
There are 105.01 Females per 100 Males in Allendale.
What is the Median Population Age in Allendale?
Median Population Age in Allendale is 39.6 Years.
What is the Average Family Size in Allendale
Average Family Size in Allendale is 3.2 People.
What is the Average Household Size in Allendale
Average Household Size in Allendale is 2.3 People.
How Large is the Labor Force in Allendale?
There are 845 People in the Labor Forcein in Allendale.
What is the Percentage of People in the Labor Force in Allendale?
41.8% of People are in the Labor Force in Allendale.
What is the Unemployment Rate in Allendale?
Unemployment Rate in Allendale is 9.2%.