Bartlett, IL Map & Demographics
Bartlett Map
Bartlett Overview
$50,193
PER CAPITA INCOME
$139,429
AVG FAMILY INCOME
$126,555
AVG HOUSEHOLD INCOME
34.0%
WAGE / INCOME GAP [ % ]
66.0¢/ $1
WAGE / INCOME GAP [ $ ]
$12,588
FAMILY INCOME DEFICIT
0.36
INEQUALITY / GINI INDEX
40,829
TOTAL POPULATION
20,557
MALE POPULATION
20,272
FEMALE POPULATION
101.41
MALES / 100 FEMALES
98.61
FEMALES / 100 MALES
41.1
MEDIAN AGE
3.2
AVG FAMILY SIZE
2.8
AVG HOUSEHOLD SIZE
23,357
LABOR FORCE [ PEOPLE ]
71.8%
PERCENT IN LABOR FORCE
2.2%
UNEMPLOYMENT RATE
Bartlett Zip Codes
Income in Bartlett
Income Overview in Bartlett
Per Capita Income in Bartlett is $50,193, while median incomes of families and households are $139,429 and $126,555 respectively.
| Characteristic | Number | Measure |
| Per Capita Income | 40,829 | $50,193 |
| Median Family Income | 11,561 | $139,429 |
| Mean Family Income | 11,561 | $153,450 |
| Median Household Income | 14,341 | $126,555 |
| Mean Household Income | 14,341 | $140,925 |
| Income Deficit | 11,561 | $12,588 |
| Wage / Income Gap (%) | 40,829 | 34.03% |
| Wage / Income Gap ($) | 40,829 | 65.97¢ per $1 |
| Gini / Inequality Index | 40,829 | 0.36 |
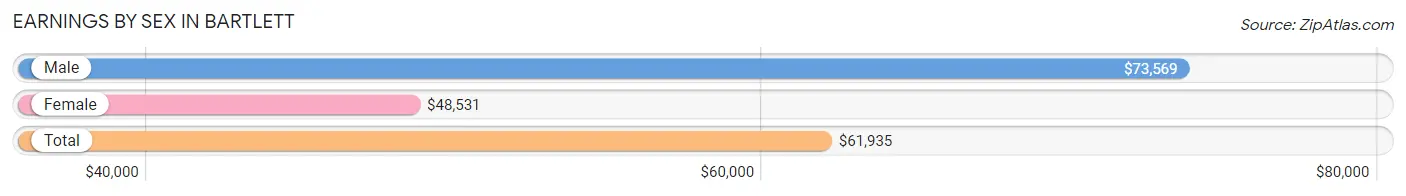
Earnings by Sex in Bartlett
Average Earnings in Bartlett are $61,935, $73,569 for men and $48,531 for women, a difference of 34.0%.
| Sex | Number | Average Earnings |
| Male | 13,034 (53.8%) | $73,569 |
| Female | 11,172 (46.2%) | $48,531 |
| Total | 24,206 (100.0%) | $61,935 |
Earnings by Sex by Income Bracket in Bartlett
The most common earnings brackets in Bartlett are $100,000+ for men (4,194 | 32.2%) and $100,000+ for women (1,841 | 16.5%).
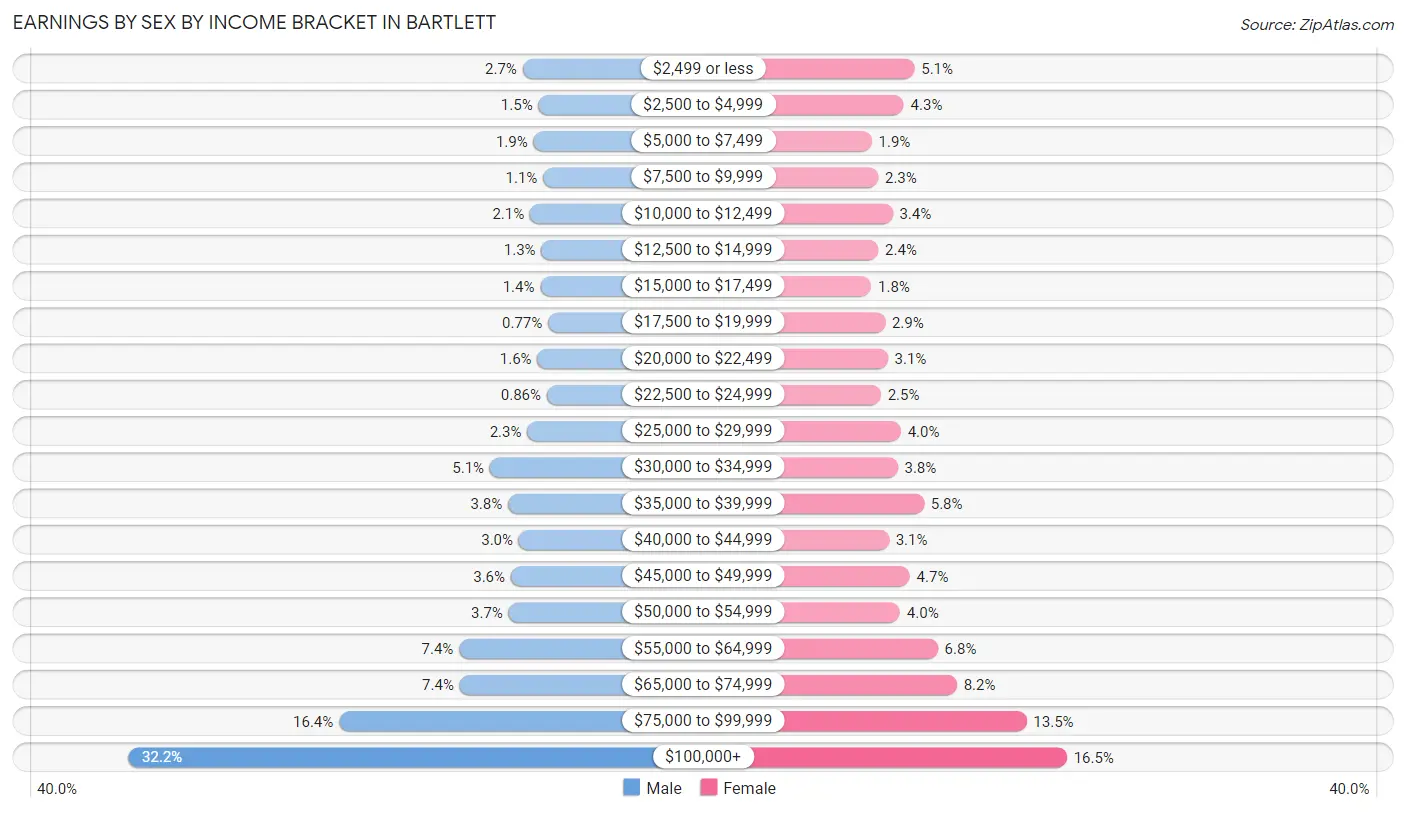
| Income | Male | Female |
| $2,499 or less | 348 (2.7%) | 565 (5.1%) |
| $2,500 to $4,999 | 194 (1.5%) | 476 (4.3%) |
| $5,000 to $7,499 | 243 (1.9%) | 208 (1.9%) |
| $7,500 to $9,999 | 148 (1.1%) | 261 (2.3%) |
| $10,000 to $12,499 | 276 (2.1%) | 382 (3.4%) |
| $12,500 to $14,999 | 165 (1.3%) | 262 (2.4%) |
| $15,000 to $17,499 | 176 (1.3%) | 203 (1.8%) |
| $17,500 to $19,999 | 101 (0.8%) | 320 (2.9%) |
| $20,000 to $22,499 | 205 (1.6%) | 342 (3.1%) |
| $22,500 to $24,999 | 112 (0.9%) | 284 (2.5%) |
| $25,000 to $29,999 | 304 (2.3%) | 451 (4.0%) |
| $30,000 to $34,999 | 668 (5.1%) | 424 (3.8%) |
| $35,000 to $39,999 | 492 (3.8%) | 645 (5.8%) |
| $40,000 to $44,999 | 386 (3.0%) | 351 (3.1%) |
| $45,000 to $49,999 | 464 (3.6%) | 526 (4.7%) |
| $50,000 to $54,999 | 485 (3.7%) | 445 (4.0%) |
| $55,000 to $64,999 | 969 (7.4%) | 761 (6.8%) |
| $65,000 to $74,999 | 963 (7.4%) | 921 (8.2%) |
| $75,000 to $99,999 | 2,141 (16.4%) | 1,504 (13.5%) |
| $100,000+ | 4,194 (32.2%) | 1,841 (16.5%) |
| Total | 13,034 (100.0%) | 11,172 (100.0%) |
Earnings by Sex by Educational Attainment in Bartlett
Average earnings in Bartlett are $79,655 for men and $55,565 for women, a difference of 30.2%. Men with an educational attainment of graduate degree enjoy the highest average annual earnings of $132,663, while those with less than high school education earn the least with $32,483. Women with an educational attainment of graduate degree earn the most with the average annual earnings of $92,500, while those with less than high school education have the smallest earnings of $29,464.
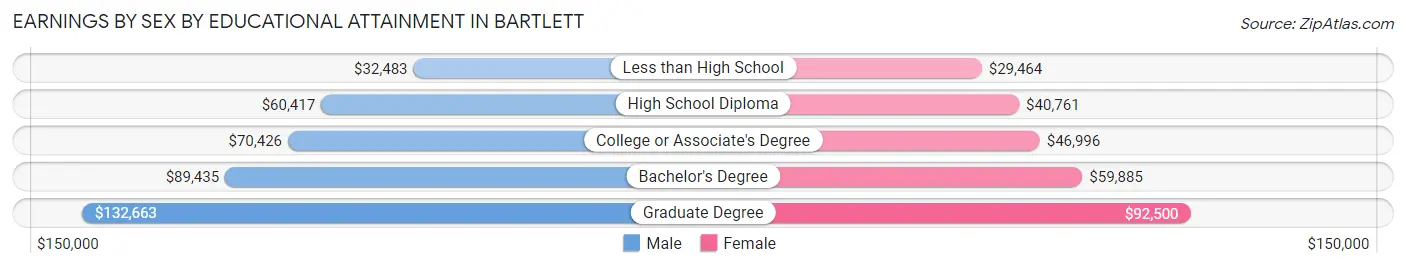
| Educational Attainment | Male Income | Female Income |
| Less than High School | $32,483 | $29,464 |
| High School Diploma | $60,417 | $40,761 |
| College or Associate's Degree | $70,426 | $46,996 |
| Bachelor's Degree | $89,435 | $59,885 |
| Graduate Degree | $132,663 | $92,500 |
| Total | $79,655 | $55,565 |
Family Income in Bartlett
Family Income Brackets in Bartlett
According to the Bartlett family income data, there are 2,821 families falling into the $100,000 to $149,999 income range, which is the most common income bracket and makes up 24.4% of all families. Conversely, the $10,000 to $14,999 income bracket is the least frequent group with only 12 families (0.1%) belonging to this category.
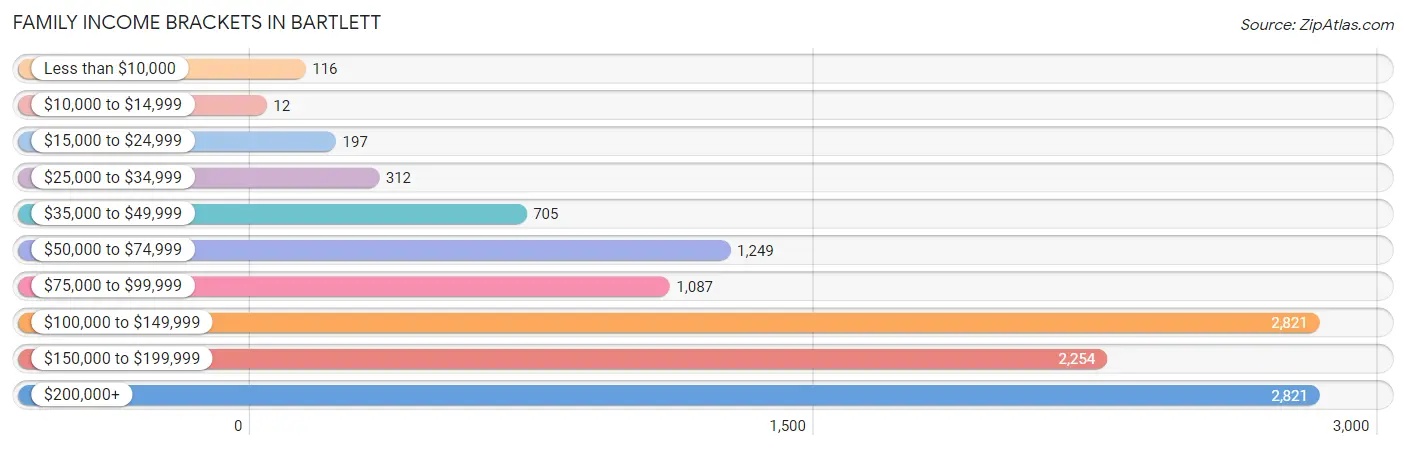
| Income Bracket | # Families | % Families |
| Less than $10,000 | 116 | 1.0% |
| $10,000 to $14,999 | 12 | 0.1% |
| $15,000 to $24,999 | 197 | 1.7% |
| $25,000 to $34,999 | 312 | 2.7% |
| $35,000 to $49,999 | 705 | 6.1% |
| $50,000 to $74,999 | 1,249 | 10.8% |
| $75,000 to $99,999 | 1,087 | 9.4% |
| $100,000 to $149,999 | 2,821 | 24.4% |
| $150,000 to $199,999 | 2,254 | 19.5% |
| $200,000+ | 2,821 | 24.4% |
Family Income by Famaliy Size in Bartlett
7+ person families (234 | 2.0%) account for the highest median family income in Bartlett with $250,001 per family, while 2-person families (4,912 | 42.5%) have the highest median income of $58,390 per family member.
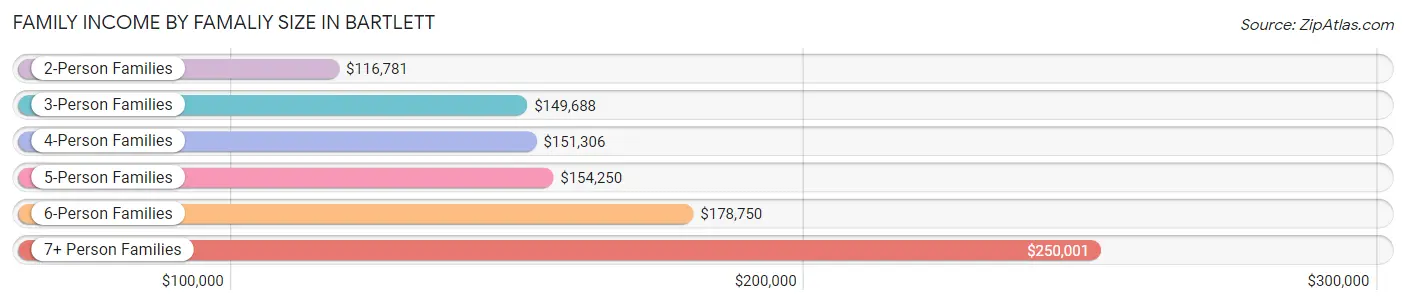
| Income Bracket | # Families | Median Income |
| 2-Person Families | 4,912 (42.5%) | $116,781 |
| 3-Person Families | 2,437 (21.1%) | $149,688 |
| 4-Person Families | 2,852 (24.7%) | $151,306 |
| 5-Person Families | 740 (6.4%) | $154,250 |
| 6-Person Families | 386 (3.3%) | $178,750 |
| 7+ Person Families | 234 (2.0%) | $250,001 |
| Total | 11,561 (100.0%) | $139,429 |
Family Income by Number of Earners in Bartlett
The median family income in Bartlett is $139,429, with families comprising 3+ earners (2,177) having the highest median family income of $192,004, while families with no earners (941) have the lowest median family income of $54,604, accounting for 18.8% and 8.1% of families, respectively.
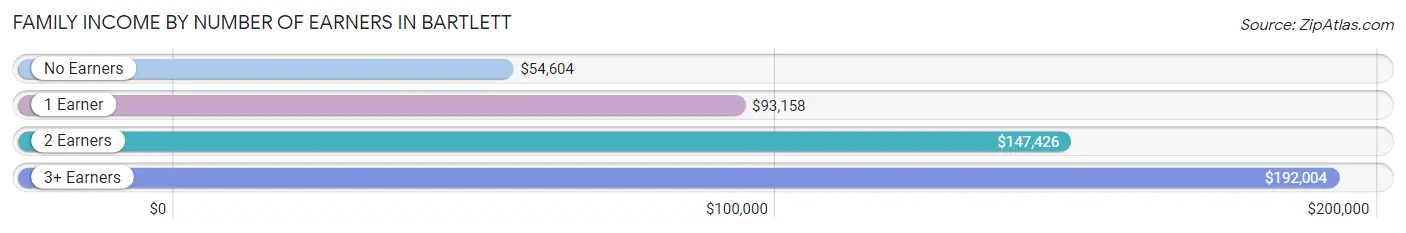
| Number of Earners | # Families | Median Income |
| No Earners | 941 (8.1%) | $54,604 |
| 1 Earner | 2,820 (24.4%) | $93,158 |
| 2 Earners | 5,623 (48.6%) | $147,426 |
| 3+ Earners | 2,177 (18.8%) | $192,004 |
| Total | 11,561 (100.0%) | $139,429 |
Household Income in Bartlett
Household Income Brackets in Bartlett
With 3,585 households falling in the category, the $100,000 to $149,999 income range is the most frequent in Bartlett, accounting for 25.0% of all households. In contrast, only 215 households (1.5%) fall into the $10,000 to $14,999 income bracket, making it the least populous group.
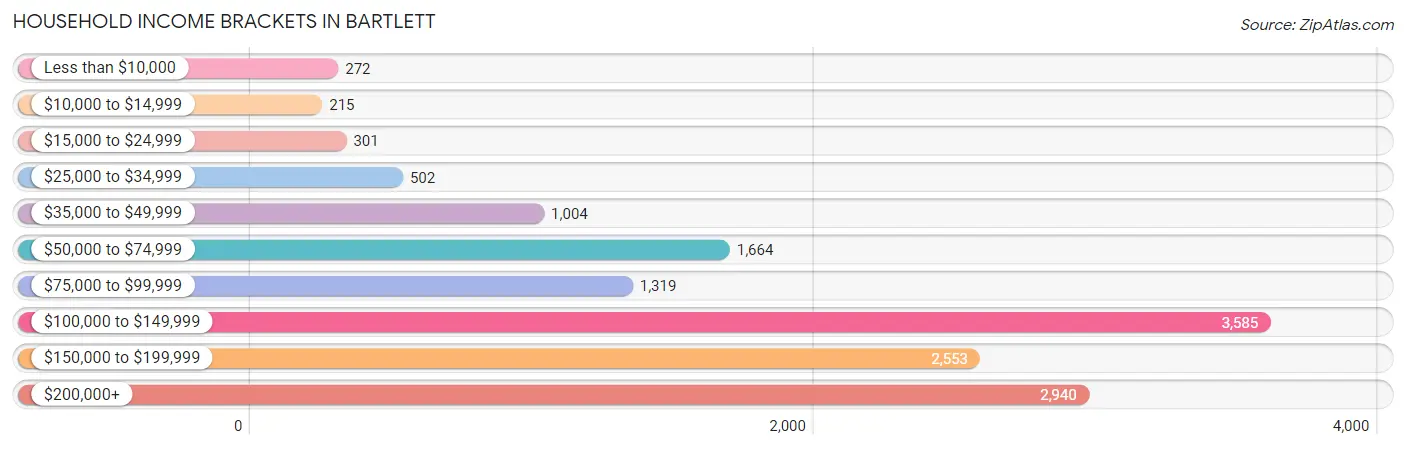
| Income Bracket | # Households | % Households |
| Less than $10,000 | 272 | 1.9% |
| $10,000 to $14,999 | 215 | 1.5% |
| $15,000 to $24,999 | 301 | 2.1% |
| $25,000 to $34,999 | 502 | 3.5% |
| $35,000 to $49,999 | 1,004 | 7.0% |
| $50,000 to $74,999 | 1,664 | 11.6% |
| $75,000 to $99,999 | 1,319 | 9.2% |
| $100,000 to $149,999 | 3,585 | 25.0% |
| $150,000 to $199,999 | 2,553 | 17.8% |
| $200,000+ | 2,940 | 20.5% |
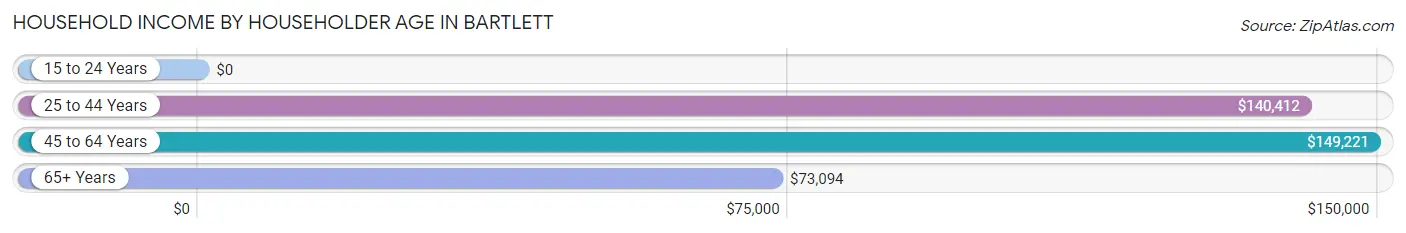
Household Income by Householder Age in Bartlett
The median household income in Bartlett is $126,555, with the highest median household income of $149,221 found in the 45 to 64 years age bracket for the primary householder. A total of 6,646 households (46.3%) fall into this category. Meanwhile, the 15 to 24 years age bracket for the primary householder has the lowest median household income of $0, with 169 households (1.2%) in this group.
| Income Bracket | # Households | Median Income |
| 15 to 24 Years | 169 (1.2%) | $0 |
| 25 to 44 Years | 4,223 (29.4%) | $140,412 |
| 45 to 64 Years | 6,646 (46.3%) | $149,221 |
| 65+ Years | 3,303 (23.0%) | $73,094 |
| Total | 14,341 (100.0%) | $126,555 |
Poverty in Bartlett
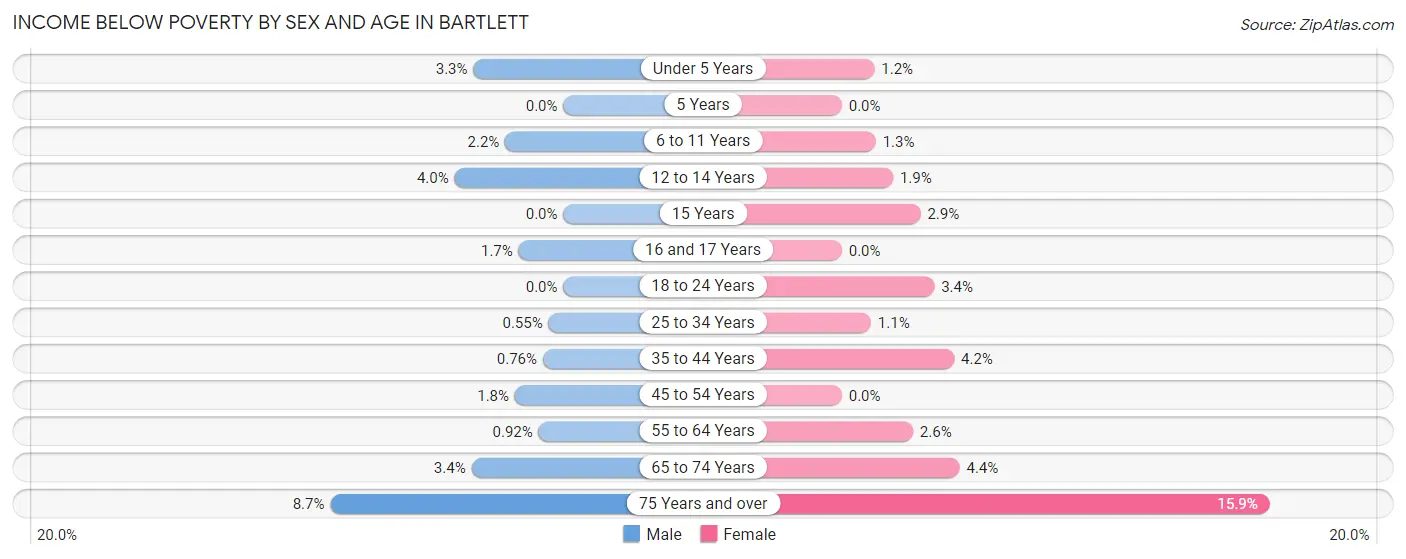
Income Below Poverty by Sex and Age in Bartlett
With 1.9% poverty level for males and 3.0% for females among the residents of Bartlett, 75 year old and over males and 75 year old and over females are the most vulnerable to poverty, with 87 males (8.6%) and 184 females (15.9%) in their respective age groups living below the poverty level.
| Age Bracket | Male | Female |
| Under 5 Years | 40 (3.3%) | 18 (1.2%) |
| 5 Years | 0 (0.0%) | 0 (0.0%) |
| 6 to 11 Years | 32 (2.2%) | 17 (1.3%) |
| 12 to 14 Years | 31 (4.0%) | 15 (1.9%) |
| 15 Years | 0 (0.0%) | 10 (2.9%) |
| 16 and 17 Years | 12 (1.7%) | 0 (0.0%) |
| 18 to 24 Years | 0 (0.0%) | 48 (3.4%) |
| 25 to 34 Years | 13 (0.5%) | 24 (1.1%) |
| 35 to 44 Years | 22 (0.8%) | 105 (4.2%) |
| 45 to 54 Years | 50 (1.8%) | 0 (0.0%) |
| 55 to 64 Years | 30 (0.9%) | 88 (2.6%) |
| 65 to 74 Years | 65 (3.4%) | 91 (4.4%) |
| 75 Years and over | 87 (8.6%) | 184 (15.9%) |
| Total | 382 (1.9%) | 600 (3.0%) |
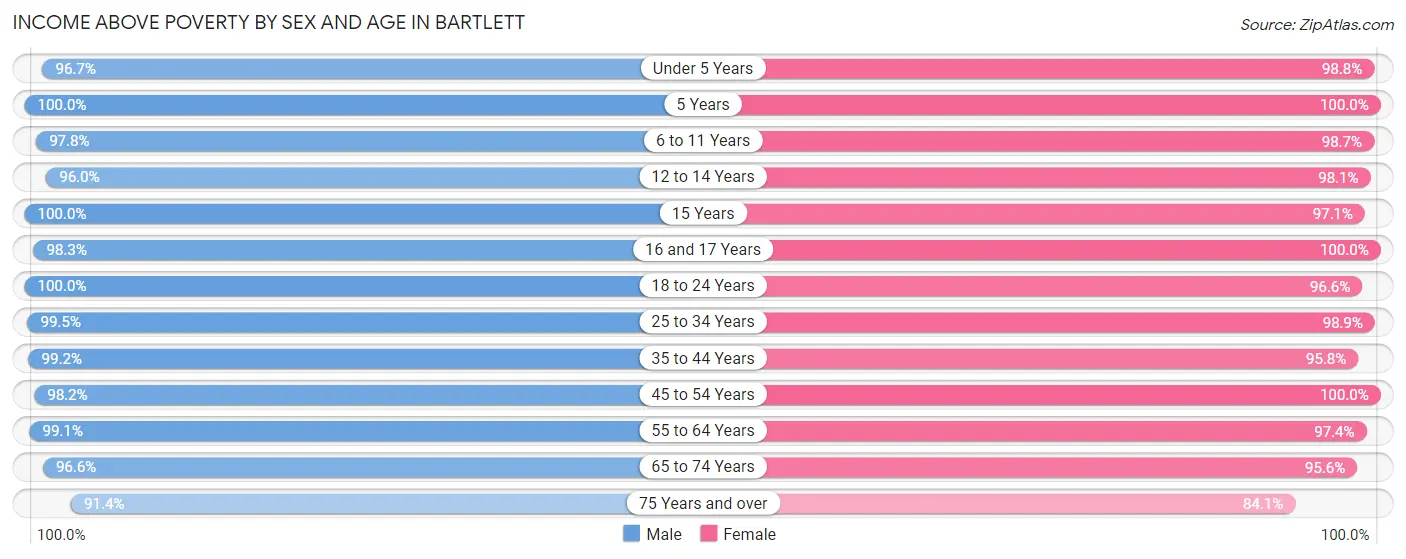
Income Above Poverty by Sex and Age in Bartlett
According to the poverty statistics in Bartlett, males aged 5 years and females aged 5 years are the age groups that are most secure financially, with 100.0% of males and 100.0% of females in these age groups living above the poverty line.
| Age Bracket | Male | Female |
| Under 5 Years | 1,156 (96.7%) | 1,473 (98.8%) |
| 5 Years | 337 (100.0%) | 248 (100.0%) |
| 6 to 11 Years | 1,451 (97.8%) | 1,337 (98.7%) |
| 12 to 14 Years | 737 (96.0%) | 773 (98.1%) |
| 15 Years | 279 (100.0%) | 332 (97.1%) |
| 16 and 17 Years | 711 (98.3%) | 378 (100.0%) |
| 18 to 24 Years | 1,466 (100.0%) | 1,352 (96.6%) |
| 25 to 34 Years | 2,361 (99.5%) | 2,188 (98.9%) |
| 35 to 44 Years | 2,878 (99.2%) | 2,411 (95.8%) |
| 45 to 54 Years | 2,730 (98.2%) | 2,909 (100.0%) |
| 55 to 64 Years | 3,244 (99.1%) | 3,248 (97.4%) |
| 65 to 74 Years | 1,841 (96.6%) | 1,992 (95.6%) |
| 75 Years and over | 919 (91.3%) | 975 (84.1%) |
| Total | 20,110 (98.1%) | 19,616 (97.0%) |
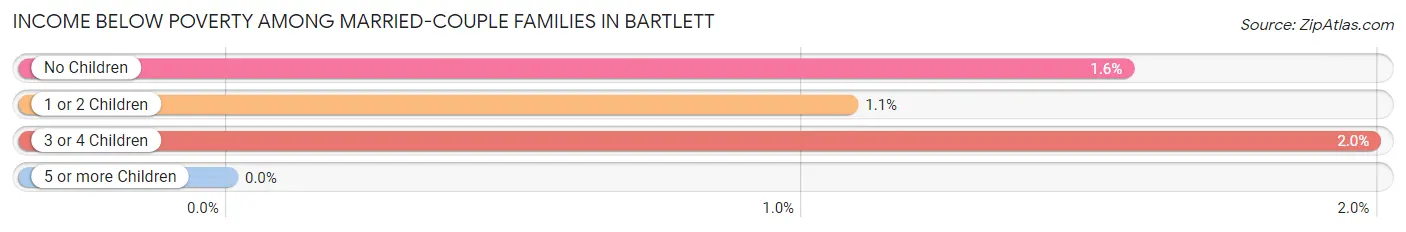
Income Below Poverty Among Married-Couple Families in Bartlett
The poverty statistics for married-couple families in Bartlett show that 1.4% or 139 of the total 9,737 families live below the poverty line. Families with 3 or 4 children have the highest poverty rate of 2.0%, comprising of 15 families. On the other hand, families with 5 or more children have the lowest poverty rate of 0.0%, which includes 0 families.
| Children | Above Poverty | Below Poverty |
| No Children | 5,561 (98.4%) | 88 (1.6%) |
| 1 or 2 Children | 3,290 (98.9%) | 36 (1.1%) |
| 3 or 4 Children | 739 (98.0%) | 15 (2.0%) |
| 5 or more Children | 8 (100.0%) | 0 (0.0%) |
| Total | 9,598 (98.6%) | 139 (1.4%) |
Income Below Poverty Among Single-Parent Households in Bartlett
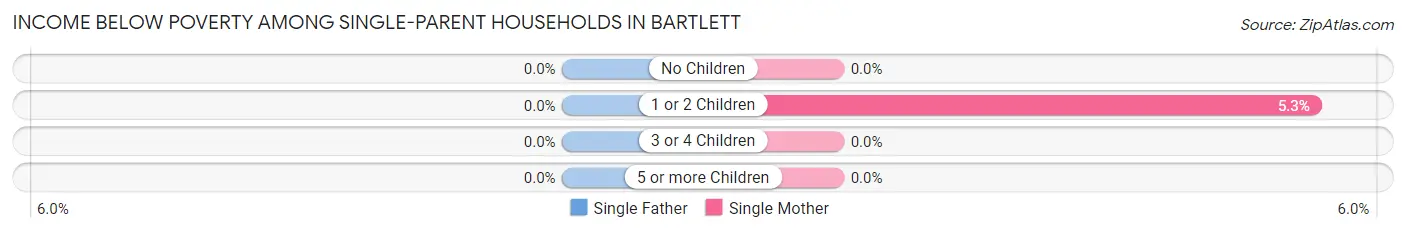
| Children | Single Father | Single Mother |
| No Children | 0 (0.0%) | 0 (0.0%) |
| 1 or 2 Children | 0 (0.0%) | 39 (5.3%) |
| 3 or 4 Children | 0 (0.0%) | 0 (0.0%) |
| 5 or more Children | 0 (0.0%) | 0 (0.0%) |
| Total | 0 (0.0%) | 39 (3.0%) |
Income Below Poverty Among Married-Couple vs Single-Parent Households in Bartlett
The poverty data for Bartlett shows that 139 of the married-couple family households (1.4%) and 39 of the single-parent households (2.1%) are living below the poverty level. Within the married-couple family households, those with 3 or 4 children have the highest poverty rate, with 15 households (2.0%) falling below the poverty line. Among the single-parent households, those with 1 or 2 children have the highest poverty rate, with 39 household (4.0%) living below poverty.
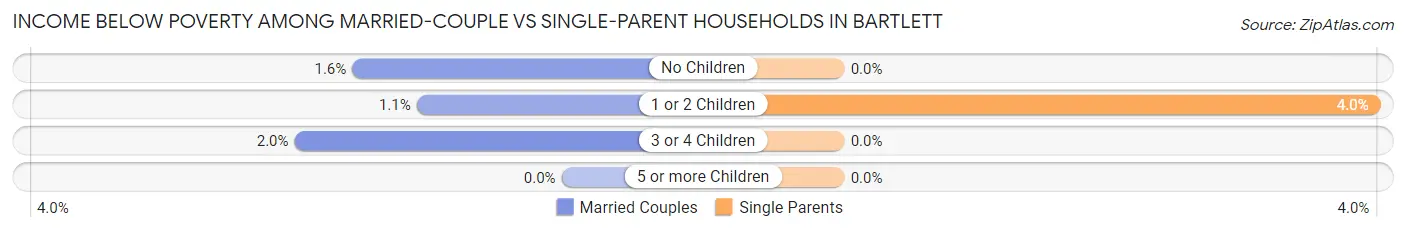
| Children | Married-Couple Families | Single-Parent Households |
| No Children | 88 (1.6%) | 0 (0.0%) |
| 1 or 2 Children | 36 (1.1%) | 39 (4.0%) |
| 3 or 4 Children | 15 (2.0%) | 0 (0.0%) |
| 5 or more Children | 0 (0.0%) | 0 (0.0%) |
| Total | 139 (1.4%) | 39 (2.1%) |
Race in Bartlett
The most populous races in Bartlett are White / Caucasian (27,666 | 67.8%), Asian (6,710 | 16.4%), and Hispanic or Latino (6,105 | 14.9%).
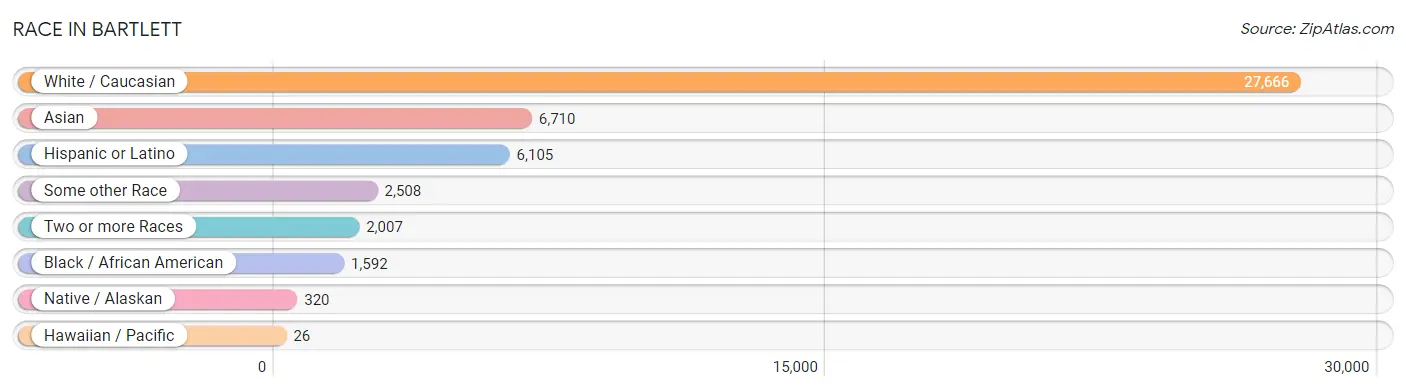
| Race | # Population | % Population |
| Asian | 6,710 | 16.4% |
| Black / African American | 1,592 | 3.9% |
| Hawaiian / Pacific | 26 | 0.1% |
| Hispanic or Latino | 6,105 | 14.9% |
| Native / Alaskan | 320 | 0.8% |
| White / Caucasian | 27,666 | 67.8% |
| Two or more Races | 2,007 | 4.9% |
| Some other Race | 2,508 | 6.1% |
| Total | 40,829 | 100.0% |
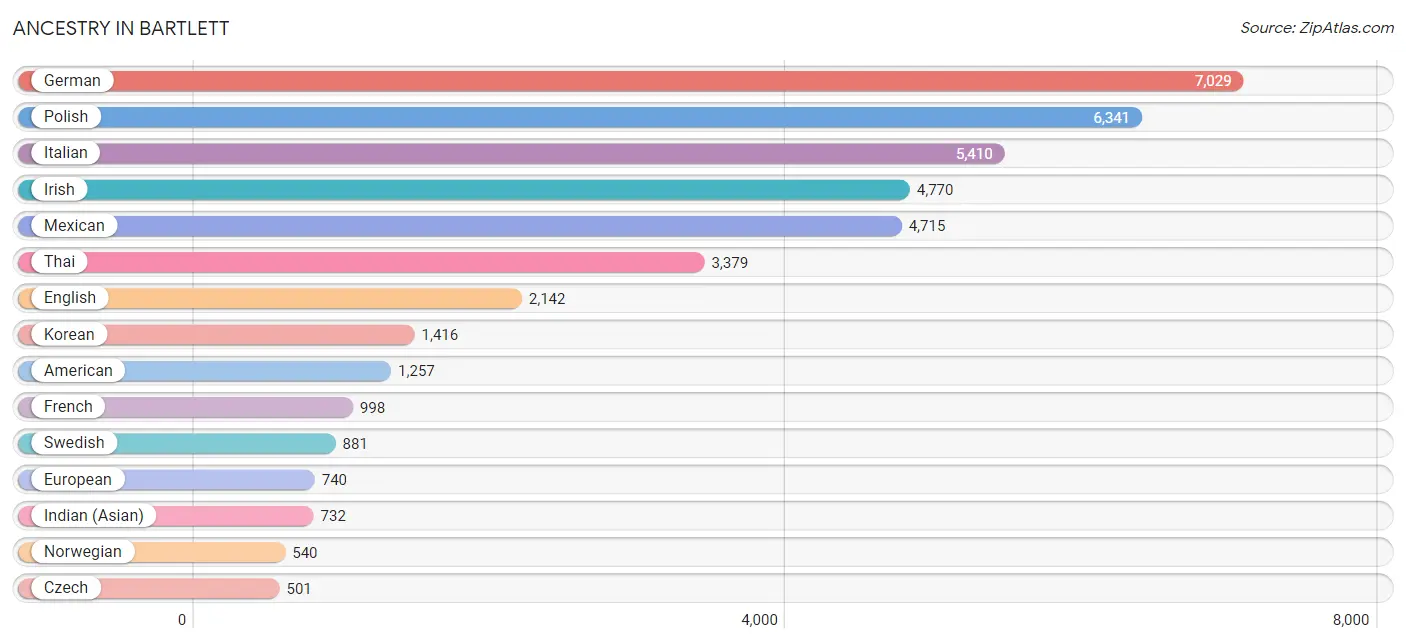
Ancestry in Bartlett
The most populous ancestries reported in Bartlett are German (7,029 | 17.2%), Polish (6,341 | 15.5%), Italian (5,410 | 13.3%), Irish (4,770 | 11.7%), and Mexican (4,715 | 11.6%), together accounting for 69.2% of all Bartlett residents.
| Ancestry | # Population | % Population |
| Albanian | 23 | 0.1% |
| American | 1,257 | 3.1% |
| Arab | 97 | 0.2% |
| Argentinean | 49 | 0.1% |
| Armenian | 12 | 0.0% |
| Assyrian / Chaldean / Syriac | 58 | 0.1% |
| Austrian | 183 | 0.4% |
| Belgian | 39 | 0.1% |
| Bhutanese | 142 | 0.4% |
| Brazilian | 3 | 0.0% |
| British | 84 | 0.2% |
| Bulgarian | 25 | 0.1% |
| Burmese | 200 | 0.5% |
| Celtic | 104 | 0.3% |
| Central American | 181 | 0.4% |
| Central American Indian | 8 | 0.0% |
| Cherokee | 26 | 0.1% |
| Colombian | 196 | 0.5% |
| Croatian | 228 | 0.6% |
| Cuban | 291 | 0.7% |
| Czech | 501 | 1.2% |
| Czechoslovakian | 20 | 0.1% |
| Danish | 133 | 0.3% |
| Delaware | 26 | 0.1% |
| Dutch | 120 | 0.3% |
| Eastern European | 67 | 0.2% |
| Ecuadorian | 73 | 0.2% |
| Egyptian | 22 | 0.1% |
| English | 2,142 | 5.2% |
| Ethiopian | 15 | 0.0% |
| European | 740 | 1.8% |
| Filipino | 21 | 0.1% |
| Finnish | 12 | 0.0% |
| French | 998 | 2.4% |
| French Canadian | 148 | 0.4% |
| German | 7,029 | 17.2% |
| Greek | 312 | 0.8% |
| Guatemalan | 119 | 0.3% |
| Hungarian | 187 | 0.5% |
| Indian (Asian) | 732 | 1.8% |
| Indonesian | 26 | 0.1% |
| Irish | 4,770 | 11.7% |
| Italian | 5,410 | 13.3% |
| Jamaican | 24 | 0.1% |
| Korean | 1,416 | 3.5% |
| Latvian | 8 | 0.0% |
| Lebanese | 75 | 0.2% |
| Lithuanian | 226 | 0.5% |
| Luxembourger | 8 | 0.0% |
| Malaysian | 14 | 0.0% |
| Mexican | 4,715 | 11.6% |
| Mexican American Indian | 295 | 0.7% |
| Native Hawaiian | 26 | 0.1% |
| Nigerian | 8 | 0.0% |
| Northern European | 21 | 0.1% |
| Norwegian | 540 | 1.3% |
| Pakistani | 64 | 0.2% |
| Pennsylvania German | 7 | 0.0% |
| Peruvian | 21 | 0.1% |
| Polish | 6,341 | 15.5% |
| Puerto Rican | 415 | 1.0% |
| Romanian | 51 | 0.1% |
| Russian | 187 | 0.5% |
| Salvadoran | 62 | 0.2% |
| Samoan | 13 | 0.0% |
| Scandinavian | 53 | 0.1% |
| Scotch-Irish | 126 | 0.3% |
| Scottish | 448 | 1.1% |
| Serbian | 74 | 0.2% |
| Slavic | 8 | 0.0% |
| Slovak | 60 | 0.2% |
| Slovene | 5 | 0.0% |
| South American | 470 | 1.1% |
| Spaniard | 33 | 0.1% |
| Sri Lankan | 92 | 0.2% |
| Subsaharan African | 62 | 0.2% |
| Swedish | 881 | 2.2% |
| Swiss | 138 | 0.3% |
| Thai | 3,379 | 8.3% |
| Trinidadian and Tobagonian | 6 | 0.0% |
| Turkish | 9 | 0.0% |
| Ukrainian | 210 | 0.5% |
| Venezuelan | 131 | 0.3% |
| Vietnamese | 11 | 0.0% |
| Welsh | 256 | 0.6% |
| West Indian | 5 | 0.0% |
| Yugoslavian | 7 | 0.0% | View All 87 Rows |
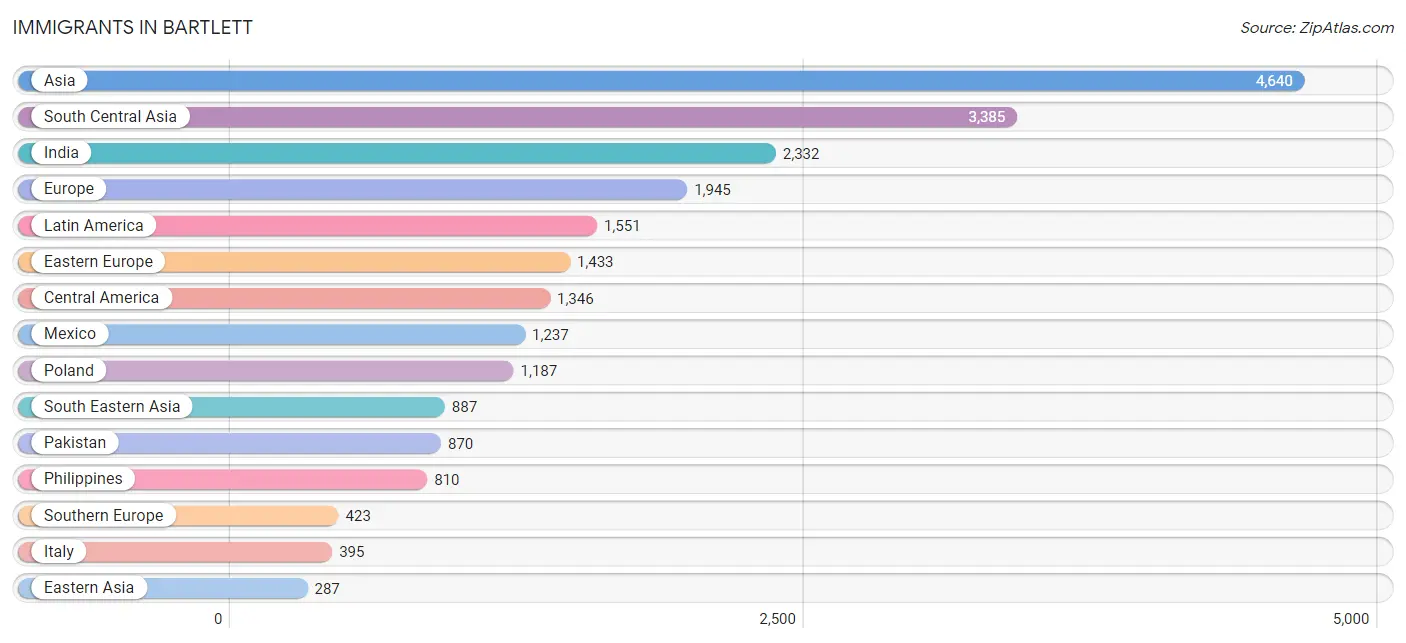
Immigrants in Bartlett
The most numerous immigrant groups reported in Bartlett came from Asia (4,640 | 11.4%), South Central Asia (3,385 | 8.3%), India (2,332 | 5.7%), Europe (1,945 | 4.8%), and Latin America (1,551 | 3.8%), together accounting for 33.9% of all Bartlett residents.
| Immigration Origin | # Population | % Population |
| Africa | 76 | 0.2% |
| Argentina | 28 | 0.1% |
| Asia | 4,640 | 11.4% |
| Bangladesh | 11 | 0.0% |
| Bosnia and Herzegovina | 25 | 0.1% |
| Bulgaria | 53 | 0.1% |
| Canada | 24 | 0.1% |
| Caribbean | 5 | 0.0% |
| Central America | 1,346 | 3.3% |
| China | 213 | 0.5% |
| Colombia | 46 | 0.1% |
| Czechoslovakia | 31 | 0.1% |
| Eastern Africa | 40 | 0.1% |
| Eastern Asia | 287 | 0.7% |
| Eastern Europe | 1,433 | 3.5% |
| Ecuador | 15 | 0.0% |
| Egypt | 22 | 0.1% |
| El Salvador | 25 | 0.1% |
| England | 13 | 0.0% |
| Ethiopia | 30 | 0.1% |
| Europe | 1,945 | 4.8% |
| France | 8 | 0.0% |
| Germany | 50 | 0.1% |
| Greece | 28 | 0.1% |
| Guatemala | 74 | 0.2% |
| Hong Kong | 61 | 0.2% |
| Hungary | 10 | 0.0% |
| India | 2,332 | 5.7% |
| Iran | 20 | 0.1% |
| Ireland | 14 | 0.0% |
| Italy | 395 | 1.0% |
| Japan | 20 | 0.1% |
| Kazakhstan | 10 | 0.0% |
| Kenya | 5 | 0.0% |
| Korea | 54 | 0.1% |
| Laos | 14 | 0.0% |
| Latin America | 1,551 | 3.8% |
| Latvia | 14 | 0.0% |
| Lebanon | 16 | 0.0% |
| Malaysia | 9 | 0.0% |
| Mexico | 1,237 | 3.0% |
| Nepal | 119 | 0.3% |
| Nigeria | 14 | 0.0% |
| North Macedonia | 2 | 0.0% |
| Northern Africa | 22 | 0.1% |
| Northern Europe | 31 | 0.1% |
| Pakistan | 870 | 2.1% |
| Panama | 10 | 0.0% |
| Peru | 10 | 0.0% |
| Philippines | 810 | 2.0% |
| Poland | 1,187 | 2.9% |
| Romania | 45 | 0.1% |
| Russia | 14 | 0.0% |
| Saudi Arabia | 16 | 0.0% |
| Serbia | 31 | 0.1% |
| South America | 200 | 0.5% |
| South Central Asia | 3,385 | 8.3% |
| South Eastern Asia | 887 | 2.2% |
| Southern Europe | 423 | 1.0% |
| Sri Lanka | 13 | 0.0% |
| Taiwan | 38 | 0.1% |
| Turkey | 9 | 0.0% |
| Ukraine | 21 | 0.1% |
| Venezuela | 101 | 0.3% |
| Vietnam | 45 | 0.1% |
| Western Africa | 14 | 0.0% |
| Western Asia | 81 | 0.2% |
| Western Europe | 58 | 0.1% | View All 68 Rows |
Sex and Age in Bartlett
Sex and Age in Bartlett
The most populous age groups in Bartlett are 55 to 59 Years (1,656 | 8.1%) for men and 55 to 59 Years (1,842 | 9.1%) for women.
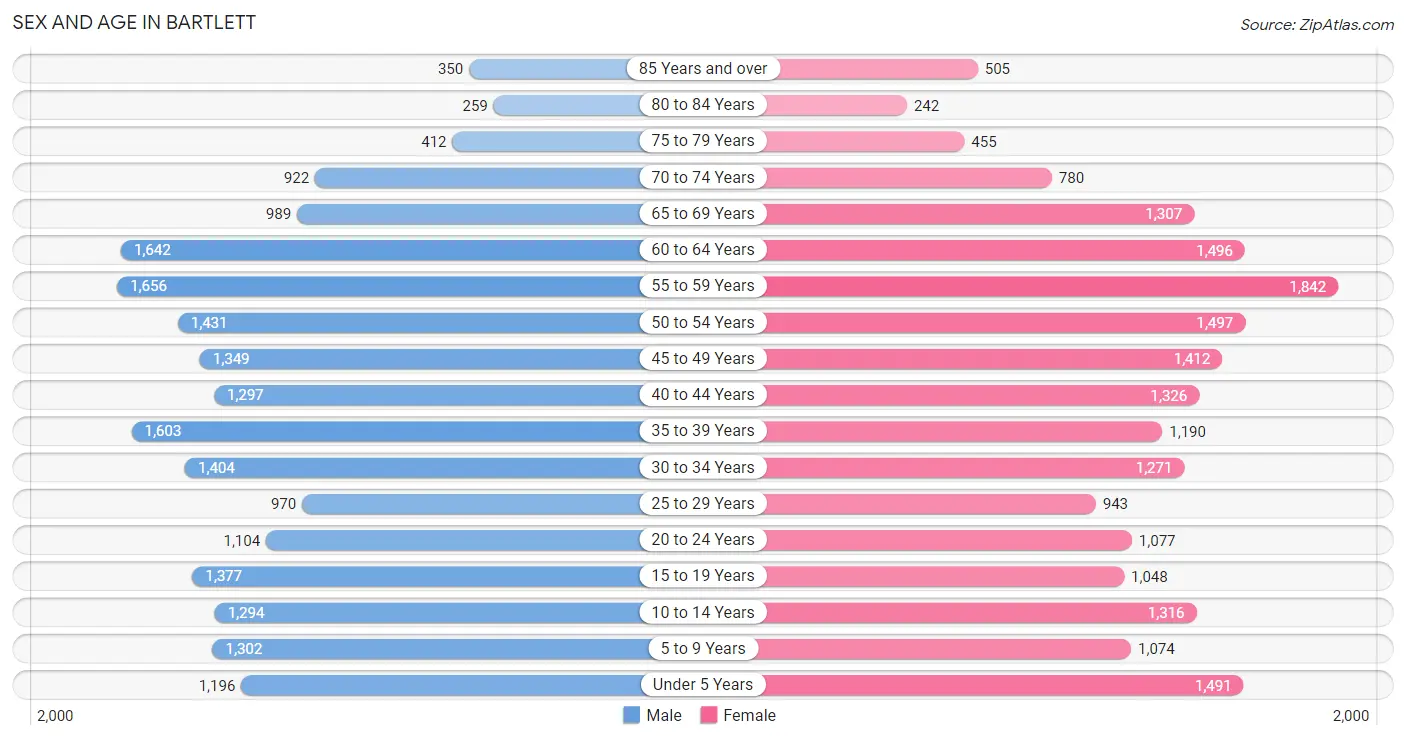
| Age Bracket | Male | Female |
| Under 5 Years | 1,196 (5.8%) | 1,491 (7.3%) |
| 5 to 9 Years | 1,302 (6.3%) | 1,074 (5.3%) |
| 10 to 14 Years | 1,294 (6.3%) | 1,316 (6.5%) |
| 15 to 19 Years | 1,377 (6.7%) | 1,048 (5.2%) |
| 20 to 24 Years | 1,104 (5.4%) | 1,077 (5.3%) |
| 25 to 29 Years | 970 (4.7%) | 943 (4.6%) |
| 30 to 34 Years | 1,404 (6.8%) | 1,271 (6.3%) |
| 35 to 39 Years | 1,603 (7.8%) | 1,190 (5.9%) |
| 40 to 44 Years | 1,297 (6.3%) | 1,326 (6.5%) |
| 45 to 49 Years | 1,349 (6.6%) | 1,412 (7.0%) |
| 50 to 54 Years | 1,431 (7.0%) | 1,497 (7.4%) |
| 55 to 59 Years | 1,656 (8.1%) | 1,842 (9.1%) |
| 60 to 64 Years | 1,642 (8.0%) | 1,496 (7.4%) |
| 65 to 69 Years | 989 (4.8%) | 1,307 (6.5%) |
| 70 to 74 Years | 922 (4.5%) | 780 (3.8%) |
| 75 to 79 Years | 412 (2.0%) | 455 (2.2%) |
| 80 to 84 Years | 259 (1.3%) | 242 (1.2%) |
| 85 Years and over | 350 (1.7%) | 505 (2.5%) |
| Total | 20,557 (100.0%) | 20,272 (100.0%) |
Families and Households in Bartlett
Median Family Size in Bartlett
The median family size in Bartlett is 3.19 persons per family, with married-couple families (9,737 | 84.2%) accounting for the largest median family size of 3.26 persons per family. On the other hand, single male/father families (507 | 4.4%) represent the smallest median family size with 2.53 persons per family.
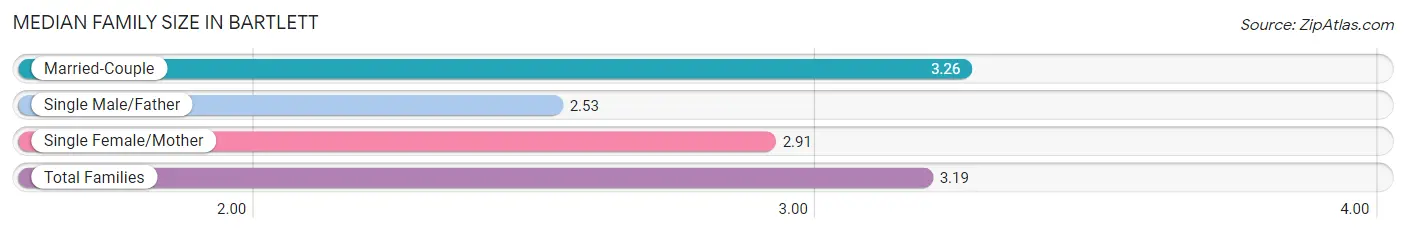
| Family Type | # Families | Family Size |
| Married-Couple | 9,737 (84.2%) | 3.26 |
| Single Male/Father | 507 (4.4%) | 2.53 |
| Single Female/Mother | 1,317 (11.4%) | 2.91 |
| Total Families | 11,561 (100.0%) | 3.19 |
Median Household Size in Bartlett
The median household size in Bartlett is 2.84 persons per household, with married-couple households (9,737 | 67.9%) accounting for the largest median household size of 3.27 persons per household. non-family households (2,780 | 19.4%) represent the smallest median household size with 1.14 persons per household.
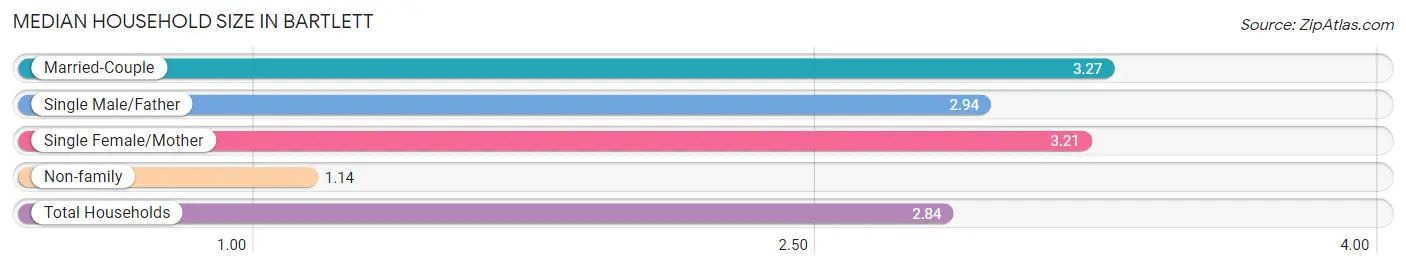
| Household Type | # Households | Household Size |
| Married-Couple | 9,737 (67.9%) | 3.27 |
| Single Male/Father | 507 (3.5%) | 2.94 |
| Single Female/Mother | 1,317 (9.2%) | 3.21 |
| Non-family | 2,780 (19.4%) | 1.14 |
| Total Households | 14,341 (100.0%) | 2.84 |
Household Size by Marriage Status in Bartlett
Out of a total of 14,341 households in Bartlett, 11,561 (80.6%) are family households, while 2,780 (19.4%) are nonfamily households. The most numerous type of family households are 2-person households, comprising 4,651, and the most common type of nonfamily households are 1-person households, comprising 2,415.
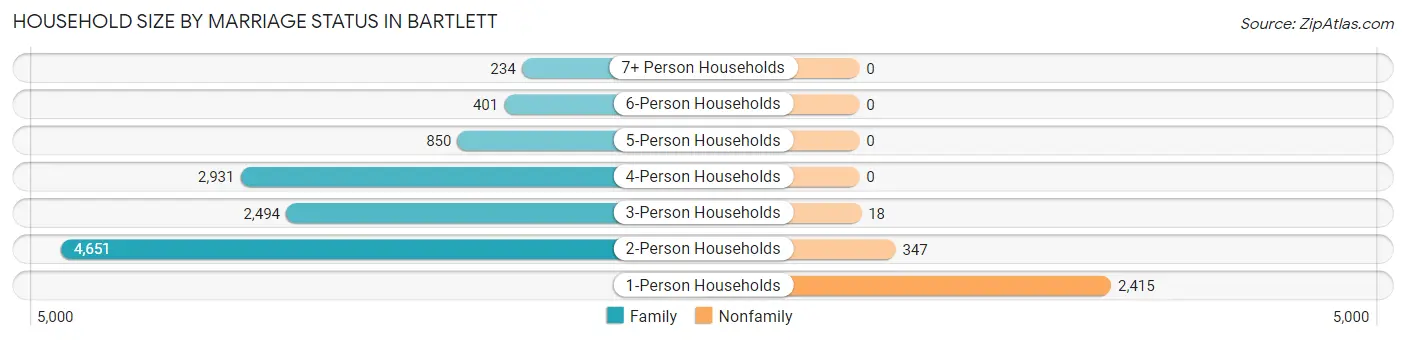
| Household Size | Family Households | Nonfamily Households |
| 1-Person Households | - | 2,415 (16.8%) |
| 2-Person Households | 4,651 (32.4%) | 347 (2.4%) |
| 3-Person Households | 2,494 (17.4%) | 18 (0.1%) |
| 4-Person Households | 2,931 (20.4%) | 0 (0.0%) |
| 5-Person Households | 850 (5.9%) | 0 (0.0%) |
| 6-Person Households | 401 (2.8%) | 0 (0.0%) |
| 7+ Person Households | 234 (1.6%) | 0 (0.0%) |
| Total | 11,561 (80.6%) | 2,780 (19.4%) |
Female Fertility in Bartlett
Fertility by Age in Bartlett
Average fertility rate in Bartlett is 69.0 births per 1,000 women. Women in the age bracket of 20 to 34 years have the highest fertility rate with 144.0 births per 1,000 women. Women in the age bracket of 20 to 34 years acount for 81.1% of all women with births.
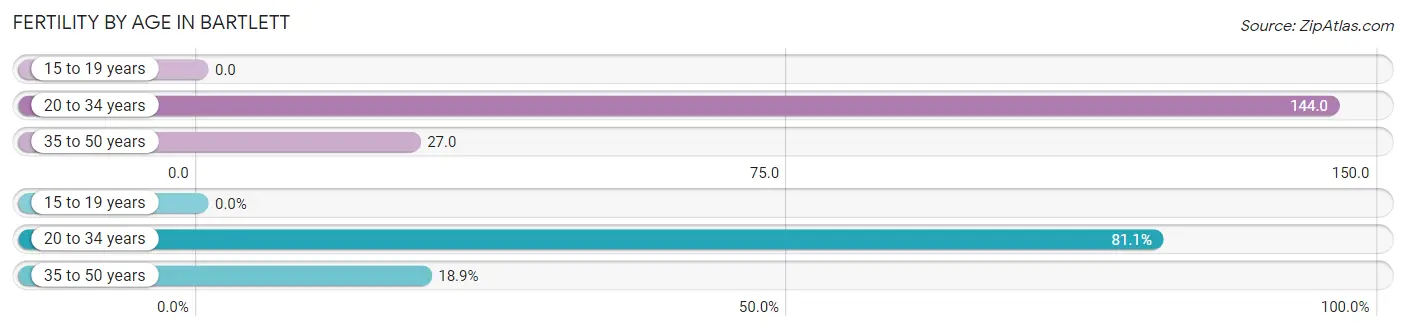
| Age Bracket | Women with Births | Births / 1,000 Women |
| 15 to 19 years | 0 (0.0%) | 0.0 |
| 20 to 34 years | 475 (81.1%) | 144.0 |
| 35 to 50 years | 111 (18.9%) | 27.0 |
| Total | 586 (100.0%) | 69.0 |
Fertility by Age by Marriage Status in Bartlett
82.6% of women with births (586) in Bartlett are married. The highest percentage of unmarried women with births falls into 35 to 50 years age bracket with 24.3% of them unmarried at the time of birth, while the lowest percentage of unmarried women with births belong to 20 to 34 years age bracket with 15.8% of them unmarried.
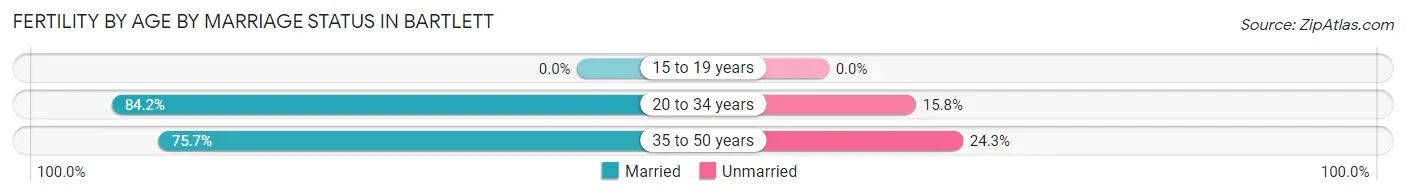
| Age Bracket | Married | Unmarried |
| 15 to 19 years | 0 (0.0%) | 0 (0.0%) |
| 20 to 34 years | 400 (84.2%) | 75 (15.8%) |
| 35 to 50 years | 84 (75.7%) | 27 (24.3%) |
| Total | 484 (82.6%) | 102 (17.4%) |
Fertility by Education in Bartlett
Average fertility rate in Bartlett is 69.0 births per 1,000 women. Women with the education attainment of graduate degree have the highest fertility rate of 193.0 births per 1,000 women, while women with the education attainment of less than high school have the lowest fertility at 20.0 births per 1,000 women. Women with the education attainment of graduate degree represent 43.0% of all women with births.
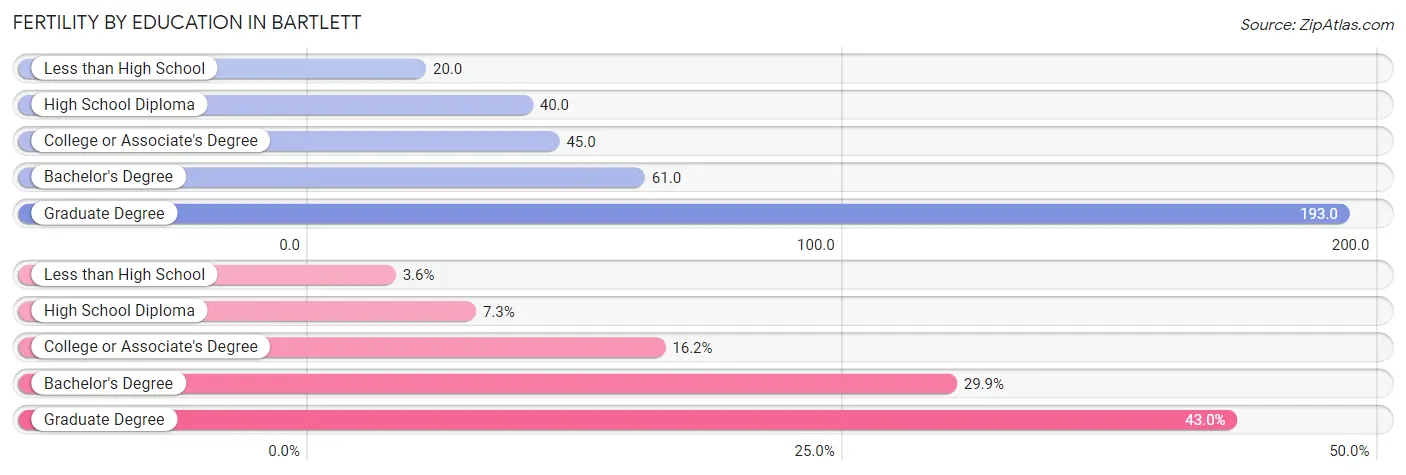
| Educational Attainment | Women with Births | Births / 1,000 Women |
| Less than High School | 21 (3.6%) | 20.0 |
| High School Diploma | 43 (7.3%) | 40.0 |
| College or Associate's Degree | 95 (16.2%) | 45.0 |
| Bachelor's Degree | 175 (29.9%) | 61.0 |
| Graduate Degree | 252 (43.0%) | 193.0 |
| Total | 586 (100.0%) | 69.0 |
Fertility by Education by Marriage Status in Bartlett
17.4% of women with births in Bartlett are unmarried. Women with the educational attainment of bachelor's degree are most likely to be married with 95.4% of them married at childbirth, while women with the educational attainment of less than high school are least likely to be married with 100.0% of them unmarried at childbirth.
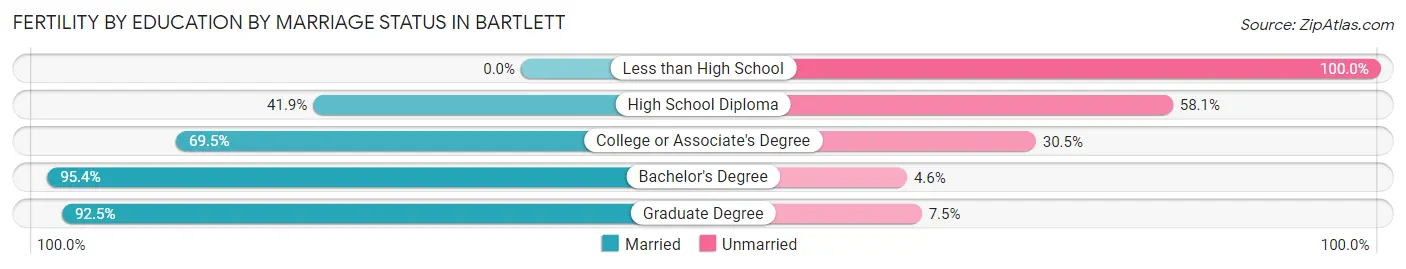
| Educational Attainment | Married | Unmarried |
| Less than High School | 0 (0.0%) | 21 (100.0%) |
| High School Diploma | 18 (41.9%) | 25 (58.1%) |
| College or Associate's Degree | 66 (69.5%) | 29 (30.5%) |
| Bachelor's Degree | 167 (95.4%) | 8 (4.6%) |
| Graduate Degree | 233 (92.5%) | 19 (7.5%) |
| Total | 484 (82.6%) | 102 (17.4%) |
Employment Characteristics in Bartlett
Employment by Class of Employer in Bartlett
Among the 22,495 employed individuals in Bartlett, private company employees (17,198 | 76.4%), local government employees (1,587 | 7.0%), and self-employed (incorporated) (1,219 | 5.4%) make up the most common classes of employment.
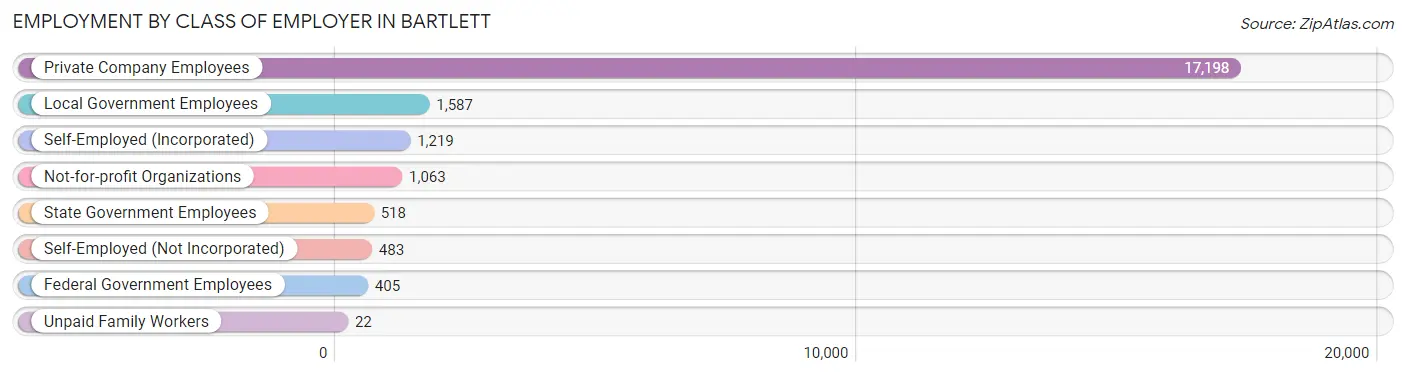
| Employer Class | # Employees | % Employees |
| Private Company Employees | 17,198 | 76.4% |
| Self-Employed (Incorporated) | 1,219 | 5.4% |
| Self-Employed (Not Incorporated) | 483 | 2.1% |
| Not-for-profit Organizations | 1,063 | 4.7% |
| Local Government Employees | 1,587 | 7.0% |
| State Government Employees | 518 | 2.3% |
| Federal Government Employees | 405 | 1.8% |
| Unpaid Family Workers | 22 | 0.1% |
| Total | 22,495 | 100.0% |
Employment Status by Age in Bartlett
According to the labor force statistics for Bartlett, out of the total population over 16 years of age (32,530), 71.8% or 23,357 individuals are in the labor force, with 2.2% or 514 of them unemployed. The age group with the highest labor force participation rate is 30 to 34 years, with 93.2% or 2,493 individuals in the labor force. Within the labor force, the 20 to 24 years age range has the highest percentage of unemployed individuals, with 6.6% or 111 of them being unemployed.
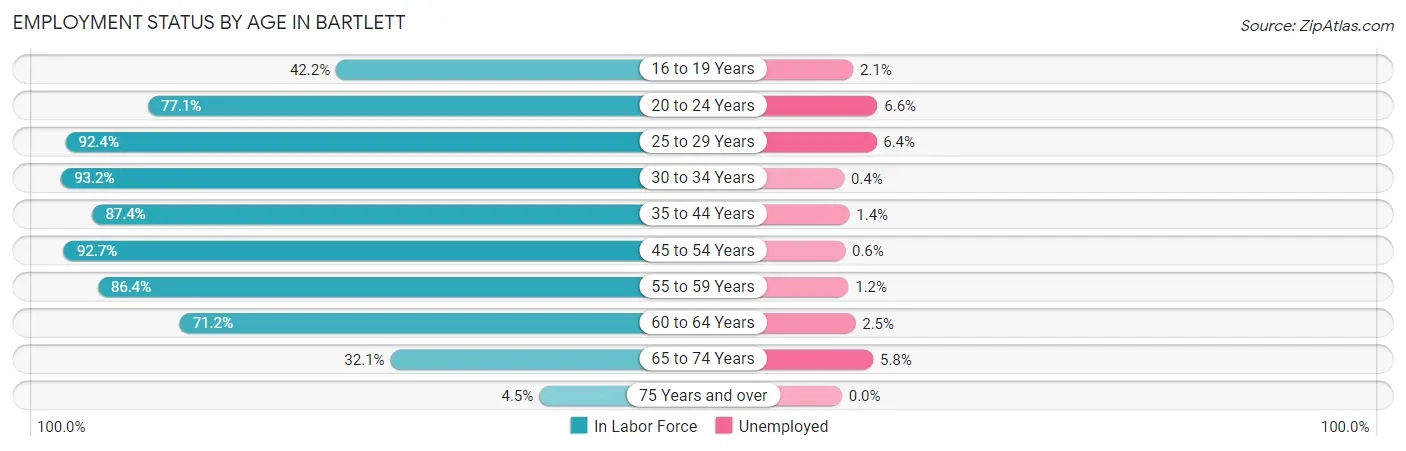
| Age Bracket | In Labor Force | Unemployed |
| 16 to 19 Years | 759 (42.2%) | 16 (2.1%) |
| 20 to 24 Years | 1,682 (77.1%) | 111 (6.6%) |
| 25 to 29 Years | 1,768 (92.4%) | 113 (6.4%) |
| 30 to 34 Years | 2,493 (93.2%) | 10 (0.4%) |
| 35 to 44 Years | 4,734 (87.4%) | 66 (1.4%) |
| 45 to 54 Years | 5,274 (92.7%) | 32 (0.6%) |
| 55 to 59 Years | 3,022 (86.4%) | 36 (1.2%) |
| 60 to 64 Years | 2,234 (71.2%) | 56 (2.5%) |
| 65 to 74 Years | 1,283 (32.1%) | 74 (5.8%) |
| 75 Years and over | 100 (4.5%) | 0 (0.0%) |
| Total | 23,357 (71.8%) | 514 (2.2%) |
Employment Status by Educational Attainment in Bartlett
According to labor force statistics for Bartlett, 87.4% of individuals (19,516) out of the total population between 25 and 64 years of age (22,329) are in the labor force, with 1.6% or 312 of them being unemployed. The group with the highest labor force participation rate are those with the educational attainment of bachelor's degree or higher, with 91.6% or 10,713 individuals in the labor force. Within the labor force, individuals with high school diploma education have the highest percentage of unemployment, with 2.7% or 81 of them being unemployed.
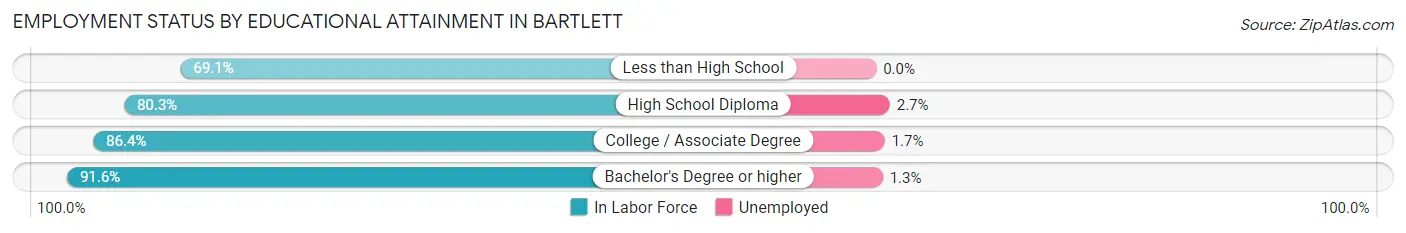
| Educational Attainment | In Labor Force | Unemployed |
| Less than High School | 578 (69.1%) | 0 (0.0%) |
| High School Diploma | 3,010 (80.3%) | 101 (2.7%) |
| College / Associate Degree | 5,226 (86.4%) | 103 (1.7%) |
| Bachelor's Degree or higher | 10,713 (91.6%) | 152 (1.3%) |
| Total | 19,516 (87.4%) | 357 (1.6%) |
Employment Occupations by Sex in Bartlett
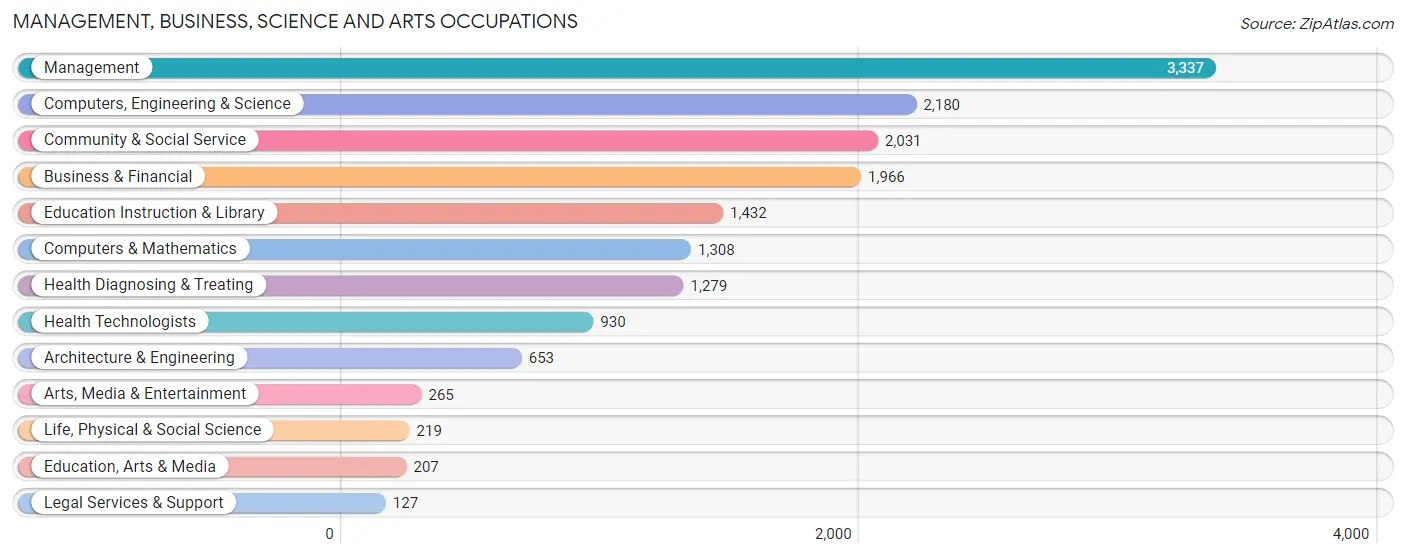
Management, Business, Science and Arts Occupations
The most common Management, Business, Science and Arts occupations in Bartlett are Management (3,337 | 14.6%), Computers, Engineering & Science (2,180 | 9.6%), Community & Social Service (2,031 | 8.9%), Business & Financial (1,966 | 8.6%), and Education Instruction & Library (1,432 | 6.3%).
Management, Business, Science and Arts Occupations by Sex
Within the Management, Business, Science and Arts occupations in Bartlett, the most male-oriented occupations are Architecture & Engineering (86.8%), Computers, Engineering & Science (72.1%), and Computers & Mathematics (68.6%), while the most female-oriented occupations are Education Instruction & Library (82.6%), Education, Arts & Media (76.3%), and Community & Social Service (75.1%).
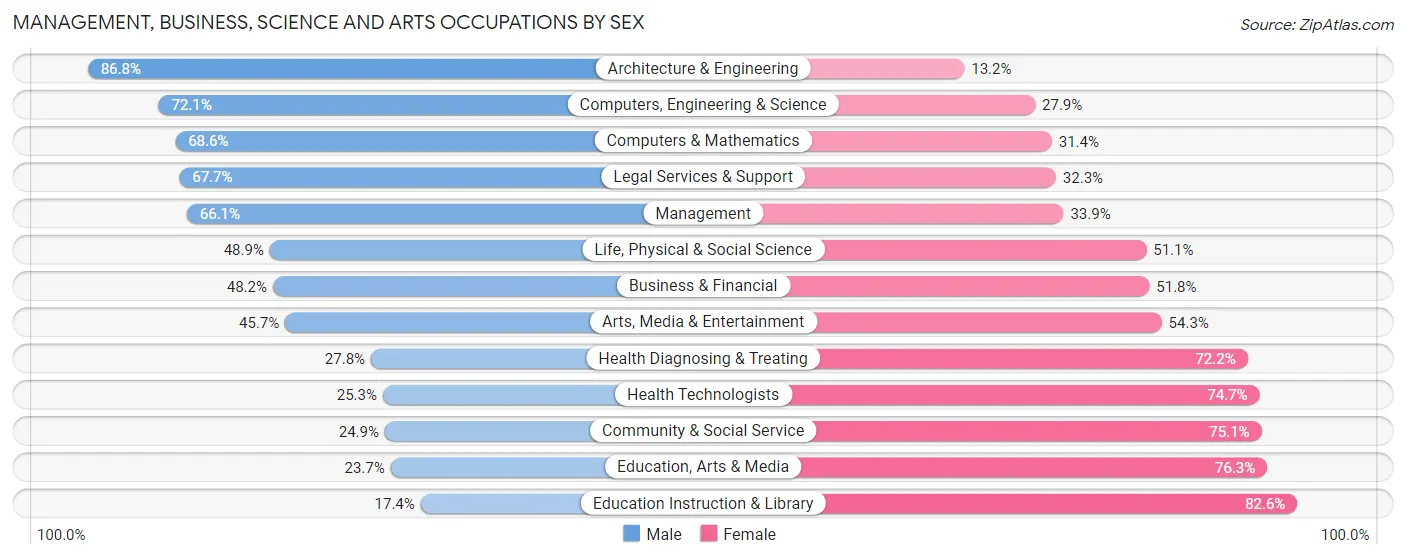
| Occupation | Male | Female |
| Management | 2,207 (66.1%) | 1,130 (33.9%) |
| Business & Financial | 948 (48.2%) | 1,018 (51.8%) |
| Computers, Engineering & Science | 1,571 (72.1%) | 609 (27.9%) |
| Computers & Mathematics | 897 (68.6%) | 411 (31.4%) |
| Architecture & Engineering | 567 (86.8%) | 86 (13.2%) |
| Life, Physical & Social Science | 107 (48.9%) | 112 (51.1%) |
| Community & Social Service | 505 (24.9%) | 1,526 (75.1%) |
| Education, Arts & Media | 49 (23.7%) | 158 (76.3%) |
| Legal Services & Support | 86 (67.7%) | 41 (32.3%) |
| Education Instruction & Library | 249 (17.4%) | 1,183 (82.6%) |
| Arts, Media & Entertainment | 121 (45.7%) | 144 (54.3%) |
| Health Diagnosing & Treating | 355 (27.8%) | 924 (72.2%) |
| Health Technologists | 235 (25.3%) | 695 (74.7%) |
| Total (Category) | 5,586 (51.8%) | 5,207 (48.2%) |
| Total (Overall) | 12,245 (53.6%) | 10,586 (46.4%) |
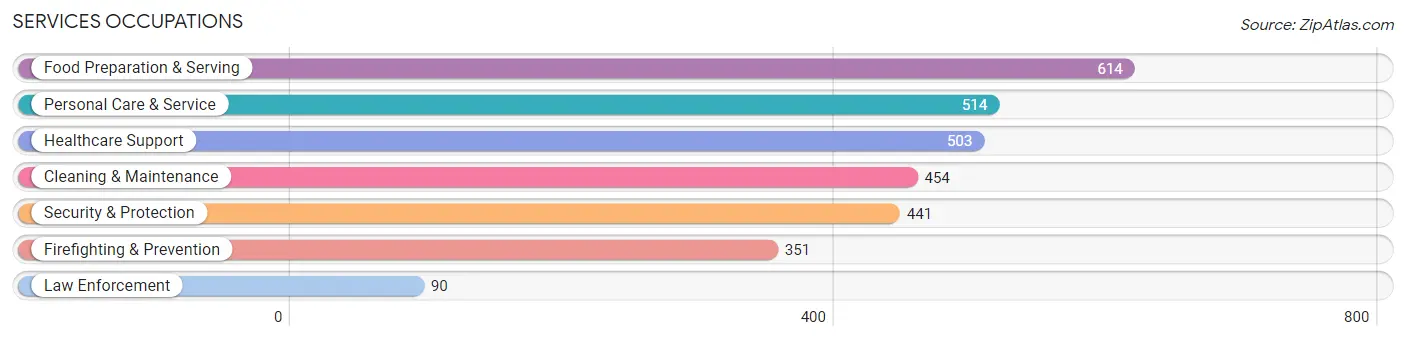
Services Occupations
The most common Services occupations in Bartlett are Food Preparation & Serving (614 | 2.7%), Personal Care & Service (514 | 2.2%), Healthcare Support (503 | 2.2%), Cleaning & Maintenance (454 | 2.0%), and Security & Protection (441 | 1.9%).
Services Occupations by Sex
Within the Services occupations in Bartlett, the most male-oriented occupations are Firefighting & Prevention (90.6%), Security & Protection (81.6%), and Cleaning & Maintenance (62.3%), while the most female-oriented occupations are Personal Care & Service (98.4%), Healthcare Support (95.2%), and Law Enforcement (53.3%).
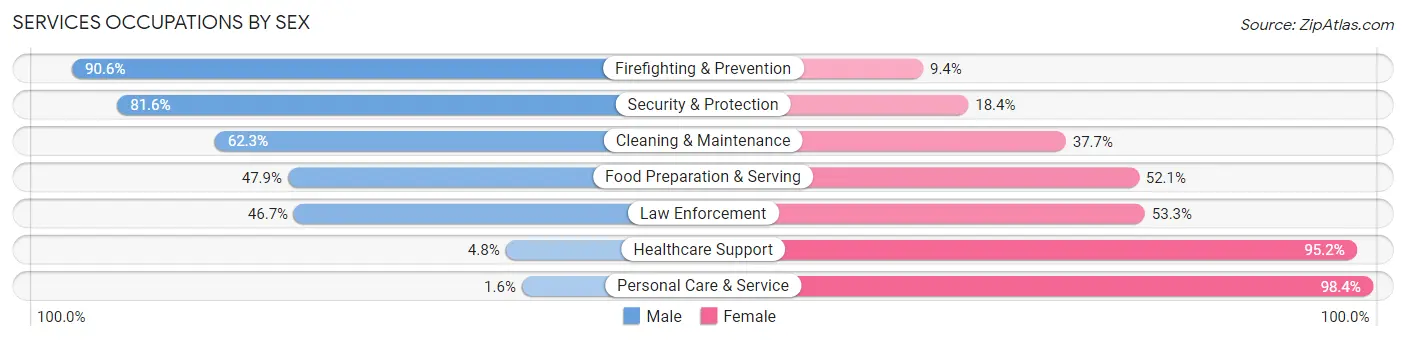
| Occupation | Male | Female |
| Healthcare Support | 24 (4.8%) | 479 (95.2%) |
| Security & Protection | 360 (81.6%) | 81 (18.4%) |
| Firefighting & Prevention | 318 (90.6%) | 33 (9.4%) |
| Law Enforcement | 42 (46.7%) | 48 (53.3%) |
| Food Preparation & Serving | 294 (47.9%) | 320 (52.1%) |
| Cleaning & Maintenance | 283 (62.3%) | 171 (37.7%) |
| Personal Care & Service | 8 (1.6%) | 506 (98.4%) |
| Total (Category) | 969 (38.4%) | 1,557 (61.6%) |
| Total (Overall) | 12,245 (53.6%) | 10,586 (46.4%) |
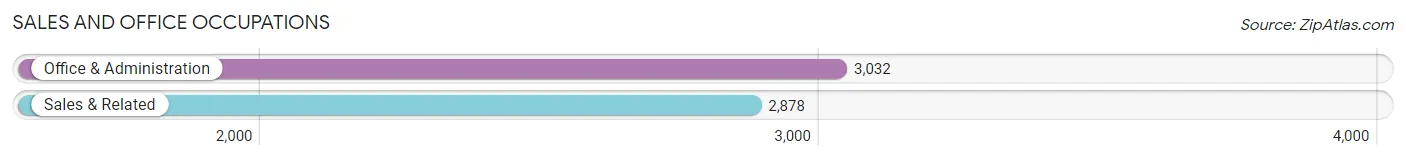
Sales and Office Occupations
The most common Sales and Office occupations in Bartlett are Office & Administration (3,032 | 13.3%), and Sales & Related (2,878 | 12.6%).
Sales and Office Occupations by Sex
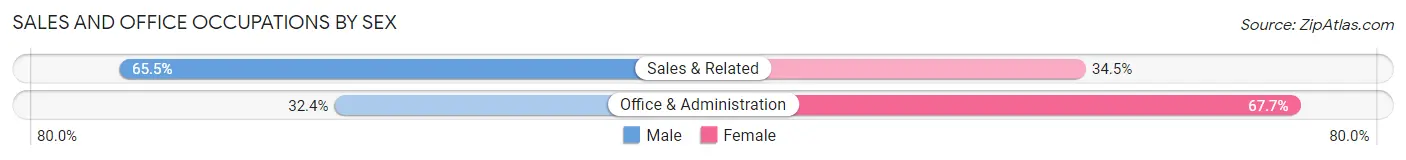
| Occupation | Male | Female |
| Sales & Related | 1,884 (65.5%) | 994 (34.5%) |
| Office & Administration | 981 (32.4%) | 2,051 (67.6%) |
| Total (Category) | 2,865 (48.5%) | 3,045 (51.5%) |
| Total (Overall) | 12,245 (53.6%) | 10,586 (46.4%) |
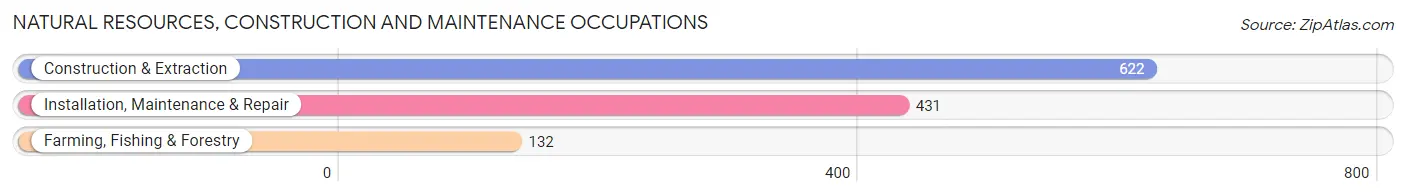
Natural Resources, Construction and Maintenance Occupations
The most common Natural Resources, Construction and Maintenance occupations in Bartlett are Construction & Extraction (622 | 2.7%), Installation, Maintenance & Repair (431 | 1.9%), and Farming, Fishing & Forestry (132 | 0.6%).
Natural Resources, Construction and Maintenance Occupations by Sex
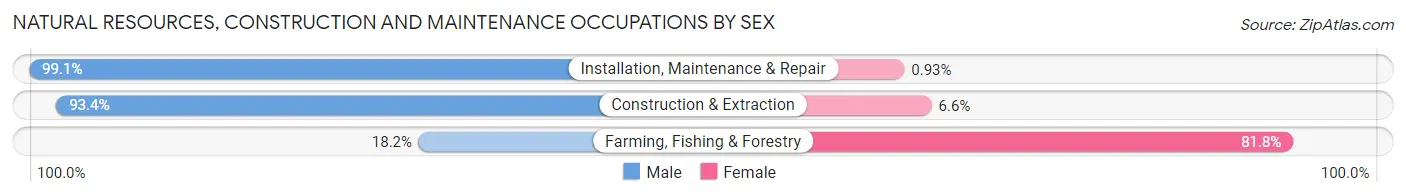
| Occupation | Male | Female |
| Farming, Fishing & Forestry | 24 (18.2%) | 108 (81.8%) |
| Construction & Extraction | 581 (93.4%) | 41 (6.6%) |
| Installation, Maintenance & Repair | 427 (99.1%) | 4 (0.9%) |
| Total (Category) | 1,032 (87.1%) | 153 (12.9%) |
| Total (Overall) | 12,245 (53.6%) | 10,586 (46.4%) |
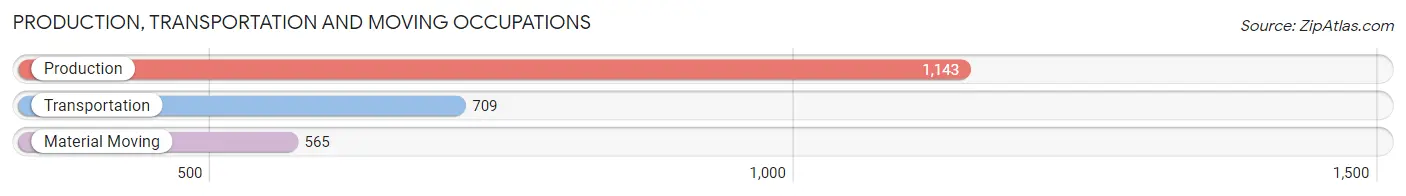
Production, Transportation and Moving Occupations
The most common Production, Transportation and Moving occupations in Bartlett are Production (1,143 | 5.0%), Transportation (709 | 3.1%), and Material Moving (565 | 2.5%).
Production, Transportation and Moving Occupations by Sex
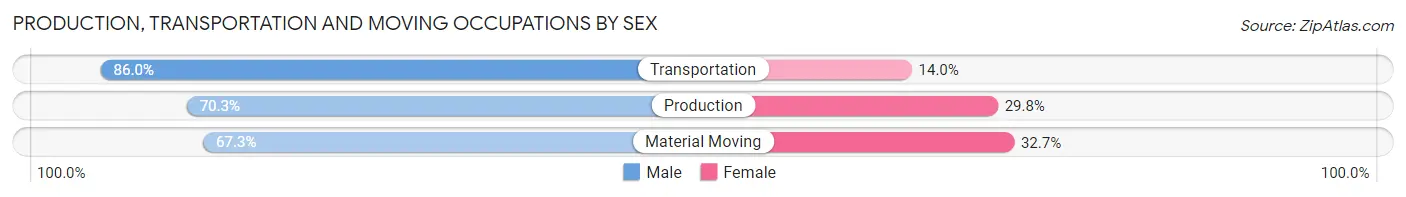
| Occupation | Male | Female |
| Production | 803 (70.3%) | 340 (29.7%) |
| Transportation | 610 (86.0%) | 99 (14.0%) |
| Material Moving | 380 (67.3%) | 185 (32.7%) |
| Total (Category) | 1,793 (74.2%) | 624 (25.8%) |
| Total (Overall) | 12,245 (53.6%) | 10,586 (46.4%) |
Employment Industries by Sex in Bartlett
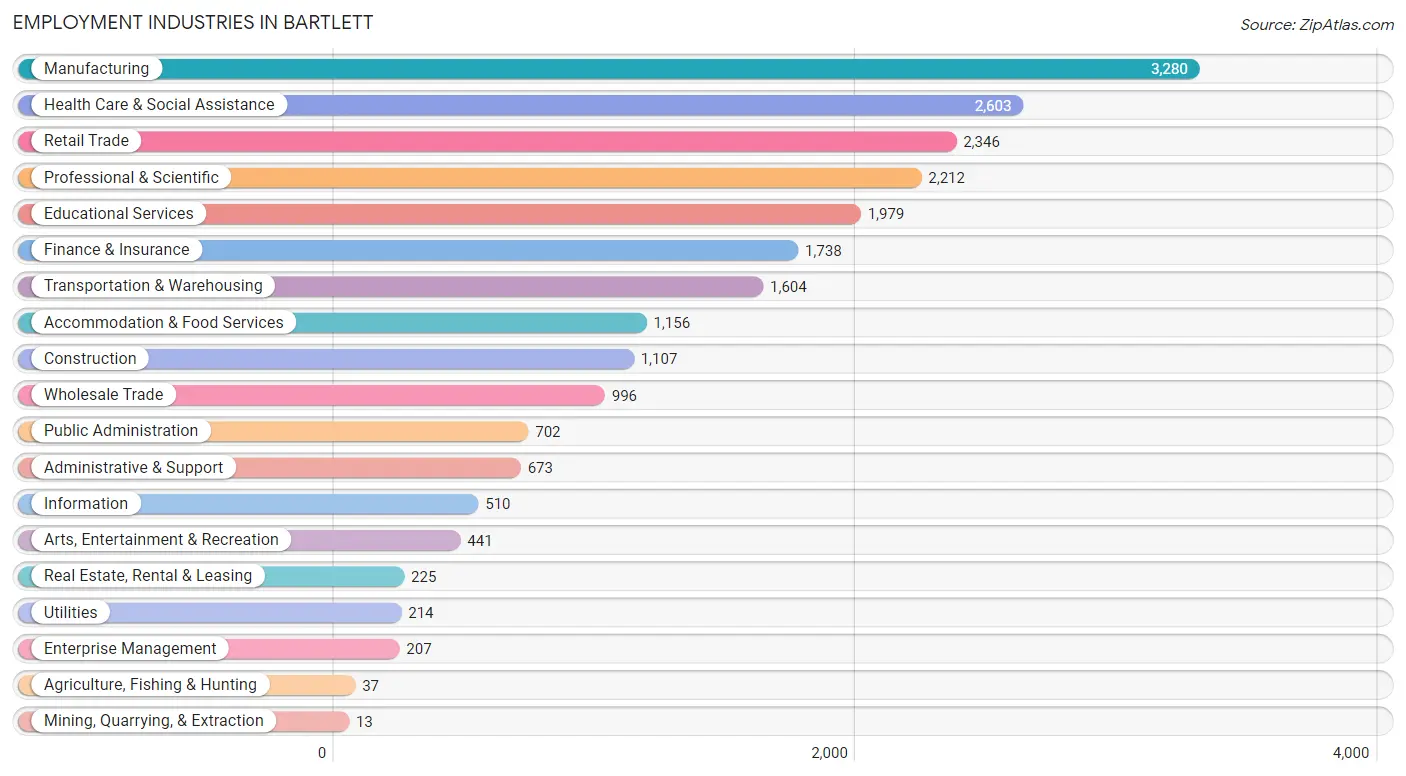
Employment Industries in Bartlett
The major employment industries in Bartlett include Manufacturing (3,280 | 14.4%), Health Care & Social Assistance (2,603 | 11.4%), Retail Trade (2,346 | 10.3%), Professional & Scientific (2,212 | 9.7%), and Educational Services (1,979 | 8.7%).
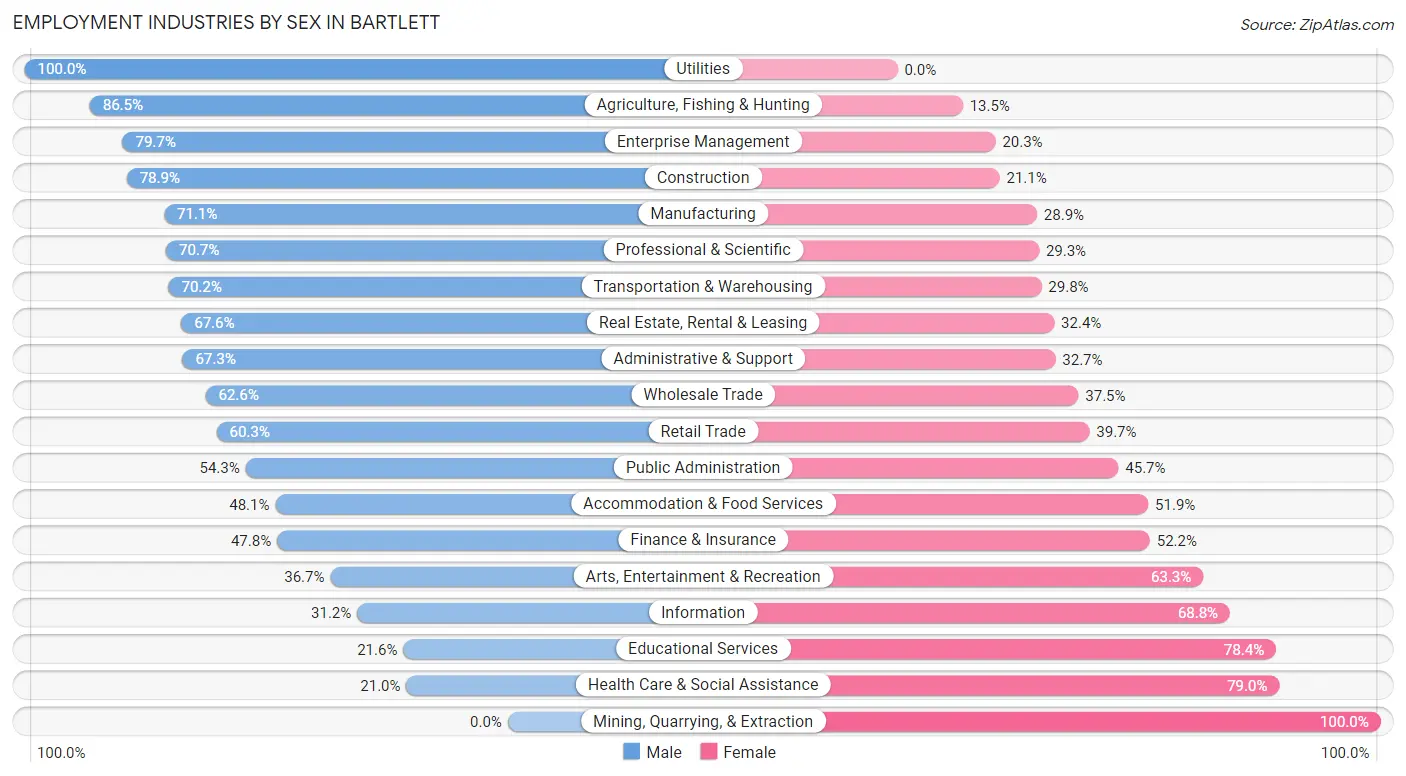
Employment Industries by Sex in Bartlett
The Bartlett industries that see more men than women are Utilities (100.0%), Agriculture, Fishing & Hunting (86.5%), and Enterprise Management (79.7%), whereas the industries that tend to have a higher number of women are Mining, Quarrying, & Extraction (100.0%), Health Care & Social Assistance (79.0%), and Educational Services (78.4%).
| Industry | Male | Female |
| Agriculture, Fishing & Hunting | 32 (86.5%) | 5 (13.5%) |
| Mining, Quarrying, & Extraction | 0 (0.0%) | 13 (100.0%) |
| Construction | 873 (78.9%) | 234 (21.1%) |
| Manufacturing | 2,333 (71.1%) | 947 (28.9%) |
| Wholesale Trade | 623 (62.5%) | 373 (37.4%) |
| Retail Trade | 1,414 (60.3%) | 932 (39.7%) |
| Transportation & Warehousing | 1,126 (70.2%) | 478 (29.8%) |
| Utilities | 214 (100.0%) | 0 (0.0%) |
| Information | 159 (31.2%) | 351 (68.8%) |
| Finance & Insurance | 830 (47.8%) | 908 (52.2%) |
| Real Estate, Rental & Leasing | 152 (67.6%) | 73 (32.4%) |
| Professional & Scientific | 1,564 (70.7%) | 648 (29.3%) |
| Enterprise Management | 165 (79.7%) | 42 (20.3%) |
| Administrative & Support | 453 (67.3%) | 220 (32.7%) |
| Educational Services | 428 (21.6%) | 1,551 (78.4%) |
| Health Care & Social Assistance | 546 (21.0%) | 2,057 (79.0%) |
| Arts, Entertainment & Recreation | 162 (36.7%) | 279 (63.3%) |
| Accommodation & Food Services | 556 (48.1%) | 600 (51.9%) |
| Public Administration | 381 (54.3%) | 321 (45.7%) |
| Total | 12,245 (53.6%) | 10,586 (46.4%) |
Education in Bartlett
School Enrollment in Bartlett
The most common levels of schooling among the 8,881 students in Bartlett are high school (2,187 | 24.6%), middle school (2,175 | 24.5%), and elementary school (1,671 | 18.8%).
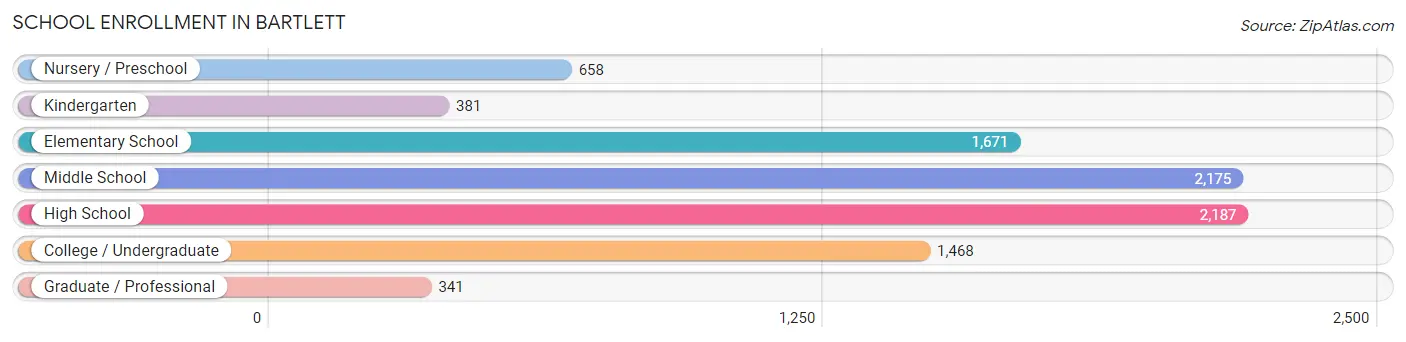
| School Level | # Students | % Students |
| Nursery / Preschool | 658 | 7.4% |
| Kindergarten | 381 | 4.3% |
| Elementary School | 1,671 | 18.8% |
| Middle School | 2,175 | 24.5% |
| High School | 2,187 | 24.6% |
| College / Undergraduate | 1,468 | 16.5% |
| Graduate / Professional | 341 | 3.8% |
| Total | 8,881 | 100.0% |
School Enrollment by Age by Funding Source in Bartlett
Out of a total of 8,881 students who are enrolled in schools in Bartlett, 1,536 (17.3%) attend a private institution, while the remaining 7,345 (82.7%) are enrolled in public schools. The age group of 25 to 34 year olds has the highest likelihood of being enrolled in private schools, with 105 (37.1% in the age bracket) enrolled. Conversely, the age group of 10 to 14 year olds has the lowest likelihood of being enrolled in a private school, with 2,349 (92.6% in the age bracket) attending a public institution.
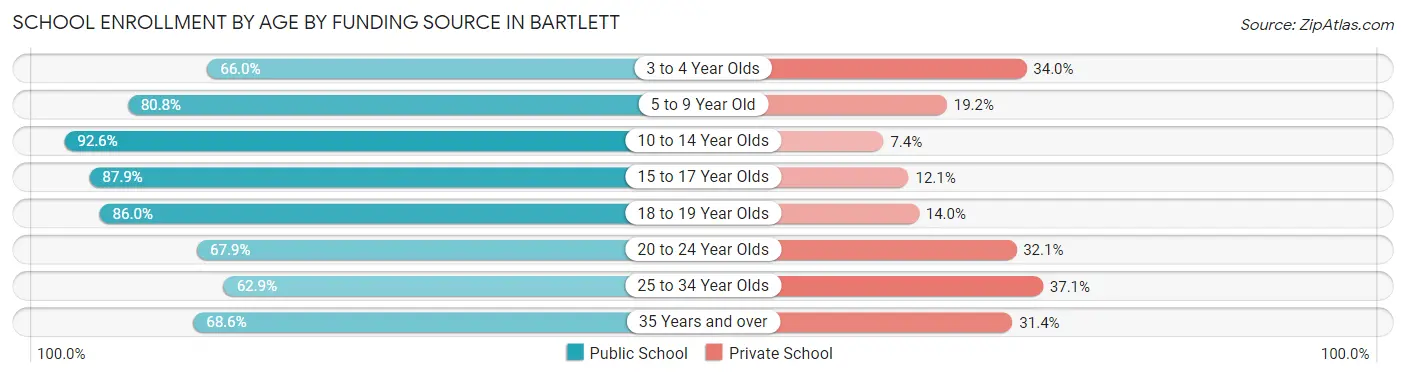
| Age Bracket | Public School | Private School |
| 3 to 4 Year Olds | 285 (66.0%) | 147 (34.0%) |
| 5 to 9 Year Old | 1,770 (80.8%) | 421 (19.2%) |
| 10 to 14 Year Olds | 2,349 (92.6%) | 188 (7.4%) |
| 15 to 17 Year Olds | 1,427 (87.9%) | 196 (12.1%) |
| 18 to 19 Year Olds | 504 (86.0%) | 82 (14.0%) |
| 20 to 24 Year Olds | 644 (67.9%) | 305 (32.1%) |
| 25 to 34 Year Olds | 178 (62.9%) | 105 (37.1%) |
| 35 Years and over | 192 (68.6%) | 88 (31.4%) |
| Total | 7,345 (82.7%) | 1,536 (17.3%) |
Educational Attainment by Field of Study in Bartlett
Business (4,354 | 29.9%), science & technology (1,502 | 10.3%), computers & mathematics (1,460 | 10.0%), education (1,370 | 9.4%), and engineering (1,127 | 7.7%) are the most common fields of study among 14,566 individuals in Bartlett who have obtained a bachelor's degree or higher.
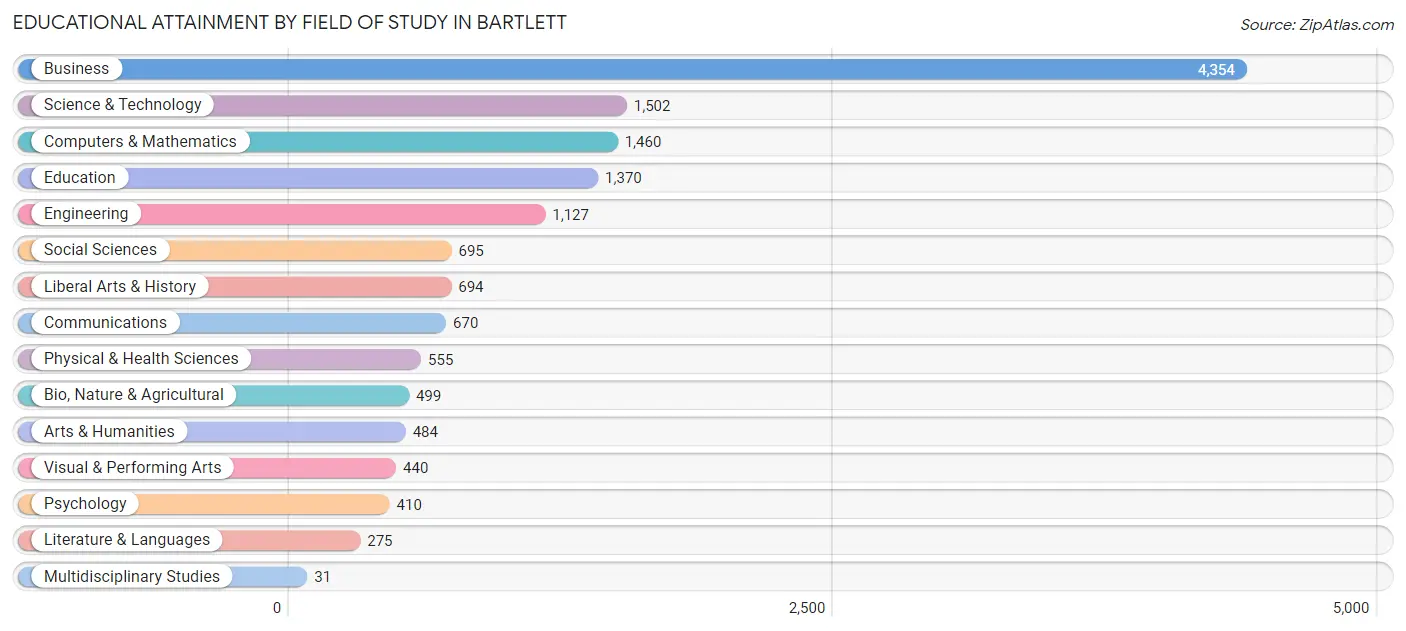
| Field of Study | # Graduates | % Graduates |
| Computers & Mathematics | 1,460 | 10.0% |
| Bio, Nature & Agricultural | 499 | 3.4% |
| Physical & Health Sciences | 555 | 3.8% |
| Psychology | 410 | 2.8% |
| Social Sciences | 695 | 4.8% |
| Engineering | 1,127 | 7.7% |
| Multidisciplinary Studies | 31 | 0.2% |
| Science & Technology | 1,502 | 10.3% |
| Business | 4,354 | 29.9% |
| Education | 1,370 | 9.4% |
| Literature & Languages | 275 | 1.9% |
| Liberal Arts & History | 694 | 4.8% |
| Visual & Performing Arts | 440 | 3.0% |
| Communications | 670 | 4.6% |
| Arts & Humanities | 484 | 3.3% |
| Total | 14,566 | 100.0% |
Transportation & Commute in Bartlett
Vehicle Availability by Sex in Bartlett
The most prevalent vehicle ownership categories in Bartlett are males with 2 vehicles (6,231, accounting for 51.4%) and females with 2 vehicles (5,265, making up 60.1%).
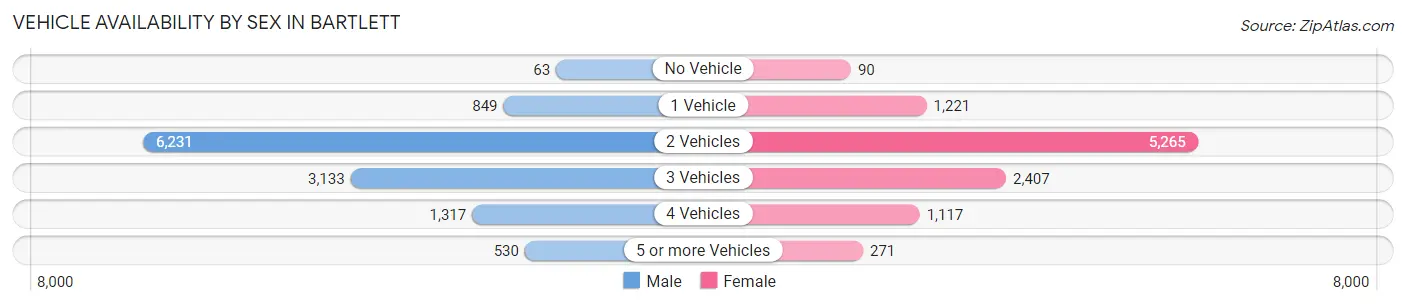
| Vehicles Available | Male | Female |
| No Vehicle | 63 (0.5%) | 90 (0.9%) |
| 1 Vehicle | 849 (7.0%) | 1,221 (11.8%) |
| 2 Vehicles | 6,231 (51.4%) | 5,265 (50.8%) |
| 3 Vehicles | 3,133 (25.8%) | 2,407 (23.2%) |
| 4 Vehicles | 1,317 (10.9%) | 1,117 (10.8%) |
| 5 or more Vehicles | 530 (4.4%) | 271 (2.6%) |
| Total | 12,123 (100.0%) | 10,371 (100.0%) |
Commute Time in Bartlett
The most frequently occuring commute durations in Bartlett are 30 to 34 minutes (3,081 commuters, 16.5%), 20 to 24 minutes (2,724 commuters, 14.6%), and 15 to 19 minutes (2,511 commuters, 13.4%).
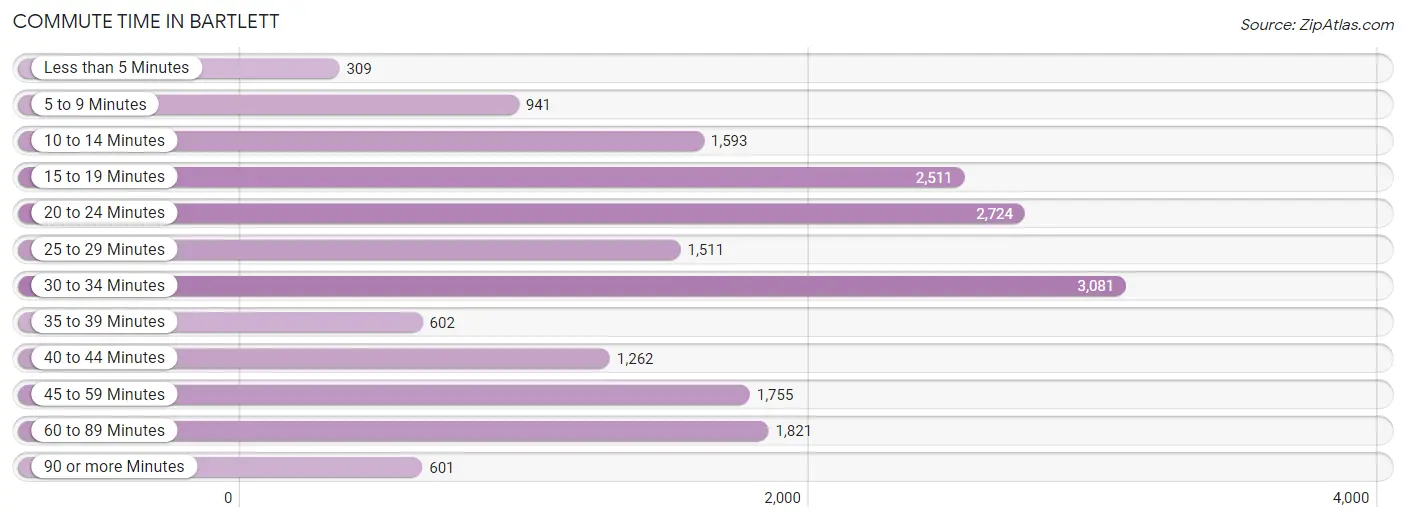
| Commute Time | # Commuters | % Commuters |
| Less than 5 Minutes | 309 | 1.7% |
| 5 to 9 Minutes | 941 | 5.0% |
| 10 to 14 Minutes | 1,593 | 8.5% |
| 15 to 19 Minutes | 2,511 | 13.4% |
| 20 to 24 Minutes | 2,724 | 14.6% |
| 25 to 29 Minutes | 1,511 | 8.1% |
| 30 to 34 Minutes | 3,081 | 16.5% |
| 35 to 39 Minutes | 602 | 3.2% |
| 40 to 44 Minutes | 1,262 | 6.7% |
| 45 to 59 Minutes | 1,755 | 9.4% |
| 60 to 89 Minutes | 1,821 | 9.7% |
| 90 or more Minutes | 601 | 3.2% |
Commute Time by Sex in Bartlett
The most common commute times in Bartlett are 30 to 34 minutes (1,523 commuters, 15.1%) for males and 30 to 34 minutes (1,558 commuters, 18.0%) for females.
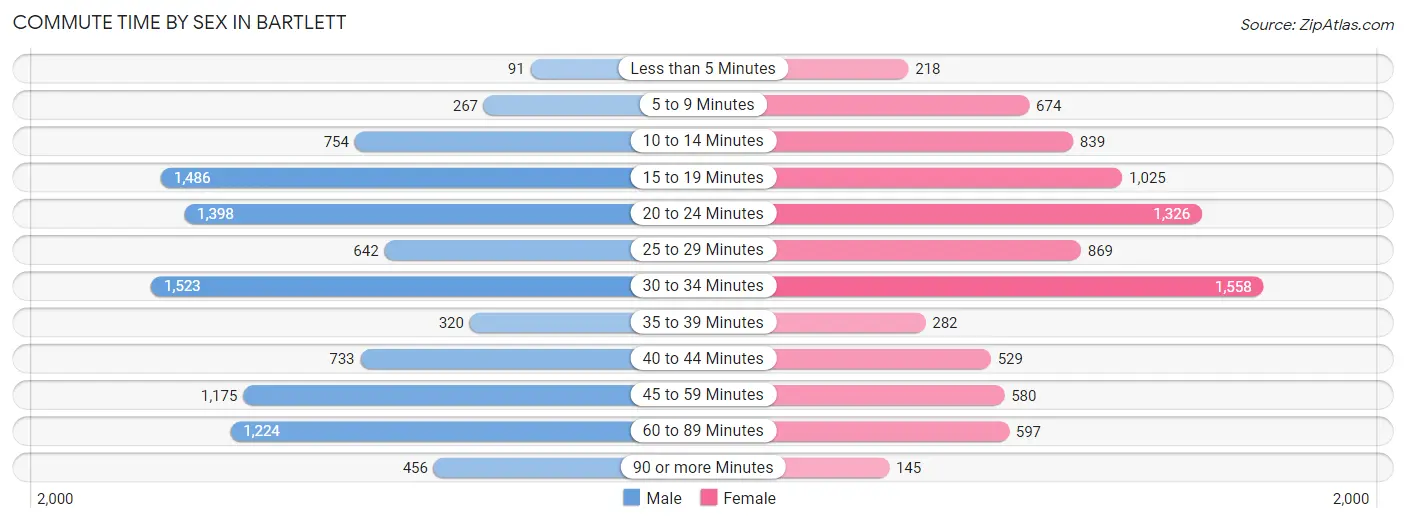
| Commute Time | Male | Female |
| Less than 5 Minutes | 91 (0.9%) | 218 (2.5%) |
| 5 to 9 Minutes | 267 (2.6%) | 674 (7.8%) |
| 10 to 14 Minutes | 754 (7.5%) | 839 (9.7%) |
| 15 to 19 Minutes | 1,486 (14.8%) | 1,025 (11.9%) |
| 20 to 24 Minutes | 1,398 (13.9%) | 1,326 (15.3%) |
| 25 to 29 Minutes | 642 (6.4%) | 869 (10.1%) |
| 30 to 34 Minutes | 1,523 (15.1%) | 1,558 (18.0%) |
| 35 to 39 Minutes | 320 (3.2%) | 282 (3.3%) |
| 40 to 44 Minutes | 733 (7.3%) | 529 (6.1%) |
| 45 to 59 Minutes | 1,175 (11.7%) | 580 (6.7%) |
| 60 to 89 Minutes | 1,224 (12.2%) | 597 (6.9%) |
| 90 or more Minutes | 456 (4.5%) | 145 (1.7%) |
Time of Departure to Work by Sex in Bartlett
The most frequent times of departure to work in Bartlett are 7:00 AM to 7:29 AM (1,669, 16.6%) for males and 7:00 AM to 7:29 AM (1,420, 16.4%) for females.
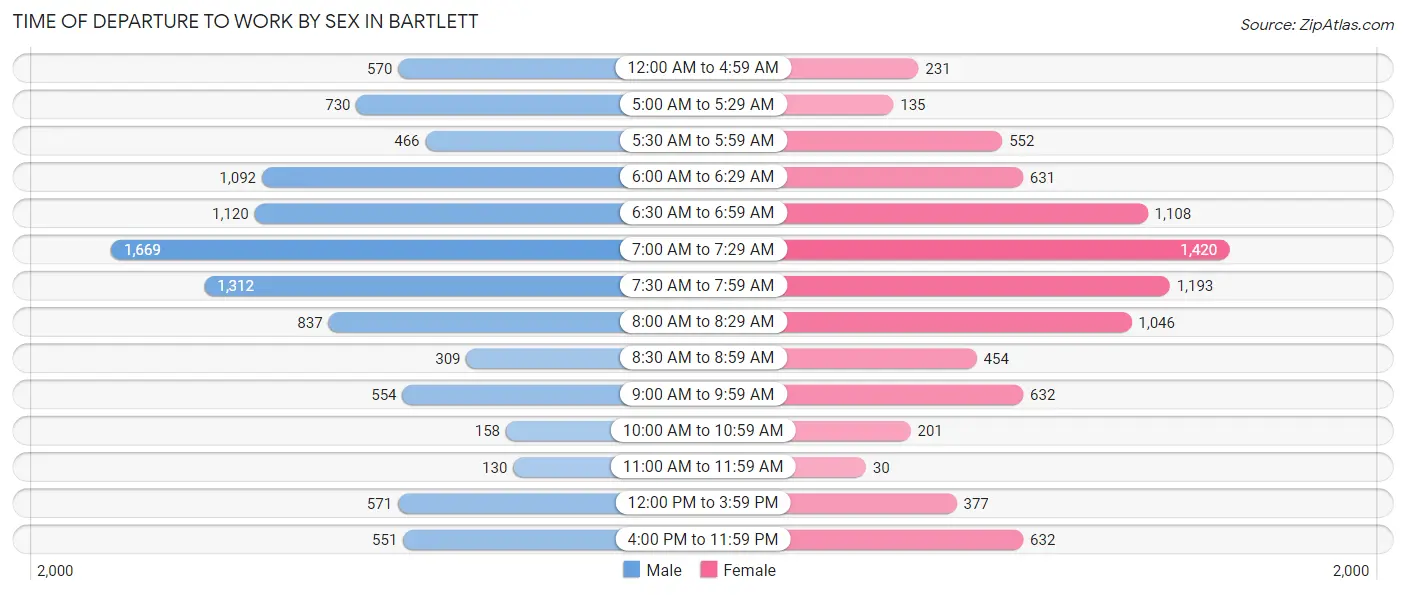
| Time of Departure | Male | Female |
| 12:00 AM to 4:59 AM | 570 (5.7%) | 231 (2.7%) |
| 5:00 AM to 5:29 AM | 730 (7.2%) | 135 (1.6%) |
| 5:30 AM to 5:59 AM | 466 (4.6%) | 552 (6.4%) |
| 6:00 AM to 6:29 AM | 1,092 (10.8%) | 631 (7.3%) |
| 6:30 AM to 6:59 AM | 1,120 (11.1%) | 1,108 (12.8%) |
| 7:00 AM to 7:29 AM | 1,669 (16.6%) | 1,420 (16.4%) |
| 7:30 AM to 7:59 AM | 1,312 (13.0%) | 1,193 (13.8%) |
| 8:00 AM to 8:29 AM | 837 (8.3%) | 1,046 (12.1%) |
| 8:30 AM to 8:59 AM | 309 (3.1%) | 454 (5.2%) |
| 9:00 AM to 9:59 AM | 554 (5.5%) | 632 (7.3%) |
| 10:00 AM to 10:59 AM | 158 (1.6%) | 201 (2.3%) |
| 11:00 AM to 11:59 AM | 130 (1.3%) | 30 (0.4%) |
| 12:00 PM to 3:59 PM | 571 (5.7%) | 377 (4.4%) |
| 4:00 PM to 11:59 PM | 551 (5.5%) | 632 (7.3%) |
| Total | 10,069 (100.0%) | 8,642 (100.0%) |
Housing Occupancy in Bartlett
Occupancy by Ownership in Bartlett
Of the total 14,341 dwellings in Bartlett, owner-occupied units account for 12,391 (86.4%), while renter-occupied units make up 1,950 (13.6%).
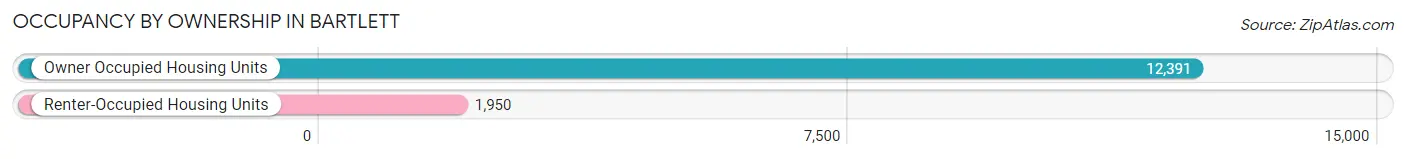
| Occupancy | # Housing Units | % Housing Units |
| Owner Occupied Housing Units | 12,391 | 86.4% |
| Renter-Occupied Housing Units | 1,950 | 13.6% |
| Total Occupied Housing Units | 14,341 | 100.0% |
Occupancy by Household Size in Bartlett
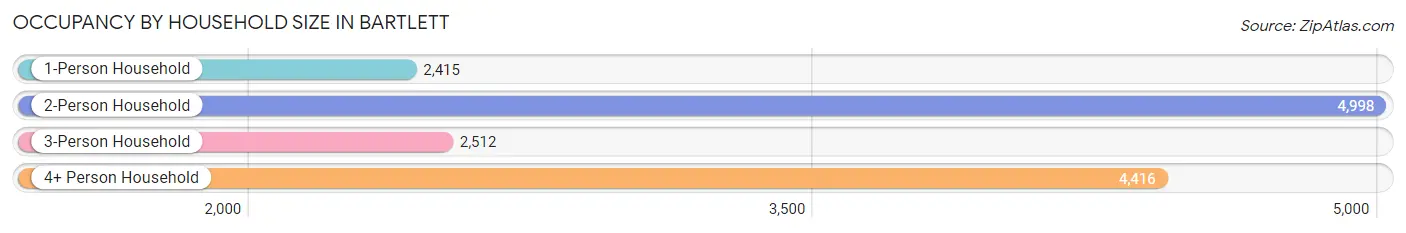
| Household Size | # Housing Units | % Housing Units |
| 1-Person Household | 2,415 | 16.8% |
| 2-Person Household | 4,998 | 34.8% |
| 3-Person Household | 2,512 | 17.5% |
| 4+ Person Household | 4,416 | 30.8% |
| Total Housing Units | 14,341 | 100.0% |
Occupancy by Ownership by Household Size in Bartlett
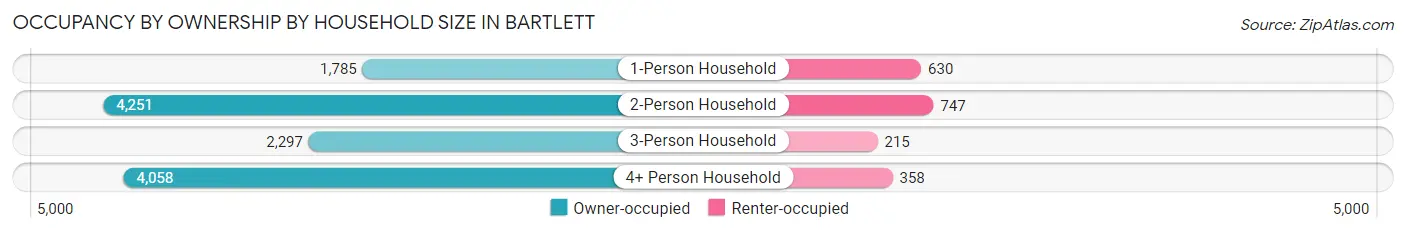
| Household Size | Owner-occupied | Renter-occupied |
| 1-Person Household | 1,785 (73.9%) | 630 (26.1%) |
| 2-Person Household | 4,251 (85.1%) | 747 (14.9%) |
| 3-Person Household | 2,297 (91.4%) | 215 (8.6%) |
| 4+ Person Household | 4,058 (91.9%) | 358 (8.1%) |
| Total Housing Units | 12,391 (86.4%) | 1,950 (13.6%) |
Occupancy by Educational Attainment in Bartlett
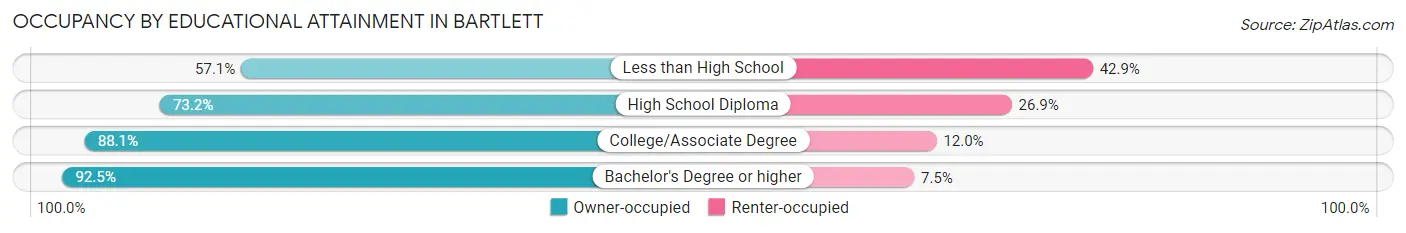
| Household Size | Owner-occupied | Renter-occupied |
| Less than High School | 335 (57.1%) | 252 (42.9%) |
| High School Diploma | 1,847 (73.2%) | 678 (26.9%) |
| College/Associate Degree | 3,491 (88.0%) | 474 (11.9%) |
| Bachelor's Degree or higher | 6,718 (92.5%) | 546 (7.5%) |
Occupancy by Age of Householder in Bartlett
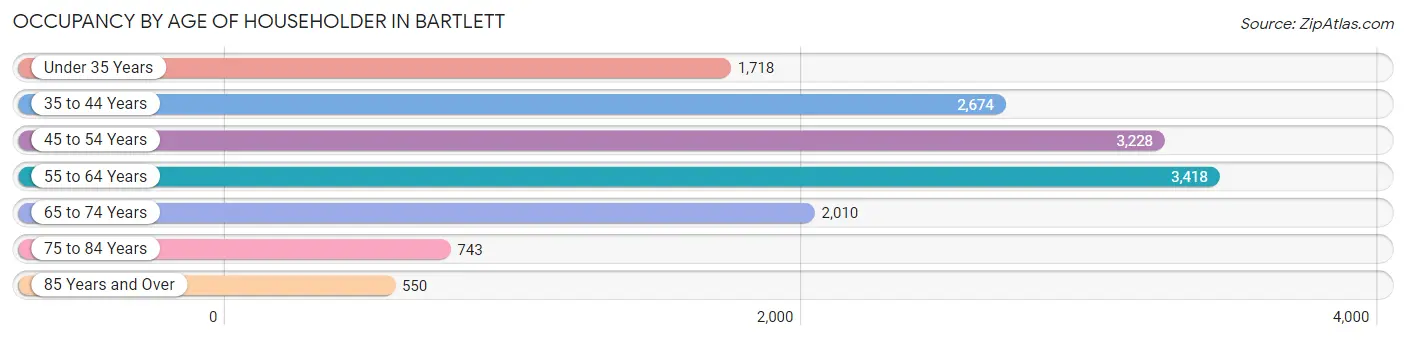
| Age Bracket | # Households | % Households |
| Under 35 Years | 1,718 | 12.0% |
| 35 to 44 Years | 2,674 | 18.6% |
| 45 to 54 Years | 3,228 | 22.5% |
| 55 to 64 Years | 3,418 | 23.8% |
| 65 to 74 Years | 2,010 | 14.0% |
| 75 to 84 Years | 743 | 5.2% |
| 85 Years and Over | 550 | 3.8% |
| Total | 14,341 | 100.0% |
Housing Finances in Bartlett
Median Income by Occupancy in Bartlett
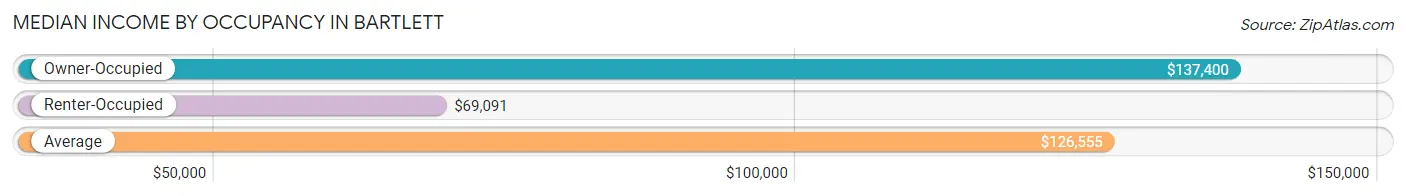
| Occupancy Type | # Households | Median Income |
| Owner-Occupied | 12,391 (86.4%) | $137,400 |
| Renter-Occupied | 1,950 (13.6%) | $69,091 |
| Average | 14,341 (100.0%) | $126,555 |
Occupancy by Householder Income Bracket in Bartlett
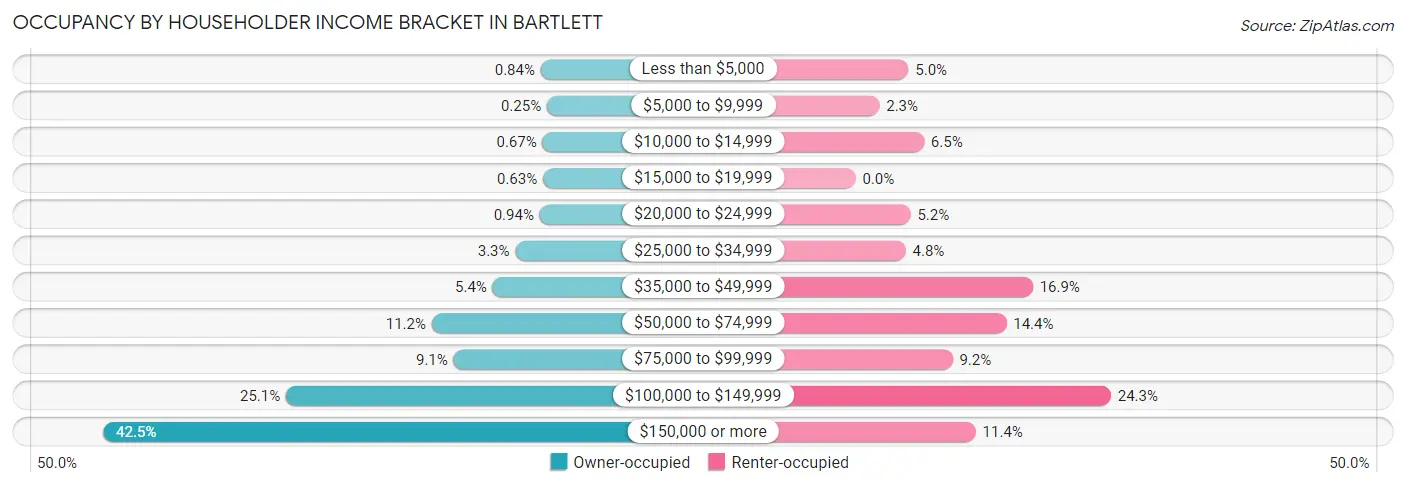
| Income Bracket | Owner-occupied | Renter-occupied |
| Less than $5,000 | 104 (0.8%) | 98 (5.0%) |
| $5,000 to $9,999 | 31 (0.3%) | 44 (2.3%) |
| $10,000 to $14,999 | 83 (0.7%) | 127 (6.5%) |
| $15,000 to $19,999 | 78 (0.6%) | 0 (0.0%) |
| $20,000 to $24,999 | 117 (0.9%) | 102 (5.2%) |
| $25,000 to $34,999 | 404 (3.3%) | 93 (4.8%) |
| $35,000 to $49,999 | 672 (5.4%) | 329 (16.9%) |
| $50,000 to $74,999 | 1,390 (11.2%) | 280 (14.4%) |
| $75,000 to $99,999 | 1,133 (9.1%) | 180 (9.2%) |
| $100,000 to $149,999 | 3,110 (25.1%) | 474 (24.3%) |
| $150,000 or more | 5,269 (42.5%) | 223 (11.4%) |
| Total | 12,391 (100.0%) | 1,950 (100.0%) |
Monthly Housing Cost Tiers in Bartlett
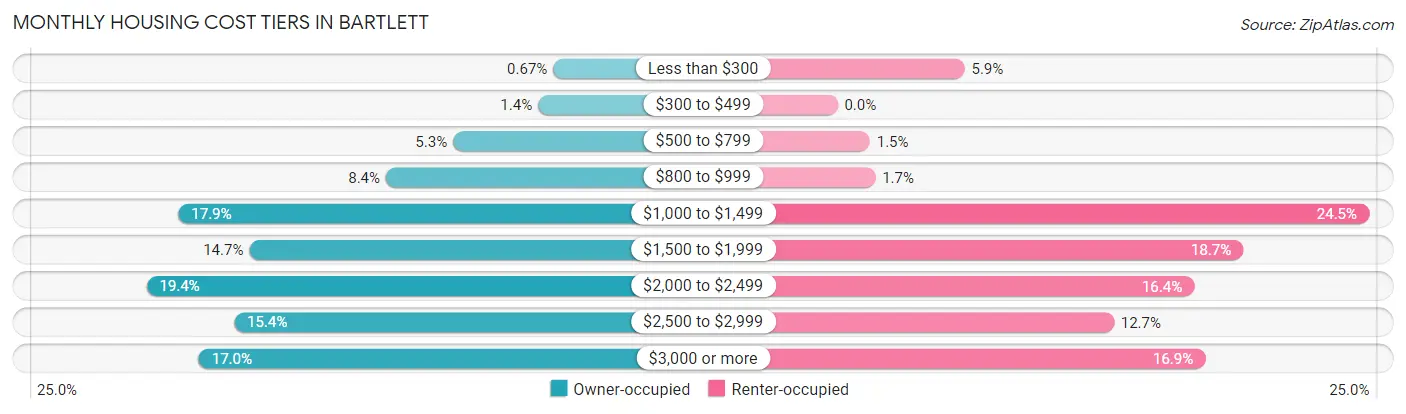
| Monthly Cost | Owner-occupied | Renter-occupied |
| Less than $300 | 83 (0.7%) | 114 (5.9%) |
| $300 to $499 | 170 (1.4%) | 0 (0.0%) |
| $500 to $799 | 654 (5.3%) | 29 (1.5%) |
| $800 to $999 | 1,037 (8.4%) | 34 (1.7%) |
| $1,000 to $1,499 | 2,221 (17.9%) | 477 (24.5%) |
| $1,500 to $1,999 | 1,816 (14.7%) | 364 (18.7%) |
| $2,000 to $2,499 | 2,403 (19.4%) | 320 (16.4%) |
| $2,500 to $2,999 | 1,903 (15.4%) | 248 (12.7%) |
| $3,000 or more | 2,104 (17.0%) | 330 (16.9%) |
| Total | 12,391 (100.0%) | 1,950 (100.0%) |
Physical Housing Characteristics in Bartlett
Housing Structures in Bartlett
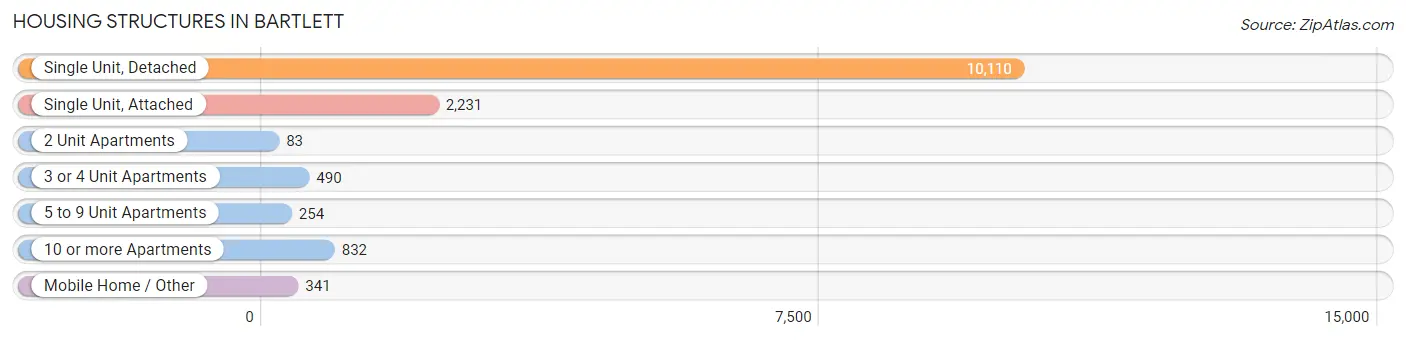
| Structure Type | # Housing Units | % Housing Units |
| Single Unit, Detached | 10,110 | 70.5% |
| Single Unit, Attached | 2,231 | 15.6% |
| 2 Unit Apartments | 83 | 0.6% |
| 3 or 4 Unit Apartments | 490 | 3.4% |
| 5 to 9 Unit Apartments | 254 | 1.8% |
| 10 or more Apartments | 832 | 5.8% |
| Mobile Home / Other | 341 | 2.4% |
| Total | 14,341 | 100.0% |
Housing Structures by Occupancy in Bartlett
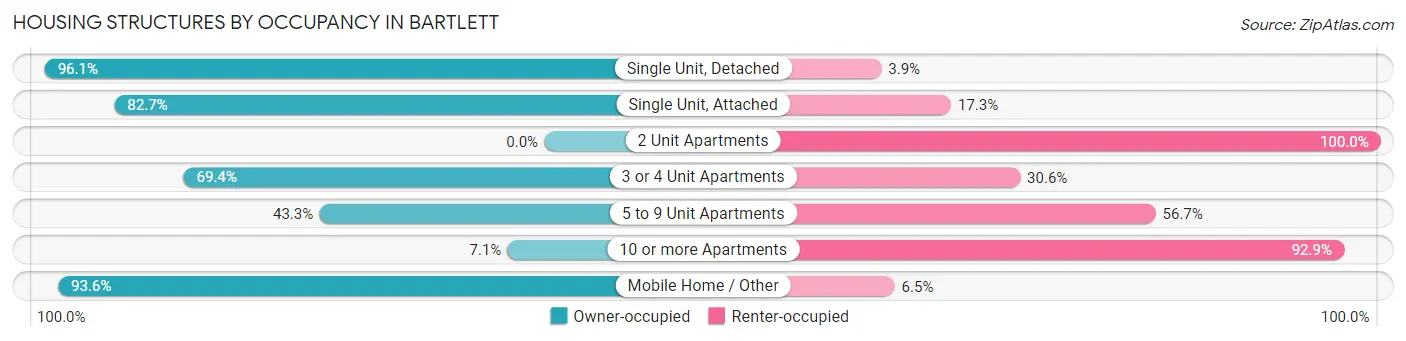
| Structure Type | Owner-occupied | Renter-occupied |
| Single Unit, Detached | 9,718 (96.1%) | 392 (3.9%) |
| Single Unit, Attached | 1,845 (82.7%) | 386 (17.3%) |
| 2 Unit Apartments | 0 (0.0%) | 83 (100.0%) |
| 3 or 4 Unit Apartments | 340 (69.4%) | 150 (30.6%) |
| 5 to 9 Unit Apartments | 110 (43.3%) | 144 (56.7%) |
| 10 or more Apartments | 59 (7.1%) | 773 (92.9%) |
| Mobile Home / Other | 319 (93.5%) | 22 (6.5%) |
| Total | 12,391 (86.4%) | 1,950 (13.6%) |
Housing Structures by Number of Rooms in Bartlett
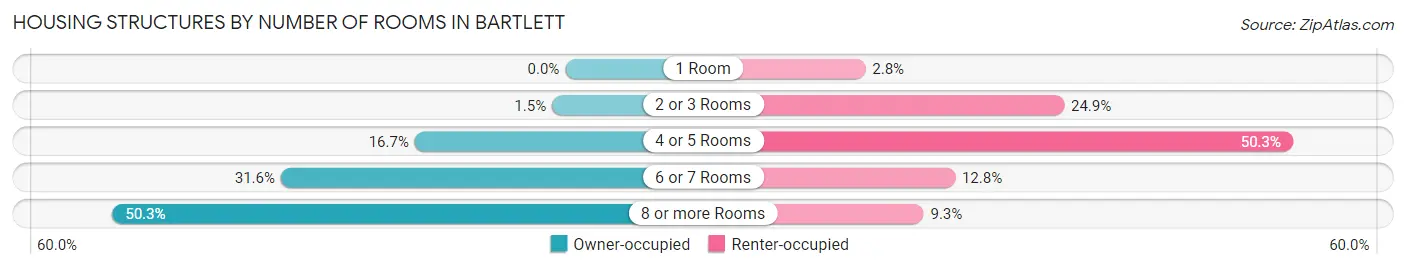
| Number of Rooms | Owner-occupied | Renter-occupied |
| 1 Room | 0 (0.0%) | 55 (2.8%) |
| 2 or 3 Rooms | 182 (1.5%) | 485 (24.9%) |
| 4 or 5 Rooms | 2,069 (16.7%) | 980 (50.3%) |
| 6 or 7 Rooms | 3,912 (31.6%) | 249 (12.8%) |
| 8 or more Rooms | 6,228 (50.3%) | 181 (9.3%) |
| Total | 12,391 (100.0%) | 1,950 (100.0%) |
Housing Structure by Heating Type in Bartlett
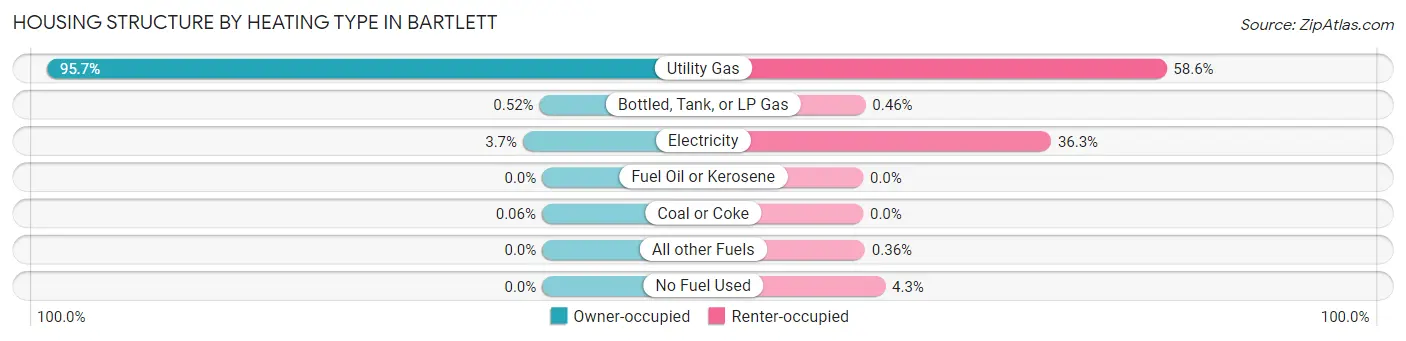
| Heating Type | Owner-occupied | Renter-occupied |
| Utility Gas | 11,859 (95.7%) | 1,143 (58.6%) |
| Bottled, Tank, or LP Gas | 65 (0.5%) | 9 (0.5%) |
| Electricity | 460 (3.7%) | 708 (36.3%) |
| Fuel Oil or Kerosene | 0 (0.0%) | 0 (0.0%) |
| Coal or Coke | 7 (0.1%) | 0 (0.0%) |
| All other Fuels | 0 (0.0%) | 7 (0.4%) |
| No Fuel Used | 0 (0.0%) | 83 (4.3%) |
| Total | 12,391 (100.0%) | 1,950 (100.0%) |
Household Vehicle Usage in Bartlett
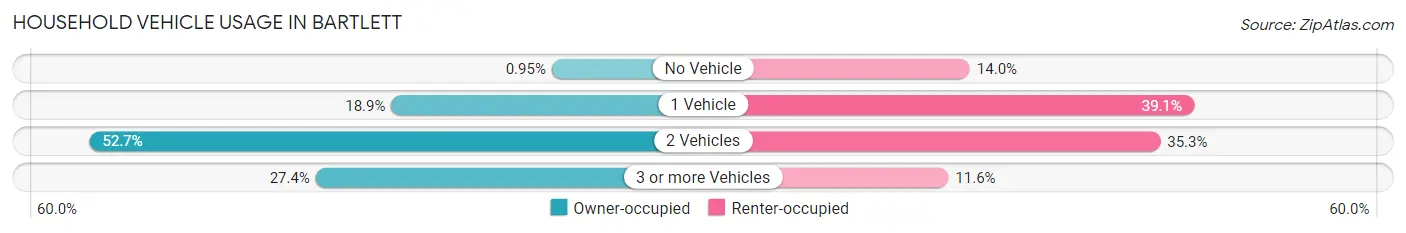
| Vehicles per Household | Owner-occupied | Renter-occupied |
| No Vehicle | 118 (0.9%) | 273 (14.0%) |
| 1 Vehicle | 2,344 (18.9%) | 762 (39.1%) |
| 2 Vehicles | 6,535 (52.7%) | 689 (35.3%) |
| 3 or more Vehicles | 3,394 (27.4%) | 226 (11.6%) |
| Total | 12,391 (100.0%) | 1,950 (100.0%) |
Real Estate & Mortgages in Bartlett
Real Estate and Mortgage Overview in Bartlett
| Characteristic | Without Mortgage | With Mortgage |
| Housing Units | 3,566 | 8,825 |
| Median Property Value | $311,600 | $343,000 |
| Median Household Income | $109,430 | $4,236 |
| Monthly Housing Costs | $1,015 | $2,104 |
| Real Estate Taxes | $8,428 | $108 |
Property Value by Mortgage Status in Bartlett
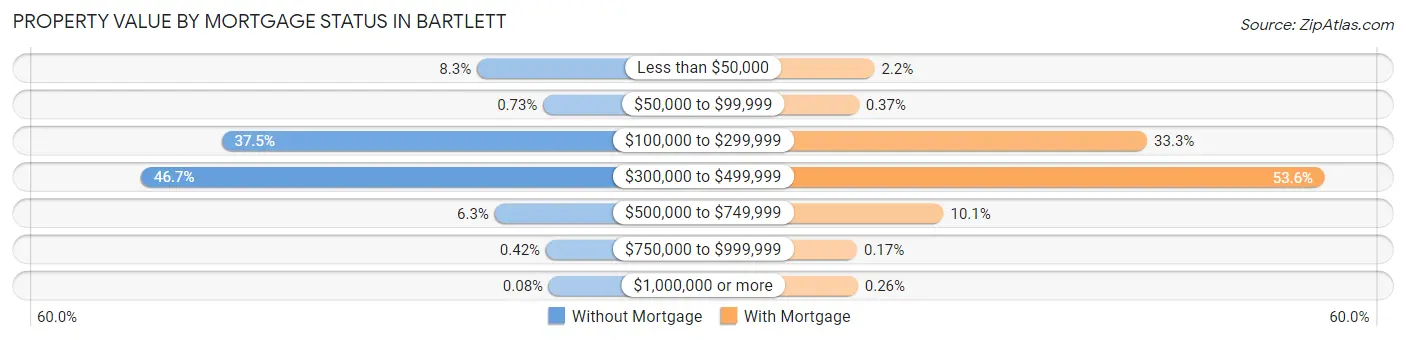
| Property Value | Without Mortgage | With Mortgage |
| Less than $50,000 | 296 (8.3%) | 191 (2.2%) |
| $50,000 to $99,999 | 26 (0.7%) | 33 (0.4%) |
| $100,000 to $299,999 | 1,337 (37.5%) | 2,941 (33.3%) |
| $300,000 to $499,999 | 1,665 (46.7%) | 4,734 (53.6%) |
| $500,000 to $749,999 | 224 (6.3%) | 888 (10.1%) |
| $750,000 to $999,999 | 15 (0.4%) | 15 (0.2%) |
| $1,000,000 or more | 3 (0.1%) | 23 (0.3%) |
| Total | 3,566 (100.0%) | 8,825 (100.0%) |
Household Income by Mortgage Status in Bartlett
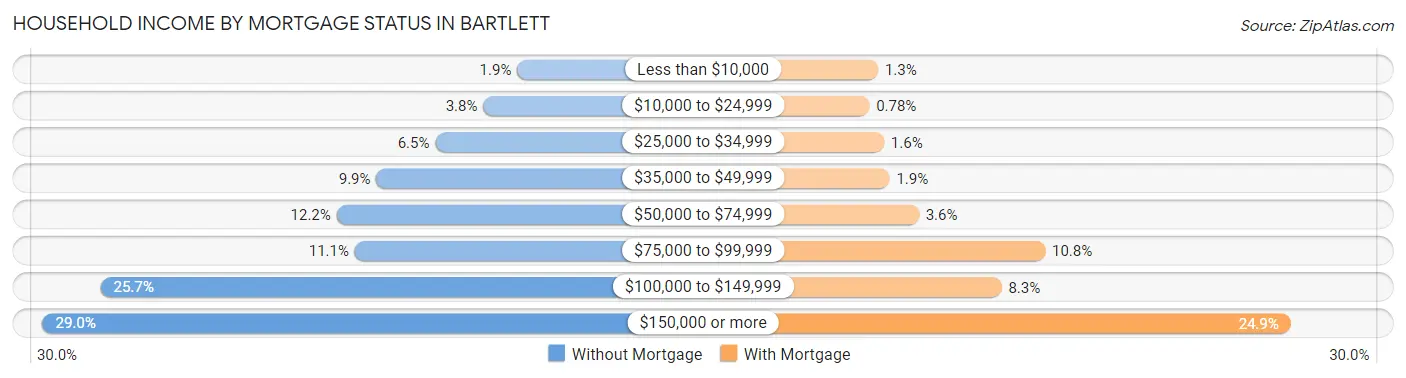
| Household Income | Without Mortgage | With Mortgage |
| Less than $10,000 | 66 (1.8%) | 113 (1.3%) |
| $10,000 to $24,999 | 135 (3.8%) | 69 (0.8%) |
| $25,000 to $34,999 | 233 (6.5%) | 143 (1.6%) |
| $35,000 to $49,999 | 353 (9.9%) | 171 (1.9%) |
| $50,000 to $74,999 | 434 (12.2%) | 319 (3.6%) |
| $75,000 to $99,999 | 397 (11.1%) | 956 (10.8%) |
| $100,000 to $149,999 | 915 (25.7%) | 736 (8.3%) |
| $150,000 or more | 1,033 (29.0%) | 2,195 (24.9%) |
| Total | 3,566 (100.0%) | 8,825 (100.0%) |
Property Value to Household Income Ratio in Bartlett
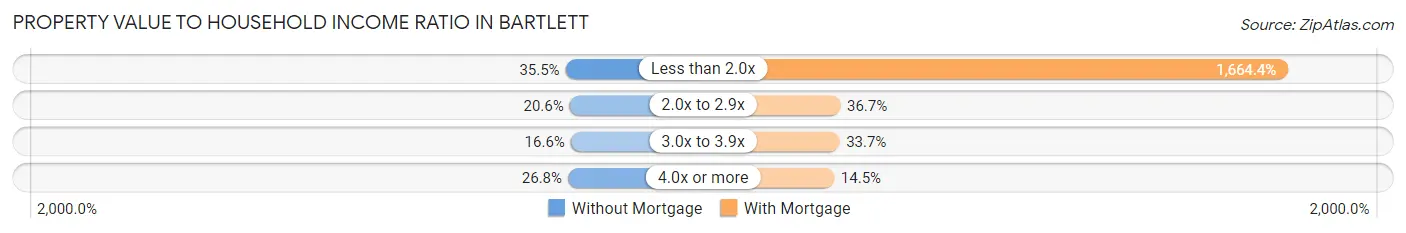
| Value-to-Income Ratio | Without Mortgage | With Mortgage |
| Less than 2.0x | 1,266 (35.5%) | 146,887 (1,664.4%) |
| 2.0x to 2.9x | 733 (20.6%) | 3,235 (36.7%) |
| 3.0x to 3.9x | 590 (16.6%) | 2,973 (33.7%) |
| 4.0x or more | 956 (26.8%) | 1,275 (14.4%) |
| Total | 3,566 (100.0%) | 8,825 (100.0%) |
Real Estate Taxes by Mortgage Status in Bartlett
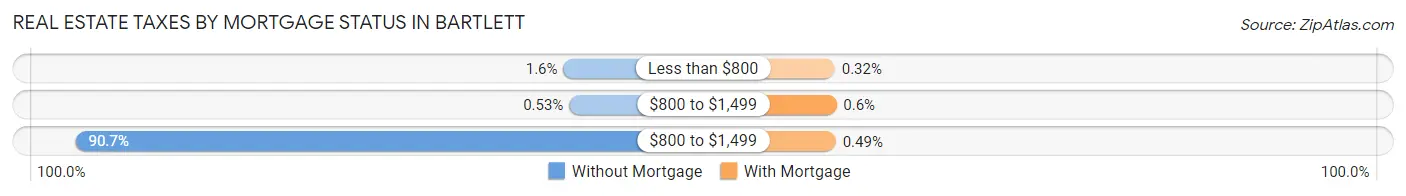
| Property Taxes | Without Mortgage | With Mortgage |
| Less than $800 | 57 (1.6%) | 28 (0.3%) |
| $800 to $1,499 | 19 (0.5%) | 53 (0.6%) |
| $800 to $1,499 | 3,234 (90.7%) | 43 (0.5%) |
| Total | 3,566 (100.0%) | 8,825 (100.0%) |
Health & Disability in Bartlett
Health Insurance Coverage by Age in Bartlett
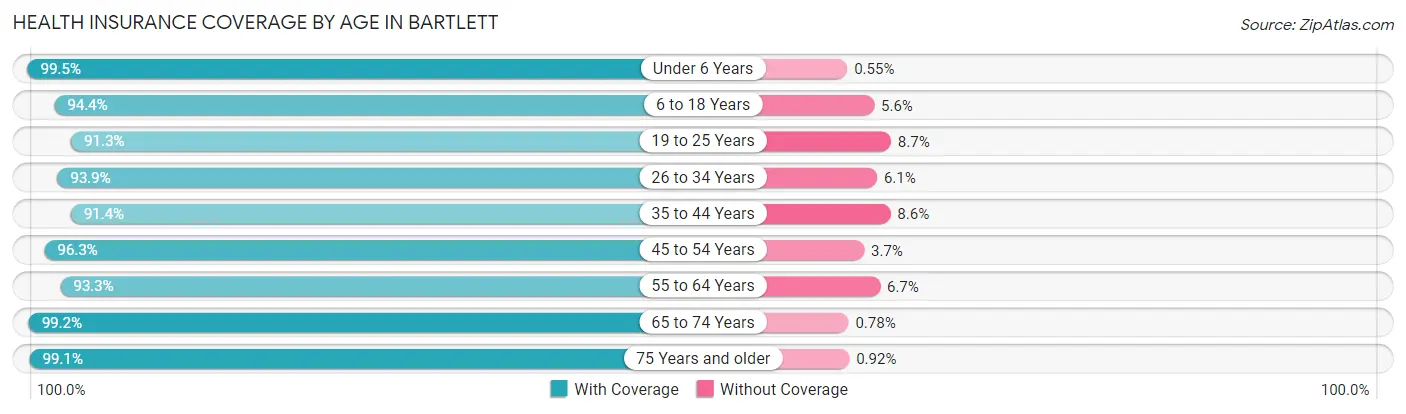
| Age Bracket | With Coverage | Without Coverage |
| Under 6 Years | 3,254 (99.5%) | 18 (0.5%) |
| 6 to 18 Years | 6,183 (94.4%) | 364 (5.6%) |
| 19 to 25 Years | 2,618 (91.3%) | 249 (8.7%) |
| 26 to 34 Years | 3,907 (93.9%) | 254 (6.1%) |
| 35 to 44 Years | 4,950 (91.4%) | 466 (8.6%) |
| 45 to 54 Years | 5,473 (96.3%) | 210 (3.7%) |
| 55 to 64 Years | 6,170 (93.3%) | 440 (6.7%) |
| 65 to 74 Years | 3,958 (99.2%) | 31 (0.8%) |
| 75 Years and older | 2,145 (99.1%) | 20 (0.9%) |
| Total | 38,658 (95.0%) | 2,052 (5.0%) |
Health Insurance Coverage by Citizenship Status in Bartlett
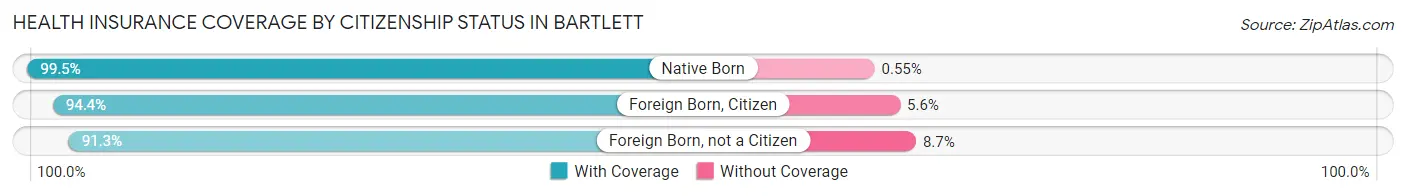
| Citizenship Status | With Coverage | Without Coverage |
| Native Born | 3,254 (99.5%) | 18 (0.5%) |
| Foreign Born, Citizen | 6,183 (94.4%) | 364 (5.6%) |
| Foreign Born, not a Citizen | 2,618 (91.3%) | 249 (8.7%) |
Health Insurance Coverage by Household Income in Bartlett
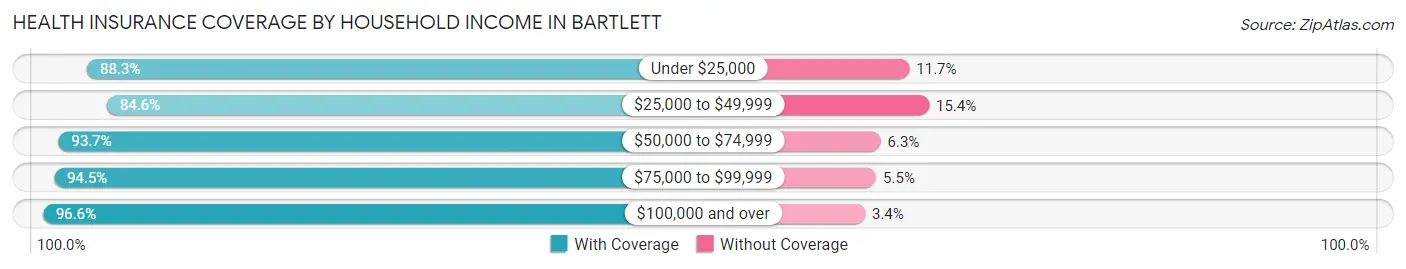
| Household Income | With Coverage | Without Coverage |
| Under $25,000 | 1,055 (88.3%) | 140 (11.7%) |
| $25,000 to $49,999 | 2,705 (84.6%) | 493 (15.4%) |
| $50,000 to $74,999 | 3,670 (93.7%) | 248 (6.3%) |
| $75,000 to $99,999 | 3,109 (94.5%) | 181 (5.5%) |
| $100,000 and over | 28,116 (96.6%) | 990 (3.4%) |
Public vs Private Health Insurance Coverage by Age in Bartlett
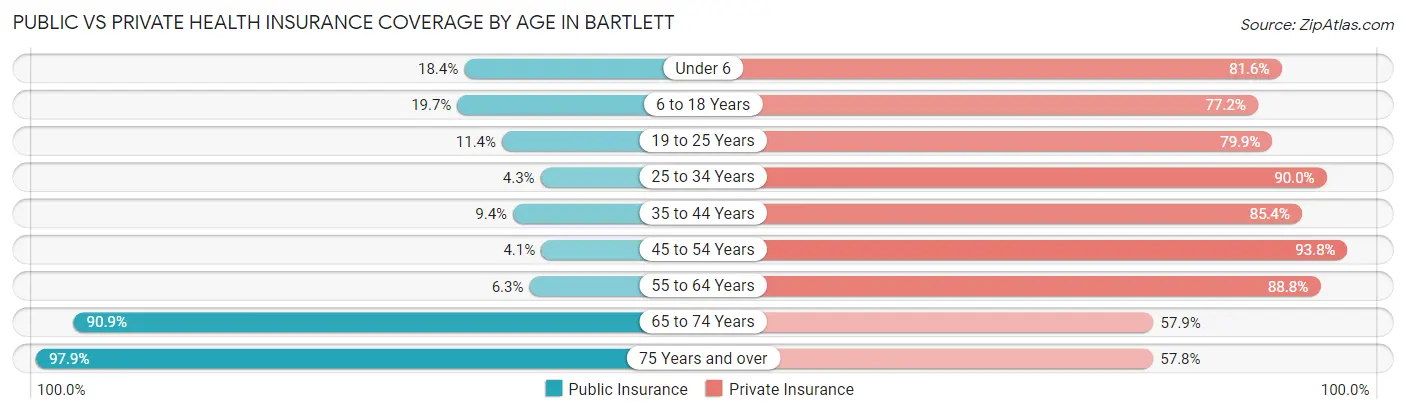
| Age Bracket | Public Insurance | Private Insurance |
| Under 6 | 603 (18.4%) | 2,669 (81.6%) |
| 6 to 18 Years | 1,290 (19.7%) | 5,053 (77.2%) |
| 19 to 25 Years | 327 (11.4%) | 2,291 (79.9%) |
| 25 to 34 Years | 177 (4.3%) | 3,743 (89.9%) |
| 35 to 44 Years | 507 (9.4%) | 4,624 (85.4%) |
| 45 to 54 Years | 235 (4.1%) | 5,333 (93.8%) |
| 55 to 64 Years | 418 (6.3%) | 5,868 (88.8%) |
| 65 to 74 Years | 3,626 (90.9%) | 2,309 (57.9%) |
| 75 Years and over | 2,119 (97.9%) | 1,252 (57.8%) |
| Total | 9,302 (22.9%) | 33,142 (81.4%) |
Disability Status by Sex by Age in Bartlett
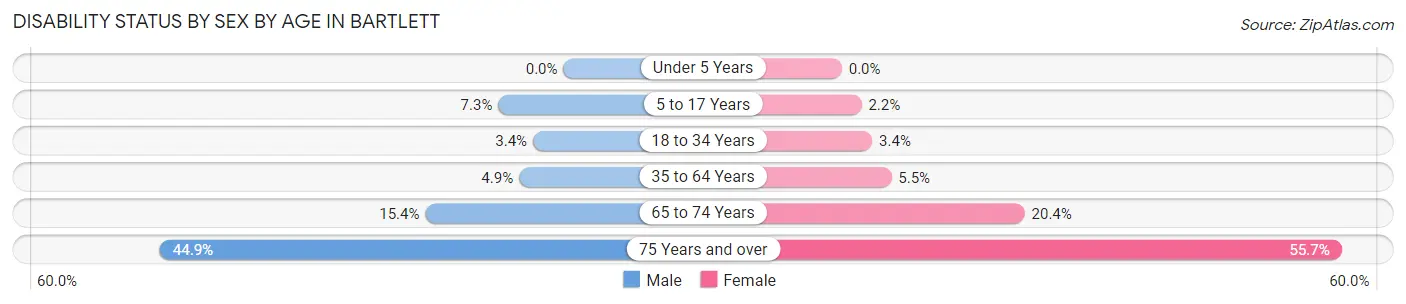
| Age Bracket | Male | Female |
| Under 5 Years | 0 (0.0%) | 0 (0.0%) |
| 5 to 17 Years | 261 (7.2%) | 68 (2.2%) |
| 18 to 34 Years | 130 (3.4%) | 122 (3.4%) |
| 35 to 64 Years | 442 (4.9%) | 484 (5.5%) |
| 65 to 74 Years | 293 (15.4%) | 424 (20.4%) |
| 75 Years and over | 452 (44.9%) | 645 (55.6%) |
Disability Class by Sex by Age in Bartlett
Disability Class: Hearing Difficulty
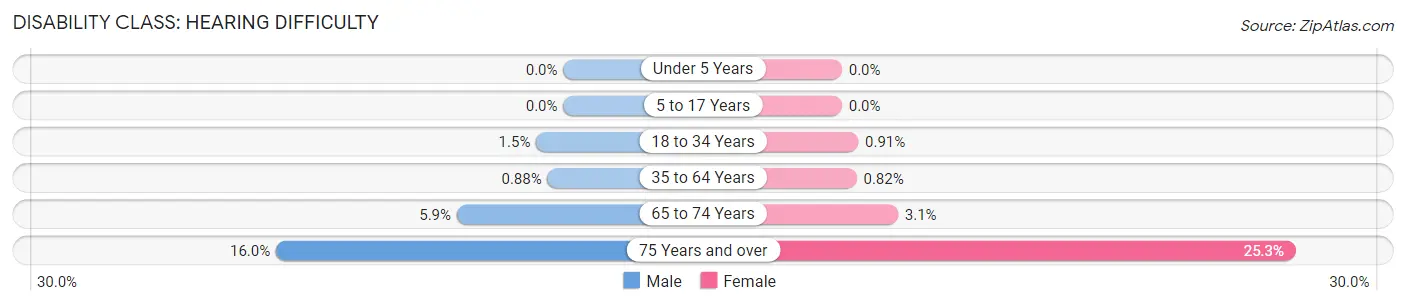
| Age Bracket | Male | Female |
| Under 5 Years | 0 (0.0%) | 0 (0.0%) |
| 5 to 17 Years | 0 (0.0%) | 0 (0.0%) |
| 18 to 34 Years | 58 (1.5%) | 33 (0.9%) |
| 35 to 64 Years | 79 (0.9%) | 72 (0.8%) |
| 65 to 74 Years | 113 (5.9%) | 65 (3.1%) |
| 75 Years and over | 161 (16.0%) | 293 (25.3%) |
Disability Class: Vision Difficulty
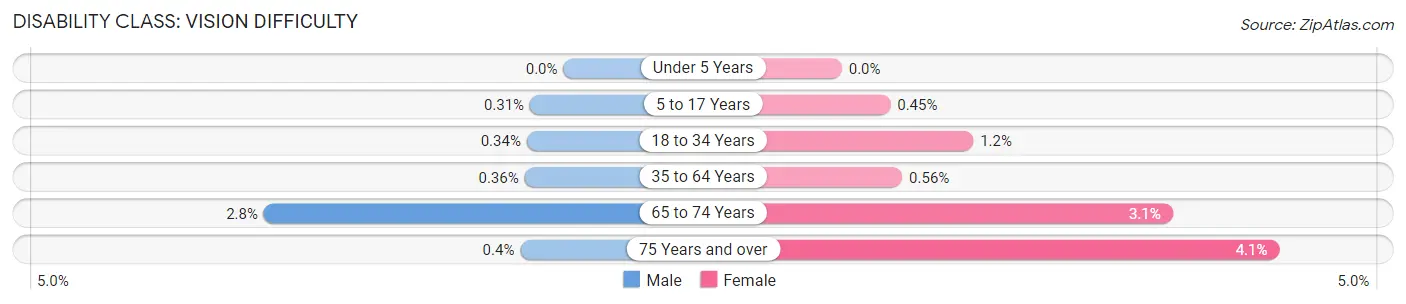
| Age Bracket | Male | Female |
| Under 5 Years | 0 (0.0%) | 0 (0.0%) |
| 5 to 17 Years | 11 (0.3%) | 14 (0.4%) |
| 18 to 34 Years | 13 (0.3%) | 44 (1.2%) |
| 35 to 64 Years | 32 (0.4%) | 49 (0.6%) |
| 65 to 74 Years | 53 (2.8%) | 64 (3.1%) |
| 75 Years and over | 4 (0.4%) | 47 (4.1%) |
Disability Class: Cognitive Difficulty
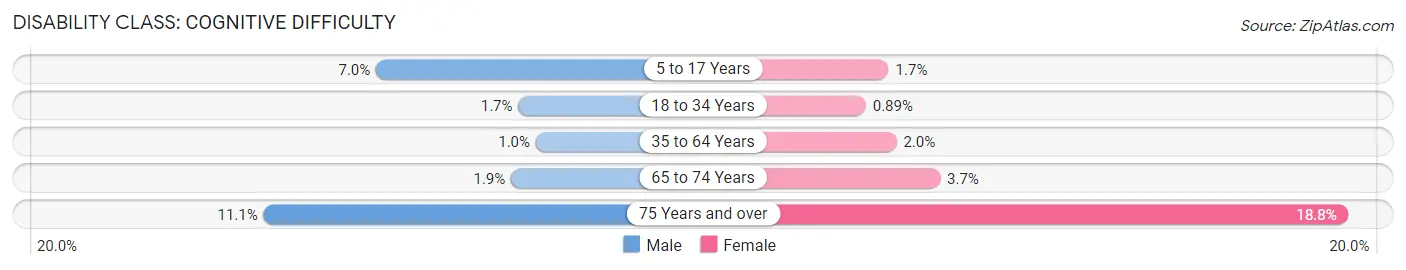
| Age Bracket | Male | Female |
| 5 to 17 Years | 250 (7.0%) | 54 (1.7%) |
| 18 to 34 Years | 64 (1.7%) | 32 (0.9%) |
| 35 to 64 Years | 91 (1.0%) | 178 (2.0%) |
| 65 to 74 Years | 37 (1.9%) | 76 (3.6%) |
| 75 Years and over | 112 (11.1%) | 218 (18.8%) |
Disability Class: Ambulatory Difficulty
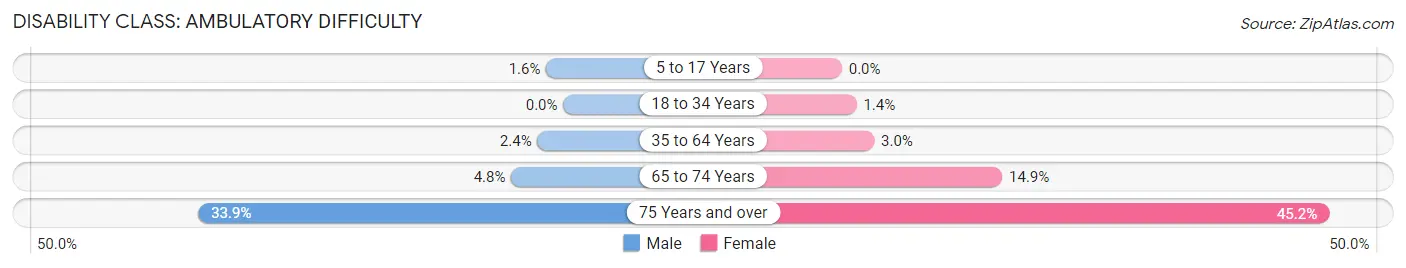
| Age Bracket | Male | Female |
| 5 to 17 Years | 57 (1.6%) | 0 (0.0%) |
| 18 to 34 Years | 0 (0.0%) | 49 (1.4%) |
| 35 to 64 Years | 215 (2.4%) | 263 (3.0%) |
| 65 to 74 Years | 92 (4.8%) | 310 (14.9%) |
| 75 Years and over | 341 (33.9%) | 524 (45.2%) |
Disability Class: Self-Care Difficulty
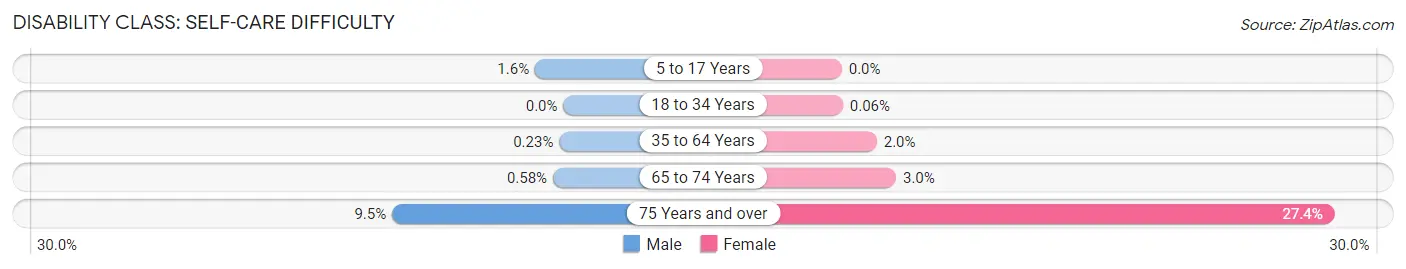
| Age Bracket | Male | Female |
| 5 to 17 Years | 57 (1.6%) | 0 (0.0%) |
| 18 to 34 Years | 0 (0.0%) | 2 (0.1%) |
| 35 to 64 Years | 21 (0.2%) | 171 (1.9%) |
| 65 to 74 Years | 11 (0.6%) | 63 (3.0%) |
| 75 Years and over | 96 (9.5%) | 318 (27.4%) |
Technology Access in Bartlett
Computing Device Access in Bartlett
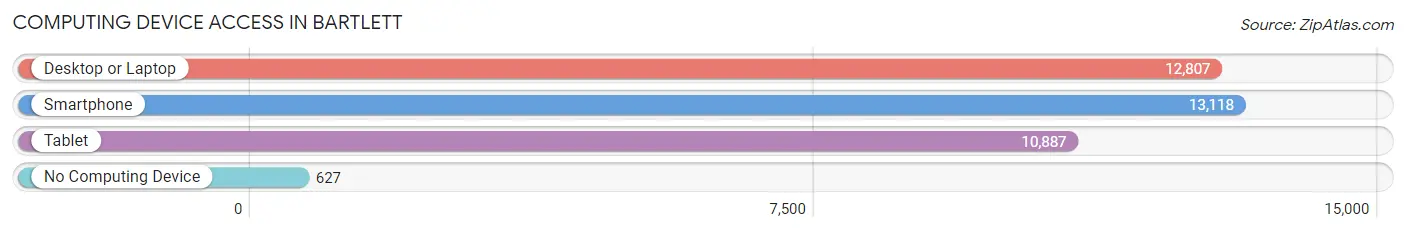
| Device Type | # Households | % Households |
| Desktop or Laptop | 12,807 | 89.3% |
| Smartphone | 13,118 | 91.5% |
| Tablet | 10,887 | 75.9% |
| No Computing Device | 627 | 4.4% |
| Total | 14,341 | 100.0% |
Internet Access in Bartlett
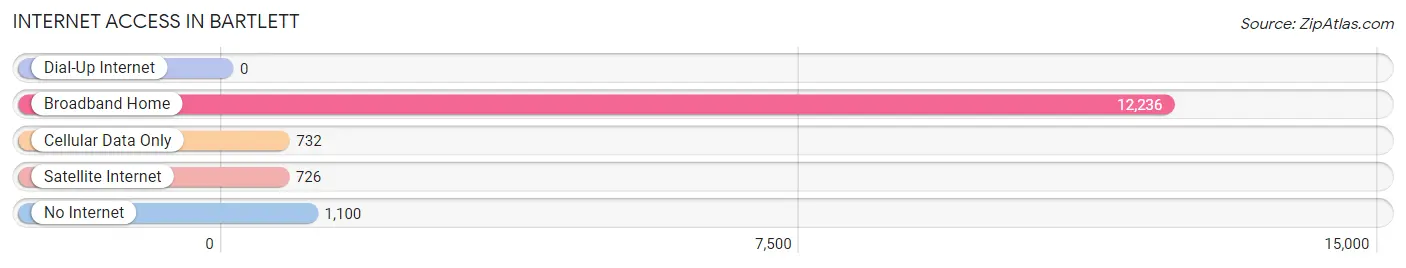
| Internet Type | # Households | % Households |
| Dial-Up Internet | 0 | 0.0% |
| Broadband Home | 12,236 | 85.3% |
| Cellular Data Only | 732 | 5.1% |
| Satellite Internet | 726 | 5.1% |
| No Internet | 1,100 | 7.7% |
| Total | 14,341 | 100.0% |
Bartlett Summary
Bartlett, Illinois is a village located in Cook and DuPage counties in the U.S. state of Illinois. It is a suburb of Chicago, located approximately 25 miles northwest of the city. As of the 2010 census, the village had a population of 41,208.
History
The area that is now Bartlett was first settled in the 1830s by Luther Bartlett, a farmer from New Hampshire. He purchased land in the area and built a log cabin, which he used as a trading post. The area was known as Bartlett’s Station, and the name was eventually changed to Bartlett. The village was officially incorporated in 1891.
In the early 20th century, Bartlett was a rural farming community. However, the village began to experience rapid growth in the 1950s and 1960s, as the Chicago metropolitan area expanded. By the 1990s, Bartlett had become a suburban community, with many of its residents commuting to Chicago for work.
Geography
Bartlett is located in northeastern Illinois, in Cook and DuPage counties. It is situated on the Fox River, approximately 25 miles northwest of Chicago. The village has a total area of 10.3 square miles, of which 10.2 square miles is land and 0.1 square miles is water.
Climate
Bartlett has a humid continental climate, with cold, snowy winters and hot, humid summers. The average annual temperature is 48°F, and the average annual precipitation is 37 inches.
Demographics
As of the 2010 census, there were 41,208 people, 14,919 households, and 11,717 families residing in the village. The population density was 4,033.3 people per square mile. The racial makeup of the village was 81.2% White, 8.2% African American, 0.3% Native American, 5.3% Asian, 0.1% Pacific Islander, 2.7% from other races, and 2.3% from two or more races. Hispanic or Latino of any race were 8.7% of the population.
The median income for a household in the village was $77,837, and the median income for a family was $90,945. The per capita income for the village was $33,945. About 2.7% of families and 3.7% of the population were below the poverty line, including 4.2% of those under age 18 and 3.2% of those age 65 or over.
Economy
Bartlett’s economy is largely based on retail and services. The village is home to several large shopping centers, including the Bartlett Town Center and the Bartlett Commons Shopping Center. The village is also home to several industrial and manufacturing businesses, including the Bartlett Manufacturing Company and the Bartlett Tool and Die Company. The village is also home to several corporate headquarters, including the headquarters of the American Automobile Association (AAA).
Common Questions
What is Per Capita Income in Bartlett?
Per Capita income in Bartlett is $50,193.
What is the Median Family Income in Bartlett?
Median Family Income in Bartlett is $139,429.
What is the Median Household income in Bartlett?
Median Household Income in Bartlett is $126,555.
What is Income or Wage Gap in Bartlett?
Income or Wage Gap in Bartlett is 34.0%.
Women in Bartlett earn 66.0 cents for every dollar earned by a man.
What is Family Income Deficit in Bartlett?
Family Income Deficit in Bartlett is $12,588.
Families that are below poverty line in Bartlett earn $12,588 less on average than the poverty threshold level.
What is Inequality or Gini Index in Bartlett?
Inequality or Gini Index in Bartlett is 0.36.
What is the Total Population of Bartlett?
Total Population of Bartlett is 40,829.
What is the Total Male Population of Bartlett?
Total Male Population of Bartlett is 20,557.
What is the Total Female Population of Bartlett?
Total Female Population of Bartlett is 20,272.
What is the Ratio of Males per 100 Females in Bartlett?
There are 101.41 Males per 100 Females in Bartlett.
What is the Ratio of Females per 100 Males in Bartlett?
There are 98.61 Females per 100 Males in Bartlett.
What is the Median Population Age in Bartlett?
Median Population Age in Bartlett is 41.1 Years.
What is the Average Family Size in Bartlett
Average Family Size in Bartlett is 3.2 People.
What is the Average Household Size in Bartlett
Average Household Size in Bartlett is 2.8 People.
How Large is the Labor Force in Bartlett?
There are 23,357 People in the Labor Forcein in Bartlett.
What is the Percentage of People in the Labor Force in Bartlett?
71.8% of People are in the Labor Force in Bartlett.
What is the Unemployment Rate in Bartlett?
Unemployment Rate in Bartlett is 2.2%.