Yardville, NJ Map & Demographics
Yardville Map
Yardville Overview
$49,970
PER CAPITA INCOME
$127,426
AVG FAMILY INCOME
$107,661
AVG HOUSEHOLD INCOME
27.1%
WAGE / INCOME GAP [ % ]
72.9¢/ $1
WAGE / INCOME GAP [ $ ]
0.39
INEQUALITY / GINI INDEX
6,405
TOTAL POPULATION
3,142
MALE POPULATION
3,263
FEMALE POPULATION
96.29
MALES / 100 FEMALES
103.85
FEMALES / 100 MALES
45.5
MEDIAN AGE
3.1
AVG FAMILY SIZE
2.4
AVG HOUSEHOLD SIZE
3,309
LABOR FORCE [ PEOPLE ]
61.4%
PERCENT IN LABOR FORCE
3.6%
UNEMPLOYMENT RATE
Income in Yardville
Income Overview in Yardville
Per Capita Income in Yardville is $49,970, while median incomes of families and households are $127,426 and $107,661 respectively.
| Characteristic | Number | Measure |
| Per Capita Income | 6,405 | $49,970 |
| Median Family Income | 1,709 | $127,426 |
| Mean Family Income | 1,709 | $147,037 |
| Median Household Income | 2,622 | $107,661 |
| Mean Household Income | 2,622 | $118,667 |
| Income Deficit | 1,709 | $0 |
| Wage / Income Gap (%) | 6,405 | 27.07% |
| Wage / Income Gap ($) | 6,405 | 72.93¢ per $1 |
| Gini / Inequality Index | 6,405 | 0.39 |
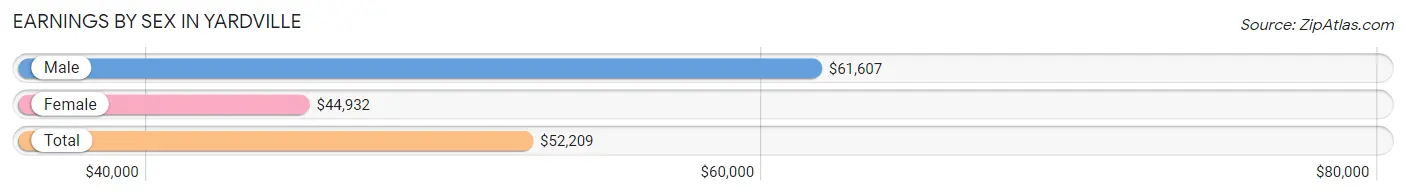
Earnings by Sex in Yardville
Average Earnings in Yardville are $52,209, $61,607 for men and $44,932 for women, a difference of 27.1%.
| Sex | Number | Average Earnings |
| Male | 1,929 (54.9%) | $61,607 |
| Female | 1,584 (45.1%) | $44,932 |
| Total | 3,513 (100.0%) | $52,209 |
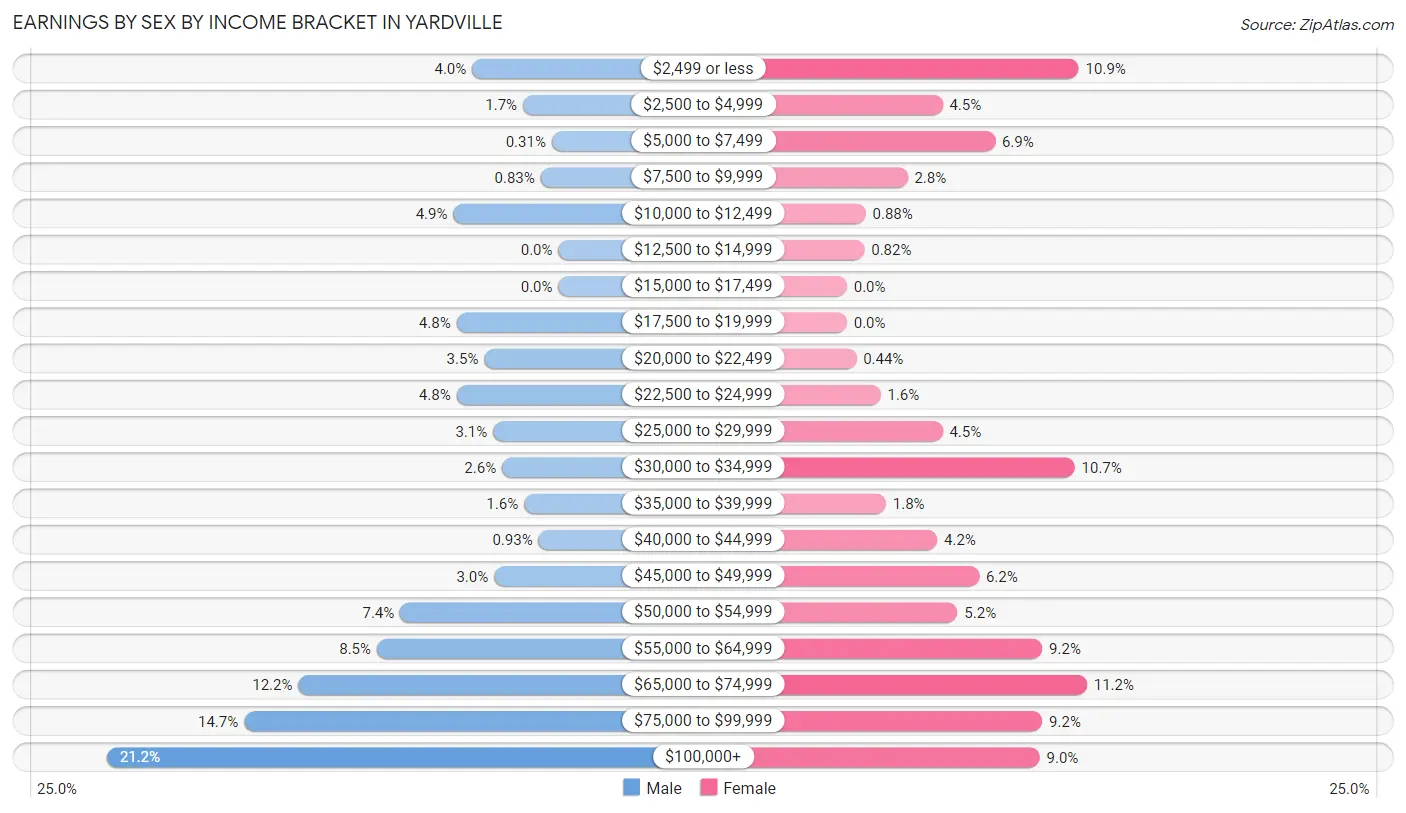
Earnings by Sex by Income Bracket in Yardville
The most common earnings brackets in Yardville are $100,000+ for men (408 | 21.1%) and $65,000 to $74,999 for women (178 | 11.2%).
| Income | Male | Female |
| $2,499 or less | 78 (4.0%) | 172 (10.9%) |
| $2,500 to $4,999 | 32 (1.7%) | 71 (4.5%) |
| $5,000 to $7,499 | 6 (0.3%) | 110 (6.9%) |
| $7,500 to $9,999 | 16 (0.8%) | 45 (2.8%) |
| $10,000 to $12,499 | 95 (4.9%) | 14 (0.9%) |
| $12,500 to $14,999 | 0 (0.0%) | 13 (0.8%) |
| $15,000 to $17,499 | 0 (0.0%) | 0 (0.0%) |
| $17,500 to $19,999 | 92 (4.8%) | 0 (0.0%) |
| $20,000 to $22,499 | 67 (3.5%) | 7 (0.4%) |
| $22,500 to $24,999 | 92 (4.8%) | 25 (1.6%) |
| $25,000 to $29,999 | 59 (3.1%) | 71 (4.5%) |
| $30,000 to $34,999 | 51 (2.6%) | 169 (10.7%) |
| $35,000 to $39,999 | 31 (1.6%) | 29 (1.8%) |
| $40,000 to $44,999 | 18 (0.9%) | 67 (4.2%) |
| $45,000 to $49,999 | 58 (3.0%) | 98 (6.2%) |
| $50,000 to $54,999 | 143 (7.4%) | 82 (5.2%) |
| $55,000 to $64,999 | 164 (8.5%) | 145 (9.1%) |
| $65,000 to $74,999 | 235 (12.2%) | 178 (11.2%) |
| $75,000 to $99,999 | 284 (14.7%) | 145 (9.1%) |
| $100,000+ | 408 (21.1%) | 143 (9.0%) |
| Total | 1,929 (100.0%) | 1,584 (100.0%) |
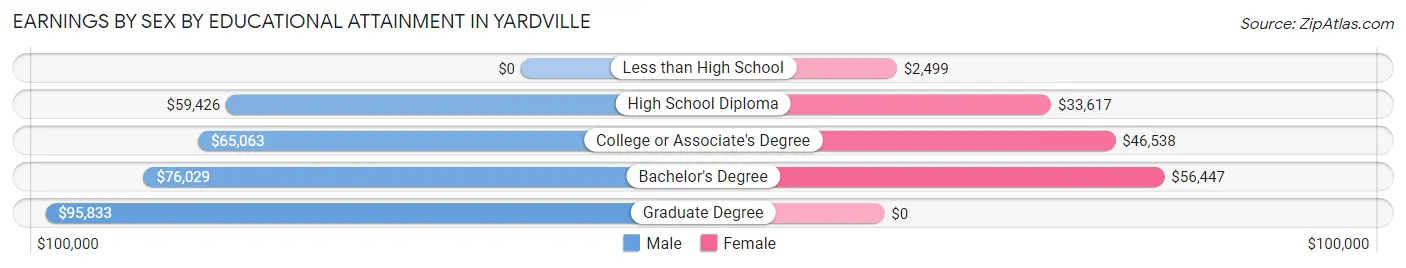
Earnings by Sex by Educational Attainment in Yardville
Average earnings in Yardville are $65,820 for men and $46,713 for women, a difference of 29.0%. Men with an educational attainment of graduate degree enjoy the highest average annual earnings of $95,833, while those with high school diploma education earn the least with $59,426. Women with an educational attainment of bachelor's degree earn the most with the average annual earnings of $56,447, while those with less than high school education have the smallest earnings of $2,499.
| Educational Attainment | Male Income | Female Income |
| Less than High School | - | - |
| High School Diploma | $59,426 | $33,617 |
| College or Associate's Degree | $65,063 | $46,538 |
| Bachelor's Degree | $76,029 | $56,447 |
| Graduate Degree | $95,833 | $0 |
| Total | $65,820 | $46,713 |
Family Income in Yardville
Family Income Brackets in Yardville
According to the Yardville family income data, there are 593 families falling into the $100,000 to $149,999 income range, which is the most common income bracket and makes up 34.7% of all families.
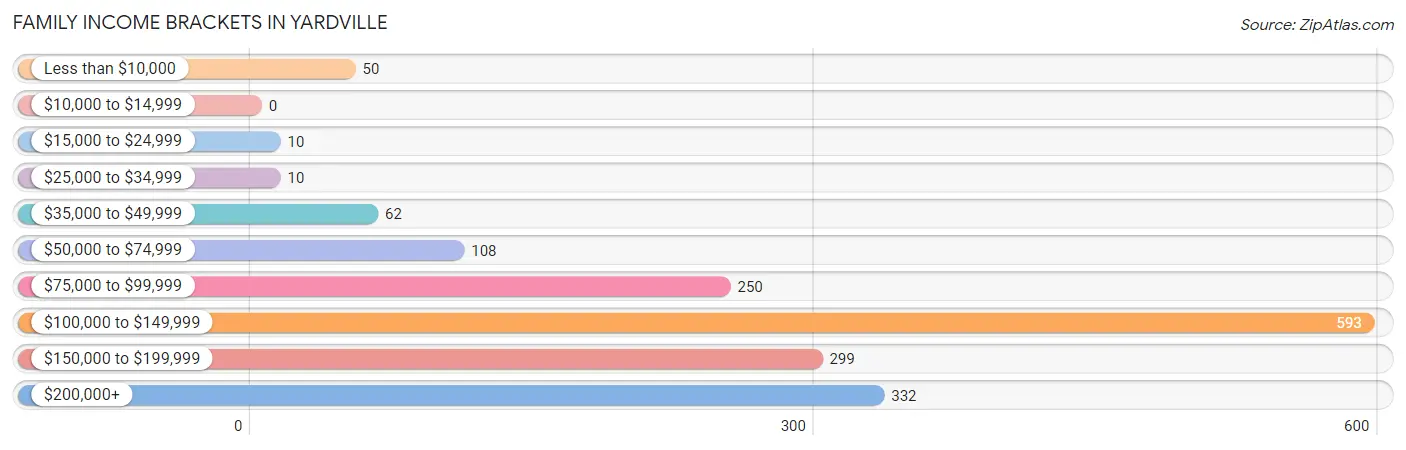
| Income Bracket | # Families | % Families |
| Less than $10,000 | 50 | 2.9% |
| $10,000 to $14,999 | 0 | 0.0% |
| $15,000 to $24,999 | 10 | 0.6% |
| $25,000 to $34,999 | 10 | 0.6% |
| $35,000 to $49,999 | 62 | 3.6% |
| $50,000 to $74,999 | 108 | 6.3% |
| $75,000 to $99,999 | 250 | 14.6% |
| $100,000 to $149,999 | 593 | 34.7% |
| $150,000 to $199,999 | 299 | 17.5% |
| $200,000+ | 332 | 19.4% |
Family Income by Famaliy Size in Yardville
5-person families (122 | 7.1%) account for the highest median family income in Yardville with $234,000 per family, while 2-person families (739 | 43.2%) have the highest median income of $60,346 per family member.
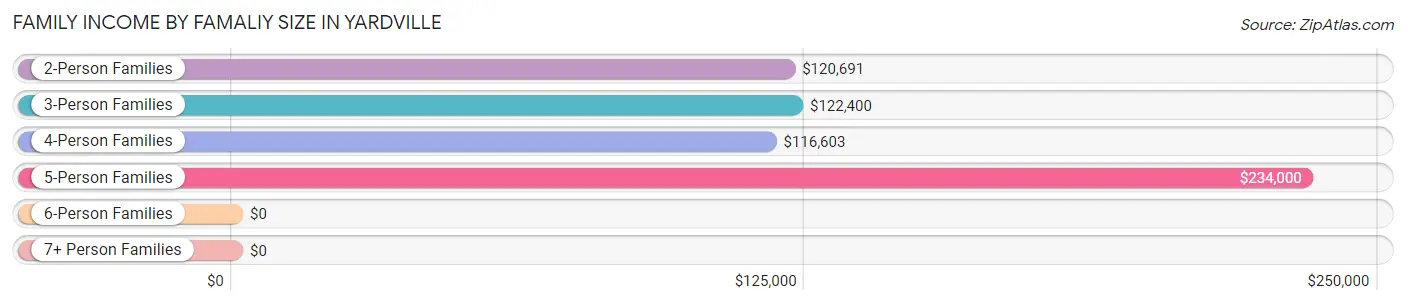
| Income Bracket | # Families | Median Income |
| 2-Person Families | 739 (43.2%) | $120,691 |
| 3-Person Families | 348 (20.4%) | $122,400 |
| 4-Person Families | 468 (27.4%) | $116,603 |
| 5-Person Families | 122 (7.1%) | $234,000 |
| 6-Person Families | 32 (1.9%) | $0 |
| 7+ Person Families | 0 (0.0%) | $0 |
| Total | 1,709 (100.0%) | $127,426 |
Family Income by Number of Earners in Yardville
The median family income in Yardville is $127,426, with families comprising 3+ earners (288) having the highest median family income of $165,227, while families with no earners (253) have the lowest median family income of $92,788, accounting for 16.9% and 14.8% of families, respectively.
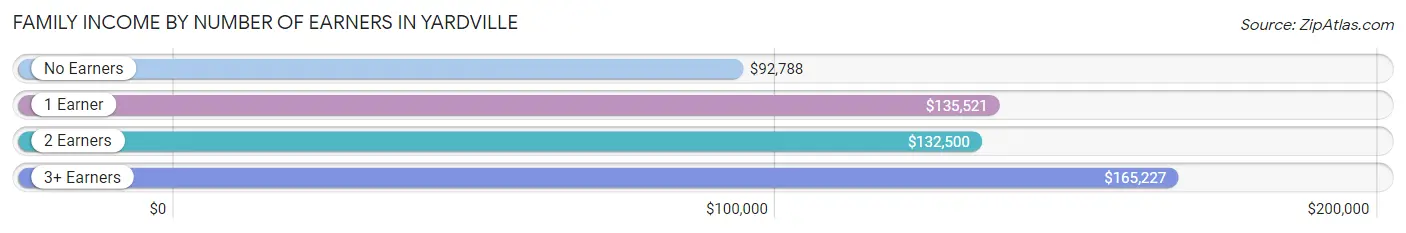
| Number of Earners | # Families | Median Income |
| No Earners | 253 (14.8%) | $92,788 |
| 1 Earner | 408 (23.9%) | $135,521 |
| 2 Earners | 760 (44.5%) | $132,500 |
| 3+ Earners | 288 (16.9%) | $165,227 |
| Total | 1,709 (100.0%) | $127,426 |
Household Income in Yardville
Household Income Brackets in Yardville
With 658 households falling in the category, the $100,000 to $149,999 income range is the most frequent in Yardville, accounting for 25.1% of all households.
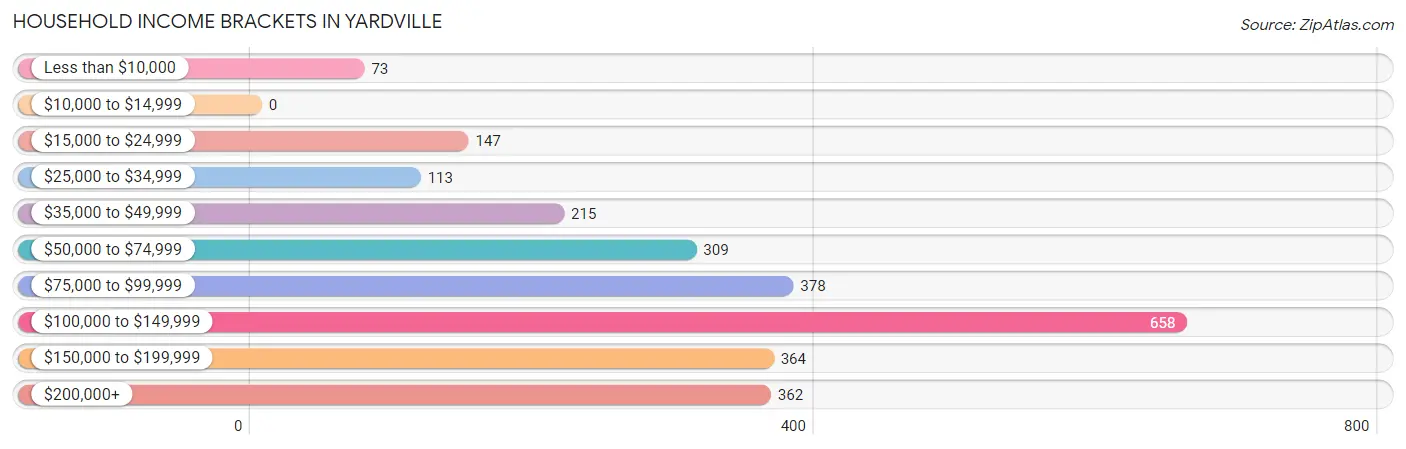
| Income Bracket | # Households | % Households |
| Less than $10,000 | 73 | 2.8% |
| $10,000 to $14,999 | 0 | 0.0% |
| $15,000 to $24,999 | 147 | 5.6% |
| $25,000 to $34,999 | 113 | 4.3% |
| $35,000 to $49,999 | 215 | 8.2% |
| $50,000 to $74,999 | 309 | 11.8% |
| $75,000 to $99,999 | 378 | 14.4% |
| $100,000 to $149,999 | 658 | 25.1% |
| $150,000 to $199,999 | 364 | 13.9% |
| $200,000+ | 362 | 13.8% |
Household Income by Householder Age in Yardville
The median household income in Yardville is $107,661, with the highest median household income of $120,750 found in the 25 to 44 years age bracket for the primary householder. A total of 655 households (25.0%) fall into this category.
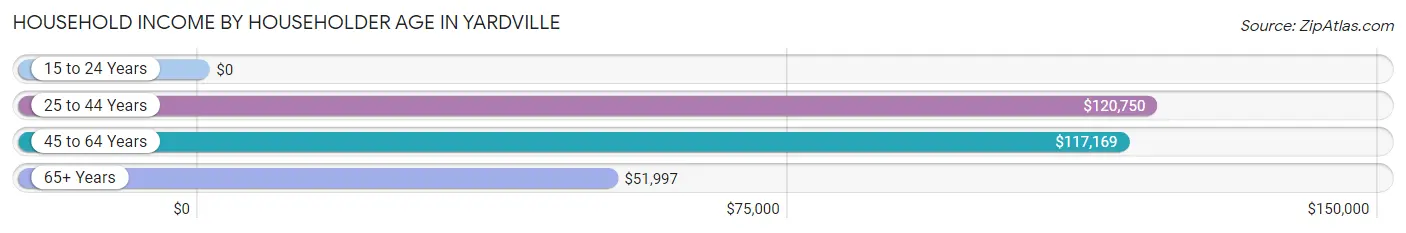
| Income Bracket | # Households | Median Income |
| 15 to 24 Years | 0 (0.0%) | $0 |
| 25 to 44 Years | 655 (25.0%) | $120,750 |
| 45 to 64 Years | 1,019 (38.9%) | $117,169 |
| 65+ Years | 948 (36.2%) | $51,997 |
| Total | 2,622 (100.0%) | $107,661 |
Poverty in Yardville
Income Below Poverty by Sex and Age in Yardville
With 5.3% poverty level for males and 4.6% for females among the residents of Yardville, under 5 year old males and 18 to 24 year old females are the most vulnerable to poverty, with 30 males (21.0%) and 24 females (17.3%) in their respective age groups living below the poverty level.
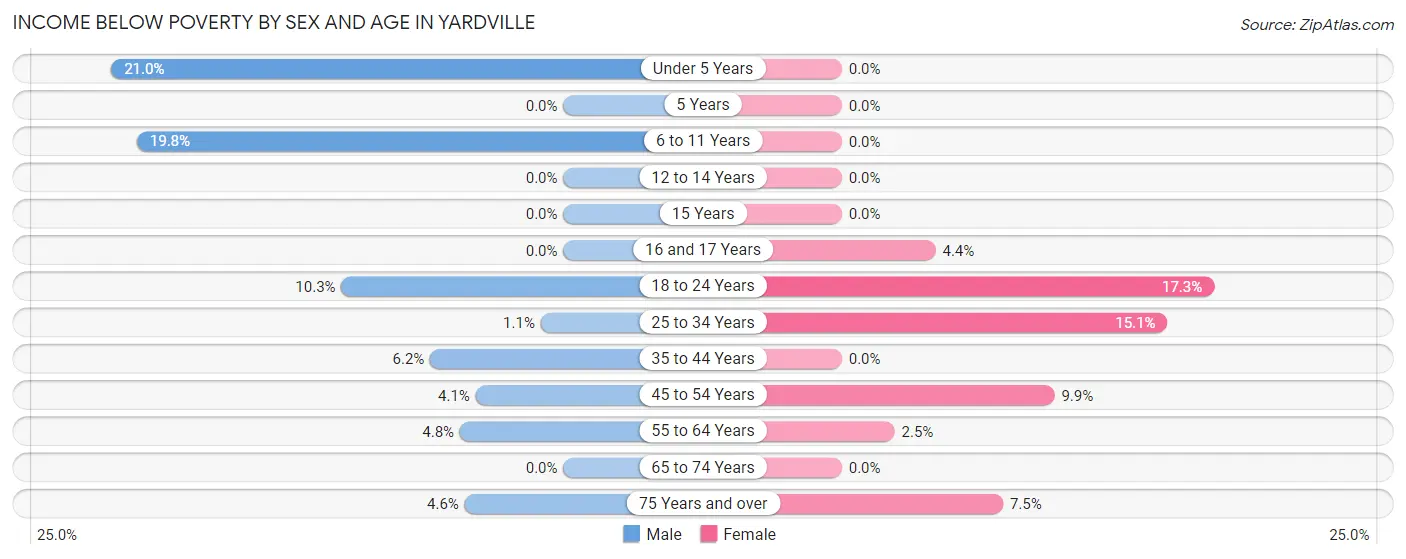
| Age Bracket | Male | Female |
| Under 5 Years | 30 (21.0%) | 0 (0.0%) |
| 5 Years | 0 (0.0%) | 0 (0.0%) |
| 6 to 11 Years | 37 (19.8%) | 0 (0.0%) |
| 12 to 14 Years | 0 (0.0%) | 0 (0.0%) |
| 15 Years | 0 (0.0%) | 0 (0.0%) |
| 16 and 17 Years | 0 (0.0%) | 1 (4.3%) |
| 18 to 24 Years | 17 (10.3%) | 24 (17.3%) |
| 25 to 34 Years | 8 (1.1%) | 55 (15.1%) |
| 35 to 44 Years | 21 (6.2%) | 0 (0.0%) |
| 45 to 54 Years | 18 (4.1%) | 31 (9.9%) |
| 55 to 64 Years | 25 (4.8%) | 15 (2.5%) |
| 65 to 74 Years | 0 (0.0%) | 0 (0.0%) |
| 75 Years and over | 12 (4.6%) | 24 (7.5%) |
| Total | 168 (5.3%) | 150 (4.6%) |
Income Above Poverty by Sex and Age in Yardville
According to the poverty statistics in Yardville, males aged 12 to 14 years and females aged under 5 years are the age groups that are most secure financially, with 100.0% of males and 100.0% of females in these age groups living above the poverty line.
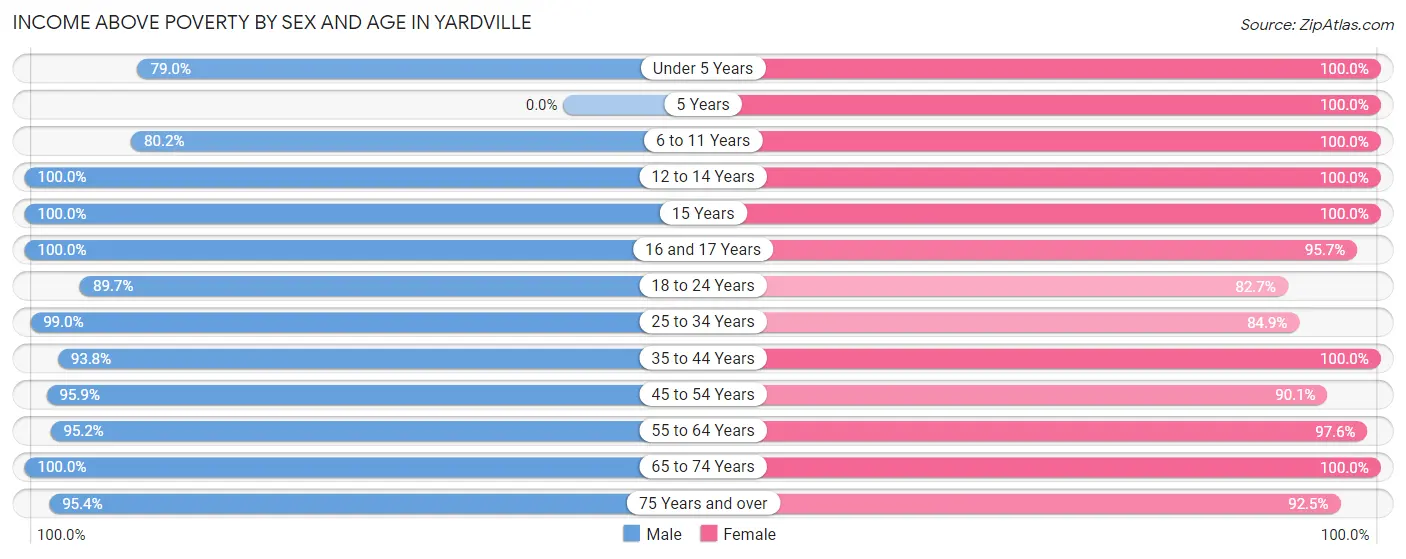
| Age Bracket | Male | Female |
| Under 5 Years | 113 (79.0%) | 185 (100.0%) |
| 5 Years | 0 (0.0%) | 35 (100.0%) |
| 6 to 11 Years | 150 (80.2%) | 206 (100.0%) |
| 12 to 14 Years | 100 (100.0%) | 116 (100.0%) |
| 15 Years | 19 (100.0%) | 23 (100.0%) |
| 16 and 17 Years | 18 (100.0%) | 22 (95.7%) |
| 18 to 24 Years | 148 (89.7%) | 115 (82.7%) |
| 25 to 34 Years | 751 (99.0%) | 309 (84.9%) |
| 35 to 44 Years | 319 (93.8%) | 332 (100.0%) |
| 45 to 54 Years | 424 (95.9%) | 283 (90.1%) |
| 55 to 64 Years | 496 (95.2%) | 598 (97.6%) |
| 65 to 74 Years | 186 (100.0%) | 591 (100.0%) |
| 75 Years and over | 250 (95.4%) | 297 (92.5%) |
| Total | 2,974 (94.7%) | 3,112 (95.4%) |
Income Below Poverty Among Married-Couple Families in Yardville
The poverty statistics for married-couple families in Yardville show that 3.5% or 49 of the total 1,415 families live below the poverty line. Families with 1 or 2 children have the highest poverty rate of 7.1%, comprising of 37 families. On the other hand, families with 3 or 4 children have the lowest poverty rate of 0.0%, which includes 0 families.
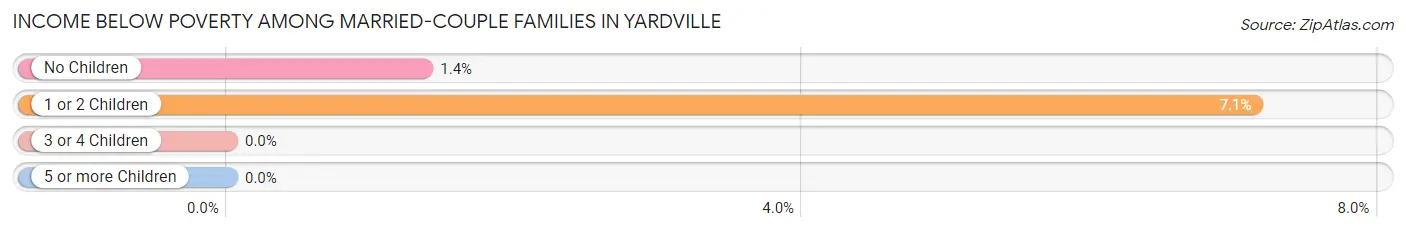
| Children | Above Poverty | Below Poverty |
| No Children | 870 (98.6%) | 12 (1.4%) |
| 1 or 2 Children | 481 (92.9%) | 37 (7.1%) |
| 3 or 4 Children | 15 (100.0%) | 0 (0.0%) |
| 5 or more Children | 0 (0.0%) | 0 (0.0%) |
| Total | 1,366 (96.5%) | 49 (3.5%) |
Income Below Poverty Among Single-Parent Households in Yardville
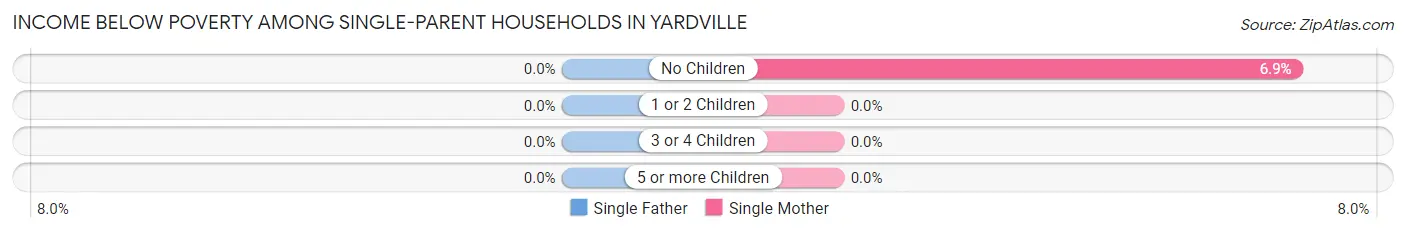
| Children | Single Father | Single Mother |
| No Children | 0 (0.0%) | 10 (6.9%) |
| 1 or 2 Children | 0 (0.0%) | 0 (0.0%) |
| 3 or 4 Children | 0 (0.0%) | 0 (0.0%) |
| 5 or more Children | 0 (0.0%) | 0 (0.0%) |
| Total | 0 (0.0%) | 10 (5.3%) |
Income Below Poverty Among Married-Couple vs Single-Parent Households in Yardville
The poverty data for Yardville shows that 49 of the married-couple family households (3.5%) and 10 of the single-parent households (3.4%) are living below the poverty level. Within the married-couple family households, those with 1 or 2 children have the highest poverty rate, with 37 households (7.1%) falling below the poverty line. Among the single-parent households, those with no children have the highest poverty rate, with 10 household (5.4%) living below poverty.
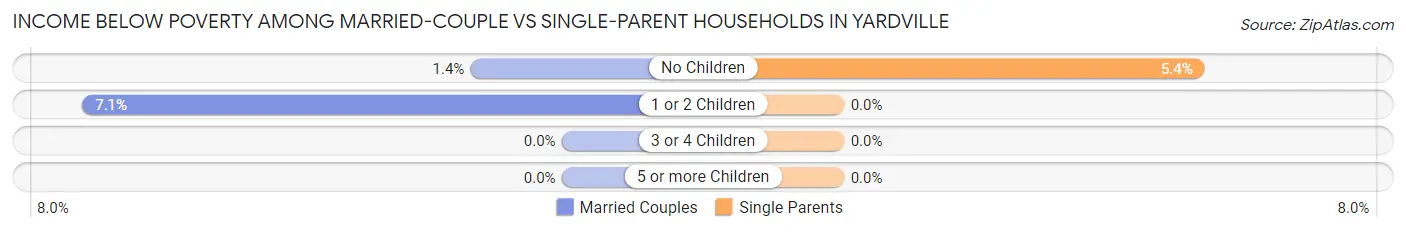
| Children | Married-Couple Families | Single-Parent Households |
| No Children | 12 (1.4%) | 10 (5.4%) |
| 1 or 2 Children | 37 (7.1%) | 0 (0.0%) |
| 3 or 4 Children | 0 (0.0%) | 0 (0.0%) |
| 5 or more Children | 0 (0.0%) | 0 (0.0%) |
| Total | 49 (3.5%) | 10 (3.4%) |
Race in Yardville
The most populous races in Yardville are White / Caucasian (5,973 | 93.3%), Hispanic or Latino (518 | 8.1%), and Asian (196 | 3.1%).
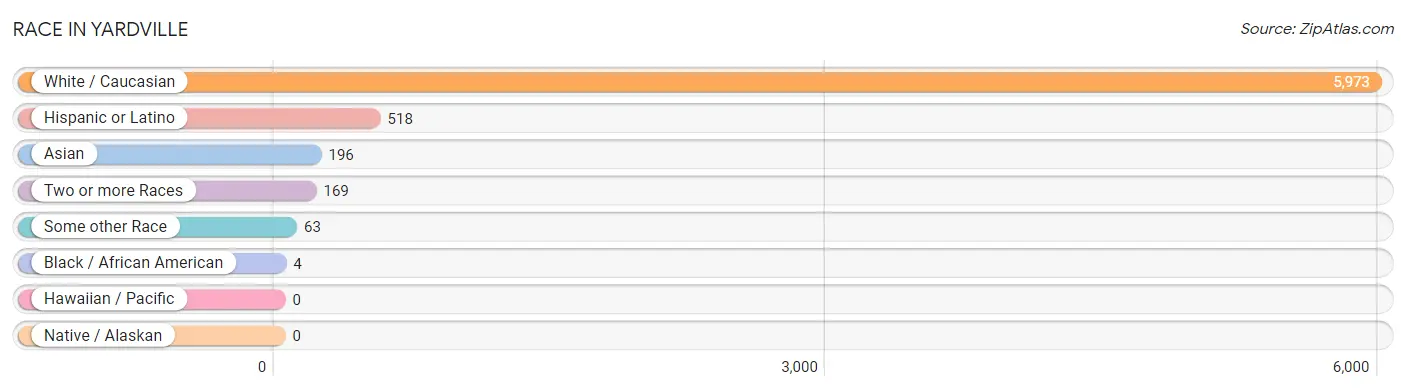
| Race | # Population | % Population |
| Asian | 196 | 3.1% |
| Black / African American | 4 | 0.1% |
| Hawaiian / Pacific | 0 | 0.0% |
| Hispanic or Latino | 518 | 8.1% |
| Native / Alaskan | 0 | 0.0% |
| White / Caucasian | 5,973 | 93.3% |
| Two or more Races | 169 | 2.6% |
| Some other Race | 63 | 1.0% |
| Total | 6,405 | 100.0% |
Ancestry in Yardville
The most populous ancestries reported in Yardville are Italian (1,842 | 28.8%), German (1,157 | 18.1%), Polish (1,067 | 16.7%), Irish (990 | 15.5%), and English (571 | 8.9%), together accounting for 87.8% of all Yardville residents.
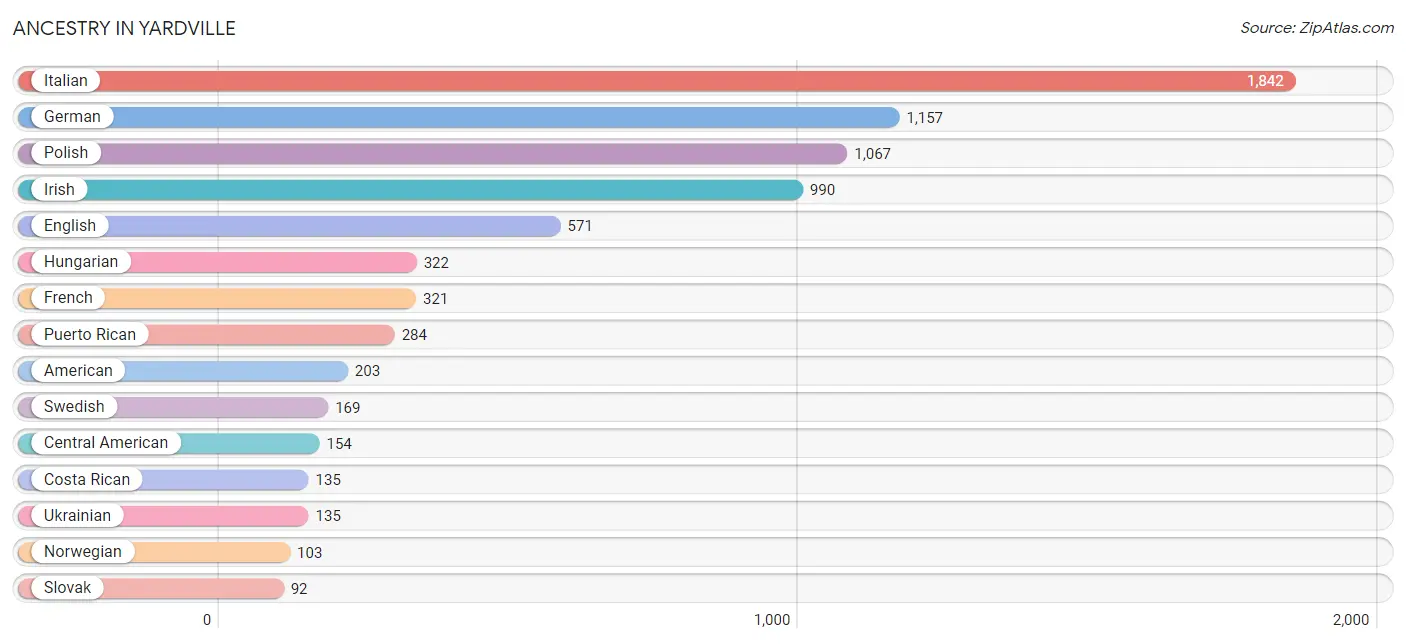
| Ancestry | # Population | % Population |
| American | 203 | 3.2% |
| Argentinean | 28 | 0.4% |
| Armenian | 15 | 0.2% |
| Austrian | 13 | 0.2% |
| British | 26 | 0.4% |
| Central American | 154 | 2.4% |
| Colombian | 48 | 0.7% |
| Costa Rican | 135 | 2.1% |
| Danish | 32 | 0.5% |
| Dutch | 32 | 0.5% |
| Eastern European | 61 | 0.9% |
| English | 571 | 8.9% |
| French | 321 | 5.0% |
| German | 1,157 | 18.1% |
| Guatemalan | 19 | 0.3% |
| Hungarian | 322 | 5.0% |
| Irish | 990 | 15.5% |
| Italian | 1,842 | 28.8% |
| Korean | 63 | 1.0% |
| Latvian | 38 | 0.6% |
| Lithuanian | 23 | 0.4% |
| Mexican | 3 | 0.1% |
| Norwegian | 103 | 1.6% |
| Polish | 1,067 | 16.7% |
| Puerto Rican | 284 | 4.4% |
| Russian | 14 | 0.2% |
| Scandinavian | 27 | 0.4% |
| Scotch-Irish | 34 | 0.5% |
| Scottish | 73 | 1.1% |
| Slovak | 92 | 1.4% |
| South American | 76 | 1.2% |
| Swedish | 169 | 2.6% |
| Thai | 42 | 0.7% |
| Turkish | 34 | 0.5% |
| Ukrainian | 135 | 2.1% |
| Welsh | 51 | 0.8% | View All 36 Rows |
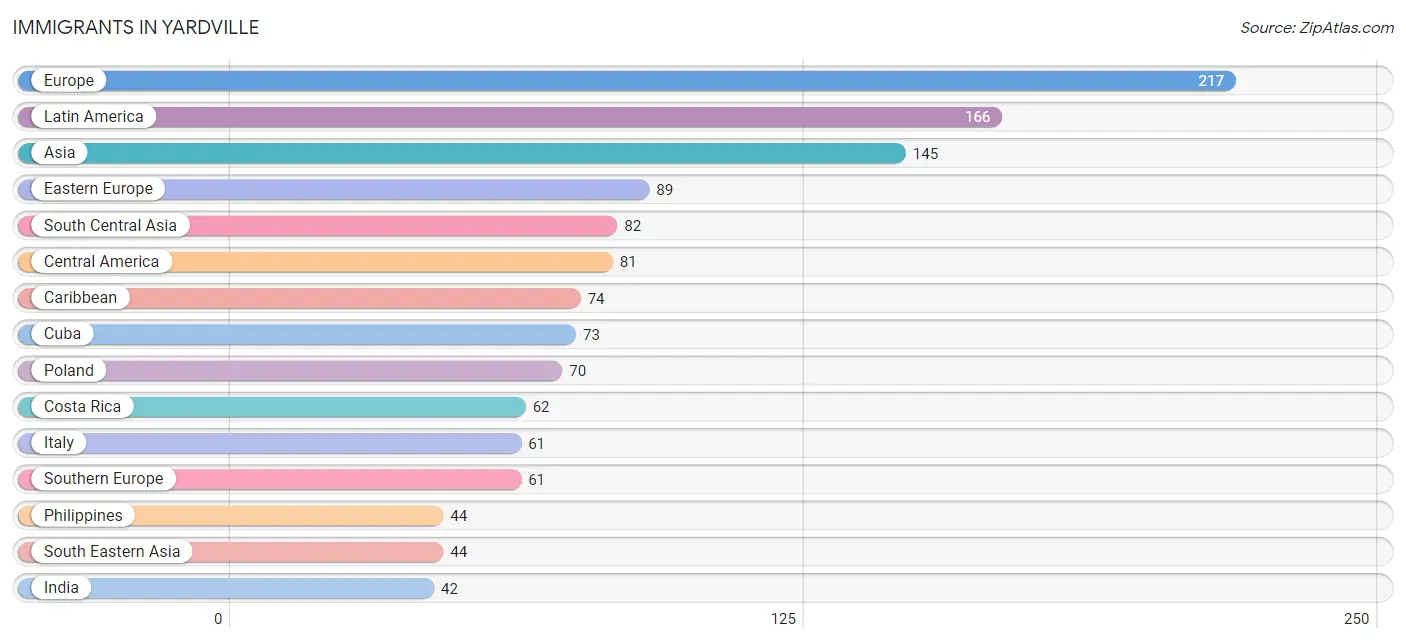
Immigrants in Yardville
The most numerous immigrant groups reported in Yardville came from Europe (217 | 3.4%), Latin America (166 | 2.6%), Asia (145 | 2.3%), Eastern Europe (89 | 1.4%), and South Central Asia (82 | 1.3%), together accounting for 10.9% of all Yardville residents.
| Immigration Origin | # Population | % Population |
| Argentina | 11 | 0.2% |
| Asia | 145 | 2.3% |
| Caribbean | 74 | 1.2% |
| Central America | 81 | 1.3% |
| Costa Rica | 62 | 1.0% |
| Cuba | 73 | 1.1% |
| Dominica | 1 | 0.0% |
| Eastern Europe | 89 | 1.4% |
| England | 31 | 0.5% |
| Europe | 217 | 3.4% |
| Germany | 36 | 0.6% |
| Guatemala | 19 | 0.3% |
| India | 42 | 0.7% |
| Italy | 61 | 0.9% |
| Latin America | 166 | 2.6% |
| Latvia | 19 | 0.3% |
| Northern Europe | 31 | 0.5% |
| Pakistan | 40 | 0.6% |
| Philippines | 44 | 0.7% |
| Poland | 70 | 1.1% |
| South America | 11 | 0.2% |
| South Central Asia | 82 | 1.3% |
| South Eastern Asia | 44 | 0.7% |
| Southern Europe | 61 | 0.9% |
| Turkey | 19 | 0.3% |
| Western Asia | 19 | 0.3% |
| Western Europe | 36 | 0.6% | View All 27 Rows |
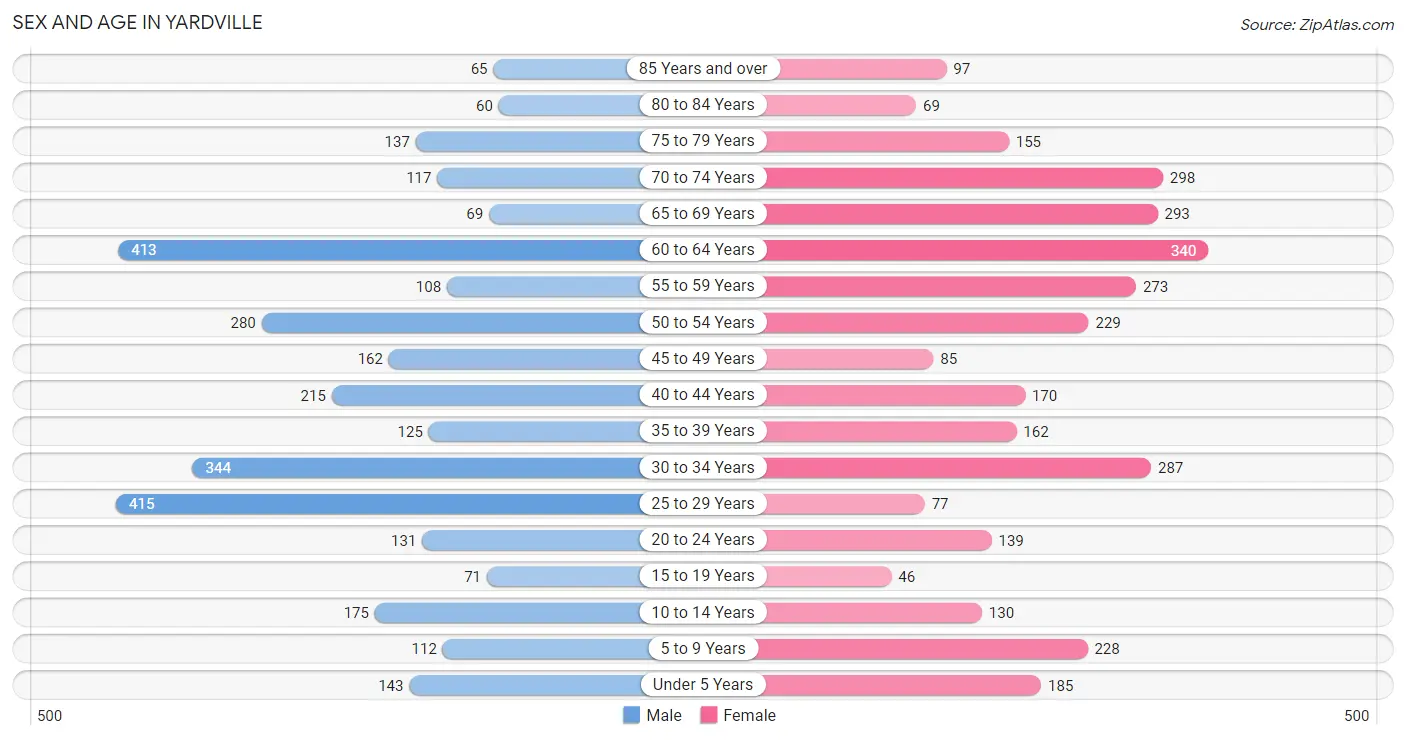
Sex and Age in Yardville
Sex and Age in Yardville
The most populous age groups in Yardville are 25 to 29 Years (415 | 13.2%) for men and 60 to 64 Years (340 | 10.4%) for women.
| Age Bracket | Male | Female |
| Under 5 Years | 143 (4.5%) | 185 (5.7%) |
| 5 to 9 Years | 112 (3.6%) | 228 (7.0%) |
| 10 to 14 Years | 175 (5.6%) | 130 (4.0%) |
| 15 to 19 Years | 71 (2.3%) | 46 (1.4%) |
| 20 to 24 Years | 131 (4.2%) | 139 (4.3%) |
| 25 to 29 Years | 415 (13.2%) | 77 (2.4%) |
| 30 to 34 Years | 344 (11.0%) | 287 (8.8%) |
| 35 to 39 Years | 125 (4.0%) | 162 (5.0%) |
| 40 to 44 Years | 215 (6.8%) | 170 (5.2%) |
| 45 to 49 Years | 162 (5.2%) | 85 (2.6%) |
| 50 to 54 Years | 280 (8.9%) | 229 (7.0%) |
| 55 to 59 Years | 108 (3.4%) | 273 (8.4%) |
| 60 to 64 Years | 413 (13.1%) | 340 (10.4%) |
| 65 to 69 Years | 69 (2.2%) | 293 (9.0%) |
| 70 to 74 Years | 117 (3.7%) | 298 (9.1%) |
| 75 to 79 Years | 137 (4.4%) | 155 (4.8%) |
| 80 to 84 Years | 60 (1.9%) | 69 (2.1%) |
| 85 Years and over | 65 (2.1%) | 97 (3.0%) |
| Total | 3,142 (100.0%) | 3,263 (100.0%) |
Families and Households in Yardville
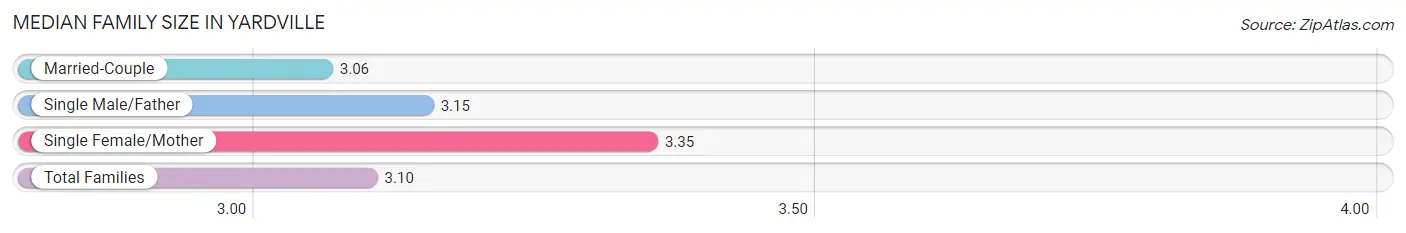
Median Family Size in Yardville
The median family size in Yardville is 3.10 persons per family, with single female/mother families (188 | 11.0%) accounting for the largest median family size of 3.35 persons per family. On the other hand, married-couple families (1,415 | 82.8%) represent the smallest median family size with 3.06 persons per family.
| Family Type | # Families | Family Size |
| Married-Couple | 1,415 (82.8%) | 3.06 |
| Single Male/Father | 106 (6.2%) | 3.15 |
| Single Female/Mother | 188 (11.0%) | 3.35 |
| Total Families | 1,709 (100.0%) | 3.10 |
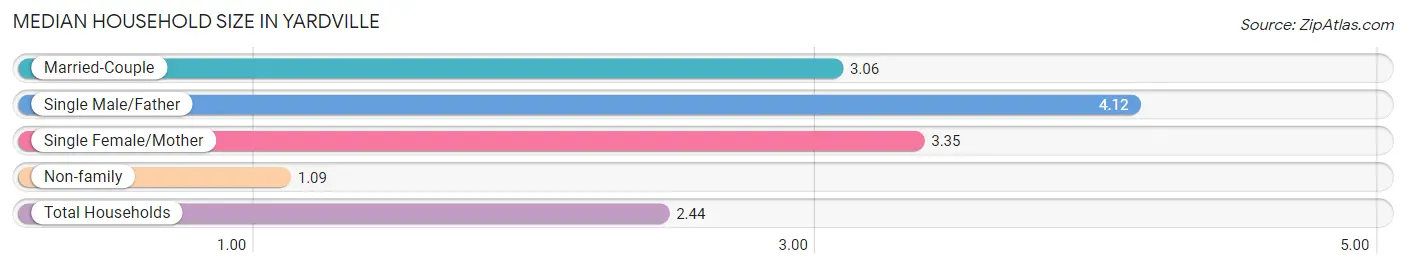
Median Household Size in Yardville
The median household size in Yardville is 2.44 persons per household, with single male/father households (106 | 4.0%) accounting for the largest median household size of 4.12 persons per household. non-family households (913 | 34.8%) represent the smallest median household size with 1.09 persons per household.
| Household Type | # Households | Household Size |
| Married-Couple | 1,415 (54.0%) | 3.06 |
| Single Male/Father | 106 (4.0%) | 4.12 |
| Single Female/Mother | 188 (7.2%) | 3.35 |
| Non-family | 913 (34.8%) | 1.09 |
| Total Households | 2,622 (100.0%) | 2.44 |
Household Size by Marriage Status in Yardville
Out of a total of 2,622 households in Yardville, 1,709 (65.2%) are family households, while 913 (34.8%) are nonfamily households. The most numerous type of family households are 2-person households, comprising 722, and the most common type of nonfamily households are 1-person households, comprising 862.
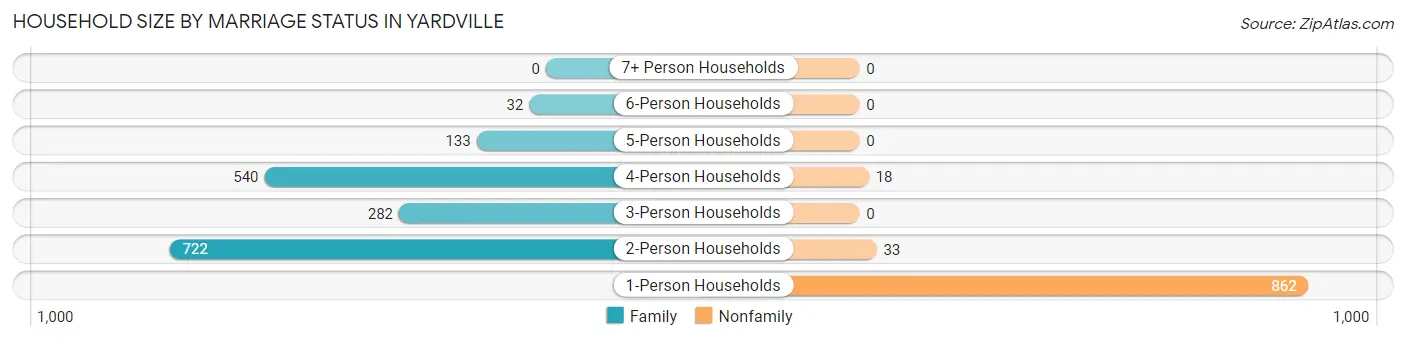
| Household Size | Family Households | Nonfamily Households |
| 1-Person Households | - | 862 (32.9%) |
| 2-Person Households | 722 (27.5%) | 33 (1.3%) |
| 3-Person Households | 282 (10.8%) | 0 (0.0%) |
| 4-Person Households | 540 (20.6%) | 18 (0.7%) |
| 5-Person Households | 133 (5.1%) | 0 (0.0%) |
| 6-Person Households | 32 (1.2%) | 0 (0.0%) |
| 7+ Person Households | 0 (0.0%) | 0 (0.0%) |
| Total | 1,709 (65.2%) | 913 (34.8%) |
Female Fertility in Yardville
Fertility by Age in Yardville
Average fertility rate in Yardville is 26.0 births per 1,000 women. Women in the age bracket of 20 to 34 years have the highest fertility rate with 50.0 births per 1,000 women. Women in the age bracket of 20 to 34 years acount for 100.0% of all women with births.
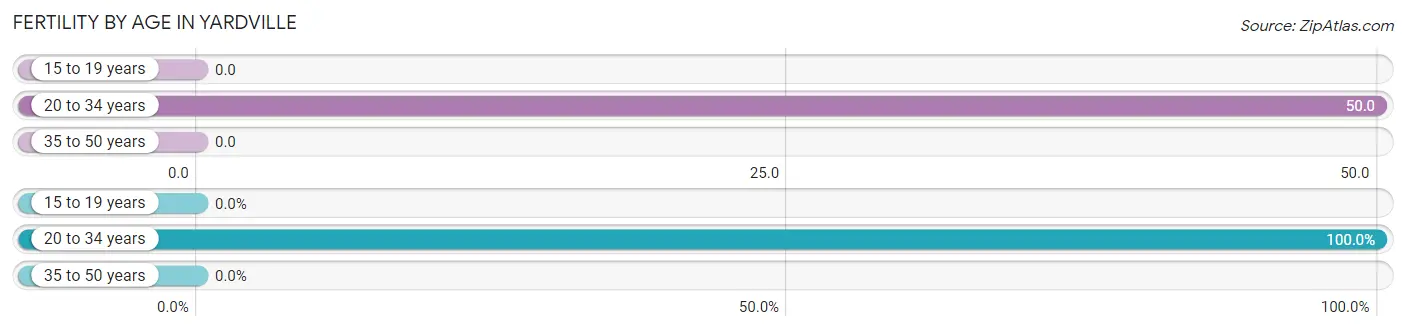
| Age Bracket | Women with Births | Births / 1,000 Women |
| 15 to 19 years | 0 (0.0%) | 0.0 |
| 20 to 34 years | 25 (100.0%) | 50.0 |
| 35 to 50 years | 0 (0.0%) | 0.0 |
| Total | 25 (100.0%) | 26.0 |
Fertility by Age by Marriage Status in Yardville
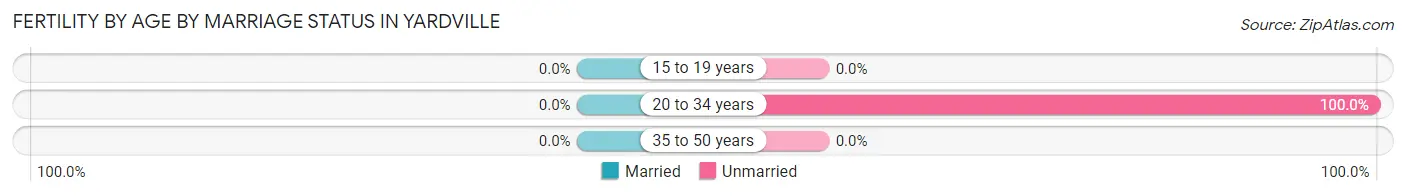
| Age Bracket | Married | Unmarried |
| 15 to 19 years | 0 (0.0%) | 0 (0.0%) |
| 20 to 34 years | 0 (0.0%) | 25 (100.0%) |
| 35 to 50 years | 0 (0.0%) | 0 (0.0%) |
| Total | 0 (0.0%) | 25 (100.0%) |
Fertility by Education in Yardville
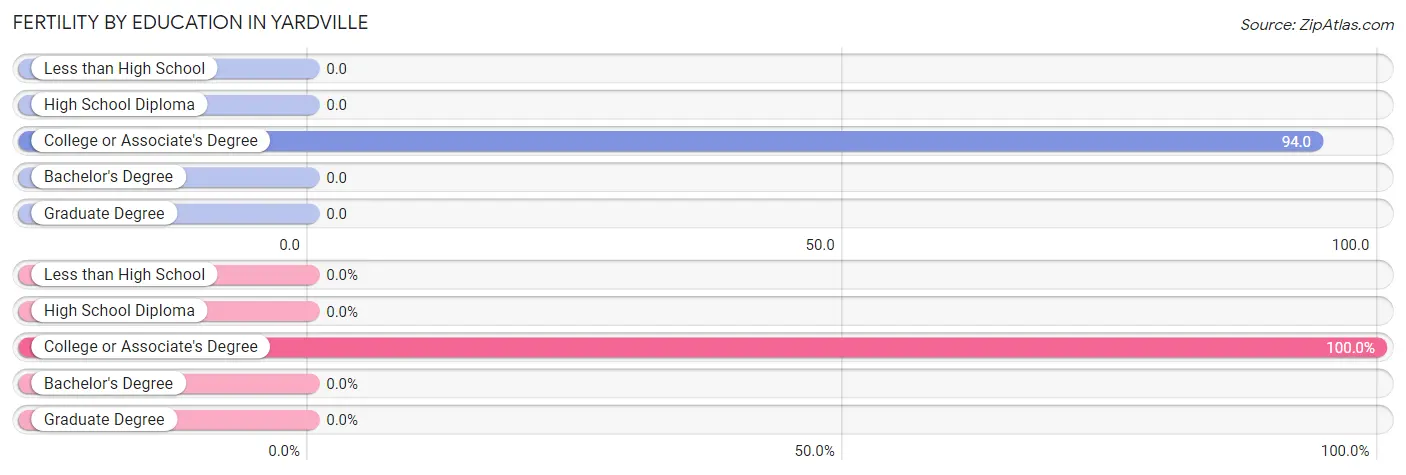
| Educational Attainment | Women with Births | Births / 1,000 Women |
| Less than High School | 0 (0.0%) | 0.0 |
| High School Diploma | 0 (0.0%) | 0.0 |
| College or Associate's Degree | 25 (100.0%) | 94.0 |
| Bachelor's Degree | 0 (0.0%) | 0.0 |
| Graduate Degree | 0 (0.0%) | 0.0 |
| Total | 25 (100.0%) | 26.0 |
Fertility by Education by Marriage Status in Yardville
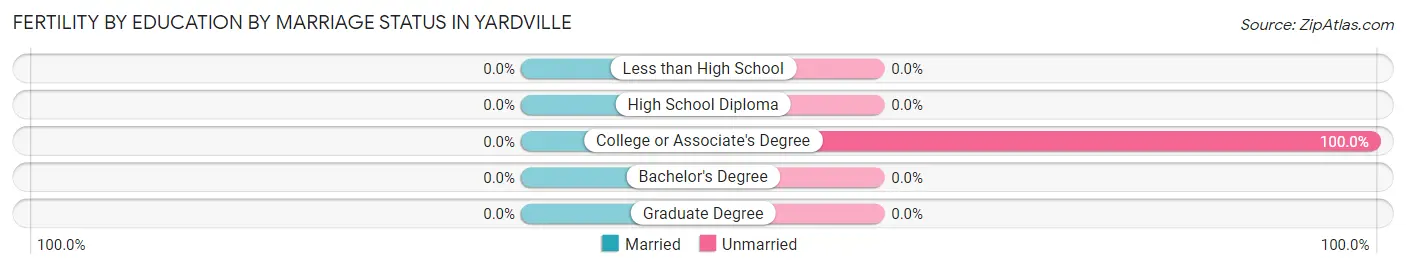
| Educational Attainment | Married | Unmarried |
| Less than High School | 0 (0.0%) | 0 (0.0%) |
| High School Diploma | 0 (0.0%) | 0 (0.0%) |
| College or Associate's Degree | 0 (0.0%) | 25 (100.0%) |
| Bachelor's Degree | 0 (0.0%) | 0 (0.0%) |
| Graduate Degree | 0 (0.0%) | 0 (0.0%) |
| Total | 0 (0.0%) | 25 (100.0%) |
Employment Characteristics in Yardville
Employment by Class of Employer in Yardville
Among the 3,112 employed individuals in Yardville, private company employees (2,112 | 67.9%), local government employees (337 | 10.8%), and state government employees (325 | 10.4%) make up the most common classes of employment.
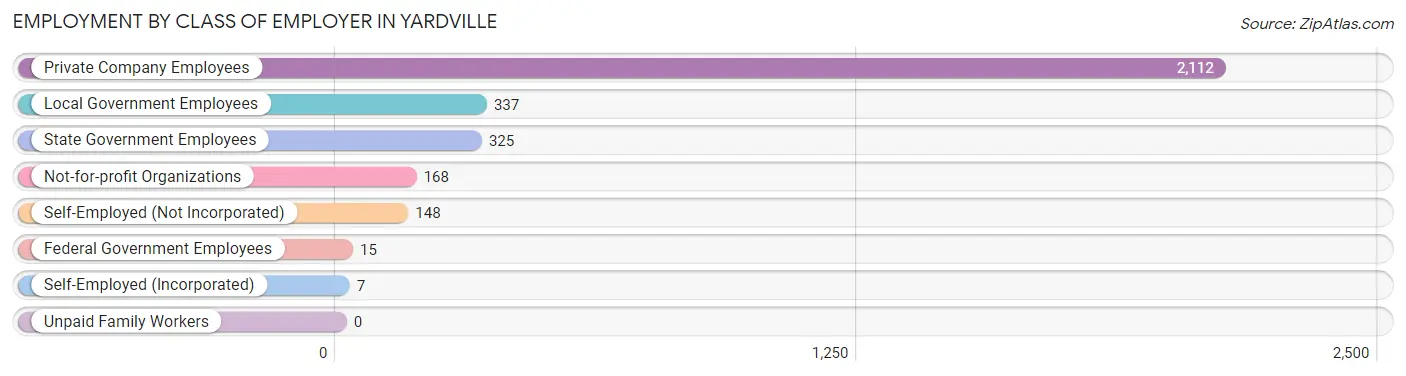
| Employer Class | # Employees | % Employees |
| Private Company Employees | 2,112 | 67.9% |
| Self-Employed (Incorporated) | 7 | 0.2% |
| Self-Employed (Not Incorporated) | 148 | 4.8% |
| Not-for-profit Organizations | 168 | 5.4% |
| Local Government Employees | 337 | 10.8% |
| State Government Employees | 325 | 10.4% |
| Federal Government Employees | 15 | 0.5% |
| Unpaid Family Workers | 0 | 0.0% |
| Total | 3,112 | 100.0% |
Employment Status by Age in Yardville
According to the labor force statistics for Yardville, out of the total population over 16 years of age (5,390), 61.4% or 3,309 individuals are in the labor force, with 3.6% or 119 of them unemployed. The age group with the highest labor force participation rate is 35 to 44 years, with 100.0% or 672 individuals in the labor force. Within the labor force, the 45 to 54 years age range has the highest percentage of unemployed individuals, with 8.4% or 51 of them being unemployed.
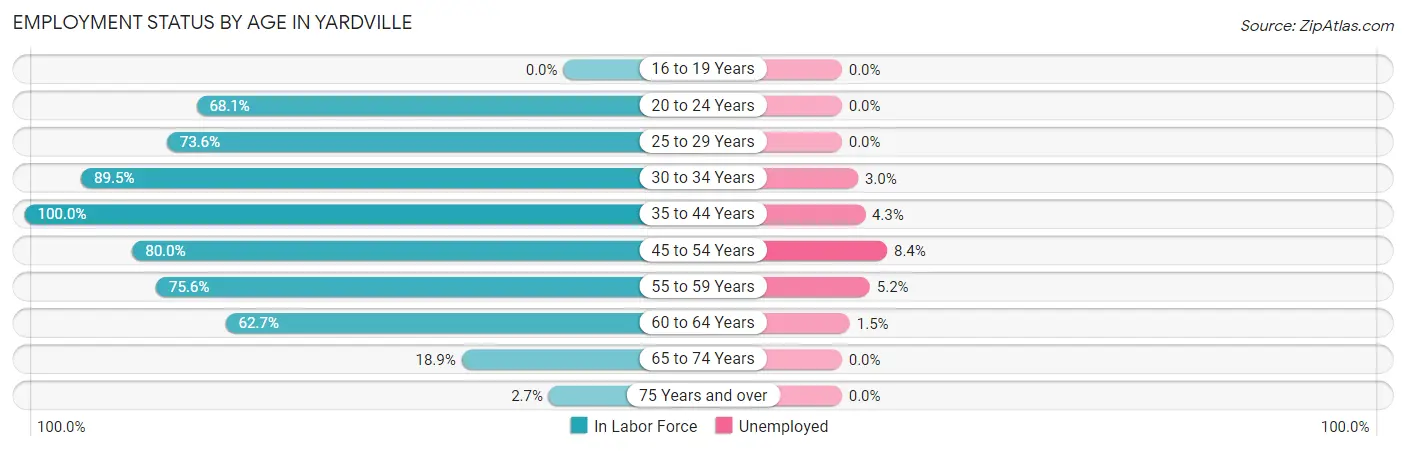
| Age Bracket | In Labor Force | Unemployed |
| 16 to 19 Years | 0 (0.0%) | 0 (0.0%) |
| 20 to 24 Years | 184 (68.1%) | 0 (0.0%) |
| 25 to 29 Years | 362 (73.6%) | 0 (0.0%) |
| 30 to 34 Years | 565 (89.5%) | 17 (3.0%) |
| 35 to 44 Years | 672 (100.0%) | 29 (4.3%) |
| 45 to 54 Years | 605 (80.0%) | 51 (8.4%) |
| 55 to 59 Years | 288 (75.6%) | 15 (5.2%) |
| 60 to 64 Years | 472 (62.7%) | 7 (1.5%) |
| 65 to 74 Years | 147 (18.9%) | 0 (0.0%) |
| 75 Years and over | 16 (2.7%) | 0 (0.0%) |
| Total | 3,309 (61.4%) | 119 (3.6%) |
Employment Status by Educational Attainment in Yardville
According to labor force statistics for Yardville, 80.4% of individuals (2,963) out of the total population between 25 and 64 years of age (3,685) are in the labor force, with 4.0% or 119 of them being unemployed. The group with the highest labor force participation rate are those with the educational attainment of bachelor's degree or higher, with 92.2% or 1,146 individuals in the labor force. Within the labor force, individuals with less than high school education have the highest percentage of unemployment, with 8.3% or 15 of them being unemployed.
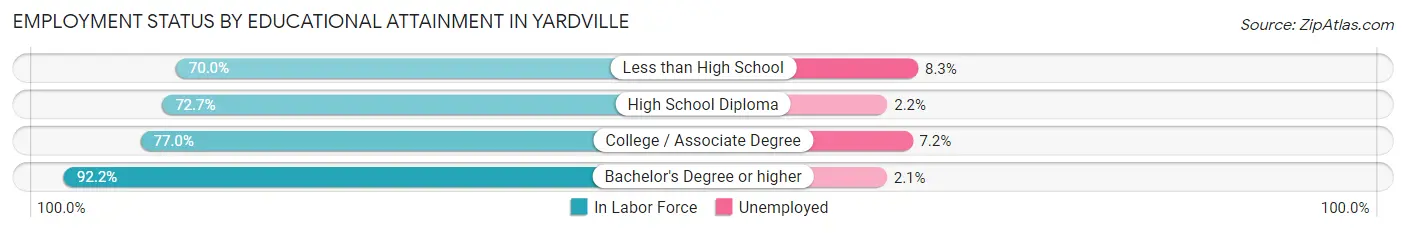
| Educational Attainment | In Labor Force | Unemployed |
| Less than High School | 180 (70.0%) | 21 (8.3%) |
| High School Diploma | 759 (72.7%) | 23 (2.2%) |
| College / Associate Degree | 879 (77.0%) | 82 (7.2%) |
| Bachelor's Degree or higher | 1,146 (92.2%) | 26 (2.1%) |
| Total | 2,963 (80.4%) | 147 (4.0%) |
Employment Occupations by Sex in Yardville
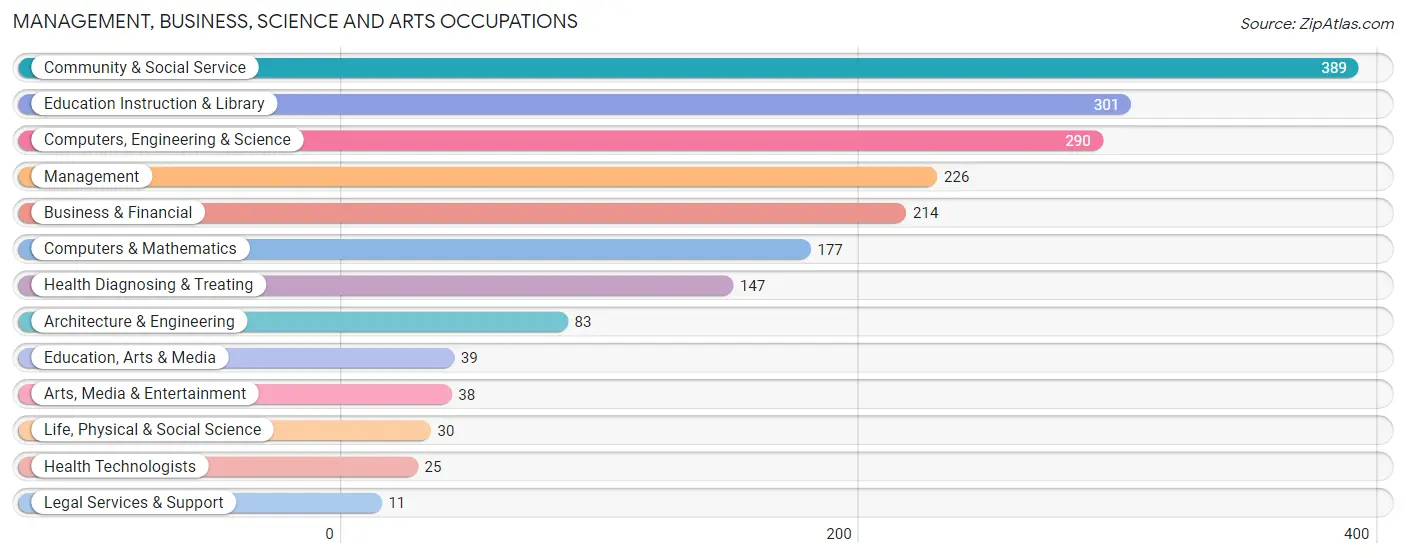
Management, Business, Science and Arts Occupations
The most common Management, Business, Science and Arts occupations in Yardville are Community & Social Service (389 | 12.2%), Education Instruction & Library (301 | 9.4%), Computers, Engineering & Science (290 | 9.1%), Management (226 | 7.1%), and Business & Financial (214 | 6.7%).
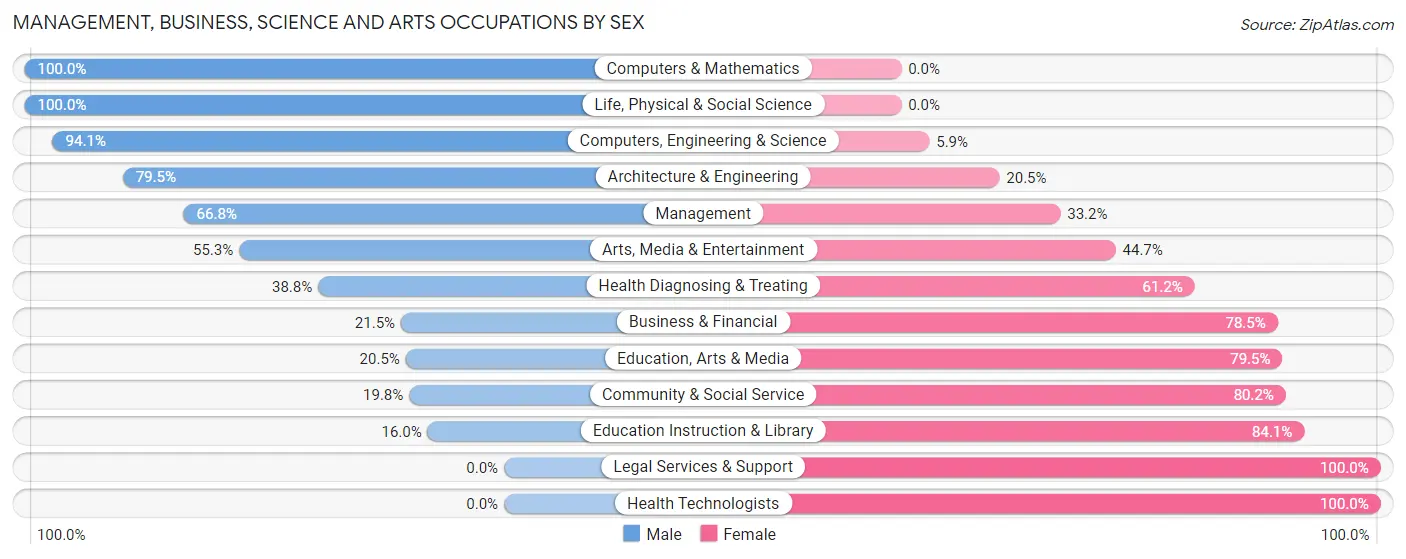
Management, Business, Science and Arts Occupations by Sex
Within the Management, Business, Science and Arts occupations in Yardville, the most male-oriented occupations are Computers & Mathematics (100.0%), Life, Physical & Social Science (100.0%), and Computers, Engineering & Science (94.1%), while the most female-oriented occupations are Legal Services & Support (100.0%), Health Technologists (100.0%), and Education Instruction & Library (84.1%).
| Occupation | Male | Female |
| Management | 151 (66.8%) | 75 (33.2%) |
| Business & Financial | 46 (21.5%) | 168 (78.5%) |
| Computers, Engineering & Science | 273 (94.1%) | 17 (5.9%) |
| Computers & Mathematics | 177 (100.0%) | 0 (0.0%) |
| Architecture & Engineering | 66 (79.5%) | 17 (20.5%) |
| Life, Physical & Social Science | 30 (100.0%) | 0 (0.0%) |
| Community & Social Service | 77 (19.8%) | 312 (80.2%) |
| Education, Arts & Media | 8 (20.5%) | 31 (79.5%) |
| Legal Services & Support | 0 (0.0%) | 11 (100.0%) |
| Education Instruction & Library | 48 (16.0%) | 253 (84.1%) |
| Arts, Media & Entertainment | 21 (55.3%) | 17 (44.7%) |
| Health Diagnosing & Treating | 57 (38.8%) | 90 (61.2%) |
| Health Technologists | 0 (0.0%) | 25 (100.0%) |
| Total (Category) | 604 (47.7%) | 662 (52.3%) |
| Total (Overall) | 1,762 (55.2%) | 1,430 (44.8%) |
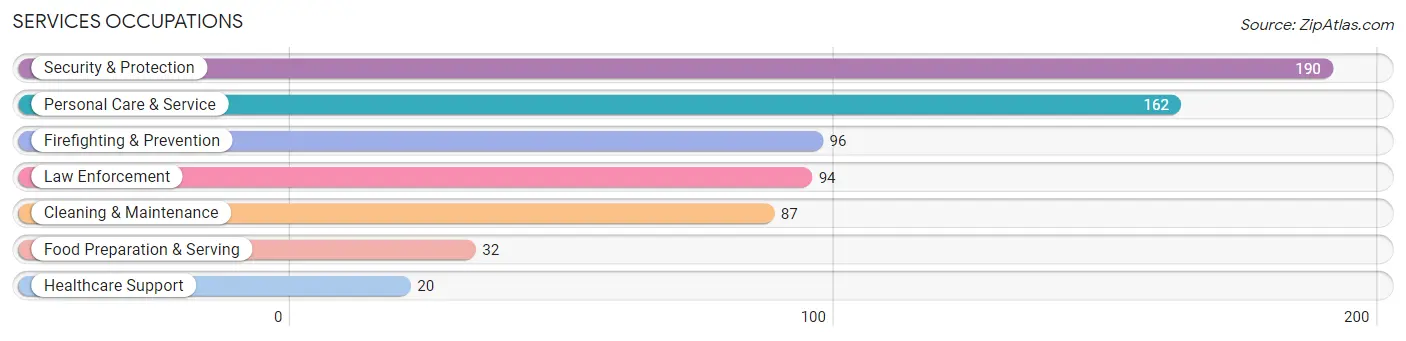
Services Occupations
The most common Services occupations in Yardville are Security & Protection (190 | 5.9%), Personal Care & Service (162 | 5.1%), Firefighting & Prevention (96 | 3.0%), Law Enforcement (94 | 2.9%), and Cleaning & Maintenance (87 | 2.7%).
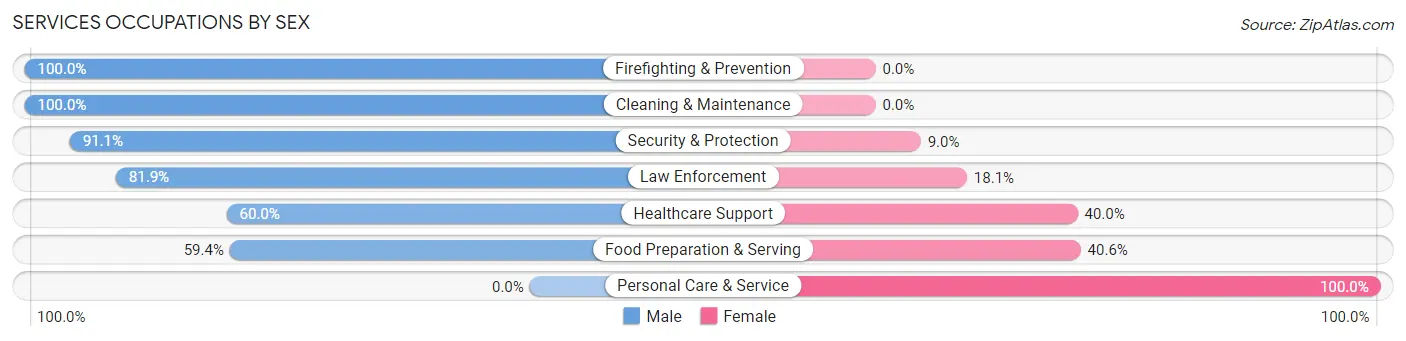
Services Occupations by Sex
Within the Services occupations in Yardville, the most male-oriented occupations are Firefighting & Prevention (100.0%), Cleaning & Maintenance (100.0%), and Security & Protection (91.0%), while the most female-oriented occupations are Personal Care & Service (100.0%), Food Preparation & Serving (40.6%), and Healthcare Support (40.0%).
| Occupation | Male | Female |
| Healthcare Support | 12 (60.0%) | 8 (40.0%) |
| Security & Protection | 173 (91.0%) | 17 (8.9%) |
| Firefighting & Prevention | 96 (100.0%) | 0 (0.0%) |
| Law Enforcement | 77 (81.9%) | 17 (18.1%) |
| Food Preparation & Serving | 19 (59.4%) | 13 (40.6%) |
| Cleaning & Maintenance | 87 (100.0%) | 0 (0.0%) |
| Personal Care & Service | 0 (0.0%) | 162 (100.0%) |
| Total (Category) | 291 (59.3%) | 200 (40.7%) |
| Total (Overall) | 1,762 (55.2%) | 1,430 (44.8%) |
Sales and Office Occupations
The most common Sales and Office occupations in Yardville are Office & Administration (602 | 18.9%), and Sales & Related (123 | 3.8%).
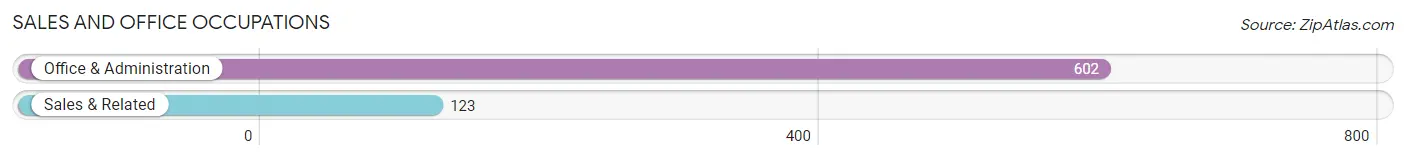
Sales and Office Occupations by Sex
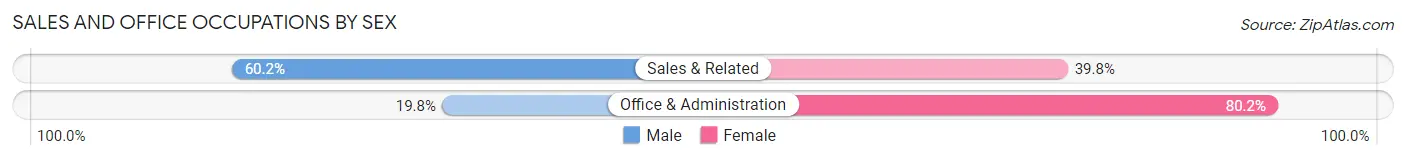
| Occupation | Male | Female |
| Sales & Related | 74 (60.2%) | 49 (39.8%) |
| Office & Administration | 119 (19.8%) | 483 (80.2%) |
| Total (Category) | 193 (26.6%) | 532 (73.4%) |
| Total (Overall) | 1,762 (55.2%) | 1,430 (44.8%) |
Natural Resources, Construction and Maintenance Occupations
The most common Natural Resources, Construction and Maintenance occupations in Yardville are Construction & Extraction (304 | 9.5%), and Installation, Maintenance & Repair (117 | 3.7%).
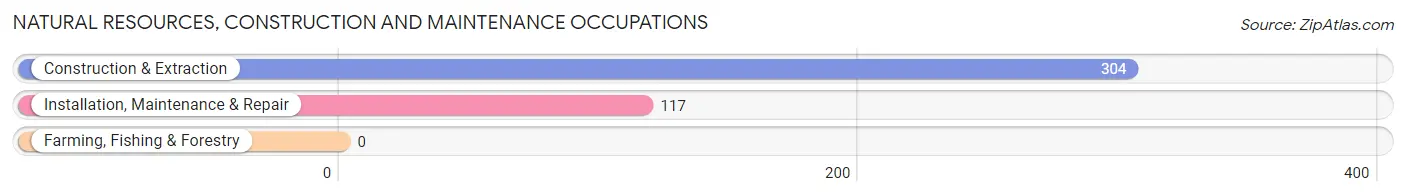
Natural Resources, Construction and Maintenance Occupations by Sex
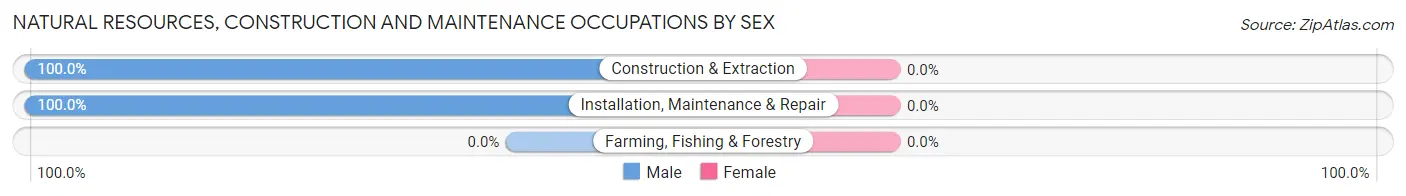
| Occupation | Male | Female |
| Farming, Fishing & Forestry | 0 (0.0%) | 0 (0.0%) |
| Construction & Extraction | 304 (100.0%) | 0 (0.0%) |
| Installation, Maintenance & Repair | 117 (100.0%) | 0 (0.0%) |
| Total (Category) | 421 (100.0%) | 0 (0.0%) |
| Total (Overall) | 1,762 (55.2%) | 1,430 (44.8%) |
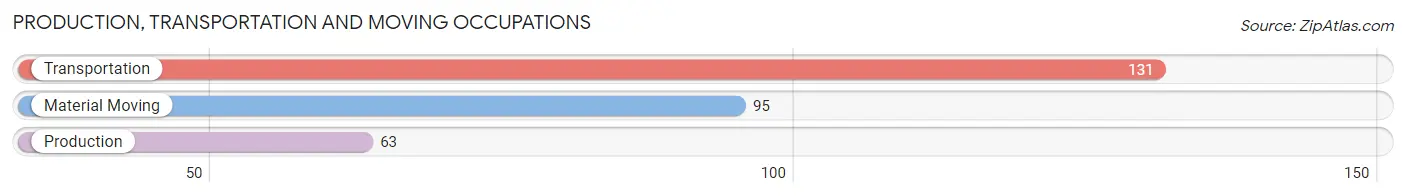
Production, Transportation and Moving Occupations
The most common Production, Transportation and Moving occupations in Yardville are Transportation (131 | 4.1%), Material Moving (95 | 3.0%), and Production (63 | 2.0%).
Production, Transportation and Moving Occupations by Sex
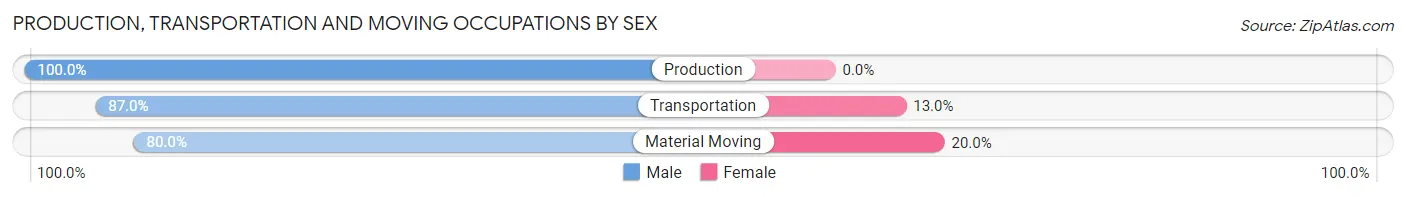
| Occupation | Male | Female |
| Production | 63 (100.0%) | 0 (0.0%) |
| Transportation | 114 (87.0%) | 17 (13.0%) |
| Material Moving | 76 (80.0%) | 19 (20.0%) |
| Total (Category) | 253 (87.5%) | 36 (12.5%) |
| Total (Overall) | 1,762 (55.2%) | 1,430 (44.8%) |
Employment Industries by Sex in Yardville
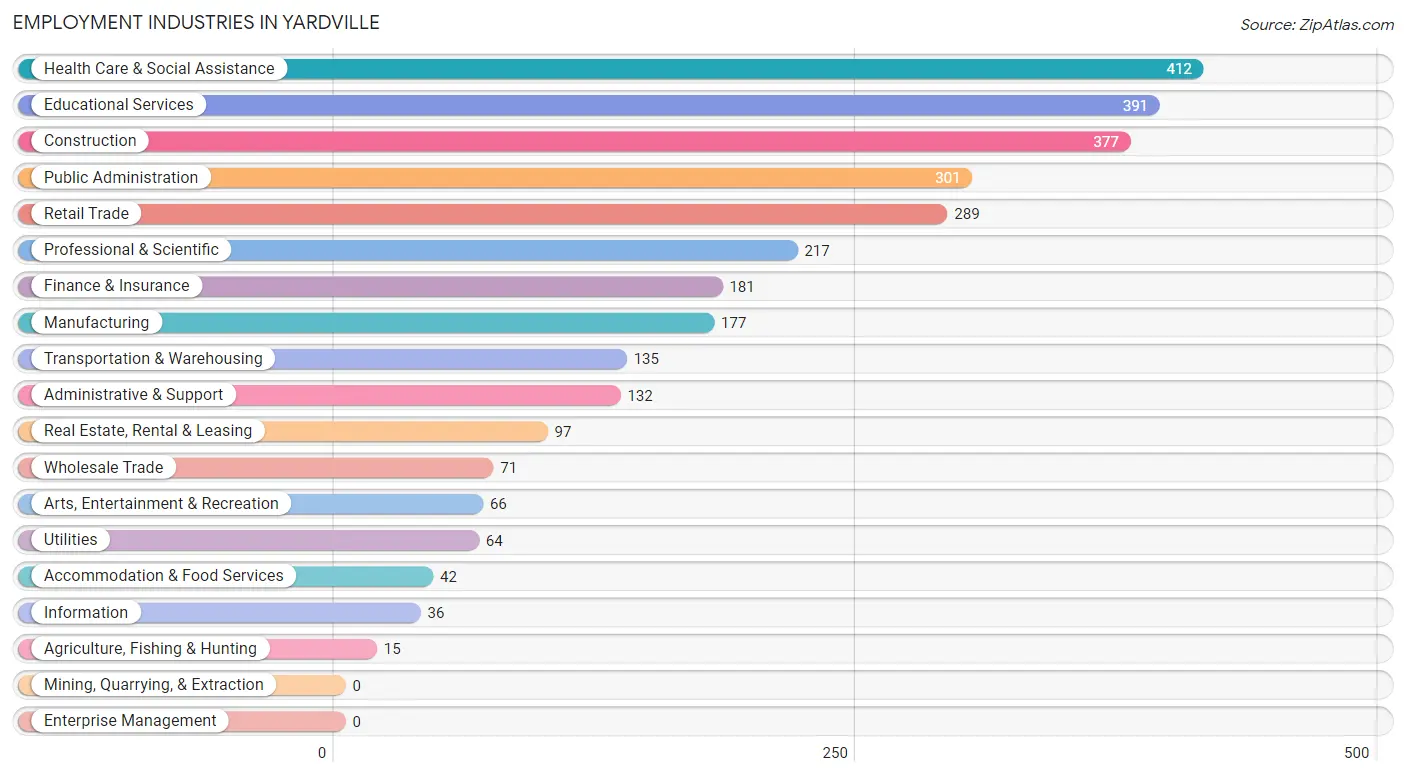
Employment Industries in Yardville
The major employment industries in Yardville include Health Care & Social Assistance (412 | 12.9%), Educational Services (391 | 12.2%), Construction (377 | 11.8%), Public Administration (301 | 9.4%), and Retail Trade (289 | 9.0%).
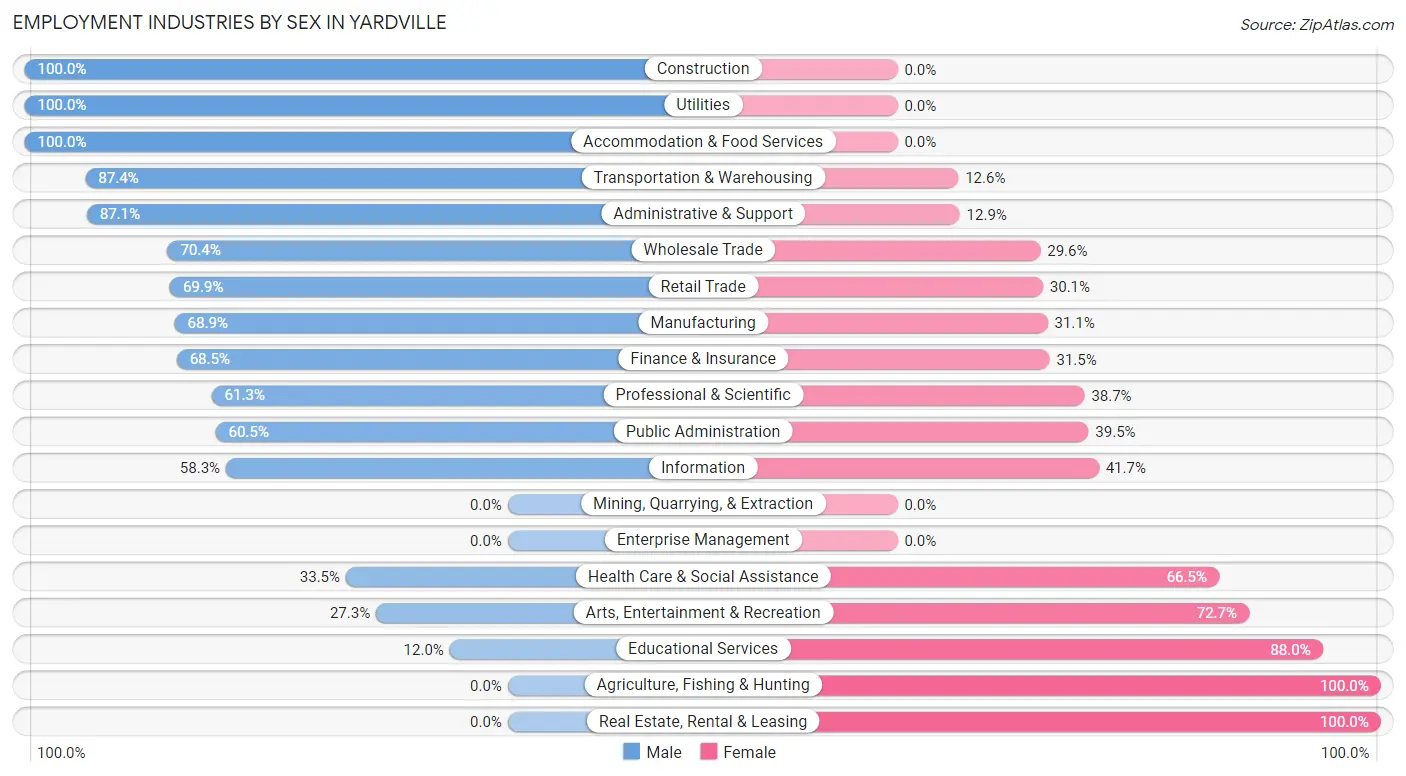
Employment Industries by Sex in Yardville
The Yardville industries that see more men than women are Construction (100.0%), Utilities (100.0%), and Accommodation & Food Services (100.0%), whereas the industries that tend to have a higher number of women are Agriculture, Fishing & Hunting (100.0%), Real Estate, Rental & Leasing (100.0%), and Educational Services (88.0%).
| Industry | Male | Female |
| Agriculture, Fishing & Hunting | 0 (0.0%) | 15 (100.0%) |
| Mining, Quarrying, & Extraction | 0 (0.0%) | 0 (0.0%) |
| Construction | 377 (100.0%) | 0 (0.0%) |
| Manufacturing | 122 (68.9%) | 55 (31.1%) |
| Wholesale Trade | 50 (70.4%) | 21 (29.6%) |
| Retail Trade | 202 (69.9%) | 87 (30.1%) |
| Transportation & Warehousing | 118 (87.4%) | 17 (12.6%) |
| Utilities | 64 (100.0%) | 0 (0.0%) |
| Information | 21 (58.3%) | 15 (41.7%) |
| Finance & Insurance | 124 (68.5%) | 57 (31.5%) |
| Real Estate, Rental & Leasing | 0 (0.0%) | 97 (100.0%) |
| Professional & Scientific | 133 (61.3%) | 84 (38.7%) |
| Enterprise Management | 0 (0.0%) | 0 (0.0%) |
| Administrative & Support | 115 (87.1%) | 17 (12.9%) |
| Educational Services | 47 (12.0%) | 344 (88.0%) |
| Health Care & Social Assistance | 138 (33.5%) | 274 (66.5%) |
| Arts, Entertainment & Recreation | 18 (27.3%) | 48 (72.7%) |
| Accommodation & Food Services | 42 (100.0%) | 0 (0.0%) |
| Public Administration | 182 (60.5%) | 119 (39.5%) |
| Total | 1,762 (55.2%) | 1,430 (44.8%) |
Education in Yardville
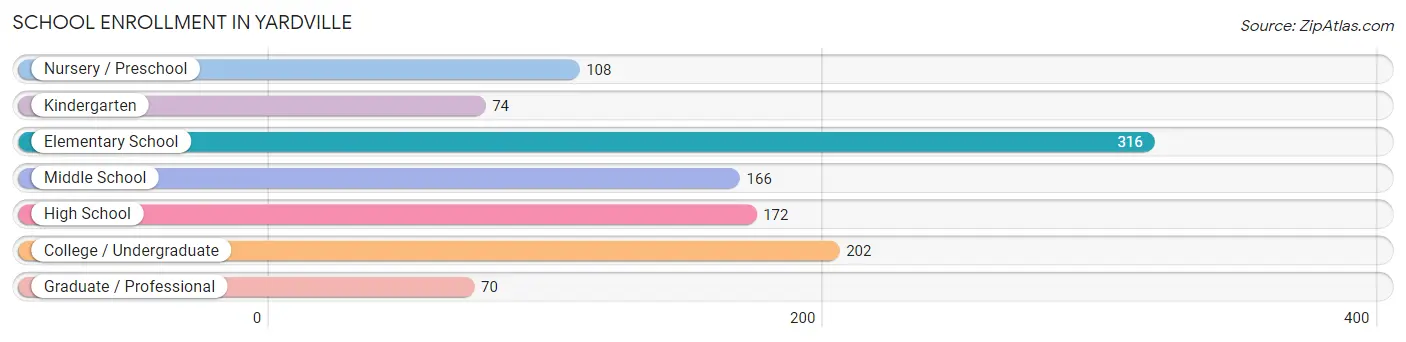
School Enrollment in Yardville
The most common levels of schooling among the 1,108 students in Yardville are elementary school (316 | 28.5%), college / undergraduate (202 | 18.2%), and high school (172 | 15.5%).
| School Level | # Students | % Students |
| Nursery / Preschool | 108 | 9.8% |
| Kindergarten | 74 | 6.7% |
| Elementary School | 316 | 28.5% |
| Middle School | 166 | 15.0% |
| High School | 172 | 15.5% |
| College / Undergraduate | 202 | 18.2% |
| Graduate / Professional | 70 | 6.3% |
| Total | 1,108 | 100.0% |
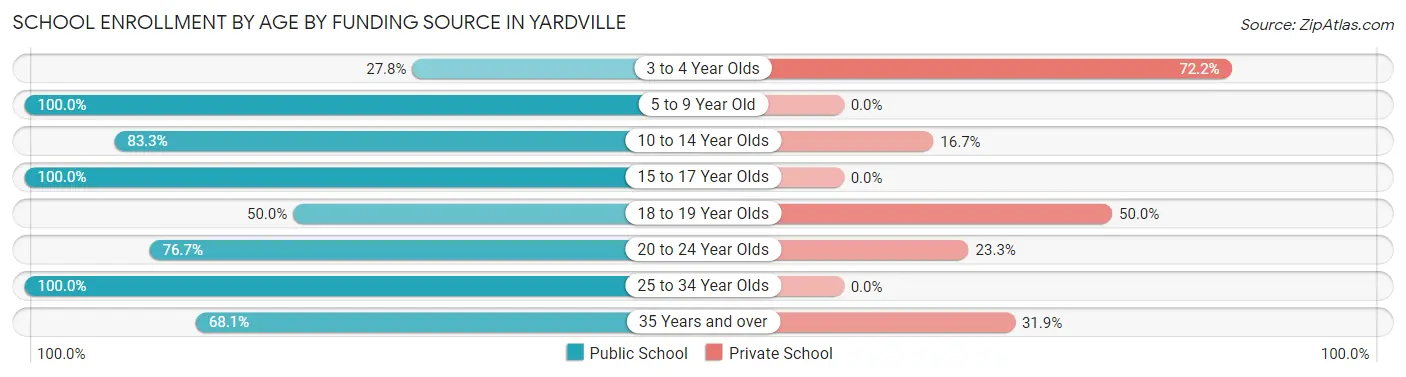
School Enrollment by Age by Funding Source in Yardville
Out of a total of 1,108 students who are enrolled in schools in Yardville, 188 (17.0%) attend a private institution, while the remaining 920 (83.0%) are enrolled in public schools. The age group of 3 to 4 year olds has the highest likelihood of being enrolled in private schools, with 78 (72.2% in the age bracket) enrolled. Conversely, the age group of 5 to 9 year old has the lowest likelihood of being enrolled in a private school, with 332 (100.0% in the age bracket) attending a public institution.
| Age Bracket | Public School | Private School |
| 3 to 4 Year Olds | 30 (27.8%) | 78 (72.2%) |
| 5 to 9 Year Old | 332 (100.0%) | 0 (0.0%) |
| 10 to 14 Year Olds | 254 (83.3%) | 51 (16.7%) |
| 15 to 17 Year Olds | 83 (100.0%) | 0 (0.0%) |
| 18 to 19 Year Olds | 17 (50.0%) | 17 (50.0%) |
| 20 to 24 Year Olds | 89 (76.7%) | 27 (23.3%) |
| 25 to 34 Year Olds | 83 (100.0%) | 0 (0.0%) |
| 35 Years and over | 32 (68.1%) | 15 (31.9%) |
| Total | 920 (83.0%) | 188 (17.0%) |
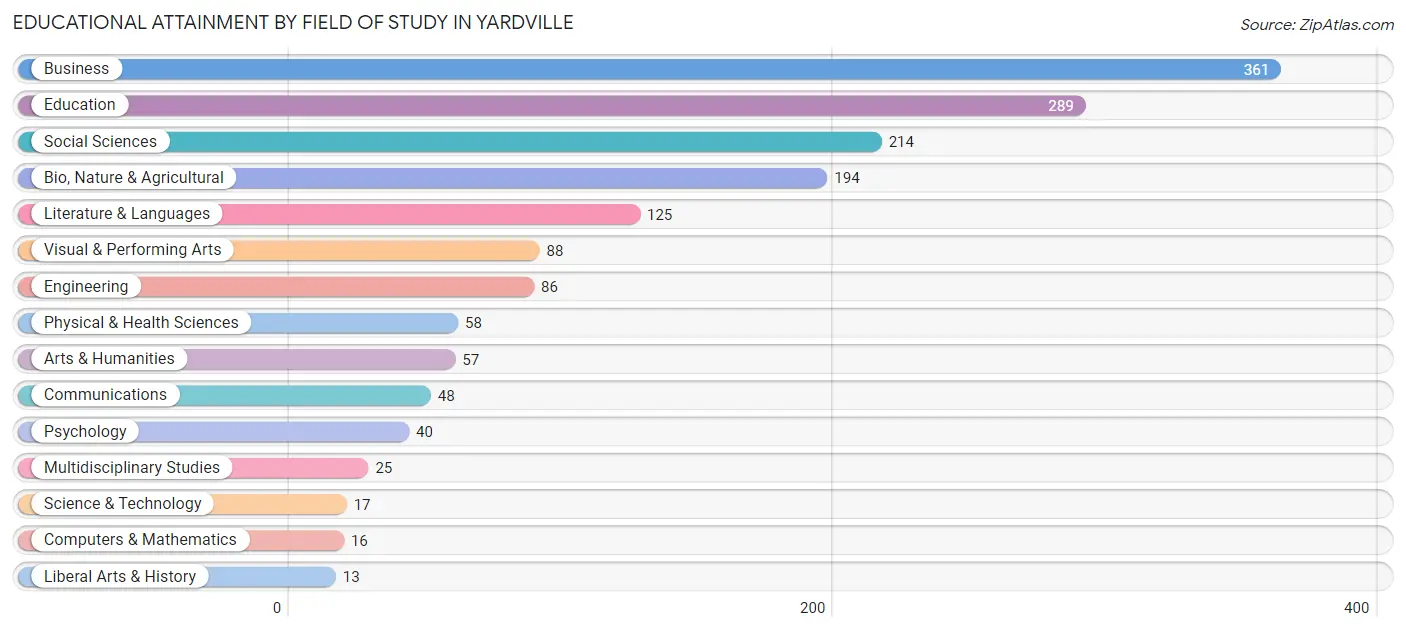
Educational Attainment by Field of Study in Yardville
Business (361 | 22.1%), education (289 | 17.7%), social sciences (214 | 13.1%), bio, nature & agricultural (194 | 11.9%), and literature & languages (125 | 7.7%) are the most common fields of study among 1,631 individuals in Yardville who have obtained a bachelor's degree or higher.
| Field of Study | # Graduates | % Graduates |
| Computers & Mathematics | 16 | 1.0% |
| Bio, Nature & Agricultural | 194 | 11.9% |
| Physical & Health Sciences | 58 | 3.6% |
| Psychology | 40 | 2.5% |
| Social Sciences | 214 | 13.1% |
| Engineering | 86 | 5.3% |
| Multidisciplinary Studies | 25 | 1.5% |
| Science & Technology | 17 | 1.0% |
| Business | 361 | 22.1% |
| Education | 289 | 17.7% |
| Literature & Languages | 125 | 7.7% |
| Liberal Arts & History | 13 | 0.8% |
| Visual & Performing Arts | 88 | 5.4% |
| Communications | 48 | 2.9% |
| Arts & Humanities | 57 | 3.5% |
| Total | 1,631 | 100.0% |
Transportation & Commute in Yardville
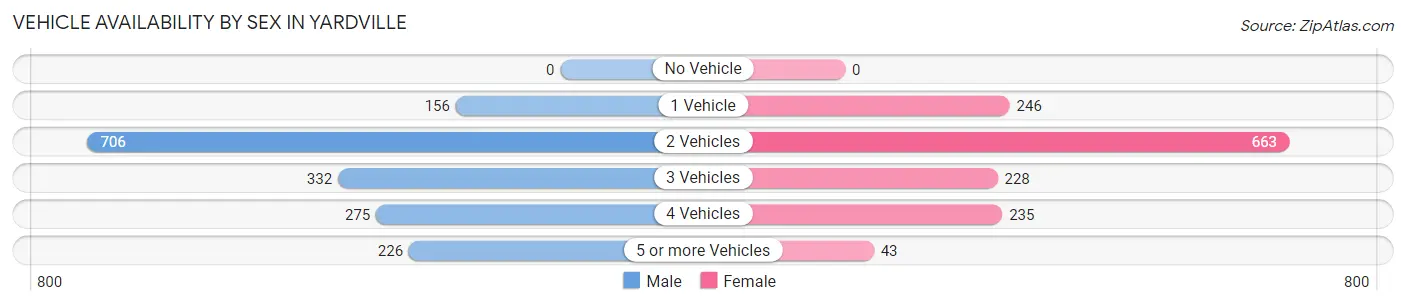
Vehicle Availability by Sex in Yardville
The most prevalent vehicle ownership categories in Yardville are males with 2 vehicles (706, accounting for 41.6%) and females with 2 vehicles (663, making up 49.9%).
| Vehicles Available | Male | Female |
| No Vehicle | 0 (0.0%) | 0 (0.0%) |
| 1 Vehicle | 156 (9.2%) | 246 (17.4%) |
| 2 Vehicles | 706 (41.6%) | 663 (46.9%) |
| 3 Vehicles | 332 (19.6%) | 228 (16.1%) |
| 4 Vehicles | 275 (16.2%) | 235 (16.6%) |
| 5 or more Vehicles | 226 (13.3%) | 43 (3.0%) |
| Total | 1,695 (100.0%) | 1,415 (100.0%) |
Commute Time in Yardville
The most frequently occuring commute durations in Yardville are 15 to 19 minutes (541 commuters, 19.1%), 20 to 24 minutes (476 commuters, 16.8%), and 60 to 89 minutes (396 commuters, 14.0%).
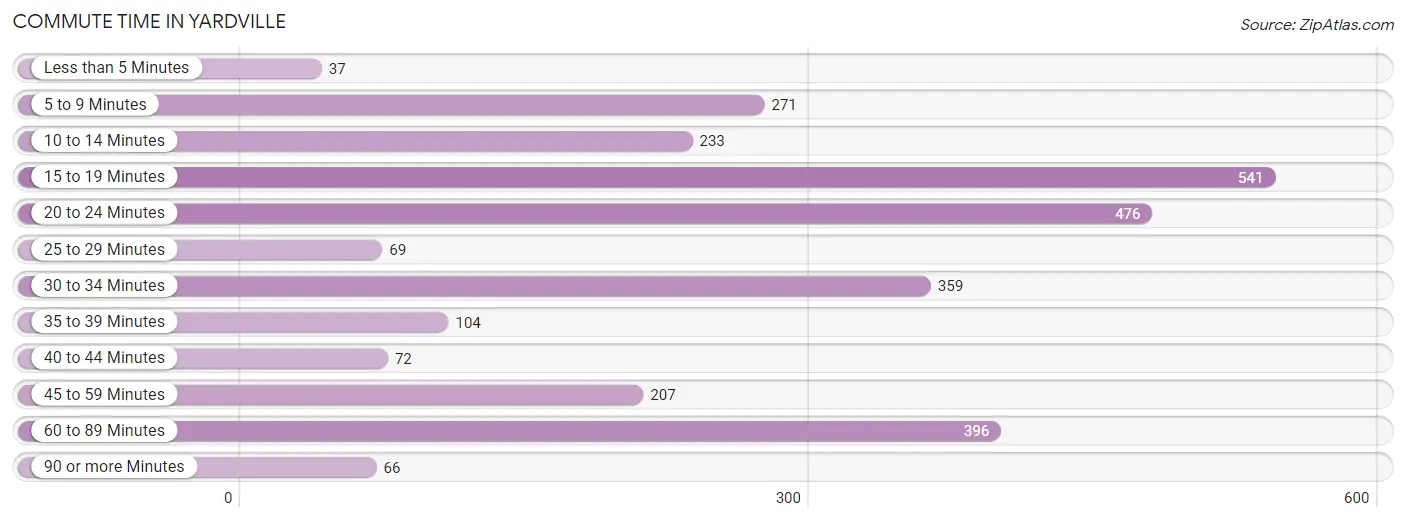
| Commute Time | # Commuters | % Commuters |
| Less than 5 Minutes | 37 | 1.3% |
| 5 to 9 Minutes | 271 | 9.6% |
| 10 to 14 Minutes | 233 | 8.2% |
| 15 to 19 Minutes | 541 | 19.1% |
| 20 to 24 Minutes | 476 | 16.8% |
| 25 to 29 Minutes | 69 | 2.4% |
| 30 to 34 Minutes | 359 | 12.7% |
| 35 to 39 Minutes | 104 | 3.7% |
| 40 to 44 Minutes | 72 | 2.5% |
| 45 to 59 Minutes | 207 | 7.3% |
| 60 to 89 Minutes | 396 | 14.0% |
| 90 or more Minutes | 66 | 2.3% |
Commute Time by Sex in Yardville
The most common commute times in Yardville are 20 to 24 minutes (324 commuters, 20.5%) for males and 15 to 19 minutes (219 commuters, 17.5%) for females.
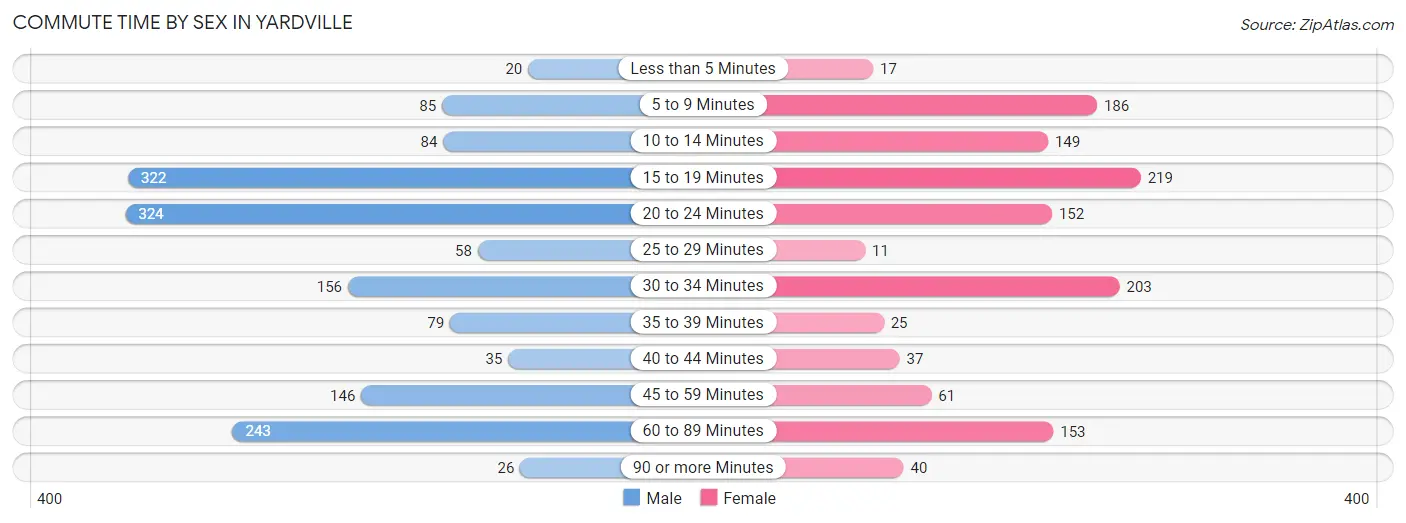
| Commute Time | Male | Female |
| Less than 5 Minutes | 20 (1.3%) | 17 (1.4%) |
| 5 to 9 Minutes | 85 (5.4%) | 186 (14.8%) |
| 10 to 14 Minutes | 84 (5.3%) | 149 (11.9%) |
| 15 to 19 Minutes | 322 (20.4%) | 219 (17.5%) |
| 20 to 24 Minutes | 324 (20.5%) | 152 (12.1%) |
| 25 to 29 Minutes | 58 (3.7%) | 11 (0.9%) |
| 30 to 34 Minutes | 156 (9.9%) | 203 (16.2%) |
| 35 to 39 Minutes | 79 (5.0%) | 25 (2.0%) |
| 40 to 44 Minutes | 35 (2.2%) | 37 (2.9%) |
| 45 to 59 Minutes | 146 (9.2%) | 61 (4.9%) |
| 60 to 89 Minutes | 243 (15.4%) | 153 (12.2%) |
| 90 or more Minutes | 26 (1.7%) | 40 (3.2%) |
Time of Departure to Work by Sex in Yardville
The most frequent times of departure to work in Yardville are 7:00 AM to 7:29 AM (368, 23.3%) for males and 8:30 AM to 8:59 AM (343, 27.4%) for females.
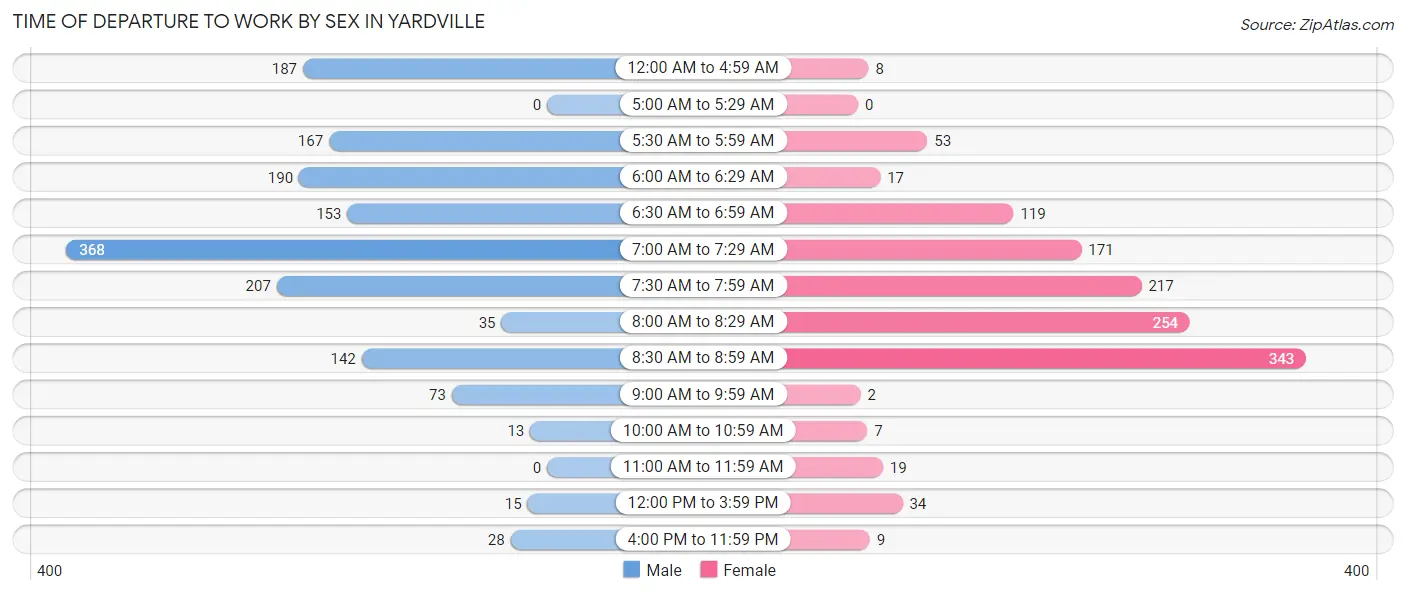
| Time of Departure | Male | Female |
| 12:00 AM to 4:59 AM | 187 (11.8%) | 8 (0.6%) |
| 5:00 AM to 5:29 AM | 0 (0.0%) | 0 (0.0%) |
| 5:30 AM to 5:59 AM | 167 (10.6%) | 53 (4.2%) |
| 6:00 AM to 6:29 AM | 190 (12.0%) | 17 (1.4%) |
| 6:30 AM to 6:59 AM | 153 (9.7%) | 119 (9.5%) |
| 7:00 AM to 7:29 AM | 368 (23.3%) | 171 (13.7%) |
| 7:30 AM to 7:59 AM | 207 (13.1%) | 217 (17.3%) |
| 8:00 AM to 8:29 AM | 35 (2.2%) | 254 (20.3%) |
| 8:30 AM to 8:59 AM | 142 (9.0%) | 343 (27.4%) |
| 9:00 AM to 9:59 AM | 73 (4.6%) | 2 (0.2%) |
| 10:00 AM to 10:59 AM | 13 (0.8%) | 7 (0.6%) |
| 11:00 AM to 11:59 AM | 0 (0.0%) | 19 (1.5%) |
| 12:00 PM to 3:59 PM | 15 (0.9%) | 34 (2.7%) |
| 4:00 PM to 11:59 PM | 28 (1.8%) | 9 (0.7%) |
| Total | 1,578 (100.0%) | 1,253 (100.0%) |
Housing Occupancy in Yardville
Occupancy by Ownership in Yardville
Of the total 2,622 dwellings in Yardville, owner-occupied units account for 2,239 (85.4%), while renter-occupied units make up 383 (14.6%).
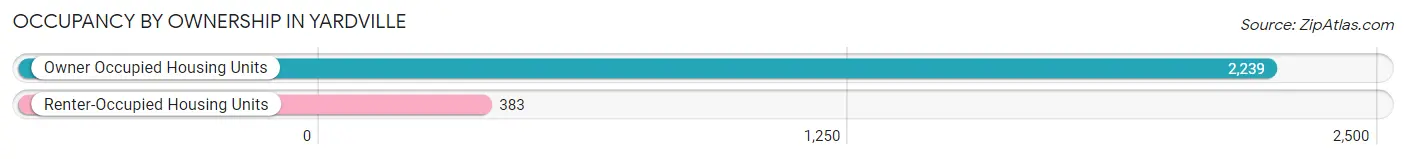
| Occupancy | # Housing Units | % Housing Units |
| Owner Occupied Housing Units | 2,239 | 85.4% |
| Renter-Occupied Housing Units | 383 | 14.6% |
| Total Occupied Housing Units | 2,622 | 100.0% |
Occupancy by Household Size in Yardville
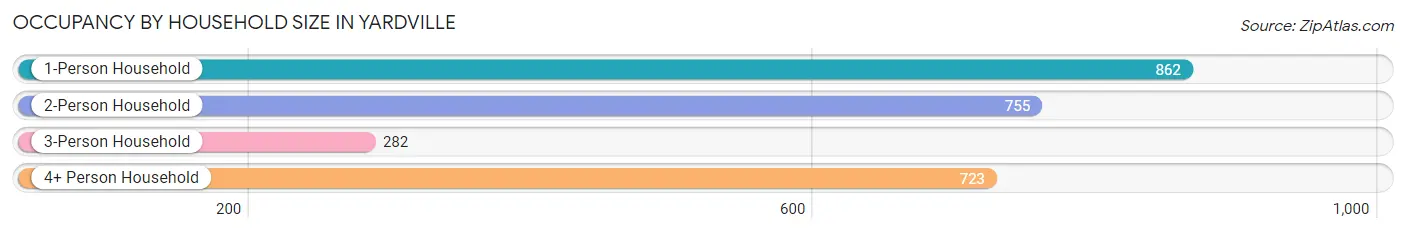
| Household Size | # Housing Units | % Housing Units |
| 1-Person Household | 862 | 32.9% |
| 2-Person Household | 755 | 28.8% |
| 3-Person Household | 282 | 10.8% |
| 4+ Person Household | 723 | 27.6% |
| Total Housing Units | 2,622 | 100.0% |
Occupancy by Ownership by Household Size in Yardville
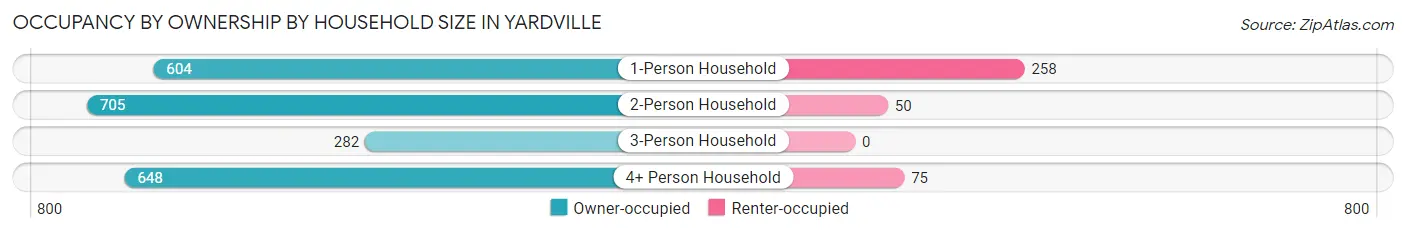
| Household Size | Owner-occupied | Renter-occupied |
| 1-Person Household | 604 (70.1%) | 258 (29.9%) |
| 2-Person Household | 705 (93.4%) | 50 (6.6%) |
| 3-Person Household | 282 (100.0%) | 0 (0.0%) |
| 4+ Person Household | 648 (89.6%) | 75 (10.4%) |
| Total Housing Units | 2,239 (85.4%) | 383 (14.6%) |
Occupancy by Educational Attainment in Yardville
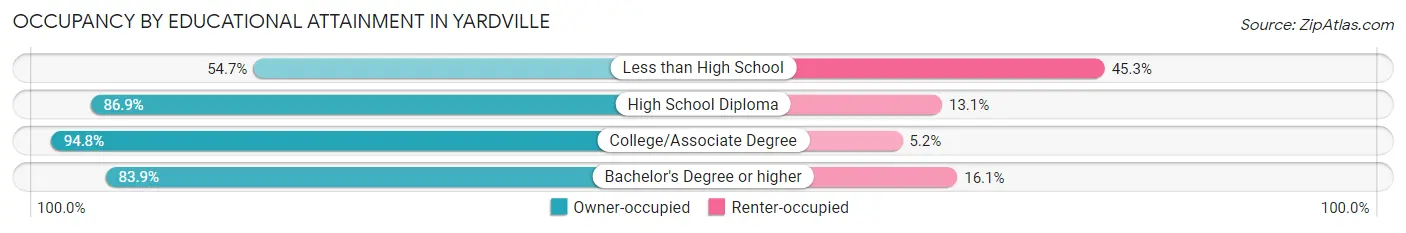
| Household Size | Owner-occupied | Renter-occupied |
| Less than High School | 111 (54.7%) | 92 (45.3%) |
| High School Diploma | 599 (86.9%) | 90 (13.1%) |
| College/Associate Degree | 673 (94.8%) | 37 (5.2%) |
| Bachelor's Degree or higher | 856 (83.9%) | 164 (16.1%) |
Occupancy by Age of Householder in Yardville
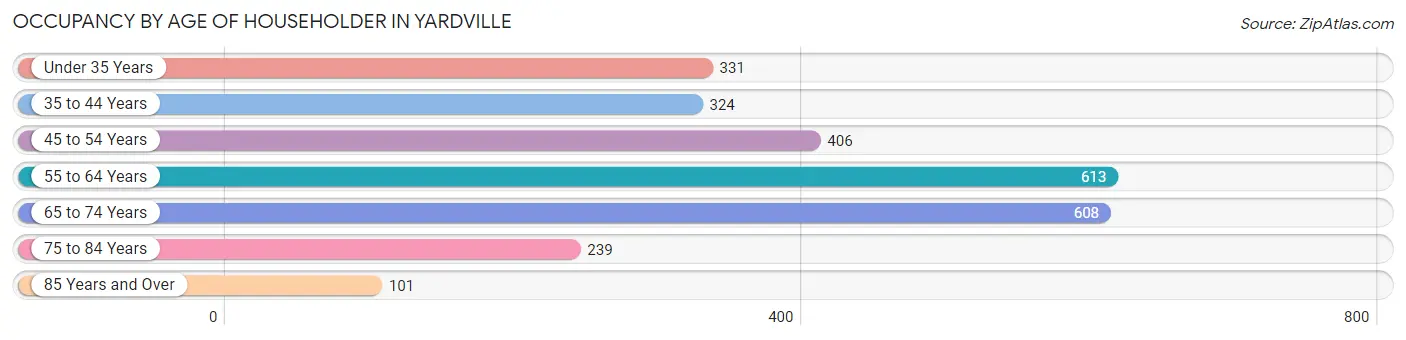
| Age Bracket | # Households | % Households |
| Under 35 Years | 331 | 12.6% |
| 35 to 44 Years | 324 | 12.4% |
| 45 to 54 Years | 406 | 15.5% |
| 55 to 64 Years | 613 | 23.4% |
| 65 to 74 Years | 608 | 23.2% |
| 75 to 84 Years | 239 | 9.1% |
| 85 Years and Over | 101 | 3.8% |
| Total | 2,622 | 100.0% |
Housing Finances in Yardville
Median Income by Occupancy in Yardville
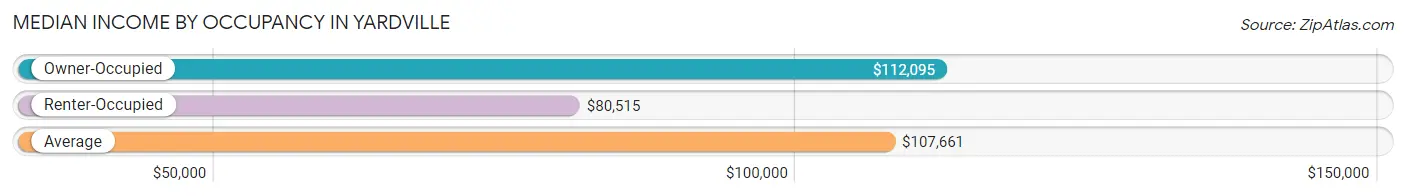
| Occupancy Type | # Households | Median Income |
| Owner-Occupied | 2,239 (85.4%) | $112,095 |
| Renter-Occupied | 383 (14.6%) | $80,515 |
| Average | 2,622 (100.0%) | $107,661 |
Occupancy by Householder Income Bracket in Yardville
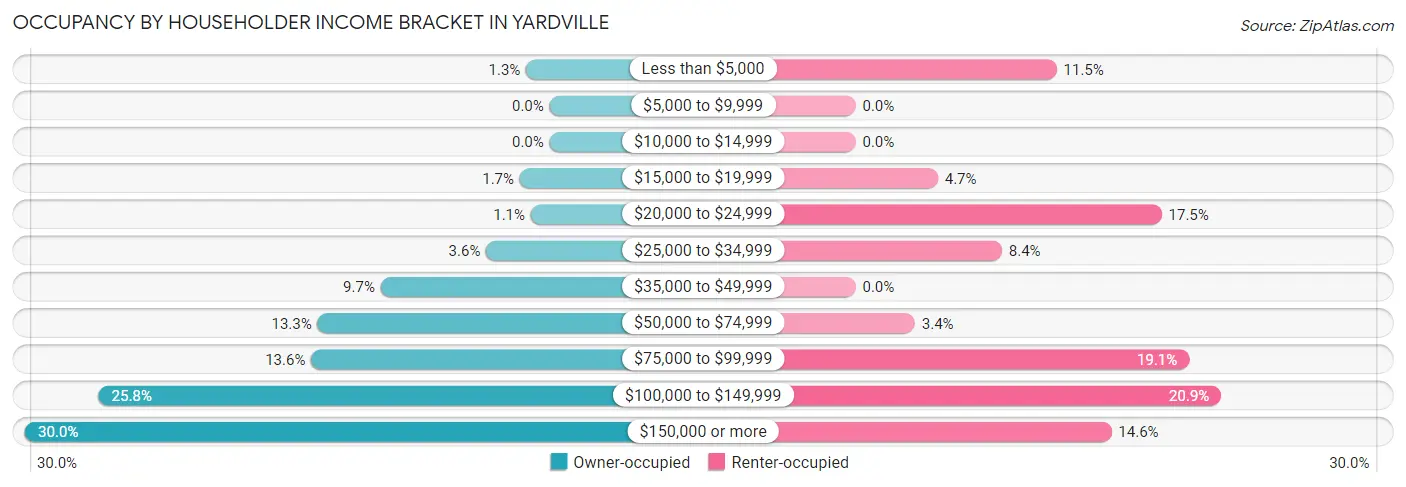
| Income Bracket | Owner-occupied | Renter-occupied |
| Less than $5,000 | 30 (1.3%) | 44 (11.5%) |
| $5,000 to $9,999 | 0 (0.0%) | 0 (0.0%) |
| $10,000 to $14,999 | 0 (0.0%) | 0 (0.0%) |
| $15,000 to $19,999 | 38 (1.7%) | 18 (4.7%) |
| $20,000 to $24,999 | 24 (1.1%) | 67 (17.5%) |
| $25,000 to $34,999 | 81 (3.6%) | 32 (8.4%) |
| $35,000 to $49,999 | 216 (9.7%) | 0 (0.0%) |
| $50,000 to $74,999 | 297 (13.3%) | 13 (3.4%) |
| $75,000 to $99,999 | 305 (13.6%) | 73 (19.1%) |
| $100,000 to $149,999 | 577 (25.8%) | 80 (20.9%) |
| $150,000 or more | 671 (30.0%) | 56 (14.6%) |
| Total | 2,239 (100.0%) | 383 (100.0%) |
Monthly Housing Cost Tiers in Yardville
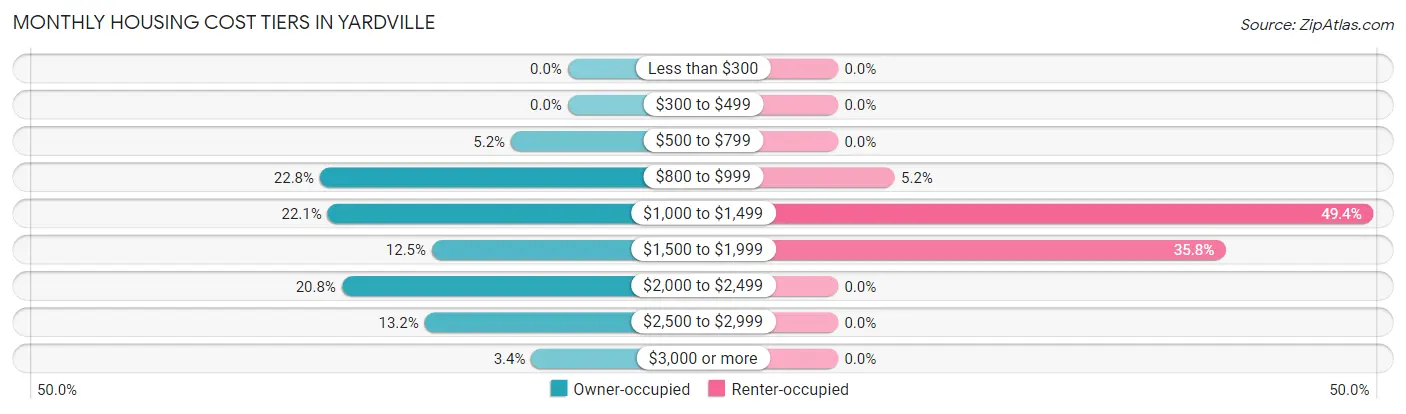
| Monthly Cost | Owner-occupied | Renter-occupied |
| Less than $300 | 0 (0.0%) | 0 (0.0%) |
| $300 to $499 | 0 (0.0%) | 0 (0.0%) |
| $500 to $799 | 117 (5.2%) | 0 (0.0%) |
| $800 to $999 | 511 (22.8%) | 20 (5.2%) |
| $1,000 to $1,499 | 495 (22.1%) | 189 (49.3%) |
| $1,500 to $1,999 | 280 (12.5%) | 137 (35.8%) |
| $2,000 to $2,499 | 466 (20.8%) | 0 (0.0%) |
| $2,500 to $2,999 | 295 (13.2%) | 0 (0.0%) |
| $3,000 or more | 75 (3.4%) | 0 (0.0%) |
| Total | 2,239 (100.0%) | 383 (100.0%) |
Physical Housing Characteristics in Yardville
Housing Structures in Yardville
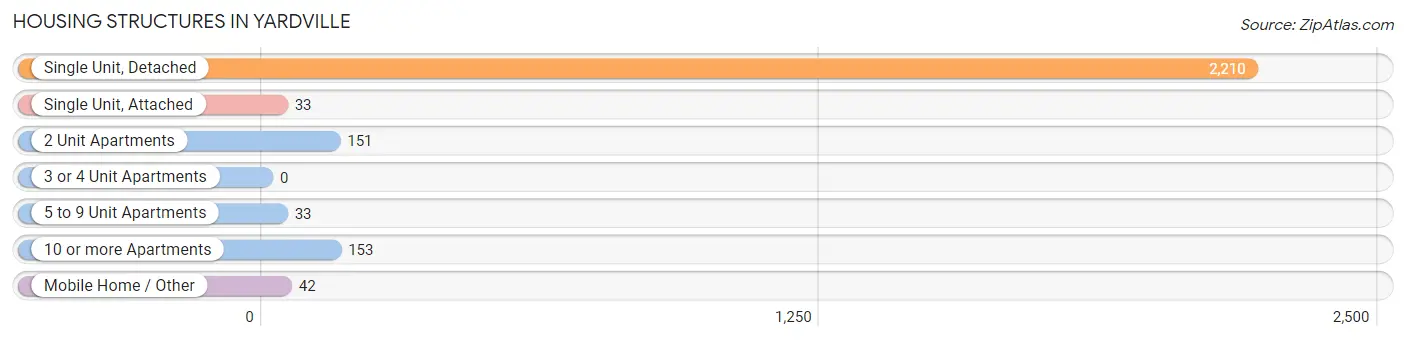
| Structure Type | # Housing Units | % Housing Units |
| Single Unit, Detached | 2,210 | 84.3% |
| Single Unit, Attached | 33 | 1.3% |
| 2 Unit Apartments | 151 | 5.8% |
| 3 or 4 Unit Apartments | 0 | 0.0% |
| 5 to 9 Unit Apartments | 33 | 1.3% |
| 10 or more Apartments | 153 | 5.8% |
| Mobile Home / Other | 42 | 1.6% |
| Total | 2,622 | 100.0% |
Housing Structures by Occupancy in Yardville
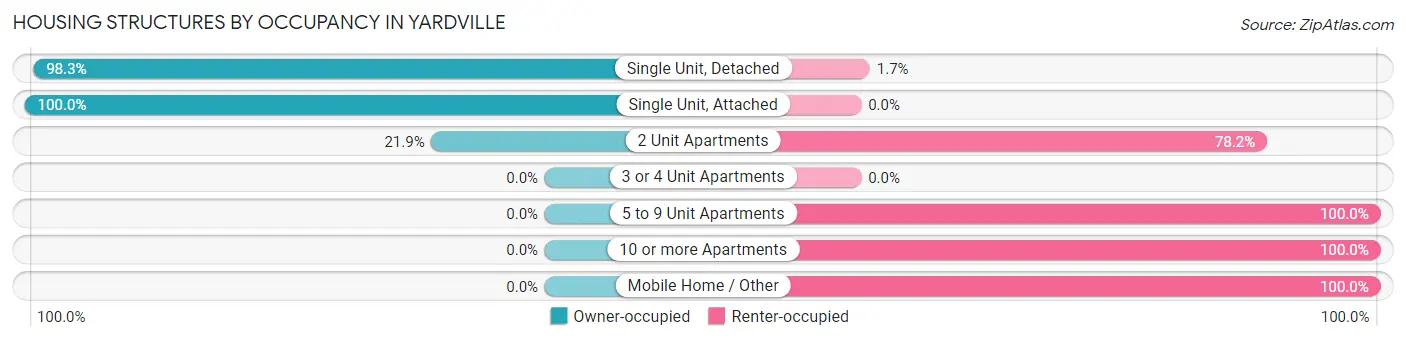
| Structure Type | Owner-occupied | Renter-occupied |
| Single Unit, Detached | 2,173 (98.3%) | 37 (1.7%) |
| Single Unit, Attached | 33 (100.0%) | 0 (0.0%) |
| 2 Unit Apartments | 33 (21.8%) | 118 (78.1%) |
| 3 or 4 Unit Apartments | 0 (0.0%) | 0 (0.0%) |
| 5 to 9 Unit Apartments | 0 (0.0%) | 33 (100.0%) |
| 10 or more Apartments | 0 (0.0%) | 153 (100.0%) |
| Mobile Home / Other | 0 (0.0%) | 42 (100.0%) |
| Total | 2,239 (85.4%) | 383 (14.6%) |
Housing Structures by Number of Rooms in Yardville
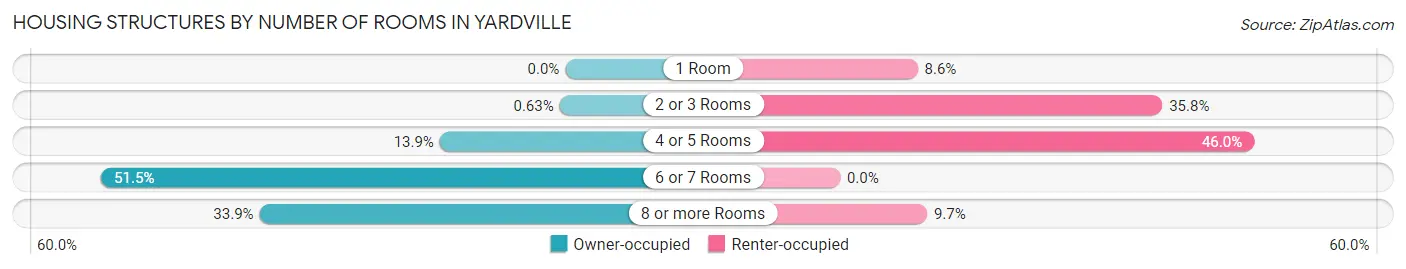
| Number of Rooms | Owner-occupied | Renter-occupied |
| 1 Room | 0 (0.0%) | 33 (8.6%) |
| 2 or 3 Rooms | 14 (0.6%) | 137 (35.8%) |
| 4 or 5 Rooms | 312 (13.9%) | 176 (46.0%) |
| 6 or 7 Rooms | 1,153 (51.5%) | 0 (0.0%) |
| 8 or more Rooms | 760 (33.9%) | 37 (9.7%) |
| Total | 2,239 (100.0%) | 383 (100.0%) |
Housing Structure by Heating Type in Yardville
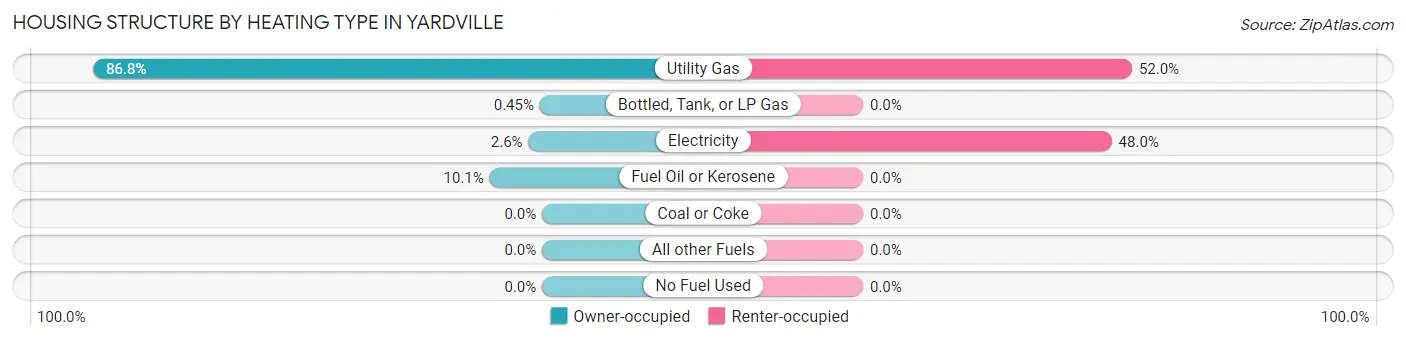
| Heating Type | Owner-occupied | Renter-occupied |
| Utility Gas | 1,943 (86.8%) | 199 (52.0%) |
| Bottled, Tank, or LP Gas | 10 (0.4%) | 0 (0.0%) |
| Electricity | 59 (2.6%) | 184 (48.0%) |
| Fuel Oil or Kerosene | 227 (10.1%) | 0 (0.0%) |
| Coal or Coke | 0 (0.0%) | 0 (0.0%) |
| All other Fuels | 0 (0.0%) | 0 (0.0%) |
| No Fuel Used | 0 (0.0%) | 0 (0.0%) |
| Total | 2,239 (100.0%) | 383 (100.0%) |
Household Vehicle Usage in Yardville
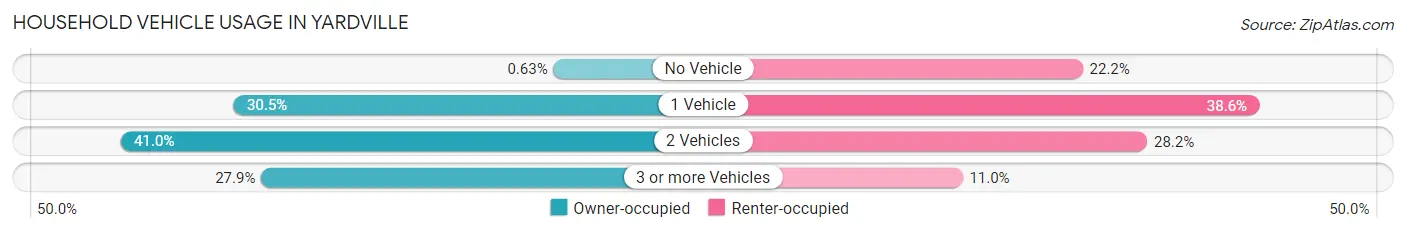
| Vehicles per Household | Owner-occupied | Renter-occupied |
| No Vehicle | 14 (0.6%) | 85 (22.2%) |
| 1 Vehicle | 682 (30.5%) | 148 (38.6%) |
| 2 Vehicles | 918 (41.0%) | 108 (28.2%) |
| 3 or more Vehicles | 625 (27.9%) | 42 (11.0%) |
| Total | 2,239 (100.0%) | 383 (100.0%) |
Real Estate & Mortgages in Yardville
Real Estate and Mortgage Overview in Yardville
| Characteristic | Without Mortgage | With Mortgage |
| Housing Units | 1,029 | 1,210 |
| Median Property Value | $290,000 | $309,000 |
| Median Household Income | $61,406 | $363 |
| Monthly Housing Costs | $971 | $75 |
| Real Estate Taxes | $8,119 | $0 |
Property Value by Mortgage Status in Yardville
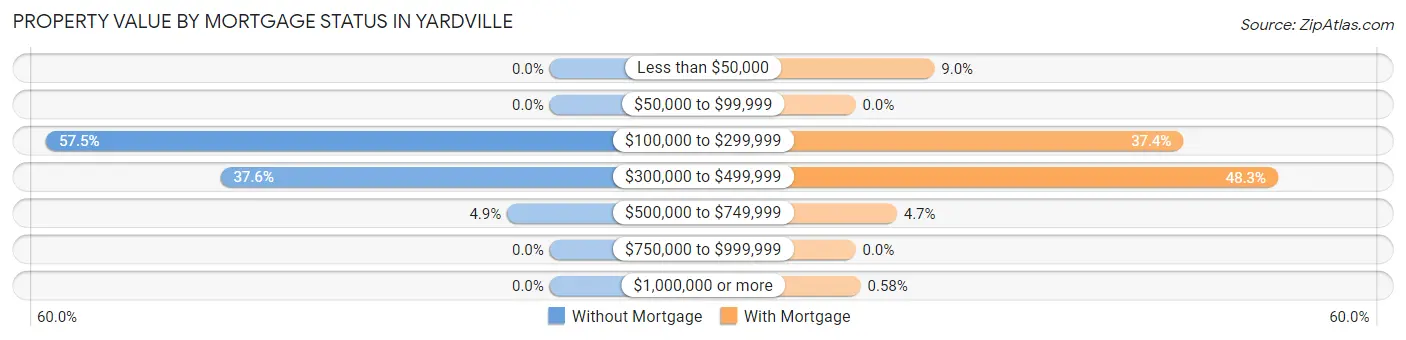
| Property Value | Without Mortgage | With Mortgage |
| Less than $50,000 | 0 (0.0%) | 109 (9.0%) |
| $50,000 to $99,999 | 0 (0.0%) | 0 (0.0%) |
| $100,000 to $299,999 | 592 (57.5%) | 453 (37.4%) |
| $300,000 to $499,999 | 387 (37.6%) | 584 (48.3%) |
| $500,000 to $749,999 | 50 (4.9%) | 57 (4.7%) |
| $750,000 to $999,999 | 0 (0.0%) | 0 (0.0%) |
| $1,000,000 or more | 0 (0.0%) | 7 (0.6%) |
| Total | 1,029 (100.0%) | 1,210 (100.0%) |
Household Income by Mortgage Status in Yardville
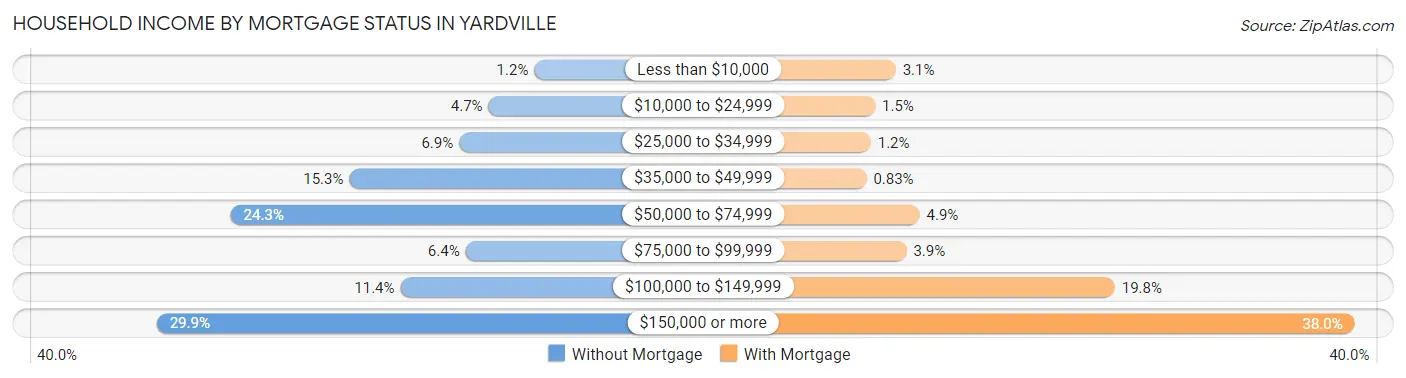
| Household Income | Without Mortgage | With Mortgage |
| Less than $10,000 | 12 (1.2%) | 37 (3.1%) |
| $10,000 to $24,999 | 48 (4.7%) | 18 (1.5%) |
| $25,000 to $34,999 | 71 (6.9%) | 14 (1.2%) |
| $35,000 to $49,999 | 157 (15.3%) | 10 (0.8%) |
| $50,000 to $74,999 | 250 (24.3%) | 59 (4.9%) |
| $75,000 to $99,999 | 66 (6.4%) | 47 (3.9%) |
| $100,000 to $149,999 | 117 (11.4%) | 239 (19.8%) |
| $150,000 or more | 308 (29.9%) | 460 (38.0%) |
| Total | 1,029 (100.0%) | 1,210 (100.0%) |
Property Value to Household Income Ratio in Yardville
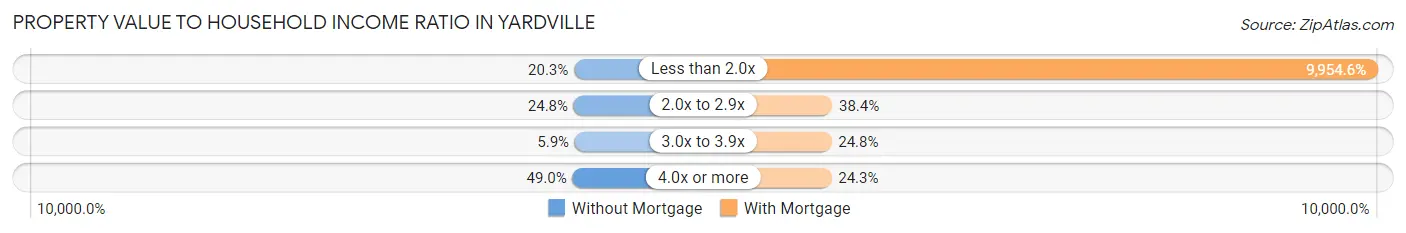
| Value-to-Income Ratio | Without Mortgage | With Mortgage |
| Less than 2.0x | 209 (20.3%) | 120,450 (9,954.6%) |
| 2.0x to 2.9x | 255 (24.8%) | 464 (38.4%) |
| 3.0x to 3.9x | 61 (5.9%) | 300 (24.8%) |
| 4.0x or more | 504 (49.0%) | 294 (24.3%) |
| Total | 1,029 (100.0%) | 1,210 (100.0%) |
Real Estate Taxes by Mortgage Status in Yardville
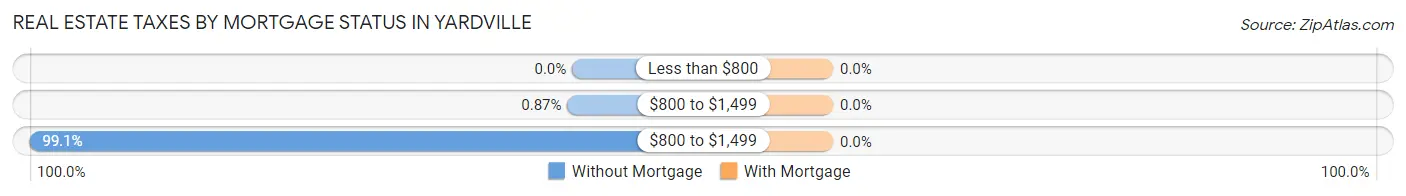
| Property Taxes | Without Mortgage | With Mortgage |
| Less than $800 | 0 (0.0%) | 0 (0.0%) |
| $800 to $1,499 | 9 (0.9%) | 0 (0.0%) |
| $800 to $1,499 | 1,020 (99.1%) | 0 (0.0%) |
| Total | 1,029 (100.0%) | 1,210 (100.0%) |
Health & Disability in Yardville
Health Insurance Coverage by Age in Yardville
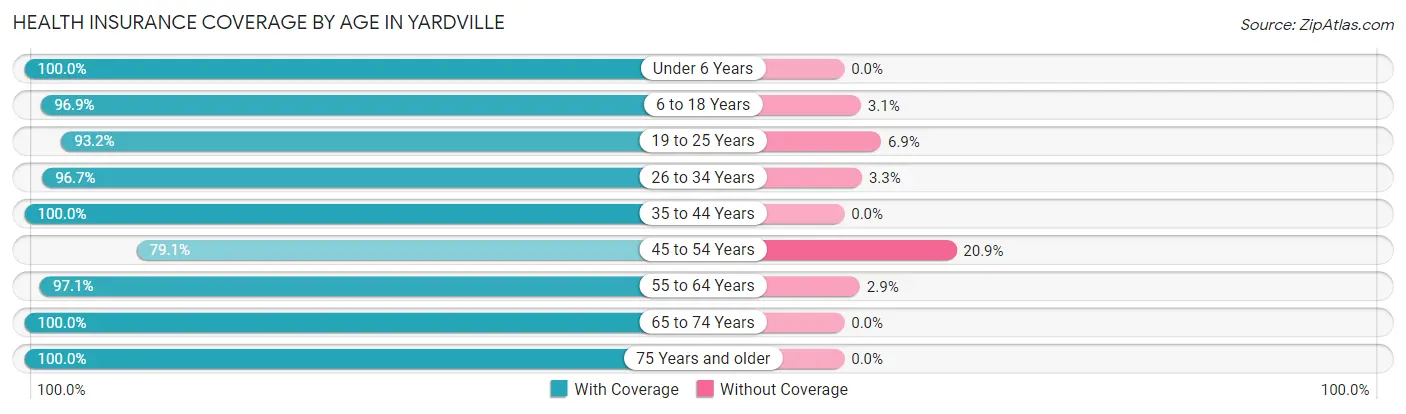
| Age Bracket | With Coverage | Without Coverage |
| Under 6 Years | 363 (100.0%) | 0 (0.0%) |
| 6 to 18 Years | 688 (96.9%) | 22 (3.1%) |
| 19 to 25 Years | 408 (93.1%) | 30 (6.9%) |
| 26 to 34 Years | 940 (96.7%) | 32 (3.3%) |
| 35 to 44 Years | 672 (100.0%) | 0 (0.0%) |
| 45 to 54 Years | 598 (79.1%) | 158 (20.9%) |
| 55 to 64 Years | 1,101 (97.1%) | 33 (2.9%) |
| 65 to 74 Years | 777 (100.0%) | 0 (0.0%) |
| 75 Years and older | 583 (100.0%) | 0 (0.0%) |
| Total | 6,130 (95.7%) | 275 (4.3%) |
Health Insurance Coverage by Citizenship Status in Yardville
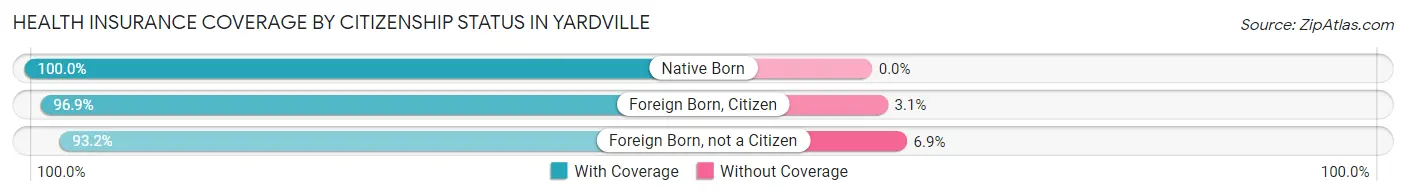
| Citizenship Status | With Coverage | Without Coverage |
| Native Born | 363 (100.0%) | 0 (0.0%) |
| Foreign Born, Citizen | 688 (96.9%) | 22 (3.1%) |
| Foreign Born, not a Citizen | 408 (93.1%) | 30 (6.9%) |
Health Insurance Coverage by Household Income in Yardville
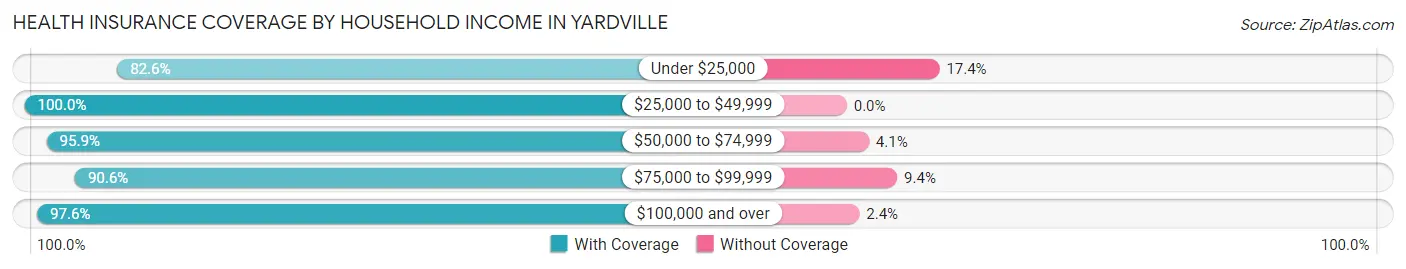
| Household Income | With Coverage | Without Coverage |
| Under $25,000 | 319 (82.6%) | 67 (17.4%) |
| $25,000 to $49,999 | 400 (100.0%) | 0 (0.0%) |
| $50,000 to $74,999 | 394 (95.9%) | 17 (4.1%) |
| $75,000 to $99,999 | 873 (90.6%) | 91 (9.4%) |
| $100,000 and over | 4,131 (97.6%) | 100 (2.4%) |
Public vs Private Health Insurance Coverage by Age in Yardville
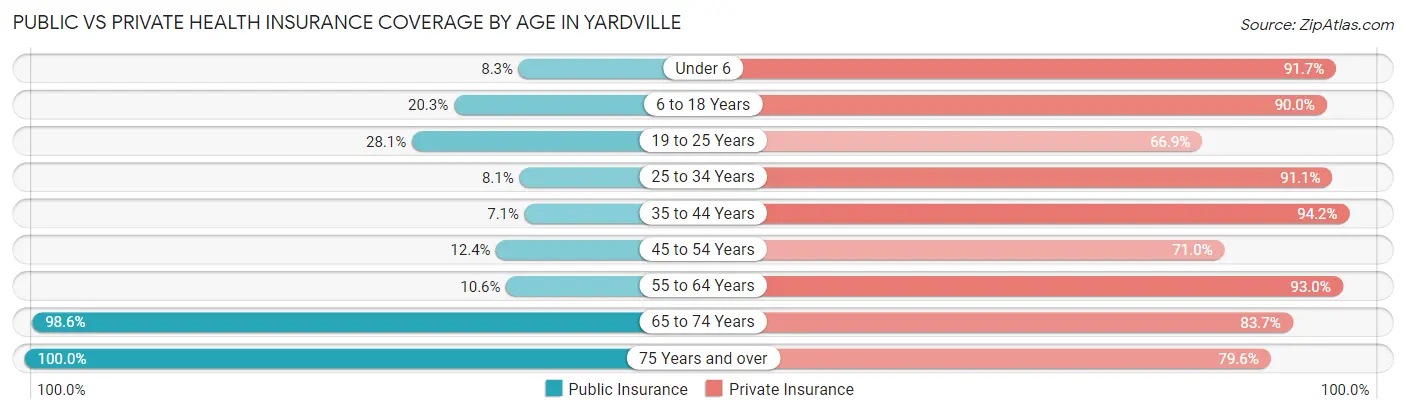
| Age Bracket | Public Insurance | Private Insurance |
| Under 6 | 30 (8.3%) | 333 (91.7%) |
| 6 to 18 Years | 144 (20.3%) | 639 (90.0%) |
| 19 to 25 Years | 123 (28.1%) | 293 (66.9%) |
| 25 to 34 Years | 79 (8.1%) | 885 (91.0%) |
| 35 to 44 Years | 48 (7.1%) | 633 (94.2%) |
| 45 to 54 Years | 94 (12.4%) | 537 (71.0%) |
| 55 to 64 Years | 120 (10.6%) | 1,054 (92.9%) |
| 65 to 74 Years | 766 (98.6%) | 650 (83.7%) |
| 75 Years and over | 583 (100.0%) | 464 (79.6%) |
| Total | 1,987 (31.0%) | 5,488 (85.7%) |
Disability Status by Sex by Age in Yardville
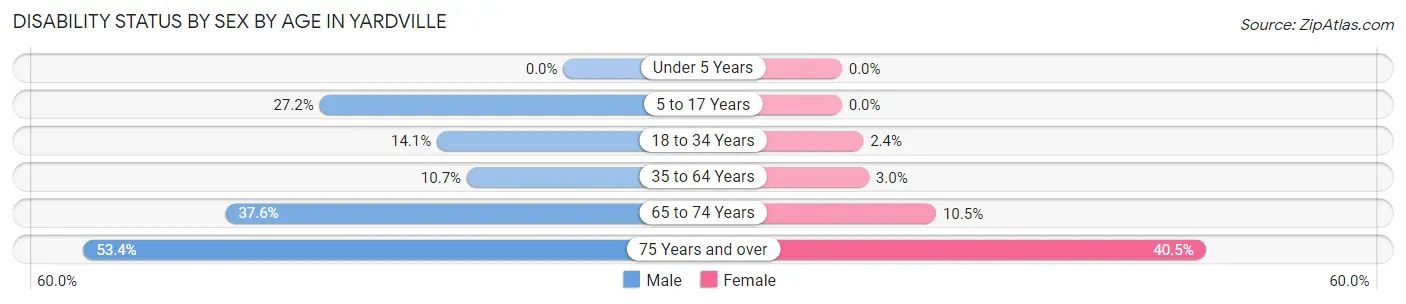
| Age Bracket | Male | Female |
| Under 5 Years | 0 (0.0%) | 0 (0.0%) |
| 5 to 17 Years | 88 (27.2%) | 0 (0.0%) |
| 18 to 34 Years | 130 (14.1%) | 12 (2.4%) |
| 35 to 64 Years | 140 (10.7%) | 38 (3.0%) |
| 65 to 74 Years | 70 (37.6%) | 62 (10.5%) |
| 75 Years and over | 140 (53.4%) | 130 (40.5%) |
Disability Class by Sex by Age in Yardville
Disability Class: Hearing Difficulty
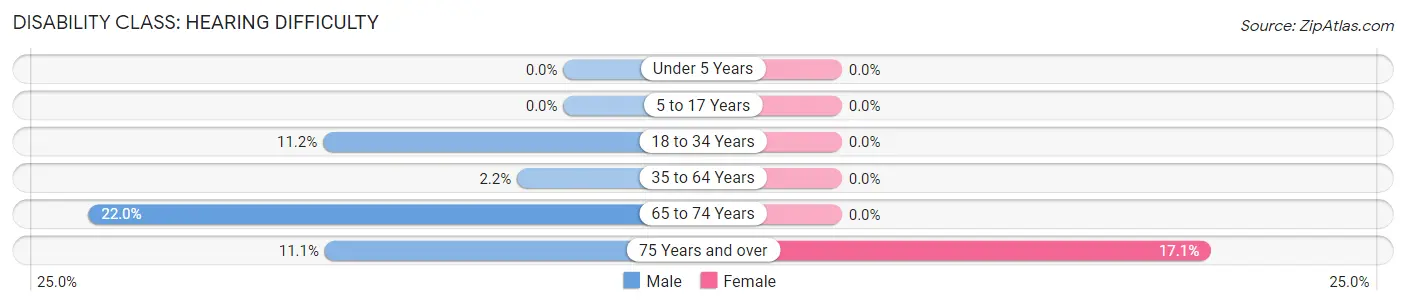
| Age Bracket | Male | Female |
| Under 5 Years | 0 (0.0%) | 0 (0.0%) |
| 5 to 17 Years | 0 (0.0%) | 0 (0.0%) |
| 18 to 34 Years | 103 (11.2%) | 0 (0.0%) |
| 35 to 64 Years | 28 (2.1%) | 0 (0.0%) |
| 65 to 74 Years | 41 (22.0%) | 0 (0.0%) |
| 75 Years and over | 29 (11.1%) | 55 (17.1%) |
Disability Class: Vision Difficulty
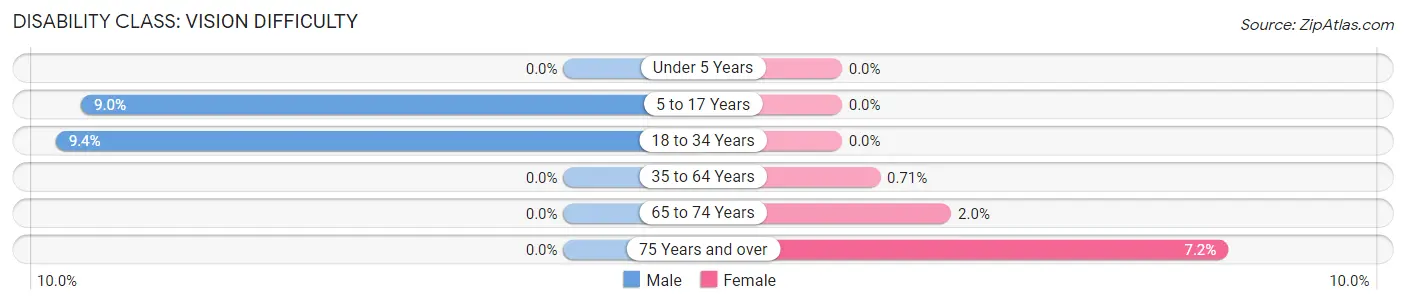
| Age Bracket | Male | Female |
| Under 5 Years | 0 (0.0%) | 0 (0.0%) |
| 5 to 17 Years | 29 (8.9%) | 0 (0.0%) |
| 18 to 34 Years | 87 (9.4%) | 0 (0.0%) |
| 35 to 64 Years | 0 (0.0%) | 9 (0.7%) |
| 65 to 74 Years | 0 (0.0%) | 12 (2.0%) |
| 75 Years and over | 0 (0.0%) | 23 (7.2%) |
Disability Class: Cognitive Difficulty
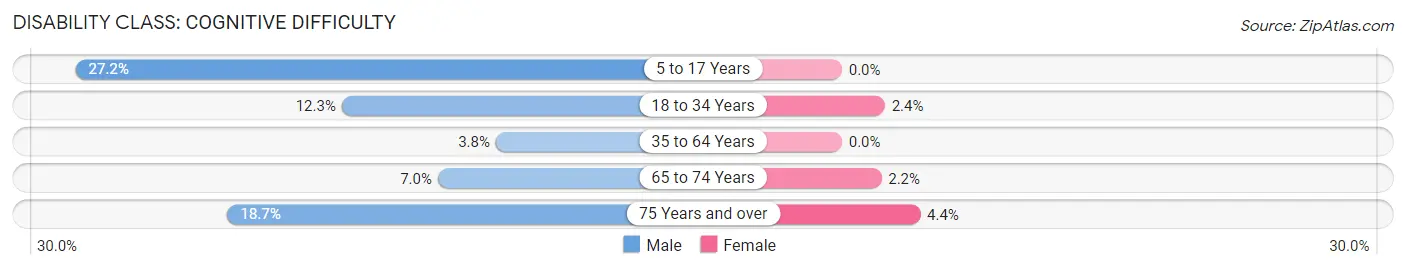
| Age Bracket | Male | Female |
| 5 to 17 Years | 88 (27.2%) | 0 (0.0%) |
| 18 to 34 Years | 114 (12.3%) | 12 (2.4%) |
| 35 to 64 Years | 49 (3.8%) | 0 (0.0%) |
| 65 to 74 Years | 13 (7.0%) | 13 (2.2%) |
| 75 Years and over | 49 (18.7%) | 14 (4.4%) |
Disability Class: Ambulatory Difficulty
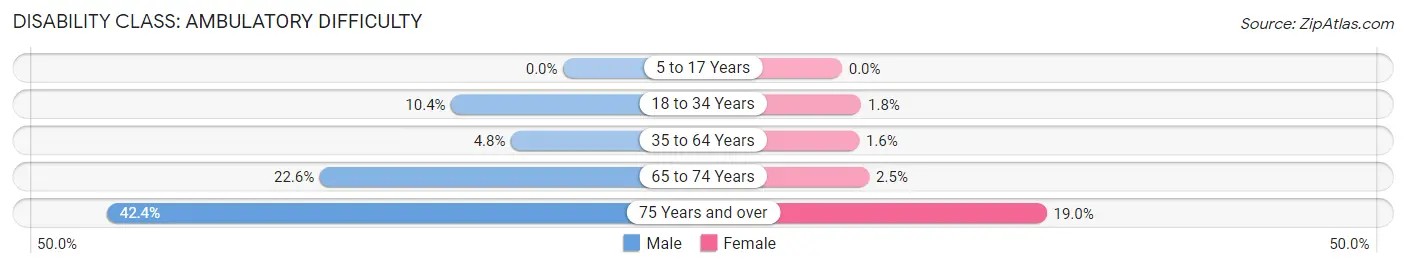
| Age Bracket | Male | Female |
| 5 to 17 Years | 0 (0.0%) | 0 (0.0%) |
| 18 to 34 Years | 96 (10.4%) | 9 (1.8%) |
| 35 to 64 Years | 63 (4.8%) | 20 (1.6%) |
| 65 to 74 Years | 42 (22.6%) | 15 (2.5%) |
| 75 Years and over | 111 (42.4%) | 61 (19.0%) |
Disability Class: Self-Care Difficulty
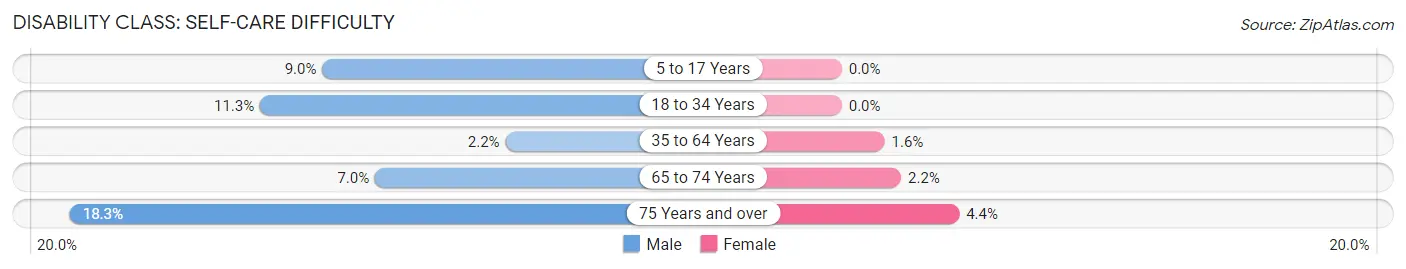
| Age Bracket | Male | Female |
| 5 to 17 Years | 29 (8.9%) | 0 (0.0%) |
| 18 to 34 Years | 104 (11.3%) | 0 (0.0%) |
| 35 to 64 Years | 28 (2.1%) | 20 (1.6%) |
| 65 to 74 Years | 13 (7.0%) | 13 (2.2%) |
| 75 Years and over | 48 (18.3%) | 14 (4.4%) |
Technology Access in Yardville
Computing Device Access in Yardville
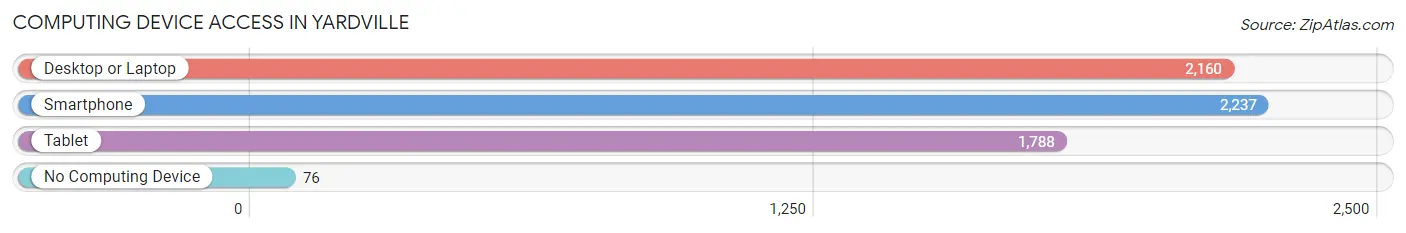
| Device Type | # Households | % Households |
| Desktop or Laptop | 2,160 | 82.4% |
| Smartphone | 2,237 | 85.3% |
| Tablet | 1,788 | 68.2% |
| No Computing Device | 76 | 2.9% |
| Total | 2,622 | 100.0% |
Internet Access in Yardville
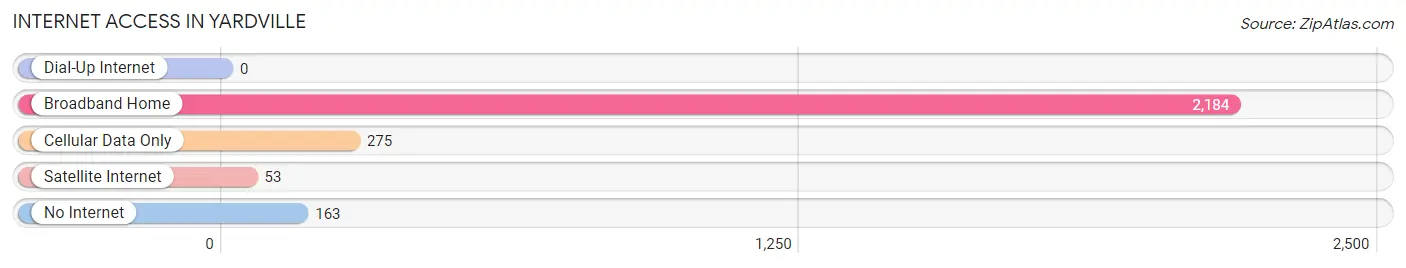
| Internet Type | # Households | % Households |
| Dial-Up Internet | 0 | 0.0% |
| Broadband Home | 2,184 | 83.3% |
| Cellular Data Only | 275 | 10.5% |
| Satellite Internet | 53 | 2.0% |
| No Internet | 163 | 6.2% |
| Total | 2,622 | 100.0% |
Yardville Summary
Yardville is a small unincorporated community located in Mercer County, New Jersey. It is situated in the northern part of the county, just south of the city of Trenton. The community is bordered by Hamilton Township to the north, East Windsor Township to the east, and Robbinsville Township to the south and west. The population of Yardville was estimated to be 2,845 in 2019.
History
Yardville was first settled in the late 1700s by a group of German immigrants. The area was originally known as “Yard’s Mill” after the mill that was built by the settlers. The mill was used to grind grain and was powered by the nearby Assunpink Creek. The area was later renamed “Yardville” after the mill.
In the early 1800s, the area was home to a number of small farms and businesses. The most notable of these was the Yardville Glassworks, which was established in 1820 and produced glass bottles and jars. The glassworks was in operation until the early 1900s.
In the late 1800s, the area began to develop into a residential community. The first post office was established in 1891 and the first school was built in 1895. The community continued to grow throughout the 20th century and by the 1950s, it had become a thriving suburban community.
Geography
Yardville is located in northern Mercer County, just south of the city of Trenton. It is bordered by Hamilton Township to the north, East Windsor Township to the east, and Robbinsville Township to the south and west. The community is situated on the Assunpink Creek, which flows through the area.
The area is mostly flat, with some rolling hills in the northern part of the community. The climate is humid subtropical, with hot, humid summers and cold, wet winters.
Economy
Yardville’s economy is largely based on the service industry. The area is home to a number of small businesses, including restaurants, retail stores, and professional services. The community is also home to a number of industrial and manufacturing businesses, including a plastics factory and a metal fabrication plant.
Demographics
As of the 2019 census, the population of Yardville was estimated to be 2,845. The racial makeup of the community was 79.3% White, 11.2% African American, 4.2% Asian, and 5.3% Hispanic or Latino. The median household income was $76,944, and the median home value was $323,400.
Conclusion
Yardville is a small unincorporated community located in Mercer County, New Jersey. It has a long history, dating back to the late 1700s when it was first settled by German immigrants. The area has since developed into a thriving suburban community, with a largely service-based economy. The population of Yardville was estimated to be 2,845 in 2019, with a diverse racial makeup and a median household income of $76,944.
Common Questions
What is Per Capita Income in Yardville?
Per Capita income in Yardville is $49,970.
What is the Median Family Income in Yardville?
Median Family Income in Yardville is $127,426.
What is the Median Household income in Yardville?
Median Household Income in Yardville is $107,661.
What is Income or Wage Gap in Yardville?
Income or Wage Gap in Yardville is 27.1%.
Women in Yardville earn 72.9 cents for every dollar earned by a man.
What is Inequality or Gini Index in Yardville?
Inequality or Gini Index in Yardville is 0.39.
What is the Total Population of Yardville?
Total Population of Yardville is 6,405.
What is the Total Male Population of Yardville?
Total Male Population of Yardville is 3,142.
What is the Total Female Population of Yardville?
Total Female Population of Yardville is 3,263.
What is the Ratio of Males per 100 Females in Yardville?
There are 96.29 Males per 100 Females in Yardville.
What is the Ratio of Females per 100 Males in Yardville?
There are 103.85 Females per 100 Males in Yardville.
What is the Median Population Age in Yardville?
Median Population Age in Yardville is 45.5 Years.
What is the Average Family Size in Yardville
Average Family Size in Yardville is 3.1 People.
What is the Average Household Size in Yardville
Average Household Size in Yardville is 2.4 People.
How Large is the Labor Force in Yardville?
There are 3,309 People in the Labor Forcein in Yardville.
What is the Percentage of People in the Labor Force in Yardville?
61.4% of People are in the Labor Force in Yardville.
What is the Unemployment Rate in Yardville?
Unemployment Rate in Yardville is 3.6%.