Manati, PR Map & Demographics
Manati Overview
$10,984
PER CAPITA INCOME
$20,948
AVG FAMILY INCOME
$16,599
AVG HOUSEHOLD INCOME
7.1%
WAGE / INCOME GAP [ % ]
92.9¢/ $1
WAGE / INCOME GAP [ $ ]
$12,668
FAMILY INCOME DEFICIT
0.52
INEQUALITY / GINI INDEX
11,134
TOTAL POPULATION
4,932
MALE POPULATION
6,202
FEMALE POPULATION
79.52
MALES / 100 FEMALES
125.75
FEMALES / 100 MALES
46.0
MEDIAN AGE
3.3
AVG FAMILY SIZE
2.4
AVG HOUSEHOLD SIZE
3,513
LABOR FORCE [ PEOPLE ]
36.9%
PERCENT IN LABOR FORCE
21.6%
UNEMPLOYMENT RATE
Manati Zip Codes
Income in Manati
Income Overview in Manati
Per Capita Income in Manati is $10,984, while median incomes of families and households are $20,948 and $16,599 respectively.
| Characteristic | Number | Measure |
| Per Capita Income | 11,134 | $10,984 |
| Median Family Income | 2,490 | $20,948 |
| Mean Family Income | 2,490 | $29,459 |
| Median Household Income | 4,656 | $16,599 |
| Mean Household Income | 4,656 | $23,549 |
| Income Deficit | 2,490 | $12,668 |
| Wage / Income Gap (%) | 11,134 | 7.10% |
| Wage / Income Gap ($) | 11,134 | 92.90¢ per $1 |
| Gini / Inequality Index | 11,134 | 0.52 |
Earnings by Sex in Manati
Average Earnings in Manati are $17,274, $17,925 for men and $16,653 for women, a difference of 7.1%.
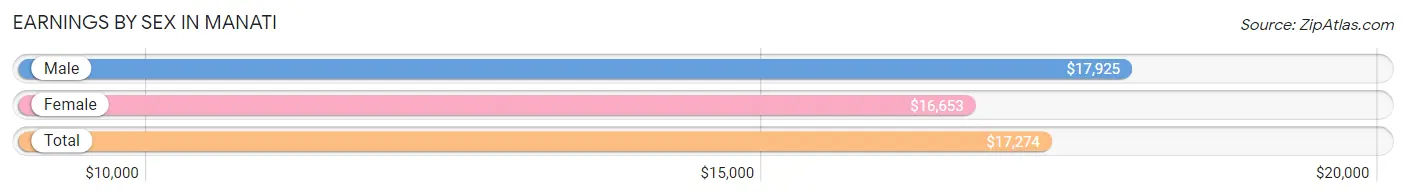
| Sex | Number | Average Earnings |
| Male | 1,647 (53.7%) | $17,925 |
| Female | 1,418 (46.3%) | $16,653 |
| Total | 3,065 (100.0%) | $17,274 |
Earnings by Sex by Income Bracket in Manati
The most common earnings brackets in Manati are $15,000 to $17,499 for men (201 | 12.2%) and $25,000 to $29,999 for women (257 | 18.1%).
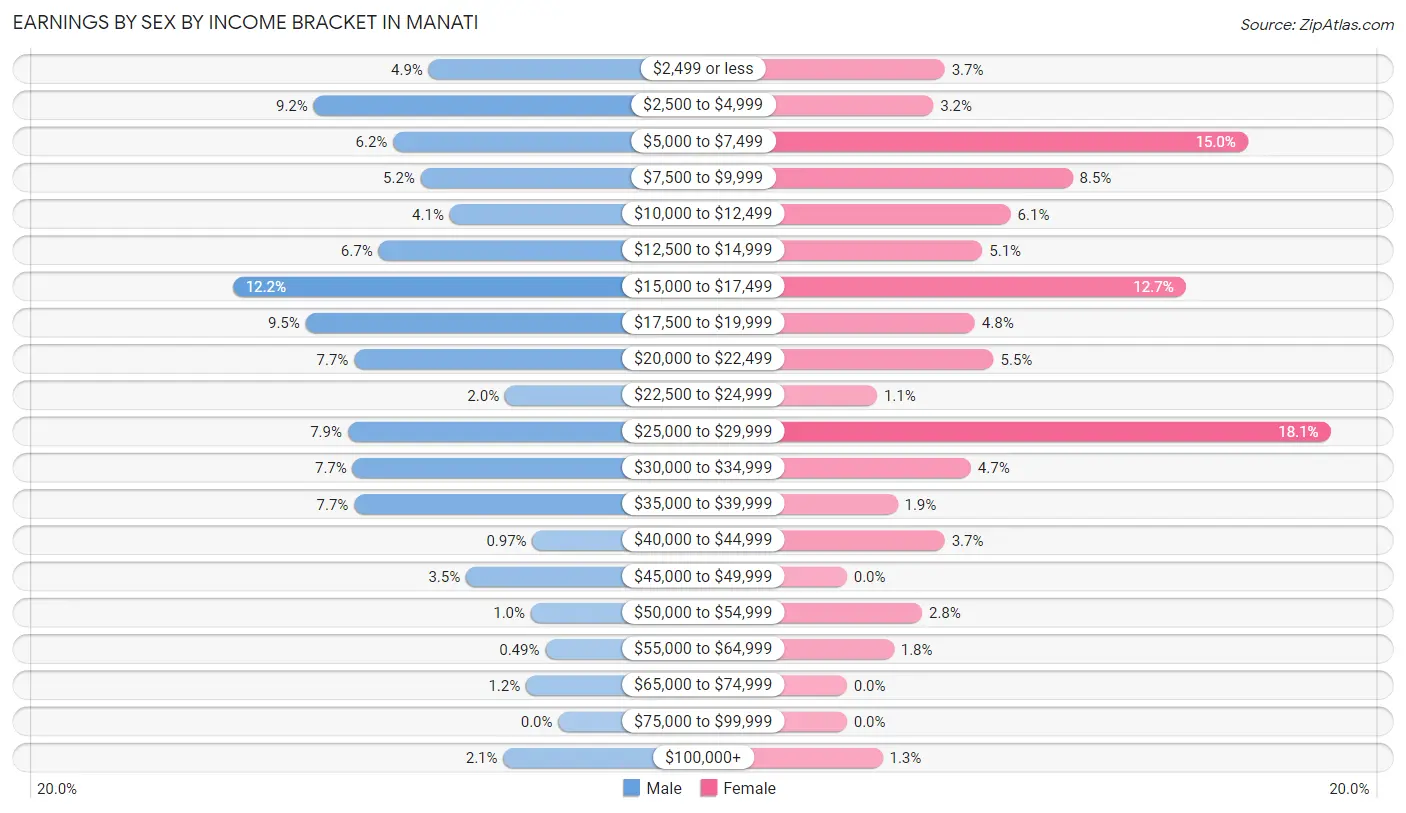
| Income | Male | Female |
| $2,499 or less | 80 (4.9%) | 52 (3.7%) |
| $2,500 to $4,999 | 151 (9.2%) | 46 (3.2%) |
| $5,000 to $7,499 | 102 (6.2%) | 213 (15.0%) |
| $7,500 to $9,999 | 85 (5.2%) | 120 (8.5%) |
| $10,000 to $12,499 | 67 (4.1%) | 87 (6.1%) |
| $12,500 to $14,999 | 111 (6.7%) | 72 (5.1%) |
| $15,000 to $17,499 | 201 (12.2%) | 180 (12.7%) |
| $17,500 to $19,999 | 156 (9.5%) | 68 (4.8%) |
| $20,000 to $22,499 | 126 (7.6%) | 78 (5.5%) |
| $22,500 to $24,999 | 33 (2.0%) | 16 (1.1%) |
| $25,000 to $29,999 | 130 (7.9%) | 257 (18.1%) |
| $30,000 to $34,999 | 127 (7.7%) | 66 (4.6%) |
| $35,000 to $39,999 | 126 (7.6%) | 27 (1.9%) |
| $40,000 to $44,999 | 16 (1.0%) | 52 (3.7%) |
| $45,000 to $49,999 | 57 (3.5%) | 0 (0.0%) |
| $50,000 to $54,999 | 17 (1.0%) | 40 (2.8%) |
| $55,000 to $64,999 | 8 (0.5%) | 25 (1.8%) |
| $65,000 to $74,999 | 20 (1.2%) | 0 (0.0%) |
| $75,000 to $99,999 | 0 (0.0%) | 0 (0.0%) |
| $100,000+ | 34 (2.1%) | 19 (1.3%) |
| Total | 1,647 (100.0%) | 1,418 (100.0%) |
Earnings by Sex by Educational Attainment in Manati
Average earnings in Manati are $18,292 for men and $19,521 for women, a difference of 6.3%. Men with an educational attainment of graduate degree enjoy the highest average annual earnings of $68,250, while those with less than high school education earn the least with $14,826. Women with an educational attainment of graduate degree earn the most with the average annual earnings of $40,060, while those with high school diploma education have the smallest earnings of $8,664.
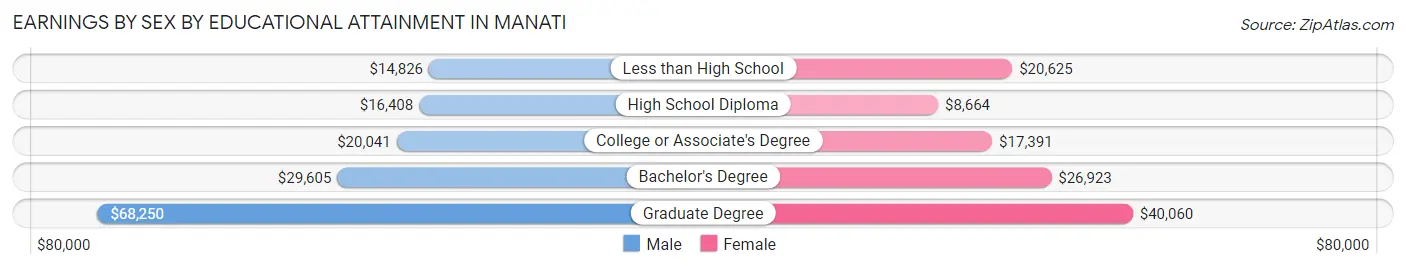
| Educational Attainment | Male Income | Female Income |
| Less than High School | $14,826 | $20,625 |
| High School Diploma | $16,408 | $8,664 |
| College or Associate's Degree | $20,041 | $17,391 |
| Bachelor's Degree | $29,605 | $26,923 |
| Graduate Degree | $68,250 | $40,060 |
| Total | $18,292 | $19,521 |
Family Income in Manati
Family Income Brackets in Manati
According to the Manati family income data, there are 720 families falling into the less than $10,000 income range, which is the most common income bracket and makes up 28.9% of all families. Conversely, the $100,000 to $149,999 income bracket is the least frequent group with only 10 families (0.4%) belonging to this category.
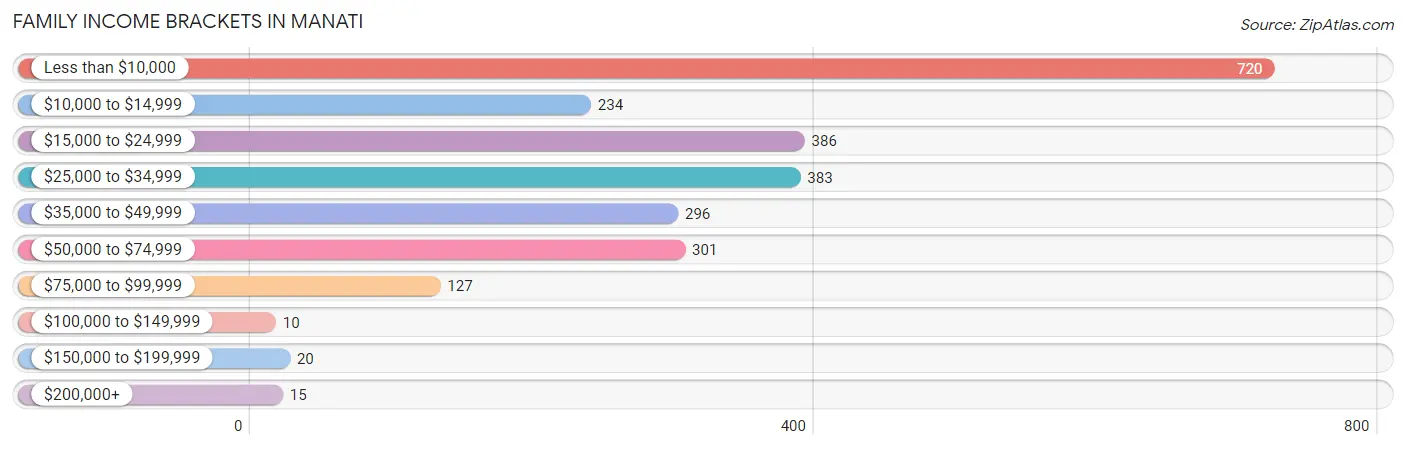
| Income Bracket | # Families | % Families |
| Less than $10,000 | 720 | 28.9% |
| $10,000 to $14,999 | 234 | 9.4% |
| $15,000 to $24,999 | 386 | 15.5% |
| $25,000 to $34,999 | 383 | 15.4% |
| $35,000 to $49,999 | 296 | 11.9% |
| $50,000 to $74,999 | 301 | 12.1% |
| $75,000 to $99,999 | 127 | 5.1% |
| $100,000 to $149,999 | 10 | 0.4% |
| $150,000 to $199,999 | 20 | 0.8% |
| $200,000+ | 15 | 0.6% |
Family Income by Famaliy Size in Manati
4-person families (363 | 14.6%) account for the highest median family income in Manati with $34,890 per family, while 2-person families (1,396 | 56.1%) have the highest median income of $9,772 per family member.
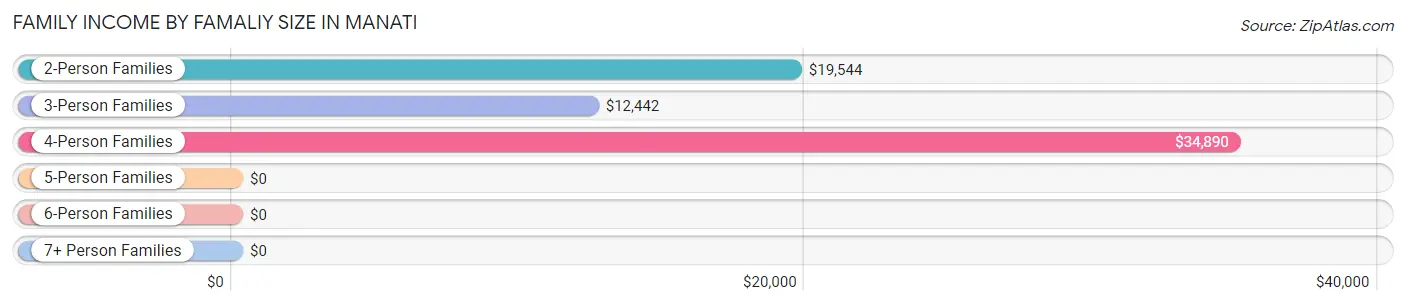
| Income Bracket | # Families | Median Income |
| 2-Person Families | 1,396 (56.1%) | $19,544 |
| 3-Person Families | 627 (25.2%) | $12,442 |
| 4-Person Families | 363 (14.6%) | $34,890 |
| 5-Person Families | 74 (3.0%) | $0 |
| 6-Person Families | 0 (0.0%) | $0 |
| 7+ Person Families | 30 (1.2%) | $0 |
| Total | 2,490 (100.0%) | $20,948 |
Family Income by Number of Earners in Manati
The median family income in Manati is $20,948, with families comprising 3+ earners (42) having the highest median family income of $68,889, while families with no earners (1,238) have the lowest median family income of $10,440, accounting for 1.7% and 49.7% of families, respectively.
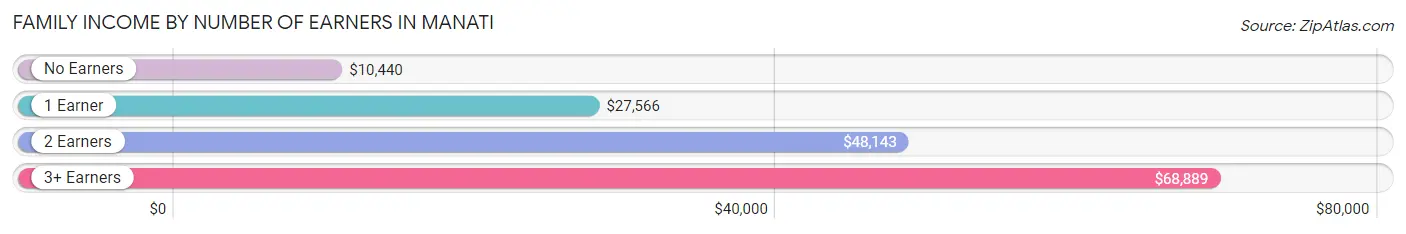
| Number of Earners | # Families | Median Income |
| No Earners | 1,238 (49.7%) | $10,440 |
| 1 Earner | 812 (32.6%) | $27,566 |
| 2 Earners | 398 (16.0%) | $48,143 |
| 3+ Earners | 42 (1.7%) | $68,889 |
| Total | 2,490 (100.0%) | $20,948 |
Household Income in Manati
Household Income Brackets in Manati
With 1,443 households falling in the category, the less than $10,000 income range is the most frequent in Manati, accounting for 31.0% of all households. In contrast, only 14 households (0.3%) fall into the $200,000+ income bracket, making it the least populous group.
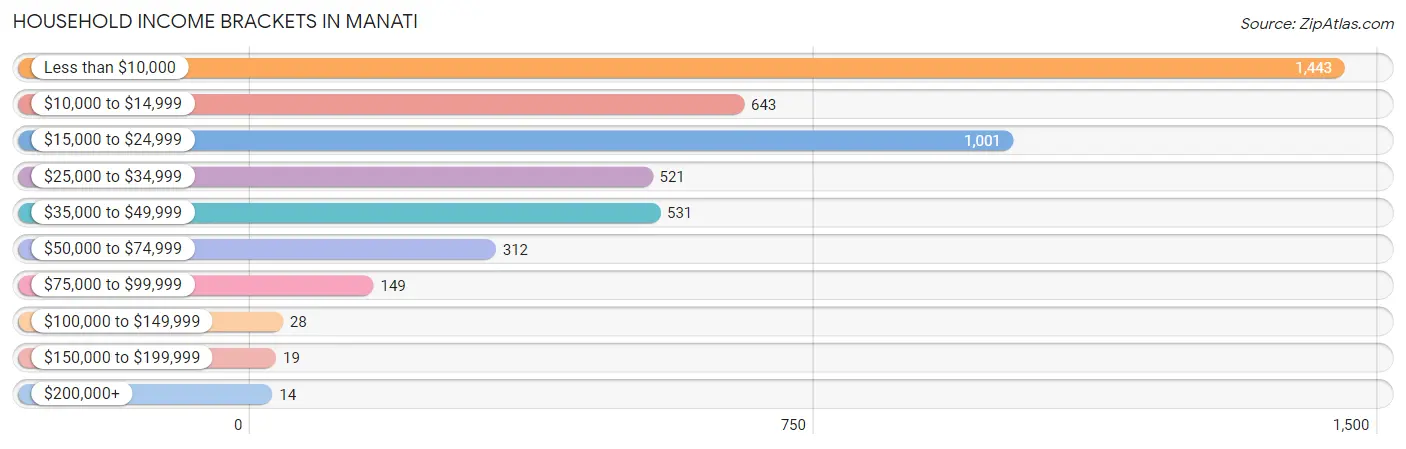
| Income Bracket | # Households | % Households |
| Less than $10,000 | 1,443 | 31.0% |
| $10,000 to $14,999 | 643 | 13.8% |
| $15,000 to $24,999 | 1,001 | 21.5% |
| $25,000 to $34,999 | 521 | 11.2% |
| $35,000 to $49,999 | 531 | 11.4% |
| $50,000 to $74,999 | 312 | 6.7% |
| $75,000 to $99,999 | 149 | 3.2% |
| $100,000 to $149,999 | 28 | 0.6% |
| $150,000 to $199,999 | 19 | 0.4% |
| $200,000+ | 14 | 0.3% |
Household Income by Householder Age in Manati
The median household income in Manati is $16,599, with the highest median household income of $17,561 found in the 25 to 44 years age bracket for the primary householder. A total of 1,060 households (22.8%) fall into this category. Meanwhile, the 15 to 24 years age bracket for the primary householder has the lowest median household income of $0, with 139 households (3.0%) in this group.
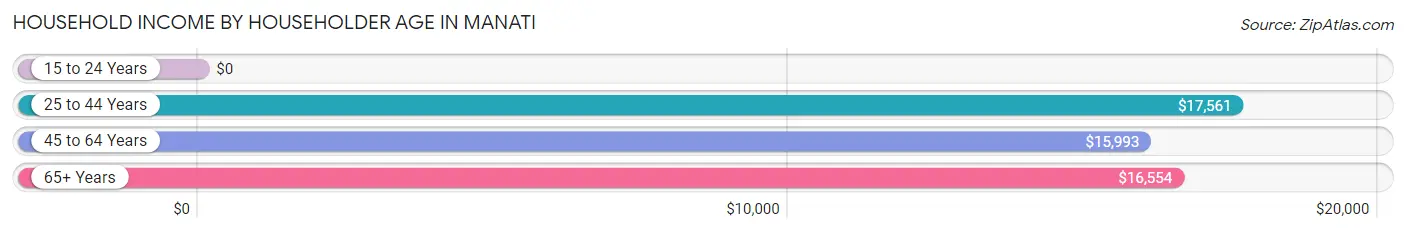
| Income Bracket | # Households | Median Income |
| 15 to 24 Years | 139 (3.0%) | $0 |
| 25 to 44 Years | 1,060 (22.8%) | $17,561 |
| 45 to 64 Years | 1,450 (31.1%) | $15,993 |
| 65+ Years | 2,007 (43.1%) | $16,554 |
| Total | 4,656 (100.0%) | $16,599 |
Poverty in Manati
Income Below Poverty by Sex and Age in Manati
With 53.1% poverty level for males and 56.4% for females among the residents of Manati, 15 year old males and 15 year old females are the most vulnerable to poverty, with 22 males (100.0%) and 35 females (100.0%) in their respective age groups living below the poverty level.
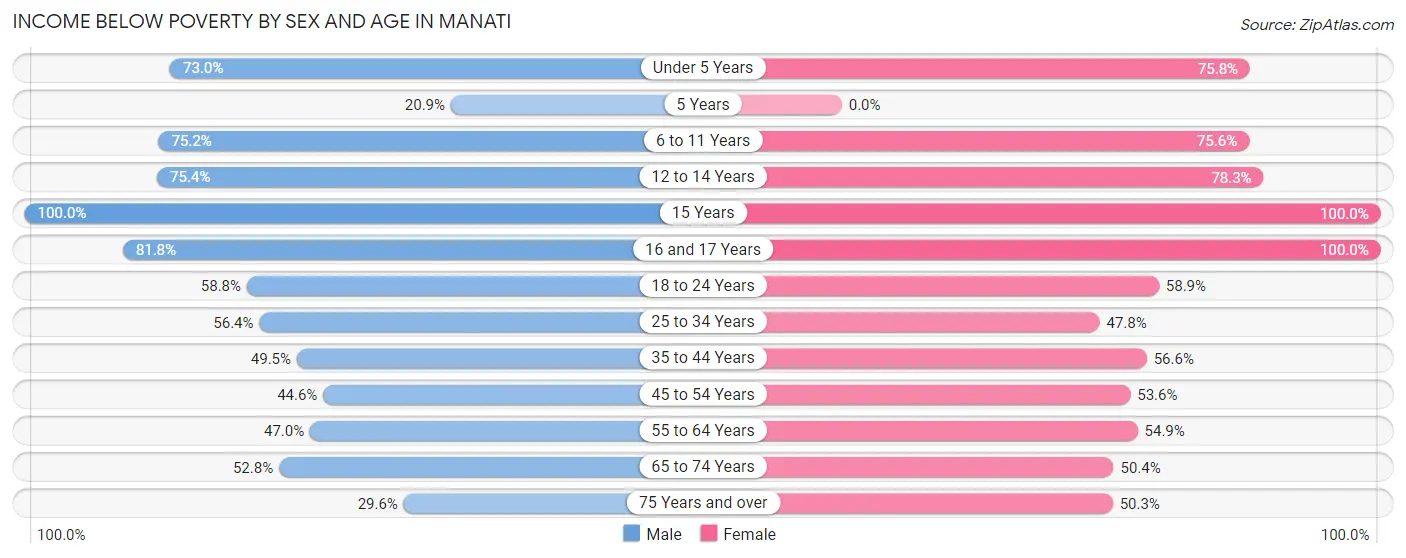
| Age Bracket | Male | Female |
| Under 5 Years | 100 (73.0%) | 253 (75.7%) |
| 5 Years | 19 (20.9%) | 0 (0.0%) |
| 6 to 11 Years | 248 (75.1%) | 198 (75.6%) |
| 12 to 14 Years | 178 (75.4%) | 108 (78.3%) |
| 15 Years | 22 (100.0%) | 35 (100.0%) |
| 16 and 17 Years | 121 (81.8%) | 105 (100.0%) |
| 18 to 24 Years | 292 (58.8%) | 339 (58.9%) |
| 25 to 34 Years | 338 (56.4%) | 332 (47.8%) |
| 35 to 44 Years | 319 (49.5%) | 296 (56.6%) |
| 45 to 54 Years | 251 (44.6%) | 445 (53.5%) |
| 55 to 64 Years | 267 (47.0%) | 414 (54.9%) |
| 65 to 74 Years | 304 (52.8%) | 397 (50.4%) |
| 75 Years and over | 144 (29.6%) | 542 (50.3%) |
| Total | 2,603 (53.1%) | 3,464 (56.4%) |
Income Above Poverty by Sex and Age in Manati
According to the poverty statistics in Manati, males aged 5 years and females aged 5 years are the age groups that are most secure financially, with 79.1% of males and 100.0% of females in these age groups living above the poverty line.
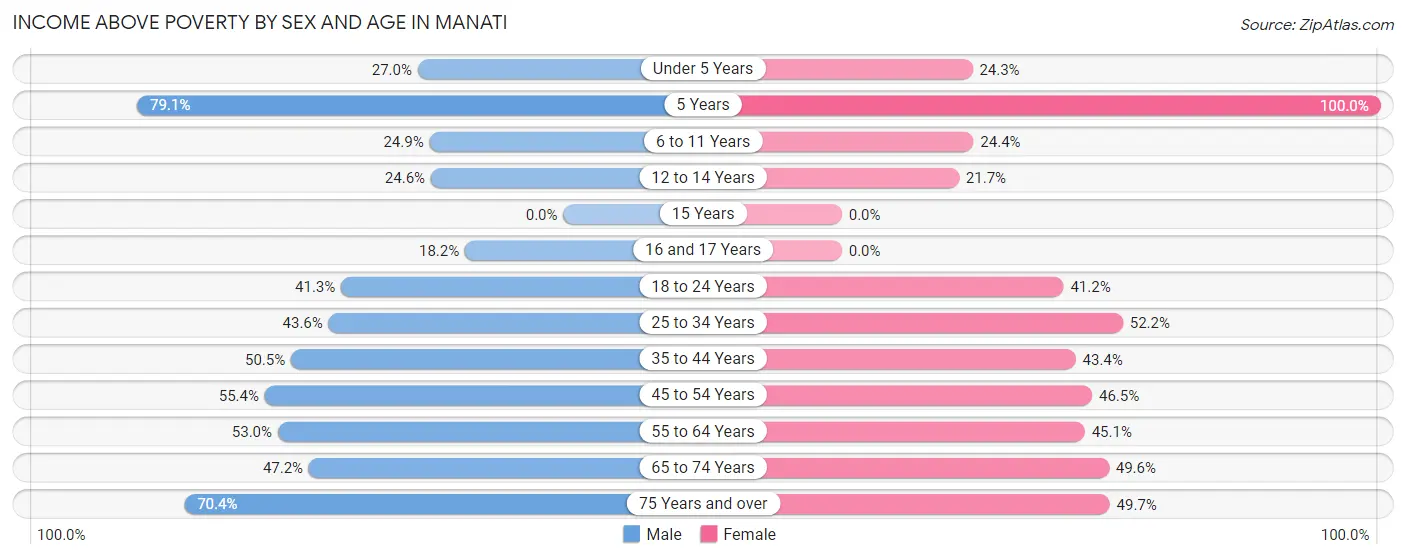
| Age Bracket | Male | Female |
| Under 5 Years | 37 (27.0%) | 81 (24.2%) |
| 5 Years | 72 (79.1%) | 30 (100.0%) |
| 6 to 11 Years | 82 (24.8%) | 64 (24.4%) |
| 12 to 14 Years | 58 (24.6%) | 30 (21.7%) |
| 15 Years | 0 (0.0%) | 0 (0.0%) |
| 16 and 17 Years | 27 (18.2%) | 0 (0.0%) |
| 18 to 24 Years | 205 (41.2%) | 237 (41.1%) |
| 25 to 34 Years | 261 (43.6%) | 362 (52.2%) |
| 35 to 44 Years | 326 (50.5%) | 227 (43.4%) |
| 45 to 54 Years | 312 (55.4%) | 386 (46.5%) |
| 55 to 64 Years | 301 (53.0%) | 340 (45.1%) |
| 65 to 74 Years | 272 (47.2%) | 390 (49.6%) |
| 75 Years and over | 342 (70.4%) | 536 (49.7%) |
| Total | 2,295 (46.9%) | 2,683 (43.6%) |
Income Below Poverty Among Married-Couple Families in Manati
The poverty statistics for married-couple families in Manati show that 26.5% or 280 of the total 1,058 families live below the poverty line. Families with 3 or 4 children have the highest poverty rate of 100.0%, comprising of 17 families. On the other hand, families with no children have the lowest poverty rate of 25.2%, which includes 219 families.
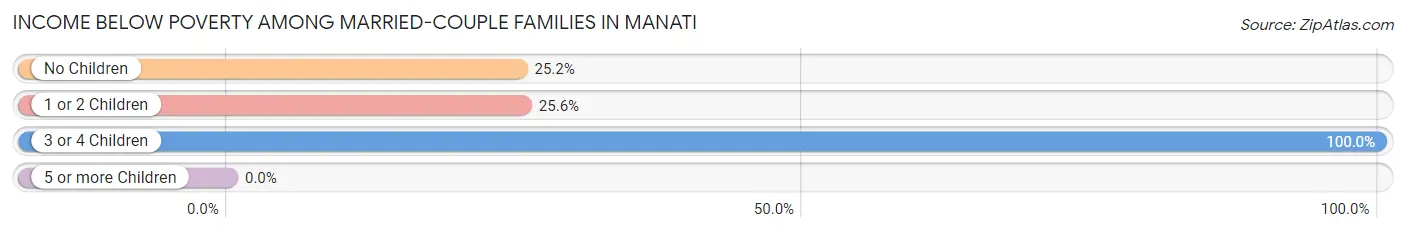
| Children | Above Poverty | Below Poverty |
| No Children | 650 (74.8%) | 219 (25.2%) |
| 1 or 2 Children | 128 (74.4%) | 44 (25.6%) |
| 3 or 4 Children | 0 (0.0%) | 17 (100.0%) |
| 5 or more Children | 0 (0.0%) | 0 (0.0%) |
| Total | 778 (73.5%) | 280 (26.5%) |
Income Below Poverty Among Single-Parent Households in Manati
According to the poverty data in Manati, 70.9% or 214 single-father households and 65.6% or 741 single-mother households are living below the poverty line. Among single-father households, those with 1 or 2 children have the highest poverty rate, with 99 households (100.0%) experiencing poverty. Likewise, among single-mother households, those with 3 or 4 children have the highest poverty rate, with 54 households (100.0%) falling below the poverty line.
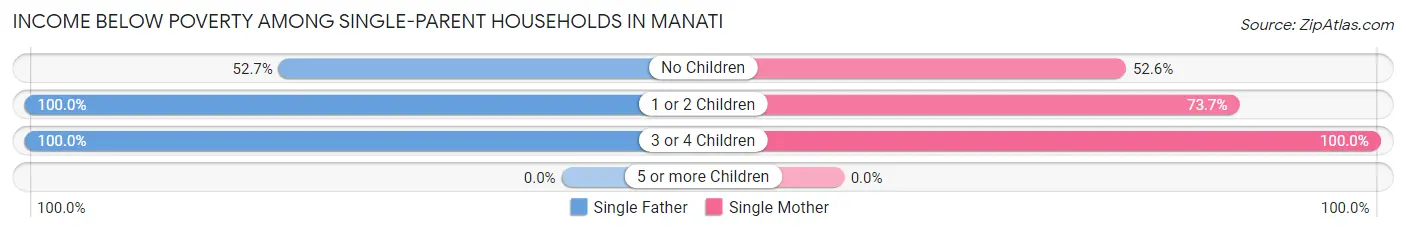
| Children | Single Father | Single Mother |
| No Children | 98 (52.7%) | 264 (52.6%) |
| 1 or 2 Children | 99 (100.0%) | 423 (73.7%) |
| 3 or 4 Children | 17 (100.0%) | 54 (100.0%) |
| 5 or more Children | 0 (0.0%) | 0 (0.0%) |
| Total | 214 (70.9%) | 741 (65.6%) |
Income Below Poverty Among Married-Couple vs Single-Parent Households in Manati
The poverty data for Manati shows that 280 of the married-couple family households (26.5%) and 955 of the single-parent households (66.7%) are living below the poverty level. Within the married-couple family households, those with 3 or 4 children have the highest poverty rate, with 17 households (100.0%) falling below the poverty line. Among the single-parent households, those with 3 or 4 children have the highest poverty rate, with 71 household (100.0%) living below poverty.
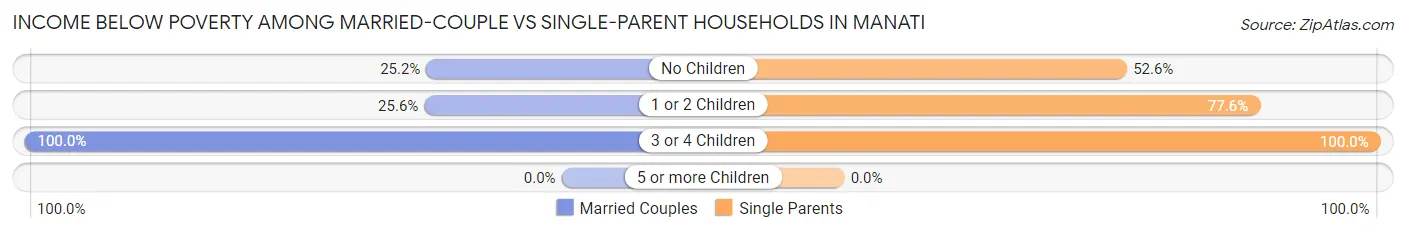
| Children | Married-Couple Families | Single-Parent Households |
| No Children | 219 (25.2%) | 362 (52.6%) |
| 1 or 2 Children | 44 (25.6%) | 522 (77.6%) |
| 3 or 4 Children | 17 (100.0%) | 71 (100.0%) |
| 5 or more Children | 0 (0.0%) | 0 (0.0%) |
| Total | 280 (26.5%) | 955 (66.7%) |
Race in Manati
The most populous races in Manati are Hispanic or Latino (10,972 | 98.5%), White / Caucasian (5,147 | 46.2%), and Two or more Races (4,256 | 38.2%).
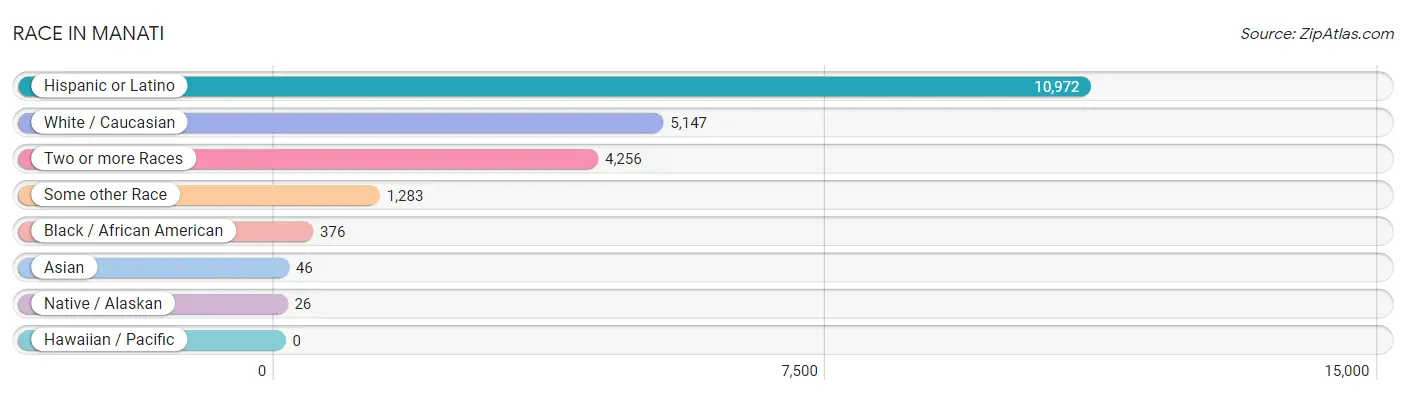
| Race | # Population | % Population |
| Asian | 46 | 0.4% |
| Black / African American | 376 | 3.4% |
| Hawaiian / Pacific | 0 | 0.0% |
| Hispanic or Latino | 10,972 | 98.5% |
| Native / Alaskan | 26 | 0.2% |
| White / Caucasian | 5,147 | 46.2% |
| Two or more Races | 4,256 | 38.2% |
| Some other Race | 1,283 | 11.5% |
| Total | 11,134 | 100.0% |
Ancestry in Manati
The most populous ancestries reported in Manati are Puerto Rican (10,877 | 97.7%), American (180 | 1.6%), Central American Indian (87 | 0.8%), Mexican (72 | 0.6%), and Thai (46 | 0.4%), together accounting for 101.1% of all Manati residents.
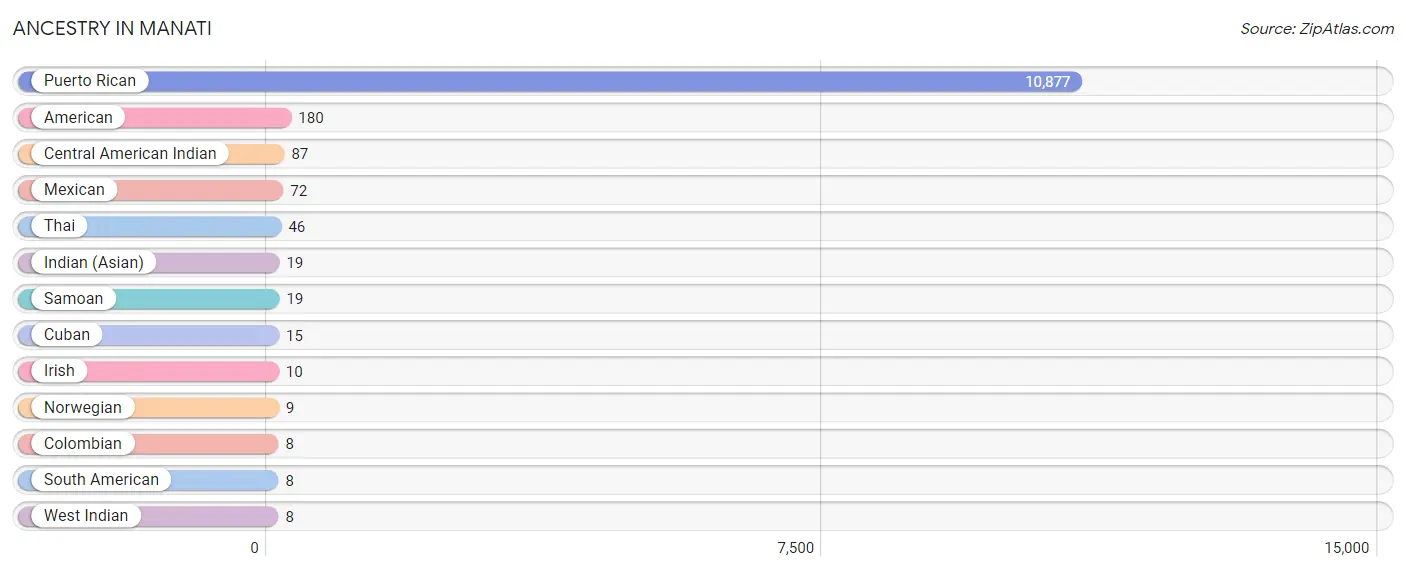
| Ancestry | # Population | % Population |
| American | 180 | 1.6% |
| Central American Indian | 87 | 0.8% |
| Colombian | 8 | 0.1% |
| Cuban | 15 | 0.1% |
| Indian (Asian) | 19 | 0.2% |
| Irish | 10 | 0.1% |
| Mexican | 72 | 0.6% |
| Norwegian | 9 | 0.1% |
| Puerto Rican | 10,877 | 97.7% |
| Samoan | 19 | 0.2% |
| South American | 8 | 0.1% |
| Thai | 46 | 0.4% |
| West Indian | 8 | 0.1% | View All 13 Rows |
Immigrants in Manati

| Immigration Origin | # Population | % Population | View All 0 Rows |
Sex and Age in Manati
Sex and Age in Manati
The most populous age groups in Manati are 65 to 69 Years (402 | 8.2%) for men and 20 to 24 Years (491 | 7.9%) for women.
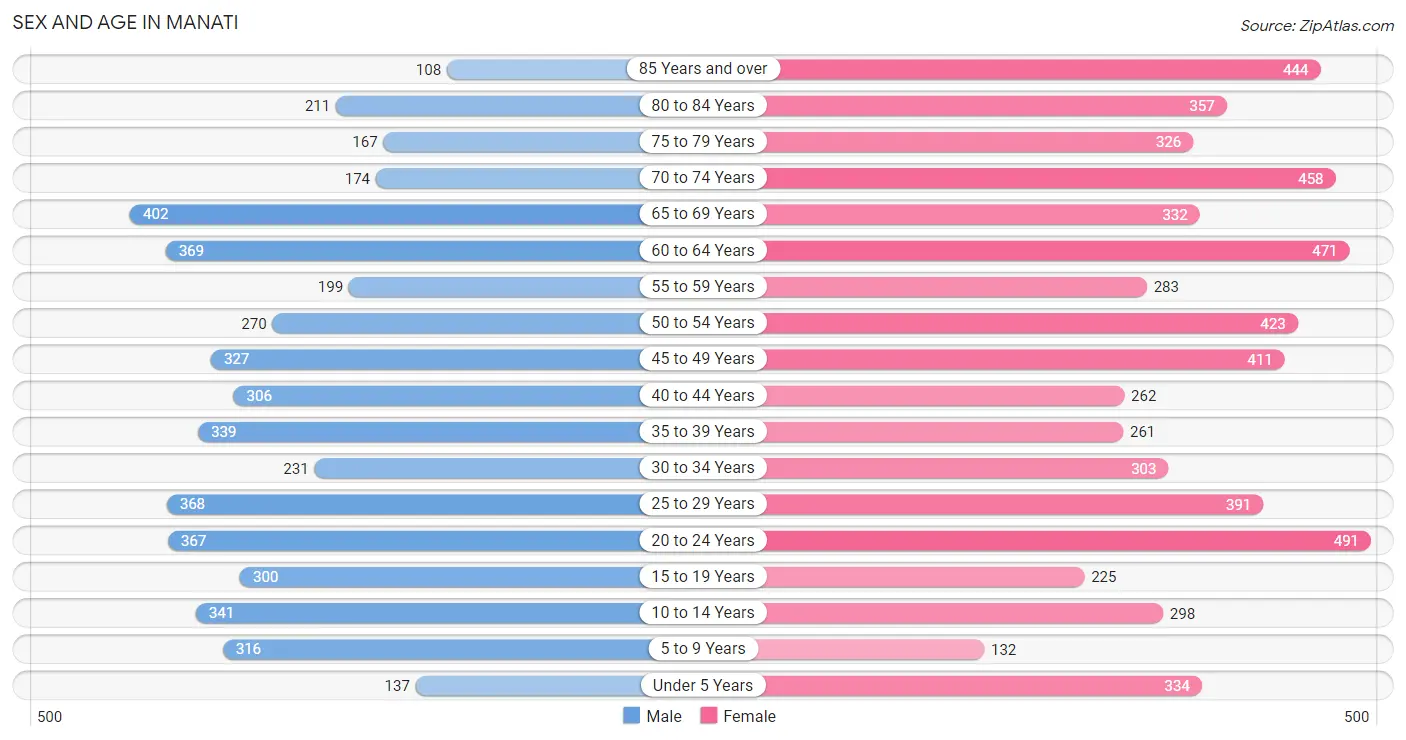
| Age Bracket | Male | Female |
| Under 5 Years | 137 (2.8%) | 334 (5.4%) |
| 5 to 9 Years | 316 (6.4%) | 132 (2.1%) |
| 10 to 14 Years | 341 (6.9%) | 298 (4.8%) |
| 15 to 19 Years | 300 (6.1%) | 225 (3.6%) |
| 20 to 24 Years | 367 (7.4%) | 491 (7.9%) |
| 25 to 29 Years | 368 (7.5%) | 391 (6.3%) |
| 30 to 34 Years | 231 (4.7%) | 303 (4.9%) |
| 35 to 39 Years | 339 (6.9%) | 261 (4.2%) |
| 40 to 44 Years | 306 (6.2%) | 262 (4.2%) |
| 45 to 49 Years | 327 (6.6%) | 411 (6.6%) |
| 50 to 54 Years | 270 (5.5%) | 423 (6.8%) |
| 55 to 59 Years | 199 (4.0%) | 283 (4.6%) |
| 60 to 64 Years | 369 (7.5%) | 471 (7.6%) |
| 65 to 69 Years | 402 (8.2%) | 332 (5.3%) |
| 70 to 74 Years | 174 (3.5%) | 458 (7.4%) |
| 75 to 79 Years | 167 (3.4%) | 326 (5.3%) |
| 80 to 84 Years | 211 (4.3%) | 357 (5.8%) |
| 85 Years and over | 108 (2.2%) | 444 (7.2%) |
| Total | 4,932 (100.0%) | 6,202 (100.0%) |
Families and Households in Manati
Median Family Size in Manati
The median family size in Manati is 3.29 persons per family, with single male/father families (302 | 12.1%) accounting for the largest median family size of 3.76 persons per family. On the other hand, married-couple families (1,058 | 42.5%) represent the smallest median family size with 3.07 persons per family.
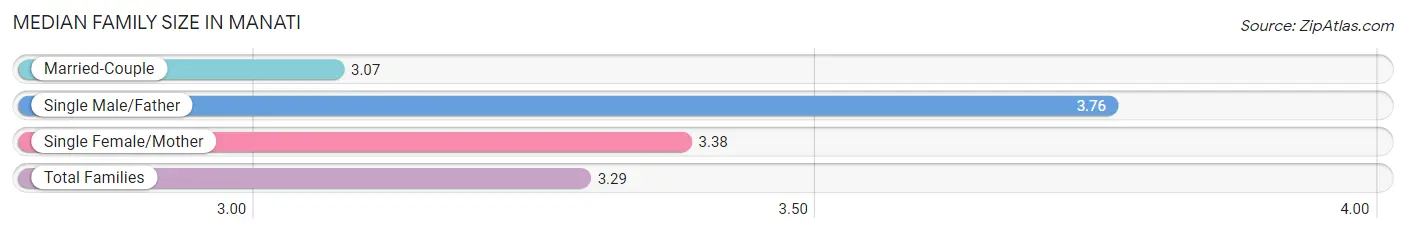
| Family Type | # Families | Family Size |
| Married-Couple | 1,058 (42.5%) | 3.07 |
| Single Male/Father | 302 (12.1%) | 3.76 |
| Single Female/Mother | 1,130 (45.4%) | 3.38 |
| Total Families | 2,490 (100.0%) | 3.29 |
Median Household Size in Manati
The median household size in Manati is 2.37 persons per household, with single male/father households (302 | 6.5%) accounting for the largest median household size of 4.26 persons per household. non-family households (2,166 | 46.5%) represent the smallest median household size with 1.16 persons per household.
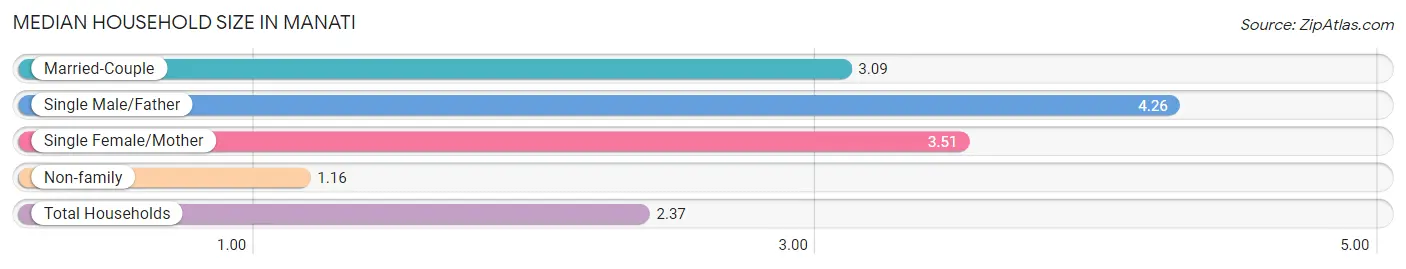
| Household Type | # Households | Household Size |
| Married-Couple | 1,058 (22.7%) | 3.09 |
| Single Male/Father | 302 (6.5%) | 4.26 |
| Single Female/Mother | 1,130 (24.3%) | 3.51 |
| Non-family | 2,166 (46.5%) | 1.16 |
| Total Households | 4,656 (100.0%) | 2.37 |
Household Size by Marriage Status in Manati
Out of a total of 4,656 households in Manati, 2,490 (53.5%) are family households, while 2,166 (46.5%) are nonfamily households. The most numerous type of family households are 2-person households, comprising 1,240, and the most common type of nonfamily households are 1-person households, comprising 1,868.
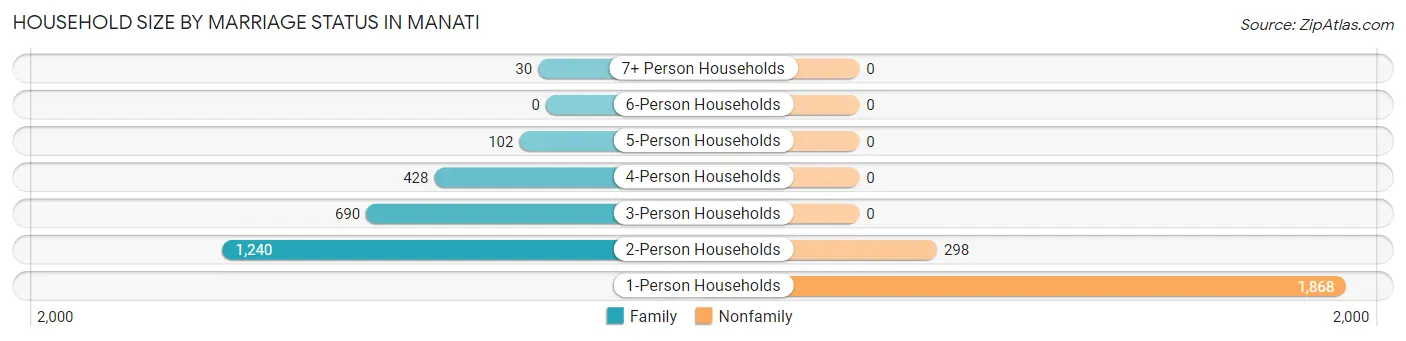
| Household Size | Family Households | Nonfamily Households |
| 1-Person Households | - | 1,868 (40.1%) |
| 2-Person Households | 1,240 (26.6%) | 298 (6.4%) |
| 3-Person Households | 690 (14.8%) | 0 (0.0%) |
| 4-Person Households | 428 (9.2%) | 0 (0.0%) |
| 5-Person Households | 102 (2.2%) | 0 (0.0%) |
| 6-Person Households | 0 (0.0%) | 0 (0.0%) |
| 7+ Person Households | 30 (0.6%) | 0 (0.0%) |
| Total | 2,490 (53.5%) | 2,166 (46.5%) |
Female Fertility in Manati
Fertility by Age in Manati
Average fertility rate in Manati is 27.0 births per 1,000 women. Women in the age bracket of 15 to 19 years have the highest fertility rate with 111.0 births per 1,000 women. Women in the age bracket of 20 to 34 years acount for 63.2% of all women with births.
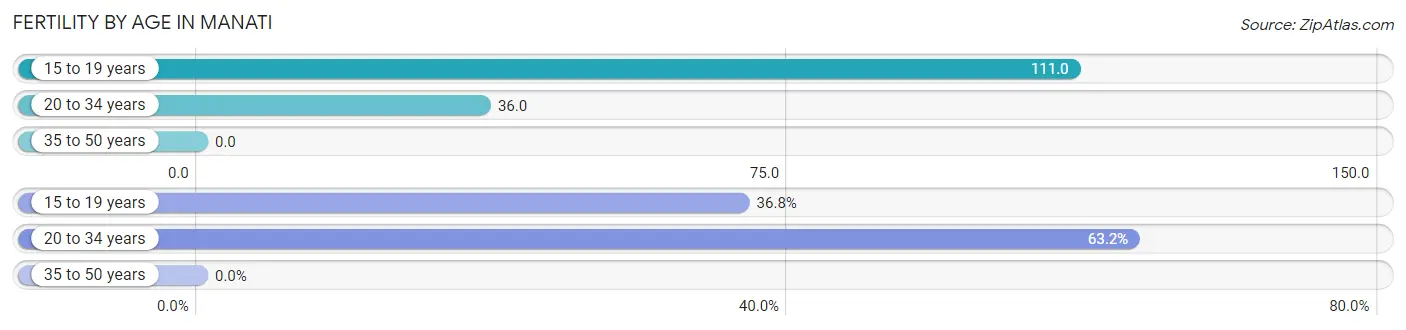
| Age Bracket | Women with Births | Births / 1,000 Women |
| 15 to 19 years | 25 (36.8%) | 111.0 |
| 20 to 34 years | 43 (63.2%) | 36.0 |
| 35 to 50 years | 0 (0.0%) | 0.0 |
| Total | 68 (100.0%) | 27.0 |
Fertility by Age by Marriage Status in Manati
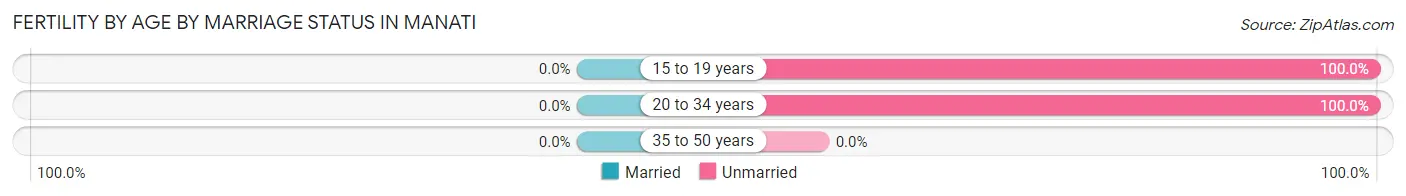
| Age Bracket | Married | Unmarried |
| 15 to 19 years | 0 (0.0%) | 25 (100.0%) |
| 20 to 34 years | 0 (0.0%) | 43 (100.0%) |
| 35 to 50 years | 0 (0.0%) | 0 (0.0%) |
| Total | 0 (0.0%) | 68 (100.0%) |
Fertility by Education in Manati
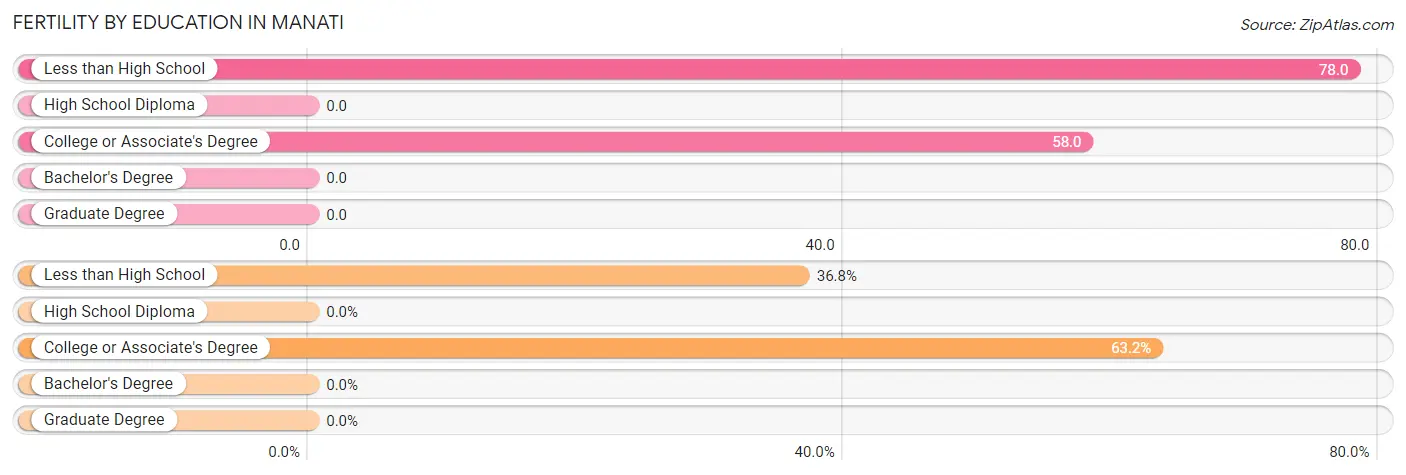
| Educational Attainment | Women with Births | Births / 1,000 Women |
| Less than High School | 25 (36.8%) | 78.0 |
| High School Diploma | 0 (0.0%) | 0.0 |
| College or Associate's Degree | 43 (63.2%) | 58.0 |
| Bachelor's Degree | 0 (0.0%) | 0.0 |
| Graduate Degree | 0 (0.0%) | 0.0 |
| Total | 68 (100.0%) | 27.0 |
Fertility by Education by Marriage Status in Manati
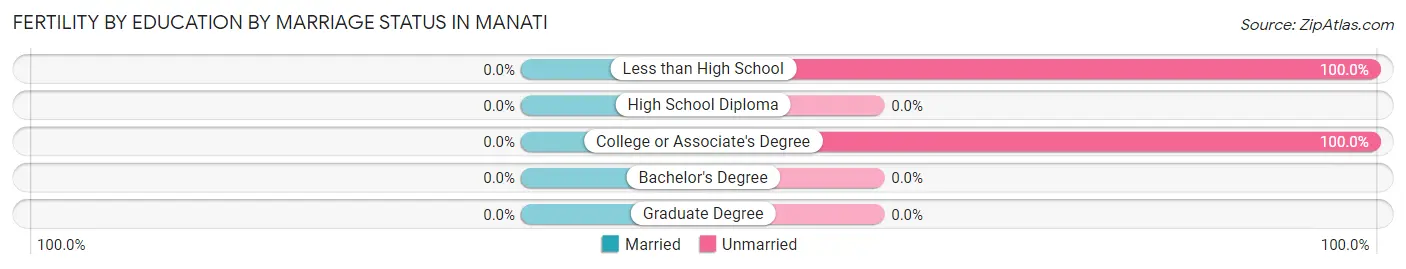
| Educational Attainment | Married | Unmarried |
| Less than High School | 0 (0.0%) | 25 (100.0%) |
| High School Diploma | 0 (0.0%) | 0 (0.0%) |
| College or Associate's Degree | 0 (0.0%) | 43 (100.0%) |
| Bachelor's Degree | 0 (0.0%) | 0 (0.0%) |
| Graduate Degree | 0 (0.0%) | 0 (0.0%) |
| Total | 0 (0.0%) | 68 (100.0%) |
Employment Characteristics in Manati
Employment by Class of Employer in Manati
Among the 2,754 employed individuals in Manati, private company employees (1,898 | 68.9%), self-employed (not incorporated) (346 | 12.6%), and state government employees (214 | 7.8%) make up the most common classes of employment.
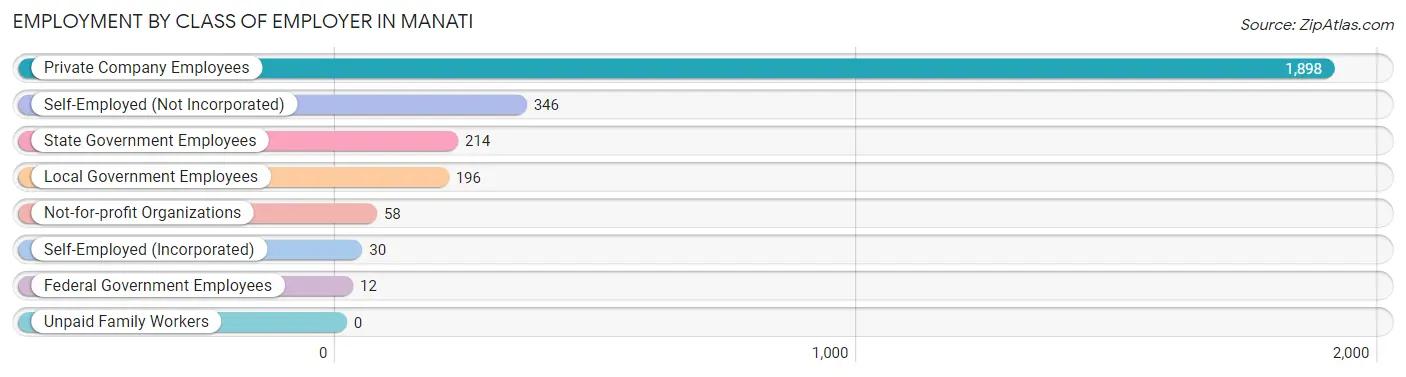
| Employer Class | # Employees | % Employees |
| Private Company Employees | 1,898 | 68.9% |
| Self-Employed (Incorporated) | 30 | 1.1% |
| Self-Employed (Not Incorporated) | 346 | 12.6% |
| Not-for-profit Organizations | 58 | 2.1% |
| Local Government Employees | 196 | 7.1% |
| State Government Employees | 214 | 7.8% |
| Federal Government Employees | 12 | 0.4% |
| Unpaid Family Workers | 0 | 0.0% |
| Total | 2,754 | 100.0% |
Employment Status by Age in Manati
According to the labor force statistics for Manati, out of the total population over 16 years of age (9,519), 36.9% or 3,513 individuals are in the labor force, with 21.6% or 759 of them unemployed. The age group with the highest labor force participation rate is 25 to 29 years, with 83.3% or 632 individuals in the labor force. Within the labor force, the 16 to 19 years age range has the highest percentage of unemployed individuals, with 100.0% or 43 of them being unemployed.
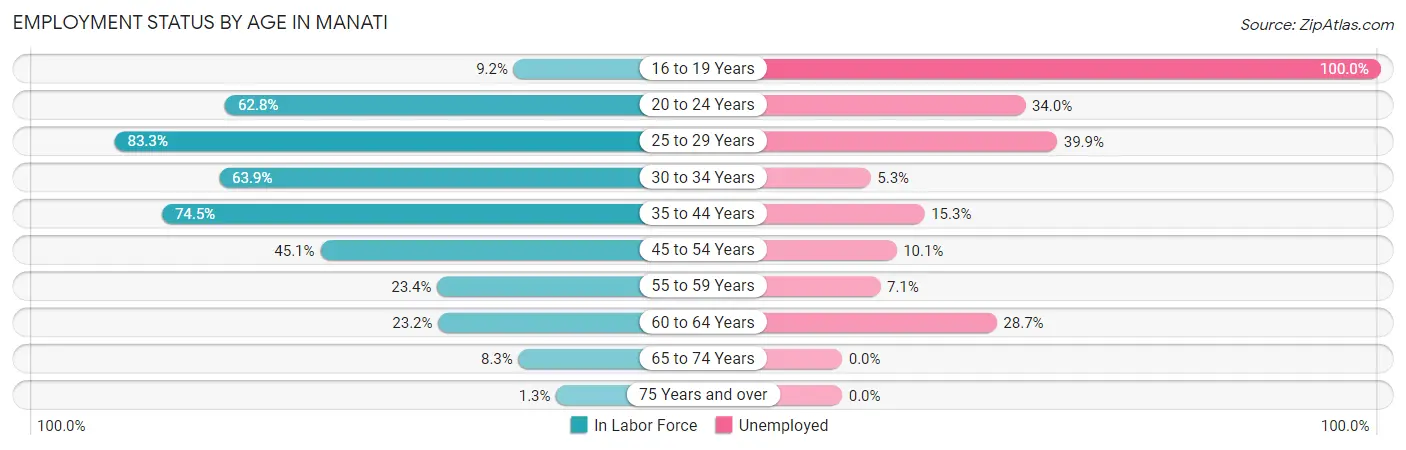
| Age Bracket | In Labor Force | Unemployed |
| 16 to 19 Years | 43 (9.2%) | 43 (100.0%) |
| 20 to 24 Years | 539 (62.8%) | 183 (34.0%) |
| 25 to 29 Years | 632 (83.3%) | 252 (39.9%) |
| 30 to 34 Years | 341 (63.9%) | 18 (5.3%) |
| 35 to 44 Years | 870 (74.5%) | 133 (15.3%) |
| 45 to 54 Years | 645 (45.1%) | 65 (10.1%) |
| 55 to 59 Years | 113 (23.4%) | 8 (7.1%) |
| 60 to 64 Years | 195 (23.2%) | 56 (28.7%) |
| 65 to 74 Years | 113 (8.3%) | 0 (0.0%) |
| 75 Years and over | 21 (1.3%) | 0 (0.0%) |
| Total | 3,513 (36.9%) | 759 (21.6%) |
Employment Status by Educational Attainment in Manati
According to labor force statistics for Manati, 53.6% of individuals (2,795) out of the total population between 25 and 64 years of age (5,214) are in the labor force, with 19.0% or 531 of them being unemployed. The group with the highest labor force participation rate are those with the educational attainment of bachelor's degree or higher, with 78.6% or 902 individuals in the labor force. Within the labor force, individuals with less than high school education have the highest percentage of unemployment, with 33.2% or 79 of them being unemployed.
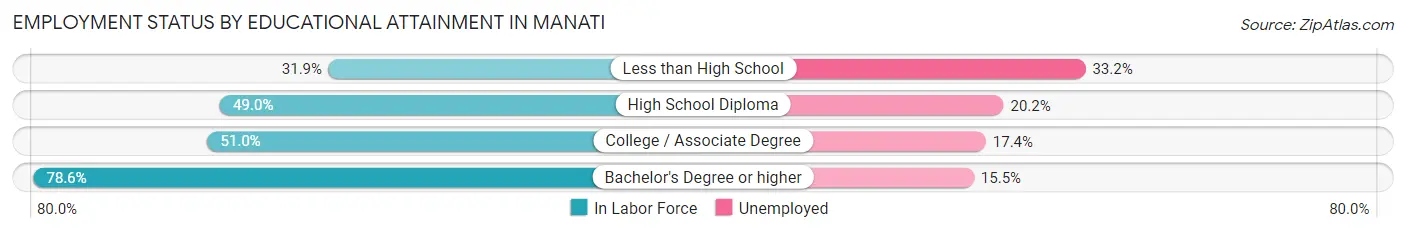
| Educational Attainment | In Labor Force | Unemployed |
| Less than High School | 238 (31.9%) | 248 (33.2%) |
| High School Diploma | 896 (49.0%) | 369 (20.2%) |
| College / Associate Degree | 760 (51.0%) | 259 (17.4%) |
| Bachelor's Degree or higher | 902 (78.6%) | 178 (15.5%) |
| Total | 2,795 (53.6%) | 991 (19.0%) |
Employment Occupations by Sex in Manati
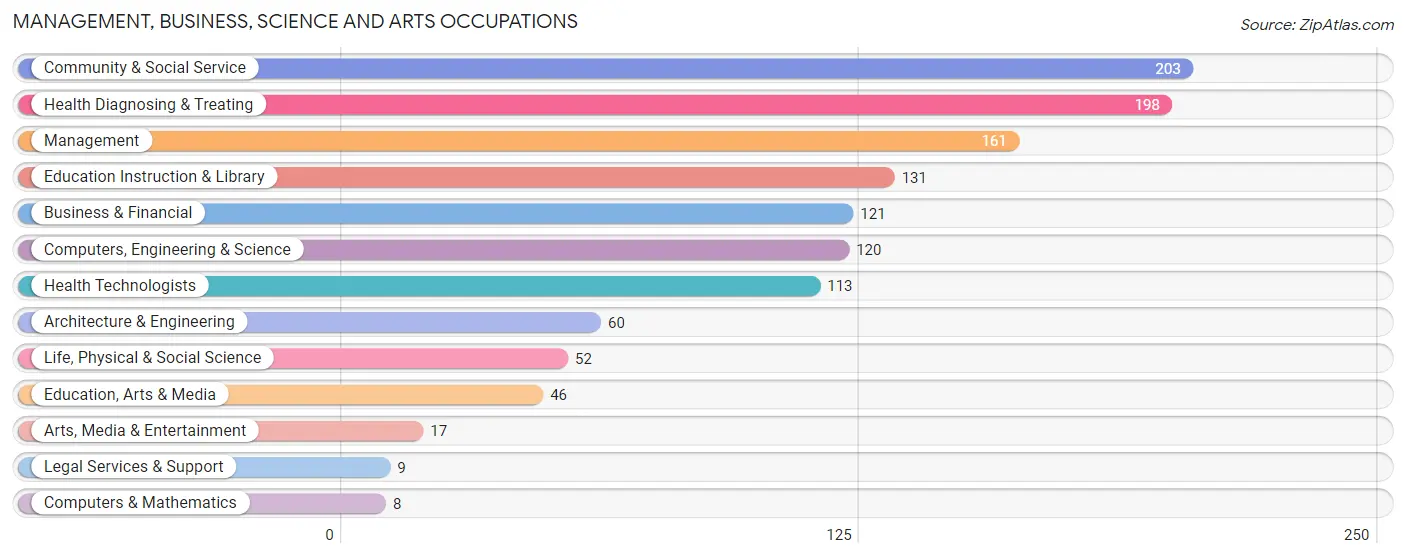
Management, Business, Science and Arts Occupations
The most common Management, Business, Science and Arts occupations in Manati are Community & Social Service (203 | 7.4%), Health Diagnosing & Treating (198 | 7.2%), Management (161 | 5.9%), Education Instruction & Library (131 | 4.8%), and Business & Financial (121 | 4.4%).
Management, Business, Science and Arts Occupations by Sex
Within the Management, Business, Science and Arts occupations in Manati, the most male-oriented occupations are Computers & Mathematics (100.0%), Architecture & Engineering (100.0%), and Arts, Media & Entertainment (100.0%), while the most female-oriented occupations are Legal Services & Support (100.0%), Education Instruction & Library (83.2%), and Business & Financial (72.7%).
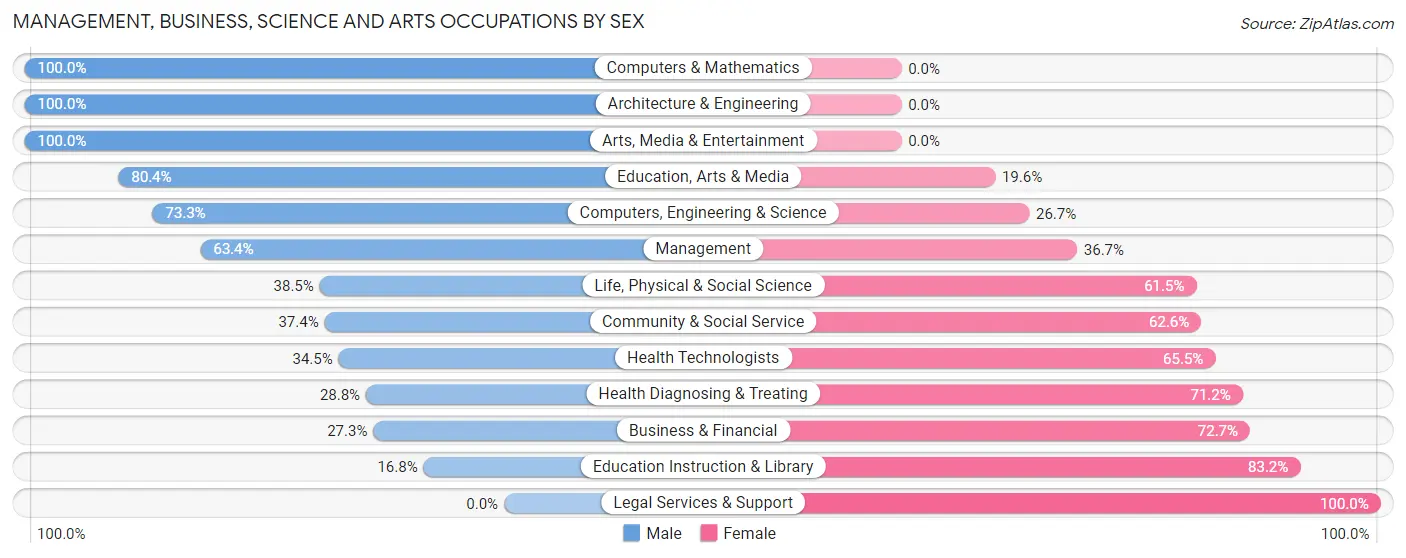
| Occupation | Male | Female |
| Management | 102 (63.3%) | 59 (36.6%) |
| Business & Financial | 33 (27.3%) | 88 (72.7%) |
| Computers, Engineering & Science | 88 (73.3%) | 32 (26.7%) |
| Computers & Mathematics | 8 (100.0%) | 0 (0.0%) |
| Architecture & Engineering | 60 (100.0%) | 0 (0.0%) |
| Life, Physical & Social Science | 20 (38.5%) | 32 (61.5%) |
| Community & Social Service | 76 (37.4%) | 127 (62.6%) |
| Education, Arts & Media | 37 (80.4%) | 9 (19.6%) |
| Legal Services & Support | 0 (0.0%) | 9 (100.0%) |
| Education Instruction & Library | 22 (16.8%) | 109 (83.2%) |
| Arts, Media & Entertainment | 17 (100.0%) | 0 (0.0%) |
| Health Diagnosing & Treating | 57 (28.8%) | 141 (71.2%) |
| Health Technologists | 39 (34.5%) | 74 (65.5%) |
| Total (Category) | 356 (44.3%) | 447 (55.7%) |
| Total (Overall) | 1,476 (53.6%) | 1,278 (46.4%) |
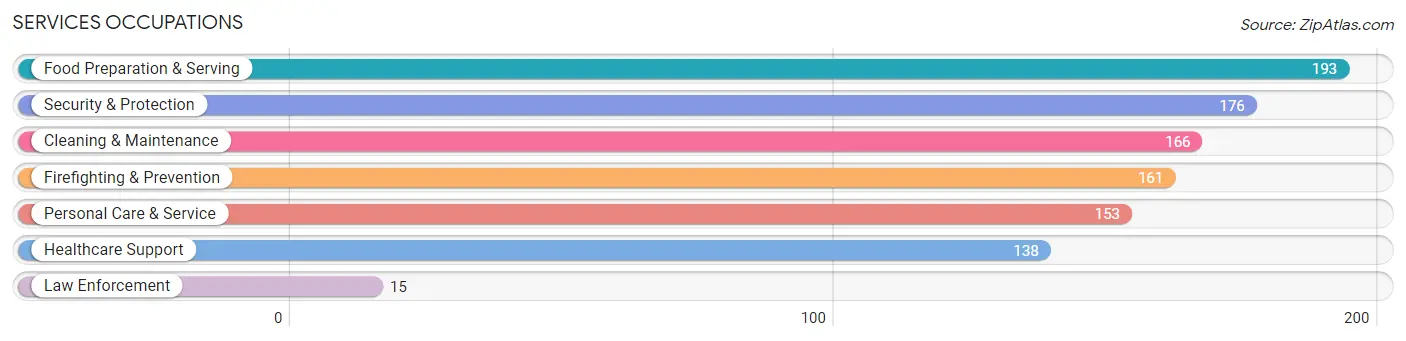
Services Occupations
The most common Services occupations in Manati are Food Preparation & Serving (193 | 7.0%), Security & Protection (176 | 6.4%), Cleaning & Maintenance (166 | 6.0%), Firefighting & Prevention (161 | 5.9%), and Personal Care & Service (153 | 5.6%).
Services Occupations by Sex
Within the Services occupations in Manati, the most male-oriented occupations are Law Enforcement (100.0%), Personal Care & Service (75.2%), and Security & Protection (68.2%), while the most female-oriented occupations are Healthcare Support (100.0%), Food Preparation & Serving (50.8%), and Cleaning & Maintenance (41.6%).
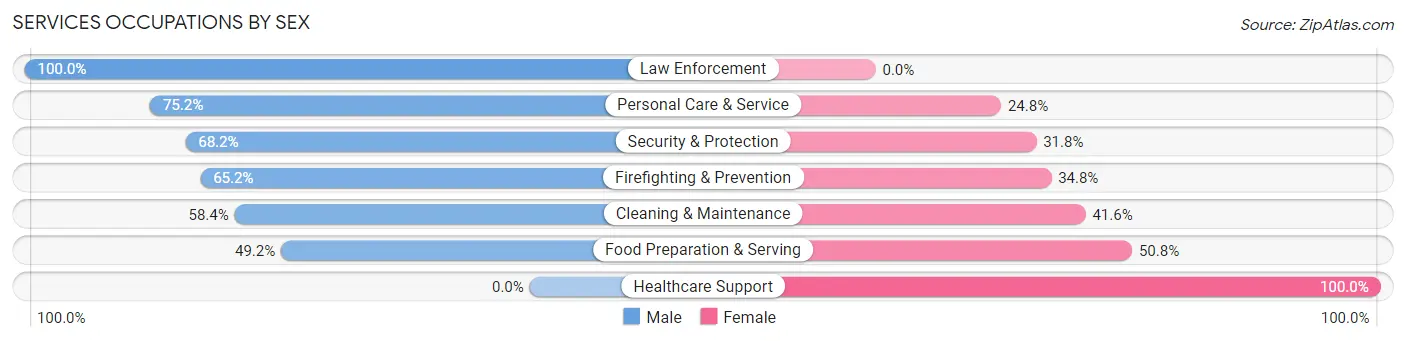
| Occupation | Male | Female |
| Healthcare Support | 0 (0.0%) | 138 (100.0%) |
| Security & Protection | 120 (68.2%) | 56 (31.8%) |
| Firefighting & Prevention | 105 (65.2%) | 56 (34.8%) |
| Law Enforcement | 15 (100.0%) | 0 (0.0%) |
| Food Preparation & Serving | 95 (49.2%) | 98 (50.8%) |
| Cleaning & Maintenance | 97 (58.4%) | 69 (41.6%) |
| Personal Care & Service | 115 (75.2%) | 38 (24.8%) |
| Total (Category) | 427 (51.7%) | 399 (48.3%) |
| Total (Overall) | 1,476 (53.6%) | 1,278 (46.4%) |
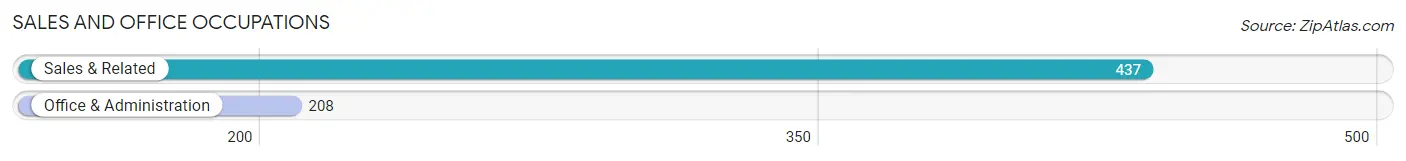
Sales and Office Occupations
The most common Sales and Office occupations in Manati are Sales & Related (437 | 15.9%), and Office & Administration (208 | 7.5%).
Sales and Office Occupations by Sex
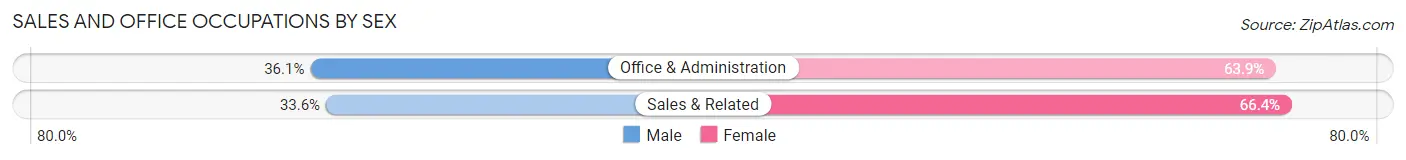
| Occupation | Male | Female |
| Sales & Related | 147 (33.6%) | 290 (66.4%) |
| Office & Administration | 75 (36.1%) | 133 (63.9%) |
| Total (Category) | 222 (34.4%) | 423 (65.6%) |
| Total (Overall) | 1,476 (53.6%) | 1,278 (46.4%) |
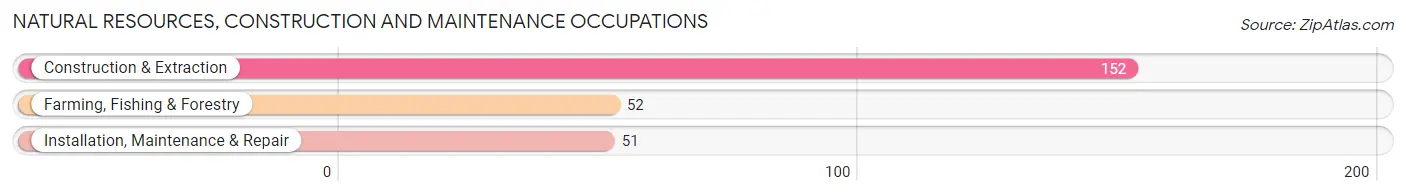
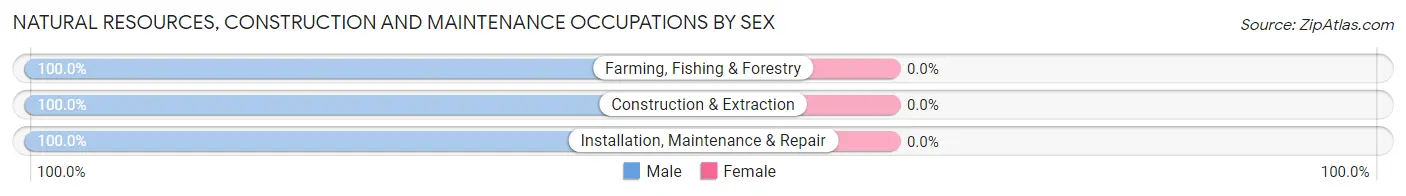
Natural Resources, Construction and Maintenance Occupations
The most common Natural Resources, Construction and Maintenance occupations in Manati are Construction & Extraction (152 | 5.5%), Farming, Fishing & Forestry (52 | 1.9%), and Installation, Maintenance & Repair (51 | 1.8%).
Natural Resources, Construction and Maintenance Occupations by Sex
| Occupation | Male | Female |
| Farming, Fishing & Forestry | 52 (100.0%) | 0 (0.0%) |
| Construction & Extraction | 152 (100.0%) | 0 (0.0%) |
| Installation, Maintenance & Repair | 51 (100.0%) | 0 (0.0%) |
| Total (Category) | 255 (100.0%) | 0 (0.0%) |
| Total (Overall) | 1,476 (53.6%) | 1,278 (46.4%) |
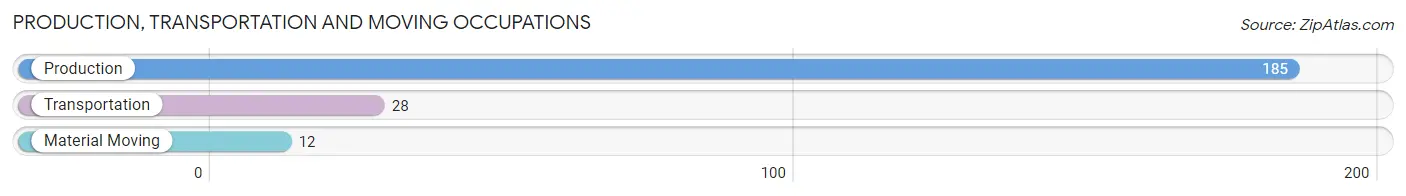
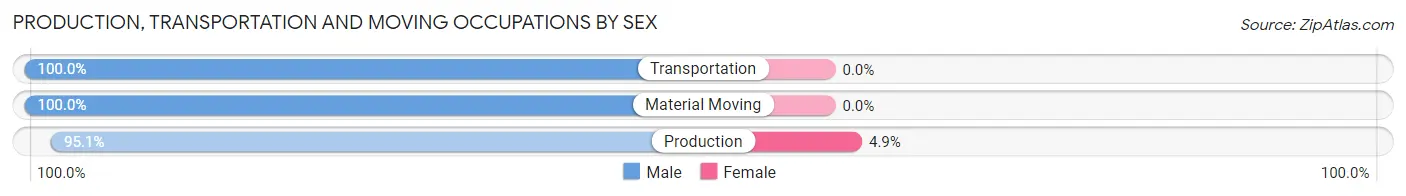
Production, Transportation and Moving Occupations
The most common Production, Transportation and Moving occupations in Manati are Production (185 | 6.7%), Transportation (28 | 1.0%), and Material Moving (12 | 0.4%).
Production, Transportation and Moving Occupations by Sex
| Occupation | Male | Female |
| Production | 176 (95.1%) | 9 (4.9%) |
| Transportation | 28 (100.0%) | 0 (0.0%) |
| Material Moving | 12 (100.0%) | 0 (0.0%) |
| Total (Category) | 216 (96.0%) | 9 (4.0%) |
| Total (Overall) | 1,476 (53.6%) | 1,278 (46.4%) |
Employment Industries by Sex in Manati
Employment Industries in Manati
The major employment industries in Manati include Health Care & Social Assistance (446 | 16.2%), Retail Trade (364 | 13.2%), Manufacturing (322 | 11.7%), Accommodation & Food Services (255 | 9.3%), and Administrative & Support (241 | 8.7%).
Employment Industries by Sex in Manati
The Manati industries that see more men than women are Agriculture, Fishing & Hunting (100.0%), Construction (100.0%), and Wholesale Trade (100.0%), whereas the industries that tend to have a higher number of women are Real Estate, Rental & Leasing (100.0%), Educational Services (86.8%), and Health Care & Social Assistance (81.2%).
| Industry | Male | Female |
| Agriculture, Fishing & Hunting | 65 (100.0%) | 0 (0.0%) |
| Mining, Quarrying, & Extraction | 0 (0.0%) | 0 (0.0%) |
| Construction | 224 (100.0%) | 0 (0.0%) |
| Manufacturing | 272 (84.5%) | 50 (15.5%) |
| Wholesale Trade | 18 (100.0%) | 0 (0.0%) |
| Retail Trade | 152 (41.8%) | 212 (58.2%) |
| Transportation & Warehousing | 0 (0.0%) | 0 (0.0%) |
| Utilities | 18 (100.0%) | 0 (0.0%) |
| Information | 18 (48.6%) | 19 (51.3%) |
| Finance & Insurance | 8 (22.9%) | 27 (77.1%) |
| Real Estate, Rental & Leasing | 0 (0.0%) | 32 (100.0%) |
| Professional & Scientific | 74 (79.6%) | 19 (20.4%) |
| Enterprise Management | 0 (0.0%) | 0 (0.0%) |
| Administrative & Support | 144 (59.8%) | 97 (40.3%) |
| Educational Services | 22 (13.2%) | 145 (86.8%) |
| Health Care & Social Assistance | 84 (18.8%) | 362 (81.2%) |
| Arts, Entertainment & Recreation | 44 (55.0%) | 36 (45.0%) |
| Accommodation & Food Services | 126 (49.4%) | 129 (50.6%) |
| Public Administration | 62 (48.4%) | 66 (51.6%) |
| Total | 1,476 (53.6%) | 1,278 (46.4%) |
Education in Manati
School Enrollment in Manati
The most common levels of schooling among the 1,922 students in Manati are middle school (583 | 30.3%), college / undergraduate (541 | 28.1%), and high school (305 | 15.9%).
| School Level | # Students | % Students |
| Nursery / Preschool | 93 | 4.8% |
| Kindergarten | 91 | 4.7% |
| Elementary School | 285 | 14.8% |
| Middle School | 583 | 30.3% |
| High School | 305 | 15.9% |
| College / Undergraduate | 541 | 28.1% |
| Graduate / Professional | 24 | 1.3% |
| Total | 1,922 | 100.0% |
School Enrollment by Age by Funding Source in Manati
Out of a total of 1,922 students who are enrolled in schools in Manati, 461 (24.0%) attend a private institution, while the remaining 1,461 (76.0%) are enrolled in public schools. The age group of 25 to 34 year olds has the highest likelihood of being enrolled in private schools, with 80 (100.0% in the age bracket) enrolled. Conversely, the age group of 3 to 4 year olds has the lowest likelihood of being enrolled in a private school, with 83 (100.0% in the age bracket) attending a public institution.
| Age Bracket | Public School | Private School |
| 3 to 4 Year Olds | 83 (100.0%) | 0 (0.0%) |
| 5 to 9 Year Old | 306 (79.3%) | 80 (20.7%) |
| 10 to 14 Year Olds | 541 (87.5%) | 77 (12.5%) |
| 15 to 17 Year Olds | 218 (80.7%) | 52 (19.3%) |
| 18 to 19 Year Olds | 55 (55.6%) | 44 (44.4%) |
| 20 to 24 Year Olds | 213 (62.3%) | 129 (37.7%) |
| 25 to 34 Year Olds | 0 (0.0%) | 80 (100.0%) |
| 35 Years and over | 44 (100.0%) | 0 (0.0%) |
| Total | 1,461 (76.0%) | 461 (24.0%) |
Educational Attainment by Field of Study in Manati
Business (429 | 27.0%), education (361 | 22.7%), science & technology (228 | 14.3%), bio, nature & agricultural (117 | 7.4%), and engineering (98 | 6.2%) are the most common fields of study among 1,589 individuals in Manati who have obtained a bachelor's degree or higher.
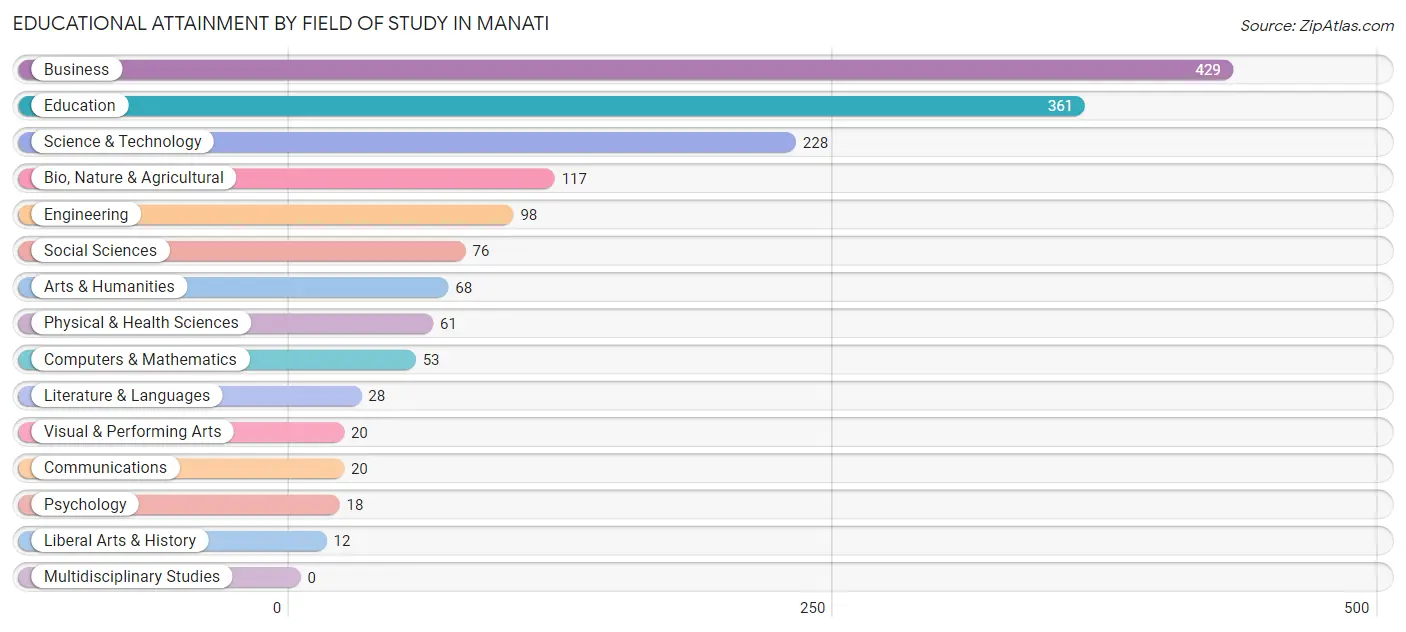
| Field of Study | # Graduates | % Graduates |
| Computers & Mathematics | 53 | 3.3% |
| Bio, Nature & Agricultural | 117 | 7.4% |
| Physical & Health Sciences | 61 | 3.8% |
| Psychology | 18 | 1.1% |
| Social Sciences | 76 | 4.8% |
| Engineering | 98 | 6.2% |
| Multidisciplinary Studies | 0 | 0.0% |
| Science & Technology | 228 | 14.3% |
| Business | 429 | 27.0% |
| Education | 361 | 22.7% |
| Literature & Languages | 28 | 1.8% |
| Liberal Arts & History | 12 | 0.8% |
| Visual & Performing Arts | 20 | 1.3% |
| Communications | 20 | 1.3% |
| Arts & Humanities | 68 | 4.3% |
| Total | 1,589 | 100.0% |
Transportation & Commute in Manati
Vehicle Availability by Sex in Manati
The most prevalent vehicle ownership categories in Manati are males with 2 vehicles (595, accounting for 40.3%) and females with 2 vehicles (605, making up 46.6%).
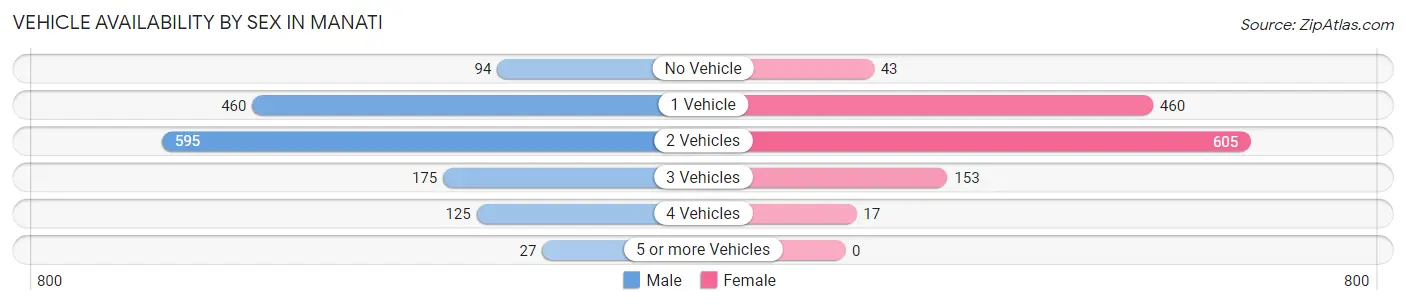
| Vehicles Available | Male | Female |
| No Vehicle | 94 (6.4%) | 43 (3.4%) |
| 1 Vehicle | 460 (31.2%) | 460 (36.0%) |
| 2 Vehicles | 595 (40.3%) | 605 (47.3%) |
| 3 Vehicles | 175 (11.9%) | 153 (12.0%) |
| 4 Vehicles | 125 (8.5%) | 17 (1.3%) |
| 5 or more Vehicles | 27 (1.8%) | 0 (0.0%) |
| Total | 1,476 (100.0%) | 1,278 (100.0%) |
Commute Time in Manati
The most frequently occuring commute durations in Manati are 10 to 14 minutes (828 commuters, 30.1%), 15 to 19 minutes (457 commuters, 16.6%), and 20 to 24 minutes (421 commuters, 15.3%).
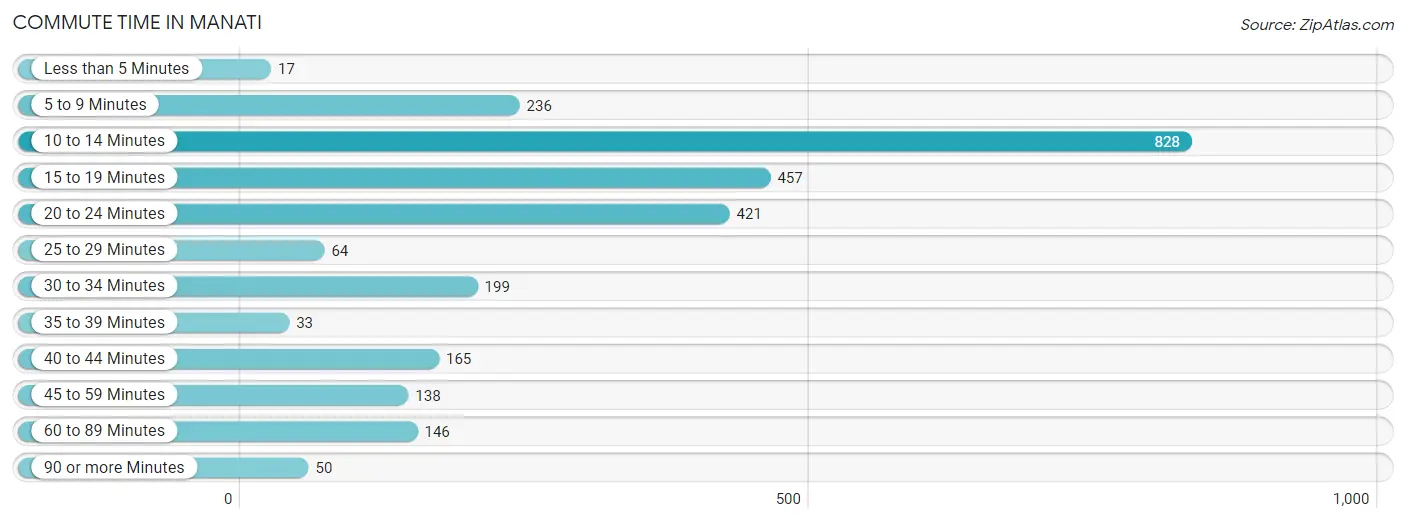
| Commute Time | # Commuters | % Commuters |
| Less than 5 Minutes | 17 | 0.6% |
| 5 to 9 Minutes | 236 | 8.6% |
| 10 to 14 Minutes | 828 | 30.1% |
| 15 to 19 Minutes | 457 | 16.6% |
| 20 to 24 Minutes | 421 | 15.3% |
| 25 to 29 Minutes | 64 | 2.3% |
| 30 to 34 Minutes | 199 | 7.2% |
| 35 to 39 Minutes | 33 | 1.2% |
| 40 to 44 Minutes | 165 | 6.0% |
| 45 to 59 Minutes | 138 | 5.0% |
| 60 to 89 Minutes | 146 | 5.3% |
| 90 or more Minutes | 50 | 1.8% |
Commute Time by Sex in Manati
The most common commute times in Manati are 10 to 14 minutes (495 commuters, 33.5%) for males and 10 to 14 minutes (333 commuters, 26.1%) for females.
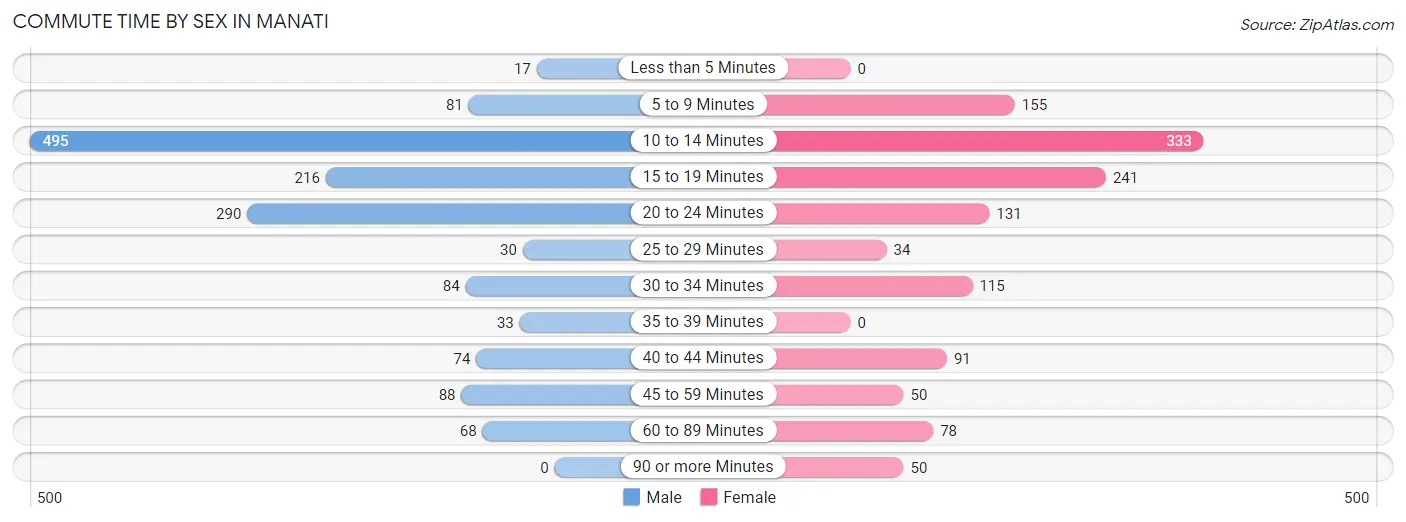
| Commute Time | Male | Female |
| Less than 5 Minutes | 17 (1.1%) | 0 (0.0%) |
| 5 to 9 Minutes | 81 (5.5%) | 155 (12.1%) |
| 10 to 14 Minutes | 495 (33.5%) | 333 (26.1%) |
| 15 to 19 Minutes | 216 (14.6%) | 241 (18.9%) |
| 20 to 24 Minutes | 290 (19.7%) | 131 (10.2%) |
| 25 to 29 Minutes | 30 (2.0%) | 34 (2.7%) |
| 30 to 34 Minutes | 84 (5.7%) | 115 (9.0%) |
| 35 to 39 Minutes | 33 (2.2%) | 0 (0.0%) |
| 40 to 44 Minutes | 74 (5.0%) | 91 (7.1%) |
| 45 to 59 Minutes | 88 (6.0%) | 50 (3.9%) |
| 60 to 89 Minutes | 68 (4.6%) | 78 (6.1%) |
| 90 or more Minutes | 0 (0.0%) | 50 (3.9%) |
Time of Departure to Work by Sex in Manati
The most frequent times of departure to work in Manati are 7:00 AM to 7:29 AM (293, 19.9%) for males and 7:30 AM to 7:59 AM (249, 19.5%) for females.
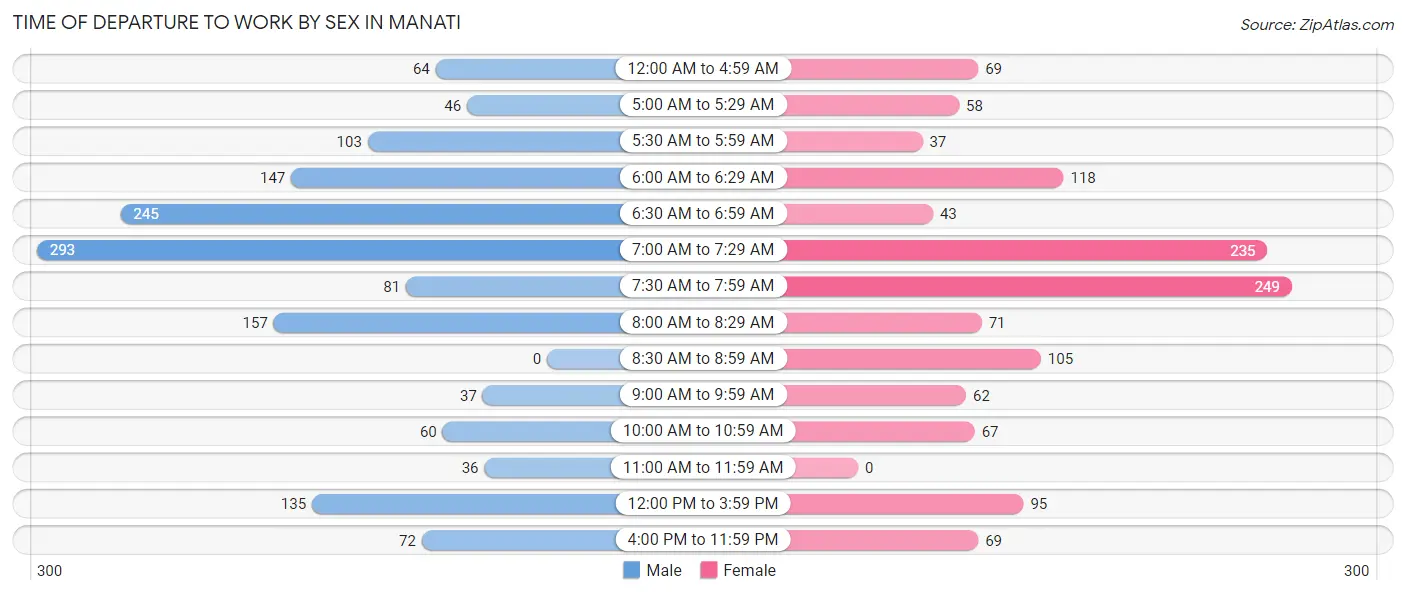
| Time of Departure | Male | Female |
| 12:00 AM to 4:59 AM | 64 (4.3%) | 69 (5.4%) |
| 5:00 AM to 5:29 AM | 46 (3.1%) | 58 (4.5%) |
| 5:30 AM to 5:59 AM | 103 (7.0%) | 37 (2.9%) |
| 6:00 AM to 6:29 AM | 147 (10.0%) | 118 (9.2%) |
| 6:30 AM to 6:59 AM | 245 (16.6%) | 43 (3.4%) |
| 7:00 AM to 7:29 AM | 293 (19.9%) | 235 (18.4%) |
| 7:30 AM to 7:59 AM | 81 (5.5%) | 249 (19.5%) |
| 8:00 AM to 8:29 AM | 157 (10.6%) | 71 (5.6%) |
| 8:30 AM to 8:59 AM | 0 (0.0%) | 105 (8.2%) |
| 9:00 AM to 9:59 AM | 37 (2.5%) | 62 (4.9%) |
| 10:00 AM to 10:59 AM | 60 (4.1%) | 67 (5.2%) |
| 11:00 AM to 11:59 AM | 36 (2.4%) | 0 (0.0%) |
| 12:00 PM to 3:59 PM | 135 (9.1%) | 95 (7.4%) |
| 4:00 PM to 11:59 PM | 72 (4.9%) | 69 (5.4%) |
| Total | 1,476 (100.0%) | 1,278 (100.0%) |
Housing Occupancy in Manati
Occupancy by Ownership in Manati
Of the total 4,656 dwellings in Manati, owner-occupied units account for 2,792 (60.0%), while renter-occupied units make up 1,864 (40.0%).
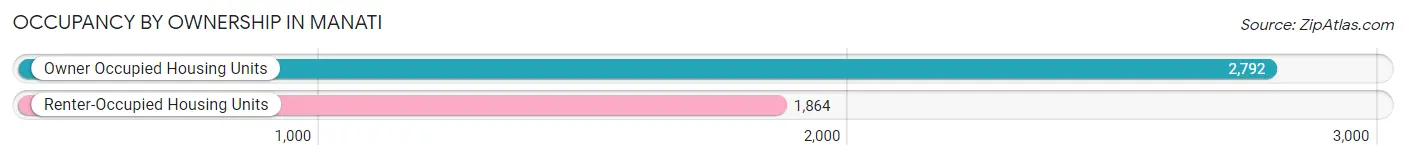
| Occupancy | # Housing Units | % Housing Units |
| Owner Occupied Housing Units | 2,792 | 60.0% |
| Renter-Occupied Housing Units | 1,864 | 40.0% |
| Total Occupied Housing Units | 4,656 | 100.0% |
Occupancy by Household Size in Manati
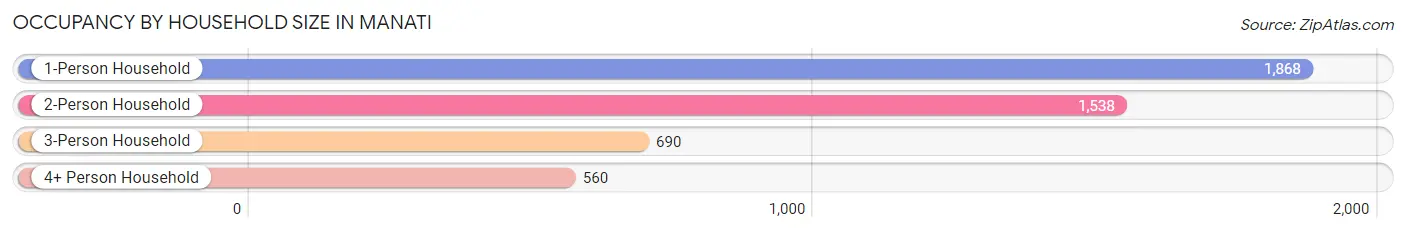
| Household Size | # Housing Units | % Housing Units |
| 1-Person Household | 1,868 | 40.1% |
| 2-Person Household | 1,538 | 33.0% |
| 3-Person Household | 690 | 14.8% |
| 4+ Person Household | 560 | 12.0% |
| Total Housing Units | 4,656 | 100.0% |
Occupancy by Ownership by Household Size in Manati
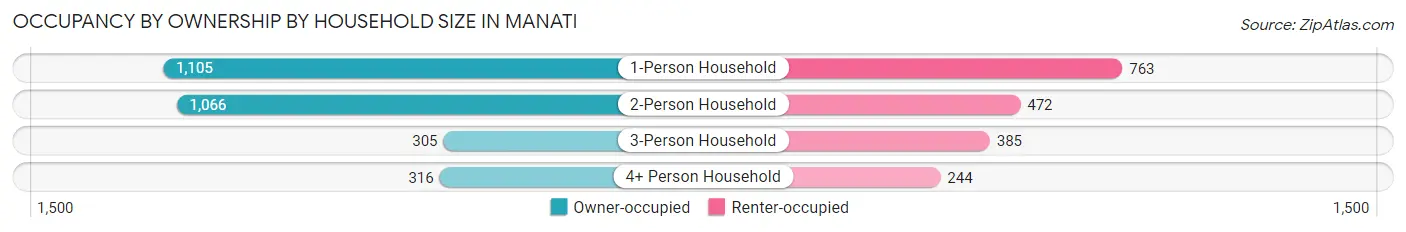
| Household Size | Owner-occupied | Renter-occupied |
| 1-Person Household | 1,105 (59.2%) | 763 (40.8%) |
| 2-Person Household | 1,066 (69.3%) | 472 (30.7%) |
| 3-Person Household | 305 (44.2%) | 385 (55.8%) |
| 4+ Person Household | 316 (56.4%) | 244 (43.6%) |
| Total Housing Units | 2,792 (60.0%) | 1,864 (40.0%) |
Occupancy by Educational Attainment in Manati
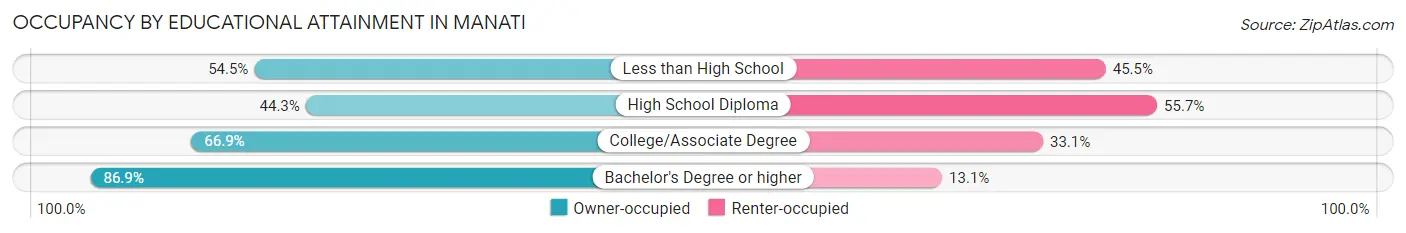
| Household Size | Owner-occupied | Renter-occupied |
| Less than High School | 675 (54.5%) | 564 (45.5%) |
| High School Diploma | 667 (44.3%) | 839 (55.7%) |
| College/Associate Degree | 706 (66.9%) | 349 (33.1%) |
| Bachelor's Degree or higher | 744 (86.9%) | 112 (13.1%) |
Occupancy by Age of Householder in Manati
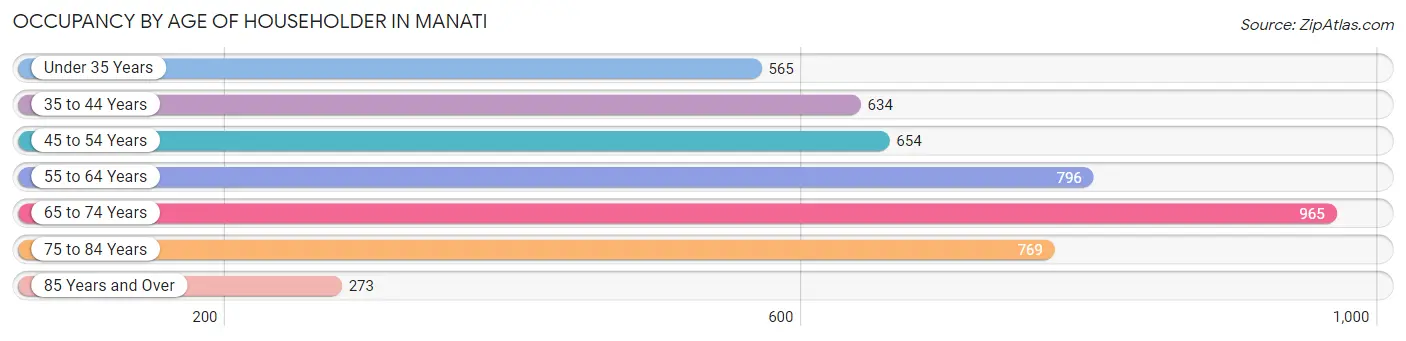
| Age Bracket | # Households | % Households |
| Under 35 Years | 565 | 12.1% |
| 35 to 44 Years | 634 | 13.6% |
| 45 to 54 Years | 654 | 14.1% |
| 55 to 64 Years | 796 | 17.1% |
| 65 to 74 Years | 965 | 20.7% |
| 75 to 84 Years | 769 | 16.5% |
| 85 Years and Over | 273 | 5.9% |
| Total | 4,656 | 100.0% |
Housing Finances in Manati
Median Income by Occupancy in Manati
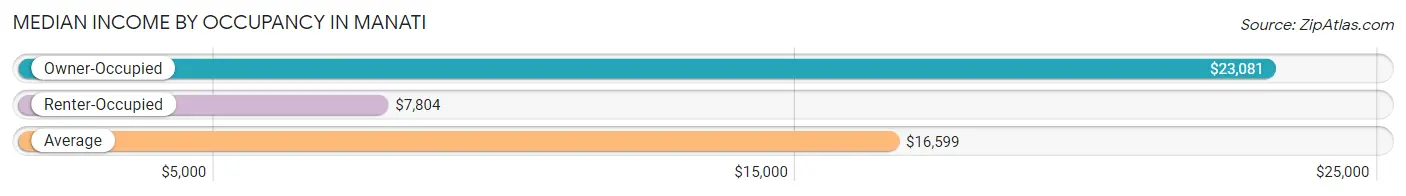
| Occupancy Type | # Households | Median Income |
| Owner-Occupied | 2,792 (60.0%) | $23,081 |
| Renter-Occupied | 1,864 (40.0%) | $7,804 |
| Average | 4,656 (100.0%) | $16,599 |
Occupancy by Householder Income Bracket in Manati
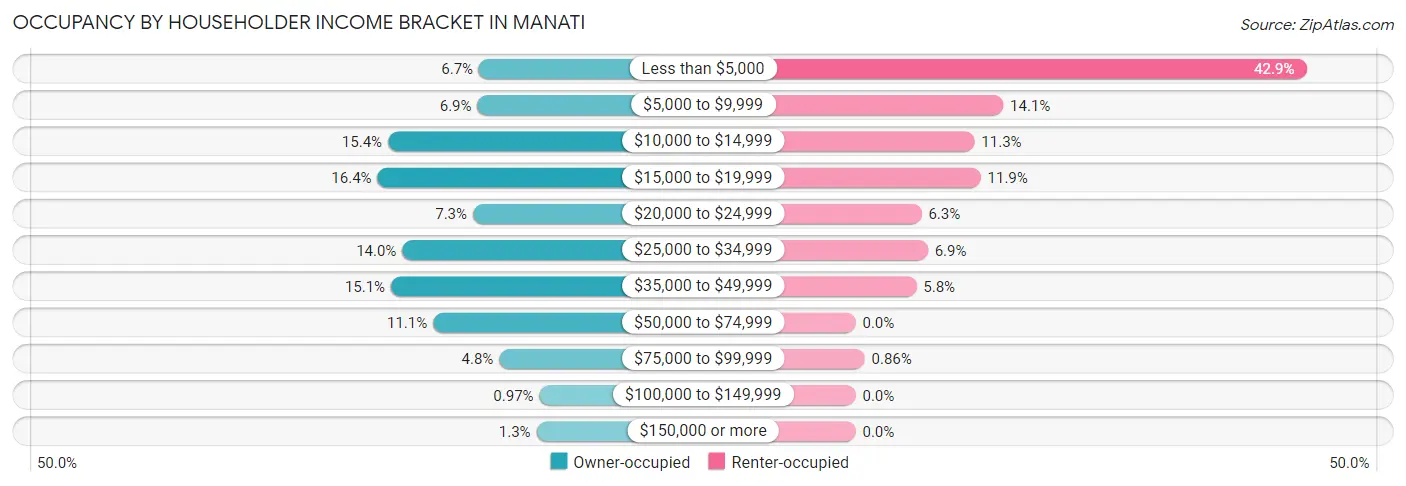
| Income Bracket | Owner-occupied | Renter-occupied |
| Less than $5,000 | 188 (6.7%) | 800 (42.9%) |
| $5,000 to $9,999 | 192 (6.9%) | 262 (14.1%) |
| $10,000 to $14,999 | 430 (15.4%) | 211 (11.3%) |
| $15,000 to $19,999 | 458 (16.4%) | 222 (11.9%) |
| $20,000 to $24,999 | 204 (7.3%) | 117 (6.3%) |
| $25,000 to $34,999 | 392 (14.0%) | 128 (6.9%) |
| $35,000 to $49,999 | 422 (15.1%) | 108 (5.8%) |
| $50,000 to $74,999 | 310 (11.1%) | 0 (0.0%) |
| $75,000 to $99,999 | 134 (4.8%) | 16 (0.9%) |
| $100,000 to $149,999 | 27 (1.0%) | 0 (0.0%) |
| $150,000 or more | 35 (1.3%) | 0 (0.0%) |
| Total | 2,792 (100.0%) | 1,864 (100.0%) |
Monthly Housing Cost Tiers in Manati
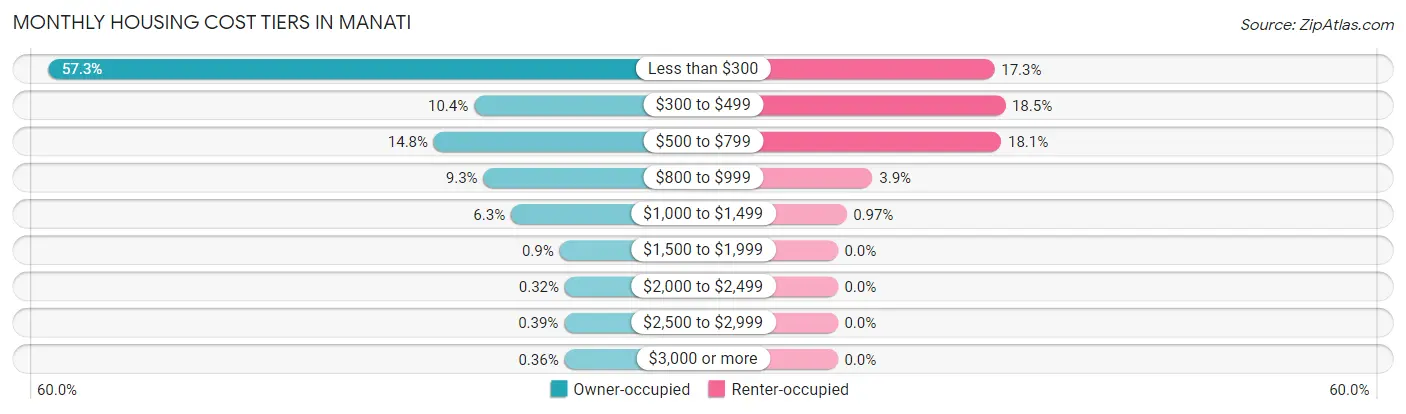
| Monthly Cost | Owner-occupied | Renter-occupied |
| Less than $300 | 1,600 (57.3%) | 323 (17.3%) |
| $300 to $499 | 289 (10.3%) | 345 (18.5%) |
| $500 to $799 | 413 (14.8%) | 337 (18.1%) |
| $800 to $999 | 260 (9.3%) | 72 (3.9%) |
| $1,000 to $1,499 | 175 (6.3%) | 18 (1.0%) |
| $1,500 to $1,999 | 25 (0.9%) | 0 (0.0%) |
| $2,000 to $2,499 | 9 (0.3%) | 0 (0.0%) |
| $2,500 to $2,999 | 11 (0.4%) | 0 (0.0%) |
| $3,000 or more | 10 (0.4%) | 0 (0.0%) |
| Total | 2,792 (100.0%) | 1,864 (100.0%) |
Physical Housing Characteristics in Manati
Housing Structures in Manati
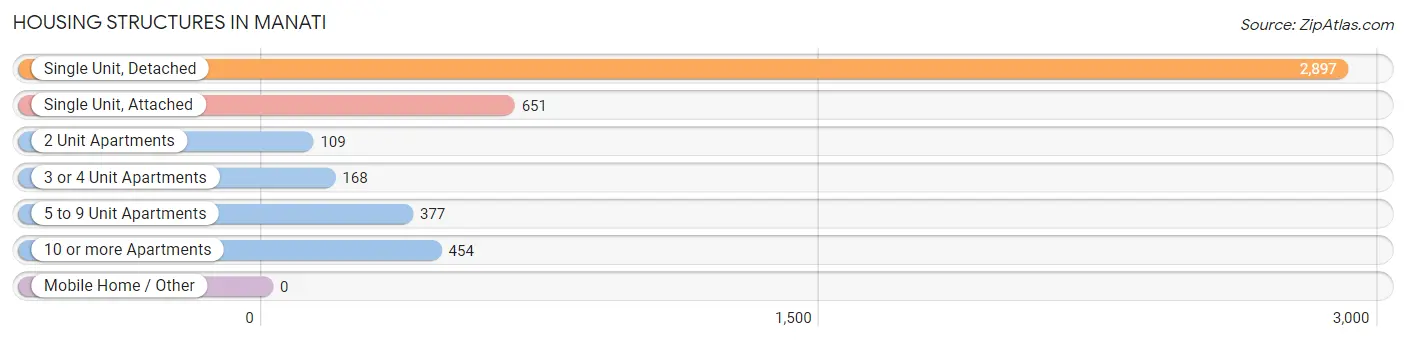
| Structure Type | # Housing Units | % Housing Units |
| Single Unit, Detached | 2,897 | 62.2% |
| Single Unit, Attached | 651 | 14.0% |
| 2 Unit Apartments | 109 | 2.3% |
| 3 or 4 Unit Apartments | 168 | 3.6% |
| 5 to 9 Unit Apartments | 377 | 8.1% |
| 10 or more Apartments | 454 | 9.8% |
| Mobile Home / Other | 0 | 0.0% |
| Total | 4,656 | 100.0% |
Housing Structures by Occupancy in Manati
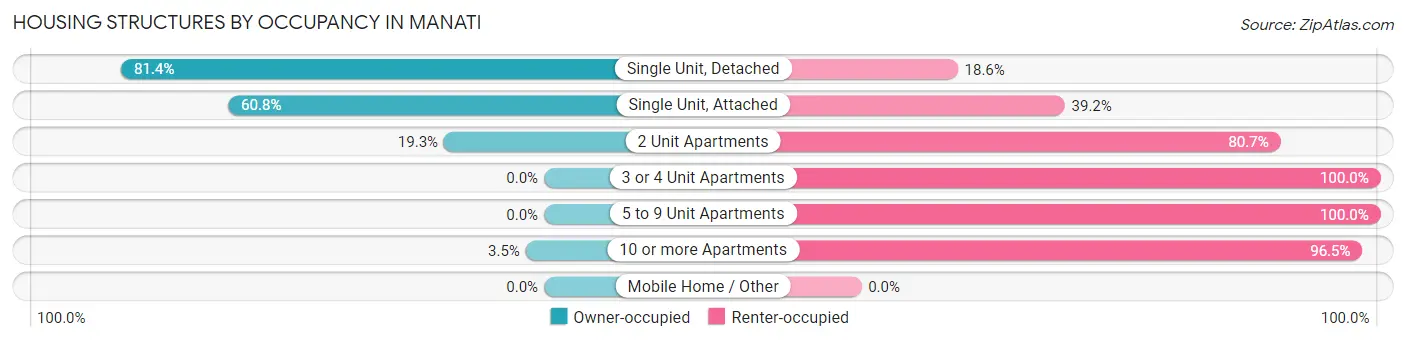
| Structure Type | Owner-occupied | Renter-occupied |
| Single Unit, Detached | 2,359 (81.4%) | 538 (18.6%) |
| Single Unit, Attached | 396 (60.8%) | 255 (39.2%) |
| 2 Unit Apartments | 21 (19.3%) | 88 (80.7%) |
| 3 or 4 Unit Apartments | 0 (0.0%) | 168 (100.0%) |
| 5 to 9 Unit Apartments | 0 (0.0%) | 377 (100.0%) |
| 10 or more Apartments | 16 (3.5%) | 438 (96.5%) |
| Mobile Home / Other | 0 (0.0%) | 0 (0.0%) |
| Total | 2,792 (60.0%) | 1,864 (40.0%) |
Housing Structures by Number of Rooms in Manati
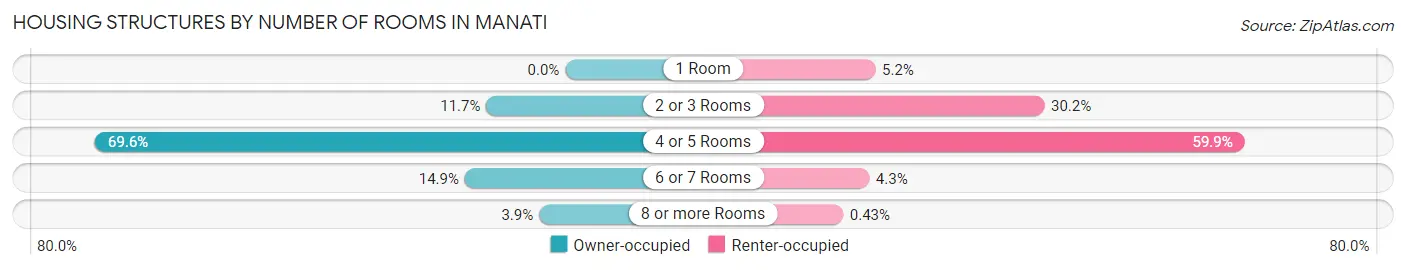
| Number of Rooms | Owner-occupied | Renter-occupied |
| 1 Room | 0 (0.0%) | 97 (5.2%) |
| 2 or 3 Rooms | 326 (11.7%) | 563 (30.2%) |
| 4 or 5 Rooms | 1,943 (69.6%) | 1,116 (59.9%) |
| 6 or 7 Rooms | 415 (14.9%) | 80 (4.3%) |
| 8 or more Rooms | 108 (3.9%) | 8 (0.4%) |
| Total | 2,792 (100.0%) | 1,864 (100.0%) |
Housing Structure by Heating Type in Manati
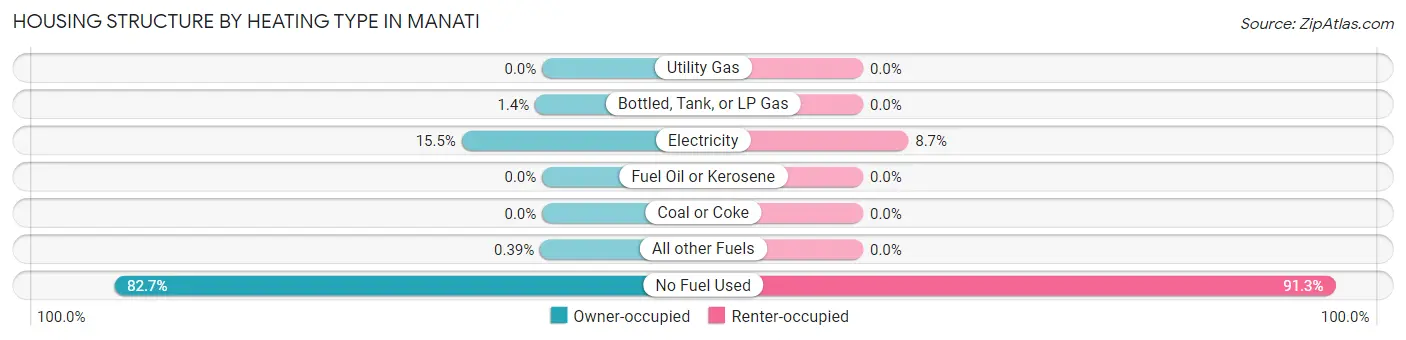
| Heating Type | Owner-occupied | Renter-occupied |
| Utility Gas | 0 (0.0%) | 0 (0.0%) |
| Bottled, Tank, or LP Gas | 38 (1.4%) | 0 (0.0%) |
| Electricity | 434 (15.5%) | 163 (8.7%) |
| Fuel Oil or Kerosene | 0 (0.0%) | 0 (0.0%) |
| Coal or Coke | 0 (0.0%) | 0 (0.0%) |
| All other Fuels | 11 (0.4%) | 0 (0.0%) |
| No Fuel Used | 2,309 (82.7%) | 1,701 (91.3%) |
| Total | 2,792 (100.0%) | 1,864 (100.0%) |
Household Vehicle Usage in Manati
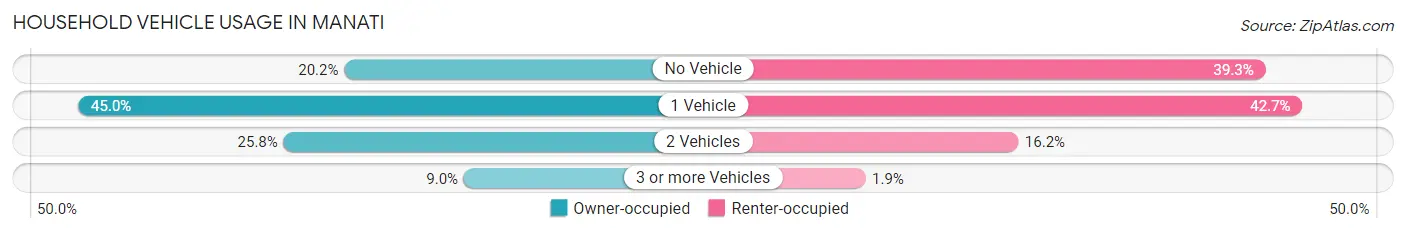
| Vehicles per Household | Owner-occupied | Renter-occupied |
| No Vehicle | 563 (20.2%) | 732 (39.3%) |
| 1 Vehicle | 1,257 (45.0%) | 796 (42.7%) |
| 2 Vehicles | 721 (25.8%) | 301 (16.2%) |
| 3 or more Vehicles | 251 (9.0%) | 35 (1.9%) |
| Total | 2,792 (100.0%) | 1,864 (100.0%) |
Real Estate & Mortgages in Manati
Real Estate and Mortgage Overview in Manati
| Characteristic | Without Mortgage | With Mortgage |
| Housing Units | 1,843 | 949 |
| Median Property Value | $106,800 | $122,700 |
| Median Household Income | $18,385 | $16 |
| Monthly Housing Costs | $146 | $0 |
| Real Estate Taxes | $390 | $905 |
Property Value by Mortgage Status in Manati
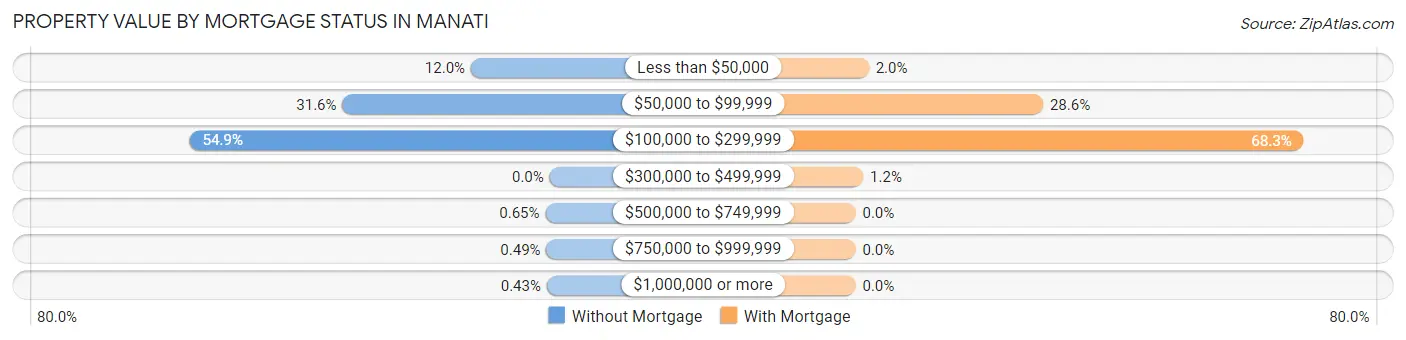
| Property Value | Without Mortgage | With Mortgage |
| Less than $50,000 | 221 (12.0%) | 19 (2.0%) |
| $50,000 to $99,999 | 582 (31.6%) | 271 (28.6%) |
| $100,000 to $299,999 | 1,011 (54.9%) | 648 (68.3%) |
| $300,000 to $499,999 | 0 (0.0%) | 11 (1.2%) |
| $500,000 to $749,999 | 12 (0.6%) | 0 (0.0%) |
| $750,000 to $999,999 | 9 (0.5%) | 0 (0.0%) |
| $1,000,000 or more | 8 (0.4%) | 0 (0.0%) |
| Total | 1,843 (100.0%) | 949 (100.0%) |
Household Income by Mortgage Status in Manati
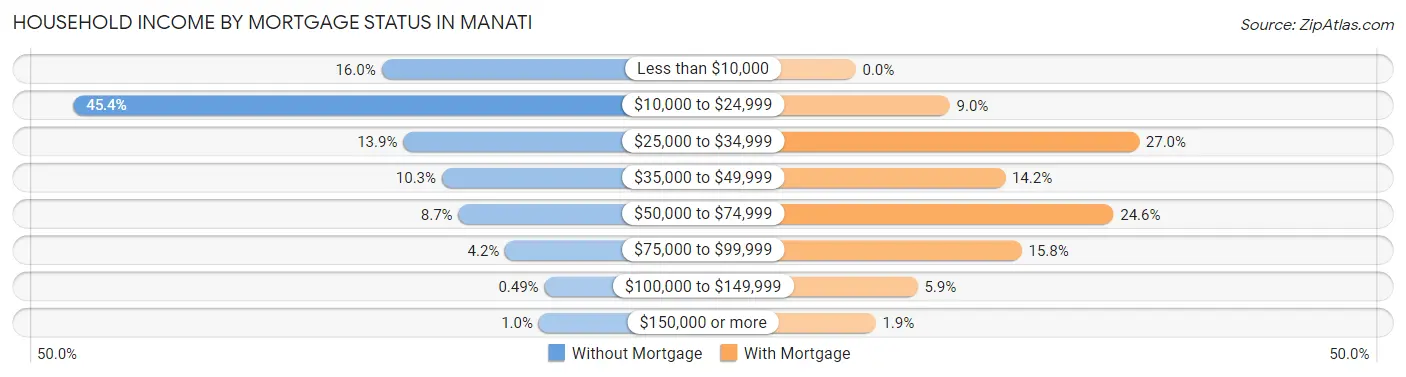
| Household Income | Without Mortgage | With Mortgage |
| Less than $10,000 | 295 (16.0%) | 0 (0.0%) |
| $10,000 to $24,999 | 836 (45.4%) | 85 (9.0%) |
| $25,000 to $34,999 | 257 (13.9%) | 256 (27.0%) |
| $35,000 to $49,999 | 189 (10.3%) | 135 (14.2%) |
| $50,000 to $74,999 | 160 (8.7%) | 233 (24.5%) |
| $75,000 to $99,999 | 78 (4.2%) | 150 (15.8%) |
| $100,000 to $149,999 | 9 (0.5%) | 56 (5.9%) |
| $150,000 or more | 19 (1.0%) | 18 (1.9%) |
| Total | 1,843 (100.0%) | 949 (100.0%) |
Property Value to Household Income Ratio in Manati
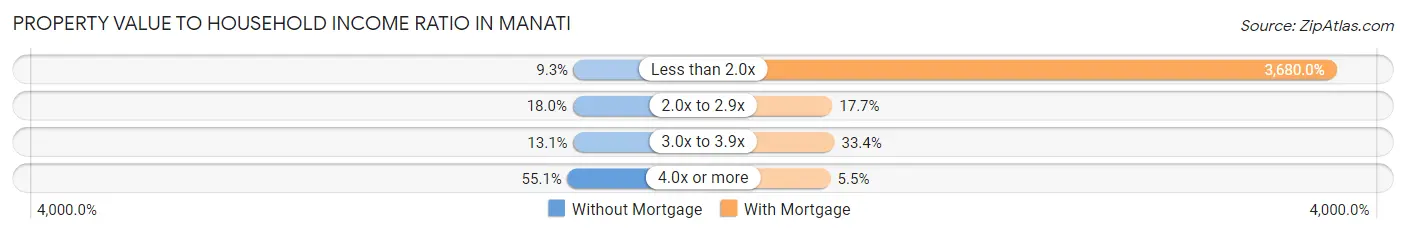
| Value-to-Income Ratio | Without Mortgage | With Mortgage |
| Less than 2.0x | 172 (9.3%) | 34,923 (3,680.0%) |
| 2.0x to 2.9x | 332 (18.0%) | 168 (17.7%) |
| 3.0x to 3.9x | 242 (13.1%) | 317 (33.4%) |
| 4.0x or more | 1,016 (55.1%) | 52 (5.5%) |
| Total | 1,843 (100.0%) | 949 (100.0%) |
Real Estate Taxes by Mortgage Status in Manati
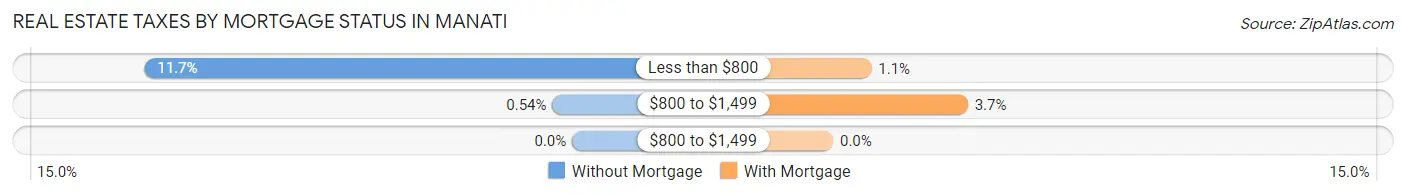
| Property Taxes | Without Mortgage | With Mortgage |
| Less than $800 | 216 (11.7%) | 10 (1.1%) |
| $800 to $1,499 | 10 (0.5%) | 35 (3.7%) |
| $800 to $1,499 | 0 (0.0%) | 0 (0.0%) |
| Total | 1,843 (100.0%) | 949 (100.0%) |
Health & Disability in Manati
Health Insurance Coverage by Age in Manati
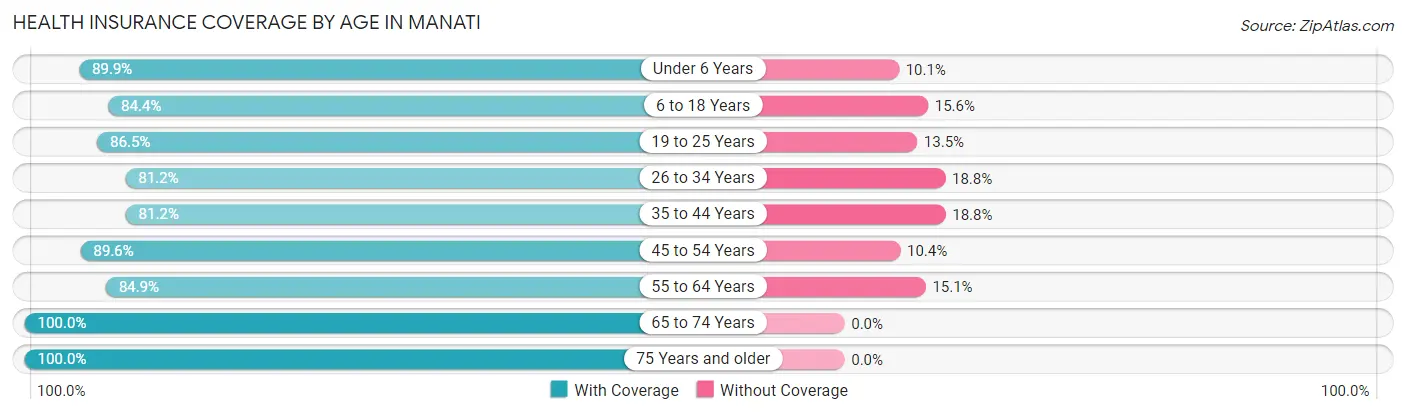
| Age Bracket | With Coverage | Without Coverage |
| Under 6 Years | 532 (89.9%) | 60 (10.1%) |
| 6 to 18 Years | 1,204 (84.4%) | 222 (15.6%) |
| 19 to 25 Years | 945 (86.5%) | 148 (13.5%) |
| 26 to 34 Years | 912 (81.2%) | 211 (18.8%) |
| 35 to 44 Years | 948 (81.2%) | 220 (18.8%) |
| 45 to 54 Years | 1,249 (89.6%) | 145 (10.4%) |
| 55 to 64 Years | 1,122 (84.9%) | 200 (15.1%) |
| 65 to 74 Years | 1,363 (100.0%) | 0 (0.0%) |
| 75 Years and older | 1,564 (100.0%) | 0 (0.0%) |
| Total | 9,839 (89.1%) | 1,206 (10.9%) |
Health Insurance Coverage by Citizenship Status in Manati
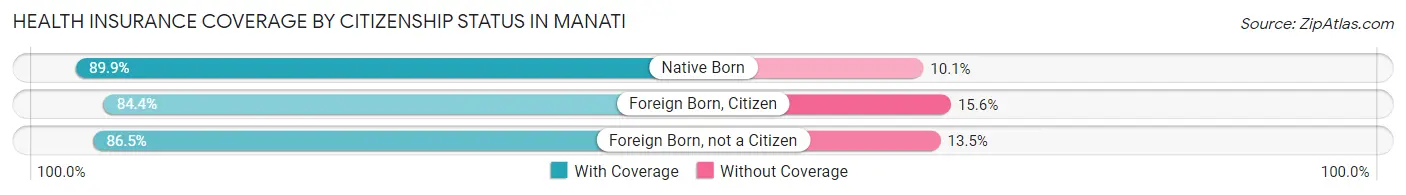
| Citizenship Status | With Coverage | Without Coverage |
| Native Born | 532 (89.9%) | 60 (10.1%) |
| Foreign Born, Citizen | 1,204 (84.4%) | 222 (15.6%) |
| Foreign Born, not a Citizen | 945 (86.5%) | 148 (13.5%) |
Health Insurance Coverage by Household Income in Manati
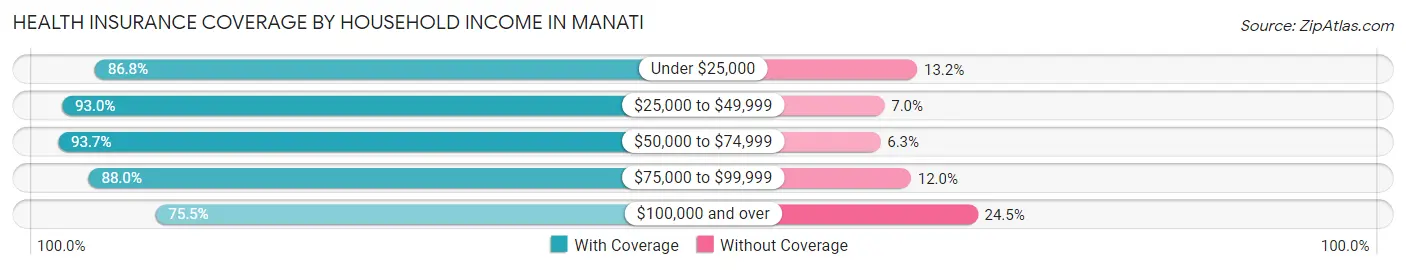
| Household Income | With Coverage | Without Coverage |
| Under $25,000 | 5,459 (86.8%) | 827 (13.2%) |
| $25,000 to $49,999 | 2,741 (93.0%) | 207 (7.0%) |
| $50,000 to $74,999 | 1,002 (93.7%) | 67 (6.3%) |
| $75,000 to $99,999 | 499 (88.0%) | 68 (12.0%) |
| $100,000 and over | 114 (75.5%) | 37 (24.5%) |
Public vs Private Health Insurance Coverage by Age in Manati
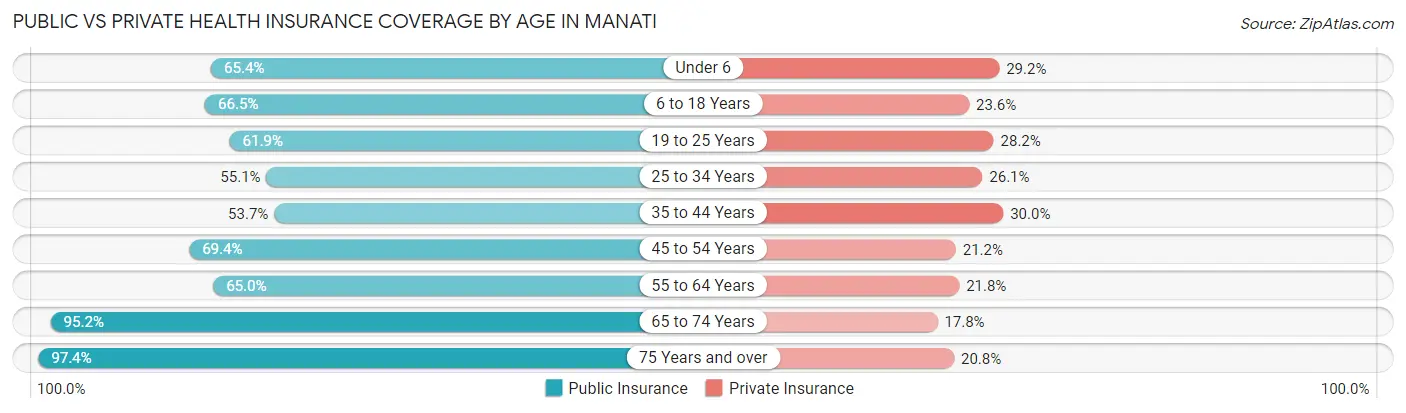
| Age Bracket | Public Insurance | Private Insurance |
| Under 6 | 387 (65.4%) | 173 (29.2%) |
| 6 to 18 Years | 948 (66.5%) | 337 (23.6%) |
| 19 to 25 Years | 677 (61.9%) | 308 (28.2%) |
| 25 to 34 Years | 619 (55.1%) | 293 (26.1%) |
| 35 to 44 Years | 627 (53.7%) | 350 (30.0%) |
| 45 to 54 Years | 968 (69.4%) | 295 (21.2%) |
| 55 to 64 Years | 859 (65.0%) | 288 (21.8%) |
| 65 to 74 Years | 1,297 (95.2%) | 242 (17.7%) |
| 75 Years and over | 1,524 (97.4%) | 326 (20.8%) |
| Total | 7,906 (71.6%) | 2,612 (23.6%) |
Disability Status by Sex by Age in Manati
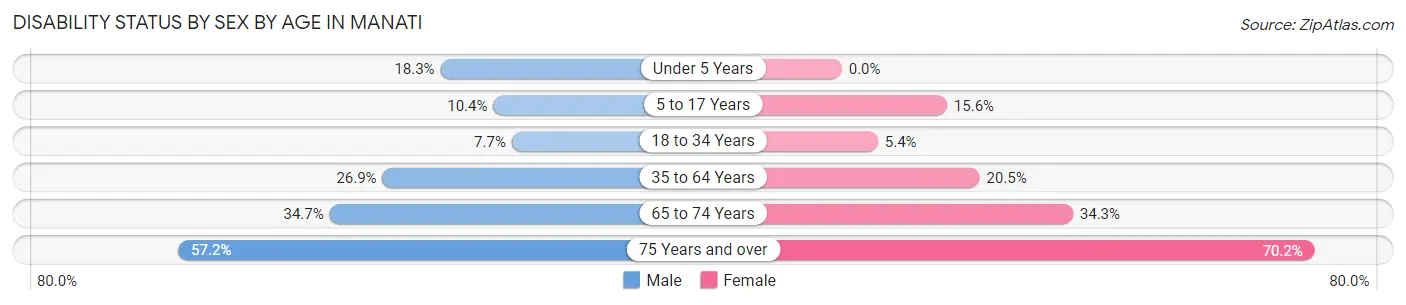
| Age Bracket | Male | Female |
| Under 5 Years | 25 (18.2%) | 0 (0.0%) |
| 5 to 17 Years | 86 (10.4%) | 89 (15.6%) |
| 18 to 34 Years | 84 (7.7%) | 68 (5.3%) |
| 35 to 64 Years | 477 (26.9%) | 431 (20.4%) |
| 65 to 74 Years | 200 (34.7%) | 270 (34.3%) |
| 75 Years and over | 278 (57.2%) | 757 (70.2%) |
Disability Class by Sex by Age in Manati
Disability Class: Hearing Difficulty
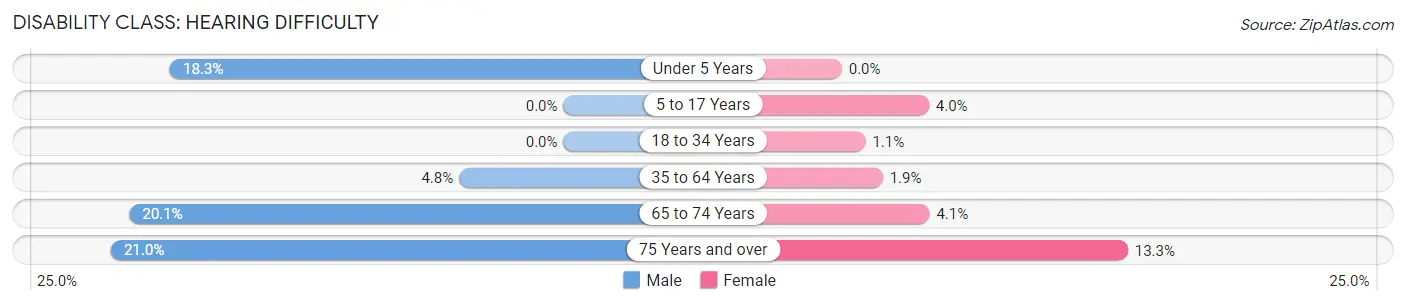
| Age Bracket | Male | Female |
| Under 5 Years | 25 (18.2%) | 0 (0.0%) |
| 5 to 17 Years | 0 (0.0%) | 23 (4.0%) |
| 18 to 34 Years | 0 (0.0%) | 14 (1.1%) |
| 35 to 64 Years | 86 (4.8%) | 40 (1.9%) |
| 65 to 74 Years | 116 (20.1%) | 32 (4.1%) |
| 75 Years and over | 102 (21.0%) | 143 (13.3%) |
Disability Class: Vision Difficulty
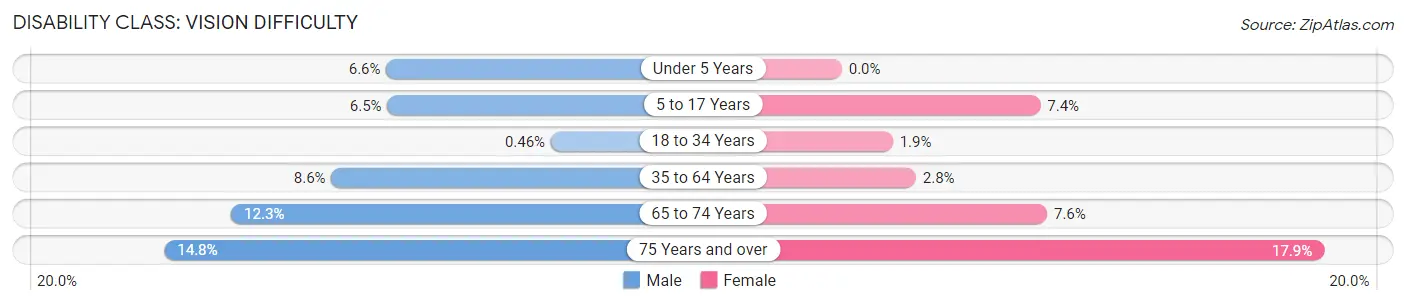
| Age Bracket | Male | Female |
| Under 5 Years | 9 (6.6%) | 0 (0.0%) |
| 5 to 17 Years | 54 (6.5%) | 42 (7.4%) |
| 18 to 34 Years | 5 (0.5%) | 24 (1.9%) |
| 35 to 64 Years | 153 (8.6%) | 58 (2.8%) |
| 65 to 74 Years | 71 (12.3%) | 60 (7.6%) |
| 75 Years and over | 72 (14.8%) | 193 (17.9%) |
Disability Class: Cognitive Difficulty
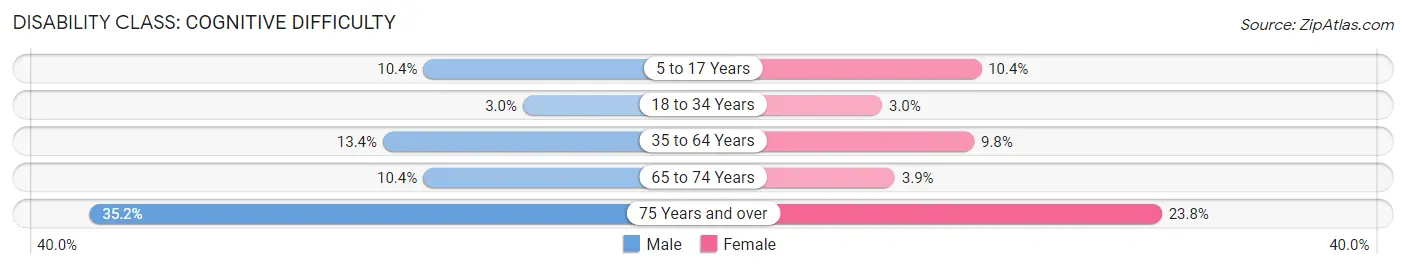
| Age Bracket | Male | Female |
| 5 to 17 Years | 86 (10.4%) | 59 (10.3%) |
| 18 to 34 Years | 33 (3.0%) | 38 (3.0%) |
| 35 to 64 Years | 238 (13.4%) | 207 (9.8%) |
| 65 to 74 Years | 60 (10.4%) | 31 (3.9%) |
| 75 Years and over | 171 (35.2%) | 256 (23.7%) |
Disability Class: Ambulatory Difficulty
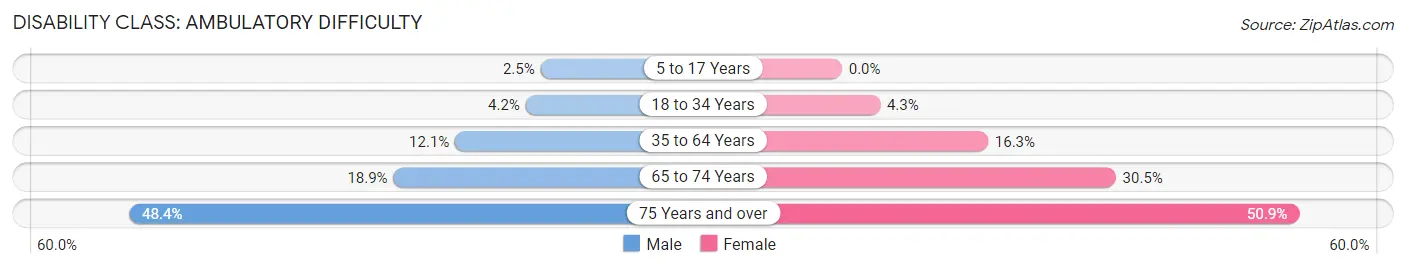
| Age Bracket | Male | Female |
| 5 to 17 Years | 21 (2.5%) | 0 (0.0%) |
| 18 to 34 Years | 46 (4.2%) | 54 (4.3%) |
| 35 to 64 Years | 214 (12.0%) | 343 (16.3%) |
| 65 to 74 Years | 109 (18.9%) | 240 (30.5%) |
| 75 Years and over | 235 (48.3%) | 549 (50.9%) |
Disability Class: Self-Care Difficulty
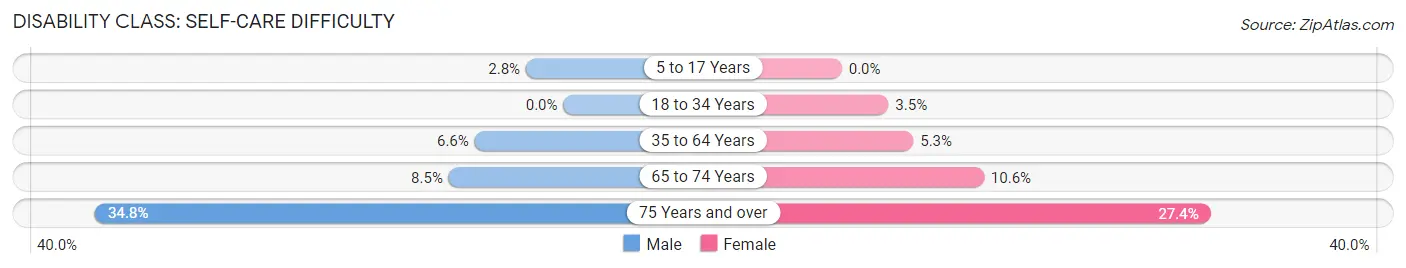
| Age Bracket | Male | Female |
| 5 to 17 Years | 23 (2.8%) | 0 (0.0%) |
| 18 to 34 Years | 0 (0.0%) | 44 (3.5%) |
| 35 to 64 Years | 117 (6.6%) | 112 (5.3%) |
| 65 to 74 Years | 49 (8.5%) | 83 (10.5%) |
| 75 Years and over | 169 (34.8%) | 295 (27.4%) |
Technology Access in Manati
Computing Device Access in Manati
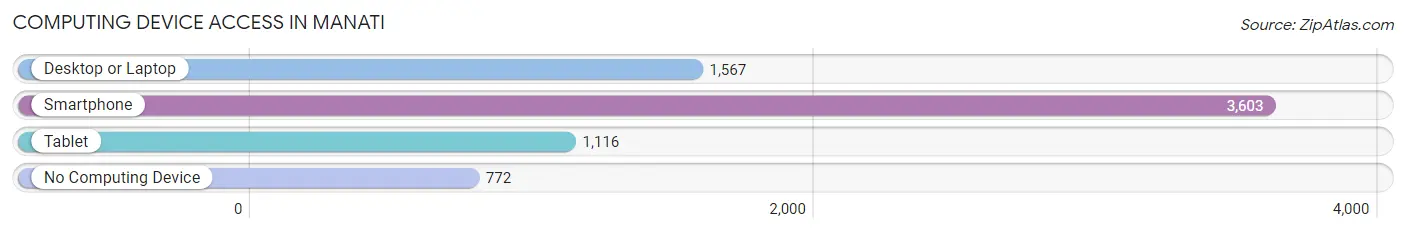
| Device Type | # Households | % Households |
| Desktop or Laptop | 1,567 | 33.7% |
| Smartphone | 3,603 | 77.4% |
| Tablet | 1,116 | 24.0% |
| No Computing Device | 772 | 16.6% |
| Total | 4,656 | 100.0% |
Internet Access in Manati
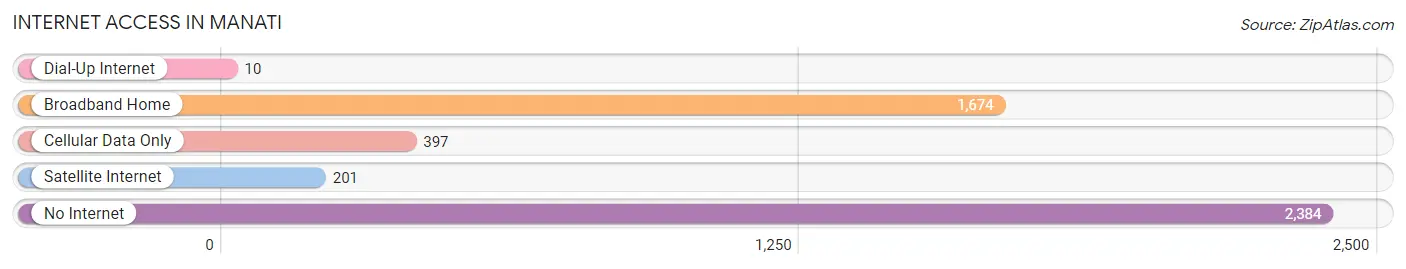
| Internet Type | # Households | % Households |
| Dial-Up Internet | 10 | 0.2% |
| Broadband Home | 1,674 | 35.9% |
| Cellular Data Only | 397 | 8.5% |
| Satellite Internet | 201 | 4.3% |
| No Internet | 2,384 | 51.2% |
| Total | 4,656 | 100.0% |
Manati Summary
Manati is a municipality located in the northern coast of Puerto Rico, in the northern part of the island. It is part of the San Juan-Caguas-Guaynabo Metropolitan Statistical Area. As of the 2010 census, the population of Manati was 40,039.
History
The area of Manati was originally inhabited by the Taíno Indians. The first European settlers arrived in the area in the 16th century. The town was founded in 1738 by Don Francisco de los Olivos. The town was named after the Taíno chief Manatí.
In the 19th century, Manati was an important agricultural center, producing coffee, sugar cane, tobacco, and other crops. The town was also known for its pottery and ceramics.
Geography
Manati is located in the northern coast of Puerto Rico, in the northern part of the island. It is bordered by the municipalities of Vega Baja to the west, Barceloneta to the east, and Arecibo to the south. The town is located on the northern coast of the island, about 20 miles (32 km) west of San Juan.
The terrain of Manati is mostly flat, with some hills in the western part of the municipality. The highest point in the municipality is Cerro de Manati, which is located in the western part of the municipality and has an elevation of 1,067 feet (325 meters).
Climate
Manati has a tropical climate, with temperatures ranging from an average low of 73°F (23°C) in the winter to an average high of 89°F (32°C) in the summer. The average annual precipitation is about 50 inches (127 cm).
Economy
Manati's economy is mainly based on agriculture and manufacturing. The main agricultural products are sugar cane, coffee, and tobacco. The main industries in the municipality are food processing, electronics, and textiles.
Demographics
As of the 2010 census, the population of Manati was 40,039. The population is mostly of mixed European and African descent. The majority of the population (90%) is Roman Catholic.
Manati is also home to a large number of immigrants from the Dominican Republic, making up about 10% of the population. The town also has a small but growing population of immigrants from other countries, including the United States, Colombia, and Venezuela.
Common Questions
What is Per Capita Income in Manati?
Per Capita income in Manati is $10,984.
What is the Median Family Income in Manati?
Median Family Income in Manati is $20,948.
What is the Median Household income in Manati?
Median Household Income in Manati is $16,599.
What is Income or Wage Gap in Manati?
Income or Wage Gap in Manati is 7.1%.
Women in Manati earn 92.9 cents for every dollar earned by a man.
What is Family Income Deficit in Manati?
Family Income Deficit in Manati is $12,668.
Families that are below poverty line in Manati earn $12,668 less on average than the poverty threshold level.
What is Inequality or Gini Index in Manati?
Inequality or Gini Index in Manati is 0.52.
What is the Total Population of Manati?
Total Population of Manati is 11,134.
What is the Total Male Population of Manati?
Total Male Population of Manati is 4,932.
What is the Total Female Population of Manati?
Total Female Population of Manati is 6,202.
What is the Ratio of Males per 100 Females in Manati?
There are 79.52 Males per 100 Females in Manati.
What is the Ratio of Females per 100 Males in Manati?
There are 125.75 Females per 100 Males in Manati.
What is the Median Population Age in Manati?
Median Population Age in Manati is 46.0 Years.
What is the Average Family Size in Manati
Average Family Size in Manati is 3.3 People.
What is the Average Household Size in Manati
Average Household Size in Manati is 2.4 People.
How Large is the Labor Force in Manati?
There are 3,513 People in the Labor Forcein in Manati.
What is the Percentage of People in the Labor Force in Manati?
36.9% of People are in the Labor Force in Manati.
What is the Unemployment Rate in Manati?
Unemployment Rate in Manati is 21.6%.