Brevard, NC Map & Demographics
Brevard Map
Brevard Overview
$32,711
PER CAPITA INCOME
$77,232
AVG FAMILY INCOME
$42,843
AVG HOUSEHOLD INCOME
11.0%
WAGE / INCOME GAP [ % ]
89.0¢/ $1
WAGE / INCOME GAP [ $ ]
$13,729
FAMILY INCOME DEFICIT
0.49
INEQUALITY / GINI INDEX
7,777
TOTAL POPULATION
3,467
MALE POPULATION
4,310
FEMALE POPULATION
80.44
MALES / 100 FEMALES
124.31
FEMALES / 100 MALES
49.7
MEDIAN AGE
2.5
AVG FAMILY SIZE
1.9
AVG HOUSEHOLD SIZE
3,478
LABOR FORCE [ PEOPLE ]
50.0%
PERCENT IN LABOR FORCE
5.6%
UNEMPLOYMENT RATE
Brevard Zip Codes
Brevard Area Codes
Income in Brevard
Income Overview in Brevard
Per Capita Income in Brevard is $32,711, while median incomes of families and households are $77,232 and $42,843 respectively.
| Characteristic | Number | Measure |
| Per Capita Income | 7,777 | $32,711 |
| Median Family Income | 1,850 | $77,232 |
| Mean Family Income | 1,850 | $93,802 |
| Median Household Income | 3,618 | $42,843 |
| Mean Household Income | 3,618 | $67,400 |
| Income Deficit | 1,850 | $13,729 |
| Wage / Income Gap (%) | 7,777 | 11.01% |
| Wage / Income Gap ($) | 7,777 | 88.99¢ per $1 |
| Gini / Inequality Index | 7,777 | 0.49 |
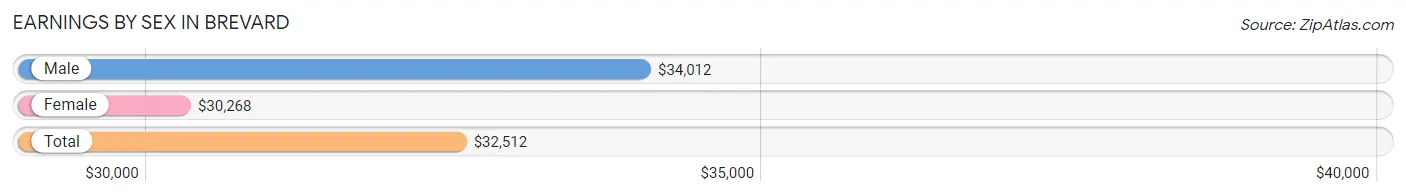
Earnings by Sex in Brevard
Average Earnings in Brevard are $32,512, $34,012 for men and $30,268 for women, a difference of 11.0%.
| Sex | Number | Average Earnings |
| Male | 1,785 (46.3%) | $34,012 |
| Female | 2,067 (53.7%) | $30,268 |
| Total | 3,852 (100.0%) | $32,512 |
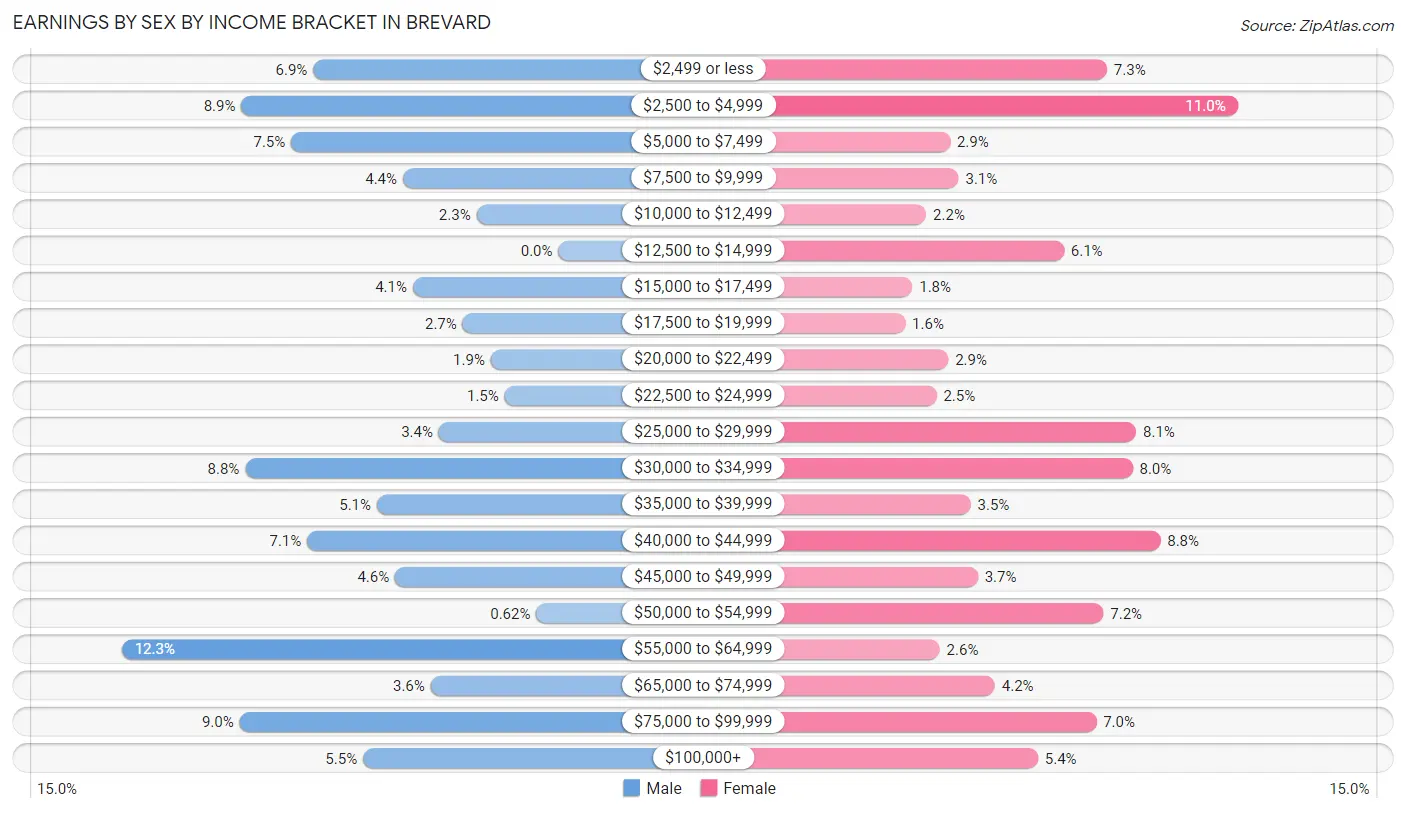
Earnings by Sex by Income Bracket in Brevard
The most common earnings brackets in Brevard are $55,000 to $64,999 for men (219 | 12.3%) and $2,500 to $4,999 for women (227 | 11.0%).
| Income | Male | Female |
| $2,499 or less | 123 (6.9%) | 151 (7.3%) |
| $2,500 to $4,999 | 159 (8.9%) | 227 (11.0%) |
| $5,000 to $7,499 | 134 (7.5%) | 60 (2.9%) |
| $7,500 to $9,999 | 78 (4.4%) | 65 (3.1%) |
| $10,000 to $12,499 | 41 (2.3%) | 46 (2.2%) |
| $12,500 to $14,999 | 0 (0.0%) | 126 (6.1%) |
| $15,000 to $17,499 | 73 (4.1%) | 38 (1.8%) |
| $17,500 to $19,999 | 48 (2.7%) | 34 (1.6%) |
| $20,000 to $22,499 | 34 (1.9%) | 59 (2.9%) |
| $22,500 to $24,999 | 27 (1.5%) | 52 (2.5%) |
| $25,000 to $29,999 | 60 (3.4%) | 168 (8.1%) |
| $30,000 to $34,999 | 157 (8.8%) | 166 (8.0%) |
| $35,000 to $39,999 | 91 (5.1%) | 72 (3.5%) |
| $40,000 to $44,999 | 126 (7.1%) | 182 (8.8%) |
| $45,000 to $49,999 | 82 (4.6%) | 76 (3.7%) |
| $50,000 to $54,999 | 11 (0.6%) | 149 (7.2%) |
| $55,000 to $64,999 | 219 (12.3%) | 54 (2.6%) |
| $65,000 to $74,999 | 64 (3.6%) | 86 (4.2%) |
| $75,000 to $99,999 | 160 (9.0%) | 145 (7.0%) |
| $100,000+ | 98 (5.5%) | 111 (5.4%) |
| Total | 1,785 (100.0%) | 2,067 (100.0%) |
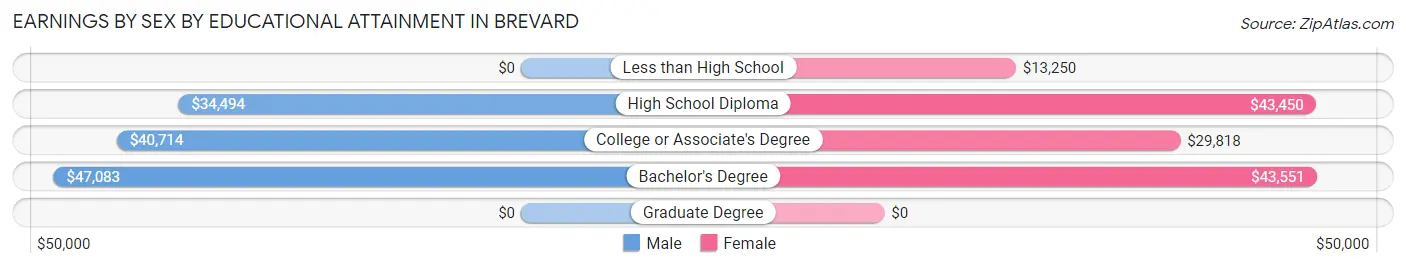
Earnings by Sex by Educational Attainment in Brevard
Average earnings in Brevard are $41,703 for men and $36,148 for women, a difference of 13.3%. Men with an educational attainment of bachelor's degree enjoy the highest average annual earnings of $47,083, while those with high school diploma education earn the least with $34,494. Women with an educational attainment of bachelor's degree earn the most with the average annual earnings of $43,551, while those with less than high school education have the smallest earnings of $13,250.
| Educational Attainment | Male Income | Female Income |
| Less than High School | - | - |
| High School Diploma | $34,494 | $43,450 |
| College or Associate's Degree | $40,714 | $29,818 |
| Bachelor's Degree | $47,083 | $43,551 |
| Graduate Degree | - | - |
| Total | $41,703 | $36,148 |
Family Income in Brevard
Family Income Brackets in Brevard
According to the Brevard family income data, there are 387 families falling into the $100,000 to $149,999 income range, which is the most common income bracket and makes up 20.9% of all families. Conversely, the $10,000 to $14,999 income bracket is the least frequent group with only 70 families (3.8%) belonging to this category.
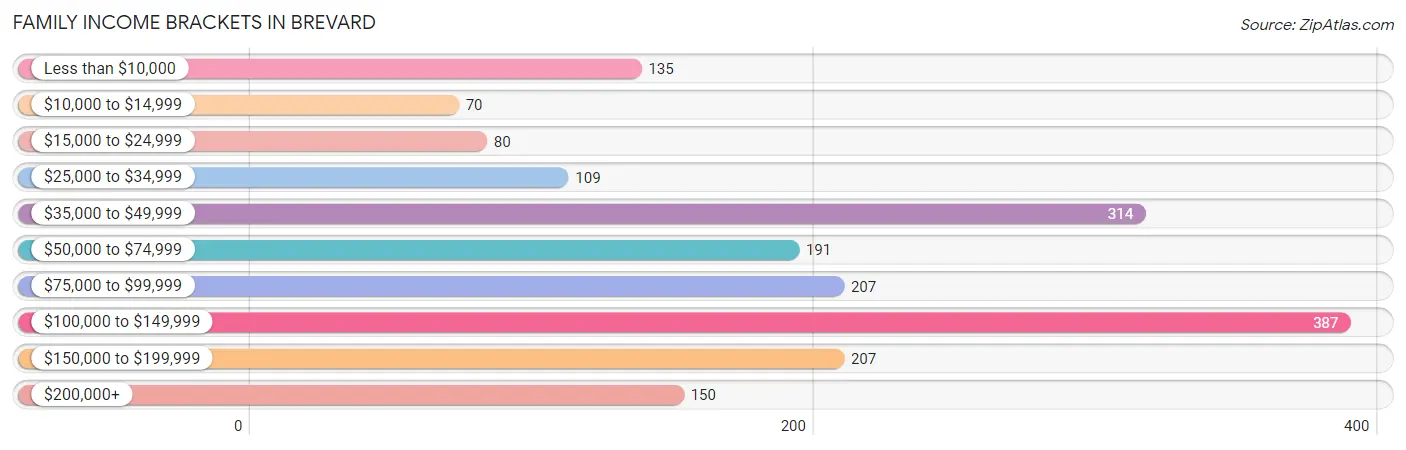
| Income Bracket | # Families | % Families |
| Less than $10,000 | 135 | 7.3% |
| $10,000 to $14,999 | 70 | 3.8% |
| $15,000 to $24,999 | 80 | 4.3% |
| $25,000 to $34,999 | 109 | 5.9% |
| $35,000 to $49,999 | 314 | 17.0% |
| $50,000 to $74,999 | 191 | 10.3% |
| $75,000 to $99,999 | 207 | 11.2% |
| $100,000 to $149,999 | 387 | 20.9% |
| $150,000 to $199,999 | 207 | 11.2% |
| $200,000+ | 150 | 8.1% |
Family Income by Famaliy Size in Brevard
4-person families (189 | 10.2%) account for the highest median family income in Brevard with $140,820 per family, while 2-person families (1,229 | 66.4%) have the highest median income of $36,051 per family member.
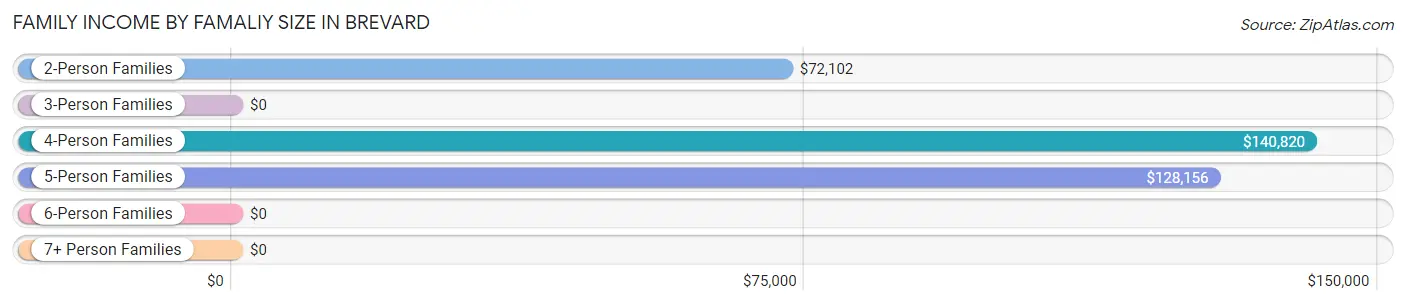
| Income Bracket | # Families | Median Income |
| 2-Person Families | 1,229 (66.4%) | $72,102 |
| 3-Person Families | 338 (18.3%) | $0 |
| 4-Person Families | 189 (10.2%) | $140,820 |
| 5-Person Families | 87 (4.7%) | $128,156 |
| 6-Person Families | 0 (0.0%) | $0 |
| 7+ Person Families | 7 (0.4%) | $0 |
| Total | 1,850 (100.0%) | $77,232 |
Family Income by Number of Earners in Brevard
The median family income in Brevard is $77,232, with families comprising 3+ earners (149) having the highest median family income of $250,001, while families with 1 earner (604) have the lowest median family income of $42,541, accounting for 8.1% and 32.7% of families, respectively.
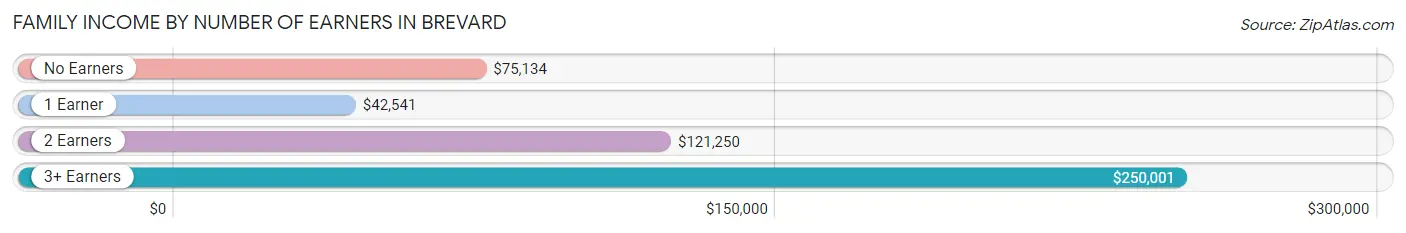
| Number of Earners | # Families | Median Income |
| No Earners | 445 (24.0%) | $75,134 |
| 1 Earner | 604 (32.7%) | $42,541 |
| 2 Earners | 652 (35.2%) | $121,250 |
| 3+ Earners | 149 (8.1%) | $250,001 |
| Total | 1,850 (100.0%) | $77,232 |
Household Income in Brevard
Household Income Brackets in Brevard
With 528 households falling in the category, the $25,000 to $34,999 income range is the most frequent in Brevard, accounting for 14.6% of all households. In contrast, only 163 households (4.5%) fall into the $200,000+ income bracket, making it the least populous group.
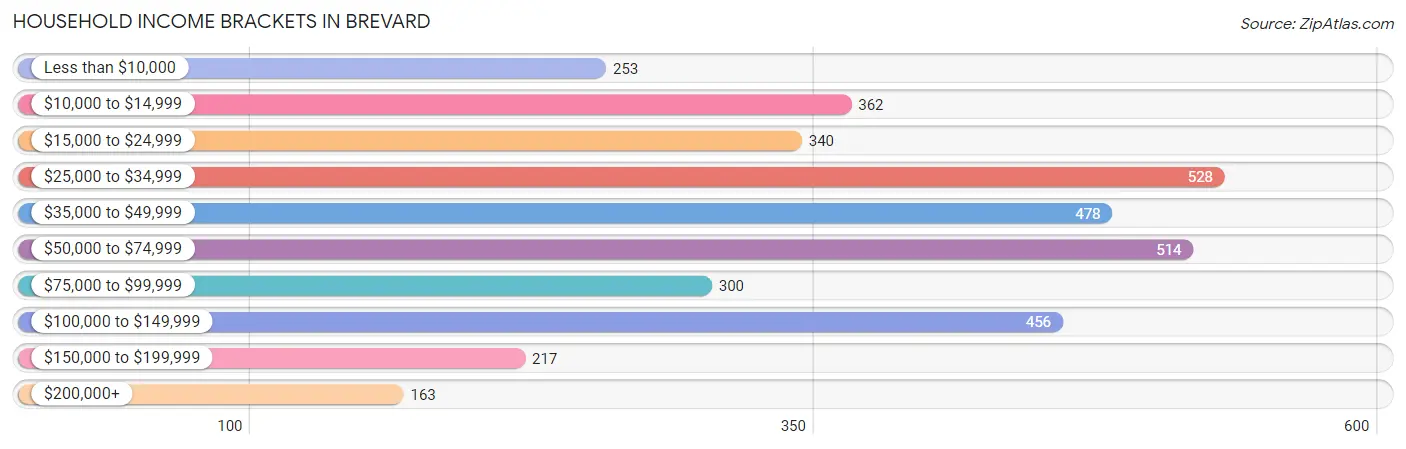
| Income Bracket | # Households | % Households |
| Less than $10,000 | 253 | 7.0% |
| $10,000 to $14,999 | 362 | 10.0% |
| $15,000 to $24,999 | 340 | 9.4% |
| $25,000 to $34,999 | 528 | 14.6% |
| $35,000 to $49,999 | 478 | 13.2% |
| $50,000 to $74,999 | 514 | 14.2% |
| $75,000 to $99,999 | 300 | 8.3% |
| $100,000 to $149,999 | 456 | 12.6% |
| $150,000 to $199,999 | 217 | 6.0% |
| $200,000+ | 163 | 4.5% |
Household Income by Householder Age in Brevard
The median household income in Brevard is $42,843, with the highest median household income of $70,455 found in the 45 to 64 years age bracket for the primary householder. A total of 924 households (25.5%) fall into this category. Meanwhile, the 15 to 24 years age bracket for the primary householder has the lowest median household income of $0, with 74 households (2.1%) in this group.
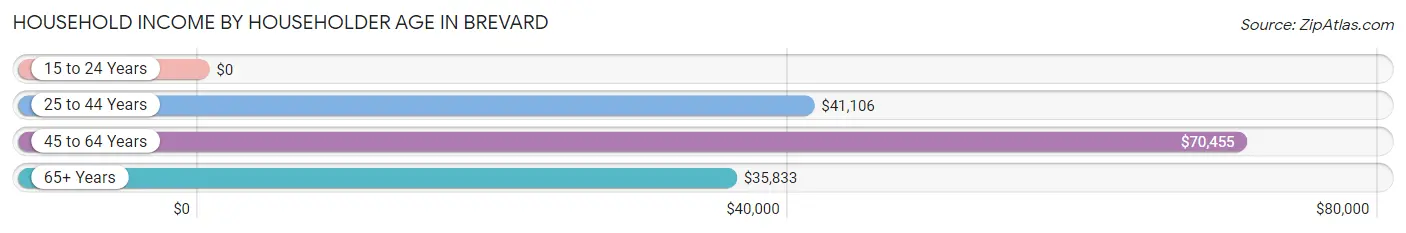
| Income Bracket | # Households | Median Income |
| 15 to 24 Years | 74 (2.1%) | $0 |
| 25 to 44 Years | 982 (27.1%) | $41,106 |
| 45 to 64 Years | 924 (25.5%) | $70,455 |
| 65+ Years | 1,638 (45.3%) | $35,833 |
| Total | 3,618 (100.0%) | $42,843 |
Poverty in Brevard
Income Below Poverty by Sex and Age in Brevard
With 18.6% poverty level for males and 13.2% for females among the residents of Brevard, 16 and 17 year old males and 15 year old females are the most vulnerable to poverty, with 35 males (100.0%) and 7 females (50.0%) in their respective age groups living below the poverty level.
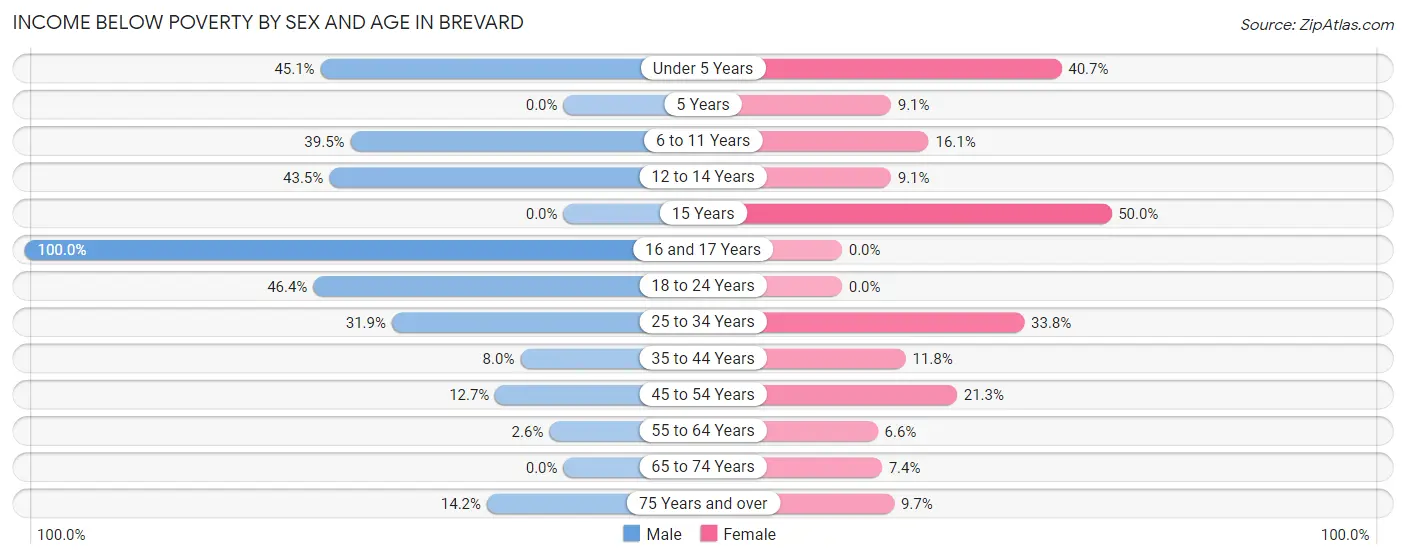
| Age Bracket | Male | Female |
| Under 5 Years | 101 (45.1%) | 22 (40.7%) |
| 5 Years | 0 (0.0%) | 5 (9.1%) |
| 6 to 11 Years | 51 (39.5%) | 19 (16.1%) |
| 12 to 14 Years | 10 (43.5%) | 5 (9.1%) |
| 15 Years | 0 (0.0%) | 7 (50.0%) |
| 16 and 17 Years | 35 (100.0%) | 0 (0.0%) |
| 18 to 24 Years | 104 (46.4%) | 0 (0.0%) |
| 25 to 34 Years | 122 (31.9%) | 156 (33.8%) |
| 35 to 44 Years | 14 (8.0%) | 44 (11.8%) |
| 45 to 54 Years | 62 (12.7%) | 102 (21.3%) |
| 55 to 64 Years | 8 (2.6%) | 42 (6.6%) |
| 65 to 74 Years | 0 (0.0%) | 48 (7.4%) |
| 75 Years and over | 47 (14.2%) | 67 (9.7%) |
| Total | 554 (18.6%) | 517 (13.2%) |
Income Above Poverty by Sex and Age in Brevard
According to the poverty statistics in Brevard, males aged 5 years and females aged 16 and 17 years are the age groups that are most secure financially, with 100.0% of males and 100.0% of females in these age groups living above the poverty line.
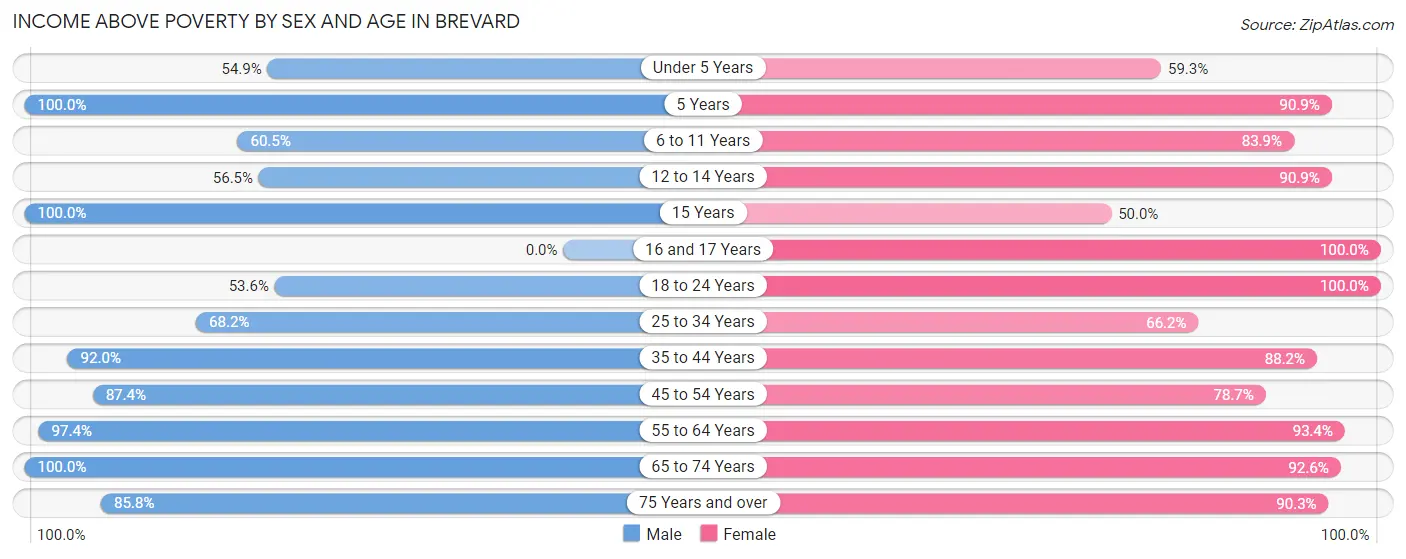
| Age Bracket | Male | Female |
| Under 5 Years | 123 (54.9%) | 32 (59.3%) |
| 5 Years | 31 (100.0%) | 50 (90.9%) |
| 6 to 11 Years | 78 (60.5%) | 99 (83.9%) |
| 12 to 14 Years | 13 (56.5%) | 50 (90.9%) |
| 15 Years | 101 (100.0%) | 7 (50.0%) |
| 16 and 17 Years | 0 (0.0%) | 172 (100.0%) |
| 18 to 24 Years | 120 (53.6%) | 176 (100.0%) |
| 25 to 34 Years | 261 (68.1%) | 305 (66.2%) |
| 35 to 44 Years | 161 (92.0%) | 328 (88.2%) |
| 45 to 54 Years | 428 (87.4%) | 376 (78.7%) |
| 55 to 64 Years | 297 (97.4%) | 591 (93.4%) |
| 65 to 74 Years | 530 (100.0%) | 600 (92.6%) |
| 75 Years and over | 284 (85.8%) | 625 (90.3%) |
| Total | 2,427 (81.4%) | 3,411 (86.8%) |
Income Below Poverty Among Married-Couple Families in Brevard
The poverty statistics for married-couple families in Brevard show that 6.0% or 78 of the total 1,307 families live below the poverty line. Families with 3 or 4 children have the highest poverty rate of 15.1%, comprising of 11 families. On the other hand, families with 1 or 2 children have the lowest poverty rate of 0.0%, which includes 0 families.
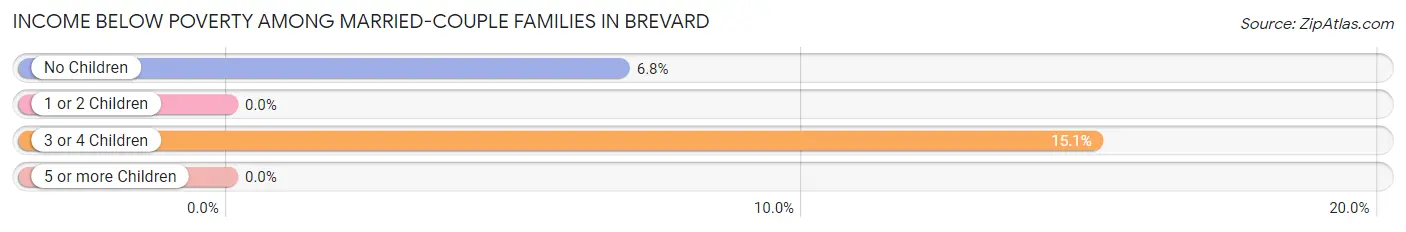
| Children | Above Poverty | Below Poverty |
| No Children | 915 (93.2%) | 67 (6.8%) |
| 1 or 2 Children | 252 (100.0%) | 0 (0.0%) |
| 3 or 4 Children | 62 (84.9%) | 11 (15.1%) |
| 5 or more Children | 0 (0.0%) | 0 (0.0%) |
| Total | 1,229 (94.0%) | 78 (6.0%) |
Income Below Poverty Among Single-Parent Households in Brevard
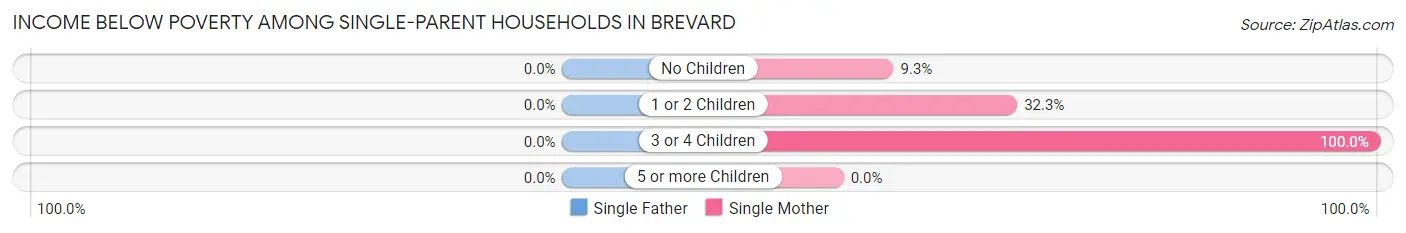
| Children | Single Father | Single Mother |
| No Children | 0 (0.0%) | 12 (9.3%) |
| 1 or 2 Children | 0 (0.0%) | 117 (32.3%) |
| 3 or 4 Children | 0 (0.0%) | 31 (100.0%) |
| 5 or more Children | 0 (0.0%) | 0 (0.0%) |
| Total | 0 (0.0%) | 160 (30.6%) |
Income Below Poverty Among Married-Couple vs Single-Parent Households in Brevard
The poverty data for Brevard shows that 78 of the married-couple family households (6.0%) and 160 of the single-parent households (29.5%) are living below the poverty level. Within the married-couple family households, those with 3 or 4 children have the highest poverty rate, with 11 households (15.1%) falling below the poverty line. Among the single-parent households, those with 3 or 4 children have the highest poverty rate, with 31 household (100.0%) living below poverty.
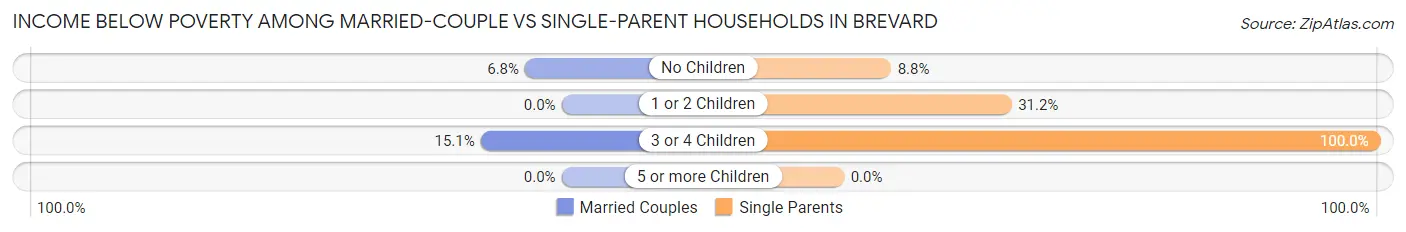
| Children | Married-Couple Families | Single-Parent Households |
| No Children | 67 (6.8%) | 12 (8.8%) |
| 1 or 2 Children | 0 (0.0%) | 117 (31.2%) |
| 3 or 4 Children | 11 (15.1%) | 31 (100.0%) |
| 5 or more Children | 0 (0.0%) | 0 (0.0%) |
| Total | 78 (6.0%) | 160 (29.5%) |
Race in Brevard
The most populous races in Brevard are White / Caucasian (6,353 | 81.7%), Black / African American (1,009 | 13.0%), and Two or more Races (358 | 4.6%).
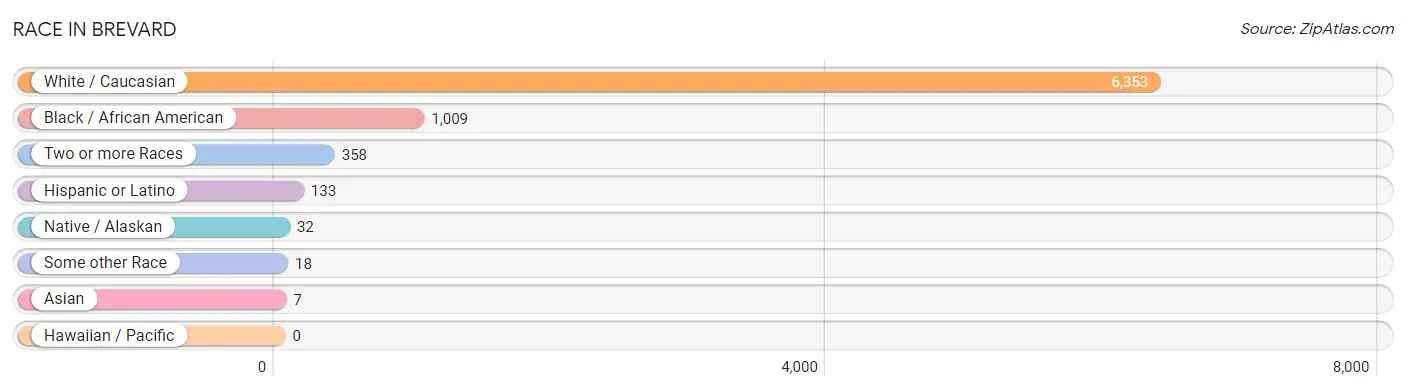
| Race | # Population | % Population |
| Asian | 7 | 0.1% |
| Black / African American | 1,009 | 13.0% |
| Hawaiian / Pacific | 0 | 0.0% |
| Hispanic or Latino | 133 | 1.7% |
| Native / Alaskan | 32 | 0.4% |
| White / Caucasian | 6,353 | 81.7% |
| Two or more Races | 358 | 4.6% |
| Some other Race | 18 | 0.2% |
| Total | 7,777 | 100.0% |
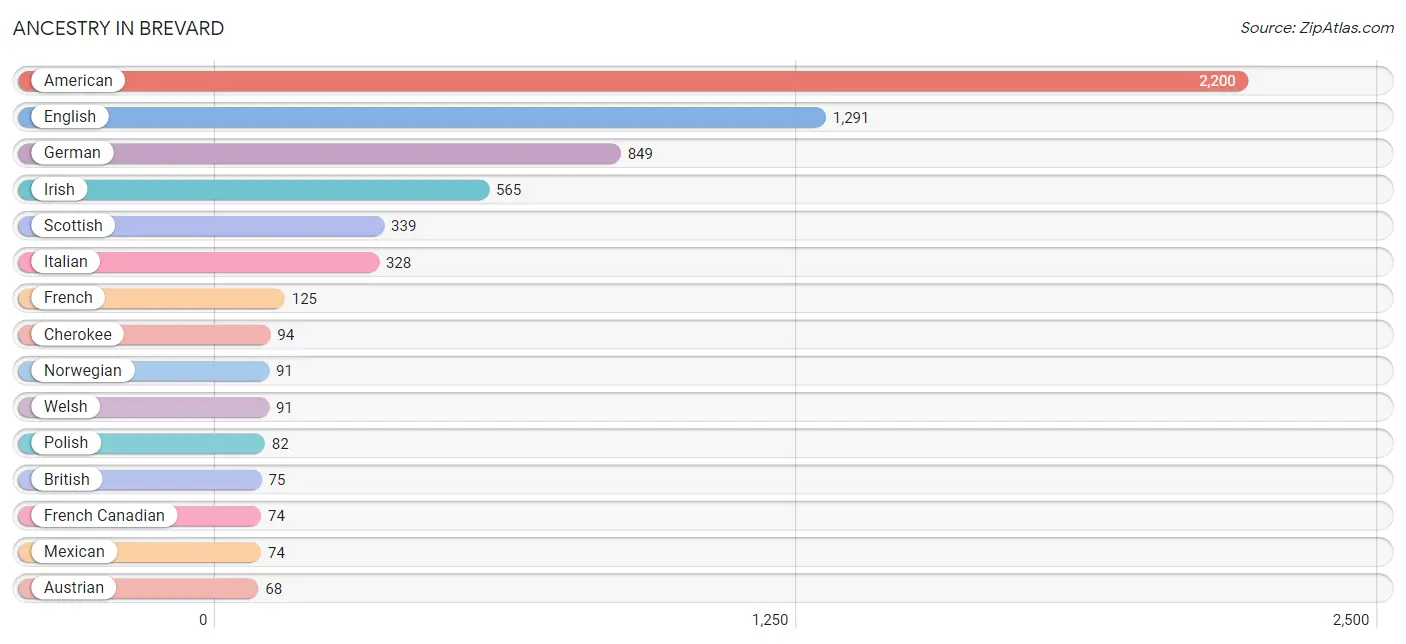
Ancestry in Brevard
The most populous ancestries reported in Brevard are American (2,200 | 28.3%), English (1,291 | 16.6%), German (849 | 10.9%), Irish (565 | 7.3%), and Scottish (339 | 4.4%), together accounting for 67.4% of all Brevard residents.
| Ancestry | # Population | % Population |
| African | 23 | 0.3% |
| American | 2,200 | 28.3% |
| Arab | 8 | 0.1% |
| Austrian | 68 | 0.9% |
| Blackfeet | 34 | 0.4% |
| British | 75 | 1.0% |
| Cherokee | 94 | 1.2% |
| Cuban | 38 | 0.5% |
| Danish | 22 | 0.3% |
| Dominican | 7 | 0.1% |
| Dutch | 48 | 0.6% |
| Eastern European | 11 | 0.1% |
| English | 1,291 | 16.6% |
| European | 20 | 0.3% |
| Finnish | 14 | 0.2% |
| French | 125 | 1.6% |
| French Canadian | 74 | 0.9% |
| German | 849 | 10.9% |
| Ghanaian | 4 | 0.1% |
| Greek | 17 | 0.2% |
| Haitian | 29 | 0.4% |
| Hungarian | 11 | 0.1% |
| Indian (Asian) | 31 | 0.4% |
| Irish | 565 | 7.3% |
| Italian | 328 | 4.2% |
| Lebanese | 4 | 0.1% |
| Lithuanian | 4 | 0.1% |
| Lumbee | 18 | 0.2% |
| Mexican | 74 | 0.9% |
| Moroccan | 4 | 0.1% |
| Navajo | 32 | 0.4% |
| Norwegian | 91 | 1.2% |
| Pennsylvania German | 19 | 0.2% |
| Polish | 82 | 1.1% |
| Puerto Rican | 14 | 0.2% |
| Scandinavian | 16 | 0.2% |
| Scotch-Irish | 65 | 0.8% |
| Scottish | 339 | 4.4% |
| Sioux | 7 | 0.1% |
| Subsaharan African | 46 | 0.6% |
| Swedish | 46 | 0.6% |
| Ukrainian | 2 | 0.0% |
| Welsh | 91 | 1.2% |
| West Indian | 46 | 0.6% | View All 44 Rows |
Immigrants in Brevard
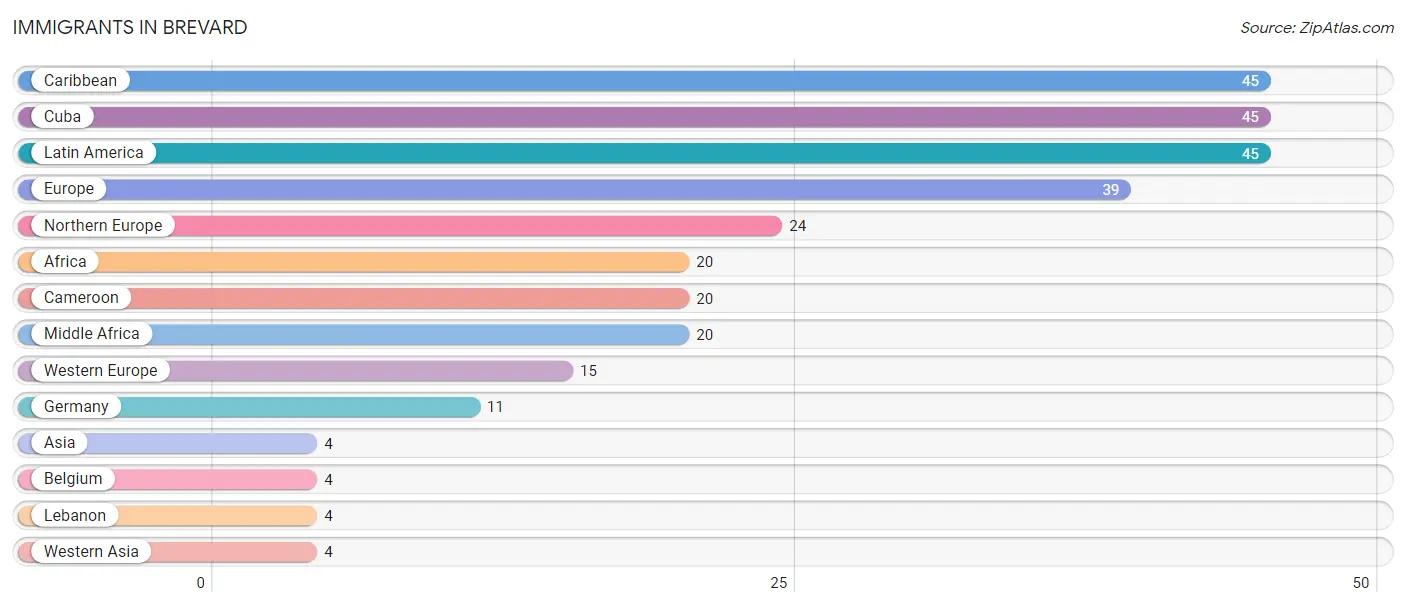
The most numerous immigrant groups reported in Brevard came from Caribbean (45 | 0.6%), Cuba (45 | 0.6%), Latin America (45 | 0.6%), Europe (39 | 0.5%), and Northern Europe (24 | 0.3%), together accounting for 2.5% of all Brevard residents.
| Immigration Origin | # Population | % Population |
| Africa | 20 | 0.3% |
| Asia | 4 | 0.1% |
| Belgium | 4 | 0.1% |
| Cameroon | 20 | 0.3% |
| Caribbean | 45 | 0.6% |
| Cuba | 45 | 0.6% |
| Europe | 39 | 0.5% |
| Germany | 11 | 0.1% |
| Latin America | 45 | 0.6% |
| Lebanon | 4 | 0.1% |
| Middle Africa | 20 | 0.3% |
| Northern Europe | 24 | 0.3% |
| Western Asia | 4 | 0.1% |
| Western Europe | 15 | 0.2% | View All 14 Rows |
Sex and Age in Brevard
Sex and Age in Brevard
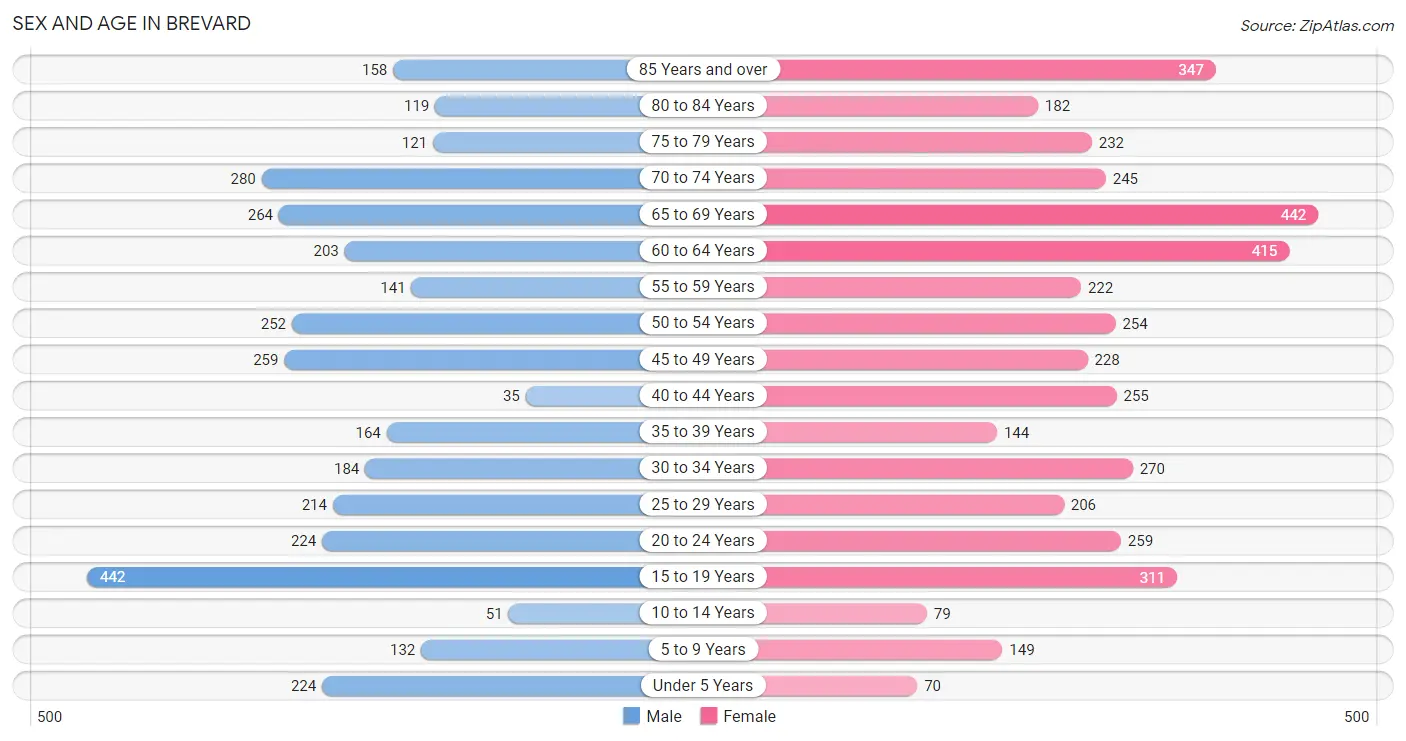
The most populous age groups in Brevard are 15 to 19 Years (442 | 12.8%) for men and 65 to 69 Years (442 | 10.3%) for women.
| Age Bracket | Male | Female |
| Under 5 Years | 224 (6.5%) | 70 (1.6%) |
| 5 to 9 Years | 132 (3.8%) | 149 (3.5%) |
| 10 to 14 Years | 51 (1.5%) | 79 (1.8%) |
| 15 to 19 Years | 442 (12.8%) | 311 (7.2%) |
| 20 to 24 Years | 224 (6.5%) | 259 (6.0%) |
| 25 to 29 Years | 214 (6.2%) | 206 (4.8%) |
| 30 to 34 Years | 184 (5.3%) | 270 (6.3%) |
| 35 to 39 Years | 164 (4.7%) | 144 (3.3%) |
| 40 to 44 Years | 35 (1.0%) | 255 (5.9%) |
| 45 to 49 Years | 259 (7.5%) | 228 (5.3%) |
| 50 to 54 Years | 252 (7.3%) | 254 (5.9%) |
| 55 to 59 Years | 141 (4.1%) | 222 (5.1%) |
| 60 to 64 Years | 203 (5.9%) | 415 (9.6%) |
| 65 to 69 Years | 264 (7.6%) | 442 (10.3%) |
| 70 to 74 Years | 280 (8.1%) | 245 (5.7%) |
| 75 to 79 Years | 121 (3.5%) | 232 (5.4%) |
| 80 to 84 Years | 119 (3.4%) | 182 (4.2%) |
| 85 Years and over | 158 (4.6%) | 347 (8.1%) |
| Total | 3,467 (100.0%) | 4,310 (100.0%) |
Families and Households in Brevard
Median Family Size in Brevard
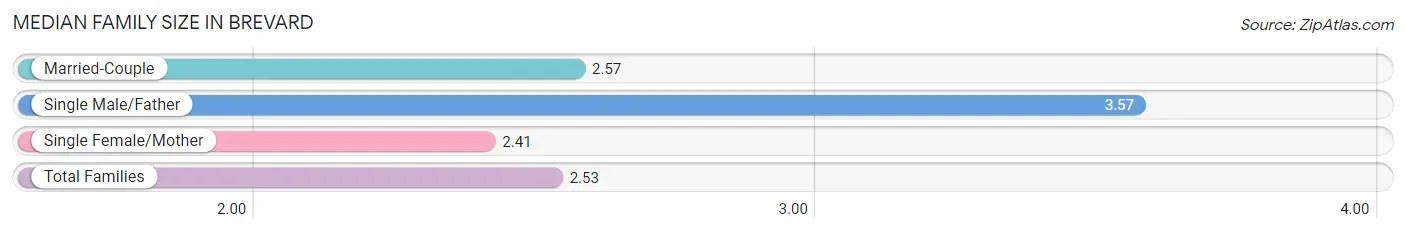
The median family size in Brevard is 2.53 persons per family, with single male/father families (21 | 1.1%) accounting for the largest median family size of 3.57 persons per family. On the other hand, single female/mother families (522 | 28.2%) represent the smallest median family size with 2.41 persons per family.
| Family Type | # Families | Family Size |
| Married-Couple | 1,307 (70.7%) | 2.57 |
| Single Male/Father | 21 (1.1%) | 3.57 |
| Single Female/Mother | 522 (28.2%) | 2.41 |
| Total Families | 1,850 (100.0%) | 2.53 |
Median Household Size in Brevard
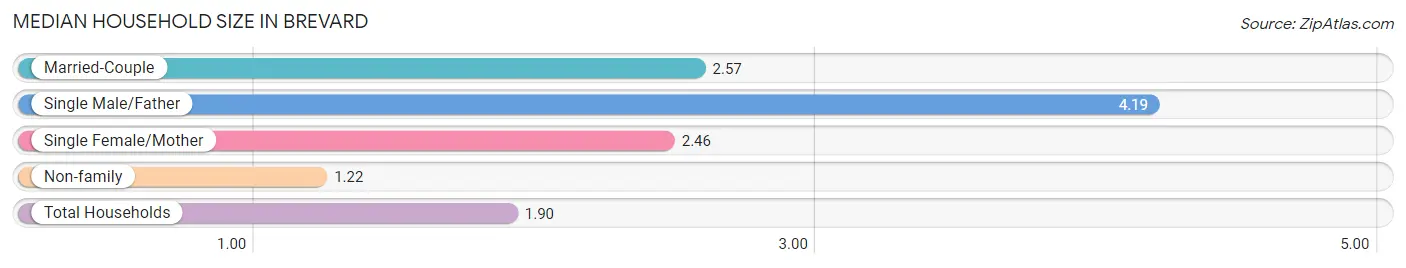
The median household size in Brevard is 1.90 persons per household, with single male/father households (21 | 0.6%) accounting for the largest median household size of 4.19 persons per household. non-family households (1,768 | 48.9%) represent the smallest median household size with 1.22 persons per household.
| Household Type | # Households | Household Size |
| Married-Couple | 1,307 (36.1%) | 2.57 |
| Single Male/Father | 21 (0.6%) | 4.19 |
| Single Female/Mother | 522 (14.4%) | 2.46 |
| Non-family | 1,768 (48.9%) | 1.22 |
| Total Households | 3,618 (100.0%) | 1.90 |
Household Size by Marriage Status in Brevard
Out of a total of 3,618 households in Brevard, 1,850 (51.1%) are family households, while 1,768 (48.9%) are nonfamily households. The most numerous type of family households are 2-person households, comprising 1,209, and the most common type of nonfamily households are 1-person households, comprising 1,477.
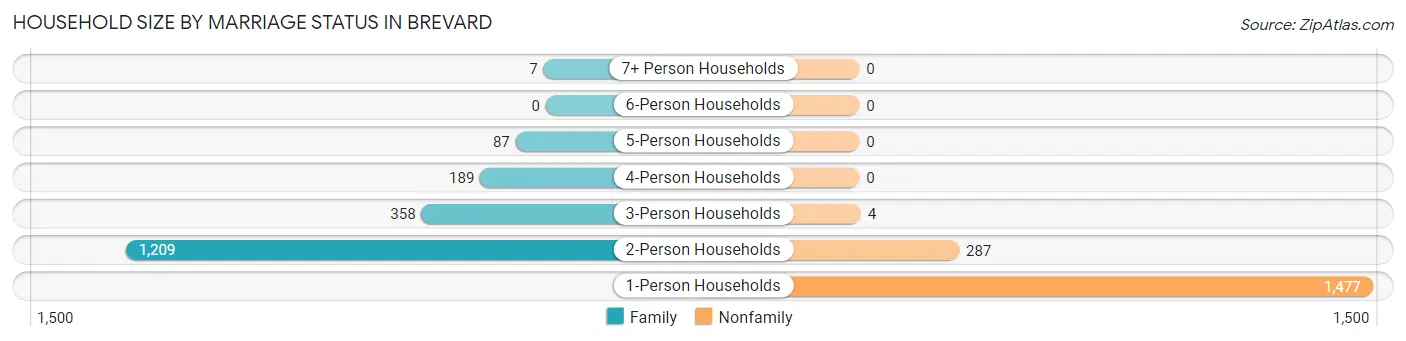
| Household Size | Family Households | Nonfamily Households |
| 1-Person Households | - | 1,477 (40.8%) |
| 2-Person Households | 1,209 (33.4%) | 287 (7.9%) |
| 3-Person Households | 358 (9.9%) | 4 (0.1%) |
| 4-Person Households | 189 (5.2%) | 0 (0.0%) |
| 5-Person Households | 87 (2.4%) | 0 (0.0%) |
| 6-Person Households | 0 (0.0%) | 0 (0.0%) |
| 7+ Person Households | 7 (0.2%) | 0 (0.0%) |
| Total | 1,850 (51.1%) | 1,768 (48.9%) |
Female Fertility in Brevard
Fertility by Age in Brevard
Average fertility rate in Brevard is 42.0 births per 1,000 women. Women in the age bracket of 20 to 34 years have the highest fertility rate with 97.0 births per 1,000 women. Women in the age bracket of 20 to 34 years acount for 100.0% of all women with births.
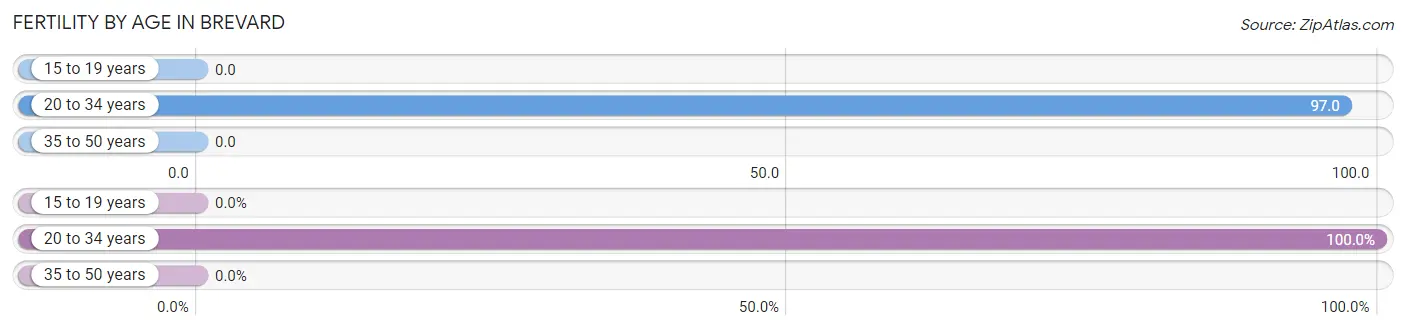
| Age Bracket | Women with Births | Births / 1,000 Women |
| 15 to 19 years | 0 (0.0%) | 0.0 |
| 20 to 34 years | 71 (100.0%) | 97.0 |
| 35 to 50 years | 0 (0.0%) | 0.0 |
| Total | 71 (100.0%) | 42.0 |
Fertility by Age by Marriage Status in Brevard
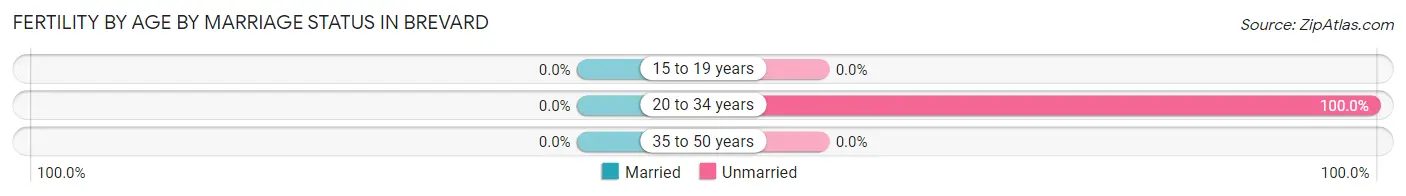
| Age Bracket | Married | Unmarried |
| 15 to 19 years | 0 (0.0%) | 0 (0.0%) |
| 20 to 34 years | 0 (0.0%) | 71 (100.0%) |
| 35 to 50 years | 0 (0.0%) | 0 (0.0%) |
| Total | 0 (0.0%) | 71 (100.0%) |
Fertility by Education in Brevard
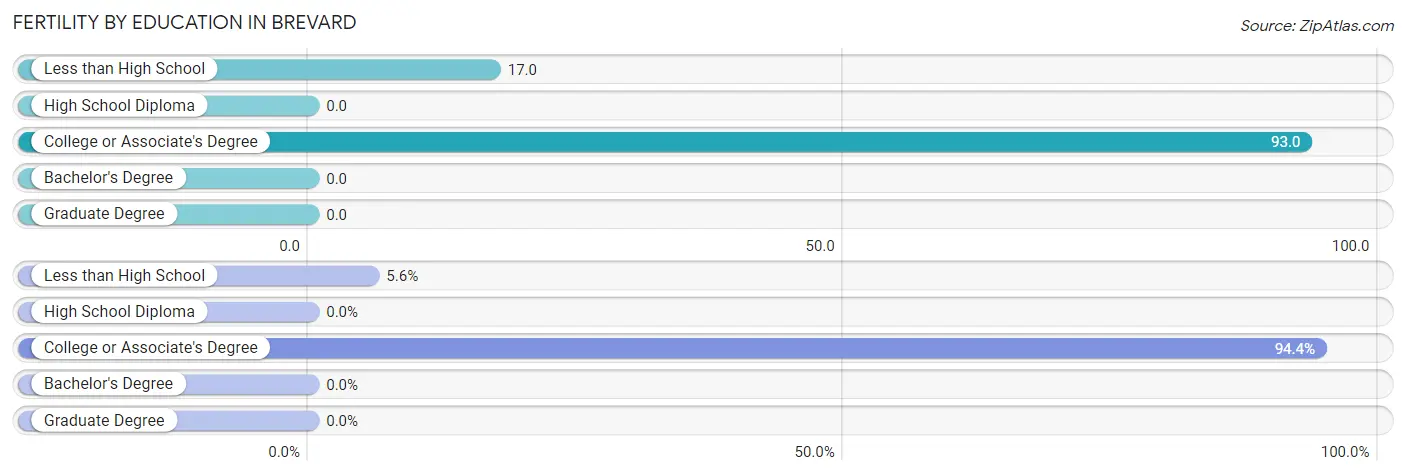
| Educational Attainment | Women with Births | Births / 1,000 Women |
| Less than High School | 4 (5.6%) | 17.0 |
| High School Diploma | 0 (0.0%) | 0.0 |
| College or Associate's Degree | 67 (94.4%) | 93.0 |
| Bachelor's Degree | 0 (0.0%) | 0.0 |
| Graduate Degree | 0 (0.0%) | 0.0 |
| Total | 71 (100.0%) | 42.0 |
Fertility by Education by Marriage Status in Brevard
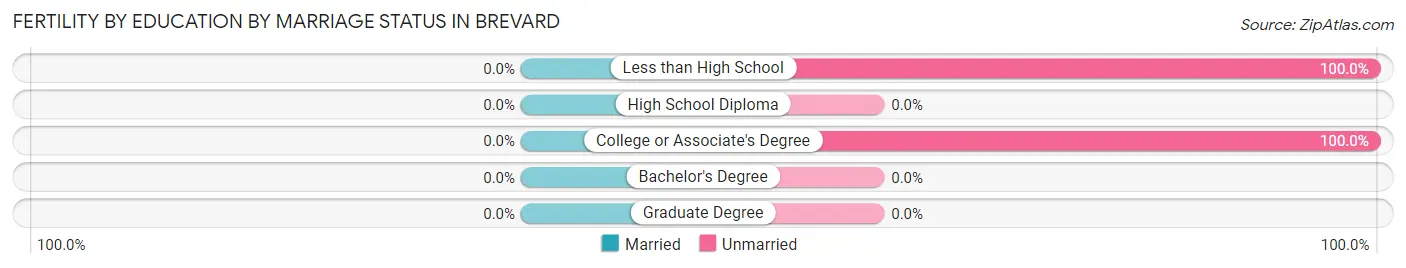
| Educational Attainment | Married | Unmarried |
| Less than High School | 0 (0.0%) | 4 (100.0%) |
| High School Diploma | 0 (0.0%) | 0 (0.0%) |
| College or Associate's Degree | 0 (0.0%) | 67 (100.0%) |
| Bachelor's Degree | 0 (0.0%) | 0 (0.0%) |
| Graduate Degree | 0 (0.0%) | 0 (0.0%) |
| Total | 0 (0.0%) | 71 (100.0%) |
Employment Characteristics in Brevard
Employment by Class of Employer in Brevard
Among the 3,139 employed individuals in Brevard, private company employees (1,911 | 60.9%), not-for-profit organizations (380 | 12.1%), and local government employees (274 | 8.7%) make up the most common classes of employment.
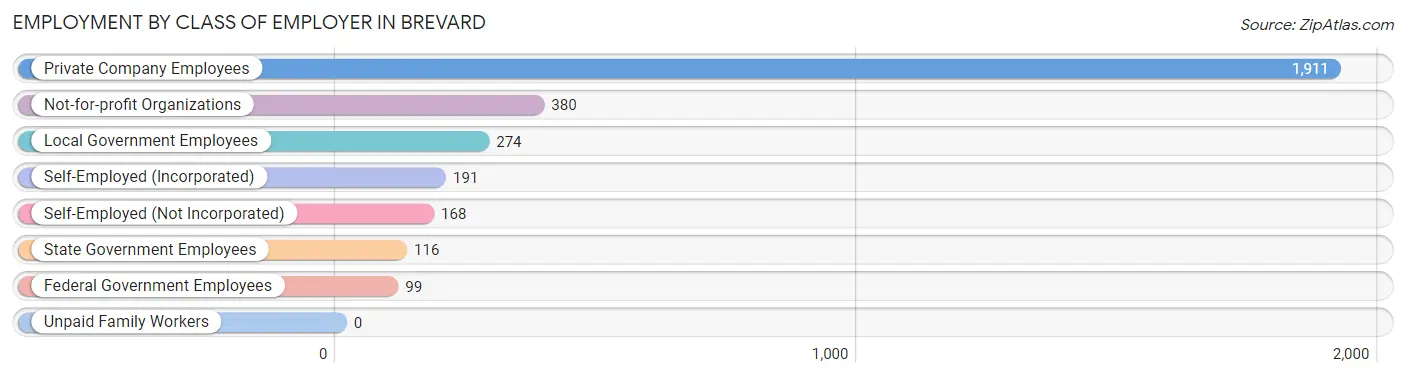
| Employer Class | # Employees | % Employees |
| Private Company Employees | 1,911 | 60.9% |
| Self-Employed (Incorporated) | 191 | 6.1% |
| Self-Employed (Not Incorporated) | 168 | 5.3% |
| Not-for-profit Organizations | 380 | 12.1% |
| Local Government Employees | 274 | 8.7% |
| State Government Employees | 116 | 3.7% |
| Federal Government Employees | 99 | 3.2% |
| Unpaid Family Workers | 0 | 0.0% |
| Total | 3,139 | 100.0% |
Employment Status by Age in Brevard
According to the labor force statistics for Brevard, out of the total population over 16 years of age (6,957), 50.0% or 3,478 individuals are in the labor force, with 5.6% or 195 of them unemployed. The age group with the highest labor force participation rate is 25 to 29 years, with 93.6% or 393 individuals in the labor force. Within the labor force, the 25 to 29 years age range has the highest percentage of unemployed individuals, with 24.9% or 98 of them being unemployed.
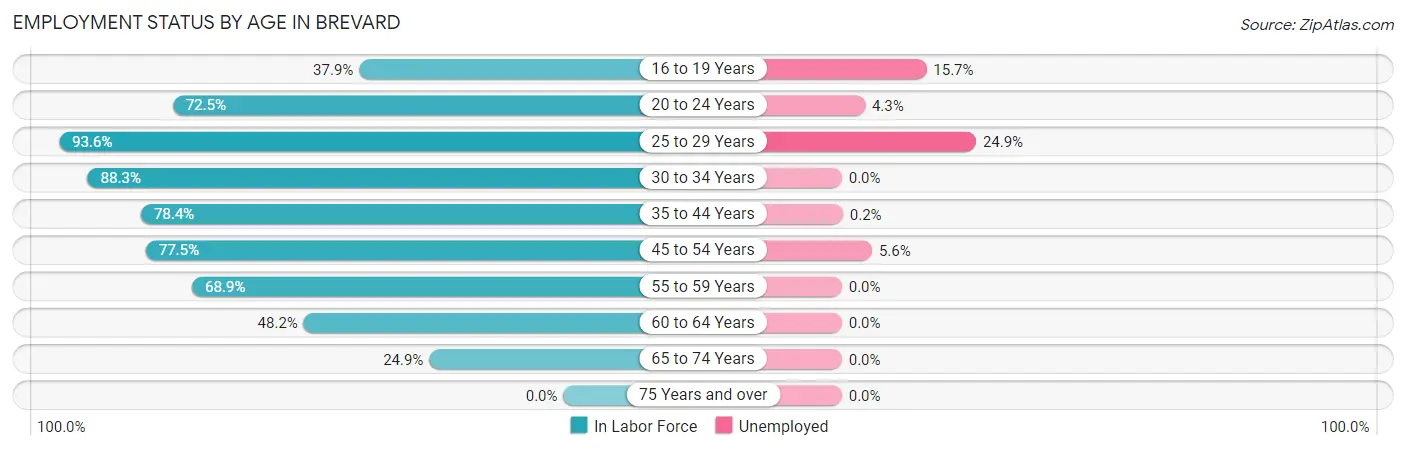
| Age Bracket | In Labor Force | Unemployed |
| 16 to 19 Years | 242 (37.9%) | 38 (15.7%) |
| 20 to 24 Years | 350 (72.5%) | 15 (4.3%) |
| 25 to 29 Years | 393 (93.6%) | 98 (24.9%) |
| 30 to 34 Years | 401 (88.3%) | 0 (0.0%) |
| 35 to 44 Years | 469 (78.4%) | 1 (0.2%) |
| 45 to 54 Years | 770 (77.5%) | 43 (5.6%) |
| 55 to 59 Years | 250 (68.9%) | 0 (0.0%) |
| 60 to 64 Years | 298 (48.2%) | 0 (0.0%) |
| 65 to 74 Years | 307 (24.9%) | 0 (0.0%) |
| 75 Years and over | 0 (0.0%) | 0 (0.0%) |
| Total | 3,478 (50.0%) | 195 (5.6%) |
Employment Status by Educational Attainment in Brevard
According to labor force statistics for Brevard, 74.9% of individuals (2,581) out of the total population between 25 and 64 years of age (3,446) are in the labor force, with 5.5% or 142 of them being unemployed. The group with the highest labor force participation rate are those with the educational attainment of bachelor's degree or higher, with 92.6% or 978 individuals in the labor force. Within the labor force, individuals with college / associate degree education have the highest percentage of unemployment, with 11.5% or 118 of them being unemployed.
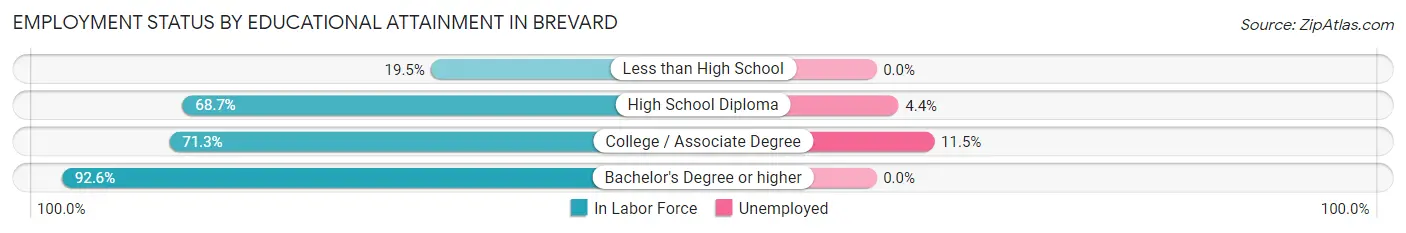
| Educational Attainment | In Labor Force | Unemployed |
| Less than High School | 30 (19.5%) | 0 (0.0%) |
| High School Diploma | 546 (68.7%) | 35 (4.4%) |
| College / Associate Degree | 1,027 (71.3%) | 166 (11.5%) |
| Bachelor's Degree or higher | 978 (92.6%) | 0 (0.0%) |
| Total | 2,581 (74.9%) | 190 (5.5%) |
Employment Occupations by Sex in Brevard
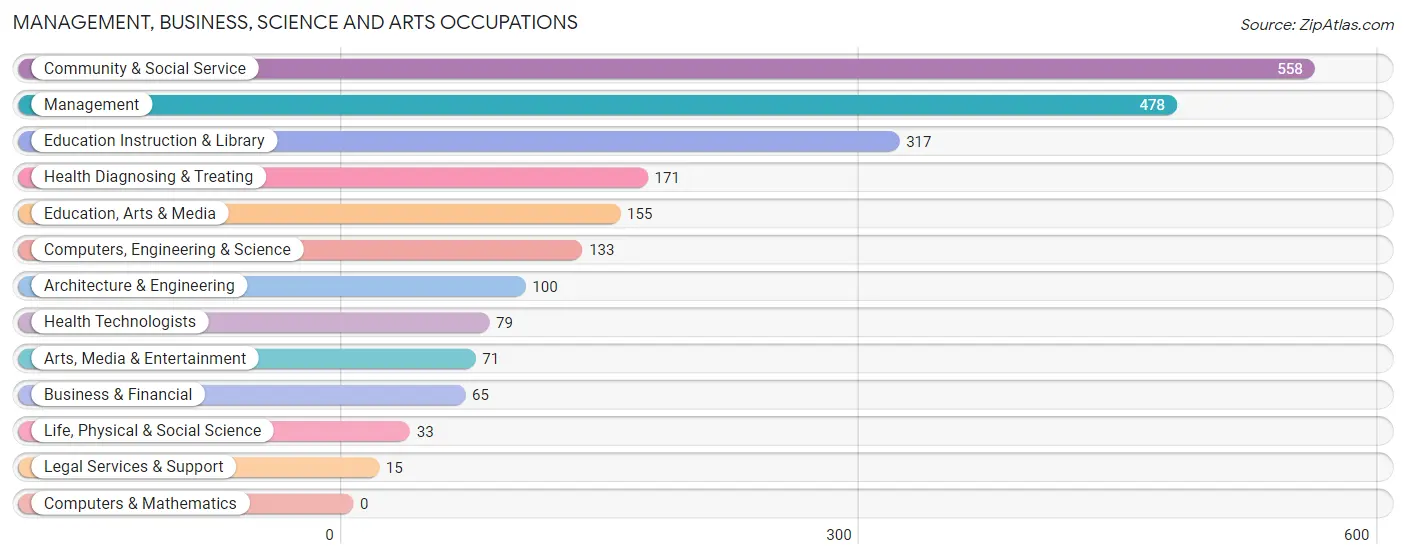
Management, Business, Science and Arts Occupations
The most common Management, Business, Science and Arts occupations in Brevard are Community & Social Service (558 | 17.0%), Management (478 | 14.6%), Education Instruction & Library (317 | 9.7%), Health Diagnosing & Treating (171 | 5.2%), and Education, Arts & Media (155 | 4.7%).
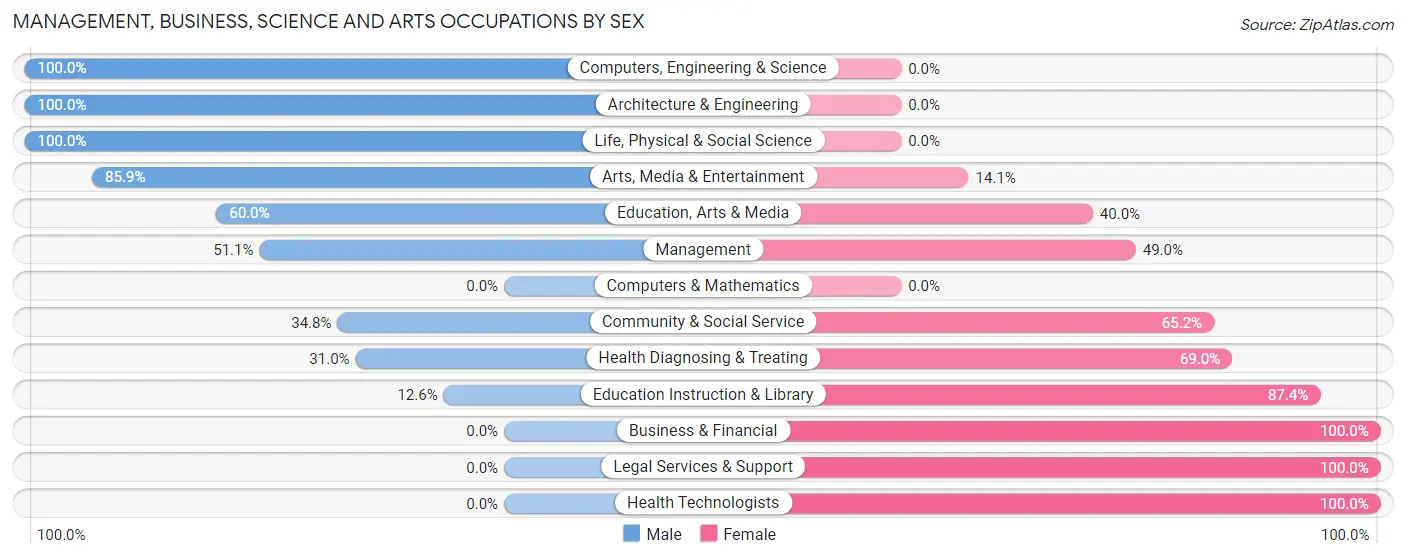
Management, Business, Science and Arts Occupations by Sex
Within the Management, Business, Science and Arts occupations in Brevard, the most male-oriented occupations are Computers, Engineering & Science (100.0%), Architecture & Engineering (100.0%), and Life, Physical & Social Science (100.0%), while the most female-oriented occupations are Business & Financial (100.0%), Legal Services & Support (100.0%), and Health Technologists (100.0%).
| Occupation | Male | Female |
| Management | 244 (51.0%) | 234 (48.9%) |
| Business & Financial | 0 (0.0%) | 65 (100.0%) |
| Computers, Engineering & Science | 133 (100.0%) | 0 (0.0%) |
| Computers & Mathematics | 0 (0.0%) | 0 (0.0%) |
| Architecture & Engineering | 100 (100.0%) | 0 (0.0%) |
| Life, Physical & Social Science | 33 (100.0%) | 0 (0.0%) |
| Community & Social Service | 194 (34.8%) | 364 (65.2%) |
| Education, Arts & Media | 93 (60.0%) | 62 (40.0%) |
| Legal Services & Support | 0 (0.0%) | 15 (100.0%) |
| Education Instruction & Library | 40 (12.6%) | 277 (87.4%) |
| Arts, Media & Entertainment | 61 (85.9%) | 10 (14.1%) |
| Health Diagnosing & Treating | 53 (31.0%) | 118 (69.0%) |
| Health Technologists | 0 (0.0%) | 79 (100.0%) |
| Total (Category) | 624 (44.4%) | 781 (55.6%) |
| Total (Overall) | 1,503 (45.8%) | 1,781 (54.2%) |
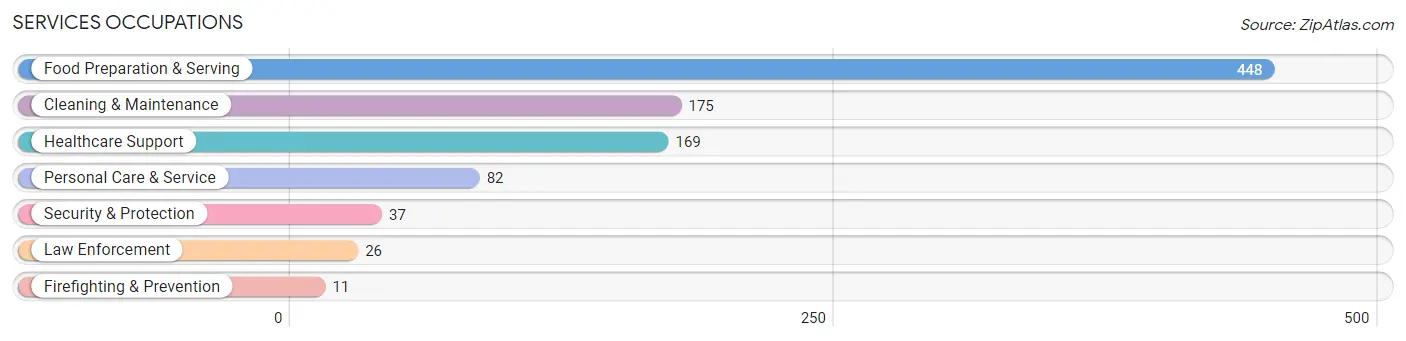
Services Occupations
The most common Services occupations in Brevard are Food Preparation & Serving (448 | 13.6%), Cleaning & Maintenance (175 | 5.3%), Healthcare Support (169 | 5.1%), Personal Care & Service (82 | 2.5%), and Security & Protection (37 | 1.1%).
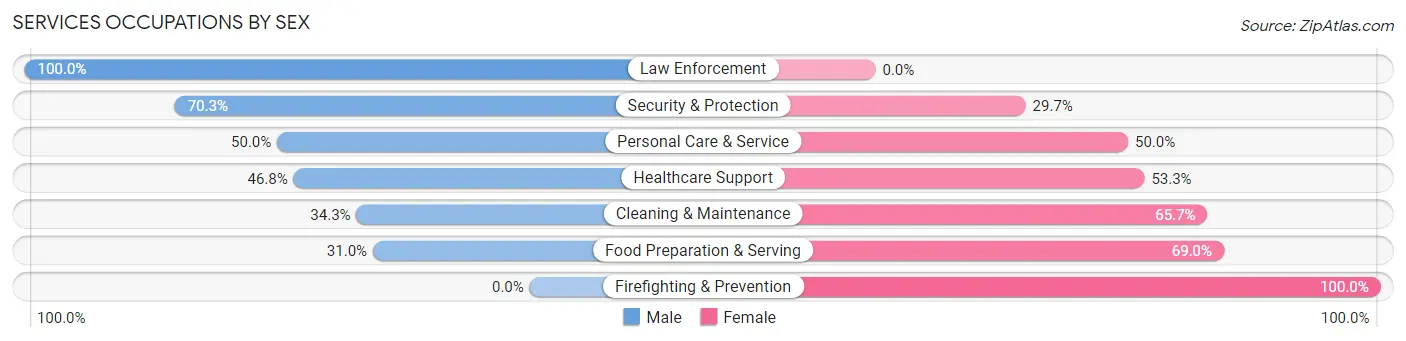
Services Occupations by Sex
Within the Services occupations in Brevard, the most male-oriented occupations are Law Enforcement (100.0%), Security & Protection (70.3%), and Personal Care & Service (50.0%), while the most female-oriented occupations are Firefighting & Prevention (100.0%), Food Preparation & Serving (69.0%), and Cleaning & Maintenance (65.7%).
| Occupation | Male | Female |
| Healthcare Support | 79 (46.8%) | 90 (53.2%) |
| Security & Protection | 26 (70.3%) | 11 (29.7%) |
| Firefighting & Prevention | 0 (0.0%) | 11 (100.0%) |
| Law Enforcement | 26 (100.0%) | 0 (0.0%) |
| Food Preparation & Serving | 139 (31.0%) | 309 (69.0%) |
| Cleaning & Maintenance | 60 (34.3%) | 115 (65.7%) |
| Personal Care & Service | 41 (50.0%) | 41 (50.0%) |
| Total (Category) | 345 (37.9%) | 566 (62.1%) |
| Total (Overall) | 1,503 (45.8%) | 1,781 (54.2%) |
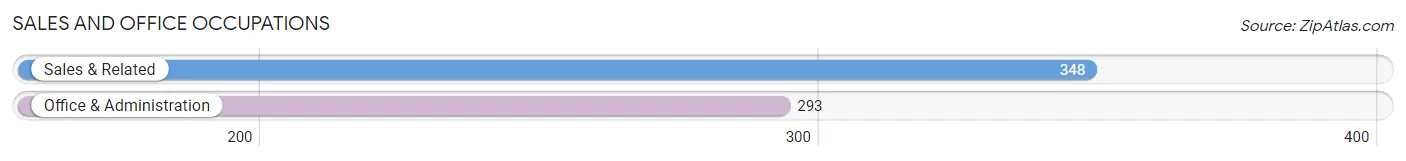
Sales and Office Occupations
The most common Sales and Office occupations in Brevard are Sales & Related (348 | 10.6%), and Office & Administration (293 | 8.9%).
Sales and Office Occupations by Sex
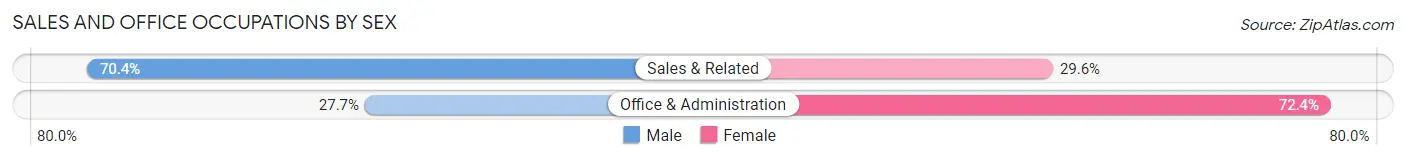
| Occupation | Male | Female |
| Sales & Related | 245 (70.4%) | 103 (29.6%) |
| Office & Administration | 81 (27.7%) | 212 (72.4%) |
| Total (Category) | 326 (50.9%) | 315 (49.1%) |
| Total (Overall) | 1,503 (45.8%) | 1,781 (54.2%) |
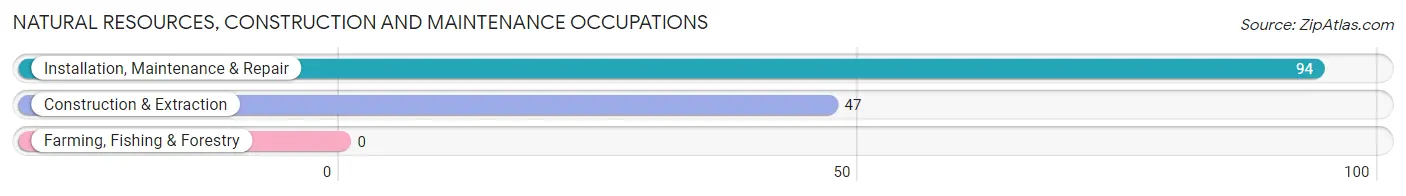
Natural Resources, Construction and Maintenance Occupations
The most common Natural Resources, Construction and Maintenance occupations in Brevard are Installation, Maintenance & Repair (94 | 2.9%), and Construction & Extraction (47 | 1.4%).
Natural Resources, Construction and Maintenance Occupations by Sex
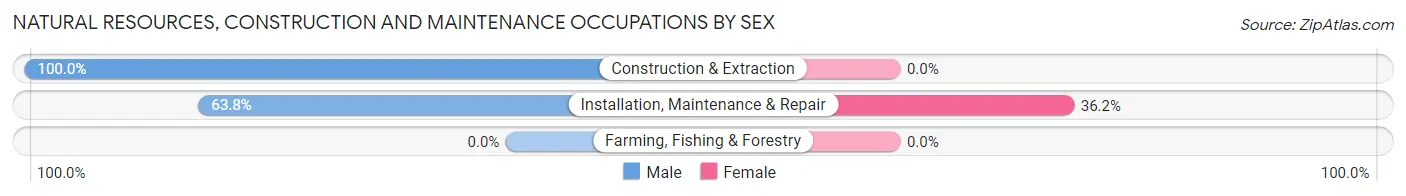
| Occupation | Male | Female |
| Farming, Fishing & Forestry | 0 (0.0%) | 0 (0.0%) |
| Construction & Extraction | 47 (100.0%) | 0 (0.0%) |
| Installation, Maintenance & Repair | 60 (63.8%) | 34 (36.2%) |
| Total (Category) | 107 (75.9%) | 34 (24.1%) |
| Total (Overall) | 1,503 (45.8%) | 1,781 (54.2%) |
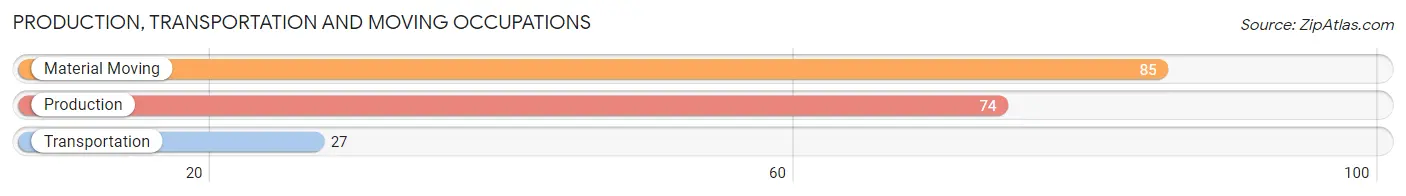
Production, Transportation and Moving Occupations
The most common Production, Transportation and Moving occupations in Brevard are Material Moving (85 | 2.6%), Production (74 | 2.2%), and Transportation (27 | 0.8%).
Production, Transportation and Moving Occupations by Sex
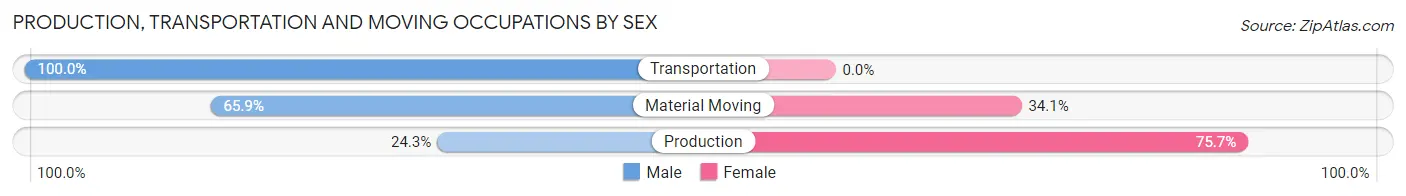
| Occupation | Male | Female |
| Production | 18 (24.3%) | 56 (75.7%) |
| Transportation | 27 (100.0%) | 0 (0.0%) |
| Material Moving | 56 (65.9%) | 29 (34.1%) |
| Total (Category) | 101 (54.3%) | 85 (45.7%) |
| Total (Overall) | 1,503 (45.8%) | 1,781 (54.2%) |
Employment Industries by Sex in Brevard
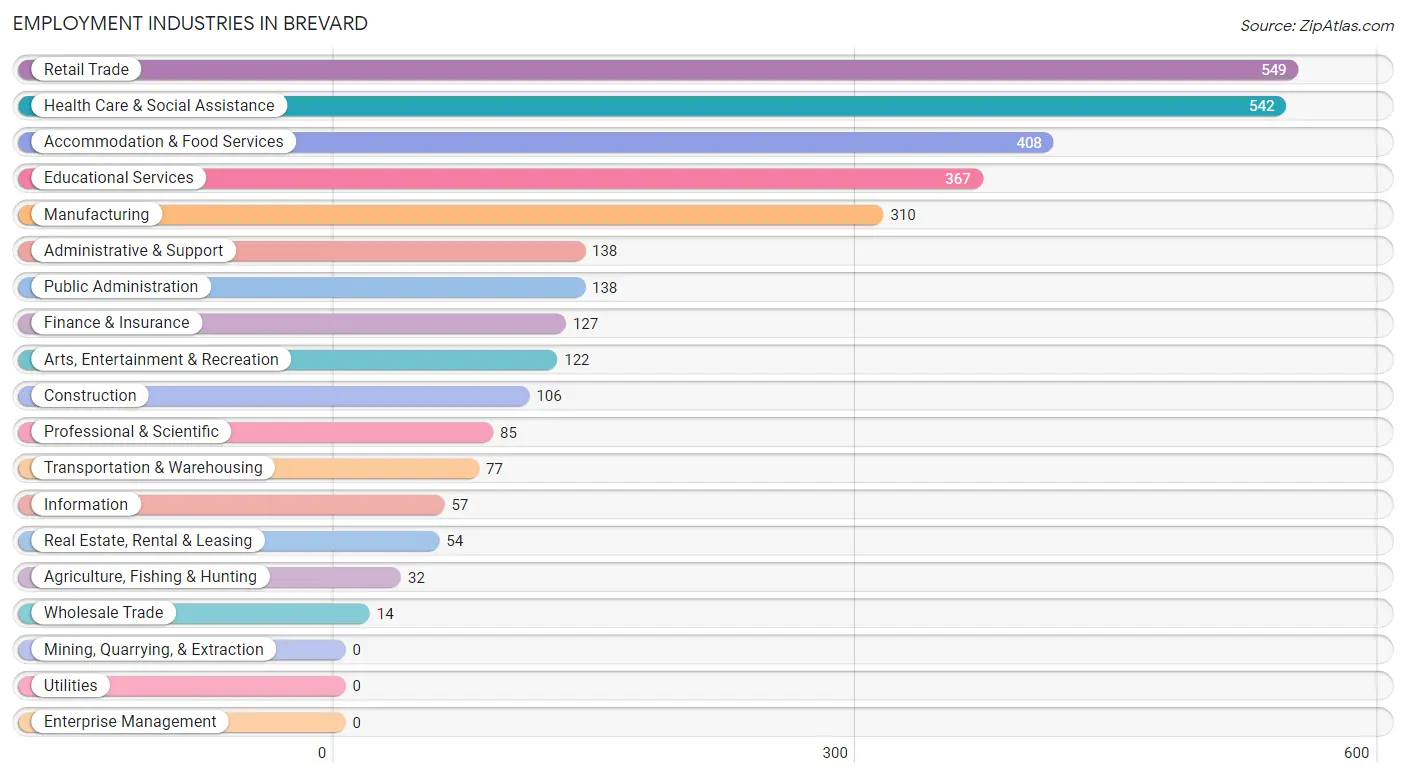
Employment Industries in Brevard
The major employment industries in Brevard include Retail Trade (549 | 16.7%), Health Care & Social Assistance (542 | 16.5%), Accommodation & Food Services (408 | 12.4%), Educational Services (367 | 11.2%), and Manufacturing (310 | 9.4%).
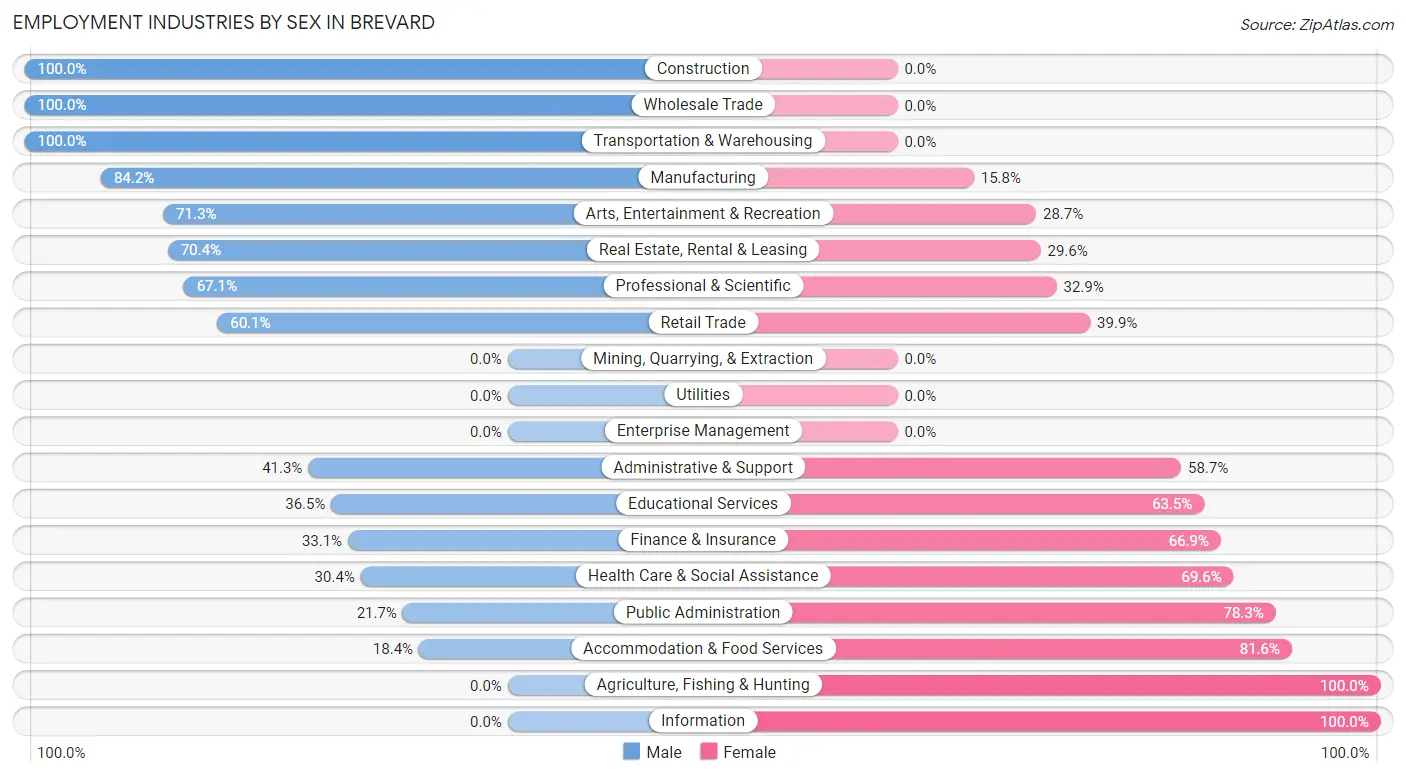
Employment Industries by Sex in Brevard
The Brevard industries that see more men than women are Construction (100.0%), Wholesale Trade (100.0%), and Transportation & Warehousing (100.0%), whereas the industries that tend to have a higher number of women are Agriculture, Fishing & Hunting (100.0%), Information (100.0%), and Accommodation & Food Services (81.6%).
| Industry | Male | Female |
| Agriculture, Fishing & Hunting | 0 (0.0%) | 32 (100.0%) |
| Mining, Quarrying, & Extraction | 0 (0.0%) | 0 (0.0%) |
| Construction | 106 (100.0%) | 0 (0.0%) |
| Manufacturing | 261 (84.2%) | 49 (15.8%) |
| Wholesale Trade | 14 (100.0%) | 0 (0.0%) |
| Retail Trade | 330 (60.1%) | 219 (39.9%) |
| Transportation & Warehousing | 77 (100.0%) | 0 (0.0%) |
| Utilities | 0 (0.0%) | 0 (0.0%) |
| Information | 0 (0.0%) | 57 (100.0%) |
| Finance & Insurance | 42 (33.1%) | 85 (66.9%) |
| Real Estate, Rental & Leasing | 38 (70.4%) | 16 (29.6%) |
| Professional & Scientific | 57 (67.1%) | 28 (32.9%) |
| Enterprise Management | 0 (0.0%) | 0 (0.0%) |
| Administrative & Support | 57 (41.3%) | 81 (58.7%) |
| Educational Services | 134 (36.5%) | 233 (63.5%) |
| Health Care & Social Assistance | 165 (30.4%) | 377 (69.6%) |
| Arts, Entertainment & Recreation | 87 (71.3%) | 35 (28.7%) |
| Accommodation & Food Services | 75 (18.4%) | 333 (81.6%) |
| Public Administration | 30 (21.7%) | 108 (78.3%) |
| Total | 1,503 (45.8%) | 1,781 (54.2%) |
Education in Brevard
School Enrollment in Brevard
The most common levels of schooling among the 1,748 students in Brevard are college / undergraduate (749 | 42.8%), high school (393 | 22.5%), and elementary school (201 | 11.5%).
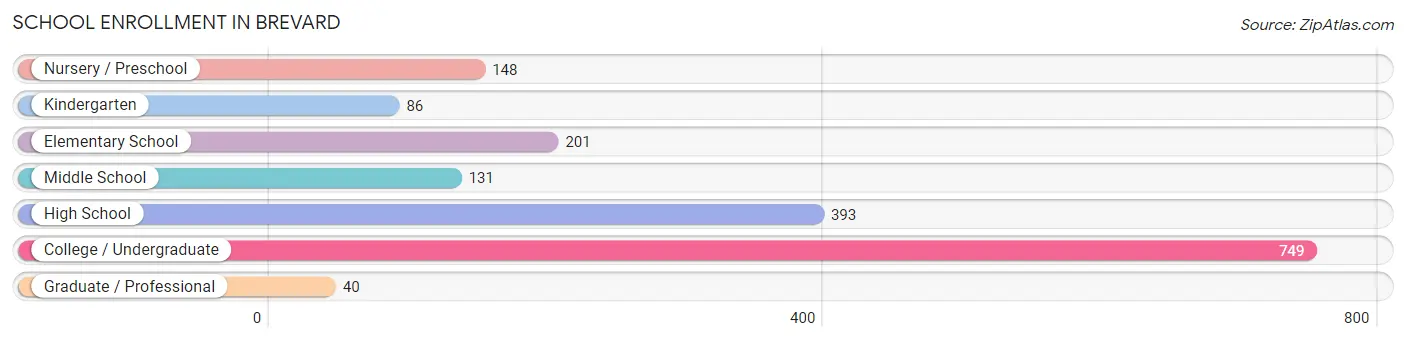
| School Level | # Students | % Students |
| Nursery / Preschool | 148 | 8.5% |
| Kindergarten | 86 | 4.9% |
| Elementary School | 201 | 11.5% |
| Middle School | 131 | 7.5% |
| High School | 393 | 22.5% |
| College / Undergraduate | 749 | 42.8% |
| Graduate / Professional | 40 | 2.3% |
| Total | 1,748 | 100.0% |
School Enrollment by Age by Funding Source in Brevard
Out of a total of 1,748 students who are enrolled in schools in Brevard, 481 (27.5%) attend a private institution, while the remaining 1,267 (72.5%) are enrolled in public schools. The age group of 20 to 24 year olds has the highest likelihood of being enrolled in private schools, with 165 (62.7% in the age bracket) enrolled. Conversely, the age group of 10 to 14 year olds has the lowest likelihood of being enrolled in a private school, with 130 (100.0% in the age bracket) attending a public institution.
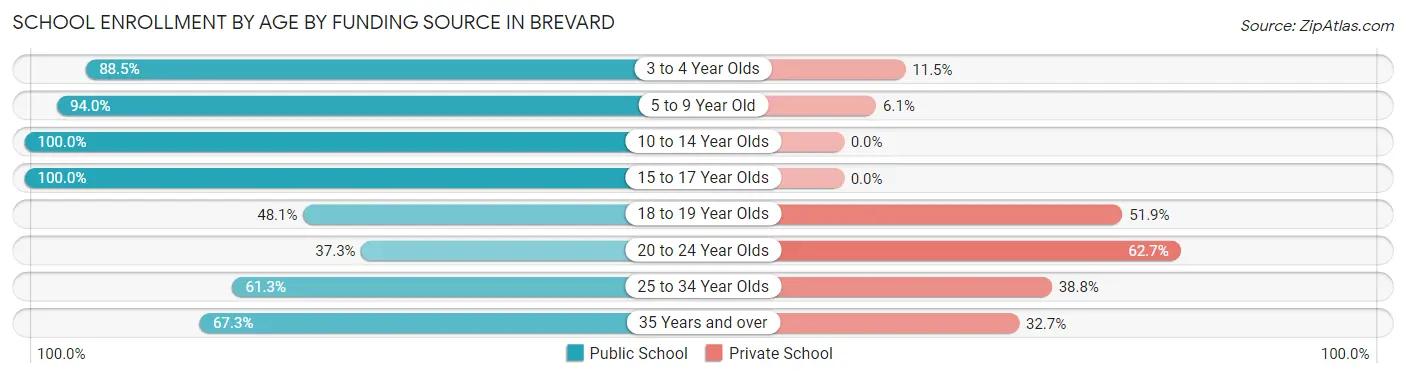
| Age Bracket | Public School | Private School |
| 3 to 4 Year Olds | 131 (88.5%) | 17 (11.5%) |
| 5 to 9 Year Old | 264 (94.0%) | 17 (6.0%) |
| 10 to 14 Year Olds | 130 (100.0%) | 0 (0.0%) |
| 15 to 17 Year Olds | 327 (100.0%) | 0 (0.0%) |
| 18 to 19 Year Olds | 201 (48.1%) | 217 (51.9%) |
| 20 to 24 Year Olds | 98 (37.3%) | 165 (62.7%) |
| 25 to 34 Year Olds | 49 (61.3%) | 31 (38.8%) |
| 35 Years and over | 68 (67.3%) | 33 (32.7%) |
| Total | 1,267 (72.5%) | 481 (27.5%) |
Educational Attainment by Field of Study in Brevard
Business (404 | 17.9%), education (235 | 10.4%), visual & performing arts (205 | 9.1%), science & technology (198 | 8.8%), and arts & humanities (179 | 7.9%) are the most common fields of study among 2,258 individuals in Brevard who have obtained a bachelor's degree or higher.
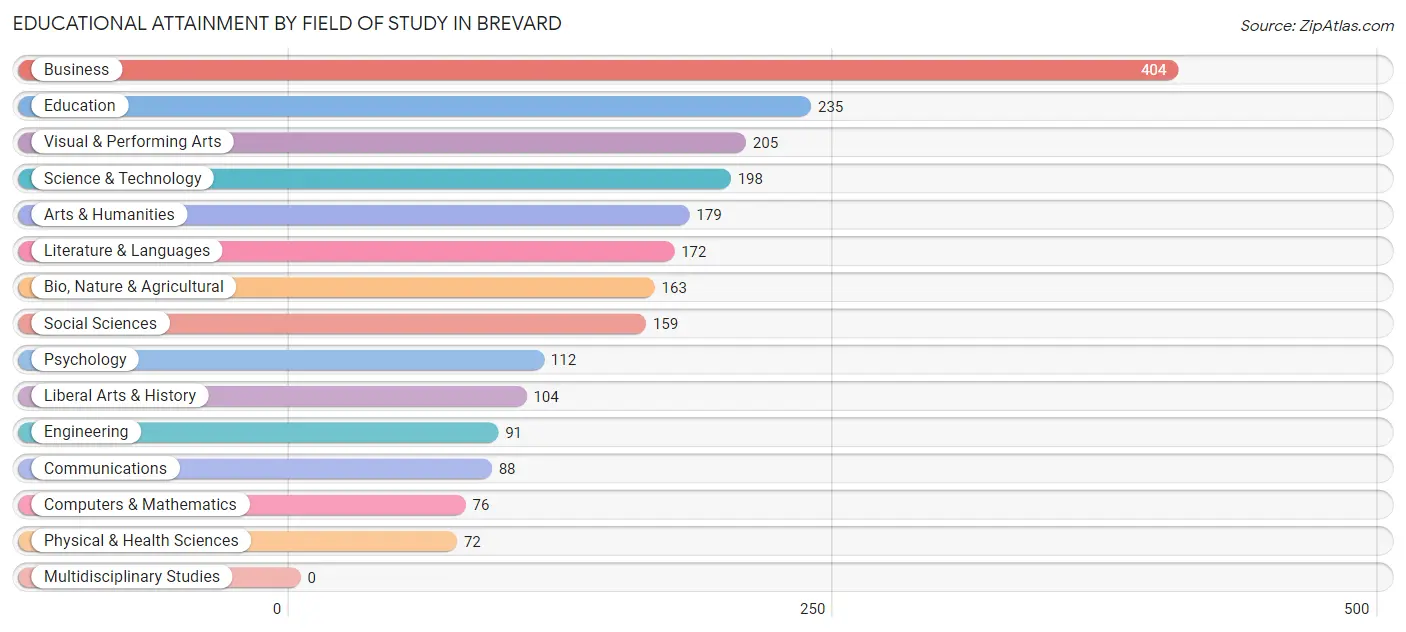
| Field of Study | # Graduates | % Graduates |
| Computers & Mathematics | 76 | 3.4% |
| Bio, Nature & Agricultural | 163 | 7.2% |
| Physical & Health Sciences | 72 | 3.2% |
| Psychology | 112 | 5.0% |
| Social Sciences | 159 | 7.0% |
| Engineering | 91 | 4.0% |
| Multidisciplinary Studies | 0 | 0.0% |
| Science & Technology | 198 | 8.8% |
| Business | 404 | 17.9% |
| Education | 235 | 10.4% |
| Literature & Languages | 172 | 7.6% |
| Liberal Arts & History | 104 | 4.6% |
| Visual & Performing Arts | 205 | 9.1% |
| Communications | 88 | 3.9% |
| Arts & Humanities | 179 | 7.9% |
| Total | 2,258 | 100.0% |
Transportation & Commute in Brevard
Vehicle Availability by Sex in Brevard
The most prevalent vehicle ownership categories in Brevard are males with 2 vehicles (770, accounting for 59.0%) and females with 2 vehicles (718, making up 47.6%).
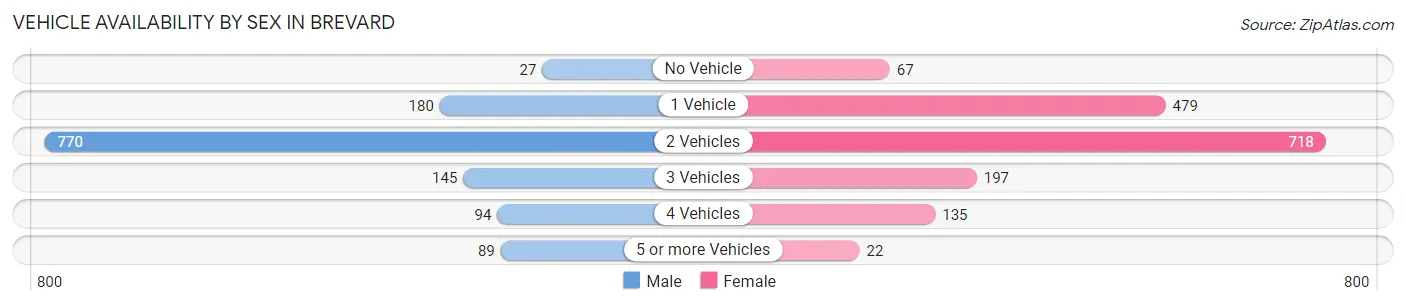
| Vehicles Available | Male | Female |
| No Vehicle | 27 (2.1%) | 67 (4.1%) |
| 1 Vehicle | 180 (13.8%) | 479 (29.6%) |
| 2 Vehicles | 770 (59.0%) | 718 (44.4%) |
| 3 Vehicles | 145 (11.1%) | 197 (12.2%) |
| 4 Vehicles | 94 (7.2%) | 135 (8.3%) |
| 5 or more Vehicles | 89 (6.8%) | 22 (1.4%) |
| Total | 1,305 (100.0%) | 1,618 (100.0%) |
Commute Time in Brevard
The most frequently occuring commute durations in Brevard are 10 to 14 minutes (806 commuters, 27.9%), 5 to 9 minutes (749 commuters, 26.0%), and 30 to 34 minutes (358 commuters, 12.4%).
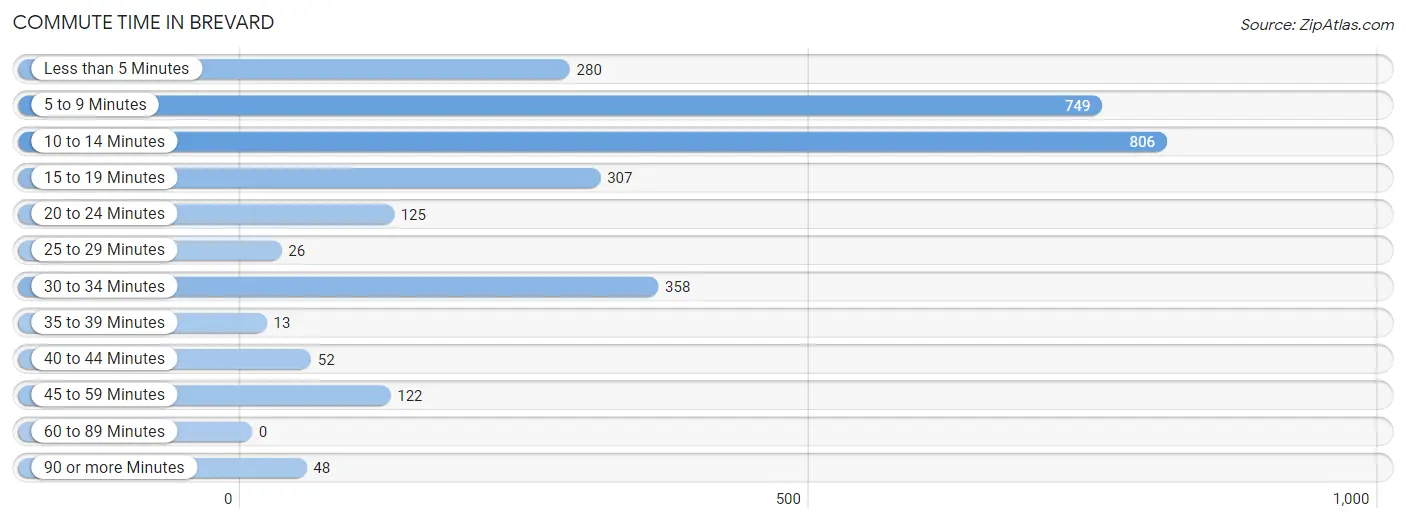
| Commute Time | # Commuters | % Commuters |
| Less than 5 Minutes | 280 | 9.7% |
| 5 to 9 Minutes | 749 | 26.0% |
| 10 to 14 Minutes | 806 | 27.9% |
| 15 to 19 Minutes | 307 | 10.6% |
| 20 to 24 Minutes | 125 | 4.3% |
| 25 to 29 Minutes | 26 | 0.9% |
| 30 to 34 Minutes | 358 | 12.4% |
| 35 to 39 Minutes | 13 | 0.4% |
| 40 to 44 Minutes | 52 | 1.8% |
| 45 to 59 Minutes | 122 | 4.2% |
| 60 to 89 Minutes | 0 | 0.0% |
| 90 or more Minutes | 48 | 1.7% |
Commute Time by Sex in Brevard
The most common commute times in Brevard are 5 to 9 minutes (328 commuters, 25.0%) for males and 10 to 14 minutes (493 commuters, 31.3%) for females.
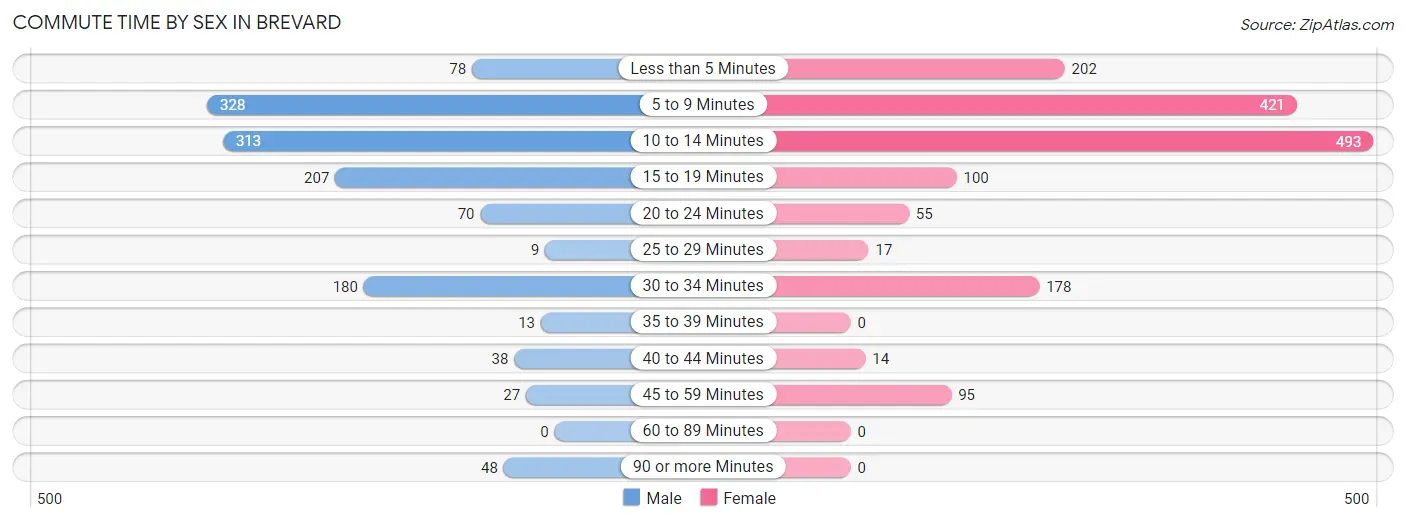
| Commute Time | Male | Female |
| Less than 5 Minutes | 78 (5.9%) | 202 (12.8%) |
| 5 to 9 Minutes | 328 (25.0%) | 421 (26.7%) |
| 10 to 14 Minutes | 313 (23.9%) | 493 (31.3%) |
| 15 to 19 Minutes | 207 (15.8%) | 100 (6.4%) |
| 20 to 24 Minutes | 70 (5.3%) | 55 (3.5%) |
| 25 to 29 Minutes | 9 (0.7%) | 17 (1.1%) |
| 30 to 34 Minutes | 180 (13.7%) | 178 (11.3%) |
| 35 to 39 Minutes | 13 (1.0%) | 0 (0.0%) |
| 40 to 44 Minutes | 38 (2.9%) | 14 (0.9%) |
| 45 to 59 Minutes | 27 (2.1%) | 95 (6.0%) |
| 60 to 89 Minutes | 0 (0.0%) | 0 (0.0%) |
| 90 or more Minutes | 48 (3.7%) | 0 (0.0%) |
Time of Departure to Work by Sex in Brevard
The most frequent times of departure to work in Brevard are 7:00 AM to 7:29 AM (206, 15.7%) for males and 7:30 AM to 7:59 AM (329, 20.9%) for females.
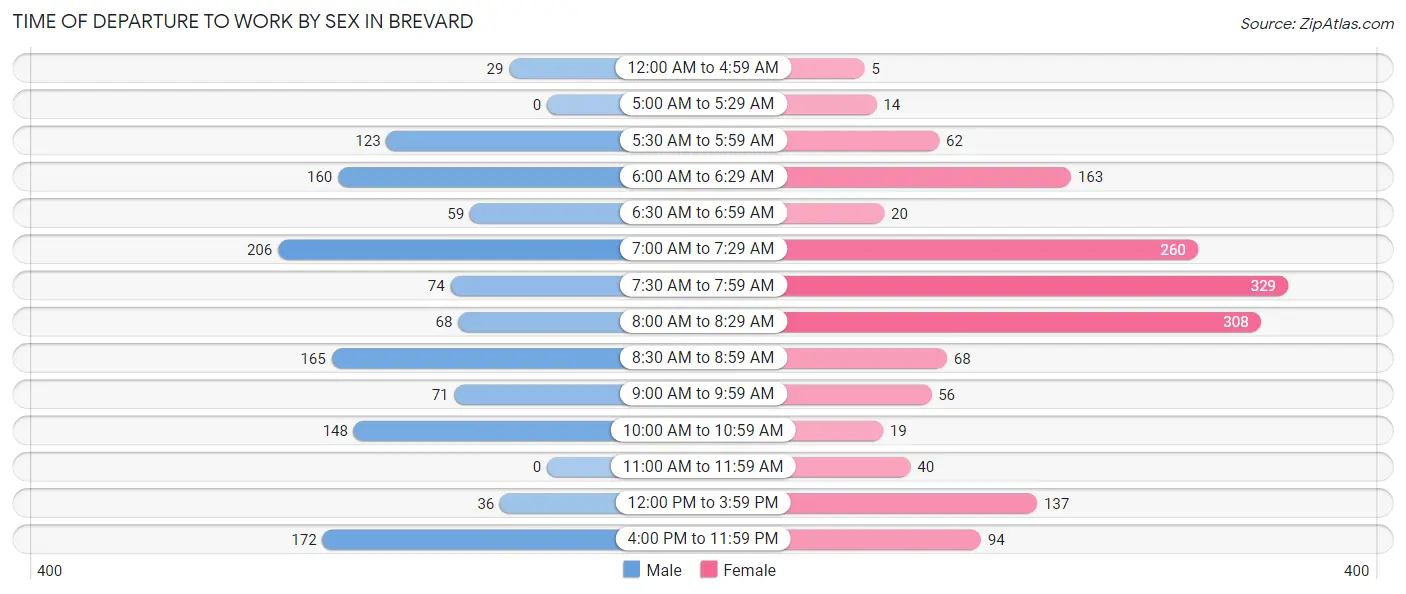
| Time of Departure | Male | Female |
| 12:00 AM to 4:59 AM | 29 (2.2%) | 5 (0.3%) |
| 5:00 AM to 5:29 AM | 0 (0.0%) | 14 (0.9%) |
| 5:30 AM to 5:59 AM | 123 (9.4%) | 62 (3.9%) |
| 6:00 AM to 6:29 AM | 160 (12.2%) | 163 (10.3%) |
| 6:30 AM to 6:59 AM | 59 (4.5%) | 20 (1.3%) |
| 7:00 AM to 7:29 AM | 206 (15.7%) | 260 (16.5%) |
| 7:30 AM to 7:59 AM | 74 (5.6%) | 329 (20.9%) |
| 8:00 AM to 8:29 AM | 68 (5.2%) | 308 (19.6%) |
| 8:30 AM to 8:59 AM | 165 (12.6%) | 68 (4.3%) |
| 9:00 AM to 9:59 AM | 71 (5.4%) | 56 (3.6%) |
| 10:00 AM to 10:59 AM | 148 (11.3%) | 19 (1.2%) |
| 11:00 AM to 11:59 AM | 0 (0.0%) | 40 (2.5%) |
| 12:00 PM to 3:59 PM | 36 (2.8%) | 137 (8.7%) |
| 4:00 PM to 11:59 PM | 172 (13.1%) | 94 (6.0%) |
| Total | 1,311 (100.0%) | 1,575 (100.0%) |
Housing Occupancy in Brevard
Occupancy by Ownership in Brevard
Of the total 3,618 dwellings in Brevard, owner-occupied units account for 2,034 (56.2%), while renter-occupied units make up 1,584 (43.8%).
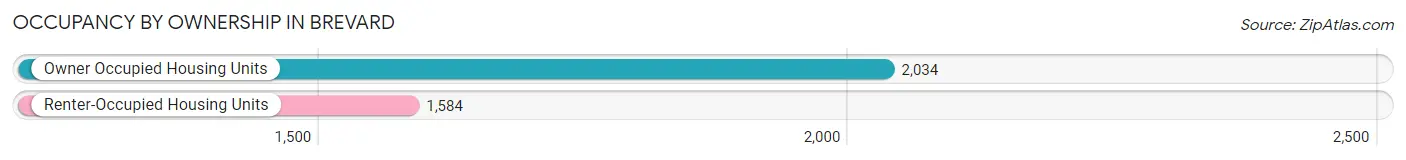
| Occupancy | # Housing Units | % Housing Units |
| Owner Occupied Housing Units | 2,034 | 56.2% |
| Renter-Occupied Housing Units | 1,584 | 43.8% |
| Total Occupied Housing Units | 3,618 | 100.0% |
Occupancy by Household Size in Brevard
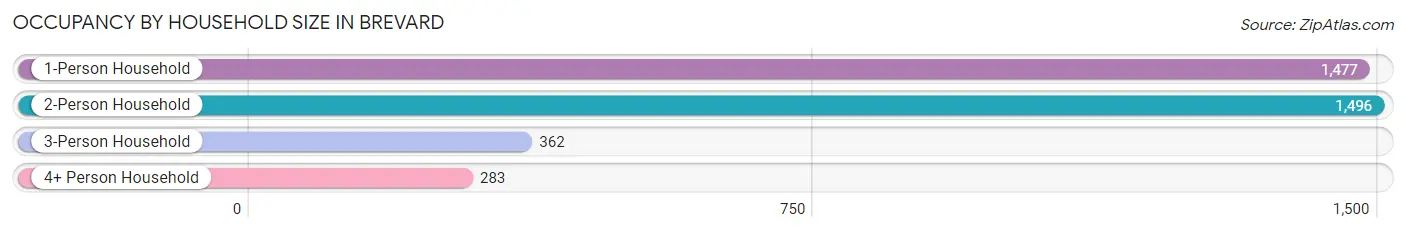
| Household Size | # Housing Units | % Housing Units |
| 1-Person Household | 1,477 | 40.8% |
| 2-Person Household | 1,496 | 41.3% |
| 3-Person Household | 362 | 10.0% |
| 4+ Person Household | 283 | 7.8% |
| Total Housing Units | 3,618 | 100.0% |
Occupancy by Ownership by Household Size in Brevard
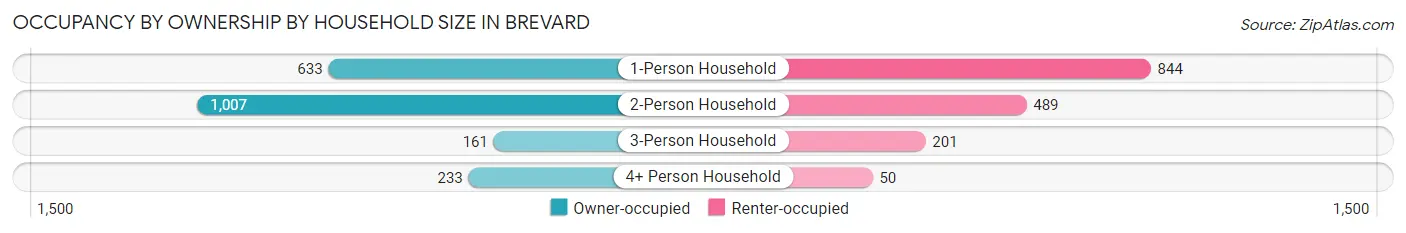
| Household Size | Owner-occupied | Renter-occupied |
| 1-Person Household | 633 (42.9%) | 844 (57.1%) |
| 2-Person Household | 1,007 (67.3%) | 489 (32.7%) |
| 3-Person Household | 161 (44.5%) | 201 (55.5%) |
| 4+ Person Household | 233 (82.3%) | 50 (17.7%) |
| Total Housing Units | 2,034 (56.2%) | 1,584 (43.8%) |
Occupancy by Educational Attainment in Brevard
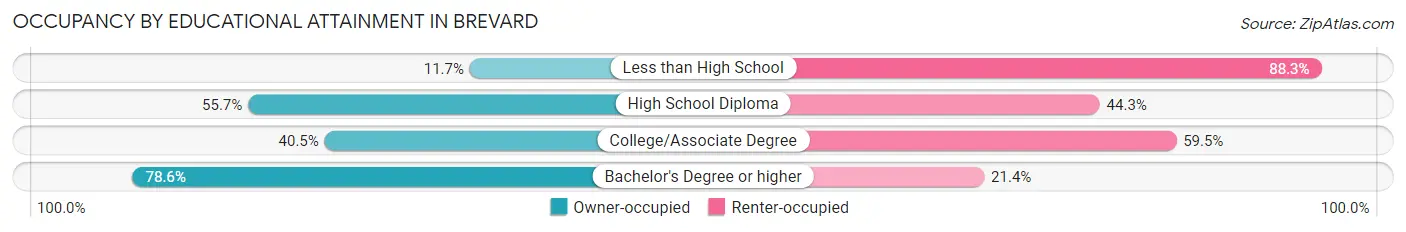
| Household Size | Owner-occupied | Renter-occupied |
| Less than High School | 25 (11.7%) | 188 (88.3%) |
| High School Diploma | 411 (55.7%) | 327 (44.3%) |
| College/Associate Degree | 530 (40.5%) | 778 (59.5%) |
| Bachelor's Degree or higher | 1,068 (78.6%) | 291 (21.4%) |
Occupancy by Age of Householder in Brevard
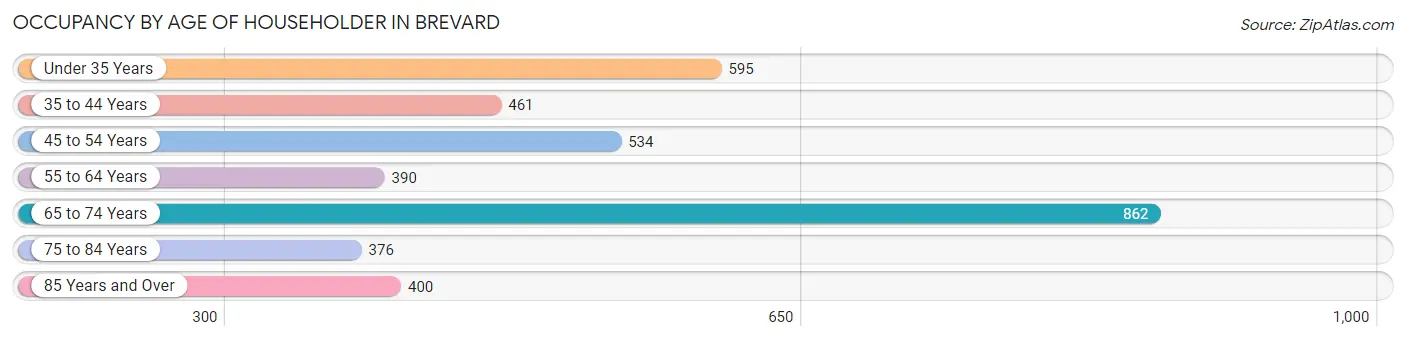
| Age Bracket | # Households | % Households |
| Under 35 Years | 595 | 16.5% |
| 35 to 44 Years | 461 | 12.7% |
| 45 to 54 Years | 534 | 14.8% |
| 55 to 64 Years | 390 | 10.8% |
| 65 to 74 Years | 862 | 23.8% |
| 75 to 84 Years | 376 | 10.4% |
| 85 Years and Over | 400 | 11.1% |
| Total | 3,618 | 100.0% |
Housing Finances in Brevard
Median Income by Occupancy in Brevard
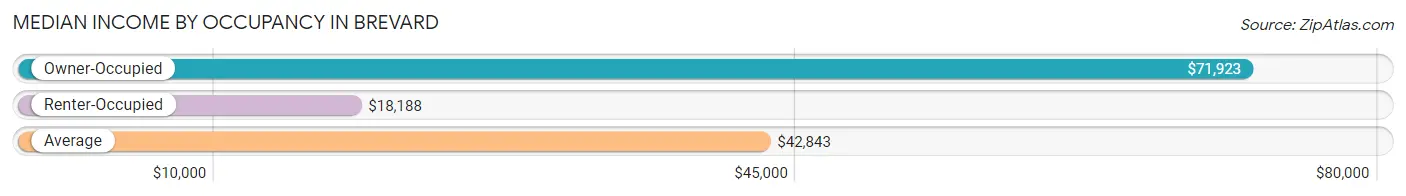
| Occupancy Type | # Households | Median Income |
| Owner-Occupied | 2,034 (56.2%) | $71,923 |
| Renter-Occupied | 1,584 (43.8%) | $18,188 |
| Average | 3,618 (100.0%) | $42,843 |
Occupancy by Householder Income Bracket in Brevard
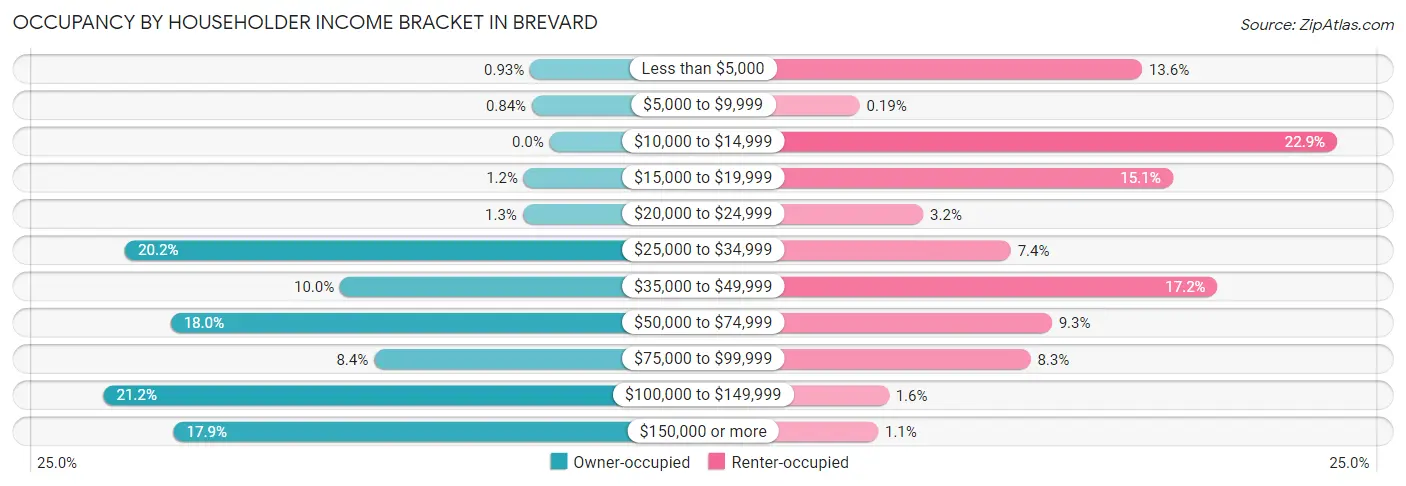
| Income Bracket | Owner-occupied | Renter-occupied |
| Less than $5,000 | 19 (0.9%) | 216 (13.6%) |
| $5,000 to $9,999 | 17 (0.8%) | 3 (0.2%) |
| $10,000 to $14,999 | 0 (0.0%) | 363 (22.9%) |
| $15,000 to $19,999 | 25 (1.2%) | 239 (15.1%) |
| $20,000 to $24,999 | 26 (1.3%) | 51 (3.2%) |
| $25,000 to $34,999 | 411 (20.2%) | 117 (7.4%) |
| $35,000 to $49,999 | 203 (10.0%) | 273 (17.2%) |
| $50,000 to $74,999 | 367 (18.0%) | 148 (9.3%) |
| $75,000 to $99,999 | 170 (8.4%) | 132 (8.3%) |
| $100,000 to $149,999 | 432 (21.2%) | 25 (1.6%) |
| $150,000 or more | 364 (17.9%) | 17 (1.1%) |
| Total | 2,034 (100.0%) | 1,584 (100.0%) |
Monthly Housing Cost Tiers in Brevard
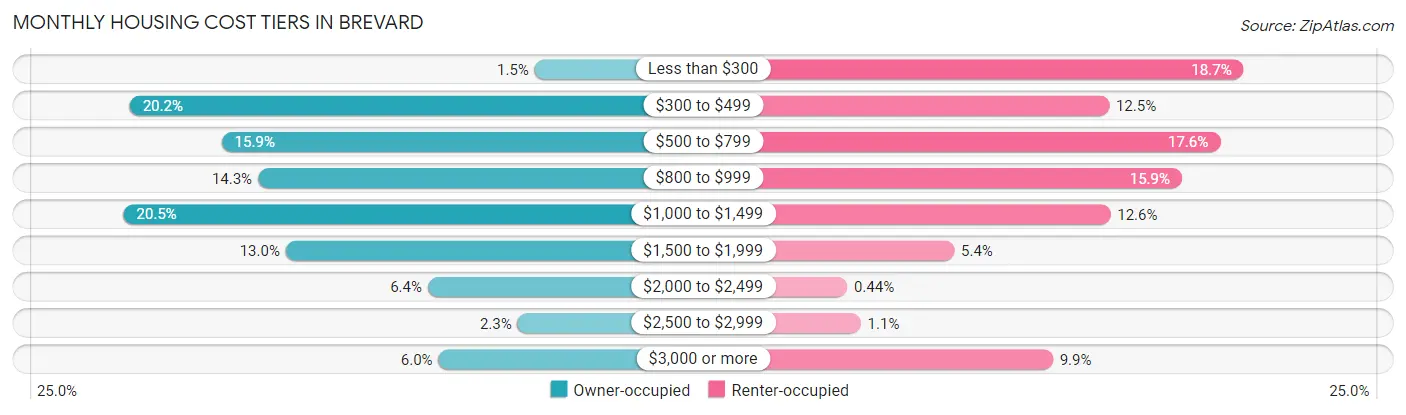
| Monthly Cost | Owner-occupied | Renter-occupied |
| Less than $300 | 31 (1.5%) | 296 (18.7%) |
| $300 to $499 | 410 (20.2%) | 198 (12.5%) |
| $500 to $799 | 324 (15.9%) | 279 (17.6%) |
| $800 to $999 | 290 (14.3%) | 251 (15.9%) |
| $1,000 to $1,499 | 416 (20.4%) | 199 (12.6%) |
| $1,500 to $1,999 | 264 (13.0%) | 85 (5.4%) |
| $2,000 to $2,499 | 131 (6.4%) | 7 (0.4%) |
| $2,500 to $2,999 | 47 (2.3%) | 17 (1.1%) |
| $3,000 or more | 121 (5.9%) | 157 (9.9%) |
| Total | 2,034 (100.0%) | 1,584 (100.0%) |
Physical Housing Characteristics in Brevard
Housing Structures in Brevard
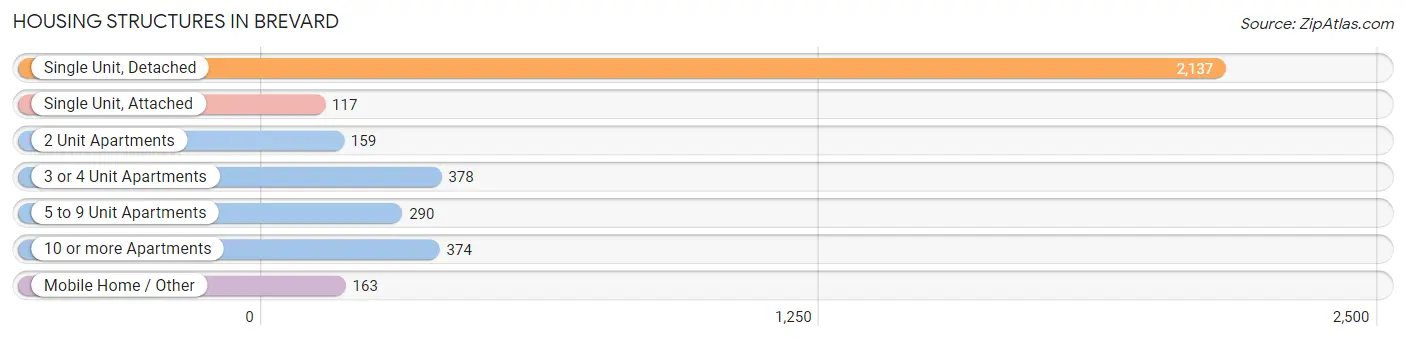
| Structure Type | # Housing Units | % Housing Units |
| Single Unit, Detached | 2,137 | 59.1% |
| Single Unit, Attached | 117 | 3.2% |
| 2 Unit Apartments | 159 | 4.4% |
| 3 or 4 Unit Apartments | 378 | 10.4% |
| 5 to 9 Unit Apartments | 290 | 8.0% |
| 10 or more Apartments | 374 | 10.3% |
| Mobile Home / Other | 163 | 4.5% |
| Total | 3,618 | 100.0% |
Housing Structures by Occupancy in Brevard
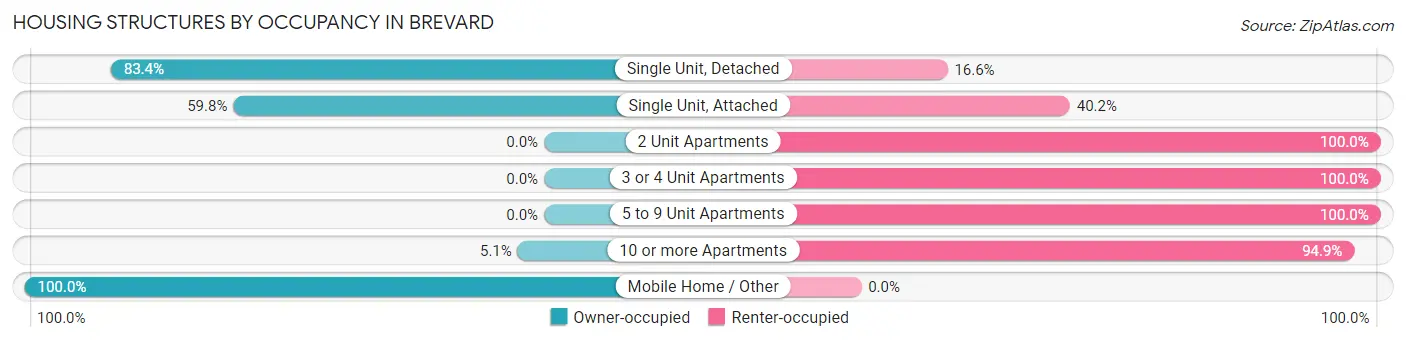
| Structure Type | Owner-occupied | Renter-occupied |
| Single Unit, Detached | 1,782 (83.4%) | 355 (16.6%) |
| Single Unit, Attached | 70 (59.8%) | 47 (40.2%) |
| 2 Unit Apartments | 0 (0.0%) | 159 (100.0%) |
| 3 or 4 Unit Apartments | 0 (0.0%) | 378 (100.0%) |
| 5 to 9 Unit Apartments | 0 (0.0%) | 290 (100.0%) |
| 10 or more Apartments | 19 (5.1%) | 355 (94.9%) |
| Mobile Home / Other | 163 (100.0%) | 0 (0.0%) |
| Total | 2,034 (56.2%) | 1,584 (43.8%) |
Housing Structures by Number of Rooms in Brevard
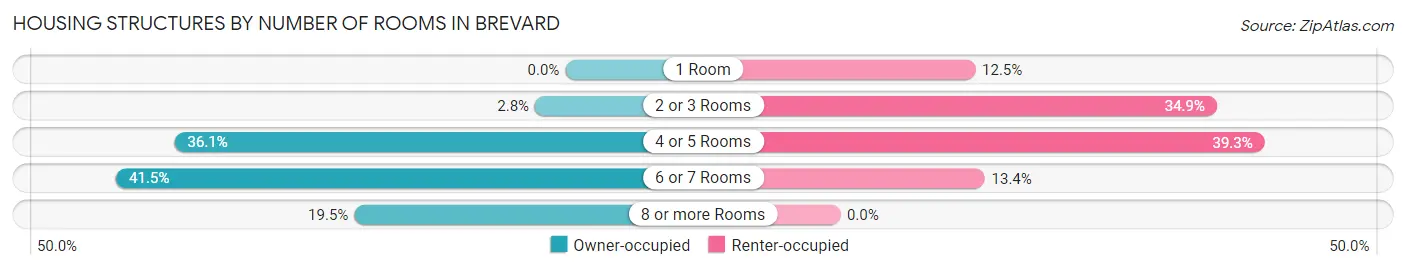
| Number of Rooms | Owner-occupied | Renter-occupied |
| 1 Room | 0 (0.0%) | 198 (12.5%) |
| 2 or 3 Rooms | 57 (2.8%) | 552 (34.8%) |
| 4 or 5 Rooms | 735 (36.1%) | 622 (39.3%) |
| 6 or 7 Rooms | 845 (41.5%) | 212 (13.4%) |
| 8 or more Rooms | 397 (19.5%) | 0 (0.0%) |
| Total | 2,034 (100.0%) | 1,584 (100.0%) |
Housing Structure by Heating Type in Brevard
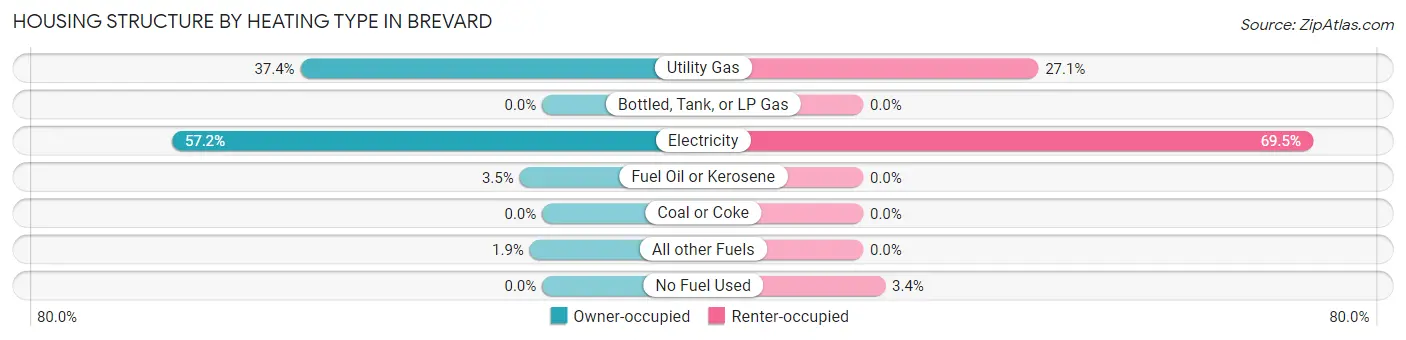
| Heating Type | Owner-occupied | Renter-occupied |
| Utility Gas | 760 (37.4%) | 429 (27.1%) |
| Bottled, Tank, or LP Gas | 0 (0.0%) | 0 (0.0%) |
| Electricity | 1,164 (57.2%) | 1,101 (69.5%) |
| Fuel Oil or Kerosene | 71 (3.5%) | 0 (0.0%) |
| Coal or Coke | 0 (0.0%) | 0 (0.0%) |
| All other Fuels | 39 (1.9%) | 0 (0.0%) |
| No Fuel Used | 0 (0.0%) | 54 (3.4%) |
| Total | 2,034 (100.0%) | 1,584 (100.0%) |
Household Vehicle Usage in Brevard
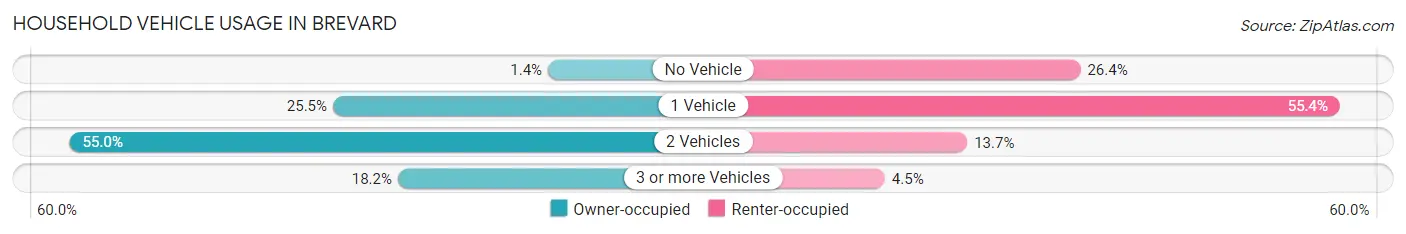
| Vehicles per Household | Owner-occupied | Renter-occupied |
| No Vehicle | 28 (1.4%) | 418 (26.4%) |
| 1 Vehicle | 518 (25.5%) | 878 (55.4%) |
| 2 Vehicles | 1,118 (55.0%) | 217 (13.7%) |
| 3 or more Vehicles | 370 (18.2%) | 71 (4.5%) |
| Total | 2,034 (100.0%) | 1,584 (100.0%) |
Real Estate & Mortgages in Brevard
Real Estate and Mortgage Overview in Brevard
| Characteristic | Without Mortgage | With Mortgage |
| Housing Units | 795 | 1,239 |
| Median Property Value | $361,400 | $291,200 |
| Median Household Income | $63,040 | $208 |
| Monthly Housing Costs | $511 | $121 |
| Real Estate Taxes | $2,250 | $51 |
Property Value by Mortgage Status in Brevard
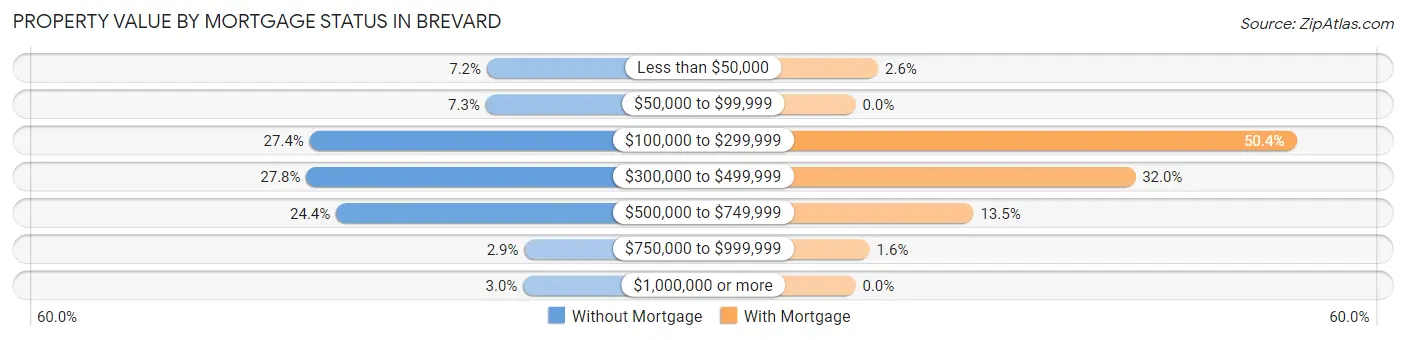
| Property Value | Without Mortgage | With Mortgage |
| Less than $50,000 | 57 (7.2%) | 32 (2.6%) |
| $50,000 to $99,999 | 58 (7.3%) | 0 (0.0%) |
| $100,000 to $299,999 | 218 (27.4%) | 624 (50.4%) |
| $300,000 to $499,999 | 221 (27.8%) | 396 (32.0%) |
| $500,000 to $749,999 | 194 (24.4%) | 167 (13.5%) |
| $750,000 to $999,999 | 23 (2.9%) | 20 (1.6%) |
| $1,000,000 or more | 24 (3.0%) | 0 (0.0%) |
| Total | 795 (100.0%) | 1,239 (100.0%) |
Household Income by Mortgage Status in Brevard
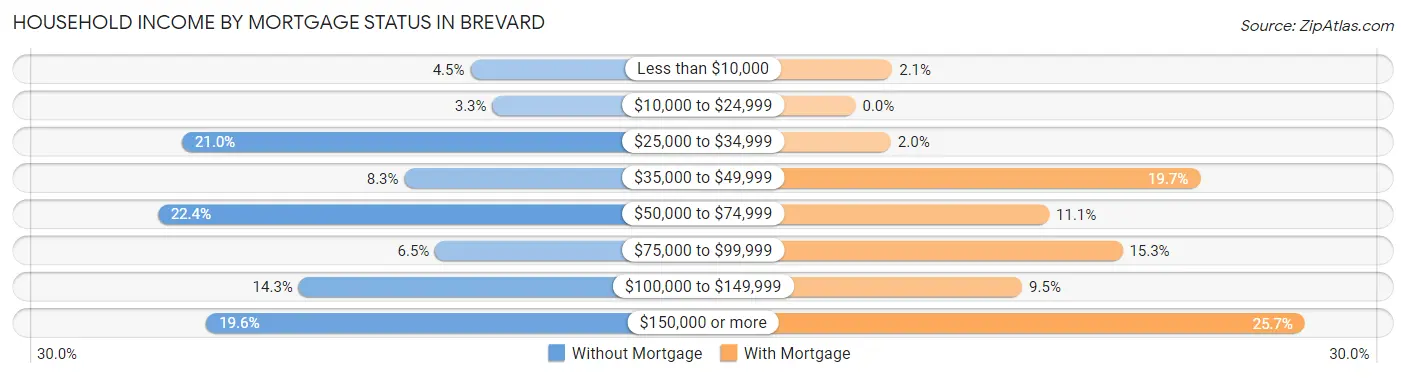
| Household Income | Without Mortgage | With Mortgage |
| Less than $10,000 | 36 (4.5%) | 26 (2.1%) |
| $10,000 to $24,999 | 26 (3.3%) | 0 (0.0%) |
| $25,000 to $34,999 | 167 (21.0%) | 25 (2.0%) |
| $35,000 to $49,999 | 66 (8.3%) | 244 (19.7%) |
| $50,000 to $74,999 | 178 (22.4%) | 137 (11.1%) |
| $75,000 to $99,999 | 52 (6.5%) | 189 (15.2%) |
| $100,000 to $149,999 | 114 (14.3%) | 118 (9.5%) |
| $150,000 or more | 156 (19.6%) | 318 (25.7%) |
| Total | 795 (100.0%) | 1,239 (100.0%) |
Property Value to Household Income Ratio in Brevard
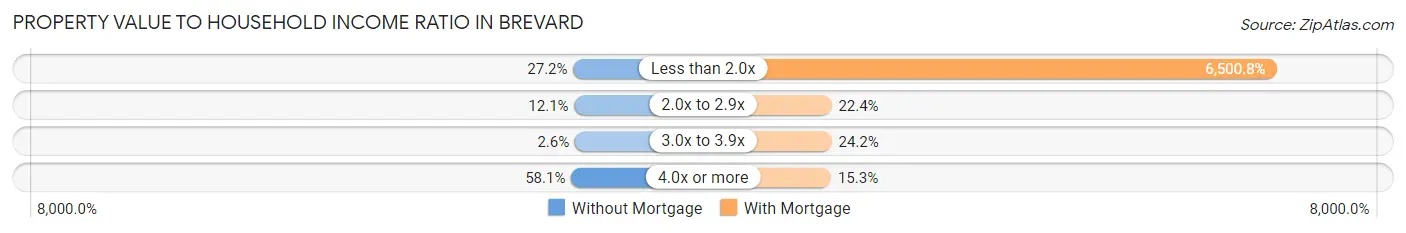
| Value-to-Income Ratio | Without Mortgage | With Mortgage |
| Less than 2.0x | 216 (27.2%) | 80,545 (6,500.8%) |
| 2.0x to 2.9x | 96 (12.1%) | 277 (22.4%) |
| 3.0x to 3.9x | 21 (2.6%) | 300 (24.2%) |
| 4.0x or more | 462 (58.1%) | 190 (15.3%) |
| Total | 795 (100.0%) | 1,239 (100.0%) |
Real Estate Taxes by Mortgage Status in Brevard
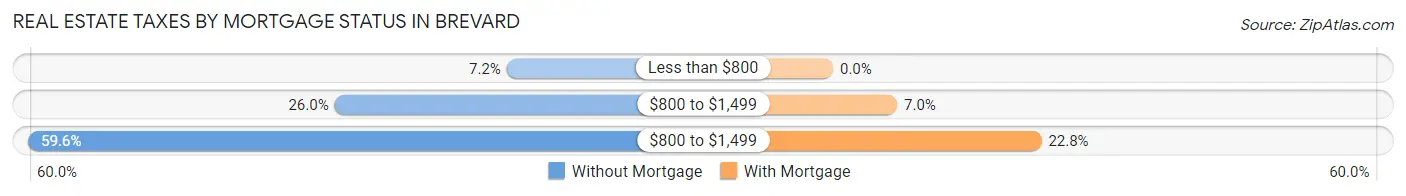
| Property Taxes | Without Mortgage | With Mortgage |
| Less than $800 | 57 (7.2%) | 0 (0.0%) |
| $800 to $1,499 | 207 (26.0%) | 87 (7.0%) |
| $800 to $1,499 | 474 (59.6%) | 283 (22.8%) |
| Total | 795 (100.0%) | 1,239 (100.0%) |
Health & Disability in Brevard
Health Insurance Coverage by Age in Brevard
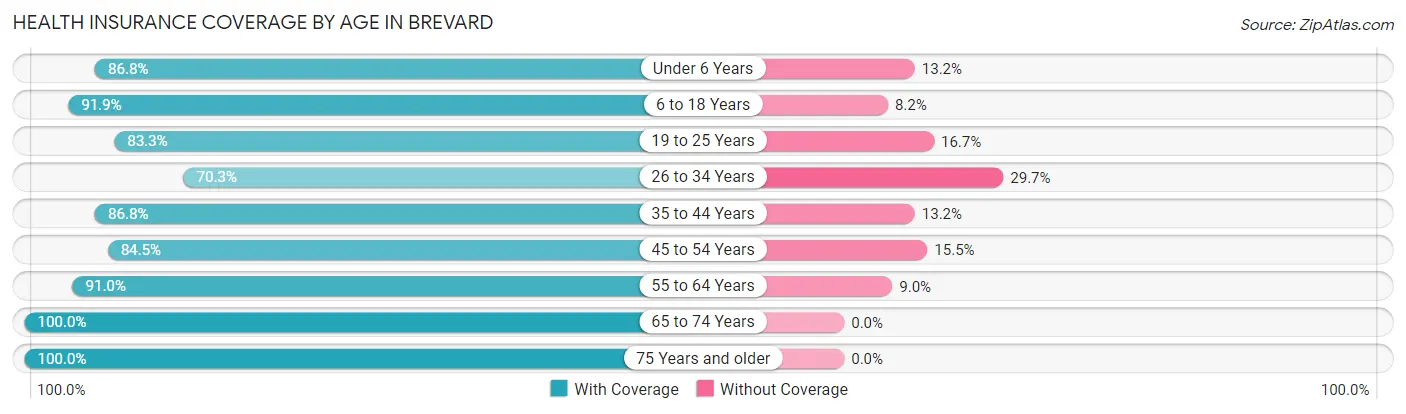
| Age Bracket | With Coverage | Without Coverage |
| Under 6 Years | 330 (86.8%) | 50 (13.2%) |
| 6 to 18 Years | 744 (91.8%) | 66 (8.2%) |
| 19 to 25 Years | 697 (83.3%) | 140 (16.7%) |
| 26 to 34 Years | 510 (70.3%) | 215 (29.7%) |
| 35 to 44 Years | 475 (86.8%) | 72 (13.2%) |
| 45 to 54 Years | 818 (84.5%) | 150 (15.5%) |
| 55 to 64 Years | 854 (91.0%) | 84 (9.0%) |
| 65 to 74 Years | 1,178 (100.0%) | 0 (0.0%) |
| 75 Years and older | 1,023 (100.0%) | 0 (0.0%) |
| Total | 6,629 (89.5%) | 777 (10.5%) |
Health Insurance Coverage by Citizenship Status in Brevard
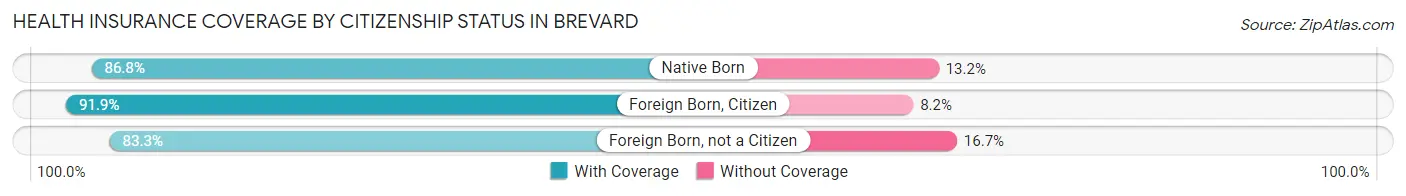
| Citizenship Status | With Coverage | Without Coverage |
| Native Born | 330 (86.8%) | 50 (13.2%) |
| Foreign Born, Citizen | 744 (91.8%) | 66 (8.2%) |
| Foreign Born, not a Citizen | 697 (83.3%) | 140 (16.7%) |
Health Insurance Coverage by Household Income in Brevard
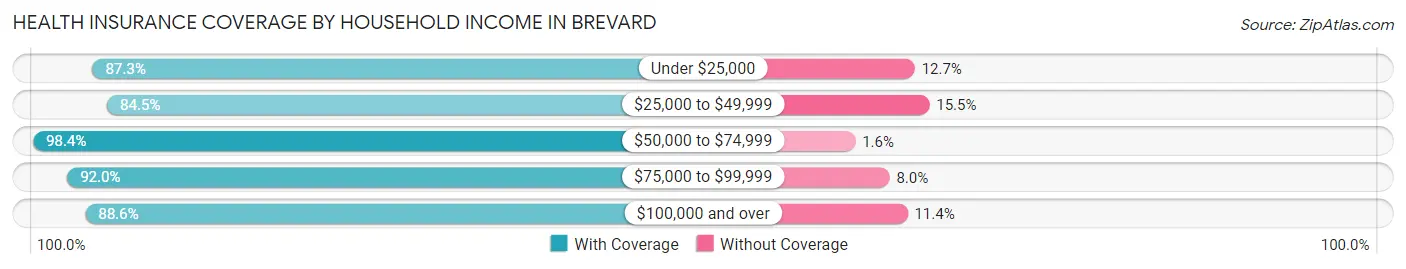
| Household Income | With Coverage | Without Coverage |
| Under $25,000 | 1,283 (87.3%) | 187 (12.7%) |
| $25,000 to $49,999 | 1,422 (84.5%) | 260 (15.5%) |
| $50,000 to $74,999 | 873 (98.4%) | 14 (1.6%) |
| $75,000 to $99,999 | 633 (92.0%) | 55 (8.0%) |
| $100,000 and over | 1,918 (88.6%) | 246 (11.4%) |
Public vs Private Health Insurance Coverage by Age in Brevard
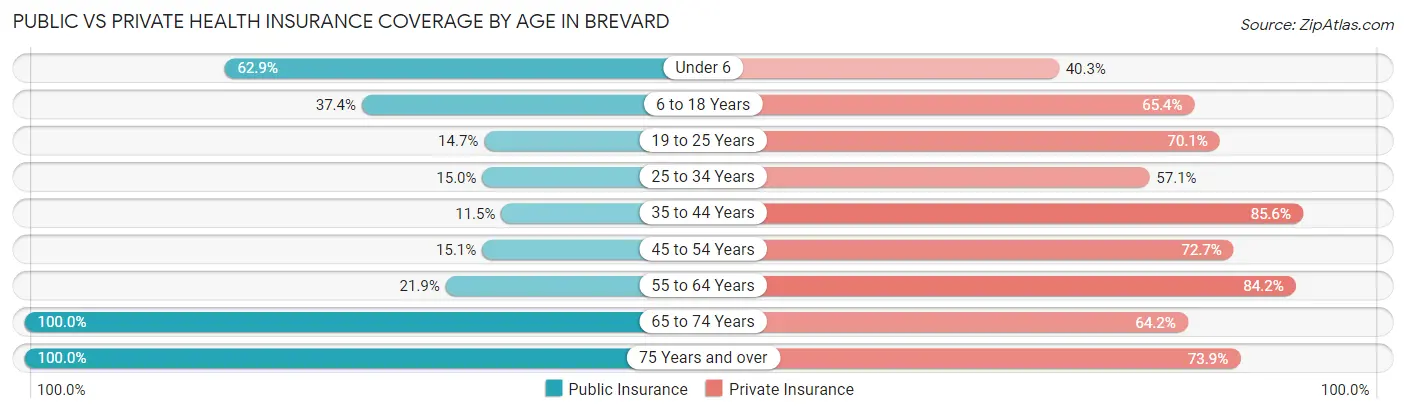
| Age Bracket | Public Insurance | Private Insurance |
| Under 6 | 239 (62.9%) | 153 (40.3%) |
| 6 to 18 Years | 303 (37.4%) | 530 (65.4%) |
| 19 to 25 Years | 123 (14.7%) | 587 (70.1%) |
| 25 to 34 Years | 109 (15.0%) | 414 (57.1%) |
| 35 to 44 Years | 63 (11.5%) | 468 (85.6%) |
| 45 to 54 Years | 146 (15.1%) | 704 (72.7%) |
| 55 to 64 Years | 205 (21.9%) | 790 (84.2%) |
| 65 to 74 Years | 1,178 (100.0%) | 756 (64.2%) |
| 75 Years and over | 1,023 (100.0%) | 756 (73.9%) |
| Total | 3,389 (45.8%) | 5,158 (69.7%) |
Disability Status by Sex by Age in Brevard
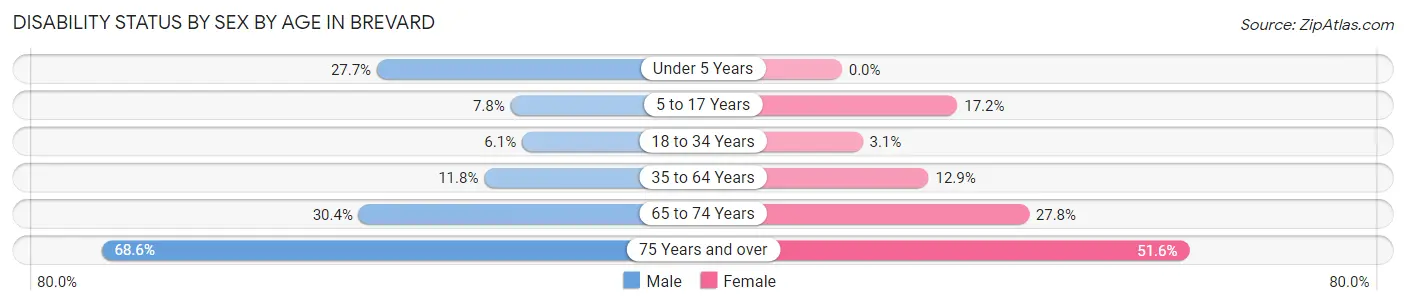
| Age Bracket | Male | Female |
| Under 5 Years | 62 (27.7%) | 0 (0.0%) |
| 5 to 17 Years | 25 (7.8%) | 71 (17.2%) |
| 18 to 34 Years | 54 (6.1%) | 26 (3.1%) |
| 35 to 64 Years | 114 (11.7%) | 191 (12.9%) |
| 65 to 74 Years | 161 (30.4%) | 180 (27.8%) |
| 75 Years and over | 227 (68.6%) | 357 (51.6%) |
Disability Class by Sex by Age in Brevard
Disability Class: Hearing Difficulty
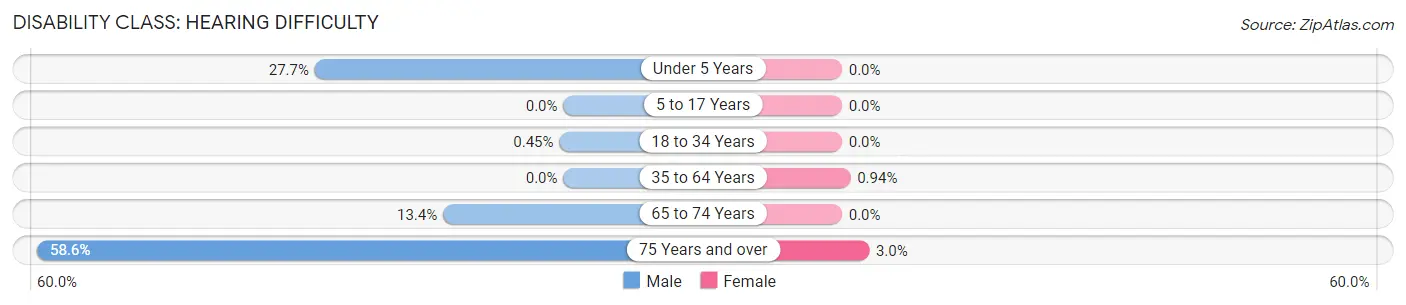
| Age Bracket | Male | Female |
| Under 5 Years | 62 (27.7%) | 0 (0.0%) |
| 5 to 17 Years | 0 (0.0%) | 0 (0.0%) |
| 18 to 34 Years | 4 (0.4%) | 0 (0.0%) |
| 35 to 64 Years | 0 (0.0%) | 14 (0.9%) |
| 65 to 74 Years | 71 (13.4%) | 0 (0.0%) |
| 75 Years and over | 194 (58.6%) | 21 (3.0%) |
Disability Class: Vision Difficulty
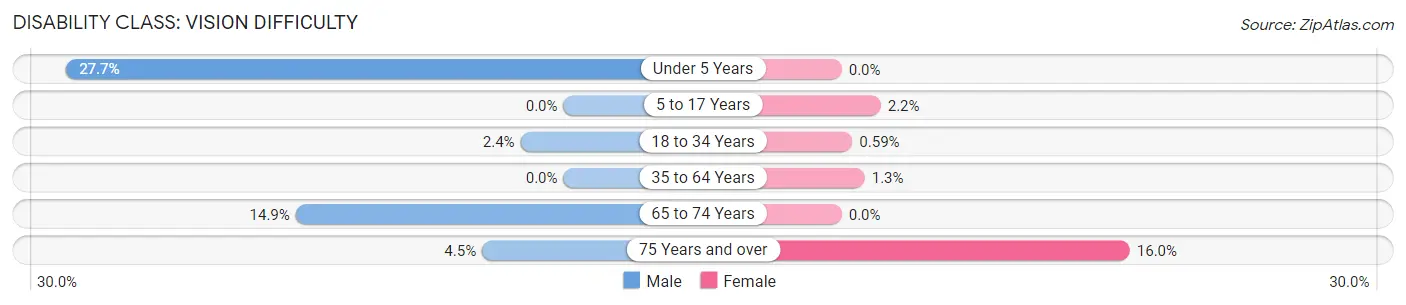
| Age Bracket | Male | Female |
| Under 5 Years | 62 (27.7%) | 0 (0.0%) |
| 5 to 17 Years | 0 (0.0%) | 9 (2.2%) |
| 18 to 34 Years | 21 (2.4%) | 5 (0.6%) |
| 35 to 64 Years | 0 (0.0%) | 19 (1.3%) |
| 65 to 74 Years | 79 (14.9%) | 0 (0.0%) |
| 75 Years and over | 15 (4.5%) | 111 (16.0%) |
Disability Class: Cognitive Difficulty
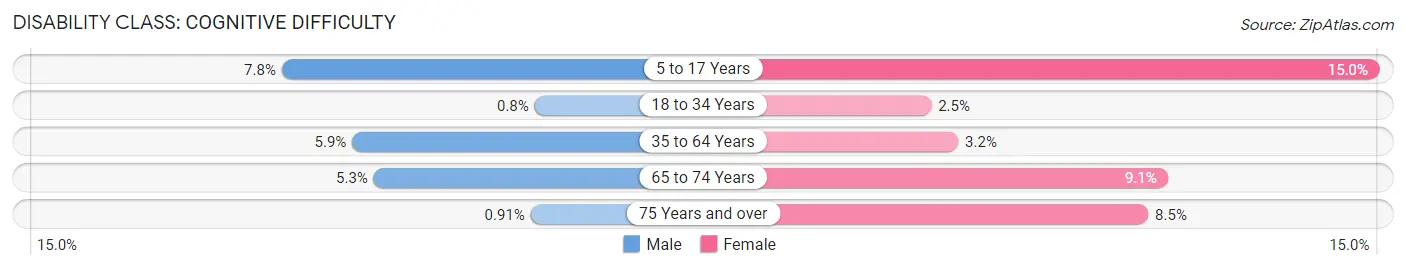
| Age Bracket | Male | Female |
| 5 to 17 Years | 25 (7.8%) | 62 (15.0%) |
| 18 to 34 Years | 7 (0.8%) | 21 (2.5%) |
| 35 to 64 Years | 57 (5.9%) | 48 (3.2%) |
| 65 to 74 Years | 28 (5.3%) | 59 (9.1%) |
| 75 Years and over | 3 (0.9%) | 59 (8.5%) |
Disability Class: Ambulatory Difficulty
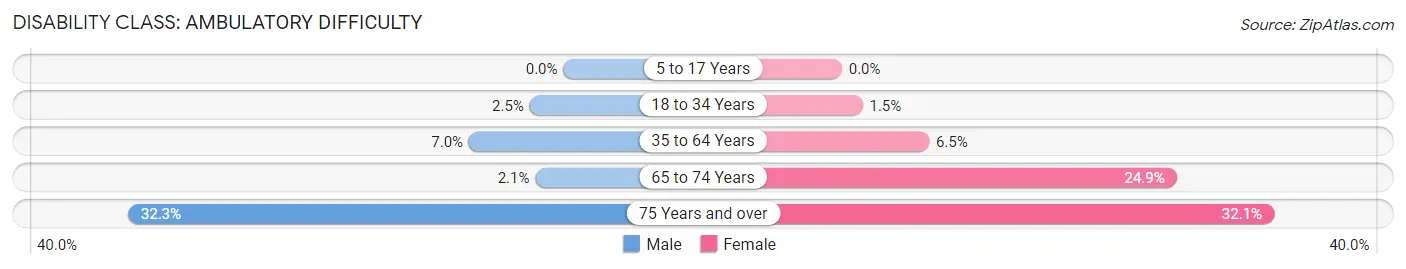
| Age Bracket | Male | Female |
| 5 to 17 Years | 0 (0.0%) | 0 (0.0%) |
| 18 to 34 Years | 22 (2.5%) | 13 (1.5%) |
| 35 to 64 Years | 68 (7.0%) | 96 (6.5%) |
| 65 to 74 Years | 11 (2.1%) | 161 (24.8%) |
| 75 Years and over | 107 (32.3%) | 222 (32.1%) |
Disability Class: Self-Care Difficulty
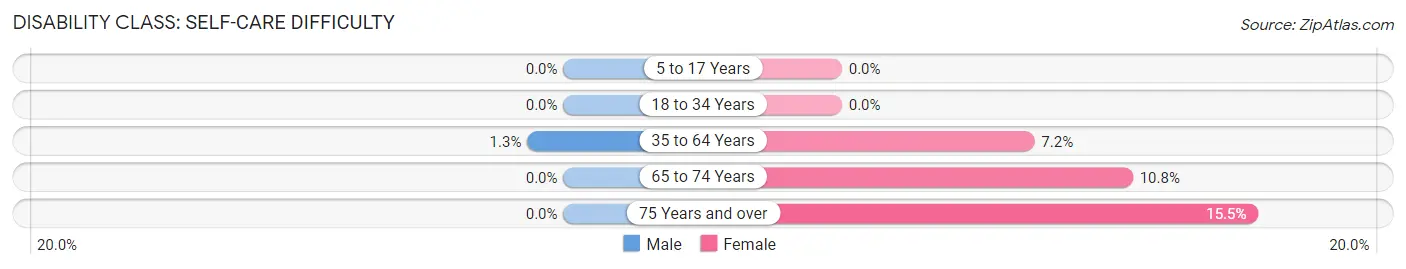
| Age Bracket | Male | Female |
| 5 to 17 Years | 0 (0.0%) | 0 (0.0%) |
| 18 to 34 Years | 0 (0.0%) | 0 (0.0%) |
| 35 to 64 Years | 13 (1.3%) | 106 (7.1%) |
| 65 to 74 Years | 0 (0.0%) | 70 (10.8%) |
| 75 Years and over | 0 (0.0%) | 107 (15.5%) |
Technology Access in Brevard
Computing Device Access in Brevard
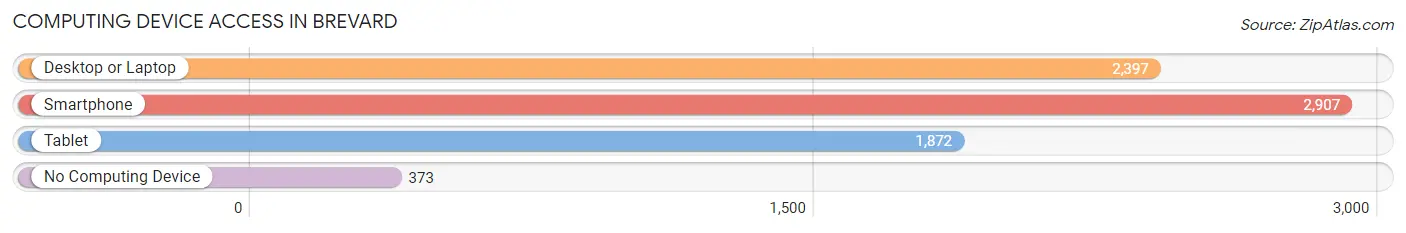
| Device Type | # Households | % Households |
| Desktop or Laptop | 2,397 | 66.2% |
| Smartphone | 2,907 | 80.3% |
| Tablet | 1,872 | 51.7% |
| No Computing Device | 373 | 10.3% |
| Total | 3,618 | 100.0% |
Internet Access in Brevard
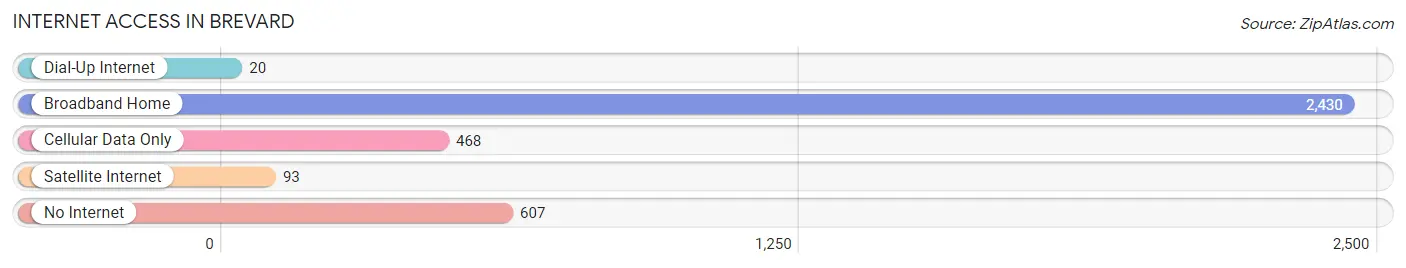
| Internet Type | # Households | % Households |
| Dial-Up Internet | 20 | 0.5% |
| Broadband Home | 2,430 | 67.2% |
| Cellular Data Only | 468 | 12.9% |
| Satellite Internet | 93 | 2.6% |
| No Internet | 607 | 16.8% |
| Total | 3,618 | 100.0% |
Brevard Summary
Introduction
Brevard, North Carolina is a small town located in the Blue Ridge Mountains of Transylvania County. It is known for its picturesque scenery, outdoor activities, and vibrant culture. The town has a population of 8,000 people and is the county seat of Transylvania County. Brevard is a popular tourist destination due to its proximity to the Pisgah National Forest, DuPont State Forest, and the Blue Ridge Parkway.
History
The town of Brevard was founded in 1855 by Colonel Ephraim Brevard, a Confederate veteran of the Civil War. He named the town after himself and it quickly became a popular destination for travelers and settlers. The town was incorporated in 1875 and the first post office was established in 1876.
The town grew steadily throughout the late 19th and early 20th centuries, becoming a popular tourist destination for its scenic beauty and outdoor activities. In the 1920s, the town was home to a thriving logging industry, which provided jobs for many of the town’s residents.
In the 1950s, the town began to experience a decline in population as many of its residents moved away in search of better job opportunities. However, the town has since experienced a resurgence in population and is now a popular tourist destination.
Geography
Brevard is located in the Blue Ridge Mountains of Transylvania County, North Carolina. The town is situated at an elevation of 2,000 feet and is surrounded by the Pisgah National Forest, DuPont State Forest, and the Blue Ridge Parkway. The town is located approximately 30 miles south of Asheville and is accessible via US Highway 64.
The town is located in a temperate climate zone and experiences mild winters and warm summers. The average annual temperature is around 60 degrees Fahrenheit and the average annual precipitation is around 50 inches.
Economy
The economy of Brevard is largely based on tourism and outdoor recreation. The town is home to a variety of outdoor activities, including hiking, biking, fishing, and camping. The town is also home to a number of art galleries, restaurants, and shops.
The town is also home to a number of manufacturing and technology companies, including Ecusta Paper Corporation, which produces paper products, and Olin Corporation, which produces chemicals. The town is also home to a number of healthcare facilities, including Transylvania Regional Hospital.
Demographics
As of the 2010 census, the population of Brevard was 8,000 people. The racial makeup of the town was 94.3% White, 2.2% African American, 0.7% Native American, 0.7% Asian, 0.2% Pacific Islander, and 1.9% from other races. The median household income was $37,000 and the median family income was $45,000.
Conclusion
Brevard, North Carolina is a small town located in the Blue Ridge Mountains of Transylvania County. It is known for its picturesque scenery, outdoor activities, and vibrant culture. The town has a population of 8,000 people and is the county seat of Transylvania County. Brevard is a popular tourist destination due to its proximity to the Pisgah National Forest, DuPont State Forest, and the Blue Ridge Parkway. The town’s economy is largely based on tourism and outdoor recreation, and it is home to a variety of manufacturing and technology companies. The town’s population is 94.3% White, 2.2% African American, 0.7% Native American, 0.7% Asian, 0.2% Pacific Islander, and 1.9% from other races.
Common Questions
What is Per Capita Income in Brevard?
Per Capita income in Brevard is $32,711.
What is the Median Family Income in Brevard?
Median Family Income in Brevard is $77,232.
What is the Median Household income in Brevard?
Median Household Income in Brevard is $42,843.
What is Income or Wage Gap in Brevard?
Income or Wage Gap in Brevard is 11.0%.
Women in Brevard earn 89.0 cents for every dollar earned by a man.
What is Family Income Deficit in Brevard?
Family Income Deficit in Brevard is $13,729.
Families that are below poverty line in Brevard earn $13,729 less on average than the poverty threshold level.
What is Inequality or Gini Index in Brevard?
Inequality or Gini Index in Brevard is 0.49.
What is the Total Population of Brevard?
Total Population of Brevard is 7,777.
What is the Total Male Population of Brevard?
Total Male Population of Brevard is 3,467.
What is the Total Female Population of Brevard?
Total Female Population of Brevard is 4,310.
What is the Ratio of Males per 100 Females in Brevard?
There are 80.44 Males per 100 Females in Brevard.
What is the Ratio of Females per 100 Males in Brevard?
There are 124.31 Females per 100 Males in Brevard.
What is the Median Population Age in Brevard?
Median Population Age in Brevard is 49.7 Years.
What is the Average Family Size in Brevard
Average Family Size in Brevard is 2.5 People.
What is the Average Household Size in Brevard
Average Household Size in Brevard is 1.9 People.
How Large is the Labor Force in Brevard?
There are 3,478 People in the Labor Forcein in Brevard.
What is the Percentage of People in the Labor Force in Brevard?
50.0% of People are in the Labor Force in Brevard.
What is the Unemployment Rate in Brevard?
Unemployment Rate in Brevard is 5.6%.