Plymouth, MA Map & Demographics
Plymouth Map
Plymouth Overview
$49,620
PER CAPITA INCOME
$111,161
AVG FAMILY INCOME
$74,500
AVG HOUSEHOLD INCOME
36.4%
WAGE / INCOME GAP [ % ]
63.6¢/ $1
WAGE / INCOME GAP [ $ ]
0.44
INEQUALITY / GINI INDEX
7,649
TOTAL POPULATION
3,794
MALE POPULATION
3,855
FEMALE POPULATION
98.42
MALES / 100 FEMALES
101.61
FEMALES / 100 MALES
45.0
MEDIAN AGE
2.9
AVG FAMILY SIZE
2.0
AVG HOUSEHOLD SIZE
4,764
LABOR FORCE [ PEOPLE ]
68.7%
PERCENT IN LABOR FORCE
6.0%
UNEMPLOYMENT RATE
Plymouth Zip Codes
Income in Plymouth
Income Overview in Plymouth
Per Capita Income in Plymouth is $49,620, while median incomes of families and households are $111,161 and $74,500 respectively.
| Characteristic | Number | Measure |
| Per Capita Income | 7,649 | $49,620 |
| Median Family Income | 1,559 | $111,161 |
| Mean Family Income | 1,559 | $123,838 |
| Median Household Income | 3,708 | $74,500 |
| Mean Household Income | 3,708 | $100,129 |
| Income Deficit | 1,559 | $0 |
| Wage / Income Gap (%) | 7,649 | 36.43% |
| Wage / Income Gap ($) | 7,649 | 63.57¢ per $1 |
| Gini / Inequality Index | 7,649 | 0.44 |
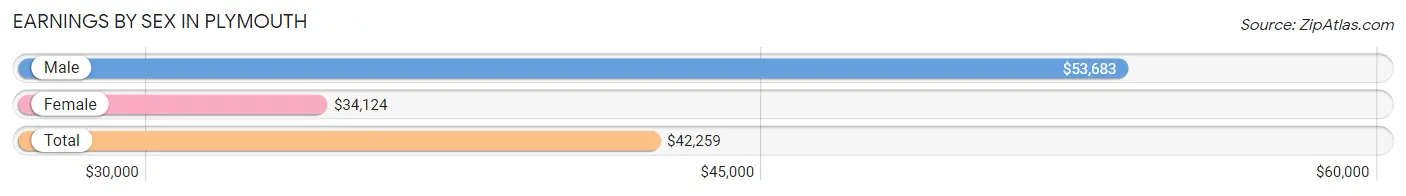
Earnings by Sex in Plymouth
Average Earnings in Plymouth are $42,259, $53,683 for men and $34,124 for women, a difference of 36.4%.
| Sex | Number | Average Earnings |
| Male | 2,557 (51.7%) | $53,683 |
| Female | 2,392 (48.3%) | $34,124 |
| Total | 4,949 (100.0%) | $42,259 |
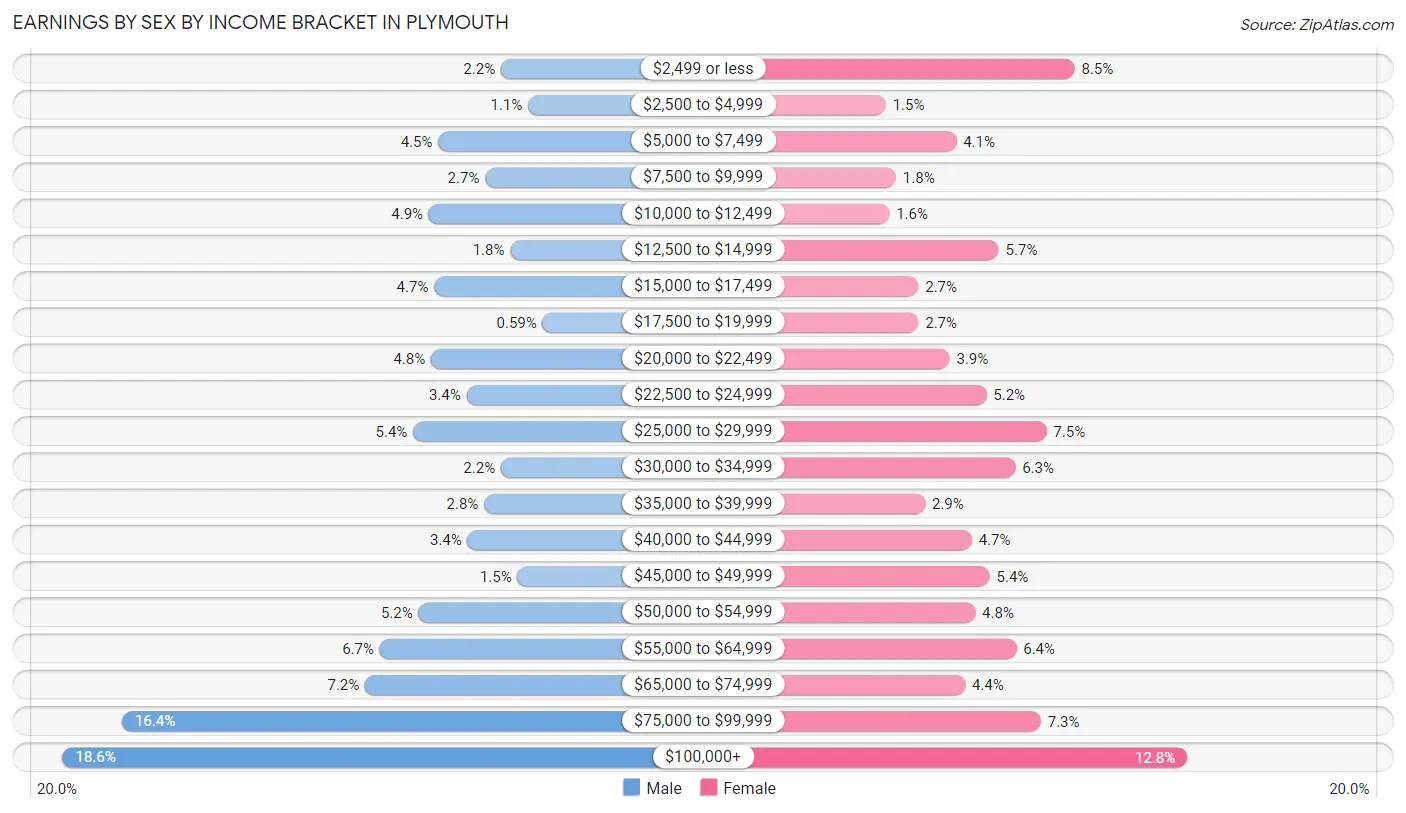
Earnings by Sex by Income Bracket in Plymouth
The most common earnings brackets in Plymouth are $100,000+ for men (475 | 18.6%) and $100,000+ for women (305 | 12.8%).
| Income | Male | Female |
| $2,499 or less | 55 (2.1%) | 204 (8.5%) |
| $2,500 to $4,999 | 29 (1.1%) | 35 (1.5%) |
| $5,000 to $7,499 | 115 (4.5%) | 98 (4.1%) |
| $7,500 to $9,999 | 70 (2.7%) | 44 (1.8%) |
| $10,000 to $12,499 | 124 (4.9%) | 38 (1.6%) |
| $12,500 to $14,999 | 46 (1.8%) | 136 (5.7%) |
| $15,000 to $17,499 | 119 (4.6%) | 64 (2.7%) |
| $17,500 to $19,999 | 15 (0.6%) | 64 (2.7%) |
| $20,000 to $22,499 | 122 (4.8%) | 92 (3.8%) |
| $22,500 to $24,999 | 88 (3.4%) | 125 (5.2%) |
| $25,000 to $29,999 | 139 (5.4%) | 179 (7.5%) |
| $30,000 to $34,999 | 55 (2.1%) | 151 (6.3%) |
| $35,000 to $39,999 | 71 (2.8%) | 70 (2.9%) |
| $40,000 to $44,999 | 87 (3.4%) | 112 (4.7%) |
| $45,000 to $49,999 | 39 (1.5%) | 128 (5.3%) |
| $50,000 to $54,999 | 134 (5.2%) | 115 (4.8%) |
| $55,000 to $64,999 | 171 (6.7%) | 152 (6.4%) |
| $65,000 to $74,999 | 185 (7.2%) | 106 (4.4%) |
| $75,000 to $99,999 | 418 (16.4%) | 174 (7.3%) |
| $100,000+ | 475 (18.6%) | 305 (12.8%) |
| Total | 2,557 (100.0%) | 2,392 (100.0%) |
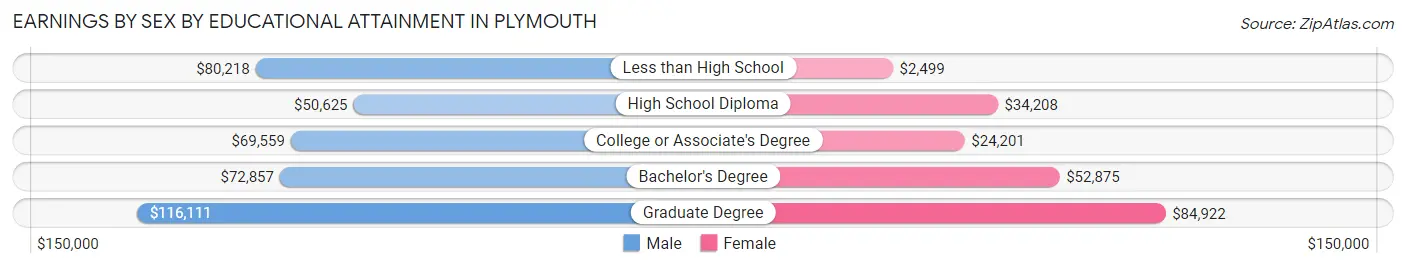
Earnings by Sex by Educational Attainment in Plymouth
Average earnings in Plymouth are $64,139 for men and $37,325 for women, a difference of 41.8%. Men with an educational attainment of graduate degree enjoy the highest average annual earnings of $116,111, while those with high school diploma education earn the least with $50,625. Women with an educational attainment of graduate degree earn the most with the average annual earnings of $84,922, while those with less than high school education have the smallest earnings of $2,499.
| Educational Attainment | Male Income | Female Income |
| Less than High School | $80,218 | $2,499 |
| High School Diploma | $50,625 | $34,208 |
| College or Associate's Degree | $69,559 | $24,201 |
| Bachelor's Degree | $72,857 | $52,875 |
| Graduate Degree | $116,111 | $84,922 |
| Total | $64,139 | $37,325 |
Family Income in Plymouth
Family Income Brackets in Plymouth
According to the Plymouth family income data, there are 408 families falling into the $100,000 to $149,999 income range, which is the most common income bracket and makes up 26.2% of all families.
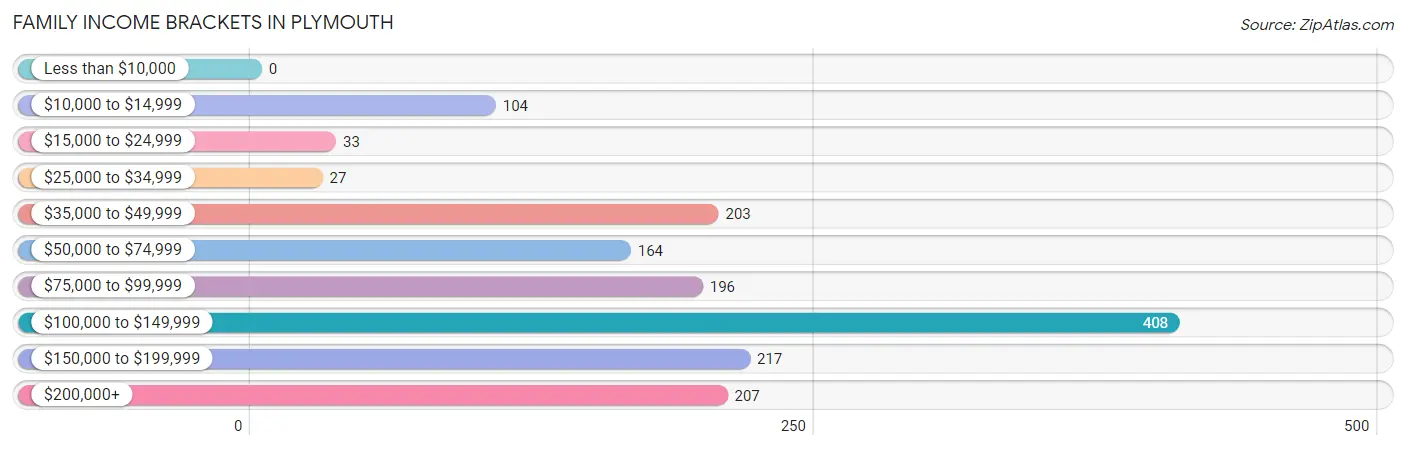
| Income Bracket | # Families | % Families |
| Less than $10,000 | 0 | 0.0% |
| $10,000 to $14,999 | 104 | 6.7% |
| $15,000 to $24,999 | 33 | 2.1% |
| $25,000 to $34,999 | 27 | 1.7% |
| $35,000 to $49,999 | 203 | 13.0% |
| $50,000 to $74,999 | 164 | 10.5% |
| $75,000 to $99,999 | 196 | 12.6% |
| $100,000 to $149,999 | 408 | 26.2% |
| $150,000 to $199,999 | 217 | 13.9% |
| $200,000+ | 207 | 13.3% |
Family Income by Famaliy Size in Plymouth
3-person families (360 | 23.1%) account for the highest median family income in Plymouth with $119,844 per family, while 2-person families (845 | 54.2%) have the highest median income of $46,272 per family member.
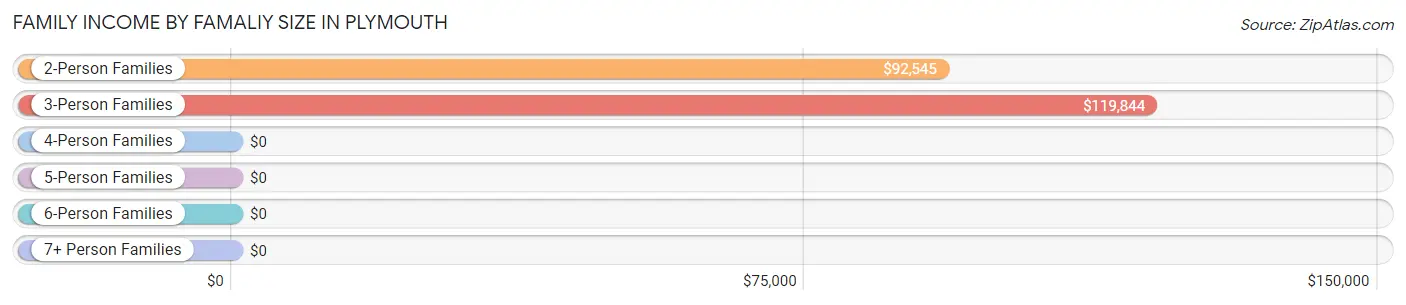
| Income Bracket | # Families | Median Income |
| 2-Person Families | 845 (54.2%) | $92,545 |
| 3-Person Families | 360 (23.1%) | $119,844 |
| 4-Person Families | 186 (11.9%) | $0 |
| 5-Person Families | 125 (8.0%) | $0 |
| 6-Person Families | 35 (2.2%) | $0 |
| 7+ Person Families | 8 (0.5%) | $0 |
| Total | 1,559 (100.0%) | $111,161 |
Family Income by Number of Earners in Plymouth
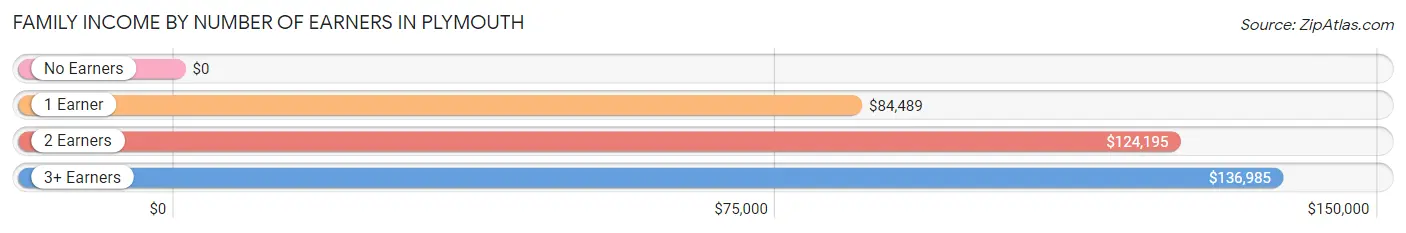
| Number of Earners | # Families | Median Income |
| No Earners | 203 (13.0%) | $0 |
| 1 Earner | 351 (22.5%) | $84,489 |
| 2 Earners | 854 (54.8%) | $124,195 |
| 3+ Earners | 151 (9.7%) | $136,985 |
| Total | 1,559 (100.0%) | $111,161 |
Household Income in Plymouth
Household Income Brackets in Plymouth
With 760 households falling in the category, the $100,000 to $149,999 income range is the most frequent in Plymouth, accounting for 20.5% of all households. In contrast, only 63 households (1.7%) fall into the less than $10,000 income bracket, making it the least populous group.
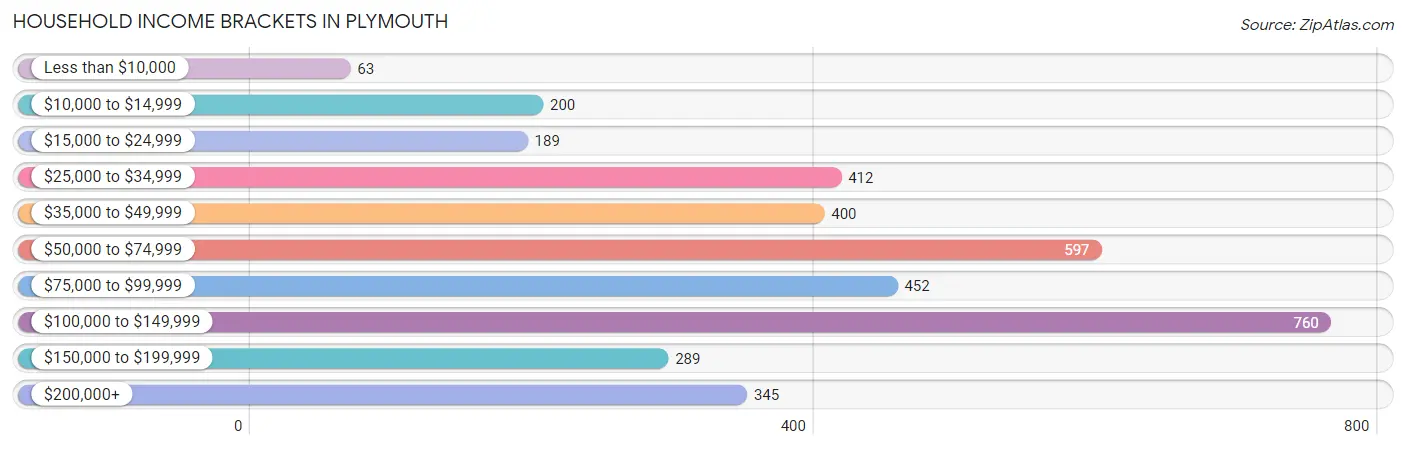
| Income Bracket | # Households | % Households |
| Less than $10,000 | 63 | 1.7% |
| $10,000 to $14,999 | 200 | 5.4% |
| $15,000 to $24,999 | 189 | 5.1% |
| $25,000 to $34,999 | 412 | 11.1% |
| $35,000 to $49,999 | 400 | 10.8% |
| $50,000 to $74,999 | 597 | 16.1% |
| $75,000 to $99,999 | 452 | 12.2% |
| $100,000 to $149,999 | 760 | 20.5% |
| $150,000 to $199,999 | 289 | 7.8% |
| $200,000+ | 345 | 9.3% |
Household Income by Householder Age in Plymouth
The median household income in Plymouth is $74,500, with the highest median household income of $90,909 found in the 45 to 64 years age bracket for the primary householder. A total of 1,300 households (35.1%) fall into this category.
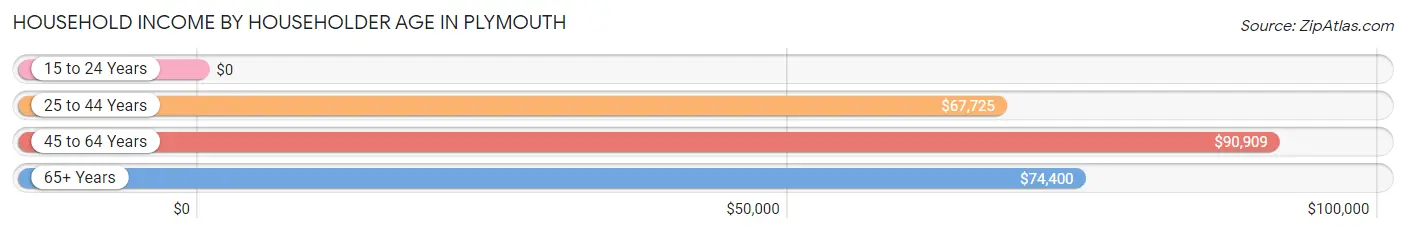
| Income Bracket | # Households | Median Income |
| 15 to 24 Years | 0 (0.0%) | $0 |
| 25 to 44 Years | 1,436 (38.7%) | $67,725 |
| 45 to 64 Years | 1,300 (35.1%) | $90,909 |
| 65+ Years | 972 (26.2%) | $74,400 |
| Total | 3,708 (100.0%) | $74,500 |
Poverty in Plymouth
Income Below Poverty by Sex and Age in Plymouth
With 6.6% poverty level for males and 11.9% for females among the residents of Plymouth, under 5 year old males and 16 and 17 year old females are the most vulnerable to poverty, with 26 males (47.3%) and 70 females (34.3%) in their respective age groups living below the poverty level.
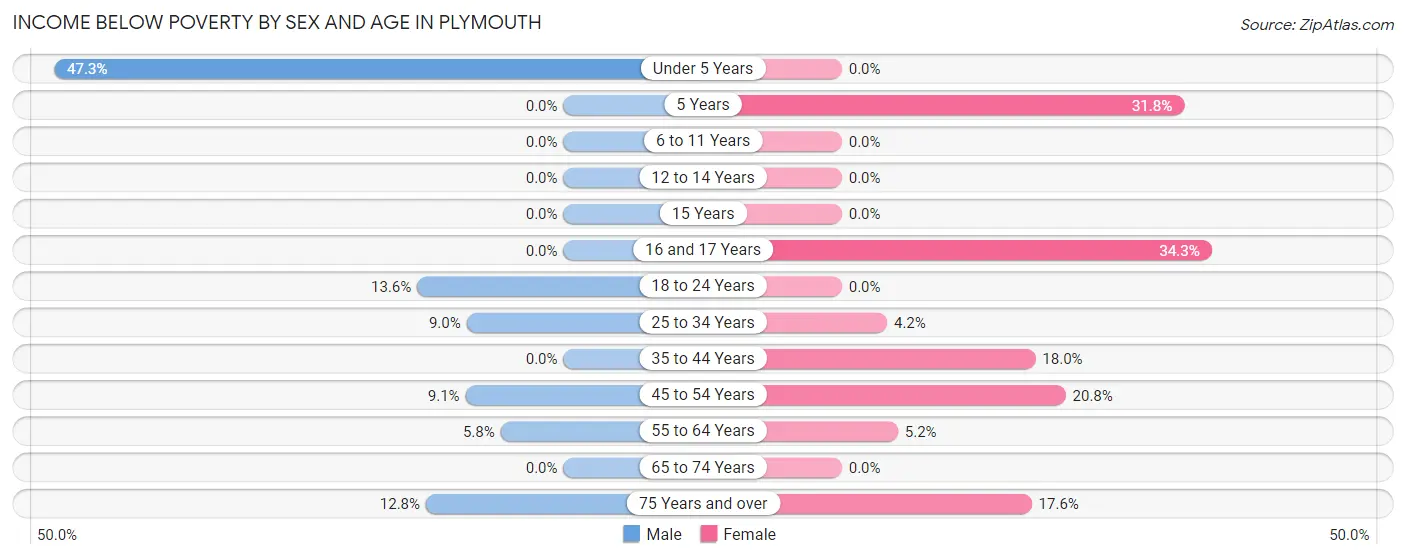
| Age Bracket | Male | Female |
| Under 5 Years | 26 (47.3%) | 0 (0.0%) |
| 5 Years | 0 (0.0%) | 27 (31.8%) |
| 6 to 11 Years | 0 (0.0%) | 0 (0.0%) |
| 12 to 14 Years | 0 (0.0%) | 0 (0.0%) |
| 15 Years | 0 (0.0%) | 0 (0.0%) |
| 16 and 17 Years | 0 (0.0%) | 70 (34.3%) |
| 18 to 24 Years | 49 (13.6%) | 0 (0.0%) |
| 25 to 34 Years | 60 (9.0%) | 23 (4.2%) |
| 35 to 44 Years | 0 (0.0%) | 106 (18.0%) |
| 45 to 54 Years | 39 (9.1%) | 124 (20.8%) |
| 55 to 64 Years | 38 (5.8%) | 26 (5.2%) |
| 65 to 74 Years | 0 (0.0%) | 0 (0.0%) |
| 75 Years and over | 31 (12.8%) | 71 (17.6%) |
| Total | 243 (6.6%) | 447 (11.9%) |
Income Above Poverty by Sex and Age in Plymouth
According to the poverty statistics in Plymouth, males aged 5 years and females aged under 5 years are the age groups that are most secure financially, with 100.0% of males and 100.0% of females in these age groups living above the poverty line.
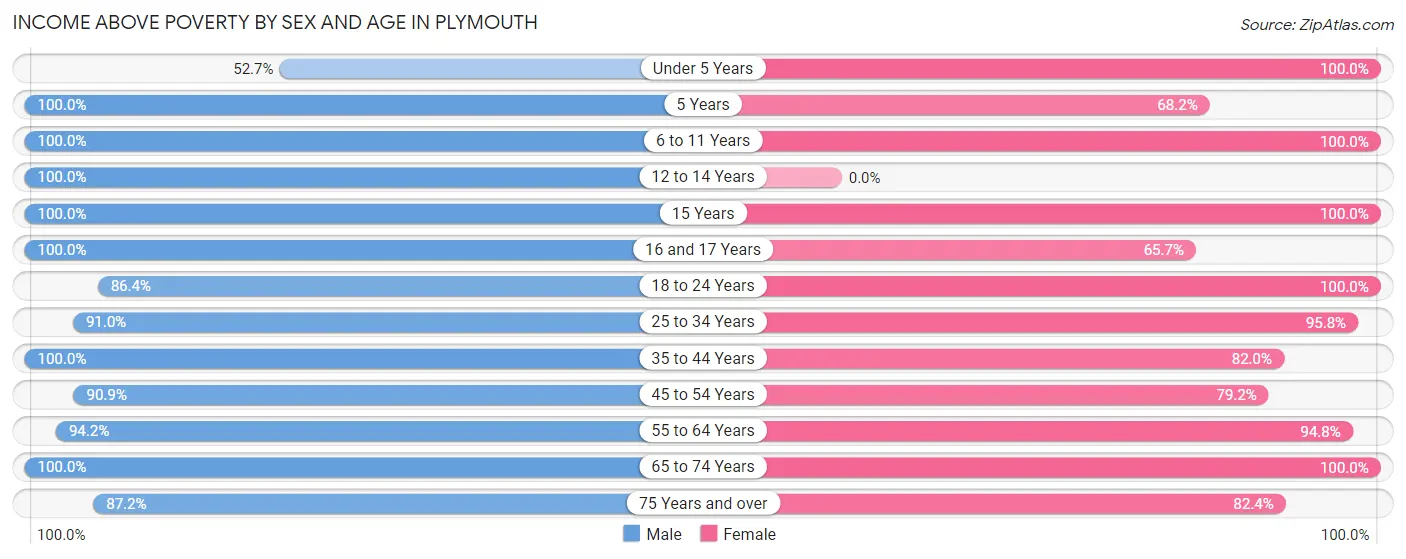
| Age Bracket | Male | Female |
| Under 5 Years | 29 (52.7%) | 138 (100.0%) |
| 5 Years | 46 (100.0%) | 58 (68.2%) |
| 6 to 11 Years | 162 (100.0%) | 18 (100.0%) |
| 12 to 14 Years | 70 (100.0%) | 0 (0.0%) |
| 15 Years | 83 (100.0%) | 57 (100.0%) |
| 16 and 17 Years | 68 (100.0%) | 134 (65.7%) |
| 18 to 24 Years | 312 (86.4%) | 219 (100.0%) |
| 25 to 34 Years | 608 (91.0%) | 525 (95.8%) |
| 35 to 44 Years | 453 (100.0%) | 484 (82.0%) |
| 45 to 54 Years | 390 (90.9%) | 473 (79.2%) |
| 55 to 64 Years | 614 (94.2%) | 474 (94.8%) |
| 65 to 74 Years | 385 (100.0%) | 405 (100.0%) |
| 75 Years and over | 212 (87.2%) | 332 (82.4%) |
| Total | 3,432 (93.4%) | 3,317 (88.1%) |
Income Below Poverty Among Married-Couple Families in Plymouth
The poverty statistics for married-couple families in Plymouth show that 4.8% or 56 of the total 1,169 families live below the poverty line. Families with 1 or 2 children have the highest poverty rate of 7.5%, comprising of 23 families. On the other hand, families with 3 or 4 children have the lowest poverty rate of 0.0%, which includes 0 families.
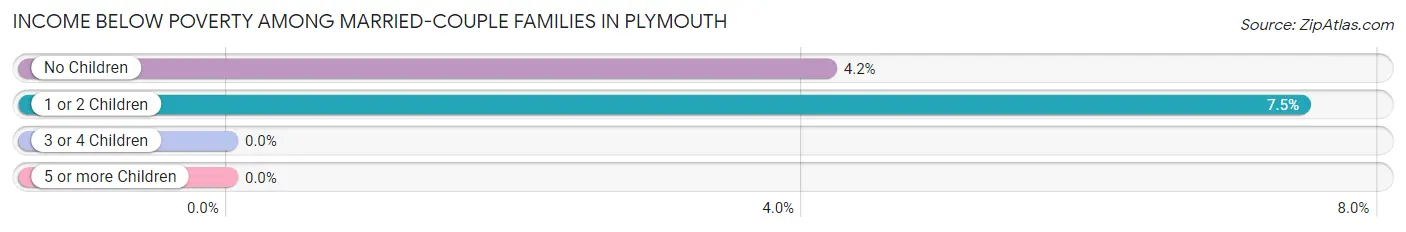
| Children | Above Poverty | Below Poverty |
| No Children | 759 (95.8%) | 33 (4.2%) |
| 1 or 2 Children | 285 (92.5%) | 23 (7.5%) |
| 3 or 4 Children | 69 (100.0%) | 0 (0.0%) |
| 5 or more Children | 0 (0.0%) | 0 (0.0%) |
| Total | 1,113 (95.2%) | 56 (4.8%) |
Income Below Poverty Among Single-Parent Households in Plymouth
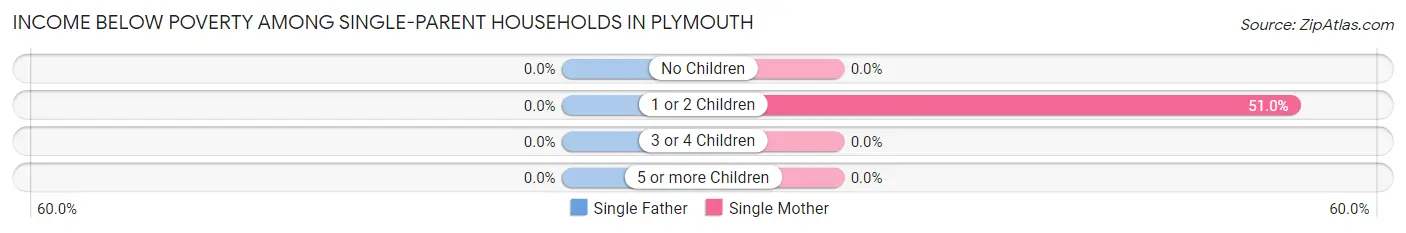
| Children | Single Father | Single Mother |
| No Children | 0 (0.0%) | 0 (0.0%) |
| 1 or 2 Children | 0 (0.0%) | 49 (51.0%) |
| 3 or 4 Children | 0 (0.0%) | 0 (0.0%) |
| 5 or more Children | 0 (0.0%) | 0 (0.0%) |
| Total | 0 (0.0%) | 49 (23.8%) |
Income Below Poverty Among Married-Couple vs Single-Parent Households in Plymouth
The poverty data for Plymouth shows that 56 of the married-couple family households (4.8%) and 49 of the single-parent households (12.6%) are living below the poverty level. Within the married-couple family households, those with 1 or 2 children have the highest poverty rate, with 23 households (7.5%) falling below the poverty line. Among the single-parent households, those with 1 or 2 children have the highest poverty rate, with 49 household (23.2%) living below poverty.
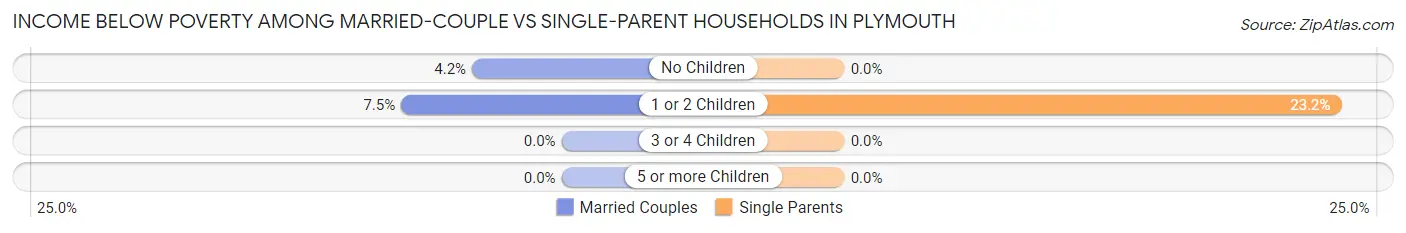
| Children | Married-Couple Families | Single-Parent Households |
| No Children | 33 (4.2%) | 0 (0.0%) |
| 1 or 2 Children | 23 (7.5%) | 49 (23.2%) |
| 3 or 4 Children | 0 (0.0%) | 0 (0.0%) |
| 5 or more Children | 0 (0.0%) | 0 (0.0%) |
| Total | 56 (4.8%) | 49 (12.6%) |
Race in Plymouth
The most populous races in Plymouth are White / Caucasian (6,390 | 83.5%), Two or more Races (712 | 9.3%), and Hispanic or Latino (482 | 6.3%).
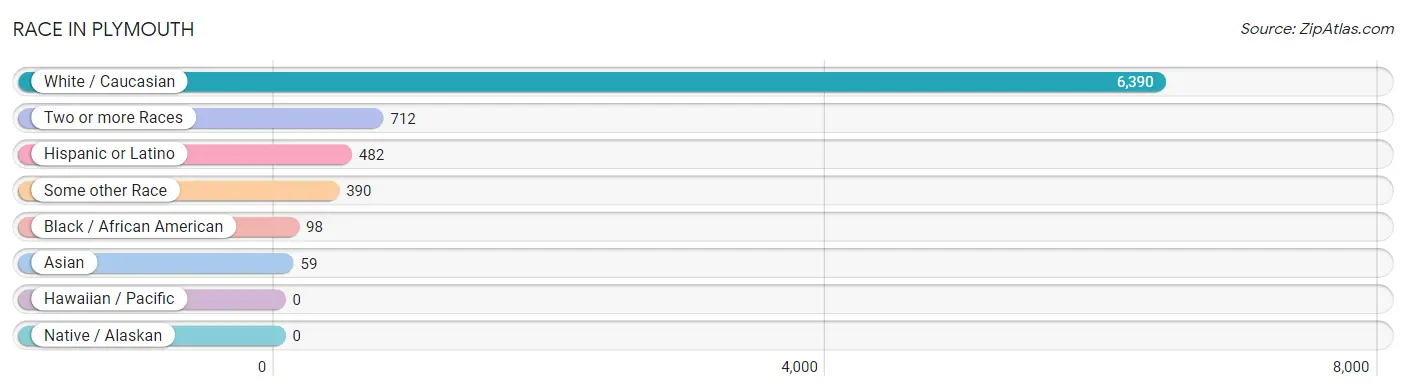
| Race | # Population | % Population |
| Asian | 59 | 0.8% |
| Black / African American | 98 | 1.3% |
| Hawaiian / Pacific | 0 | 0.0% |
| Hispanic or Latino | 482 | 6.3% |
| Native / Alaskan | 0 | 0.0% |
| White / Caucasian | 6,390 | 83.5% |
| Two or more Races | 712 | 9.3% |
| Some other Race | 390 | 5.1% |
| Total | 7,649 | 100.0% |
Ancestry in Plymouth
The most populous ancestries reported in Plymouth are Irish (2,096 | 27.4%), Italian (1,587 | 20.7%), English (1,310 | 17.1%), Portuguese (821 | 10.7%), and German (586 | 7.7%), together accounting for 83.7% of all Plymouth residents.
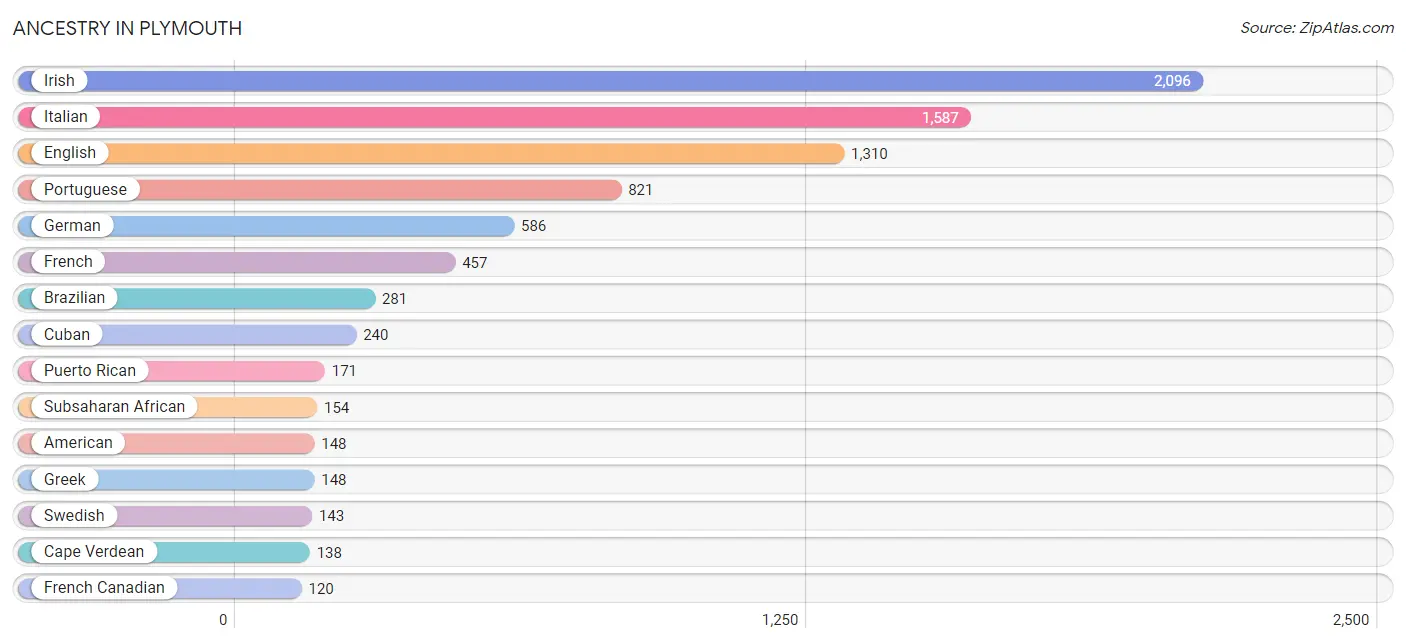
| Ancestry | # Population | % Population |
| American | 148 | 1.9% |
| Arab | 68 | 0.9% |
| Armenian | 17 | 0.2% |
| Blackfeet | 4 | 0.1% |
| Brazilian | 281 | 3.7% |
| Bulgarian | 25 | 0.3% |
| Canadian | 31 | 0.4% |
| Cape Verdean | 138 | 1.8% |
| Central American | 56 | 0.7% |
| Cuban | 240 | 3.1% |
| Dutch | 18 | 0.2% |
| Eastern European | 75 | 1.0% |
| Egyptian | 45 | 0.6% |
| English | 1,310 | 17.1% |
| European | 61 | 0.8% |
| Finnish | 35 | 0.5% |
| French | 457 | 6.0% |
| French Canadian | 120 | 1.6% |
| German | 586 | 7.7% |
| Greek | 148 | 1.9% |
| Honduran | 56 | 0.7% |
| Hungarian | 7 | 0.1% |
| Indian (Asian) | 44 | 0.6% |
| Irish | 2,096 | 27.4% |
| Italian | 1,587 | 20.7% |
| Jamaican | 17 | 0.2% |
| Japanese | 21 | 0.3% |
| Korean | 42 | 0.5% |
| Lebanese | 10 | 0.1% |
| Polish | 112 | 1.5% |
| Portuguese | 821 | 10.7% |
| Puerto Rican | 171 | 2.2% |
| Russian | 18 | 0.2% |
| Scotch-Irish | 37 | 0.5% |
| Scottish | 57 | 0.7% |
| Slavic | 9 | 0.1% |
| Spanish | 15 | 0.2% |
| Subsaharan African | 154 | 2.0% |
| Swedish | 143 | 1.9% |
| Ukrainian | 46 | 0.6% |
| Vietnamese | 54 | 0.7% |
| Welsh | 8 | 0.1% | View All 42 Rows |
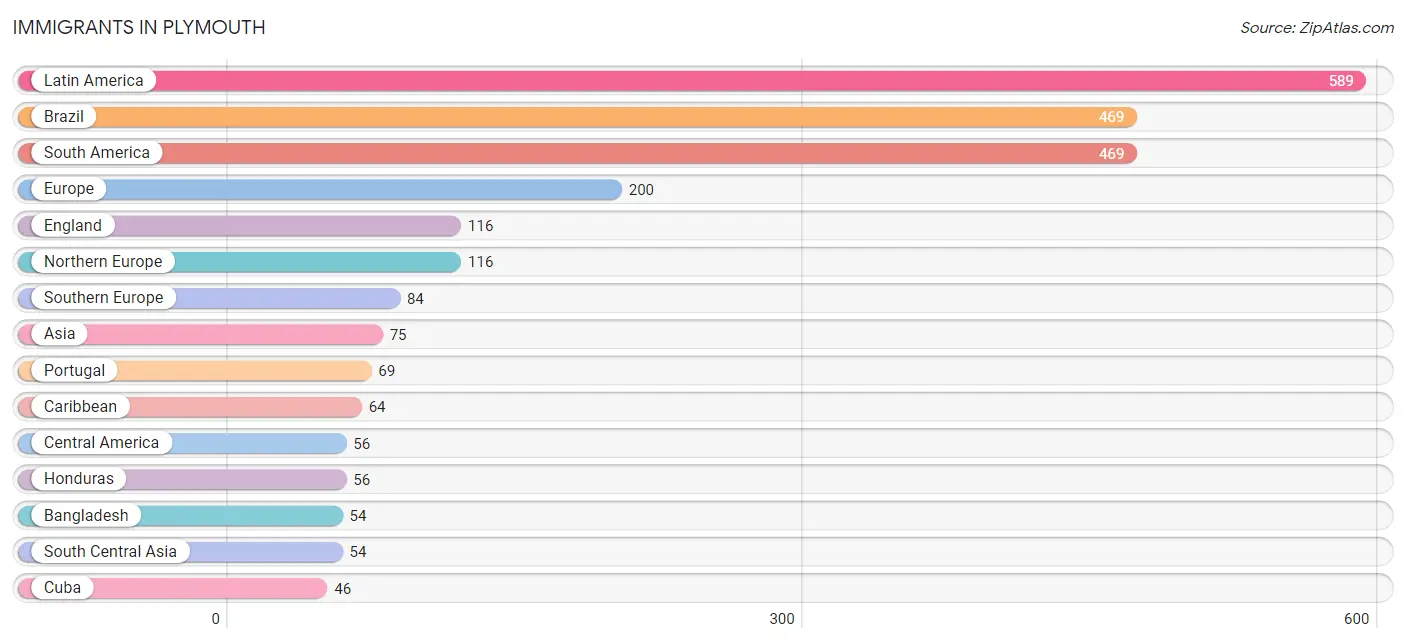
Immigrants in Plymouth
The most numerous immigrant groups reported in Plymouth came from Latin America (589 | 7.7%), Brazil (469 | 6.1%), South America (469 | 6.1%), Europe (200 | 2.6%), and England (116 | 1.5%), together accounting for 24.1% of all Plymouth residents.
| Immigration Origin | # Population | % Population |
| Africa | 13 | 0.2% |
| Asia | 75 | 1.0% |
| Bangladesh | 54 | 0.7% |
| Brazil | 469 | 6.1% |
| Cambodia | 21 | 0.3% |
| Canada | 23 | 0.3% |
| Caribbean | 64 | 0.8% |
| Central America | 56 | 0.7% |
| Cuba | 46 | 0.6% |
| England | 116 | 1.5% |
| Europe | 200 | 2.6% |
| Honduras | 56 | 0.7% |
| Italy | 15 | 0.2% |
| Latin America | 589 | 7.7% |
| Northern Africa | 13 | 0.2% |
| Northern Europe | 116 | 1.5% |
| Portugal | 69 | 0.9% |
| South America | 469 | 6.1% |
| South Central Asia | 54 | 0.7% |
| South Eastern Asia | 21 | 0.3% |
| Southern Europe | 84 | 1.1% | View All 21 Rows |
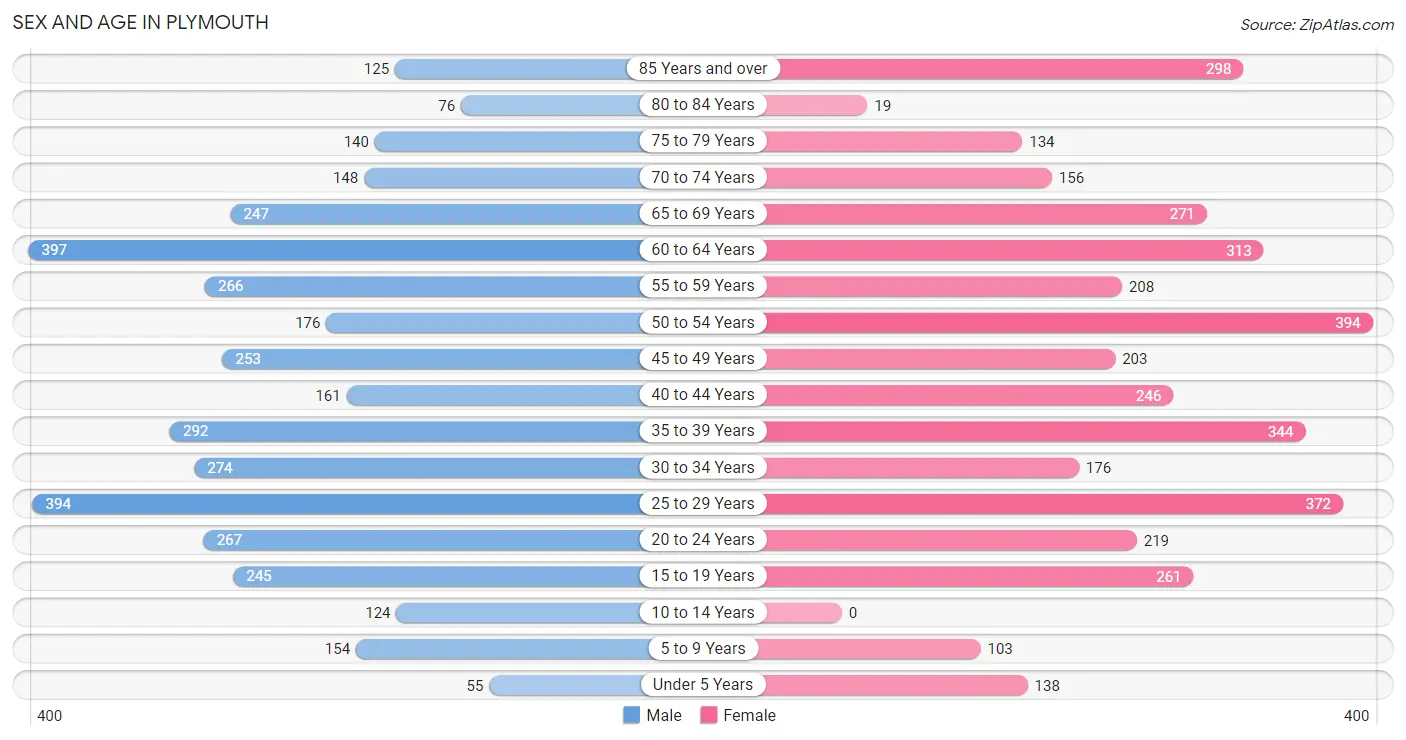
Sex and Age in Plymouth
Sex and Age in Plymouth
The most populous age groups in Plymouth are 60 to 64 Years (397 | 10.5%) for men and 50 to 54 Years (394 | 10.2%) for women.
| Age Bracket | Male | Female |
| Under 5 Years | 55 (1.5%) | 138 (3.6%) |
| 5 to 9 Years | 154 (4.1%) | 103 (2.7%) |
| 10 to 14 Years | 124 (3.3%) | 0 (0.0%) |
| 15 to 19 Years | 245 (6.5%) | 261 (6.8%) |
| 20 to 24 Years | 267 (7.0%) | 219 (5.7%) |
| 25 to 29 Years | 394 (10.4%) | 372 (9.7%) |
| 30 to 34 Years | 274 (7.2%) | 176 (4.6%) |
| 35 to 39 Years | 292 (7.7%) | 344 (8.9%) |
| 40 to 44 Years | 161 (4.2%) | 246 (6.4%) |
| 45 to 49 Years | 253 (6.7%) | 203 (5.3%) |
| 50 to 54 Years | 176 (4.6%) | 394 (10.2%) |
| 55 to 59 Years | 266 (7.0%) | 208 (5.4%) |
| 60 to 64 Years | 397 (10.5%) | 313 (8.1%) |
| 65 to 69 Years | 247 (6.5%) | 271 (7.0%) |
| 70 to 74 Years | 148 (3.9%) | 156 (4.1%) |
| 75 to 79 Years | 140 (3.7%) | 134 (3.5%) |
| 80 to 84 Years | 76 (2.0%) | 19 (0.5%) |
| 85 Years and over | 125 (3.3%) | 298 (7.7%) |
| Total | 3,794 (100.0%) | 3,855 (100.0%) |
Families and Households in Plymouth
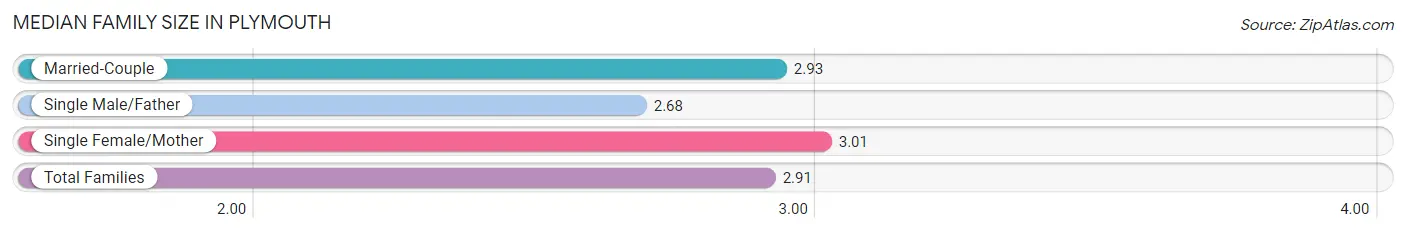
Median Family Size in Plymouth
The median family size in Plymouth is 2.91 persons per family, with single female/mother families (206 | 13.2%) accounting for the largest median family size of 3.01 persons per family. On the other hand, single male/father families (184 | 11.8%) represent the smallest median family size with 2.68 persons per family.
| Family Type | # Families | Family Size |
| Married-Couple | 1,169 (75.0%) | 2.93 |
| Single Male/Father | 184 (11.8%) | 2.68 |
| Single Female/Mother | 206 (13.2%) | 3.01 |
| Total Families | 1,559 (100.0%) | 2.91 |
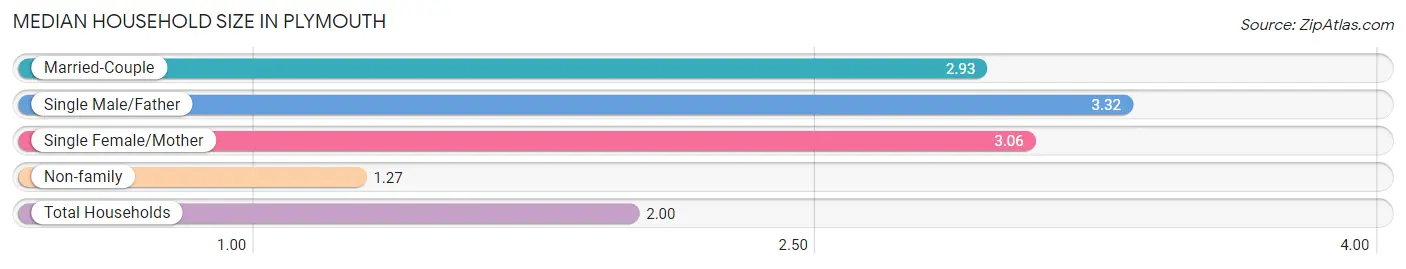
Median Household Size in Plymouth
The median household size in Plymouth is 2.00 persons per household, with single male/father households (184 | 5.0%) accounting for the largest median household size of 3.32 persons per household. non-family households (2,149 | 58.0%) represent the smallest median household size with 1.27 persons per household.
| Household Type | # Households | Household Size |
| Married-Couple | 1,169 (31.5%) | 2.93 |
| Single Male/Father | 184 (5.0%) | 3.32 |
| Single Female/Mother | 206 (5.6%) | 3.06 |
| Non-family | 2,149 (58.0%) | 1.27 |
| Total Households | 3,708 (100.0%) | 2.00 |
Household Size by Marriage Status in Plymouth
Out of a total of 3,708 households in Plymouth, 1,559 (42.0%) are family households, while 2,149 (58.0%) are nonfamily households. The most numerous type of family households are 2-person households, comprising 803, and the most common type of nonfamily households are 1-person households, comprising 1,688.
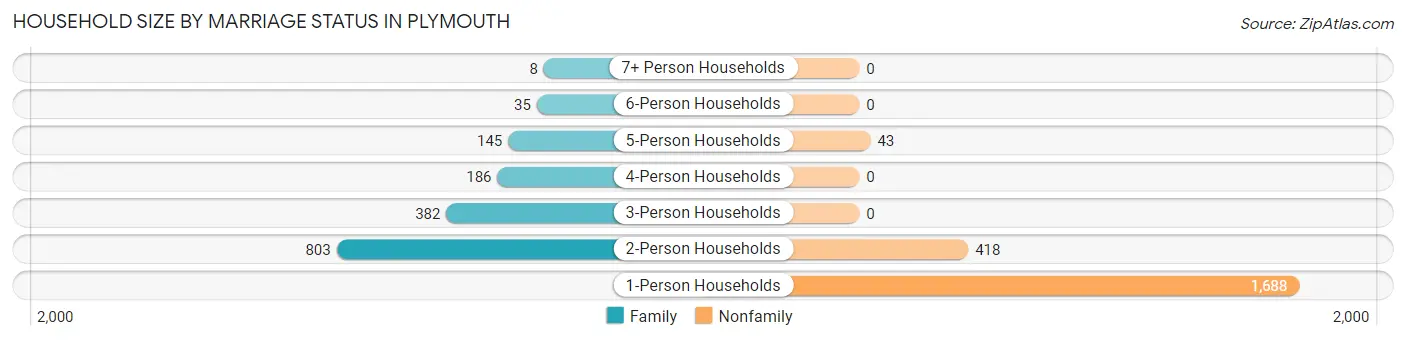
| Household Size | Family Households | Nonfamily Households |
| 1-Person Households | - | 1,688 (45.5%) |
| 2-Person Households | 803 (21.7%) | 418 (11.3%) |
| 3-Person Households | 382 (10.3%) | 0 (0.0%) |
| 4-Person Households | 186 (5.0%) | 0 (0.0%) |
| 5-Person Households | 145 (3.9%) | 43 (1.2%) |
| 6-Person Households | 35 (0.9%) | 0 (0.0%) |
| 7+ Person Households | 8 (0.2%) | 0 (0.0%) |
| Total | 1,559 (42.0%) | 2,149 (58.0%) |
Female Fertility in Plymouth
Fertility by Age in Plymouth
Average fertility rate in Plymouth is 26.0 births per 1,000 women. Women in the age bracket of 35 to 50 years have the highest fertility rate with 56.0 births per 1,000 women. Women in the age bracket of 35 to 50 years acount for 100.0% of all women with births.
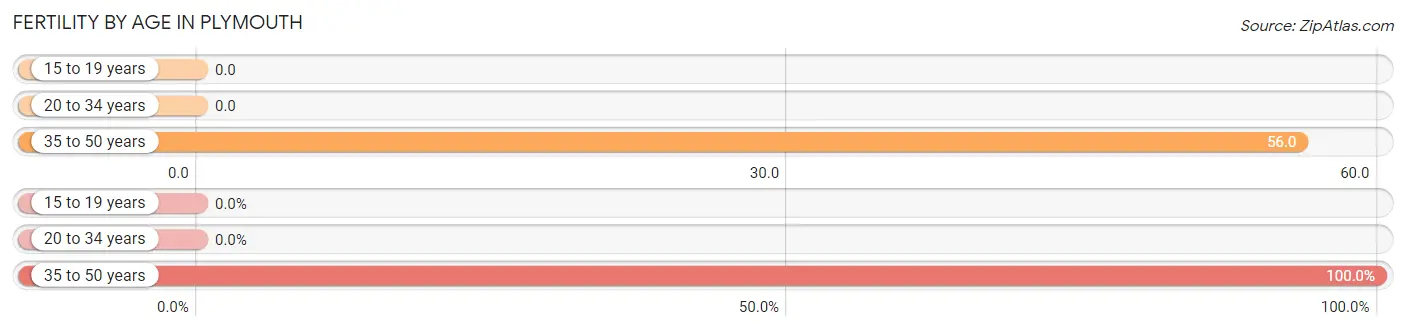
| Age Bracket | Women with Births | Births / 1,000 Women |
| 15 to 19 years | 0 (0.0%) | 0.0 |
| 20 to 34 years | 0 (0.0%) | 0.0 |
| 35 to 50 years | 51 (100.0%) | 56.0 |
| Total | 51 (100.0%) | 26.0 |
Fertility by Age by Marriage Status in Plymouth
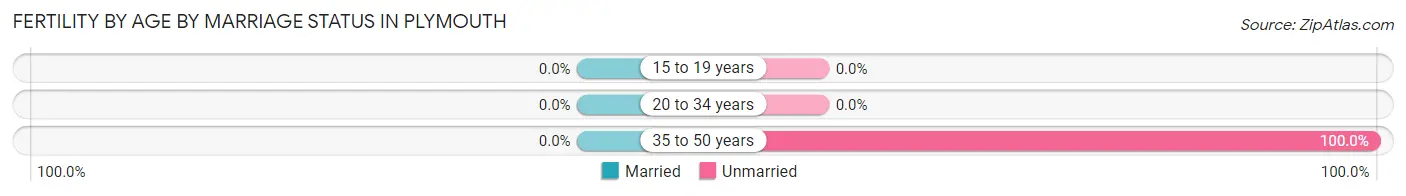
| Age Bracket | Married | Unmarried |
| 15 to 19 years | 0 (0.0%) | 0 (0.0%) |
| 20 to 34 years | 0 (0.0%) | 0 (0.0%) |
| 35 to 50 years | 0 (0.0%) | 51 (100.0%) |
| Total | 0 (0.0%) | 51 (100.0%) |
Fertility by Education in Plymouth
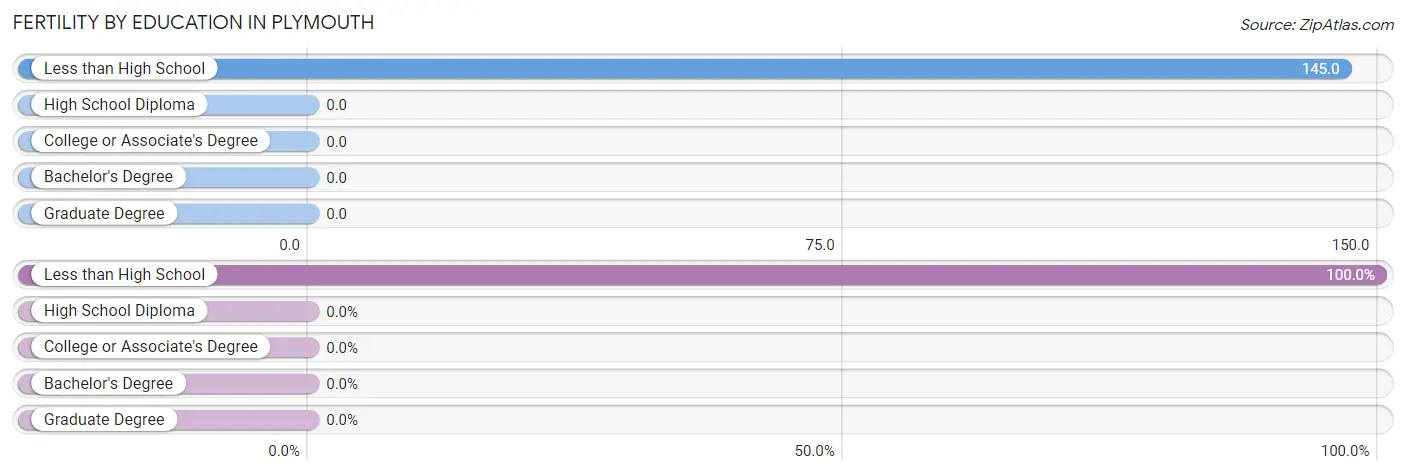
| Educational Attainment | Women with Births | Births / 1,000 Women |
| Less than High School | 51 (100.0%) | 145.0 |
| High School Diploma | 0 (0.0%) | 0.0 |
| College or Associate's Degree | 0 (0.0%) | 0.0 |
| Bachelor's Degree | 0 (0.0%) | 0.0 |
| Graduate Degree | 0 (0.0%) | 0.0 |
| Total | 51 (100.0%) | 26.0 |
Fertility by Education by Marriage Status in Plymouth
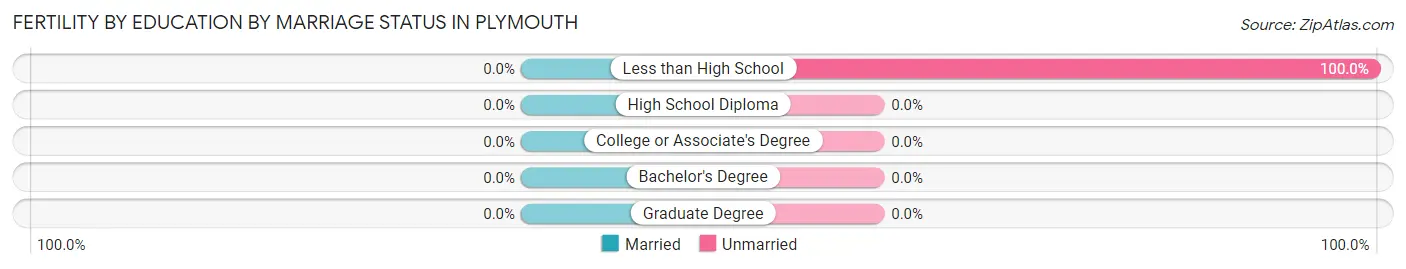
| Educational Attainment | Married | Unmarried |
| Less than High School | 0 (0.0%) | 51 (100.0%) |
| High School Diploma | 0 (0.0%) | 0 (0.0%) |
| College or Associate's Degree | 0 (0.0%) | 0 (0.0%) |
| Bachelor's Degree | 0 (0.0%) | 0 (0.0%) |
| Graduate Degree | 0 (0.0%) | 0 (0.0%) |
| Total | 0 (0.0%) | 51 (100.0%) |
Employment Characteristics in Plymouth
Employment by Class of Employer in Plymouth
Among the 4,446 employed individuals in Plymouth, private company employees (3,028 | 68.1%), not-for-profit organizations (442 | 9.9%), and self-employed (not incorporated) (317 | 7.1%) make up the most common classes of employment.
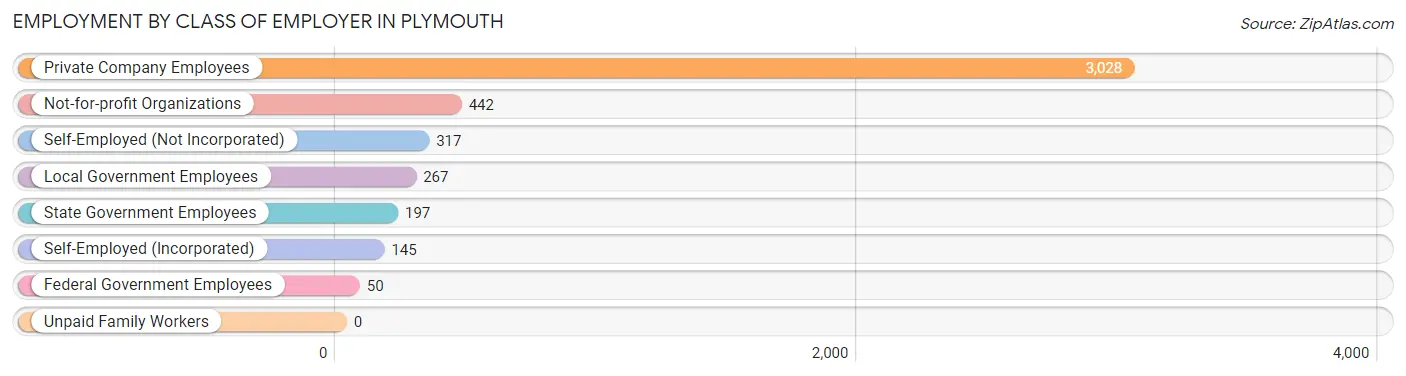
| Employer Class | # Employees | % Employees |
| Private Company Employees | 3,028 | 68.1% |
| Self-Employed (Incorporated) | 145 | 3.3% |
| Self-Employed (Not Incorporated) | 317 | 7.1% |
| Not-for-profit Organizations | 442 | 9.9% |
| Local Government Employees | 267 | 6.0% |
| State Government Employees | 197 | 4.4% |
| Federal Government Employees | 50 | 1.1% |
| Unpaid Family Workers | 0 | 0.0% |
| Total | 4,446 | 100.0% |
Employment Status by Age in Plymouth
According to the labor force statistics for Plymouth, out of the total population over 16 years of age (6,935), 68.7% or 4,764 individuals are in the labor force, with 6.0% or 286 of them unemployed. The age group with the highest labor force participation rate is 25 to 29 years, with 100.0% or 766 individuals in the labor force. Within the labor force, the 65 to 74 years age range has the highest percentage of unemployed individuals, with 12.3% or 50 of them being unemployed.
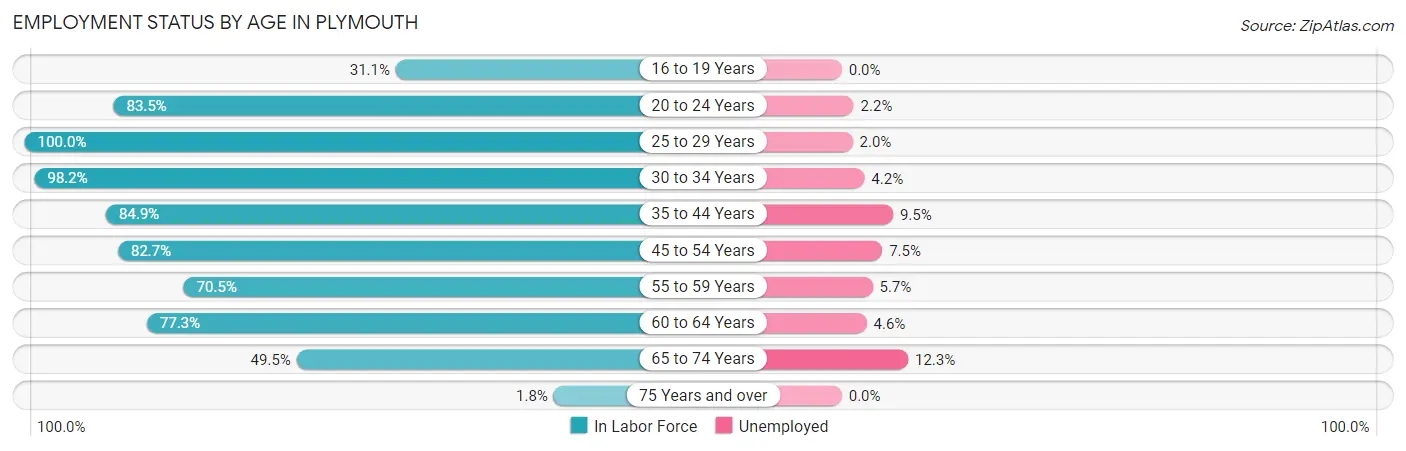
| Age Bracket | In Labor Force | Unemployed |
| 16 to 19 Years | 114 (31.1%) | 0 (0.0%) |
| 20 to 24 Years | 406 (83.5%) | 9 (2.2%) |
| 25 to 29 Years | 766 (100.0%) | 15 (2.0%) |
| 30 to 34 Years | 442 (98.2%) | 19 (4.2%) |
| 35 to 44 Years | 886 (84.9%) | 84 (9.5%) |
| 45 to 54 Years | 849 (82.7%) | 64 (7.5%) |
| 55 to 59 Years | 334 (70.5%) | 19 (5.7%) |
| 60 to 64 Years | 549 (77.3%) | 25 (4.6%) |
| 65 to 74 Years | 407 (49.5%) | 50 (12.3%) |
| 75 Years and over | 14 (1.8%) | 0 (0.0%) |
| Total | 4,764 (68.7%) | 286 (6.0%) |
Employment Status by Educational Attainment in Plymouth
According to labor force statistics for Plymouth, 85.6% of individuals (3,825) out of the total population between 25 and 64 years of age (4,469) are in the labor force, with 5.9% or 226 of them being unemployed. The group with the highest labor force participation rate are those with the educational attainment of bachelor's degree or higher, with 97.1% or 1,692 individuals in the labor force. Within the labor force, individuals with college / associate degree education have the highest percentage of unemployment, with 13.5% or 107 of them being unemployed.
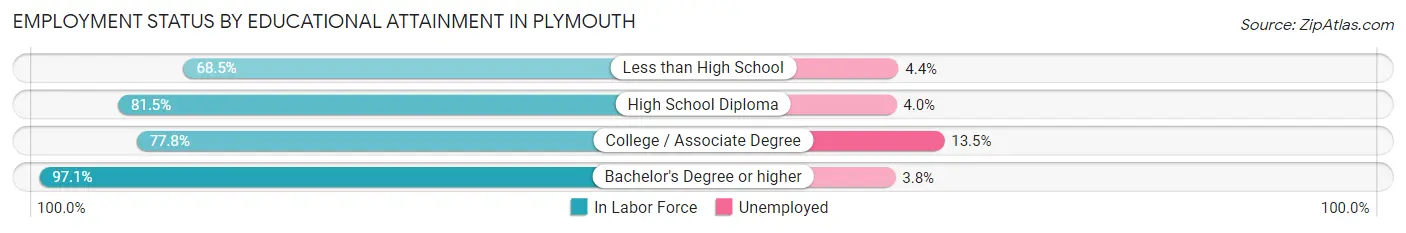
| Educational Attainment | In Labor Force | Unemployed |
| Less than High School | 272 (68.5%) | 17 (4.4%) |
| High School Diploma | 1,068 (81.5%) | 52 (4.0%) |
| College / Associate Degree | 793 (77.8%) | 138 (13.5%) |
| Bachelor's Degree or higher | 1,692 (97.1%) | 66 (3.8%) |
| Total | 3,825 (85.6%) | 264 (5.9%) |
Employment Occupations by Sex in Plymouth
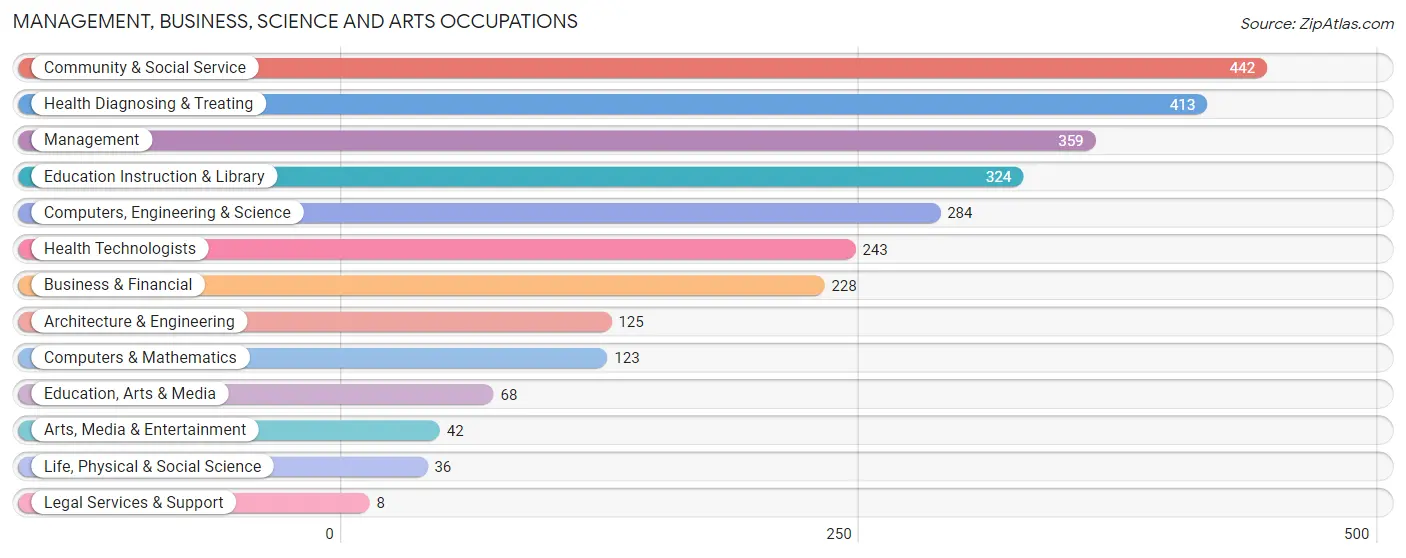
Management, Business, Science and Arts Occupations
The most common Management, Business, Science and Arts occupations in Plymouth are Community & Social Service (442 | 9.9%), Health Diagnosing & Treating (413 | 9.2%), Management (359 | 8.0%), Education Instruction & Library (324 | 7.2%), and Computers, Engineering & Science (284 | 6.4%).
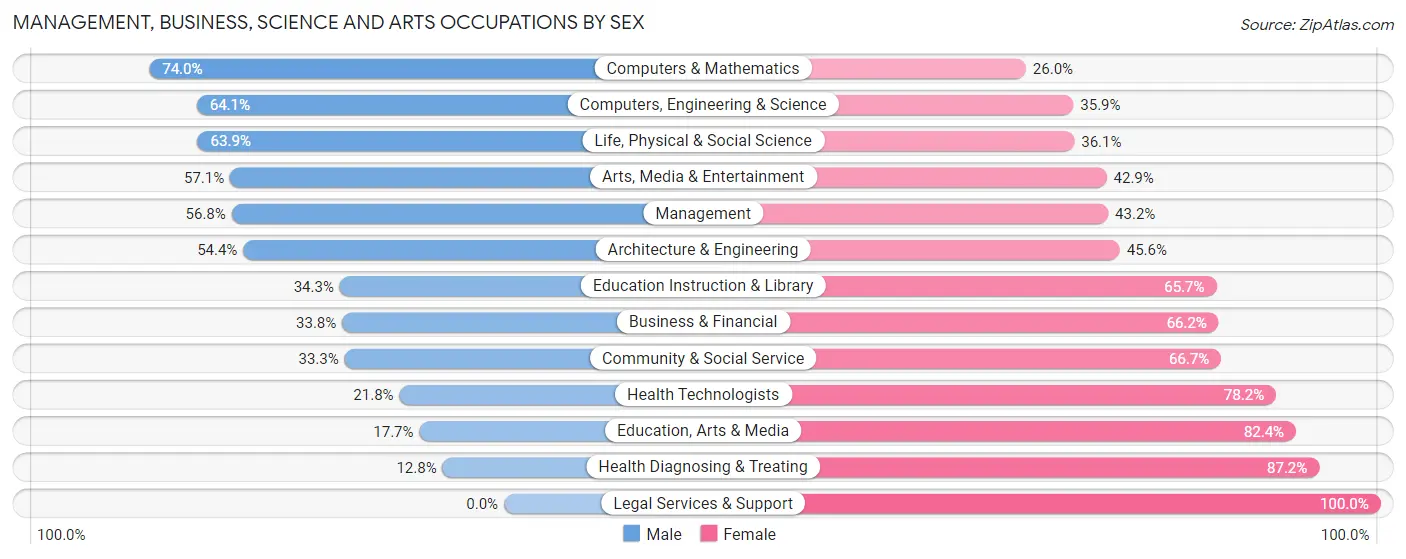
Management, Business, Science and Arts Occupations by Sex
Within the Management, Business, Science and Arts occupations in Plymouth, the most male-oriented occupations are Computers & Mathematics (74.0%), Computers, Engineering & Science (64.1%), and Life, Physical & Social Science (63.9%), while the most female-oriented occupations are Legal Services & Support (100.0%), Health Diagnosing & Treating (87.2%), and Education, Arts & Media (82.4%).
| Occupation | Male | Female |
| Management | 204 (56.8%) | 155 (43.2%) |
| Business & Financial | 77 (33.8%) | 151 (66.2%) |
| Computers, Engineering & Science | 182 (64.1%) | 102 (35.9%) |
| Computers & Mathematics | 91 (74.0%) | 32 (26.0%) |
| Architecture & Engineering | 68 (54.4%) | 57 (45.6%) |
| Life, Physical & Social Science | 23 (63.9%) | 13 (36.1%) |
| Community & Social Service | 147 (33.3%) | 295 (66.7%) |
| Education, Arts & Media | 12 (17.6%) | 56 (82.4%) |
| Legal Services & Support | 0 (0.0%) | 8 (100.0%) |
| Education Instruction & Library | 111 (34.3%) | 213 (65.7%) |
| Arts, Media & Entertainment | 24 (57.1%) | 18 (42.9%) |
| Health Diagnosing & Treating | 53 (12.8%) | 360 (87.2%) |
| Health Technologists | 53 (21.8%) | 190 (78.2%) |
| Total (Category) | 663 (38.4%) | 1,063 (61.6%) |
| Total (Overall) | 2,396 (53.6%) | 2,074 (46.4%) |
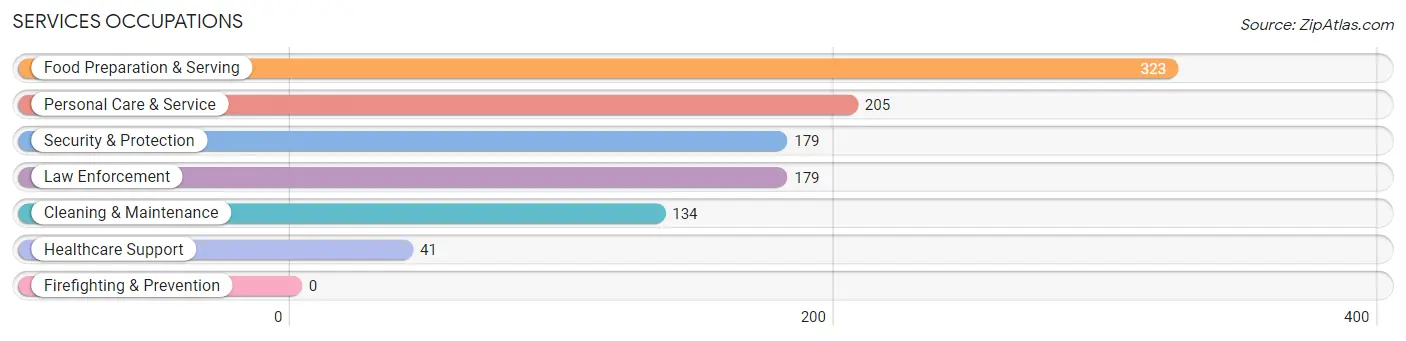
Services Occupations
The most common Services occupations in Plymouth are Food Preparation & Serving (323 | 7.2%), Personal Care & Service (205 | 4.6%), Security & Protection (179 | 4.0%), Law Enforcement (179 | 4.0%), and Cleaning & Maintenance (134 | 3.0%).
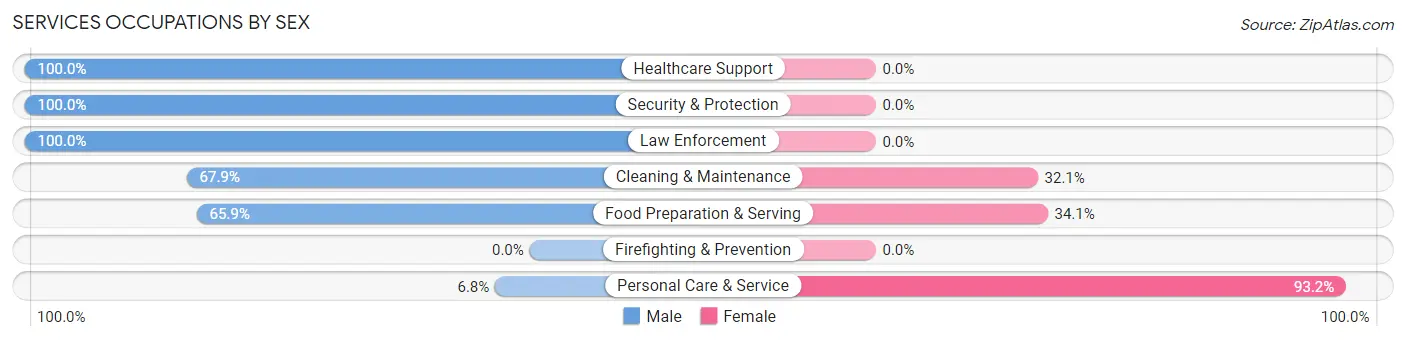
Services Occupations by Sex
Within the Services occupations in Plymouth, the most male-oriented occupations are Healthcare Support (100.0%), Security & Protection (100.0%), and Law Enforcement (100.0%), while the most female-oriented occupations are Personal Care & Service (93.2%), Food Preparation & Serving (34.1%), and Cleaning & Maintenance (32.1%).
| Occupation | Male | Female |
| Healthcare Support | 41 (100.0%) | 0 (0.0%) |
| Security & Protection | 179 (100.0%) | 0 (0.0%) |
| Firefighting & Prevention | 0 (0.0%) | 0 (0.0%) |
| Law Enforcement | 179 (100.0%) | 0 (0.0%) |
| Food Preparation & Serving | 213 (65.9%) | 110 (34.1%) |
| Cleaning & Maintenance | 91 (67.9%) | 43 (32.1%) |
| Personal Care & Service | 14 (6.8%) | 191 (93.2%) |
| Total (Category) | 538 (61.0%) | 344 (39.0%) |
| Total (Overall) | 2,396 (53.6%) | 2,074 (46.4%) |
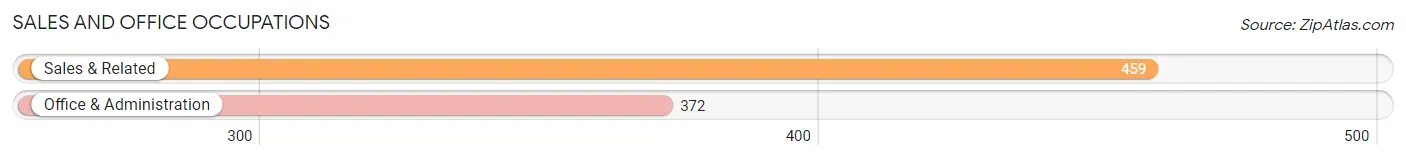
Sales and Office Occupations
The most common Sales and Office occupations in Plymouth are Sales & Related (459 | 10.3%), and Office & Administration (372 | 8.3%).
Sales and Office Occupations by Sex
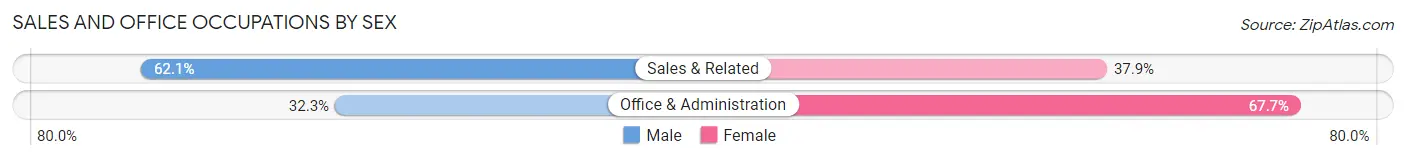
| Occupation | Male | Female |
| Sales & Related | 285 (62.1%) | 174 (37.9%) |
| Office & Administration | 120 (32.3%) | 252 (67.7%) |
| Total (Category) | 405 (48.7%) | 426 (51.3%) |
| Total (Overall) | 2,396 (53.6%) | 2,074 (46.4%) |
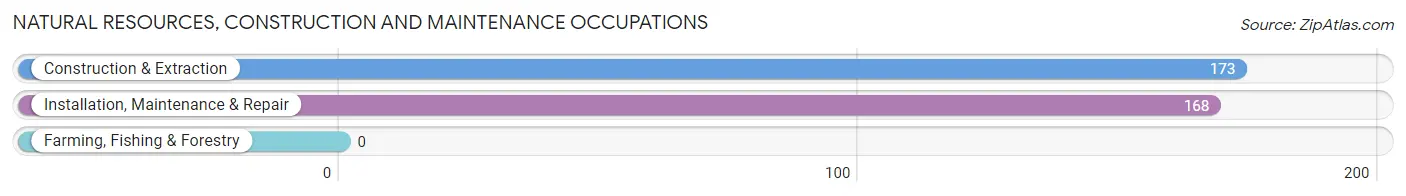
Natural Resources, Construction and Maintenance Occupations
The most common Natural Resources, Construction and Maintenance occupations in Plymouth are Construction & Extraction (173 | 3.9%), and Installation, Maintenance & Repair (168 | 3.8%).
Natural Resources, Construction and Maintenance Occupations by Sex
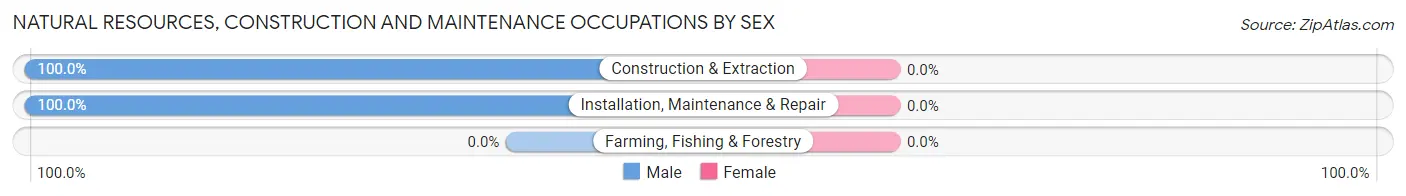
| Occupation | Male | Female |
| Farming, Fishing & Forestry | 0 (0.0%) | 0 (0.0%) |
| Construction & Extraction | 173 (100.0%) | 0 (0.0%) |
| Installation, Maintenance & Repair | 168 (100.0%) | 0 (0.0%) |
| Total (Category) | 341 (100.0%) | 0 (0.0%) |
| Total (Overall) | 2,396 (53.6%) | 2,074 (46.4%) |
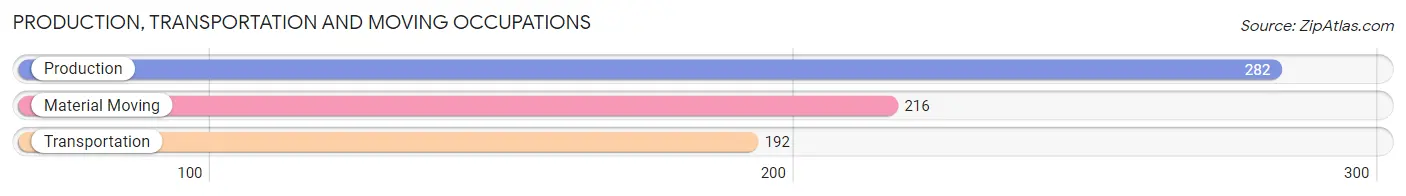
Production, Transportation and Moving Occupations
The most common Production, Transportation and Moving occupations in Plymouth are Production (282 | 6.3%), Material Moving (216 | 4.8%), and Transportation (192 | 4.3%).
Production, Transportation and Moving Occupations by Sex
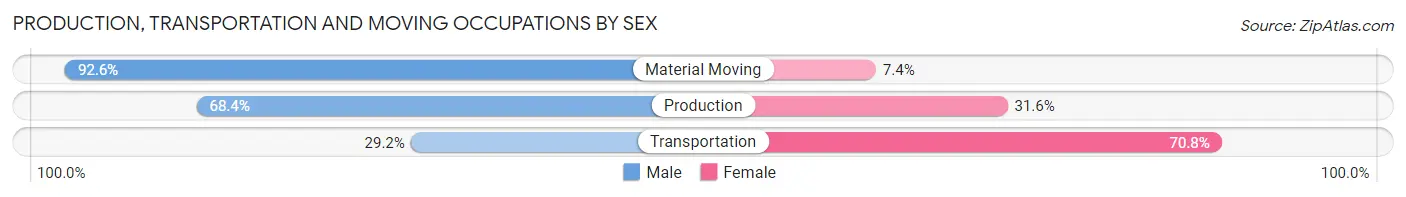
| Occupation | Male | Female |
| Production | 193 (68.4%) | 89 (31.6%) |
| Transportation | 56 (29.2%) | 136 (70.8%) |
| Material Moving | 200 (92.6%) | 16 (7.4%) |
| Total (Category) | 449 (65.1%) | 241 (34.9%) |
| Total (Overall) | 2,396 (53.6%) | 2,074 (46.4%) |
Employment Industries by Sex in Plymouth
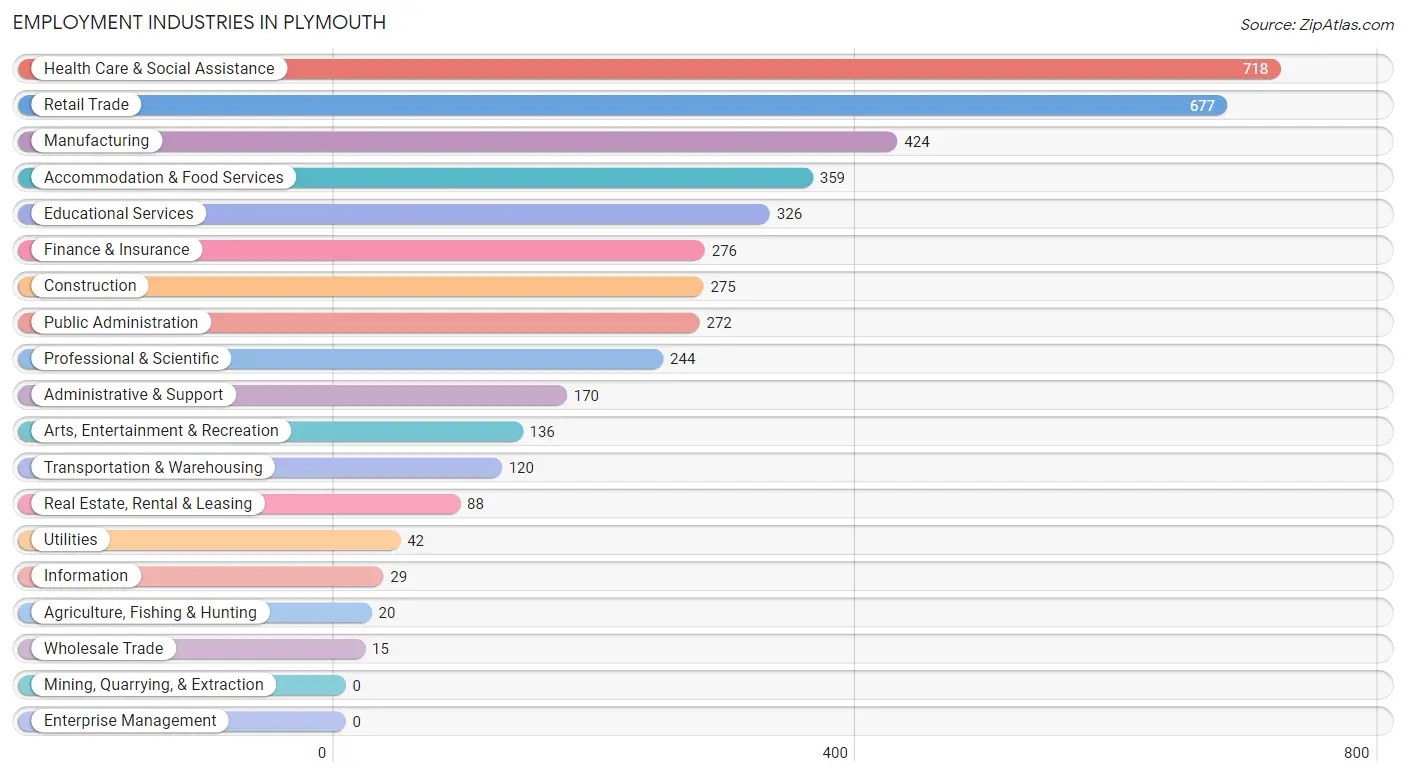
Employment Industries in Plymouth
The major employment industries in Plymouth include Health Care & Social Assistance (718 | 16.1%), Retail Trade (677 | 15.1%), Manufacturing (424 | 9.5%), Accommodation & Food Services (359 | 8.0%), and Educational Services (326 | 7.3%).
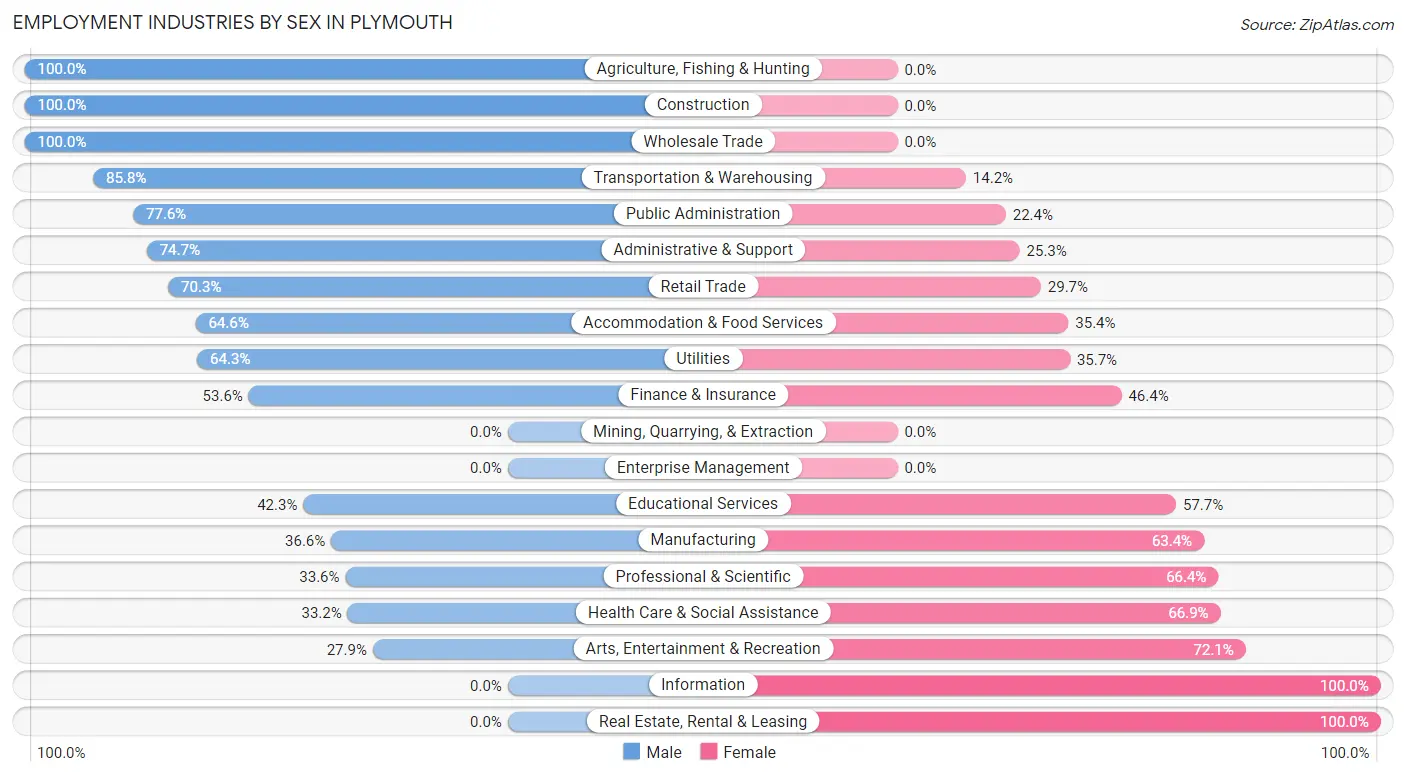
Employment Industries by Sex in Plymouth
The Plymouth industries that see more men than women are Agriculture, Fishing & Hunting (100.0%), Construction (100.0%), and Wholesale Trade (100.0%), whereas the industries that tend to have a higher number of women are Information (100.0%), Real Estate, Rental & Leasing (100.0%), and Arts, Entertainment & Recreation (72.1%).
| Industry | Male | Female |
| Agriculture, Fishing & Hunting | 20 (100.0%) | 0 (0.0%) |
| Mining, Quarrying, & Extraction | 0 (0.0%) | 0 (0.0%) |
| Construction | 275 (100.0%) | 0 (0.0%) |
| Manufacturing | 155 (36.6%) | 269 (63.4%) |
| Wholesale Trade | 15 (100.0%) | 0 (0.0%) |
| Retail Trade | 476 (70.3%) | 201 (29.7%) |
| Transportation & Warehousing | 103 (85.8%) | 17 (14.2%) |
| Utilities | 27 (64.3%) | 15 (35.7%) |
| Information | 0 (0.0%) | 29 (100.0%) |
| Finance & Insurance | 148 (53.6%) | 128 (46.4%) |
| Real Estate, Rental & Leasing | 0 (0.0%) | 88 (100.0%) |
| Professional & Scientific | 82 (33.6%) | 162 (66.4%) |
| Enterprise Management | 0 (0.0%) | 0 (0.0%) |
| Administrative & Support | 127 (74.7%) | 43 (25.3%) |
| Educational Services | 138 (42.3%) | 188 (57.7%) |
| Health Care & Social Assistance | 238 (33.2%) | 480 (66.8%) |
| Arts, Entertainment & Recreation | 38 (27.9%) | 98 (72.1%) |
| Accommodation & Food Services | 232 (64.6%) | 127 (35.4%) |
| Public Administration | 211 (77.6%) | 61 (22.4%) |
| Total | 2,396 (53.6%) | 2,074 (46.4%) |
Education in Plymouth
School Enrollment in Plymouth
The most common levels of schooling among the 1,249 students in Plymouth are high school (506 | 40.5%), college / undergraduate (234 | 18.7%), and graduate / professional (161 | 12.9%).
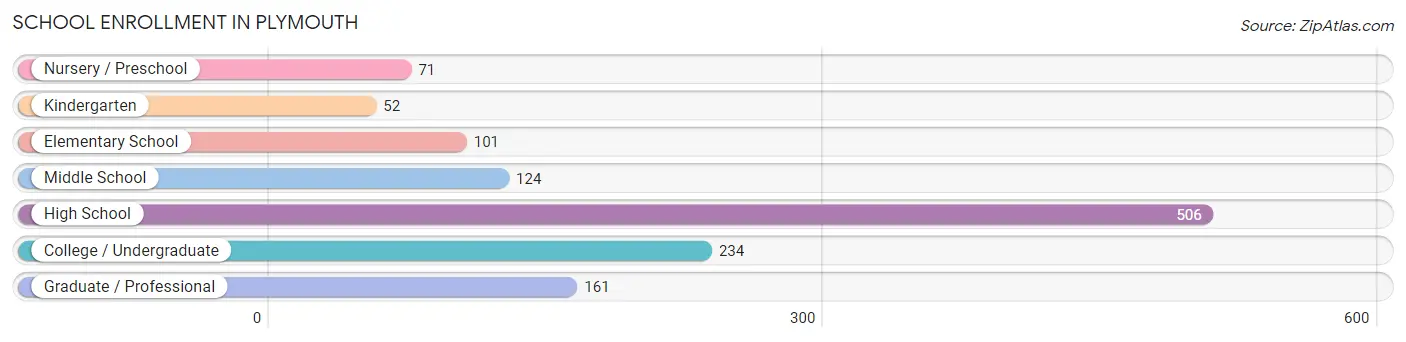
| School Level | # Students | % Students |
| Nursery / Preschool | 71 | 5.7% |
| Kindergarten | 52 | 4.2% |
| Elementary School | 101 | 8.1% |
| Middle School | 124 | 9.9% |
| High School | 506 | 40.5% |
| College / Undergraduate | 234 | 18.7% |
| Graduate / Professional | 161 | 12.9% |
| Total | 1,249 | 100.0% |
School Enrollment by Age by Funding Source in Plymouth
Out of a total of 1,249 students who are enrolled in schools in Plymouth, 415 (33.2%) attend a private institution, while the remaining 834 (66.8%) are enrolled in public schools. The age group of 3 to 4 year olds has the highest likelihood of being enrolled in private schools, with 25 (100.0% in the age bracket) enrolled. Conversely, the age group of 18 to 19 year olds has the lowest likelihood of being enrolled in a private school, with 94 (100.0% in the age bracket) attending a public institution.
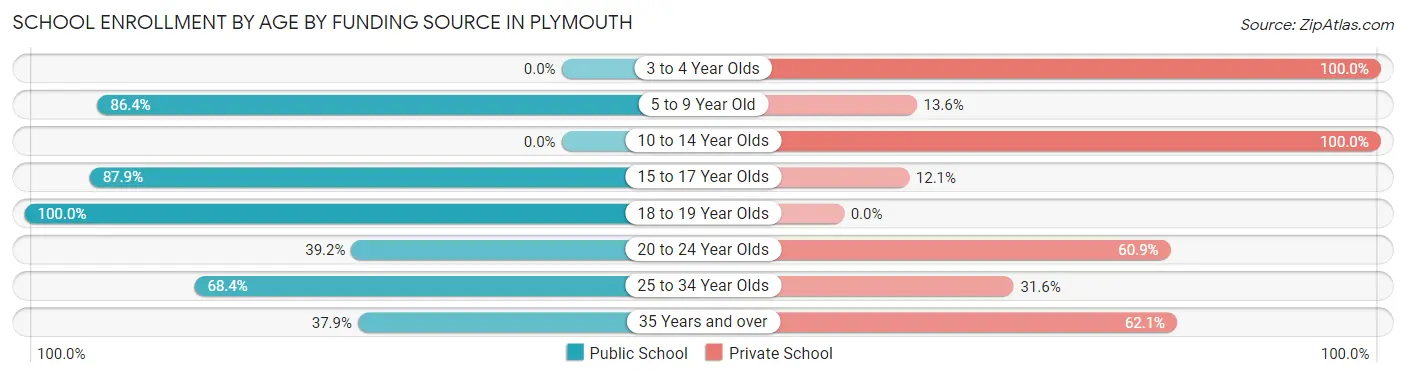
| Age Bracket | Public School | Private School |
| 3 to 4 Year Olds | 0 (0.0%) | 25 (100.0%) |
| 5 to 9 Year Old | 172 (86.4%) | 27 (13.6%) |
| 10 to 14 Year Olds | 0 (0.0%) | 124 (100.0%) |
| 15 to 17 Year Olds | 362 (87.9%) | 50 (12.1%) |
| 18 to 19 Year Olds | 94 (100.0%) | 0 (0.0%) |
| 20 to 24 Year Olds | 74 (39.2%) | 115 (60.9%) |
| 25 to 34 Year Olds | 121 (68.4%) | 56 (31.6%) |
| 35 Years and over | 11 (37.9%) | 18 (62.1%) |
| Total | 834 (66.8%) | 415 (33.2%) |
Educational Attainment by Field of Study in Plymouth
Business (654 | 25.1%), education (324 | 12.4%), liberal arts & history (270 | 10.4%), science & technology (217 | 8.3%), and social sciences (206 | 7.9%) are the most common fields of study among 2,607 individuals in Plymouth who have obtained a bachelor's degree or higher.
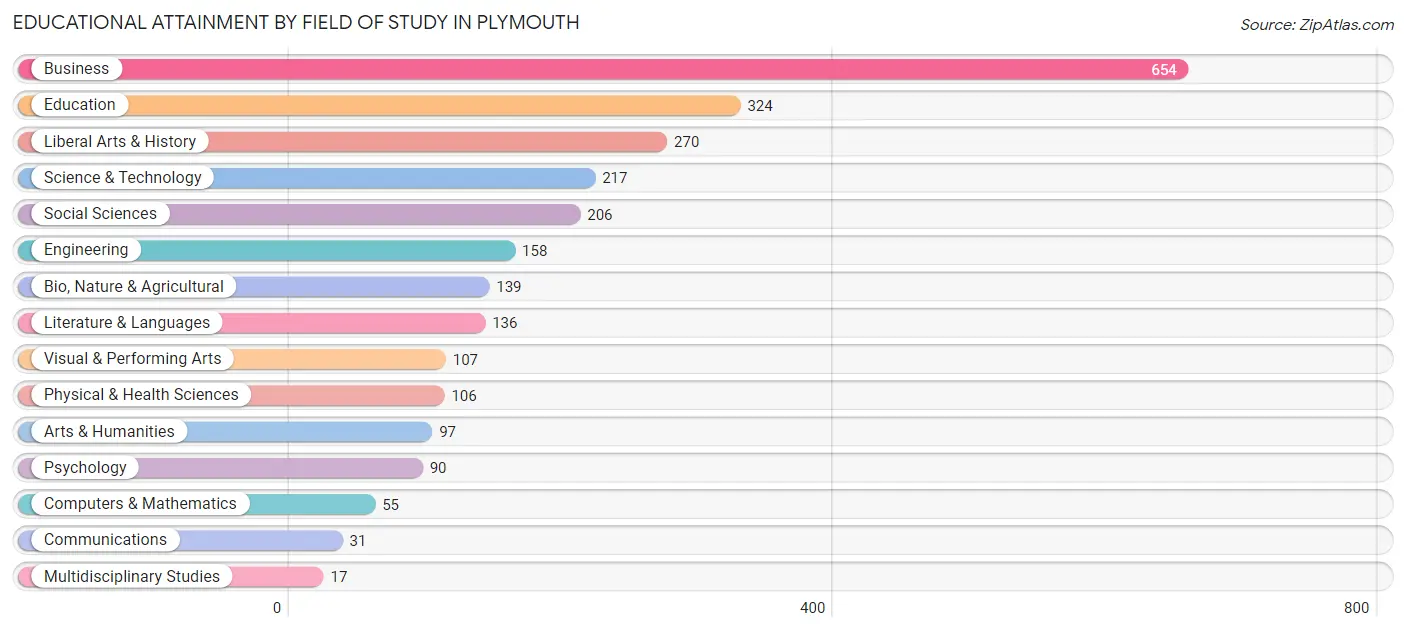
| Field of Study | # Graduates | % Graduates |
| Computers & Mathematics | 55 | 2.1% |
| Bio, Nature & Agricultural | 139 | 5.3% |
| Physical & Health Sciences | 106 | 4.1% |
| Psychology | 90 | 3.5% |
| Social Sciences | 206 | 7.9% |
| Engineering | 158 | 6.1% |
| Multidisciplinary Studies | 17 | 0.6% |
| Science & Technology | 217 | 8.3% |
| Business | 654 | 25.1% |
| Education | 324 | 12.4% |
| Literature & Languages | 136 | 5.2% |
| Liberal Arts & History | 270 | 10.4% |
| Visual & Performing Arts | 107 | 4.1% |
| Communications | 31 | 1.2% |
| Arts & Humanities | 97 | 3.7% |
| Total | 2,607 | 100.0% |
Transportation & Commute in Plymouth
Vehicle Availability by Sex in Plymouth
The most prevalent vehicle ownership categories in Plymouth are males with 1 vehicle (904, accounting for 38.1%) and females with 1 vehicle (750, making up 43.8%).
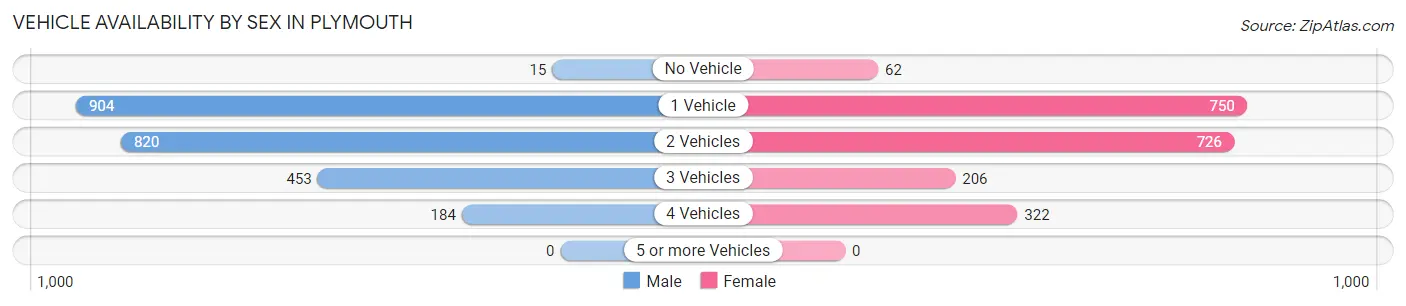
| Vehicles Available | Male | Female |
| No Vehicle | 15 (0.6%) | 62 (3.0%) |
| 1 Vehicle | 904 (38.1%) | 750 (36.3%) |
| 2 Vehicles | 820 (34.5%) | 726 (35.1%) |
| 3 Vehicles | 453 (19.1%) | 206 (10.0%) |
| 4 Vehicles | 184 (7.7%) | 322 (15.6%) |
| 5 or more Vehicles | 0 (0.0%) | 0 (0.0%) |
| Total | 2,376 (100.0%) | 2,066 (100.0%) |
Commute Time in Plymouth
The most frequently occuring commute durations in Plymouth are 10 to 14 minutes (676 commuters, 17.2%), 60 to 89 minutes (578 commuters, 14.7%), and 15 to 19 minutes (480 commuters, 12.2%).
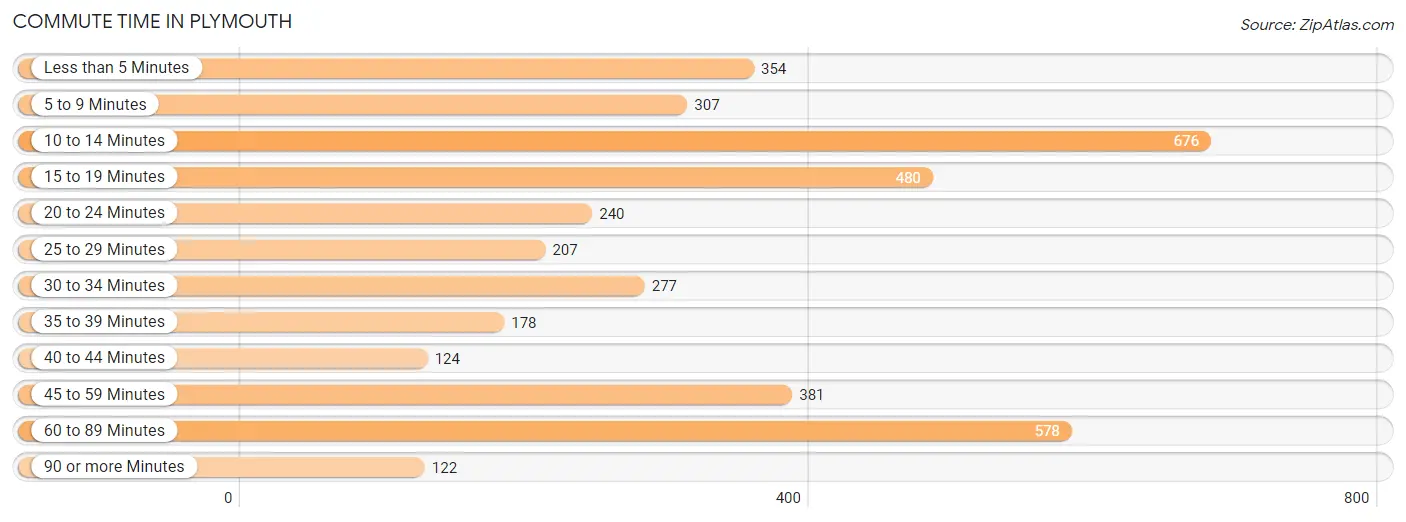
| Commute Time | # Commuters | % Commuters |
| Less than 5 Minutes | 354 | 9.0% |
| 5 to 9 Minutes | 307 | 7.8% |
| 10 to 14 Minutes | 676 | 17.2% |
| 15 to 19 Minutes | 480 | 12.2% |
| 20 to 24 Minutes | 240 | 6.1% |
| 25 to 29 Minutes | 207 | 5.3% |
| 30 to 34 Minutes | 277 | 7.1% |
| 35 to 39 Minutes | 178 | 4.5% |
| 40 to 44 Minutes | 124 | 3.2% |
| 45 to 59 Minutes | 381 | 9.7% |
| 60 to 89 Minutes | 578 | 14.7% |
| 90 or more Minutes | 122 | 3.1% |
Commute Time by Sex in Plymouth
The most common commute times in Plymouth are 60 to 89 minutes (428 commuters, 20.1%) for males and 10 to 14 minutes (487 commuters, 27.2%) for females.
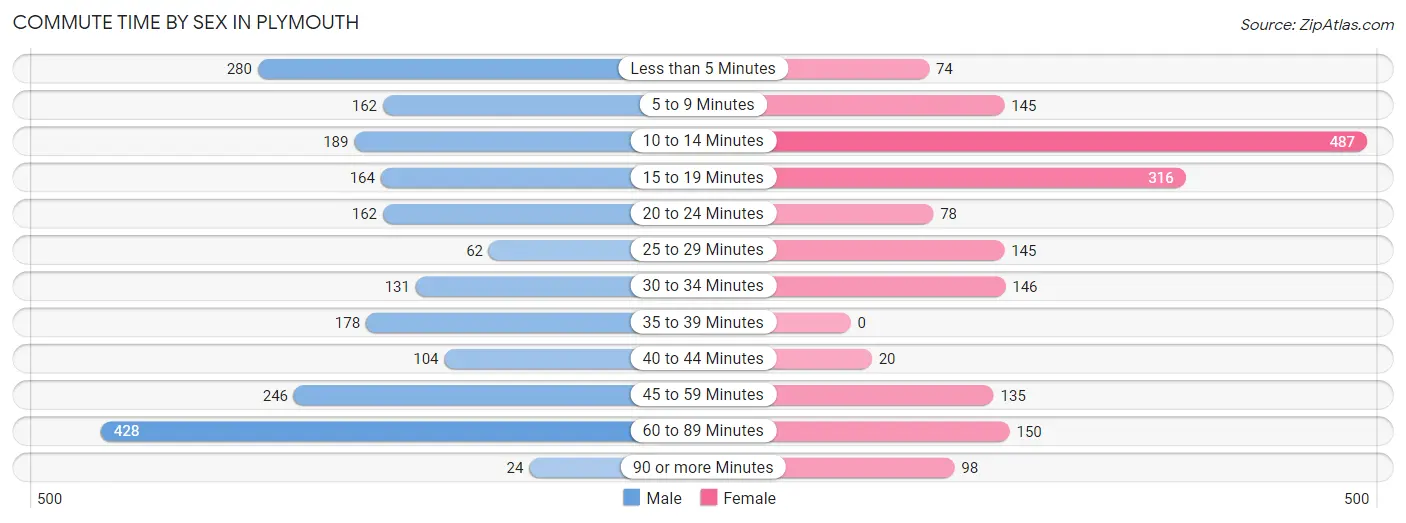
| Commute Time | Male | Female |
| Less than 5 Minutes | 280 (13.2%) | 74 (4.1%) |
| 5 to 9 Minutes | 162 (7.6%) | 145 (8.1%) |
| 10 to 14 Minutes | 189 (8.9%) | 487 (27.2%) |
| 15 to 19 Minutes | 164 (7.7%) | 316 (17.6%) |
| 20 to 24 Minutes | 162 (7.6%) | 78 (4.3%) |
| 25 to 29 Minutes | 62 (2.9%) | 145 (8.1%) |
| 30 to 34 Minutes | 131 (6.1%) | 146 (8.1%) |
| 35 to 39 Minutes | 178 (8.4%) | 0 (0.0%) |
| 40 to 44 Minutes | 104 (4.9%) | 20 (1.1%) |
| 45 to 59 Minutes | 246 (11.6%) | 135 (7.5%) |
| 60 to 89 Minutes | 428 (20.1%) | 150 (8.4%) |
| 90 or more Minutes | 24 (1.1%) | 98 (5.5%) |
Time of Departure to Work by Sex in Plymouth
The most frequent times of departure to work in Plymouth are 7:00 AM to 7:29 AM (326, 15.3%) for males and 6:00 AM to 6:29 AM (249, 13.9%) for females.
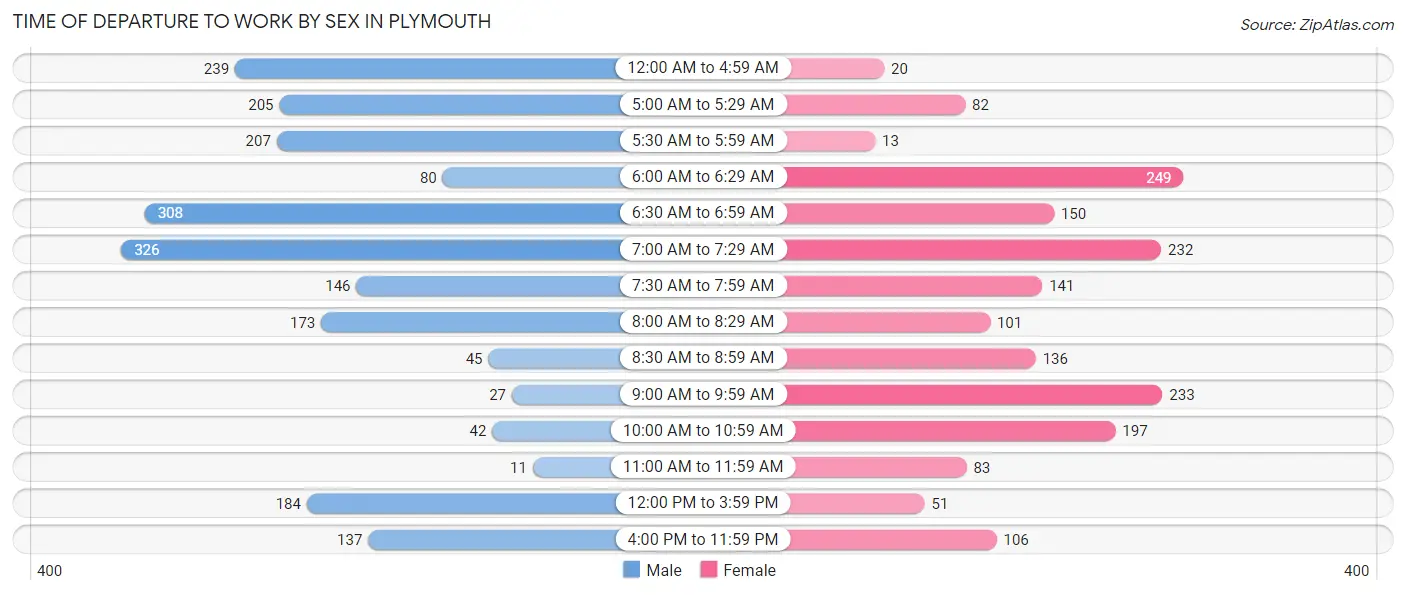
| Time of Departure | Male | Female |
| 12:00 AM to 4:59 AM | 239 (11.2%) | 20 (1.1%) |
| 5:00 AM to 5:29 AM | 205 (9.6%) | 82 (4.6%) |
| 5:30 AM to 5:59 AM | 207 (9.7%) | 13 (0.7%) |
| 6:00 AM to 6:29 AM | 80 (3.8%) | 249 (13.9%) |
| 6:30 AM to 6:59 AM | 308 (14.5%) | 150 (8.4%) |
| 7:00 AM to 7:29 AM | 326 (15.3%) | 232 (12.9%) |
| 7:30 AM to 7:59 AM | 146 (6.9%) | 141 (7.9%) |
| 8:00 AM to 8:29 AM | 173 (8.1%) | 101 (5.6%) |
| 8:30 AM to 8:59 AM | 45 (2.1%) | 136 (7.6%) |
| 9:00 AM to 9:59 AM | 27 (1.3%) | 233 (13.0%) |
| 10:00 AM to 10:59 AM | 42 (2.0%) | 197 (11.0%) |
| 11:00 AM to 11:59 AM | 11 (0.5%) | 83 (4.6%) |
| 12:00 PM to 3:59 PM | 184 (8.6%) | 51 (2.8%) |
| 4:00 PM to 11:59 PM | 137 (6.4%) | 106 (5.9%) |
| Total | 2,130 (100.0%) | 1,794 (100.0%) |
Housing Occupancy in Plymouth
Occupancy by Ownership in Plymouth
Of the total 3,708 dwellings in Plymouth, owner-occupied units account for 1,738 (46.9%), while renter-occupied units make up 1,970 (53.1%).
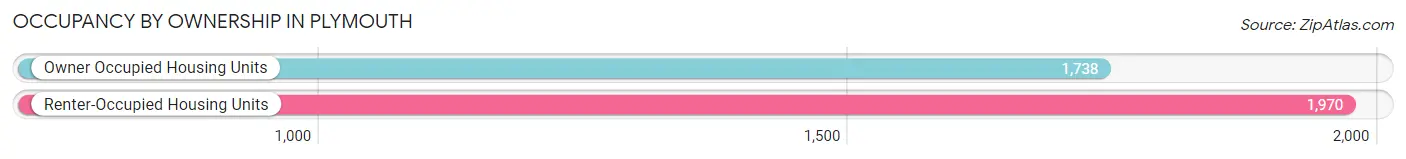
| Occupancy | # Housing Units | % Housing Units |
| Owner Occupied Housing Units | 1,738 | 46.9% |
| Renter-Occupied Housing Units | 1,970 | 53.1% |
| Total Occupied Housing Units | 3,708 | 100.0% |
Occupancy by Household Size in Plymouth
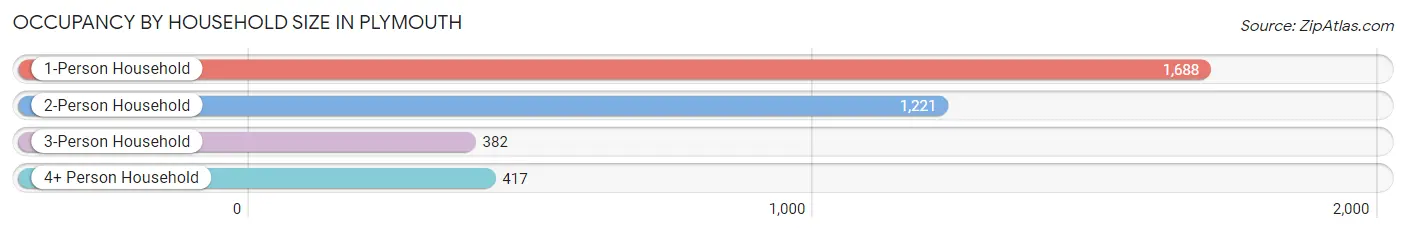
| Household Size | # Housing Units | % Housing Units |
| 1-Person Household | 1,688 | 45.5% |
| 2-Person Household | 1,221 | 32.9% |
| 3-Person Household | 382 | 10.3% |
| 4+ Person Household | 417 | 11.3% |
| Total Housing Units | 3,708 | 100.0% |
Occupancy by Ownership by Household Size in Plymouth
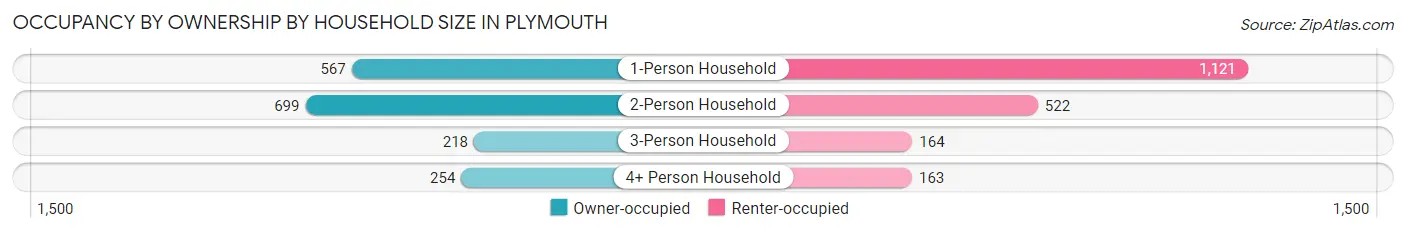
| Household Size | Owner-occupied | Renter-occupied |
| 1-Person Household | 567 (33.6%) | 1,121 (66.4%) |
| 2-Person Household | 699 (57.3%) | 522 (42.7%) |
| 3-Person Household | 218 (57.1%) | 164 (42.9%) |
| 4+ Person Household | 254 (60.9%) | 163 (39.1%) |
| Total Housing Units | 1,738 (46.9%) | 1,970 (53.1%) |
Occupancy by Educational Attainment in Plymouth
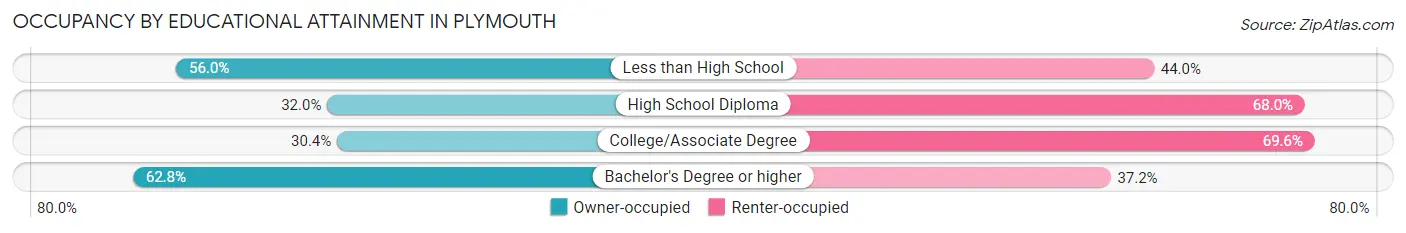
| Household Size | Owner-occupied | Renter-occupied |
| Less than High School | 164 (56.0%) | 129 (44.0%) |
| High School Diploma | 304 (32.0%) | 646 (68.0%) |
| College/Associate Degree | 262 (30.4%) | 599 (69.6%) |
| Bachelor's Degree or higher | 1,008 (62.8%) | 596 (37.2%) |
Occupancy by Age of Householder in Plymouth
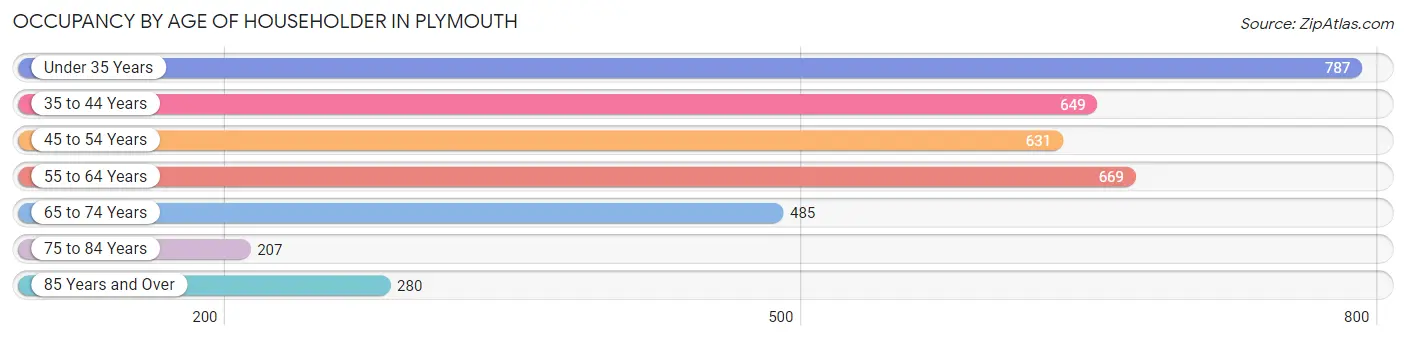
| Age Bracket | # Households | % Households |
| Under 35 Years | 787 | 21.2% |
| 35 to 44 Years | 649 | 17.5% |
| 45 to 54 Years | 631 | 17.0% |
| 55 to 64 Years | 669 | 18.0% |
| 65 to 74 Years | 485 | 13.1% |
| 75 to 84 Years | 207 | 5.6% |
| 85 Years and Over | 280 | 7.5% |
| Total | 3,708 | 100.0% |
Housing Finances in Plymouth
Median Income by Occupancy in Plymouth
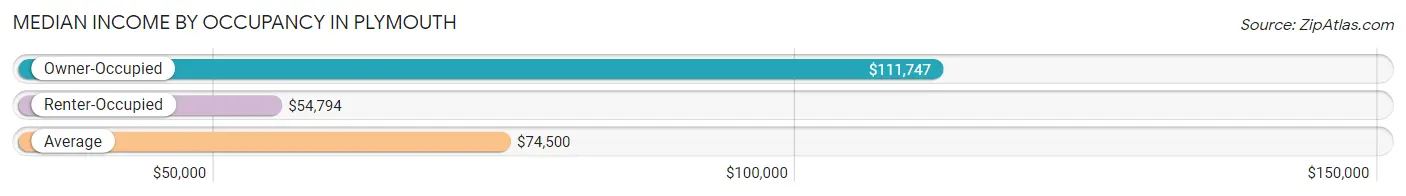
| Occupancy Type | # Households | Median Income |
| Owner-Occupied | 1,738 (46.9%) | $111,747 |
| Renter-Occupied | 1,970 (53.1%) | $54,794 |
| Average | 3,708 (100.0%) | $74,500 |
Occupancy by Householder Income Bracket in Plymouth
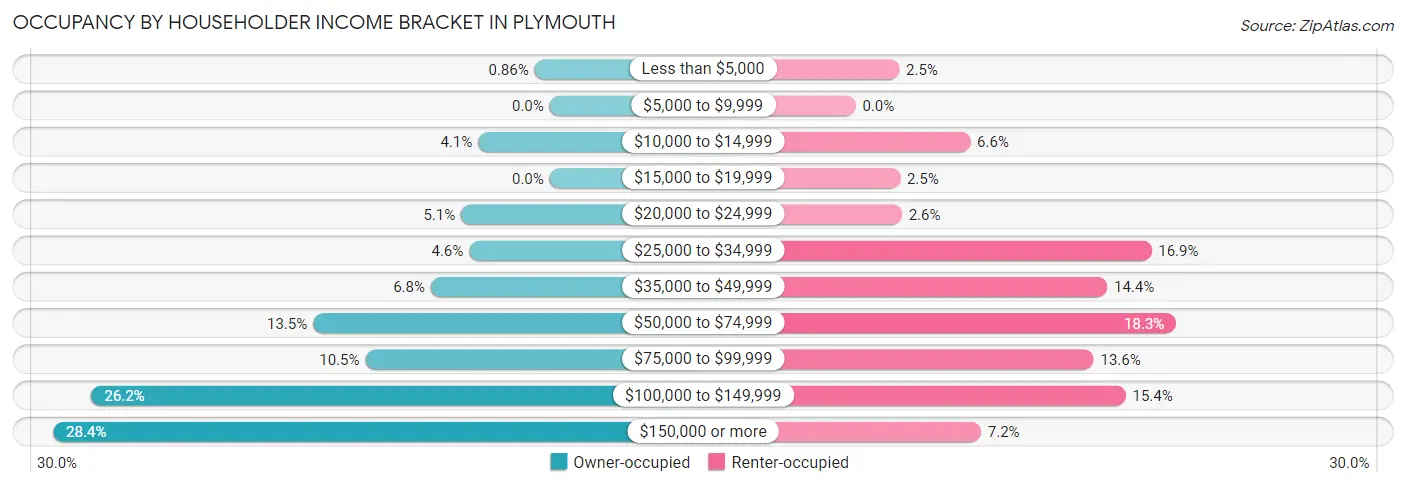
| Income Bracket | Owner-occupied | Renter-occupied |
| Less than $5,000 | 15 (0.9%) | 49 (2.5%) |
| $5,000 to $9,999 | 0 (0.0%) | 0 (0.0%) |
| $10,000 to $14,999 | 71 (4.1%) | 129 (6.6%) |
| $15,000 to $19,999 | 0 (0.0%) | 50 (2.5%) |
| $20,000 to $24,999 | 88 (5.1%) | 52 (2.6%) |
| $25,000 to $34,999 | 80 (4.6%) | 333 (16.9%) |
| $35,000 to $49,999 | 118 (6.8%) | 283 (14.4%) |
| $50,000 to $74,999 | 235 (13.5%) | 361 (18.3%) |
| $75,000 to $99,999 | 183 (10.5%) | 268 (13.6%) |
| $100,000 to $149,999 | 455 (26.2%) | 304 (15.4%) |
| $150,000 or more | 493 (28.4%) | 141 (7.2%) |
| Total | 1,738 (100.0%) | 1,970 (100.0%) |
Monthly Housing Cost Tiers in Plymouth
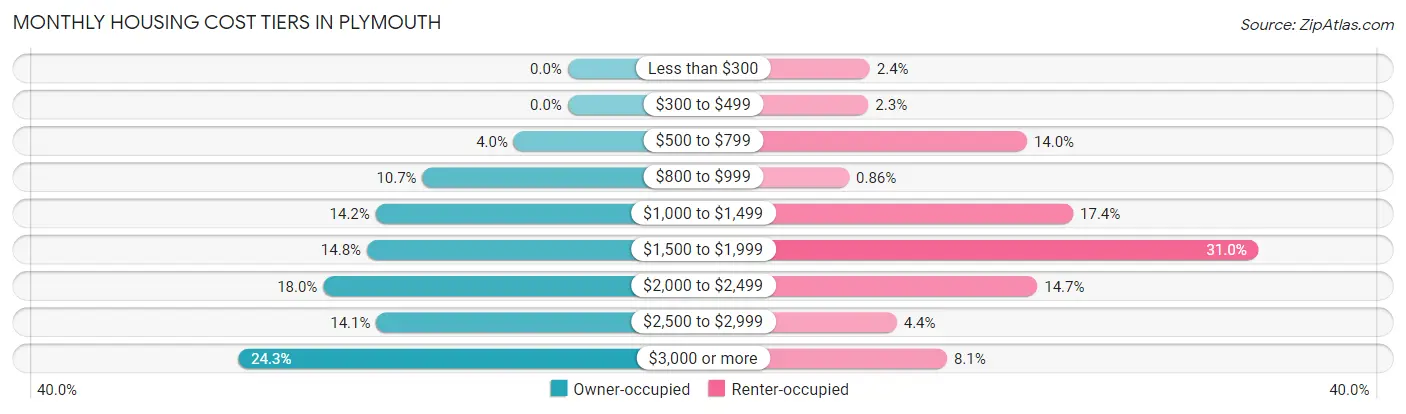
| Monthly Cost | Owner-occupied | Renter-occupied |
| Less than $300 | 0 (0.0%) | 47 (2.4%) |
| $300 to $499 | 0 (0.0%) | 45 (2.3%) |
| $500 to $799 | 69 (4.0%) | 275 (14.0%) |
| $800 to $999 | 186 (10.7%) | 17 (0.9%) |
| $1,000 to $1,499 | 246 (14.1%) | 342 (17.4%) |
| $1,500 to $1,999 | 257 (14.8%) | 611 (31.0%) |
| $2,000 to $2,499 | 313 (18.0%) | 290 (14.7%) |
| $2,500 to $2,999 | 245 (14.1%) | 86 (4.4%) |
| $3,000 or more | 422 (24.3%) | 159 (8.1%) |
| Total | 1,738 (100.0%) | 1,970 (100.0%) |
Physical Housing Characteristics in Plymouth
Housing Structures in Plymouth
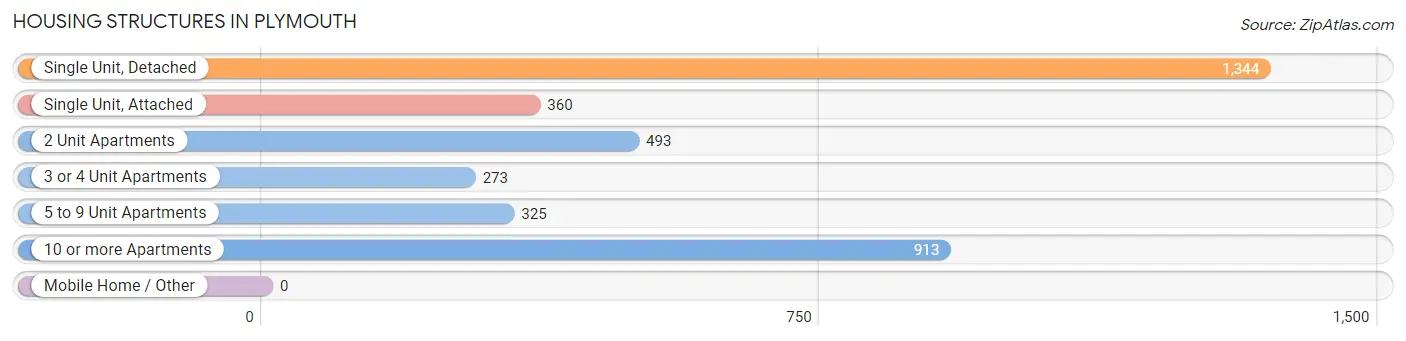
| Structure Type | # Housing Units | % Housing Units |
| Single Unit, Detached | 1,344 | 36.2% |
| Single Unit, Attached | 360 | 9.7% |
| 2 Unit Apartments | 493 | 13.3% |
| 3 or 4 Unit Apartments | 273 | 7.4% |
| 5 to 9 Unit Apartments | 325 | 8.8% |
| 10 or more Apartments | 913 | 24.6% |
| Mobile Home / Other | 0 | 0.0% |
| Total | 3,708 | 100.0% |
Housing Structures by Occupancy in Plymouth
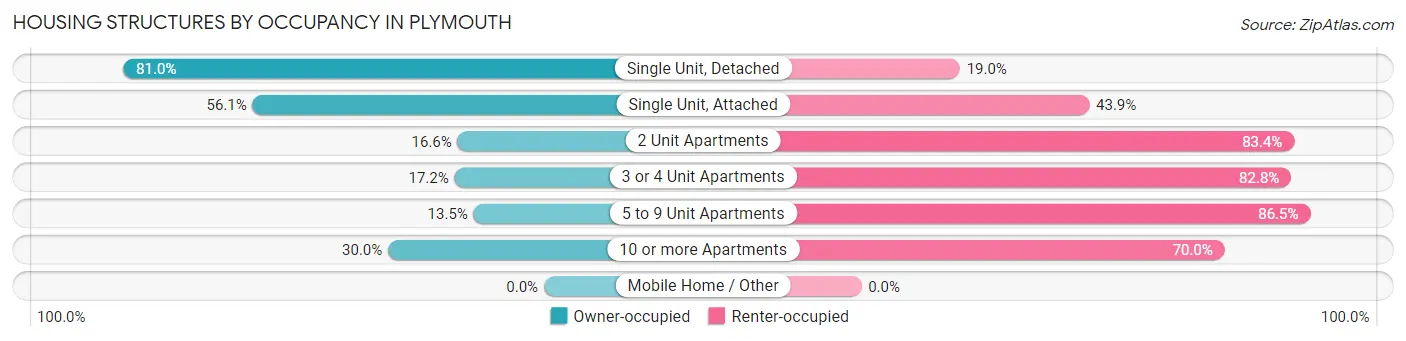
| Structure Type | Owner-occupied | Renter-occupied |
| Single Unit, Detached | 1,089 (81.0%) | 255 (19.0%) |
| Single Unit, Attached | 202 (56.1%) | 158 (43.9%) |
| 2 Unit Apartments | 82 (16.6%) | 411 (83.4%) |
| 3 or 4 Unit Apartments | 47 (17.2%) | 226 (82.8%) |
| 5 to 9 Unit Apartments | 44 (13.5%) | 281 (86.5%) |
| 10 or more Apartments | 274 (30.0%) | 639 (70.0%) |
| Mobile Home / Other | 0 (0.0%) | 0 (0.0%) |
| Total | 1,738 (46.9%) | 1,970 (53.1%) |
Housing Structures by Number of Rooms in Plymouth
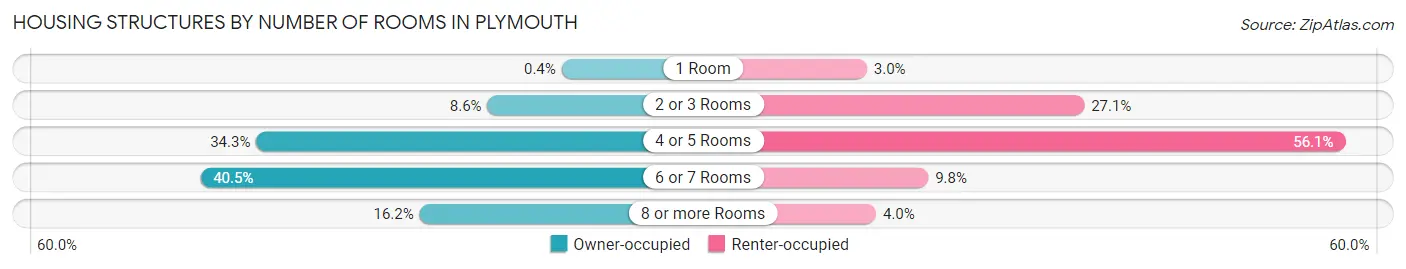
| Number of Rooms | Owner-occupied | Renter-occupied |
| 1 Room | 7 (0.4%) | 59 (3.0%) |
| 2 or 3 Rooms | 150 (8.6%) | 534 (27.1%) |
| 4 or 5 Rooms | 596 (34.3%) | 1,105 (56.1%) |
| 6 or 7 Rooms | 704 (40.5%) | 193 (9.8%) |
| 8 or more Rooms | 281 (16.2%) | 79 (4.0%) |
| Total | 1,738 (100.0%) | 1,970 (100.0%) |
Housing Structure by Heating Type in Plymouth
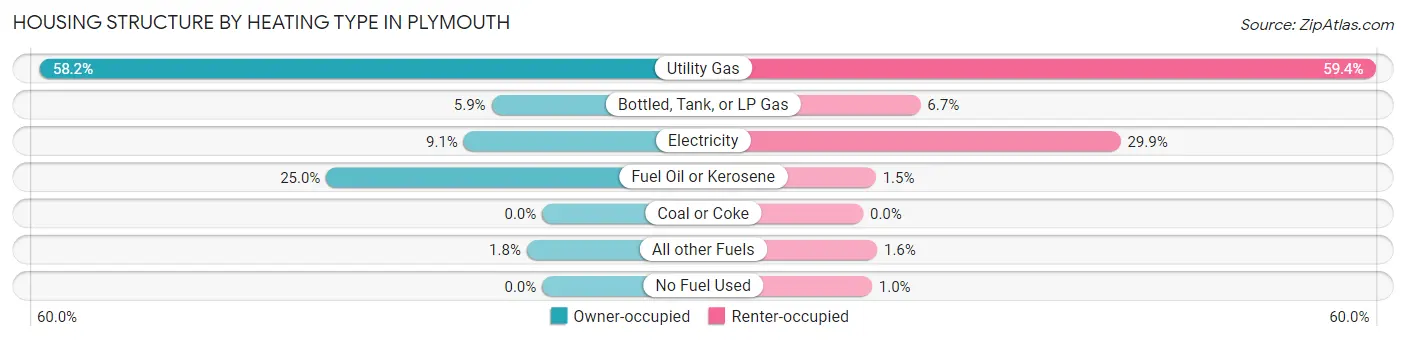
| Heating Type | Owner-occupied | Renter-occupied |
| Utility Gas | 1,012 (58.2%) | 1,170 (59.4%) |
| Bottled, Tank, or LP Gas | 102 (5.9%) | 131 (6.7%) |
| Electricity | 158 (9.1%) | 588 (29.8%) |
| Fuel Oil or Kerosene | 435 (25.0%) | 29 (1.5%) |
| Coal or Coke | 0 (0.0%) | 0 (0.0%) |
| All other Fuels | 31 (1.8%) | 32 (1.6%) |
| No Fuel Used | 0 (0.0%) | 20 (1.0%) |
| Total | 1,738 (100.0%) | 1,970 (100.0%) |
Household Vehicle Usage in Plymouth
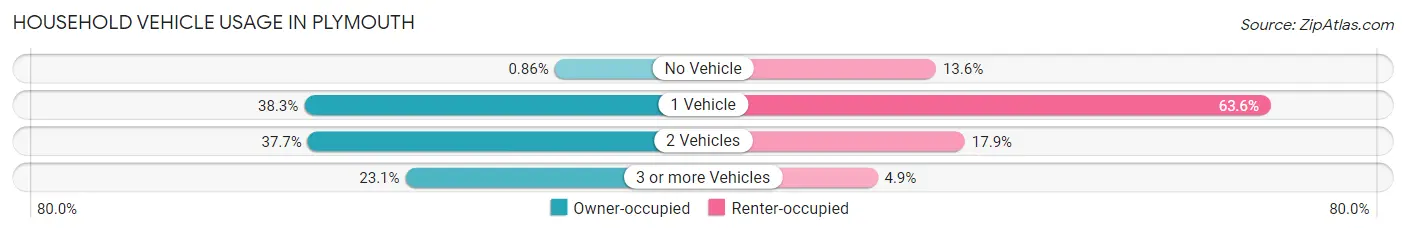
| Vehicles per Household | Owner-occupied | Renter-occupied |
| No Vehicle | 15 (0.9%) | 268 (13.6%) |
| 1 Vehicle | 665 (38.3%) | 1,253 (63.6%) |
| 2 Vehicles | 656 (37.7%) | 353 (17.9%) |
| 3 or more Vehicles | 402 (23.1%) | 96 (4.9%) |
| Total | 1,738 (100.0%) | 1,970 (100.0%) |
Real Estate & Mortgages in Plymouth
Real Estate and Mortgage Overview in Plymouth
| Characteristic | Without Mortgage | With Mortgage |
| Housing Units | 458 | 1,280 |
| Median Property Value | $363,200 | $401,500 |
| Median Household Income | $67,500 | $387 |
| Monthly Housing Costs | $991 | $422 |
| Real Estate Taxes | $5,295 | $0 |
Property Value by Mortgage Status in Plymouth
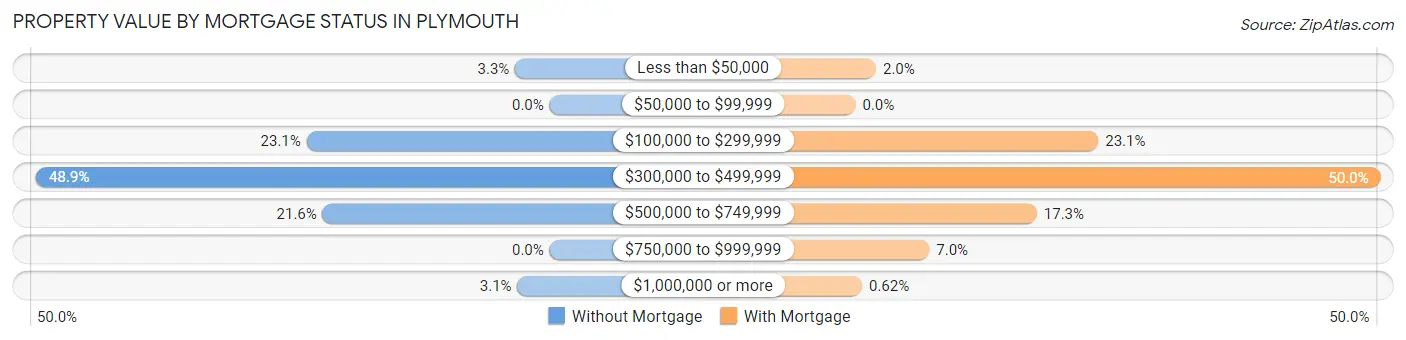
| Property Value | Without Mortgage | With Mortgage |
| Less than $50,000 | 15 (3.3%) | 25 (1.9%) |
| $50,000 to $99,999 | 0 (0.0%) | 0 (0.0%) |
| $100,000 to $299,999 | 106 (23.1%) | 296 (23.1%) |
| $300,000 to $499,999 | 224 (48.9%) | 640 (50.0%) |
| $500,000 to $749,999 | 99 (21.6%) | 221 (17.3%) |
| $750,000 to $999,999 | 0 (0.0%) | 90 (7.0%) |
| $1,000,000 or more | 14 (3.1%) | 8 (0.6%) |
| Total | 458 (100.0%) | 1,280 (100.0%) |
Household Income by Mortgage Status in Plymouth
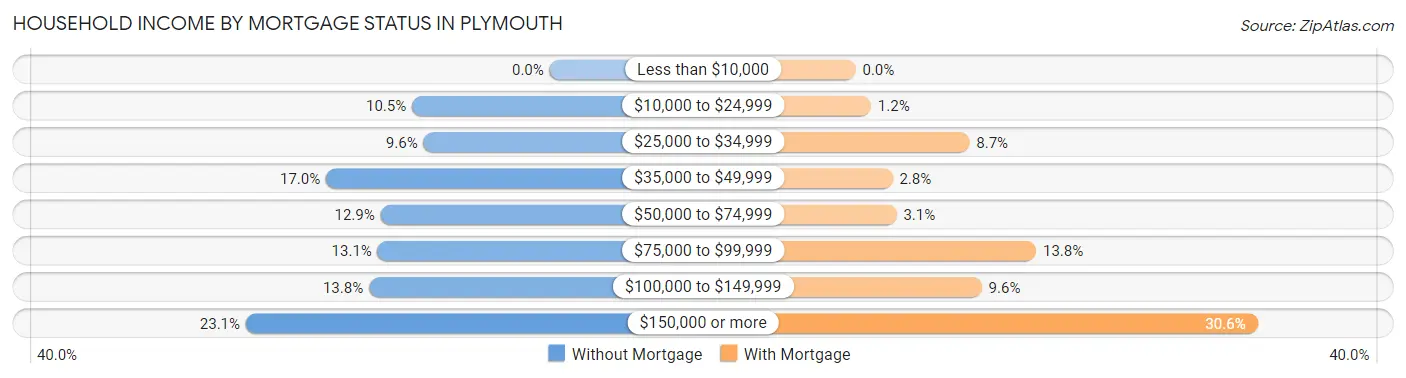
| Household Income | Without Mortgage | With Mortgage |
| Less than $10,000 | 0 (0.0%) | 0 (0.0%) |
| $10,000 to $24,999 | 48 (10.5%) | 15 (1.2%) |
| $25,000 to $34,999 | 44 (9.6%) | 111 (8.7%) |
| $35,000 to $49,999 | 78 (17.0%) | 36 (2.8%) |
| $50,000 to $74,999 | 59 (12.9%) | 40 (3.1%) |
| $75,000 to $99,999 | 60 (13.1%) | 176 (13.8%) |
| $100,000 to $149,999 | 63 (13.8%) | 123 (9.6%) |
| $150,000 or more | 106 (23.1%) | 392 (30.6%) |
| Total | 458 (100.0%) | 1,280 (100.0%) |
Property Value to Household Income Ratio in Plymouth
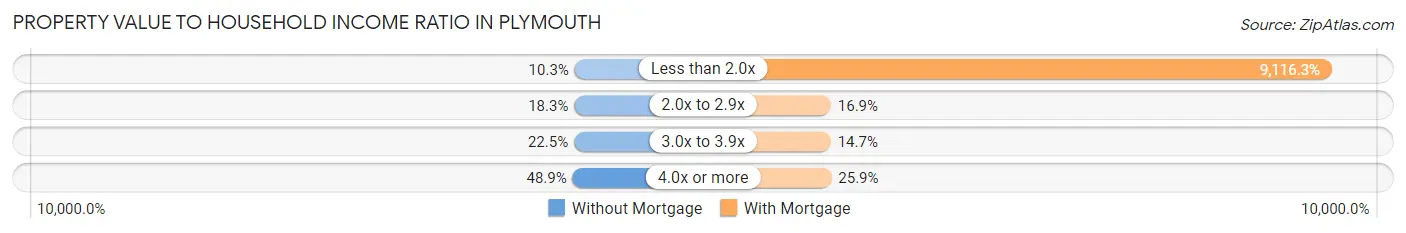
| Value-to-Income Ratio | Without Mortgage | With Mortgage |
| Less than 2.0x | 47 (10.3%) | 116,689 (9,116.3%) |
| 2.0x to 2.9x | 84 (18.3%) | 216 (16.9%) |
| 3.0x to 3.9x | 103 (22.5%) | 188 (14.7%) |
| 4.0x or more | 224 (48.9%) | 332 (25.9%) |
| Total | 458 (100.0%) | 1,280 (100.0%) |
Real Estate Taxes by Mortgage Status in Plymouth
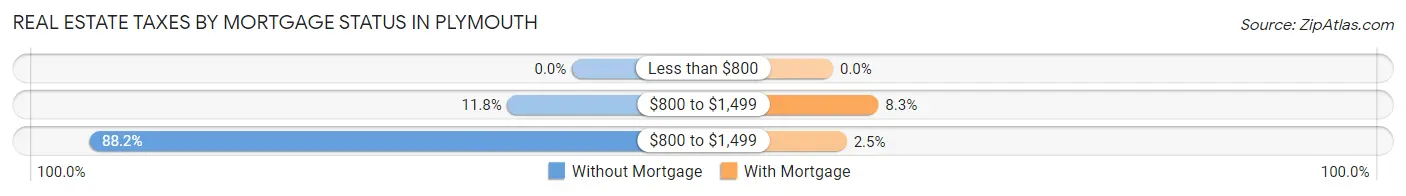
| Property Taxes | Without Mortgage | With Mortgage |
| Less than $800 | 0 (0.0%) | 0 (0.0%) |
| $800 to $1,499 | 54 (11.8%) | 106 (8.3%) |
| $800 to $1,499 | 404 (88.2%) | 32 (2.5%) |
| Total | 458 (100.0%) | 1,280 (100.0%) |
Health & Disability in Plymouth
Health Insurance Coverage by Age in Plymouth
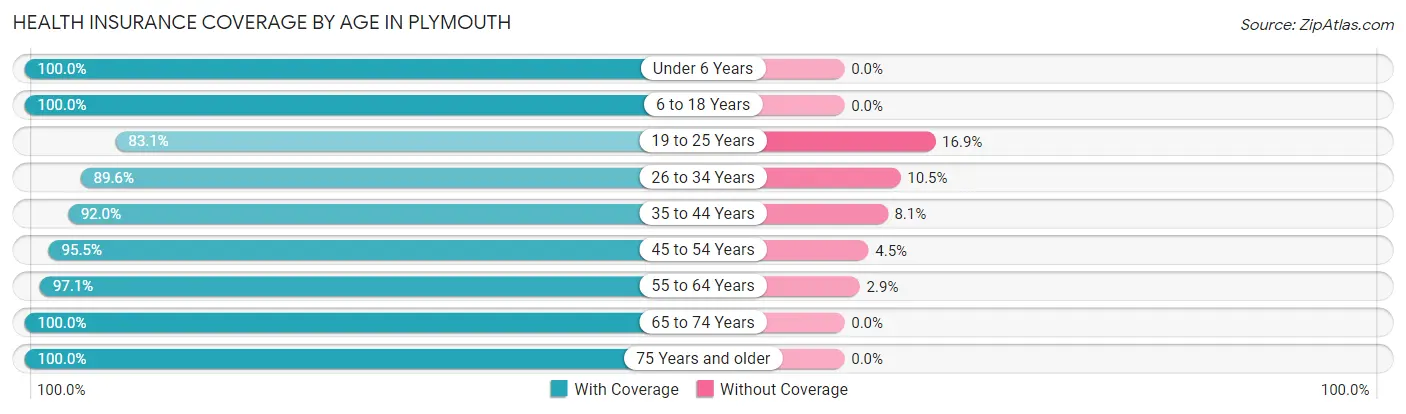
| Age Bracket | With Coverage | Without Coverage |
| Under 6 Years | 324 (100.0%) | 0 (0.0%) |
| 6 to 18 Years | 735 (100.0%) | 0 (0.0%) |
| 19 to 25 Years | 515 (83.1%) | 105 (16.9%) |
| 26 to 34 Years | 977 (89.5%) | 114 (10.4%) |
| 35 to 44 Years | 959 (91.9%) | 84 (8.1%) |
| 45 to 54 Years | 980 (95.5%) | 46 (4.5%) |
| 55 to 64 Years | 1,119 (97.1%) | 33 (2.9%) |
| 65 to 74 Years | 790 (100.0%) | 0 (0.0%) |
| 75 Years and older | 646 (100.0%) | 0 (0.0%) |
| Total | 7,045 (94.9%) | 382 (5.1%) |
Health Insurance Coverage by Citizenship Status in Plymouth
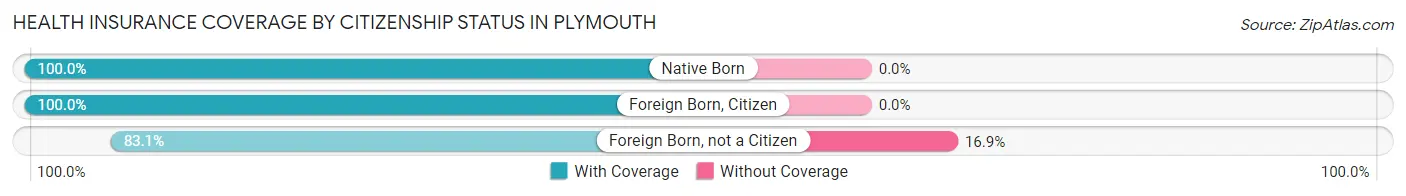
| Citizenship Status | With Coverage | Without Coverage |
| Native Born | 324 (100.0%) | 0 (0.0%) |
| Foreign Born, Citizen | 735 (100.0%) | 0 (0.0%) |
| Foreign Born, not a Citizen | 515 (83.1%) | 105 (16.9%) |
Health Insurance Coverage by Household Income in Plymouth
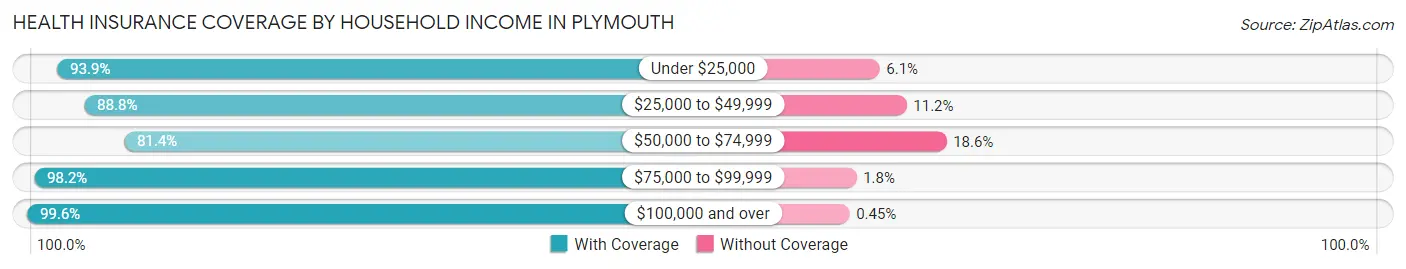
| Household Income | With Coverage | Without Coverage |
| Under $25,000 | 631 (93.9%) | 41 (6.1%) |
| $25,000 to $49,999 | 1,043 (88.8%) | 131 (11.2%) |
| $50,000 to $74,999 | 778 (81.4%) | 178 (18.6%) |
| $75,000 to $99,999 | 837 (98.2%) | 15 (1.8%) |
| $100,000 and over | 3,723 (99.6%) | 17 (0.4%) |
Public vs Private Health Insurance Coverage by Age in Plymouth
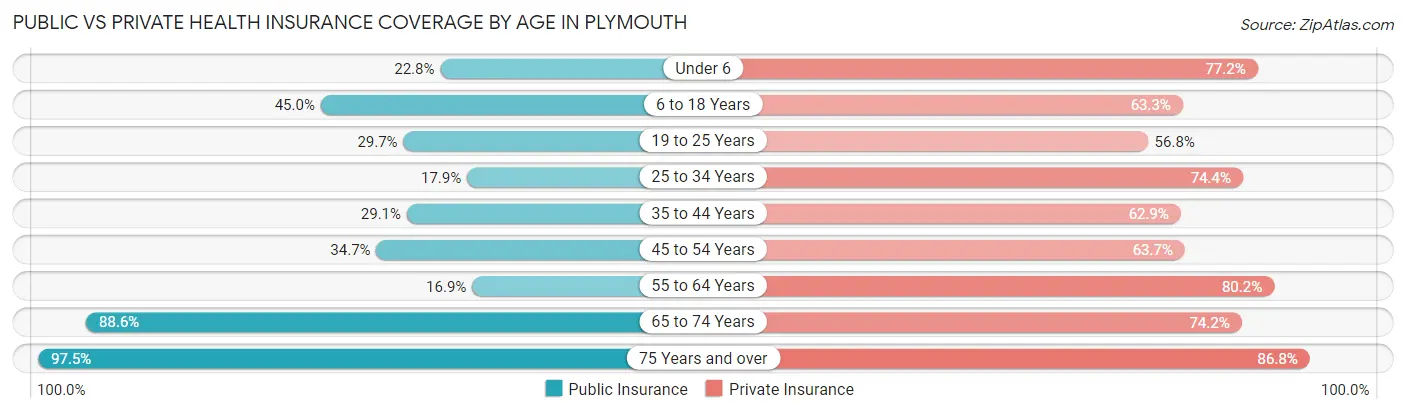
| Age Bracket | Public Insurance | Private Insurance |
| Under 6 | 74 (22.8%) | 250 (77.2%) |
| 6 to 18 Years | 331 (45.0%) | 465 (63.3%) |
| 19 to 25 Years | 184 (29.7%) | 352 (56.8%) |
| 25 to 34 Years | 195 (17.9%) | 812 (74.4%) |
| 35 to 44 Years | 303 (29.0%) | 656 (62.9%) |
| 45 to 54 Years | 356 (34.7%) | 653 (63.6%) |
| 55 to 64 Years | 195 (16.9%) | 924 (80.2%) |
| 65 to 74 Years | 700 (88.6%) | 586 (74.2%) |
| 75 Years and over | 630 (97.5%) | 561 (86.8%) |
| Total | 2,968 (40.0%) | 5,259 (70.8%) |
Disability Status by Sex by Age in Plymouth
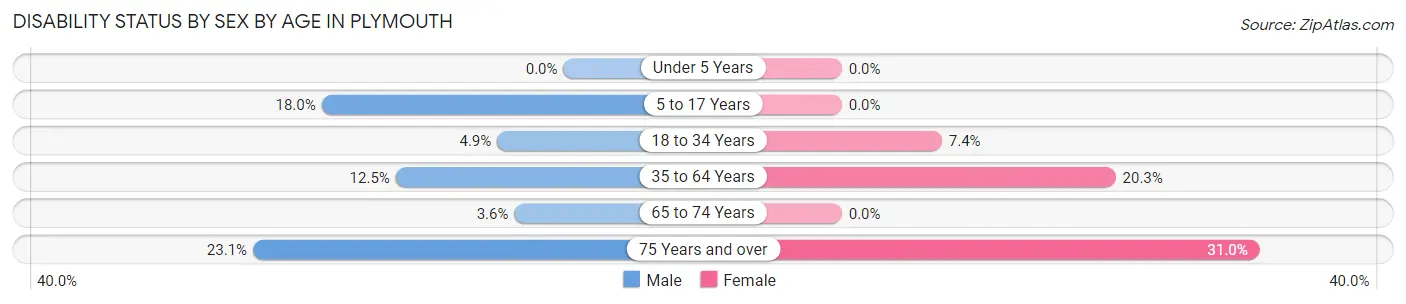
| Age Bracket | Male | Female |
| Under 5 Years | 0 (0.0%) | 0 (0.0%) |
| 5 to 17 Years | 77 (17.9%) | 0 (0.0%) |
| 18 to 34 Years | 50 (4.9%) | 57 (7.4%) |
| 35 to 64 Years | 191 (12.4%) | 343 (20.3%) |
| 65 to 74 Years | 14 (3.6%) | 0 (0.0%) |
| 75 Years and over | 56 (23.1%) | 125 (31.0%) |
Disability Class by Sex by Age in Plymouth
Disability Class: Hearing Difficulty
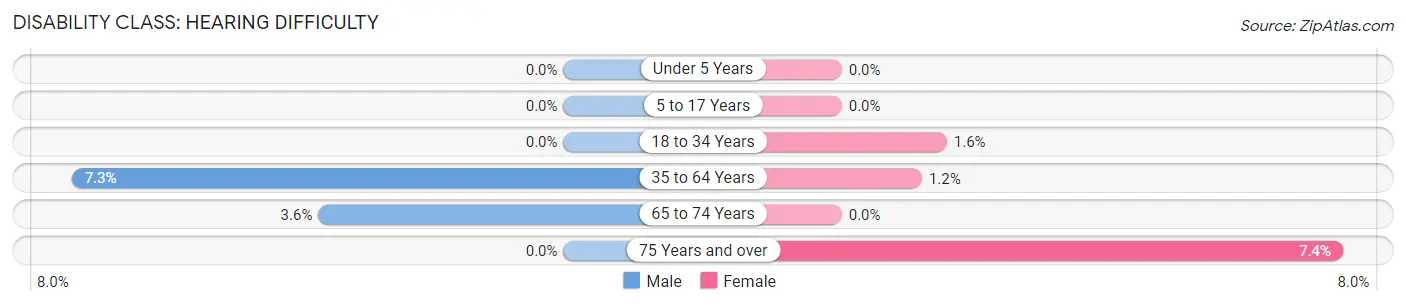
| Age Bracket | Male | Female |
| Under 5 Years | 0 (0.0%) | 0 (0.0%) |
| 5 to 17 Years | 0 (0.0%) | 0 (0.0%) |
| 18 to 34 Years | 0 (0.0%) | 12 (1.6%) |
| 35 to 64 Years | 112 (7.3%) | 20 (1.2%) |
| 65 to 74 Years | 14 (3.6%) | 0 (0.0%) |
| 75 Years and over | 0 (0.0%) | 30 (7.4%) |
Disability Class: Vision Difficulty
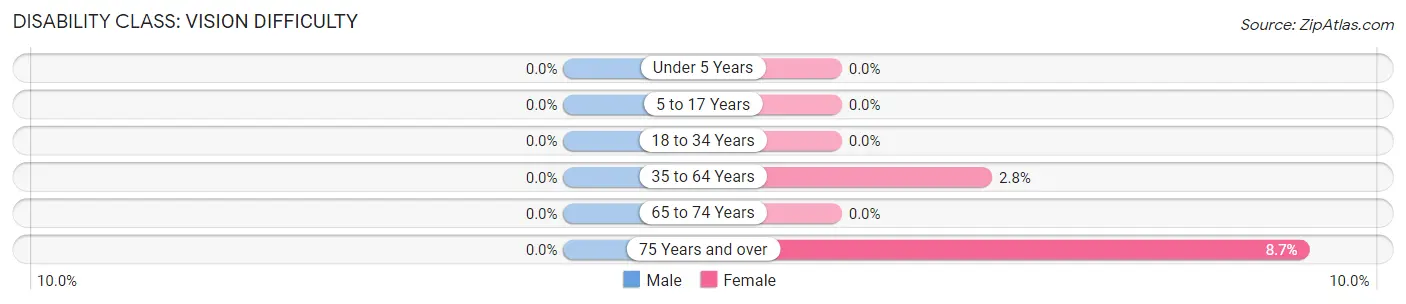
| Age Bracket | Male | Female |
| Under 5 Years | 0 (0.0%) | 0 (0.0%) |
| 5 to 17 Years | 0 (0.0%) | 0 (0.0%) |
| 18 to 34 Years | 0 (0.0%) | 0 (0.0%) |
| 35 to 64 Years | 0 (0.0%) | 47 (2.8%) |
| 65 to 74 Years | 0 (0.0%) | 0 (0.0%) |
| 75 Years and over | 0 (0.0%) | 35 (8.7%) |
Disability Class: Cognitive Difficulty
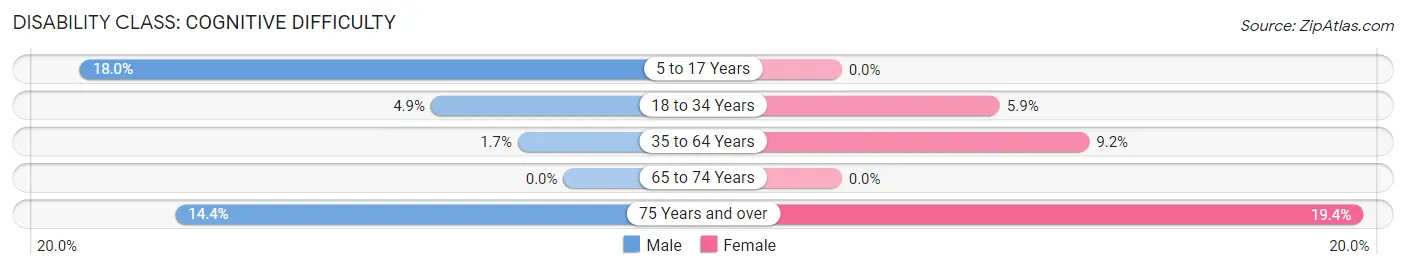
| Age Bracket | Male | Female |
| 5 to 17 Years | 77 (17.9%) | 0 (0.0%) |
| 18 to 34 Years | 50 (4.9%) | 45 (5.9%) |
| 35 to 64 Years | 26 (1.7%) | 155 (9.2%) |
| 65 to 74 Years | 0 (0.0%) | 0 (0.0%) |
| 75 Years and over | 35 (14.4%) | 78 (19.4%) |
Disability Class: Ambulatory Difficulty
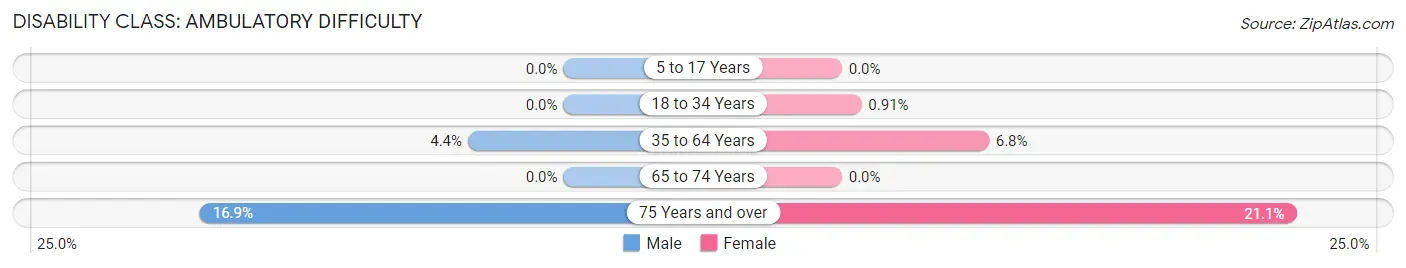
| Age Bracket | Male | Female |
| 5 to 17 Years | 0 (0.0%) | 0 (0.0%) |
| 18 to 34 Years | 0 (0.0%) | 7 (0.9%) |
| 35 to 64 Years | 68 (4.4%) | 115 (6.8%) |
| 65 to 74 Years | 0 (0.0%) | 0 (0.0%) |
| 75 Years and over | 41 (16.9%) | 85 (21.1%) |
Disability Class: Self-Care Difficulty
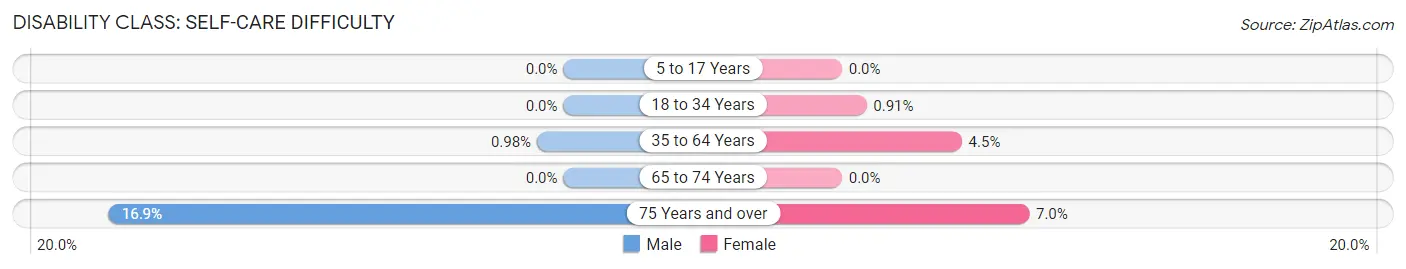
| Age Bracket | Male | Female |
| 5 to 17 Years | 0 (0.0%) | 0 (0.0%) |
| 18 to 34 Years | 0 (0.0%) | 7 (0.9%) |
| 35 to 64 Years | 15 (1.0%) | 75 (4.4%) |
| 65 to 74 Years | 0 (0.0%) | 0 (0.0%) |
| 75 Years and over | 41 (16.9%) | 28 (7.0%) |
Technology Access in Plymouth
Computing Device Access in Plymouth
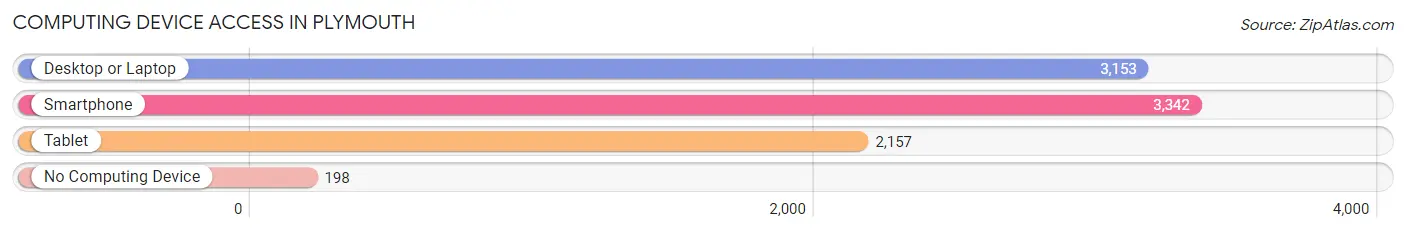
| Device Type | # Households | % Households |
| Desktop or Laptop | 3,153 | 85.0% |
| Smartphone | 3,342 | 90.1% |
| Tablet | 2,157 | 58.2% |
| No Computing Device | 198 | 5.3% |
| Total | 3,708 | 100.0% |
Internet Access in Plymouth
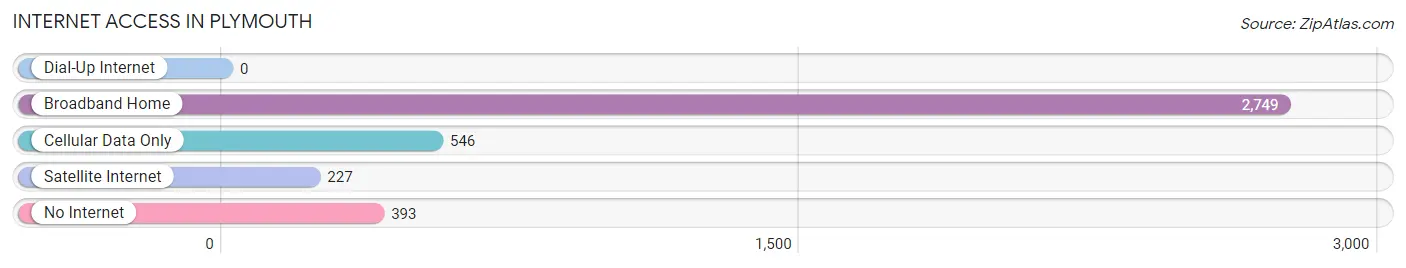
| Internet Type | # Households | % Households |
| Dial-Up Internet | 0 | 0.0% |
| Broadband Home | 2,749 | 74.1% |
| Cellular Data Only | 546 | 14.7% |
| Satellite Internet | 227 | 6.1% |
| No Internet | 393 | 10.6% |
| Total | 3,708 | 100.0% |
Plymouth Summary
Plymouth, Massachusetts is a town located in Plymouth County, in the southeastern part of the state. It is the oldest town in the United States, having been founded in 1620 by the Pilgrims. Plymouth is known for its historical significance, as it was the site of the first Thanksgiving in 1621. The town is also known for its beautiful beaches, its quaint downtown area, and its proximity to Boston.
Geography
Plymouth is located in southeastern Massachusetts, about 40 miles south of Boston. It is bordered by the towns of Carver, Kingston, Duxbury, and Marshfield. The town is situated on the western shore of Cape Cod Bay, and is home to several beaches, including Plymouth Beach, White Horse Beach, and Manomet Beach. The town is also home to several ponds, including Great Herring Pond, Little Herring Pond, and Long Pond. The town is mostly flat, with some hills in the northern part of town.
Economy
Plymouth’s economy is largely based on tourism, as the town is a popular destination for visitors from all over the world. The town is home to several attractions, including Plymouth Plantation, the Mayflower II, and the Plymouth Rock. The town is also home to several restaurants, shops, and hotels. In addition, Plymouth is home to several industries, including manufacturing, healthcare, and education.
Demographics
As of the 2010 census, Plymouth had a population of 58,271. The town is predominantly white, with a population that is 94.2% white, 2.2% Hispanic or Latino, 1.2% African American, and 1.2% Asian. The median household income in Plymouth is $68,845, and the median home value is $346,400.
History
Plymouth was founded in 1620 by the Pilgrims, who arrived on the Mayflower. The town was the site of the first Thanksgiving in 1621, and was the first permanent settlement in New England. The town was incorporated in 1685, and was the capital of the Plymouth Colony until 1691. During the American Revolution, Plymouth was the site of several battles, including the Battle of Plymouth in 1778. In the 19th century, the town became a popular summer resort destination, and was home to several prominent figures, including President John Adams. Today, Plymouth is a popular tourist destination, and is home to several historical sites, including Plymouth Plantation, the Mayflower II, and the Plymouth Rock.
Common Questions
What is Per Capita Income in Plymouth?
Per Capita income in Plymouth is $49,620.
What is the Median Family Income in Plymouth?
Median Family Income in Plymouth is $111,161.
What is the Median Household income in Plymouth?
Median Household Income in Plymouth is $74,500.
What is Income or Wage Gap in Plymouth?
Income or Wage Gap in Plymouth is 36.4%.
Women in Plymouth earn 63.6 cents for every dollar earned by a man.
What is Inequality or Gini Index in Plymouth?
Inequality or Gini Index in Plymouth is 0.44.
What is the Total Population of Plymouth?
Total Population of Plymouth is 7,649.
What is the Total Male Population of Plymouth?
Total Male Population of Plymouth is 3,794.
What is the Total Female Population of Plymouth?
Total Female Population of Plymouth is 3,855.
What is the Ratio of Males per 100 Females in Plymouth?
There are 98.42 Males per 100 Females in Plymouth.
What is the Ratio of Females per 100 Males in Plymouth?
There are 101.61 Females per 100 Males in Plymouth.
What is the Median Population Age in Plymouth?
Median Population Age in Plymouth is 45.0 Years.
What is the Average Family Size in Plymouth
Average Family Size in Plymouth is 2.9 People.
What is the Average Household Size in Plymouth
Average Household Size in Plymouth is 2.0 People.
How Large is the Labor Force in Plymouth?
There are 4,764 People in the Labor Forcein in Plymouth.
What is the Percentage of People in the Labor Force in Plymouth?
68.7% of People are in the Labor Force in Plymouth.
What is the Unemployment Rate in Plymouth?
Unemployment Rate in Plymouth is 6.0%.