Ville Platte, LA Map & Demographics
Ville Platte Map
Ville Platte Overview
$14,132
PER CAPITA INCOME
$30,106
AVG FAMILY INCOME
$24,341
AVG HOUSEHOLD INCOME
47.4%
WAGE / INCOME GAP [ % ]
52.6¢/ $1
WAGE / INCOME GAP [ $ ]
0.44
INEQUALITY / GINI INDEX
6,364
TOTAL POPULATION
3,202
MALE POPULATION
3,162
FEMALE POPULATION
101.27
MALES / 100 FEMALES
98.75
FEMALES / 100 MALES
37.6
MEDIAN AGE
3.3
AVG FAMILY SIZE
2.4
AVG HOUSEHOLD SIZE
2,837
LABOR FORCE [ PEOPLE ]
56.1%
PERCENT IN LABOR FORCE
24.8%
UNEMPLOYMENT RATE
Ville Platte Zip Codes
Ville Platte Area Codes
Income in Ville Platte
Income Overview in Ville Platte
Per Capita Income in Ville Platte is $14,132, while median incomes of families and households are $30,106 and $24,341 respectively.
| Characteristic | Number | Measure |
| Per Capita Income | 6,364 | $14,132 |
| Median Family Income | 1,442 | $30,106 |
| Mean Family Income | 1,442 | $36,278 |
| Median Household Income | 2,652 | $24,341 |
| Mean Household Income | 2,652 | $32,166 |
| Income Deficit | 1,442 | $0 |
| Wage / Income Gap (%) | 6,364 | 47.38% |
| Wage / Income Gap ($) | 6,364 | 52.62¢ per $1 |
| Gini / Inequality Index | 6,364 | 0.44 |
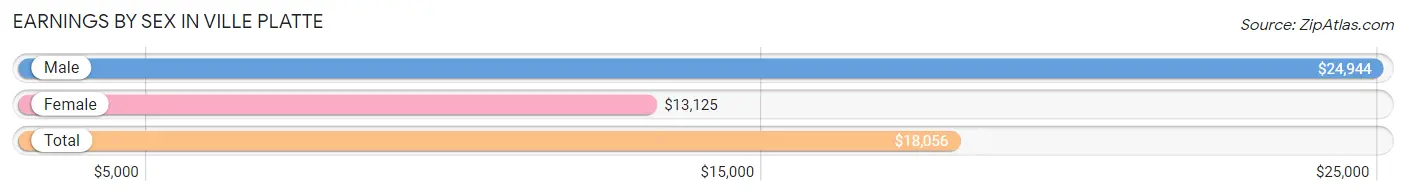
Earnings by Sex in Ville Platte
Average Earnings in Ville Platte are $18,056, $24,944 for men and $13,125 for women, a difference of 47.4%.
| Sex | Number | Average Earnings |
| Male | 1,324 (53.1%) | $24,944 |
| Female | 1,170 (46.9%) | $13,125 |
| Total | 2,494 (100.0%) | $18,056 |
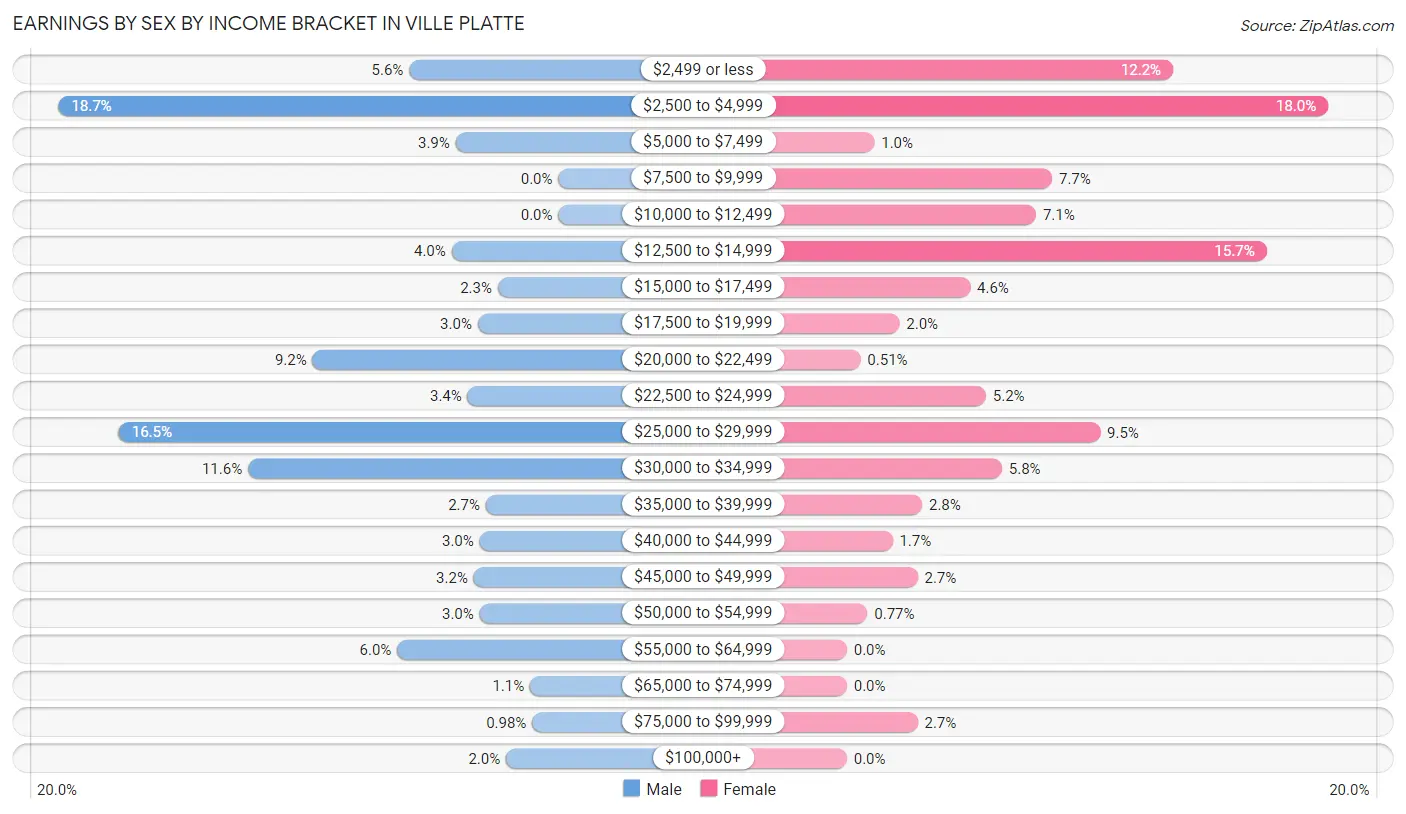
Earnings by Sex by Income Bracket in Ville Platte
The most common earnings brackets in Ville Platte are $2,500 to $4,999 for men (248 | 18.7%) and $2,500 to $4,999 for women (211 | 18.0%).
| Income | Male | Female |
| $2,499 or less | 74 (5.6%) | 143 (12.2%) |
| $2,500 to $4,999 | 248 (18.7%) | 211 (18.0%) |
| $5,000 to $7,499 | 51 (3.8%) | 12 (1.0%) |
| $7,500 to $9,999 | 0 (0.0%) | 90 (7.7%) |
| $10,000 to $12,499 | 0 (0.0%) | 83 (7.1%) |
| $12,500 to $14,999 | 53 (4.0%) | 184 (15.7%) |
| $15,000 to $17,499 | 30 (2.3%) | 54 (4.6%) |
| $17,500 to $19,999 | 40 (3.0%) | 23 (2.0%) |
| $20,000 to $22,499 | 122 (9.2%) | 6 (0.5%) |
| $22,500 to $24,999 | 45 (3.4%) | 61 (5.2%) |
| $25,000 to $29,999 | 218 (16.5%) | 111 (9.5%) |
| $30,000 to $34,999 | 154 (11.6%) | 68 (5.8%) |
| $35,000 to $39,999 | 36 (2.7%) | 33 (2.8%) |
| $40,000 to $44,999 | 39 (2.9%) | 20 (1.7%) |
| $45,000 to $49,999 | 42 (3.2%) | 31 (2.6%) |
| $50,000 to $54,999 | 39 (2.9%) | 9 (0.8%) |
| $55,000 to $64,999 | 80 (6.0%) | 0 (0.0%) |
| $65,000 to $74,999 | 14 (1.1%) | 0 (0.0%) |
| $75,000 to $99,999 | 13 (1.0%) | 31 (2.6%) |
| $100,000+ | 26 (2.0%) | 0 (0.0%) |
| Total | 1,324 (100.0%) | 1,170 (100.0%) |
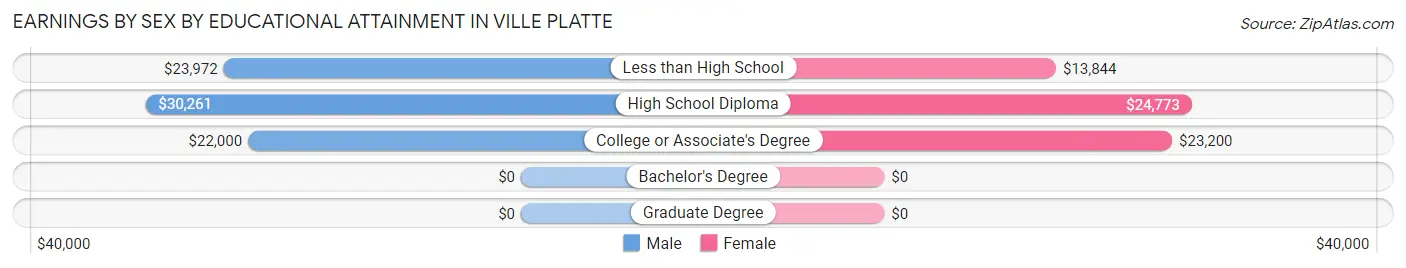
Earnings by Sex by Educational Attainment in Ville Platte
Average earnings in Ville Platte are $28,750 for men and $16,204 for women, a difference of 43.6%. Men with an educational attainment of high school diploma enjoy the highest average annual earnings of $30,261, while those with college or associate's degree education earn the least with $22,000. Women with an educational attainment of high school diploma earn the most with the average annual earnings of $24,773, while those with less than high school education have the smallest earnings of $13,844.
| Educational Attainment | Male Income | Female Income |
| Less than High School | $23,972 | $13,844 |
| High School Diploma | $30,261 | $24,773 |
| College or Associate's Degree | $22,000 | $23,200 |
| Bachelor's Degree | - | - |
| Graduate Degree | - | - |
| Total | $28,750 | $16,204 |
Family Income in Ville Platte
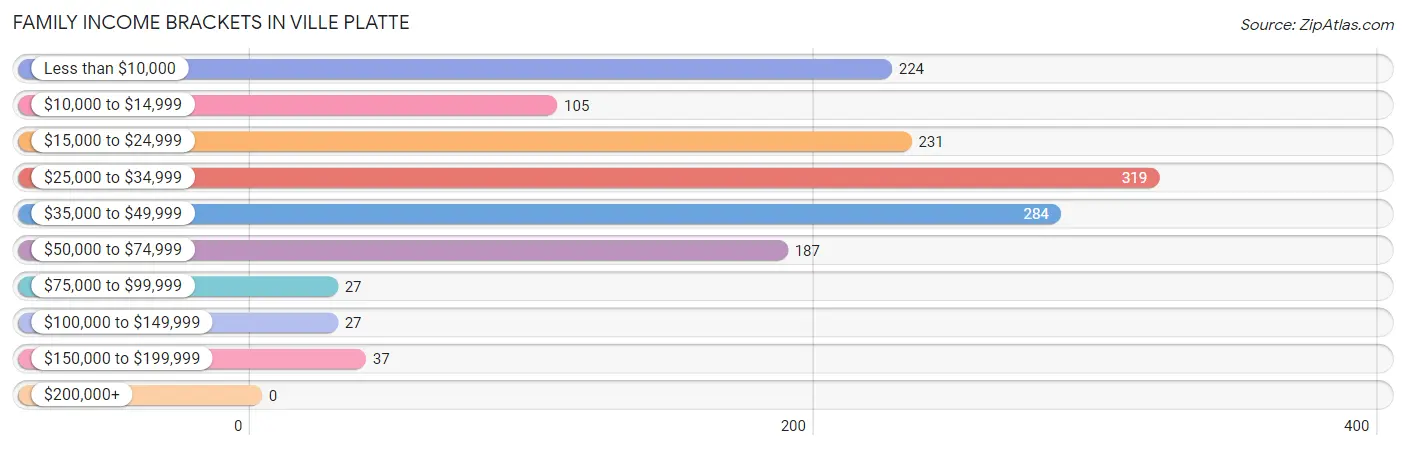
Family Income Brackets in Ville Platte
According to the Ville Platte family income data, there are 319 families falling into the $25,000 to $34,999 income range, which is the most common income bracket and makes up 22.1% of all families.
| Income Bracket | # Families | % Families |
| Less than $10,000 | 224 | 15.5% |
| $10,000 to $14,999 | 105 | 7.3% |
| $15,000 to $24,999 | 231 | 16.0% |
| $25,000 to $34,999 | 319 | 22.1% |
| $35,000 to $49,999 | 284 | 19.7% |
| $50,000 to $74,999 | 187 | 13.0% |
| $75,000 to $99,999 | 27 | 1.9% |
| $100,000 to $149,999 | 27 | 1.9% |
| $150,000 to $199,999 | 37 | 2.6% |
| $200,000+ | 0 | 0.0% |
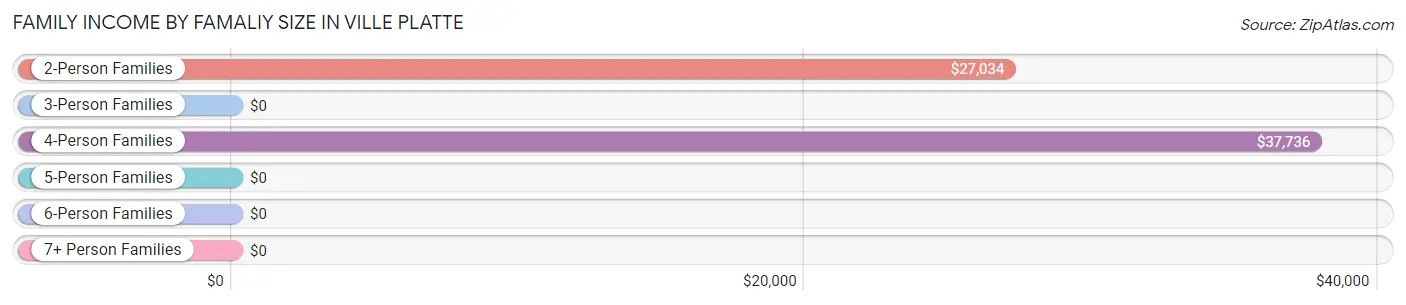
Family Income by Famaliy Size in Ville Platte
4-person families (327 | 22.7%) account for the highest median family income in Ville Platte with $37,736 per family, while 2-person families (943 | 65.4%) have the highest median income of $13,517 per family member.
| Income Bracket | # Families | Median Income |
| 2-Person Families | 943 (65.4%) | $27,034 |
| 3-Person Families | 150 (10.4%) | $0 |
| 4-Person Families | 327 (22.7%) | $37,736 |
| 5-Person Families | 11 (0.8%) | $0 |
| 6-Person Families | 0 (0.0%) | $0 |
| 7+ Person Families | 11 (0.8%) | $0 |
| Total | 1,442 (100.0%) | $30,106 |
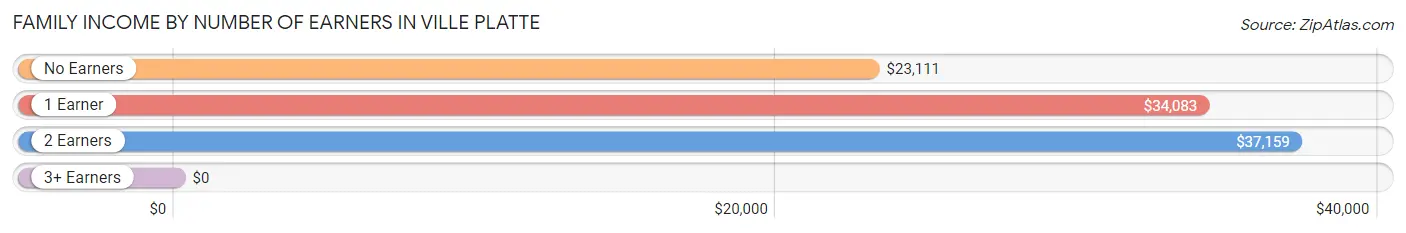
Family Income by Number of Earners in Ville Platte
| Number of Earners | # Families | Median Income |
| No Earners | 444 (30.8%) | $23,111 |
| 1 Earner | 699 (48.5%) | $34,083 |
| 2 Earners | 299 (20.7%) | $37,159 |
| 3+ Earners | 0 (0.0%) | $0 |
| Total | 1,442 (100.0%) | $30,106 |
Household Income in Ville Platte
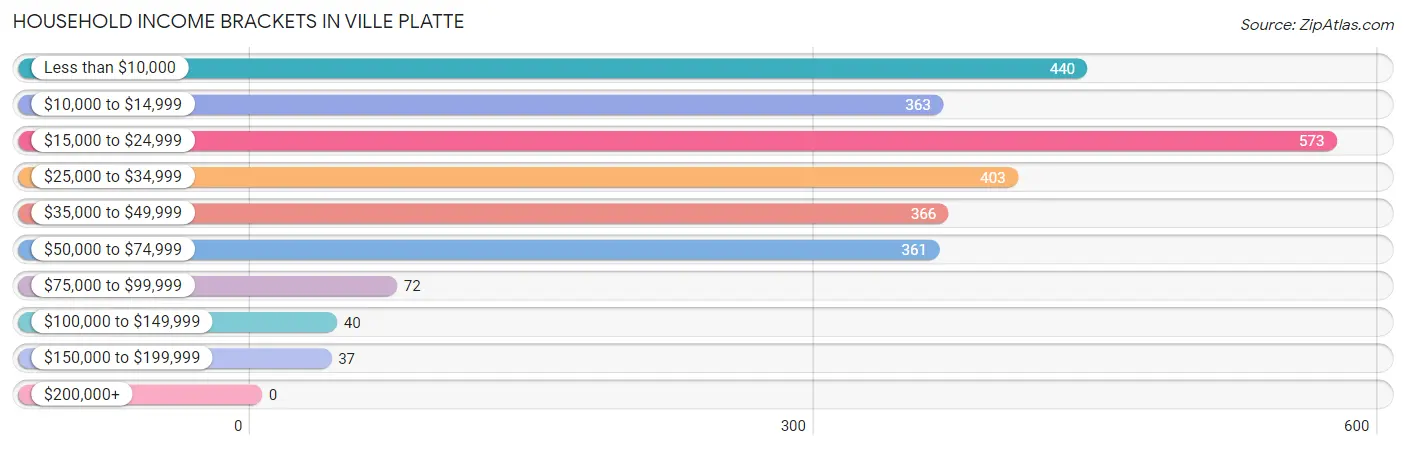
Household Income Brackets in Ville Platte
With 573 households falling in the category, the $15,000 to $24,999 income range is the most frequent in Ville Platte, accounting for 21.6% of all households.
| Income Bracket | # Households | % Households |
| Less than $10,000 | 440 | 16.6% |
| $10,000 to $14,999 | 363 | 13.7% |
| $15,000 to $24,999 | 573 | 21.6% |
| $25,000 to $34,999 | 403 | 15.2% |
| $35,000 to $49,999 | 366 | 13.8% |
| $50,000 to $74,999 | 361 | 13.6% |
| $75,000 to $99,999 | 72 | 2.7% |
| $100,000 to $149,999 | 40 | 1.5% |
| $150,000 to $199,999 | 37 | 1.4% |
| $200,000+ | 0 | 0.0% |
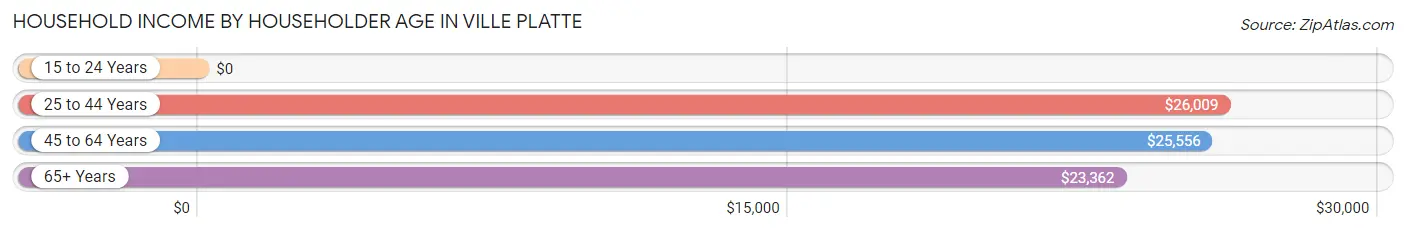
Household Income by Householder Age in Ville Platte
The median household income in Ville Platte is $24,341, with the highest median household income of $26,009 found in the 25 to 44 years age bracket for the primary householder. A total of 752 households (28.4%) fall into this category. Meanwhile, the 15 to 24 years age bracket for the primary householder has the lowest median household income of $0, with 318 households (12.0%) in this group.
| Income Bracket | # Households | Median Income |
| 15 to 24 Years | 318 (12.0%) | $0 |
| 25 to 44 Years | 752 (28.4%) | $26,009 |
| 45 to 64 Years | 732 (27.6%) | $25,556 |
| 65+ Years | 850 (32.1%) | $23,362 |
| Total | 2,652 (100.0%) | $24,341 |
Poverty in Ville Platte
Income Below Poverty by Sex and Age in Ville Platte
With 33.5% poverty level for males and 50.0% for females among the residents of Ville Platte, 16 and 17 year old males and 18 to 24 year old females are the most vulnerable to poverty, with 97 males (87.4%) and 360 females (80.9%) in their respective age groups living below the poverty level.
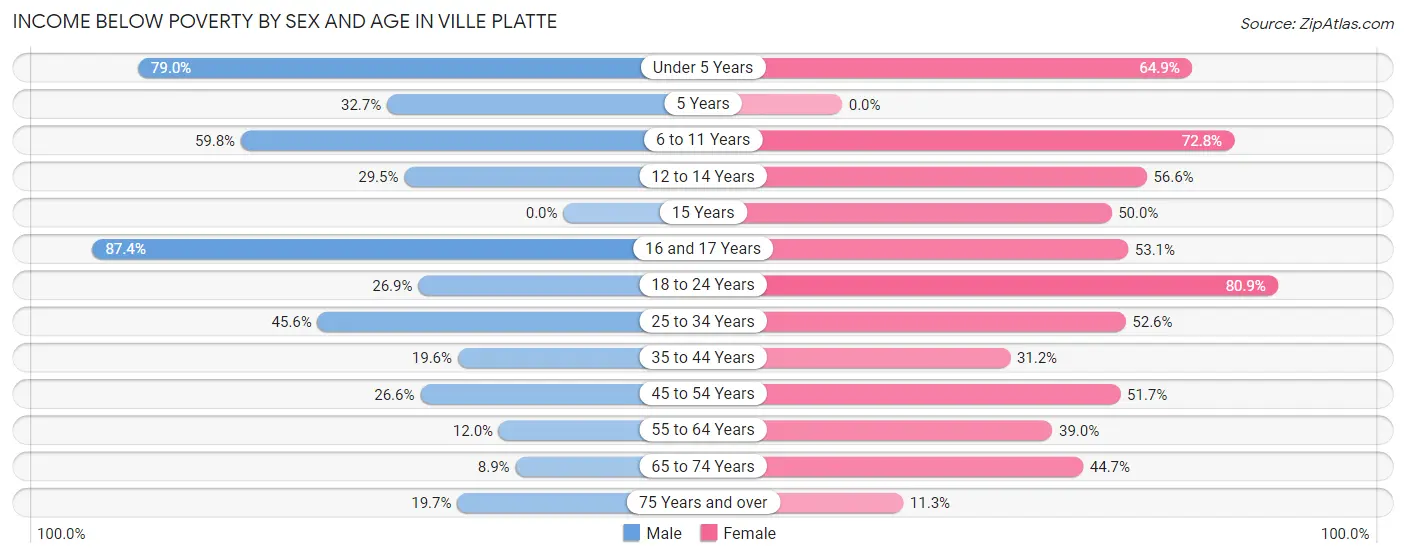
| Age Bracket | Male | Female |
| Under 5 Years | 274 (79.0%) | 87 (64.9%) |
| 5 Years | 18 (32.7%) | 0 (0.0%) |
| 6 to 11 Years | 76 (59.8%) | 238 (72.8%) |
| 12 to 14 Years | 31 (29.5%) | 82 (56.6%) |
| 15 Years | 0 (0.0%) | 19 (50.0%) |
| 16 and 17 Years | 97 (87.4%) | 60 (53.1%) |
| 18 to 24 Years | 108 (26.9%) | 360 (80.9%) |
| 25 to 34 Years | 187 (45.6%) | 130 (52.6%) |
| 35 to 44 Years | 122 (19.6%) | 98 (31.2%) |
| 45 to 54 Years | 60 (26.6%) | 156 (51.7%) |
| 55 to 64 Years | 39 (12.0%) | 169 (39.0%) |
| 65 to 74 Years | 24 (8.9%) | 136 (44.7%) |
| 75 Years and over | 37 (19.7%) | 39 (11.3%) |
| Total | 1,073 (33.5%) | 1,574 (50.0%) |
Income Above Poverty by Sex and Age in Ville Platte
According to the poverty statistics in Ville Platte, males aged 15 years and females aged 75 years and over are the age groups that are most secure financially, with 100.0% of males and 88.7% of females in these age groups living above the poverty line.
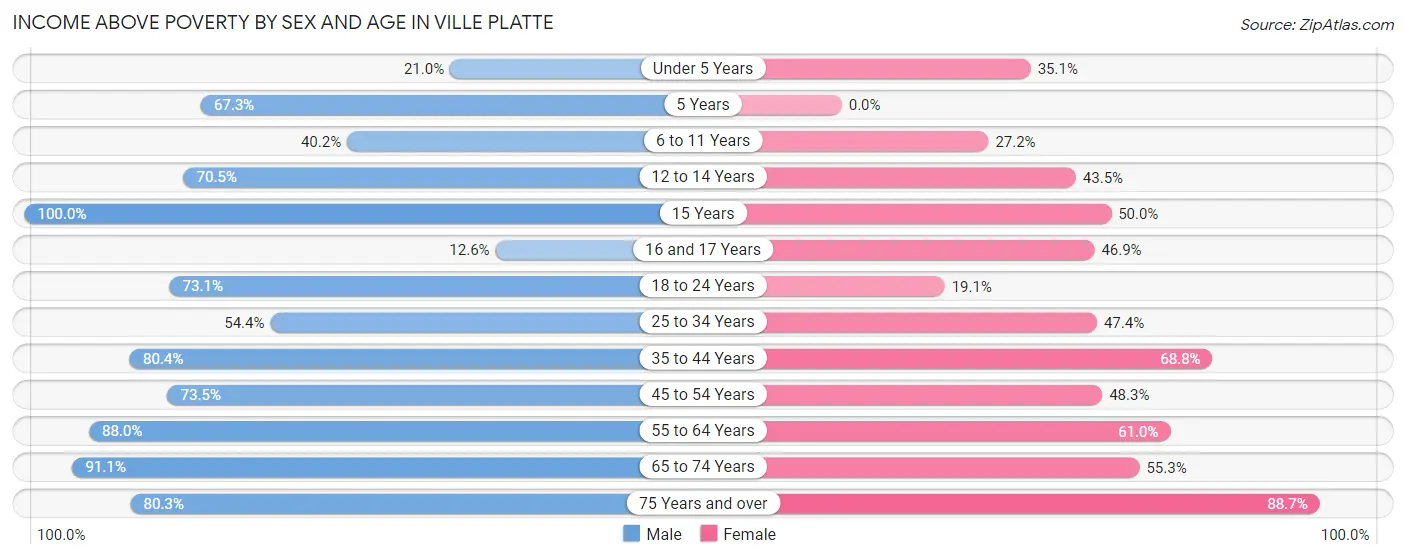
| Age Bracket | Male | Female |
| Under 5 Years | 73 (21.0%) | 47 (35.1%) |
| 5 Years | 37 (67.3%) | 0 (0.0%) |
| 6 to 11 Years | 51 (40.2%) | 89 (27.2%) |
| 12 to 14 Years | 74 (70.5%) | 63 (43.4%) |
| 15 Years | 13 (100.0%) | 19 (50.0%) |
| 16 and 17 Years | 14 (12.6%) | 53 (46.9%) |
| 18 to 24 Years | 293 (73.1%) | 85 (19.1%) |
| 25 to 34 Years | 223 (54.4%) | 117 (47.4%) |
| 35 to 44 Years | 501 (80.4%) | 216 (68.8%) |
| 45 to 54 Years | 166 (73.5%) | 146 (48.3%) |
| 55 to 64 Years | 287 (88.0%) | 264 (61.0%) |
| 65 to 74 Years | 246 (91.1%) | 168 (55.3%) |
| 75 Years and over | 151 (80.3%) | 305 (88.7%) |
| Total | 2,129 (66.5%) | 1,572 (50.0%) |
Income Below Poverty Among Married-Couple Families in Ville Platte
The poverty statistics for married-couple families in Ville Platte show that 13.9% or 81 of the total 584 families live below the poverty line. Families with 1 or 2 children have the highest poverty rate of 23.0%, comprising of 40 families. On the other hand, families with no children have the lowest poverty rate of 10.0%, which includes 41 families.
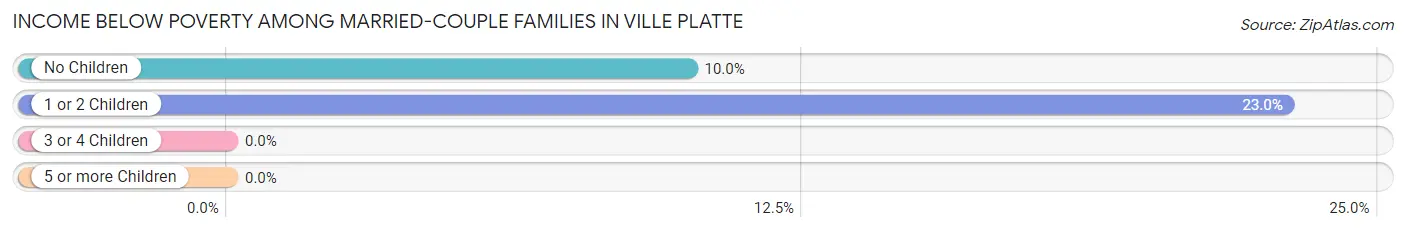
| Children | Above Poverty | Below Poverty |
| No Children | 369 (90.0%) | 41 (10.0%) |
| 1 or 2 Children | 134 (77.0%) | 40 (23.0%) |
| 3 or 4 Children | 0 (0.0%) | 0 (0.0%) |
| 5 or more Children | 0 (0.0%) | 0 (0.0%) |
| Total | 503 (86.1%) | 81 (13.9%) |
Income Below Poverty Among Single-Parent Households in Ville Platte
According to the poverty data in Ville Platte, 28.1% or 59 single-father households and 53.9% or 349 single-mother households are living below the poverty line. Among single-father households, those with 1 or 2 children have the highest poverty rate, with 59 households (33.0%) experiencing poverty. Likewise, among single-mother households, those with 3 or 4 children have the highest poverty rate, with 42 households (100.0%) falling below the poverty line.
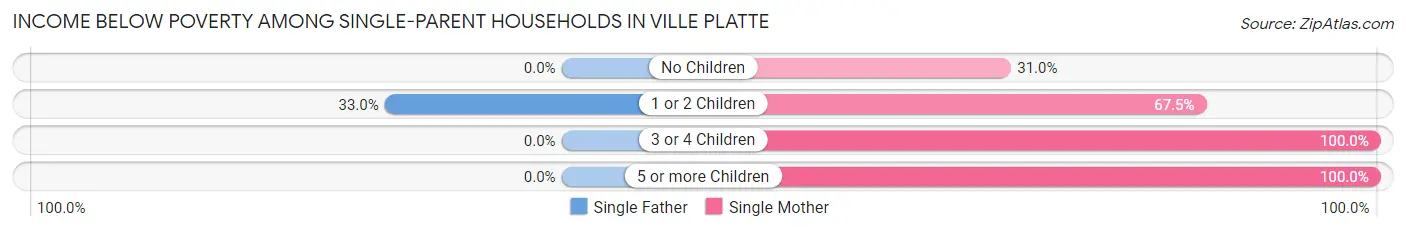
| Children | Single Father | Single Mother |
| No Children | 0 (0.0%) | 90 (31.0%) |
| 1 or 2 Children | 59 (33.0%) | 206 (67.5%) |
| 3 or 4 Children | 0 (0.0%) | 42 (100.0%) |
| 5 or more Children | 0 (0.0%) | 11 (100.0%) |
| Total | 59 (28.1%) | 349 (53.9%) |
Income Below Poverty Among Married-Couple vs Single-Parent Households in Ville Platte
The poverty data for Ville Platte shows that 81 of the married-couple family households (13.9%) and 408 of the single-parent households (47.5%) are living below the poverty level. Within the married-couple family households, those with 1 or 2 children have the highest poverty rate, with 40 households (23.0%) falling below the poverty line. Among the single-parent households, those with 5 or more children have the highest poverty rate, with 11 household (100.0%) living below poverty.
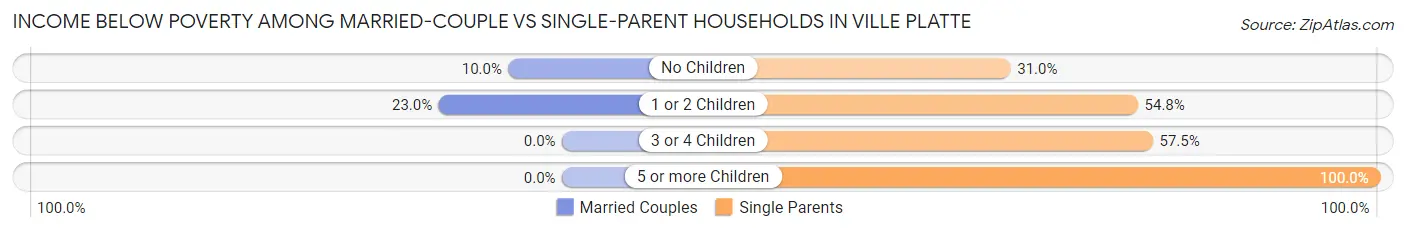
| Children | Married-Couple Families | Single-Parent Households |
| No Children | 41 (10.0%) | 90 (31.0%) |
| 1 or 2 Children | 40 (23.0%) | 265 (54.7%) |
| 3 or 4 Children | 0 (0.0%) | 42 (57.5%) |
| 5 or more Children | 0 (0.0%) | 11 (100.0%) |
| Total | 81 (13.9%) | 408 (47.5%) |
Race in Ville Platte
The most populous races in Ville Platte are Black / African American (4,334 | 68.1%), White / Caucasian (1,616 | 25.4%), and Two or more Races (381 | 6.0%).
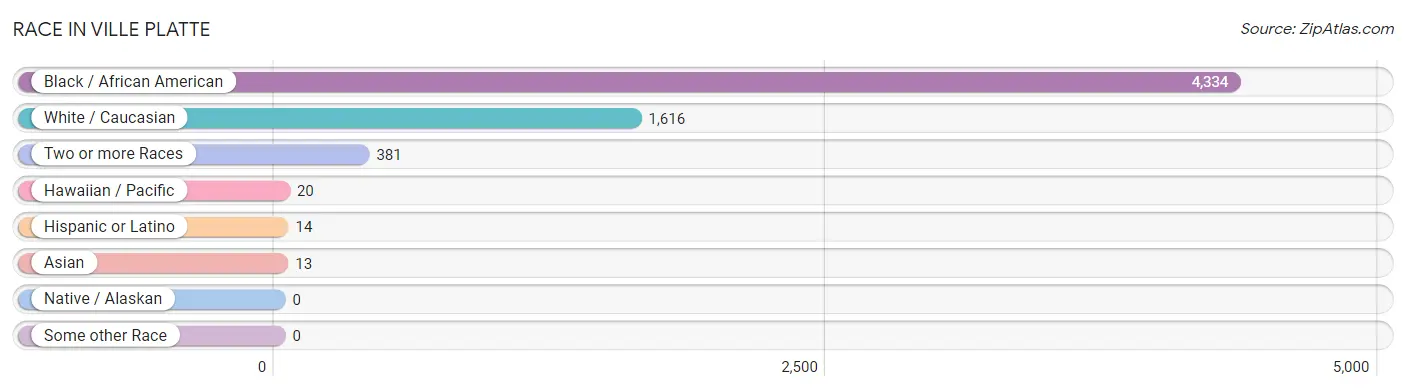
| Race | # Population | % Population |
| Asian | 13 | 0.2% |
| Black / African American | 4,334 | 68.1% |
| Hawaiian / Pacific | 20 | 0.3% |
| Hispanic or Latino | 14 | 0.2% |
| Native / Alaskan | 0 | 0.0% |
| White / Caucasian | 1,616 | 25.4% |
| Two or more Races | 381 | 6.0% |
| Some other Race | 0 | 0.0% |
| Total | 6,364 | 100.0% |
Ancestry in Ville Platte
The most populous ancestries reported in Ville Platte are French (915 | 14.4%), American (210 | 3.3%), French Canadian (92 | 1.5%), English (73 | 1.1%), and Irish (69 | 1.1%), together accounting for 21.4% of all Ville Platte residents.
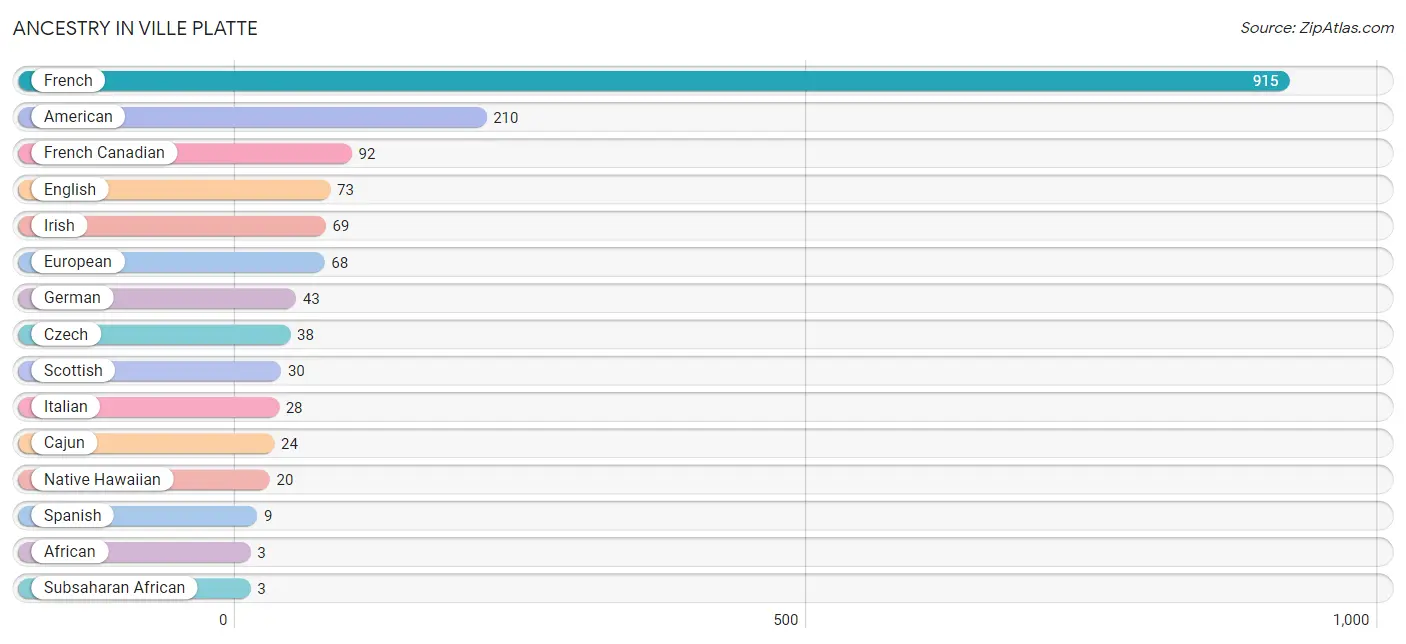
| Ancestry | # Population | % Population |
| African | 3 | 0.1% |
| American | 210 | 3.3% |
| Cajun | 24 | 0.4% |
| Czech | 38 | 0.6% |
| English | 73 | 1.1% |
| European | 68 | 1.1% |
| French | 915 | 14.4% |
| French Canadian | 92 | 1.5% |
| German | 43 | 0.7% |
| Irish | 69 | 1.1% |
| Italian | 28 | 0.4% |
| Native Hawaiian | 20 | 0.3% |
| Scottish | 30 | 0.5% |
| Spanish | 9 | 0.1% |
| Subsaharan African | 3 | 0.1% | View All 15 Rows |
Immigrants in Ville Platte
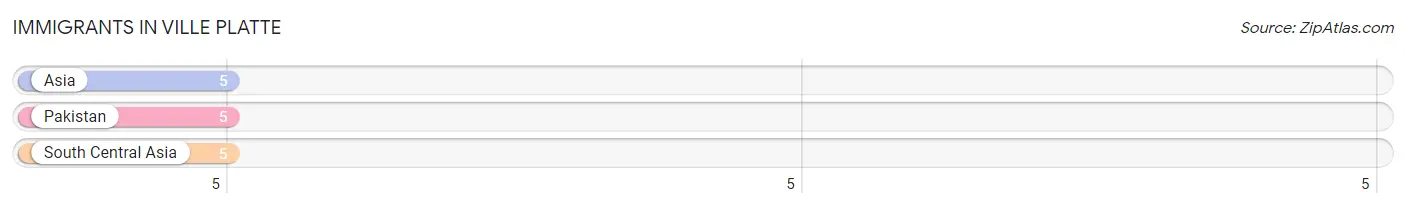
The most numerous immigrant groups reported in Ville Platte came from Asia (5 | 0.1%), Pakistan (5 | 0.1%), and South Central Asia (5 | 0.1%), together accounting for 0.2% of all Ville Platte residents.
| Immigration Origin | # Population | % Population |
| Asia | 5 | 0.1% |
| Pakistan | 5 | 0.1% |
| South Central Asia | 5 | 0.1% | View All 3 Rows |
Sex and Age in Ville Platte
Sex and Age in Ville Platte
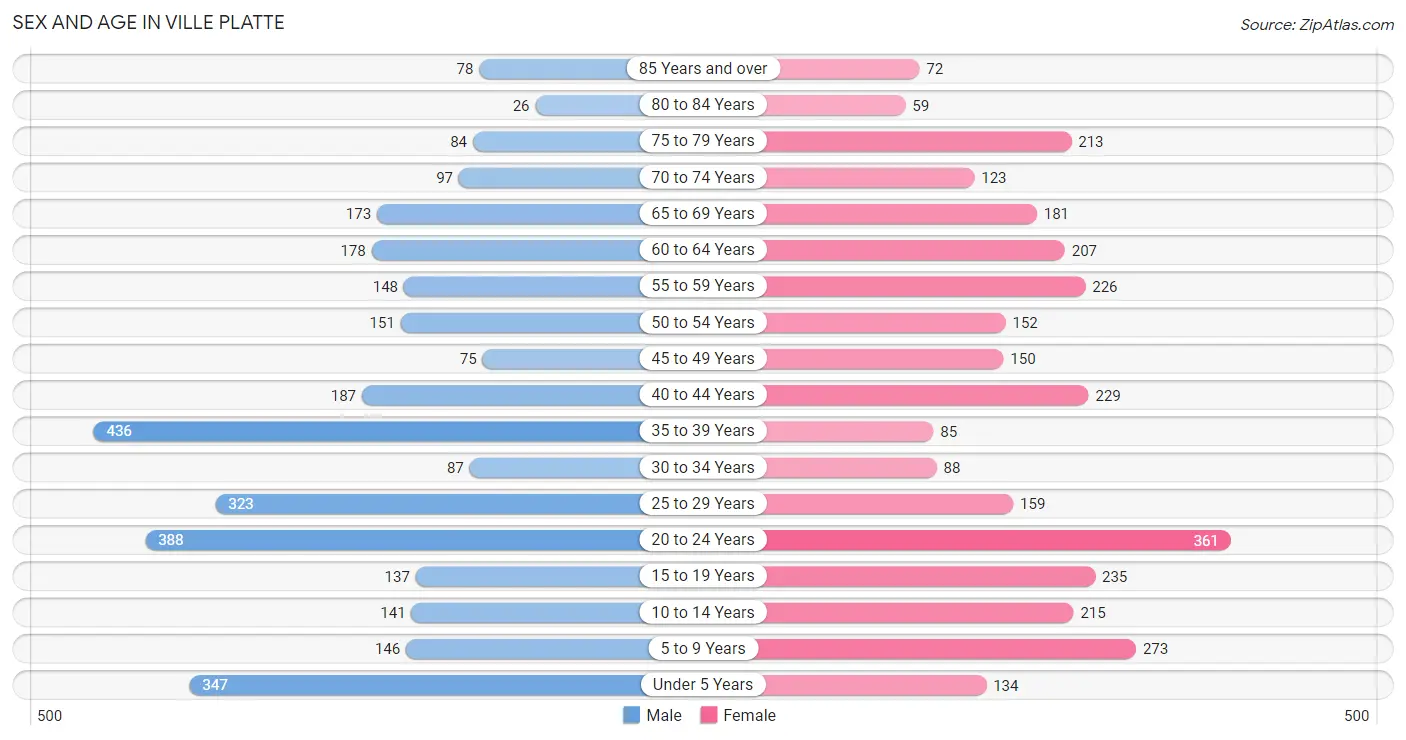
The most populous age groups in Ville Platte are 35 to 39 Years (436 | 13.6%) for men and 20 to 24 Years (361 | 11.4%) for women.
| Age Bracket | Male | Female |
| Under 5 Years | 347 (10.8%) | 134 (4.2%) |
| 5 to 9 Years | 146 (4.6%) | 273 (8.6%) |
| 10 to 14 Years | 141 (4.4%) | 215 (6.8%) |
| 15 to 19 Years | 137 (4.3%) | 235 (7.4%) |
| 20 to 24 Years | 388 (12.1%) | 361 (11.4%) |
| 25 to 29 Years | 323 (10.1%) | 159 (5.0%) |
| 30 to 34 Years | 87 (2.7%) | 88 (2.8%) |
| 35 to 39 Years | 436 (13.6%) | 85 (2.7%) |
| 40 to 44 Years | 187 (5.8%) | 229 (7.2%) |
| 45 to 49 Years | 75 (2.3%) | 150 (4.7%) |
| 50 to 54 Years | 151 (4.7%) | 152 (4.8%) |
| 55 to 59 Years | 148 (4.6%) | 226 (7.1%) |
| 60 to 64 Years | 178 (5.6%) | 207 (6.6%) |
| 65 to 69 Years | 173 (5.4%) | 181 (5.7%) |
| 70 to 74 Years | 97 (3.0%) | 123 (3.9%) |
| 75 to 79 Years | 84 (2.6%) | 213 (6.7%) |
| 80 to 84 Years | 26 (0.8%) | 59 (1.9%) |
| 85 Years and over | 78 (2.4%) | 72 (2.3%) |
| Total | 3,202 (100.0%) | 3,162 (100.0%) |
Families and Households in Ville Platte
Median Family Size in Ville Platte
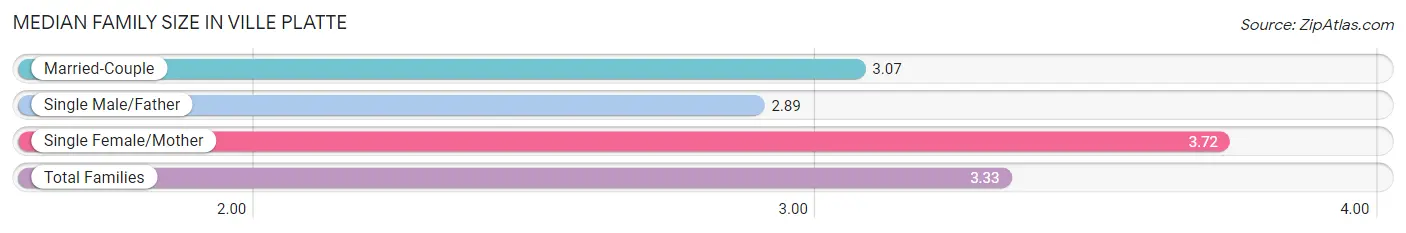
The median family size in Ville Platte is 3.33 persons per family, with single female/mother families (648 | 44.9%) accounting for the largest median family size of 3.72 persons per family. On the other hand, single male/father families (210 | 14.6%) represent the smallest median family size with 2.89 persons per family.
| Family Type | # Families | Family Size |
| Married-Couple | 584 (40.5%) | 3.07 |
| Single Male/Father | 210 (14.6%) | 2.89 |
| Single Female/Mother | 648 (44.9%) | 3.72 |
| Total Families | 1,442 (100.0%) | 3.33 |
Median Household Size in Ville Platte
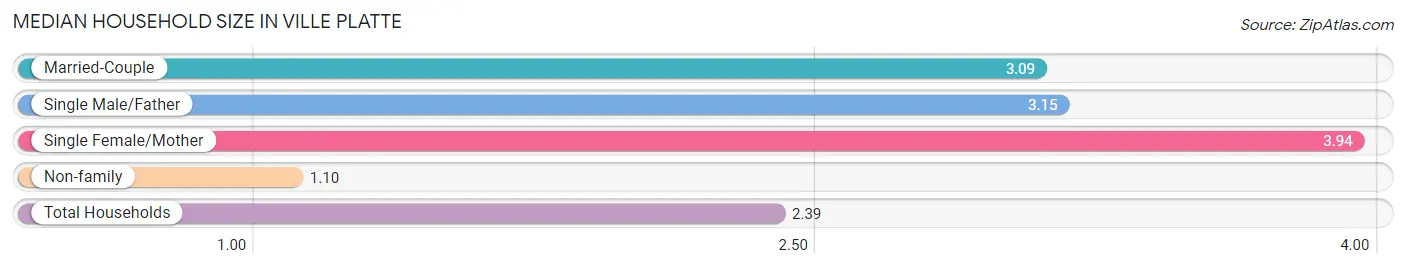
The median household size in Ville Platte is 2.39 persons per household, with single female/mother households (648 | 24.4%) accounting for the largest median household size of 3.94 persons per household. non-family households (1,210 | 45.6%) represent the smallest median household size with 1.10 persons per household.
| Household Type | # Households | Household Size |
| Married-Couple | 584 (22.0%) | 3.09 |
| Single Male/Father | 210 (7.9%) | 3.15 |
| Single Female/Mother | 648 (24.4%) | 3.94 |
| Non-family | 1,210 (45.6%) | 1.10 |
| Total Households | 2,652 (100.0%) | 2.39 |
Household Size by Marriage Status in Ville Platte
Out of a total of 2,652 households in Ville Platte, 1,442 (54.4%) are family households, while 1,210 (45.6%) are nonfamily households. The most numerous type of family households are 2-person households, comprising 761, and the most common type of nonfamily households are 1-person households, comprising 1,076.
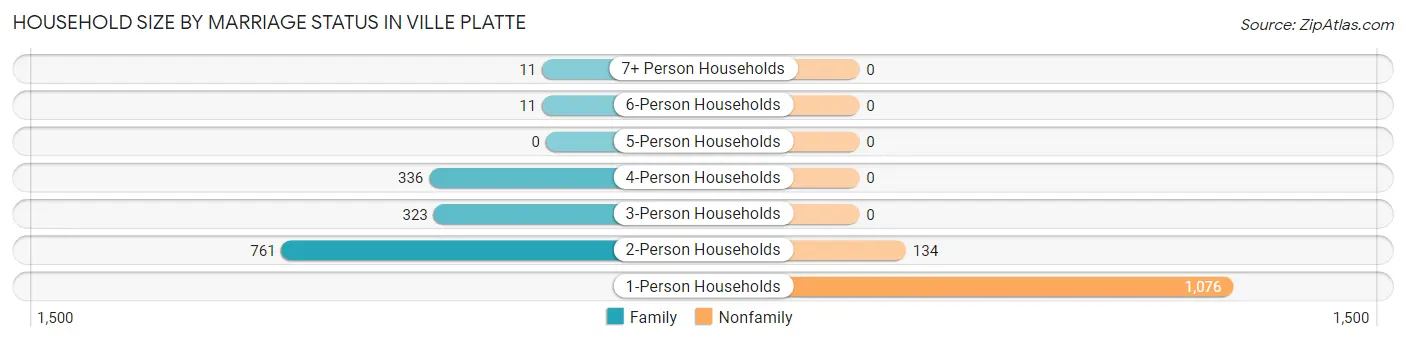
| Household Size | Family Households | Nonfamily Households |
| 1-Person Households | - | 1,076 (40.6%) |
| 2-Person Households | 761 (28.7%) | 134 (5.1%) |
| 3-Person Households | 323 (12.2%) | 0 (0.0%) |
| 4-Person Households | 336 (12.7%) | 0 (0.0%) |
| 5-Person Households | 0 (0.0%) | 0 (0.0%) |
| 6-Person Households | 11 (0.4%) | 0 (0.0%) |
| 7+ Person Households | 11 (0.4%) | 0 (0.0%) |
| Total | 1,442 (54.4%) | 1,210 (45.6%) |
Female Fertility in Ville Platte
Fertility by Age in Ville Platte
Average fertility rate in Ville Platte is 84.0 births per 1,000 women. Women in the age bracket of 20 to 34 years have the highest fertility rate with 143.0 births per 1,000 women. Women in the age bracket of 20 to 34 years acount for 79.1% of all women with births.
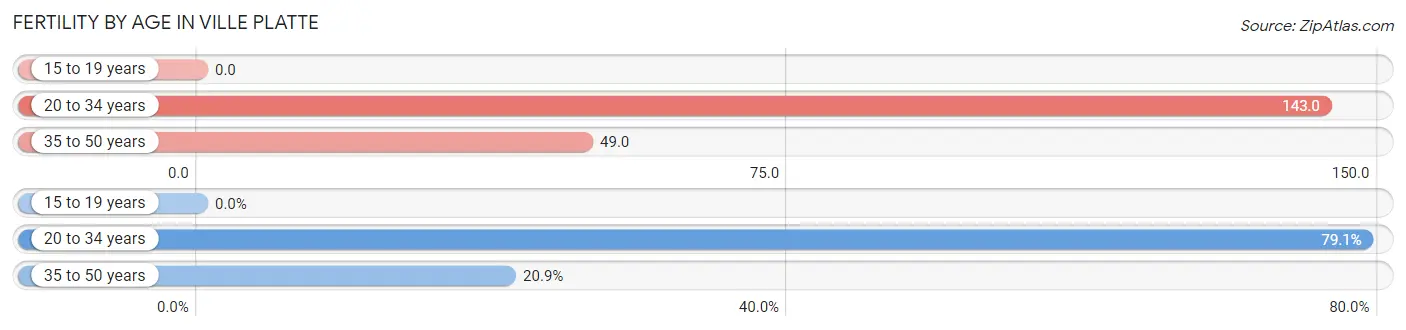
| Age Bracket | Women with Births | Births / 1,000 Women |
| 15 to 19 years | 0 (0.0%) | 0.0 |
| 20 to 34 years | 87 (79.1%) | 143.0 |
| 35 to 50 years | 23 (20.9%) | 49.0 |
| Total | 110 (100.0%) | 84.0 |
Fertility by Age by Marriage Status in Ville Platte
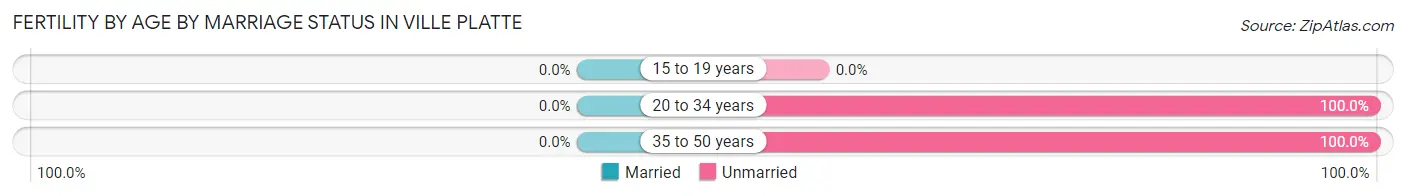
| Age Bracket | Married | Unmarried |
| 15 to 19 years | 0 (0.0%) | 0 (0.0%) |
| 20 to 34 years | 0 (0.0%) | 87 (100.0%) |
| 35 to 50 years | 0 (0.0%) | 23 (100.0%) |
| Total | 0 (0.0%) | 110 (100.0%) |
Fertility by Education in Ville Platte
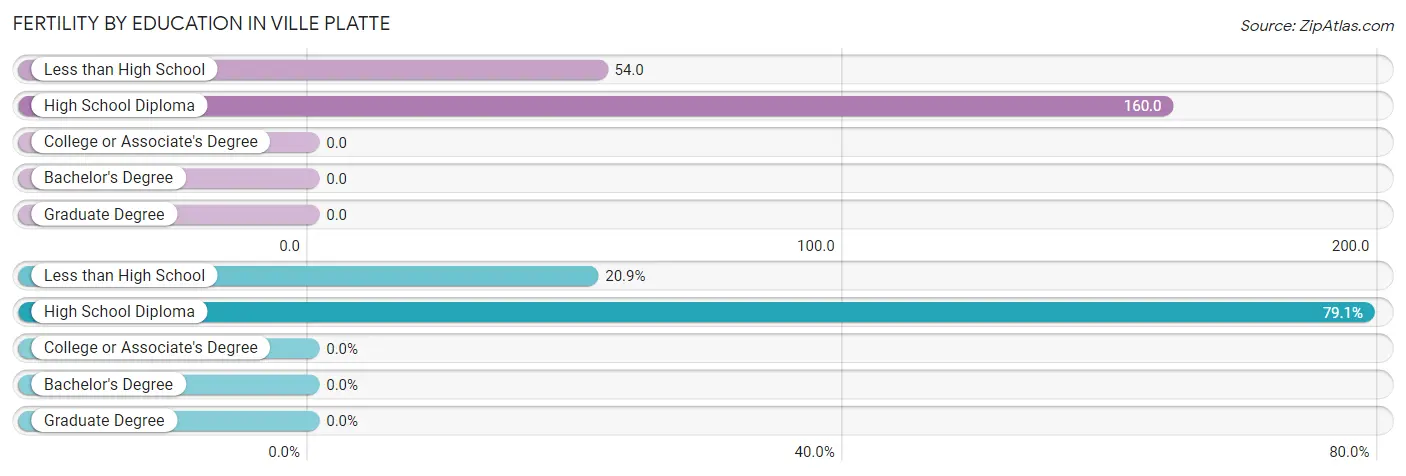
| Educational Attainment | Women with Births | Births / 1,000 Women |
| Less than High School | 23 (20.9%) | 54.0 |
| High School Diploma | 87 (79.1%) | 160.0 |
| College or Associate's Degree | 0 (0.0%) | 0.0 |
| Bachelor's Degree | 0 (0.0%) | 0.0 |
| Graduate Degree | 0 (0.0%) | 0.0 |
| Total | 110 (100.0%) | 84.0 |
Fertility by Education by Marriage Status in Ville Platte
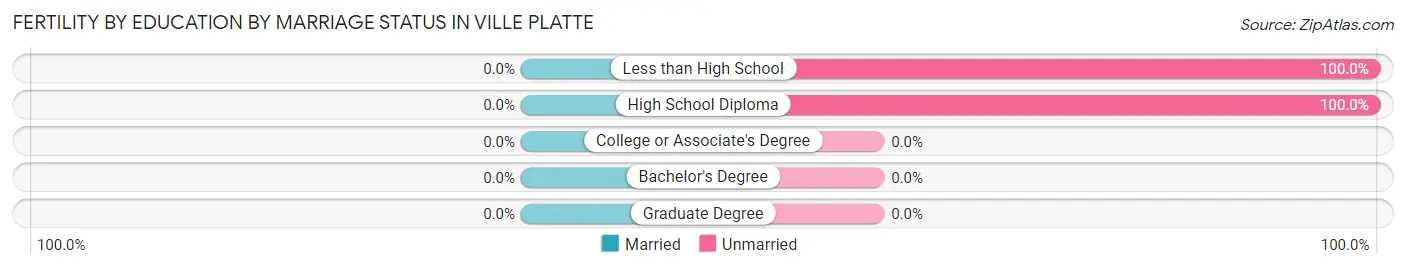
| Educational Attainment | Married | Unmarried |
| Less than High School | 0 (0.0%) | 23 (100.0%) |
| High School Diploma | 0 (0.0%) | 87 (100.0%) |
| College or Associate's Degree | 0 (0.0%) | 0 (0.0%) |
| Bachelor's Degree | 0 (0.0%) | 0 (0.0%) |
| Graduate Degree | 0 (0.0%) | 0 (0.0%) |
| Total | 0 (0.0%) | 110 (100.0%) |
Employment Characteristics in Ville Platte
Employment by Class of Employer in Ville Platte
Among the 1,962 employed individuals in Ville Platte, private company employees (1,523 | 77.6%), local government employees (132 | 6.7%), and not-for-profit organizations (104 | 5.3%) make up the most common classes of employment.
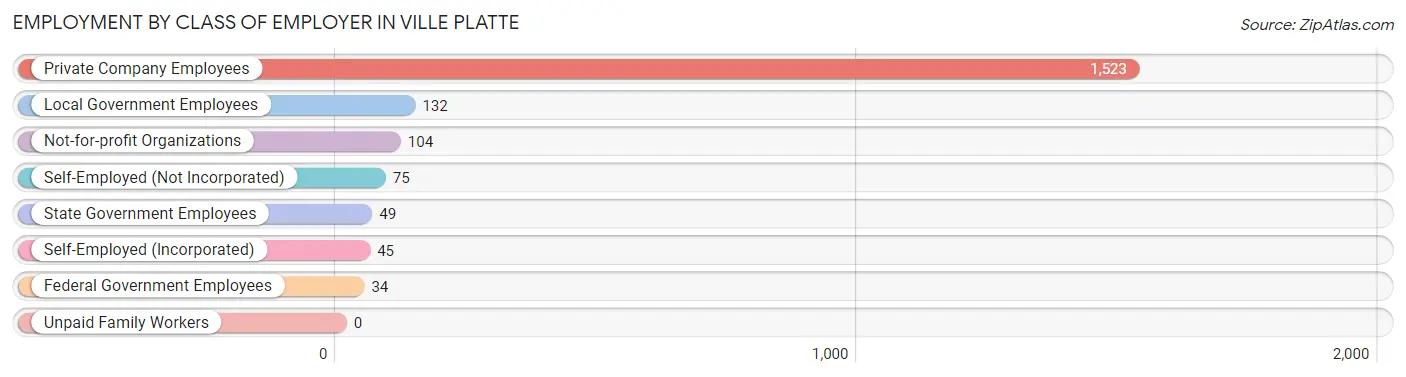
| Employer Class | # Employees | % Employees |
| Private Company Employees | 1,523 | 77.6% |
| Self-Employed (Incorporated) | 45 | 2.3% |
| Self-Employed (Not Incorporated) | 75 | 3.8% |
| Not-for-profit Organizations | 104 | 5.3% |
| Local Government Employees | 132 | 6.7% |
| State Government Employees | 49 | 2.5% |
| Federal Government Employees | 34 | 1.7% |
| Unpaid Family Workers | 0 | 0.0% |
| Total | 1,962 | 100.0% |
Employment Status by Age in Ville Platte
According to the labor force statistics for Ville Platte, out of the total population over 16 years of age (5,057), 56.1% or 2,837 individuals are in the labor force, with 24.8% or 704 of them unemployed. The age group with the highest labor force participation rate is 20 to 24 years, with 81.3% or 609 individuals in the labor force. Within the labor force, the 35 to 44 years age range has the highest percentage of unemployed individuals, with 51.4% or 347 of them being unemployed.
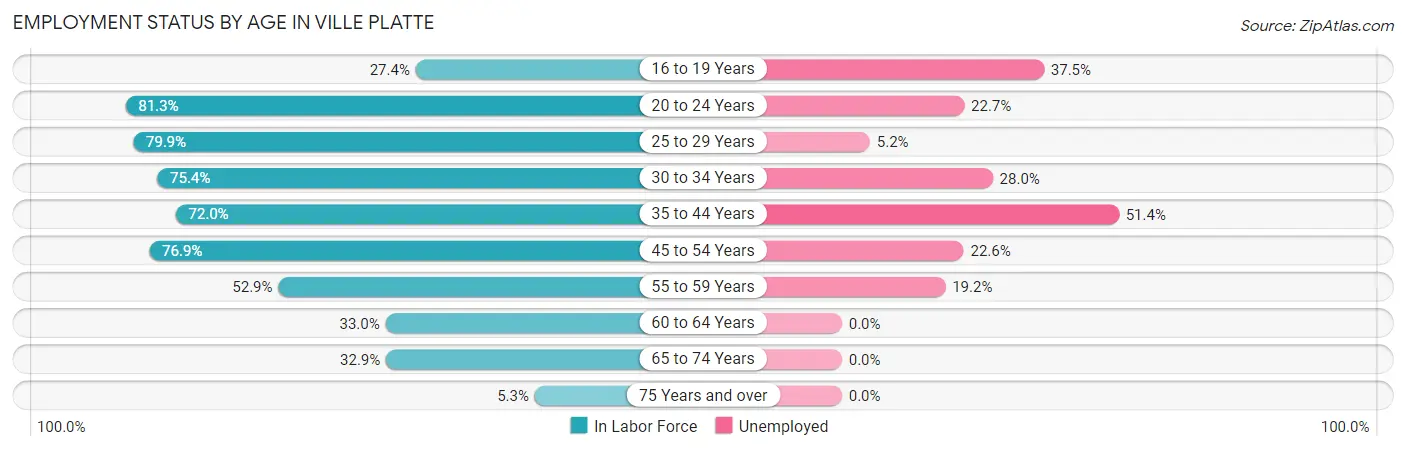
| Age Bracket | In Labor Force | Unemployed |
| 16 to 19 Years | 88 (27.4%) | 33 (37.5%) |
| 20 to 24 Years | 609 (81.3%) | 138 (22.7%) |
| 25 to 29 Years | 385 (79.9%) | 20 (5.2%) |
| 30 to 34 Years | 132 (75.4%) | 37 (28.0%) |
| 35 to 44 Years | 675 (72.0%) | 347 (51.4%) |
| 45 to 54 Years | 406 (76.9%) | 92 (22.6%) |
| 55 to 59 Years | 198 (52.9%) | 38 (19.2%) |
| 60 to 64 Years | 127 (33.0%) | 0 (0.0%) |
| 65 to 74 Years | 189 (32.9%) | 0 (0.0%) |
| 75 Years and over | 28 (5.3%) | 0 (0.0%) |
| Total | 2,837 (56.1%) | 704 (24.8%) |
Employment Status by Educational Attainment in Ville Platte
According to labor force statistics for Ville Platte, 66.7% of individuals (1,922) out of the total population between 25 and 64 years of age (2,881) are in the labor force, with 27.8% or 534 of them being unemployed. The group with the highest labor force participation rate are those with the educational attainment of college / associate degree, with 83.4% or 331 individuals in the labor force. Within the labor force, individuals with less than high school education have the highest percentage of unemployment, with 56.9% or 447 of them being unemployed.
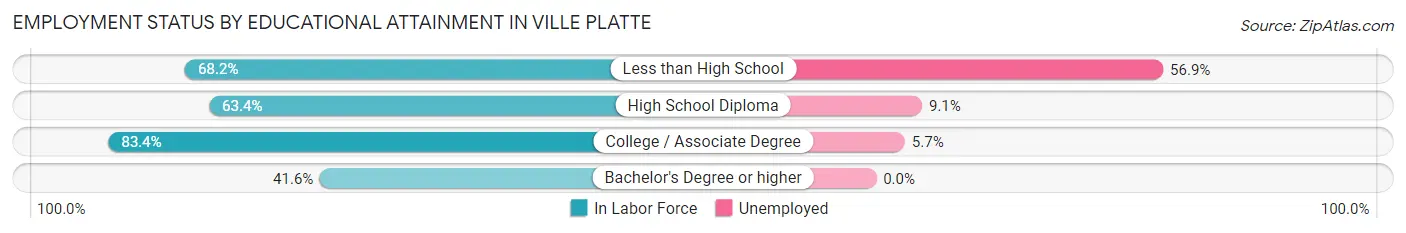
| Educational Attainment | In Labor Force | Unemployed |
| Less than High School | 786 (68.2%) | 655 (56.9%) |
| High School Diploma | 732 (63.4%) | 105 (9.1%) |
| College / Associate Degree | 331 (83.4%) | 23 (5.7%) |
| Bachelor's Degree or higher | 74 (41.6%) | 0 (0.0%) |
| Total | 1,922 (66.7%) | 801 (27.8%) |
Employment Occupations by Sex in Ville Platte
Management, Business, Science and Arts Occupations
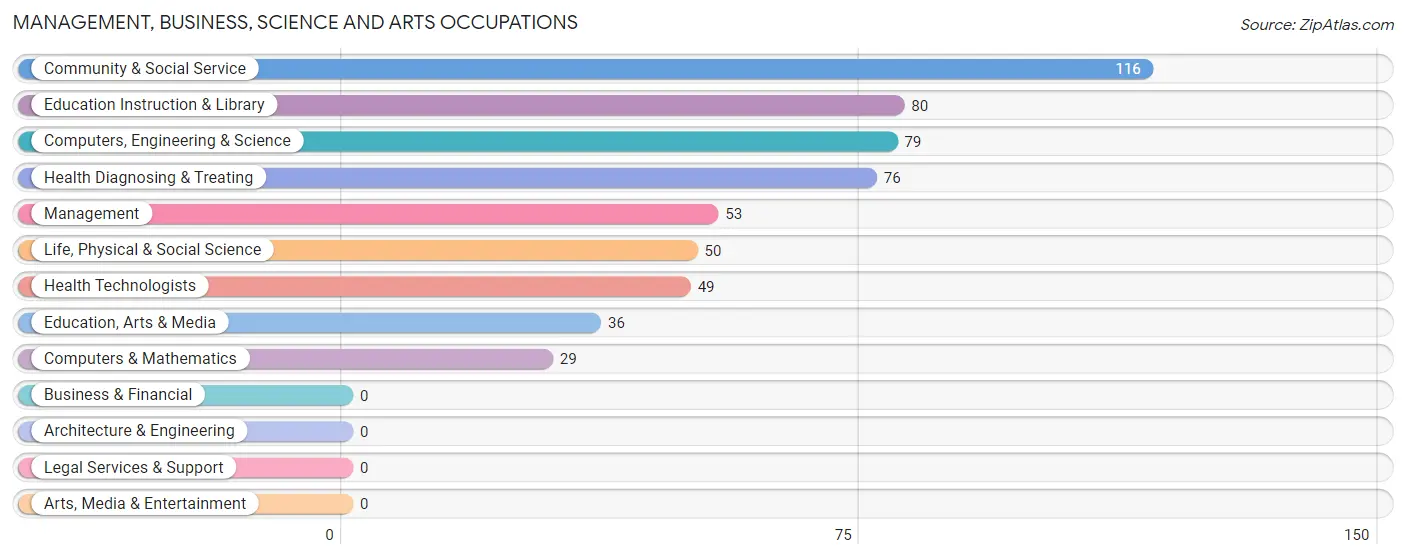
The most common Management, Business, Science and Arts occupations in Ville Platte are Community & Social Service (116 | 5.4%), Education Instruction & Library (80 | 3.8%), Computers, Engineering & Science (79 | 3.7%), Health Diagnosing & Treating (76 | 3.6%), and Management (53 | 2.5%).
Management, Business, Science and Arts Occupations by Sex
Within the Management, Business, Science and Arts occupations in Ville Platte, the most male-oriented occupations are Computers, Engineering & Science (100.0%), Computers & Mathematics (100.0%), and Life, Physical & Social Science (100.0%), while the most female-oriented occupations are Health Technologists (100.0%), Health Diagnosing & Treating (93.4%), and Education Instruction & Library (82.5%).
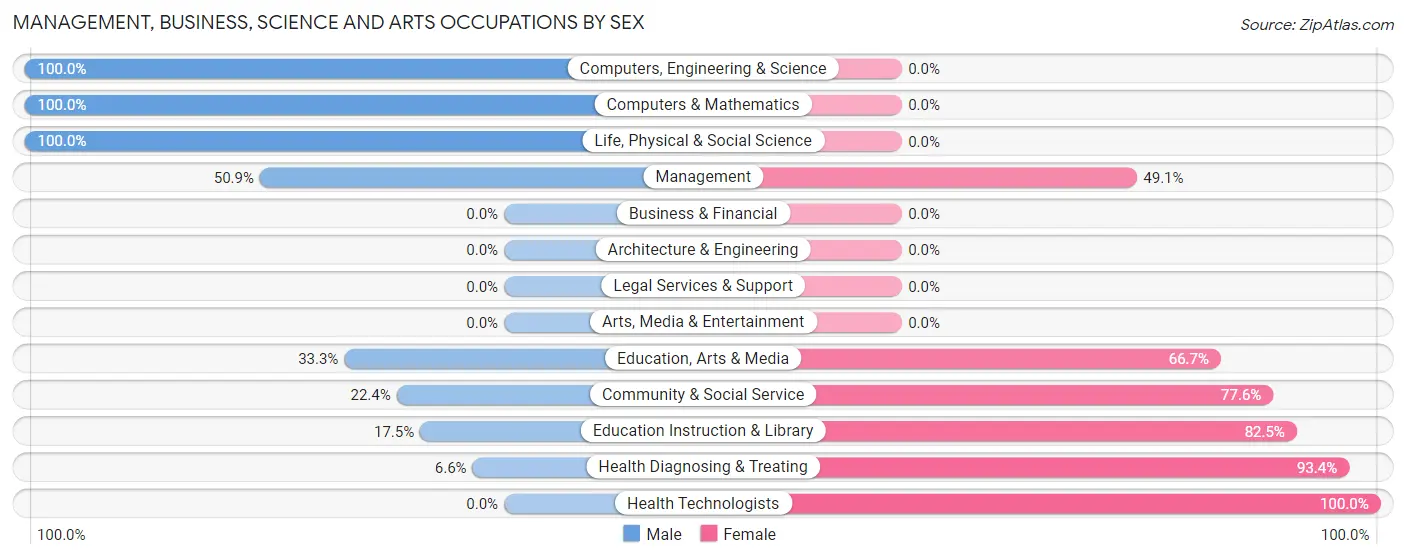
| Occupation | Male | Female |
| Management | 27 (50.9%) | 26 (49.1%) |
| Business & Financial | 0 (0.0%) | 0 (0.0%) |
| Computers, Engineering & Science | 79 (100.0%) | 0 (0.0%) |
| Computers & Mathematics | 29 (100.0%) | 0 (0.0%) |
| Architecture & Engineering | 0 (0.0%) | 0 (0.0%) |
| Life, Physical & Social Science | 50 (100.0%) | 0 (0.0%) |
| Community & Social Service | 26 (22.4%) | 90 (77.6%) |
| Education, Arts & Media | 12 (33.3%) | 24 (66.7%) |
| Legal Services & Support | 0 (0.0%) | 0 (0.0%) |
| Education Instruction & Library | 14 (17.5%) | 66 (82.5%) |
| Arts, Media & Entertainment | 0 (0.0%) | 0 (0.0%) |
| Health Diagnosing & Treating | 5 (6.6%) | 71 (93.4%) |
| Health Technologists | 0 (0.0%) | 49 (100.0%) |
| Total (Category) | 137 (42.3%) | 187 (57.7%) |
| Total (Overall) | 1,073 (50.4%) | 1,054 (49.5%) |
Services Occupations
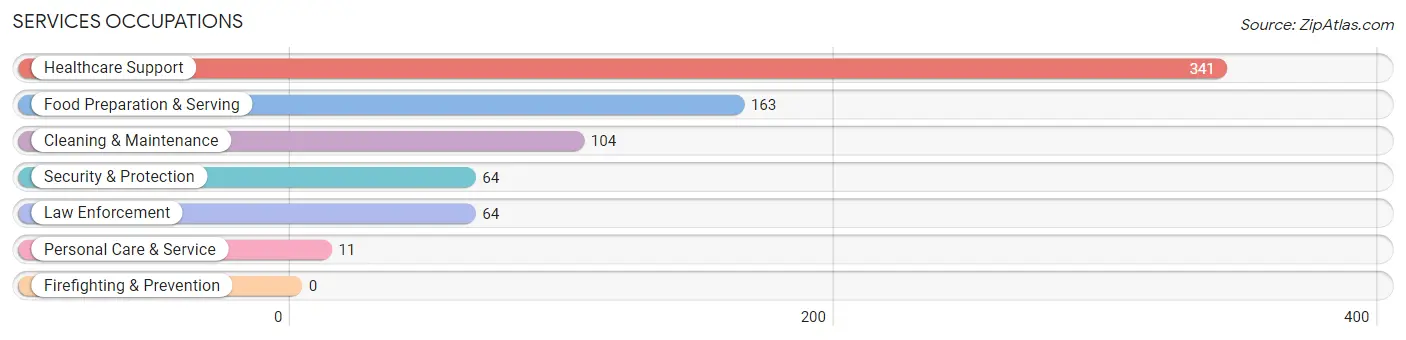
The most common Services occupations in Ville Platte are Healthcare Support (341 | 16.0%), Food Preparation & Serving (163 | 7.7%), Cleaning & Maintenance (104 | 4.9%), Security & Protection (64 | 3.0%), and Law Enforcement (64 | 3.0%).
Services Occupations by Sex
Within the Services occupations in Ville Platte, the most male-oriented occupations are Security & Protection (100.0%), Law Enforcement (100.0%), and Cleaning & Maintenance (59.6%), while the most female-oriented occupations are Personal Care & Service (100.0%), Food Preparation & Serving (89.6%), and Healthcare Support (78.6%).
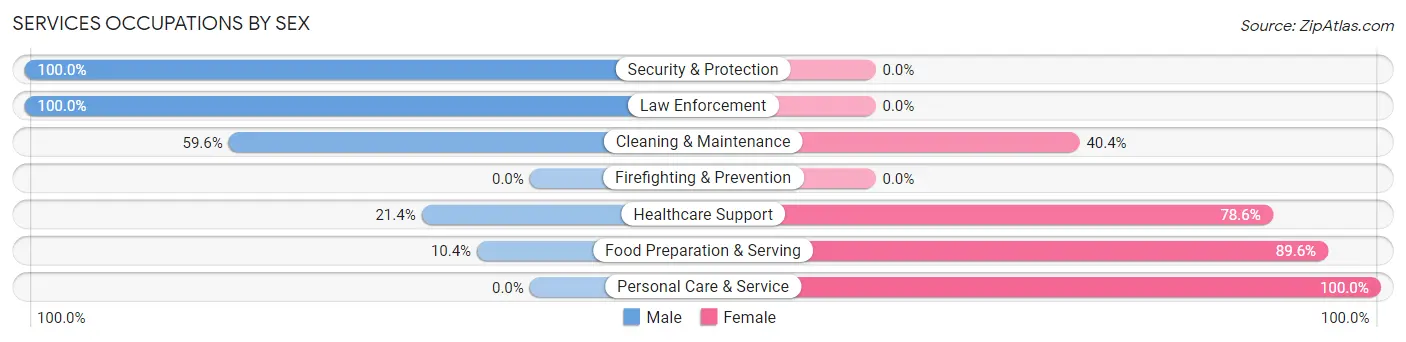
| Occupation | Male | Female |
| Healthcare Support | 73 (21.4%) | 268 (78.6%) |
| Security & Protection | 64 (100.0%) | 0 (0.0%) |
| Firefighting & Prevention | 0 (0.0%) | 0 (0.0%) |
| Law Enforcement | 64 (100.0%) | 0 (0.0%) |
| Food Preparation & Serving | 17 (10.4%) | 146 (89.6%) |
| Cleaning & Maintenance | 62 (59.6%) | 42 (40.4%) |
| Personal Care & Service | 0 (0.0%) | 11 (100.0%) |
| Total (Category) | 216 (31.6%) | 467 (68.4%) |
| Total (Overall) | 1,073 (50.4%) | 1,054 (49.5%) |
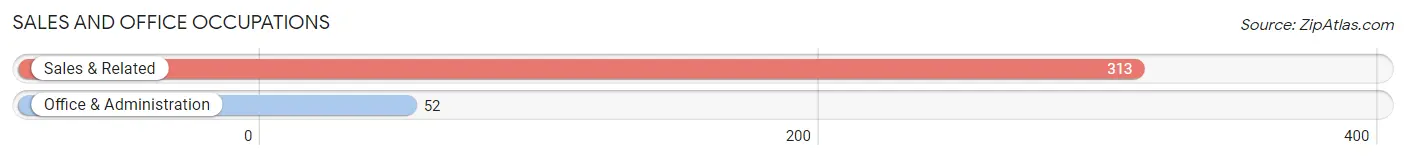
Sales and Office Occupations
The most common Sales and Office occupations in Ville Platte are Sales & Related (313 | 14.7%), and Office & Administration (52 | 2.4%).
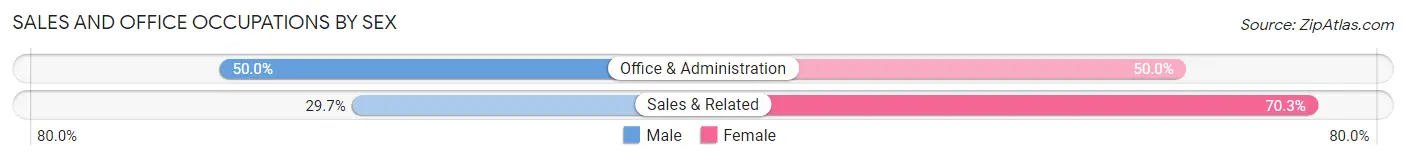
Sales and Office Occupations by Sex
| Occupation | Male | Female |
| Sales & Related | 93 (29.7%) | 220 (70.3%) |
| Office & Administration | 26 (50.0%) | 26 (50.0%) |
| Total (Category) | 119 (32.6%) | 246 (67.4%) |
| Total (Overall) | 1,073 (50.4%) | 1,054 (49.5%) |
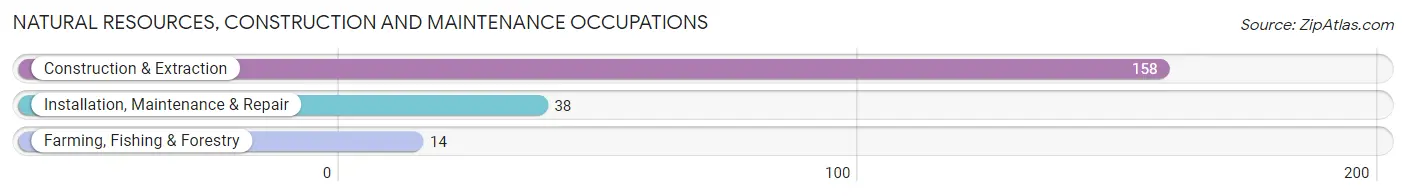
Natural Resources, Construction and Maintenance Occupations
The most common Natural Resources, Construction and Maintenance occupations in Ville Platte are Construction & Extraction (158 | 7.4%), Installation, Maintenance & Repair (38 | 1.8%), and Farming, Fishing & Forestry (14 | 0.7%).
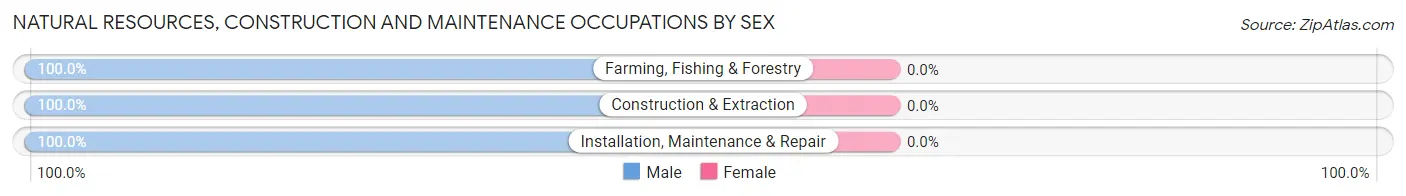
Natural Resources, Construction and Maintenance Occupations by Sex
| Occupation | Male | Female |
| Farming, Fishing & Forestry | 14 (100.0%) | 0 (0.0%) |
| Construction & Extraction | 158 (100.0%) | 0 (0.0%) |
| Installation, Maintenance & Repair | 38 (100.0%) | 0 (0.0%) |
| Total (Category) | 210 (100.0%) | 0 (0.0%) |
| Total (Overall) | 1,073 (50.4%) | 1,054 (49.5%) |
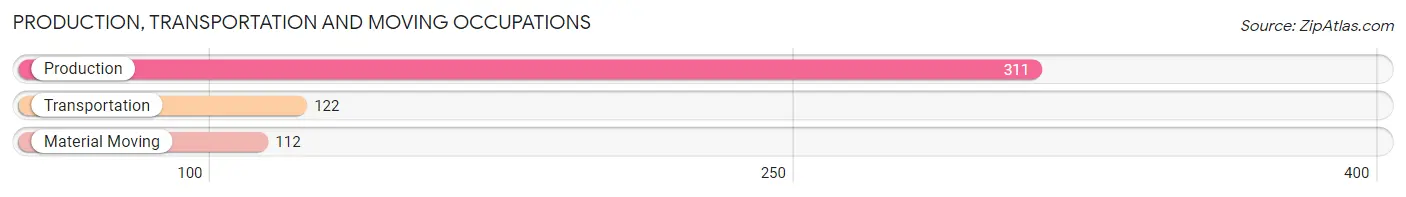
Production, Transportation and Moving Occupations
The most common Production, Transportation and Moving occupations in Ville Platte are Production (311 | 14.6%), Transportation (122 | 5.7%), and Material Moving (112 | 5.3%).
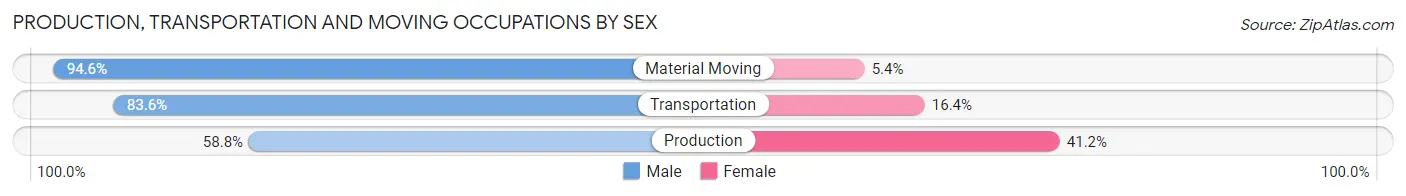
Production, Transportation and Moving Occupations by Sex
| Occupation | Male | Female |
| Production | 183 (58.8%) | 128 (41.2%) |
| Transportation | 102 (83.6%) | 20 (16.4%) |
| Material Moving | 106 (94.6%) | 6 (5.4%) |
| Total (Category) | 391 (71.7%) | 154 (28.3%) |
| Total (Overall) | 1,073 (50.4%) | 1,054 (49.5%) |
Employment Industries by Sex in Ville Platte
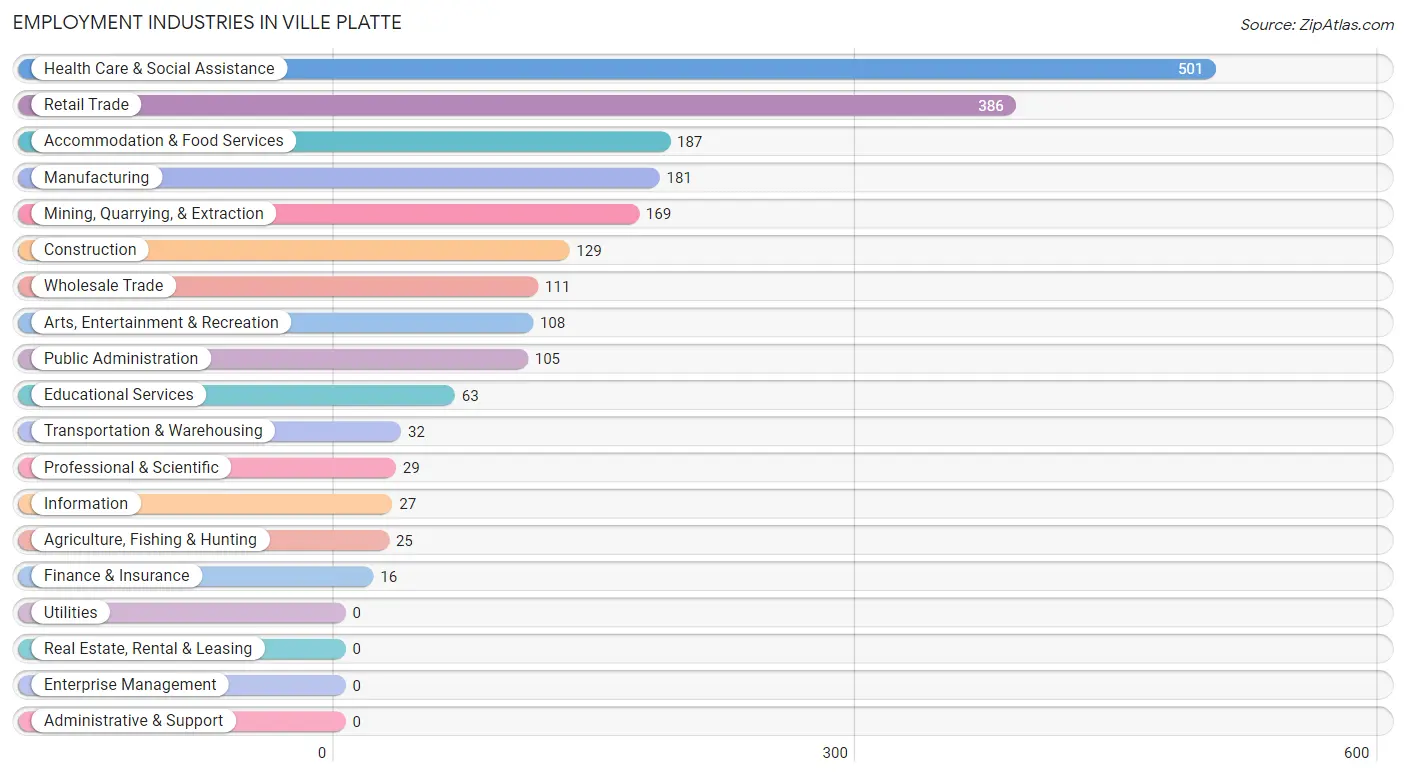
Employment Industries in Ville Platte
The major employment industries in Ville Platte include Health Care & Social Assistance (501 | 23.5%), Retail Trade (386 | 18.1%), Accommodation & Food Services (187 | 8.8%), Manufacturing (181 | 8.5%), and Mining, Quarrying, & Extraction (169 | 8.0%).
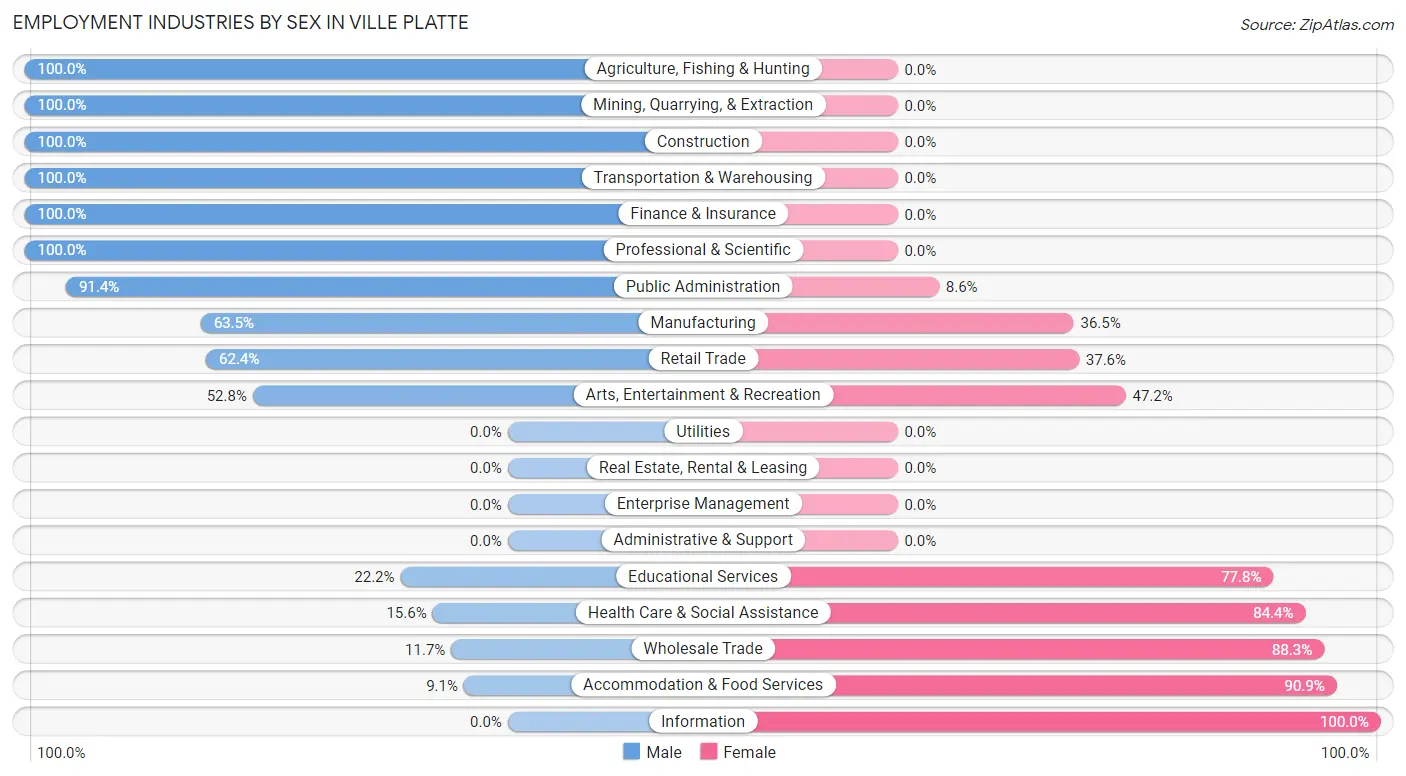
Employment Industries by Sex in Ville Platte
The Ville Platte industries that see more men than women are Agriculture, Fishing & Hunting (100.0%), Mining, Quarrying, & Extraction (100.0%), and Construction (100.0%), whereas the industries that tend to have a higher number of women are Information (100.0%), Accommodation & Food Services (90.9%), and Wholesale Trade (88.3%).
| Industry | Male | Female |
| Agriculture, Fishing & Hunting | 25 (100.0%) | 0 (0.0%) |
| Mining, Quarrying, & Extraction | 169 (100.0%) | 0 (0.0%) |
| Construction | 129 (100.0%) | 0 (0.0%) |
| Manufacturing | 115 (63.5%) | 66 (36.5%) |
| Wholesale Trade | 13 (11.7%) | 98 (88.3%) |
| Retail Trade | 241 (62.4%) | 145 (37.6%) |
| Transportation & Warehousing | 32 (100.0%) | 0 (0.0%) |
| Utilities | 0 (0.0%) | 0 (0.0%) |
| Information | 0 (0.0%) | 27 (100.0%) |
| Finance & Insurance | 16 (100.0%) | 0 (0.0%) |
| Real Estate, Rental & Leasing | 0 (0.0%) | 0 (0.0%) |
| Professional & Scientific | 29 (100.0%) | 0 (0.0%) |
| Enterprise Management | 0 (0.0%) | 0 (0.0%) |
| Administrative & Support | 0 (0.0%) | 0 (0.0%) |
| Educational Services | 14 (22.2%) | 49 (77.8%) |
| Health Care & Social Assistance | 78 (15.6%) | 423 (84.4%) |
| Arts, Entertainment & Recreation | 57 (52.8%) | 51 (47.2%) |
| Accommodation & Food Services | 17 (9.1%) | 170 (90.9%) |
| Public Administration | 96 (91.4%) | 9 (8.6%) |
| Total | 1,073 (50.4%) | 1,054 (49.5%) |
Education in Ville Platte
School Enrollment in Ville Platte
The most common levels of schooling among the 1,359 students in Ville Platte are elementary school (330 | 24.3%), high school (303 | 22.3%), and middle school (242 | 17.8%).
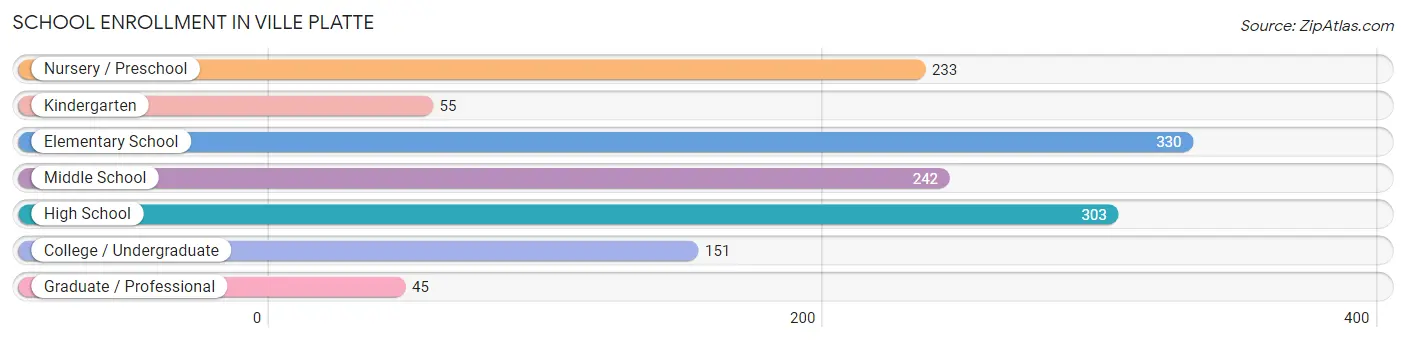
| School Level | # Students | % Students |
| Nursery / Preschool | 233 | 17.1% |
| Kindergarten | 55 | 4.1% |
| Elementary School | 330 | 24.3% |
| Middle School | 242 | 17.8% |
| High School | 303 | 22.3% |
| College / Undergraduate | 151 | 11.1% |
| Graduate / Professional | 45 | 3.3% |
| Total | 1,359 | 100.0% |
School Enrollment by Age by Funding Source in Ville Platte
Out of a total of 1,359 students who are enrolled in schools in Ville Platte, 71 (5.2%) attend a private institution, while the remaining 1,288 (94.8%) are enrolled in public schools. The age group of 35 years and over has the highest likelihood of being enrolled in private schools, with 21 (28.8% in the age bracket) enrolled. Conversely, the age group of 3 to 4 year olds has the lowest likelihood of being enrolled in a private school, with 233 (100.0% in the age bracket) attending a public institution.
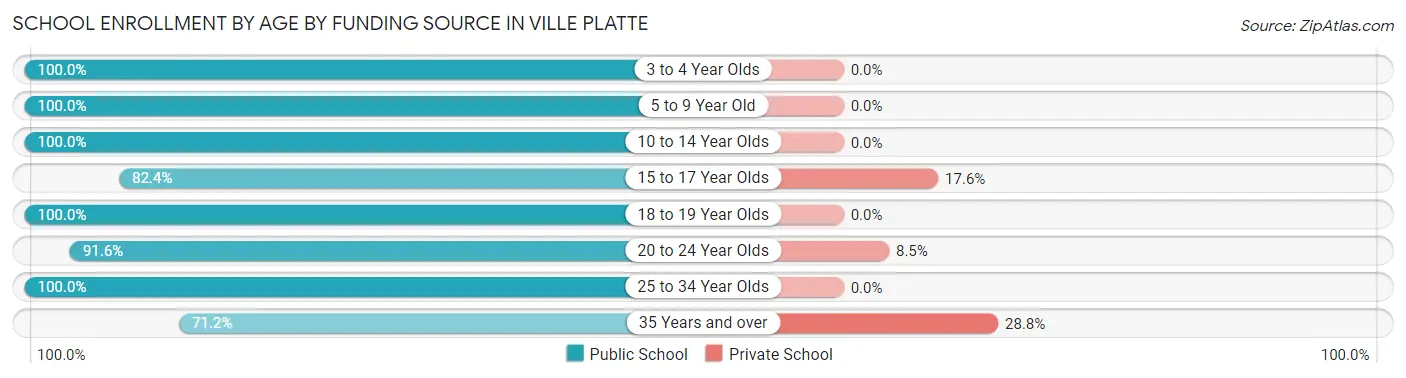
| Age Bracket | Public School | Private School |
| 3 to 4 Year Olds | 233 (100.0%) | 0 (0.0%) |
| 5 to 9 Year Old | 328 (100.0%) | 0 (0.0%) |
| 10 to 14 Year Olds | 317 (100.0%) | 0 (0.0%) |
| 15 to 17 Year Olds | 206 (82.4%) | 44 (17.6%) |
| 18 to 19 Year Olds | 41 (100.0%) | 0 (0.0%) |
| 20 to 24 Year Olds | 65 (91.5%) | 6 (8.5%) |
| 25 to 34 Year Olds | 46 (100.0%) | 0 (0.0%) |
| 35 Years and over | 52 (71.2%) | 21 (28.8%) |
| Total | 1,288 (94.8%) | 71 (5.2%) |
Educational Attainment by Field of Study in Ville Platte
Education (99 | 28.1%), multidisciplinary studies (90 | 25.5%), science & technology (49 | 13.9%), business (29 | 8.2%), and bio, nature & agricultural (15 | 4.3%) are the most common fields of study among 353 individuals in Ville Platte who have obtained a bachelor's degree or higher.
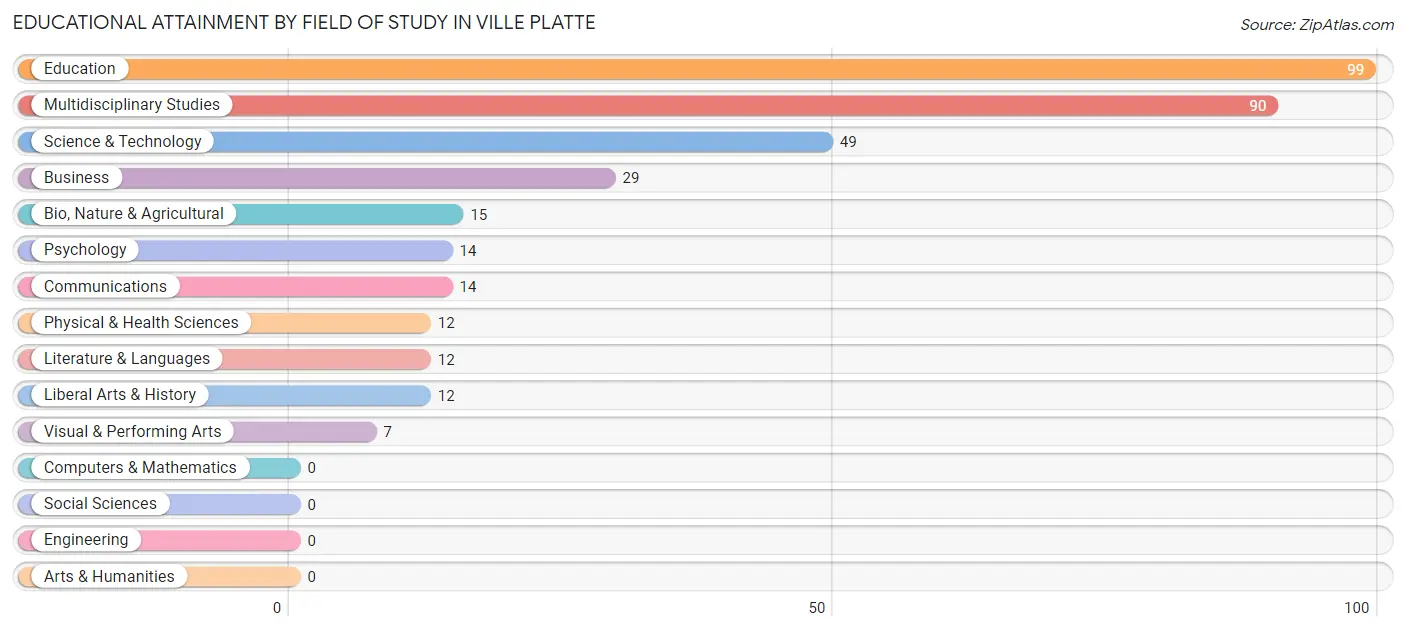
| Field of Study | # Graduates | % Graduates |
| Computers & Mathematics | 0 | 0.0% |
| Bio, Nature & Agricultural | 15 | 4.3% |
| Physical & Health Sciences | 12 | 3.4% |
| Psychology | 14 | 4.0% |
| Social Sciences | 0 | 0.0% |
| Engineering | 0 | 0.0% |
| Multidisciplinary Studies | 90 | 25.5% |
| Science & Technology | 49 | 13.9% |
| Business | 29 | 8.2% |
| Education | 99 | 28.1% |
| Literature & Languages | 12 | 3.4% |
| Liberal Arts & History | 12 | 3.4% |
| Visual & Performing Arts | 7 | 2.0% |
| Communications | 14 | 4.0% |
| Arts & Humanities | 0 | 0.0% |
| Total | 353 | 100.0% |
Transportation & Commute in Ville Platte
Vehicle Availability by Sex in Ville Platte
The most prevalent vehicle ownership categories in Ville Platte are males with 1 vehicle (556, accounting for 53.6%) and females with 1 vehicle (376, making up 60.4%).
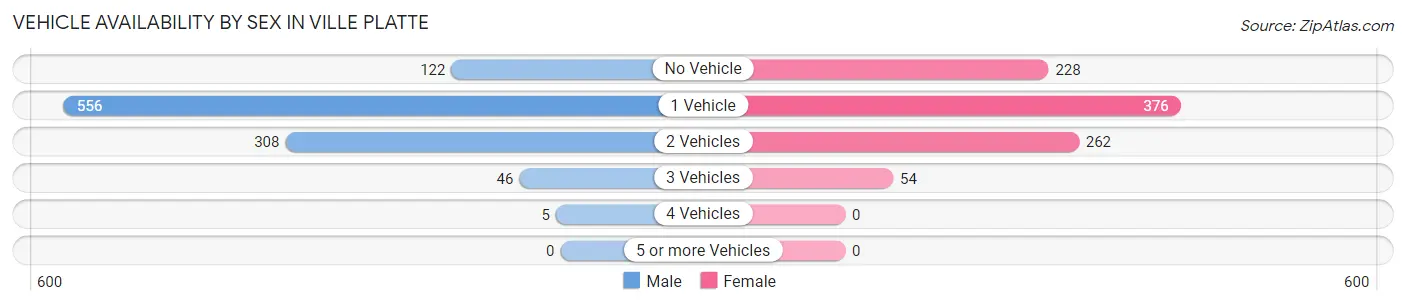
| Vehicles Available | Male | Female |
| No Vehicle | 122 (11.8%) | 228 (24.8%) |
| 1 Vehicle | 556 (53.6%) | 376 (40.9%) |
| 2 Vehicles | 308 (29.7%) | 262 (28.5%) |
| 3 Vehicles | 46 (4.4%) | 54 (5.9%) |
| 4 Vehicles | 5 (0.5%) | 0 (0.0%) |
| 5 or more Vehicles | 0 (0.0%) | 0 (0.0%) |
| Total | 1,037 (100.0%) | 920 (100.0%) |
Commute Time in Ville Platte
The most frequently occuring commute durations in Ville Platte are 5 to 9 minutes (497 commuters, 26.6%), 10 to 14 minutes (354 commuters, 18.9%), and 30 to 34 minutes (237 commuters, 12.7%).
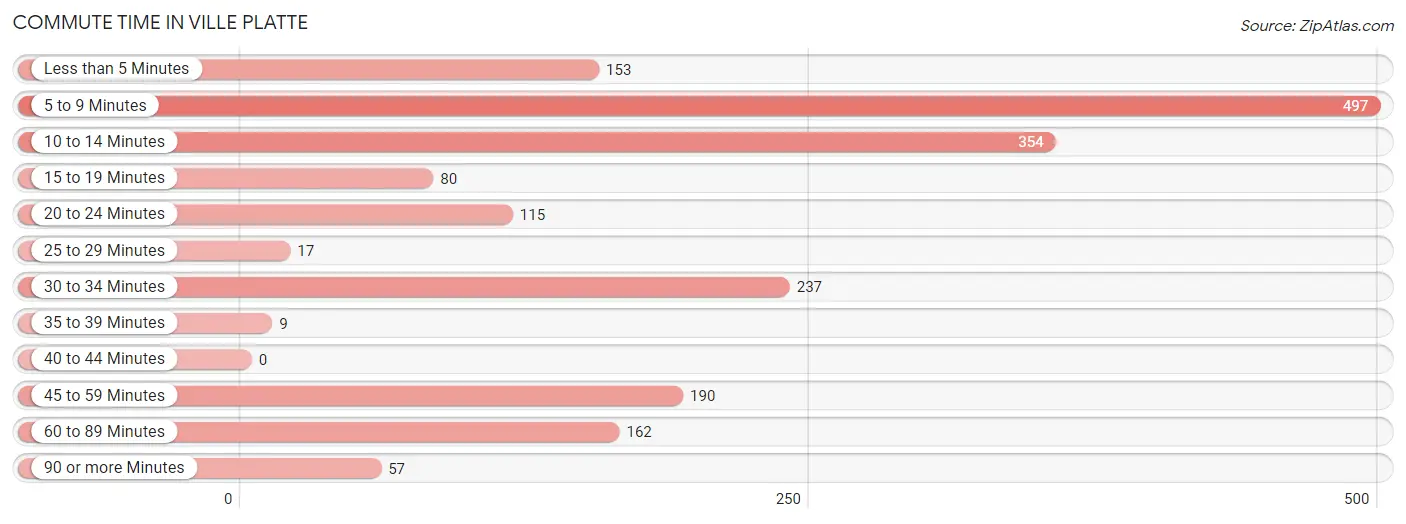
| Commute Time | # Commuters | % Commuters |
| Less than 5 Minutes | 153 | 8.2% |
| 5 to 9 Minutes | 497 | 26.6% |
| 10 to 14 Minutes | 354 | 18.9% |
| 15 to 19 Minutes | 80 | 4.3% |
| 20 to 24 Minutes | 115 | 6.1% |
| 25 to 29 Minutes | 17 | 0.9% |
| 30 to 34 Minutes | 237 | 12.7% |
| 35 to 39 Minutes | 9 | 0.5% |
| 40 to 44 Minutes | 0 | 0.0% |
| 45 to 59 Minutes | 190 | 10.2% |
| 60 to 89 Minutes | 162 | 8.7% |
| 90 or more Minutes | 57 | 3.0% |
Commute Time by Sex in Ville Platte
The most common commute times in Ville Platte are 10 to 14 minutes (273 commuters, 26.5%) for males and 5 to 9 minutes (290 commuters, 34.5%) for females.
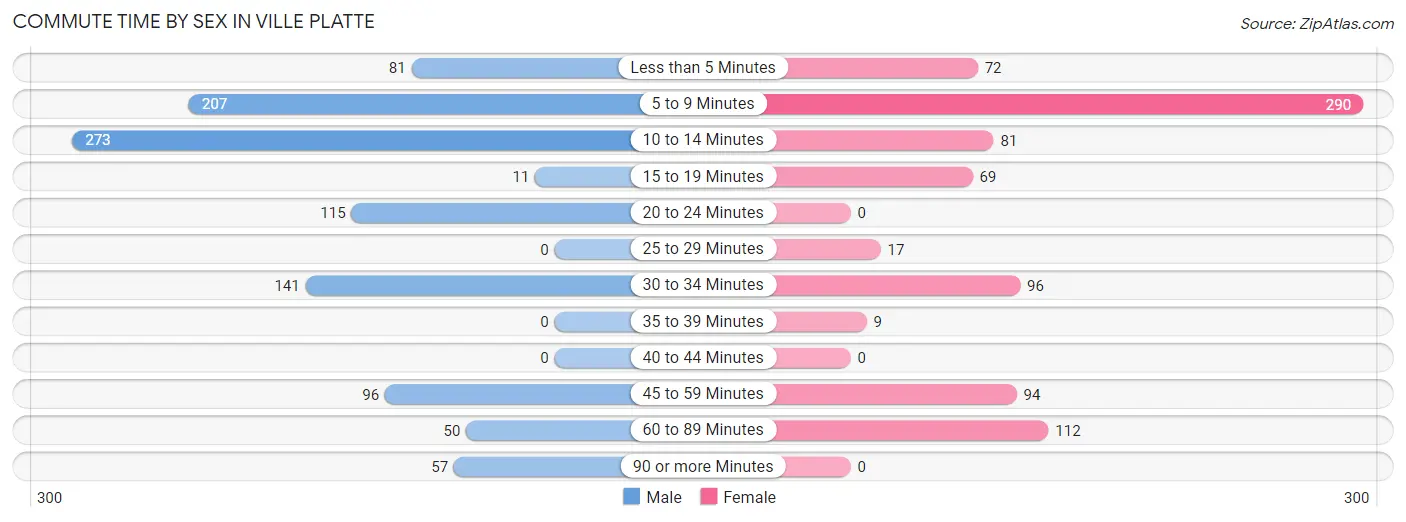
| Commute Time | Male | Female |
| Less than 5 Minutes | 81 (7.9%) | 72 (8.6%) |
| 5 to 9 Minutes | 207 (20.1%) | 290 (34.5%) |
| 10 to 14 Minutes | 273 (26.5%) | 81 (9.6%) |
| 15 to 19 Minutes | 11 (1.1%) | 69 (8.2%) |
| 20 to 24 Minutes | 115 (11.2%) | 0 (0.0%) |
| 25 to 29 Minutes | 0 (0.0%) | 17 (2.0%) |
| 30 to 34 Minutes | 141 (13.7%) | 96 (11.4%) |
| 35 to 39 Minutes | 0 (0.0%) | 9 (1.1%) |
| 40 to 44 Minutes | 0 (0.0%) | 0 (0.0%) |
| 45 to 59 Minutes | 96 (9.3%) | 94 (11.2%) |
| 60 to 89 Minutes | 50 (4.9%) | 112 (13.3%) |
| 90 or more Minutes | 57 (5.5%) | 0 (0.0%) |
Time of Departure to Work by Sex in Ville Platte
The most frequent times of departure to work in Ville Platte are 12:00 AM to 4:59 AM (183, 17.7%) for males and 4:00 PM to 11:59 PM (223, 26.6%) for females.
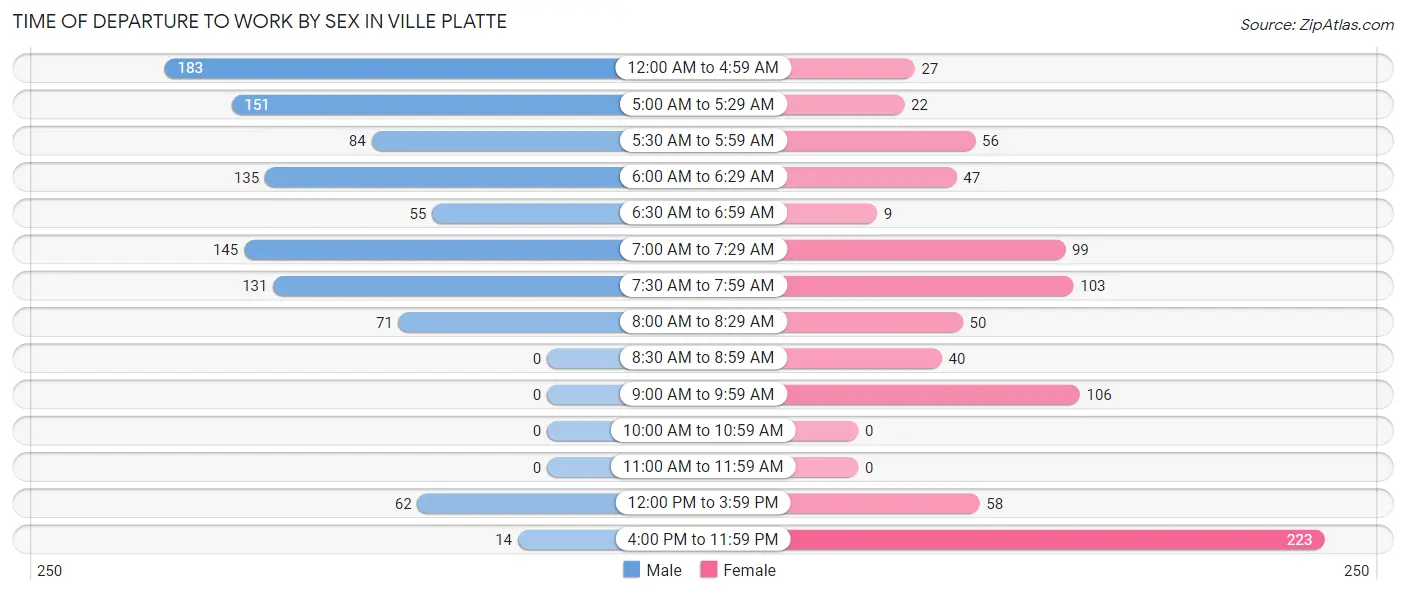
| Time of Departure | Male | Female |
| 12:00 AM to 4:59 AM | 183 (17.7%) | 27 (3.2%) |
| 5:00 AM to 5:29 AM | 151 (14.6%) | 22 (2.6%) |
| 5:30 AM to 5:59 AM | 84 (8.2%) | 56 (6.7%) |
| 6:00 AM to 6:29 AM | 135 (13.1%) | 47 (5.6%) |
| 6:30 AM to 6:59 AM | 55 (5.3%) | 9 (1.1%) |
| 7:00 AM to 7:29 AM | 145 (14.1%) | 99 (11.8%) |
| 7:30 AM to 7:59 AM | 131 (12.7%) | 103 (12.3%) |
| 8:00 AM to 8:29 AM | 71 (6.9%) | 50 (5.9%) |
| 8:30 AM to 8:59 AM | 0 (0.0%) | 40 (4.8%) |
| 9:00 AM to 9:59 AM | 0 (0.0%) | 106 (12.6%) |
| 10:00 AM to 10:59 AM | 0 (0.0%) | 0 (0.0%) |
| 11:00 AM to 11:59 AM | 0 (0.0%) | 0 (0.0%) |
| 12:00 PM to 3:59 PM | 62 (6.0%) | 58 (6.9%) |
| 4:00 PM to 11:59 PM | 14 (1.4%) | 223 (26.6%) |
| Total | 1,031 (100.0%) | 840 (100.0%) |
Housing Occupancy in Ville Platte
Occupancy by Ownership in Ville Platte
Of the total 2,652 dwellings in Ville Platte, owner-occupied units account for 1,015 (38.3%), while renter-occupied units make up 1,637 (61.7%).
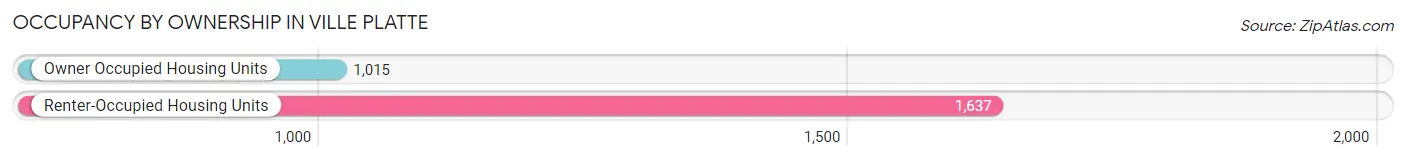
| Occupancy | # Housing Units | % Housing Units |
| Owner Occupied Housing Units | 1,015 | 38.3% |
| Renter-Occupied Housing Units | 1,637 | 61.7% |
| Total Occupied Housing Units | 2,652 | 100.0% |
Occupancy by Household Size in Ville Platte
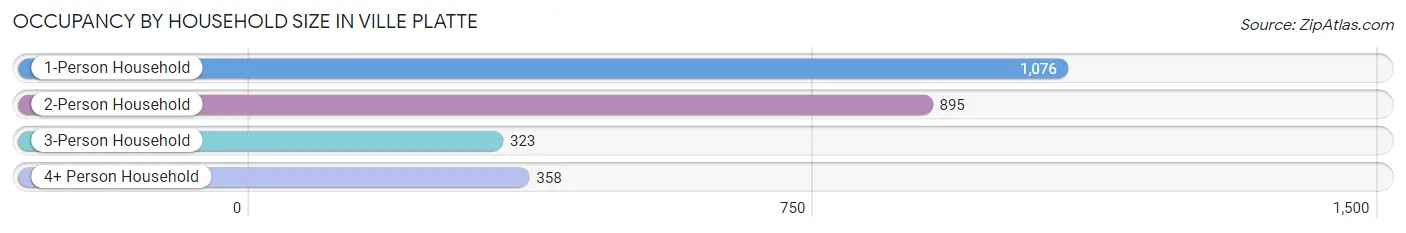
| Household Size | # Housing Units | % Housing Units |
| 1-Person Household | 1,076 | 40.6% |
| 2-Person Household | 895 | 33.8% |
| 3-Person Household | 323 | 12.2% |
| 4+ Person Household | 358 | 13.5% |
| Total Housing Units | 2,652 | 100.0% |
Occupancy by Ownership by Household Size in Ville Platte
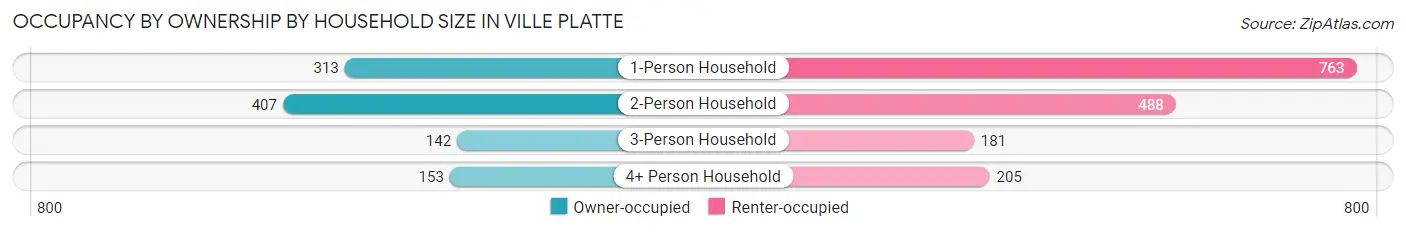
| Household Size | Owner-occupied | Renter-occupied |
| 1-Person Household | 313 (29.1%) | 763 (70.9%) |
| 2-Person Household | 407 (45.5%) | 488 (54.5%) |
| 3-Person Household | 142 (44.0%) | 181 (56.0%) |
| 4+ Person Household | 153 (42.7%) | 205 (57.3%) |
| Total Housing Units | 1,015 (38.3%) | 1,637 (61.7%) |
Occupancy by Educational Attainment in Ville Platte
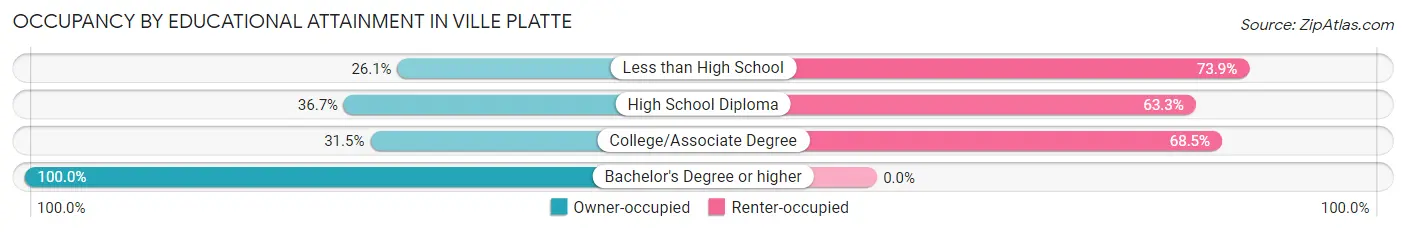
| Household Size | Owner-occupied | Renter-occupied |
| Less than High School | 199 (26.1%) | 564 (73.9%) |
| High School Diploma | 401 (36.7%) | 692 (63.3%) |
| College/Associate Degree | 175 (31.5%) | 381 (68.5%) |
| Bachelor's Degree or higher | 240 (100.0%) | 0 (0.0%) |
Occupancy by Age of Householder in Ville Platte
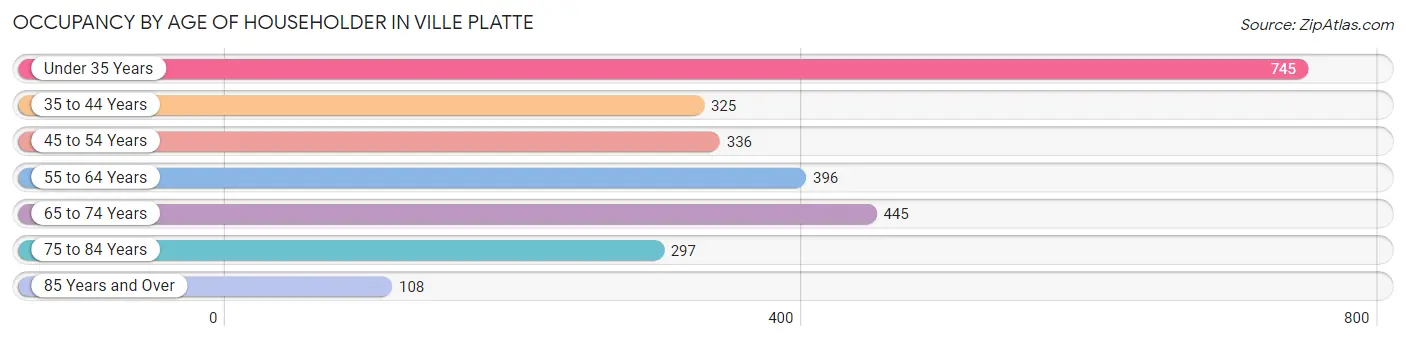
| Age Bracket | # Households | % Households |
| Under 35 Years | 745 | 28.1% |
| 35 to 44 Years | 325 | 12.2% |
| 45 to 54 Years | 336 | 12.7% |
| 55 to 64 Years | 396 | 14.9% |
| 65 to 74 Years | 445 | 16.8% |
| 75 to 84 Years | 297 | 11.2% |
| 85 Years and Over | 108 | 4.1% |
| Total | 2,652 | 100.0% |
Housing Finances in Ville Platte
Median Income by Occupancy in Ville Platte
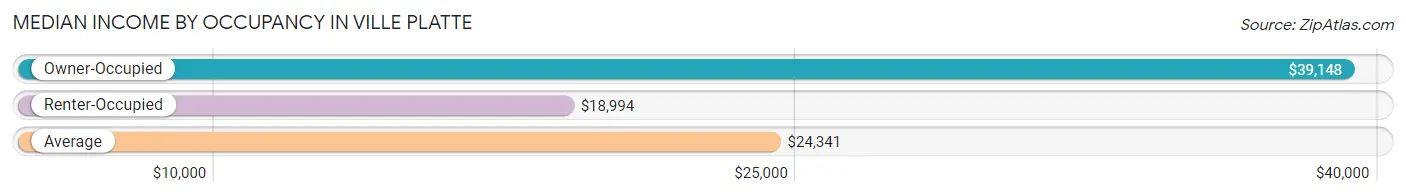
| Occupancy Type | # Households | Median Income |
| Owner-Occupied | 1,015 (38.3%) | $39,148 |
| Renter-Occupied | 1,637 (61.7%) | $18,994 |
| Average | 2,652 (100.0%) | $24,341 |
Occupancy by Householder Income Bracket in Ville Platte
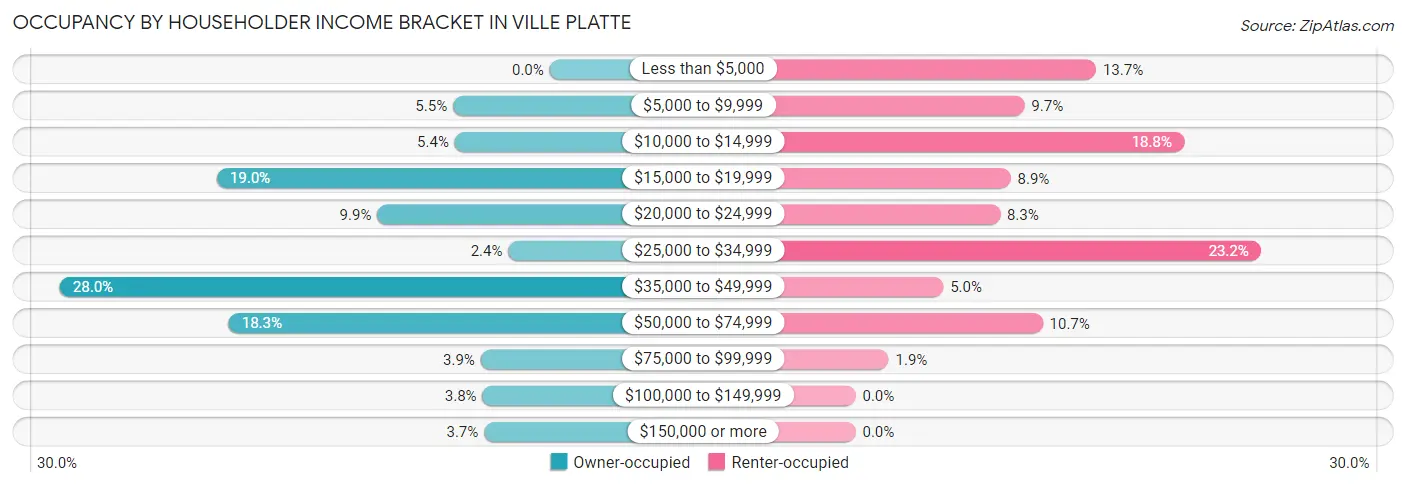
| Income Bracket | Owner-occupied | Renter-occupied |
| Less than $5,000 | 0 (0.0%) | 225 (13.7%) |
| $5,000 to $9,999 | 56 (5.5%) | 158 (9.7%) |
| $10,000 to $14,999 | 55 (5.4%) | 307 (18.8%) |
| $15,000 to $19,999 | 193 (19.0%) | 145 (8.9%) |
| $20,000 to $24,999 | 100 (9.9%) | 135 (8.3%) |
| $25,000 to $34,999 | 24 (2.4%) | 379 (23.2%) |
| $35,000 to $49,999 | 284 (28.0%) | 82 (5.0%) |
| $50,000 to $74,999 | 186 (18.3%) | 175 (10.7%) |
| $75,000 to $99,999 | 40 (3.9%) | 31 (1.9%) |
| $100,000 to $149,999 | 39 (3.8%) | 0 (0.0%) |
| $150,000 or more | 38 (3.7%) | 0 (0.0%) |
| Total | 1,015 (100.0%) | 1,637 (100.0%) |
Monthly Housing Cost Tiers in Ville Platte
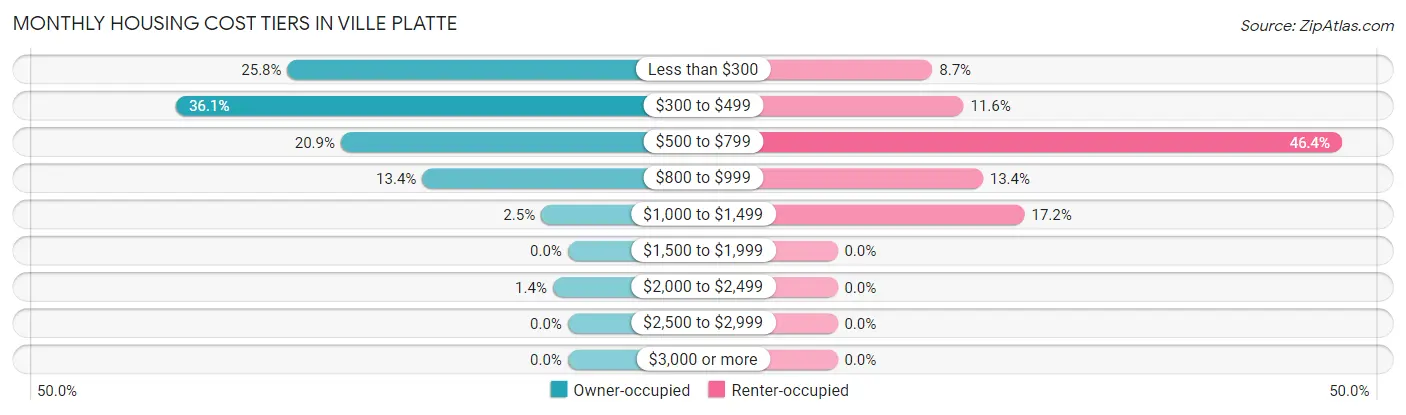
| Monthly Cost | Owner-occupied | Renter-occupied |
| Less than $300 | 262 (25.8%) | 143 (8.7%) |
| $300 to $499 | 366 (36.1%) | 190 (11.6%) |
| $500 to $799 | 212 (20.9%) | 760 (46.4%) |
| $800 to $999 | 136 (13.4%) | 219 (13.4%) |
| $1,000 to $1,499 | 25 (2.5%) | 282 (17.2%) |
| $1,500 to $1,999 | 0 (0.0%) | 0 (0.0%) |
| $2,000 to $2,499 | 14 (1.4%) | 0 (0.0%) |
| $2,500 to $2,999 | 0 (0.0%) | 0 (0.0%) |
| $3,000 or more | 0 (0.0%) | 0 (0.0%) |
| Total | 1,015 (100.0%) | 1,637 (100.0%) |
Physical Housing Characteristics in Ville Platte
Housing Structures in Ville Platte
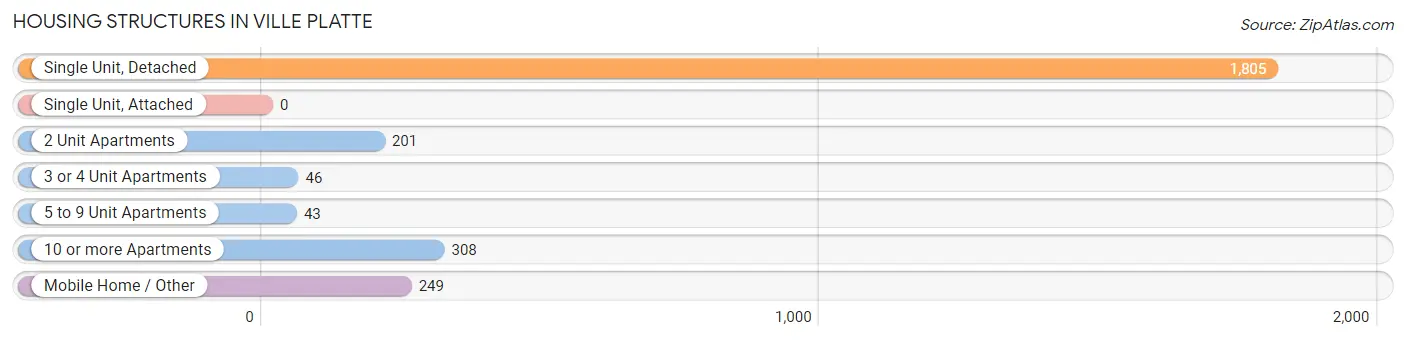
| Structure Type | # Housing Units | % Housing Units |
| Single Unit, Detached | 1,805 | 68.1% |
| Single Unit, Attached | 0 | 0.0% |
| 2 Unit Apartments | 201 | 7.6% |
| 3 or 4 Unit Apartments | 46 | 1.7% |
| 5 to 9 Unit Apartments | 43 | 1.6% |
| 10 or more Apartments | 308 | 11.6% |
| Mobile Home / Other | 249 | 9.4% |
| Total | 2,652 | 100.0% |
Housing Structures by Occupancy in Ville Platte
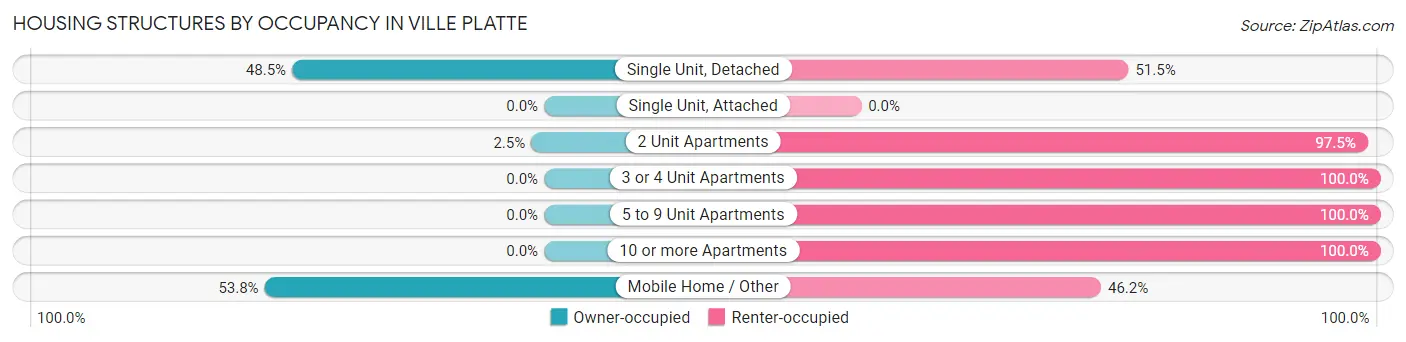
| Structure Type | Owner-occupied | Renter-occupied |
| Single Unit, Detached | 876 (48.5%) | 929 (51.5%) |
| Single Unit, Attached | 0 (0.0%) | 0 (0.0%) |
| 2 Unit Apartments | 5 (2.5%) | 196 (97.5%) |
| 3 or 4 Unit Apartments | 0 (0.0%) | 46 (100.0%) |
| 5 to 9 Unit Apartments | 0 (0.0%) | 43 (100.0%) |
| 10 or more Apartments | 0 (0.0%) | 308 (100.0%) |
| Mobile Home / Other | 134 (53.8%) | 115 (46.2%) |
| Total | 1,015 (38.3%) | 1,637 (61.7%) |
Housing Structures by Number of Rooms in Ville Platte
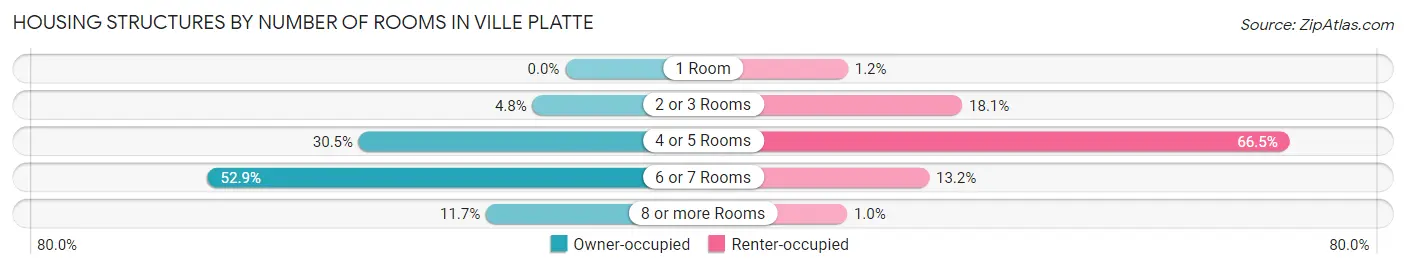
| Number of Rooms | Owner-occupied | Renter-occupied |
| 1 Room | 0 (0.0%) | 19 (1.2%) |
| 2 or 3 Rooms | 49 (4.8%) | 296 (18.1%) |
| 4 or 5 Rooms | 310 (30.5%) | 1,089 (66.5%) |
| 6 or 7 Rooms | 537 (52.9%) | 216 (13.2%) |
| 8 or more Rooms | 119 (11.7%) | 17 (1.0%) |
| Total | 1,015 (100.0%) | 1,637 (100.0%) |
Housing Structure by Heating Type in Ville Platte
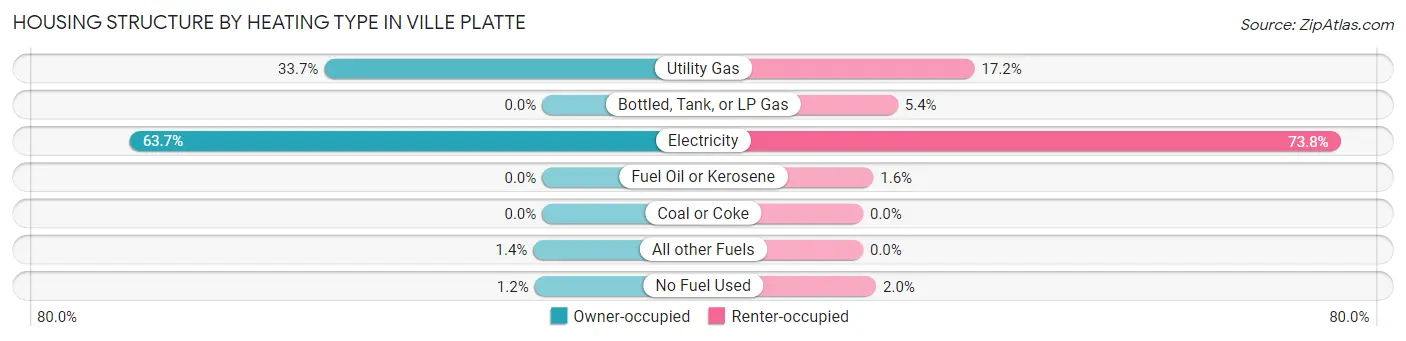
| Heating Type | Owner-occupied | Renter-occupied |
| Utility Gas | 342 (33.7%) | 282 (17.2%) |
| Bottled, Tank, or LP Gas | 0 (0.0%) | 88 (5.4%) |
| Electricity | 647 (63.7%) | 1,208 (73.8%) |
| Fuel Oil or Kerosene | 0 (0.0%) | 26 (1.6%) |
| Coal or Coke | 0 (0.0%) | 0 (0.0%) |
| All other Fuels | 14 (1.4%) | 0 (0.0%) |
| No Fuel Used | 12 (1.2%) | 33 (2.0%) |
| Total | 1,015 (100.0%) | 1,637 (100.0%) |
Household Vehicle Usage in Ville Platte
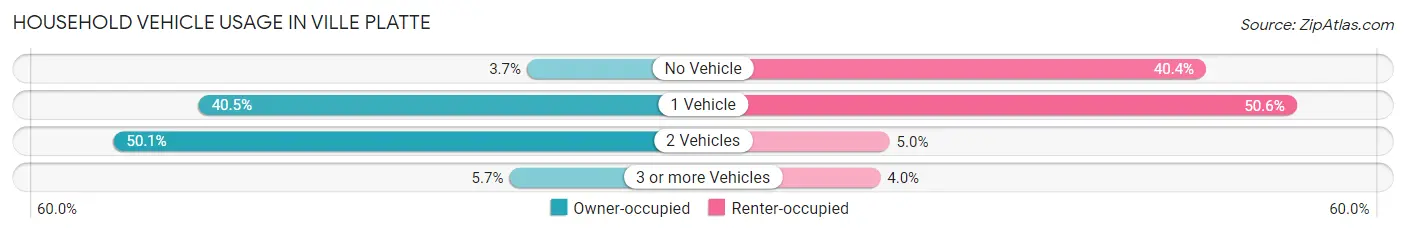
| Vehicles per Household | Owner-occupied | Renter-occupied |
| No Vehicle | 38 (3.7%) | 662 (40.4%) |
| 1 Vehicle | 411 (40.5%) | 828 (50.6%) |
| 2 Vehicles | 508 (50.0%) | 82 (5.0%) |
| 3 or more Vehicles | 58 (5.7%) | 65 (4.0%) |
| Total | 1,015 (100.0%) | 1,637 (100.0%) |
Real Estate & Mortgages in Ville Platte
Real Estate and Mortgage Overview in Ville Platte
| Characteristic | Without Mortgage | With Mortgage |
| Housing Units | 769 | 246 |
| Median Property Value | $74,300 | $80,200 |
| Median Household Income | $39,097 | $18 |
| Monthly Housing Costs | $375 | $0 |
| Real Estate Taxes | $199 | $26 |
Property Value by Mortgage Status in Ville Platte
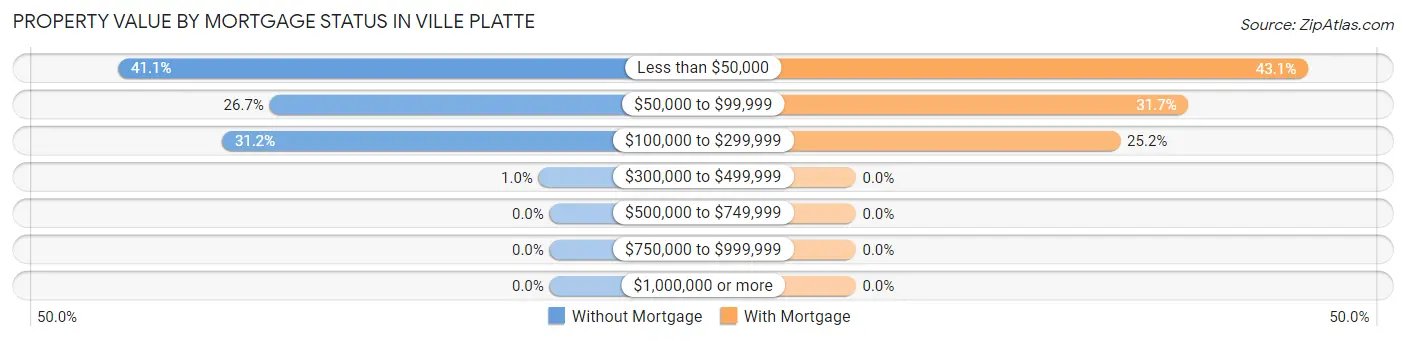
| Property Value | Without Mortgage | With Mortgage |
| Less than $50,000 | 316 (41.1%) | 106 (43.1%) |
| $50,000 to $99,999 | 205 (26.7%) | 78 (31.7%) |
| $100,000 to $299,999 | 240 (31.2%) | 62 (25.2%) |
| $300,000 to $499,999 | 8 (1.0%) | 0 (0.0%) |
| $500,000 to $749,999 | 0 (0.0%) | 0 (0.0%) |
| $750,000 to $999,999 | 0 (0.0%) | 0 (0.0%) |
| $1,000,000 or more | 0 (0.0%) | 0 (0.0%) |
| Total | 769 (100.0%) | 246 (100.0%) |
Household Income by Mortgage Status in Ville Platte
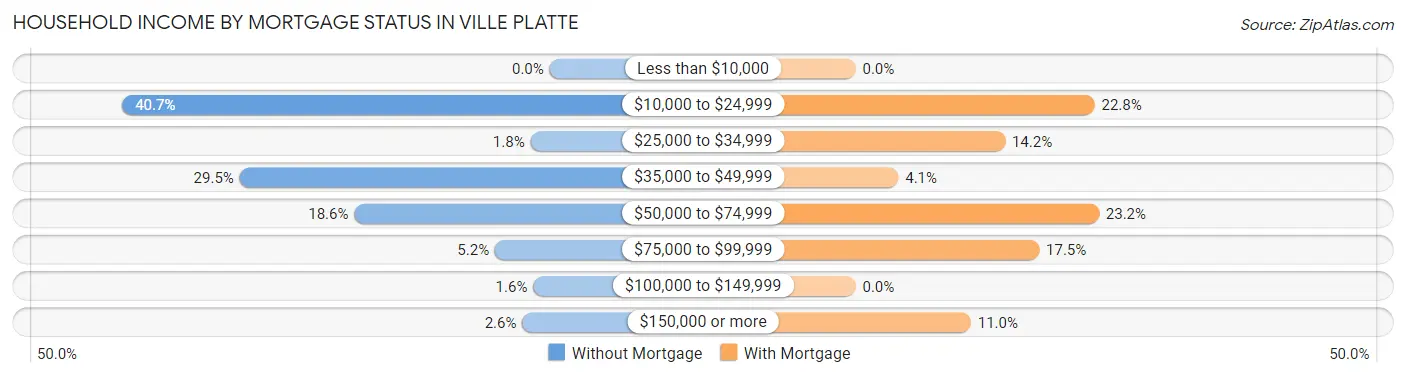
| Household Income | Without Mortgage | With Mortgage |
| Less than $10,000 | 0 (0.0%) | 0 (0.0%) |
| $10,000 to $24,999 | 313 (40.7%) | 56 (22.8%) |
| $25,000 to $34,999 | 14 (1.8%) | 35 (14.2%) |
| $35,000 to $49,999 | 227 (29.5%) | 10 (4.1%) |
| $50,000 to $74,999 | 143 (18.6%) | 57 (23.2%) |
| $75,000 to $99,999 | 40 (5.2%) | 43 (17.5%) |
| $100,000 to $149,999 | 12 (1.6%) | 0 (0.0%) |
| $150,000 or more | 20 (2.6%) | 27 (11.0%) |
| Total | 769 (100.0%) | 246 (100.0%) |
Property Value to Household Income Ratio in Ville Platte
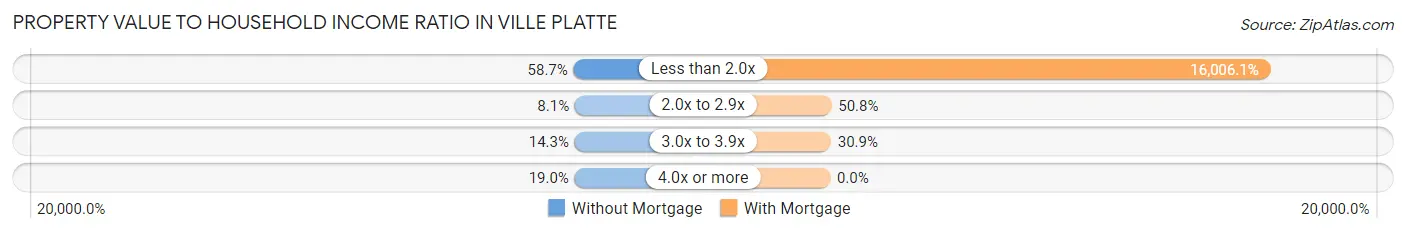
| Value-to-Income Ratio | Without Mortgage | With Mortgage |
| Less than 2.0x | 451 (58.7%) | 39,375 (16,006.1%) |
| 2.0x to 2.9x | 62 (8.1%) | 125 (50.8%) |
| 3.0x to 3.9x | 110 (14.3%) | 76 (30.9%) |
| 4.0x or more | 146 (19.0%) | 0 (0.0%) |
| Total | 769 (100.0%) | 246 (100.0%) |
Real Estate Taxes by Mortgage Status in Ville Platte
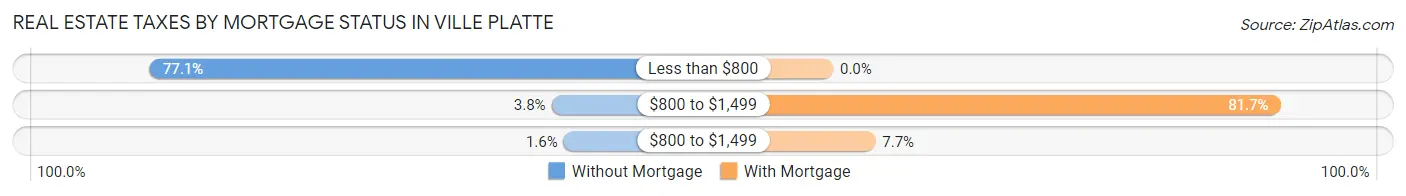
| Property Taxes | Without Mortgage | With Mortgage |
| Less than $800 | 593 (77.1%) | 0 (0.0%) |
| $800 to $1,499 | 29 (3.8%) | 201 (81.7%) |
| $800 to $1,499 | 12 (1.6%) | 19 (7.7%) |
| Total | 769 (100.0%) | 246 (100.0%) |
Health & Disability in Ville Platte
Health Insurance Coverage by Age in Ville Platte
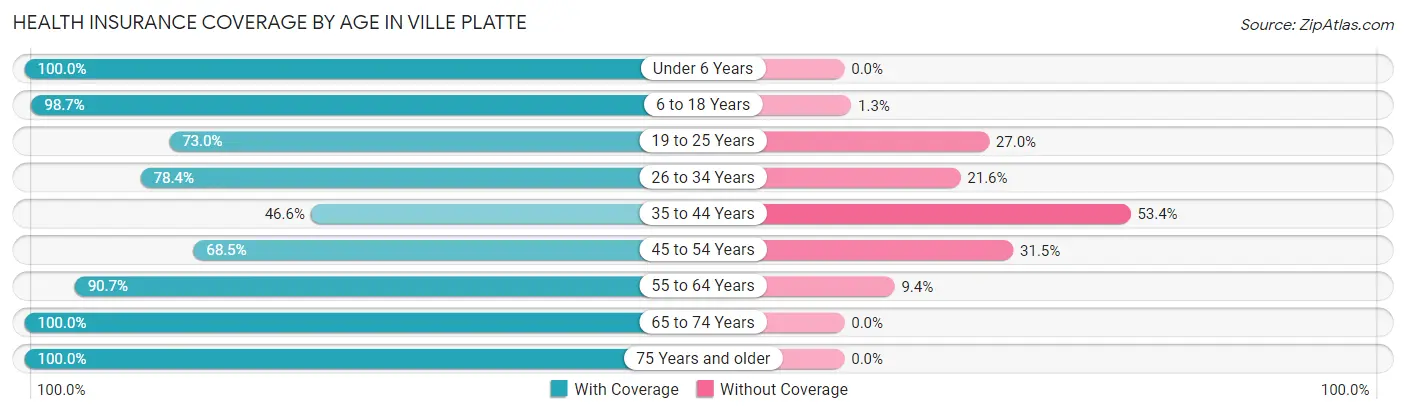
| Age Bracket | With Coverage | Without Coverage |
| Under 6 Years | 536 (100.0%) | 0 (0.0%) |
| 6 to 18 Years | 1,011 (98.7%) | 13 (1.3%) |
| 19 to 25 Years | 685 (73.0%) | 253 (27.0%) |
| 26 to 34 Years | 420 (78.4%) | 116 (21.6%) |
| 35 to 44 Years | 437 (46.6%) | 500 (53.4%) |
| 45 to 54 Years | 357 (68.5%) | 164 (31.5%) |
| 55 to 64 Years | 688 (90.6%) | 71 (9.3%) |
| 65 to 74 Years | 574 (100.0%) | 0 (0.0%) |
| 75 Years and older | 532 (100.0%) | 0 (0.0%) |
| Total | 5,240 (82.4%) | 1,117 (17.6%) |
Health Insurance Coverage by Citizenship Status in Ville Platte
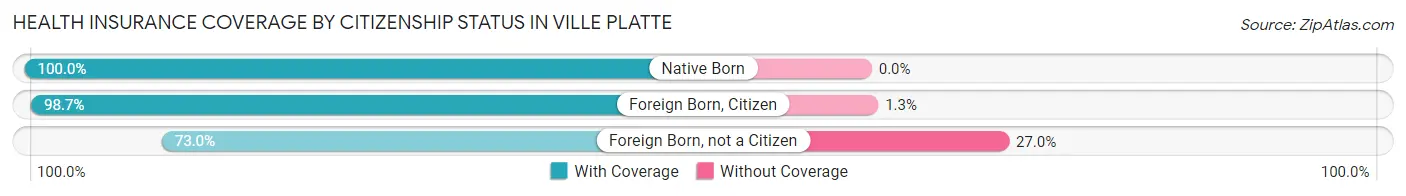
| Citizenship Status | With Coverage | Without Coverage |
| Native Born | 536 (100.0%) | 0 (0.0%) |
| Foreign Born, Citizen | 1,011 (98.7%) | 13 (1.3%) |
| Foreign Born, not a Citizen | 685 (73.0%) | 253 (27.0%) |
Health Insurance Coverage by Household Income in Ville Platte
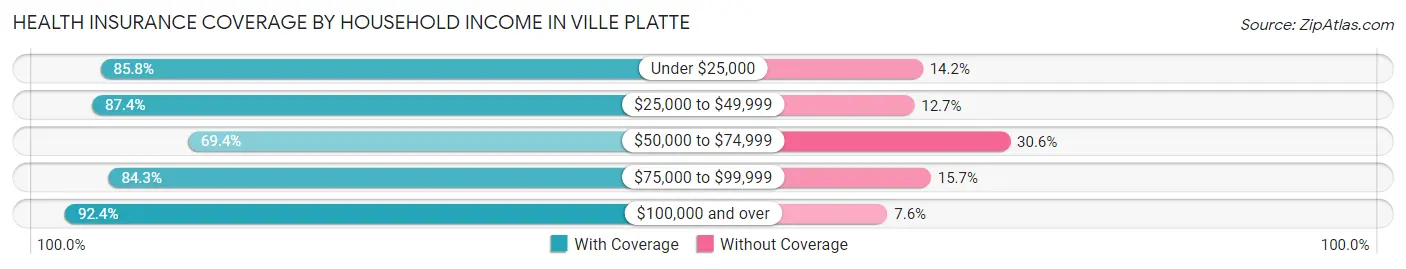
| Household Income | With Coverage | Without Coverage |
| Under $25,000 | 2,290 (85.8%) | 380 (14.2%) |
| $25,000 to $49,999 | 1,623 (87.4%) | 235 (12.7%) |
| $50,000 to $74,999 | 1,073 (69.4%) | 473 (30.6%) |
| $75,000 to $99,999 | 91 (84.3%) | 17 (15.7%) |
| $100,000 and over | 146 (92.4%) | 12 (7.6%) |
Public vs Private Health Insurance Coverage by Age in Ville Platte
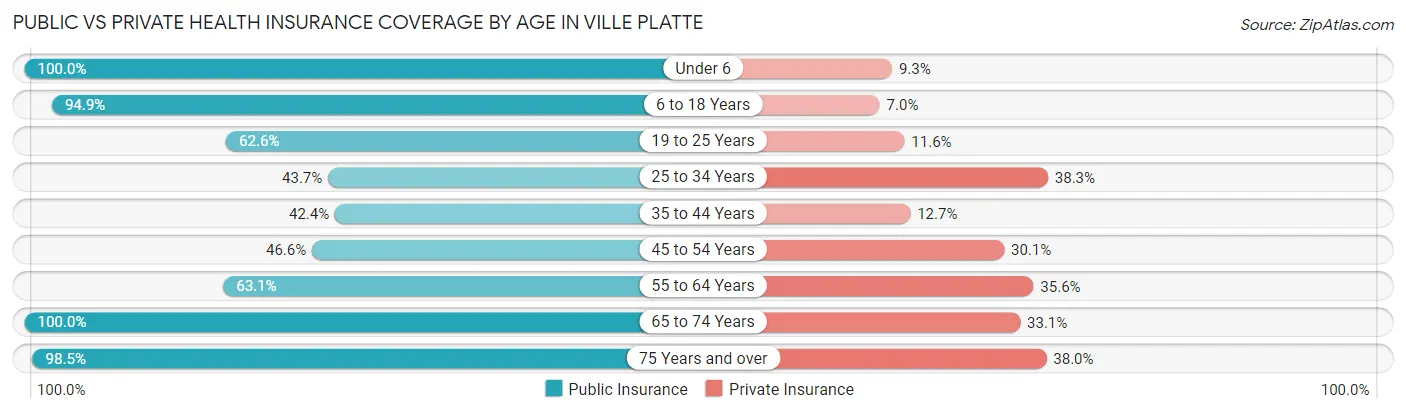
| Age Bracket | Public Insurance | Private Insurance |
| Under 6 | 536 (100.0%) | 50 (9.3%) |
| 6 to 18 Years | 972 (94.9%) | 72 (7.0%) |
| 19 to 25 Years | 587 (62.6%) | 109 (11.6%) |
| 25 to 34 Years | 234 (43.7%) | 205 (38.3%) |
| 35 to 44 Years | 397 (42.4%) | 119 (12.7%) |
| 45 to 54 Years | 243 (46.6%) | 157 (30.1%) |
| 55 to 64 Years | 479 (63.1%) | 270 (35.6%) |
| 65 to 74 Years | 574 (100.0%) | 190 (33.1%) |
| 75 Years and over | 524 (98.5%) | 202 (38.0%) |
| Total | 4,546 (71.5%) | 1,374 (21.6%) |
Disability Status by Sex by Age in Ville Platte
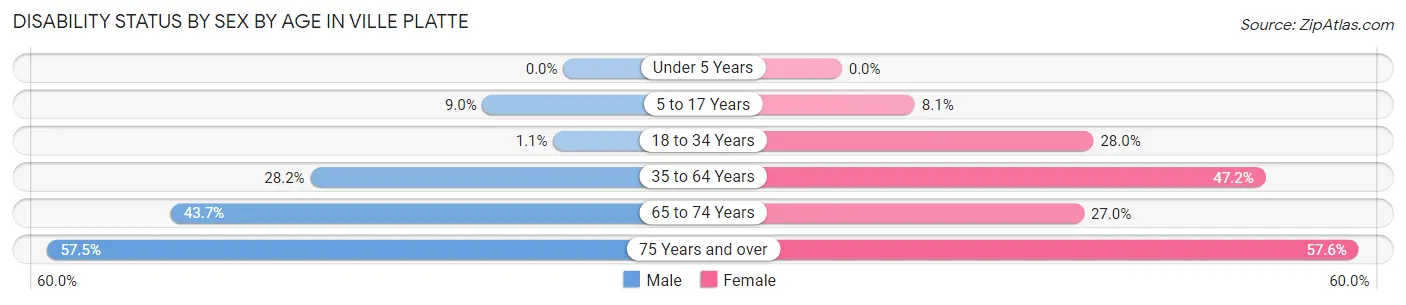
| Age Bracket | Male | Female |
| Under 5 Years | 0 (0.0%) | 0 (0.0%) |
| 5 to 17 Years | 37 (9.0%) | 52 (8.1%) |
| 18 to 34 Years | 9 (1.1%) | 194 (28.0%) |
| 35 to 64 Years | 329 (28.2%) | 495 (47.2%) |
| 65 to 74 Years | 118 (43.7%) | 82 (27.0%) |
| 75 Years and over | 108 (57.5%) | 198 (57.6%) |
Disability Class by Sex by Age in Ville Platte
Disability Class: Hearing Difficulty
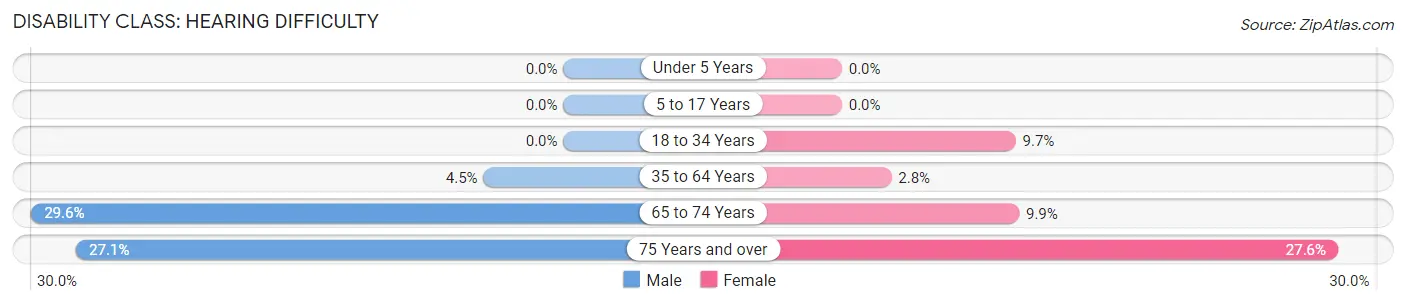
| Age Bracket | Male | Female |
| Under 5 Years | 0 (0.0%) | 0 (0.0%) |
| 5 to 17 Years | 0 (0.0%) | 0 (0.0%) |
| 18 to 34 Years | 0 (0.0%) | 67 (9.7%) |
| 35 to 64 Years | 52 (4.4%) | 29 (2.8%) |
| 65 to 74 Years | 80 (29.6%) | 30 (9.9%) |
| 75 Years and over | 51 (27.1%) | 95 (27.6%) |
Disability Class: Vision Difficulty
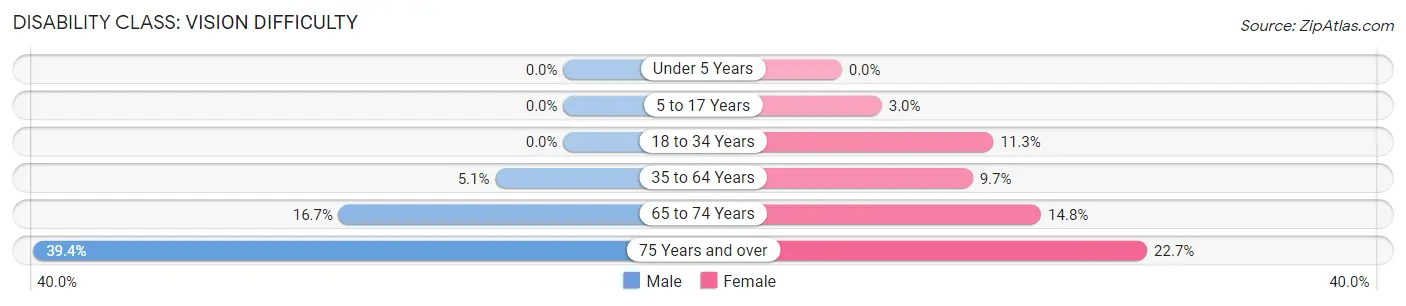
| Age Bracket | Male | Female |
| Under 5 Years | 0 (0.0%) | 0 (0.0%) |
| 5 to 17 Years | 0 (0.0%) | 19 (3.0%) |
| 18 to 34 Years | 0 (0.0%) | 78 (11.3%) |
| 35 to 64 Years | 59 (5.1%) | 102 (9.7%) |
| 65 to 74 Years | 45 (16.7%) | 45 (14.8%) |
| 75 Years and over | 74 (39.4%) | 78 (22.7%) |
Disability Class: Cognitive Difficulty
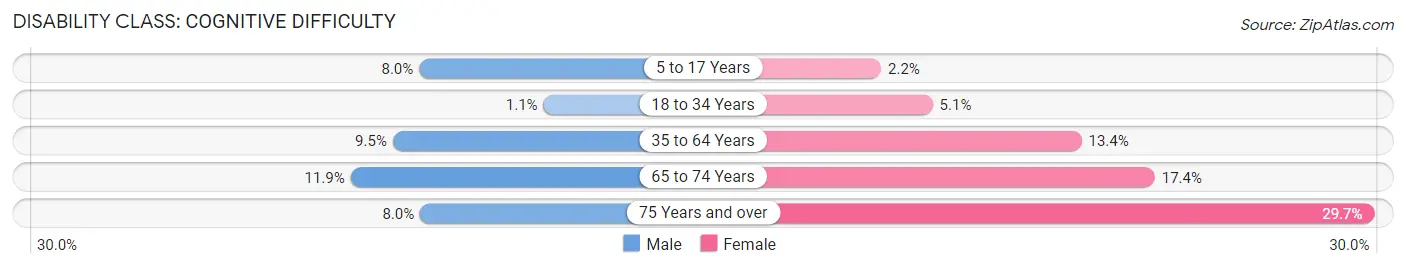
| Age Bracket | Male | Female |
| 5 to 17 Years | 33 (8.0%) | 14 (2.2%) |
| 18 to 34 Years | 9 (1.1%) | 35 (5.1%) |
| 35 to 64 Years | 111 (9.5%) | 140 (13.4%) |
| 65 to 74 Years | 32 (11.8%) | 53 (17.4%) |
| 75 Years and over | 15 (8.0%) | 102 (29.6%) |
Disability Class: Ambulatory Difficulty
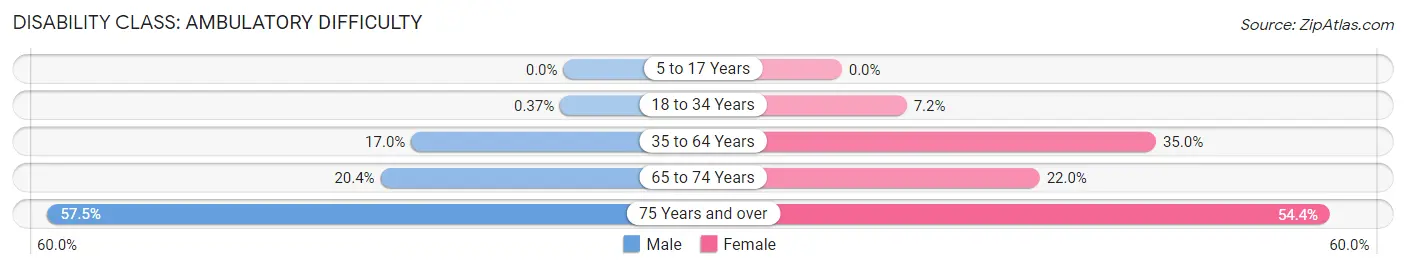
| Age Bracket | Male | Female |
| 5 to 17 Years | 0 (0.0%) | 0 (0.0%) |
| 18 to 34 Years | 3 (0.4%) | 50 (7.2%) |
| 35 to 64 Years | 198 (17.0%) | 367 (35.0%) |
| 65 to 74 Years | 55 (20.4%) | 67 (22.0%) |
| 75 Years and over | 108 (57.5%) | 187 (54.4%) |
Disability Class: Self-Care Difficulty
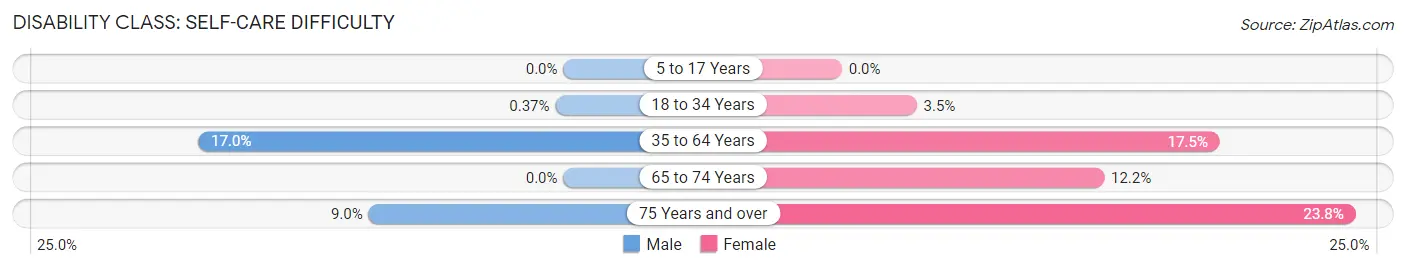
| Age Bracket | Male | Female |
| 5 to 17 Years | 0 (0.0%) | 0 (0.0%) |
| 18 to 34 Years | 3 (0.4%) | 24 (3.5%) |
| 35 to 64 Years | 198 (17.0%) | 184 (17.5%) |
| 65 to 74 Years | 0 (0.0%) | 37 (12.2%) |
| 75 Years and over | 17 (9.0%) | 82 (23.8%) |
Technology Access in Ville Platte
Computing Device Access in Ville Platte
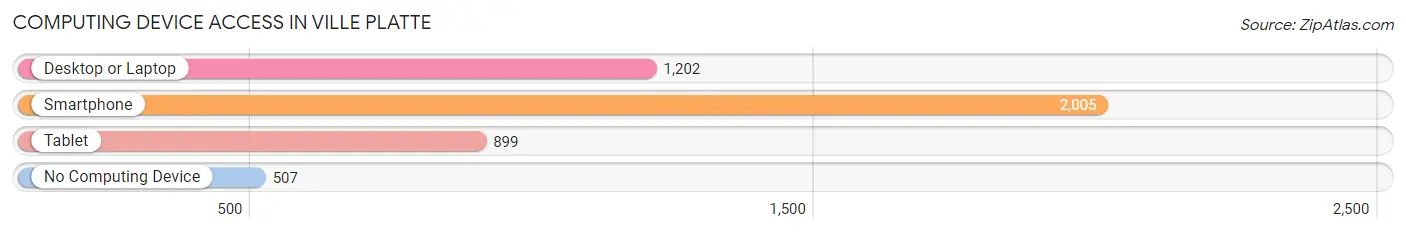
| Device Type | # Households | % Households |
| Desktop or Laptop | 1,202 | 45.3% |
| Smartphone | 2,005 | 75.6% |
| Tablet | 899 | 33.9% |
| No Computing Device | 507 | 19.1% |
| Total | 2,652 | 100.0% |
Internet Access in Ville Platte
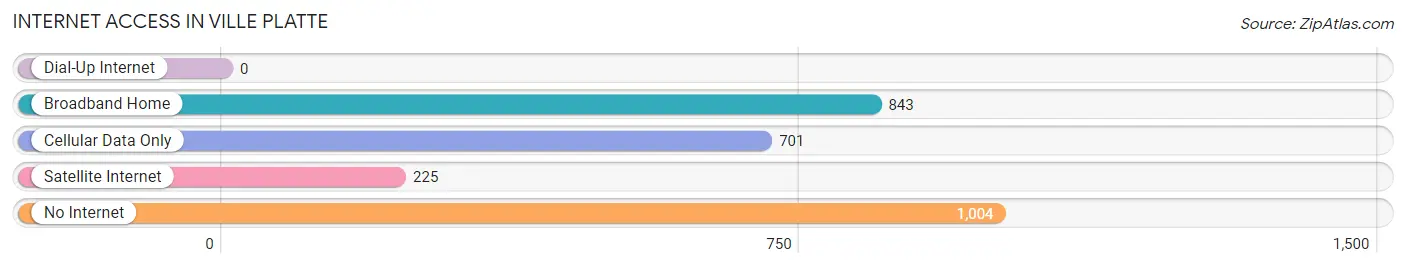
| Internet Type | # Households | % Households |
| Dial-Up Internet | 0 | 0.0% |
| Broadband Home | 843 | 31.8% |
| Cellular Data Only | 701 | 26.4% |
| Satellite Internet | 225 | 8.5% |
| No Internet | 1,004 | 37.9% |
| Total | 2,652 | 100.0% |
Ville Platte Summary
Ville Platte is a city located in Evangeline Parish, Louisiana, United States. It is the parish seat of Evangeline Parish and is the largest city in the parish. The population of Ville Platte was 7,430 at the 2010 census, up from 6,702 at the 2000 census.
History
Ville Platte was founded in 1829 by French-speaking settlers from the Attakapas region of Louisiana. The name Ville Platte is derived from the French words for "flat town," referring to the flat terrain of the area. The town was incorporated in 1844 and has been the parish seat of Evangeline Parish since its formation in 1910.
Ville Platte has a long history of French and Cajun culture. The area was originally inhabited by the Attakapas Indians, who were later displaced by French settlers. The French settlers brought with them their language, culture, and cuisine, which are still evident in the area today.
Geography
Ville Platte is located in the center of Evangeline Parish at 30°45'25" North, 92°17'17" West (30.7569, -92.2881). It is bordered to the north by the city of Mamou, to the east by the town of Basile, to the south by the town of Turkey Creek, and to the west by the town of Chataignier.
According to the United States Census Bureau, the city has a total area of 4.2 square miles (10.8 km2), all land.
Economy
Ville Platte is the economic hub of Evangeline Parish. The city is home to a variety of businesses, including retail stores, restaurants, and manufacturing plants. The city is also home to a number of government offices, including the Evangeline Parish Courthouse and the Evangeline Parish Sheriff's Office.
The city is also home to a number of educational institutions, including Ville Platte High School, Ville Platte Elementary School, and Southside Elementary School.
Demographics
As of the 2010 census, there were 7,430 people, 2,845 households, and 1,845 families residing in the city. The population density was 1,764.3 people per square mile (683.2/km2). There were 3,093 housing units at an average density of 735.3 per square mile (284.2/km2). The racial makeup of the city was 57.2% White, 39.3% African American, 0.3% Native American, 0.5% Asian, 0.1% Pacific Islander, 1.2% from other races, and 1.5% from two or more races. Hispanic or Latino of any race were 3.2% of the population.
There were 2,845 households, out of which 33.2% had children under the age of 18 living with them, 37.2% were married couples living together, 22.2% had a female householder with no husband present, and 35.7% were non-families. 30.7% of all households were made up of individuals, and 13.2% had someone living alone who was 65 years of age or older. The average household size was 2.54 and the average family size was 3.17.
In the city, the population was spread out, with 28.2% under the age of 18, 9.7% from 18 to 24, 25.7% from 25 to 44, 21.3% from 45 to 64, and 15.1% who were 65 years of age or older. The median age was 35 years. For every 100 females, there were 87.2 males. For every 100 females age 18 and over, there were 81.2 males.
The median income for a household in the city was $19,917, and the median income for a family was $25,938. Males had a median income of $27,917 versus $17,500 for females. The per capita income for the city was $11,945. About 28.2% of families and 32.2% of the population were below the poverty line, including 43.2% of those under age 18 and 25.2% of those age 65 or over.
Common Questions
What is Per Capita Income in Ville Platte?
Per Capita income in Ville Platte is $14,132.
What is the Median Family Income in Ville Platte?
Median Family Income in Ville Platte is $30,106.
What is the Median Household income in Ville Platte?
Median Household Income in Ville Platte is $24,341.
What is Income or Wage Gap in Ville Platte?
Income or Wage Gap in Ville Platte is 47.4%.
Women in Ville Platte earn 52.6 cents for every dollar earned by a man.
What is Inequality or Gini Index in Ville Platte?
Inequality or Gini Index in Ville Platte is 0.44.
What is the Total Population of Ville Platte?
Total Population of Ville Platte is 6,364.
What is the Total Male Population of Ville Platte?
Total Male Population of Ville Platte is 3,202.
What is the Total Female Population of Ville Platte?
Total Female Population of Ville Platte is 3,162.
What is the Ratio of Males per 100 Females in Ville Platte?
There are 101.27 Males per 100 Females in Ville Platte.
What is the Ratio of Females per 100 Males in Ville Platte?
There are 98.75 Females per 100 Males in Ville Platte.
What is the Median Population Age in Ville Platte?
Median Population Age in Ville Platte is 37.6 Years.
What is the Average Family Size in Ville Platte
Average Family Size in Ville Platte is 3.3 People.
What is the Average Household Size in Ville Platte
Average Household Size in Ville Platte is 2.4 People.
How Large is the Labor Force in Ville Platte?
There are 2,837 People in the Labor Forcein in Ville Platte.
What is the Percentage of People in the Labor Force in Ville Platte?
56.1% of People are in the Labor Force in Ville Platte.
What is the Unemployment Rate in Ville Platte?
Unemployment Rate in Ville Platte is 24.8%.