Tuscumbia, AL Map & Demographics
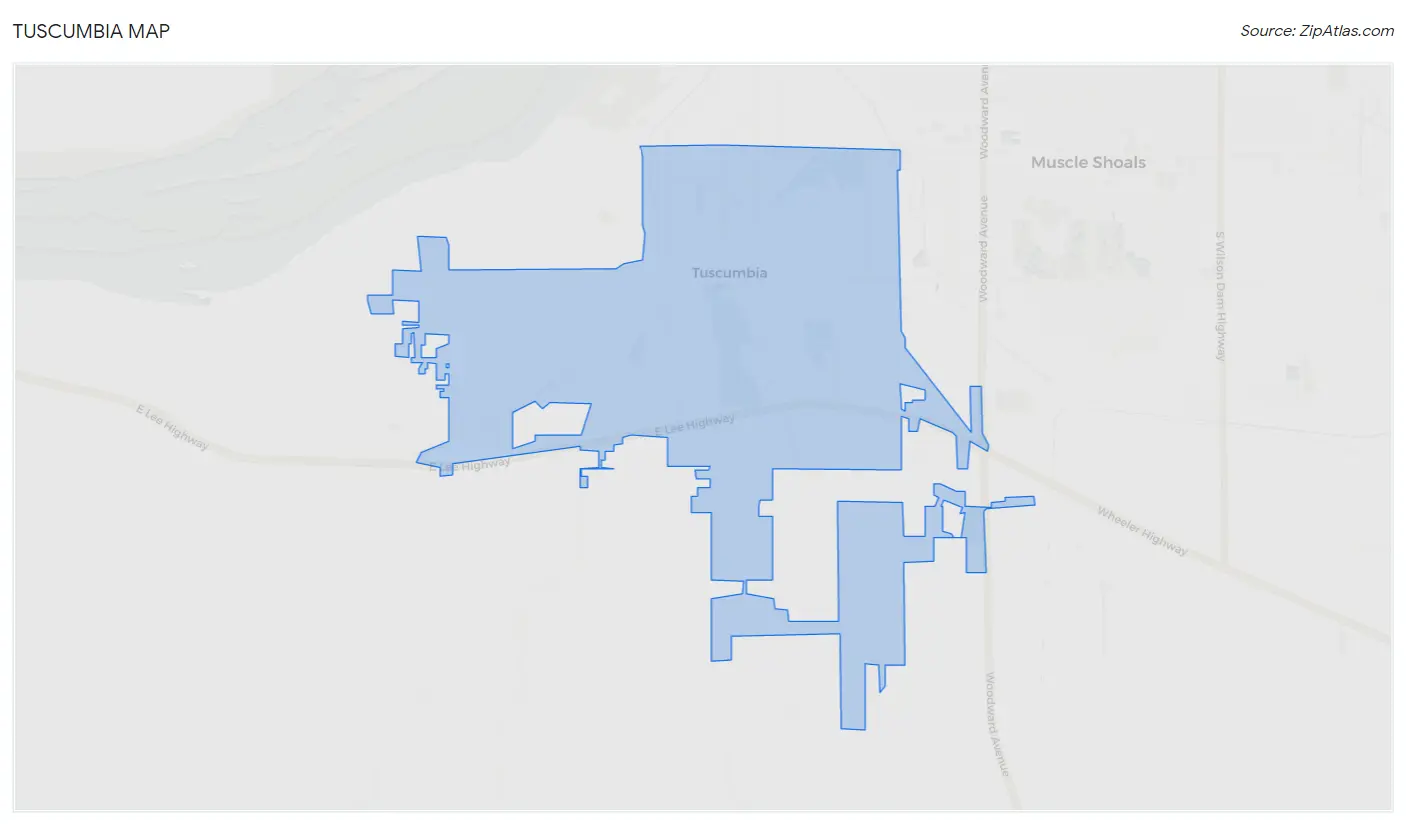
Tuscumbia Map
Tuscumbia Overview
$28,134
PER CAPITA INCOME
$66,006
AVG FAMILY INCOME
$47,530
AVG HOUSEHOLD INCOME
40.5%
WAGE / INCOME GAP [ % ]
59.5¢/ $1
WAGE / INCOME GAP [ $ ]
$27,949
FAMILY INCOME DEFICIT
0.47
INEQUALITY / GINI INDEX
9,029
TOTAL POPULATION
4,176
MALE POPULATION
4,853
FEMALE POPULATION
86.05
MALES / 100 FEMALES
116.21
FEMALES / 100 MALES
37.4
MEDIAN AGE
3.1
AVG FAMILY SIZE
2.3
AVG HOUSEHOLD SIZE
3,695
LABOR FORCE [ PEOPLE ]
53.5%
PERCENT IN LABOR FORCE
1.2%
UNEMPLOYMENT RATE
Tuscumbia Zip Codes
Tuscumbia Area Codes
Income in Tuscumbia
Income Overview in Tuscumbia
Per Capita Income in Tuscumbia is $28,134, while median incomes of families and households are $66,006 and $47,530 respectively.
| Characteristic | Number | Measure |
| Per Capita Income | 9,029 | $28,134 |
| Median Family Income | 2,073 | $66,006 |
| Mean Family Income | 2,073 | $85,365 |
| Median Household Income | 3,799 | $47,530 |
| Mean Household Income | 3,799 | $63,781 |
| Income Deficit | 2,073 | $27,949 |
| Wage / Income Gap (%) | 9,029 | 40.46% |
| Wage / Income Gap ($) | 9,029 | 59.54¢ per $1 |
| Gini / Inequality Index | 9,029 | 0.47 |
Earnings by Sex in Tuscumbia
Average Earnings in Tuscumbia are $35,102, $47,668 for men and $28,381 for women, a difference of 40.5%.
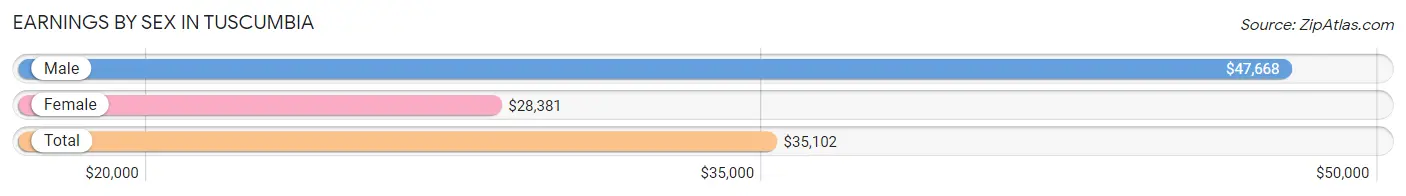
| Sex | Number | Average Earnings |
| Male | 1,959 (52.3%) | $47,668 |
| Female | 1,785 (47.7%) | $28,381 |
| Total | 3,744 (100.0%) | $35,102 |
Earnings by Sex by Income Bracket in Tuscumbia
The most common earnings brackets in Tuscumbia are $75,000 to $99,999 for men (400 | 20.4%) and $25,000 to $29,999 for women (466 | 26.1%).
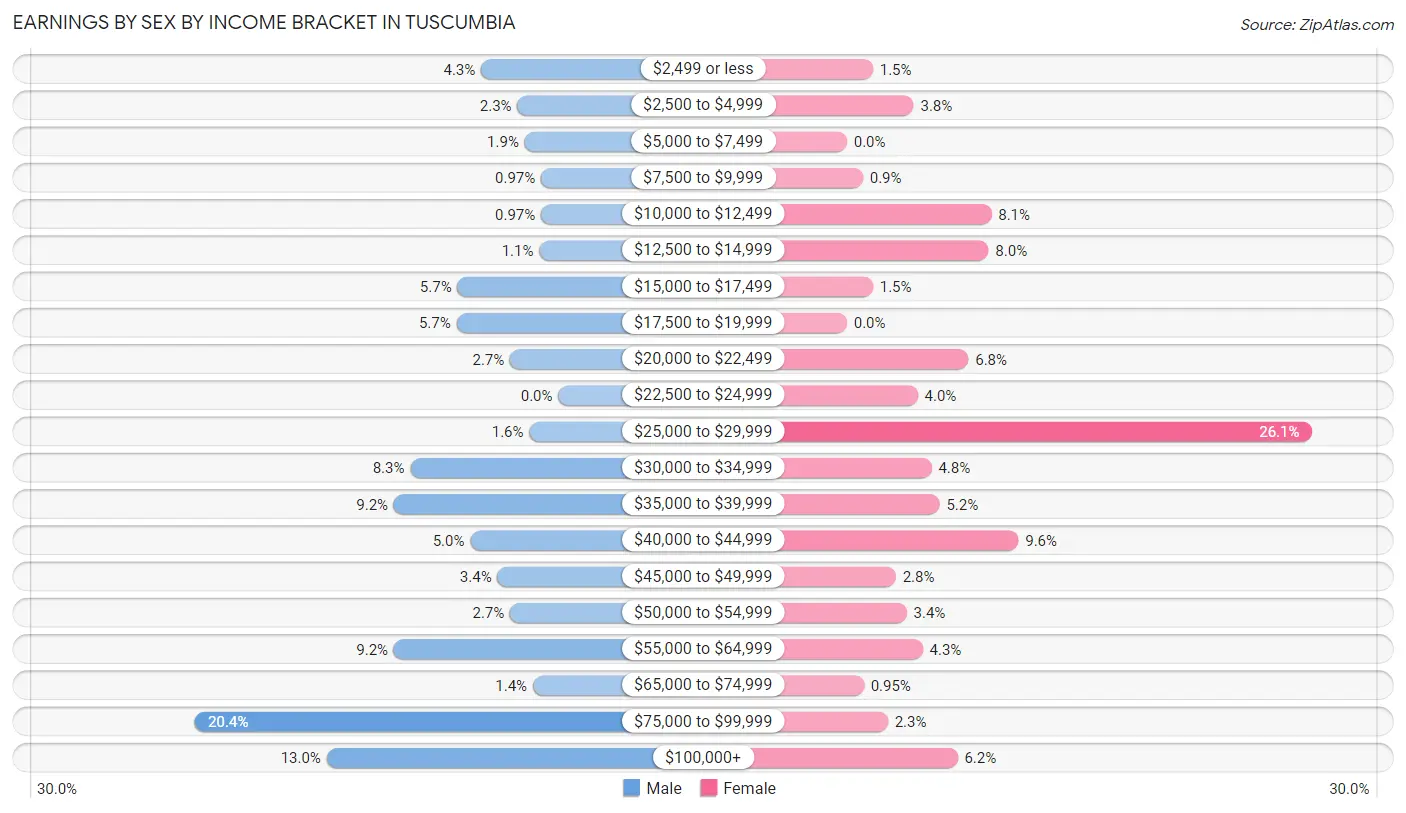
| Income | Male | Female |
| $2,499 or less | 85 (4.3%) | 26 (1.5%) |
| $2,500 to $4,999 | 45 (2.3%) | 67 (3.7%) |
| $5,000 to $7,499 | 37 (1.9%) | 0 (0.0%) |
| $7,500 to $9,999 | 19 (1.0%) | 16 (0.9%) |
| $10,000 to $12,499 | 19 (1.0%) | 145 (8.1%) |
| $12,500 to $14,999 | 21 (1.1%) | 142 (8.0%) |
| $15,000 to $17,499 | 111 (5.7%) | 26 (1.5%) |
| $17,500 to $19,999 | 112 (5.7%) | 0 (0.0%) |
| $20,000 to $22,499 | 53 (2.7%) | 122 (6.8%) |
| $22,500 to $24,999 | 0 (0.0%) | 71 (4.0%) |
| $25,000 to $29,999 | 32 (1.6%) | 466 (26.1%) |
| $30,000 to $34,999 | 163 (8.3%) | 85 (4.8%) |
| $35,000 to $39,999 | 181 (9.2%) | 93 (5.2%) |
| $40,000 to $44,999 | 97 (5.0%) | 172 (9.6%) |
| $45,000 to $49,999 | 67 (3.4%) | 49 (2.8%) |
| $50,000 to $54,999 | 53 (2.7%) | 60 (3.4%) |
| $55,000 to $64,999 | 181 (9.2%) | 76 (4.3%) |
| $65,000 to $74,999 | 28 (1.4%) | 17 (0.9%) |
| $75,000 to $99,999 | 400 (20.4%) | 41 (2.3%) |
| $100,000+ | 255 (13.0%) | 111 (6.2%) |
| Total | 1,959 (100.0%) | 1,785 (100.0%) |
Earnings by Sex by Educational Attainment in Tuscumbia
Average earnings in Tuscumbia are $49,832 for men and $28,439 for women, a difference of 42.9%. Men with an educational attainment of graduate degree enjoy the highest average annual earnings of $167,917, while those with less than high school education earn the least with $36,347. Women with an educational attainment of graduate degree earn the most with the average annual earnings of $111,677, while those with high school diploma education have the smallest earnings of $15,240.
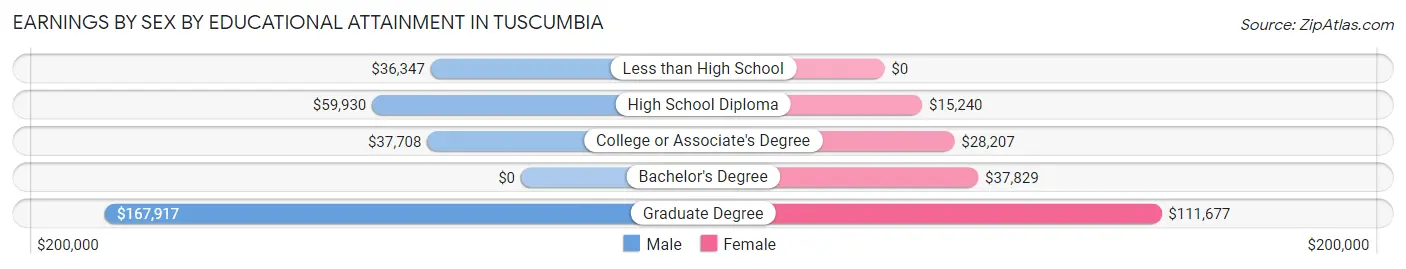
| Educational Attainment | Male Income | Female Income |
| Less than High School | $36,347 | $0 |
| High School Diploma | $59,930 | $15,240 |
| College or Associate's Degree | $37,708 | $28,207 |
| Bachelor's Degree | - | - |
| Graduate Degree | $167,917 | $111,677 |
| Total | $49,832 | $28,439 |
Family Income in Tuscumbia
Family Income Brackets in Tuscumbia
According to the Tuscumbia family income data, there are 456 families falling into the $100,000 to $149,999 income range, which is the most common income bracket and makes up 22.0% of all families.
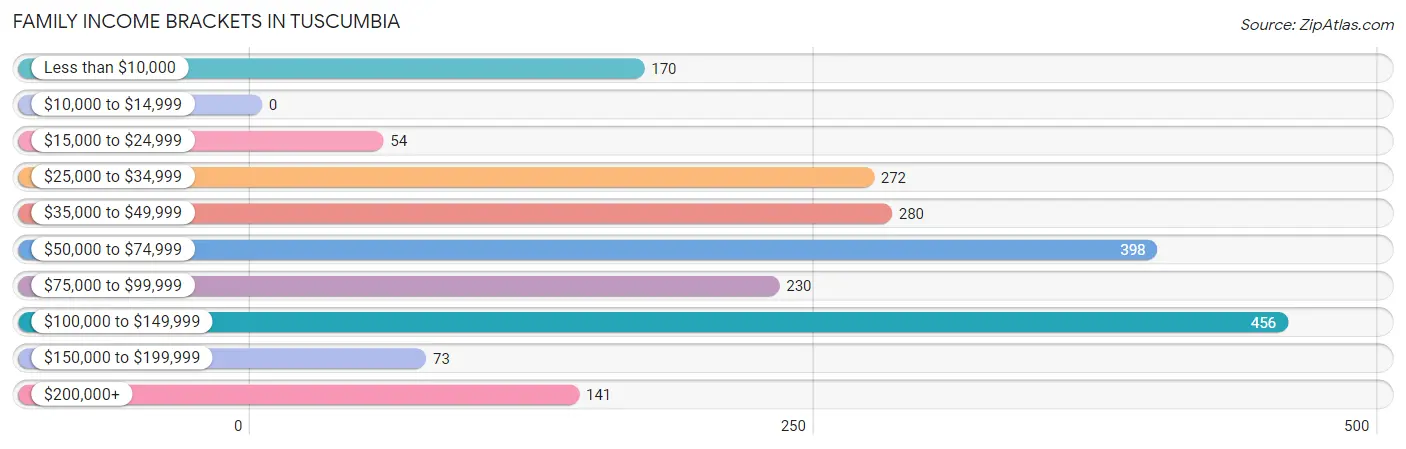
| Income Bracket | # Families | % Families |
| Less than $10,000 | 170 | 8.2% |
| $10,000 to $14,999 | 0 | 0.0% |
| $15,000 to $24,999 | 54 | 2.6% |
| $25,000 to $34,999 | 272 | 13.1% |
| $35,000 to $49,999 | 280 | 13.5% |
| $50,000 to $74,999 | 398 | 19.2% |
| $75,000 to $99,999 | 230 | 11.1% |
| $100,000 to $149,999 | 456 | 22.0% |
| $150,000 to $199,999 | 73 | 3.5% |
| $200,000+ | 141 | 6.8% |
Family Income by Famaliy Size in Tuscumbia
4-person families (463 | 22.3%) account for the highest median family income in Tuscumbia with $114,347 per family, while 2-person families (1,191 | 57.5%) have the highest median income of $28,844 per family member.
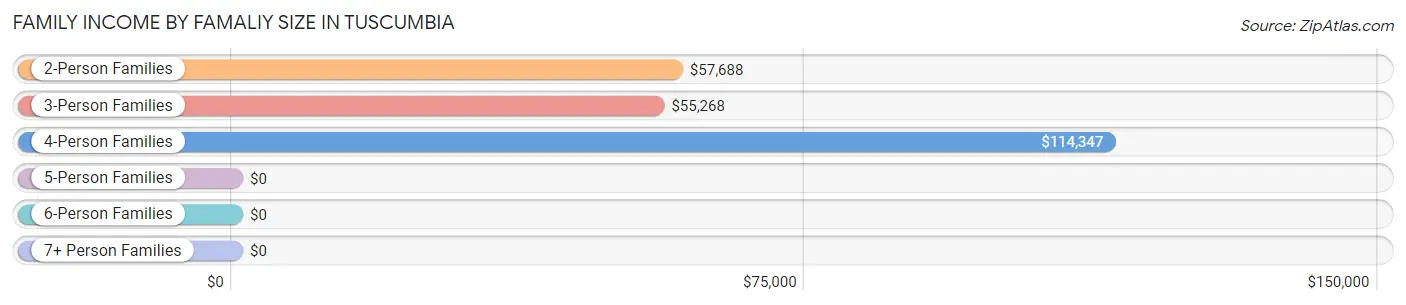
| Income Bracket | # Families | Median Income |
| 2-Person Families | 1,191 (57.5%) | $57,688 |
| 3-Person Families | 235 (11.3%) | $55,268 |
| 4-Person Families | 463 (22.3%) | $114,347 |
| 5-Person Families | 63 (3.0%) | $0 |
| 6-Person Families | 109 (5.3%) | $0 |
| 7+ Person Families | 12 (0.6%) | $0 |
| Total | 2,073 (100.0%) | $66,006 |
Family Income by Number of Earners in Tuscumbia
The median family income in Tuscumbia is $66,006, with families comprising 3+ earners (97) having the highest median family income of $206,989, while families with no earners (474) have the lowest median family income of $34,650, accounting for 4.7% and 22.9% of families, respectively.
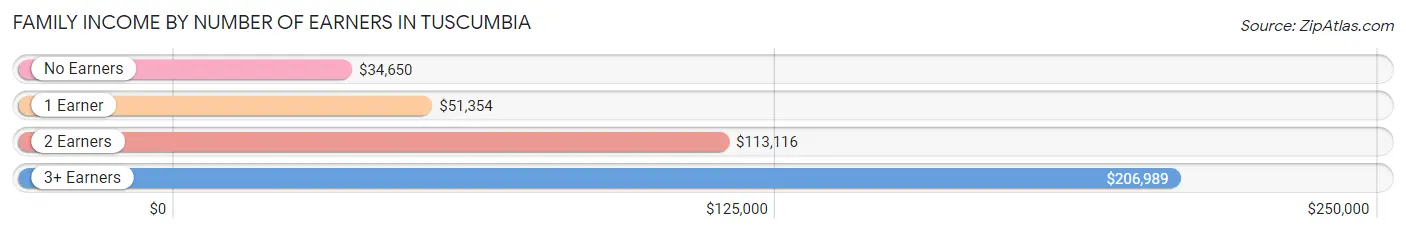
| Number of Earners | # Families | Median Income |
| No Earners | 474 (22.9%) | $34,650 |
| 1 Earner | 697 (33.6%) | $51,354 |
| 2 Earners | 805 (38.8%) | $113,116 |
| 3+ Earners | 97 (4.7%) | $206,989 |
| Total | 2,073 (100.0%) | $66,006 |
Household Income in Tuscumbia
Household Income Brackets in Tuscumbia
With 684 households falling in the category, the $50,000 to $74,999 income range is the most frequent in Tuscumbia, accounting for 18.0% of all households. In contrast, only 72 households (1.9%) fall into the $150,000 to $199,999 income bracket, making it the least populous group.
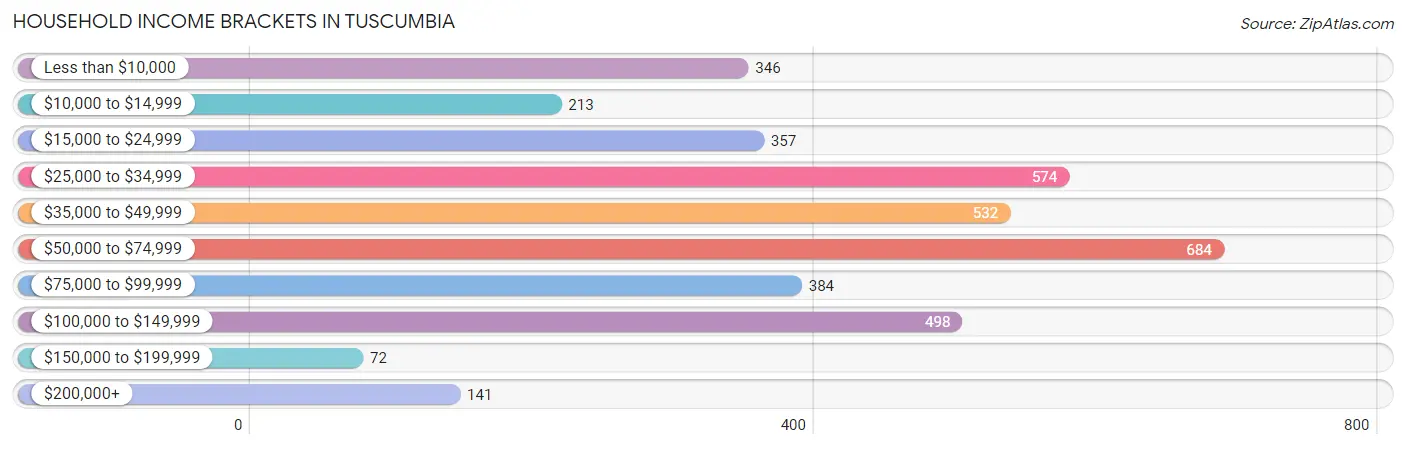
| Income Bracket | # Households | % Households |
| Less than $10,000 | 346 | 9.1% |
| $10,000 to $14,999 | 213 | 5.6% |
| $15,000 to $24,999 | 357 | 9.4% |
| $25,000 to $34,999 | 574 | 15.1% |
| $35,000 to $49,999 | 532 | 14.0% |
| $50,000 to $74,999 | 684 | 18.0% |
| $75,000 to $99,999 | 384 | 10.1% |
| $100,000 to $149,999 | 498 | 13.1% |
| $150,000 to $199,999 | 72 | 1.9% |
| $200,000+ | 141 | 3.7% |
Household Income by Householder Age in Tuscumbia
The median household income in Tuscumbia is $47,530, with the highest median household income of $54,524 found in the 45 to 64 years age bracket for the primary householder. A total of 1,252 households (33.0%) fall into this category. Meanwhile, the 65+ years age bracket for the primary householder has the lowest median household income of $38,689, with 1,252 households (33.0%) in this group.
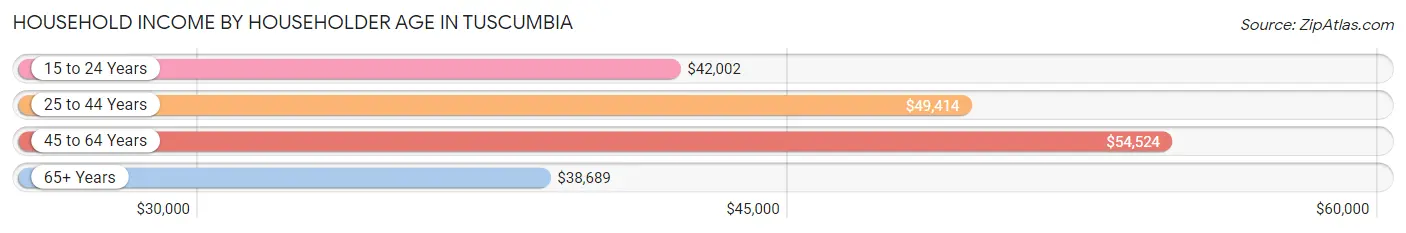
| Income Bracket | # Households | Median Income |
| 15 to 24 Years | 219 (5.8%) | $42,002 |
| 25 to 44 Years | 1,076 (28.3%) | $49,414 |
| 45 to 64 Years | 1,252 (33.0%) | $54,524 |
| 65+ Years | 1,252 (33.0%) | $38,689 |
| Total | 3,799 (100.0%) | $47,530 |
Poverty in Tuscumbia
Income Below Poverty by Sex and Age in Tuscumbia
With 19.0% poverty level for males and 19.9% for females among the residents of Tuscumbia, under 5 year old males and 6 to 11 year old females are the most vulnerable to poverty, with 478 males (93.4%) and 312 females (59.8%) in their respective age groups living below the poverty level.
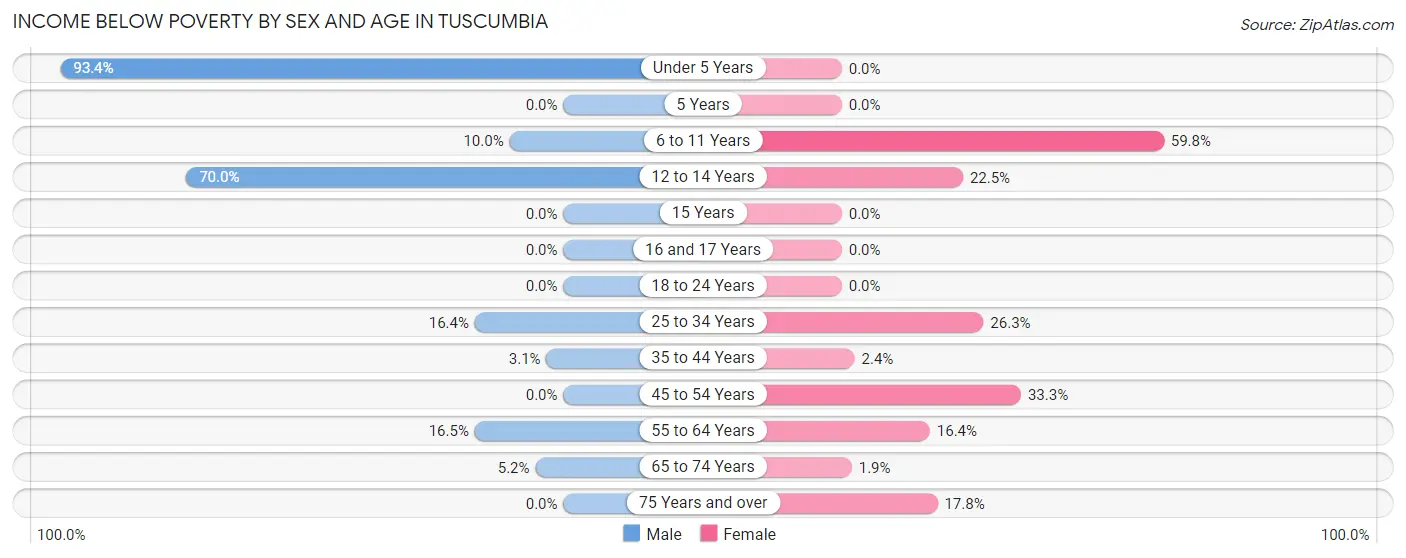
| Age Bracket | Male | Female |
| Under 5 Years | 478 (93.4%) | 0 (0.0%) |
| 5 Years | 0 (0.0%) | 0 (0.0%) |
| 6 to 11 Years | 42 (10.0%) | 312 (59.8%) |
| 12 to 14 Years | 70 (70.0%) | 74 (22.5%) |
| 15 Years | 0 (0.0%) | 0 (0.0%) |
| 16 and 17 Years | 0 (0.0%) | 0 (0.0%) |
| 18 to 24 Years | 0 (0.0%) | 0 (0.0%) |
| 25 to 34 Years | 60 (16.4%) | 184 (26.3%) |
| 35 to 44 Years | 19 (3.1%) | 10 (2.4%) |
| 45 to 54 Years | 0 (0.0%) | 158 (33.3%) |
| 55 to 64 Years | 76 (16.5%) | 87 (16.4%) |
| 65 to 74 Years | 24 (5.2%) | 11 (1.8%) |
| 75 Years and over | 0 (0.0%) | 100 (17.8%) |
| Total | 769 (19.0%) | 936 (19.9%) |
Income Above Poverty by Sex and Age in Tuscumbia
According to the poverty statistics in Tuscumbia, males aged 5 years and females aged under 5 years are the age groups that are most secure financially, with 100.0% of males and 100.0% of females in these age groups living above the poverty line.
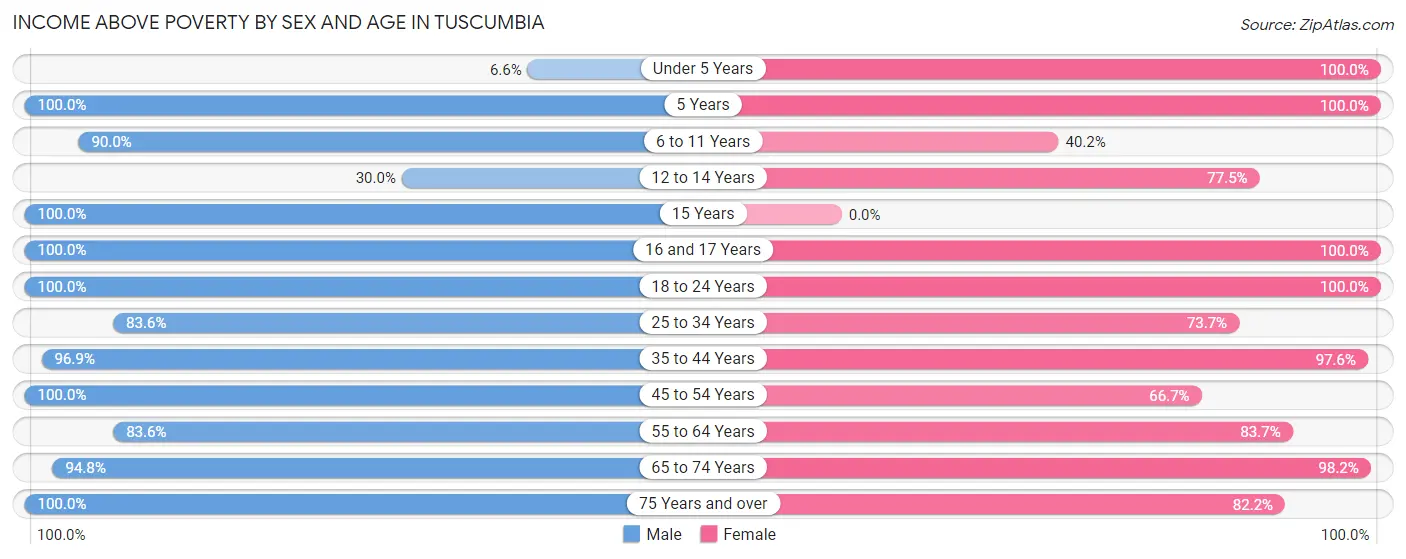
| Age Bracket | Male | Female |
| Under 5 Years | 34 (6.6%) | 139 (100.0%) |
| 5 Years | 28 (100.0%) | 4 (100.0%) |
| 6 to 11 Years | 378 (90.0%) | 210 (40.2%) |
| 12 to 14 Years | 30 (30.0%) | 255 (77.5%) |
| 15 Years | 55 (100.0%) | 0 (0.0%) |
| 16 and 17 Years | 179 (100.0%) | 9 (100.0%) |
| 18 to 24 Years | 243 (100.0%) | 410 (100.0%) |
| 25 to 34 Years | 305 (83.6%) | 516 (73.7%) |
| 35 to 44 Years | 587 (96.9%) | 410 (97.6%) |
| 45 to 54 Years | 312 (100.0%) | 317 (66.7%) |
| 55 to 64 Years | 386 (83.6%) | 445 (83.7%) |
| 65 to 74 Years | 438 (94.8%) | 583 (98.2%) |
| 75 Years and over | 307 (100.0%) | 463 (82.2%) |
| Total | 3,282 (81.0%) | 3,761 (80.1%) |
Income Below Poverty Among Married-Couple Families in Tuscumbia
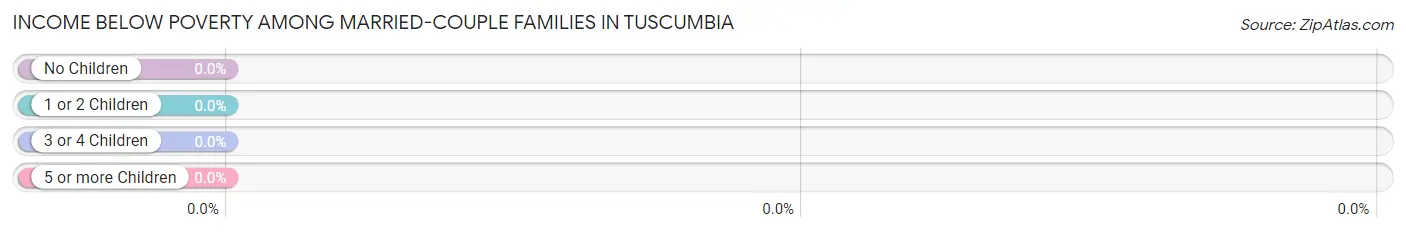
| Children | Above Poverty | Below Poverty |
| No Children | 890 (100.0%) | 0 (0.0%) |
| 1 or 2 Children | 515 (100.0%) | 0 (0.0%) |
| 3 or 4 Children | 23 (100.0%) | 0 (0.0%) |
| 5 or more Children | 0 (0.0%) | 0 (0.0%) |
| Total | 1,428 (100.0%) | 0 (0.0%) |
Income Below Poverty Among Single-Parent Households in Tuscumbia
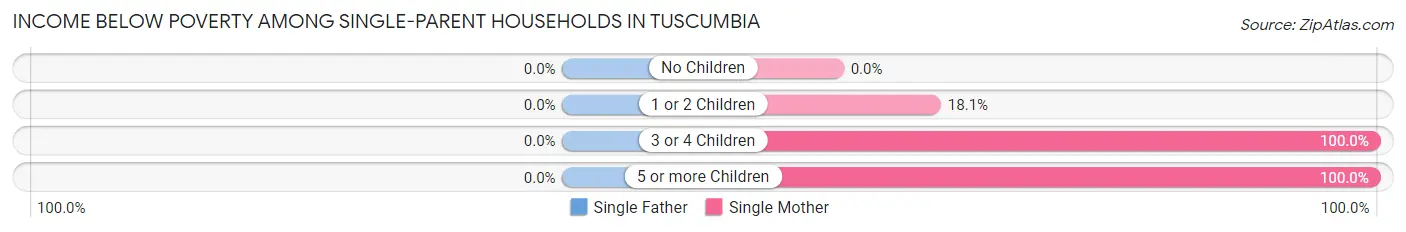
| Children | Single Father | Single Mother |
| No Children | 0 (0.0%) | 0 (0.0%) |
| 1 or 2 Children | 0 (0.0%) | 44 (18.1%) |
| 3 or 4 Children | 0 (0.0%) | 24 (100.0%) |
| 5 or more Children | 0 (0.0%) | 115 (100.0%) |
| Total | 0 (0.0%) | 183 (36.2%) |
Income Below Poverty Among Married-Couple vs Single-Parent Households in Tuscumbia
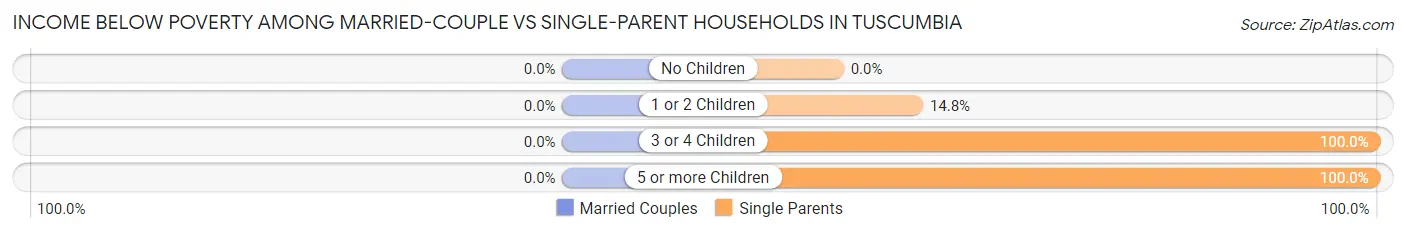
| Children | Married-Couple Families | Single-Parent Households |
| No Children | 0 (0.0%) | 0 (0.0%) |
| 1 or 2 Children | 0 (0.0%) | 44 (14.8%) |
| 3 or 4 Children | 0 (0.0%) | 24 (100.0%) |
| 5 or more Children | 0 (0.0%) | 115 (100.0%) |
| Total | 0 (0.0%) | 183 (28.4%) |
Race in Tuscumbia
The most populous races in Tuscumbia are White / Caucasian (6,374 | 70.6%), Black / African American (2,213 | 24.5%), and Two or more Races (333 | 3.7%).
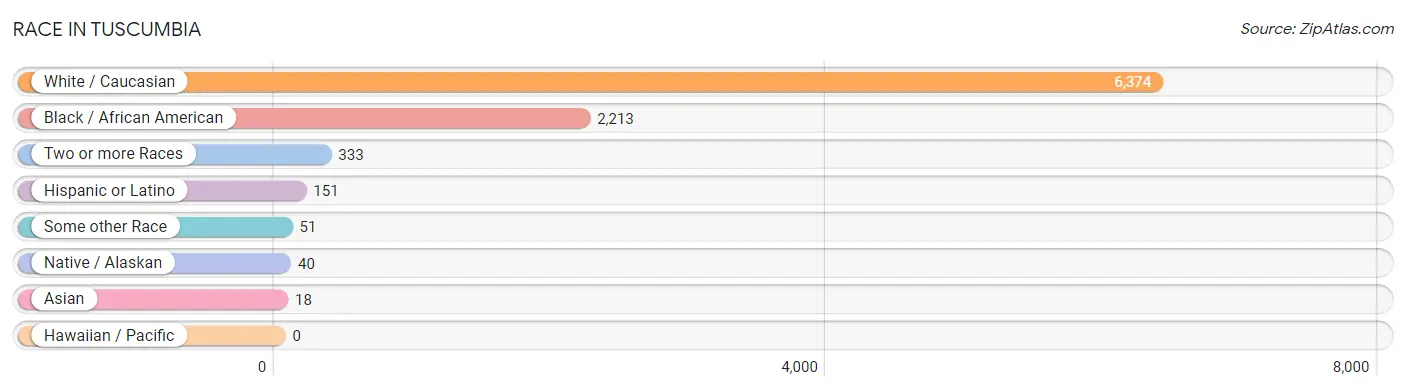
| Race | # Population | % Population |
| Asian | 18 | 0.2% |
| Black / African American | 2,213 | 24.5% |
| Hawaiian / Pacific | 0 | 0.0% |
| Hispanic or Latino | 151 | 1.7% |
| Native / Alaskan | 40 | 0.4% |
| White / Caucasian | 6,374 | 70.6% |
| Two or more Races | 333 | 3.7% |
| Some other Race | 51 | 0.6% |
| Total | 9,029 | 100.0% |
Ancestry in Tuscumbia
The most populous ancestries reported in Tuscumbia are American (1,624 | 18.0%), English (824 | 9.1%), Irish (403 | 4.5%), Italian (259 | 2.9%), and German (215 | 2.4%), together accounting for 36.8% of all Tuscumbia residents.
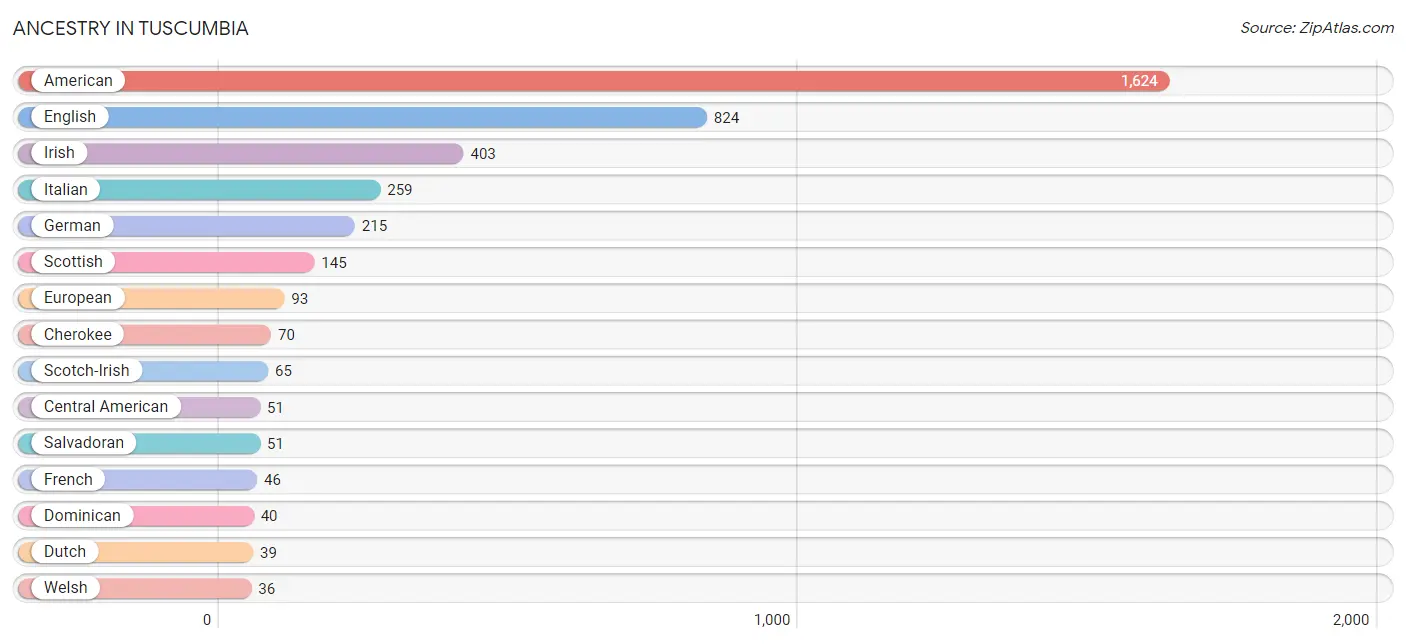
| Ancestry | # Population | % Population |
| African | 10 | 0.1% |
| American | 1,624 | 18.0% |
| Australian | 30 | 0.3% |
| Central American | 51 | 0.6% |
| Cherokee | 70 | 0.8% |
| Chickasaw | 33 | 0.4% |
| Creek | 30 | 0.3% |
| Czech | 11 | 0.1% |
| Dominican | 40 | 0.4% |
| Dutch | 39 | 0.4% |
| Eastern European | 10 | 0.1% |
| English | 824 | 9.1% |
| European | 93 | 1.0% |
| French | 46 | 0.5% |
| German | 215 | 2.4% |
| Irish | 403 | 4.5% |
| Italian | 259 | 2.9% |
| Lumbee | 15 | 0.2% |
| Mexican | 22 | 0.2% |
| Norwegian | 11 | 0.1% |
| Polish | 35 | 0.4% |
| Puerto Rican | 8 | 0.1% |
| Salvadoran | 51 | 0.6% |
| Scotch-Irish | 65 | 0.7% |
| Scottish | 145 | 1.6% |
| Spaniard | 30 | 0.3% |
| Subsaharan African | 10 | 0.1% |
| Swedish | 21 | 0.2% |
| Thai | 18 | 0.2% |
| Welsh | 36 | 0.4% |
| West Indian | 12 | 0.1% | View All 31 Rows |
Immigrants in Tuscumbia
The most numerous immigrant groups reported in Tuscumbia came from Latin America (15 | 0.2%), Caribbean (12 | 0.1%), Trinidad and Tobago (12 | 0.1%), Central America (3 | 0.0%), and Mexico (3 | 0.0%), together accounting for 0.5% of all Tuscumbia residents.
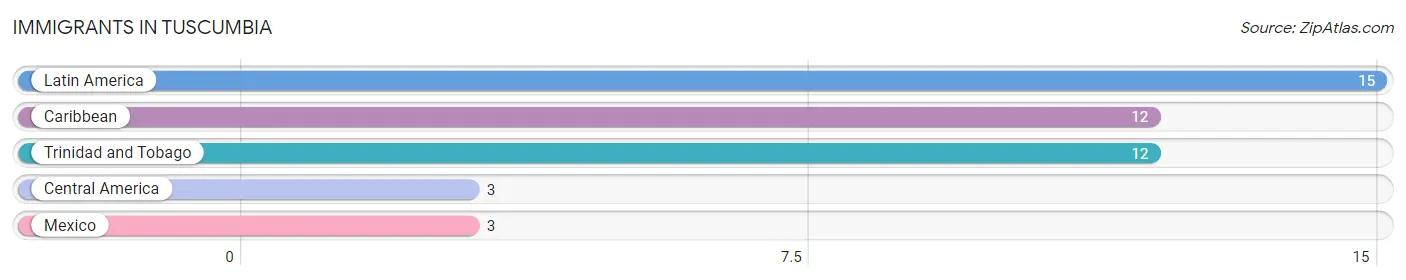
| Immigration Origin | # Population | % Population |
| Caribbean | 12 | 0.1% |
| Central America | 3 | 0.0% |
| Latin America | 15 | 0.2% |
| Mexico | 3 | 0.0% |
| Trinidad and Tobago | 12 | 0.1% | View All 5 Rows |
Sex and Age in Tuscumbia
Sex and Age in Tuscumbia
The most populous age groups in Tuscumbia are 35 to 39 Years (530 | 12.7%) for men and 10 to 14 Years (473 | 9.8%) for women.
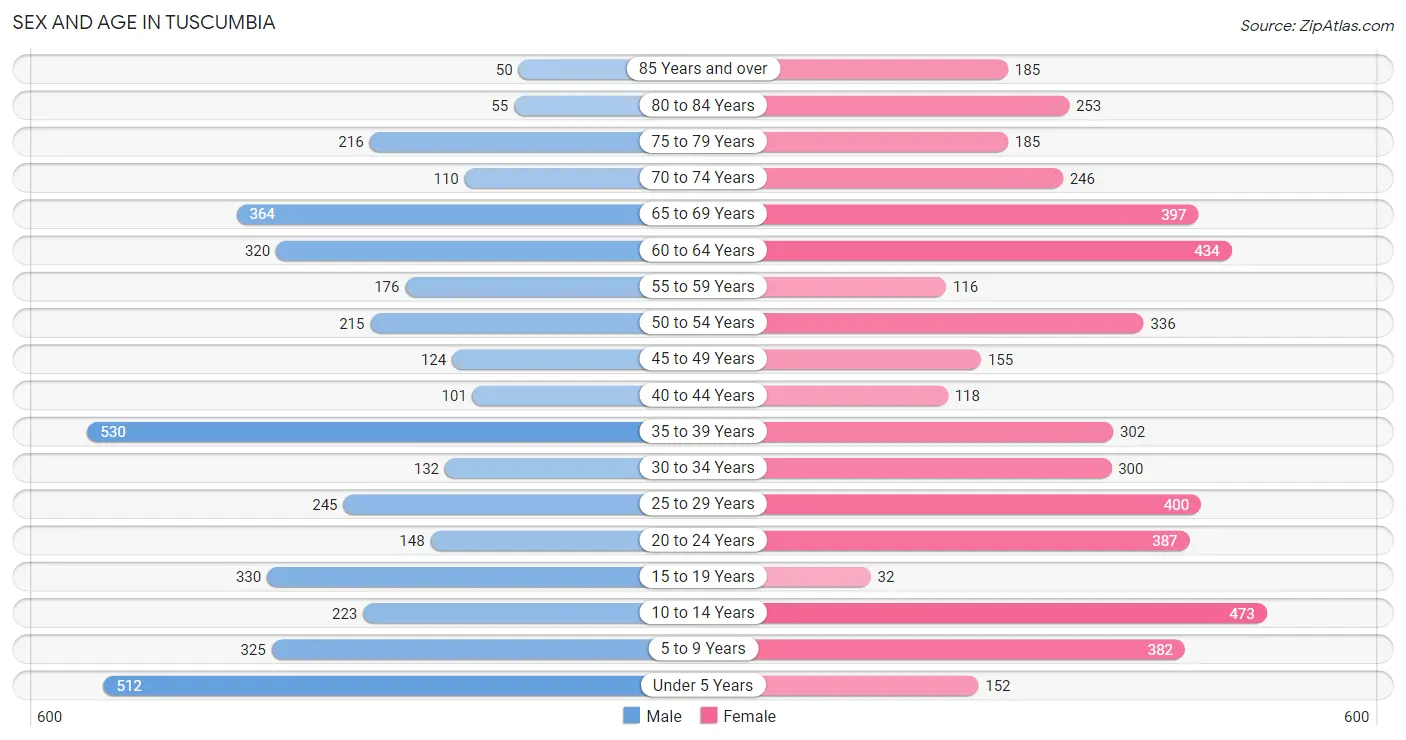
| Age Bracket | Male | Female |
| Under 5 Years | 512 (12.3%) | 152 (3.1%) |
| 5 to 9 Years | 325 (7.8%) | 382 (7.9%) |
| 10 to 14 Years | 223 (5.3%) | 473 (9.8%) |
| 15 to 19 Years | 330 (7.9%) | 32 (0.7%) |
| 20 to 24 Years | 148 (3.5%) | 387 (8.0%) |
| 25 to 29 Years | 245 (5.9%) | 400 (8.2%) |
| 30 to 34 Years | 132 (3.2%) | 300 (6.2%) |
| 35 to 39 Years | 530 (12.7%) | 302 (6.2%) |
| 40 to 44 Years | 101 (2.4%) | 118 (2.4%) |
| 45 to 49 Years | 124 (3.0%) | 155 (3.2%) |
| 50 to 54 Years | 215 (5.1%) | 336 (6.9%) |
| 55 to 59 Years | 176 (4.2%) | 116 (2.4%) |
| 60 to 64 Years | 320 (7.7%) | 434 (8.9%) |
| 65 to 69 Years | 364 (8.7%) | 397 (8.2%) |
| 70 to 74 Years | 110 (2.6%) | 246 (5.1%) |
| 75 to 79 Years | 216 (5.2%) | 185 (3.8%) |
| 80 to 84 Years | 55 (1.3%) | 253 (5.2%) |
| 85 Years and over | 50 (1.2%) | 185 (3.8%) |
| Total | 4,176 (100.0%) | 4,853 (100.0%) |
Families and Households in Tuscumbia
Median Family Size in Tuscumbia
The median family size in Tuscumbia is 3.14 persons per family, with single female/mother families (506 | 24.4%) accounting for the largest median family size of 3.98 persons per family. On the other hand, single male/father families (139 | 6.7%) represent the smallest median family size with 2.43 persons per family.
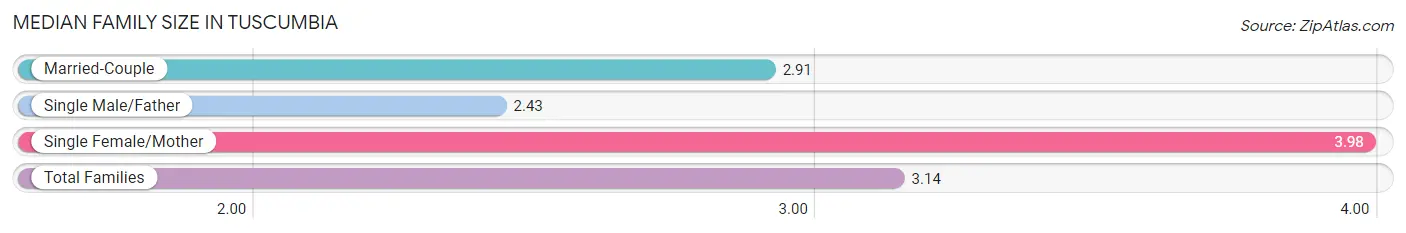
| Family Type | # Families | Family Size |
| Married-Couple | 1,428 (68.9%) | 2.91 |
| Single Male/Father | 139 (6.7%) | 2.43 |
| Single Female/Mother | 506 (24.4%) | 3.98 |
| Total Families | 2,073 (100.0%) | 3.14 |
Median Household Size in Tuscumbia
The median household size in Tuscumbia is 2.31 persons per household, with single female/mother households (506 | 13.3%) accounting for the largest median household size of 4.33 persons per household. non-family households (1,726 | 45.4%) represent the smallest median household size with 1.14 persons per household.
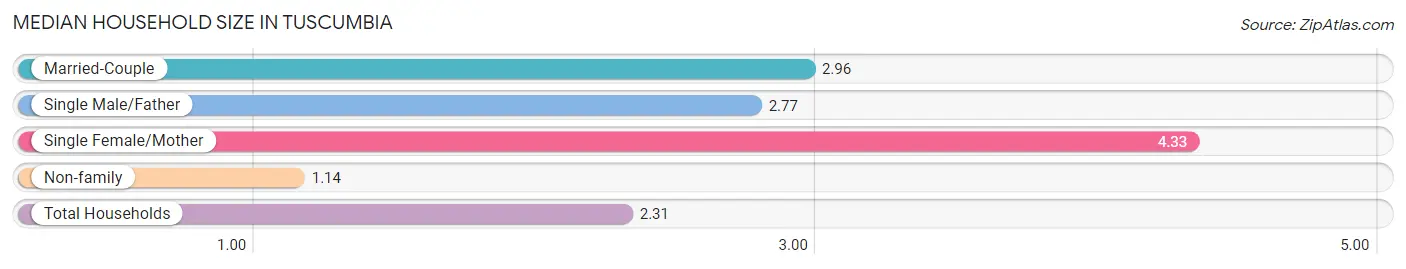
| Household Type | # Households | Household Size |
| Married-Couple | 1,428 (37.6%) | 2.96 |
| Single Male/Father | 139 (3.7%) | 2.77 |
| Single Female/Mother | 506 (13.3%) | 4.33 |
| Non-family | 1,726 (45.4%) | 1.14 |
| Total Households | 3,799 (100.0%) | 2.31 |
Household Size by Marriage Status in Tuscumbia
Out of a total of 3,799 households in Tuscumbia, 2,073 (54.6%) are family households, while 1,726 (45.4%) are nonfamily households. The most numerous type of family households are 2-person households, comprising 1,051, and the most common type of nonfamily households are 1-person households, comprising 1,497.
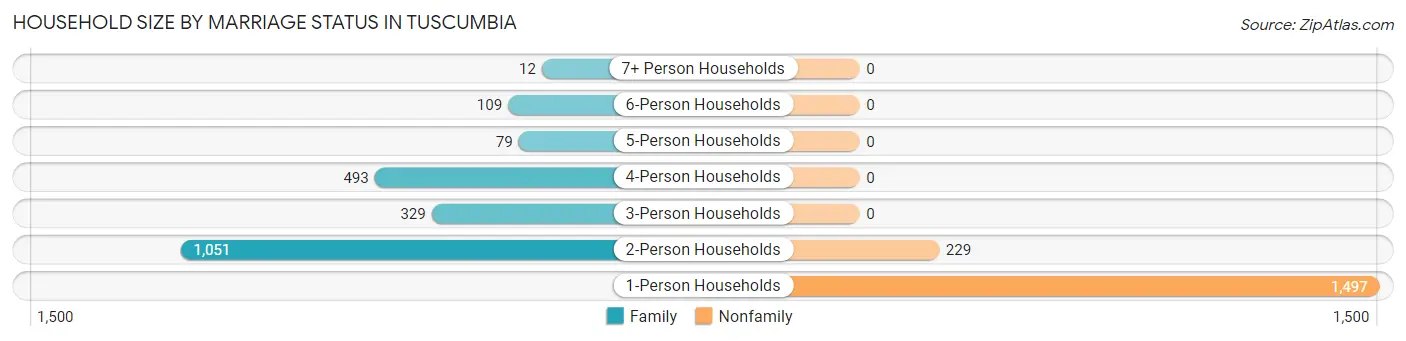
| Household Size | Family Households | Nonfamily Households |
| 1-Person Households | - | 1,497 (39.4%) |
| 2-Person Households | 1,051 (27.7%) | 229 (6.0%) |
| 3-Person Households | 329 (8.7%) | 0 (0.0%) |
| 4-Person Households | 493 (13.0%) | 0 (0.0%) |
| 5-Person Households | 79 (2.1%) | 0 (0.0%) |
| 6-Person Households | 109 (2.9%) | 0 (0.0%) |
| 7+ Person Households | 12 (0.3%) | 0 (0.0%) |
| Total | 2,073 (54.6%) | 1,726 (45.4%) |
Female Fertility in Tuscumbia
Fertility by Age in Tuscumbia
Average fertility rate in Tuscumbia is 35.0 births per 1,000 women. Women in the age bracket of 20 to 34 years have the highest fertility rate with 56.0 births per 1,000 women. Women in the age bracket of 20 to 34 years acount for 100.0% of all women with births.
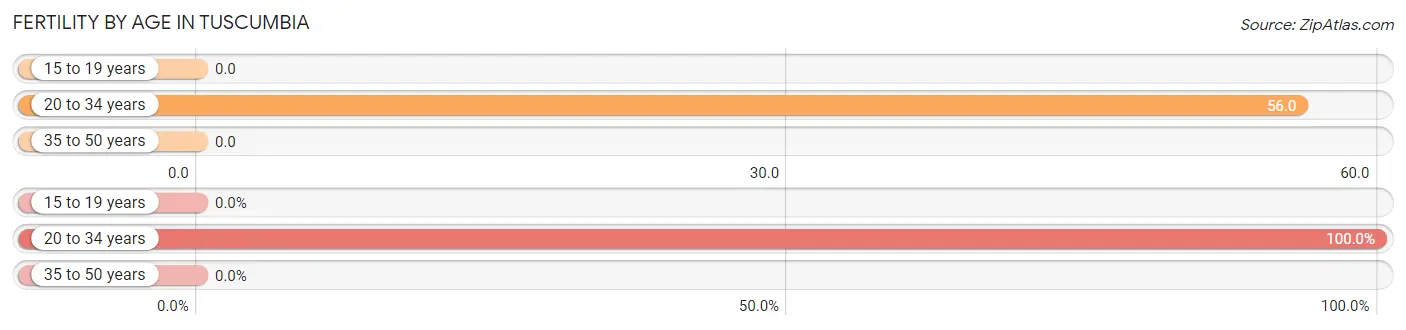
| Age Bracket | Women with Births | Births / 1,000 Women |
| 15 to 19 years | 0 (0.0%) | 0.0 |
| 20 to 34 years | 61 (100.0%) | 56.0 |
| 35 to 50 years | 0 (0.0%) | 0.0 |
| Total | 61 (100.0%) | 35.0 |
Fertility by Age by Marriage Status in Tuscumbia
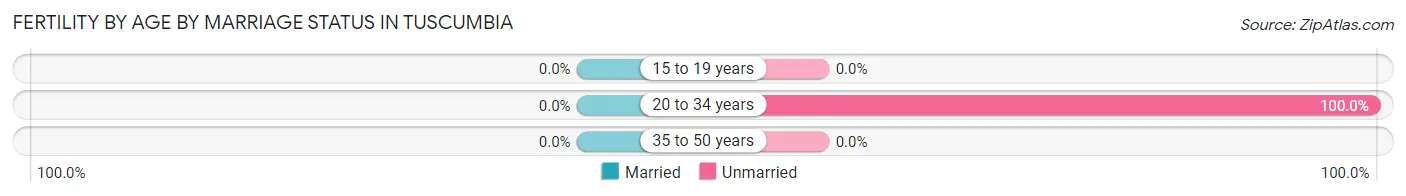
| Age Bracket | Married | Unmarried |
| 15 to 19 years | 0 (0.0%) | 0 (0.0%) |
| 20 to 34 years | 0 (0.0%) | 61 (100.0%) |
| 35 to 50 years | 0 (0.0%) | 0 (0.0%) |
| Total | 0 (0.0%) | 61 (100.0%) |
Fertility by Education in Tuscumbia
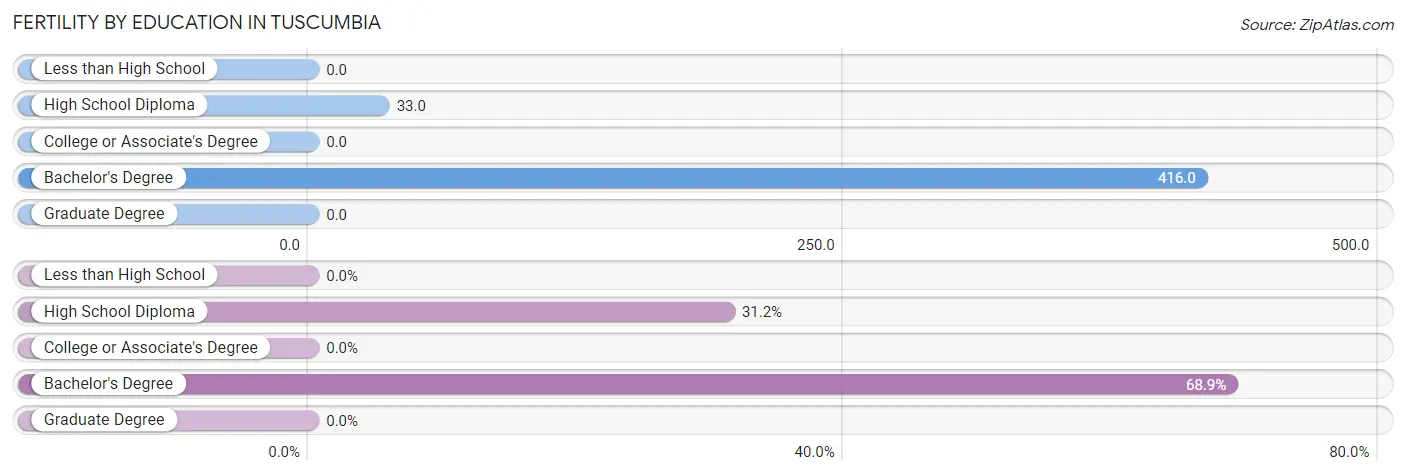
| Educational Attainment | Women with Births | Births / 1,000 Women |
| Less than High School | 0 (0.0%) | 0.0 |
| High School Diploma | 19 (31.1%) | 33.0 |
| College or Associate's Degree | 0 (0.0%) | 0.0 |
| Bachelor's Degree | 42 (68.9%) | 416.0 |
| Graduate Degree | 0 (0.0%) | 0.0 |
| Total | 61 (100.0%) | 35.0 |
Fertility by Education by Marriage Status in Tuscumbia
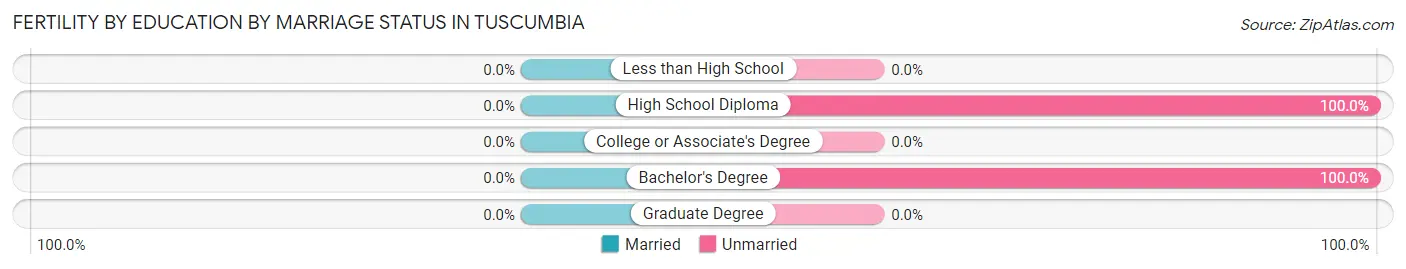
| Educational Attainment | Married | Unmarried |
| Less than High School | 0 (0.0%) | 0 (0.0%) |
| High School Diploma | 0 (0.0%) | 19 (100.0%) |
| College or Associate's Degree | 0 (0.0%) | 0 (0.0%) |
| Bachelor's Degree | 0 (0.0%) | 42 (100.0%) |
| Graduate Degree | 0 (0.0%) | 0 (0.0%) |
| Total | 0 (0.0%) | 61 (100.0%) |
Employment Characteristics in Tuscumbia
Employment by Class of Employer in Tuscumbia
Among the 3,633 employed individuals in Tuscumbia, private company employees (2,424 | 66.7%), local government employees (398 | 11.0%), and not-for-profit organizations (285 | 7.8%) make up the most common classes of employment.
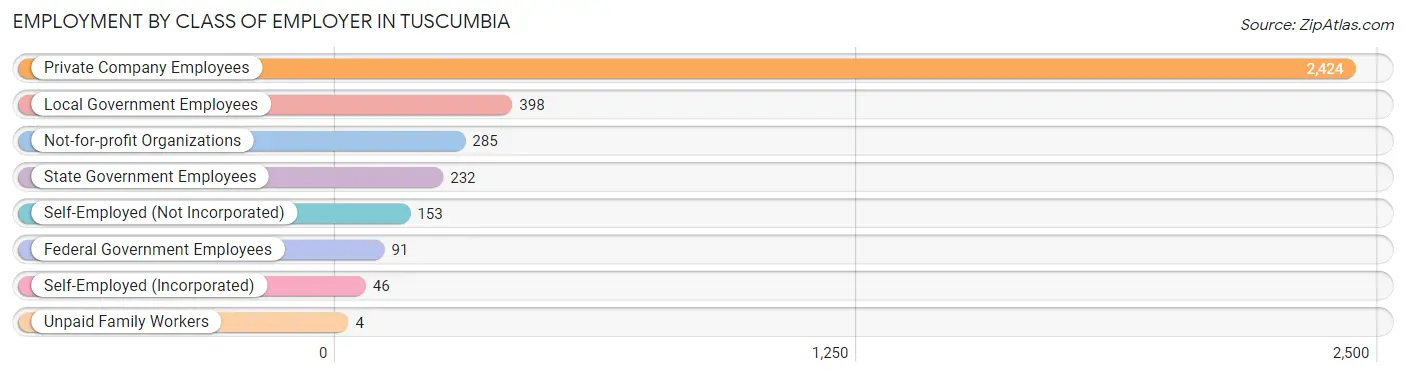
| Employer Class | # Employees | % Employees |
| Private Company Employees | 2,424 | 66.7% |
| Self-Employed (Incorporated) | 46 | 1.3% |
| Self-Employed (Not Incorporated) | 153 | 4.2% |
| Not-for-profit Organizations | 285 | 7.8% |
| Local Government Employees | 398 | 11.0% |
| State Government Employees | 232 | 6.4% |
| Federal Government Employees | 91 | 2.5% |
| Unpaid Family Workers | 4 | 0.1% |
| Total | 3,633 | 100.0% |
Employment Status by Age in Tuscumbia
According to the labor force statistics for Tuscumbia, out of the total population over 16 years of age (6,907), 53.5% or 3,695 individuals are in the labor force, with 1.2% or 44 of them unemployed. The age group with the highest labor force participation rate is 35 to 44 years, with 95.3% or 1,002 individuals in the labor force. Within the labor force, the 20 to 24 years age range has the highest percentage of unemployed individuals, with 7.7% or 33 of them being unemployed.
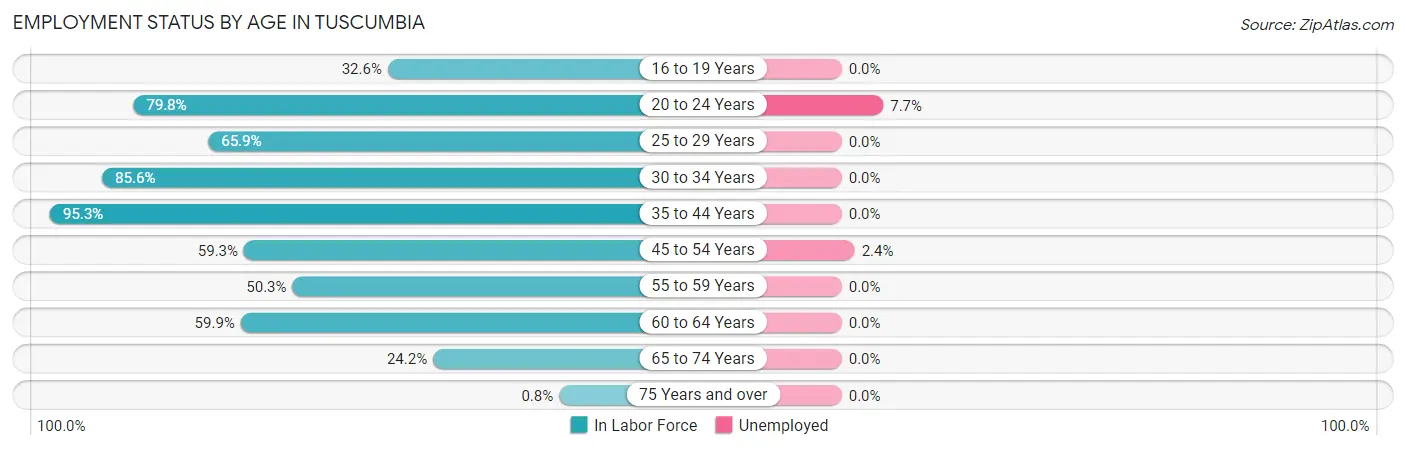
| Age Bracket | In Labor Force | Unemployed |
| 16 to 19 Years | 100 (32.6%) | 0 (0.0%) |
| 20 to 24 Years | 427 (79.8%) | 33 (7.7%) |
| 25 to 29 Years | 425 (65.9%) | 0 (0.0%) |
| 30 to 34 Years | 370 (85.6%) | 0 (0.0%) |
| 35 to 44 Years | 1,002 (95.3%) | 0 (0.0%) |
| 45 to 54 Years | 492 (59.3%) | 12 (2.4%) |
| 55 to 59 Years | 147 (50.3%) | 0 (0.0%) |
| 60 to 64 Years | 452 (59.9%) | 0 (0.0%) |
| 65 to 74 Years | 270 (24.2%) | 0 (0.0%) |
| 75 Years and over | 8 (0.8%) | 0 (0.0%) |
| Total | 3,695 (53.5%) | 44 (1.2%) |
Employment Status by Educational Attainment in Tuscumbia
According to labor force statistics for Tuscumbia, 72.1% of individuals (2,887) out of the total population between 25 and 64 years of age (4,004) are in the labor force, with 0.4% or 12 of them being unemployed. The group with the highest labor force participation rate are those with the educational attainment of bachelor's degree or higher, with 86.7% or 510 individuals in the labor force. Within the labor force, individuals with college / associate degree education have the highest percentage of unemployment, with 1.1% or 12 of them being unemployed.
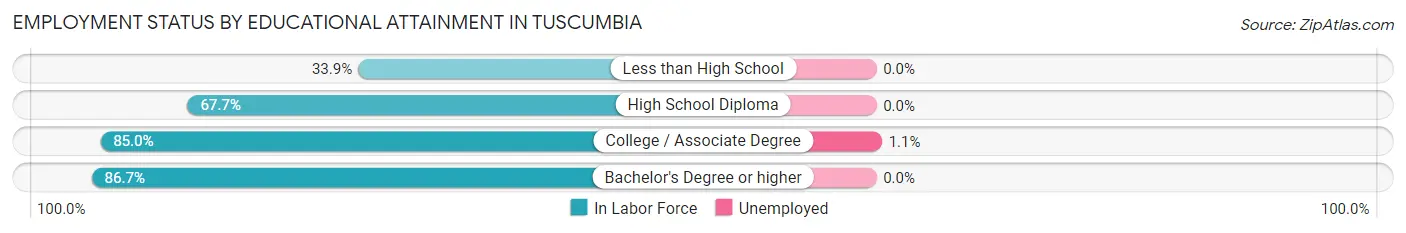
| Educational Attainment | In Labor Force | Unemployed |
| Less than High School | 151 (33.9%) | 0 (0.0%) |
| High School Diploma | 1,166 (67.7%) | 0 (0.0%) |
| College / Associate Degree | 1,061 (85.0%) | 14 (1.1%) |
| Bachelor's Degree or higher | 510 (86.7%) | 0 (0.0%) |
| Total | 2,887 (72.1%) | 16 (0.4%) |
Employment Occupations by Sex in Tuscumbia
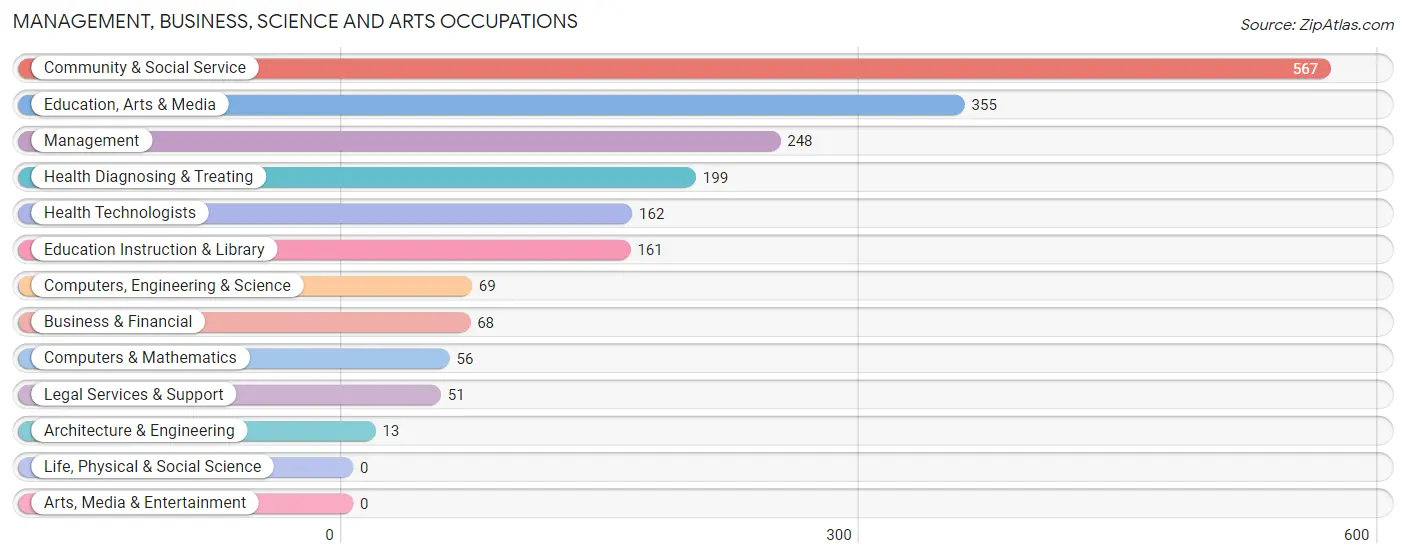
Management, Business, Science and Arts Occupations
The most common Management, Business, Science and Arts occupations in Tuscumbia are Community & Social Service (567 | 15.5%), Education, Arts & Media (355 | 9.7%), Management (248 | 6.8%), Health Diagnosing & Treating (199 | 5.5%), and Health Technologists (162 | 4.4%).
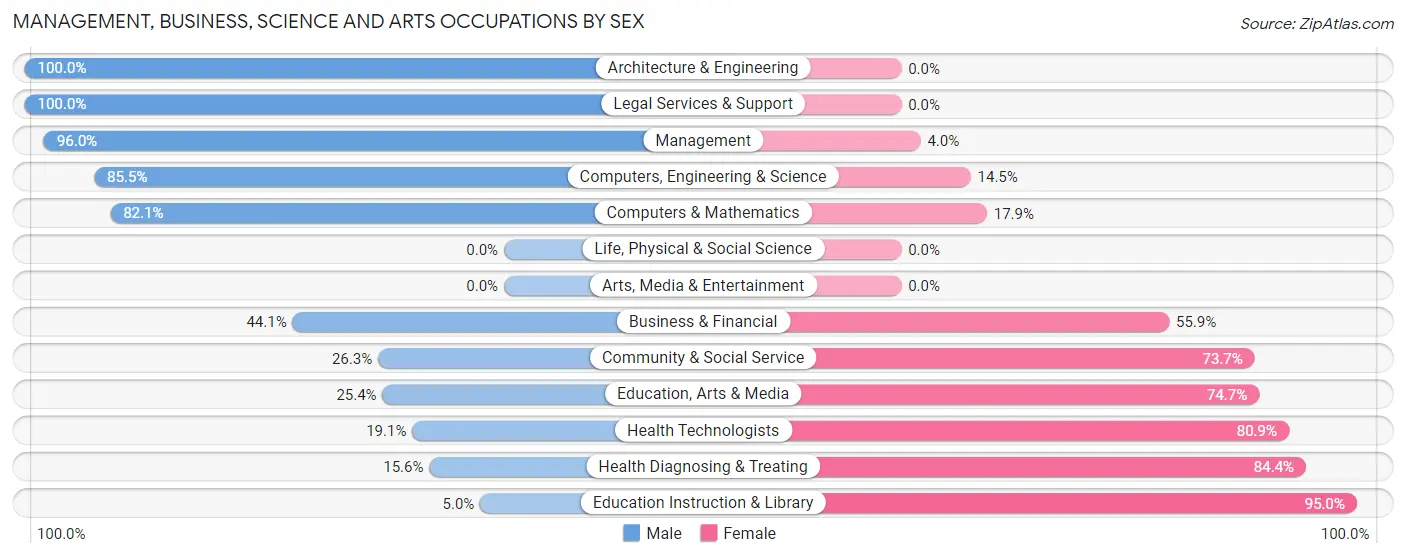
Management, Business, Science and Arts Occupations by Sex
Within the Management, Business, Science and Arts occupations in Tuscumbia, the most male-oriented occupations are Architecture & Engineering (100.0%), Legal Services & Support (100.0%), and Management (96.0%), while the most female-oriented occupations are Education Instruction & Library (95.0%), Health Diagnosing & Treating (84.4%), and Health Technologists (80.9%).
| Occupation | Male | Female |
| Management | 238 (96.0%) | 10 (4.0%) |
| Business & Financial | 30 (44.1%) | 38 (55.9%) |
| Computers, Engineering & Science | 59 (85.5%) | 10 (14.5%) |
| Computers & Mathematics | 46 (82.1%) | 10 (17.9%) |
| Architecture & Engineering | 13 (100.0%) | 0 (0.0%) |
| Life, Physical & Social Science | 0 (0.0%) | 0 (0.0%) |
| Community & Social Service | 149 (26.3%) | 418 (73.7%) |
| Education, Arts & Media | 90 (25.4%) | 265 (74.7%) |
| Legal Services & Support | 51 (100.0%) | 0 (0.0%) |
| Education Instruction & Library | 8 (5.0%) | 153 (95.0%) |
| Arts, Media & Entertainment | 0 (0.0%) | 0 (0.0%) |
| Health Diagnosing & Treating | 31 (15.6%) | 168 (84.4%) |
| Health Technologists | 31 (19.1%) | 131 (80.9%) |
| Total (Category) | 507 (44.1%) | 644 (55.9%) |
| Total (Overall) | 1,891 (51.8%) | 1,757 (48.2%) |
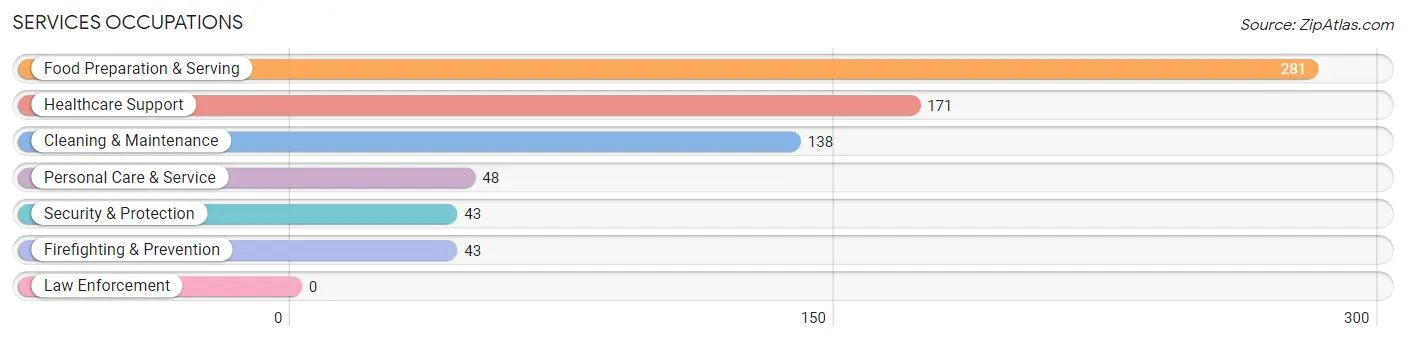
Services Occupations
The most common Services occupations in Tuscumbia are Food Preparation & Serving (281 | 7.7%), Healthcare Support (171 | 4.7%), Cleaning & Maintenance (138 | 3.8%), Personal Care & Service (48 | 1.3%), and Security & Protection (43 | 1.2%).
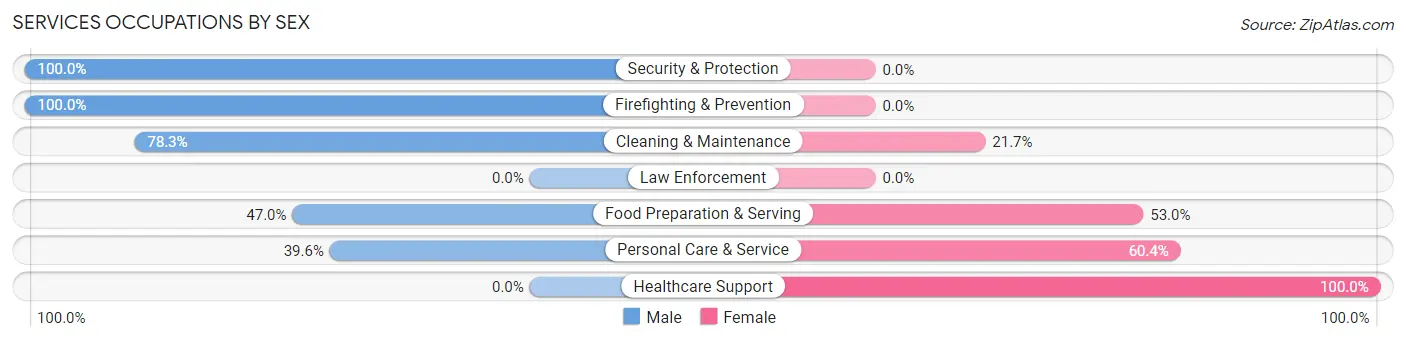
Services Occupations by Sex
Within the Services occupations in Tuscumbia, the most male-oriented occupations are Security & Protection (100.0%), Firefighting & Prevention (100.0%), and Cleaning & Maintenance (78.3%), while the most female-oriented occupations are Healthcare Support (100.0%), Personal Care & Service (60.4%), and Food Preparation & Serving (53.0%).
| Occupation | Male | Female |
| Healthcare Support | 0 (0.0%) | 171 (100.0%) |
| Security & Protection | 43 (100.0%) | 0 (0.0%) |
| Firefighting & Prevention | 43 (100.0%) | 0 (0.0%) |
| Law Enforcement | 0 (0.0%) | 0 (0.0%) |
| Food Preparation & Serving | 132 (47.0%) | 149 (53.0%) |
| Cleaning & Maintenance | 108 (78.3%) | 30 (21.7%) |
| Personal Care & Service | 19 (39.6%) | 29 (60.4%) |
| Total (Category) | 302 (44.4%) | 379 (55.6%) |
| Total (Overall) | 1,891 (51.8%) | 1,757 (48.2%) |
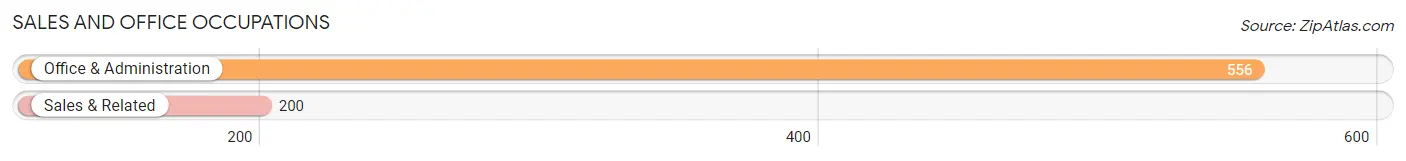
Sales and Office Occupations
The most common Sales and Office occupations in Tuscumbia are Office & Administration (556 | 15.2%), and Sales & Related (200 | 5.5%).
Sales and Office Occupations by Sex
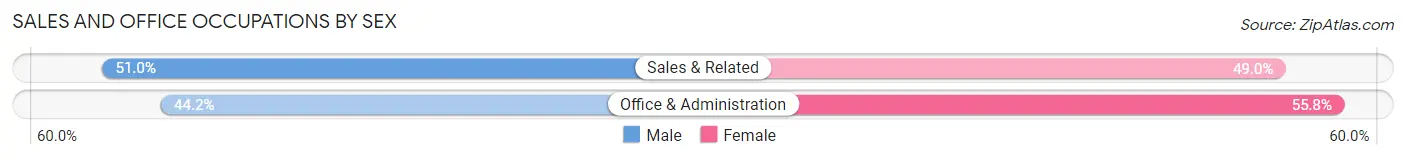
| Occupation | Male | Female |
| Sales & Related | 102 (51.0%) | 98 (49.0%) |
| Office & Administration | 246 (44.2%) | 310 (55.8%) |
| Total (Category) | 348 (46.0%) | 408 (54.0%) |
| Total (Overall) | 1,891 (51.8%) | 1,757 (48.2%) |
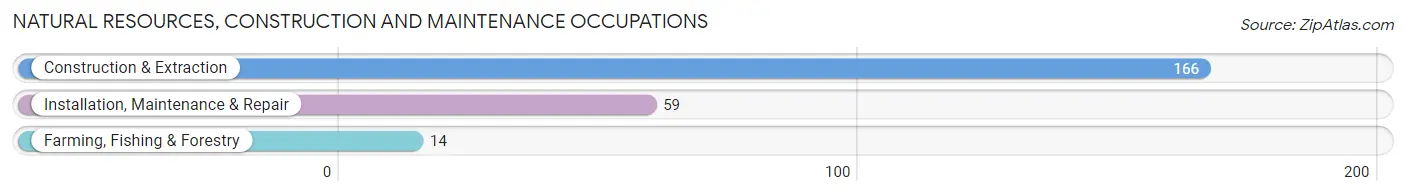
Natural Resources, Construction and Maintenance Occupations
The most common Natural Resources, Construction and Maintenance occupations in Tuscumbia are Construction & Extraction (166 | 4.5%), Installation, Maintenance & Repair (59 | 1.6%), and Farming, Fishing & Forestry (14 | 0.4%).
Natural Resources, Construction and Maintenance Occupations by Sex
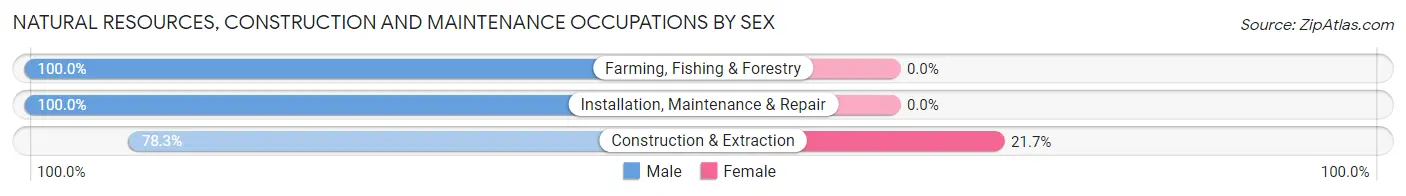
| Occupation | Male | Female |
| Farming, Fishing & Forestry | 14 (100.0%) | 0 (0.0%) |
| Construction & Extraction | 130 (78.3%) | 36 (21.7%) |
| Installation, Maintenance & Repair | 59 (100.0%) | 0 (0.0%) |
| Total (Category) | 203 (84.9%) | 36 (15.1%) |
| Total (Overall) | 1,891 (51.8%) | 1,757 (48.2%) |
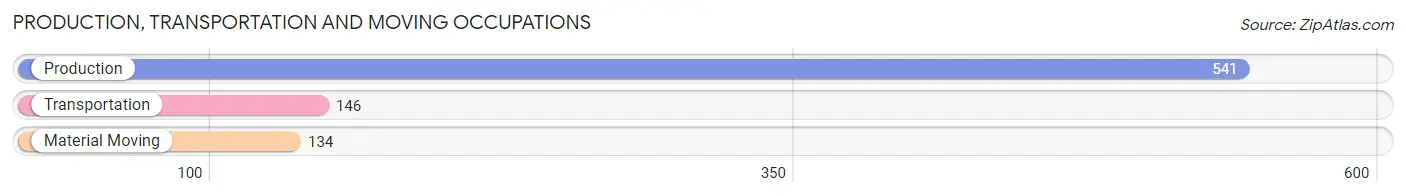
Production, Transportation and Moving Occupations
The most common Production, Transportation and Moving occupations in Tuscumbia are Production (541 | 14.8%), Transportation (146 | 4.0%), and Material Moving (134 | 3.7%).
Production, Transportation and Moving Occupations by Sex
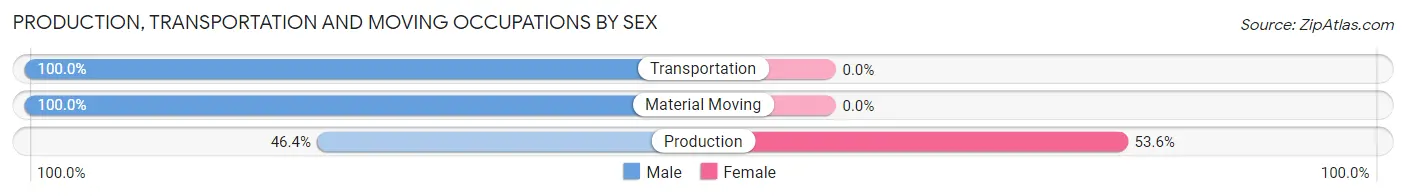
| Occupation | Male | Female |
| Production | 251 (46.4%) | 290 (53.6%) |
| Transportation | 146 (100.0%) | 0 (0.0%) |
| Material Moving | 134 (100.0%) | 0 (0.0%) |
| Total (Category) | 531 (64.7%) | 290 (35.3%) |
| Total (Overall) | 1,891 (51.8%) | 1,757 (48.2%) |
Employment Industries by Sex in Tuscumbia
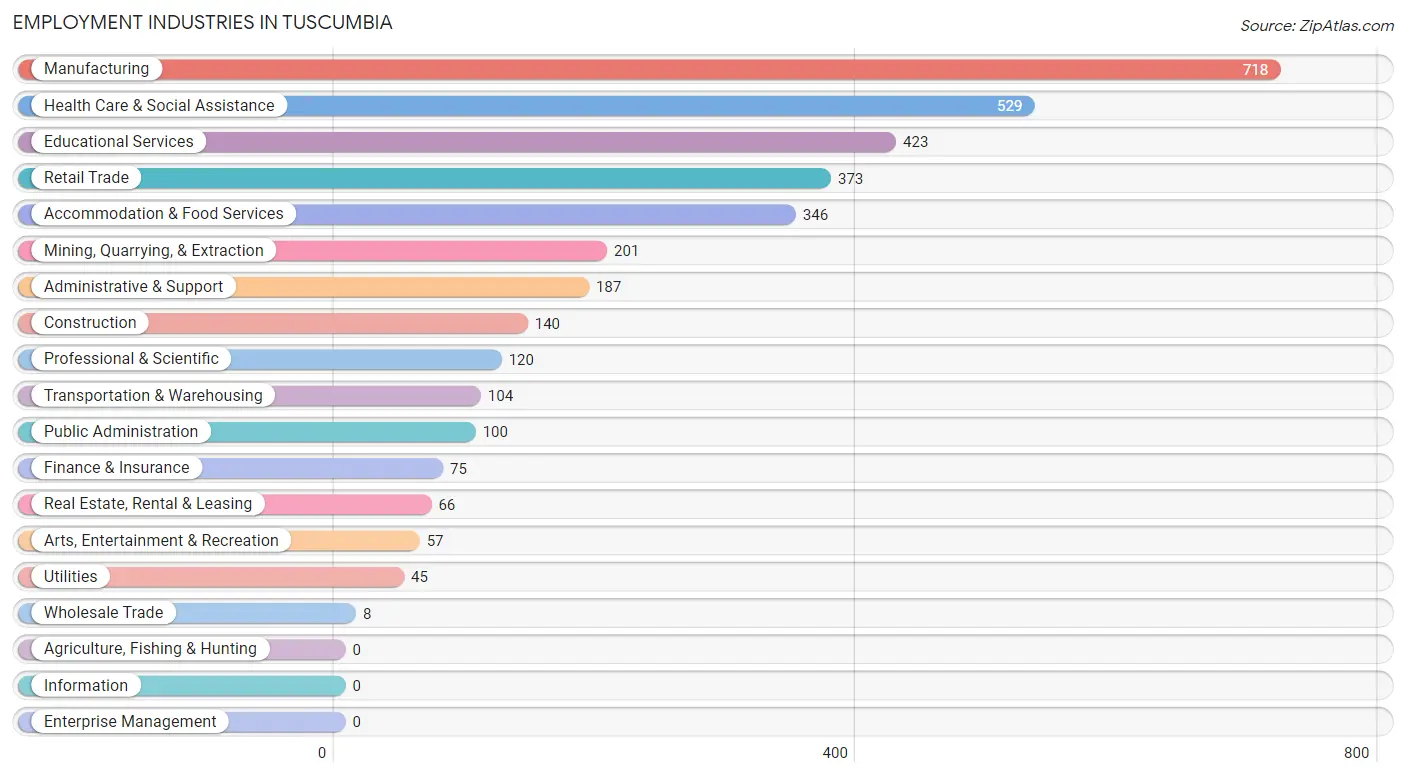
Employment Industries in Tuscumbia
The major employment industries in Tuscumbia include Manufacturing (718 | 19.7%), Health Care & Social Assistance (529 | 14.5%), Educational Services (423 | 11.6%), Retail Trade (373 | 10.2%), and Accommodation & Food Services (346 | 9.5%).
Employment Industries by Sex in Tuscumbia
The Tuscumbia industries that see more men than women are Mining, Quarrying, & Extraction (100.0%), Wholesale Trade (100.0%), and Transportation & Warehousing (100.0%), whereas the industries that tend to have a higher number of women are Educational Services (98.1%), Health Care & Social Assistance (86.0%), and Finance & Insurance (70.7%).
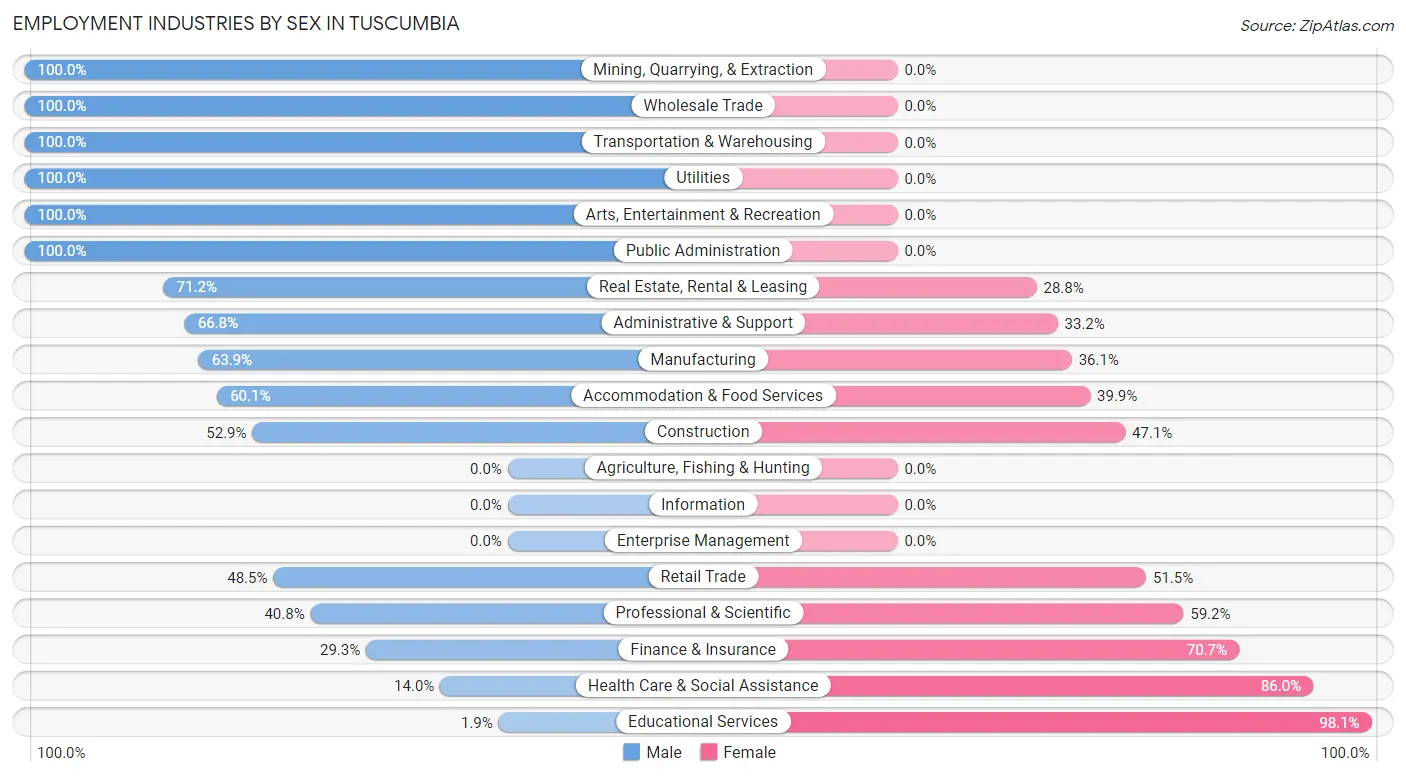
| Industry | Male | Female |
| Agriculture, Fishing & Hunting | 0 (0.0%) | 0 (0.0%) |
| Mining, Quarrying, & Extraction | 201 (100.0%) | 0 (0.0%) |
| Construction | 74 (52.9%) | 66 (47.1%) |
| Manufacturing | 459 (63.9%) | 259 (36.1%) |
| Wholesale Trade | 8 (100.0%) | 0 (0.0%) |
| Retail Trade | 181 (48.5%) | 192 (51.5%) |
| Transportation & Warehousing | 104 (100.0%) | 0 (0.0%) |
| Utilities | 45 (100.0%) | 0 (0.0%) |
| Information | 0 (0.0%) | 0 (0.0%) |
| Finance & Insurance | 22 (29.3%) | 53 (70.7%) |
| Real Estate, Rental & Leasing | 47 (71.2%) | 19 (28.8%) |
| Professional & Scientific | 49 (40.8%) | 71 (59.2%) |
| Enterprise Management | 0 (0.0%) | 0 (0.0%) |
| Administrative & Support | 125 (66.8%) | 62 (33.2%) |
| Educational Services | 8 (1.9%) | 415 (98.1%) |
| Health Care & Social Assistance | 74 (14.0%) | 455 (86.0%) |
| Arts, Entertainment & Recreation | 57 (100.0%) | 0 (0.0%) |
| Accommodation & Food Services | 208 (60.1%) | 138 (39.9%) |
| Public Administration | 100 (100.0%) | 0 (0.0%) |
| Total | 1,891 (51.8%) | 1,757 (48.2%) |
Education in Tuscumbia
School Enrollment in Tuscumbia
The most common levels of schooling among the 2,072 students in Tuscumbia are elementary school (676 | 32.6%), middle school (671 | 32.4%), and college / undergraduate (301 | 14.5%).
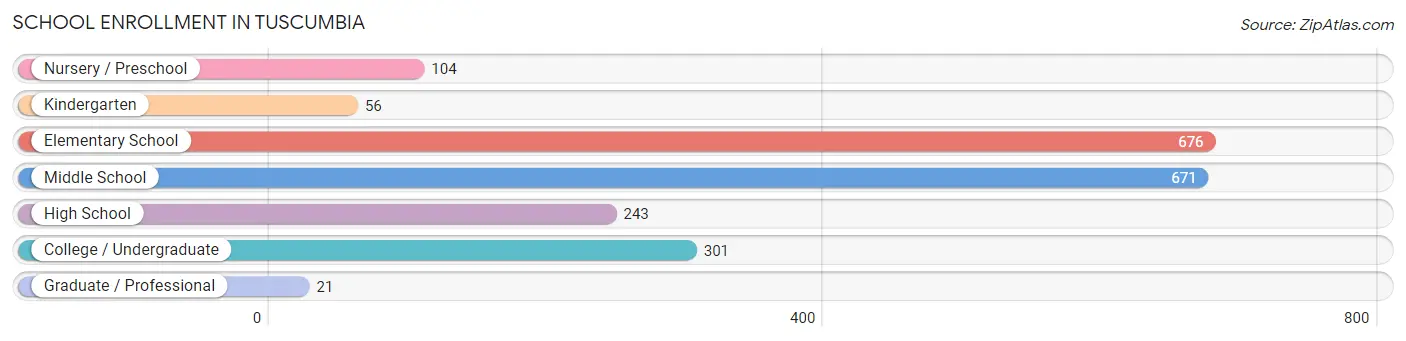
| School Level | # Students | % Students |
| Nursery / Preschool | 104 | 5.0% |
| Kindergarten | 56 | 2.7% |
| Elementary School | 676 | 32.6% |
| Middle School | 671 | 32.4% |
| High School | 243 | 11.7% |
| College / Undergraduate | 301 | 14.5% |
| Graduate / Professional | 21 | 1.0% |
| Total | 2,072 | 100.0% |
School Enrollment by Age by Funding Source in Tuscumbia
Out of a total of 2,072 students who are enrolled in schools in Tuscumbia, 276 (13.3%) attend a private institution, while the remaining 1,796 (86.7%) are enrolled in public schools. The age group of 3 to 4 year olds has the highest likelihood of being enrolled in private schools, with 57 (54.8% in the age bracket) enrolled. Conversely, the age group of 18 to 19 year olds has the lowest likelihood of being enrolled in a private school, with 119 (100.0% in the age bracket) attending a public institution.
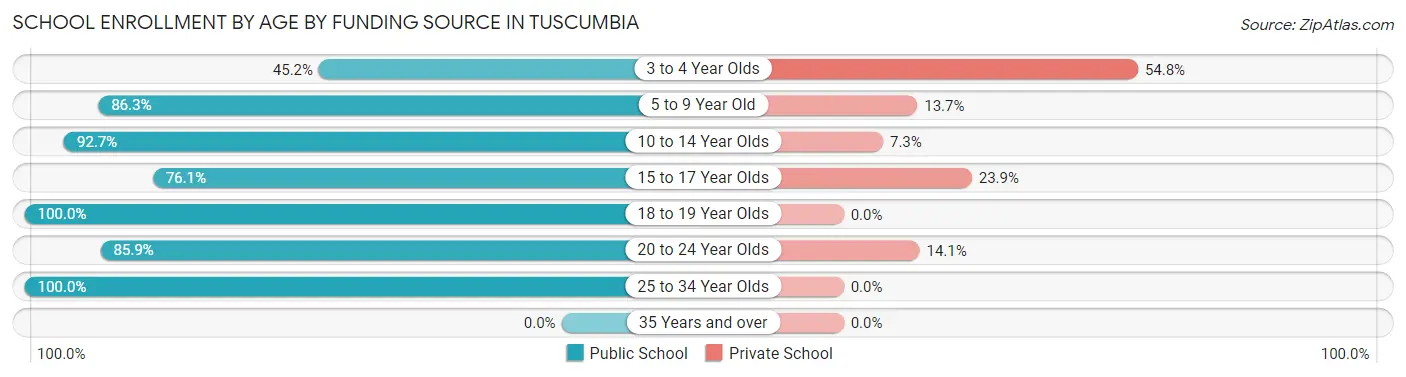
| Age Bracket | Public School | Private School |
| 3 to 4 Year Olds | 47 (45.2%) | 57 (54.8%) |
| 5 to 9 Year Old | 610 (86.3%) | 97 (13.7%) |
| 10 to 14 Year Olds | 645 (92.7%) | 51 (7.3%) |
| 15 to 17 Year Olds | 185 (76.1%) | 58 (23.9%) |
| 18 to 19 Year Olds | 119 (100.0%) | 0 (0.0%) |
| 20 to 24 Year Olds | 79 (85.9%) | 13 (14.1%) |
| 25 to 34 Year Olds | 111 (100.0%) | 0 (0.0%) |
| 35 Years and over | 0 (0.0%) | 0 (0.0%) |
| Total | 1,796 (86.7%) | 276 (13.3%) |
Educational Attainment by Field of Study in Tuscumbia
Business (285 | 26.2%), education (226 | 20.7%), science & technology (140 | 12.8%), bio, nature & agricultural (112 | 10.3%), and liberal arts & history (98 | 9.0%) are the most common fields of study among 1,090 individuals in Tuscumbia who have obtained a bachelor's degree or higher.
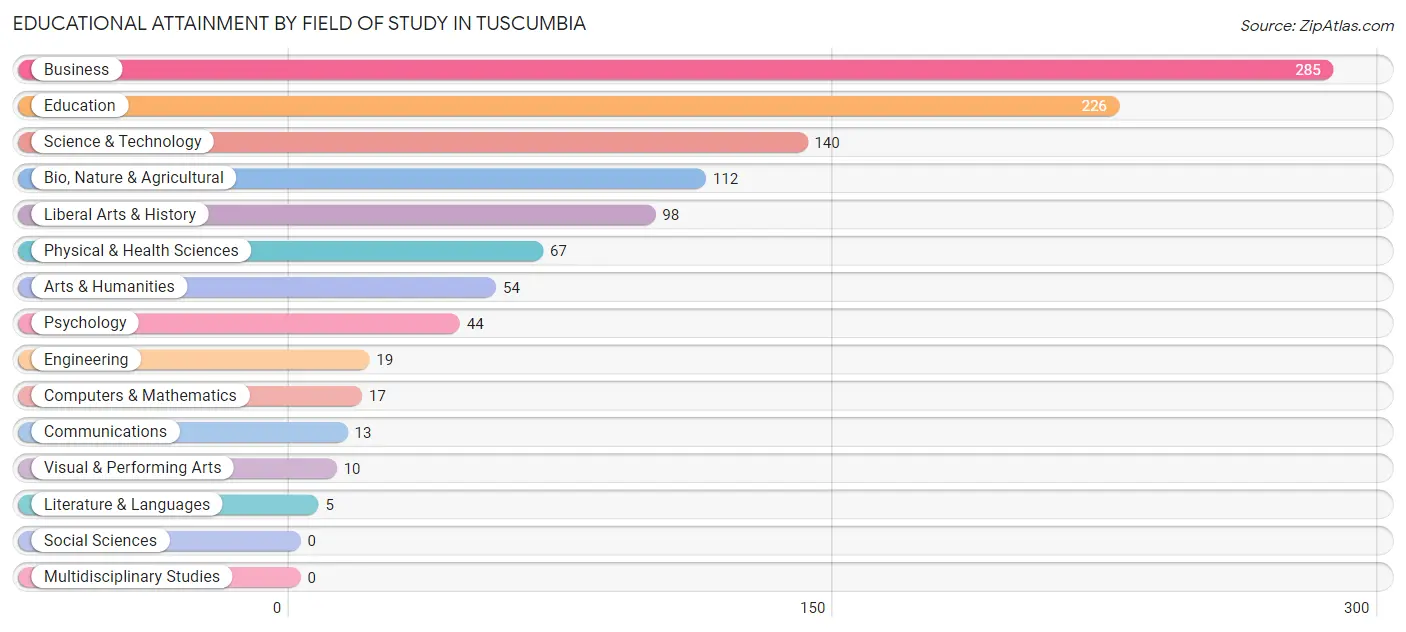
| Field of Study | # Graduates | % Graduates |
| Computers & Mathematics | 17 | 1.6% |
| Bio, Nature & Agricultural | 112 | 10.3% |
| Physical & Health Sciences | 67 | 6.1% |
| Psychology | 44 | 4.0% |
| Social Sciences | 0 | 0.0% |
| Engineering | 19 | 1.7% |
| Multidisciplinary Studies | 0 | 0.0% |
| Science & Technology | 140 | 12.8% |
| Business | 285 | 26.2% |
| Education | 226 | 20.7% |
| Literature & Languages | 5 | 0.5% |
| Liberal Arts & History | 98 | 9.0% |
| Visual & Performing Arts | 10 | 0.9% |
| Communications | 13 | 1.2% |
| Arts & Humanities | 54 | 5.0% |
| Total | 1,090 | 100.0% |
Transportation & Commute in Tuscumbia
Vehicle Availability by Sex in Tuscumbia
The most prevalent vehicle ownership categories in Tuscumbia are males with 2 vehicles (671, accounting for 35.8%) and females with 2 vehicles (675, making up 38.2%).
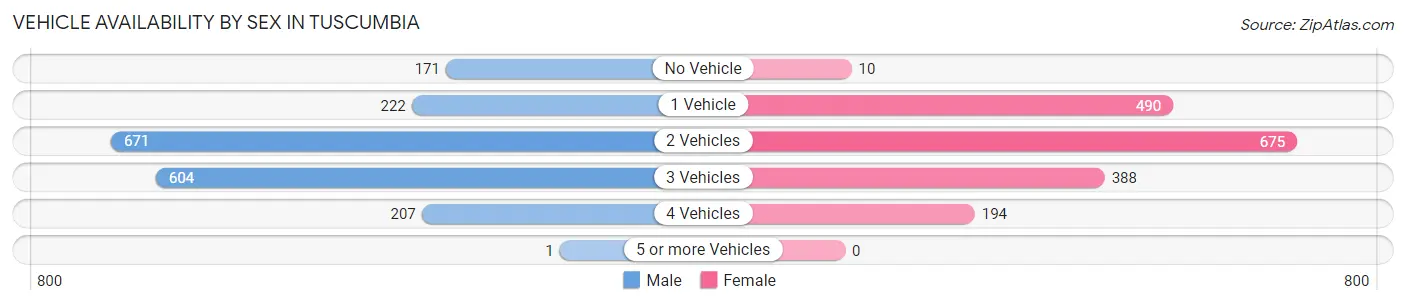
| Vehicles Available | Male | Female |
| No Vehicle | 171 (9.1%) | 10 (0.6%) |
| 1 Vehicle | 222 (11.8%) | 490 (27.9%) |
| 2 Vehicles | 671 (35.8%) | 675 (38.4%) |
| 3 Vehicles | 604 (32.2%) | 388 (22.1%) |
| 4 Vehicles | 207 (11.0%) | 194 (11.0%) |
| 5 or more Vehicles | 1 (0.1%) | 0 (0.0%) |
| Total | 1,876 (100.0%) | 1,757 (100.0%) |
Commute Time in Tuscumbia
The most frequently occuring commute durations in Tuscumbia are 20 to 24 minutes (822 commuters, 22.9%), 15 to 19 minutes (646 commuters, 18.0%), and 5 to 9 minutes (610 commuters, 17.0%).
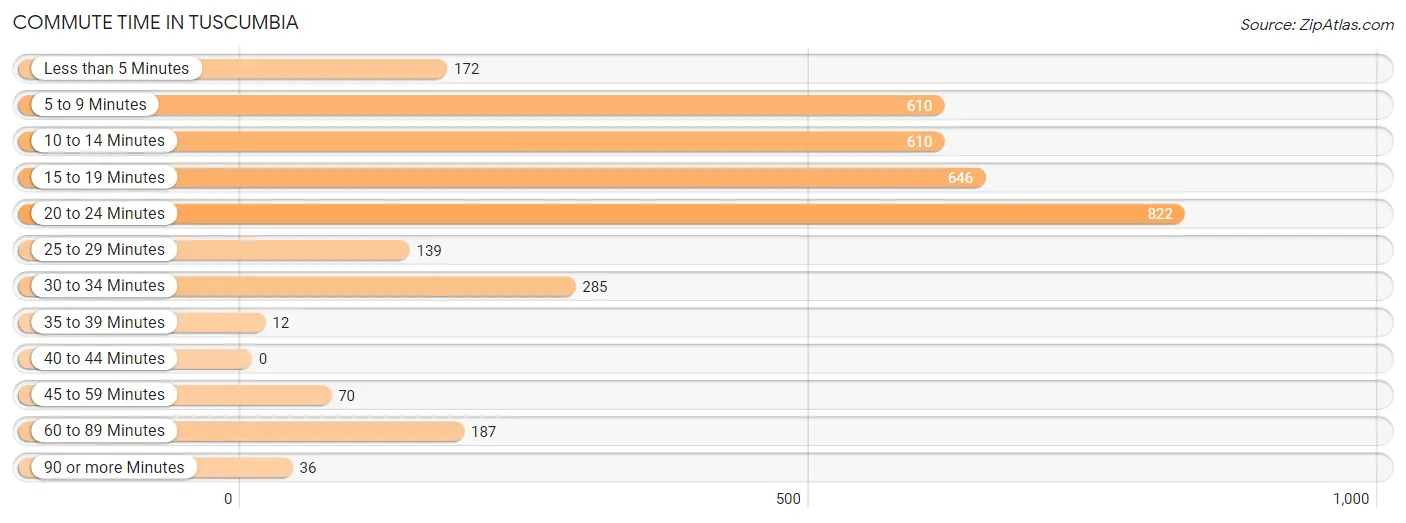
| Commute Time | # Commuters | % Commuters |
| Less than 5 Minutes | 172 | 4.8% |
| 5 to 9 Minutes | 610 | 17.0% |
| 10 to 14 Minutes | 610 | 17.0% |
| 15 to 19 Minutes | 646 | 18.0% |
| 20 to 24 Minutes | 822 | 22.9% |
| 25 to 29 Minutes | 139 | 3.9% |
| 30 to 34 Minutes | 285 | 7.9% |
| 35 to 39 Minutes | 12 | 0.3% |
| 40 to 44 Minutes | 0 | 0.0% |
| 45 to 59 Minutes | 70 | 1.9% |
| 60 to 89 Minutes | 187 | 5.2% |
| 90 or more Minutes | 36 | 1.0% |
Commute Time by Sex in Tuscumbia
The most common commute times in Tuscumbia are 20 to 24 minutes (565 commuters, 30.6%) for males and 5 to 9 minutes (396 commuters, 22.8%) for females.
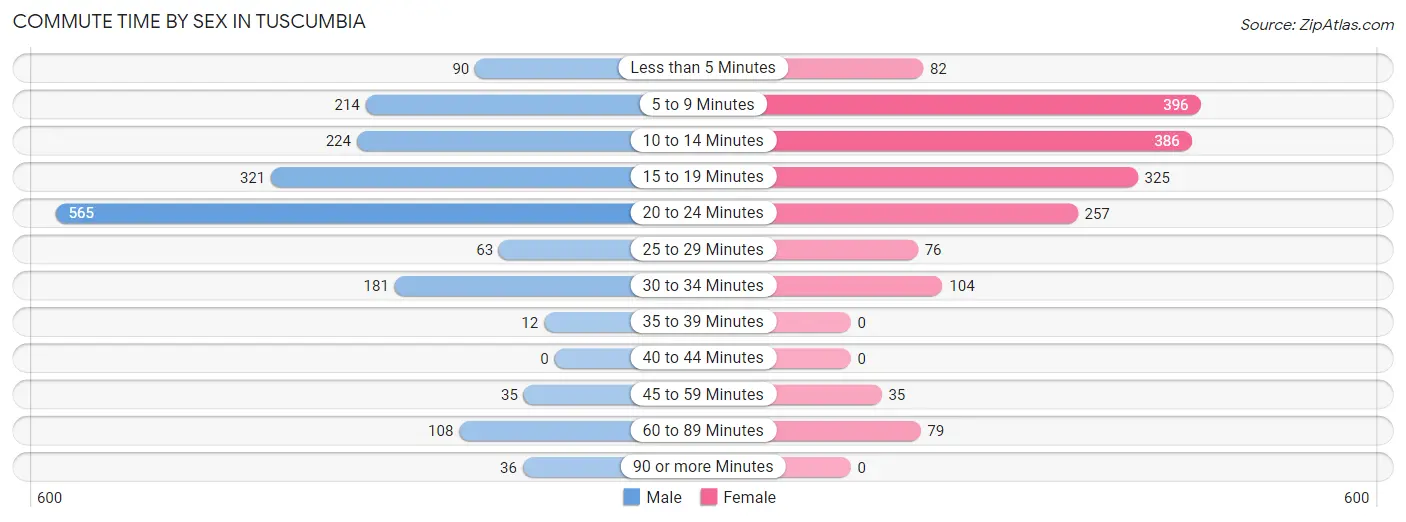
| Commute Time | Male | Female |
| Less than 5 Minutes | 90 (4.9%) | 82 (4.7%) |
| 5 to 9 Minutes | 214 (11.6%) | 396 (22.8%) |
| 10 to 14 Minutes | 224 (12.1%) | 386 (22.2%) |
| 15 to 19 Minutes | 321 (17.4%) | 325 (18.7%) |
| 20 to 24 Minutes | 565 (30.6%) | 257 (14.8%) |
| 25 to 29 Minutes | 63 (3.4%) | 76 (4.4%) |
| 30 to 34 Minutes | 181 (9.8%) | 104 (6.0%) |
| 35 to 39 Minutes | 12 (0.6%) | 0 (0.0%) |
| 40 to 44 Minutes | 0 (0.0%) | 0 (0.0%) |
| 45 to 59 Minutes | 35 (1.9%) | 35 (2.0%) |
| 60 to 89 Minutes | 108 (5.8%) | 79 (4.5%) |
| 90 or more Minutes | 36 (1.9%) | 0 (0.0%) |
Time of Departure to Work by Sex in Tuscumbia
The most frequent times of departure to work in Tuscumbia are 7:00 AM to 7:29 AM (355, 19.2%) for males and 7:30 AM to 7:59 AM (473, 27.2%) for females.
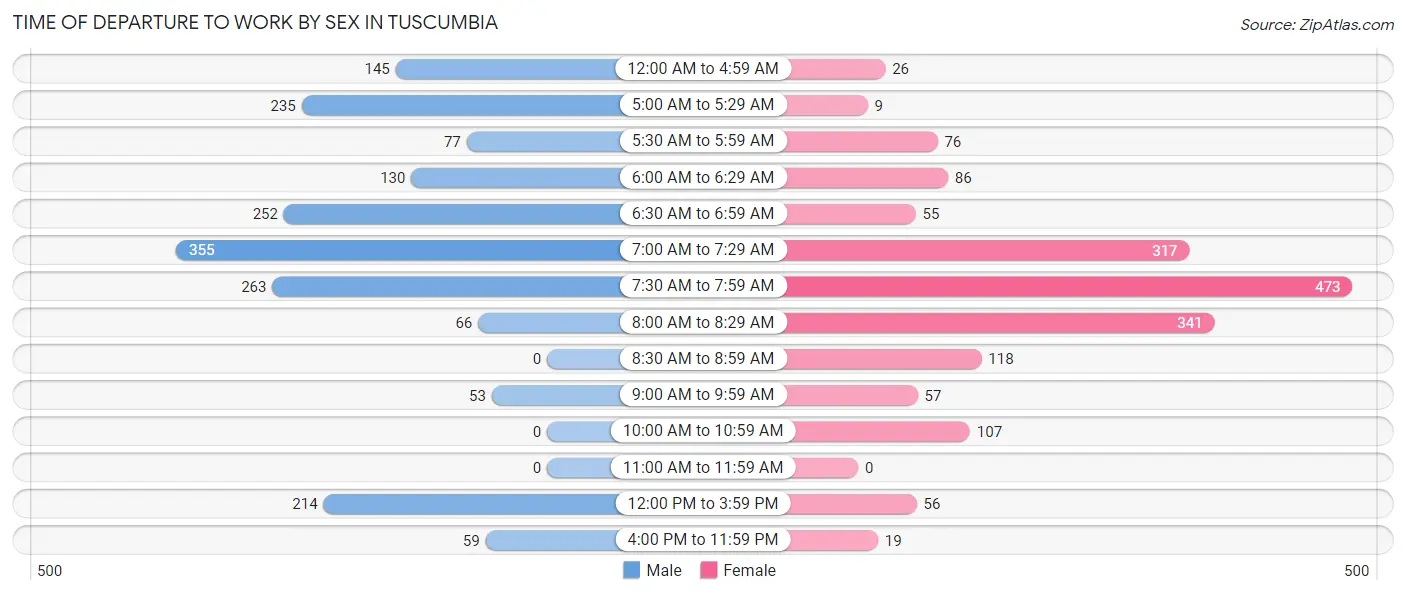
| Time of Departure | Male | Female |
| 12:00 AM to 4:59 AM | 145 (7.8%) | 26 (1.5%) |
| 5:00 AM to 5:29 AM | 235 (12.7%) | 9 (0.5%) |
| 5:30 AM to 5:59 AM | 77 (4.2%) | 76 (4.4%) |
| 6:00 AM to 6:29 AM | 130 (7.0%) | 86 (4.9%) |
| 6:30 AM to 6:59 AM | 252 (13.6%) | 55 (3.2%) |
| 7:00 AM to 7:29 AM | 355 (19.2%) | 317 (18.2%) |
| 7:30 AM to 7:59 AM | 263 (14.2%) | 473 (27.2%) |
| 8:00 AM to 8:29 AM | 66 (3.6%) | 341 (19.6%) |
| 8:30 AM to 8:59 AM | 0 (0.0%) | 118 (6.8%) |
| 9:00 AM to 9:59 AM | 53 (2.9%) | 57 (3.3%) |
| 10:00 AM to 10:59 AM | 0 (0.0%) | 107 (6.1%) |
| 11:00 AM to 11:59 AM | 0 (0.0%) | 0 (0.0%) |
| 12:00 PM to 3:59 PM | 214 (11.6%) | 56 (3.2%) |
| 4:00 PM to 11:59 PM | 59 (3.2%) | 19 (1.1%) |
| Total | 1,849 (100.0%) | 1,740 (100.0%) |
Housing Occupancy in Tuscumbia
Occupancy by Ownership in Tuscumbia
Of the total 3,799 dwellings in Tuscumbia, owner-occupied units account for 2,156 (56.8%), while renter-occupied units make up 1,643 (43.2%).
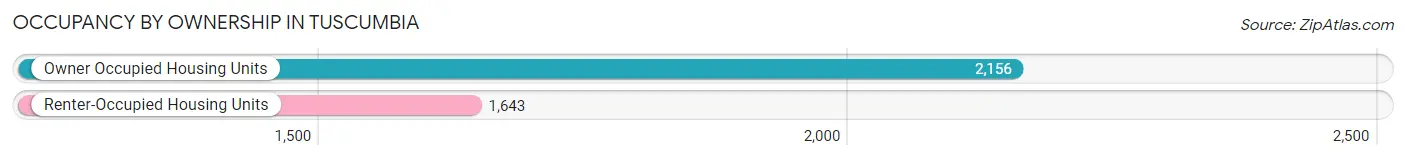
| Occupancy | # Housing Units | % Housing Units |
| Owner Occupied Housing Units | 2,156 | 56.8% |
| Renter-Occupied Housing Units | 1,643 | 43.2% |
| Total Occupied Housing Units | 3,799 | 100.0% |
Occupancy by Household Size in Tuscumbia
| Household Size | # Housing Units | % Housing Units |
| 1-Person Household | 1,497 | 39.4% |
| 2-Person Household | 1,280 | 33.7% |
| 3-Person Household | 329 | 8.7% |
| 4+ Person Household | 693 | 18.2% |
| Total Housing Units | 3,799 | 100.0% |
Occupancy by Ownership by Household Size in Tuscumbia
| Household Size | Owner-occupied | Renter-occupied |
| 1-Person Household | 626 (41.8%) | 871 (58.2%) |
| 2-Person Household | 877 (68.5%) | 403 (31.5%) |
| 3-Person Household | 139 (42.2%) | 190 (57.8%) |
| 4+ Person Household | 514 (74.2%) | 179 (25.8%) |
| Total Housing Units | 2,156 (56.8%) | 1,643 (43.2%) |
Occupancy by Educational Attainment in Tuscumbia
| Household Size | Owner-occupied | Renter-occupied |
| Less than High School | 168 (32.4%) | 350 (67.6%) |
| High School Diploma | 896 (57.7%) | 658 (42.3%) |
| College/Associate Degree | 644 (58.4%) | 458 (41.6%) |
| Bachelor's Degree or higher | 448 (71.7%) | 177 (28.3%) |
Occupancy by Age of Householder in Tuscumbia
| Age Bracket | # Households | % Households |
| Under 35 Years | 606 | 16.0% |
| 35 to 44 Years | 689 | 18.1% |
| 45 to 54 Years | 588 | 15.5% |
| 55 to 64 Years | 664 | 17.5% |
| 65 to 74 Years | 694 | 18.3% |
| 75 to 84 Years | 437 | 11.5% |
| 85 Years and Over | 121 | 3.2% |
| Total | 3,799 | 100.0% |
Housing Finances in Tuscumbia
Median Income by Occupancy in Tuscumbia
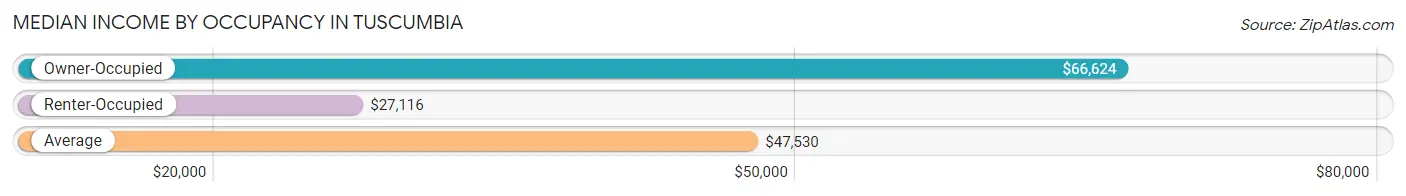
| Occupancy Type | # Households | Median Income |
| Owner-Occupied | 2,156 (56.8%) | $66,624 |
| Renter-Occupied | 1,643 (43.2%) | $27,116 |
| Average | 3,799 (100.0%) | $47,530 |
Occupancy by Householder Income Bracket in Tuscumbia
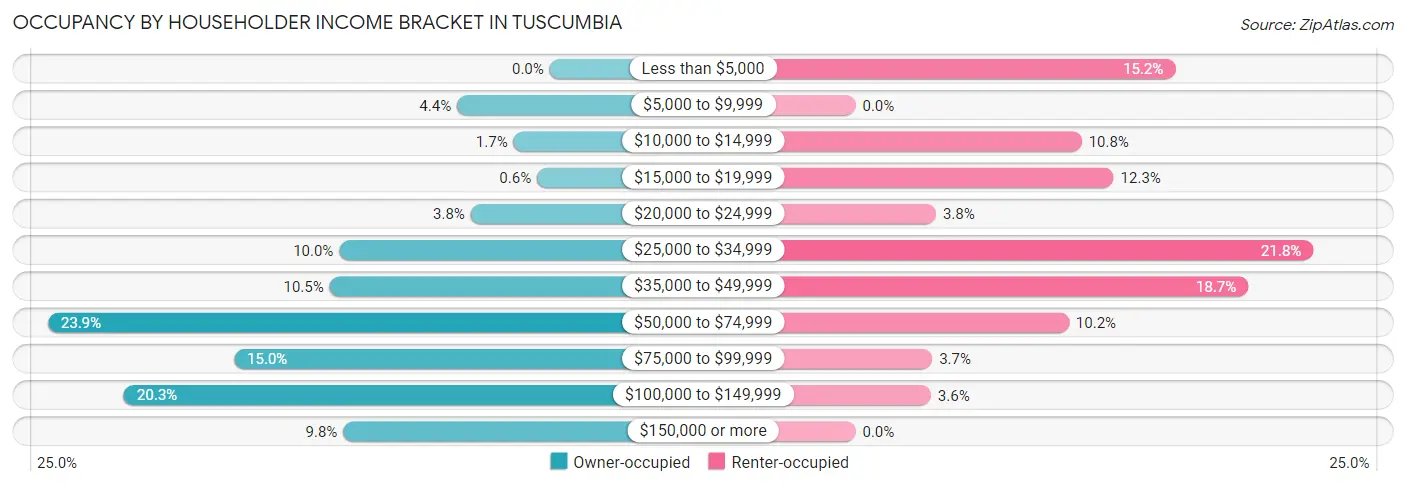
| Income Bracket | Owner-occupied | Renter-occupied |
| Less than $5,000 | 0 (0.0%) | 250 (15.2%) |
| $5,000 to $9,999 | 95 (4.4%) | 0 (0.0%) |
| $10,000 to $14,999 | 37 (1.7%) | 177 (10.8%) |
| $15,000 to $19,999 | 13 (0.6%) | 202 (12.3%) |
| $20,000 to $24,999 | 81 (3.8%) | 63 (3.8%) |
| $25,000 to $34,999 | 216 (10.0%) | 358 (21.8%) |
| $35,000 to $49,999 | 226 (10.5%) | 307 (18.7%) |
| $50,000 to $74,999 | 515 (23.9%) | 167 (10.2%) |
| $75,000 to $99,999 | 324 (15.0%) | 60 (3.6%) |
| $100,000 to $149,999 | 437 (20.3%) | 59 (3.6%) |
| $150,000 or more | 212 (9.8%) | 0 (0.0%) |
| Total | 2,156 (100.0%) | 1,643 (100.0%) |
Monthly Housing Cost Tiers in Tuscumbia
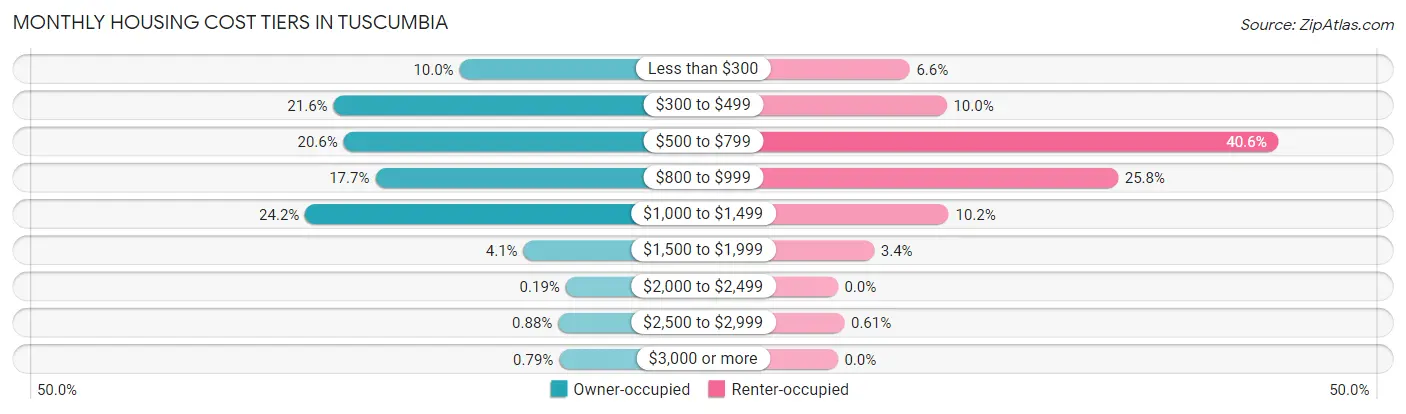
| Monthly Cost | Owner-occupied | Renter-occupied |
| Less than $300 | 215 (10.0%) | 109 (6.6%) |
| $300 to $499 | 465 (21.6%) | 165 (10.0%) |
| $500 to $799 | 445 (20.6%) | 667 (40.6%) |
| $800 to $999 | 382 (17.7%) | 424 (25.8%) |
| $1,000 to $1,499 | 521 (24.2%) | 168 (10.2%) |
| $1,500 to $1,999 | 88 (4.1%) | 55 (3.4%) |
| $2,000 to $2,499 | 4 (0.2%) | 0 (0.0%) |
| $2,500 to $2,999 | 19 (0.9%) | 10 (0.6%) |
| $3,000 or more | 17 (0.8%) | 0 (0.0%) |
| Total | 2,156 (100.0%) | 1,643 (100.0%) |
Physical Housing Characteristics in Tuscumbia
Housing Structures in Tuscumbia
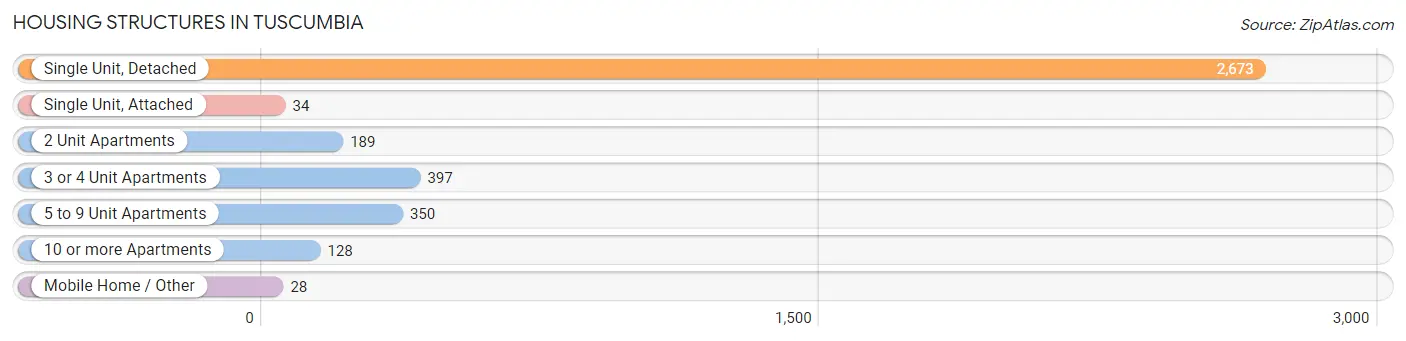
| Structure Type | # Housing Units | % Housing Units |
| Single Unit, Detached | 2,673 | 70.4% |
| Single Unit, Attached | 34 | 0.9% |
| 2 Unit Apartments | 189 | 5.0% |
| 3 or 4 Unit Apartments | 397 | 10.4% |
| 5 to 9 Unit Apartments | 350 | 9.2% |
| 10 or more Apartments | 128 | 3.4% |
| Mobile Home / Other | 28 | 0.7% |
| Total | 3,799 | 100.0% |
Housing Structures by Occupancy in Tuscumbia
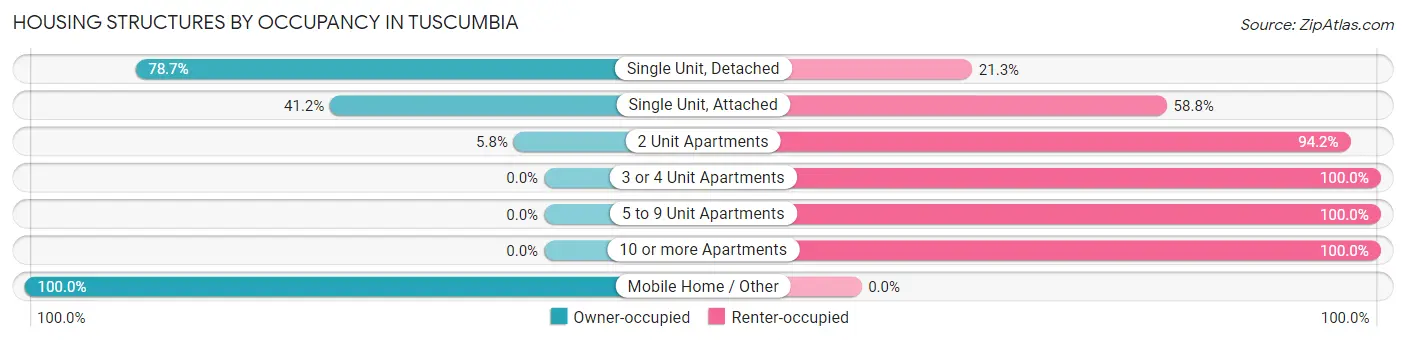
| Structure Type | Owner-occupied | Renter-occupied |
| Single Unit, Detached | 2,103 (78.7%) | 570 (21.3%) |
| Single Unit, Attached | 14 (41.2%) | 20 (58.8%) |
| 2 Unit Apartments | 11 (5.8%) | 178 (94.2%) |
| 3 or 4 Unit Apartments | 0 (0.0%) | 397 (100.0%) |
| 5 to 9 Unit Apartments | 0 (0.0%) | 350 (100.0%) |
| 10 or more Apartments | 0 (0.0%) | 128 (100.0%) |
| Mobile Home / Other | 28 (100.0%) | 0 (0.0%) |
| Total | 2,156 (56.8%) | 1,643 (43.2%) |
Housing Structures by Number of Rooms in Tuscumbia
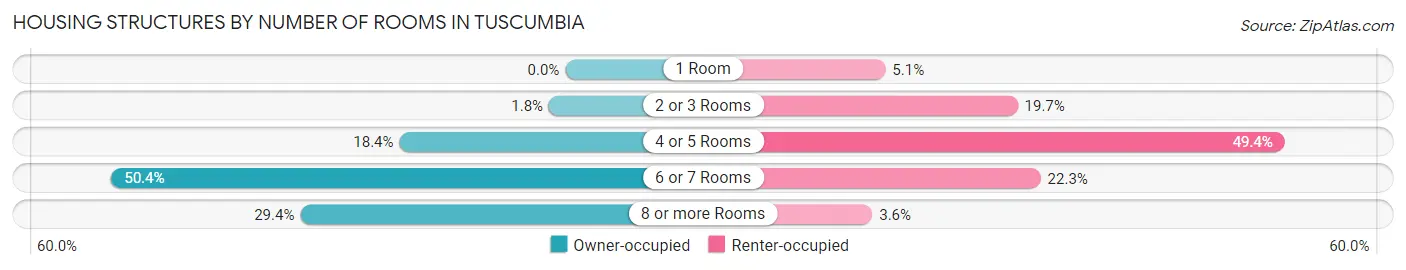
| Number of Rooms | Owner-occupied | Renter-occupied |
| 1 Room | 0 (0.0%) | 83 (5.1%) |
| 2 or 3 Rooms | 39 (1.8%) | 324 (19.7%) |
| 4 or 5 Rooms | 397 (18.4%) | 811 (49.4%) |
| 6 or 7 Rooms | 1,086 (50.4%) | 366 (22.3%) |
| 8 or more Rooms | 634 (29.4%) | 59 (3.6%) |
| Total | 2,156 (100.0%) | 1,643 (100.0%) |
Housing Structure by Heating Type in Tuscumbia
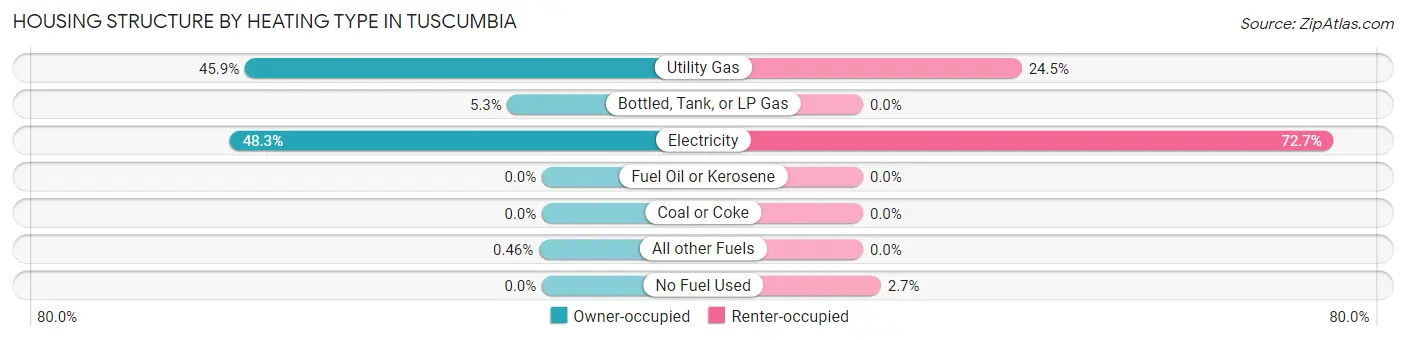
| Heating Type | Owner-occupied | Renter-occupied |
| Utility Gas | 990 (45.9%) | 403 (24.5%) |
| Bottled, Tank, or LP Gas | 115 (5.3%) | 0 (0.0%) |
| Electricity | 1,041 (48.3%) | 1,195 (72.7%) |
| Fuel Oil or Kerosene | 0 (0.0%) | 0 (0.0%) |
| Coal or Coke | 0 (0.0%) | 0 (0.0%) |
| All other Fuels | 10 (0.5%) | 0 (0.0%) |
| No Fuel Used | 0 (0.0%) | 45 (2.7%) |
| Total | 2,156 (100.0%) | 1,643 (100.0%) |
Household Vehicle Usage in Tuscumbia
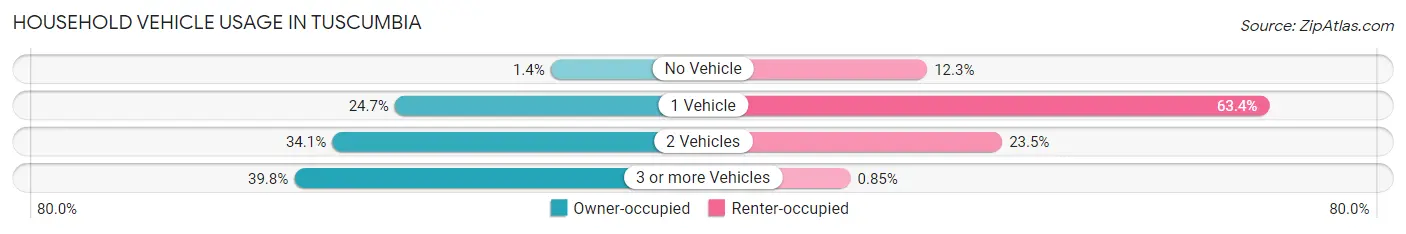
| Vehicles per Household | Owner-occupied | Renter-occupied |
| No Vehicle | 31 (1.4%) | 202 (12.3%) |
| 1 Vehicle | 533 (24.7%) | 1,041 (63.4%) |
| 2 Vehicles | 735 (34.1%) | 386 (23.5%) |
| 3 or more Vehicles | 857 (39.8%) | 14 (0.9%) |
| Total | 2,156 (100.0%) | 1,643 (100.0%) |
Real Estate & Mortgages in Tuscumbia
Real Estate and Mortgage Overview in Tuscumbia
| Characteristic | Without Mortgage | With Mortgage |
| Housing Units | 946 | 1,210 |
| Median Property Value | $123,400 | $182,000 |
| Median Household Income | $58,086 | $181 |
| Monthly Housing Costs | $390 | $17 |
| Real Estate Taxes | $589 | $220 |
Property Value by Mortgage Status in Tuscumbia
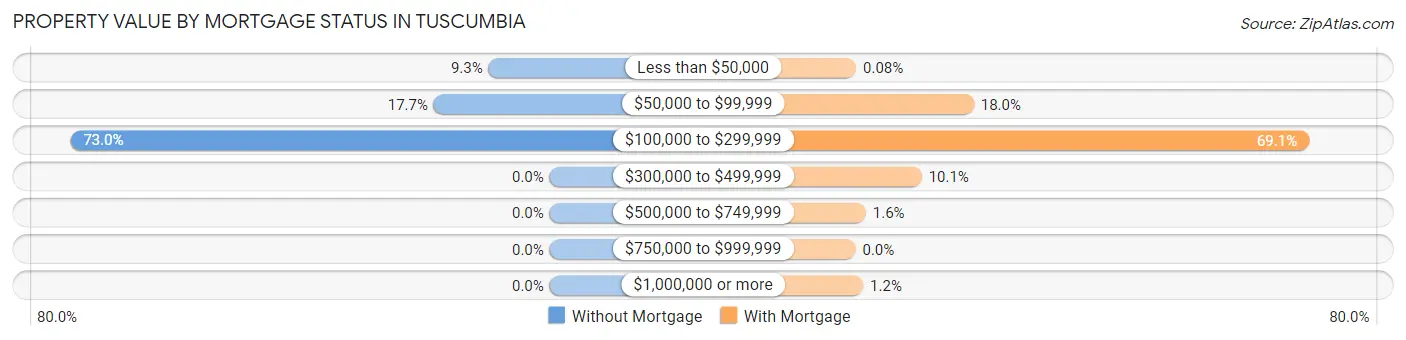
| Property Value | Without Mortgage | With Mortgage |
| Less than $50,000 | 88 (9.3%) | 1 (0.1%) |
| $50,000 to $99,999 | 167 (17.6%) | 218 (18.0%) |
| $100,000 to $299,999 | 691 (73.0%) | 836 (69.1%) |
| $300,000 to $499,999 | 0 (0.0%) | 122 (10.1%) |
| $500,000 to $749,999 | 0 (0.0%) | 19 (1.6%) |
| $750,000 to $999,999 | 0 (0.0%) | 0 (0.0%) |
| $1,000,000 or more | 0 (0.0%) | 14 (1.2%) |
| Total | 946 (100.0%) | 1,210 (100.0%) |
Household Income by Mortgage Status in Tuscumbia
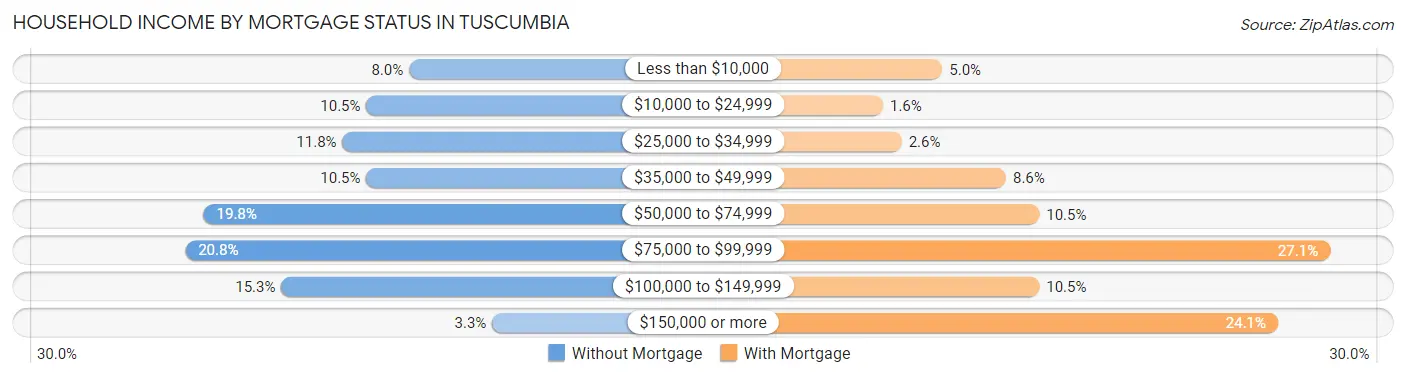
| Household Income | Without Mortgage | With Mortgage |
| Less than $10,000 | 76 (8.0%) | 60 (5.0%) |
| $10,000 to $24,999 | 99 (10.5%) | 19 (1.6%) |
| $25,000 to $34,999 | 112 (11.8%) | 32 (2.6%) |
| $35,000 to $49,999 | 99 (10.5%) | 104 (8.6%) |
| $50,000 to $74,999 | 187 (19.8%) | 127 (10.5%) |
| $75,000 to $99,999 | 197 (20.8%) | 328 (27.1%) |
| $100,000 to $149,999 | 145 (15.3%) | 127 (10.5%) |
| $150,000 or more | 31 (3.3%) | 292 (24.1%) |
| Total | 946 (100.0%) | 1,210 (100.0%) |
Property Value to Household Income Ratio in Tuscumbia
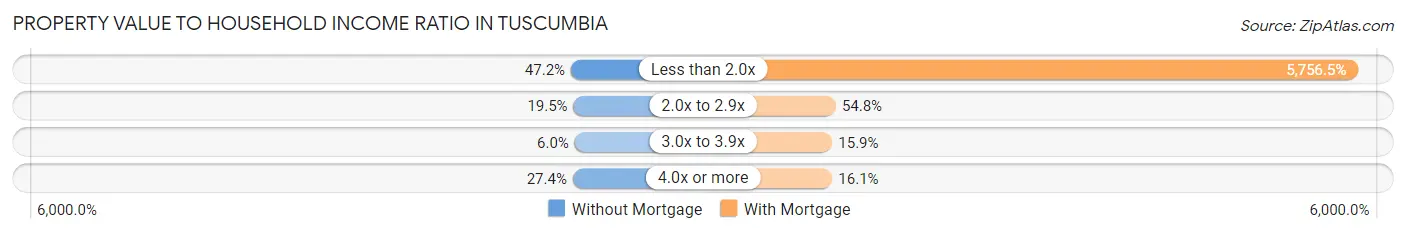
| Value-to-Income Ratio | Without Mortgage | With Mortgage |
| Less than 2.0x | 446 (47.1%) | 69,653 (5,756.5%) |
| 2.0x to 2.9x | 184 (19.5%) | 663 (54.8%) |
| 3.0x to 3.9x | 57 (6.0%) | 192 (15.9%) |
| 4.0x or more | 259 (27.4%) | 195 (16.1%) |
| Total | 946 (100.0%) | 1,210 (100.0%) |
Real Estate Taxes by Mortgage Status in Tuscumbia
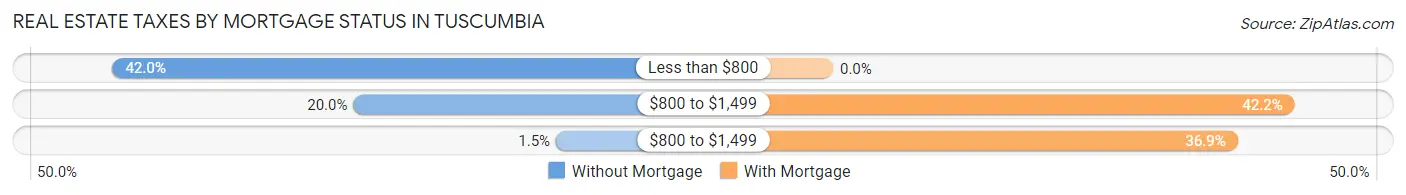
| Property Taxes | Without Mortgage | With Mortgage |
| Less than $800 | 397 (42.0%) | 0 (0.0%) |
| $800 to $1,499 | 189 (20.0%) | 510 (42.1%) |
| $800 to $1,499 | 14 (1.5%) | 447 (36.9%) |
| Total | 946 (100.0%) | 1,210 (100.0%) |
Health & Disability in Tuscumbia
Health Insurance Coverage by Age in Tuscumbia
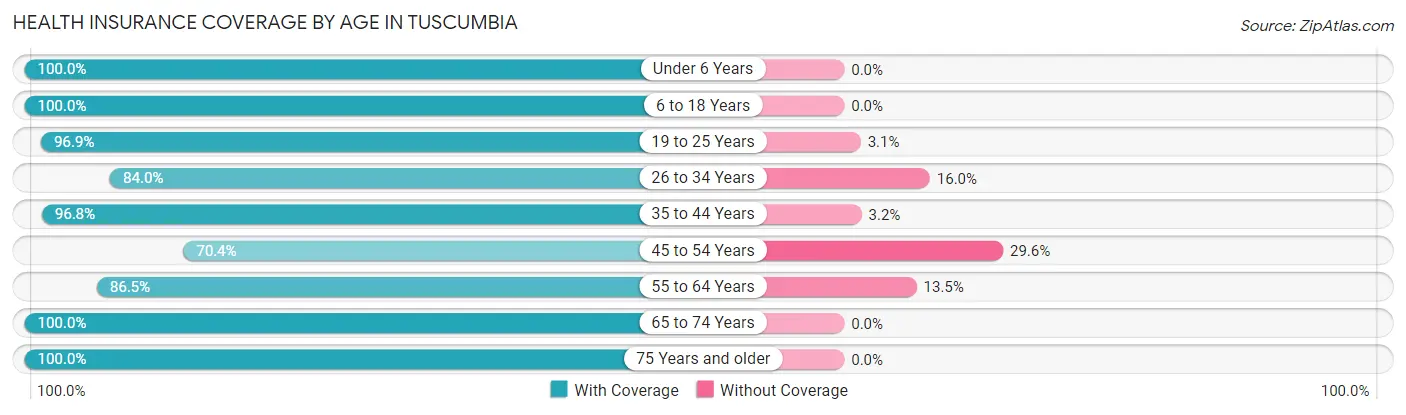
| Age Bracket | With Coverage | Without Coverage |
| Under 6 Years | 696 (100.0%) | 0 (0.0%) |
| 6 to 18 Years | 1,666 (100.0%) | 0 (0.0%) |
| 19 to 25 Years | 728 (96.9%) | 23 (3.1%) |
| 26 to 34 Years | 769 (84.0%) | 146 (16.0%) |
| 35 to 44 Years | 993 (96.8%) | 33 (3.2%) |
| 45 to 54 Years | 554 (70.4%) | 233 (29.6%) |
| 55 to 64 Years | 860 (86.5%) | 134 (13.5%) |
| 65 to 74 Years | 1,056 (100.0%) | 0 (0.0%) |
| 75 Years and older | 870 (100.0%) | 0 (0.0%) |
| Total | 8,192 (93.5%) | 569 (6.5%) |
Health Insurance Coverage by Citizenship Status in Tuscumbia
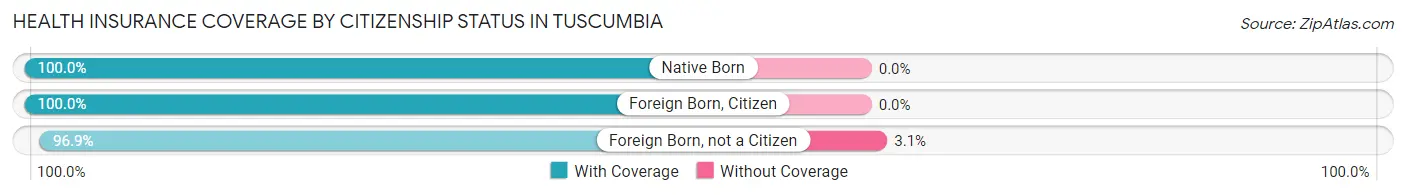
| Citizenship Status | With Coverage | Without Coverage |
| Native Born | 696 (100.0%) | 0 (0.0%) |
| Foreign Born, Citizen | 1,666 (100.0%) | 0 (0.0%) |
| Foreign Born, not a Citizen | 728 (96.9%) | 23 (3.1%) |
Health Insurance Coverage by Household Income in Tuscumbia
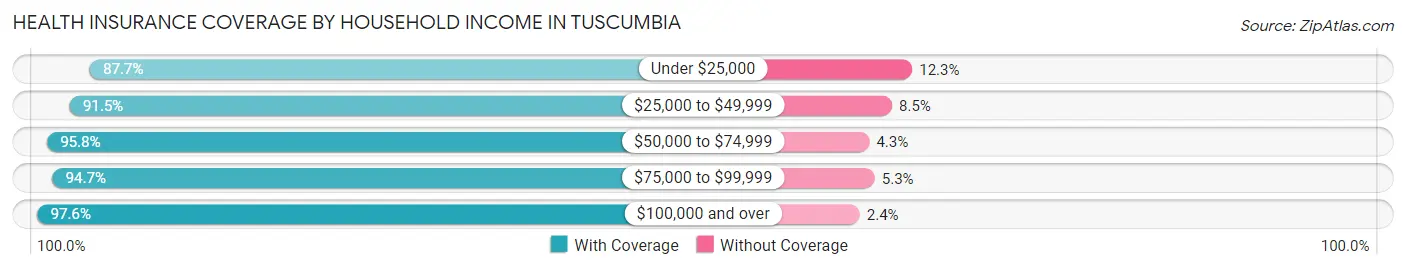
| Household Income | With Coverage | Without Coverage |
| Under $25,000 | 1,464 (87.7%) | 205 (12.3%) |
| $25,000 to $49,999 | 2,060 (91.5%) | 191 (8.5%) |
| $50,000 to $74,999 | 1,283 (95.8%) | 57 (4.3%) |
| $75,000 to $99,999 | 1,027 (94.7%) | 57 (5.3%) |
| $100,000 and over | 2,358 (97.6%) | 59 (2.4%) |
Public vs Private Health Insurance Coverage by Age in Tuscumbia
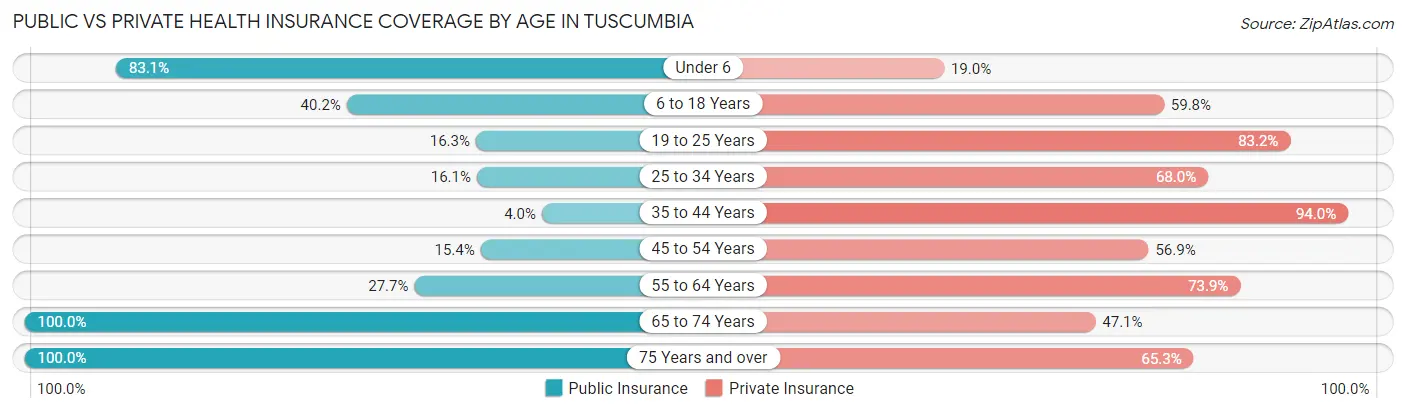
| Age Bracket | Public Insurance | Private Insurance |
| Under 6 | 578 (83.1%) | 132 (19.0%) |
| 6 to 18 Years | 670 (40.2%) | 996 (59.8%) |
| 19 to 25 Years | 122 (16.3%) | 625 (83.2%) |
| 25 to 34 Years | 147 (16.1%) | 622 (68.0%) |
| 35 to 44 Years | 41 (4.0%) | 964 (94.0%) |
| 45 to 54 Years | 121 (15.4%) | 448 (56.9%) |
| 55 to 64 Years | 275 (27.7%) | 735 (73.9%) |
| 65 to 74 Years | 1,056 (100.0%) | 497 (47.1%) |
| 75 Years and over | 870 (100.0%) | 568 (65.3%) |
| Total | 3,880 (44.3%) | 5,587 (63.8%) |
Disability Status by Sex by Age in Tuscumbia
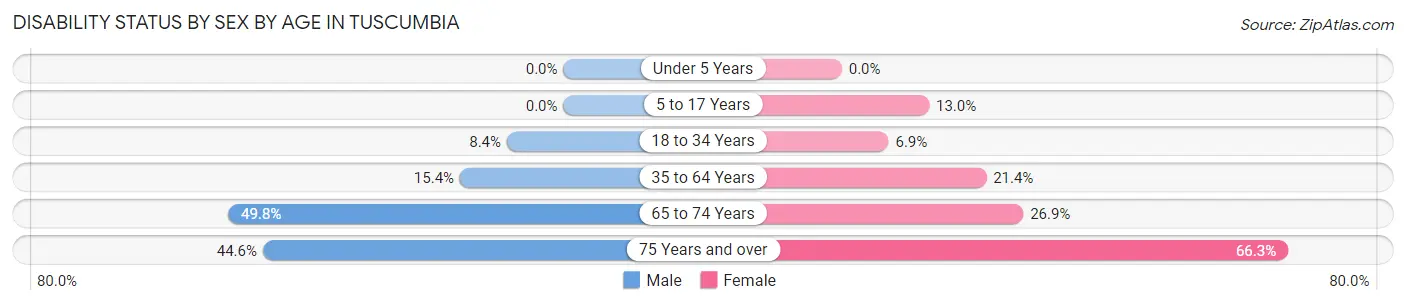
| Age Bracket | Male | Female |
| Under 5 Years | 0 (0.0%) | 0 (0.0%) |
| 5 to 17 Years | 0 (0.0%) | 112 (13.0%) |
| 18 to 34 Years | 51 (8.4%) | 77 (6.9%) |
| 35 to 64 Years | 212 (15.4%) | 306 (21.4%) |
| 65 to 74 Years | 230 (49.8%) | 160 (26.9%) |
| 75 Years and over | 137 (44.6%) | 373 (66.2%) |
Disability Class by Sex by Age in Tuscumbia
Disability Class: Hearing Difficulty
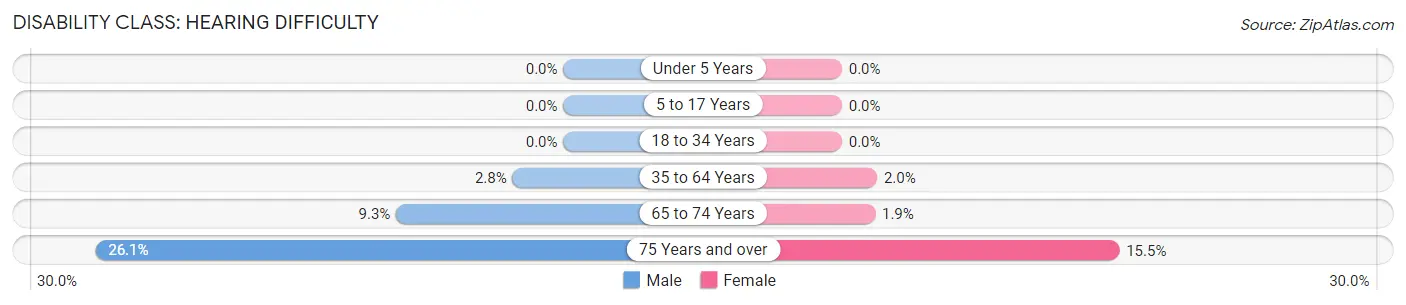
| Age Bracket | Male | Female |
| Under 5 Years | 0 (0.0%) | 0 (0.0%) |
| 5 to 17 Years | 0 (0.0%) | 0 (0.0%) |
| 18 to 34 Years | 0 (0.0%) | 0 (0.0%) |
| 35 to 64 Years | 39 (2.8%) | 28 (2.0%) |
| 65 to 74 Years | 43 (9.3%) | 11 (1.8%) |
| 75 Years and over | 80 (26.1%) | 87 (15.4%) |
Disability Class: Vision Difficulty
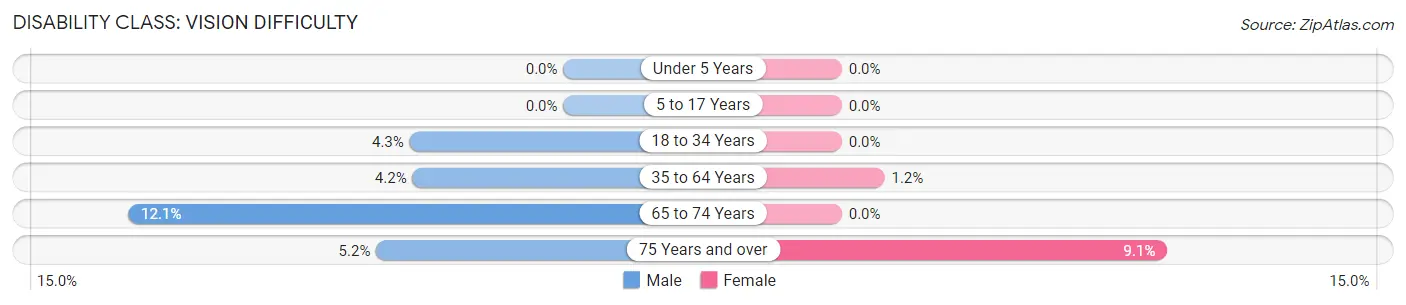
| Age Bracket | Male | Female |
| Under 5 Years | 0 (0.0%) | 0 (0.0%) |
| 5 to 17 Years | 0 (0.0%) | 0 (0.0%) |
| 18 to 34 Years | 26 (4.3%) | 0 (0.0%) |
| 35 to 64 Years | 58 (4.2%) | 17 (1.2%) |
| 65 to 74 Years | 56 (12.1%) | 0 (0.0%) |
| 75 Years and over | 16 (5.2%) | 51 (9.1%) |
Disability Class: Cognitive Difficulty
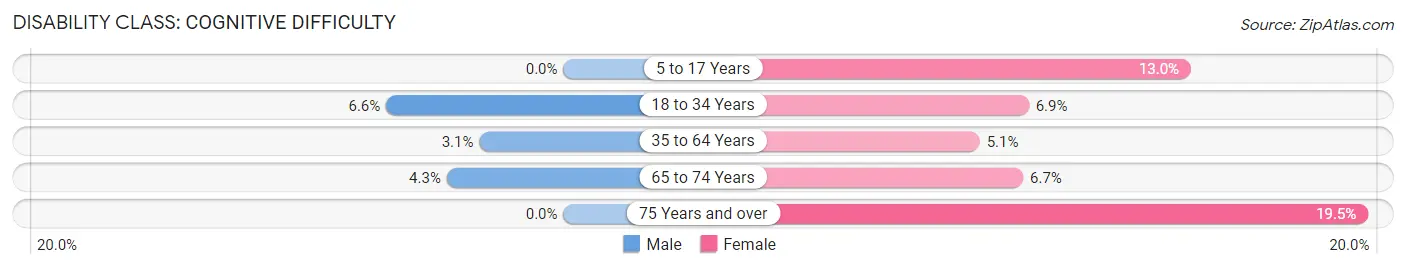
| Age Bracket | Male | Female |
| 5 to 17 Years | 0 (0.0%) | 112 (13.0%) |
| 18 to 34 Years | 40 (6.6%) | 77 (6.9%) |
| 35 to 64 Years | 43 (3.1%) | 73 (5.1%) |
| 65 to 74 Years | 20 (4.3%) | 40 (6.7%) |
| 75 Years and over | 0 (0.0%) | 110 (19.5%) |
Disability Class: Ambulatory Difficulty
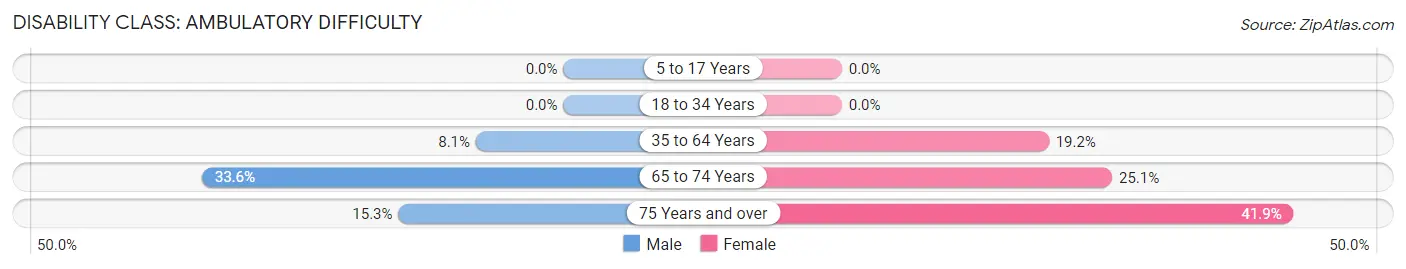
| Age Bracket | Male | Female |
| 5 to 17 Years | 0 (0.0%) | 0 (0.0%) |
| 18 to 34 Years | 0 (0.0%) | 0 (0.0%) |
| 35 to 64 Years | 112 (8.1%) | 274 (19.2%) |
| 65 to 74 Years | 155 (33.6%) | 149 (25.1%) |
| 75 Years and over | 47 (15.3%) | 236 (41.9%) |
Disability Class: Self-Care Difficulty
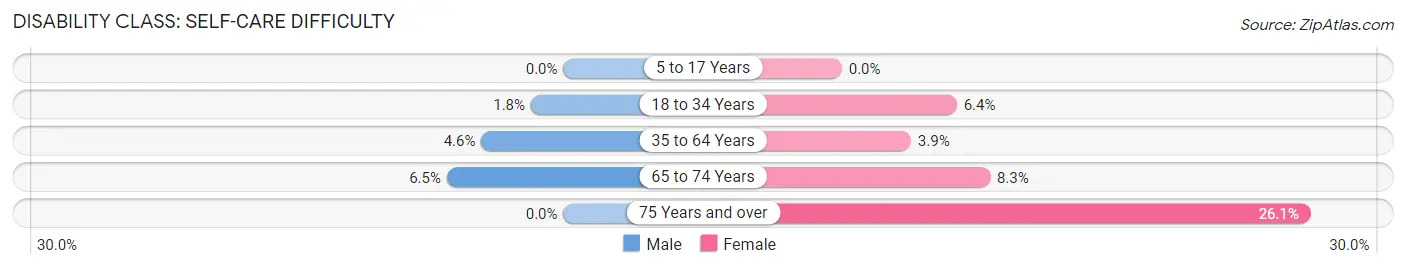
| Age Bracket | Male | Female |
| 5 to 17 Years | 0 (0.0%) | 0 (0.0%) |
| 18 to 34 Years | 11 (1.8%) | 71 (6.4%) |
| 35 to 64 Years | 63 (4.6%) | 55 (3.8%) |
| 65 to 74 Years | 30 (6.5%) | 49 (8.3%) |
| 75 Years and over | 0 (0.0%) | 147 (26.1%) |
Technology Access in Tuscumbia
Computing Device Access in Tuscumbia
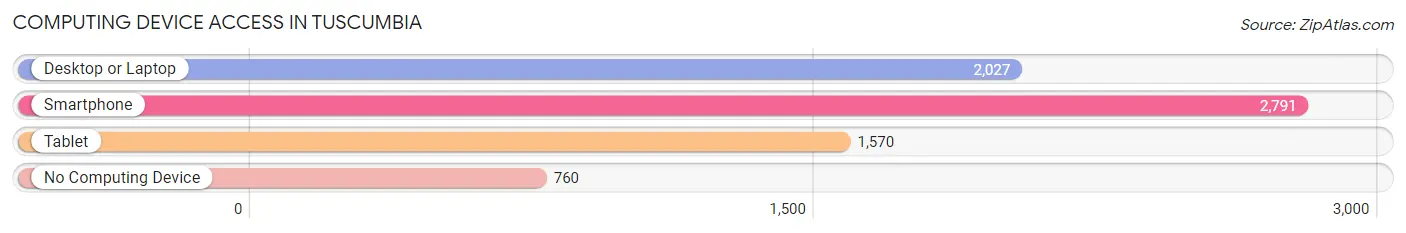
| Device Type | # Households | % Households |
| Desktop or Laptop | 2,027 | 53.4% |
| Smartphone | 2,791 | 73.5% |
| Tablet | 1,570 | 41.3% |
| No Computing Device | 760 | 20.0% |
| Total | 3,799 | 100.0% |
Internet Access in Tuscumbia
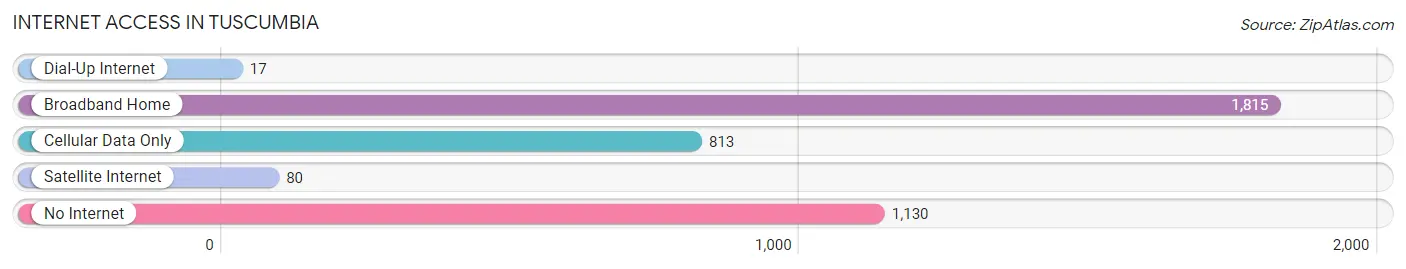
| Internet Type | # Households | % Households |
| Dial-Up Internet | 17 | 0.4% |
| Broadband Home | 1,815 | 47.8% |
| Cellular Data Only | 813 | 21.4% |
| Satellite Internet | 80 | 2.1% |
| No Internet | 1,130 | 29.7% |
| Total | 3,799 | 100.0% |
Tuscumbia Summary
Tuscumbia is a city located in the northwest corner of Colbert County, Alabama, United States. It is part of the Florence-Muscle Shoals Metropolitan Statistical Area known as "The Shoals". As of the 2010 census, the population of Tuscumbia was 8,423.
History
Tuscumbia was founded in 1820 by European-American settlers. It was named after the Creek Indian village of Tuscumbia, which was located nearby. The city was incorporated in 1821 and became the county seat of Colbert County in 1867.
Tuscumbia was the birthplace of Helen Keller, who became an internationally known advocate for the disabled. The city is home to the Alabama Music Hall of Fame, which honors the state's musical heritage.
Geography
Tuscumbia is located at 34°43'25" North, 87°42'13" West (34.723750, -87.703500). According to the U.S. Census Bureau, the city has a total area of 11.2 square miles (29.0 km2), of which 11.1 square miles (28.7 km2) is land and 0.1 square miles (0.3 km2) is water.
Economy
Tuscumbia's economy is largely based on manufacturing and tourism. The city is home to several large manufacturing plants, including a steel mill, a paper mill, and a chemical plant. The city is also home to several tourist attractions, including the Helen Keller Birthplace, the Alabama Music Hall of Fame, and the Tuscumbia Railroad Museum.
Demographics
As of the census of 2000, there were 8,521 people, 3,541 households, and 2,323 families residing in the city. The population density was 762.2 people per square mile (294.2/km2). There were 3,919 housing units at an average density of 351.2 per square mile (135.9/km2). The racial makeup of the city was 73.2% White, 24.3% Black or African American, 0.3% Native American, 0.4% Asian, 0.1% Pacific Islander, 0.7% from other races, and 0.9% from two or more races. 1.7% of the population were Hispanic or Latino of any race.
There were 3,541 households, out of which 28.2% had children under the age of 18 living with them, 44.2% were married couples living together, 17.3% had a female householder with no husband present, and 34.7% were non-families. 31.2% of all households were made up of individuals, and 14.2% had someone living alone who was 65 years of age or older. The average household size was 2.35 and the average family size was 2.94.
In the city, the population was spread out, with 24.2% under the age of 18, 8.3% from 18 to 24, 26.2% from 25 to 44, 22.7% from 45 to 64, and 18.6% who were 65 years of age or older. The median age was 38 years. For every 100 females, there were 86.2 males. For every 100 females age 18 and over, there were 81.2 males.
The median income for a household in the city was $27,845, and the median income for a family was $35,945. Males had a median income of $30,917 versus $20,813 for females. The per capita income for the city was $16,845. About 14.2% of families and 17.7% of the population were below the poverty line, including 24.2% of those under age 18 and 15.2% of those age 65 or over.
Common Questions
What is Per Capita Income in Tuscumbia?
Per Capita income in Tuscumbia is $28,134.
What is the Median Family Income in Tuscumbia?
Median Family Income in Tuscumbia is $66,006.
What is the Median Household income in Tuscumbia?
Median Household Income in Tuscumbia is $47,530.
What is Income or Wage Gap in Tuscumbia?
Income or Wage Gap in Tuscumbia is 40.5%.
Women in Tuscumbia earn 59.5 cents for every dollar earned by a man.
What is Family Income Deficit in Tuscumbia?
Family Income Deficit in Tuscumbia is $27,949.
Families that are below poverty line in Tuscumbia earn $27,949 less on average than the poverty threshold level.
What is Inequality or Gini Index in Tuscumbia?
Inequality or Gini Index in Tuscumbia is 0.47.
What is the Total Population of Tuscumbia?
Total Population of Tuscumbia is 9,029.
What is the Total Male Population of Tuscumbia?
Total Male Population of Tuscumbia is 4,176.
What is the Total Female Population of Tuscumbia?
Total Female Population of Tuscumbia is 4,853.
What is the Ratio of Males per 100 Females in Tuscumbia?
There are 86.05 Males per 100 Females in Tuscumbia.
What is the Ratio of Females per 100 Males in Tuscumbia?
There are 116.21 Females per 100 Males in Tuscumbia.
What is the Median Population Age in Tuscumbia?
Median Population Age in Tuscumbia is 37.4 Years.
What is the Average Family Size in Tuscumbia
Average Family Size in Tuscumbia is 3.1 People.
What is the Average Household Size in Tuscumbia
Average Household Size in Tuscumbia is 2.3 People.
How Large is the Labor Force in Tuscumbia?
There are 3,695 People in the Labor Forcein in Tuscumbia.
What is the Percentage of People in the Labor Force in Tuscumbia?
53.5% of People are in the Labor Force in Tuscumbia.
What is the Unemployment Rate in Tuscumbia?
Unemployment Rate in Tuscumbia is 1.2%.