Miramar Beach, FL Map & Demographics
Miramar Beach Map
Miramar Beach Overview
$66,344
PER CAPITA INCOME
$114,986
AVG FAMILY INCOME
$81,196
AVG HOUSEHOLD INCOME
21.2%
WAGE / INCOME GAP [ % ]
78.8¢/ $1
WAGE / INCOME GAP [ $ ]
0.50
INEQUALITY / GINI INDEX
9,115
TOTAL POPULATION
4,295
MALE POPULATION
4,820
FEMALE POPULATION
89.11
MALES / 100 FEMALES
112.22
FEMALES / 100 MALES
56.8
MEDIAN AGE
2.5
AVG FAMILY SIZE
2.1
AVG HOUSEHOLD SIZE
4,408
LABOR FORCE [ PEOPLE ]
52.9%
PERCENT IN LABOR FORCE
9.0%
UNEMPLOYMENT RATE
Miramar Beach Zip Codes
Miramar Beach Area Codes
Income in Miramar Beach
Income Overview in Miramar Beach
Per Capita Income in Miramar Beach is $66,344, while median incomes of families and households are $114,986 and $81,196 respectively.
| Characteristic | Number | Measure |
| Per Capita Income | 9,115 | $66,344 |
| Median Family Income | 2,736 | $114,986 |
| Mean Family Income | 2,736 | $166,697 |
| Median Household Income | 4,302 | $81,196 |
| Mean Household Income | 4,302 | $138,646 |
| Income Deficit | 2,736 | $0 |
| Wage / Income Gap (%) | 9,115 | 21.18% |
| Wage / Income Gap ($) | 9,115 | 78.82¢ per $1 |
| Gini / Inequality Index | 9,115 | 0.50 |
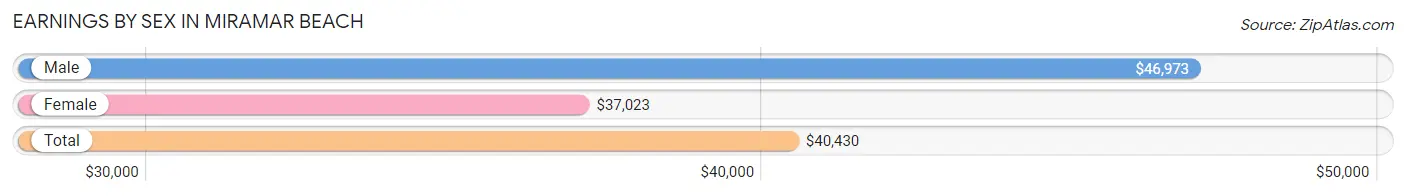
Earnings by Sex in Miramar Beach
Average Earnings in Miramar Beach are $40,430, $46,973 for men and $37,023 for women, a difference of 21.2%.
| Sex | Number | Average Earnings |
| Male | 2,353 (52.6%) | $46,973 |
| Female | 2,117 (47.4%) | $37,023 |
| Total | 4,470 (100.0%) | $40,430 |
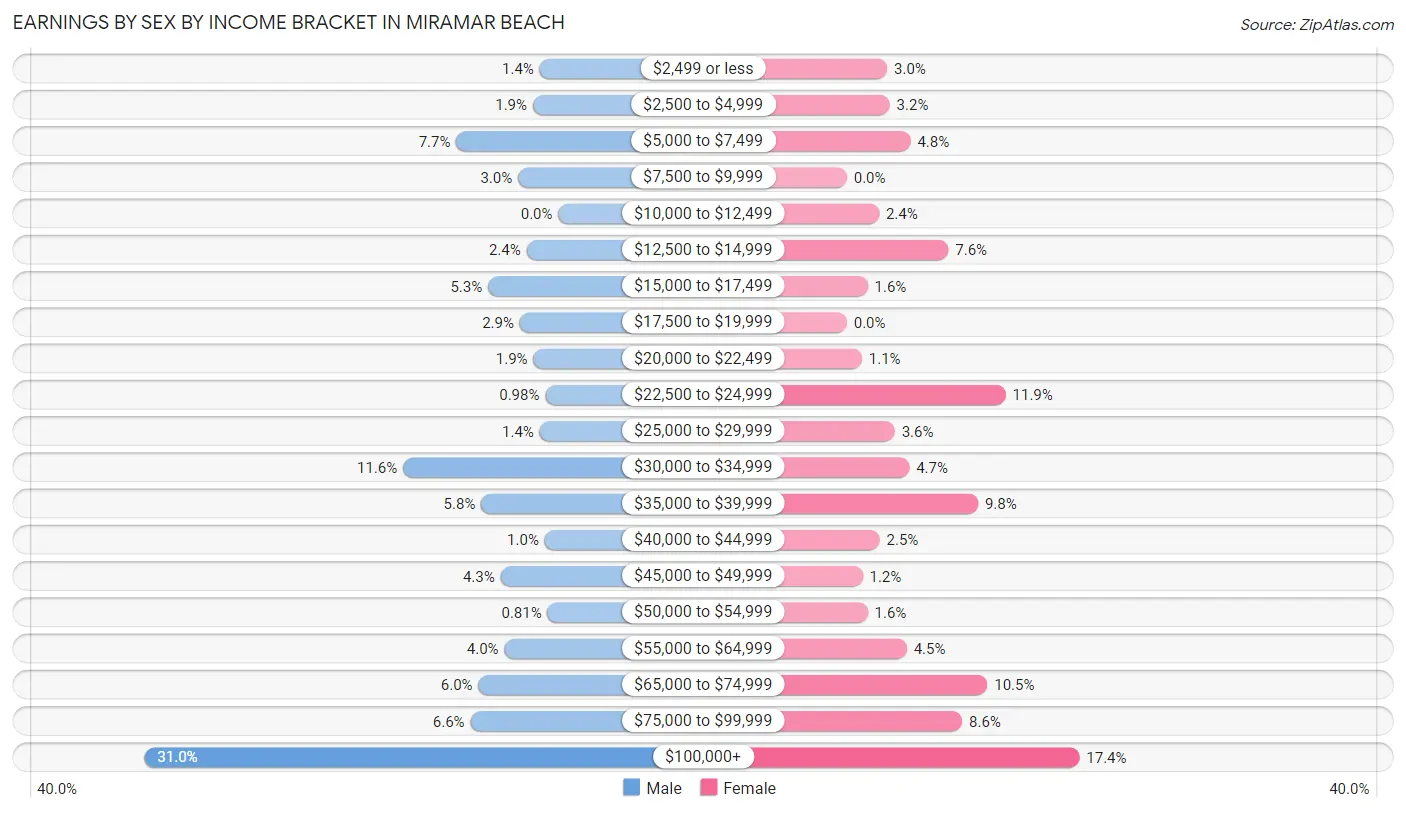
Earnings by Sex by Income Bracket in Miramar Beach
The most common earnings brackets in Miramar Beach are $100,000+ for men (730 | 31.0%) and $100,000+ for women (369 | 17.4%).
| Income | Male | Female |
| $2,499 or less | 33 (1.4%) | 64 (3.0%) |
| $2,500 to $4,999 | 45 (1.9%) | 68 (3.2%) |
| $5,000 to $7,499 | 180 (7.6%) | 101 (4.8%) |
| $7,500 to $9,999 | 71 (3.0%) | 0 (0.0%) |
| $10,000 to $12,499 | 0 (0.0%) | 51 (2.4%) |
| $12,500 to $14,999 | 56 (2.4%) | 161 (7.6%) |
| $15,000 to $17,499 | 124 (5.3%) | 33 (1.6%) |
| $17,500 to $19,999 | 68 (2.9%) | 0 (0.0%) |
| $20,000 to $22,499 | 44 (1.9%) | 24 (1.1%) |
| $22,500 to $24,999 | 23 (1.0%) | 252 (11.9%) |
| $25,000 to $29,999 | 33 (1.4%) | 76 (3.6%) |
| $30,000 to $34,999 | 274 (11.6%) | 99 (4.7%) |
| $35,000 to $39,999 | 136 (5.8%) | 208 (9.8%) |
| $40,000 to $44,999 | 24 (1.0%) | 52 (2.5%) |
| $45,000 to $49,999 | 102 (4.3%) | 25 (1.2%) |
| $50,000 to $54,999 | 19 (0.8%) | 33 (1.6%) |
| $55,000 to $64,999 | 95 (4.0%) | 95 (4.5%) |
| $65,000 to $74,999 | 141 (6.0%) | 223 (10.5%) |
| $75,000 to $99,999 | 155 (6.6%) | 183 (8.6%) |
| $100,000+ | 730 (31.0%) | 369 (17.4%) |
| Total | 2,353 (100.0%) | 2,117 (100.0%) |
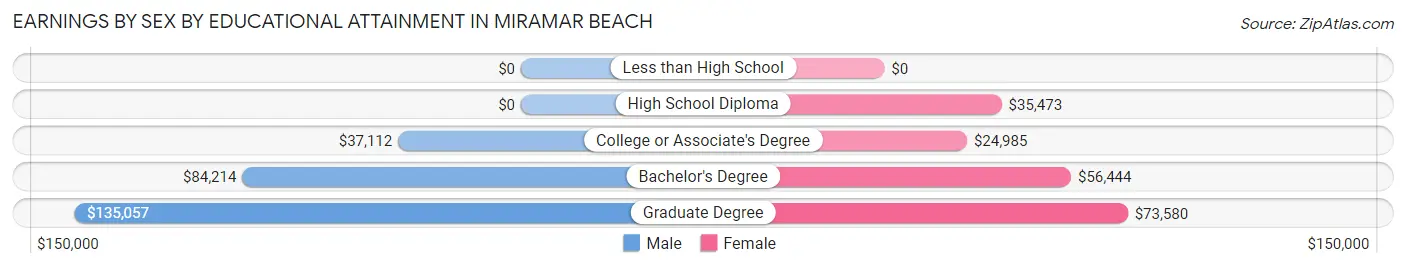
Earnings by Sex by Educational Attainment in Miramar Beach
Average earnings in Miramar Beach are $67,757 for men and $40,594 for women, a difference of 40.1%. Men with an educational attainment of graduate degree enjoy the highest average annual earnings of $135,057, while those with college or associate's degree education earn the least with $37,112. Women with an educational attainment of graduate degree earn the most with the average annual earnings of $73,580, while those with college or associate's degree education have the smallest earnings of $24,985.
| Educational Attainment | Male Income | Female Income |
| Less than High School | - | - |
| High School Diploma | - | - |
| College or Associate's Degree | $37,112 | $24,985 |
| Bachelor's Degree | $84,214 | $56,444 |
| Graduate Degree | $135,057 | $73,580 |
| Total | $67,757 | $40,594 |
Family Income in Miramar Beach
Family Income Brackets in Miramar Beach
According to the Miramar Beach family income data, there are 594 families falling into the $100,000 to $149,999 income range, which is the most common income bracket and makes up 21.7% of all families.
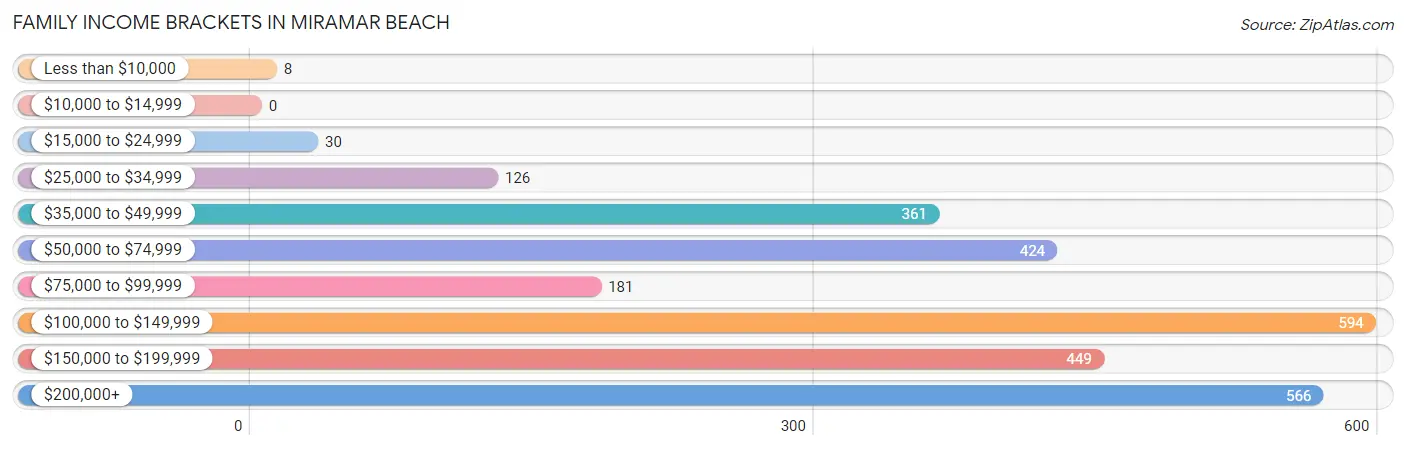
| Income Bracket | # Families | % Families |
| Less than $10,000 | 8 | 0.3% |
| $10,000 to $14,999 | 0 | 0.0% |
| $15,000 to $24,999 | 30 | 1.1% |
| $25,000 to $34,999 | 126 | 4.6% |
| $35,000 to $49,999 | 361 | 13.2% |
| $50,000 to $74,999 | 424 | 15.5% |
| $75,000 to $99,999 | 181 | 6.6% |
| $100,000 to $149,999 | 594 | 21.7% |
| $150,000 to $199,999 | 449 | 16.4% |
| $200,000+ | 566 | 20.7% |
Family Income by Famaliy Size in Miramar Beach
4-person families (297 | 10.9%) account for the highest median family income in Miramar Beach with $121,477 per family, while 2-person families (1,901 | 69.5%) have the highest median income of $59,262 per family member.
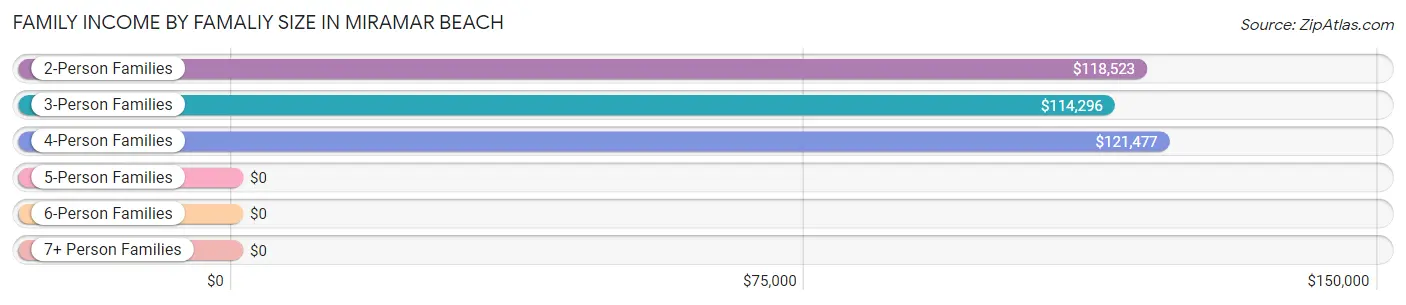
| Income Bracket | # Families | Median Income |
| 2-Person Families | 1,901 (69.5%) | $118,523 |
| 3-Person Families | 466 (17.0%) | $114,296 |
| 4-Person Families | 297 (10.9%) | $121,477 |
| 5-Person Families | 0 (0.0%) | $0 |
| 6-Person Families | 51 (1.9%) | $0 |
| 7+ Person Families | 21 (0.8%) | $0 |
| Total | 2,736 (100.0%) | $114,986 |
Family Income by Number of Earners in Miramar Beach
The median family income in Miramar Beach is $114,986, with families comprising 2 earners (795) having the highest median family income of $157,527, while families with 3+ earners (174) have the lowest median family income of $69,470, accounting for 29.1% and 6.4% of families, respectively.
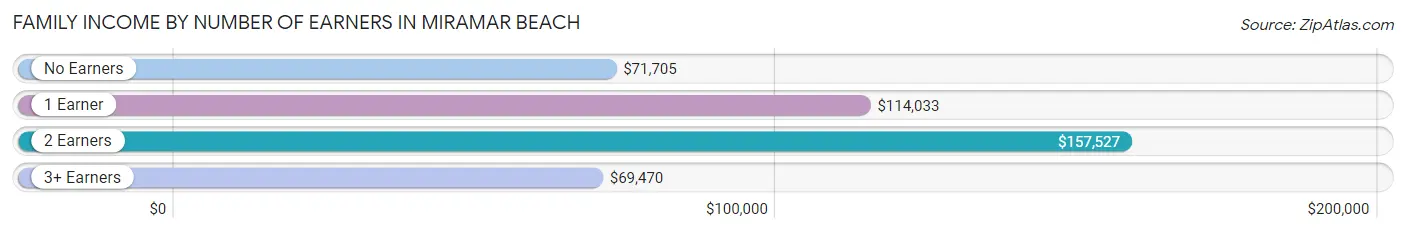
| Number of Earners | # Families | Median Income |
| No Earners | 821 (30.0%) | $71,705 |
| 1 Earner | 946 (34.6%) | $114,033 |
| 2 Earners | 795 (29.1%) | $157,527 |
| 3+ Earners | 174 (6.4%) | $69,470 |
| Total | 2,736 (100.0%) | $114,986 |
Household Income in Miramar Beach
Household Income Brackets in Miramar Beach
With 972 households falling in the category, the $50,000 to $74,999 income range is the most frequent in Miramar Beach, accounting for 22.6% of all households. In contrast, only 77 households (1.8%) fall into the $10,000 to $14,999 income bracket, making it the least populous group.
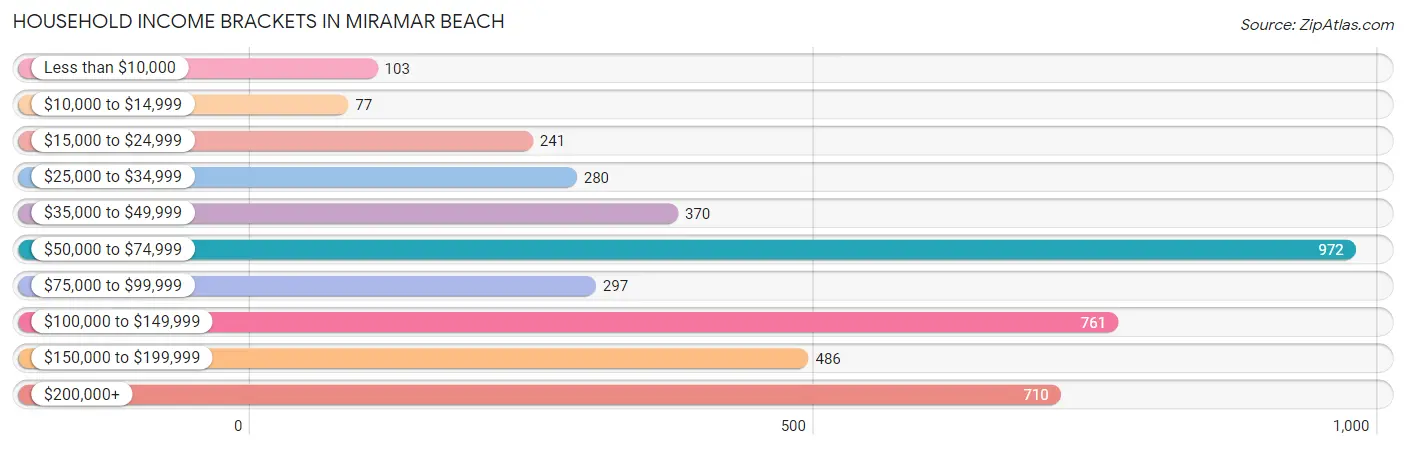
| Income Bracket | # Households | % Households |
| Less than $10,000 | 103 | 2.4% |
| $10,000 to $14,999 | 77 | 1.8% |
| $15,000 to $24,999 | 241 | 5.6% |
| $25,000 to $34,999 | 280 | 6.5% |
| $35,000 to $49,999 | 370 | 8.6% |
| $50,000 to $74,999 | 972 | 22.6% |
| $75,000 to $99,999 | 297 | 6.9% |
| $100,000 to $149,999 | 761 | 17.7% |
| $150,000 to $199,999 | 486 | 11.3% |
| $200,000+ | 710 | 16.5% |
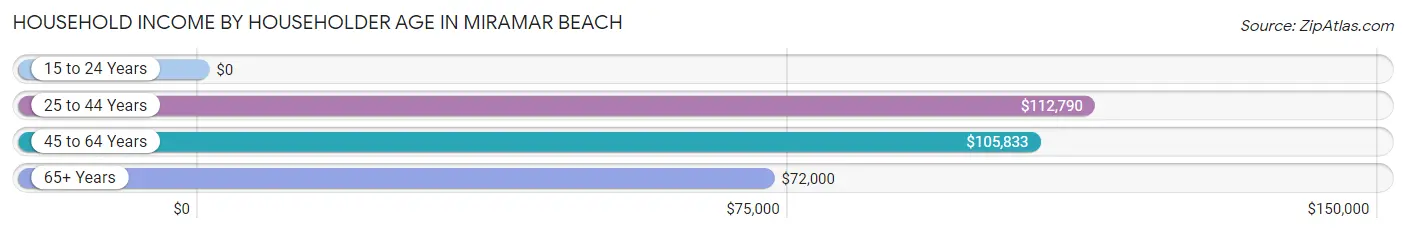
Household Income by Householder Age in Miramar Beach
The median household income in Miramar Beach is $81,196, with the highest median household income of $112,790 found in the 25 to 44 years age bracket for the primary householder. A total of 914 households (21.2%) fall into this category. Meanwhile, the 15 to 24 years age bracket for the primary householder has the lowest median household income of $0, with 56 households (1.3%) in this group.
| Income Bracket | # Households | Median Income |
| 15 to 24 Years | 56 (1.3%) | $0 |
| 25 to 44 Years | 914 (21.2%) | $112,790 |
| 45 to 64 Years | 1,442 (33.5%) | $105,833 |
| 65+ Years | 1,890 (43.9%) | $72,000 |
| Total | 4,302 (100.0%) | $81,196 |
Poverty in Miramar Beach
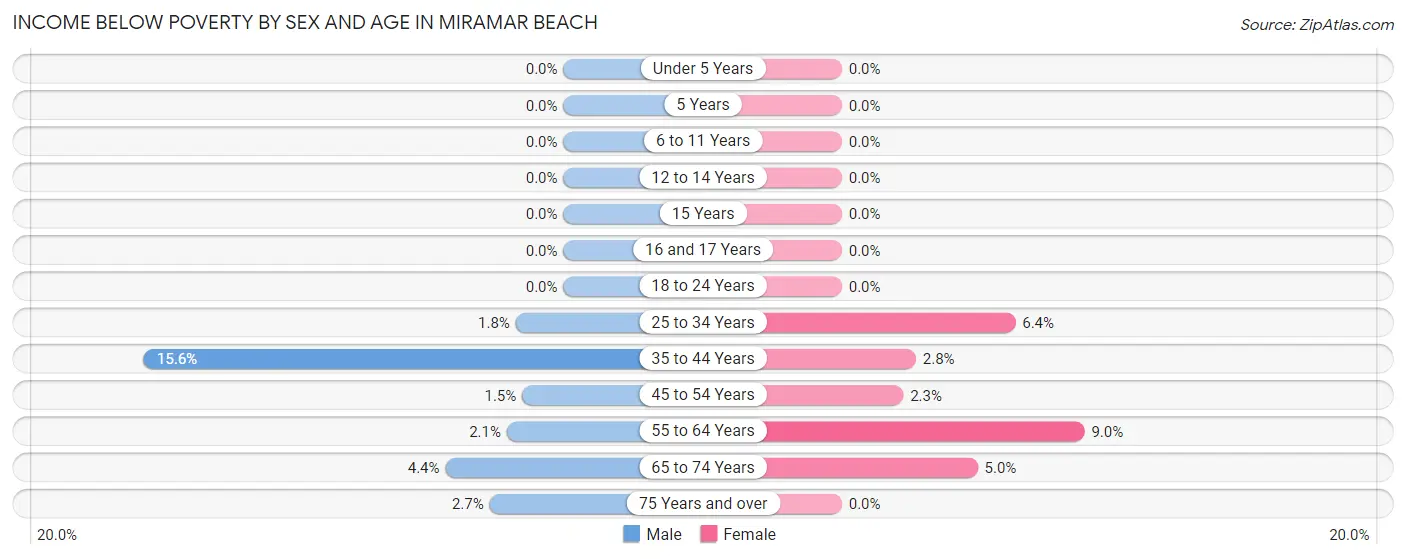
Income Below Poverty by Sex and Age in Miramar Beach
With 3.4% poverty level for males and 4.0% for females among the residents of Miramar Beach, 35 to 44 year old males and 55 to 64 year old females are the most vulnerable to poverty, with 59 males (15.6%) and 101 females (9.0%) in their respective age groups living below the poverty level.
| Age Bracket | Male | Female |
| Under 5 Years | 0 (0.0%) | 0 (0.0%) |
| 5 Years | 0 (0.0%) | 0 (0.0%) |
| 6 to 11 Years | 0 (0.0%) | 0 (0.0%) |
| 12 to 14 Years | 0 (0.0%) | 0 (0.0%) |
| 15 Years | 0 (0.0%) | 0 (0.0%) |
| 16 and 17 Years | 0 (0.0%) | 0 (0.0%) |
| 18 to 24 Years | 0 (0.0%) | 0 (0.0%) |
| 25 to 34 Years | 11 (1.8%) | 19 (6.4%) |
| 35 to 44 Years | 59 (15.6%) | 10 (2.8%) |
| 45 to 54 Years | 7 (1.5%) | 12 (2.3%) |
| 55 to 64 Years | 13 (2.1%) | 101 (9.0%) |
| 65 to 74 Years | 37 (4.4%) | 43 (5.0%) |
| 75 Years and over | 15 (2.7%) | 0 (0.0%) |
| Total | 142 (3.4%) | 185 (4.0%) |
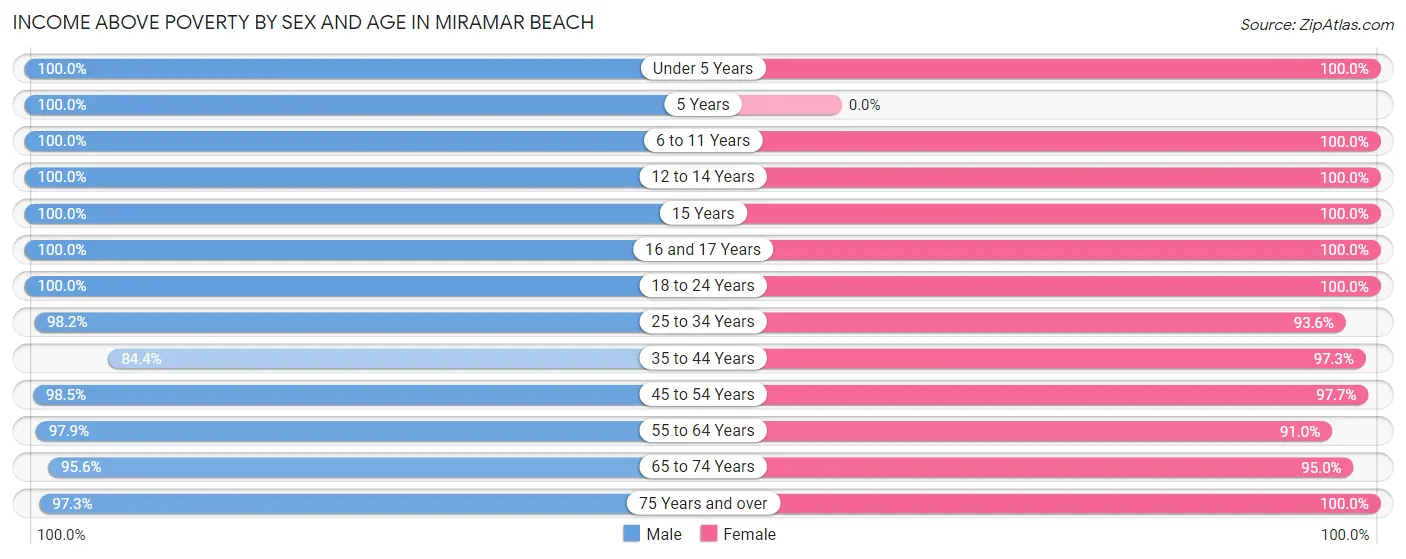
Income Above Poverty by Sex and Age in Miramar Beach
According to the poverty statistics in Miramar Beach, males aged under 5 years and females aged under 5 years are the age groups that are most secure financially, with 100.0% of males and 100.0% of females in these age groups living above the poverty line.
| Age Bracket | Male | Female |
| Under 5 Years | 28 (100.0%) | 129 (100.0%) |
| 5 Years | 12 (100.0%) | 0 (0.0%) |
| 6 to 11 Years | 203 (100.0%) | 90 (100.0%) |
| 12 to 14 Years | 115 (100.0%) | 107 (100.0%) |
| 15 Years | 44 (100.0%) | 55 (100.0%) |
| 16 and 17 Years | 26 (100.0%) | 223 (100.0%) |
| 18 to 24 Years | 322 (100.0%) | 288 (100.0%) |
| 25 to 34 Years | 612 (98.2%) | 276 (93.6%) |
| 35 to 44 Years | 320 (84.4%) | 353 (97.3%) |
| 45 to 54 Years | 450 (98.5%) | 514 (97.7%) |
| 55 to 64 Years | 606 (97.9%) | 1,020 (91.0%) |
| 65 to 74 Years | 808 (95.6%) | 811 (95.0%) |
| 75 Years and over | 533 (97.3%) | 633 (100.0%) |
| Total | 4,079 (96.6%) | 4,499 (96.1%) |
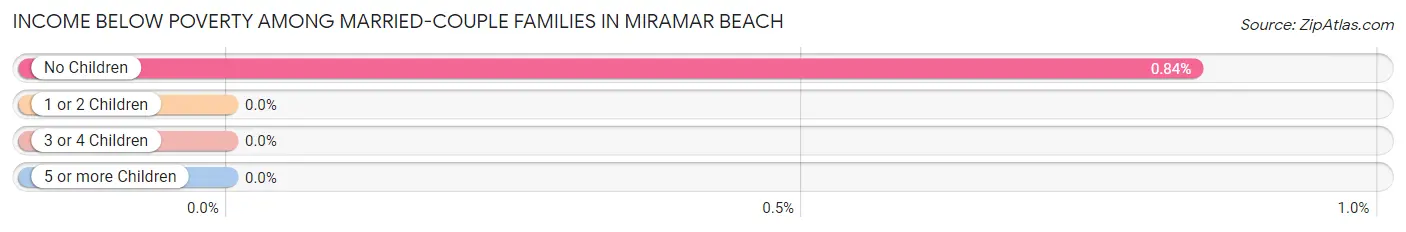
Income Below Poverty Among Married-Couple Families in Miramar Beach
The poverty statistics for married-couple families in Miramar Beach show that 0.7% or 16 of the total 2,241 families live below the poverty line. Families with no children have the highest poverty rate of 0.8%, comprising of 16 families. On the other hand, families with 1 or 2 children have the lowest poverty rate of 0.0%, which includes 0 families.
| Children | Above Poverty | Below Poverty |
| No Children | 1,886 (99.2%) | 16 (0.8%) |
| 1 or 2 Children | 267 (100.0%) | 0 (0.0%) |
| 3 or 4 Children | 72 (100.0%) | 0 (0.0%) |
| 5 or more Children | 0 (0.0%) | 0 (0.0%) |
| Total | 2,225 (99.3%) | 16 (0.7%) |
Income Below Poverty Among Single-Parent Households in Miramar Beach
| Children | Single Father | Single Mother |
| No Children | 0 (0.0%) | 0 (0.0%) |
| 1 or 2 Children | 0 (0.0%) | 0 (0.0%) |
| 3 or 4 Children | 0 (0.0%) | 0 (0.0%) |
| 5 or more Children | 0 (0.0%) | 0 (0.0%) |
| Total | 0 (0.0%) | 0 (0.0%) |
Income Below Poverty Among Married-Couple vs Single-Parent Households in Miramar Beach
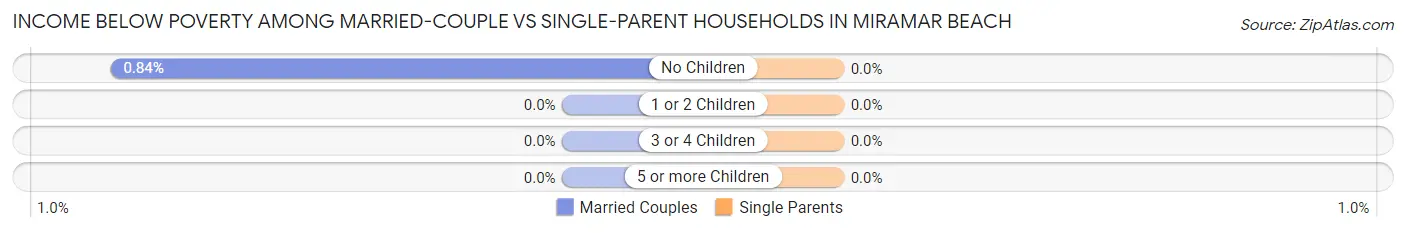
| Children | Married-Couple Families | Single-Parent Households |
| No Children | 16 (0.8%) | 0 (0.0%) |
| 1 or 2 Children | 0 (0.0%) | 0 (0.0%) |
| 3 or 4 Children | 0 (0.0%) | 0 (0.0%) |
| 5 or more Children | 0 (0.0%) | 0 (0.0%) |
| Total | 16 (0.7%) | 0 (0.0%) |
Race in Miramar Beach
The most populous races in Miramar Beach are White / Caucasian (8,324 | 91.3%), Hispanic or Latino (520 | 5.7%), and Black / African American (518 | 5.7%).
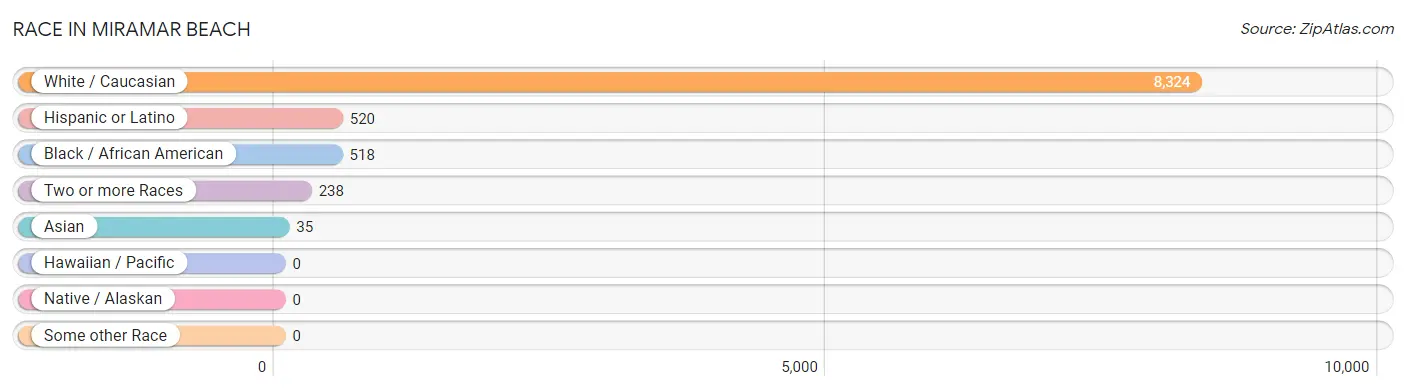
| Race | # Population | % Population |
| Asian | 35 | 0.4% |
| Black / African American | 518 | 5.7% |
| Hawaiian / Pacific | 0 | 0.0% |
| Hispanic or Latino | 520 | 5.7% |
| Native / Alaskan | 0 | 0.0% |
| White / Caucasian | 8,324 | 91.3% |
| Two or more Races | 238 | 2.6% |
| Some other Race | 0 | 0.0% |
| Total | 9,115 | 100.0% |
Ancestry in Miramar Beach
The most populous ancestries reported in Miramar Beach are English (1,463 | 16.1%), German (1,323 | 14.5%), Irish (1,154 | 12.7%), American (607 | 6.7%), and Swedish (597 | 6.6%), together accounting for 56.4% of all Miramar Beach residents.
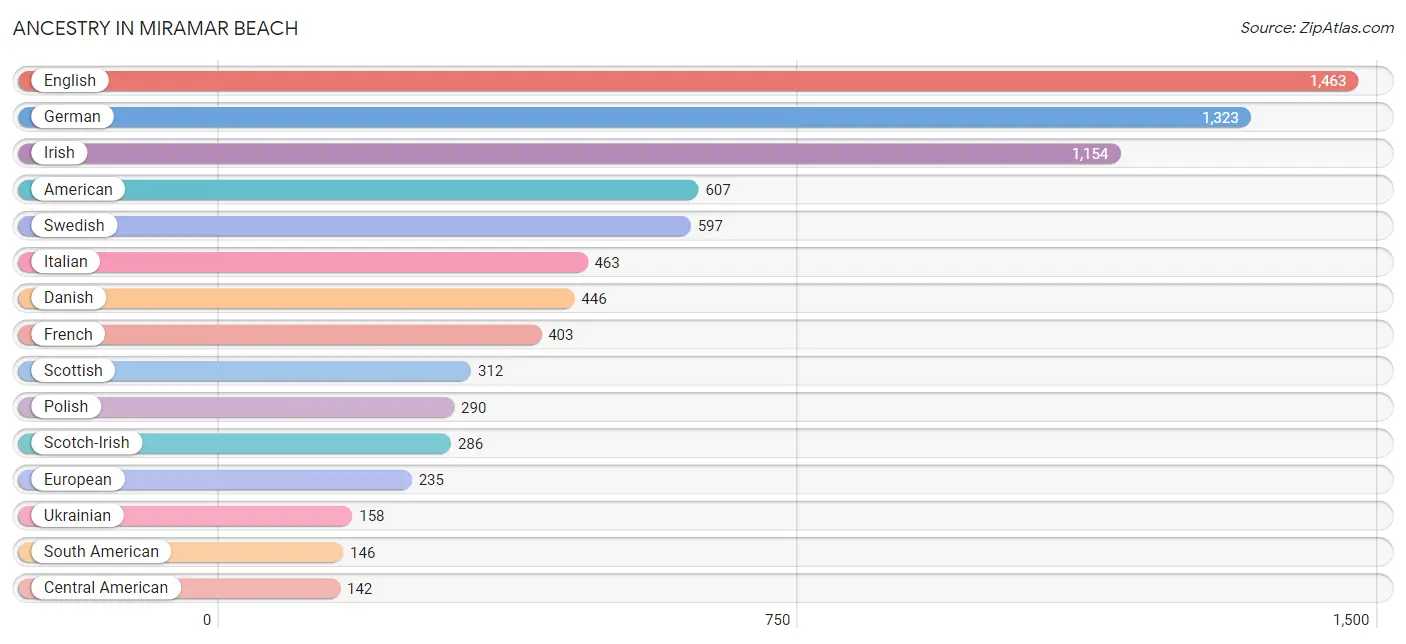
| Ancestry | # Population | % Population |
| American | 607 | 6.7% |
| Arab | 59 | 0.6% |
| Belgian | 31 | 0.3% |
| British | 65 | 0.7% |
| Canadian | 8 | 0.1% |
| Central American | 142 | 1.6% |
| Central American Indian | 6 | 0.1% |
| Colombian | 28 | 0.3% |
| Creek | 13 | 0.1% |
| Cuban | 128 | 1.4% |
| Czech | 82 | 0.9% |
| Danish | 446 | 4.9% |
| Dutch | 112 | 1.2% |
| English | 1,463 | 16.1% |
| European | 235 | 2.6% |
| Finnish | 16 | 0.2% |
| French | 403 | 4.4% |
| German | 1,323 | 14.5% |
| Greek | 22 | 0.2% |
| Hungarian | 21 | 0.2% |
| Irish | 1,154 | 12.7% |
| Italian | 463 | 5.1% |
| Jamaican | 51 | 0.6% |
| Lebanese | 59 | 0.6% |
| Lithuanian | 28 | 0.3% |
| Mexican | 44 | 0.5% |
| Nicaraguan | 27 | 0.3% |
| Norwegian | 63 | 0.7% |
| Pakistani | 94 | 1.0% |
| Panamanian | 115 | 1.3% |
| Pennsylvania German | 8 | 0.1% |
| Peruvian | 62 | 0.7% |
| Polish | 290 | 3.2% |
| Portuguese | 84 | 0.9% |
| Puerto Rican | 9 | 0.1% |
| Romanian | 54 | 0.6% |
| Russian | 110 | 1.2% |
| Scandinavian | 9 | 0.1% |
| Scotch-Irish | 286 | 3.1% |
| Scottish | 312 | 3.4% |
| Slovene | 23 | 0.3% |
| South American | 146 | 1.6% |
| Spaniard | 12 | 0.1% |
| Swedish | 597 | 6.6% |
| Thai | 7 | 0.1% |
| Ukrainian | 158 | 1.7% |
| Venezuelan | 56 | 0.6% |
| Welsh | 74 | 0.8% | View All 48 Rows |
Immigrants in Miramar Beach
The most numerous immigrant groups reported in Miramar Beach came from Europe (540 | 5.9%), Latin America (537 | 5.9%), Eastern Europe (418 | 4.6%), Caribbean (331 | 3.6%), and Jamaica (210 | 2.3%), together accounting for 22.3% of all Miramar Beach residents.
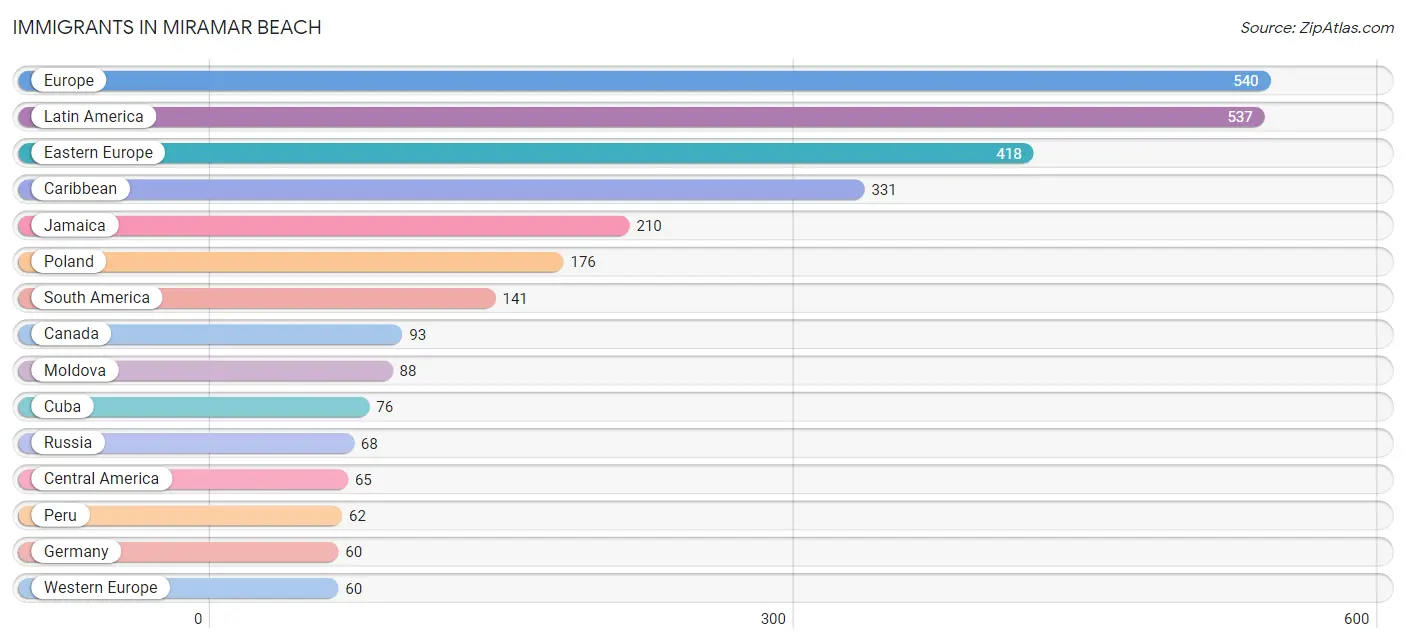
| Immigration Origin | # Population | % Population |
| Asia | 35 | 0.4% |
| Barbados | 45 | 0.5% |
| Brazil | 23 | 0.3% |
| Canada | 93 | 1.0% |
| Caribbean | 331 | 3.6% |
| Central America | 65 | 0.7% |
| Cuba | 76 | 0.8% |
| Eastern Europe | 418 | 4.6% |
| England | 57 | 0.6% |
| Europe | 540 | 5.9% |
| Germany | 60 | 0.7% |
| India | 7 | 0.1% |
| Italy | 5 | 0.1% |
| Jamaica | 210 | 2.3% |
| Latin America | 537 | 5.9% |
| Lithuania | 17 | 0.2% |
| Moldova | 88 | 1.0% |
| Nicaragua | 27 | 0.3% |
| Northern Europe | 57 | 0.6% |
| Panama | 38 | 0.4% |
| Peru | 62 | 0.7% |
| Poland | 176 | 1.9% |
| Romania | 19 | 0.2% |
| Russia | 68 | 0.7% |
| South America | 141 | 1.5% |
| South Central Asia | 7 | 0.1% |
| South Eastern Asia | 28 | 0.3% |
| Southern Europe | 5 | 0.1% |
| Thailand | 28 | 0.3% |
| Ukraine | 50 | 0.5% |
| Venezuela | 56 | 0.6% |
| Western Europe | 60 | 0.7% | View All 32 Rows |
Sex and Age in Miramar Beach
Sex and Age in Miramar Beach
The most populous age groups in Miramar Beach are 65 to 69 Years (478 | 11.1%) for men and 60 to 64 Years (603 | 12.5%) for women.
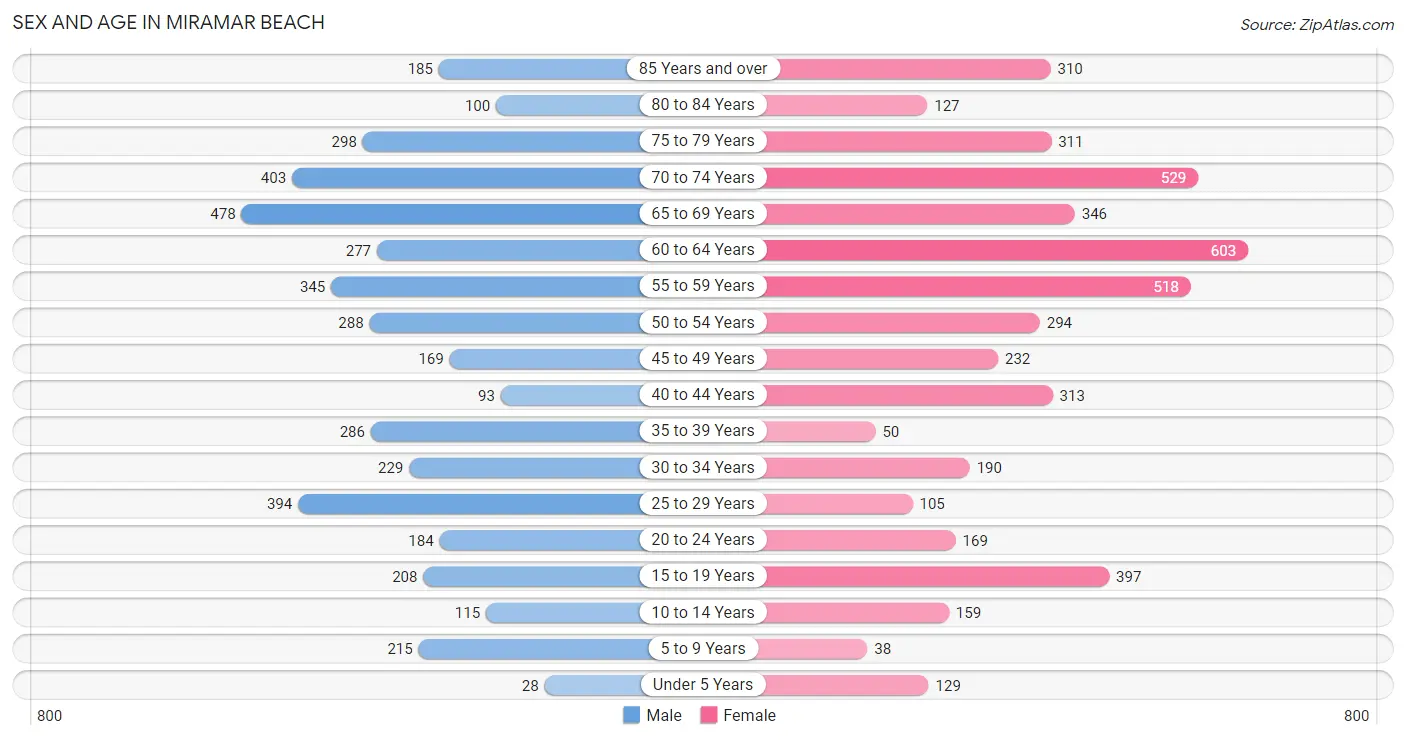
| Age Bracket | Male | Female |
| Under 5 Years | 28 (0.6%) | 129 (2.7%) |
| 5 to 9 Years | 215 (5.0%) | 38 (0.8%) |
| 10 to 14 Years | 115 (2.7%) | 159 (3.3%) |
| 15 to 19 Years | 208 (4.8%) | 397 (8.2%) |
| 20 to 24 Years | 184 (4.3%) | 169 (3.5%) |
| 25 to 29 Years | 394 (9.2%) | 105 (2.2%) |
| 30 to 34 Years | 229 (5.3%) | 190 (3.9%) |
| 35 to 39 Years | 286 (6.7%) | 50 (1.0%) |
| 40 to 44 Years | 93 (2.2%) | 313 (6.5%) |
| 45 to 49 Years | 169 (3.9%) | 232 (4.8%) |
| 50 to 54 Years | 288 (6.7%) | 294 (6.1%) |
| 55 to 59 Years | 345 (8.0%) | 518 (10.7%) |
| 60 to 64 Years | 277 (6.5%) | 603 (12.5%) |
| 65 to 69 Years | 478 (11.1%) | 346 (7.2%) |
| 70 to 74 Years | 403 (9.4%) | 529 (11.0%) |
| 75 to 79 Years | 298 (6.9%) | 311 (6.5%) |
| 80 to 84 Years | 100 (2.3%) | 127 (2.6%) |
| 85 Years and over | 185 (4.3%) | 310 (6.4%) |
| Total | 4,295 (100.0%) | 4,820 (100.0%) |
Families and Households in Miramar Beach
Median Family Size in Miramar Beach
The median family size in Miramar Beach is 2.48 persons per family, with married-couple families (2,241 | 81.9%) accounting for the largest median family size of 2.54 persons per family. On the other hand, single male/father families (198 | 7.2%) represent the smallest median family size with 2.13 persons per family.
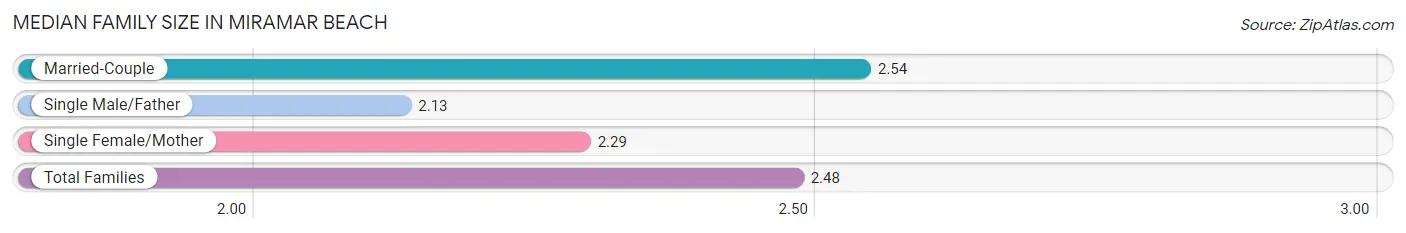
| Family Type | # Families | Family Size |
| Married-Couple | 2,241 (81.9%) | 2.54 |
| Single Male/Father | 198 (7.2%) | 2.13 |
| Single Female/Mother | 297 (10.9%) | 2.29 |
| Total Families | 2,736 (100.0%) | 2.48 |
Median Household Size in Miramar Beach
The median household size in Miramar Beach is 2.07 persons per household, with single male/father households (198 | 4.6%) accounting for the largest median household size of 2.86 persons per household. non-family households (1,566 | 36.4%) represent the smallest median household size with 1.26 persons per household.
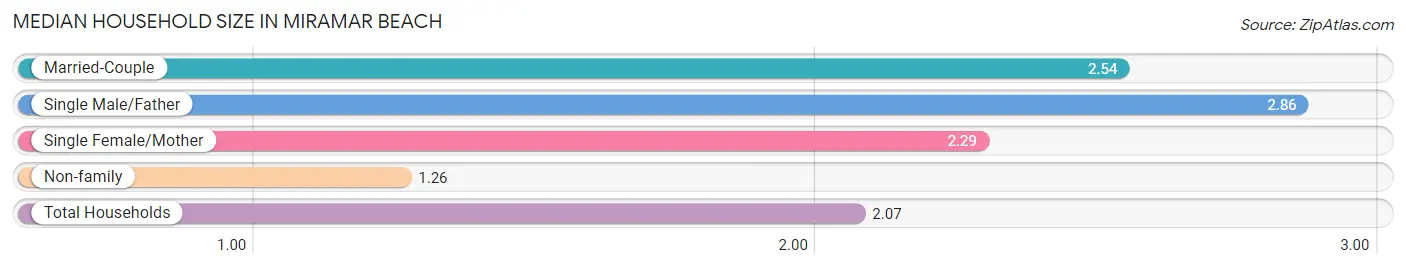
| Household Type | # Households | Household Size |
| Married-Couple | 2,241 (52.1%) | 2.54 |
| Single Male/Father | 198 (4.6%) | 2.86 |
| Single Female/Mother | 297 (6.9%) | 2.29 |
| Non-family | 1,566 (36.4%) | 1.26 |
| Total Households | 4,302 (100.0%) | 2.07 |
Household Size by Marriage Status in Miramar Beach
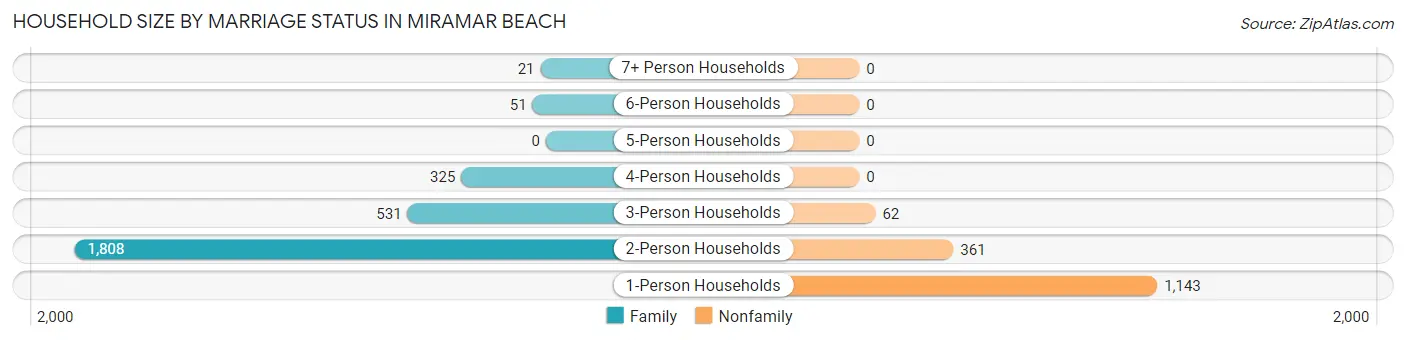
Out of a total of 4,302 households in Miramar Beach, 2,736 (63.6%) are family households, while 1,566 (36.4%) are nonfamily households. The most numerous type of family households are 2-person households, comprising 1,808, and the most common type of nonfamily households are 1-person households, comprising 1,143.
| Household Size | Family Households | Nonfamily Households |
| 1-Person Households | - | 1,143 (26.6%) |
| 2-Person Households | 1,808 (42.0%) | 361 (8.4%) |
| 3-Person Households | 531 (12.3%) | 62 (1.4%) |
| 4-Person Households | 325 (7.5%) | 0 (0.0%) |
| 5-Person Households | 0 (0.0%) | 0 (0.0%) |
| 6-Person Households | 51 (1.2%) | 0 (0.0%) |
| 7+ Person Households | 21 (0.5%) | 0 (0.0%) |
| Total | 2,736 (63.6%) | 1,566 (36.4%) |
Female Fertility in Miramar Beach
Fertility by Age in Miramar Beach
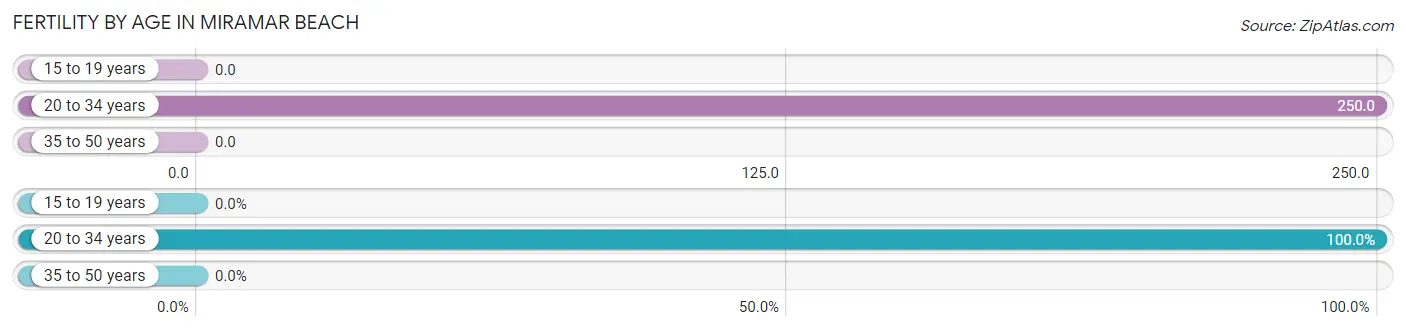
Average fertility rate in Miramar Beach is 78.0 births per 1,000 women. Women in the age bracket of 20 to 34 years have the highest fertility rate with 250.0 births per 1,000 women. Women in the age bracket of 20 to 34 years acount for 100.0% of all women with births.
| Age Bracket | Women with Births | Births / 1,000 Women |
| 15 to 19 years | 0 (0.0%) | 0.0 |
| 20 to 34 years | 116 (100.0%) | 250.0 |
| 35 to 50 years | 0 (0.0%) | 0.0 |
| Total | 116 (100.0%) | 78.0 |
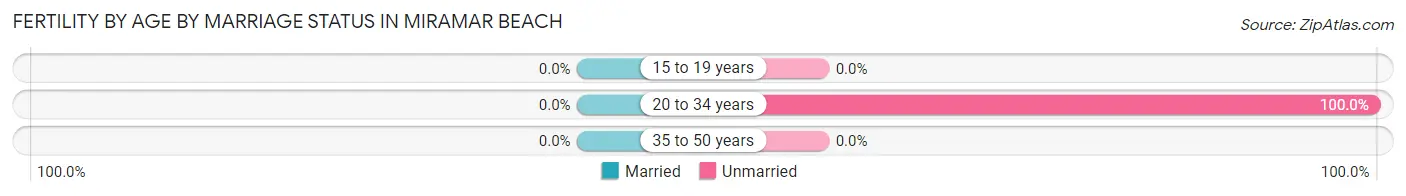
Fertility by Age by Marriage Status in Miramar Beach
| Age Bracket | Married | Unmarried |
| 15 to 19 years | 0 (0.0%) | 0 (0.0%) |
| 20 to 34 years | 0 (0.0%) | 116 (100.0%) |
| 35 to 50 years | 0 (0.0%) | 0 (0.0%) |
| Total | 0 (0.0%) | 116 (100.0%) |
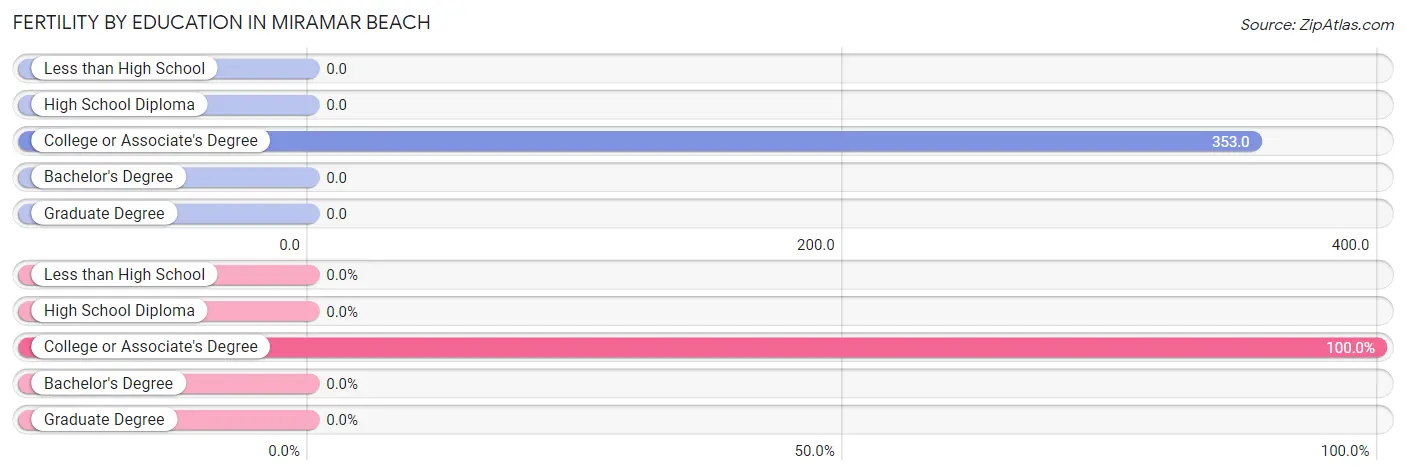
Fertility by Education in Miramar Beach
| Educational Attainment | Women with Births | Births / 1,000 Women |
| Less than High School | 0 (0.0%) | 0.0 |
| High School Diploma | 0 (0.0%) | 0.0 |
| College or Associate's Degree | 116 (100.0%) | 353.0 |
| Bachelor's Degree | 0 (0.0%) | 0.0 |
| Graduate Degree | 0 (0.0%) | 0.0 |
| Total | 116 (100.0%) | 78.0 |
Fertility by Education by Marriage Status in Miramar Beach
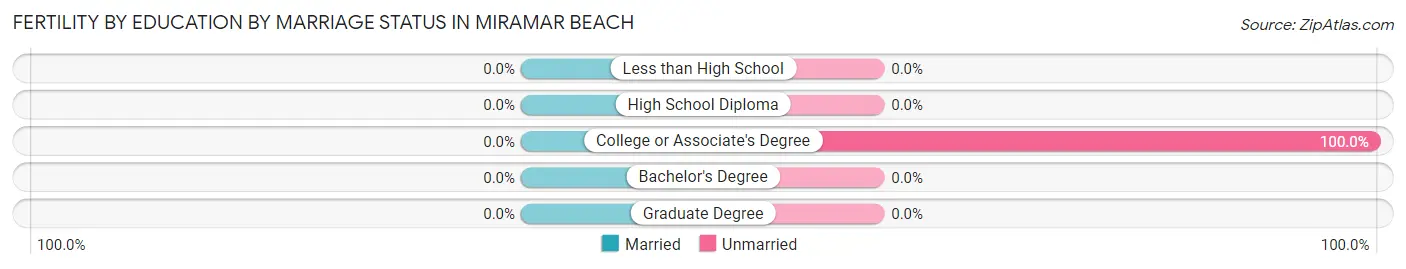
| Educational Attainment | Married | Unmarried |
| Less than High School | 0 (0.0%) | 0 (0.0%) |
| High School Diploma | 0 (0.0%) | 0 (0.0%) |
| College or Associate's Degree | 0 (0.0%) | 116 (100.0%) |
| Bachelor's Degree | 0 (0.0%) | 0 (0.0%) |
| Graduate Degree | 0 (0.0%) | 0 (0.0%) |
| Total | 0 (0.0%) | 116 (100.0%) |
Employment Characteristics in Miramar Beach
Employment by Class of Employer in Miramar Beach
Among the 4,018 employed individuals in Miramar Beach, private company employees (2,655 | 66.1%), self-employed (incorporated) (684 | 17.0%), and self-employed (not incorporated) (371 | 9.2%) make up the most common classes of employment.
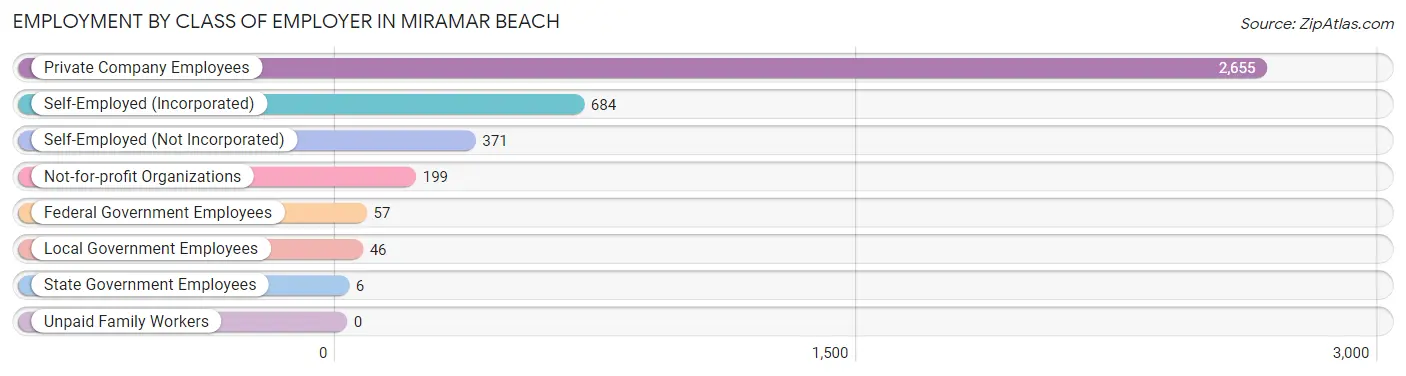
| Employer Class | # Employees | % Employees |
| Private Company Employees | 2,655 | 66.1% |
| Self-Employed (Incorporated) | 684 | 17.0% |
| Self-Employed (Not Incorporated) | 371 | 9.2% |
| Not-for-profit Organizations | 199 | 5.0% |
| Local Government Employees | 46 | 1.1% |
| State Government Employees | 6 | 0.2% |
| Federal Government Employees | 57 | 1.4% |
| Unpaid Family Workers | 0 | 0.0% |
| Total | 4,018 | 100.0% |
Employment Status by Age in Miramar Beach
According to the labor force statistics for Miramar Beach, out of the total population over 16 years of age (8,332), 52.9% or 4,408 individuals are in the labor force, with 9.0% or 397 of them unemployed. The age group with the highest labor force participation rate is 25 to 29 years, with 97.8% or 488 individuals in the labor force. Within the labor force, the 16 to 19 years age range has the highest percentage of unemployed individuals, with 78.3% or 108 of them being unemployed.
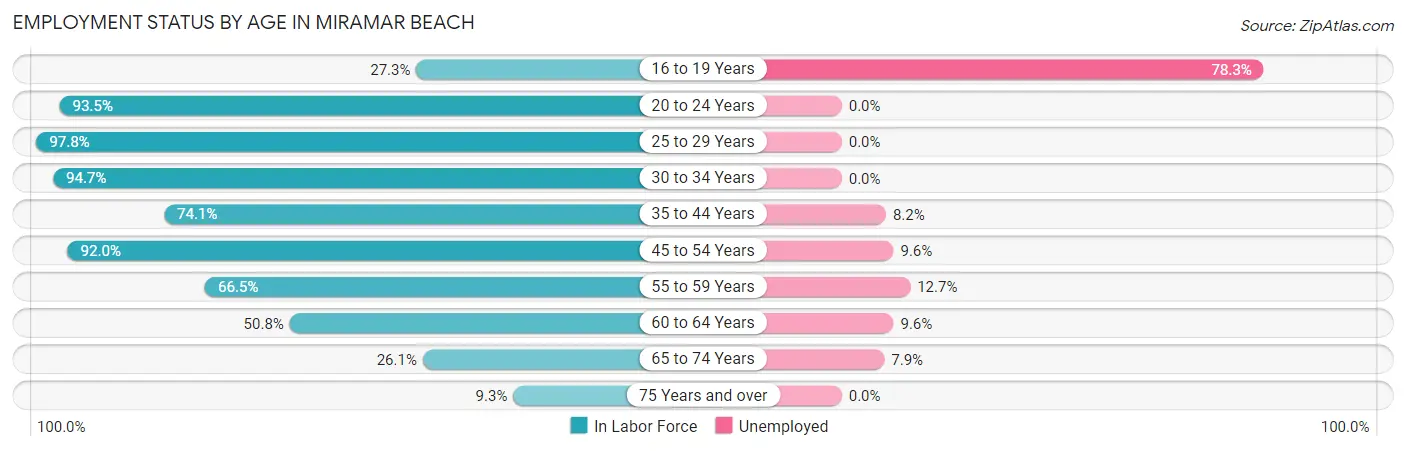
| Age Bracket | In Labor Force | Unemployed |
| 16 to 19 Years | 138 (27.3%) | 108 (78.3%) |
| 20 to 24 Years | 330 (93.5%) | 0 (0.0%) |
| 25 to 29 Years | 488 (97.8%) | 0 (0.0%) |
| 30 to 34 Years | 397 (94.7%) | 0 (0.0%) |
| 35 to 44 Years | 550 (74.1%) | 45 (8.2%) |
| 45 to 54 Years | 904 (92.0%) | 87 (9.6%) |
| 55 to 59 Years | 574 (66.5%) | 73 (12.7%) |
| 60 to 64 Years | 447 (50.8%) | 43 (9.6%) |
| 65 to 74 Years | 458 (26.1%) | 36 (7.9%) |
| 75 Years and over | 124 (9.3%) | 0 (0.0%) |
| Total | 4,408 (52.9%) | 397 (9.0%) |
Employment Status by Educational Attainment in Miramar Beach
According to labor force statistics for Miramar Beach, 76.6% of individuals (3,360) out of the total population between 25 and 64 years of age (4,386) are in the labor force, with 7.5% or 252 of them being unemployed. The group with the highest labor force participation rate are those with the educational attainment of bachelor's degree or higher, with 81.1% or 2,089 individuals in the labor force. Within the labor force, individuals with bachelor's degree or higher education have the highest percentage of unemployment, with 9.2% or 192 of them being unemployed.
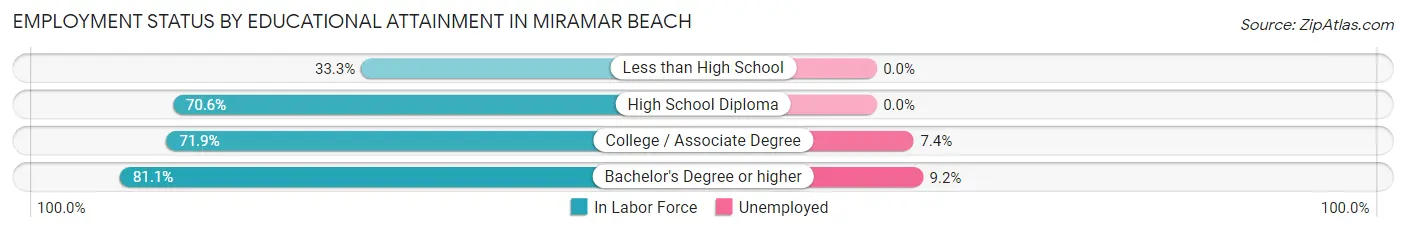
| Educational Attainment | In Labor Force | Unemployed |
| Less than High School | 18 (33.3%) | 0 (0.0%) |
| High School Diploma | 432 (70.6%) | 0 (0.0%) |
| College / Associate Degree | 823 (71.9%) | 85 (7.4%) |
| Bachelor's Degree or higher | 2,089 (81.1%) | 237 (9.2%) |
| Total | 3,360 (76.6%) | 329 (7.5%) |
Employment Occupations by Sex in Miramar Beach
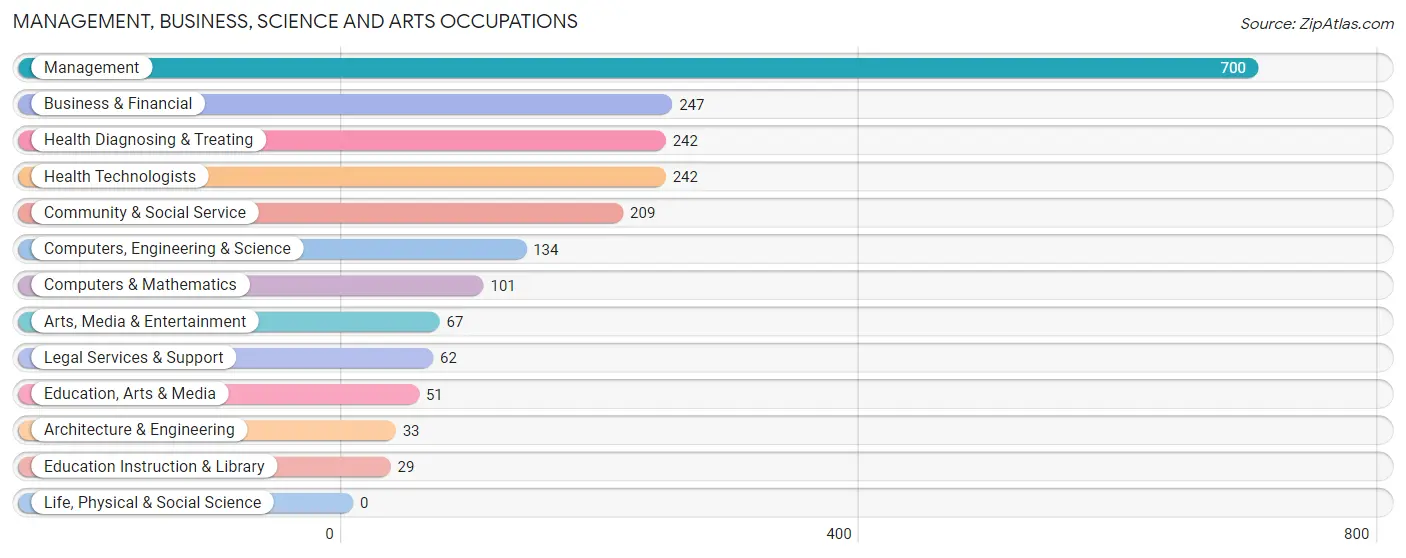
Management, Business, Science and Arts Occupations
The most common Management, Business, Science and Arts occupations in Miramar Beach are Management (700 | 17.7%), Business & Financial (247 | 6.2%), Health Diagnosing & Treating (242 | 6.1%), Health Technologists (242 | 6.1%), and Community & Social Service (209 | 5.3%).
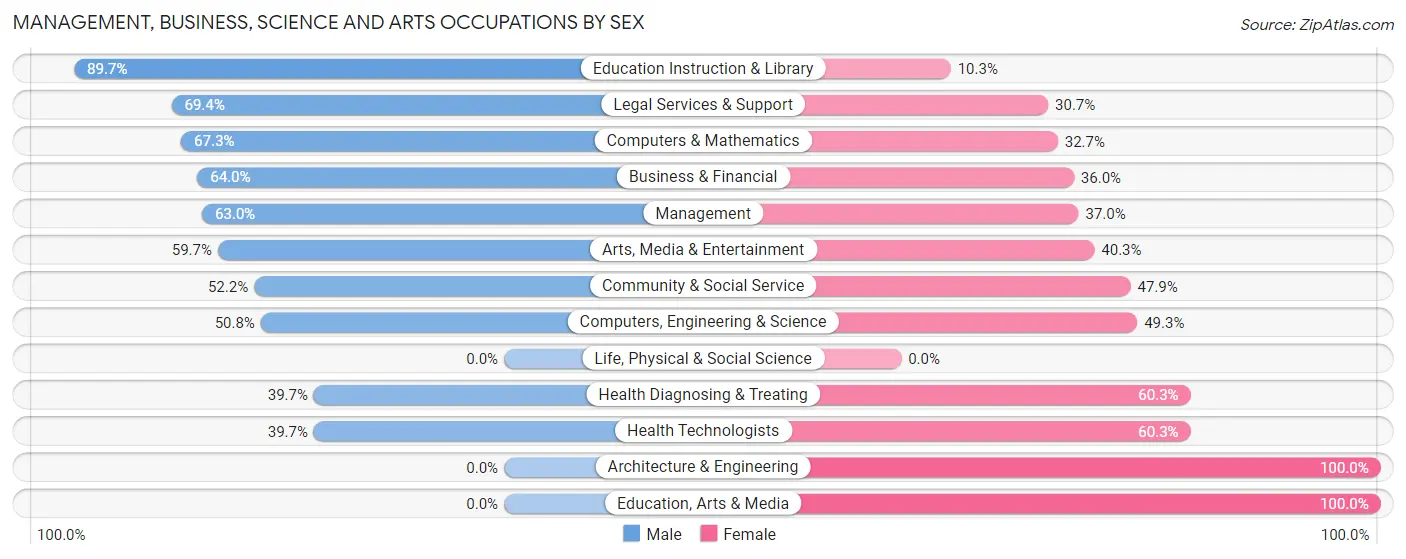
Management, Business, Science and Arts Occupations by Sex
Within the Management, Business, Science and Arts occupations in Miramar Beach, the most male-oriented occupations are Education Instruction & Library (89.7%), Legal Services & Support (69.4%), and Computers & Mathematics (67.3%), while the most female-oriented occupations are Architecture & Engineering (100.0%), Education, Arts & Media (100.0%), and Health Diagnosing & Treating (60.3%).
| Occupation | Male | Female |
| Management | 441 (63.0%) | 259 (37.0%) |
| Business & Financial | 158 (64.0%) | 89 (36.0%) |
| Computers, Engineering & Science | 68 (50.7%) | 66 (49.2%) |
| Computers & Mathematics | 68 (67.3%) | 33 (32.7%) |
| Architecture & Engineering | 0 (0.0%) | 33 (100.0%) |
| Life, Physical & Social Science | 0 (0.0%) | 0 (0.0%) |
| Community & Social Service | 109 (52.1%) | 100 (47.8%) |
| Education, Arts & Media | 0 (0.0%) | 51 (100.0%) |
| Legal Services & Support | 43 (69.4%) | 19 (30.6%) |
| Education Instruction & Library | 26 (89.7%) | 3 (10.3%) |
| Arts, Media & Entertainment | 40 (59.7%) | 27 (40.3%) |
| Health Diagnosing & Treating | 96 (39.7%) | 146 (60.3%) |
| Health Technologists | 96 (39.7%) | 146 (60.3%) |
| Total (Category) | 872 (56.9%) | 660 (43.1%) |
| Total (Overall) | 2,047 (51.7%) | 1,914 (48.3%) |
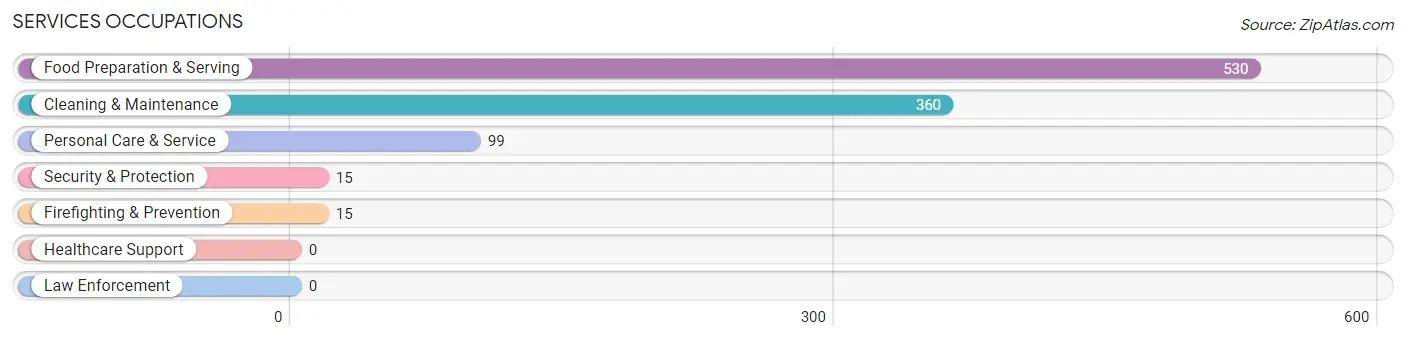
Services Occupations
The most common Services occupations in Miramar Beach are Food Preparation & Serving (530 | 13.4%), Cleaning & Maintenance (360 | 9.1%), Personal Care & Service (99 | 2.5%), Security & Protection (15 | 0.4%), and Firefighting & Prevention (15 | 0.4%).
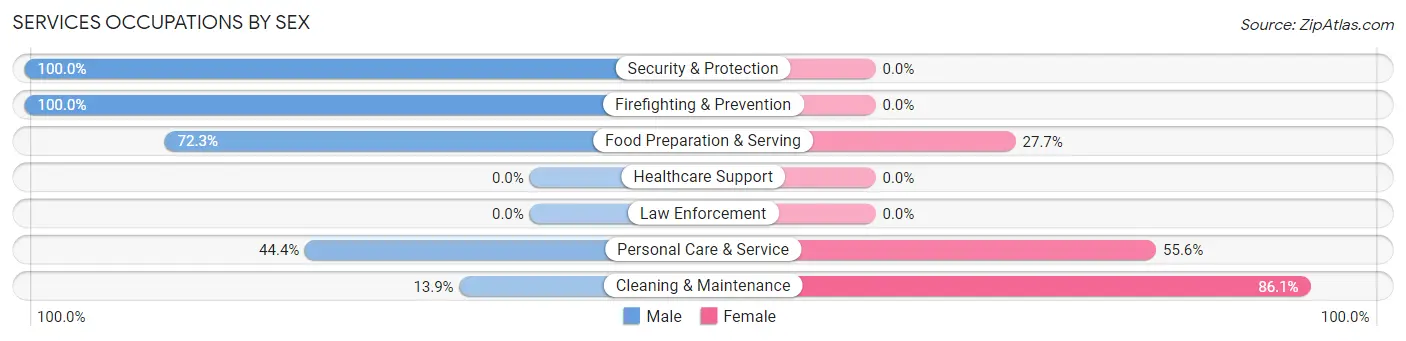
Services Occupations by Sex
Within the Services occupations in Miramar Beach, the most male-oriented occupations are Security & Protection (100.0%), Firefighting & Prevention (100.0%), and Food Preparation & Serving (72.3%), while the most female-oriented occupations are Cleaning & Maintenance (86.1%), Personal Care & Service (55.6%), and Food Preparation & Serving (27.7%).
| Occupation | Male | Female |
| Healthcare Support | 0 (0.0%) | 0 (0.0%) |
| Security & Protection | 15 (100.0%) | 0 (0.0%) |
| Firefighting & Prevention | 15 (100.0%) | 0 (0.0%) |
| Law Enforcement | 0 (0.0%) | 0 (0.0%) |
| Food Preparation & Serving | 383 (72.3%) | 147 (27.7%) |
| Cleaning & Maintenance | 50 (13.9%) | 310 (86.1%) |
| Personal Care & Service | 44 (44.4%) | 55 (55.6%) |
| Total (Category) | 492 (49.0%) | 512 (51.0%) |
| Total (Overall) | 2,047 (51.7%) | 1,914 (48.3%) |
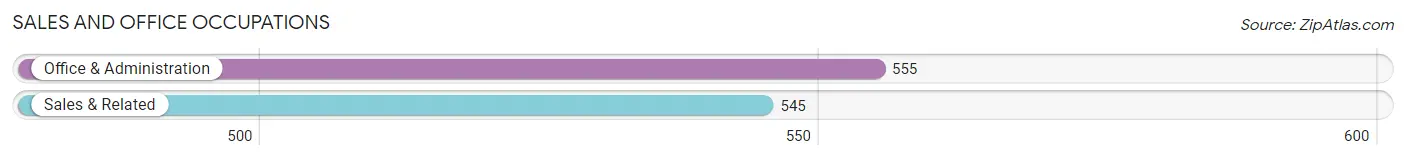
Sales and Office Occupations
The most common Sales and Office occupations in Miramar Beach are Office & Administration (555 | 14.0%), and Sales & Related (545 | 13.8%).
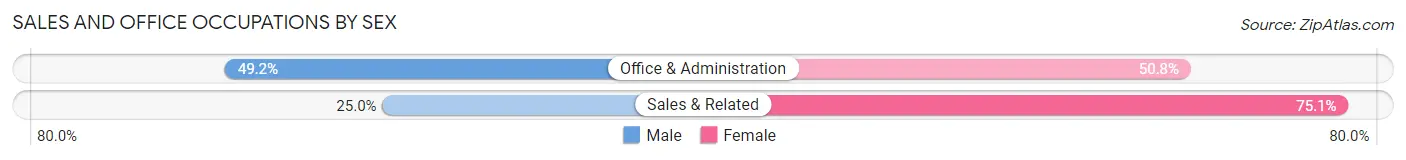
Sales and Office Occupations by Sex
| Occupation | Male | Female |
| Sales & Related | 136 (24.9%) | 409 (75.0%) |
| Office & Administration | 273 (49.2%) | 282 (50.8%) |
| Total (Category) | 409 (37.2%) | 691 (62.8%) |
| Total (Overall) | 2,047 (51.7%) | 1,914 (48.3%) |
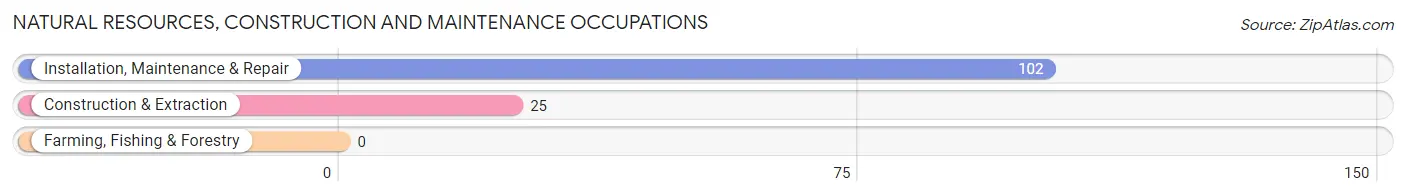
Natural Resources, Construction and Maintenance Occupations
The most common Natural Resources, Construction and Maintenance occupations in Miramar Beach are Installation, Maintenance & Repair (102 | 2.6%), and Construction & Extraction (25 | 0.6%).
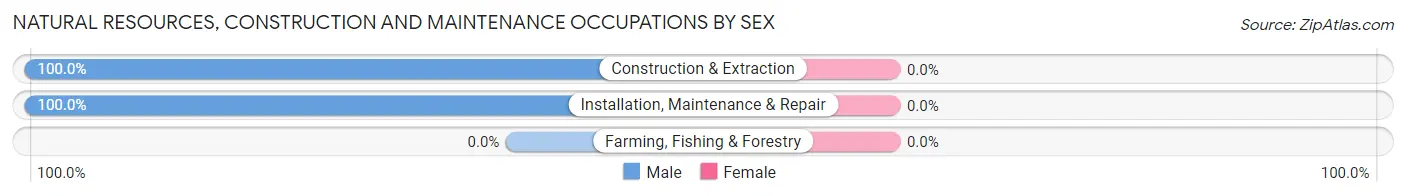
Natural Resources, Construction and Maintenance Occupations by Sex
| Occupation | Male | Female |
| Farming, Fishing & Forestry | 0 (0.0%) | 0 (0.0%) |
| Construction & Extraction | 25 (100.0%) | 0 (0.0%) |
| Installation, Maintenance & Repair | 102 (100.0%) | 0 (0.0%) |
| Total (Category) | 127 (100.0%) | 0 (0.0%) |
| Total (Overall) | 2,047 (51.7%) | 1,914 (48.3%) |
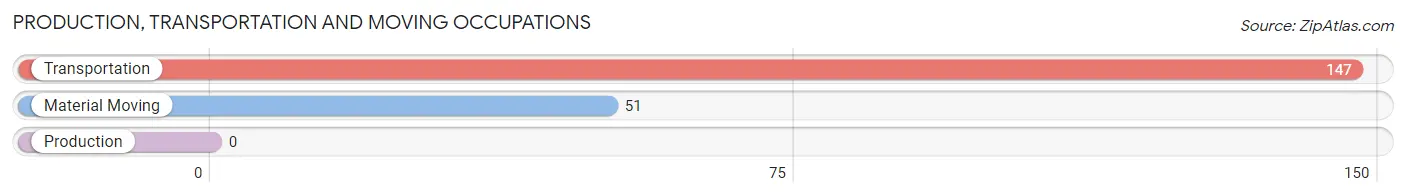
Production, Transportation and Moving Occupations
The most common Production, Transportation and Moving occupations in Miramar Beach are Transportation (147 | 3.7%), and Material Moving (51 | 1.3%).
Production, Transportation and Moving Occupations by Sex
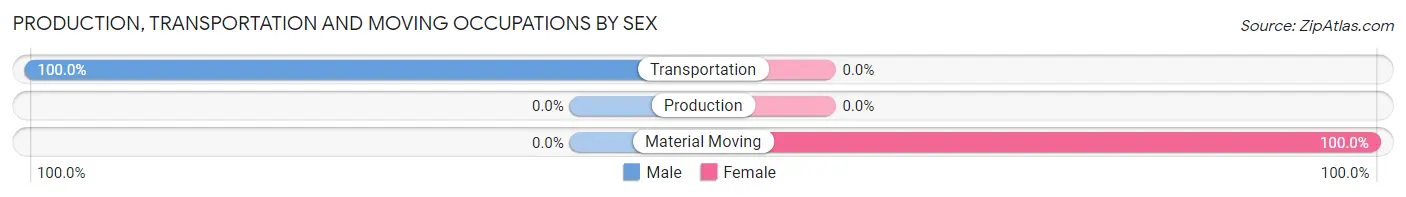
| Occupation | Male | Female |
| Production | 0 (0.0%) | 0 (0.0%) |
| Transportation | 147 (100.0%) | 0 (0.0%) |
| Material Moving | 0 (0.0%) | 51 (100.0%) |
| Total (Category) | 147 (74.2%) | 51 (25.8%) |
| Total (Overall) | 2,047 (51.7%) | 1,914 (48.3%) |
Employment Industries by Sex in Miramar Beach
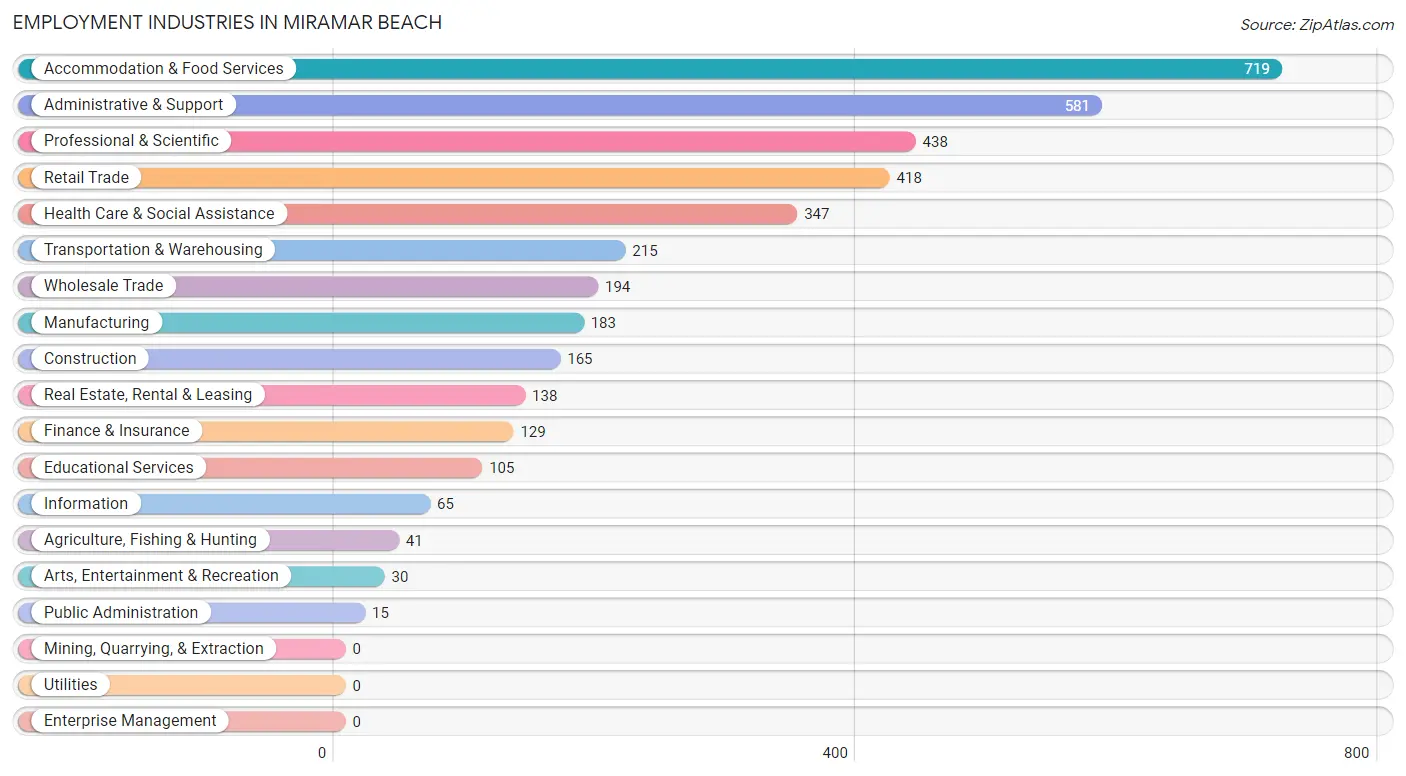
Employment Industries in Miramar Beach
The major employment industries in Miramar Beach include Accommodation & Food Services (719 | 18.1%), Administrative & Support (581 | 14.7%), Professional & Scientific (438 | 11.1%), Retail Trade (418 | 10.5%), and Health Care & Social Assistance (347 | 8.8%).
Employment Industries by Sex in Miramar Beach
The Miramar Beach industries that see more men than women are Agriculture, Fishing & Hunting (100.0%), Manufacturing (100.0%), and Public Administration (100.0%), whereas the industries that tend to have a higher number of women are Wholesale Trade (100.0%), Information (95.4%), and Administrative & Support (76.9%).
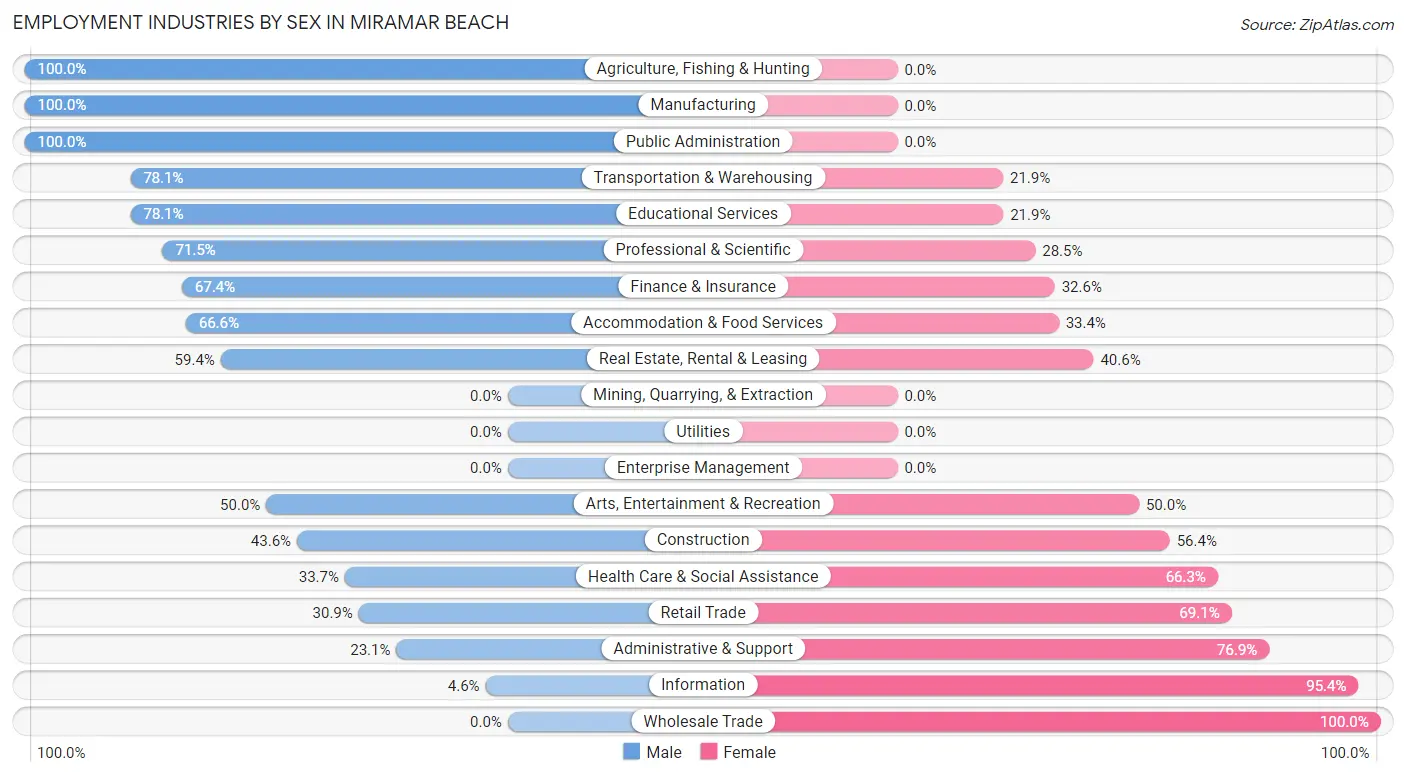
| Industry | Male | Female |
| Agriculture, Fishing & Hunting | 41 (100.0%) | 0 (0.0%) |
| Mining, Quarrying, & Extraction | 0 (0.0%) | 0 (0.0%) |
| Construction | 72 (43.6%) | 93 (56.4%) |
| Manufacturing | 183 (100.0%) | 0 (0.0%) |
| Wholesale Trade | 0 (0.0%) | 194 (100.0%) |
| Retail Trade | 129 (30.9%) | 289 (69.1%) |
| Transportation & Warehousing | 168 (78.1%) | 47 (21.9%) |
| Utilities | 0 (0.0%) | 0 (0.0%) |
| Information | 3 (4.6%) | 62 (95.4%) |
| Finance & Insurance | 87 (67.4%) | 42 (32.6%) |
| Real Estate, Rental & Leasing | 82 (59.4%) | 56 (40.6%) |
| Professional & Scientific | 313 (71.5%) | 125 (28.5%) |
| Enterprise Management | 0 (0.0%) | 0 (0.0%) |
| Administrative & Support | 134 (23.1%) | 447 (76.9%) |
| Educational Services | 82 (78.1%) | 23 (21.9%) |
| Health Care & Social Assistance | 117 (33.7%) | 230 (66.3%) |
| Arts, Entertainment & Recreation | 15 (50.0%) | 15 (50.0%) |
| Accommodation & Food Services | 479 (66.6%) | 240 (33.4%) |
| Public Administration | 15 (100.0%) | 0 (0.0%) |
| Total | 2,047 (51.7%) | 1,914 (48.3%) |
Education in Miramar Beach
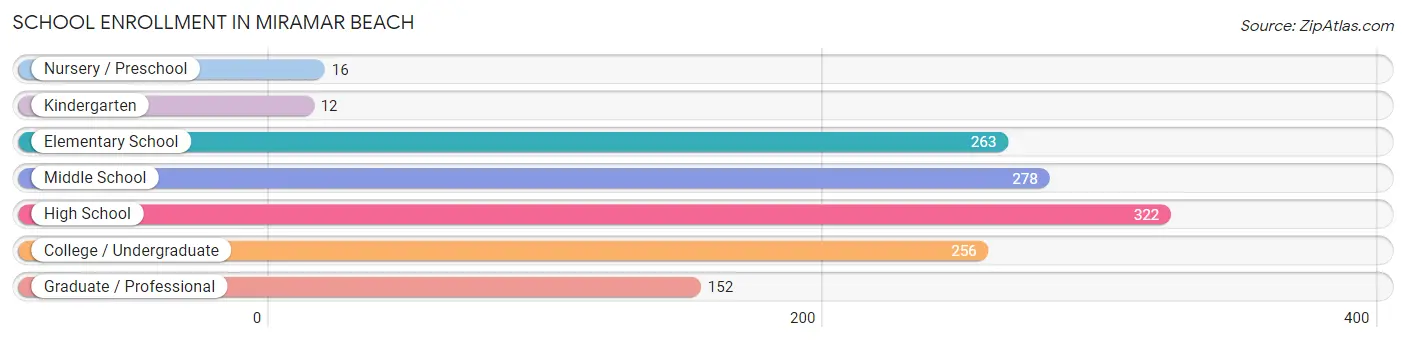
School Enrollment in Miramar Beach
The most common levels of schooling among the 1,299 students in Miramar Beach are high school (322 | 24.8%), middle school (278 | 21.4%), and elementary school (263 | 20.3%).
| School Level | # Students | % Students |
| Nursery / Preschool | 16 | 1.2% |
| Kindergarten | 12 | 0.9% |
| Elementary School | 263 | 20.3% |
| Middle School | 278 | 21.4% |
| High School | 322 | 24.8% |
| College / Undergraduate | 256 | 19.7% |
| Graduate / Professional | 152 | 11.7% |
| Total | 1,299 | 100.0% |
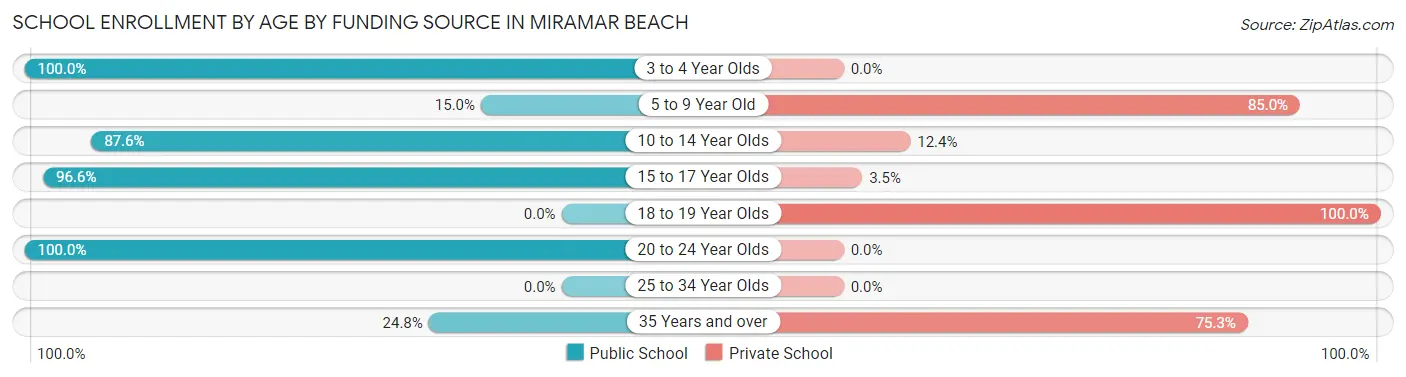
School Enrollment by Age by Funding Source in Miramar Beach
Out of a total of 1,299 students who are enrolled in schools in Miramar Beach, 446 (34.3%) attend a private institution, while the remaining 853 (65.7%) are enrolled in public schools. The age group of 18 to 19 year olds has the highest likelihood of being enrolled in private schools, with 108 (100.0% in the age bracket) enrolled. Conversely, the age group of 3 to 4 year olds has the lowest likelihood of being enrolled in a private school, with 16 (100.0% in the age bracket) attending a public institution.
| Age Bracket | Public School | Private School |
| 3 to 4 Year Olds | 16 (100.0%) | 0 (0.0%) |
| 5 to 9 Year Old | 38 (15.0%) | 215 (85.0%) |
| 10 to 14 Year Olds | 240 (87.6%) | 34 (12.4%) |
| 15 to 17 Year Olds | 336 (96.6%) | 12 (3.5%) |
| 18 to 19 Year Olds | 0 (0.0%) | 108 (100.0%) |
| 20 to 24 Year Olds | 199 (100.0%) | 0 (0.0%) |
| 25 to 34 Year Olds | 0 (0.0%) | 0 (0.0%) |
| 35 Years and over | 25 (24.7%) | 76 (75.2%) |
| Total | 853 (65.7%) | 446 (34.3%) |
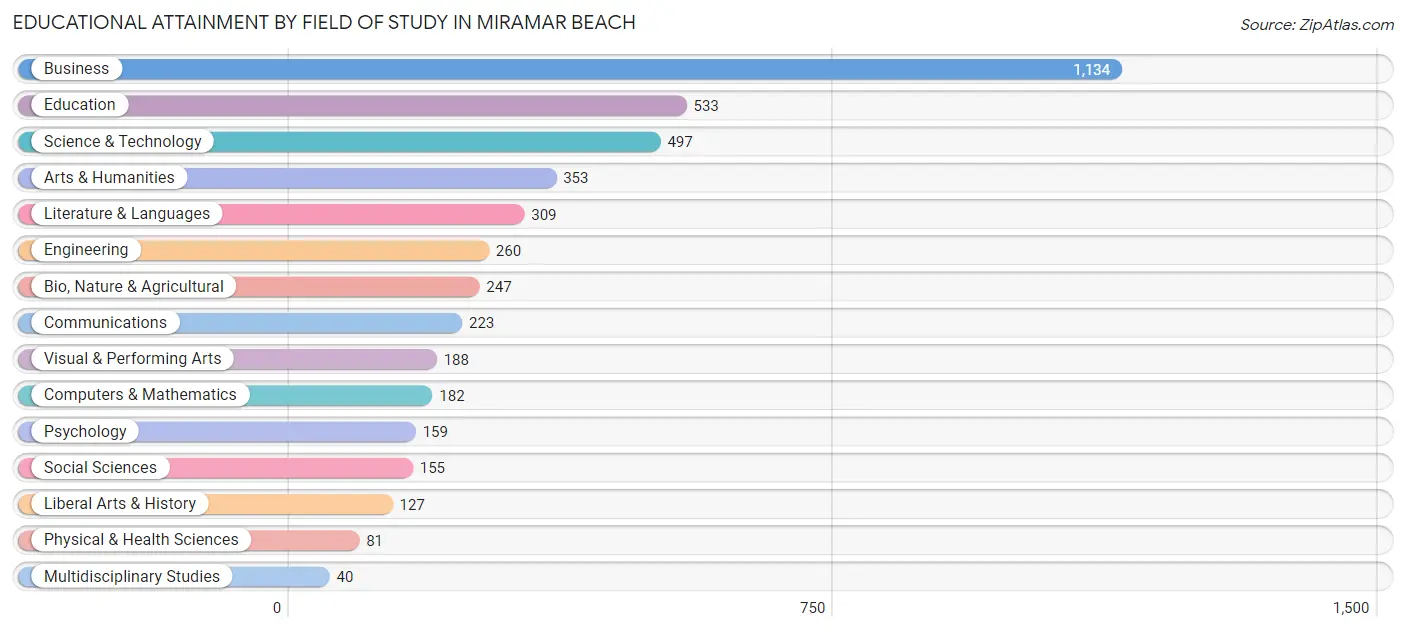
Educational Attainment by Field of Study in Miramar Beach
Business (1,134 | 25.3%), education (533 | 11.9%), science & technology (497 | 11.1%), arts & humanities (353 | 7.9%), and literature & languages (309 | 6.9%) are the most common fields of study among 4,488 individuals in Miramar Beach who have obtained a bachelor's degree or higher.
| Field of Study | # Graduates | % Graduates |
| Computers & Mathematics | 182 | 4.1% |
| Bio, Nature & Agricultural | 247 | 5.5% |
| Physical & Health Sciences | 81 | 1.8% |
| Psychology | 159 | 3.5% |
| Social Sciences | 155 | 3.5% |
| Engineering | 260 | 5.8% |
| Multidisciplinary Studies | 40 | 0.9% |
| Science & Technology | 497 | 11.1% |
| Business | 1,134 | 25.3% |
| Education | 533 | 11.9% |
| Literature & Languages | 309 | 6.9% |
| Liberal Arts & History | 127 | 2.8% |
| Visual & Performing Arts | 188 | 4.2% |
| Communications | 223 | 5.0% |
| Arts & Humanities | 353 | 7.9% |
| Total | 4,488 | 100.0% |
Transportation & Commute in Miramar Beach
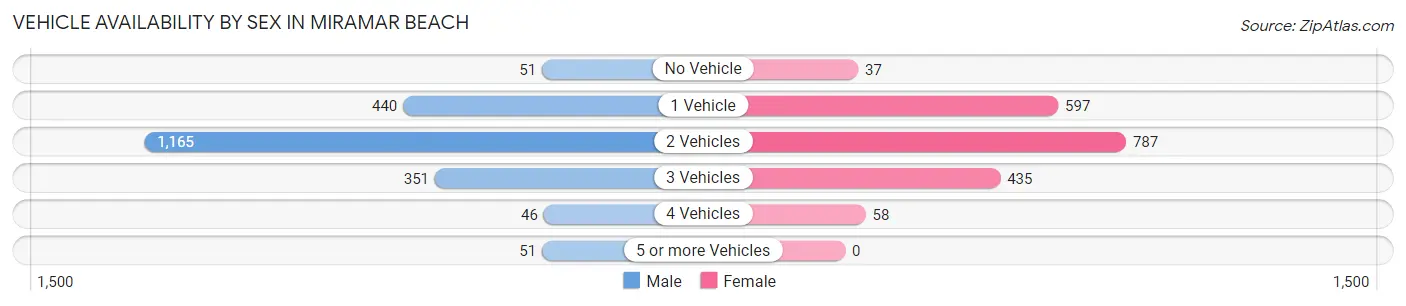
Vehicle Availability by Sex in Miramar Beach
The most prevalent vehicle ownership categories in Miramar Beach are males with 2 vehicles (1,165, accounting for 55.4%) and females with 2 vehicles (787, making up 60.9%).
| Vehicles Available | Male | Female |
| No Vehicle | 51 (2.4%) | 37 (1.9%) |
| 1 Vehicle | 440 (20.9%) | 597 (31.2%) |
| 2 Vehicles | 1,165 (55.4%) | 787 (41.1%) |
| 3 Vehicles | 351 (16.7%) | 435 (22.7%) |
| 4 Vehicles | 46 (2.2%) | 58 (3.0%) |
| 5 or more Vehicles | 51 (2.4%) | 0 (0.0%) |
| Total | 2,104 (100.0%) | 1,914 (100.0%) |
Commute Time in Miramar Beach
The most frequently occuring commute durations in Miramar Beach are 10 to 14 minutes (817 commuters, 26.1%), 15 to 19 minutes (565 commuters, 18.1%), and 45 to 59 minutes (395 commuters, 12.6%).
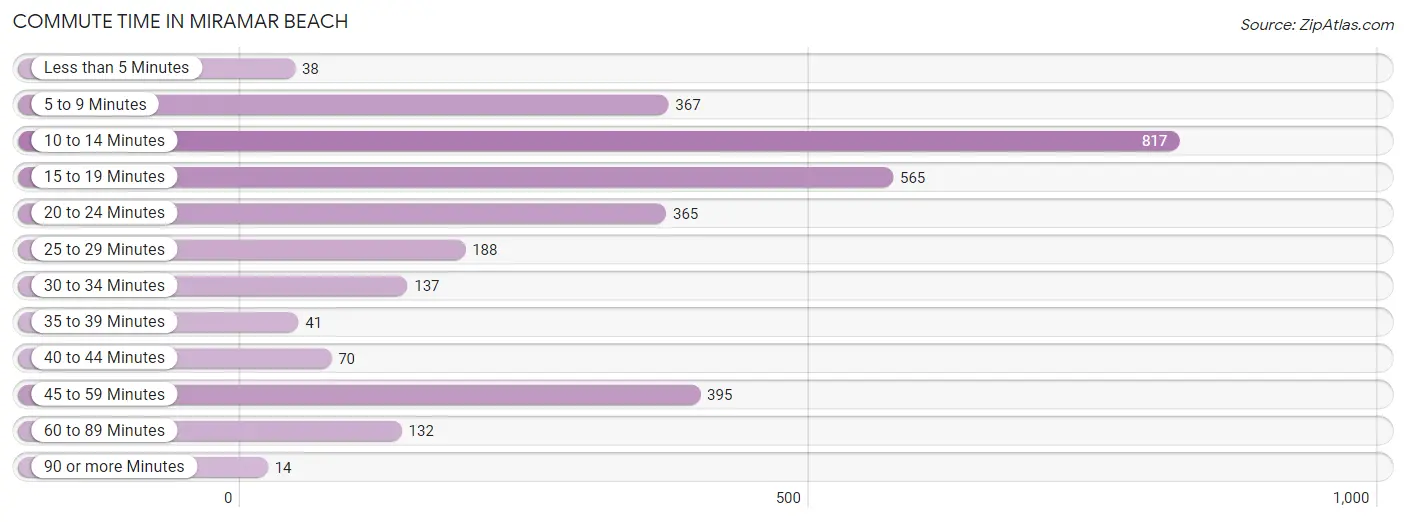
| Commute Time | # Commuters | % Commuters |
| Less than 5 Minutes | 38 | 1.2% |
| 5 to 9 Minutes | 367 | 11.7% |
| 10 to 14 Minutes | 817 | 26.1% |
| 15 to 19 Minutes | 565 | 18.1% |
| 20 to 24 Minutes | 365 | 11.7% |
| 25 to 29 Minutes | 188 | 6.0% |
| 30 to 34 Minutes | 137 | 4.4% |
| 35 to 39 Minutes | 41 | 1.3% |
| 40 to 44 Minutes | 70 | 2.2% |
| 45 to 59 Minutes | 395 | 12.6% |
| 60 to 89 Minutes | 132 | 4.2% |
| 90 or more Minutes | 14 | 0.4% |
Commute Time by Sex in Miramar Beach
The most common commute times in Miramar Beach are 10 to 14 minutes (456 commuters, 27.1%) for males and 10 to 14 minutes (361 commuters, 24.9%) for females.
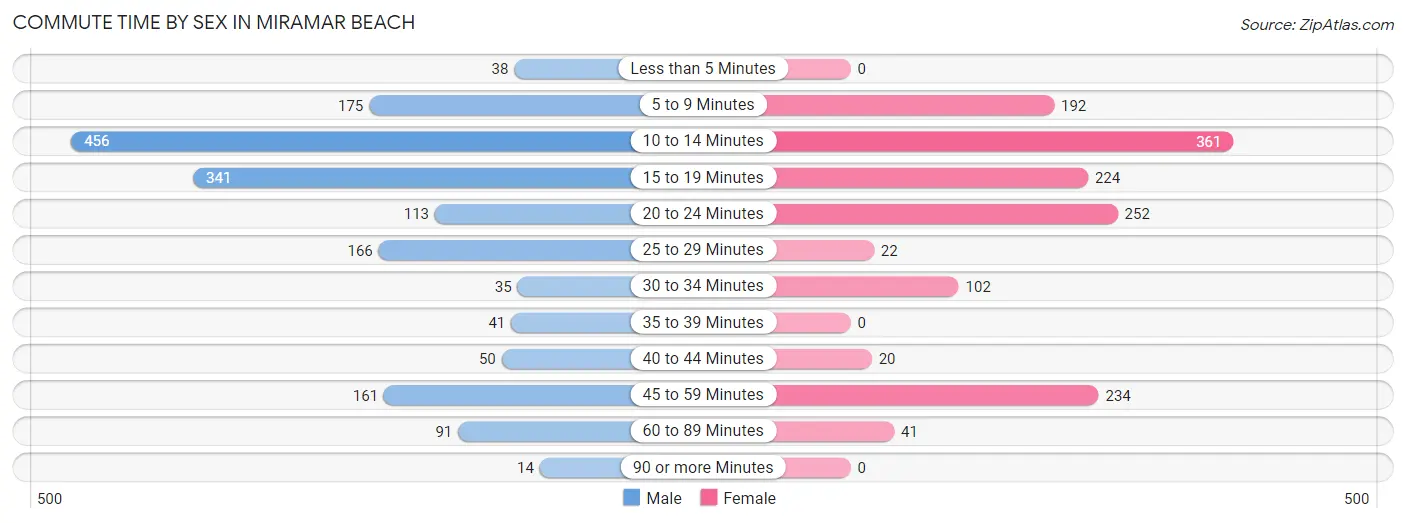
| Commute Time | Male | Female |
| Less than 5 Minutes | 38 (2.3%) | 0 (0.0%) |
| 5 to 9 Minutes | 175 (10.4%) | 192 (13.3%) |
| 10 to 14 Minutes | 456 (27.1%) | 361 (24.9%) |
| 15 to 19 Minutes | 341 (20.3%) | 224 (15.5%) |
| 20 to 24 Minutes | 113 (6.7%) | 252 (17.4%) |
| 25 to 29 Minutes | 166 (9.9%) | 22 (1.5%) |
| 30 to 34 Minutes | 35 (2.1%) | 102 (7.0%) |
| 35 to 39 Minutes | 41 (2.4%) | 0 (0.0%) |
| 40 to 44 Minutes | 50 (3.0%) | 20 (1.4%) |
| 45 to 59 Minutes | 161 (9.6%) | 234 (16.2%) |
| 60 to 89 Minutes | 91 (5.4%) | 41 (2.8%) |
| 90 or more Minutes | 14 (0.8%) | 0 (0.0%) |
Time of Departure to Work by Sex in Miramar Beach
The most frequent times of departure to work in Miramar Beach are 9:00 AM to 9:59 AM (287, 17.1%) for males and 7:00 AM to 7:29 AM (277, 19.1%) for females.
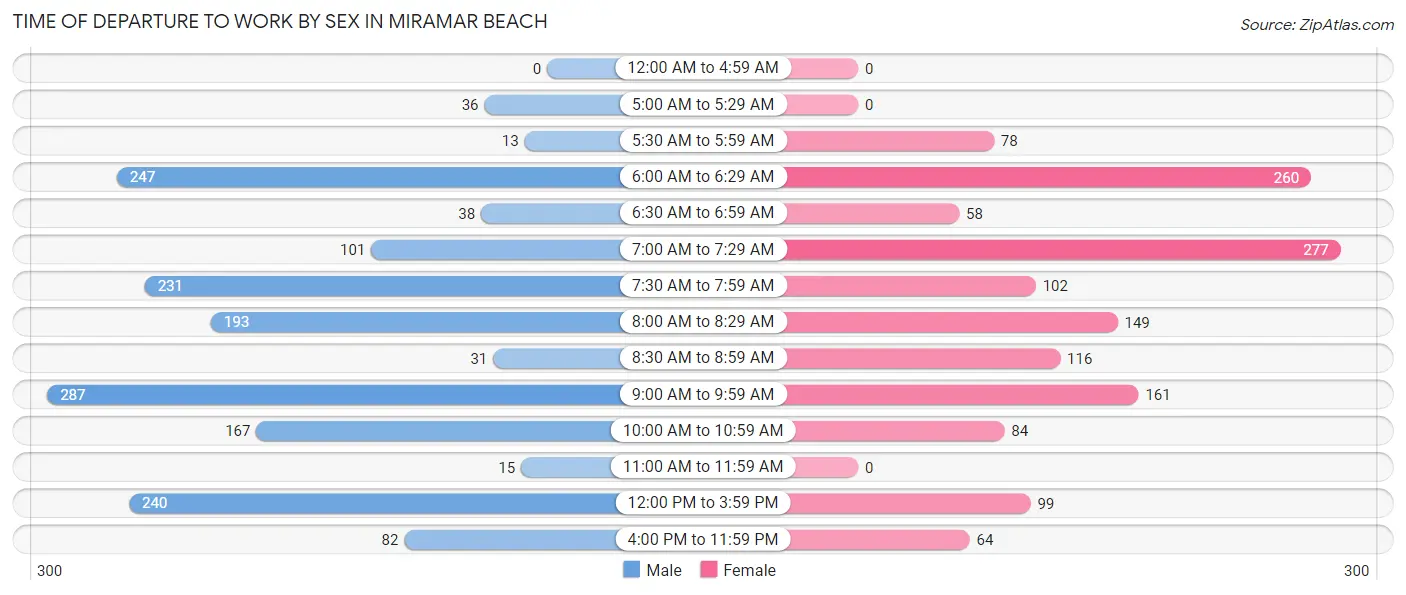
| Time of Departure | Male | Female |
| 12:00 AM to 4:59 AM | 0 (0.0%) | 0 (0.0%) |
| 5:00 AM to 5:29 AM | 36 (2.1%) | 0 (0.0%) |
| 5:30 AM to 5:59 AM | 13 (0.8%) | 78 (5.4%) |
| 6:00 AM to 6:29 AM | 247 (14.7%) | 260 (18.0%) |
| 6:30 AM to 6:59 AM | 38 (2.3%) | 58 (4.0%) |
| 7:00 AM to 7:29 AM | 101 (6.0%) | 277 (19.1%) |
| 7:30 AM to 7:59 AM | 231 (13.7%) | 102 (7.0%) |
| 8:00 AM to 8:29 AM | 193 (11.5%) | 149 (10.3%) |
| 8:30 AM to 8:59 AM | 31 (1.8%) | 116 (8.0%) |
| 9:00 AM to 9:59 AM | 287 (17.1%) | 161 (11.1%) |
| 10:00 AM to 10:59 AM | 167 (9.9%) | 84 (5.8%) |
| 11:00 AM to 11:59 AM | 15 (0.9%) | 0 (0.0%) |
| 12:00 PM to 3:59 PM | 240 (14.3%) | 99 (6.8%) |
| 4:00 PM to 11:59 PM | 82 (4.9%) | 64 (4.4%) |
| Total | 1,681 (100.0%) | 1,448 (100.0%) |
Housing Occupancy in Miramar Beach
Occupancy by Ownership in Miramar Beach
Of the total 4,302 dwellings in Miramar Beach, owner-occupied units account for 3,132 (72.8%), while renter-occupied units make up 1,170 (27.2%).
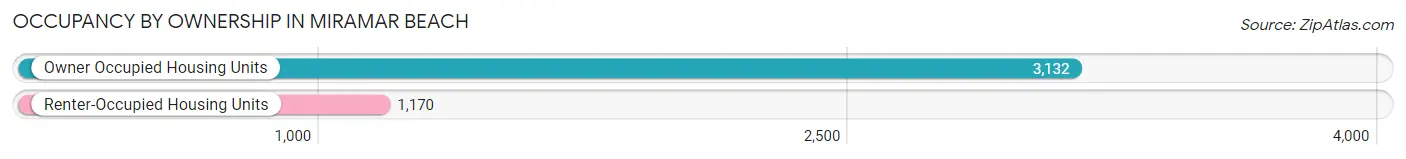
| Occupancy | # Housing Units | % Housing Units |
| Owner Occupied Housing Units | 3,132 | 72.8% |
| Renter-Occupied Housing Units | 1,170 | 27.2% |
| Total Occupied Housing Units | 4,302 | 100.0% |
Occupancy by Household Size in Miramar Beach
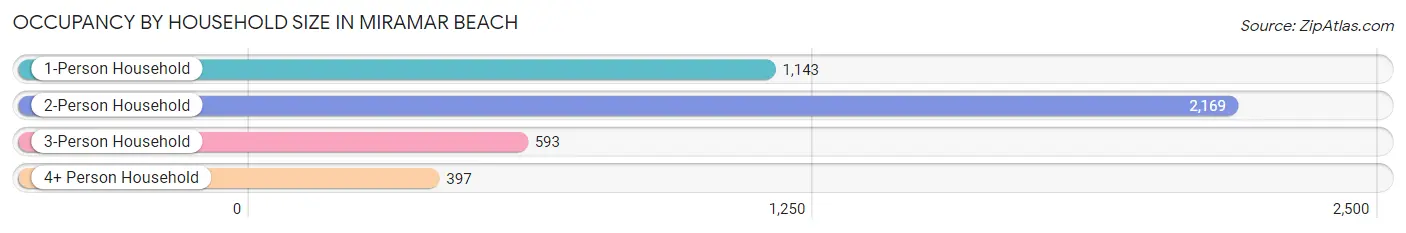
| Household Size | # Housing Units | % Housing Units |
| 1-Person Household | 1,143 | 26.6% |
| 2-Person Household | 2,169 | 50.4% |
| 3-Person Household | 593 | 13.8% |
| 4+ Person Household | 397 | 9.2% |
| Total Housing Units | 4,302 | 100.0% |
Occupancy by Ownership by Household Size in Miramar Beach
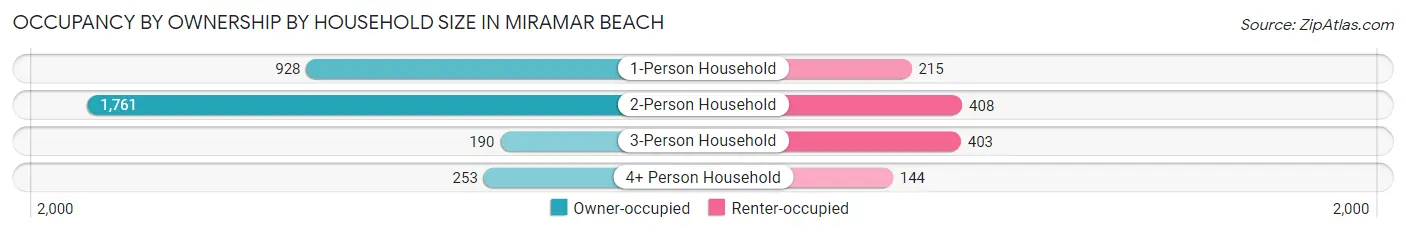
| Household Size | Owner-occupied | Renter-occupied |
| 1-Person Household | 928 (81.2%) | 215 (18.8%) |
| 2-Person Household | 1,761 (81.2%) | 408 (18.8%) |
| 3-Person Household | 190 (32.0%) | 403 (68.0%) |
| 4+ Person Household | 253 (63.7%) | 144 (36.3%) |
| Total Housing Units | 3,132 (72.8%) | 1,170 (27.2%) |
Occupancy by Educational Attainment in Miramar Beach
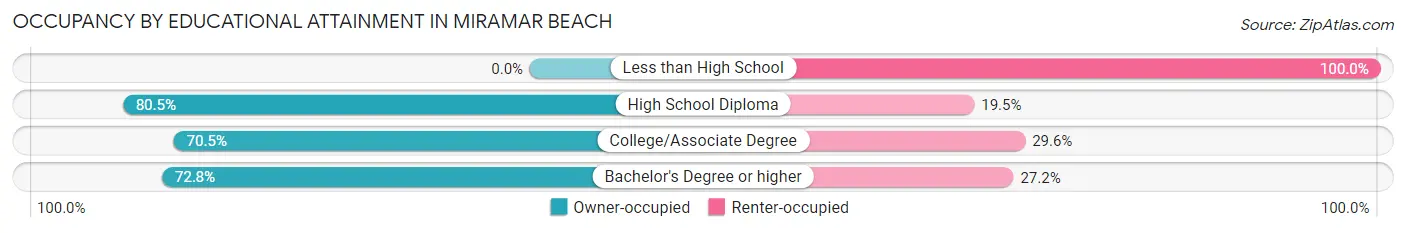
| Household Size | Owner-occupied | Renter-occupied |
| Less than High School | 0 (0.0%) | 37 (100.0%) |
| High School Diploma | 505 (80.5%) | 122 (19.5%) |
| College/Associate Degree | 627 (70.5%) | 263 (29.5%) |
| Bachelor's Degree or higher | 2,000 (72.8%) | 748 (27.2%) |
Occupancy by Age of Householder in Miramar Beach
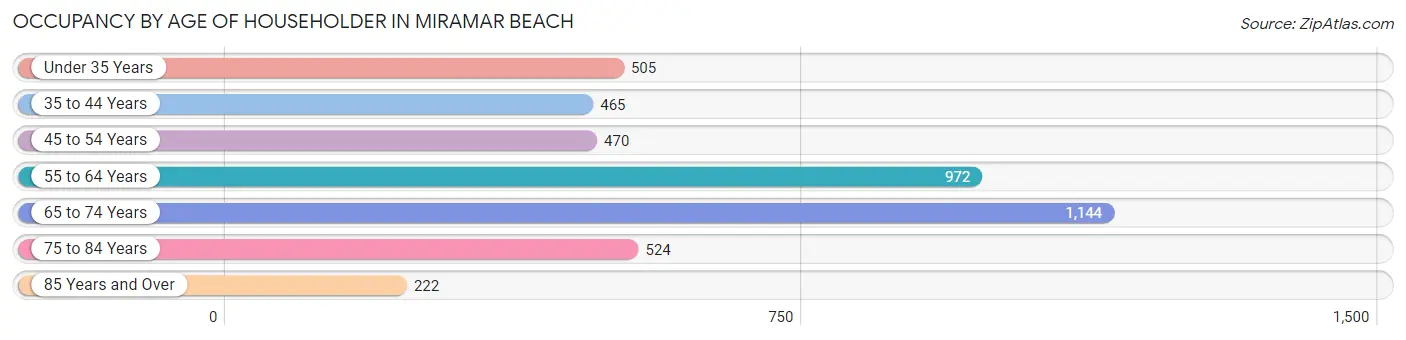
| Age Bracket | # Households | % Households |
| Under 35 Years | 505 | 11.7% |
| 35 to 44 Years | 465 | 10.8% |
| 45 to 54 Years | 470 | 10.9% |
| 55 to 64 Years | 972 | 22.6% |
| 65 to 74 Years | 1,144 | 26.6% |
| 75 to 84 Years | 524 | 12.2% |
| 85 Years and Over | 222 | 5.2% |
| Total | 4,302 | 100.0% |
Housing Finances in Miramar Beach
Median Income by Occupancy in Miramar Beach
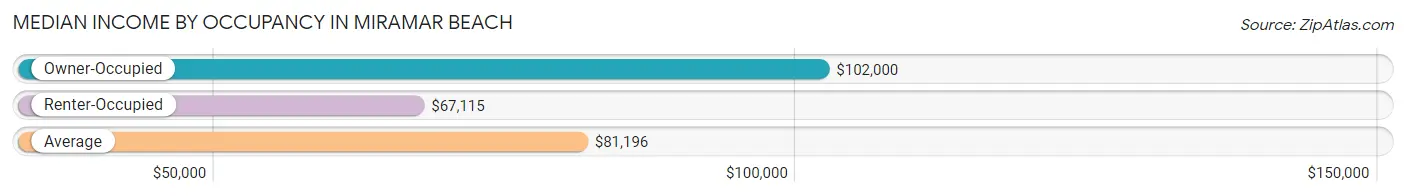
| Occupancy Type | # Households | Median Income |
| Owner-Occupied | 3,132 (72.8%) | $102,000 |
| Renter-Occupied | 1,170 (27.2%) | $67,115 |
| Average | 4,302 (100.0%) | $81,196 |
Occupancy by Householder Income Bracket in Miramar Beach
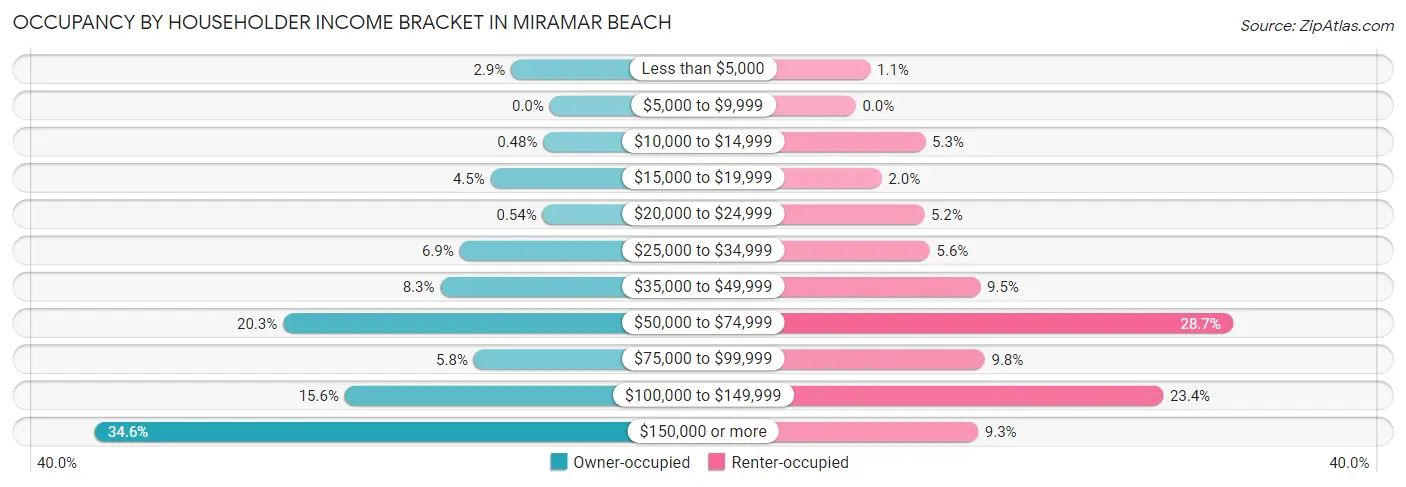
| Income Bracket | Owner-occupied | Renter-occupied |
| Less than $5,000 | 92 (2.9%) | 13 (1.1%) |
| $5,000 to $9,999 | 0 (0.0%) | 0 (0.0%) |
| $10,000 to $14,999 | 15 (0.5%) | 62 (5.3%) |
| $15,000 to $19,999 | 141 (4.5%) | 23 (2.0%) |
| $20,000 to $24,999 | 17 (0.5%) | 61 (5.2%) |
| $25,000 to $34,999 | 215 (6.9%) | 66 (5.6%) |
| $35,000 to $49,999 | 261 (8.3%) | 111 (9.5%) |
| $50,000 to $74,999 | 636 (20.3%) | 336 (28.7%) |
| $75,000 to $99,999 | 181 (5.8%) | 115 (9.8%) |
| $100,000 to $149,999 | 489 (15.6%) | 274 (23.4%) |
| $150,000 or more | 1,085 (34.6%) | 109 (9.3%) |
| Total | 3,132 (100.0%) | 1,170 (100.0%) |
Monthly Housing Cost Tiers in Miramar Beach
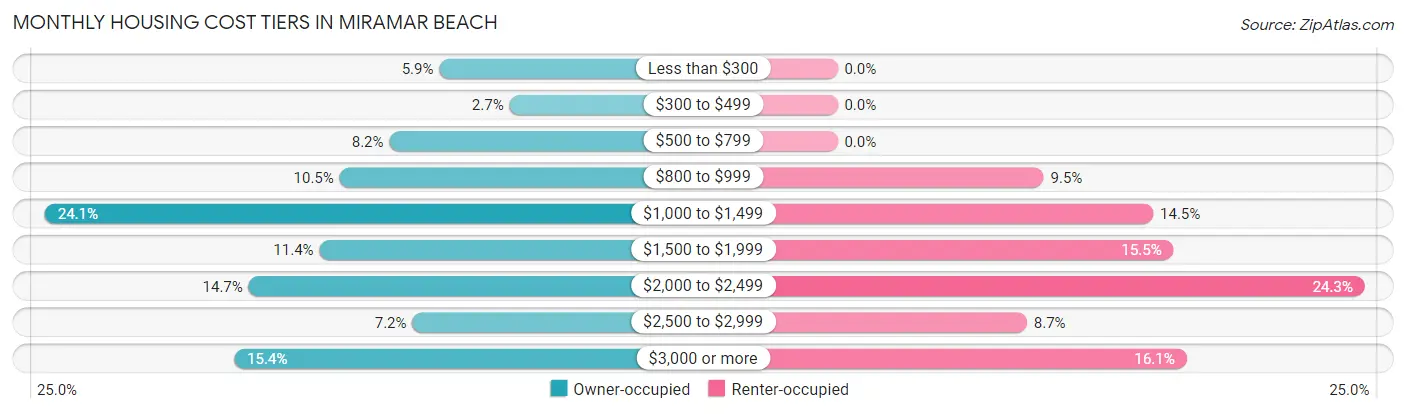
| Monthly Cost | Owner-occupied | Renter-occupied |
| Less than $300 | 185 (5.9%) | 0 (0.0%) |
| $300 to $499 | 84 (2.7%) | 0 (0.0%) |
| $500 to $799 | 257 (8.2%) | 0 (0.0%) |
| $800 to $999 | 329 (10.5%) | 111 (9.5%) |
| $1,000 to $1,499 | 754 (24.1%) | 170 (14.5%) |
| $1,500 to $1,999 | 358 (11.4%) | 181 (15.5%) |
| $2,000 to $2,499 | 460 (14.7%) | 284 (24.3%) |
| $2,500 to $2,999 | 224 (7.1%) | 102 (8.7%) |
| $3,000 or more | 481 (15.4%) | 188 (16.1%) |
| Total | 3,132 (100.0%) | 1,170 (100.0%) |
Physical Housing Characteristics in Miramar Beach
Housing Structures in Miramar Beach
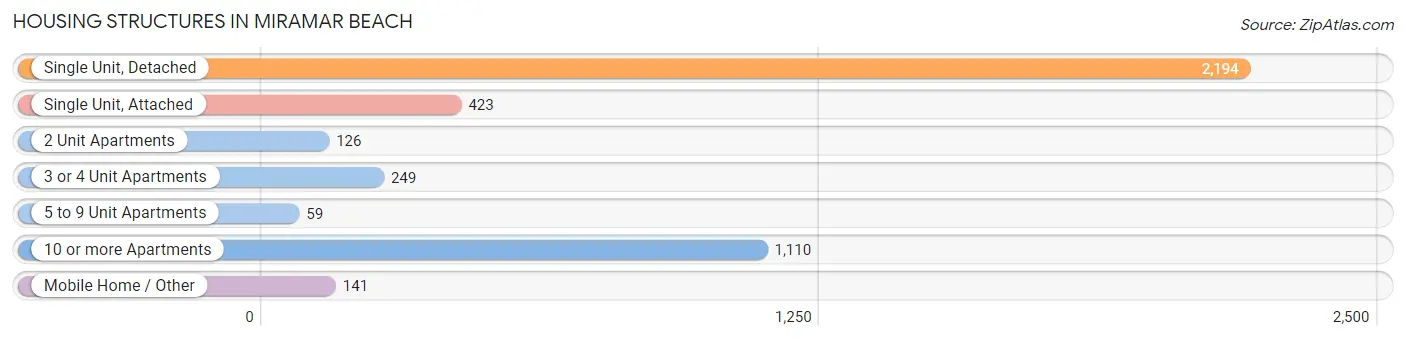
| Structure Type | # Housing Units | % Housing Units |
| Single Unit, Detached | 2,194 | 51.0% |
| Single Unit, Attached | 423 | 9.8% |
| 2 Unit Apartments | 126 | 2.9% |
| 3 or 4 Unit Apartments | 249 | 5.8% |
| 5 to 9 Unit Apartments | 59 | 1.4% |
| 10 or more Apartments | 1,110 | 25.8% |
| Mobile Home / Other | 141 | 3.3% |
| Total | 4,302 | 100.0% |
Housing Structures by Occupancy in Miramar Beach
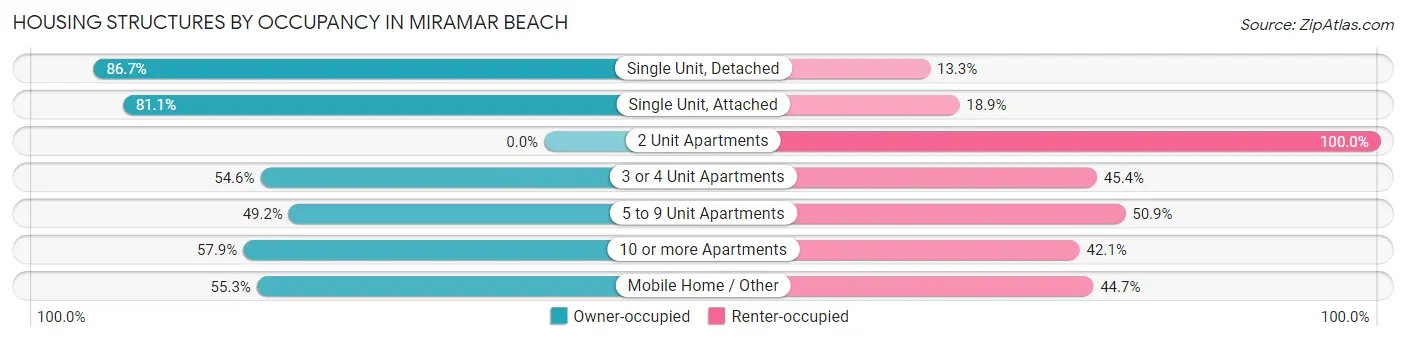
| Structure Type | Owner-occupied | Renter-occupied |
| Single Unit, Detached | 1,903 (86.7%) | 291 (13.3%) |
| Single Unit, Attached | 343 (81.1%) | 80 (18.9%) |
| 2 Unit Apartments | 0 (0.0%) | 126 (100.0%) |
| 3 or 4 Unit Apartments | 136 (54.6%) | 113 (45.4%) |
| 5 to 9 Unit Apartments | 29 (49.1%) | 30 (50.8%) |
| 10 or more Apartments | 643 (57.9%) | 467 (42.1%) |
| Mobile Home / Other | 78 (55.3%) | 63 (44.7%) |
| Total | 3,132 (72.8%) | 1,170 (27.2%) |
Housing Structures by Number of Rooms in Miramar Beach
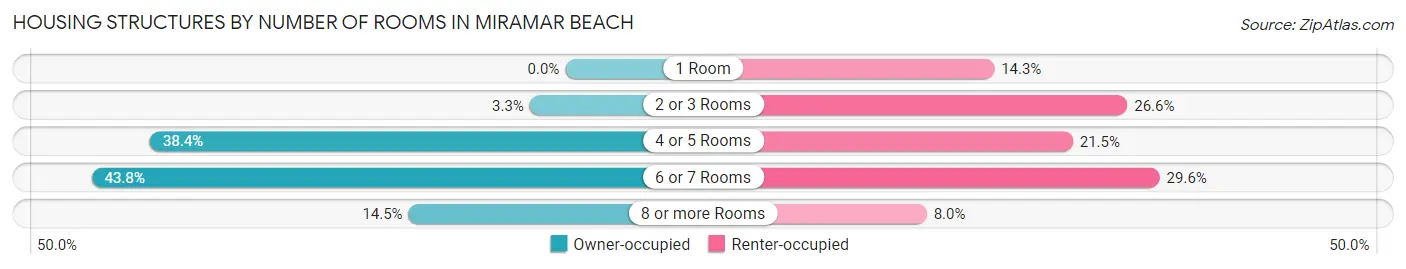
| Number of Rooms | Owner-occupied | Renter-occupied |
| 1 Room | 0 (0.0%) | 167 (14.3%) |
| 2 or 3 Rooms | 103 (3.3%) | 311 (26.6%) |
| 4 or 5 Rooms | 1,203 (38.4%) | 252 (21.5%) |
| 6 or 7 Rooms | 1,372 (43.8%) | 346 (29.6%) |
| 8 or more Rooms | 454 (14.5%) | 94 (8.0%) |
| Total | 3,132 (100.0%) | 1,170 (100.0%) |
Housing Structure by Heating Type in Miramar Beach
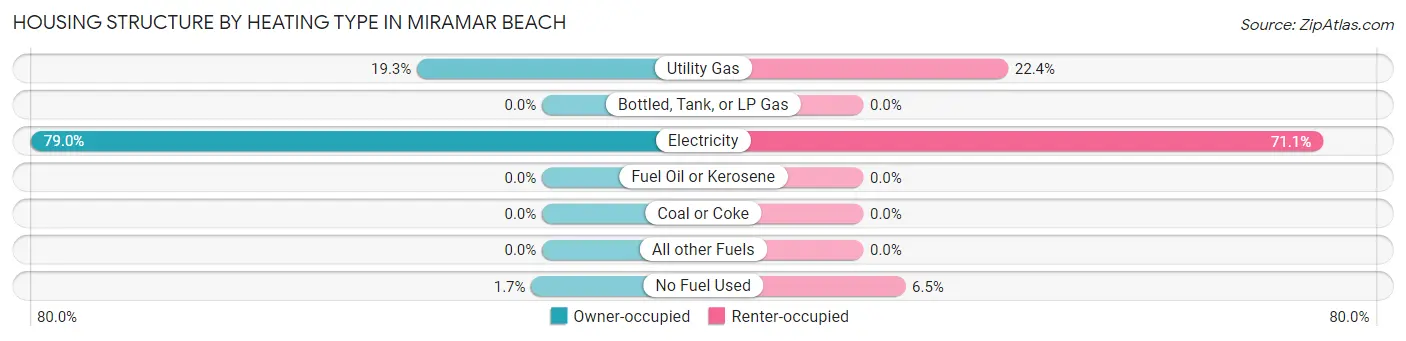
| Heating Type | Owner-occupied | Renter-occupied |
| Utility Gas | 605 (19.3%) | 262 (22.4%) |
| Bottled, Tank, or LP Gas | 0 (0.0%) | 0 (0.0%) |
| Electricity | 2,475 (79.0%) | 832 (71.1%) |
| Fuel Oil or Kerosene | 0 (0.0%) | 0 (0.0%) |
| Coal or Coke | 0 (0.0%) | 0 (0.0%) |
| All other Fuels | 0 (0.0%) | 0 (0.0%) |
| No Fuel Used | 52 (1.7%) | 76 (6.5%) |
| Total | 3,132 (100.0%) | 1,170 (100.0%) |
Household Vehicle Usage in Miramar Beach
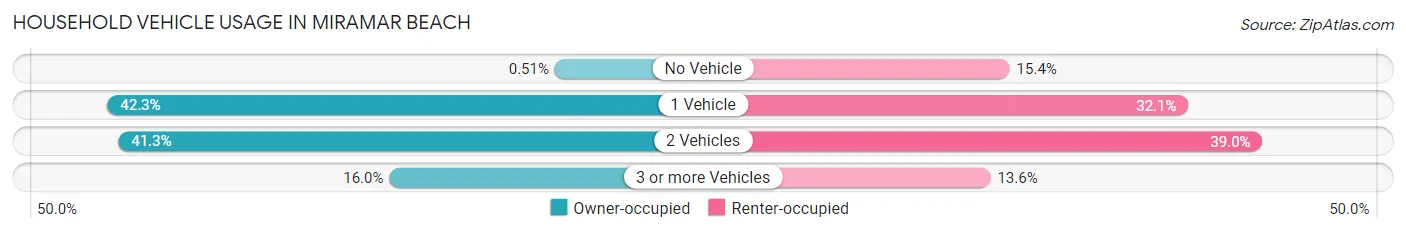
| Vehicles per Household | Owner-occupied | Renter-occupied |
| No Vehicle | 16 (0.5%) | 180 (15.4%) |
| 1 Vehicle | 1,324 (42.3%) | 375 (32.1%) |
| 2 Vehicles | 1,292 (41.2%) | 456 (39.0%) |
| 3 or more Vehicles | 500 (16.0%) | 159 (13.6%) |
| Total | 3,132 (100.0%) | 1,170 (100.0%) |
Real Estate & Mortgages in Miramar Beach
Real Estate and Mortgage Overview in Miramar Beach
| Characteristic | Without Mortgage | With Mortgage |
| Housing Units | 1,592 | 1,540 |
| Median Property Value | $573,000 | $532,300 |
| Median Household Income | $69,702 | $681 |
| Monthly Housing Costs | $992 | $451 |
| Real Estate Taxes | $3,068 | $36 |
Property Value by Mortgage Status in Miramar Beach
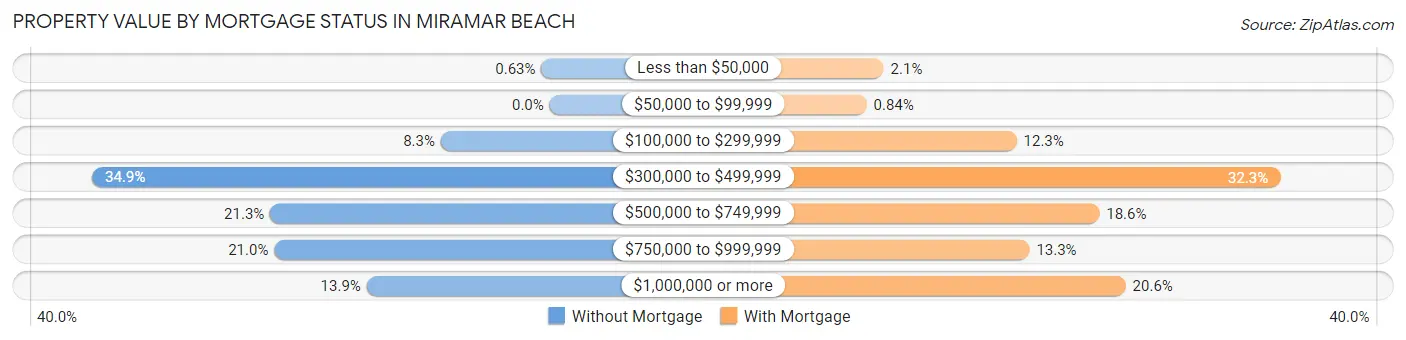
| Property Value | Without Mortgage | With Mortgage |
| Less than $50,000 | 10 (0.6%) | 33 (2.1%) |
| $50,000 to $99,999 | 0 (0.0%) | 13 (0.8%) |
| $100,000 to $299,999 | 132 (8.3%) | 189 (12.3%) |
| $300,000 to $499,999 | 555 (34.9%) | 498 (32.3%) |
| $500,000 to $749,999 | 339 (21.3%) | 286 (18.6%) |
| $750,000 to $999,999 | 334 (21.0%) | 204 (13.3%) |
| $1,000,000 or more | 222 (13.9%) | 317 (20.6%) |
| Total | 1,592 (100.0%) | 1,540 (100.0%) |
Household Income by Mortgage Status in Miramar Beach
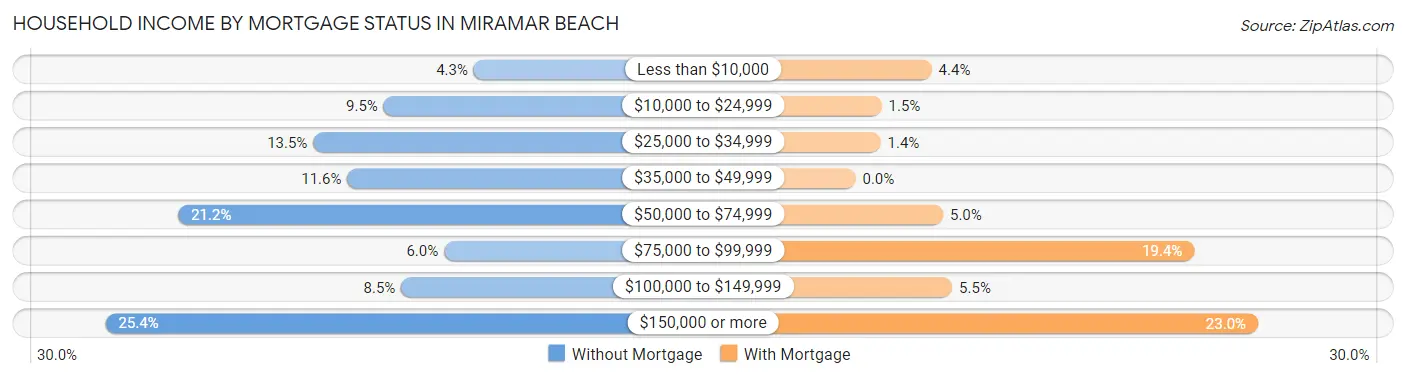
| Household Income | Without Mortgage | With Mortgage |
| Less than $10,000 | 69 (4.3%) | 67 (4.3%) |
| $10,000 to $24,999 | 151 (9.5%) | 23 (1.5%) |
| $25,000 to $34,999 | 215 (13.5%) | 22 (1.4%) |
| $35,000 to $49,999 | 184 (11.6%) | 0 (0.0%) |
| $50,000 to $74,999 | 338 (21.2%) | 77 (5.0%) |
| $75,000 to $99,999 | 96 (6.0%) | 298 (19.4%) |
| $100,000 to $149,999 | 135 (8.5%) | 85 (5.5%) |
| $150,000 or more | 404 (25.4%) | 354 (23.0%) |
| Total | 1,592 (100.0%) | 1,540 (100.0%) |
Property Value to Household Income Ratio in Miramar Beach
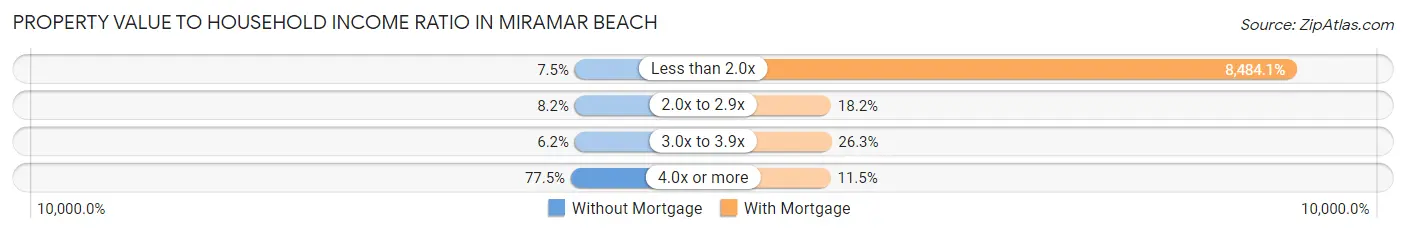
| Value-to-Income Ratio | Without Mortgage | With Mortgage |
| Less than 2.0x | 119 (7.5%) | 130,655 (8,484.1%) |
| 2.0x to 2.9x | 131 (8.2%) | 280 (18.2%) |
| 3.0x to 3.9x | 99 (6.2%) | 405 (26.3%) |
| 4.0x or more | 1,233 (77.4%) | 177 (11.5%) |
| Total | 1,592 (100.0%) | 1,540 (100.0%) |
Real Estate Taxes by Mortgage Status in Miramar Beach
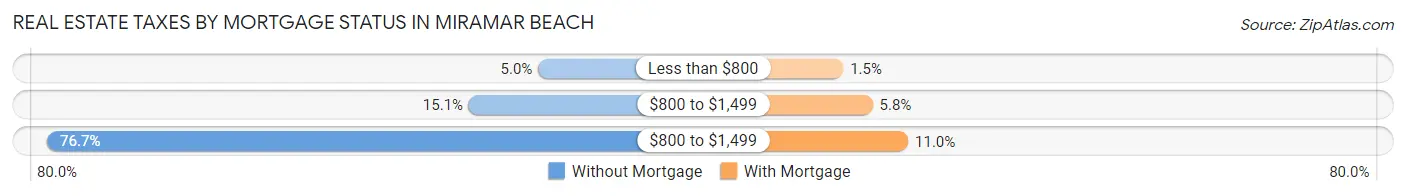
| Property Taxes | Without Mortgage | With Mortgage |
| Less than $800 | 79 (5.0%) | 23 (1.5%) |
| $800 to $1,499 | 240 (15.1%) | 89 (5.8%) |
| $800 to $1,499 | 1,221 (76.7%) | 169 (11.0%) |
| Total | 1,592 (100.0%) | 1,540 (100.0%) |
Health & Disability in Miramar Beach
Health Insurance Coverage by Age in Miramar Beach
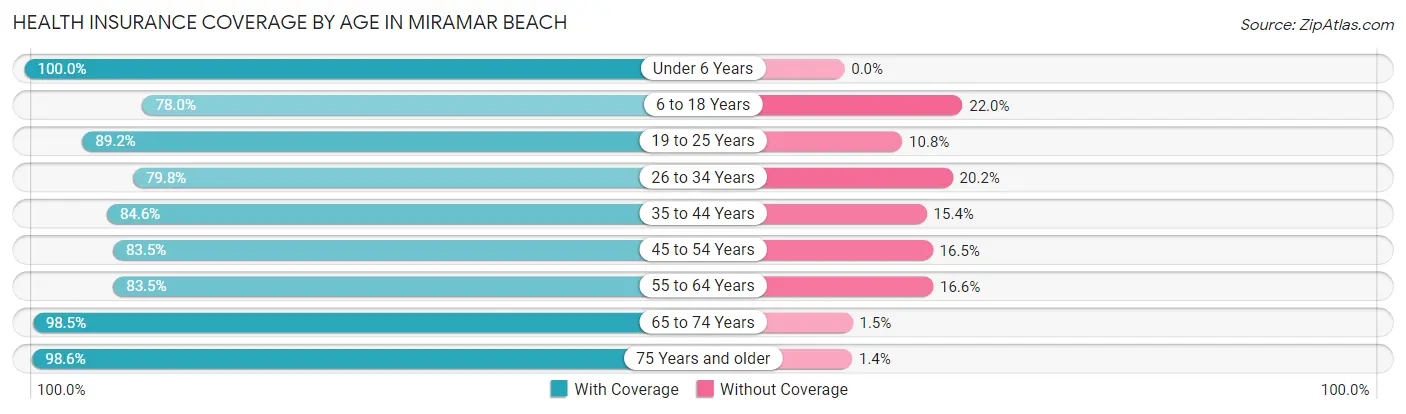
| Age Bracket | With Coverage | Without Coverage |
| Under 6 Years | 169 (100.0%) | 0 (0.0%) |
| 6 to 18 Years | 766 (78.0%) | 216 (22.0%) |
| 19 to 25 Years | 438 (89.2%) | 53 (10.8%) |
| 26 to 34 Years | 687 (79.8%) | 174 (20.2%) |
| 35 to 44 Years | 628 (84.6%) | 114 (15.4%) |
| 45 to 54 Years | 821 (83.5%) | 162 (16.5%) |
| 55 to 64 Years | 1,452 (83.5%) | 288 (16.6%) |
| 65 to 74 Years | 1,673 (98.5%) | 26 (1.5%) |
| 75 Years and older | 1,164 (98.6%) | 17 (1.4%) |
| Total | 7,798 (88.1%) | 1,050 (11.9%) |
Health Insurance Coverage by Citizenship Status in Miramar Beach
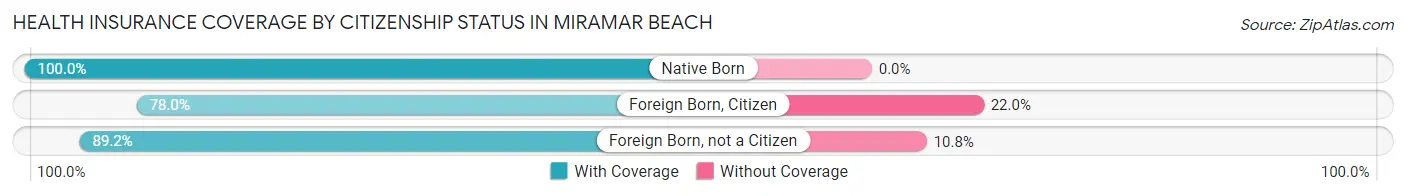
| Citizenship Status | With Coverage | Without Coverage |
| Native Born | 169 (100.0%) | 0 (0.0%) |
| Foreign Born, Citizen | 766 (78.0%) | 216 (22.0%) |
| Foreign Born, not a Citizen | 438 (89.2%) | 53 (10.8%) |
Health Insurance Coverage by Household Income in Miramar Beach
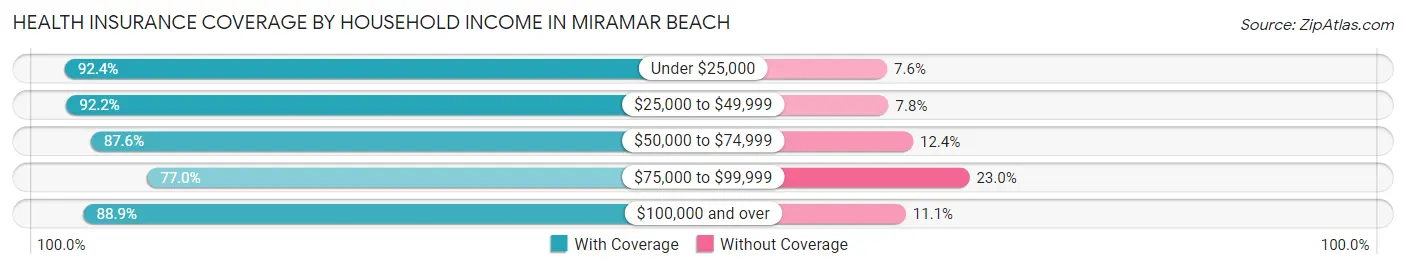
| Household Income | With Coverage | Without Coverage |
| Under $25,000 | 428 (92.4%) | 35 (7.6%) |
| $25,000 to $49,999 | 1,011 (92.2%) | 86 (7.8%) |
| $50,000 to $74,999 | 1,588 (87.6%) | 225 (12.4%) |
| $75,000 to $99,999 | 633 (77.0%) | 189 (23.0%) |
| $100,000 and over | 4,138 (88.9%) | 515 (11.1%) |
Public vs Private Health Insurance Coverage by Age in Miramar Beach
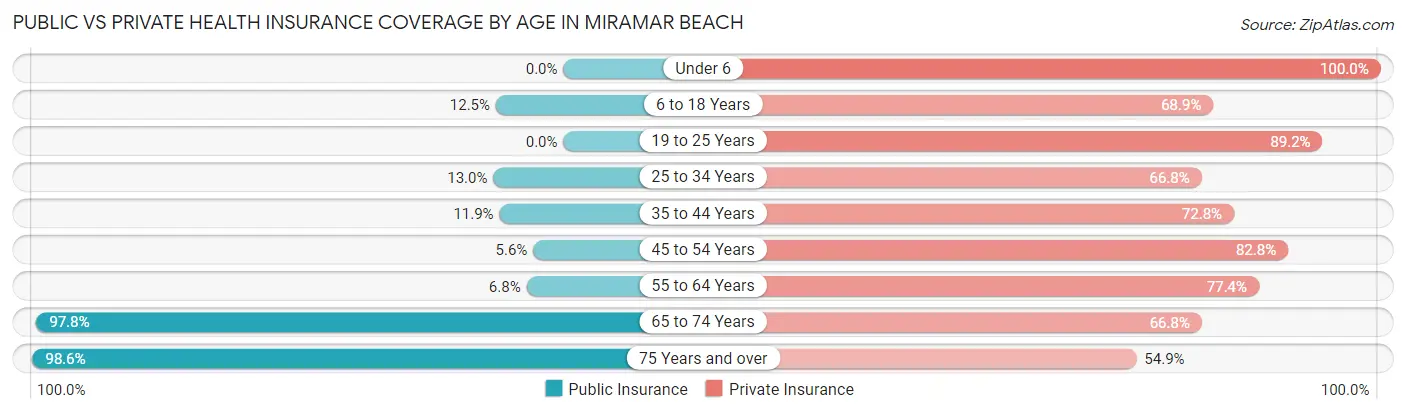
| Age Bracket | Public Insurance | Private Insurance |
| Under 6 | 0 (0.0%) | 169 (100.0%) |
| 6 to 18 Years | 123 (12.5%) | 677 (68.9%) |
| 19 to 25 Years | 0 (0.0%) | 438 (89.2%) |
| 25 to 34 Years | 112 (13.0%) | 575 (66.8%) |
| 35 to 44 Years | 88 (11.9%) | 540 (72.8%) |
| 45 to 54 Years | 55 (5.6%) | 814 (82.8%) |
| 55 to 64 Years | 119 (6.8%) | 1,347 (77.4%) |
| 65 to 74 Years | 1,662 (97.8%) | 1,135 (66.8%) |
| 75 Years and over | 1,164 (98.6%) | 648 (54.9%) |
| Total | 3,323 (37.6%) | 6,343 (71.7%) |
Disability Status by Sex by Age in Miramar Beach
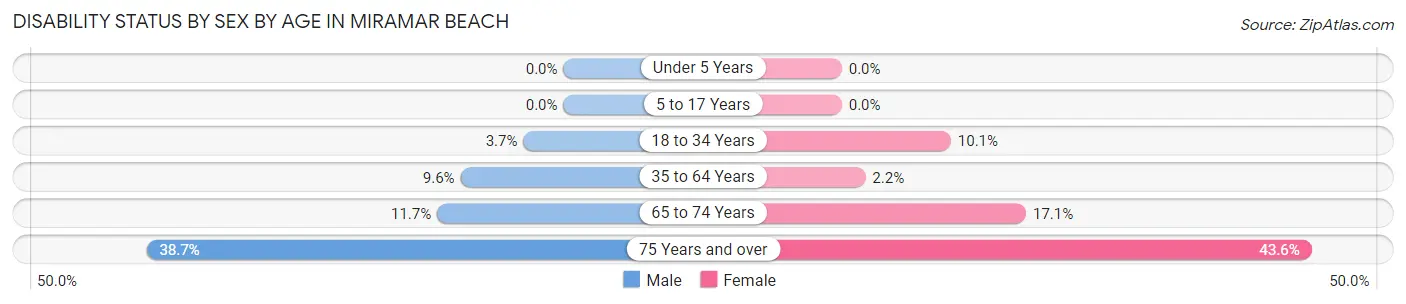
| Age Bracket | Male | Female |
| Under 5 Years | 0 (0.0%) | 0 (0.0%) |
| 5 to 17 Years | 0 (0.0%) | 0 (0.0%) |
| 18 to 34 Years | 33 (3.7%) | 59 (10.1%) |
| 35 to 64 Years | 139 (9.6%) | 44 (2.2%) |
| 65 to 74 Years | 99 (11.7%) | 146 (17.1%) |
| 75 Years and over | 212 (38.7%) | 276 (43.6%) |
Disability Class by Sex by Age in Miramar Beach
Disability Class: Hearing Difficulty
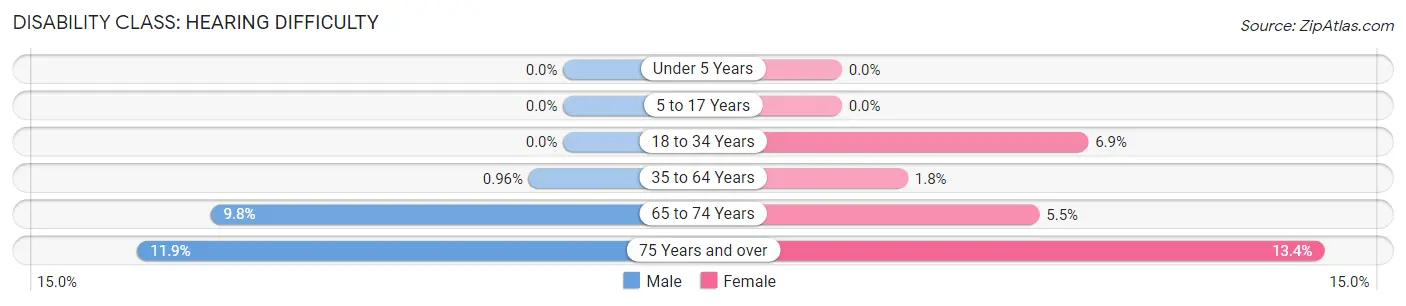
| Age Bracket | Male | Female |
| Under 5 Years | 0 (0.0%) | 0 (0.0%) |
| 5 to 17 Years | 0 (0.0%) | 0 (0.0%) |
| 18 to 34 Years | 0 (0.0%) | 40 (6.9%) |
| 35 to 64 Years | 14 (1.0%) | 37 (1.8%) |
| 65 to 74 Years | 83 (9.8%) | 47 (5.5%) |
| 75 Years and over | 65 (11.9%) | 85 (13.4%) |
Disability Class: Vision Difficulty
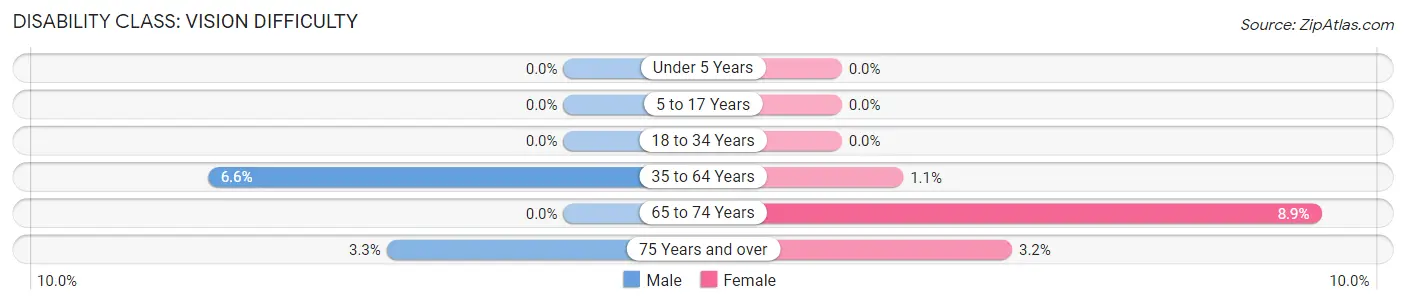
| Age Bracket | Male | Female |
| Under 5 Years | 0 (0.0%) | 0 (0.0%) |
| 5 to 17 Years | 0 (0.0%) | 0 (0.0%) |
| 18 to 34 Years | 0 (0.0%) | 0 (0.0%) |
| 35 to 64 Years | 96 (6.6%) | 23 (1.1%) |
| 65 to 74 Years | 0 (0.0%) | 76 (8.9%) |
| 75 Years and over | 18 (3.3%) | 20 (3.2%) |
Disability Class: Cognitive Difficulty
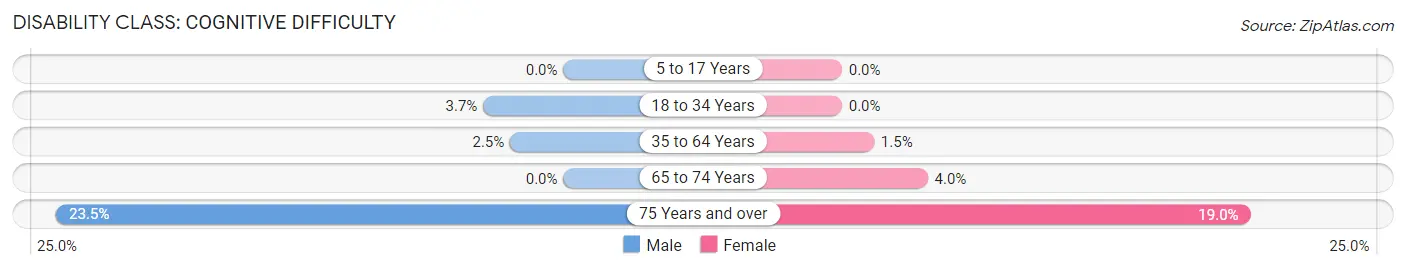
| Age Bracket | Male | Female |
| 5 to 17 Years | 0 (0.0%) | 0 (0.0%) |
| 18 to 34 Years | 33 (3.7%) | 0 (0.0%) |
| 35 to 64 Years | 36 (2.5%) | 30 (1.5%) |
| 65 to 74 Years | 0 (0.0%) | 34 (4.0%) |
| 75 Years and over | 129 (23.5%) | 120 (19.0%) |
Disability Class: Ambulatory Difficulty
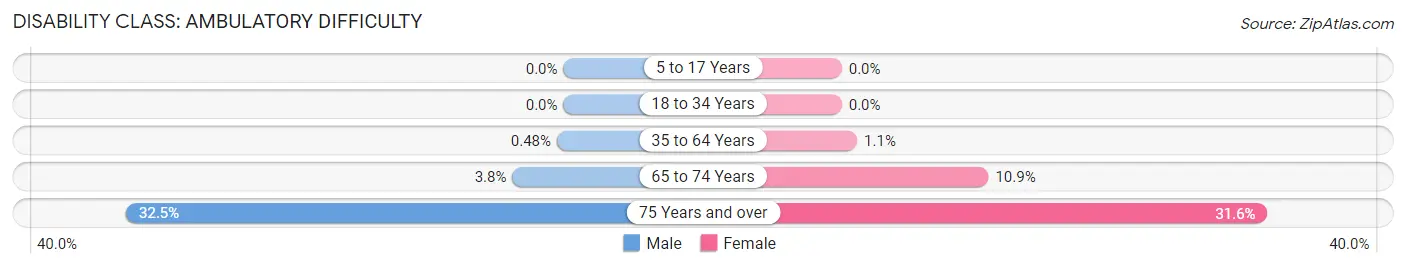
| Age Bracket | Male | Female |
| 5 to 17 Years | 0 (0.0%) | 0 (0.0%) |
| 18 to 34 Years | 0 (0.0%) | 0 (0.0%) |
| 35 to 64 Years | 7 (0.5%) | 23 (1.1%) |
| 65 to 74 Years | 32 (3.8%) | 93 (10.9%) |
| 75 Years and over | 178 (32.5%) | 200 (31.6%) |
Disability Class: Self-Care Difficulty
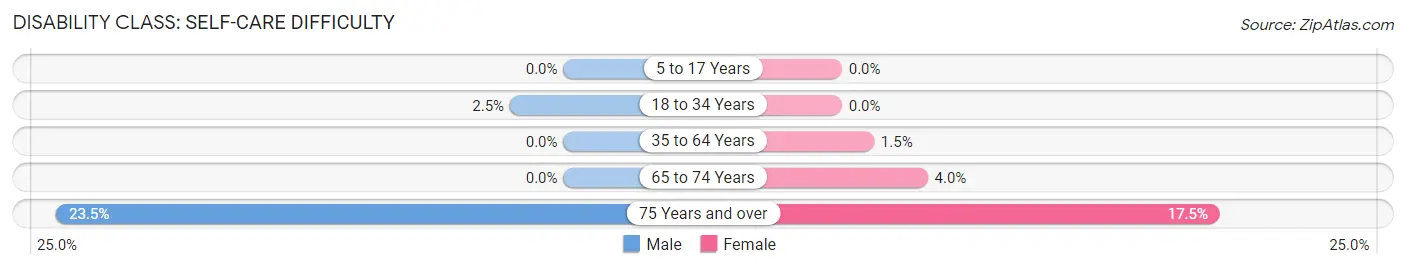
| Age Bracket | Male | Female |
| 5 to 17 Years | 0 (0.0%) | 0 (0.0%) |
| 18 to 34 Years | 22 (2.5%) | 0 (0.0%) |
| 35 to 64 Years | 0 (0.0%) | 30 (1.5%) |
| 65 to 74 Years | 0 (0.0%) | 34 (4.0%) |
| 75 Years and over | 129 (23.5%) | 111 (17.5%) |
Technology Access in Miramar Beach
Computing Device Access in Miramar Beach
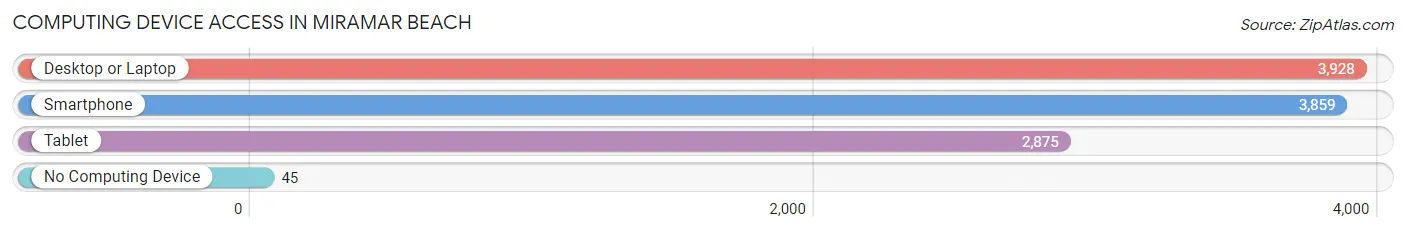
| Device Type | # Households | % Households |
| Desktop or Laptop | 3,928 | 91.3% |
| Smartphone | 3,859 | 89.7% |
| Tablet | 2,875 | 66.8% |
| No Computing Device | 45 | 1.1% |
| Total | 4,302 | 100.0% |
Internet Access in Miramar Beach
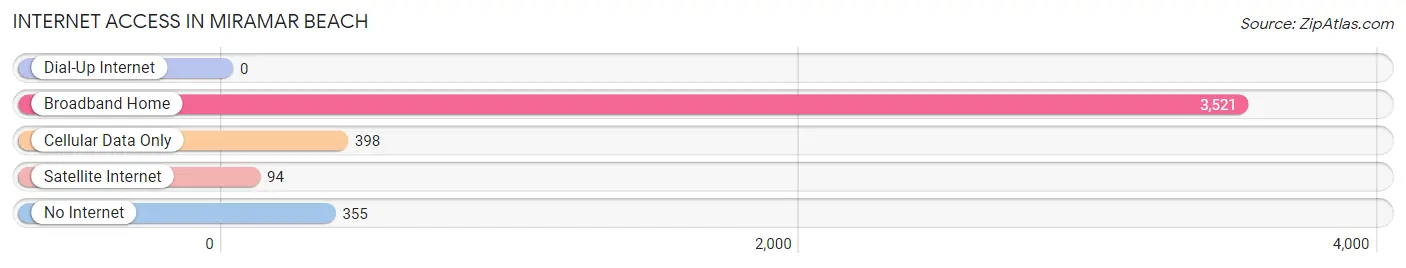
| Internet Type | # Households | % Households |
| Dial-Up Internet | 0 | 0.0% |
| Broadband Home | 3,521 | 81.9% |
| Cellular Data Only | 398 | 9.2% |
| Satellite Internet | 94 | 2.2% |
| No Internet | 355 | 8.3% |
| Total | 4,302 | 100.0% |
Miramar Beach Summary
Miramar Beach is a small beach town located in the Florida Panhandle, along the Gulf of Mexico. It is part of Walton County and is situated between Destin and Panama City Beach. The town has a population of approximately 8,000 people and is known for its white sand beaches, crystal clear waters, and laid-back atmosphere.
History
Miramar Beach was originally inhabited by Native Americans, including the Choctaw and Creek tribes. The area was first explored by Europeans in the late 1700s, and the first settlers arrived in the early 1800s. The town was officially established in 1885 and was named after the Spanish word for “sea view”.
In the early 1900s, the town began to grow as a popular tourist destination. The first hotel was built in 1910, and the first beach pavilion was constructed in 1912. The town was incorporated in 1925 and the first post office was established in 1926.
Geography
Miramar Beach is located in the Florida Panhandle, along the Gulf of Mexico. It is situated between Destin and Panama City Beach, and is part of Walton County. The town is bordered by the Choctawhatchee Bay to the north and the Gulf of Mexico to the south. The town covers an area of approximately 4.5 square miles and has a population of 8,000 people.
The town is known for its white sand beaches and crystal clear waters. The beaches are popular for swimming, sunbathing, and fishing. The town is also home to several parks, including the Henderson Beach State Park and the Grayton Beach State Park.
Economy
The economy of Miramar Beach is largely driven by tourism. The town is a popular destination for beachgoers, and the beaches are known for their white sand and crystal clear waters. The town is also home to several resorts, hotels, and restaurants.
The town is also home to several businesses, including retail stores, banks, and medical offices. The town is also home to several marinas, which provide boat rentals and fishing charters.
Demographics
As of the 2010 census, the population of Miramar Beach was 8,000 people. The racial makeup of the town was 94.3% White, 2.2% African American, 0.7% Native American, 0.7% Asian, 0.2% Pacific Islander, and 1.9% from other races. The median household income was $50,000, and the median age was 44.
The town is home to several churches, including the First Baptist Church of Miramar Beach, the Church of Jesus Christ of Latter-day Saints, and the St. Mary’s Catholic Church. The town is also home to several schools, including the Walton County School District, the Emerald Coast Middle School, and the Emerald Coast High School.
Common Questions
What is Per Capita Income in Miramar Beach?
Per Capita income in Miramar Beach is $66,344.
What is the Median Family Income in Miramar Beach?
Median Family Income in Miramar Beach is $114,986.
What is the Median Household income in Miramar Beach?
Median Household Income in Miramar Beach is $81,196.
What is Income or Wage Gap in Miramar Beach?
Income or Wage Gap in Miramar Beach is 21.2%.
Women in Miramar Beach earn 78.8 cents for every dollar earned by a man.
What is Inequality or Gini Index in Miramar Beach?
Inequality or Gini Index in Miramar Beach is 0.50.
What is the Total Population of Miramar Beach?
Total Population of Miramar Beach is 9,115.
What is the Total Male Population of Miramar Beach?
Total Male Population of Miramar Beach is 4,295.
What is the Total Female Population of Miramar Beach?
Total Female Population of Miramar Beach is 4,820.
What is the Ratio of Males per 100 Females in Miramar Beach?
There are 89.11 Males per 100 Females in Miramar Beach.
What is the Ratio of Females per 100 Males in Miramar Beach?
There are 112.22 Females per 100 Males in Miramar Beach.
What is the Median Population Age in Miramar Beach?
Median Population Age in Miramar Beach is 56.8 Years.
What is the Average Family Size in Miramar Beach
Average Family Size in Miramar Beach is 2.5 People.
What is the Average Household Size in Miramar Beach
Average Household Size in Miramar Beach is 2.1 People.
How Large is the Labor Force in Miramar Beach?
There are 4,408 People in the Labor Forcein in Miramar Beach.
What is the Percentage of People in the Labor Force in Miramar Beach?
52.9% of People are in the Labor Force in Miramar Beach.
What is the Unemployment Rate in Miramar Beach?
Unemployment Rate in Miramar Beach is 9.0%.