Heber, CA Map & Demographics
Heber Map
Heber Overview
$18,245
PER CAPITA INCOME
$52,644
AVG FAMILY INCOME
$56,604
AVG HOUSEHOLD INCOME
35.4%
WAGE / INCOME GAP [ % ]
64.6¢/ $1
WAGE / INCOME GAP [ $ ]
0.44
INEQUALITY / GINI INDEX
7,910
TOTAL POPULATION
4,274
MALE POPULATION
3,636
FEMALE POPULATION
117.55
MALES / 100 FEMALES
85.07
FEMALES / 100 MALES
30.8
MEDIAN AGE
4.5
AVG FAMILY SIZE
4.3
AVG HOUSEHOLD SIZE
3,063
LABOR FORCE [ PEOPLE ]
52.3%
PERCENT IN LABOR FORCE
4.5%
UNEMPLOYMENT RATE
Heber Zip Codes
Heber Area Codes
Income in Heber
Income Overview in Heber
Per Capita Income in Heber is $18,245, while median incomes of families and households are $52,644 and $56,604 respectively.
| Characteristic | Number | Measure |
| Per Capita Income | 7,910 | $18,245 |
| Median Family Income | 1,588 | $52,644 |
| Mean Family Income | 1,588 | $68,773 |
| Median Household Income | 1,834 | $56,604 |
| Mean Household Income | 1,834 | $69,963 |
| Income Deficit | 1,588 | $0 |
| Wage / Income Gap (%) | 7,910 | 35.35% |
| Wage / Income Gap ($) | 7,910 | 64.65¢ per $1 |
| Gini / Inequality Index | 7,910 | 0.44 |
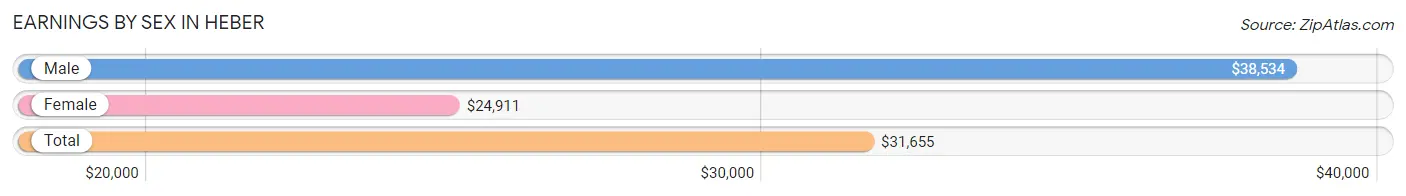
Earnings by Sex in Heber
Average Earnings in Heber are $31,655, $38,534 for men and $24,911 for women, a difference of 35.3%.
| Sex | Number | Average Earnings |
| Male | 1,836 (59.2%) | $38,534 |
| Female | 1,265 (40.8%) | $24,911 |
| Total | 3,101 (100.0%) | $31,655 |
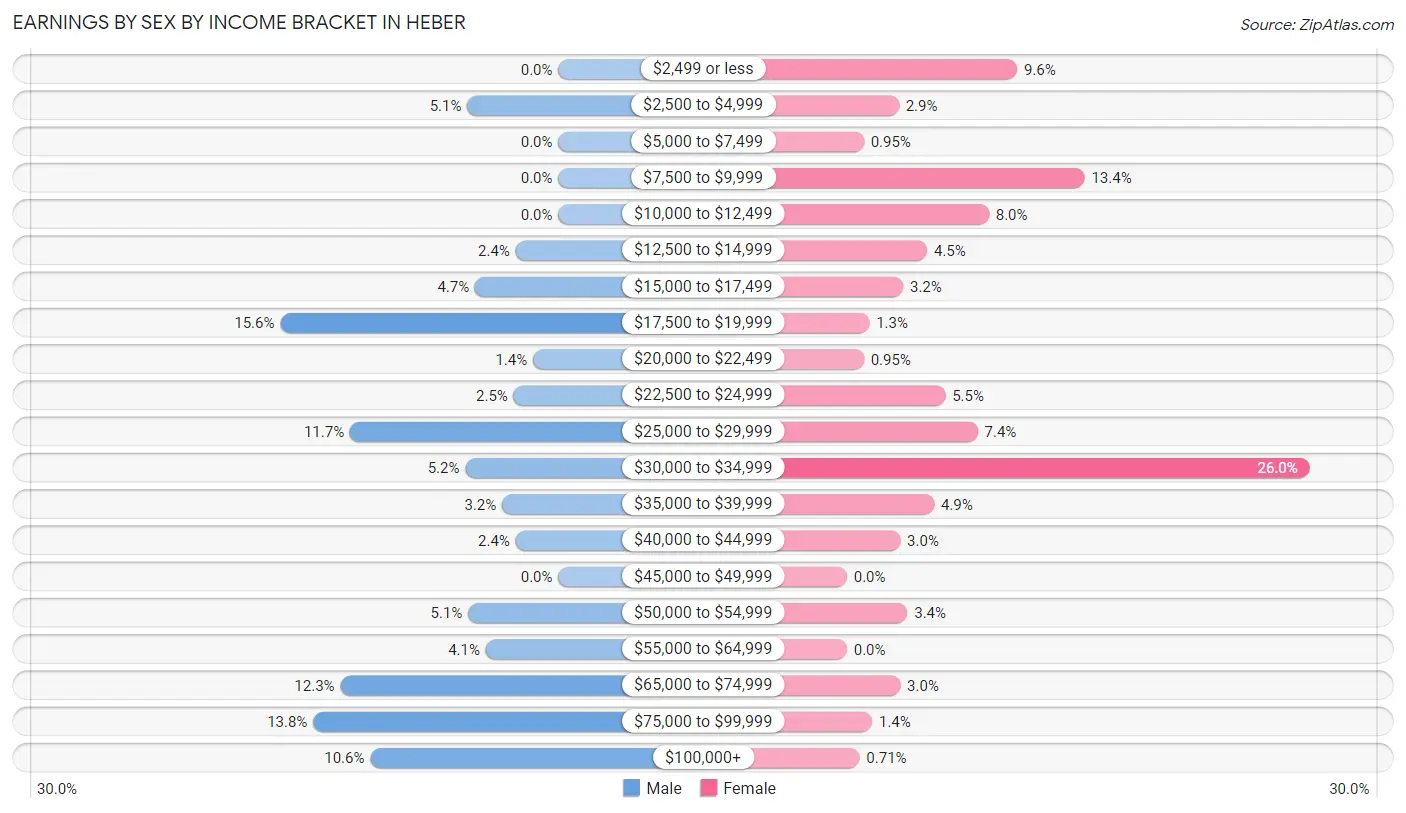
Earnings by Sex by Income Bracket in Heber
The most common earnings brackets in Heber are $17,500 to $19,999 for men (287 | 15.6%) and $30,000 to $34,999 for women (329 | 26.0%).
| Income | Male | Female |
| $2,499 or less | 0 (0.0%) | 121 (9.6%) |
| $2,500 to $4,999 | 94 (5.1%) | 37 (2.9%) |
| $5,000 to $7,499 | 0 (0.0%) | 12 (0.9%) |
| $7,500 to $9,999 | 0 (0.0%) | 169 (13.4%) |
| $10,000 to $12,499 | 0 (0.0%) | 101 (8.0%) |
| $12,500 to $14,999 | 44 (2.4%) | 57 (4.5%) |
| $15,000 to $17,499 | 86 (4.7%) | 40 (3.2%) |
| $17,500 to $19,999 | 287 (15.6%) | 16 (1.3%) |
| $20,000 to $22,499 | 26 (1.4%) | 12 (0.9%) |
| $22,500 to $24,999 | 46 (2.5%) | 70 (5.5%) |
| $25,000 to $29,999 | 215 (11.7%) | 93 (7.3%) |
| $30,000 to $34,999 | 96 (5.2%) | 329 (26.0%) |
| $35,000 to $39,999 | 58 (3.2%) | 62 (4.9%) |
| $40,000 to $44,999 | 44 (2.4%) | 38 (3.0%) |
| $45,000 to $49,999 | 0 (0.0%) | 0 (0.0%) |
| $50,000 to $54,999 | 93 (5.1%) | 43 (3.4%) |
| $55,000 to $64,999 | 75 (4.1%) | 0 (0.0%) |
| $65,000 to $74,999 | 225 (12.2%) | 38 (3.0%) |
| $75,000 to $99,999 | 253 (13.8%) | 18 (1.4%) |
| $100,000+ | 194 (10.6%) | 9 (0.7%) |
| Total | 1,836 (100.0%) | 1,265 (100.0%) |
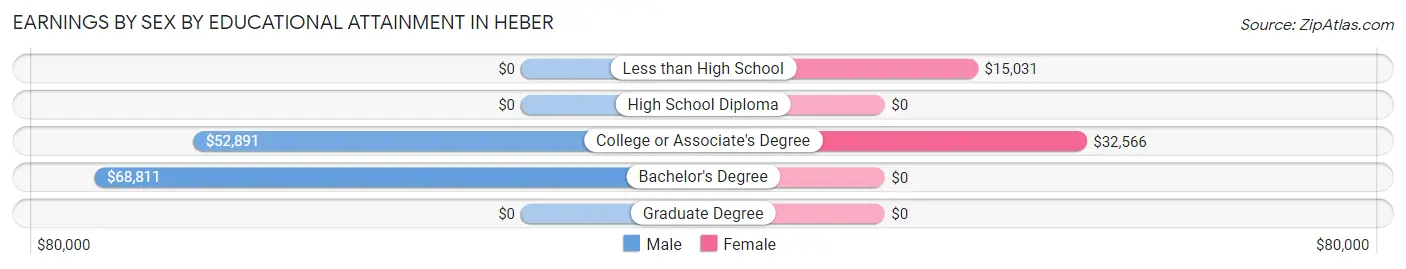
Earnings by Sex by Educational Attainment in Heber
Average earnings in Heber are $39,871 for men and $22,839 for women, a difference of 42.7%. Men with an educational attainment of bachelor's degree enjoy the highest average annual earnings of $68,811, while those with college or associate's degree education earn the least with $52,891. Women with an educational attainment of college or associate's degree earn the most with the average annual earnings of $32,566, while those with less than high school education have the smallest earnings of $15,031.
| Educational Attainment | Male Income | Female Income |
| Less than High School | - | - |
| High School Diploma | - | - |
| College or Associate's Degree | $52,891 | $32,566 |
| Bachelor's Degree | $68,811 | $0 |
| Graduate Degree | - | - |
| Total | $39,871 | $22,839 |
Family Income in Heber
Family Income Brackets in Heber
According to the Heber family income data, there are 294 families falling into the $100,000 to $149,999 income range, which is the most common income bracket and makes up 18.5% of all families. Conversely, the $10,000 to $14,999 income bracket is the least frequent group with only 44 families (2.8%) belonging to this category.
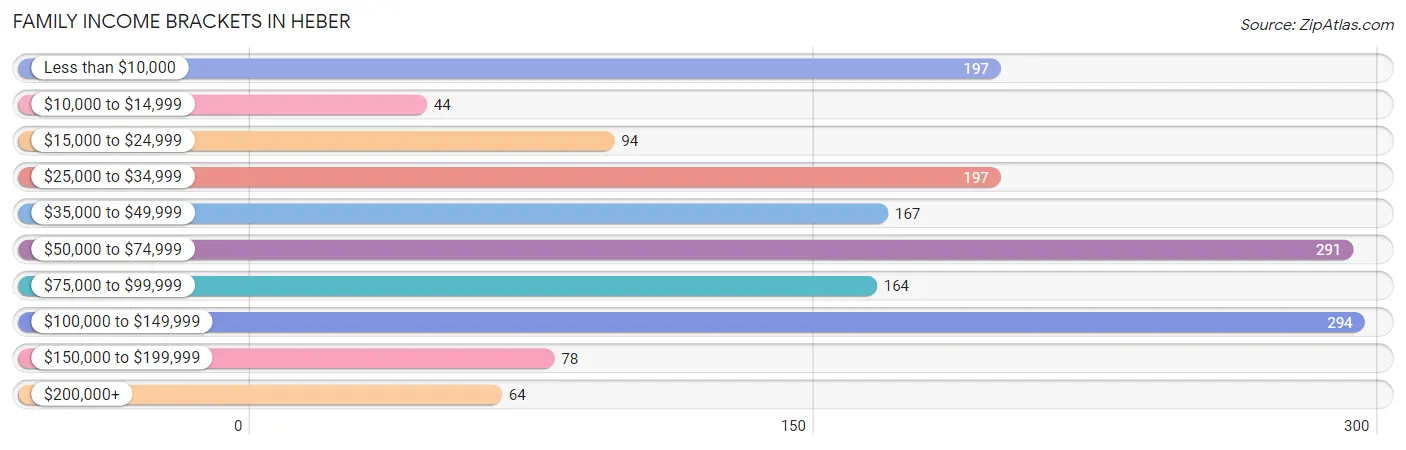
| Income Bracket | # Families | % Families |
| Less than $10,000 | 197 | 12.4% |
| $10,000 to $14,999 | 44 | 2.8% |
| $15,000 to $24,999 | 94 | 5.9% |
| $25,000 to $34,999 | 197 | 12.4% |
| $35,000 to $49,999 | 167 | 10.5% |
| $50,000 to $74,999 | 291 | 18.3% |
| $75,000 to $99,999 | 164 | 10.3% |
| $100,000 to $149,999 | 294 | 18.5% |
| $150,000 to $199,999 | 78 | 4.9% |
| $200,000+ | 64 | 4.0% |
Family Income by Famaliy Size in Heber
7+ person families (105 | 6.6%) account for the highest median family income in Heber with $151,042 per family, while 7+ person families (105 | 6.6%) have the highest median income of $21,577 per family member.
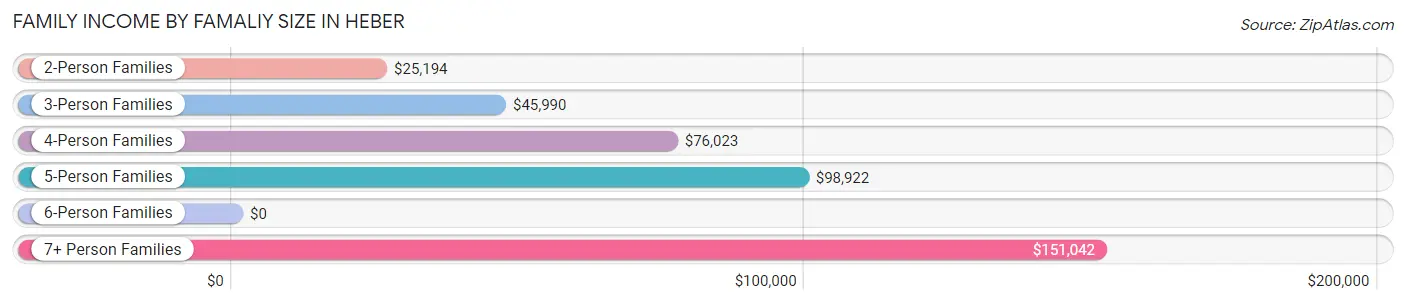
| Income Bracket | # Families | Median Income |
| 2-Person Families | 564 (35.5%) | $25,194 |
| 3-Person Families | 127 (8.0%) | $45,990 |
| 4-Person Families | 494 (31.1%) | $76,023 |
| 5-Person Families | 233 (14.7%) | $98,922 |
| 6-Person Families | 65 (4.1%) | $0 |
| 7+ Person Families | 105 (6.6%) | $151,042 |
| Total | 1,588 (100.0%) | $52,644 |
Family Income by Number of Earners in Heber
The median family income in Heber is $52,644, with families comprising 3+ earners (167) having the highest median family income of $116,156, while families with 1 earner (931) have the lowest median family income of $33,711, accounting for 10.5% and 58.6% of families, respectively.
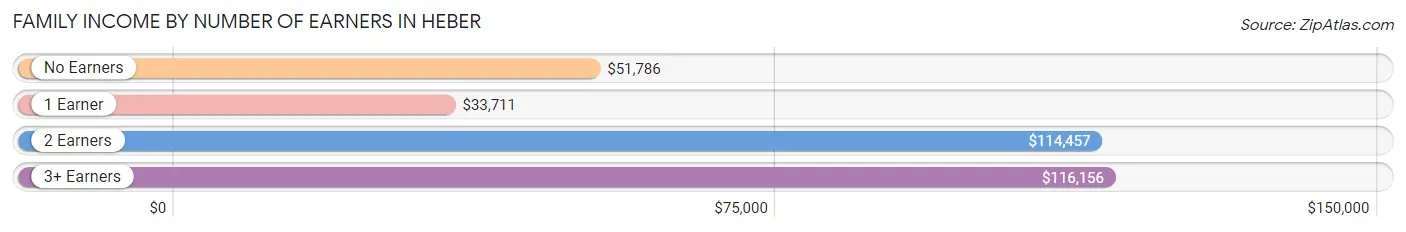
| Number of Earners | # Families | Median Income |
| No Earners | 136 (8.6%) | $51,786 |
| 1 Earner | 931 (58.6%) | $33,711 |
| 2 Earners | 354 (22.3%) | $114,457 |
| 3+ Earners | 167 (10.5%) | $116,156 |
| Total | 1,588 (100.0%) | $52,644 |
Household Income in Heber
Household Income Brackets in Heber
With 381 households falling in the category, the $50,000 to $74,999 income range is the most frequent in Heber, accounting for 20.8% of all households.
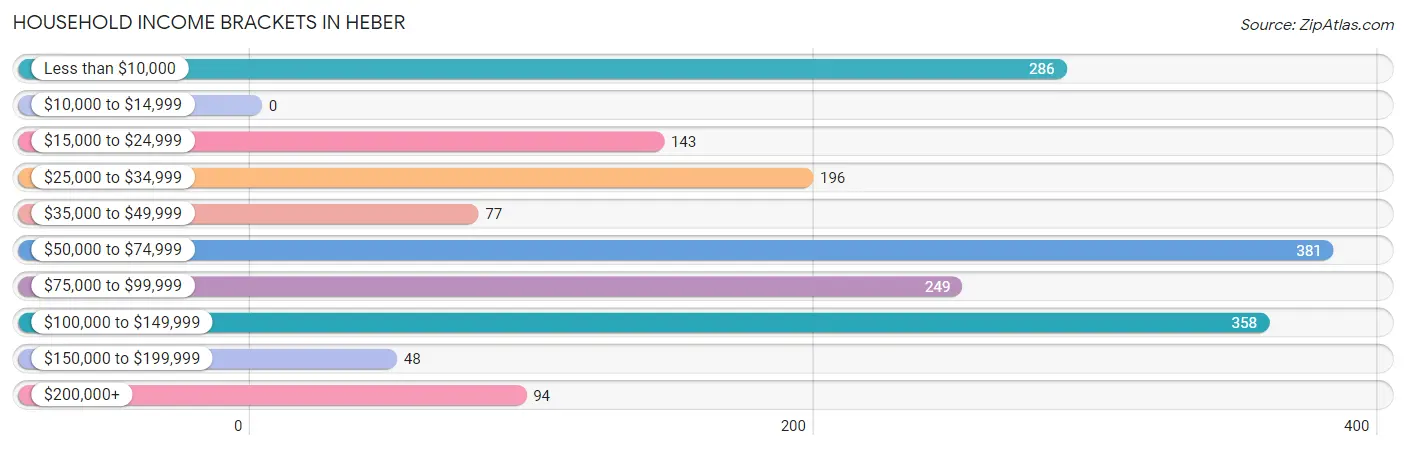
| Income Bracket | # Households | % Households |
| Less than $10,000 | 286 | 15.6% |
| $10,000 to $14,999 | 0 | 0.0% |
| $15,000 to $24,999 | 143 | 7.8% |
| $25,000 to $34,999 | 196 | 10.7% |
| $35,000 to $49,999 | 77 | 4.2% |
| $50,000 to $74,999 | 381 | 20.8% |
| $75,000 to $99,999 | 249 | 13.6% |
| $100,000 to $149,999 | 358 | 19.5% |
| $150,000 to $199,999 | 48 | 2.6% |
| $200,000+ | 94 | 5.1% |
Household Income by Householder Age in Heber
The median household income in Heber is $56,604, with the highest median household income of $78,804 found in the 25 to 44 years age bracket for the primary householder. A total of 594 households (32.4%) fall into this category. Meanwhile, the 15 to 24 years age bracket for the primary householder has the lowest median household income of $0, with 73 households (4.0%) in this group.
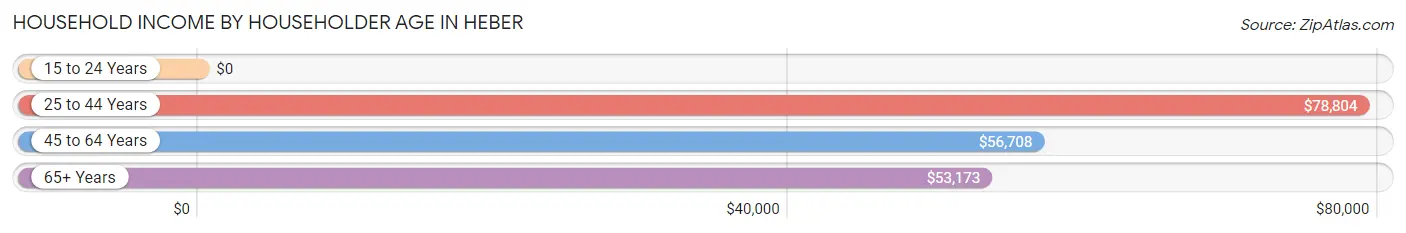
| Income Bracket | # Households | Median Income |
| 15 to 24 Years | 73 (4.0%) | $0 |
| 25 to 44 Years | 594 (32.4%) | $78,804 |
| 45 to 64 Years | 931 (50.8%) | $56,708 |
| 65+ Years | 236 (12.9%) | $53,173 |
| Total | 1,834 (100.0%) | $56,604 |
Poverty in Heber
Income Below Poverty by Sex and Age in Heber
With 13.9% poverty level for males and 18.6% for females among the residents of Heber, 15 year old males and 12 to 14 year old females are the most vulnerable to poverty, with 48 males (77.4%) and 81 females (68.6%) in their respective age groups living below the poverty level.
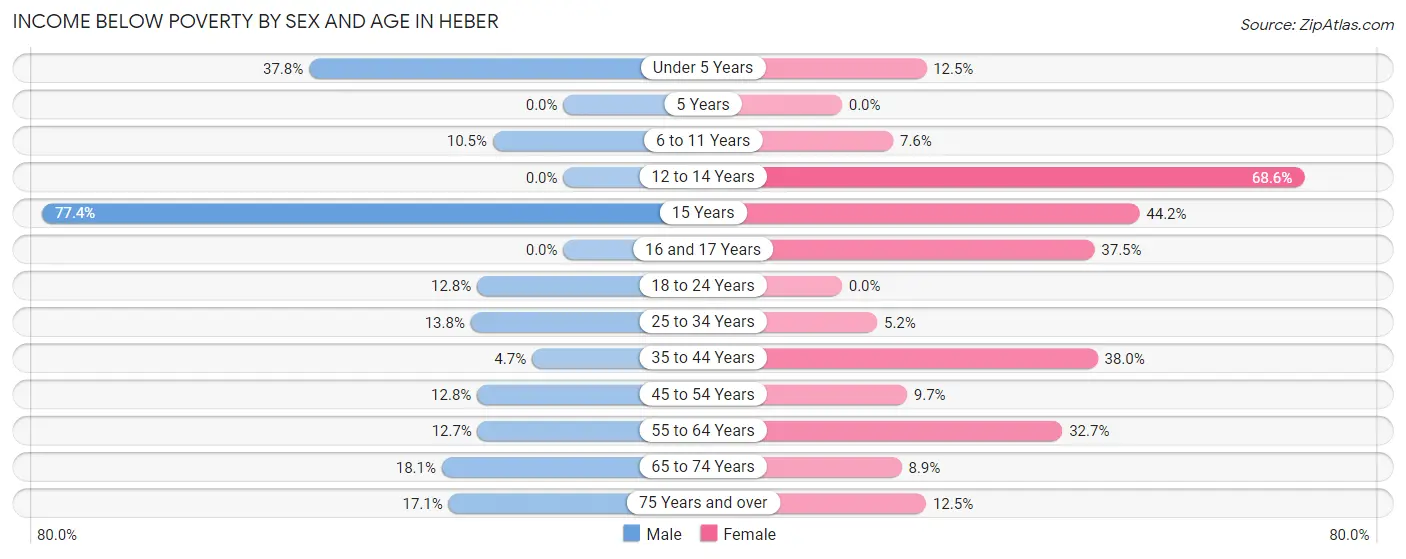
| Age Bracket | Male | Female |
| Under 5 Years | 111 (37.8%) | 56 (12.5%) |
| 5 Years | 0 (0.0%) | 0 (0.0%) |
| 6 to 11 Years | 57 (10.5%) | 14 (7.6%) |
| 12 to 14 Years | 0 (0.0%) | 81 (68.6%) |
| 15 Years | 48 (77.4%) | 57 (44.2%) |
| 16 and 17 Years | 0 (0.0%) | 51 (37.5%) |
| 18 to 24 Years | 96 (12.8%) | 0 (0.0%) |
| 25 to 34 Years | 92 (13.8%) | 34 (5.2%) |
| 35 to 44 Years | 19 (4.7%) | 199 (38.0%) |
| 45 to 54 Years | 84 (12.8%) | 48 (9.7%) |
| 55 to 64 Years | 22 (12.7%) | 91 (32.7%) |
| 65 to 74 Years | 37 (18.0%) | 18 (8.9%) |
| 75 Years and over | 30 (17.1%) | 23 (12.5%) |
| Total | 596 (13.9%) | 672 (18.6%) |
Income Above Poverty by Sex and Age in Heber
According to the poverty statistics in Heber, males aged 5 years and females aged 18 to 24 years are the age groups that are most secure financially, with 100.0% of males and 100.0% of females in these age groups living above the poverty line.
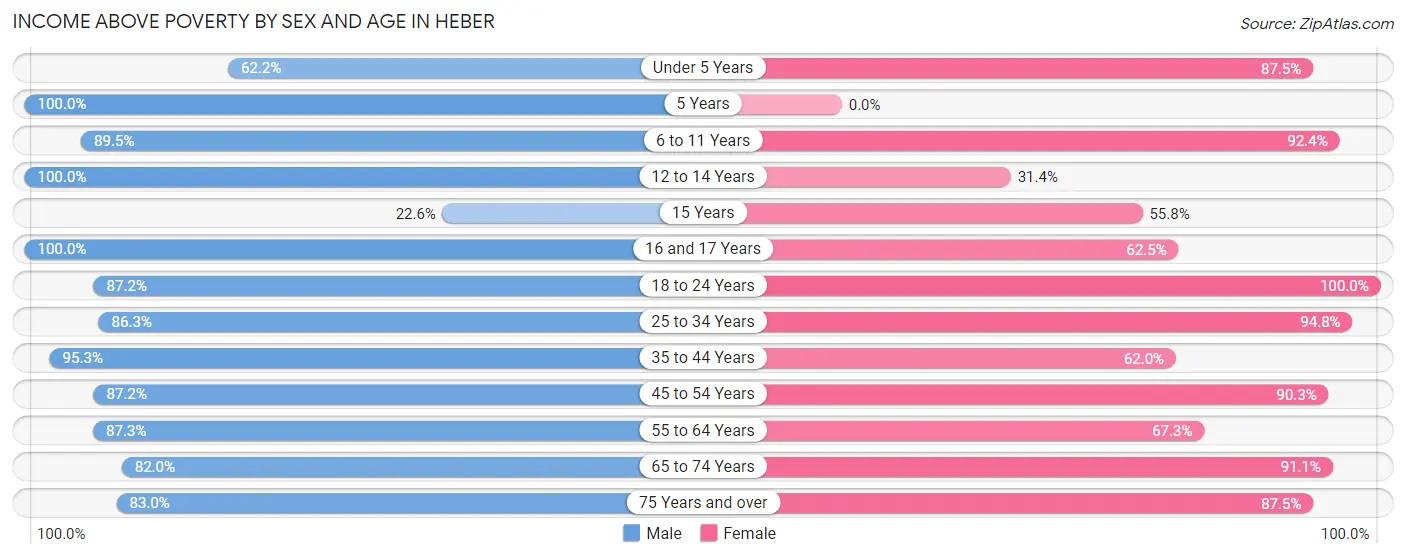
| Age Bracket | Male | Female |
| Under 5 Years | 183 (62.2%) | 391 (87.5%) |
| 5 Years | 71 (100.0%) | 0 (0.0%) |
| 6 to 11 Years | 487 (89.5%) | 170 (92.4%) |
| 12 to 14 Years | 187 (100.0%) | 37 (31.4%) |
| 15 Years | 14 (22.6%) | 72 (55.8%) |
| 16 and 17 Years | 80 (100.0%) | 85 (62.5%) |
| 18 to 24 Years | 653 (87.2%) | 269 (100.0%) |
| 25 to 34 Years | 577 (86.3%) | 616 (94.8%) |
| 35 to 44 Years | 389 (95.3%) | 325 (62.0%) |
| 45 to 54 Years | 572 (87.2%) | 449 (90.3%) |
| 55 to 64 Years | 151 (87.3%) | 187 (67.3%) |
| 65 to 74 Years | 168 (82.0%) | 185 (91.1%) |
| 75 Years and over | 146 (83.0%) | 161 (87.5%) |
| Total | 3,678 (86.1%) | 2,947 (81.4%) |
Income Below Poverty Among Married-Couple Families in Heber
The poverty statistics for married-couple families in Heber show that 11.7% or 114 of the total 978 families live below the poverty line. Families with 3 or 4 children have the highest poverty rate of 71.2%, comprising of 52 families. On the other hand, families with 1 or 2 children have the lowest poverty rate of 0.0%, which includes 0 families.
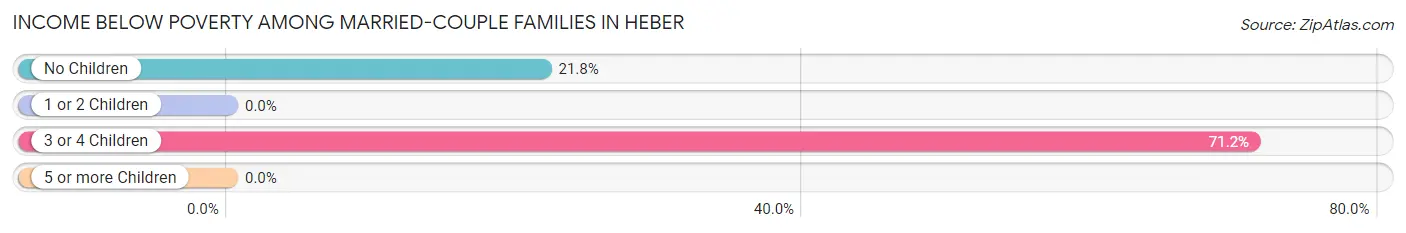
| Children | Above Poverty | Below Poverty |
| No Children | 222 (78.2%) | 62 (21.8%) |
| 1 or 2 Children | 621 (100.0%) | 0 (0.0%) |
| 3 or 4 Children | 21 (28.8%) | 52 (71.2%) |
| 5 or more Children | 0 (0.0%) | 0 (0.0%) |
| Total | 864 (88.3%) | 114 (11.7%) |
Income Below Poverty Among Single-Parent Households in Heber
According to the poverty data in Heber, 15.4% or 44 single-father households and 53.8% or 175 single-mother households are living below the poverty line. Among single-father households, those with 1 or 2 children have the highest poverty rate, with 44 households (53.0%) experiencing poverty. Likewise, among single-mother households, those with 1 or 2 children have the highest poverty rate, with 138 households (55.9%) falling below the poverty line.
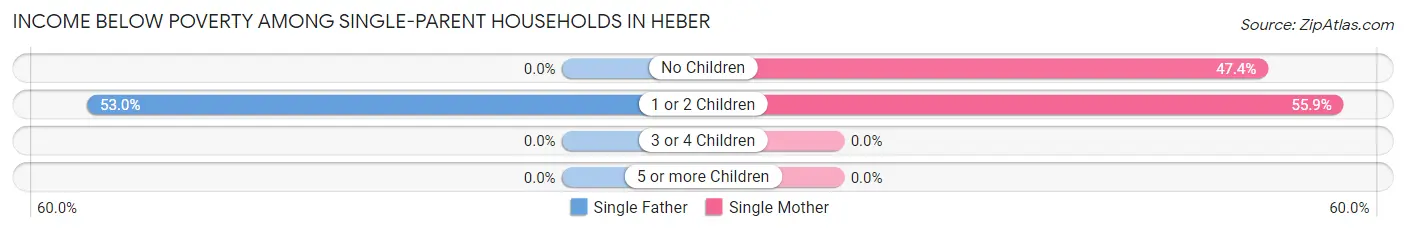
| Children | Single Father | Single Mother |
| No Children | 0 (0.0%) | 37 (47.4%) |
| 1 or 2 Children | 44 (53.0%) | 138 (55.9%) |
| 3 or 4 Children | 0 (0.0%) | 0 (0.0%) |
| 5 or more Children | 0 (0.0%) | 0 (0.0%) |
| Total | 44 (15.4%) | 175 (53.8%) |
Income Below Poverty Among Married-Couple vs Single-Parent Households in Heber
The poverty data for Heber shows that 114 of the married-couple family households (11.7%) and 219 of the single-parent households (35.9%) are living below the poverty level. Within the married-couple family households, those with 3 or 4 children have the highest poverty rate, with 52 households (71.2%) falling below the poverty line. Among the single-parent households, those with 1 or 2 children have the highest poverty rate, with 182 household (55.1%) living below poverty.
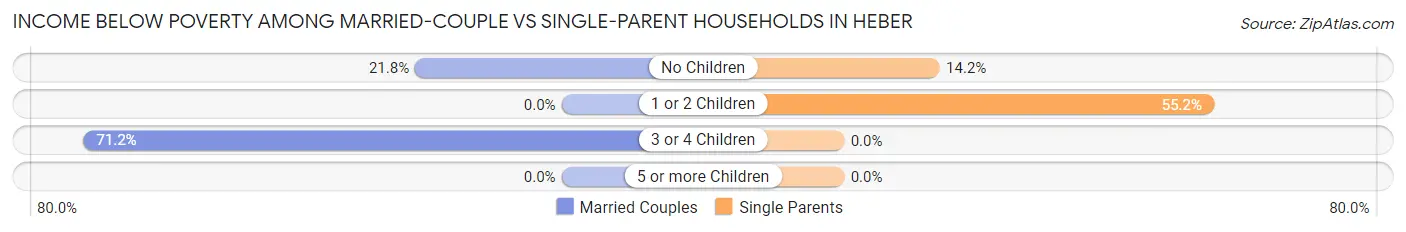
| Children | Married-Couple Families | Single-Parent Households |
| No Children | 62 (21.8%) | 37 (14.2%) |
| 1 or 2 Children | 0 (0.0%) | 182 (55.1%) |
| 3 or 4 Children | 52 (71.2%) | 0 (0.0%) |
| 5 or more Children | 0 (0.0%) | 0 (0.0%) |
| Total | 114 (11.7%) | 219 (35.9%) |
Race in Heber
The most populous races in Heber are Hispanic or Latino (7,759 | 98.1%), White / Caucasian (3,101 | 39.2%), and Two or more Races (2,389 | 30.2%).
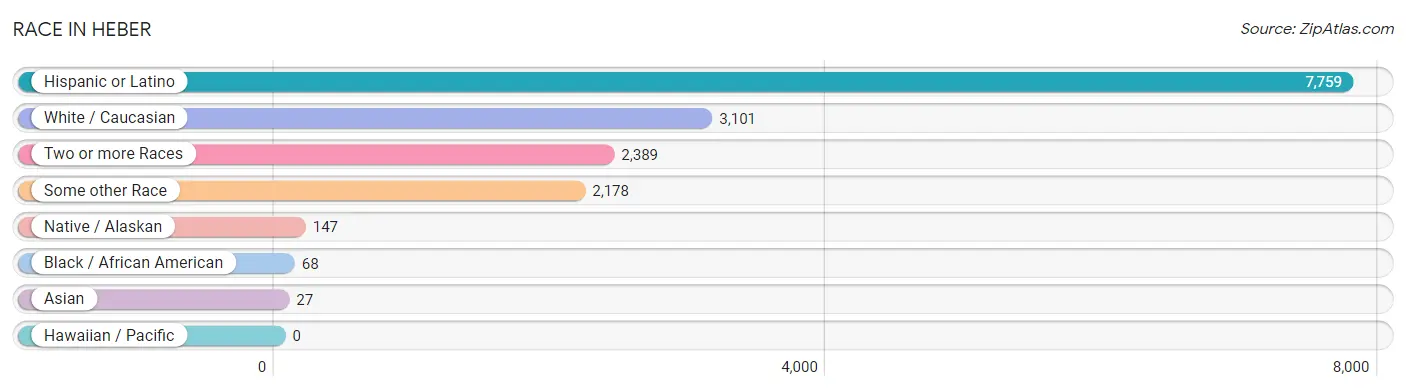
| Race | # Population | % Population |
| Asian | 27 | 0.3% |
| Black / African American | 68 | 0.9% |
| Hawaiian / Pacific | 0 | 0.0% |
| Hispanic or Latino | 7,759 | 98.1% |
| Native / Alaskan | 147 | 1.9% |
| White / Caucasian | 3,101 | 39.2% |
| Two or more Races | 2,389 | 30.2% |
| Some other Race | 2,178 | 27.5% |
| Total | 7,910 | 100.0% |
Ancestry in Heber
The most populous ancestries reported in Heber are Mexican (7,378 | 93.3%), Central American Indian (147 | 1.9%), South American (147 | 1.9%), Venezuelan (147 | 1.9%), and West Indian (147 | 1.9%), together accounting for 100.7% of all Heber residents.
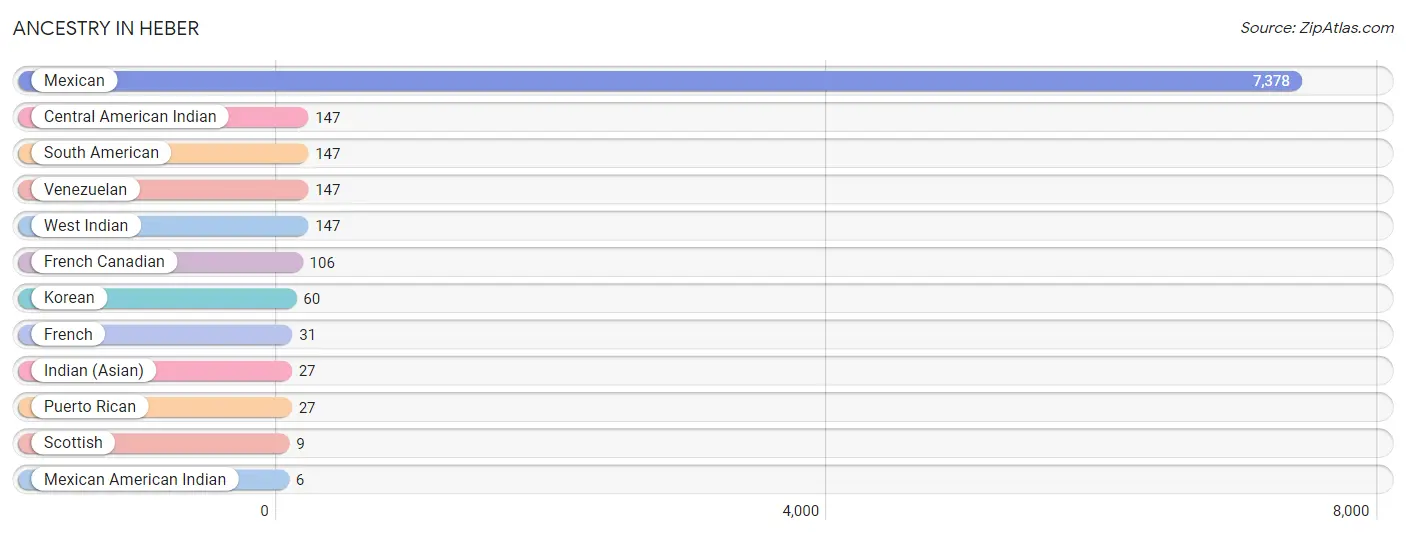
| Ancestry | # Population | % Population |
| Central American Indian | 147 | 1.9% |
| French | 31 | 0.4% |
| French Canadian | 106 | 1.3% |
| Indian (Asian) | 27 | 0.3% |
| Korean | 60 | 0.8% |
| Mexican | 7,378 | 93.3% |
| Mexican American Indian | 6 | 0.1% |
| Puerto Rican | 27 | 0.3% |
| Scottish | 9 | 0.1% |
| South American | 147 | 1.9% |
| Venezuelan | 147 | 1.9% |
| West Indian | 147 | 1.9% | View All 12 Rows |
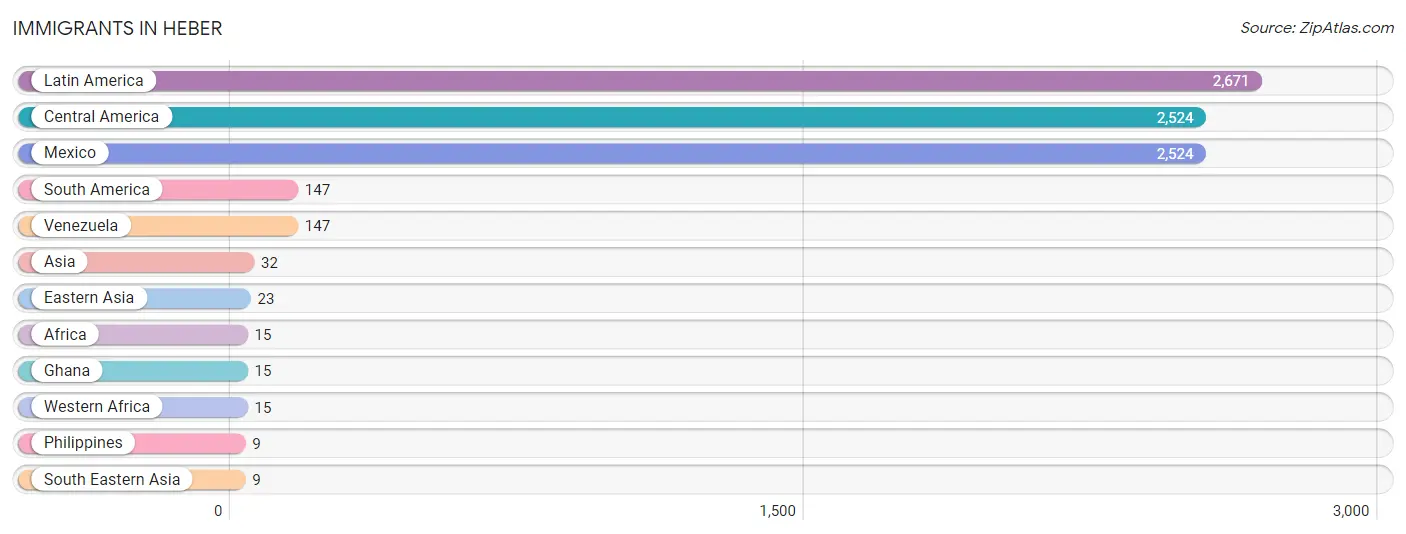
Immigrants in Heber
The most numerous immigrant groups reported in Heber came from Latin America (2,671 | 33.8%), Central America (2,524 | 31.9%), Mexico (2,524 | 31.9%), South America (147 | 1.9%), and Venezuela (147 | 1.9%), together accounting for 101.3% of all Heber residents.
| Immigration Origin | # Population | % Population |
| Africa | 15 | 0.2% |
| Asia | 32 | 0.4% |
| Central America | 2,524 | 31.9% |
| Eastern Asia | 23 | 0.3% |
| Ghana | 15 | 0.2% |
| Latin America | 2,671 | 33.8% |
| Mexico | 2,524 | 31.9% |
| Philippines | 9 | 0.1% |
| South America | 147 | 1.9% |
| South Eastern Asia | 9 | 0.1% |
| Venezuela | 147 | 1.9% |
| Western Africa | 15 | 0.2% | View All 12 Rows |
Sex and Age in Heber
Sex and Age in Heber
The most populous age groups in Heber are 30 to 34 Years (563 | 13.2%) for men and Under 5 Years (464 | 12.8%) for women.
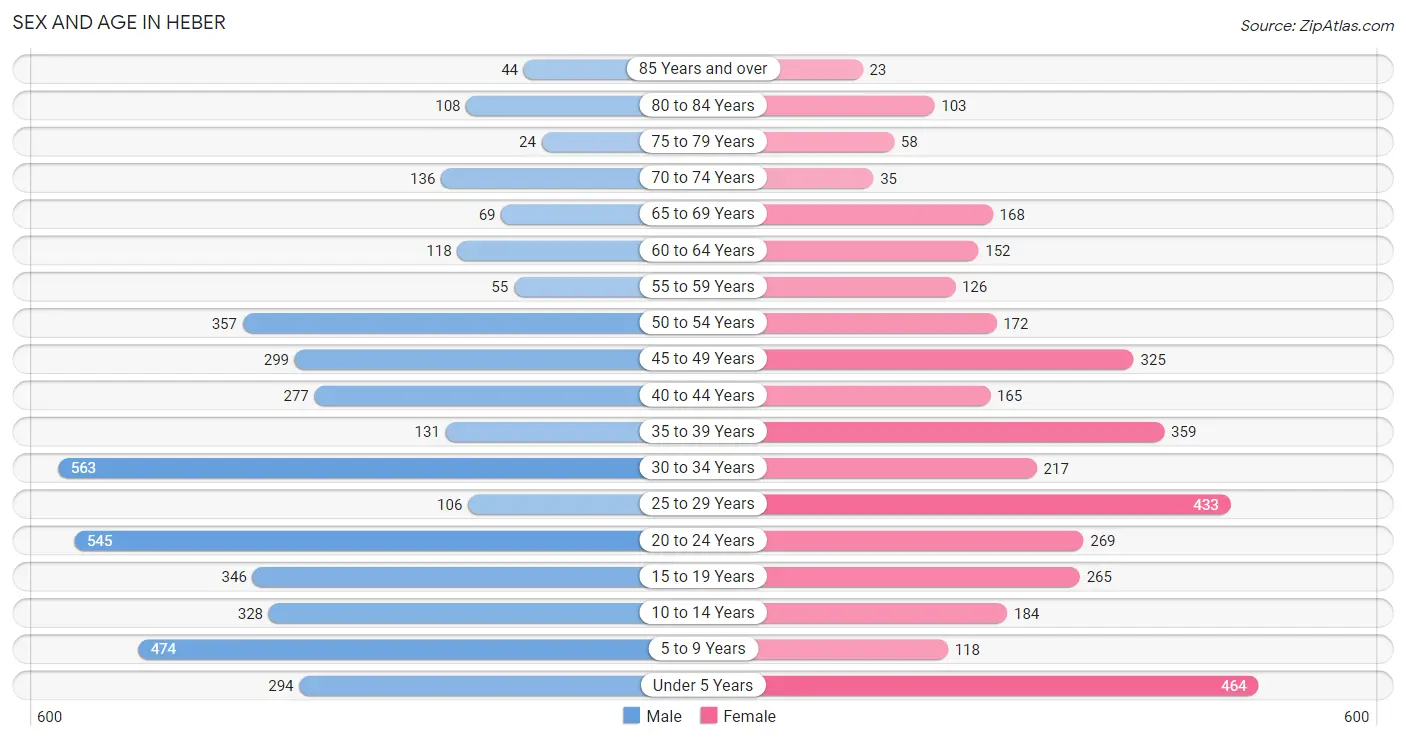
| Age Bracket | Male | Female |
| Under 5 Years | 294 (6.9%) | 464 (12.8%) |
| 5 to 9 Years | 474 (11.1%) | 118 (3.3%) |
| 10 to 14 Years | 328 (7.7%) | 184 (5.1%) |
| 15 to 19 Years | 346 (8.1%) | 265 (7.3%) |
| 20 to 24 Years | 545 (12.8%) | 269 (7.4%) |
| 25 to 29 Years | 106 (2.5%) | 433 (11.9%) |
| 30 to 34 Years | 563 (13.2%) | 217 (6.0%) |
| 35 to 39 Years | 131 (3.1%) | 359 (9.9%) |
| 40 to 44 Years | 277 (6.5%) | 165 (4.5%) |
| 45 to 49 Years | 299 (7.0%) | 325 (8.9%) |
| 50 to 54 Years | 357 (8.4%) | 172 (4.7%) |
| 55 to 59 Years | 55 (1.3%) | 126 (3.5%) |
| 60 to 64 Years | 118 (2.8%) | 152 (4.2%) |
| 65 to 69 Years | 69 (1.6%) | 168 (4.6%) |
| 70 to 74 Years | 136 (3.2%) | 35 (1.0%) |
| 75 to 79 Years | 24 (0.6%) | 58 (1.6%) |
| 80 to 84 Years | 108 (2.5%) | 103 (2.8%) |
| 85 Years and over | 44 (1.0%) | 23 (0.6%) |
| Total | 4,274 (100.0%) | 3,636 (100.0%) |
Families and Households in Heber
Median Family Size in Heber
The median family size in Heber is 4.50 persons per family, with married-couple families (978 | 61.6%) accounting for the largest median family size of 5.32 persons per family. On the other hand, single male/father families (285 | 17.9%) represent the smallest median family size with 2.84 persons per family.
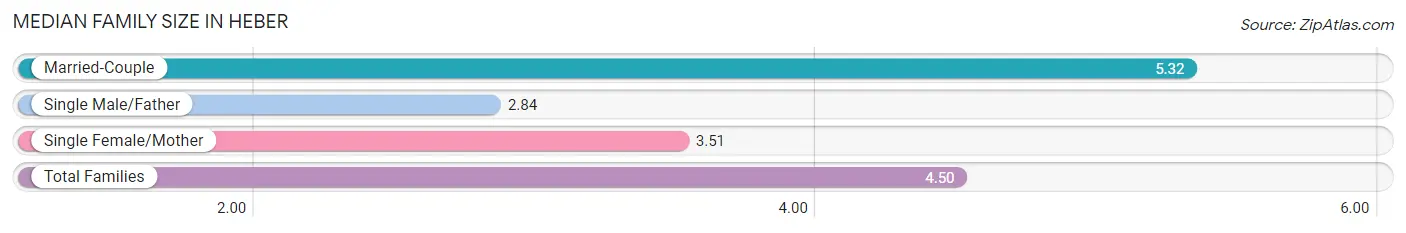
| Family Type | # Families | Family Size |
| Married-Couple | 978 (61.6%) | 5.32 |
| Single Male/Father | 285 (17.9%) | 2.84 |
| Single Female/Mother | 325 (20.5%) | 3.51 |
| Total Families | 1,588 (100.0%) | 4.50 |
Median Household Size in Heber
The median household size in Heber is 4.31 persons per household, with married-couple households (978 | 53.3%) accounting for the largest median household size of 5.41 persons per household. non-family households (246 | 13.4%) represent the smallest median household size with 1.59 persons per household.
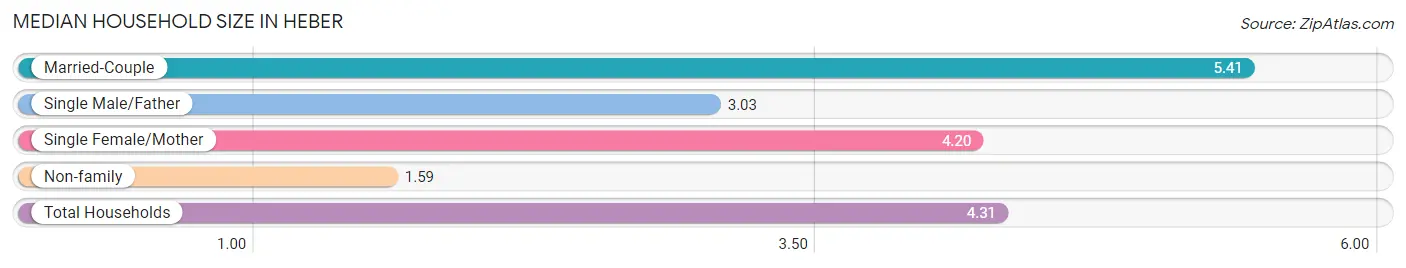
| Household Type | # Households | Household Size |
| Married-Couple | 978 (53.3%) | 5.41 |
| Single Male/Father | 285 (15.5%) | 3.03 |
| Single Female/Mother | 325 (17.7%) | 4.20 |
| Non-family | 246 (13.4%) | 1.59 |
| Total Households | 1,834 (100.0%) | 4.31 |
Household Size by Marriage Status in Heber
Out of a total of 1,834 households in Heber, 1,588 (86.6%) are family households, while 246 (13.4%) are nonfamily households. The most numerous type of family households are 2-person households, comprising 502, and the most common type of nonfamily households are 1-person households, comprising 195.
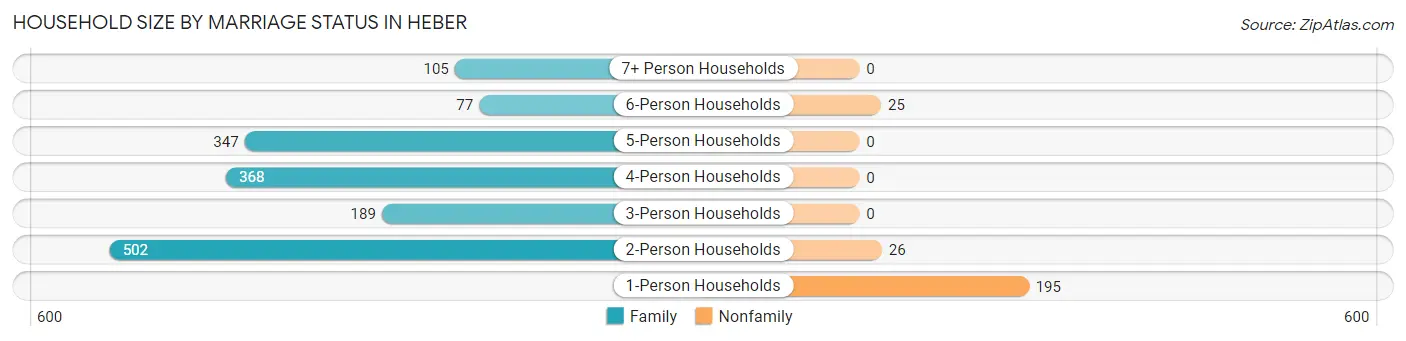
| Household Size | Family Households | Nonfamily Households |
| 1-Person Households | - | 195 (10.6%) |
| 2-Person Households | 502 (27.4%) | 26 (1.4%) |
| 3-Person Households | 189 (10.3%) | 0 (0.0%) |
| 4-Person Households | 368 (20.1%) | 0 (0.0%) |
| 5-Person Households | 347 (18.9%) | 0 (0.0%) |
| 6-Person Households | 77 (4.2%) | 25 (1.4%) |
| 7+ Person Households | 105 (5.7%) | 0 (0.0%) |
| Total | 1,588 (86.6%) | 246 (13.4%) |
Female Fertility in Heber
Fertility by Age in Heber
Average fertility rate in Heber is 8.0 births per 1,000 women. Women in the age bracket of 20 to 34 years have the highest fertility rate with 17.0 births per 1,000 women. Women in the age bracket of 20 to 34 years acount for 100.0% of all women with births.
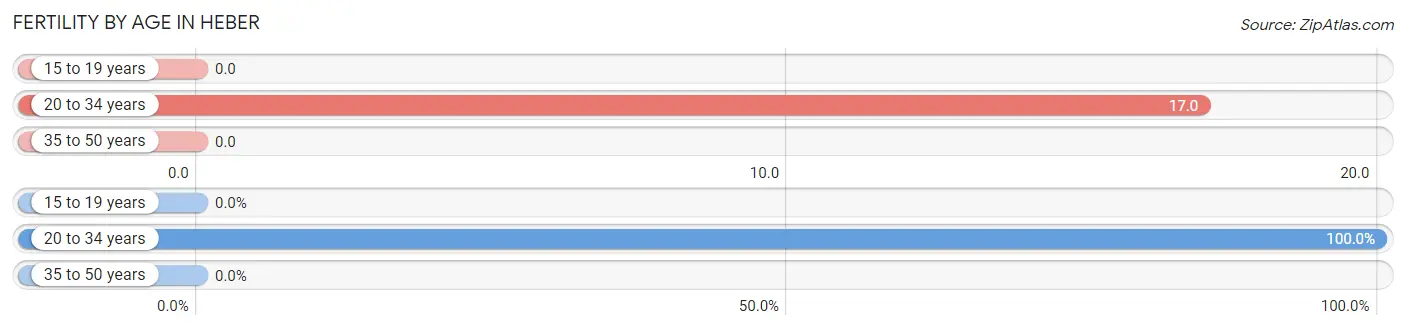
| Age Bracket | Women with Births | Births / 1,000 Women |
| 15 to 19 years | 0 (0.0%) | 0.0 |
| 20 to 34 years | 16 (100.0%) | 17.0 |
| 35 to 50 years | 0 (0.0%) | 0.0 |
| Total | 16 (100.0%) | 8.0 |
Fertility by Age by Marriage Status in Heber
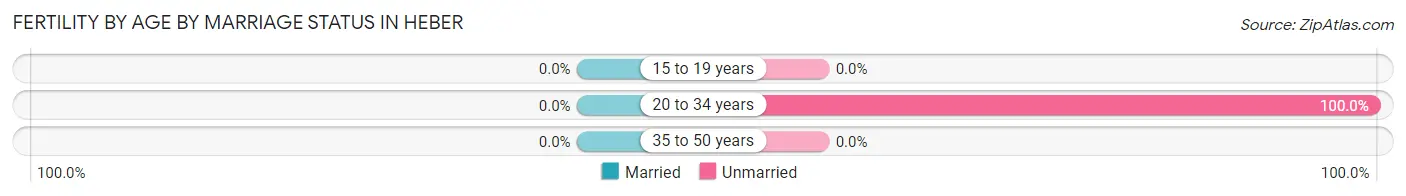
| Age Bracket | Married | Unmarried |
| 15 to 19 years | 0 (0.0%) | 0 (0.0%) |
| 20 to 34 years | 0 (0.0%) | 16 (100.0%) |
| 35 to 50 years | 0 (0.0%) | 0 (0.0%) |
| Total | 0 (0.0%) | 16 (100.0%) |
Fertility by Education in Heber
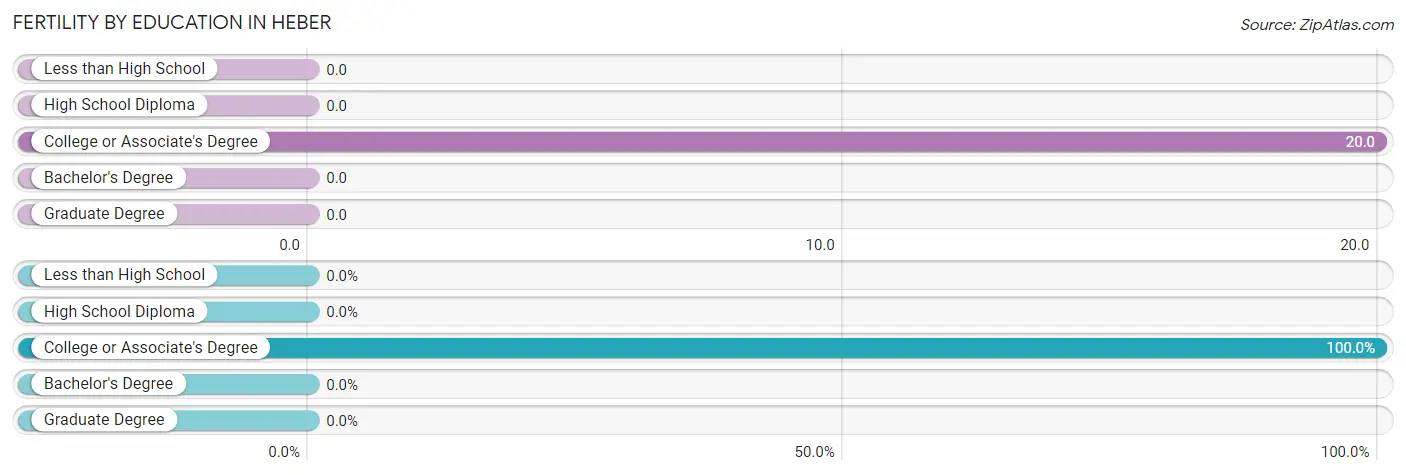
| Educational Attainment | Women with Births | Births / 1,000 Women |
| Less than High School | 0 (0.0%) | 0.0 |
| High School Diploma | 0 (0.0%) | 0.0 |
| College or Associate's Degree | 16 (100.0%) | 20.0 |
| Bachelor's Degree | 0 (0.0%) | 0.0 |
| Graduate Degree | 0 (0.0%) | 0.0 |
| Total | 16 (100.0%) | 8.0 |
Fertility by Education by Marriage Status in Heber
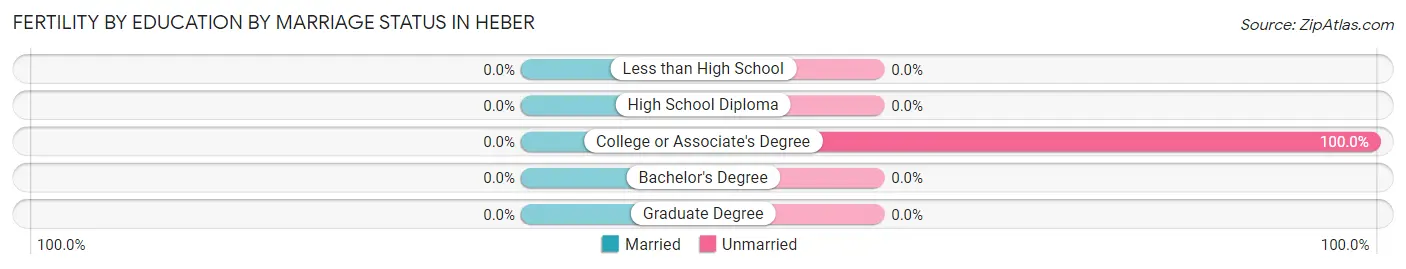
| Educational Attainment | Married | Unmarried |
| Less than High School | 0 (0.0%) | 0 (0.0%) |
| High School Diploma | 0 (0.0%) | 0 (0.0%) |
| College or Associate's Degree | 0 (0.0%) | 16 (100.0%) |
| Bachelor's Degree | 0 (0.0%) | 0 (0.0%) |
| Graduate Degree | 0 (0.0%) | 0 (0.0%) |
| Total | 0 (0.0%) | 16 (100.0%) |
Employment Characteristics in Heber
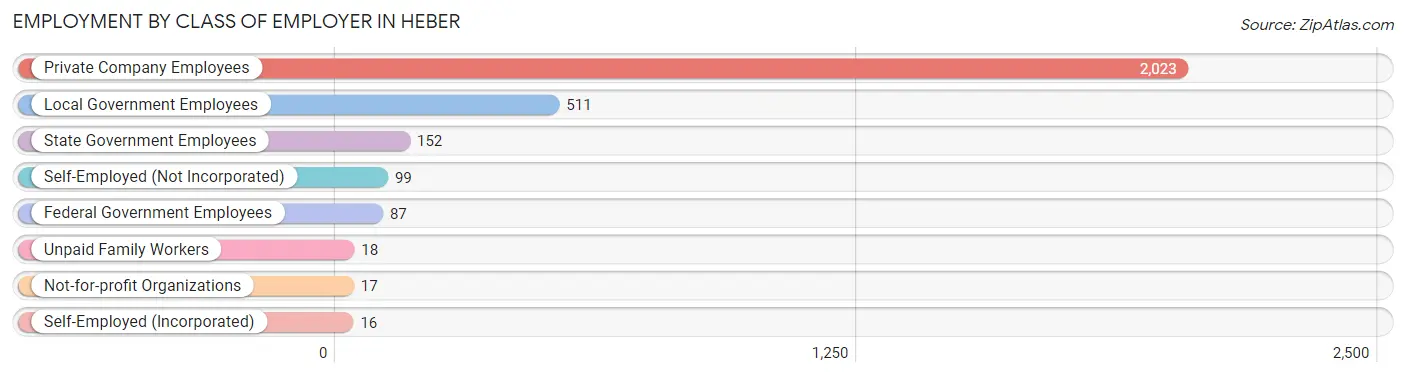
Employment by Class of Employer in Heber
Among the 2,923 employed individuals in Heber, private company employees (2,023 | 69.2%), local government employees (511 | 17.5%), and state government employees (152 | 5.2%) make up the most common classes of employment.
| Employer Class | # Employees | % Employees |
| Private Company Employees | 2,023 | 69.2% |
| Self-Employed (Incorporated) | 16 | 0.5% |
| Self-Employed (Not Incorporated) | 99 | 3.4% |
| Not-for-profit Organizations | 17 | 0.6% |
| Local Government Employees | 511 | 17.5% |
| State Government Employees | 152 | 5.2% |
| Federal Government Employees | 87 | 3.0% |
| Unpaid Family Workers | 18 | 0.6% |
| Total | 2,923 | 100.0% |
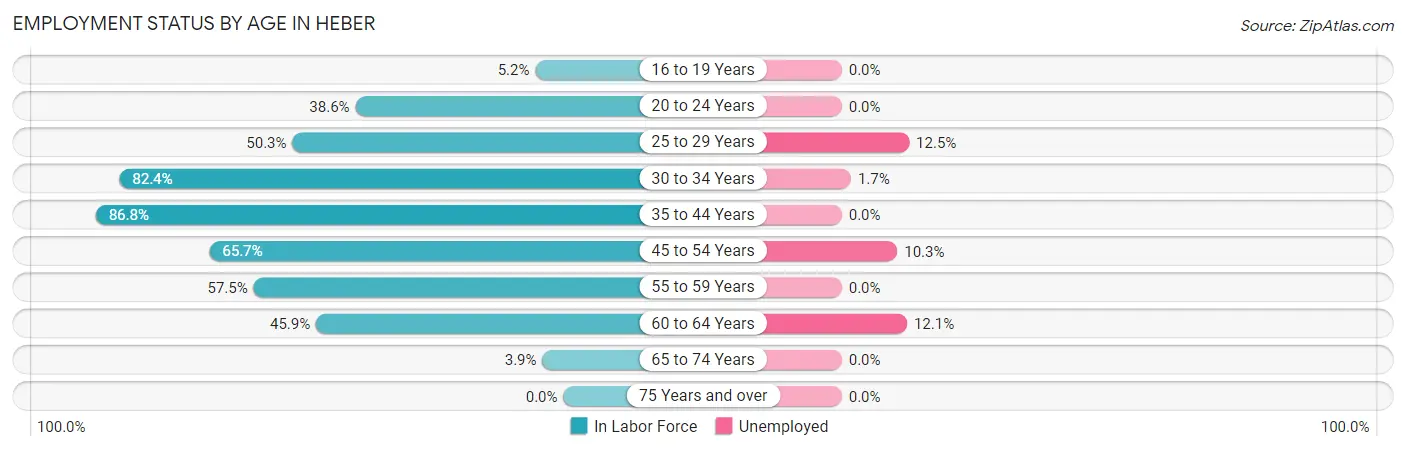
Employment Status by Age in Heber
According to the labor force statistics for Heber, out of the total population over 16 years of age (5,857), 52.3% or 3,063 individuals are in the labor force, with 4.5% or 138 of them unemployed. The age group with the highest labor force participation rate is 35 to 44 years, with 86.8% or 809 individuals in the labor force. Within the labor force, the 25 to 29 years age range has the highest percentage of unemployed individuals, with 12.5% or 34 of them being unemployed.
| Age Bracket | In Labor Force | Unemployed |
| 16 to 19 Years | 22 (5.2%) | 0 (0.0%) |
| 20 to 24 Years | 314 (38.6%) | 0 (0.0%) |
| 25 to 29 Years | 271 (50.3%) | 34 (12.5%) |
| 30 to 34 Years | 643 (82.4%) | 11 (1.7%) |
| 35 to 44 Years | 809 (86.8%) | 0 (0.0%) |
| 45 to 54 Years | 758 (65.7%) | 78 (10.3%) |
| 55 to 59 Years | 104 (57.5%) | 0 (0.0%) |
| 60 to 64 Years | 124 (45.9%) | 15 (12.1%) |
| 65 to 74 Years | 16 (3.9%) | 0 (0.0%) |
| 75 Years and over | 0 (0.0%) | 0 (0.0%) |
| Total | 3,063 (52.3%) | 138 (4.5%) |
Employment Status by Educational Attainment in Heber
According to labor force statistics for Heber, 70.3% of individuals (2,710) out of the total population between 25 and 64 years of age (3,855) are in the labor force, with 5.1% or 138 of them being unemployed. The group with the highest labor force participation rate are those with the educational attainment of high school diploma, with 74.8% or 865 individuals in the labor force. Within the labor force, individuals with bachelor's degree or higher education have the highest percentage of unemployment, with 16.1% or 104 of them being unemployed.
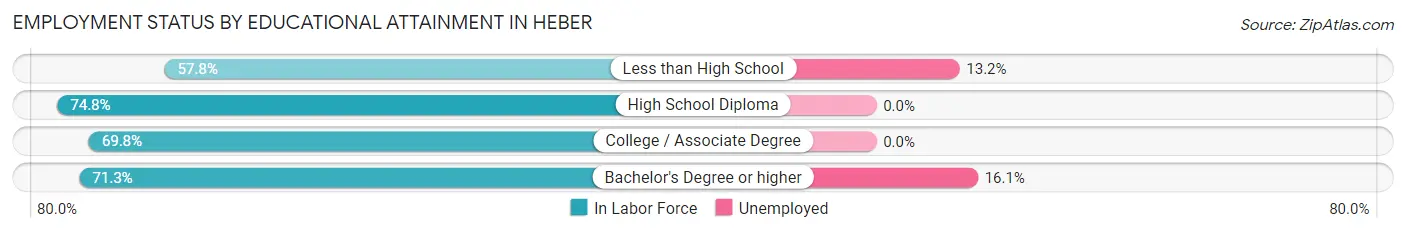
| Educational Attainment | In Labor Force | Unemployed |
| Less than High School | 257 (57.8%) | 59 (13.2%) |
| High School Diploma | 865 (74.8%) | 0 (0.0%) |
| College / Associate Degree | 942 (69.8%) | 0 (0.0%) |
| Bachelor's Degree or higher | 644 (71.3%) | 145 (16.1%) |
| Total | 2,710 (70.3%) | 197 (5.1%) |
Employment Occupations by Sex in Heber
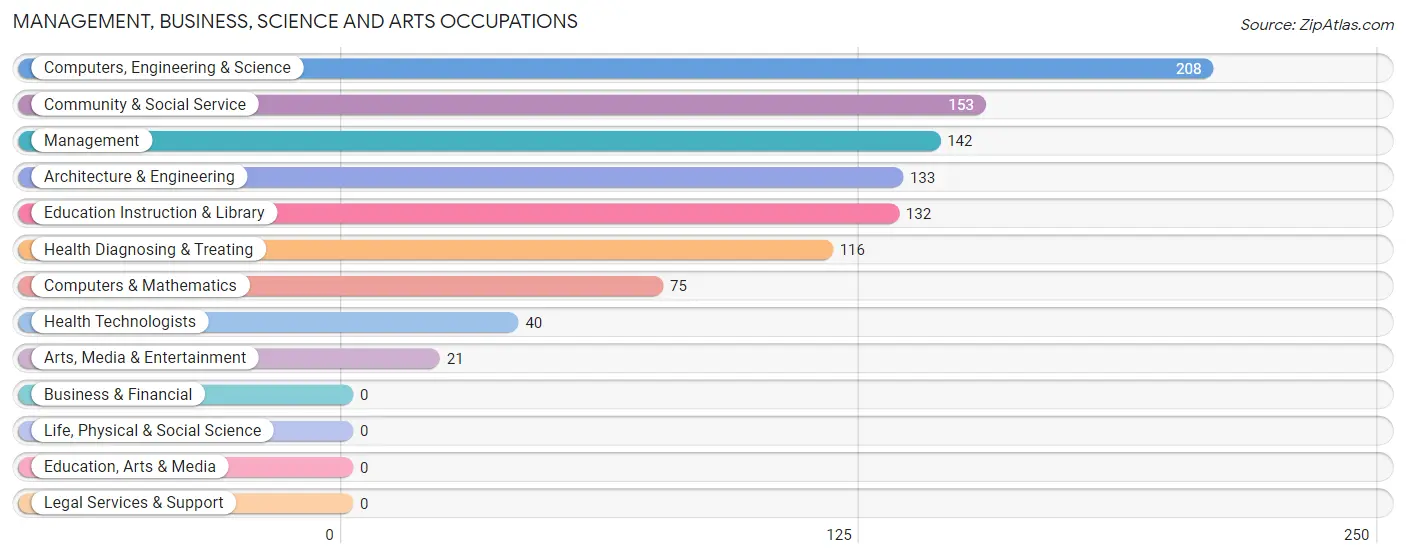
Management, Business, Science and Arts Occupations
The most common Management, Business, Science and Arts occupations in Heber are Computers, Engineering & Science (208 | 7.1%), Community & Social Service (153 | 5.2%), Management (142 | 4.9%), Architecture & Engineering (133 | 4.5%), and Education Instruction & Library (132 | 4.5%).
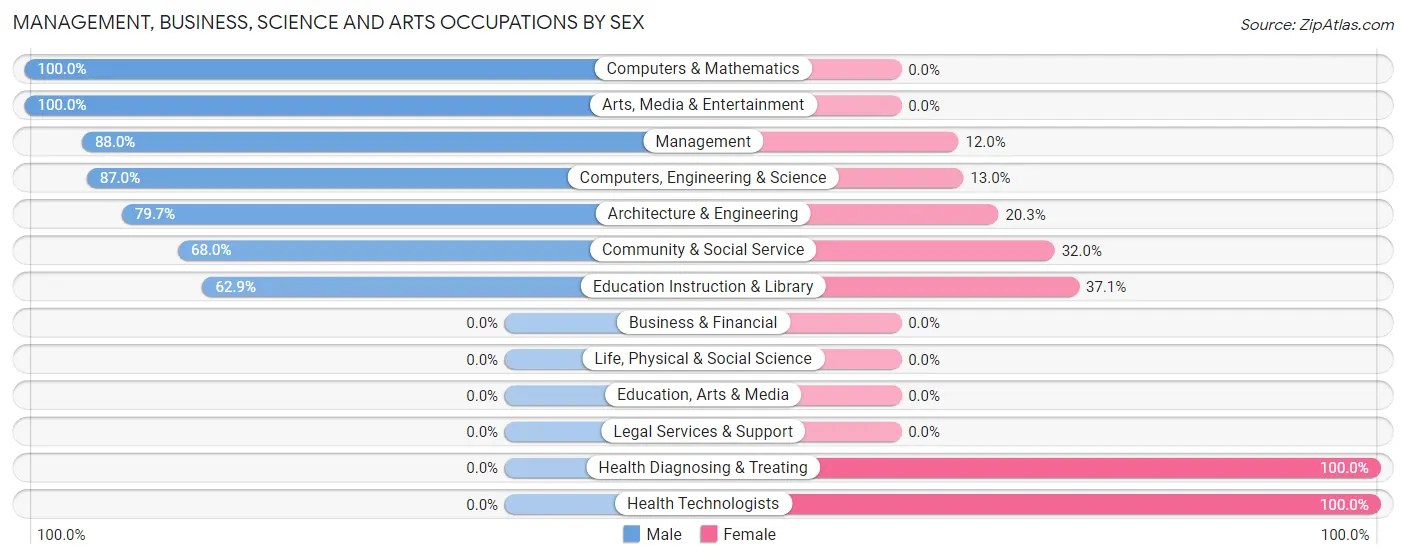
Management, Business, Science and Arts Occupations by Sex
Within the Management, Business, Science and Arts occupations in Heber, the most male-oriented occupations are Computers & Mathematics (100.0%), Arts, Media & Entertainment (100.0%), and Management (88.0%), while the most female-oriented occupations are Health Diagnosing & Treating (100.0%), Health Technologists (100.0%), and Education Instruction & Library (37.1%).
| Occupation | Male | Female |
| Management | 125 (88.0%) | 17 (12.0%) |
| Business & Financial | 0 (0.0%) | 0 (0.0%) |
| Computers, Engineering & Science | 181 (87.0%) | 27 (13.0%) |
| Computers & Mathematics | 75 (100.0%) | 0 (0.0%) |
| Architecture & Engineering | 106 (79.7%) | 27 (20.3%) |
| Life, Physical & Social Science | 0 (0.0%) | 0 (0.0%) |
| Community & Social Service | 104 (68.0%) | 49 (32.0%) |
| Education, Arts & Media | 0 (0.0%) | 0 (0.0%) |
| Legal Services & Support | 0 (0.0%) | 0 (0.0%) |
| Education Instruction & Library | 83 (62.9%) | 49 (37.1%) |
| Arts, Media & Entertainment | 21 (100.0%) | 0 (0.0%) |
| Health Diagnosing & Treating | 0 (0.0%) | 116 (100.0%) |
| Health Technologists | 0 (0.0%) | 40 (100.0%) |
| Total (Category) | 410 (66.2%) | 209 (33.8%) |
| Total (Overall) | 1,710 (58.5%) | 1,213 (41.5%) |
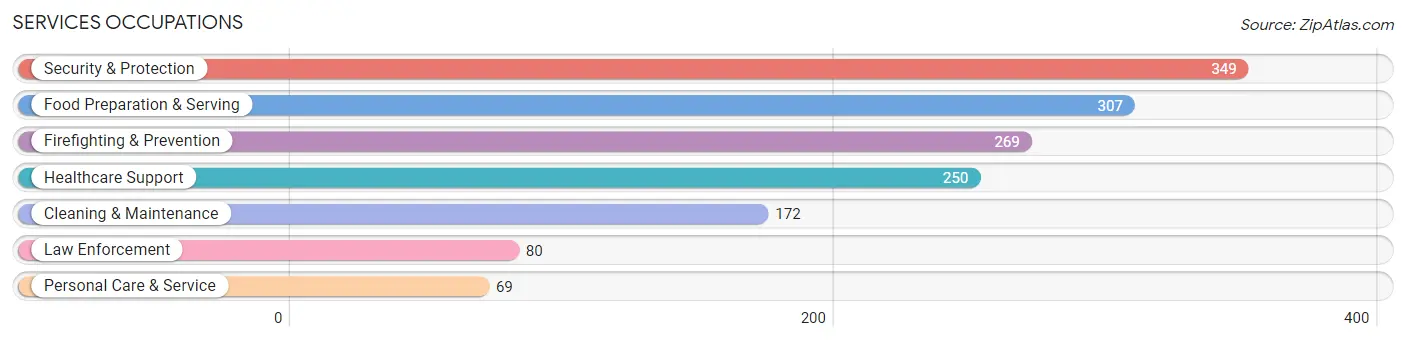
Services Occupations
The most common Services occupations in Heber are Security & Protection (349 | 11.9%), Food Preparation & Serving (307 | 10.5%), Firefighting & Prevention (269 | 9.2%), Healthcare Support (250 | 8.6%), and Cleaning & Maintenance (172 | 5.9%).
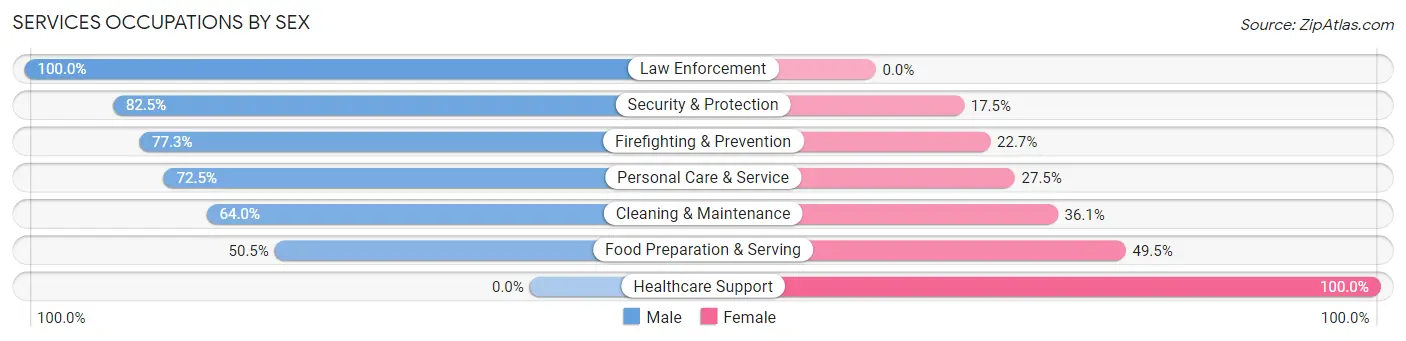
Services Occupations by Sex
Within the Services occupations in Heber, the most male-oriented occupations are Law Enforcement (100.0%), Security & Protection (82.5%), and Firefighting & Prevention (77.3%), while the most female-oriented occupations are Healthcare Support (100.0%), Food Preparation & Serving (49.5%), and Cleaning & Maintenance (36.0%).
| Occupation | Male | Female |
| Healthcare Support | 0 (0.0%) | 250 (100.0%) |
| Security & Protection | 288 (82.5%) | 61 (17.5%) |
| Firefighting & Prevention | 208 (77.3%) | 61 (22.7%) |
| Law Enforcement | 80 (100.0%) | 0 (0.0%) |
| Food Preparation & Serving | 155 (50.5%) | 152 (49.5%) |
| Cleaning & Maintenance | 110 (63.9%) | 62 (36.0%) |
| Personal Care & Service | 50 (72.5%) | 19 (27.5%) |
| Total (Category) | 603 (52.6%) | 544 (47.4%) |
| Total (Overall) | 1,710 (58.5%) | 1,213 (41.5%) |
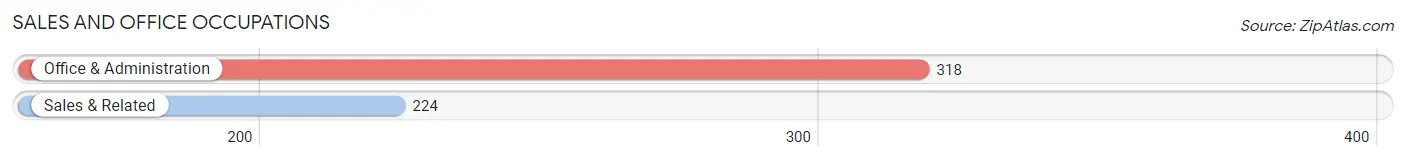
Sales and Office Occupations
The most common Sales and Office occupations in Heber are Office & Administration (318 | 10.9%), and Sales & Related (224 | 7.7%).
Sales and Office Occupations by Sex
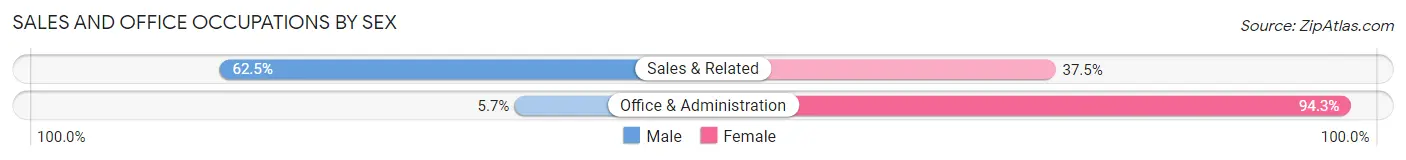
| Occupation | Male | Female |
| Sales & Related | 140 (62.5%) | 84 (37.5%) |
| Office & Administration | 18 (5.7%) | 300 (94.3%) |
| Total (Category) | 158 (29.1%) | 384 (70.9%) |
| Total (Overall) | 1,710 (58.5%) | 1,213 (41.5%) |
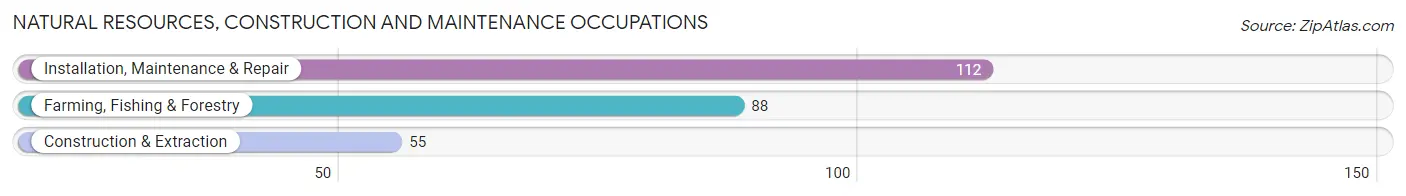
Natural Resources, Construction and Maintenance Occupations
The most common Natural Resources, Construction and Maintenance occupations in Heber are Installation, Maintenance & Repair (112 | 3.8%), Farming, Fishing & Forestry (88 | 3.0%), and Construction & Extraction (55 | 1.9%).
Natural Resources, Construction and Maintenance Occupations by Sex
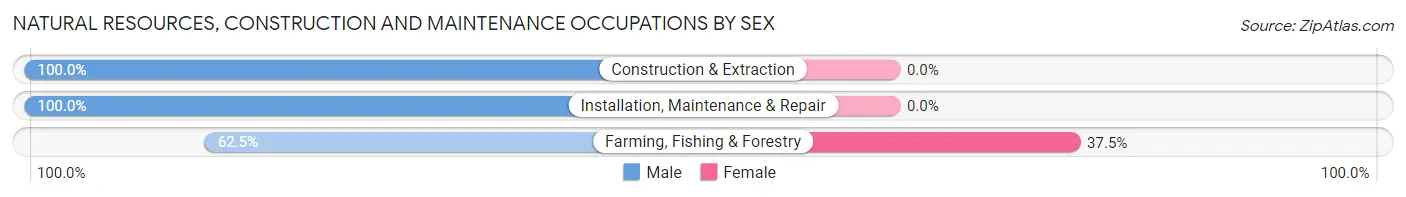
| Occupation | Male | Female |
| Farming, Fishing & Forestry | 55 (62.5%) | 33 (37.5%) |
| Construction & Extraction | 55 (100.0%) | 0 (0.0%) |
| Installation, Maintenance & Repair | 112 (100.0%) | 0 (0.0%) |
| Total (Category) | 222 (87.1%) | 33 (12.9%) |
| Total (Overall) | 1,710 (58.5%) | 1,213 (41.5%) |
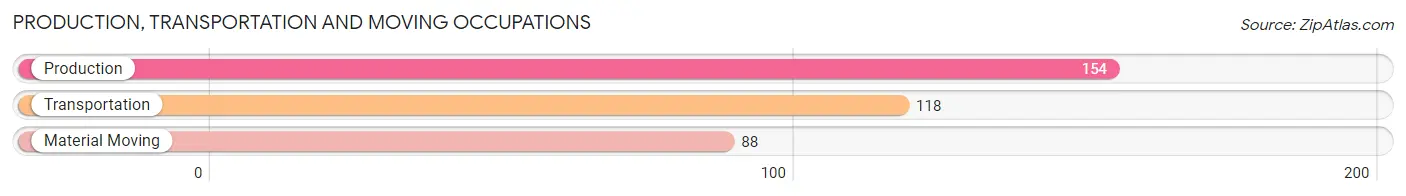
Production, Transportation and Moving Occupations
The most common Production, Transportation and Moving occupations in Heber are Production (154 | 5.3%), Transportation (118 | 4.0%), and Material Moving (88 | 3.0%).
Production, Transportation and Moving Occupations by Sex
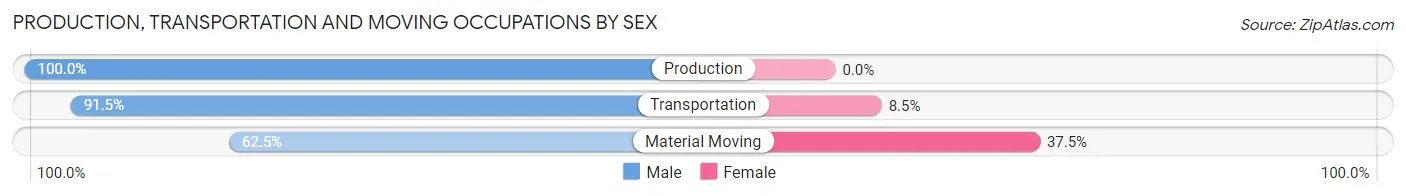
| Occupation | Male | Female |
| Production | 154 (100.0%) | 0 (0.0%) |
| Transportation | 108 (91.5%) | 10 (8.5%) |
| Material Moving | 55 (62.5%) | 33 (37.5%) |
| Total (Category) | 317 (88.1%) | 43 (11.9%) |
| Total (Overall) | 1,710 (58.5%) | 1,213 (41.5%) |
Employment Industries by Sex in Heber
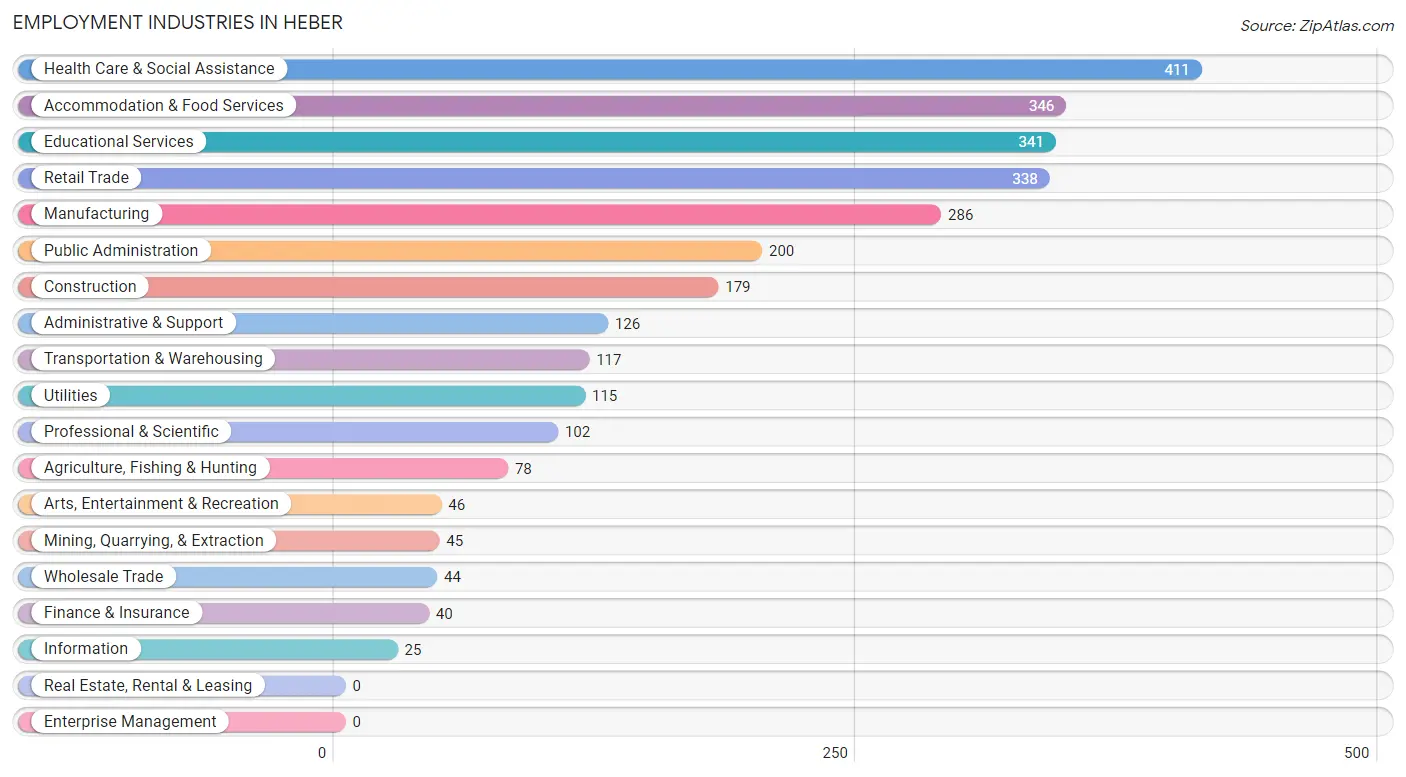
Employment Industries in Heber
The major employment industries in Heber include Health Care & Social Assistance (411 | 14.1%), Accommodation & Food Services (346 | 11.8%), Educational Services (341 | 11.7%), Retail Trade (338 | 11.6%), and Manufacturing (286 | 9.8%).
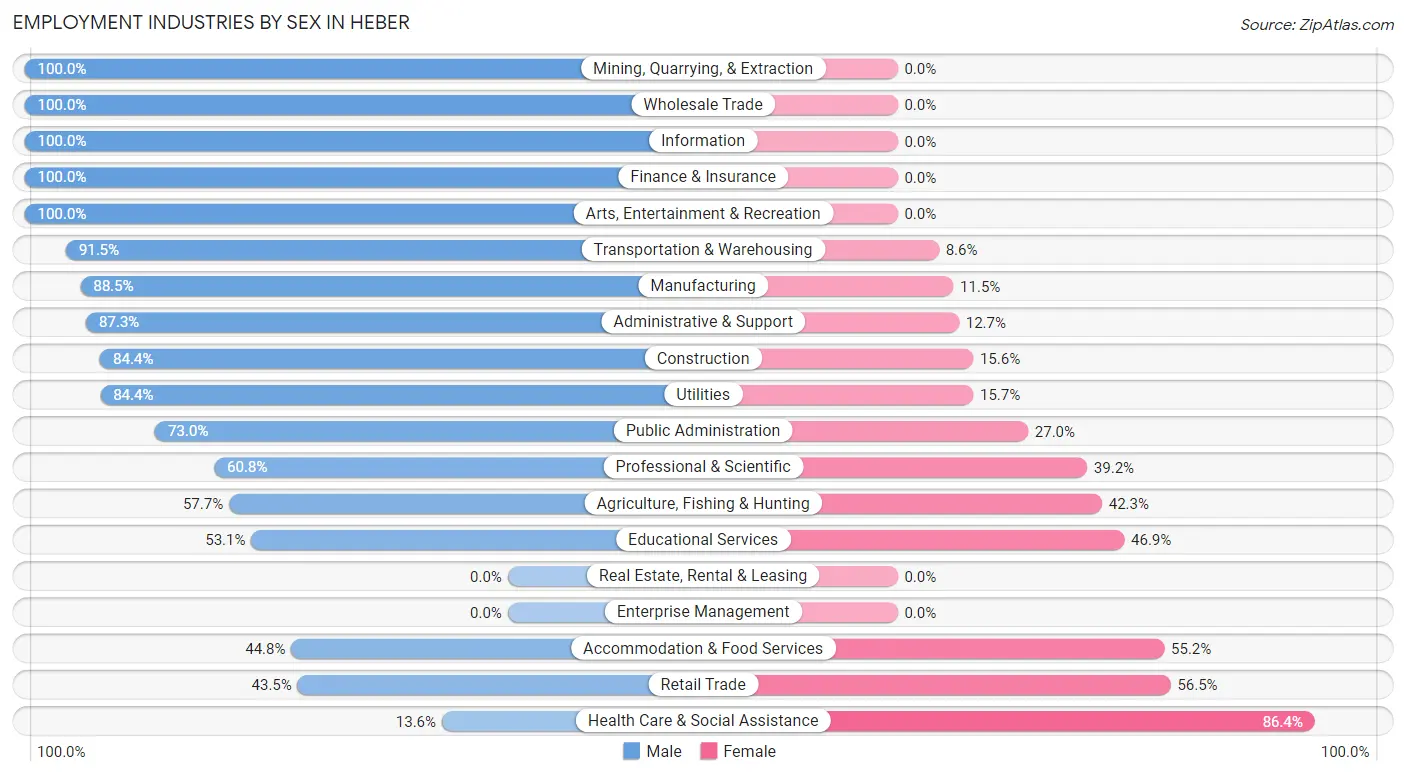
Employment Industries by Sex in Heber
The Heber industries that see more men than women are Mining, Quarrying, & Extraction (100.0%), Wholesale Trade (100.0%), and Information (100.0%), whereas the industries that tend to have a higher number of women are Health Care & Social Assistance (86.4%), Retail Trade (56.5%), and Accommodation & Food Services (55.2%).
| Industry | Male | Female |
| Agriculture, Fishing & Hunting | 45 (57.7%) | 33 (42.3%) |
| Mining, Quarrying, & Extraction | 45 (100.0%) | 0 (0.0%) |
| Construction | 151 (84.4%) | 28 (15.6%) |
| Manufacturing | 253 (88.5%) | 33 (11.5%) |
| Wholesale Trade | 44 (100.0%) | 0 (0.0%) |
| Retail Trade | 147 (43.5%) | 191 (56.5%) |
| Transportation & Warehousing | 107 (91.4%) | 10 (8.6%) |
| Utilities | 97 (84.4%) | 18 (15.7%) |
| Information | 25 (100.0%) | 0 (0.0%) |
| Finance & Insurance | 40 (100.0%) | 0 (0.0%) |
| Real Estate, Rental & Leasing | 0 (0.0%) | 0 (0.0%) |
| Professional & Scientific | 62 (60.8%) | 40 (39.2%) |
| Enterprise Management | 0 (0.0%) | 0 (0.0%) |
| Administrative & Support | 110 (87.3%) | 16 (12.7%) |
| Educational Services | 181 (53.1%) | 160 (46.9%) |
| Health Care & Social Assistance | 56 (13.6%) | 355 (86.4%) |
| Arts, Entertainment & Recreation | 46 (100.0%) | 0 (0.0%) |
| Accommodation & Food Services | 155 (44.8%) | 191 (55.2%) |
| Public Administration | 146 (73.0%) | 54 (27.0%) |
| Total | 1,710 (58.5%) | 1,213 (41.5%) |
Education in Heber
School Enrollment in Heber
The most common levels of schooling among the 2,543 students in Heber are college / undergraduate (666 | 26.2%), high school (560 | 22.0%), and middle school (454 | 17.8%).
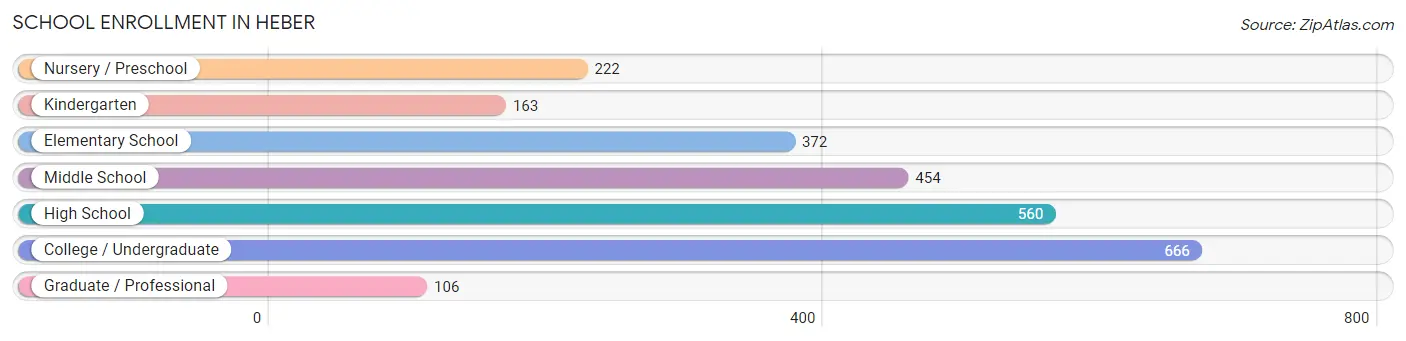
| School Level | # Students | % Students |
| Nursery / Preschool | 222 | 8.7% |
| Kindergarten | 163 | 6.4% |
| Elementary School | 372 | 14.6% |
| Middle School | 454 | 17.8% |
| High School | 560 | 22.0% |
| College / Undergraduate | 666 | 26.2% |
| Graduate / Professional | 106 | 4.2% |
| Total | 2,543 | 100.0% |
School Enrollment by Age by Funding Source in Heber
Out of a total of 2,543 students who are enrolled in schools in Heber, 132 (5.2%) attend a private institution, while the remaining 2,411 (94.8%) are enrolled in public schools. The age group of 3 to 4 year olds has the highest likelihood of being enrolled in private schools, with 34 (20.6% in the age bracket) enrolled. Conversely, the age group of 15 to 17 year olds has the lowest likelihood of being enrolled in a private school, with 407 (100.0% in the age bracket) attending a public institution.
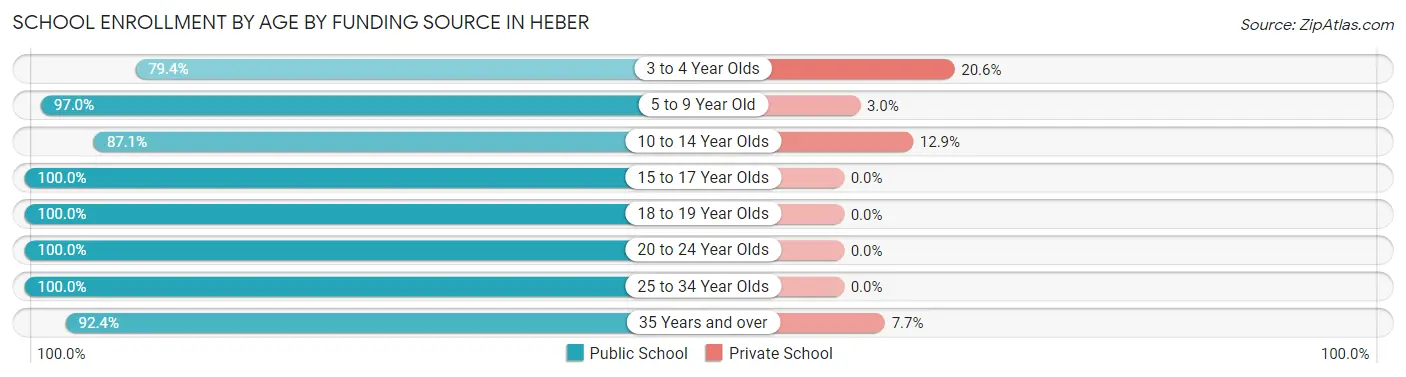
| Age Bracket | Public School | Private School |
| 3 to 4 Year Olds | 131 (79.4%) | 34 (20.6%) |
| 5 to 9 Year Old | 574 (97.0%) | 18 (3.0%) |
| 10 to 14 Year Olds | 446 (87.1%) | 66 (12.9%) |
| 15 to 17 Year Olds | 407 (100.0%) | 0 (0.0%) |
| 18 to 19 Year Olds | 151 (100.0%) | 0 (0.0%) |
| 20 to 24 Year Olds | 324 (100.0%) | 0 (0.0%) |
| 25 to 34 Year Olds | 222 (100.0%) | 0 (0.0%) |
| 35 Years and over | 157 (92.3%) | 13 (7.6%) |
| Total | 2,411 (94.8%) | 132 (5.2%) |
Educational Attainment by Field of Study in Heber
Business (202 | 20.8%), engineering (194 | 20.0%), psychology (149 | 15.3%), education (123 | 12.7%), and social sciences (82 | 8.4%) are the most common fields of study among 971 individuals in Heber who have obtained a bachelor's degree or higher.
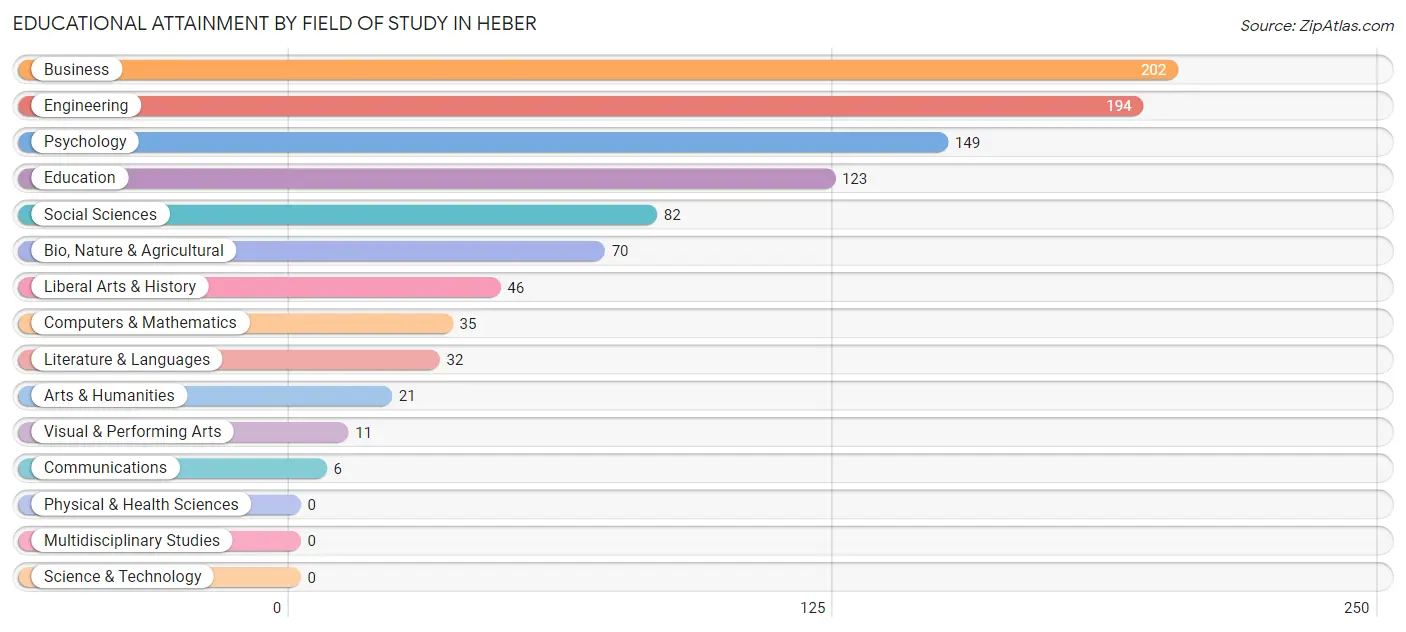
| Field of Study | # Graduates | % Graduates |
| Computers & Mathematics | 35 | 3.6% |
| Bio, Nature & Agricultural | 70 | 7.2% |
| Physical & Health Sciences | 0 | 0.0% |
| Psychology | 149 | 15.3% |
| Social Sciences | 82 | 8.4% |
| Engineering | 194 | 20.0% |
| Multidisciplinary Studies | 0 | 0.0% |
| Science & Technology | 0 | 0.0% |
| Business | 202 | 20.8% |
| Education | 123 | 12.7% |
| Literature & Languages | 32 | 3.3% |
| Liberal Arts & History | 46 | 4.7% |
| Visual & Performing Arts | 11 | 1.1% |
| Communications | 6 | 0.6% |
| Arts & Humanities | 21 | 2.2% |
| Total | 971 | 100.0% |
Transportation & Commute in Heber
Vehicle Availability by Sex in Heber
The most prevalent vehicle ownership categories in Heber are males with 1 vehicle (450, accounting for 26.3%) and females with 1 vehicle (424, making up 37.1%).
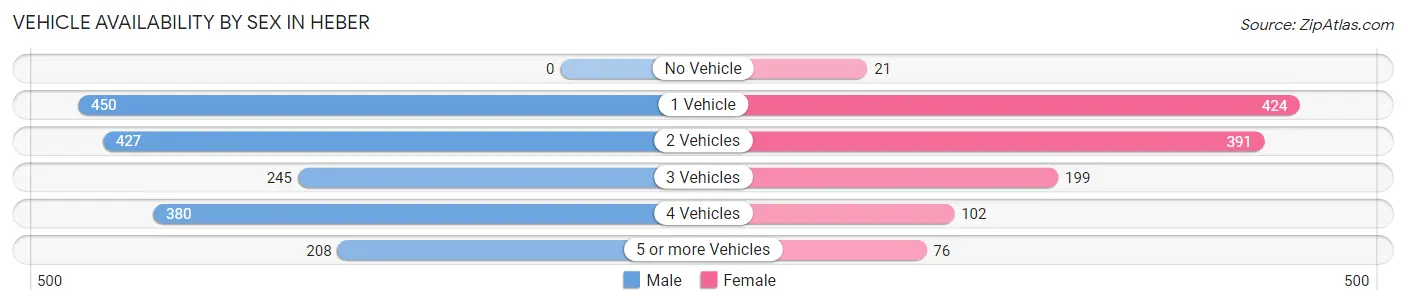
| Vehicles Available | Male | Female |
| No Vehicle | 0 (0.0%) | 21 (1.7%) |
| 1 Vehicle | 450 (26.3%) | 424 (34.9%) |
| 2 Vehicles | 427 (25.0%) | 391 (32.2%) |
| 3 Vehicles | 245 (14.3%) | 199 (16.4%) |
| 4 Vehicles | 380 (22.2%) | 102 (8.4%) |
| 5 or more Vehicles | 208 (12.2%) | 76 (6.3%) |
| Total | 1,710 (100.0%) | 1,213 (100.0%) |
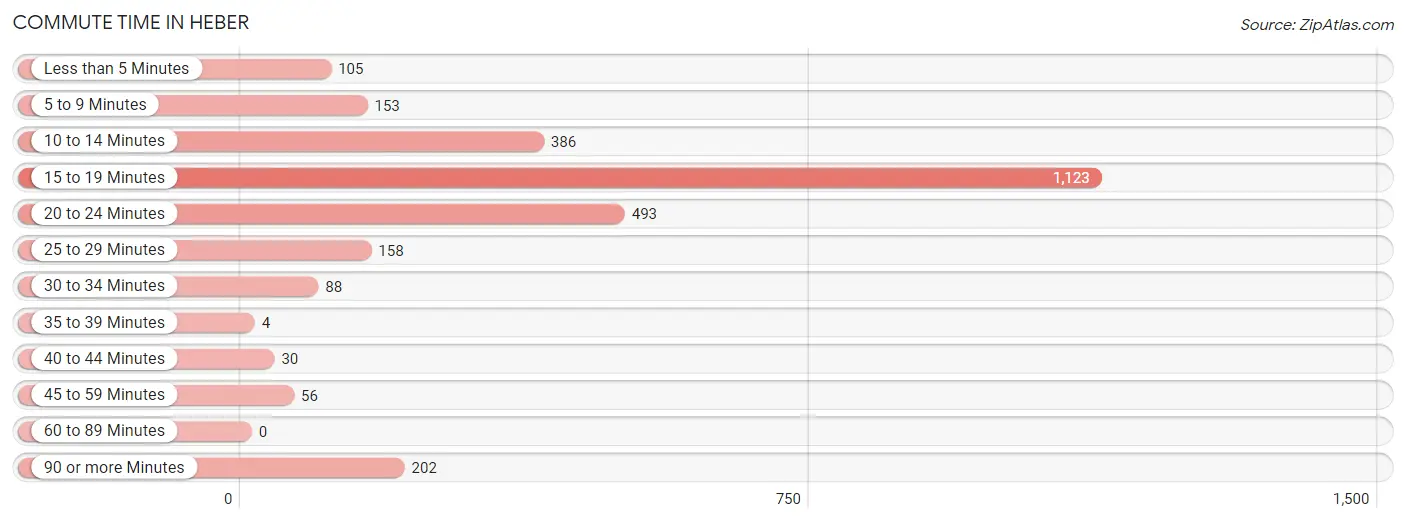
Commute Time in Heber
The most frequently occuring commute durations in Heber are 15 to 19 minutes (1,123 commuters, 40.1%), 20 to 24 minutes (493 commuters, 17.6%), and 10 to 14 minutes (386 commuters, 13.8%).
| Commute Time | # Commuters | % Commuters |
| Less than 5 Minutes | 105 | 3.7% |
| 5 to 9 Minutes | 153 | 5.5% |
| 10 to 14 Minutes | 386 | 13.8% |
| 15 to 19 Minutes | 1,123 | 40.1% |
| 20 to 24 Minutes | 493 | 17.6% |
| 25 to 29 Minutes | 158 | 5.7% |
| 30 to 34 Minutes | 88 | 3.2% |
| 35 to 39 Minutes | 4 | 0.1% |
| 40 to 44 Minutes | 30 | 1.1% |
| 45 to 59 Minutes | 56 | 2.0% |
| 60 to 89 Minutes | 0 | 0.0% |
| 90 or more Minutes | 202 | 7.2% |
Commute Time by Sex in Heber
The most common commute times in Heber are 15 to 19 minutes (694 commuters, 41.1%) for males and 15 to 19 minutes (429 commuters, 38.7%) for females.
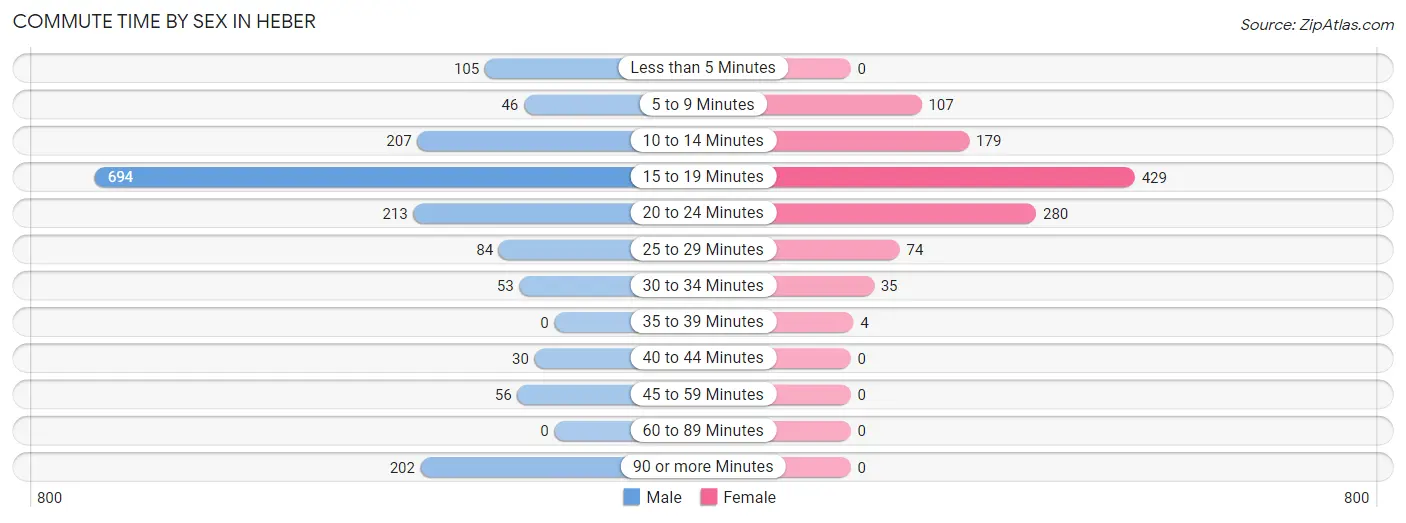
| Commute Time | Male | Female |
| Less than 5 Minutes | 105 (6.2%) | 0 (0.0%) |
| 5 to 9 Minutes | 46 (2.7%) | 107 (9.7%) |
| 10 to 14 Minutes | 207 (12.2%) | 179 (16.2%) |
| 15 to 19 Minutes | 694 (41.1%) | 429 (38.7%) |
| 20 to 24 Minutes | 213 (12.6%) | 280 (25.3%) |
| 25 to 29 Minutes | 84 (5.0%) | 74 (6.7%) |
| 30 to 34 Minutes | 53 (3.1%) | 35 (3.2%) |
| 35 to 39 Minutes | 0 (0.0%) | 4 (0.4%) |
| 40 to 44 Minutes | 30 (1.8%) | 0 (0.0%) |
| 45 to 59 Minutes | 56 (3.3%) | 0 (0.0%) |
| 60 to 89 Minutes | 0 (0.0%) | 0 (0.0%) |
| 90 or more Minutes | 202 (11.9%) | 0 (0.0%) |
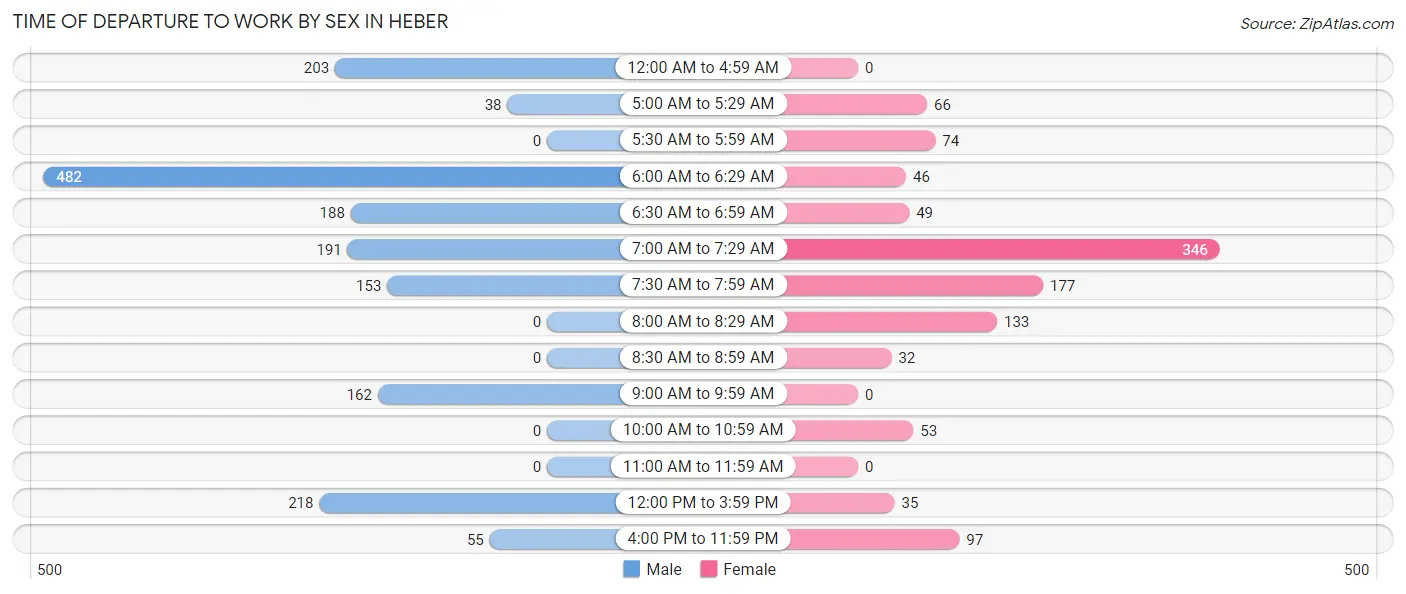
Time of Departure to Work by Sex in Heber
The most frequent times of departure to work in Heber are 6:00 AM to 6:29 AM (482, 28.5%) for males and 7:00 AM to 7:29 AM (346, 31.2%) for females.
| Time of Departure | Male | Female |
| 12:00 AM to 4:59 AM | 203 (12.0%) | 0 (0.0%) |
| 5:00 AM to 5:29 AM | 38 (2.2%) | 66 (6.0%) |
| 5:30 AM to 5:59 AM | 0 (0.0%) | 74 (6.7%) |
| 6:00 AM to 6:29 AM | 482 (28.5%) | 46 (4.2%) |
| 6:30 AM to 6:59 AM | 188 (11.1%) | 49 (4.4%) |
| 7:00 AM to 7:29 AM | 191 (11.3%) | 346 (31.2%) |
| 7:30 AM to 7:59 AM | 153 (9.0%) | 177 (16.0%) |
| 8:00 AM to 8:29 AM | 0 (0.0%) | 133 (12.0%) |
| 8:30 AM to 8:59 AM | 0 (0.0%) | 32 (2.9%) |
| 9:00 AM to 9:59 AM | 162 (9.6%) | 0 (0.0%) |
| 10:00 AM to 10:59 AM | 0 (0.0%) | 53 (4.8%) |
| 11:00 AM to 11:59 AM | 0 (0.0%) | 0 (0.0%) |
| 12:00 PM to 3:59 PM | 218 (12.9%) | 35 (3.2%) |
| 4:00 PM to 11:59 PM | 55 (3.3%) | 97 (8.7%) |
| Total | 1,690 (100.0%) | 1,108 (100.0%) |
Housing Occupancy in Heber
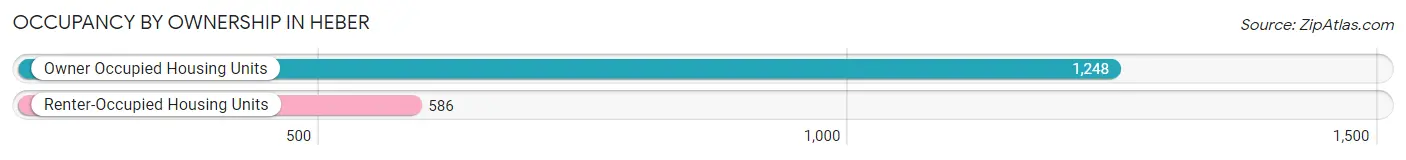
Occupancy by Ownership in Heber
Of the total 1,834 dwellings in Heber, owner-occupied units account for 1,248 (68.0%), while renter-occupied units make up 586 (32.0%).
| Occupancy | # Housing Units | % Housing Units |
| Owner Occupied Housing Units | 1,248 | 68.0% |
| Renter-Occupied Housing Units | 586 | 32.0% |
| Total Occupied Housing Units | 1,834 | 100.0% |
Occupancy by Household Size in Heber
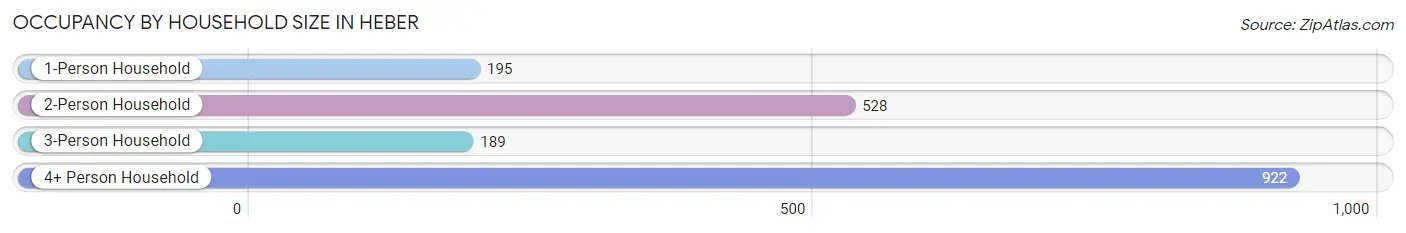
| Household Size | # Housing Units | % Housing Units |
| 1-Person Household | 195 | 10.6% |
| 2-Person Household | 528 | 28.8% |
| 3-Person Household | 189 | 10.3% |
| 4+ Person Household | 922 | 50.3% |
| Total Housing Units | 1,834 | 100.0% |
Occupancy by Ownership by Household Size in Heber
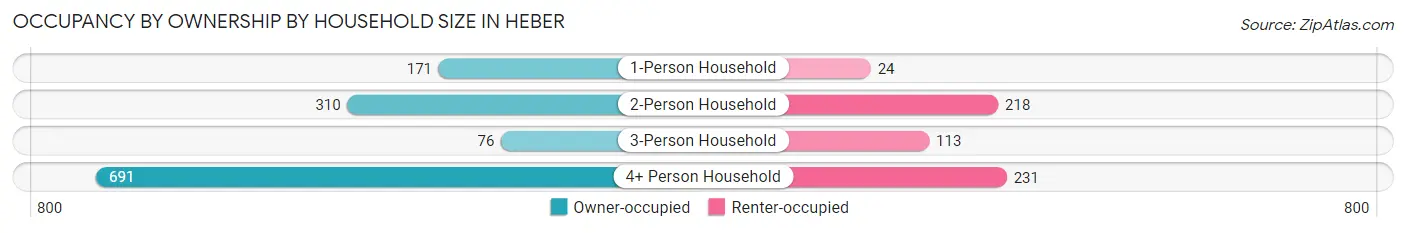
| Household Size | Owner-occupied | Renter-occupied |
| 1-Person Household | 171 (87.7%) | 24 (12.3%) |
| 2-Person Household | 310 (58.7%) | 218 (41.3%) |
| 3-Person Household | 76 (40.2%) | 113 (59.8%) |
| 4+ Person Household | 691 (75.0%) | 231 (25.1%) |
| Total Housing Units | 1,248 (68.0%) | 586 (32.0%) |
Occupancy by Educational Attainment in Heber
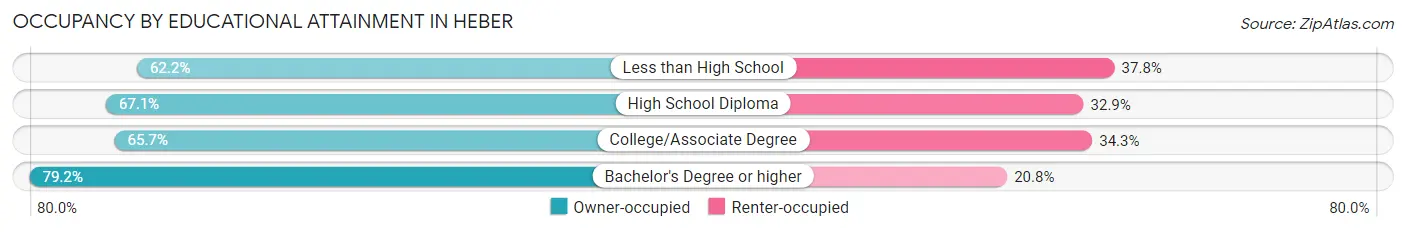
| Household Size | Owner-occupied | Renter-occupied |
| Less than High School | 263 (62.2%) | 160 (37.8%) |
| High School Diploma | 155 (67.1%) | 76 (32.9%) |
| College/Associate Degree | 510 (65.7%) | 266 (34.3%) |
| Bachelor's Degree or higher | 320 (79.2%) | 84 (20.8%) |
Occupancy by Age of Householder in Heber
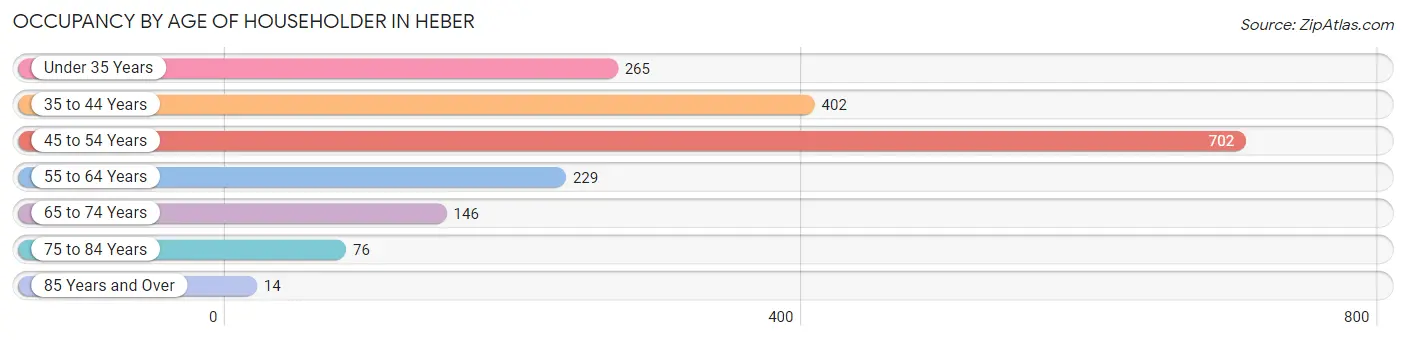
| Age Bracket | # Households | % Households |
| Under 35 Years | 265 | 14.4% |
| 35 to 44 Years | 402 | 21.9% |
| 45 to 54 Years | 702 | 38.3% |
| 55 to 64 Years | 229 | 12.5% |
| 65 to 74 Years | 146 | 8.0% |
| 75 to 84 Years | 76 | 4.1% |
| 85 Years and Over | 14 | 0.8% |
| Total | 1,834 | 100.0% |
Housing Finances in Heber
Median Income by Occupancy in Heber
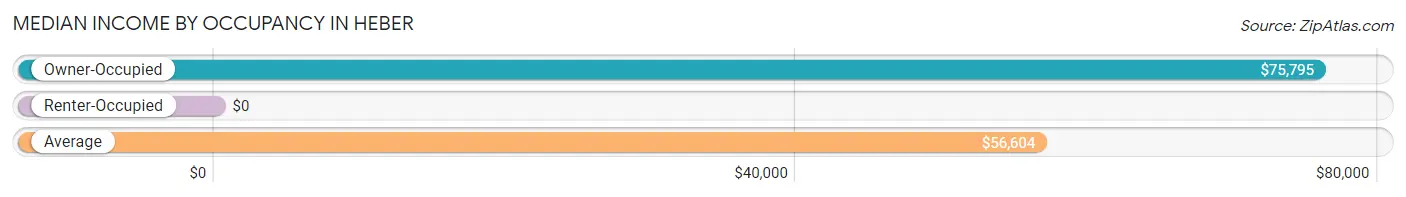
| Occupancy Type | # Households | Median Income |
| Owner-Occupied | 1,248 (68.0%) | $75,795 |
| Renter-Occupied | 586 (32.0%) | $0 |
| Average | 1,834 (100.0%) | $56,604 |
Occupancy by Householder Income Bracket in Heber
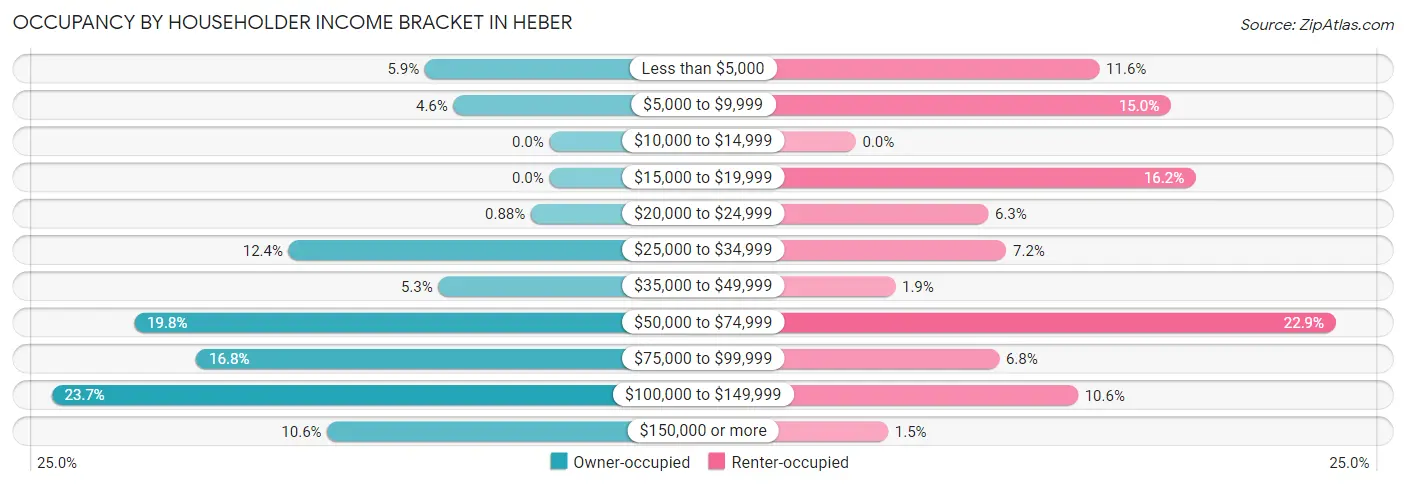
| Income Bracket | Owner-occupied | Renter-occupied |
| Less than $5,000 | 74 (5.9%) | 68 (11.6%) |
| $5,000 to $9,999 | 57 (4.6%) | 88 (15.0%) |
| $10,000 to $14,999 | 0 (0.0%) | 0 (0.0%) |
| $15,000 to $19,999 | 0 (0.0%) | 95 (16.2%) |
| $20,000 to $24,999 | 11 (0.9%) | 37 (6.3%) |
| $25,000 to $34,999 | 155 (12.4%) | 42 (7.2%) |
| $35,000 to $49,999 | 66 (5.3%) | 11 (1.9%) |
| $50,000 to $74,999 | 247 (19.8%) | 134 (22.9%) |
| $75,000 to $99,999 | 210 (16.8%) | 40 (6.8%) |
| $100,000 to $149,999 | 296 (23.7%) | 62 (10.6%) |
| $150,000 or more | 132 (10.6%) | 9 (1.5%) |
| Total | 1,248 (100.0%) | 586 (100.0%) |
Monthly Housing Cost Tiers in Heber
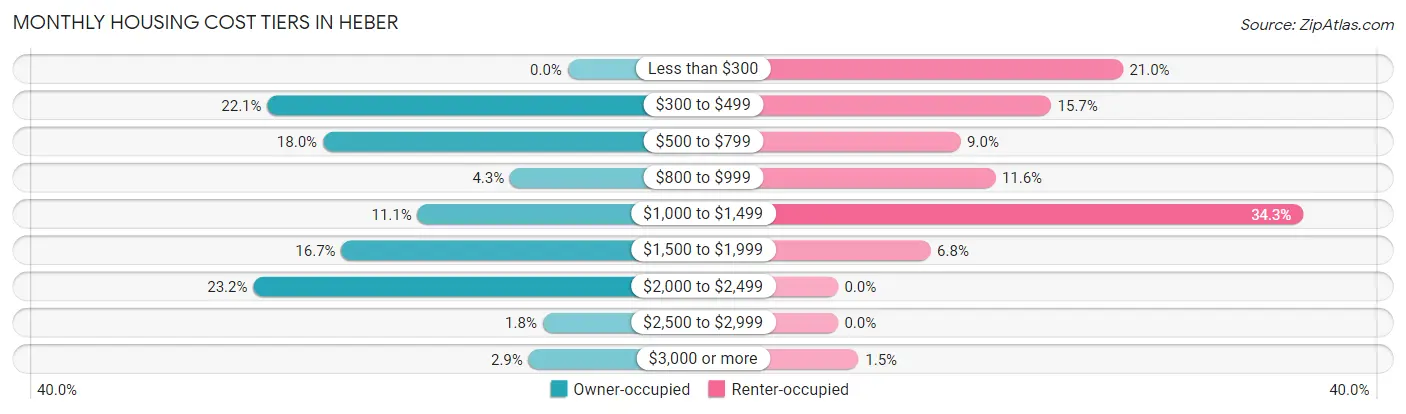
| Monthly Cost | Owner-occupied | Renter-occupied |
| Less than $300 | 0 (0.0%) | 123 (21.0%) |
| $300 to $499 | 276 (22.1%) | 92 (15.7%) |
| $500 to $799 | 225 (18.0%) | 53 (9.0%) |
| $800 to $999 | 53 (4.3%) | 68 (11.6%) |
| $1,000 to $1,499 | 138 (11.1%) | 201 (34.3%) |
| $1,500 to $1,999 | 208 (16.7%) | 40 (6.8%) |
| $2,000 to $2,499 | 289 (23.2%) | 0 (0.0%) |
| $2,500 to $2,999 | 23 (1.8%) | 0 (0.0%) |
| $3,000 or more | 36 (2.9%) | 9 (1.5%) |
| Total | 1,248 (100.0%) | 586 (100.0%) |
Physical Housing Characteristics in Heber
Housing Structures in Heber
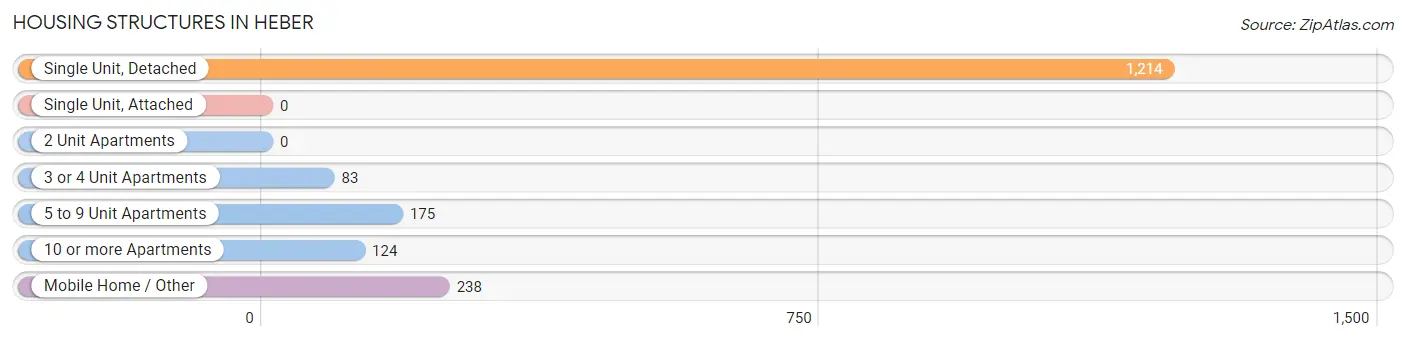
| Structure Type | # Housing Units | % Housing Units |
| Single Unit, Detached | 1,214 | 66.2% |
| Single Unit, Attached | 0 | 0.0% |
| 2 Unit Apartments | 0 | 0.0% |
| 3 or 4 Unit Apartments | 83 | 4.5% |
| 5 to 9 Unit Apartments | 175 | 9.5% |
| 10 or more Apartments | 124 | 6.8% |
| Mobile Home / Other | 238 | 13.0% |
| Total | 1,834 | 100.0% |
Housing Structures by Occupancy in Heber
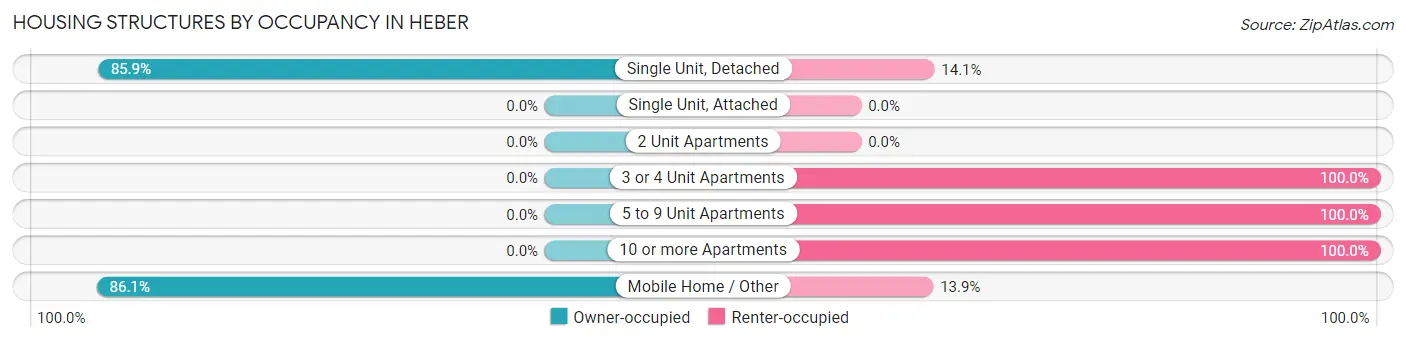
| Structure Type | Owner-occupied | Renter-occupied |
| Single Unit, Detached | 1,043 (85.9%) | 171 (14.1%) |
| Single Unit, Attached | 0 (0.0%) | 0 (0.0%) |
| 2 Unit Apartments | 0 (0.0%) | 0 (0.0%) |
| 3 or 4 Unit Apartments | 0 (0.0%) | 83 (100.0%) |
| 5 to 9 Unit Apartments | 0 (0.0%) | 175 (100.0%) |
| 10 or more Apartments | 0 (0.0%) | 124 (100.0%) |
| Mobile Home / Other | 205 (86.1%) | 33 (13.9%) |
| Total | 1,248 (68.0%) | 586 (32.0%) |
Housing Structures by Number of Rooms in Heber
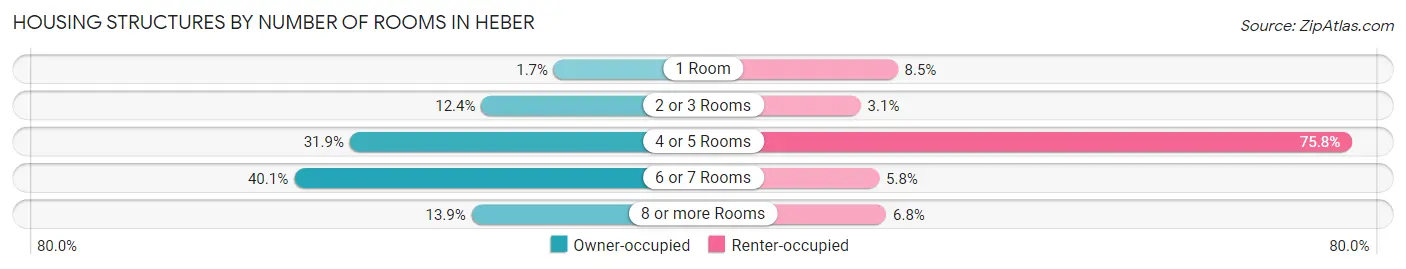
| Number of Rooms | Owner-occupied | Renter-occupied |
| 1 Room | 21 (1.7%) | 50 (8.5%) |
| 2 or 3 Rooms | 155 (12.4%) | 18 (3.1%) |
| 4 or 5 Rooms | 398 (31.9%) | 444 (75.8%) |
| 6 or 7 Rooms | 501 (40.1%) | 34 (5.8%) |
| 8 or more Rooms | 173 (13.9%) | 40 (6.8%) |
| Total | 1,248 (100.0%) | 586 (100.0%) |
Housing Structure by Heating Type in Heber
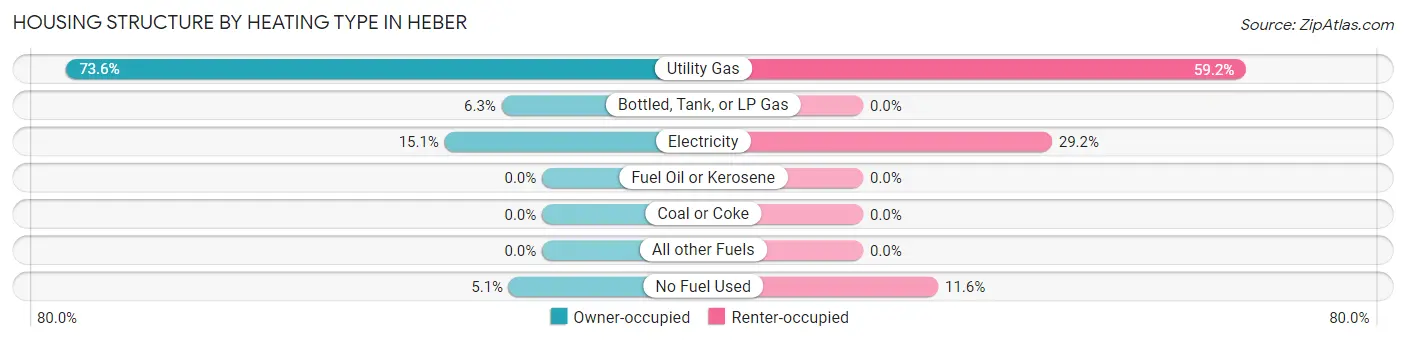
| Heating Type | Owner-occupied | Renter-occupied |
| Utility Gas | 918 (73.6%) | 347 (59.2%) |
| Bottled, Tank, or LP Gas | 78 (6.2%) | 0 (0.0%) |
| Electricity | 188 (15.1%) | 171 (29.2%) |
| Fuel Oil or Kerosene | 0 (0.0%) | 0 (0.0%) |
| Coal or Coke | 0 (0.0%) | 0 (0.0%) |
| All other Fuels | 0 (0.0%) | 0 (0.0%) |
| No Fuel Used | 64 (5.1%) | 68 (11.6%) |
| Total | 1,248 (100.0%) | 586 (100.0%) |
Household Vehicle Usage in Heber
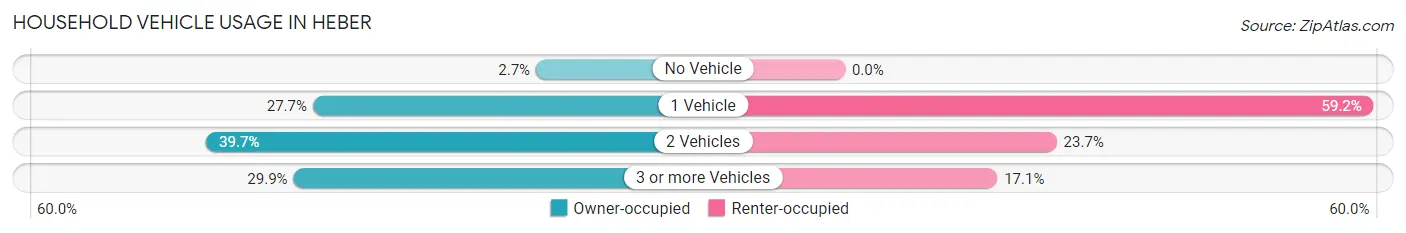
| Vehicles per Household | Owner-occupied | Renter-occupied |
| No Vehicle | 34 (2.7%) | 0 (0.0%) |
| 1 Vehicle | 346 (27.7%) | 347 (59.2%) |
| 2 Vehicles | 495 (39.7%) | 139 (23.7%) |
| 3 or more Vehicles | 373 (29.9%) | 100 (17.1%) |
| Total | 1,248 (100.0%) | 586 (100.0%) |
Real Estate & Mortgages in Heber
Real Estate and Mortgage Overview in Heber
| Characteristic | Without Mortgage | With Mortgage |
| Housing Units | 560 | 688 |
| Median Property Value | $176,100 | $275,100 |
| Median Household Income | $55,346 | $51 |
| Monthly Housing Costs | $503 | $36 |
| Real Estate Taxes | - | - |
Property Value by Mortgage Status in Heber
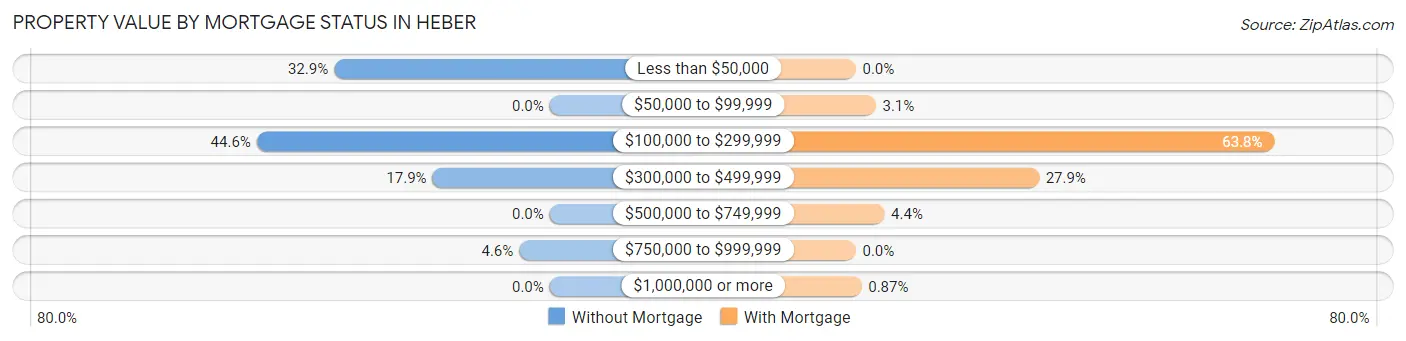
| Property Value | Without Mortgage | With Mortgage |
| Less than $50,000 | 184 (32.9%) | 0 (0.0%) |
| $50,000 to $99,999 | 0 (0.0%) | 21 (3.0%) |
| $100,000 to $299,999 | 250 (44.6%) | 439 (63.8%) |
| $300,000 to $499,999 | 100 (17.9%) | 192 (27.9%) |
| $500,000 to $749,999 | 0 (0.0%) | 30 (4.4%) |
| $750,000 to $999,999 | 26 (4.6%) | 0 (0.0%) |
| $1,000,000 or more | 0 (0.0%) | 6 (0.9%) |
| Total | 560 (100.0%) | 688 (100.0%) |
Household Income by Mortgage Status in Heber
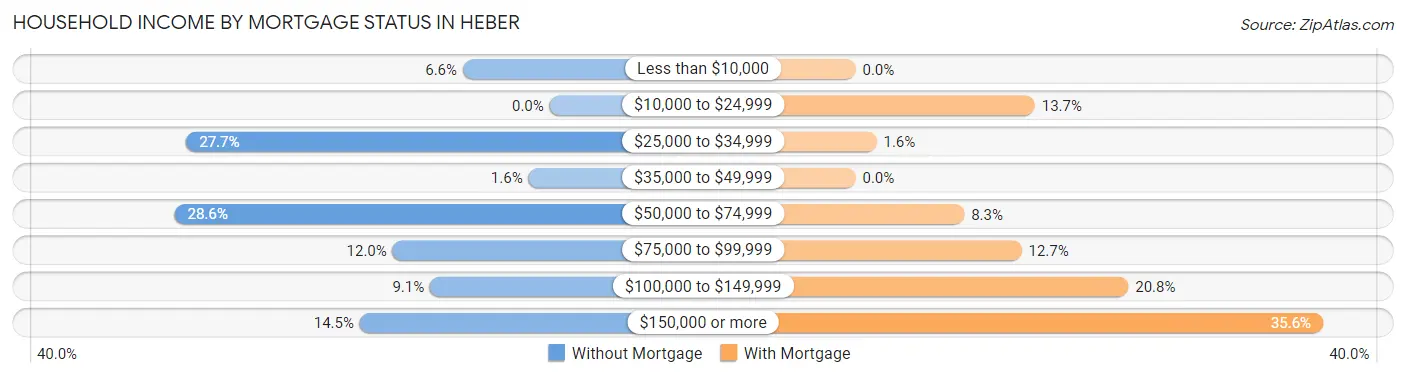
| Household Income | Without Mortgage | With Mortgage |
| Less than $10,000 | 37 (6.6%) | 0 (0.0%) |
| $10,000 to $24,999 | 0 (0.0%) | 94 (13.7%) |
| $25,000 to $34,999 | 155 (27.7%) | 11 (1.6%) |
| $35,000 to $49,999 | 9 (1.6%) | 0 (0.0%) |
| $50,000 to $74,999 | 160 (28.6%) | 57 (8.3%) |
| $75,000 to $99,999 | 67 (12.0%) | 87 (12.7%) |
| $100,000 to $149,999 | 51 (9.1%) | 143 (20.8%) |
| $150,000 or more | 81 (14.5%) | 245 (35.6%) |
| Total | 560 (100.0%) | 688 (100.0%) |
Property Value to Household Income Ratio in Heber
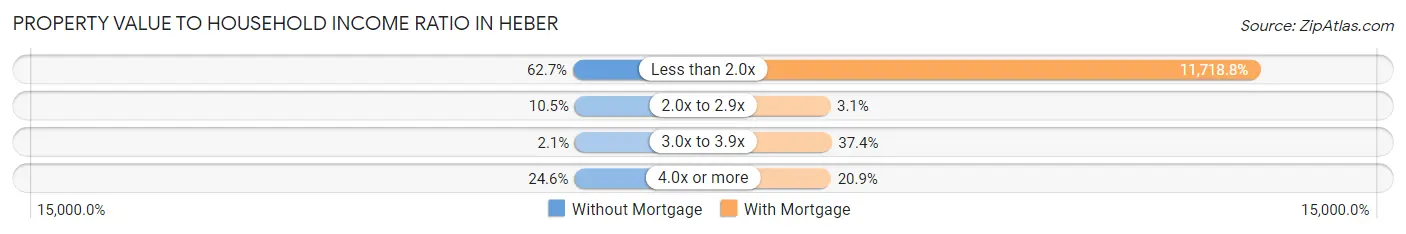
| Value-to-Income Ratio | Without Mortgage | With Mortgage |
| Less than 2.0x | 351 (62.7%) | 80,625 (11,718.8%) |
| 2.0x to 2.9x | 59 (10.5%) | 21 (3.0%) |
| 3.0x to 3.9x | 12 (2.1%) | 257 (37.3%) |
| 4.0x or more | 138 (24.6%) | 144 (20.9%) |
| Total | 560 (100.0%) | 688 (100.0%) |
Real Estate Taxes by Mortgage Status in Heber
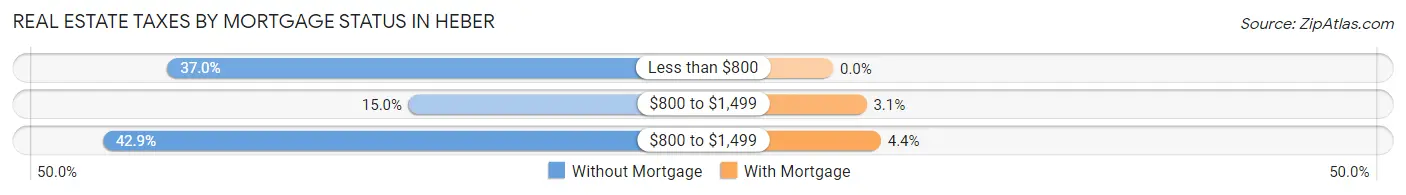
| Property Taxes | Without Mortgage | With Mortgage |
| Less than $800 | 207 (37.0%) | 0 (0.0%) |
| $800 to $1,499 | 84 (15.0%) | 21 (3.0%) |
| $800 to $1,499 | 240 (42.9%) | 30 (4.4%) |
| Total | 560 (100.0%) | 688 (100.0%) |
Health & Disability in Heber
Health Insurance Coverage by Age in Heber
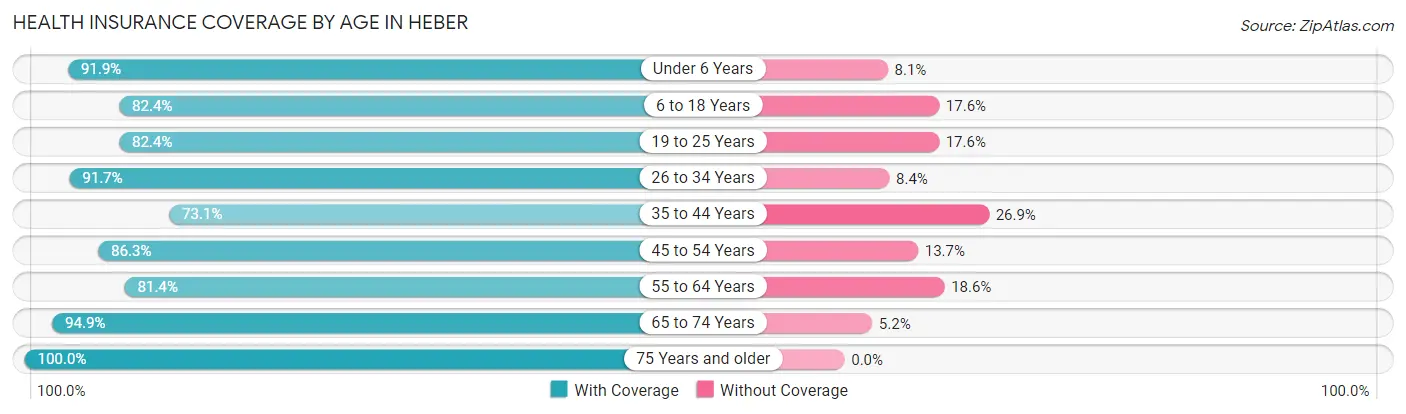
| Age Bracket | With Coverage | Without Coverage |
| Under 6 Years | 762 (91.9%) | 67 (8.1%) |
| 6 to 18 Years | 1,261 (82.4%) | 270 (17.6%) |
| 19 to 25 Years | 903 (82.4%) | 193 (17.6%) |
| 26 to 34 Years | 1,054 (91.6%) | 96 (8.4%) |
| 35 to 44 Years | 681 (73.1%) | 251 (26.9%) |
| 45 to 54 Years | 995 (86.3%) | 158 (13.7%) |
| 55 to 64 Years | 367 (81.4%) | 84 (18.6%) |
| 65 to 74 Years | 387 (94.9%) | 21 (5.1%) |
| 75 Years and older | 360 (100.0%) | 0 (0.0%) |
| Total | 6,770 (85.6%) | 1,140 (14.4%) |
Health Insurance Coverage by Citizenship Status in Heber
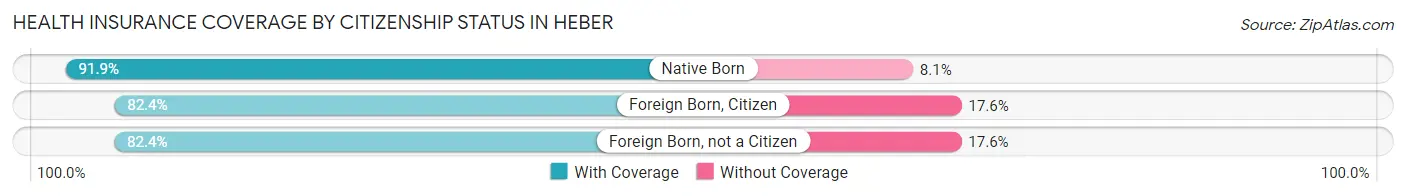
| Citizenship Status | With Coverage | Without Coverage |
| Native Born | 762 (91.9%) | 67 (8.1%) |
| Foreign Born, Citizen | 1,261 (82.4%) | 270 (17.6%) |
| Foreign Born, not a Citizen | 903 (82.4%) | 193 (17.6%) |
Health Insurance Coverage by Household Income in Heber
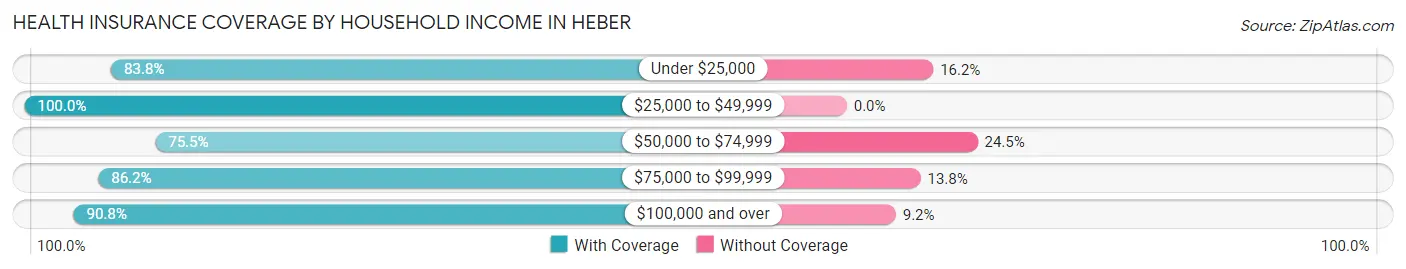
| Household Income | With Coverage | Without Coverage |
| Under $25,000 | 932 (83.8%) | 180 (16.2%) |
| $25,000 to $49,999 | 844 (100.0%) | 0 (0.0%) |
| $50,000 to $74,999 | 1,841 (75.5%) | 597 (24.5%) |
| $75,000 to $99,999 | 748 (86.2%) | 120 (13.8%) |
| $100,000 and over | 2,405 (90.8%) | 243 (9.2%) |
Public vs Private Health Insurance Coverage by Age in Heber
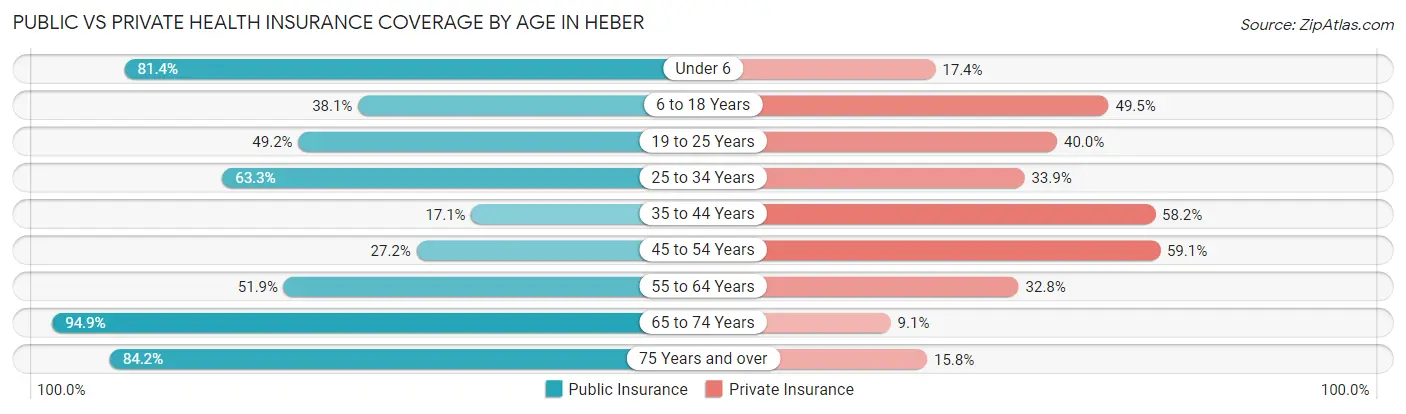
| Age Bracket | Public Insurance | Private Insurance |
| Under 6 | 675 (81.4%) | 144 (17.4%) |
| 6 to 18 Years | 583 (38.1%) | 758 (49.5%) |
| 19 to 25 Years | 539 (49.2%) | 438 (40.0%) |
| 25 to 34 Years | 728 (63.3%) | 390 (33.9%) |
| 35 to 44 Years | 159 (17.1%) | 542 (58.2%) |
| 45 to 54 Years | 314 (27.2%) | 681 (59.1%) |
| 55 to 64 Years | 234 (51.9%) | 148 (32.8%) |
| 65 to 74 Years | 387 (94.9%) | 37 (9.1%) |
| 75 Years and over | 303 (84.2%) | 57 (15.8%) |
| Total | 3,922 (49.6%) | 3,195 (40.4%) |
Disability Status by Sex by Age in Heber
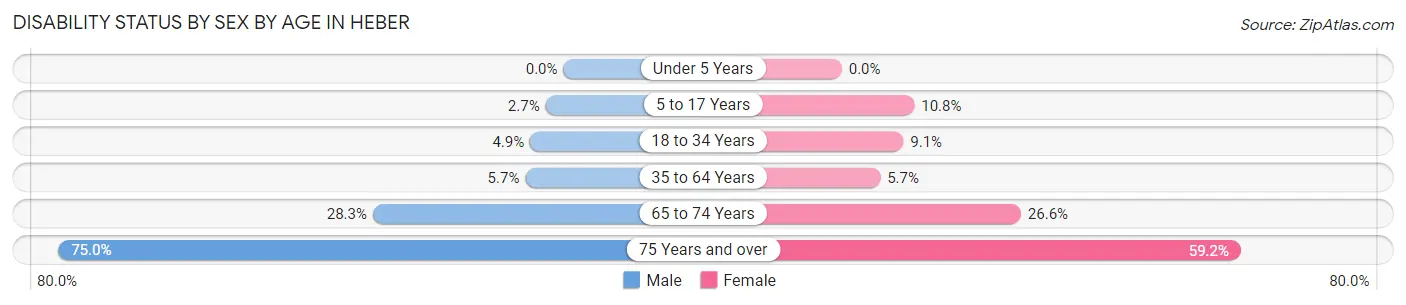
| Age Bracket | Male | Female |
| Under 5 Years | 0 (0.0%) | 0 (0.0%) |
| 5 to 17 Years | 25 (2.6%) | 61 (10.8%) |
| 18 to 34 Years | 70 (4.9%) | 84 (9.1%) |
| 35 to 64 Years | 70 (5.7%) | 74 (5.7%) |
| 65 to 74 Years | 58 (28.3%) | 54 (26.6%) |
| 75 Years and over | 132 (75.0%) | 109 (59.2%) |
Disability Class by Sex by Age in Heber
Disability Class: Hearing Difficulty
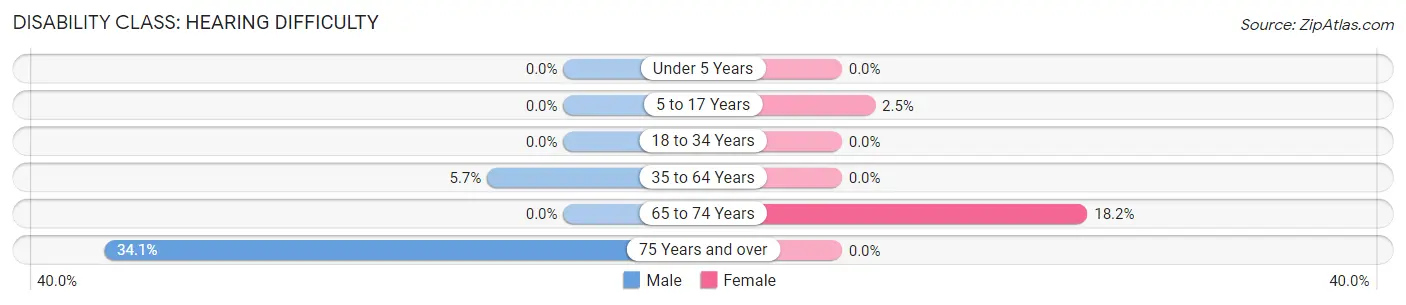
| Age Bracket | Male | Female |
| Under 5 Years | 0 (0.0%) | 0 (0.0%) |
| 5 to 17 Years | 0 (0.0%) | 14 (2.5%) |
| 18 to 34 Years | 0 (0.0%) | 0 (0.0%) |
| 35 to 64 Years | 70 (5.7%) | 0 (0.0%) |
| 65 to 74 Years | 0 (0.0%) | 37 (18.2%) |
| 75 Years and over | 60 (34.1%) | 0 (0.0%) |
Disability Class: Vision Difficulty
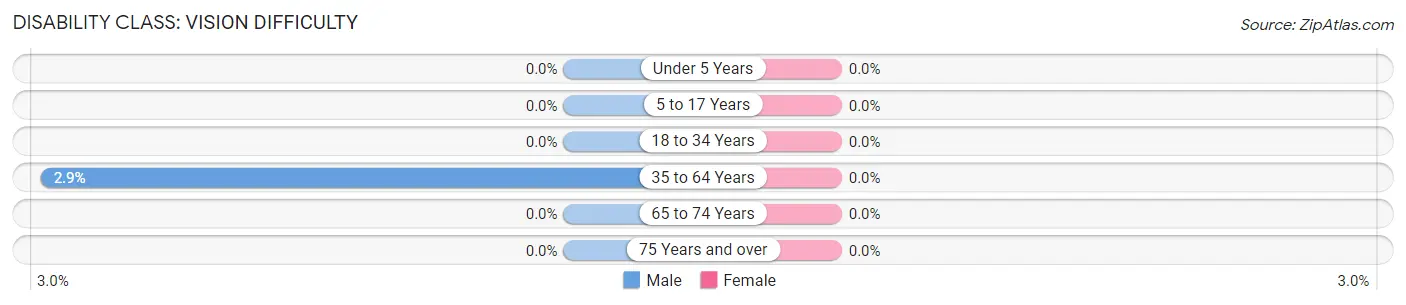
| Age Bracket | Male | Female |
| Under 5 Years | 0 (0.0%) | 0 (0.0%) |
| 5 to 17 Years | 0 (0.0%) | 0 (0.0%) |
| 18 to 34 Years | 0 (0.0%) | 0 (0.0%) |
| 35 to 64 Years | 36 (2.9%) | 0 (0.0%) |
| 65 to 74 Years | 0 (0.0%) | 0 (0.0%) |
| 75 Years and over | 0 (0.0%) | 0 (0.0%) |
Disability Class: Cognitive Difficulty
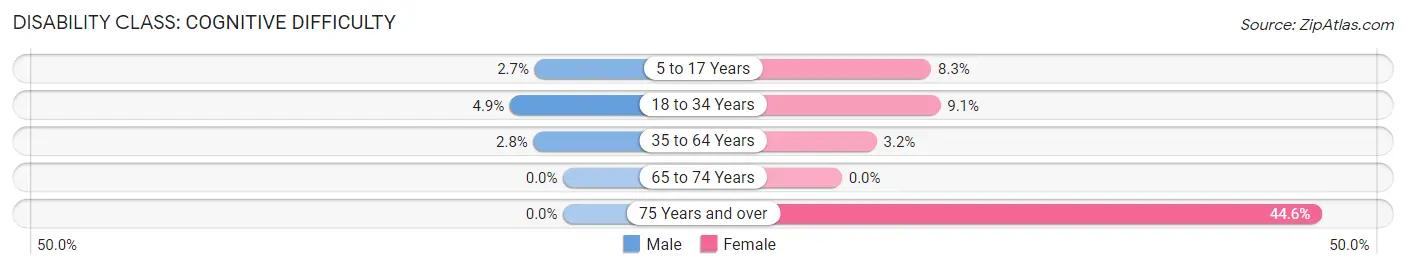
| Age Bracket | Male | Female |
| 5 to 17 Years | 25 (2.6%) | 47 (8.3%) |
| 18 to 34 Years | 70 (4.9%) | 84 (9.1%) |
| 35 to 64 Years | 34 (2.8%) | 42 (3.2%) |
| 65 to 74 Years | 0 (0.0%) | 0 (0.0%) |
| 75 Years and over | 0 (0.0%) | 82 (44.6%) |
Disability Class: Ambulatory Difficulty
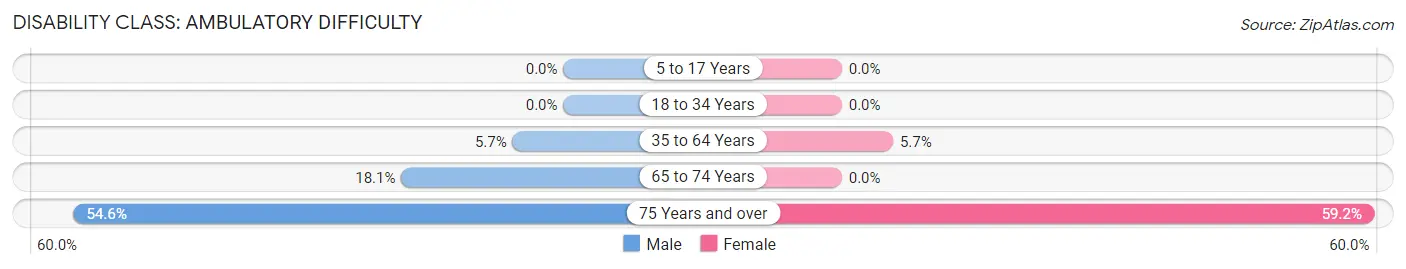
| Age Bracket | Male | Female |
| 5 to 17 Years | 0 (0.0%) | 0 (0.0%) |
| 18 to 34 Years | 0 (0.0%) | 0 (0.0%) |
| 35 to 64 Years | 70 (5.7%) | 74 (5.7%) |
| 65 to 74 Years | 37 (18.0%) | 0 (0.0%) |
| 75 Years and over | 96 (54.5%) | 109 (59.2%) |
Disability Class: Self-Care Difficulty
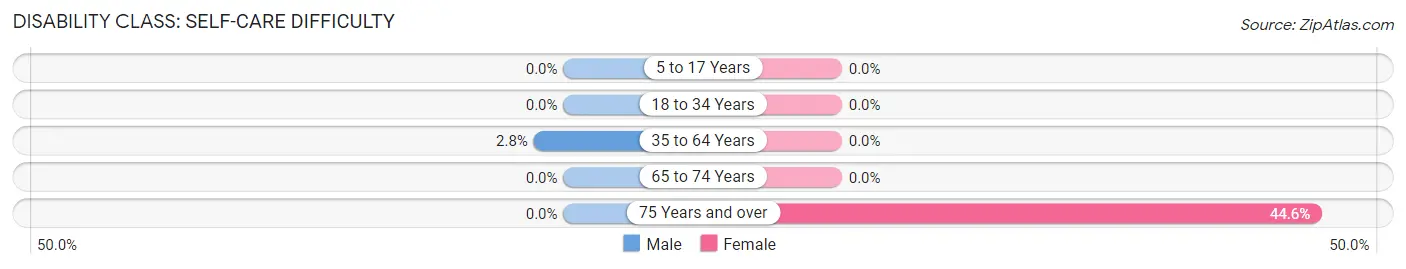
| Age Bracket | Male | Female |
| 5 to 17 Years | 0 (0.0%) | 0 (0.0%) |
| 18 to 34 Years | 0 (0.0%) | 0 (0.0%) |
| 35 to 64 Years | 34 (2.8%) | 0 (0.0%) |
| 65 to 74 Years | 0 (0.0%) | 0 (0.0%) |
| 75 Years and over | 0 (0.0%) | 82 (44.6%) |
Technology Access in Heber
Computing Device Access in Heber
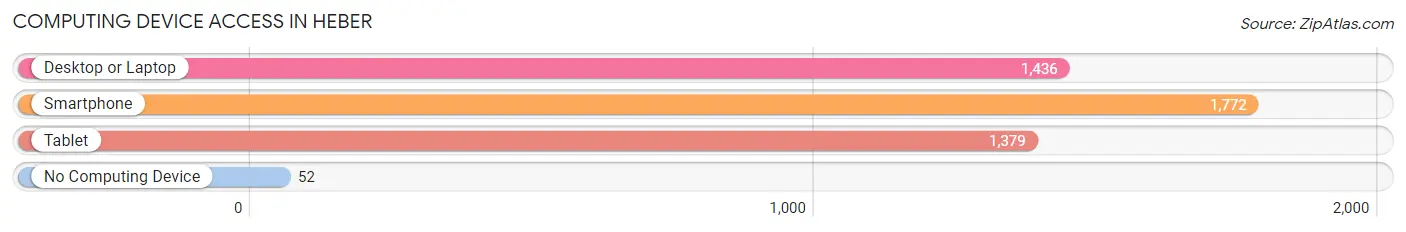
| Device Type | # Households | % Households |
| Desktop or Laptop | 1,436 | 78.3% |
| Smartphone | 1,772 | 96.6% |
| Tablet | 1,379 | 75.2% |
| No Computing Device | 52 | 2.8% |
| Total | 1,834 | 100.0% |
Internet Access in Heber
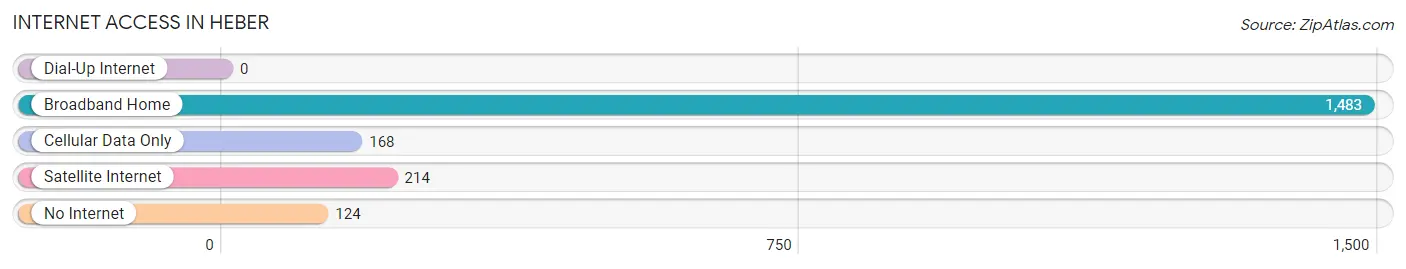
| Internet Type | # Households | % Households |
| Dial-Up Internet | 0 | 0.0% |
| Broadband Home | 1,483 | 80.9% |
| Cellular Data Only | 168 | 9.2% |
| Satellite Internet | 214 | 11.7% |
| No Internet | 124 | 6.8% |
| Total | 1,834 | 100.0% |
Heber Summary
Heber, California is a small unincorporated community located in Imperial County, California. It is situated in the southeastern corner of the state, approximately 20 miles east of El Centro and just north of the Mexican border. The population of Heber was estimated to be 1,845 in 2019.
History
Heber was founded in the late 19th century by a group of Mormon settlers from Utah. The settlers named the town after Heber J. Grant, the seventh president of the Church of Jesus Christ of Latter-day Saints. The town was originally a farming community, and the settlers grew a variety of crops, including cotton, alfalfa, and wheat.
In the early 20th century, Heber began to experience a population boom as more people moved to the area to take advantage of the fertile soil and mild climate. The town was incorporated in 1912, and the population continued to grow throughout the decade.
In the 1930s, Heber was hit hard by the Great Depression. Many of the town’s residents were forced to leave in search of work elsewhere. The population declined significantly during this time, and the town was eventually disincorporated in 1938.
Geography
Heber is located in the southeastern corner of Imperial County, California. It is situated in the Sonoran Desert, and the terrain is mostly flat and arid. The town is surrounded by agricultural fields, and the nearby Salton Sea provides a source of irrigation for the area.
The climate in Heber is hot and dry, with temperatures ranging from the mid-90s in the summer to the mid-60s in the winter. The area receives very little rainfall, and the average annual precipitation is only about 4 inches.
Economy
The economy of Heber is largely based on agriculture. The town is surrounded by agricultural fields, and the nearby Salton Sea provides a source of irrigation for the area. The main crops grown in the area are cotton, alfalfa, and wheat.
In addition to agriculture, Heber also has a small tourism industry. The town is home to several popular attractions, including the Heber Valley Railroad, the Imperial Valley Desert Museum, and the Heber Valley Historical Museum.
Demographics
As of 2019, the population of Heber was estimated to be 1,845. The racial makeup of the town was 73.3% White, 0.7% African American, 0.3% Native American, 0.2% Asian, 0.1% Pacific Islander, 22.7% from other races, and 2.7% from two or more races. Hispanic or Latino of any race were 44.2% of the population.
The median household income in Heber was $31,250, and the median family income was $35,000. The per capita income was $14,845. About 24.3% of the population was below the poverty line.
Common Questions
What is Per Capita Income in Heber?
Per Capita income in Heber is $18,245.
What is the Median Family Income in Heber?
Median Family Income in Heber is $52,644.
What is the Median Household income in Heber?
Median Household Income in Heber is $56,604.
What is Income or Wage Gap in Heber?
Income or Wage Gap in Heber is 35.4%.
Women in Heber earn 64.6 cents for every dollar earned by a man.
What is Inequality or Gini Index in Heber?
Inequality or Gini Index in Heber is 0.44.
What is the Total Population of Heber?
Total Population of Heber is 7,910.
What is the Total Male Population of Heber?
Total Male Population of Heber is 4,274.
What is the Total Female Population of Heber?
Total Female Population of Heber is 3,636.
What is the Ratio of Males per 100 Females in Heber?
There are 117.55 Males per 100 Females in Heber.
What is the Ratio of Females per 100 Males in Heber?
There are 85.07 Females per 100 Males in Heber.
What is the Median Population Age in Heber?
Median Population Age in Heber is 30.8 Years.
What is the Average Family Size in Heber
Average Family Size in Heber is 4.5 People.
What is the Average Household Size in Heber
Average Household Size in Heber is 4.3 People.
How Large is the Labor Force in Heber?
There are 3,063 People in the Labor Forcein in Heber.
What is the Percentage of People in the Labor Force in Heber?
52.3% of People are in the Labor Force in Heber.
What is the Unemployment Rate in Heber?
Unemployment Rate in Heber is 4.5%.