Thomaston, GA Map & Demographics
Thomaston Map
Thomaston Overview
$24,063
PER CAPITA INCOME
$52,282
AVG FAMILY INCOME
$30,298
AVG HOUSEHOLD INCOME
17.6%
WAGE / INCOME GAP [ % ]
82.4¢/ $1
WAGE / INCOME GAP [ $ ]
0.55
INEQUALITY / GINI INDEX
9,720
TOTAL POPULATION
4,104
MALE POPULATION
5,616
FEMALE POPULATION
73.08
MALES / 100 FEMALES
136.84
FEMALES / 100 MALES
36.7
MEDIAN AGE
3.1
AVG FAMILY SIZE
2.5
AVG HOUSEHOLD SIZE
3,572
LABOR FORCE [ PEOPLE ]
47.7%
PERCENT IN LABOR FORCE
5.1%
UNEMPLOYMENT RATE
Thomaston Zip Codes
Thomaston Area Codes
Income in Thomaston
Income Overview in Thomaston
Per Capita Income in Thomaston is $24,063, while median incomes of families and households are $52,282 and $30,298 respectively.
| Characteristic | Number | Measure |
| Per Capita Income | 9,720 | $24,063 |
| Median Family Income | 2,169 | $52,282 |
| Mean Family Income | 2,169 | $75,021 |
| Median Household Income | 3,711 | $30,298 |
| Mean Household Income | 3,711 | $58,298 |
| Income Deficit | 2,169 | $0 |
| Wage / Income Gap (%) | 9,720 | 17.55% |
| Wage / Income Gap ($) | 9,720 | 82.45¢ per $1 |
| Gini / Inequality Index | 9,720 | 0.55 |
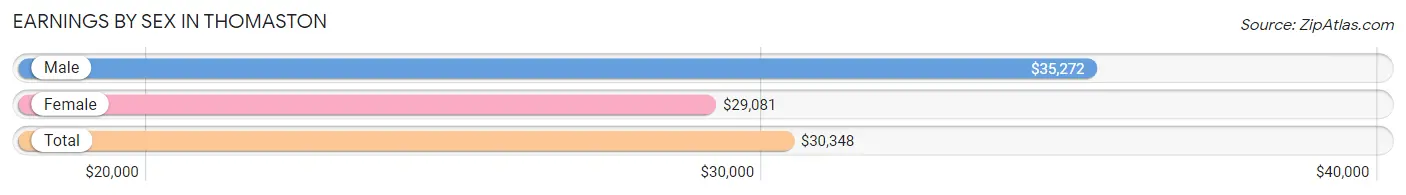
Earnings by Sex in Thomaston
Average Earnings in Thomaston are $30,348, $35,272 for men and $29,081 for women, a difference of 17.5%.
| Sex | Number | Average Earnings |
| Male | 1,771 (49.5%) | $35,272 |
| Female | 1,805 (50.5%) | $29,081 |
| Total | 3,576 (100.0%) | $30,348 |
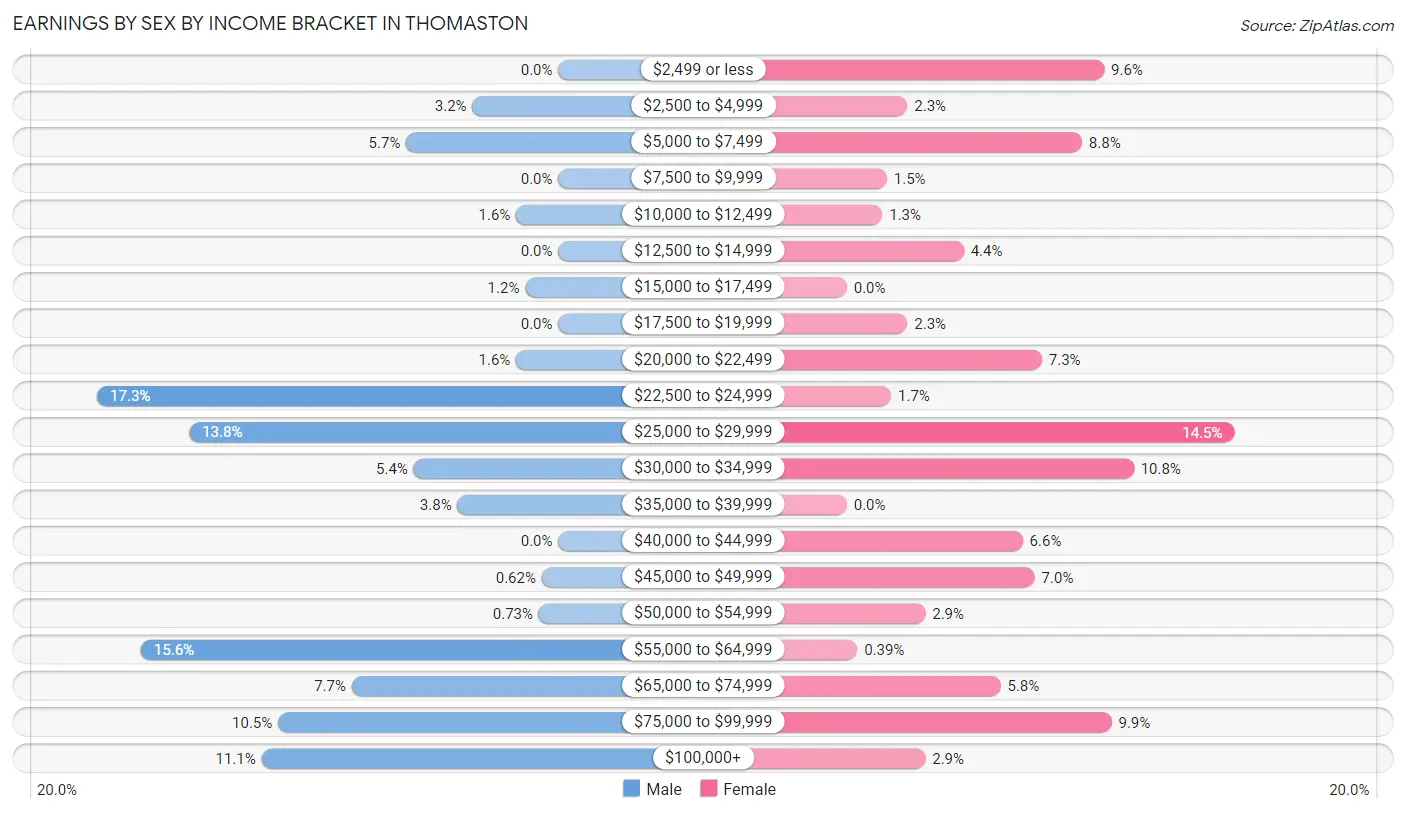
Earnings by Sex by Income Bracket in Thomaston
The most common earnings brackets in Thomaston are $22,500 to $24,999 for men (306 | 17.3%) and $25,000 to $29,999 for women (262 | 14.5%).
| Income | Male | Female |
| $2,499 or less | 0 (0.0%) | 174 (9.6%) |
| $2,500 to $4,999 | 57 (3.2%) | 41 (2.3%) |
| $5,000 to $7,499 | 101 (5.7%) | 159 (8.8%) |
| $7,500 to $9,999 | 0 (0.0%) | 27 (1.5%) |
| $10,000 to $12,499 | 28 (1.6%) | 24 (1.3%) |
| $12,500 to $14,999 | 0 (0.0%) | 79 (4.4%) |
| $15,000 to $17,499 | 22 (1.2%) | 0 (0.0%) |
| $17,500 to $19,999 | 0 (0.0%) | 41 (2.3%) |
| $20,000 to $22,499 | 28 (1.6%) | 132 (7.3%) |
| $22,500 to $24,999 | 306 (17.3%) | 30 (1.7%) |
| $25,000 to $29,999 | 245 (13.8%) | 262 (14.5%) |
| $30,000 to $34,999 | 96 (5.4%) | 194 (10.7%) |
| $35,000 to $39,999 | 67 (3.8%) | 0 (0.0%) |
| $40,000 to $44,999 | 0 (0.0%) | 119 (6.6%) |
| $45,000 to $49,999 | 11 (0.6%) | 127 (7.0%) |
| $50,000 to $54,999 | 13 (0.7%) | 53 (2.9%) |
| $55,000 to $64,999 | 277 (15.6%) | 7 (0.4%) |
| $65,000 to $74,999 | 137 (7.7%) | 104 (5.8%) |
| $75,000 to $99,999 | 186 (10.5%) | 179 (9.9%) |
| $100,000+ | 197 (11.1%) | 53 (2.9%) |
| Total | 1,771 (100.0%) | 1,805 (100.0%) |
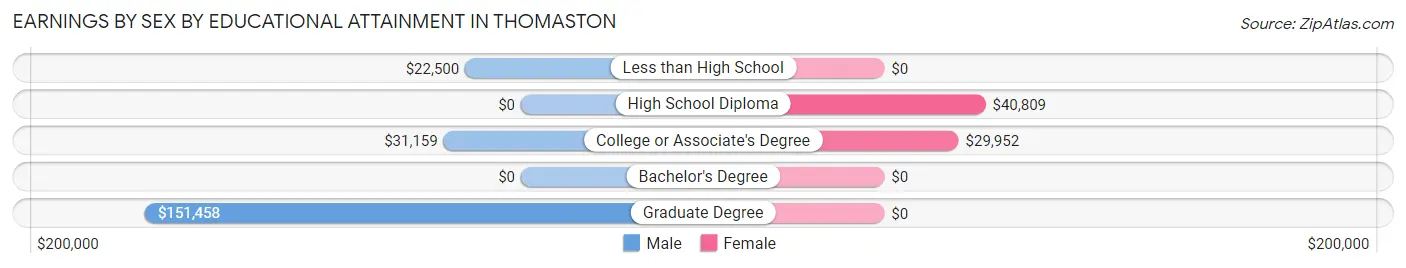
Earnings by Sex by Educational Attainment in Thomaston
Average earnings in Thomaston are $37,930 for men and $30,737 for women, a difference of 19.0%. Men with an educational attainment of graduate degree enjoy the highest average annual earnings of $151,458, while those with less than high school education earn the least with $22,500. Women with an educational attainment of high school diploma earn the most with the average annual earnings of $40,809, while those with college or associate's degree education have the smallest earnings of $29,952.
| Educational Attainment | Male Income | Female Income |
| Less than High School | $22,500 | $0 |
| High School Diploma | - | - |
| College or Associate's Degree | $31,159 | $29,952 |
| Bachelor's Degree | - | - |
| Graduate Degree | $151,458 | $0 |
| Total | $37,930 | $30,737 |
Family Income in Thomaston
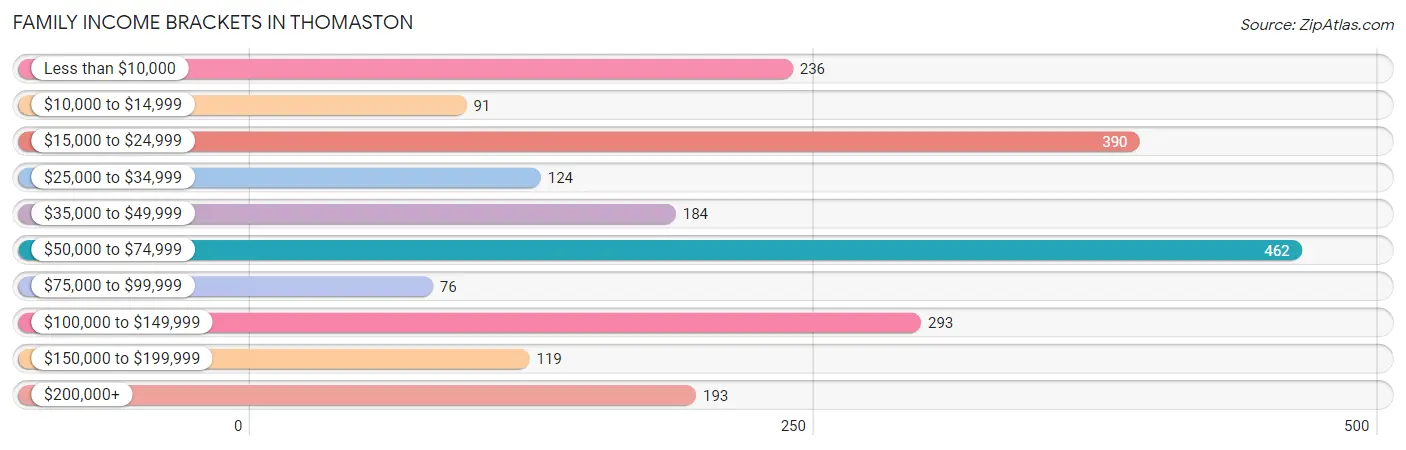
Family Income Brackets in Thomaston
According to the Thomaston family income data, there are 462 families falling into the $50,000 to $74,999 income range, which is the most common income bracket and makes up 21.3% of all families. Conversely, the $75,000 to $99,999 income bracket is the least frequent group with only 76 families (3.5%) belonging to this category.
| Income Bracket | # Families | % Families |
| Less than $10,000 | 236 | 10.9% |
| $10,000 to $14,999 | 91 | 4.2% |
| $15,000 to $24,999 | 390 | 18.0% |
| $25,000 to $34,999 | 124 | 5.7% |
| $35,000 to $49,999 | 184 | 8.5% |
| $50,000 to $74,999 | 462 | 21.3% |
| $75,000 to $99,999 | 76 | 3.5% |
| $100,000 to $149,999 | 293 | 13.5% |
| $150,000 to $199,999 | 119 | 5.5% |
| $200,000+ | 193 | 8.9% |
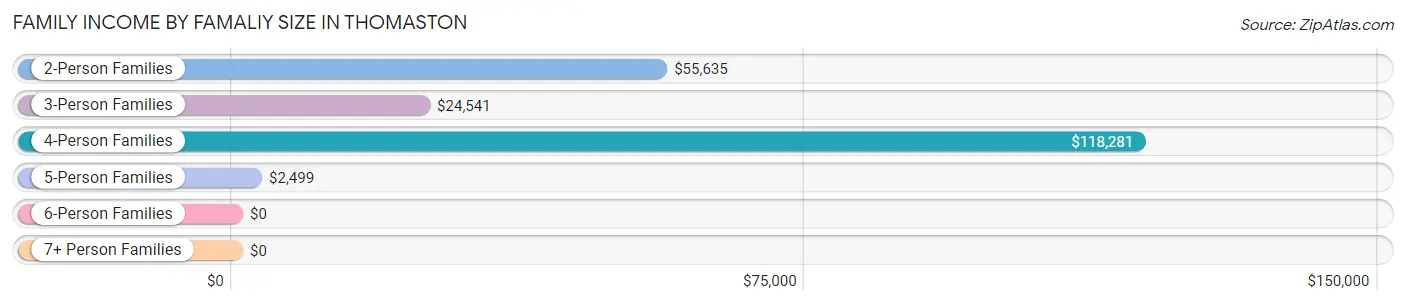
Family Income by Famaliy Size in Thomaston
4-person families (233 | 10.7%) account for the highest median family income in Thomaston with $118,281 per family, while 4-person families (233 | 10.7%) have the highest median income of $29,570 per family member.
| Income Bracket | # Families | Median Income |
| 2-Person Families | 1,222 (56.3%) | $55,635 |
| 3-Person Families | 554 (25.5%) | $24,541 |
| 4-Person Families | 233 (10.7%) | $118,281 |
| 5-Person Families | 140 (6.5%) | $2,499 |
| 6-Person Families | 14 (0.6%) | $0 |
| 7+ Person Families | 6 (0.3%) | $0 |
| Total | 2,169 (100.0%) | $52,282 |
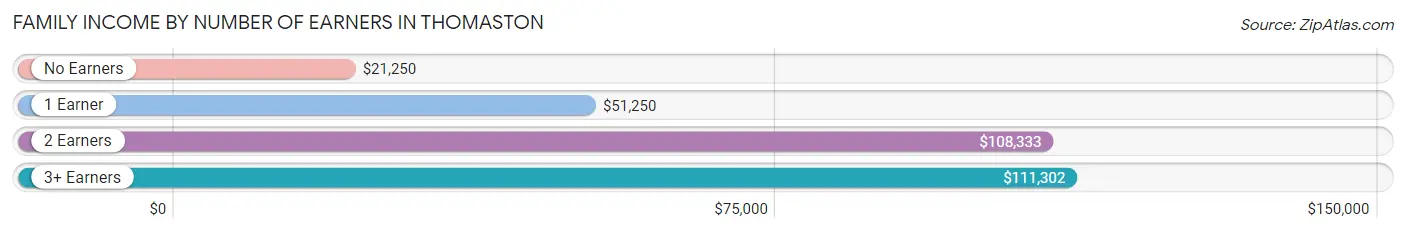
Family Income by Number of Earners in Thomaston
The median family income in Thomaston is $52,282, with families comprising 3+ earners (133) having the highest median family income of $111,302, while families with no earners (664) have the lowest median family income of $21,250, accounting for 6.1% and 30.6% of families, respectively.
| Number of Earners | # Families | Median Income |
| No Earners | 664 (30.6%) | $21,250 |
| 1 Earner | 922 (42.5%) | $51,250 |
| 2 Earners | 450 (20.7%) | $108,333 |
| 3+ Earners | 133 (6.1%) | $111,302 |
| Total | 2,169 (100.0%) | $52,282 |
Household Income in Thomaston
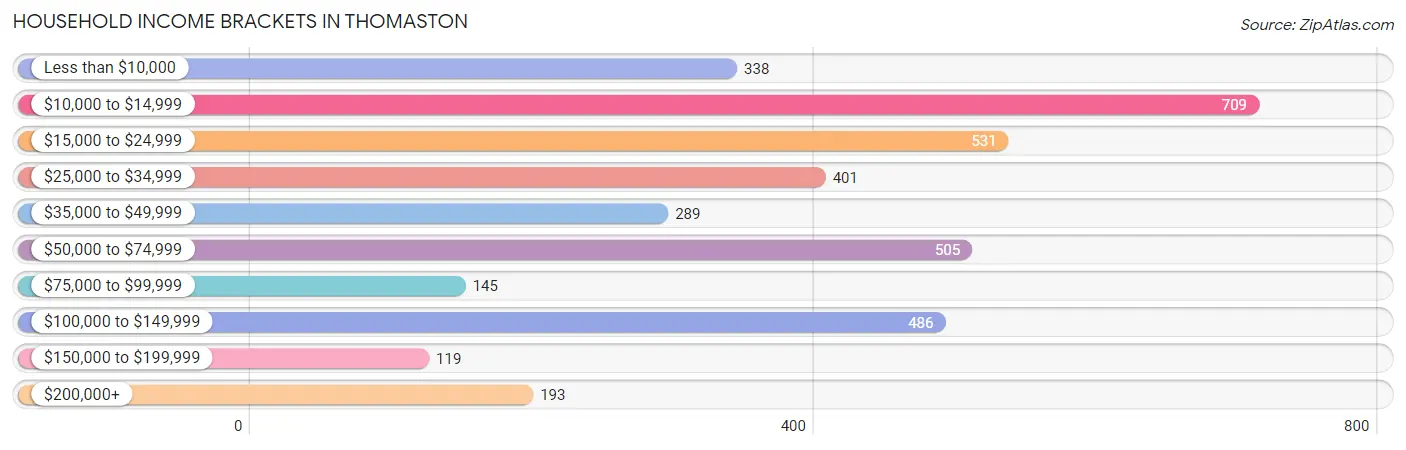
Household Income Brackets in Thomaston
With 709 households falling in the category, the $10,000 to $14,999 income range is the most frequent in Thomaston, accounting for 19.1% of all households. In contrast, only 119 households (3.2%) fall into the $150,000 to $199,999 income bracket, making it the least populous group.
| Income Bracket | # Households | % Households |
| Less than $10,000 | 338 | 9.1% |
| $10,000 to $14,999 | 709 | 19.1% |
| $15,000 to $24,999 | 531 | 14.3% |
| $25,000 to $34,999 | 401 | 10.8% |
| $35,000 to $49,999 | 289 | 7.8% |
| $50,000 to $74,999 | 505 | 13.6% |
| $75,000 to $99,999 | 145 | 3.9% |
| $100,000 to $149,999 | 486 | 13.1% |
| $150,000 to $199,999 | 119 | 3.2% |
| $200,000+ | 193 | 5.2% |
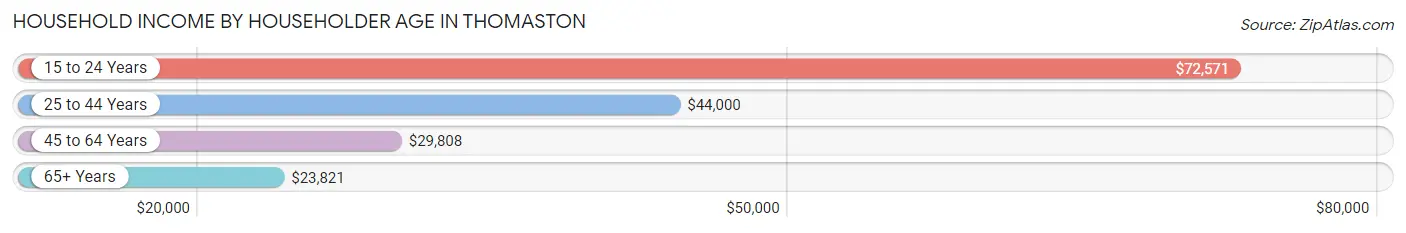
Household Income by Householder Age in Thomaston
The median household income in Thomaston is $30,298, with the highest median household income of $72,571 found in the 15 to 24 years age bracket for the primary householder. A total of 106 households (2.9%) fall into this category. Meanwhile, the 65+ years age bracket for the primary householder has the lowest median household income of $23,821, with 1,065 households (28.7%) in this group.
| Income Bracket | # Households | Median Income |
| 15 to 24 Years | 106 (2.9%) | $72,571 |
| 25 to 44 Years | 1,288 (34.7%) | $44,000 |
| 45 to 64 Years | 1,252 (33.7%) | $29,808 |
| 65+ Years | 1,065 (28.7%) | $23,821 |
| Total | 3,711 (100.0%) | $30,298 |
Poverty in Thomaston
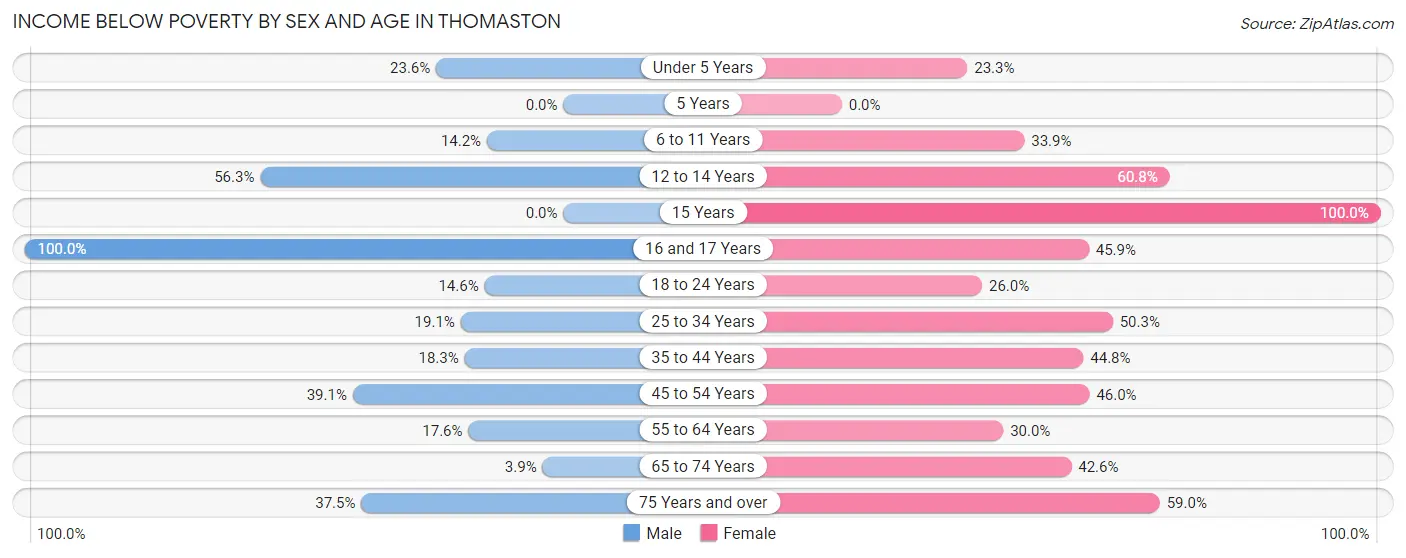
Income Below Poverty by Sex and Age in Thomaston
With 26.4% poverty level for males and 44.5% for females among the residents of Thomaston, 16 and 17 year old males and 15 year old females are the most vulnerable to poverty, with 102 males (100.0%) and 105 females (100.0%) in their respective age groups living below the poverty level.
| Age Bracket | Male | Female |
| Under 5 Years | 60 (23.6%) | 34 (23.3%) |
| 5 Years | 0 (0.0%) | 0 (0.0%) |
| 6 to 11 Years | 40 (14.2%) | 103 (33.9%) |
| 12 to 14 Years | 238 (56.3%) | 219 (60.8%) |
| 15 Years | 0 (0.0%) | 105 (100.0%) |
| 16 and 17 Years | 102 (100.0%) | 94 (45.9%) |
| 18 to 24 Years | 47 (14.6%) | 75 (26.0%) |
| 25 to 34 Years | 121 (19.1%) | 430 (50.3%) |
| 35 to 44 Years | 75 (18.3%) | 356 (44.8%) |
| 45 to 54 Years | 163 (39.1%) | 211 (46.0%) |
| 55 to 64 Years | 85 (17.6%) | 222 (30.0%) |
| 65 to 74 Years | 13 (3.9%) | 227 (42.6%) |
| 75 Years and over | 84 (37.5%) | 239 (59.0%) |
| Total | 1,028 (26.4%) | 2,315 (44.5%) |
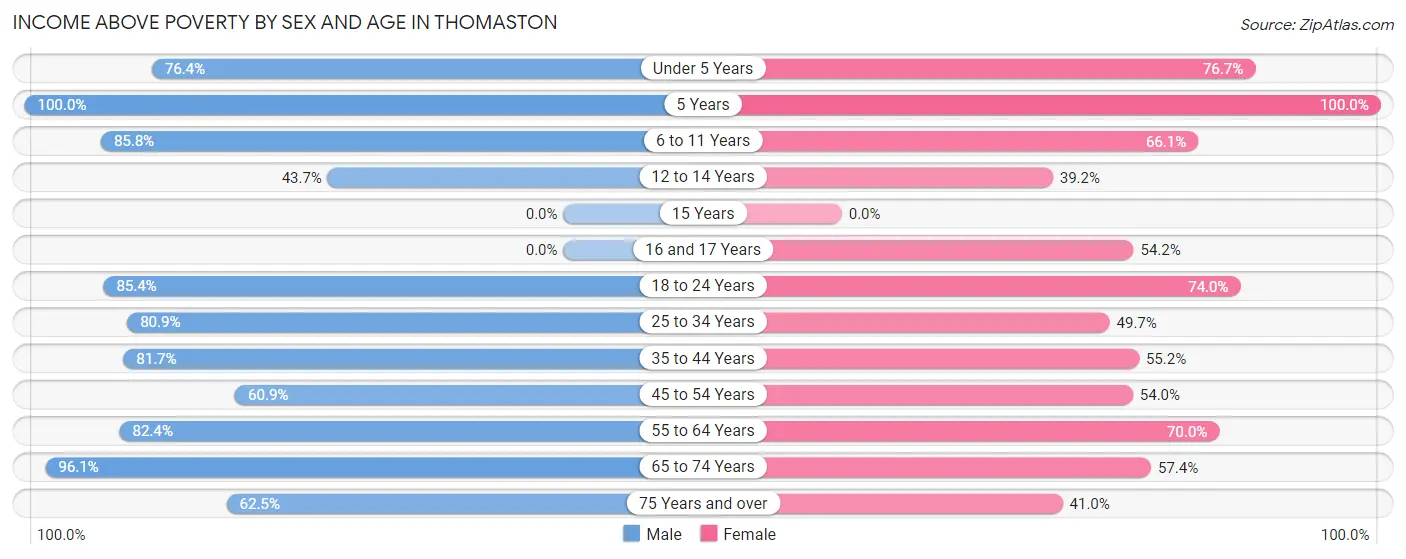
Income Above Poverty by Sex and Age in Thomaston
According to the poverty statistics in Thomaston, males aged 5 years and females aged 5 years are the age groups that are most secure financially, with 100.0% of males and 100.0% of females in these age groups living above the poverty line.
| Age Bracket | Male | Female |
| Under 5 Years | 194 (76.4%) | 112 (76.7%) |
| 5 Years | 12 (100.0%) | 8 (100.0%) |
| 6 to 11 Years | 242 (85.8%) | 201 (66.1%) |
| 12 to 14 Years | 185 (43.7%) | 141 (39.2%) |
| 15 Years | 0 (0.0%) | 0 (0.0%) |
| 16 and 17 Years | 0 (0.0%) | 111 (54.1%) |
| 18 to 24 Years | 274 (85.4%) | 213 (74.0%) |
| 25 to 34 Years | 514 (80.9%) | 425 (49.7%) |
| 35 to 44 Years | 334 (81.7%) | 438 (55.2%) |
| 45 to 54 Years | 254 (60.9%) | 248 (54.0%) |
| 55 to 64 Years | 397 (82.4%) | 519 (70.0%) |
| 65 to 74 Years | 323 (96.1%) | 306 (57.4%) |
| 75 Years and over | 140 (62.5%) | 166 (41.0%) |
| Total | 2,869 (73.6%) | 2,888 (55.5%) |
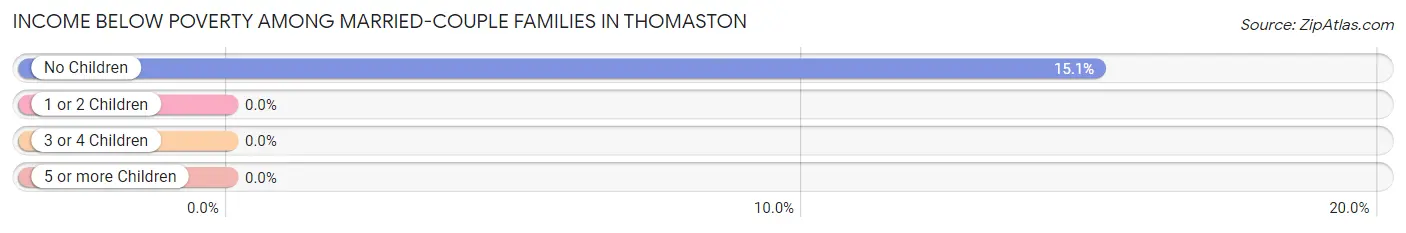
Income Below Poverty Among Married-Couple Families in Thomaston
The poverty statistics for married-couple families in Thomaston show that 11.8% or 115 of the total 976 families live below the poverty line. Families with no children have the highest poverty rate of 15.1%, comprising of 115 families. On the other hand, families with 1 or 2 children have the lowest poverty rate of 0.0%, which includes 0 families.
| Children | Above Poverty | Below Poverty |
| No Children | 646 (84.9%) | 115 (15.1%) |
| 1 or 2 Children | 194 (100.0%) | 0 (0.0%) |
| 3 or 4 Children | 21 (100.0%) | 0 (0.0%) |
| 5 or more Children | 0 (0.0%) | 0 (0.0%) |
| Total | 861 (88.2%) | 115 (11.8%) |
Income Below Poverty Among Single-Parent Households in Thomaston
According to the poverty data in Thomaston, 28.0% or 93 single-father households and 50.7% or 437 single-mother households are living below the poverty line. Among single-father households, those with 1 or 2 children have the highest poverty rate, with 93 households (34.6%) experiencing poverty. Likewise, among single-mother households, those with 3 or 4 children have the highest poverty rate, with 104 households (77.0%) falling below the poverty line.
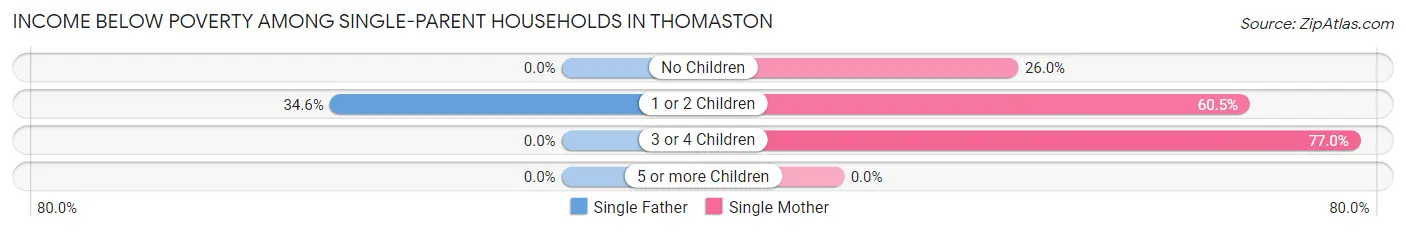
| Children | Single Father | Single Mother |
| No Children | 0 (0.0%) | 80 (26.0%) |
| 1 or 2 Children | 93 (34.6%) | 253 (60.5%) |
| 3 or 4 Children | 0 (0.0%) | 104 (77.0%) |
| 5 or more Children | 0 (0.0%) | 0 (0.0%) |
| Total | 93 (28.0%) | 437 (50.7%) |
Income Below Poverty Among Married-Couple vs Single-Parent Households in Thomaston
The poverty data for Thomaston shows that 115 of the married-couple family households (11.8%) and 530 of the single-parent households (44.4%) are living below the poverty level. Within the married-couple family households, those with no children have the highest poverty rate, with 115 households (15.1%) falling below the poverty line. Among the single-parent households, those with 3 or 4 children have the highest poverty rate, with 104 household (77.0%) living below poverty.
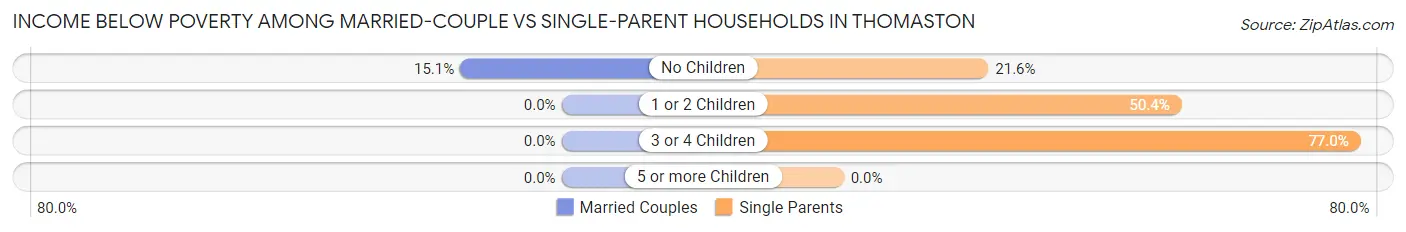
| Children | Married-Couple Families | Single-Parent Households |
| No Children | 115 (15.1%) | 80 (21.6%) |
| 1 or 2 Children | 0 (0.0%) | 346 (50.4%) |
| 3 or 4 Children | 0 (0.0%) | 104 (77.0%) |
| 5 or more Children | 0 (0.0%) | 0 (0.0%) |
| Total | 115 (11.8%) | 530 (44.4%) |
Race in Thomaston
The most populous races in Thomaston are White / Caucasian (5,248 | 54.0%), Black / African American (3,795 | 39.0%), and Hispanic or Latino (304 | 3.1%).
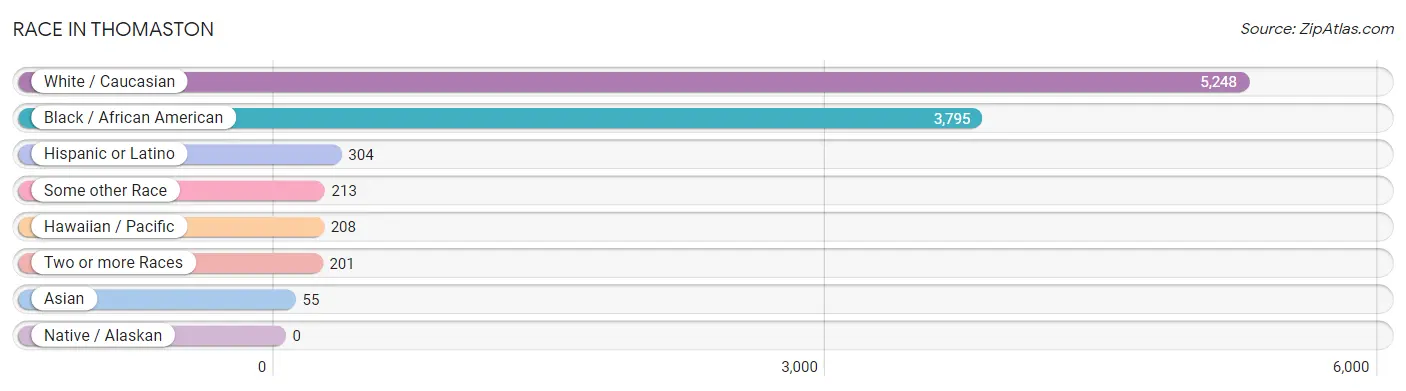
| Race | # Population | % Population |
| Asian | 55 | 0.6% |
| Black / African American | 3,795 | 39.0% |
| Hawaiian / Pacific | 208 | 2.1% |
| Hispanic or Latino | 304 | 3.1% |
| Native / Alaskan | 0 | 0.0% |
| White / Caucasian | 5,248 | 54.0% |
| Two or more Races | 201 | 2.1% |
| Some other Race | 213 | 2.2% |
| Total | 9,720 | 100.0% |
Ancestry in Thomaston
The most populous ancestries reported in Thomaston are English (603 | 6.2%), American (478 | 4.9%), African (330 | 3.4%), Subsaharan African (330 | 3.4%), and Scotch-Irish (322 | 3.3%), together accounting for 21.2% of all Thomaston residents.
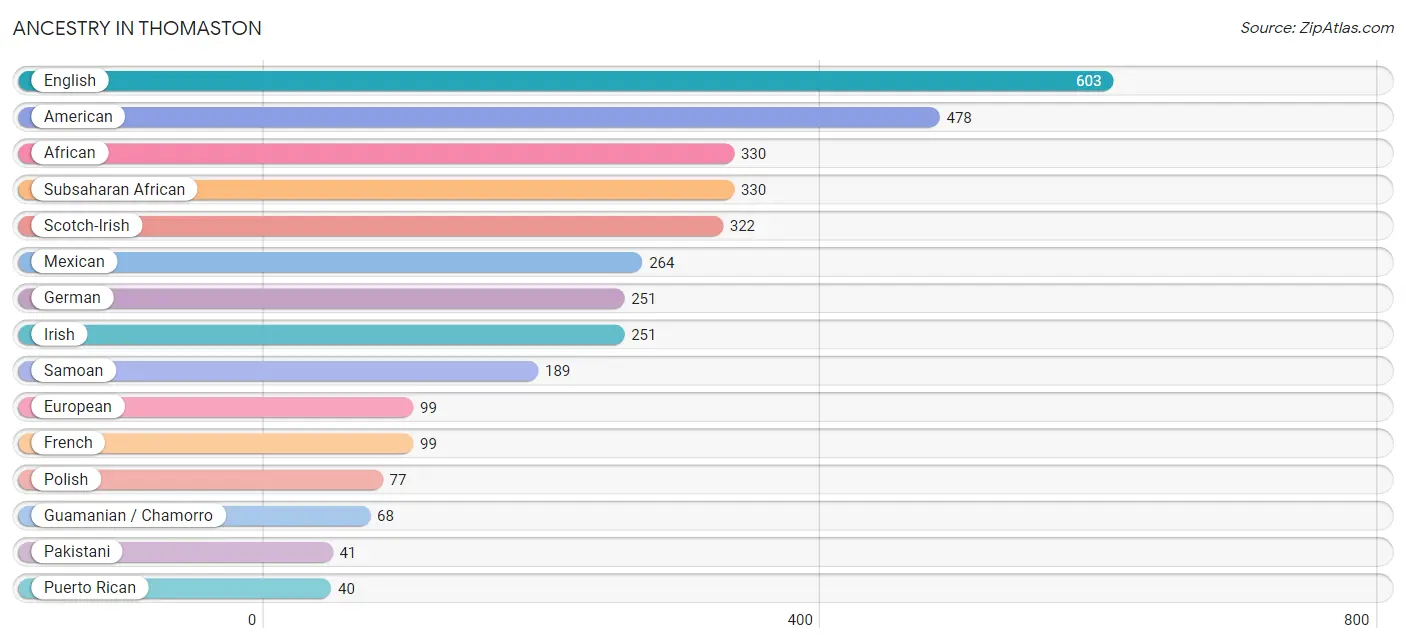
| Ancestry | # Population | % Population |
| African | 330 | 3.4% |
| Albanian | 11 | 0.1% |
| American | 478 | 4.9% |
| Arab | 12 | 0.1% |
| Cherokee | 35 | 0.4% |
| Eastern European | 24 | 0.3% |
| English | 603 | 6.2% |
| European | 99 | 1.0% |
| French | 99 | 1.0% |
| German | 251 | 2.6% |
| Guamanian / Chamorro | 68 | 0.7% |
| Irish | 251 | 2.6% |
| Korean | 14 | 0.1% |
| Mexican | 264 | 2.7% |
| Native Hawaiian | 19 | 0.2% |
| Pakistani | 41 | 0.4% |
| Polish | 77 | 0.8% |
| Puerto Rican | 40 | 0.4% |
| Samoan | 189 | 1.9% |
| Scandinavian | 19 | 0.2% |
| Scotch-Irish | 322 | 3.3% |
| Scottish | 27 | 0.3% |
| Subsaharan African | 330 | 3.4% | View All 23 Rows |
Immigrants in Thomaston
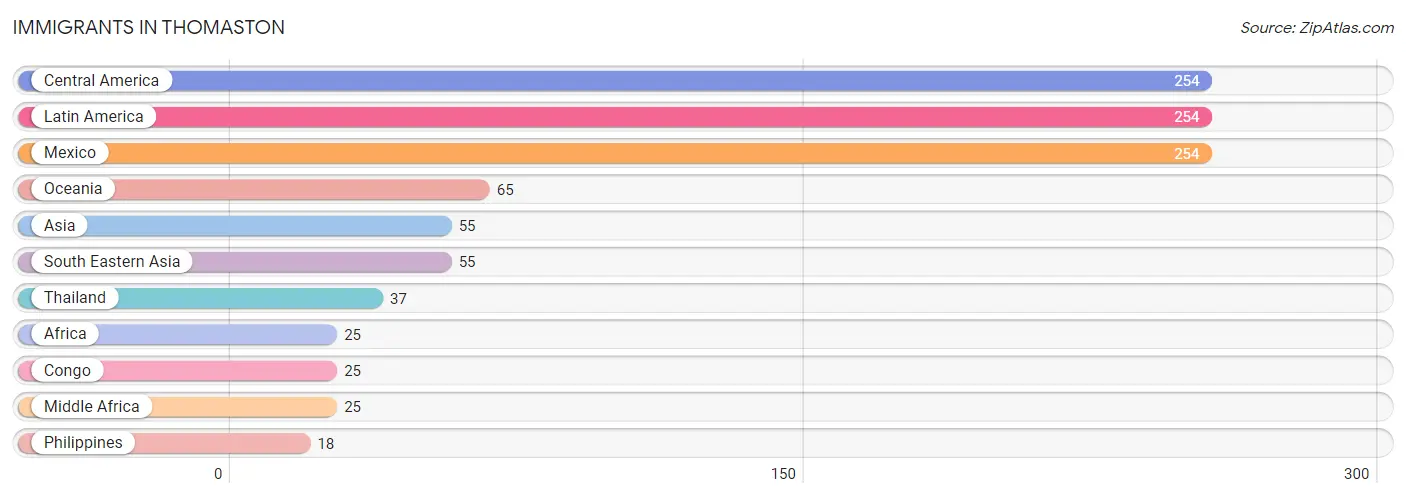
The most numerous immigrant groups reported in Thomaston came from Central America (254 | 2.6%), Latin America (254 | 2.6%), Mexico (254 | 2.6%), Oceania (65 | 0.7%), and Asia (55 | 0.6%), together accounting for 9.1% of all Thomaston residents.
| Immigration Origin | # Population | % Population |
| Africa | 25 | 0.3% |
| Asia | 55 | 0.6% |
| Central America | 254 | 2.6% |
| Congo | 25 | 0.3% |
| Latin America | 254 | 2.6% |
| Mexico | 254 | 2.6% |
| Middle Africa | 25 | 0.3% |
| Oceania | 65 | 0.7% |
| Philippines | 18 | 0.2% |
| South Eastern Asia | 55 | 0.6% |
| Thailand | 37 | 0.4% | View All 11 Rows |
Sex and Age in Thomaston
Sex and Age in Thomaston
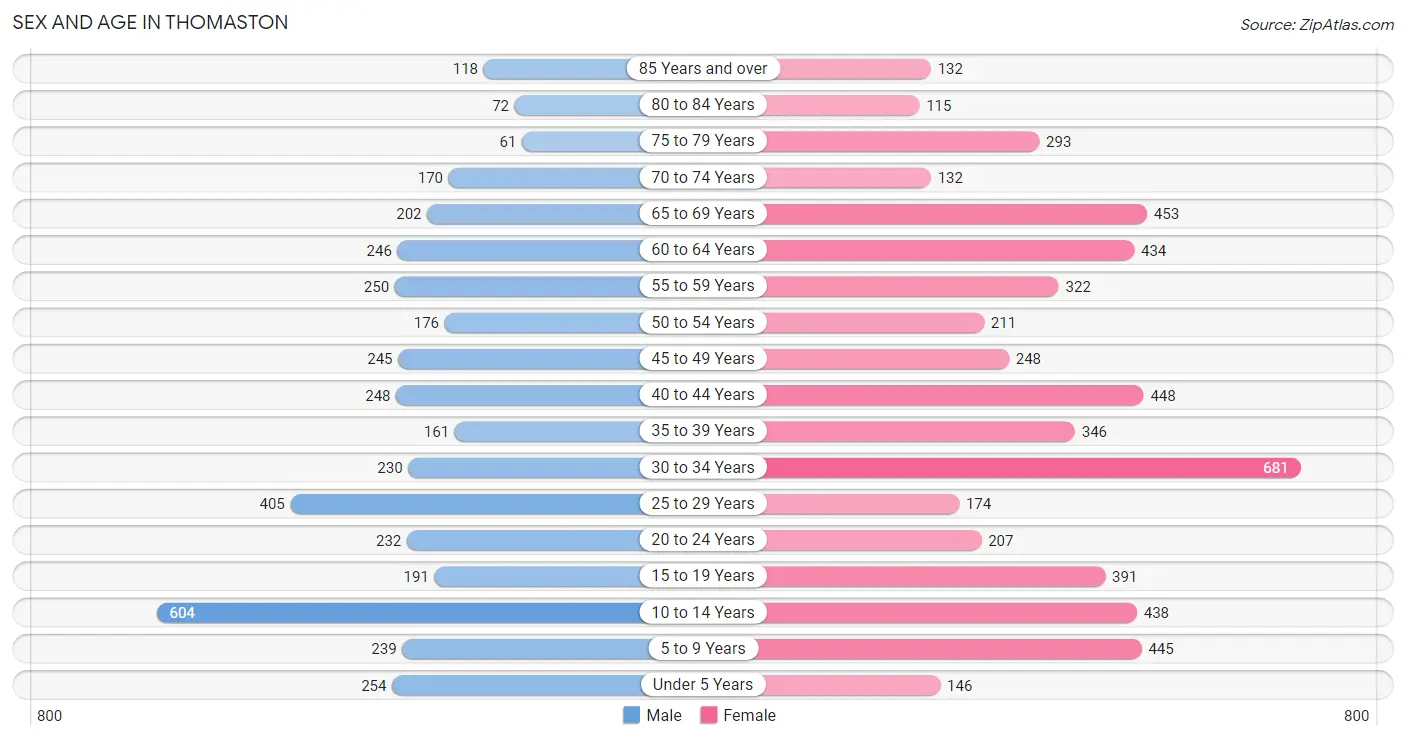
The most populous age groups in Thomaston are 10 to 14 Years (604 | 14.7%) for men and 30 to 34 Years (681 | 12.1%) for women.
| Age Bracket | Male | Female |
| Under 5 Years | 254 (6.2%) | 146 (2.6%) |
| 5 to 9 Years | 239 (5.8%) | 445 (7.9%) |
| 10 to 14 Years | 604 (14.7%) | 438 (7.8%) |
| 15 to 19 Years | 191 (4.6%) | 391 (7.0%) |
| 20 to 24 Years | 232 (5.7%) | 207 (3.7%) |
| 25 to 29 Years | 405 (9.9%) | 174 (3.1%) |
| 30 to 34 Years | 230 (5.6%) | 681 (12.1%) |
| 35 to 39 Years | 161 (3.9%) | 346 (6.2%) |
| 40 to 44 Years | 248 (6.0%) | 448 (8.0%) |
| 45 to 49 Years | 245 (6.0%) | 248 (4.4%) |
| 50 to 54 Years | 176 (4.3%) | 211 (3.8%) |
| 55 to 59 Years | 250 (6.1%) | 322 (5.7%) |
| 60 to 64 Years | 246 (6.0%) | 434 (7.7%) |
| 65 to 69 Years | 202 (4.9%) | 453 (8.1%) |
| 70 to 74 Years | 170 (4.1%) | 132 (2.4%) |
| 75 to 79 Years | 61 (1.5%) | 293 (5.2%) |
| 80 to 84 Years | 72 (1.8%) | 115 (2.1%) |
| 85 Years and over | 118 (2.9%) | 132 (2.4%) |
| Total | 4,104 (100.0%) | 5,616 (100.0%) |
Families and Households in Thomaston
Median Family Size in Thomaston
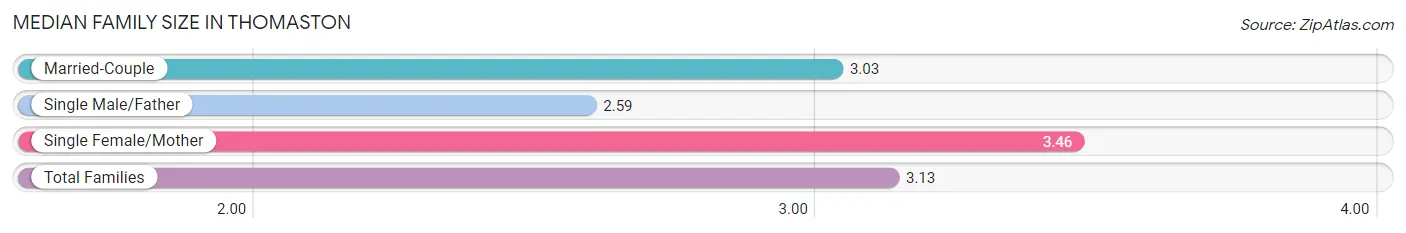
The median family size in Thomaston is 3.13 persons per family, with single female/mother families (861 | 39.7%) accounting for the largest median family size of 3.46 persons per family. On the other hand, single male/father families (332 | 15.3%) represent the smallest median family size with 2.59 persons per family.
| Family Type | # Families | Family Size |
| Married-Couple | 976 (45.0%) | 3.03 |
| Single Male/Father | 332 (15.3%) | 2.59 |
| Single Female/Mother | 861 (39.7%) | 3.46 |
| Total Families | 2,169 (100.0%) | 3.13 |
Median Household Size in Thomaston
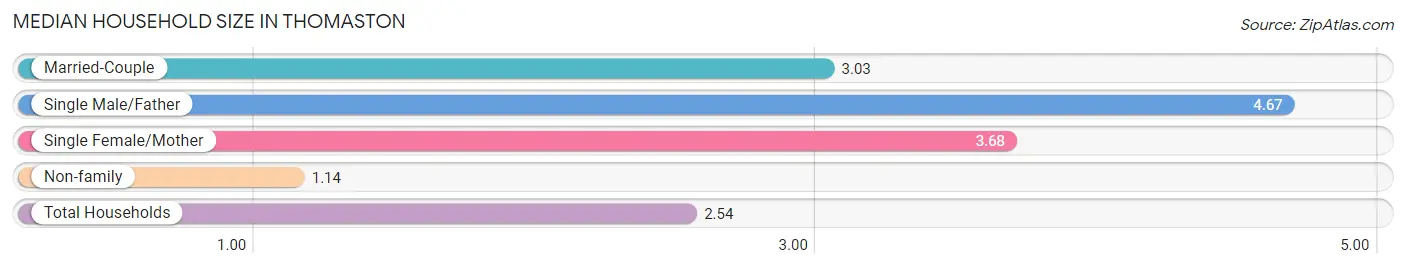
The median household size in Thomaston is 2.54 persons per household, with single male/father households (332 | 8.9%) accounting for the largest median household size of 4.67 persons per household. non-family households (1,542 | 41.5%) represent the smallest median household size with 1.14 persons per household.
| Household Type | # Households | Household Size |
| Married-Couple | 976 (26.3%) | 3.03 |
| Single Male/Father | 332 (8.9%) | 4.67 |
| Single Female/Mother | 861 (23.2%) | 3.68 |
| Non-family | 1,542 (41.5%) | 1.14 |
| Total Households | 3,711 (100.0%) | 2.54 |
Household Size by Marriage Status in Thomaston
Out of a total of 3,711 households in Thomaston, 2,169 (58.5%) are family households, while 1,542 (41.5%) are nonfamily households. The most numerous type of family households are 2-person households, comprising 955, and the most common type of nonfamily households are 1-person households, comprising 1,342.
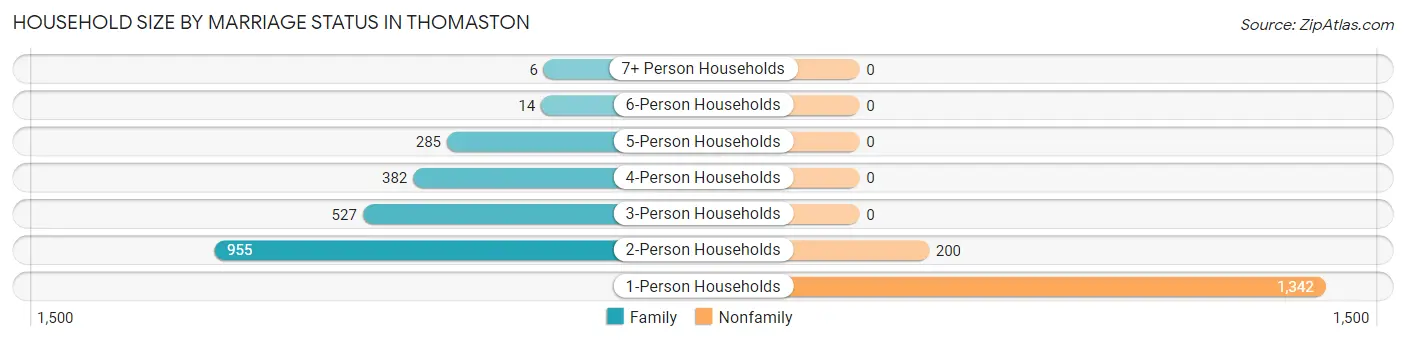
| Household Size | Family Households | Nonfamily Households |
| 1-Person Households | - | 1,342 (36.2%) |
| 2-Person Households | 955 (25.7%) | 200 (5.4%) |
| 3-Person Households | 527 (14.2%) | 0 (0.0%) |
| 4-Person Households | 382 (10.3%) | 0 (0.0%) |
| 5-Person Households | 285 (7.7%) | 0 (0.0%) |
| 6-Person Households | 14 (0.4%) | 0 (0.0%) |
| 7+ Person Households | 6 (0.2%) | 0 (0.0%) |
| Total | 2,169 (58.5%) | 1,542 (41.5%) |
Female Fertility in Thomaston
Fertility by Age in Thomaston
Average fertility rate in Thomaston is 48.0 births per 1,000 women. Women in the age bracket of 20 to 34 years have the highest fertility rate with 67.0 births per 1,000 women. Women in the age bracket of 20 to 34 years acount for 58.7% of all women with births.
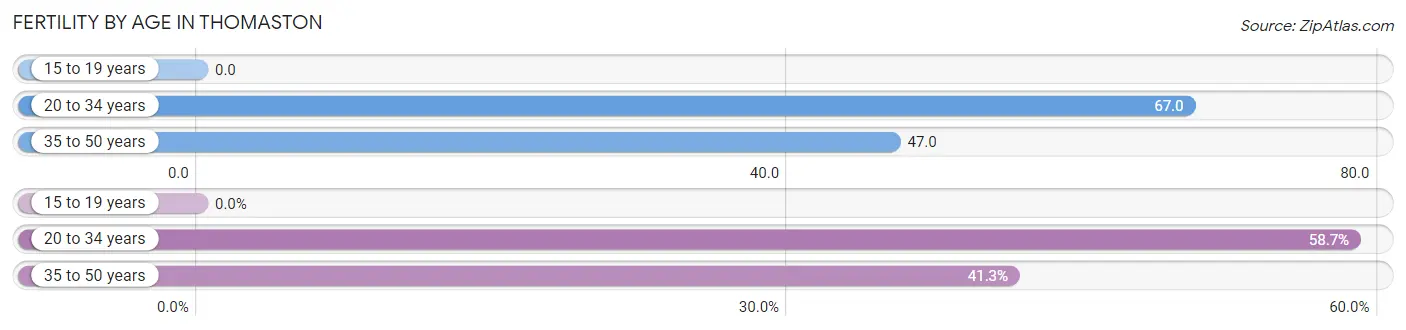
| Age Bracket | Women with Births | Births / 1,000 Women |
| 15 to 19 years | 0 (0.0%) | 0.0 |
| 20 to 34 years | 71 (58.7%) | 67.0 |
| 35 to 50 years | 50 (41.3%) | 47.0 |
| Total | 121 (100.0%) | 48.0 |
Fertility by Age by Marriage Status in Thomaston
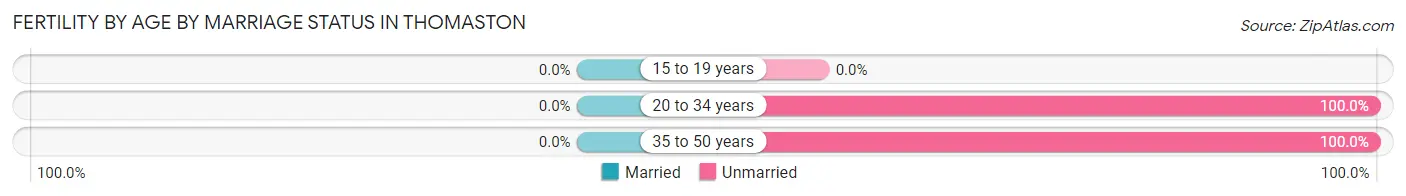
| Age Bracket | Married | Unmarried |
| 15 to 19 years | 0 (0.0%) | 0 (0.0%) |
| 20 to 34 years | 0 (0.0%) | 71 (100.0%) |
| 35 to 50 years | 0 (0.0%) | 50 (100.0%) |
| Total | 0 (0.0%) | 121 (100.0%) |
Fertility by Education in Thomaston
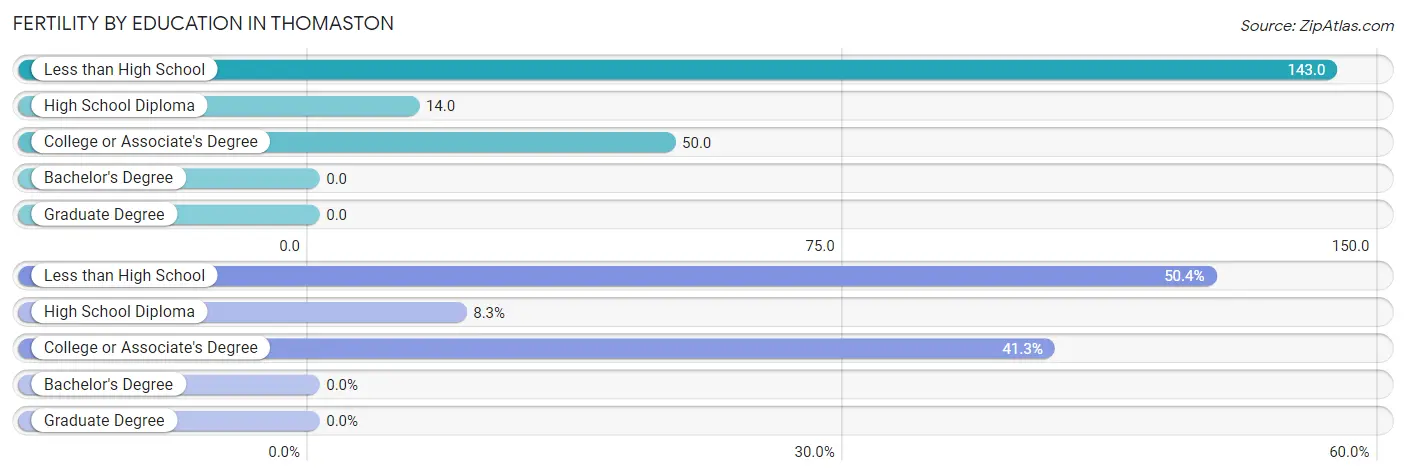
| Educational Attainment | Women with Births | Births / 1,000 Women |
| Less than High School | 61 (50.4%) | 143.0 |
| High School Diploma | 10 (8.3%) | 14.0 |
| College or Associate's Degree | 50 (41.3%) | 50.0 |
| Bachelor's Degree | 0 (0.0%) | 0.0 |
| Graduate Degree | 0 (0.0%) | 0.0 |
| Total | 121 (100.0%) | 48.0 |
Fertility by Education by Marriage Status in Thomaston
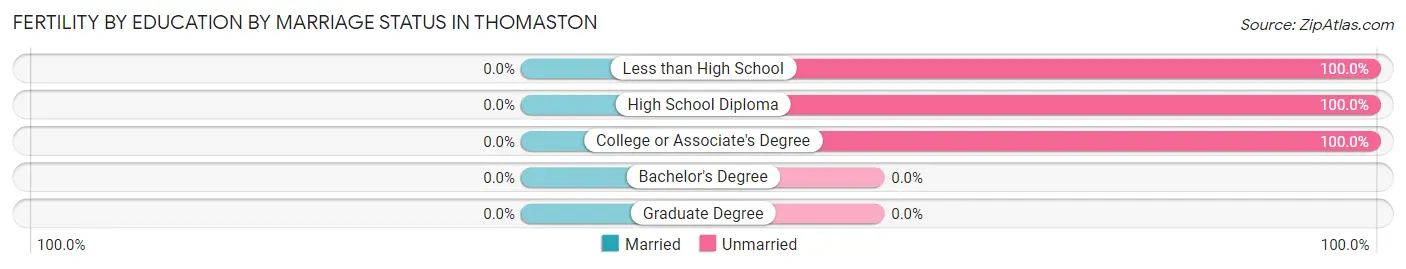
| Educational Attainment | Married | Unmarried |
| Less than High School | 0 (0.0%) | 61 (100.0%) |
| High School Diploma | 0 (0.0%) | 10 (100.0%) |
| College or Associate's Degree | 0 (0.0%) | 50 (100.0%) |
| Bachelor's Degree | 0 (0.0%) | 0 (0.0%) |
| Graduate Degree | 0 (0.0%) | 0 (0.0%) |
| Total | 0 (0.0%) | 121 (100.0%) |
Employment Characteristics in Thomaston
Employment by Class of Employer in Thomaston
Among the 3,354 employed individuals in Thomaston, private company employees (2,546 | 75.9%), local government employees (285 | 8.5%), and state government employees (243 | 7.2%) make up the most common classes of employment.
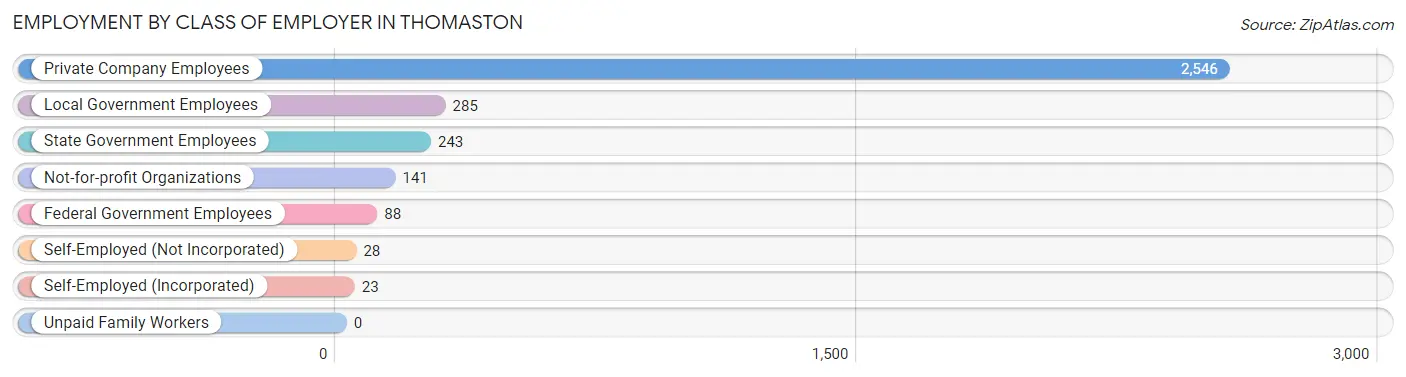
| Employer Class | # Employees | % Employees |
| Private Company Employees | 2,546 | 75.9% |
| Self-Employed (Incorporated) | 23 | 0.7% |
| Self-Employed (Not Incorporated) | 28 | 0.8% |
| Not-for-profit Organizations | 141 | 4.2% |
| Local Government Employees | 285 | 8.5% |
| State Government Employees | 243 | 7.2% |
| Federal Government Employees | 88 | 2.6% |
| Unpaid Family Workers | 0 | 0.0% |
| Total | 3,354 | 100.0% |
Employment Status by Age in Thomaston
According to the labor force statistics for Thomaston, out of the total population over 16 years of age (7,489), 47.7% or 3,572 individuals are in the labor force, with 5.1% or 182 of them unemployed. The age group with the highest labor force participation rate is 20 to 24 years, with 89.7% or 394 individuals in the labor force. Within the labor force, the 35 to 44 years age range has the highest percentage of unemployed individuals, with 22.5% or 170 of them being unemployed.
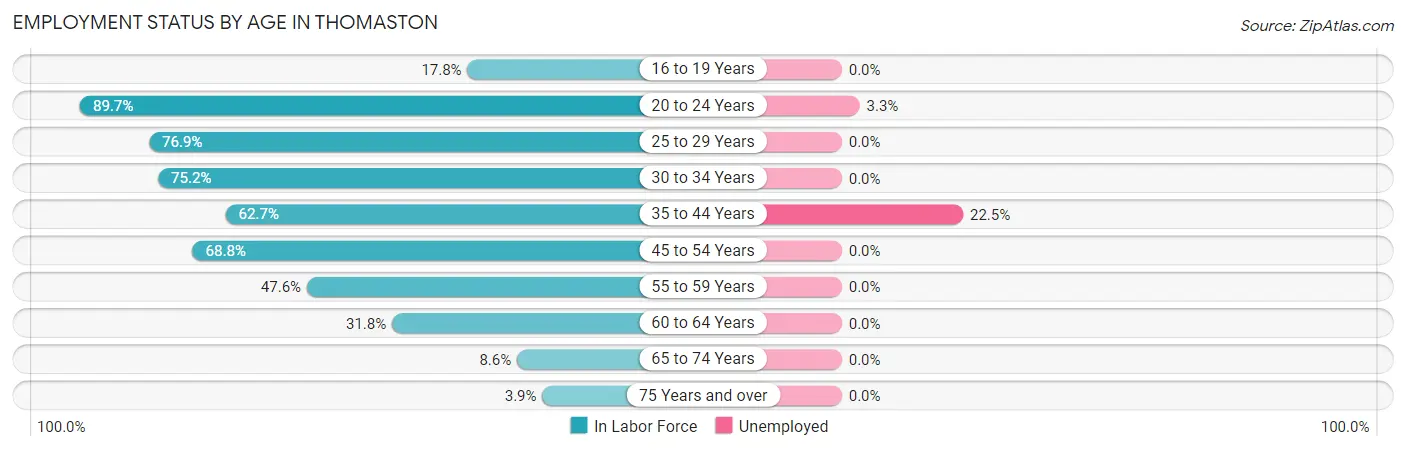
| Age Bracket | In Labor Force | Unemployed |
| 16 to 19 Years | 85 (17.8%) | 0 (0.0%) |
| 20 to 24 Years | 394 (89.7%) | 13 (3.3%) |
| 25 to 29 Years | 445 (76.9%) | 0 (0.0%) |
| 30 to 34 Years | 685 (75.2%) | 0 (0.0%) |
| 35 to 44 Years | 754 (62.7%) | 170 (22.5%) |
| 45 to 54 Years | 605 (68.8%) | 0 (0.0%) |
| 55 to 59 Years | 272 (47.6%) | 0 (0.0%) |
| 60 to 64 Years | 216 (31.8%) | 0 (0.0%) |
| 65 to 74 Years | 82 (8.6%) | 0 (0.0%) |
| 75 Years and over | 31 (3.9%) | 0 (0.0%) |
| Total | 3,572 (47.7%) | 182 (5.1%) |
Employment Status by Educational Attainment in Thomaston
According to labor force statistics for Thomaston, 61.7% of individuals (2,977) out of the total population between 25 and 64 years of age (4,825) are in the labor force, with 5.7% or 170 of them being unemployed. The group with the highest labor force participation rate are those with the educational attainment of bachelor's degree or higher, with 77.4% or 637 individuals in the labor force. Within the labor force, individuals with high school diploma education have the highest percentage of unemployment, with 11.9% or 125 of them being unemployed.
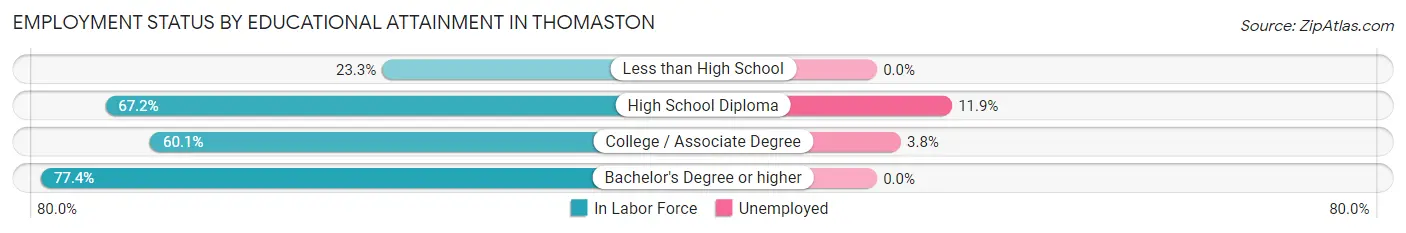
| Educational Attainment | In Labor Force | Unemployed |
| Less than High School | 112 (23.3%) | 0 (0.0%) |
| High School Diploma | 1,047 (67.2%) | 185 (11.9%) |
| College / Associate Degree | 1,180 (60.1%) | 75 (3.8%) |
| Bachelor's Degree or higher | 637 (77.4%) | 0 (0.0%) |
| Total | 2,977 (61.7%) | 275 (5.7%) |
Employment Occupations by Sex in Thomaston
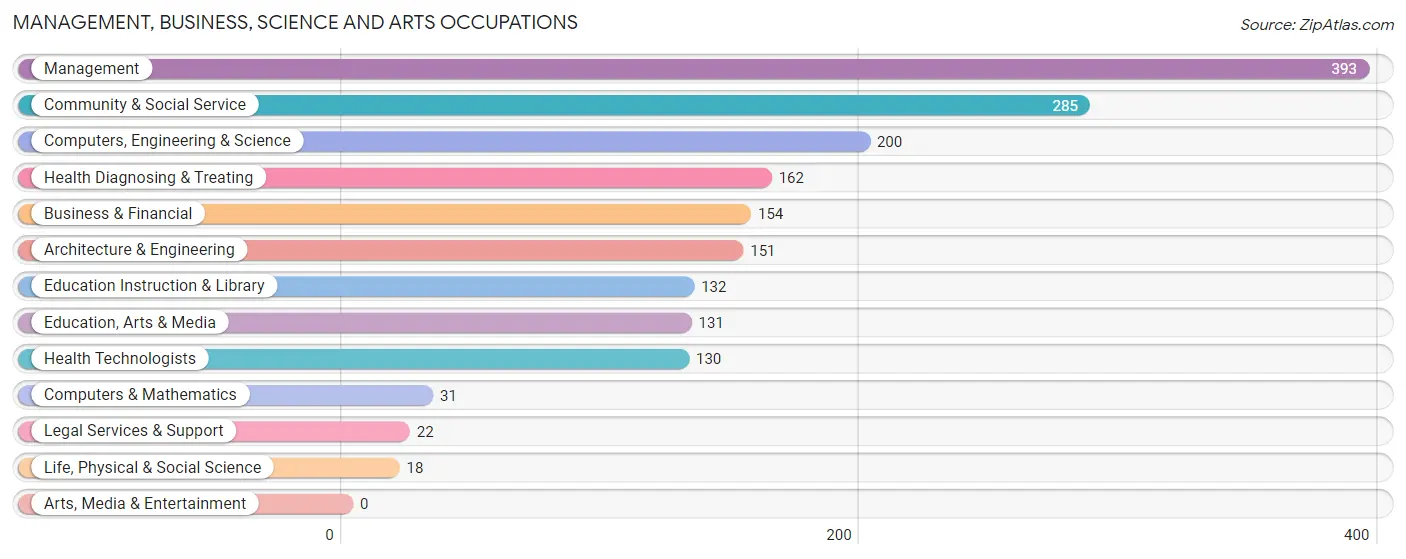
Management, Business, Science and Arts Occupations
The most common Management, Business, Science and Arts occupations in Thomaston are Management (393 | 11.6%), Community & Social Service (285 | 8.4%), Computers, Engineering & Science (200 | 5.9%), Health Diagnosing & Treating (162 | 4.8%), and Business & Financial (154 | 4.5%).
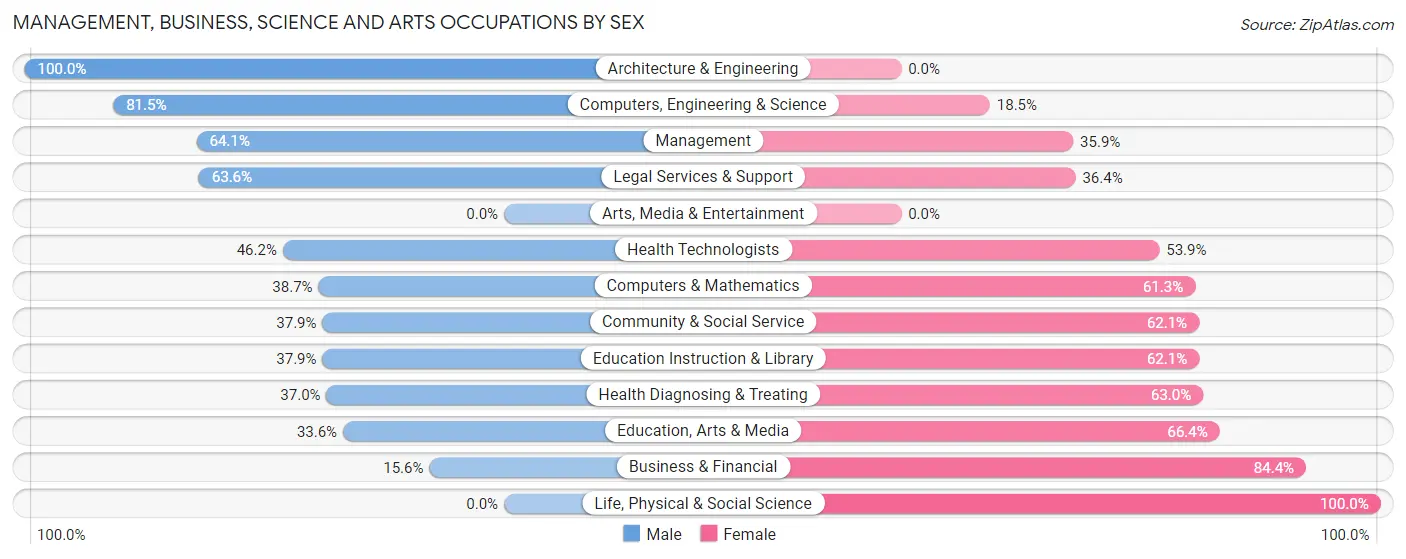
Management, Business, Science and Arts Occupations by Sex
Within the Management, Business, Science and Arts occupations in Thomaston, the most male-oriented occupations are Architecture & Engineering (100.0%), Computers, Engineering & Science (81.5%), and Management (64.1%), while the most female-oriented occupations are Life, Physical & Social Science (100.0%), Business & Financial (84.4%), and Education, Arts & Media (66.4%).
| Occupation | Male | Female |
| Management | 252 (64.1%) | 141 (35.9%) |
| Business & Financial | 24 (15.6%) | 130 (84.4%) |
| Computers, Engineering & Science | 163 (81.5%) | 37 (18.5%) |
| Computers & Mathematics | 12 (38.7%) | 19 (61.3%) |
| Architecture & Engineering | 151 (100.0%) | 0 (0.0%) |
| Life, Physical & Social Science | 0 (0.0%) | 18 (100.0%) |
| Community & Social Service | 108 (37.9%) | 177 (62.1%) |
| Education, Arts & Media | 44 (33.6%) | 87 (66.4%) |
| Legal Services & Support | 14 (63.6%) | 8 (36.4%) |
| Education Instruction & Library | 50 (37.9%) | 82 (62.1%) |
| Arts, Media & Entertainment | 0 (0.0%) | 0 (0.0%) |
| Health Diagnosing & Treating | 60 (37.0%) | 102 (63.0%) |
| Health Technologists | 60 (46.2%) | 70 (53.8%) |
| Total (Category) | 607 (50.8%) | 587 (49.2%) |
| Total (Overall) | 1,696 (50.1%) | 1,690 (49.9%) |
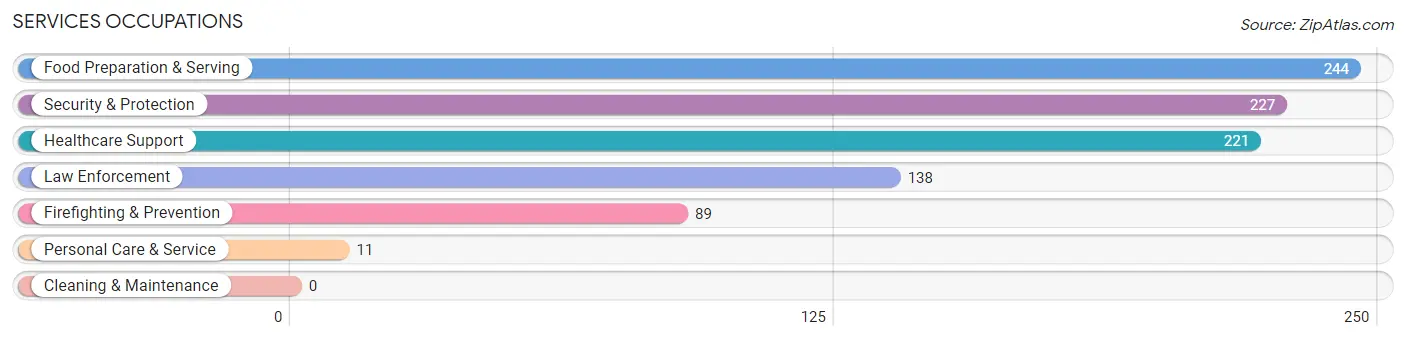
Services Occupations
The most common Services occupations in Thomaston are Food Preparation & Serving (244 | 7.2%), Security & Protection (227 | 6.7%), Healthcare Support (221 | 6.5%), Law Enforcement (138 | 4.1%), and Firefighting & Prevention (89 | 2.6%).
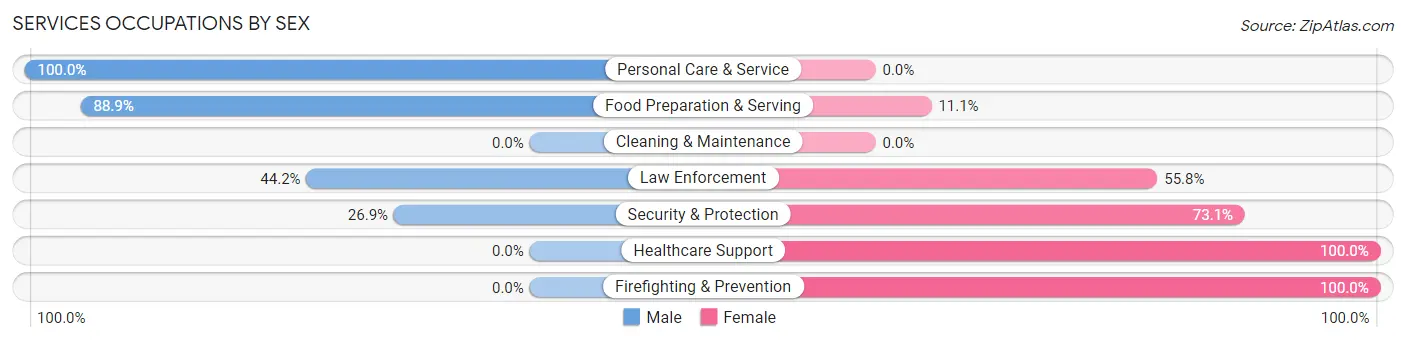
Services Occupations by Sex
Within the Services occupations in Thomaston, the most male-oriented occupations are Personal Care & Service (100.0%), Food Preparation & Serving (88.9%), and Law Enforcement (44.2%), while the most female-oriented occupations are Healthcare Support (100.0%), Firefighting & Prevention (100.0%), and Security & Protection (73.1%).
| Occupation | Male | Female |
| Healthcare Support | 0 (0.0%) | 221 (100.0%) |
| Security & Protection | 61 (26.9%) | 166 (73.1%) |
| Firefighting & Prevention | 0 (0.0%) | 89 (100.0%) |
| Law Enforcement | 61 (44.2%) | 77 (55.8%) |
| Food Preparation & Serving | 217 (88.9%) | 27 (11.1%) |
| Cleaning & Maintenance | 0 (0.0%) | 0 (0.0%) |
| Personal Care & Service | 11 (100.0%) | 0 (0.0%) |
| Total (Category) | 289 (41.1%) | 414 (58.9%) |
| Total (Overall) | 1,696 (50.1%) | 1,690 (49.9%) |
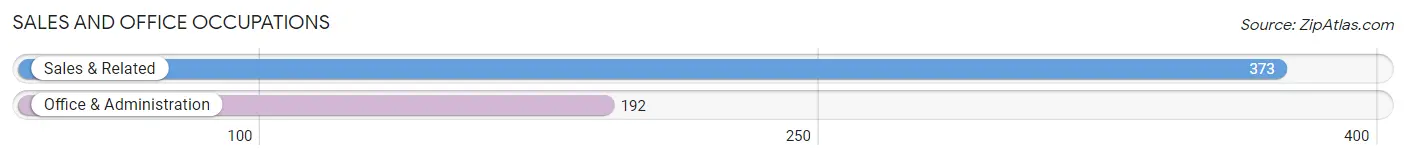
Sales and Office Occupations
The most common Sales and Office occupations in Thomaston are Sales & Related (373 | 11.0%), and Office & Administration (192 | 5.7%).
Sales and Office Occupations by Sex
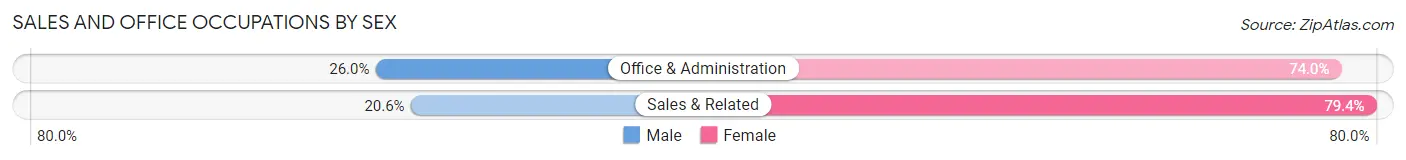
| Occupation | Male | Female |
| Sales & Related | 77 (20.6%) | 296 (79.4%) |
| Office & Administration | 50 (26.0%) | 142 (74.0%) |
| Total (Category) | 127 (22.5%) | 438 (77.5%) |
| Total (Overall) | 1,696 (50.1%) | 1,690 (49.9%) |
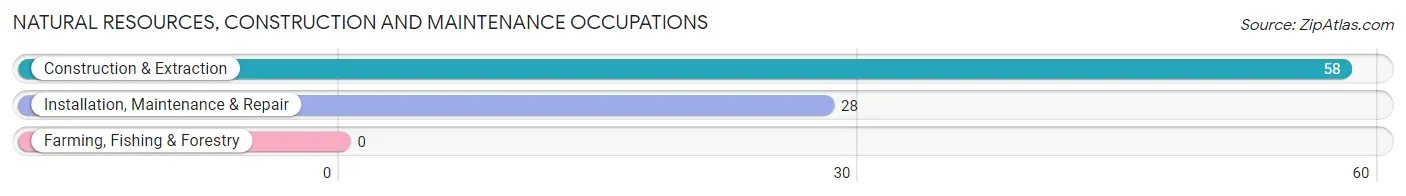
Natural Resources, Construction and Maintenance Occupations
The most common Natural Resources, Construction and Maintenance occupations in Thomaston are Construction & Extraction (58 | 1.7%), and Installation, Maintenance & Repair (28 | 0.8%).
Natural Resources, Construction and Maintenance Occupations by Sex
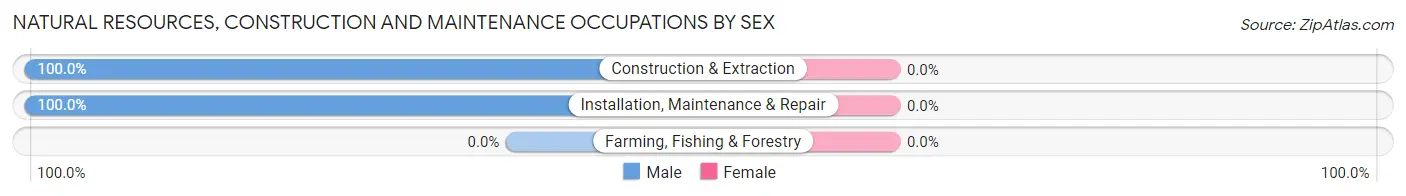
| Occupation | Male | Female |
| Farming, Fishing & Forestry | 0 (0.0%) | 0 (0.0%) |
| Construction & Extraction | 58 (100.0%) | 0 (0.0%) |
| Installation, Maintenance & Repair | 28 (100.0%) | 0 (0.0%) |
| Total (Category) | 86 (100.0%) | 0 (0.0%) |
| Total (Overall) | 1,696 (50.1%) | 1,690 (49.9%) |
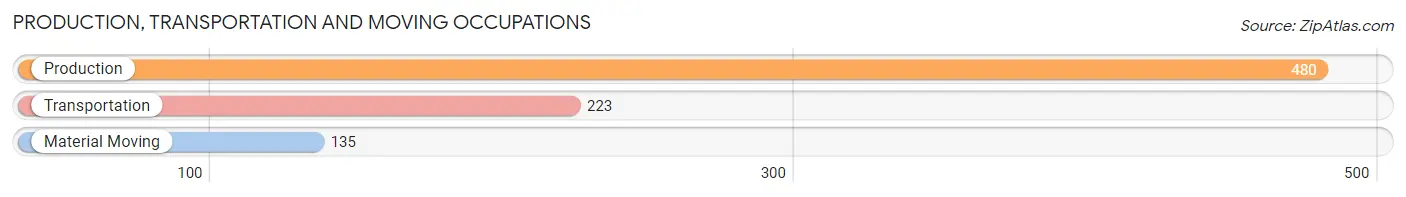
Production, Transportation and Moving Occupations
The most common Production, Transportation and Moving occupations in Thomaston are Production (480 | 14.2%), Transportation (223 | 6.6%), and Material Moving (135 | 4.0%).
Production, Transportation and Moving Occupations by Sex
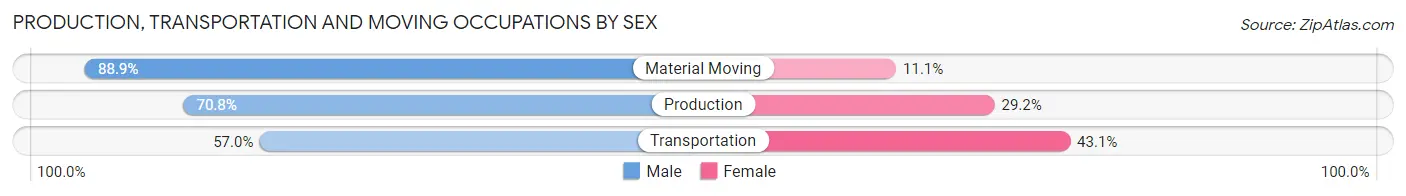
| Occupation | Male | Female |
| Production | 340 (70.8%) | 140 (29.2%) |
| Transportation | 127 (57.0%) | 96 (43.0%) |
| Material Moving | 120 (88.9%) | 15 (11.1%) |
| Total (Category) | 587 (70.1%) | 251 (29.9%) |
| Total (Overall) | 1,696 (50.1%) | 1,690 (49.9%) |
Employment Industries by Sex in Thomaston
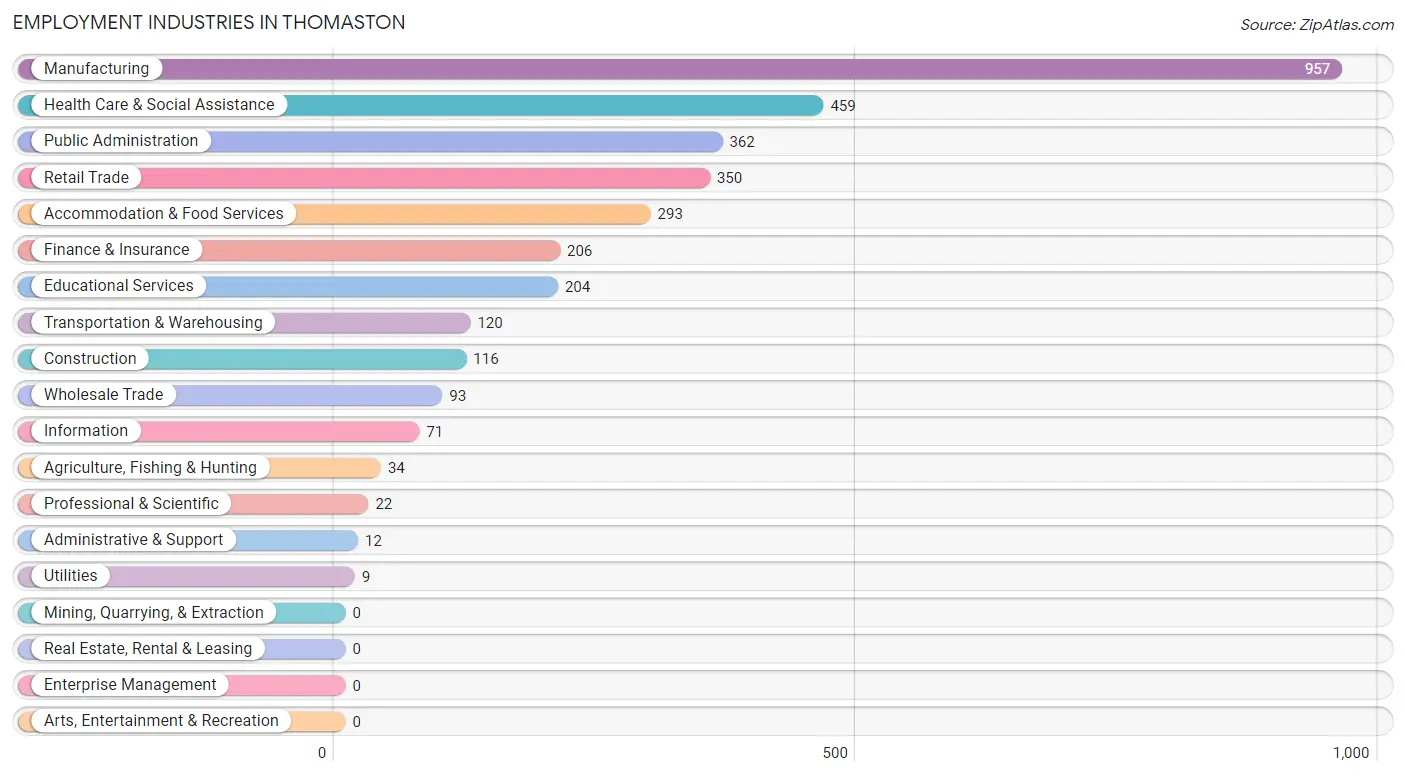
Employment Industries in Thomaston
The major employment industries in Thomaston include Manufacturing (957 | 28.3%), Health Care & Social Assistance (459 | 13.6%), Public Administration (362 | 10.7%), Retail Trade (350 | 10.3%), and Accommodation & Food Services (293 | 8.6%).
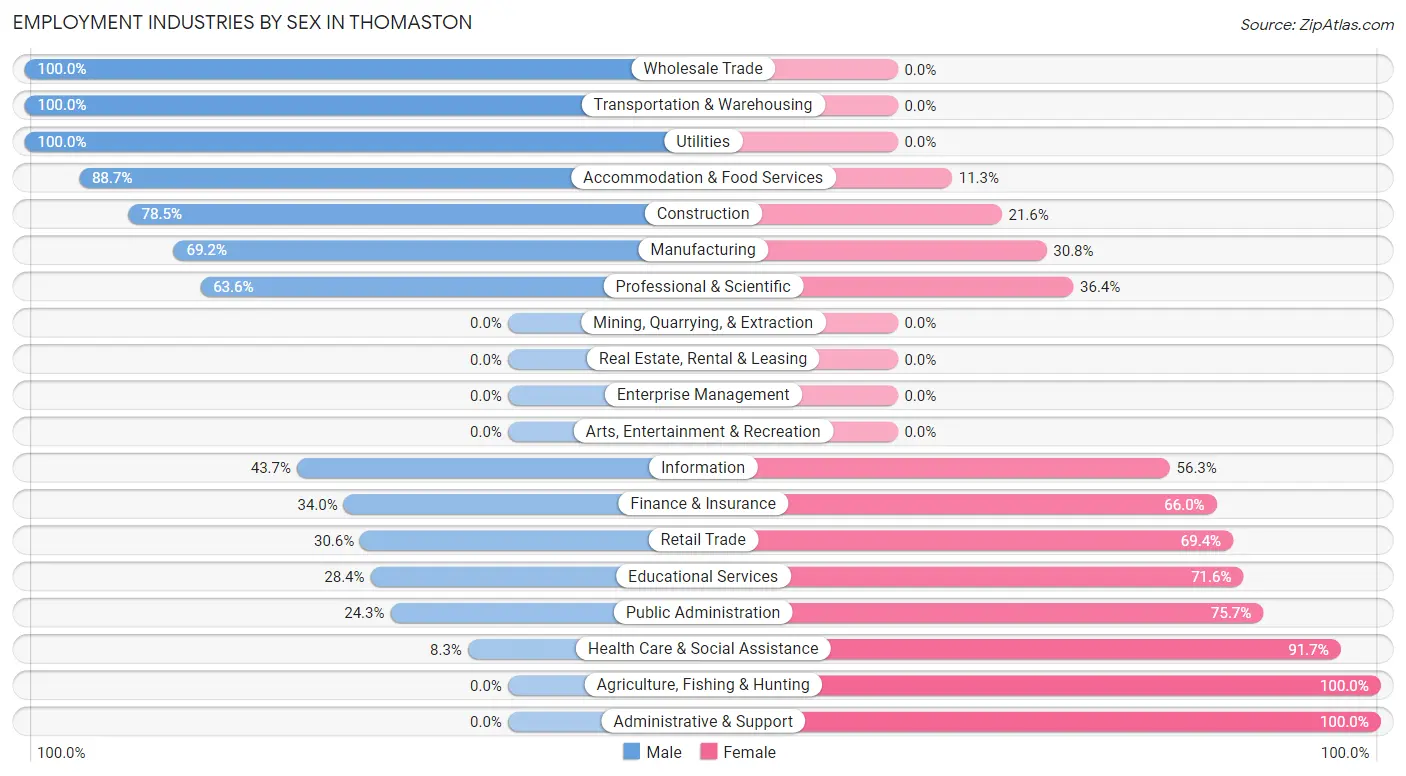
Employment Industries by Sex in Thomaston
The Thomaston industries that see more men than women are Wholesale Trade (100.0%), Transportation & Warehousing (100.0%), and Utilities (100.0%), whereas the industries that tend to have a higher number of women are Agriculture, Fishing & Hunting (100.0%), Administrative & Support (100.0%), and Health Care & Social Assistance (91.7%).
| Industry | Male | Female |
| Agriculture, Fishing & Hunting | 0 (0.0%) | 34 (100.0%) |
| Mining, Quarrying, & Extraction | 0 (0.0%) | 0 (0.0%) |
| Construction | 91 (78.4%) | 25 (21.5%) |
| Manufacturing | 662 (69.2%) | 295 (30.8%) |
| Wholesale Trade | 93 (100.0%) | 0 (0.0%) |
| Retail Trade | 107 (30.6%) | 243 (69.4%) |
| Transportation & Warehousing | 120 (100.0%) | 0 (0.0%) |
| Utilities | 9 (100.0%) | 0 (0.0%) |
| Information | 31 (43.7%) | 40 (56.3%) |
| Finance & Insurance | 70 (34.0%) | 136 (66.0%) |
| Real Estate, Rental & Leasing | 0 (0.0%) | 0 (0.0%) |
| Professional & Scientific | 14 (63.6%) | 8 (36.4%) |
| Enterprise Management | 0 (0.0%) | 0 (0.0%) |
| Administrative & Support | 0 (0.0%) | 12 (100.0%) |
| Educational Services | 58 (28.4%) | 146 (71.6%) |
| Health Care & Social Assistance | 38 (8.3%) | 421 (91.7%) |
| Arts, Entertainment & Recreation | 0 (0.0%) | 0 (0.0%) |
| Accommodation & Food Services | 260 (88.7%) | 33 (11.3%) |
| Public Administration | 88 (24.3%) | 274 (75.7%) |
| Total | 1,696 (50.1%) | 1,690 (49.9%) |
Education in Thomaston
School Enrollment in Thomaston
The most common levels of schooling among the 2,694 students in Thomaston are middle school (786 | 29.2%), high school (692 | 25.7%), and kindergarten (375 | 13.9%).
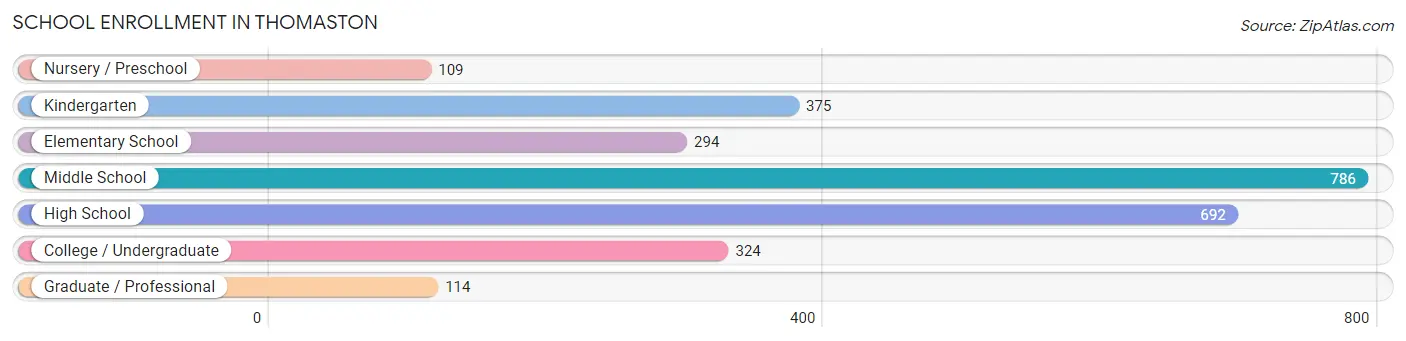
| School Level | # Students | % Students |
| Nursery / Preschool | 109 | 4.1% |
| Kindergarten | 375 | 13.9% |
| Elementary School | 294 | 10.9% |
| Middle School | 786 | 29.2% |
| High School | 692 | 25.7% |
| College / Undergraduate | 324 | 12.0% |
| Graduate / Professional | 114 | 4.2% |
| Total | 2,694 | 100.0% |
School Enrollment by Age by Funding Source in Thomaston
Out of a total of 2,694 students who are enrolled in schools in Thomaston, 267 (9.9%) attend a private institution, while the remaining 2,427 (90.1%) are enrolled in public schools. The age group of 3 to 4 year olds has the highest likelihood of being enrolled in private schools, with 45 (41.3% in the age bracket) enrolled. Conversely, the age group of 15 to 17 year olds has the lowest likelihood of being enrolled in a private school, with 412 (100.0% in the age bracket) attending a public institution.
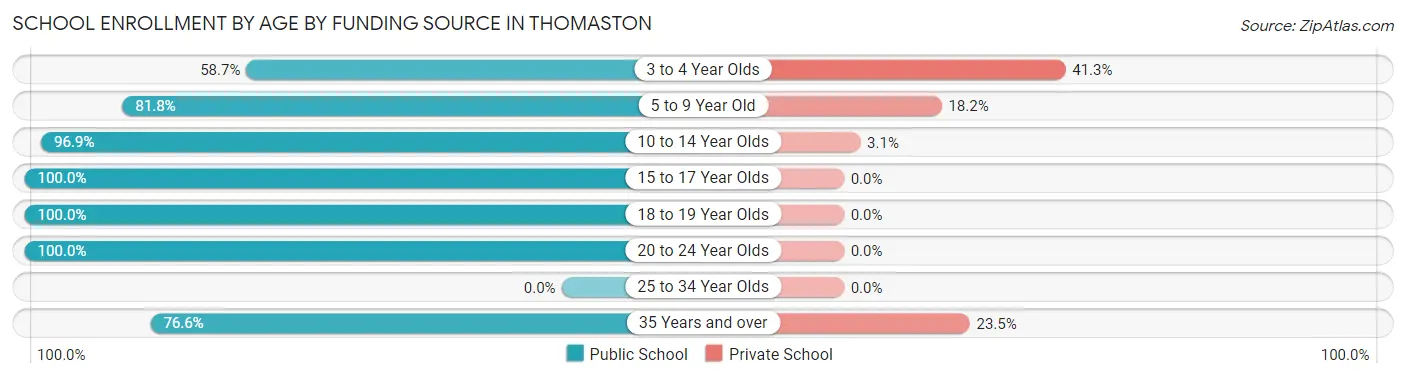
| Age Bracket | Public School | Private School |
| 3 to 4 Year Olds | 64 (58.7%) | 45 (41.3%) |
| 5 to 9 Year Old | 552 (81.8%) | 123 (18.2%) |
| 10 to 14 Year Olds | 1,010 (96.9%) | 32 (3.1%) |
| 15 to 17 Year Olds | 412 (100.0%) | 0 (0.0%) |
| 18 to 19 Year Olds | 64 (100.0%) | 0 (0.0%) |
| 20 to 24 Year Olds | 102 (100.0%) | 0 (0.0%) |
| 25 to 34 Year Olds | 0 (0.0%) | 0 (0.0%) |
| 35 Years and over | 222 (76.5%) | 68 (23.4%) |
| Total | 2,427 (90.1%) | 267 (9.9%) |
Educational Attainment by Field of Study in Thomaston
Education (253 | 21.0%), science & technology (225 | 18.7%), business (220 | 18.3%), physical & health sciences (75 | 6.2%), and arts & humanities (71 | 5.9%) are the most common fields of study among 1,204 individuals in Thomaston who have obtained a bachelor's degree or higher.
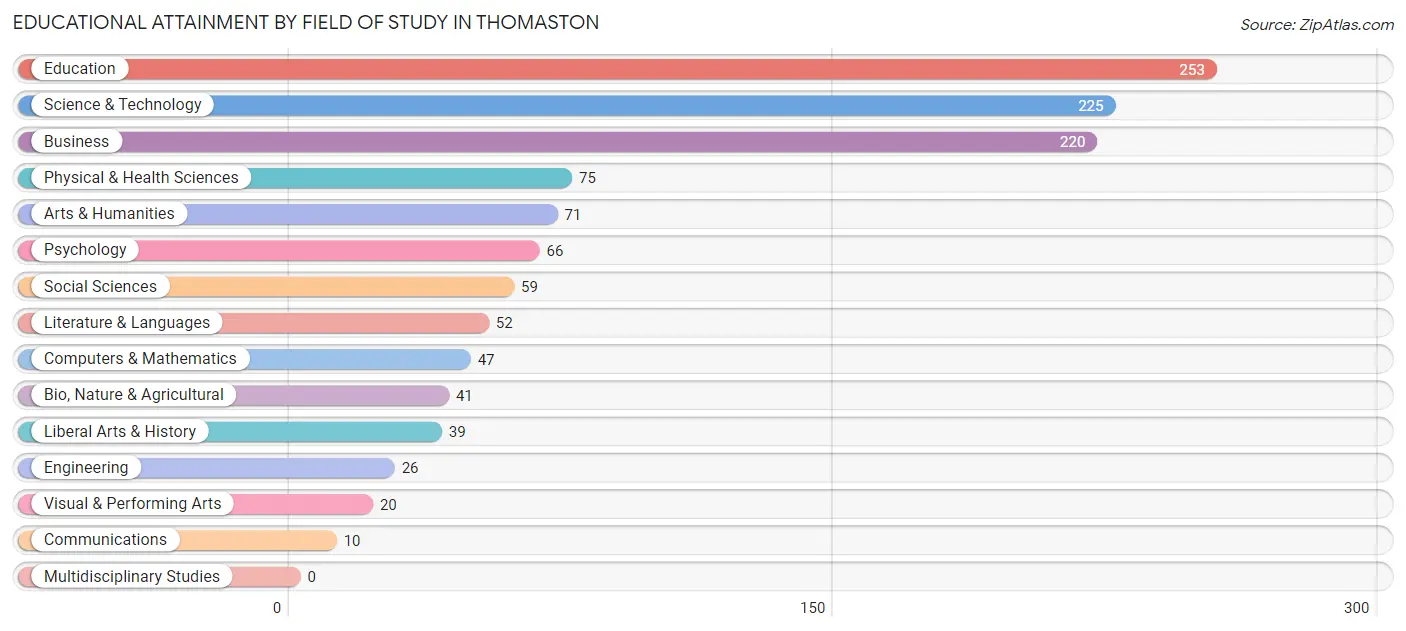
| Field of Study | # Graduates | % Graduates |
| Computers & Mathematics | 47 | 3.9% |
| Bio, Nature & Agricultural | 41 | 3.4% |
| Physical & Health Sciences | 75 | 6.2% |
| Psychology | 66 | 5.5% |
| Social Sciences | 59 | 4.9% |
| Engineering | 26 | 2.2% |
| Multidisciplinary Studies | 0 | 0.0% |
| Science & Technology | 225 | 18.7% |
| Business | 220 | 18.3% |
| Education | 253 | 21.0% |
| Literature & Languages | 52 | 4.3% |
| Liberal Arts & History | 39 | 3.2% |
| Visual & Performing Arts | 20 | 1.7% |
| Communications | 10 | 0.8% |
| Arts & Humanities | 71 | 5.9% |
| Total | 1,204 | 100.0% |
Transportation & Commute in Thomaston
Vehicle Availability by Sex in Thomaston
The most prevalent vehicle ownership categories in Thomaston are males with 1 vehicle (505, accounting for 29.8%) and females with 1 vehicle (569, making up 30.5%).
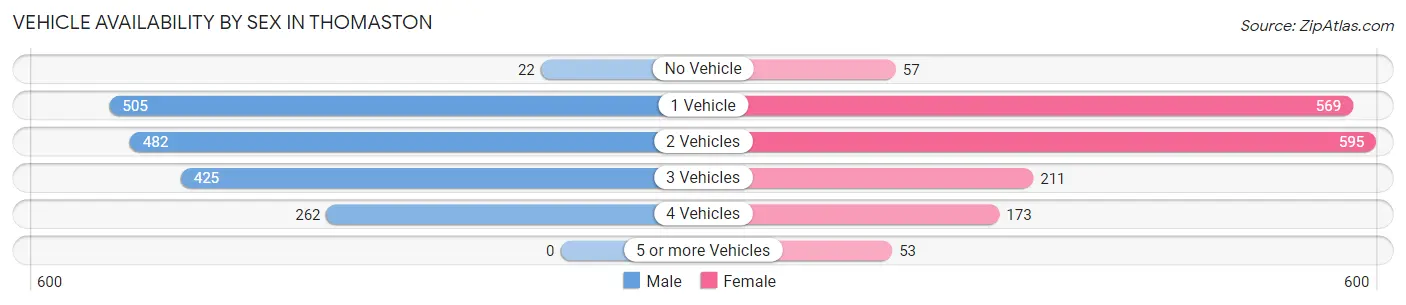
| Vehicles Available | Male | Female |
| No Vehicle | 22 (1.3%) | 57 (3.4%) |
| 1 Vehicle | 505 (29.8%) | 569 (34.3%) |
| 2 Vehicles | 482 (28.4%) | 595 (35.9%) |
| 3 Vehicles | 425 (25.1%) | 211 (12.7%) |
| 4 Vehicles | 262 (15.4%) | 173 (10.4%) |
| 5 or more Vehicles | 0 (0.0%) | 53 (3.2%) |
| Total | 1,696 (100.0%) | 1,658 (100.0%) |
Commute Time in Thomaston
The most frequently occuring commute durations in Thomaston are 5 to 9 minutes (840 commuters, 25.6%), 10 to 14 minutes (605 commuters, 18.4%), and less than 5 minutes (382 commuters, 11.6%).
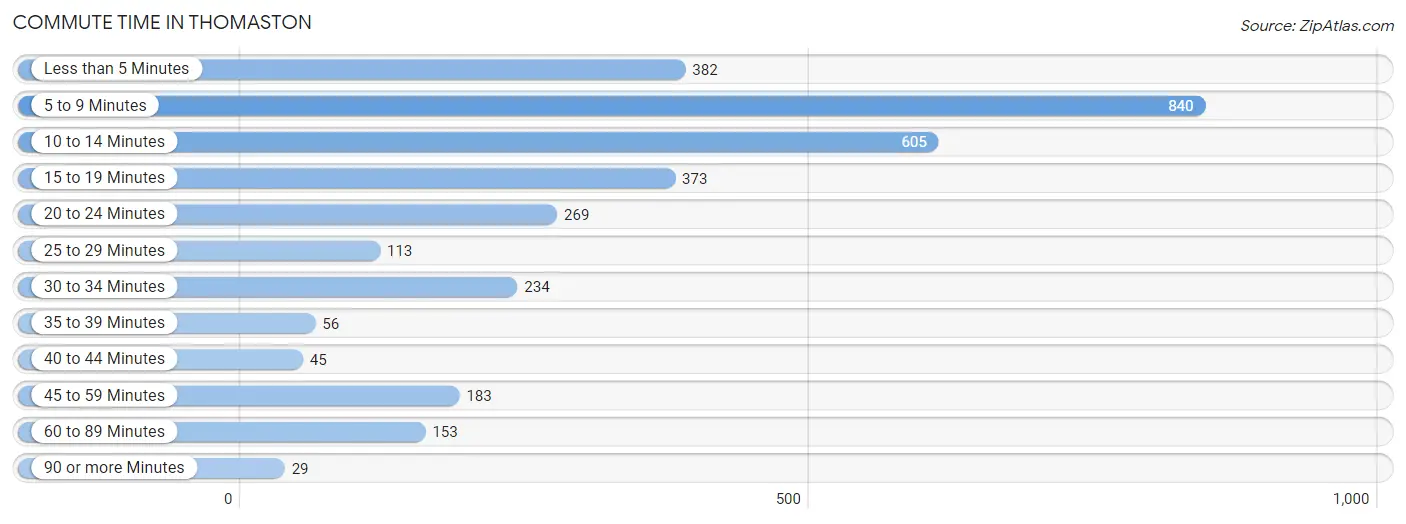
| Commute Time | # Commuters | % Commuters |
| Less than 5 Minutes | 382 | 11.6% |
| 5 to 9 Minutes | 840 | 25.6% |
| 10 to 14 Minutes | 605 | 18.4% |
| 15 to 19 Minutes | 373 | 11.4% |
| 20 to 24 Minutes | 269 | 8.2% |
| 25 to 29 Minutes | 113 | 3.4% |
| 30 to 34 Minutes | 234 | 7.1% |
| 35 to 39 Minutes | 56 | 1.7% |
| 40 to 44 Minutes | 45 | 1.4% |
| 45 to 59 Minutes | 183 | 5.6% |
| 60 to 89 Minutes | 153 | 4.7% |
| 90 or more Minutes | 29 | 0.9% |
Commute Time by Sex in Thomaston
The most common commute times in Thomaston are 5 to 9 minutes (344 commuters, 21.0%) for males and 5 to 9 minutes (496 commuters, 30.1%) for females.
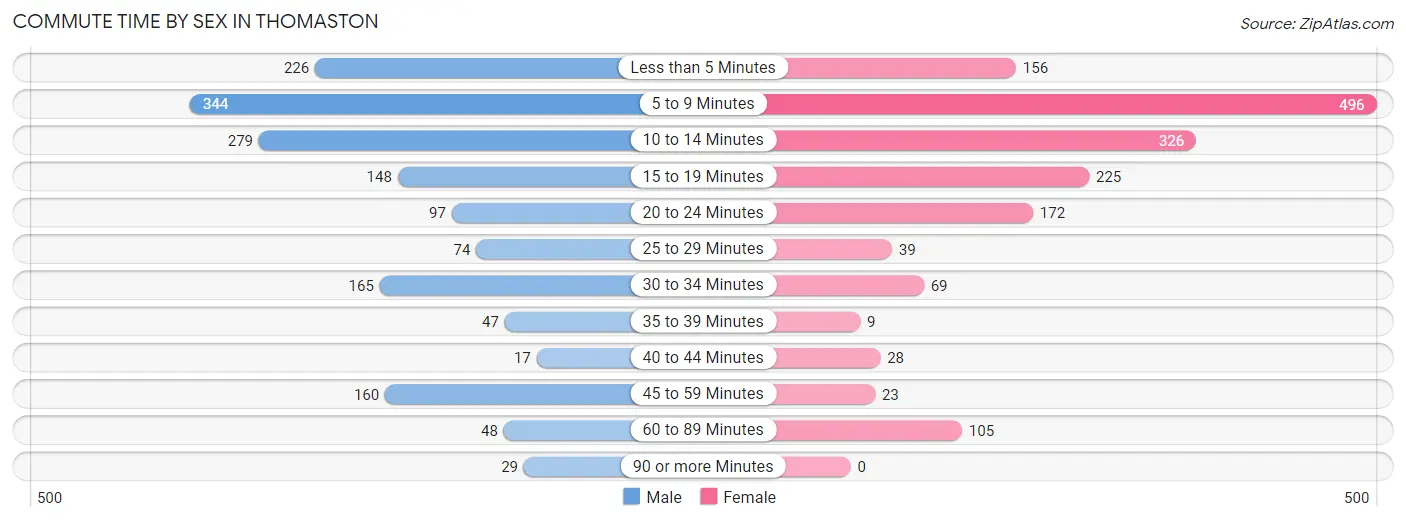
| Commute Time | Male | Female |
| Less than 5 Minutes | 226 (13.8%) | 156 (9.5%) |
| 5 to 9 Minutes | 344 (21.0%) | 496 (30.1%) |
| 10 to 14 Minutes | 279 (17.1%) | 326 (19.8%) |
| 15 to 19 Minutes | 148 (9.1%) | 225 (13.7%) |
| 20 to 24 Minutes | 97 (5.9%) | 172 (10.4%) |
| 25 to 29 Minutes | 74 (4.5%) | 39 (2.4%) |
| 30 to 34 Minutes | 165 (10.1%) | 69 (4.2%) |
| 35 to 39 Minutes | 47 (2.9%) | 9 (0.5%) |
| 40 to 44 Minutes | 17 (1.0%) | 28 (1.7%) |
| 45 to 59 Minutes | 160 (9.8%) | 23 (1.4%) |
| 60 to 89 Minutes | 48 (2.9%) | 105 (6.4%) |
| 90 or more Minutes | 29 (1.8%) | 0 (0.0%) |
Time of Departure to Work by Sex in Thomaston
The most frequent times of departure to work in Thomaston are 6:30 AM to 6:59 AM (251, 15.4%) for males and 7:30 AM to 7:59 AM (460, 27.9%) for females.
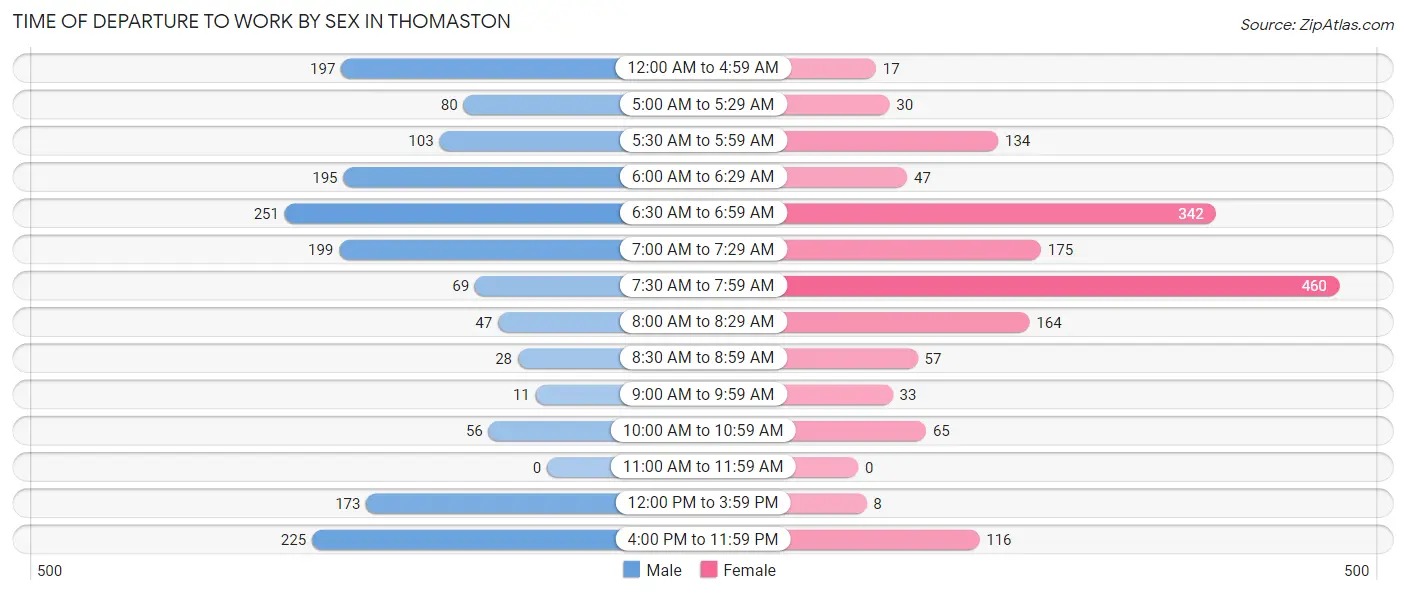
| Time of Departure | Male | Female |
| 12:00 AM to 4:59 AM | 197 (12.1%) | 17 (1.0%) |
| 5:00 AM to 5:29 AM | 80 (4.9%) | 30 (1.8%) |
| 5:30 AM to 5:59 AM | 103 (6.3%) | 134 (8.1%) |
| 6:00 AM to 6:29 AM | 195 (11.9%) | 47 (2.9%) |
| 6:30 AM to 6:59 AM | 251 (15.4%) | 342 (20.7%) |
| 7:00 AM to 7:29 AM | 199 (12.2%) | 175 (10.6%) |
| 7:30 AM to 7:59 AM | 69 (4.2%) | 460 (27.9%) |
| 8:00 AM to 8:29 AM | 47 (2.9%) | 164 (10.0%) |
| 8:30 AM to 8:59 AM | 28 (1.7%) | 57 (3.5%) |
| 9:00 AM to 9:59 AM | 11 (0.7%) | 33 (2.0%) |
| 10:00 AM to 10:59 AM | 56 (3.4%) | 65 (3.9%) |
| 11:00 AM to 11:59 AM | 0 (0.0%) | 0 (0.0%) |
| 12:00 PM to 3:59 PM | 173 (10.6%) | 8 (0.5%) |
| 4:00 PM to 11:59 PM | 225 (13.8%) | 116 (7.0%) |
| Total | 1,634 (100.0%) | 1,648 (100.0%) |
Housing Occupancy in Thomaston
Occupancy by Ownership in Thomaston
Of the total 3,711 dwellings in Thomaston, owner-occupied units account for 1,385 (37.3%), while renter-occupied units make up 2,326 (62.7%).
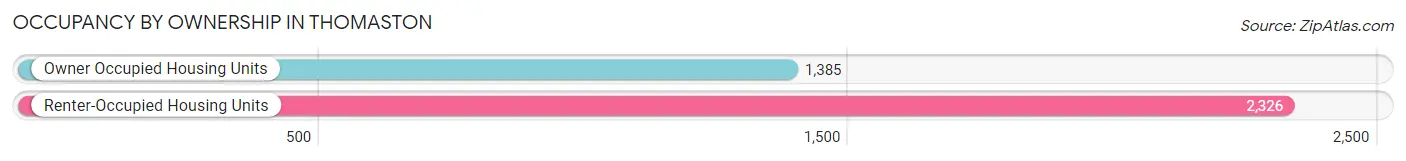
| Occupancy | # Housing Units | % Housing Units |
| Owner Occupied Housing Units | 1,385 | 37.3% |
| Renter-Occupied Housing Units | 2,326 | 62.7% |
| Total Occupied Housing Units | 3,711 | 100.0% |
Occupancy by Household Size in Thomaston
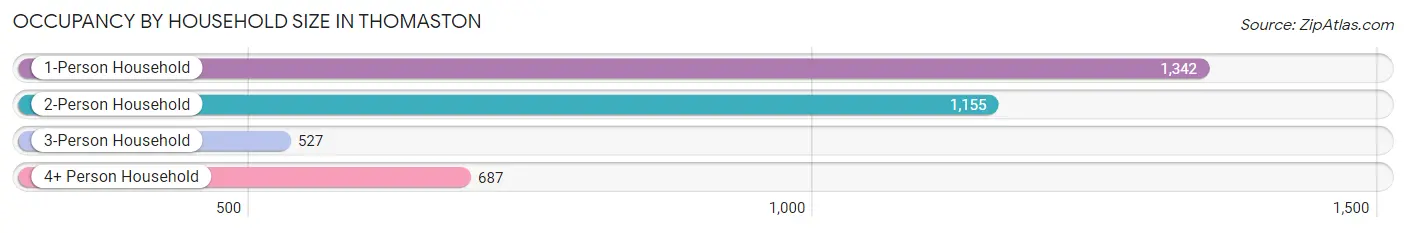
| Household Size | # Housing Units | % Housing Units |
| 1-Person Household | 1,342 | 36.2% |
| 2-Person Household | 1,155 | 31.1% |
| 3-Person Household | 527 | 14.2% |
| 4+ Person Household | 687 | 18.5% |
| Total Housing Units | 3,711 | 100.0% |
Occupancy by Ownership by Household Size in Thomaston
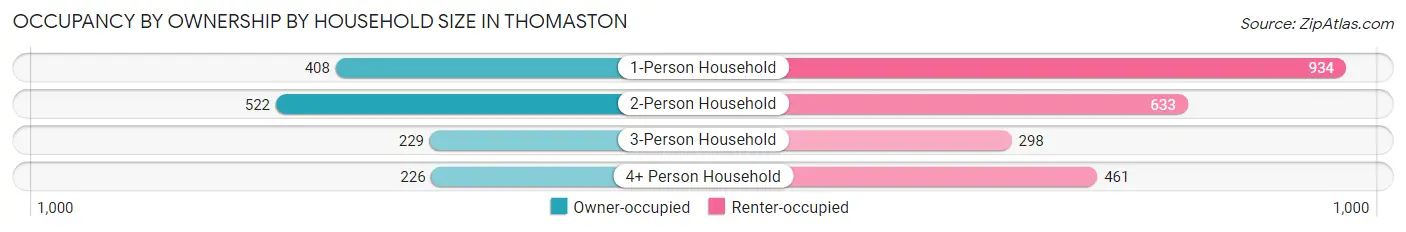
| Household Size | Owner-occupied | Renter-occupied |
| 1-Person Household | 408 (30.4%) | 934 (69.6%) |
| 2-Person Household | 522 (45.2%) | 633 (54.8%) |
| 3-Person Household | 229 (43.4%) | 298 (56.6%) |
| 4+ Person Household | 226 (32.9%) | 461 (67.1%) |
| Total Housing Units | 1,385 (37.3%) | 2,326 (62.7%) |
Occupancy by Educational Attainment in Thomaston
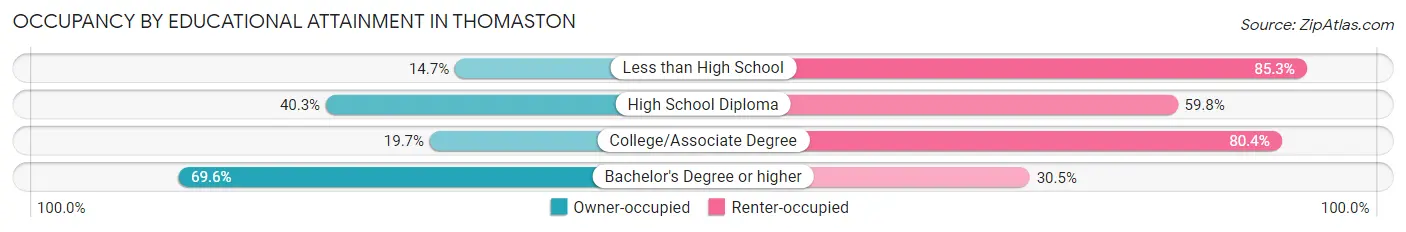
| Household Size | Owner-occupied | Renter-occupied |
| Less than High School | 81 (14.7%) | 471 (85.3%) |
| High School Diploma | 512 (40.3%) | 760 (59.8%) |
| College/Associate Degree | 205 (19.7%) | 838 (80.3%) |
| Bachelor's Degree or higher | 587 (69.6%) | 257 (30.4%) |
Occupancy by Age of Householder in Thomaston
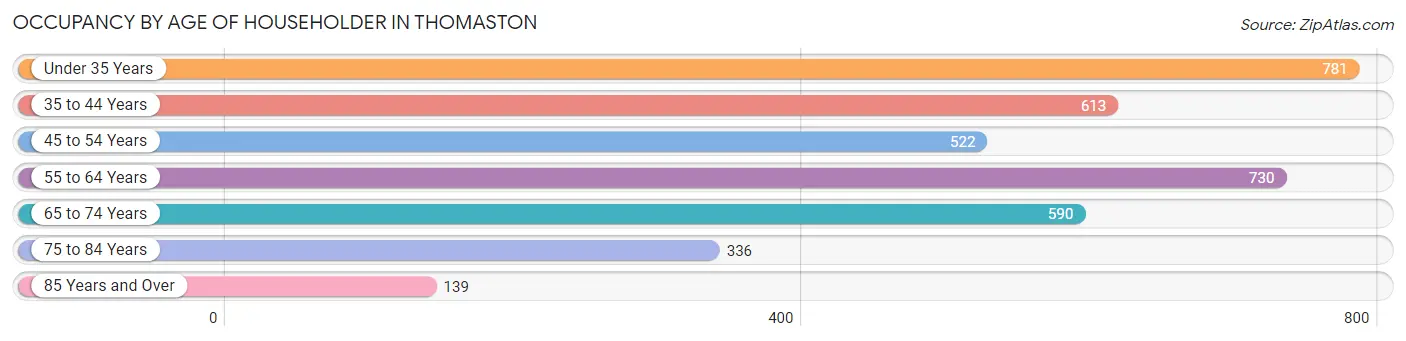
| Age Bracket | # Households | % Households |
| Under 35 Years | 781 | 21.0% |
| 35 to 44 Years | 613 | 16.5% |
| 45 to 54 Years | 522 | 14.1% |
| 55 to 64 Years | 730 | 19.7% |
| 65 to 74 Years | 590 | 15.9% |
| 75 to 84 Years | 336 | 9.0% |
| 85 Years and Over | 139 | 3.7% |
| Total | 3,711 | 100.0% |
Housing Finances in Thomaston
Median Income by Occupancy in Thomaston
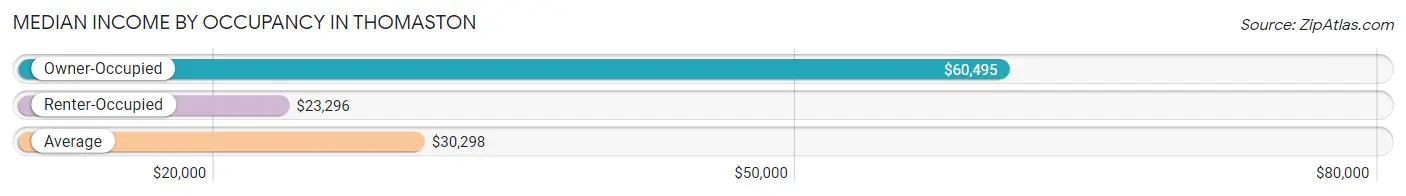
| Occupancy Type | # Households | Median Income |
| Owner-Occupied | 1,385 (37.3%) | $60,495 |
| Renter-Occupied | 2,326 (62.7%) | $23,296 |
| Average | 3,711 (100.0%) | $30,298 |
Occupancy by Householder Income Bracket in Thomaston
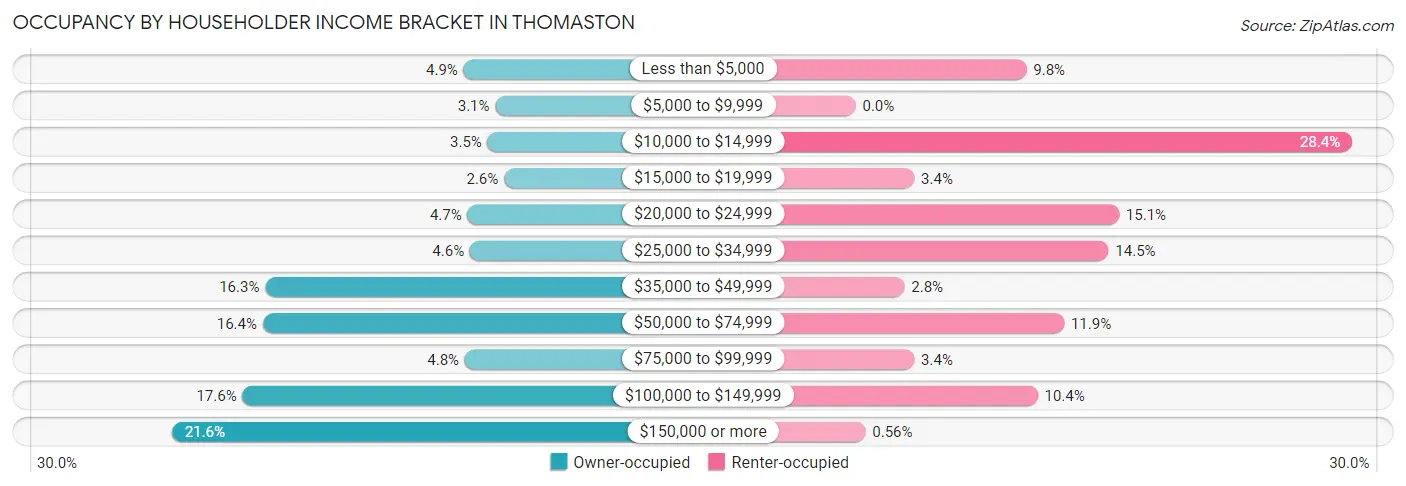
| Income Bracket | Owner-occupied | Renter-occupied |
| Less than $5,000 | 68 (4.9%) | 227 (9.8%) |
| $5,000 to $9,999 | 43 (3.1%) | 0 (0.0%) |
| $10,000 to $14,999 | 49 (3.5%) | 660 (28.4%) |
| $15,000 to $19,999 | 36 (2.6%) | 78 (3.4%) |
| $20,000 to $24,999 | 65 (4.7%) | 350 (15.0%) |
| $25,000 to $34,999 | 63 (4.5%) | 336 (14.4%) |
| $35,000 to $49,999 | 225 (16.3%) | 65 (2.8%) |
| $50,000 to $74,999 | 227 (16.4%) | 277 (11.9%) |
| $75,000 to $99,999 | 67 (4.8%) | 78 (3.4%) |
| $100,000 to $149,999 | 243 (17.5%) | 242 (10.4%) |
| $150,000 or more | 299 (21.6%) | 13 (0.6%) |
| Total | 1,385 (100.0%) | 2,326 (100.0%) |
Monthly Housing Cost Tiers in Thomaston
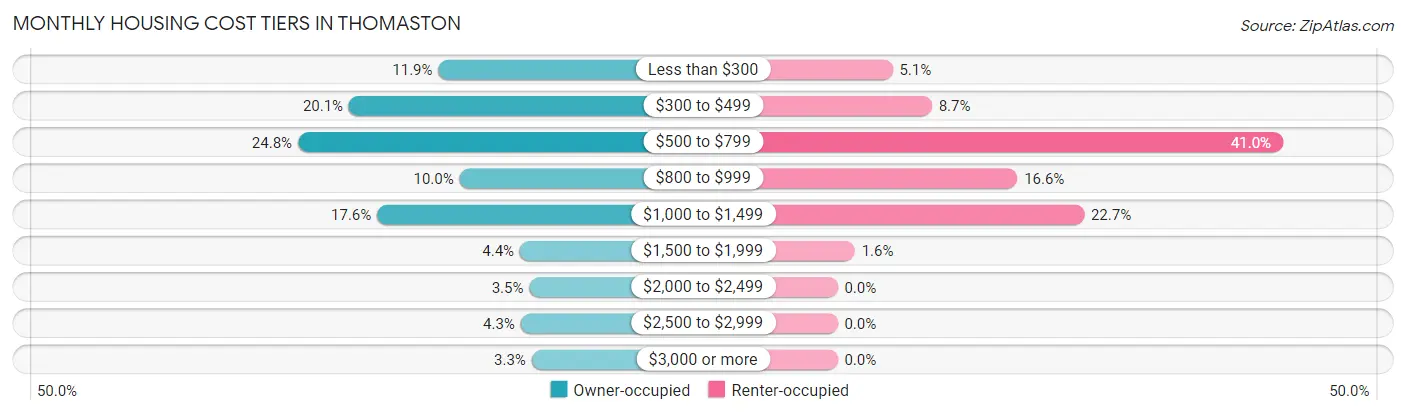
| Monthly Cost | Owner-occupied | Renter-occupied |
| Less than $300 | 165 (11.9%) | 118 (5.1%) |
| $300 to $499 | 279 (20.1%) | 202 (8.7%) |
| $500 to $799 | 344 (24.8%) | 954 (41.0%) |
| $800 to $999 | 138 (10.0%) | 385 (16.6%) |
| $1,000 to $1,499 | 243 (17.5%) | 528 (22.7%) |
| $1,500 to $1,999 | 61 (4.4%) | 37 (1.6%) |
| $2,000 to $2,499 | 49 (3.5%) | 0 (0.0%) |
| $2,500 to $2,999 | 60 (4.3%) | 0 (0.0%) |
| $3,000 or more | 46 (3.3%) | 0 (0.0%) |
| Total | 1,385 (100.0%) | 2,326 (100.0%) |
Physical Housing Characteristics in Thomaston
Housing Structures in Thomaston
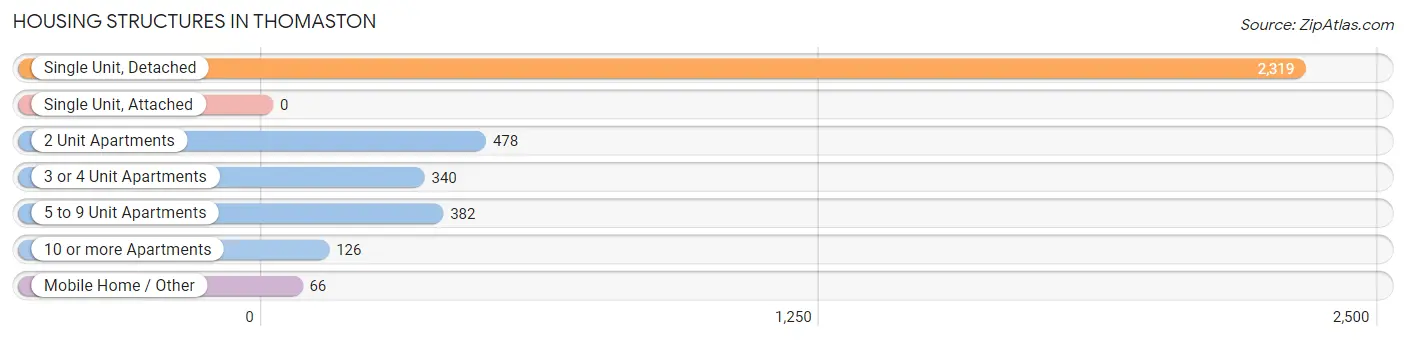
| Structure Type | # Housing Units | % Housing Units |
| Single Unit, Detached | 2,319 | 62.5% |
| Single Unit, Attached | 0 | 0.0% |
| 2 Unit Apartments | 478 | 12.9% |
| 3 or 4 Unit Apartments | 340 | 9.2% |
| 5 to 9 Unit Apartments | 382 | 10.3% |
| 10 or more Apartments | 126 | 3.4% |
| Mobile Home / Other | 66 | 1.8% |
| Total | 3,711 | 100.0% |
Housing Structures by Occupancy in Thomaston
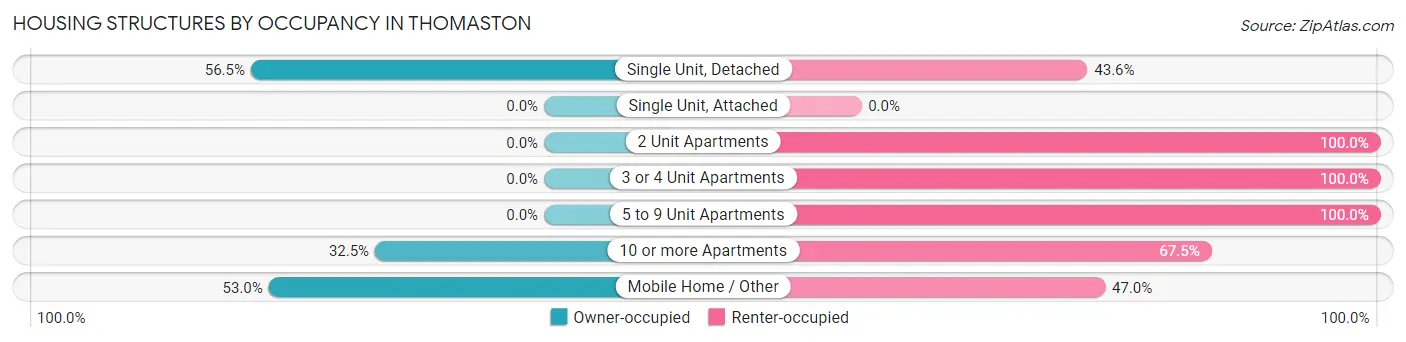
| Structure Type | Owner-occupied | Renter-occupied |
| Single Unit, Detached | 1,309 (56.5%) | 1,010 (43.5%) |
| Single Unit, Attached | 0 (0.0%) | 0 (0.0%) |
| 2 Unit Apartments | 0 (0.0%) | 478 (100.0%) |
| 3 or 4 Unit Apartments | 0 (0.0%) | 340 (100.0%) |
| 5 to 9 Unit Apartments | 0 (0.0%) | 382 (100.0%) |
| 10 or more Apartments | 41 (32.5%) | 85 (67.5%) |
| Mobile Home / Other | 35 (53.0%) | 31 (47.0%) |
| Total | 1,385 (37.3%) | 2,326 (62.7%) |
Housing Structures by Number of Rooms in Thomaston
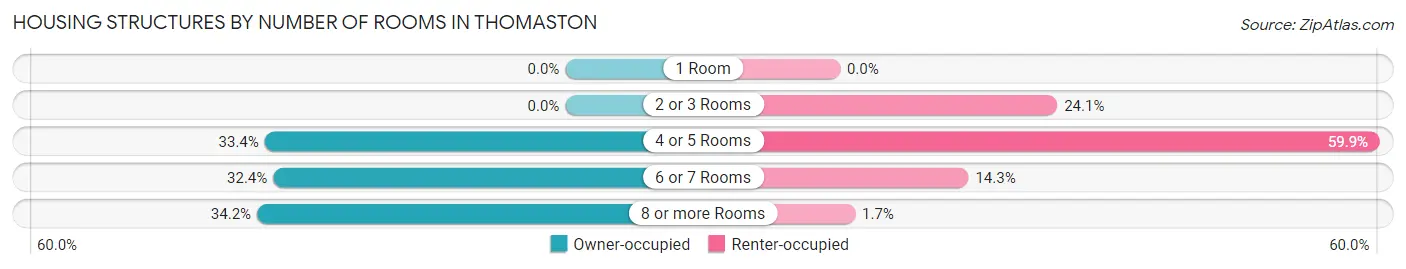
| Number of Rooms | Owner-occupied | Renter-occupied |
| 1 Room | 0 (0.0%) | 0 (0.0%) |
| 2 or 3 Rooms | 0 (0.0%) | 561 (24.1%) |
| 4 or 5 Rooms | 462 (33.4%) | 1,394 (59.9%) |
| 6 or 7 Rooms | 449 (32.4%) | 332 (14.3%) |
| 8 or more Rooms | 474 (34.2%) | 39 (1.7%) |
| Total | 1,385 (100.0%) | 2,326 (100.0%) |
Housing Structure by Heating Type in Thomaston
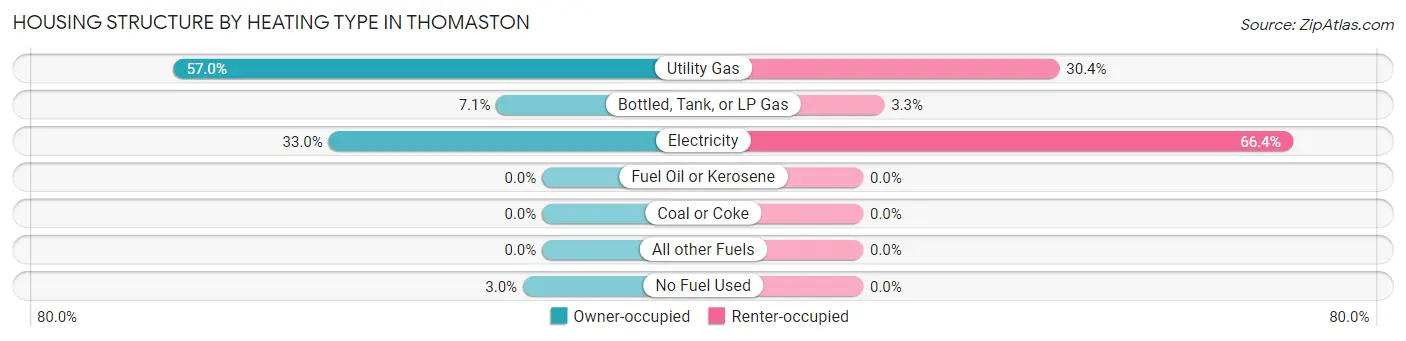
| Heating Type | Owner-occupied | Renter-occupied |
| Utility Gas | 789 (57.0%) | 706 (30.3%) |
| Bottled, Tank, or LP Gas | 98 (7.1%) | 76 (3.3%) |
| Electricity | 457 (33.0%) | 1,544 (66.4%) |
| Fuel Oil or Kerosene | 0 (0.0%) | 0 (0.0%) |
| Coal or Coke | 0 (0.0%) | 0 (0.0%) |
| All other Fuels | 0 (0.0%) | 0 (0.0%) |
| No Fuel Used | 41 (3.0%) | 0 (0.0%) |
| Total | 1,385 (100.0%) | 2,326 (100.0%) |
Household Vehicle Usage in Thomaston
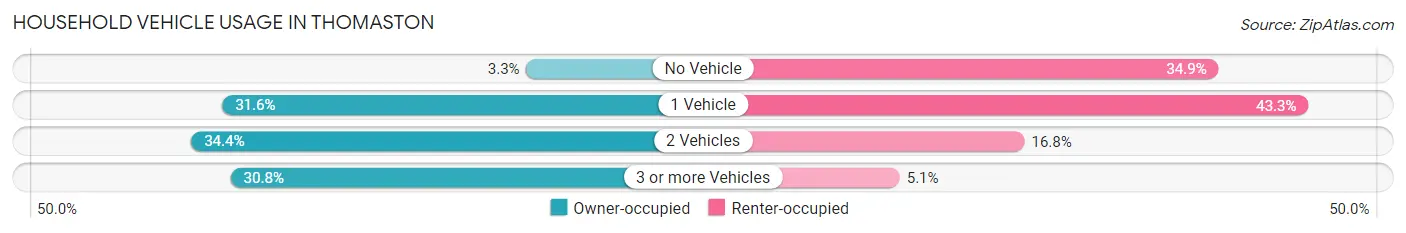
| Vehicles per Household | Owner-occupied | Renter-occupied |
| No Vehicle | 45 (3.3%) | 811 (34.9%) |
| 1 Vehicle | 437 (31.6%) | 1,006 (43.2%) |
| 2 Vehicles | 477 (34.4%) | 390 (16.8%) |
| 3 or more Vehicles | 426 (30.8%) | 119 (5.1%) |
| Total | 1,385 (100.0%) | 2,326 (100.0%) |
Real Estate & Mortgages in Thomaston
Real Estate and Mortgage Overview in Thomaston
| Characteristic | Without Mortgage | With Mortgage |
| Housing Units | 764 | 621 |
| Median Property Value | $110,600 | $170,800 |
| Median Household Income | $51,923 | $207 |
| Monthly Housing Costs | $450 | $46 |
| Real Estate Taxes | $1,109 | $0 |
Property Value by Mortgage Status in Thomaston
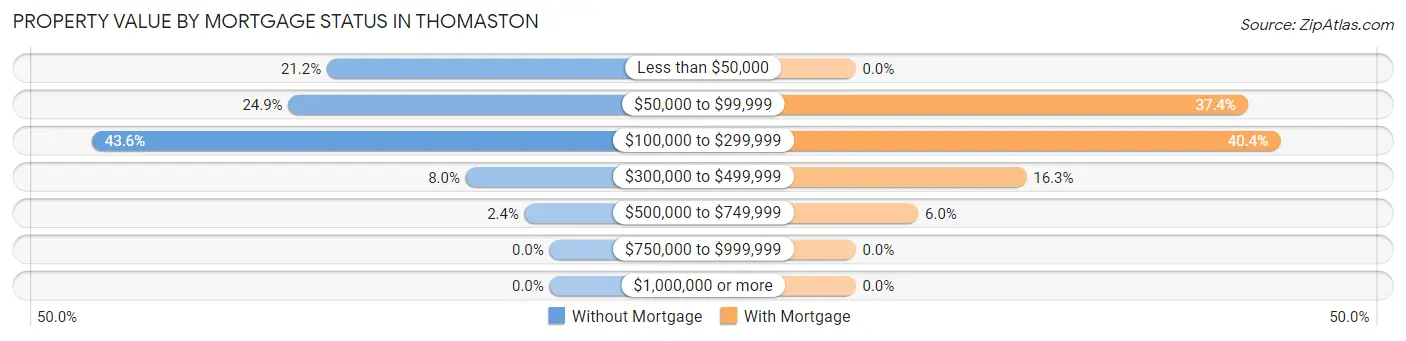
| Property Value | Without Mortgage | With Mortgage |
| Less than $50,000 | 162 (21.2%) | 0 (0.0%) |
| $50,000 to $99,999 | 190 (24.9%) | 232 (37.4%) |
| $100,000 to $299,999 | 333 (43.6%) | 251 (40.4%) |
| $300,000 to $499,999 | 61 (8.0%) | 101 (16.3%) |
| $500,000 to $749,999 | 18 (2.4%) | 37 (6.0%) |
| $750,000 to $999,999 | 0 (0.0%) | 0 (0.0%) |
| $1,000,000 or more | 0 (0.0%) | 0 (0.0%) |
| Total | 764 (100.0%) | 621 (100.0%) |
Household Income by Mortgage Status in Thomaston
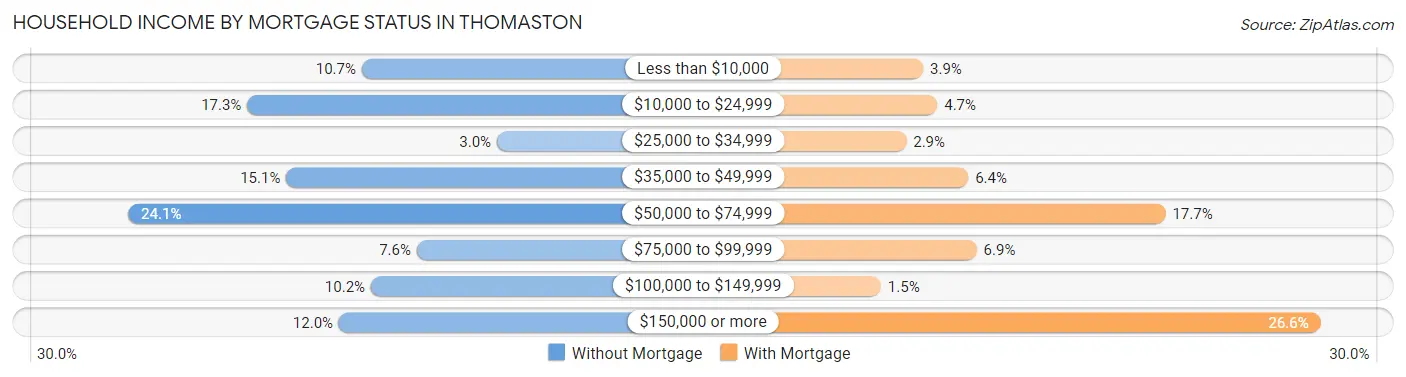
| Household Income | Without Mortgage | With Mortgage |
| Less than $10,000 | 82 (10.7%) | 24 (3.9%) |
| $10,000 to $24,999 | 132 (17.3%) | 29 (4.7%) |
| $25,000 to $34,999 | 23 (3.0%) | 18 (2.9%) |
| $35,000 to $49,999 | 115 (15.0%) | 40 (6.4%) |
| $50,000 to $74,999 | 184 (24.1%) | 110 (17.7%) |
| $75,000 to $99,999 | 58 (7.6%) | 43 (6.9%) |
| $100,000 to $149,999 | 78 (10.2%) | 9 (1.5%) |
| $150,000 or more | 92 (12.0%) | 165 (26.6%) |
| Total | 764 (100.0%) | 621 (100.0%) |
Property Value to Household Income Ratio in Thomaston
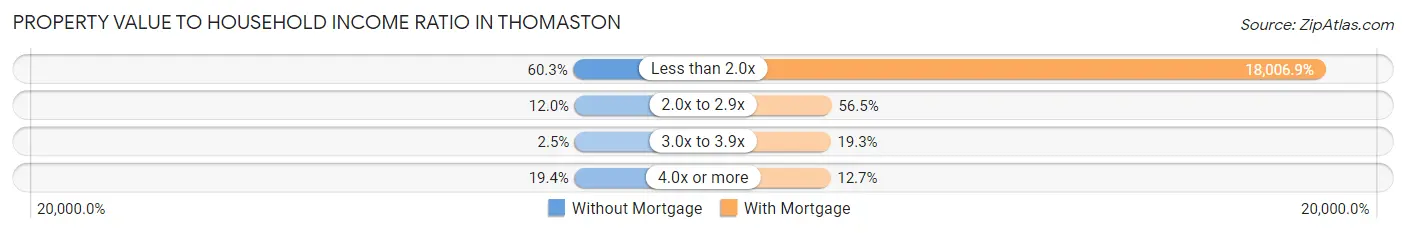
| Value-to-Income Ratio | Without Mortgage | With Mortgage |
| Less than 2.0x | 461 (60.3%) | 111,823 (18,006.9%) |
| 2.0x to 2.9x | 92 (12.0%) | 351 (56.5%) |
| 3.0x to 3.9x | 19 (2.5%) | 120 (19.3%) |
| 4.0x or more | 148 (19.4%) | 79 (12.7%) |
| Total | 764 (100.0%) | 621 (100.0%) |
Real Estate Taxes by Mortgage Status in Thomaston
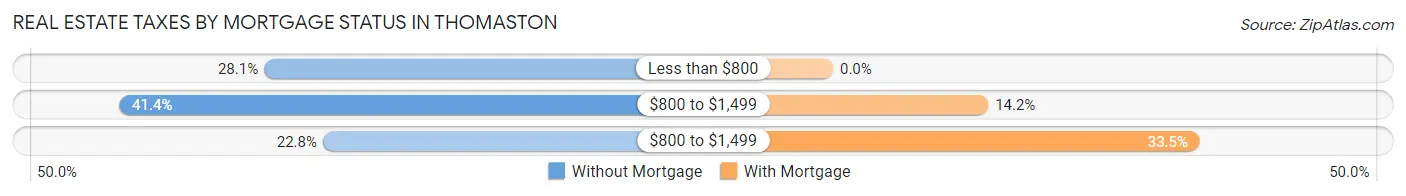
| Property Taxes | Without Mortgage | With Mortgage |
| Less than $800 | 215 (28.1%) | 0 (0.0%) |
| $800 to $1,499 | 316 (41.4%) | 88 (14.2%) |
| $800 to $1,499 | 174 (22.8%) | 208 (33.5%) |
| Total | 764 (100.0%) | 621 (100.0%) |
Health & Disability in Thomaston
Health Insurance Coverage by Age in Thomaston
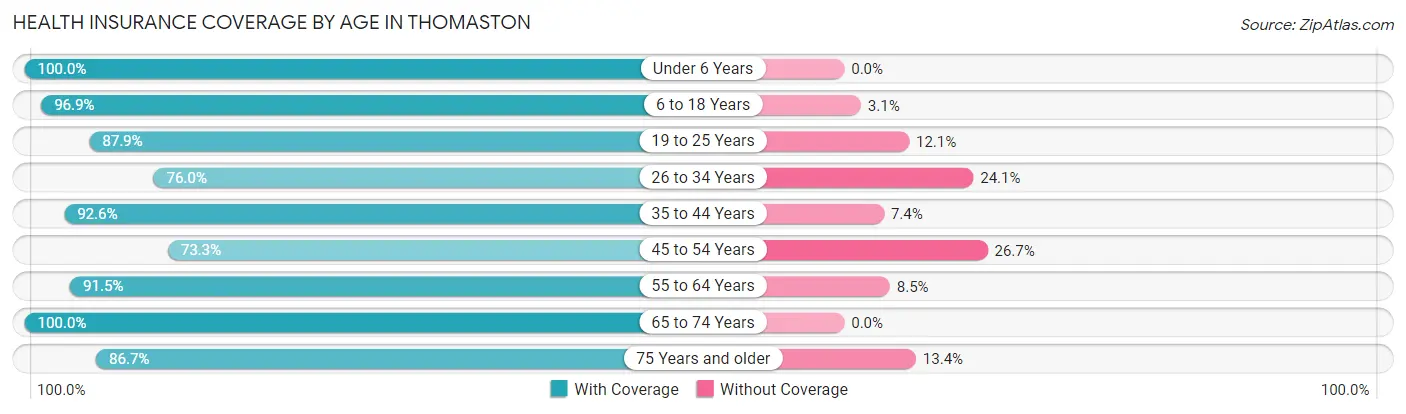
| Age Bracket | With Coverage | Without Coverage |
| Under 6 Years | 420 (100.0%) | 0 (0.0%) |
| 6 to 18 Years | 2,159 (96.9%) | 69 (3.1%) |
| 19 to 25 Years | 597 (87.9%) | 82 (12.1%) |
| 26 to 34 Years | 995 (75.9%) | 315 (24.0%) |
| 35 to 44 Years | 1,114 (92.6%) | 89 (7.4%) |
| 45 to 54 Years | 642 (73.3%) | 234 (26.7%) |
| 55 to 64 Years | 1,119 (91.5%) | 104 (8.5%) |
| 65 to 74 Years | 869 (100.0%) | 0 (0.0%) |
| 75 Years and older | 545 (86.7%) | 84 (13.4%) |
| Total | 8,460 (89.6%) | 977 (10.3%) |
Health Insurance Coverage by Citizenship Status in Thomaston
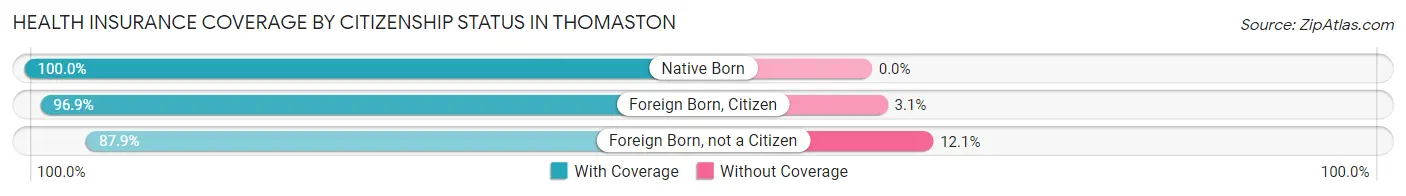
| Citizenship Status | With Coverage | Without Coverage |
| Native Born | 420 (100.0%) | 0 (0.0%) |
| Foreign Born, Citizen | 2,159 (96.9%) | 69 (3.1%) |
| Foreign Born, not a Citizen | 597 (87.9%) | 82 (12.1%) |
Health Insurance Coverage by Household Income in Thomaston
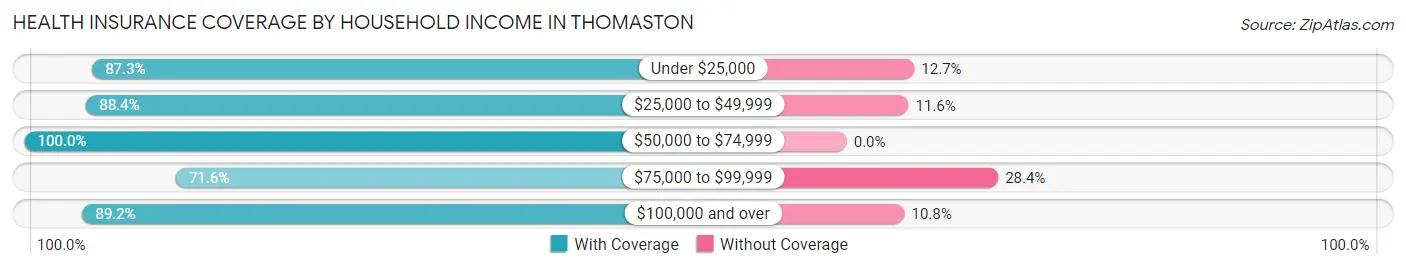
| Household Income | With Coverage | Without Coverage |
| Under $25,000 | 2,715 (87.3%) | 394 (12.7%) |
| $25,000 to $49,999 | 1,399 (88.4%) | 183 (11.6%) |
| $50,000 to $74,999 | 1,738 (100.0%) | 0 (0.0%) |
| $75,000 to $99,999 | 308 (71.6%) | 122 (28.4%) |
| $100,000 and over | 2,292 (89.2%) | 278 (10.8%) |
Public vs Private Health Insurance Coverage by Age in Thomaston
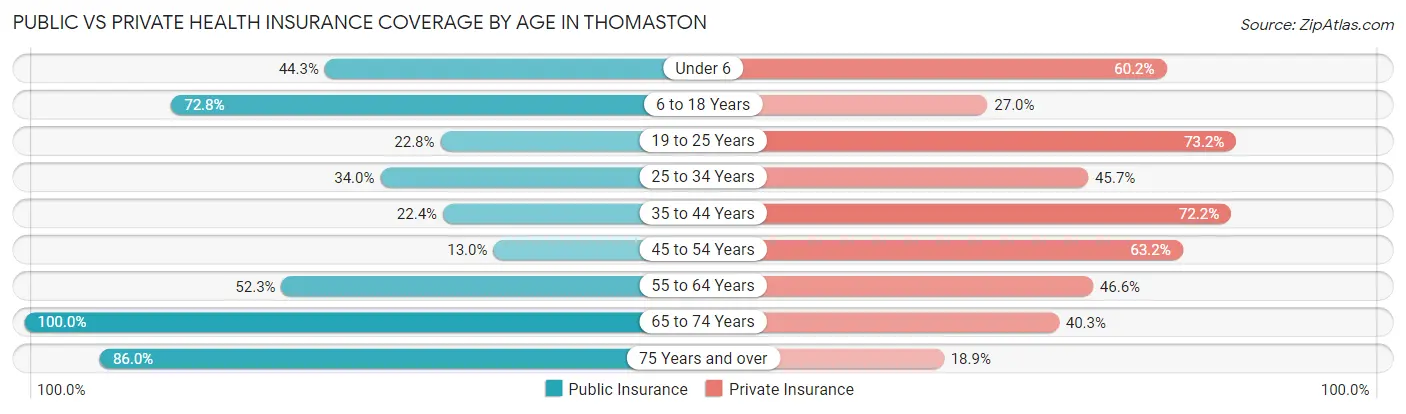
| Age Bracket | Public Insurance | Private Insurance |
| Under 6 | 186 (44.3%) | 253 (60.2%) |
| 6 to 18 Years | 1,621 (72.8%) | 602 (27.0%) |
| 19 to 25 Years | 155 (22.8%) | 497 (73.2%) |
| 25 to 34 Years | 445 (34.0%) | 599 (45.7%) |
| 35 to 44 Years | 269 (22.4%) | 869 (72.2%) |
| 45 to 54 Years | 114 (13.0%) | 554 (63.2%) |
| 55 to 64 Years | 640 (52.3%) | 570 (46.6%) |
| 65 to 74 Years | 869 (100.0%) | 350 (40.3%) |
| 75 Years and over | 541 (86.0%) | 119 (18.9%) |
| Total | 4,840 (51.3%) | 4,413 (46.8%) |
Disability Status by Sex by Age in Thomaston
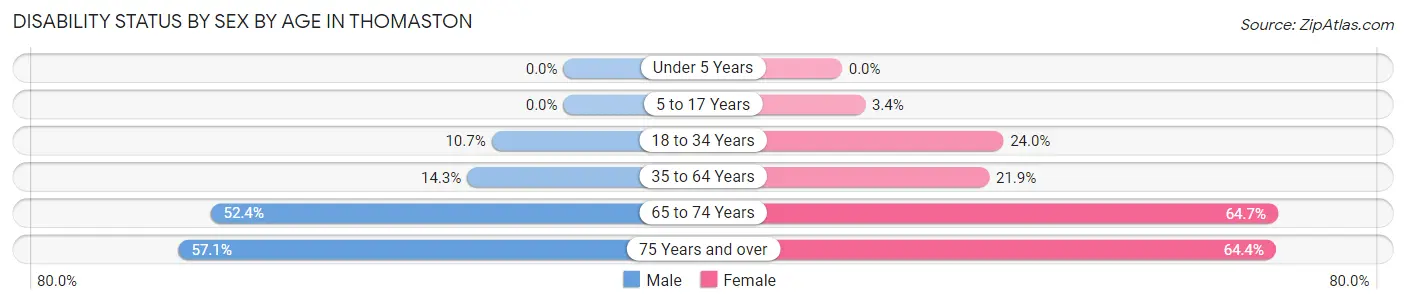
| Age Bracket | Male | Female |
| Under 5 Years | 0 (0.0%) | 0 (0.0%) |
| 5 to 17 Years | 0 (0.0%) | 41 (3.4%) |
| 18 to 34 Years | 102 (10.7%) | 274 (24.0%) |
| 35 to 64 Years | 187 (14.3%) | 436 (21.9%) |
| 65 to 74 Years | 176 (52.4%) | 345 (64.7%) |
| 75 Years and over | 128 (57.1%) | 261 (64.4%) |
Disability Class by Sex by Age in Thomaston
Disability Class: Hearing Difficulty
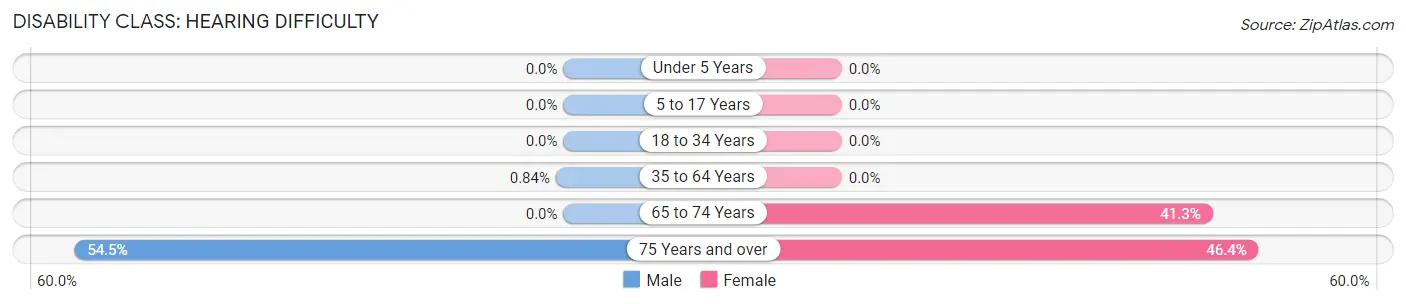
| Age Bracket | Male | Female |
| Under 5 Years | 0 (0.0%) | 0 (0.0%) |
| 5 to 17 Years | 0 (0.0%) | 0 (0.0%) |
| 18 to 34 Years | 0 (0.0%) | 0 (0.0%) |
| 35 to 64 Years | 11 (0.8%) | 0 (0.0%) |
| 65 to 74 Years | 0 (0.0%) | 220 (41.3%) |
| 75 Years and over | 122 (54.5%) | 188 (46.4%) |
Disability Class: Vision Difficulty
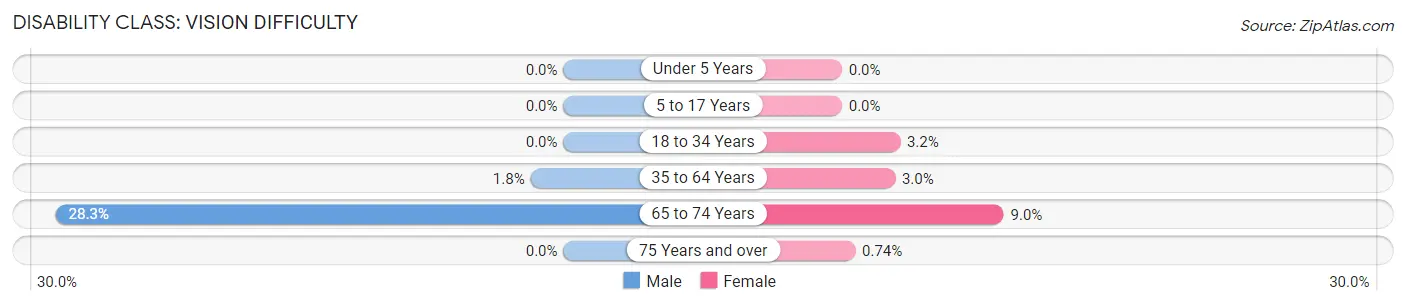
| Age Bracket | Male | Female |
| Under 5 Years | 0 (0.0%) | 0 (0.0%) |
| 5 to 17 Years | 0 (0.0%) | 0 (0.0%) |
| 18 to 34 Years | 0 (0.0%) | 37 (3.2%) |
| 35 to 64 Years | 24 (1.8%) | 59 (3.0%) |
| 65 to 74 Years | 95 (28.3%) | 48 (9.0%) |
| 75 Years and over | 0 (0.0%) | 3 (0.7%) |
Disability Class: Cognitive Difficulty
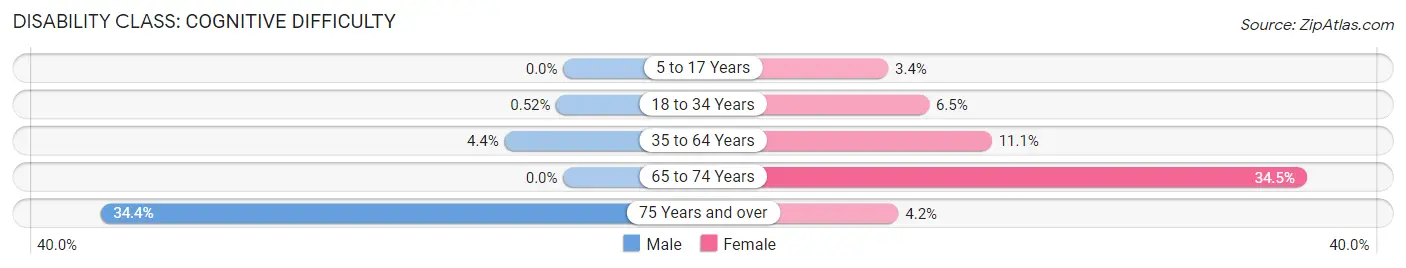
| Age Bracket | Male | Female |
| 5 to 17 Years | 0 (0.0%) | 41 (3.4%) |
| 18 to 34 Years | 5 (0.5%) | 74 (6.5%) |
| 35 to 64 Years | 57 (4.4%) | 222 (11.1%) |
| 65 to 74 Years | 0 (0.0%) | 184 (34.5%) |
| 75 Years and over | 77 (34.4%) | 17 (4.2%) |
Disability Class: Ambulatory Difficulty
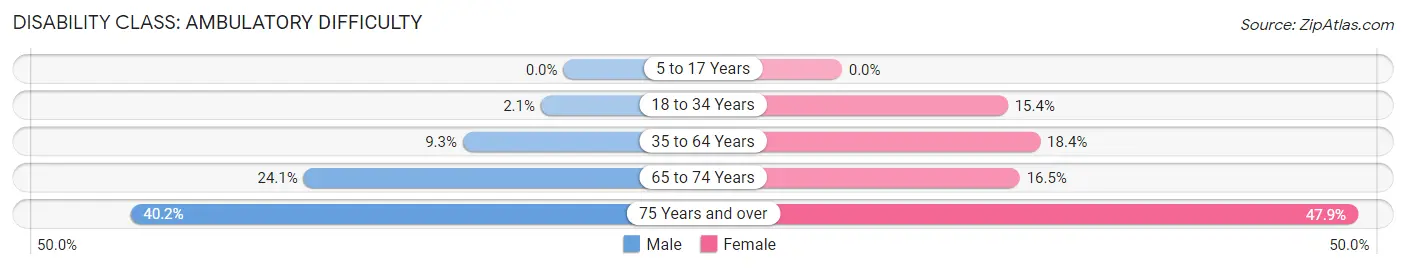
| Age Bracket | Male | Female |
| 5 to 17 Years | 0 (0.0%) | 0 (0.0%) |
| 18 to 34 Years | 20 (2.1%) | 176 (15.4%) |
| 35 to 64 Years | 122 (9.3%) | 367 (18.4%) |
| 65 to 74 Years | 81 (24.1%) | 88 (16.5%) |
| 75 Years and over | 90 (40.2%) | 194 (47.9%) |
Disability Class: Self-Care Difficulty
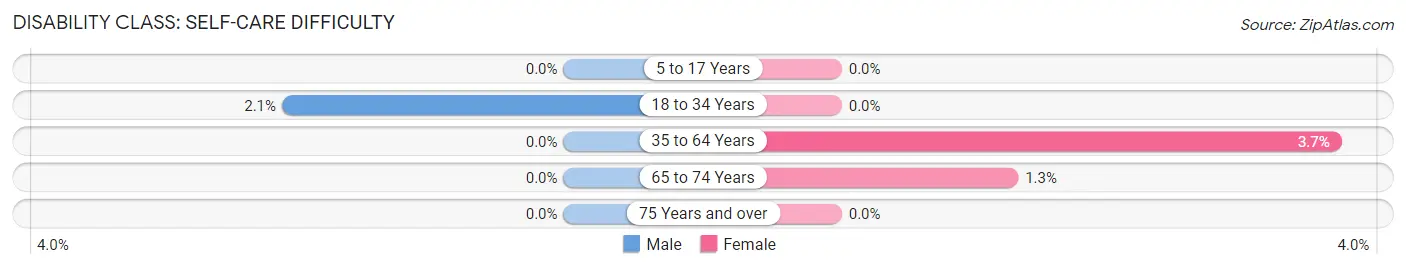
| Age Bracket | Male | Female |
| 5 to 17 Years | 0 (0.0%) | 0 (0.0%) |
| 18 to 34 Years | 20 (2.1%) | 0 (0.0%) |
| 35 to 64 Years | 0 (0.0%) | 74 (3.7%) |
| 65 to 74 Years | 0 (0.0%) | 7 (1.3%) |
| 75 Years and over | 0 (0.0%) | 0 (0.0%) |
Technology Access in Thomaston
Computing Device Access in Thomaston
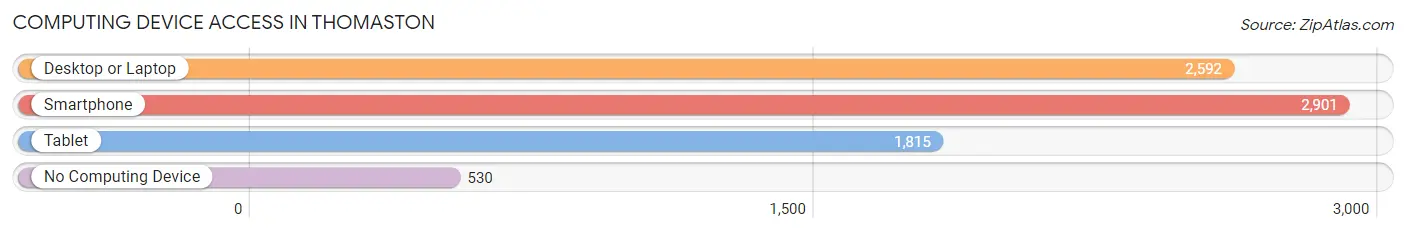
| Device Type | # Households | % Households |
| Desktop or Laptop | 2,592 | 69.9% |
| Smartphone | 2,901 | 78.2% |
| Tablet | 1,815 | 48.9% |
| No Computing Device | 530 | 14.3% |
| Total | 3,711 | 100.0% |
Internet Access in Thomaston
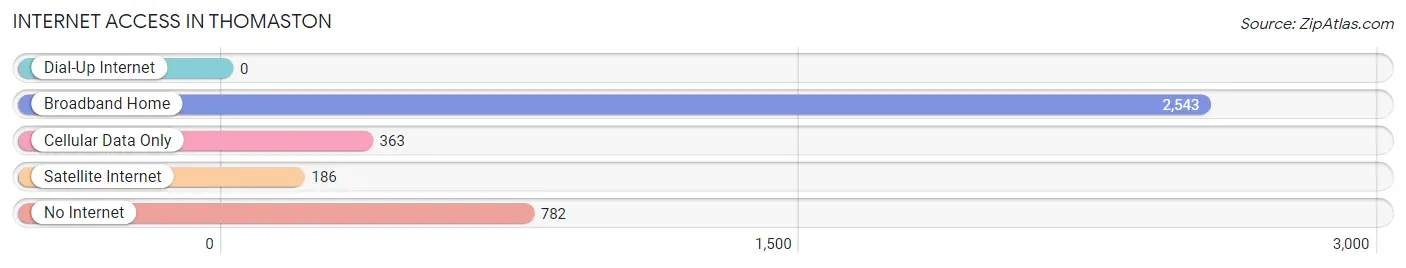
| Internet Type | # Households | % Households |
| Dial-Up Internet | 0 | 0.0% |
| Broadband Home | 2,543 | 68.5% |
| Cellular Data Only | 363 | 9.8% |
| Satellite Internet | 186 | 5.0% |
| No Internet | 782 | 21.1% |
| Total | 3,711 | 100.0% |
Thomaston Summary
Thomaston, Georgia is a small city located in Upson County in the west-central part of the state. It is situated about 70 miles south of Atlanta and is part of the Macon metropolitan area. The city has a population of 9,638 as of the 2010 census, making it the largest city in Upson County.
History
Thomaston was founded in 1825 and named after General Jett Thomas, a hero of the War of 1812. The city was incorporated in 1828 and was the county seat of Upson County until 1872, when the county seat was moved to nearby Yatesville.
Thomaston was an important center of the cotton industry in the 19th century, and the city was home to several cotton mills. The city was also the site of a major Civil War battle in 1864, when Union forces under General William T. Sherman captured the city.
Geography
Thomaston is located at 32°57'N 84°20'W (32.95, -84.33). The city is situated in the Piedmont region of Georgia, about 70 miles south of Atlanta. The city is located on the Flint River, which flows through the city and is a major source of water for the area.
The city has a total area of 8.3 square miles, of which 8.2 square miles is land and 0.1 square miles is water. The city is located in a hilly area, with elevations ranging from 500 to 800 feet above sea level.
Economy
Thomaston's economy is largely based on manufacturing and agriculture. The city is home to several manufacturing plants, including a paper mill, a furniture factory, and a textile mill. The city is also home to several agricultural businesses, including a poultry processing plant and a cotton gin.
The city is also home to several retail businesses, including several restaurants, a grocery store, and a variety of other shops. The city is also home to several medical facilities, including a hospital and several clinics.
Demographics
As of the 2010 census, there were 9,638 people, 3,845 households, and 2,541 families residing in the city. The population density was 1,168.2 people per square mile. The racial makeup of the city was 63.2% White, 34.2% African American, 0.3% Native American, 0.4% Asian, 0.1% Pacific Islander, 0.7% from other races, and 1.1% from two or more races. Hispanic or Latino of any race were 2.2% of the population.
The median income for a household in the city was $30,945, and the median income for a family was $37,917. The per capita income for the city was $16,845. About 22.2% of families and 25.3% of the population were below the poverty line, including 36.2% of those under age 18 and 16.2% of those age 65 or over.
Common Questions
What is Per Capita Income in Thomaston?
Per Capita income in Thomaston is $24,063.
What is the Median Family Income in Thomaston?
Median Family Income in Thomaston is $52,282.
What is the Median Household income in Thomaston?
Median Household Income in Thomaston is $30,298.
What is Income or Wage Gap in Thomaston?
Income or Wage Gap in Thomaston is 17.6%.
Women in Thomaston earn 82.4 cents for every dollar earned by a man.
What is Inequality or Gini Index in Thomaston?
Inequality or Gini Index in Thomaston is 0.55.
What is the Total Population of Thomaston?
Total Population of Thomaston is 9,720.
What is the Total Male Population of Thomaston?
Total Male Population of Thomaston is 4,104.
What is the Total Female Population of Thomaston?
Total Female Population of Thomaston is 5,616.
What is the Ratio of Males per 100 Females in Thomaston?
There are 73.08 Males per 100 Females in Thomaston.
What is the Ratio of Females per 100 Males in Thomaston?
There are 136.84 Females per 100 Males in Thomaston.
What is the Median Population Age in Thomaston?
Median Population Age in Thomaston is 36.7 Years.
What is the Average Family Size in Thomaston
Average Family Size in Thomaston is 3.1 People.
What is the Average Household Size in Thomaston
Average Household Size in Thomaston is 2.5 People.
How Large is the Labor Force in Thomaston?
There are 3,572 People in the Labor Forcein in Thomaston.
What is the Percentage of People in the Labor Force in Thomaston?
47.7% of People are in the Labor Force in Thomaston.
What is the Unemployment Rate in Thomaston?
Unemployment Rate in Thomaston is 5.1%.