Golden Valley, AZ Map & Demographics
Golden Valley Map
Golden Valley Overview
$26,727
PER CAPITA INCOME
$56,021
AVG FAMILY INCOME
$45,427
AVG HOUSEHOLD INCOME
12.2%
WAGE / INCOME GAP [ % ]
87.8¢/ $1
WAGE / INCOME GAP [ $ ]
0.38
INEQUALITY / GINI INDEX
7,900
TOTAL POPULATION
4,074
MALE POPULATION
3,826
FEMALE POPULATION
106.48
MALES / 100 FEMALES
93.91
FEMALES / 100 MALES
62.5
MEDIAN AGE
2.5
AVG FAMILY SIZE
2.0
AVG HOUSEHOLD SIZE
2,362
LABOR FORCE [ PEOPLE ]
31.8%
PERCENT IN LABOR FORCE
7.2%
UNEMPLOYMENT RATE
Golden Valley Zip Codes
Golden Valley Area Codes
Income in Golden Valley
Income Overview in Golden Valley
Per Capita Income in Golden Valley is $26,727, while median incomes of families and households are $56,021 and $45,427 respectively.
| Characteristic | Number | Measure |
| Per Capita Income | 7,900 | $26,727 |
| Median Family Income | 2,381 | $56,021 |
| Mean Family Income | 2,381 | $59,185 |
| Median Household Income | 3,861 | $45,427 |
| Mean Household Income | 3,861 | $55,046 |
| Income Deficit | 2,381 | $0 |
| Wage / Income Gap (%) | 7,900 | 12.19% |
| Wage / Income Gap ($) | 7,900 | 87.81¢ per $1 |
| Gini / Inequality Index | 7,900 | 0.38 |
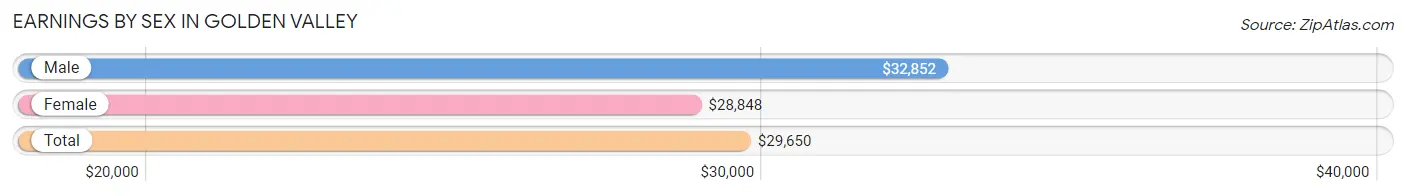
Earnings by Sex in Golden Valley
Average Earnings in Golden Valley are $29,650, $32,852 for men and $28,848 for women, a difference of 12.2%.
| Sex | Number | Average Earnings |
| Male | 1,046 (44.2%) | $32,852 |
| Female | 1,321 (55.8%) | $28,848 |
| Total | 2,367 (100.0%) | $29,650 |
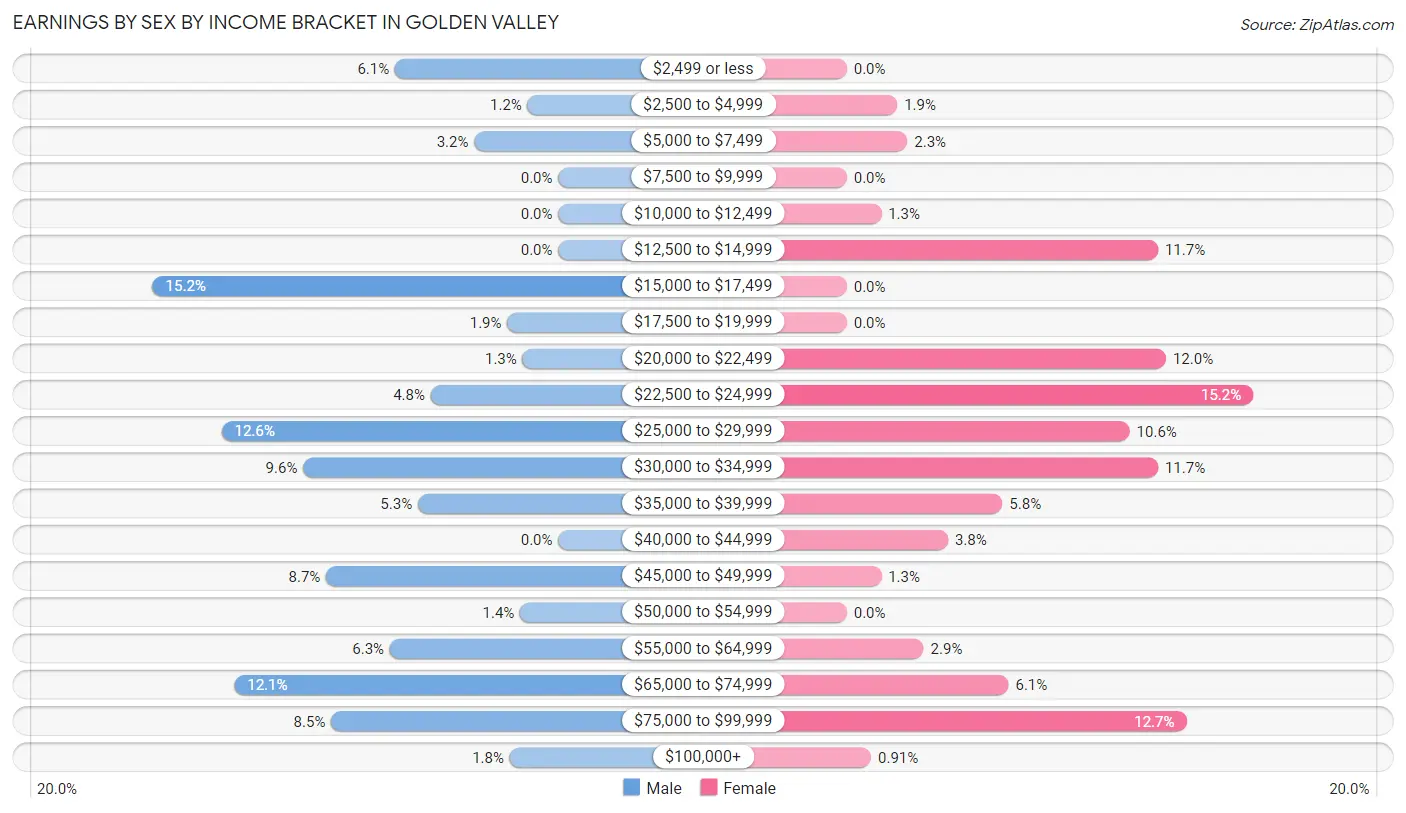
Earnings by Sex by Income Bracket in Golden Valley
The most common earnings brackets in Golden Valley are $15,000 to $17,499 for men (159 | 15.2%) and $22,500 to $24,999 for women (201 | 15.2%).
| Income | Male | Female |
| $2,499 or less | 64 (6.1%) | 0 (0.0%) |
| $2,500 to $4,999 | 12 (1.1%) | 25 (1.9%) |
| $5,000 to $7,499 | 33 (3.2%) | 30 (2.3%) |
| $7,500 to $9,999 | 0 (0.0%) | 0 (0.0%) |
| $10,000 to $12,499 | 0 (0.0%) | 17 (1.3%) |
| $12,500 to $14,999 | 0 (0.0%) | 154 (11.7%) |
| $15,000 to $17,499 | 159 (15.2%) | 0 (0.0%) |
| $17,500 to $19,999 | 20 (1.9%) | 0 (0.0%) |
| $20,000 to $22,499 | 14 (1.3%) | 158 (12.0%) |
| $22,500 to $24,999 | 50 (4.8%) | 201 (15.2%) |
| $25,000 to $29,999 | 132 (12.6%) | 140 (10.6%) |
| $30,000 to $34,999 | 100 (9.6%) | 154 (11.7%) |
| $35,000 to $39,999 | 55 (5.3%) | 77 (5.8%) |
| $40,000 to $44,999 | 0 (0.0%) | 50 (3.8%) |
| $45,000 to $49,999 | 91 (8.7%) | 17 (1.3%) |
| $50,000 to $54,999 | 15 (1.4%) | 0 (0.0%) |
| $55,000 to $64,999 | 66 (6.3%) | 38 (2.9%) |
| $65,000 to $74,999 | 127 (12.1%) | 80 (6.1%) |
| $75,000 to $99,999 | 89 (8.5%) | 168 (12.7%) |
| $100,000+ | 19 (1.8%) | 12 (0.9%) |
| Total | 1,046 (100.0%) | 1,321 (100.0%) |
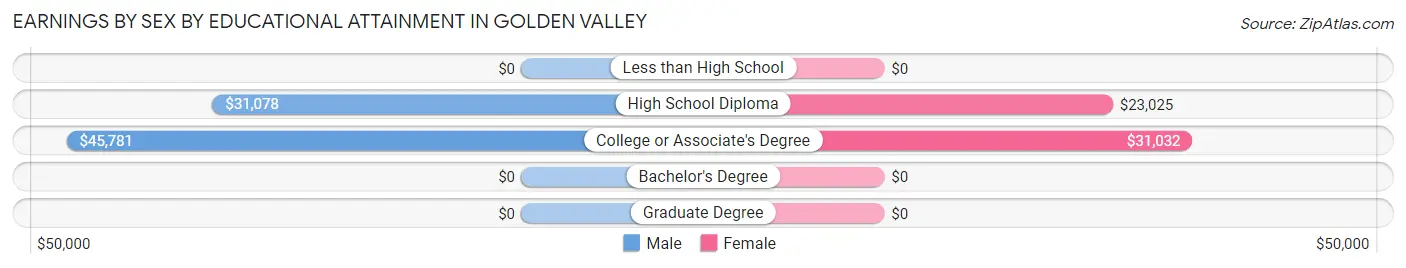
Earnings by Sex by Educational Attainment in Golden Valley
Average earnings in Golden Valley are $33,715 for men and $29,179 for women, a difference of 13.5%. Men with an educational attainment of college or associate's degree enjoy the highest average annual earnings of $45,781, while those with high school diploma education earn the least with $31,078. Women with an educational attainment of college or associate's degree earn the most with the average annual earnings of $31,032, while those with high school diploma education have the smallest earnings of $23,025.
| Educational Attainment | Male Income | Female Income |
| Less than High School | - | - |
| High School Diploma | $31,078 | $23,025 |
| College or Associate's Degree | $45,781 | $31,032 |
| Bachelor's Degree | - | - |
| Graduate Degree | - | - |
| Total | $33,715 | $29,179 |
Family Income in Golden Valley
Family Income Brackets in Golden Valley
According to the Golden Valley family income data, there are 507 families falling into the $75,000 to $99,999 income range, which is the most common income bracket and makes up 21.3% of all families.
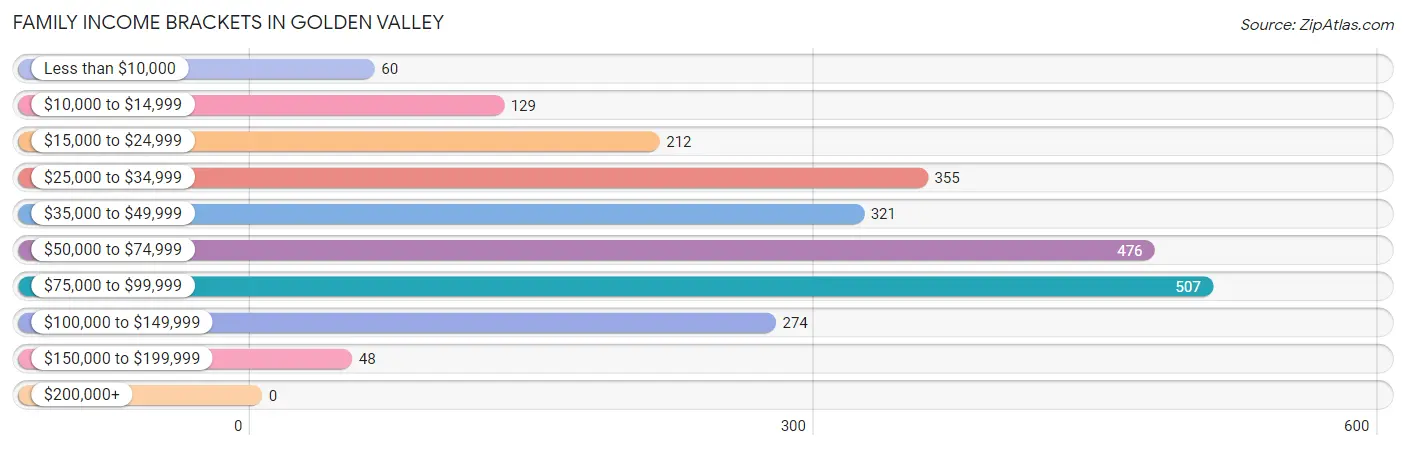
| Income Bracket | # Families | % Families |
| Less than $10,000 | 60 | 2.5% |
| $10,000 to $14,999 | 129 | 5.4% |
| $15,000 to $24,999 | 212 | 8.9% |
| $25,000 to $34,999 | 355 | 14.9% |
| $35,000 to $49,999 | 321 | 13.5% |
| $50,000 to $74,999 | 476 | 20.0% |
| $75,000 to $99,999 | 507 | 21.3% |
| $100,000 to $149,999 | 274 | 11.5% |
| $150,000 to $199,999 | 48 | 2.0% |
| $200,000+ | 0 | 0.0% |
Family Income by Famaliy Size in Golden Valley
3-person families (506 | 21.2%) account for the highest median family income in Golden Valley with $62,250 per family, while 2-person families (1,703 | 71.5%) have the highest median income of $27,996 per family member.
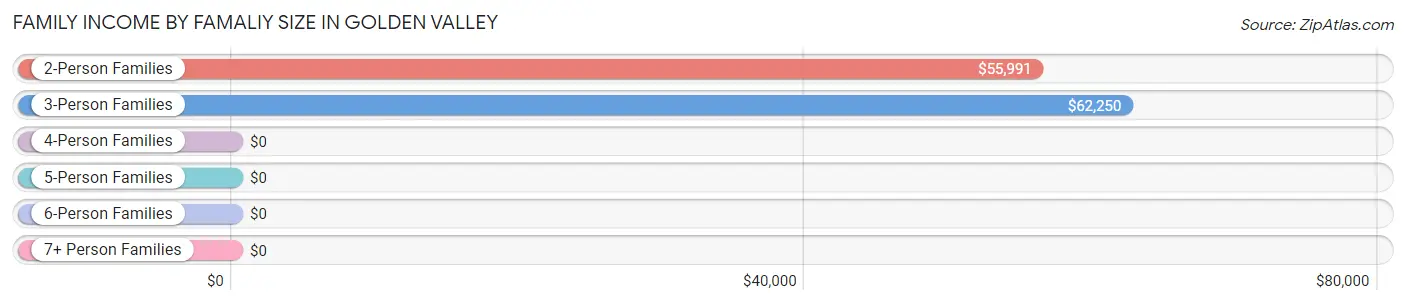
| Income Bracket | # Families | Median Income |
| 2-Person Families | 1,703 (71.5%) | $55,991 |
| 3-Person Families | 506 (21.2%) | $62,250 |
| 4-Person Families | 59 (2.5%) | $0 |
| 5-Person Families | 19 (0.8%) | $0 |
| 6-Person Families | 68 (2.9%) | $0 |
| 7+ Person Families | 26 (1.1%) | $0 |
| Total | 2,381 (100.0%) | $56,021 |
Family Income by Number of Earners in Golden Valley
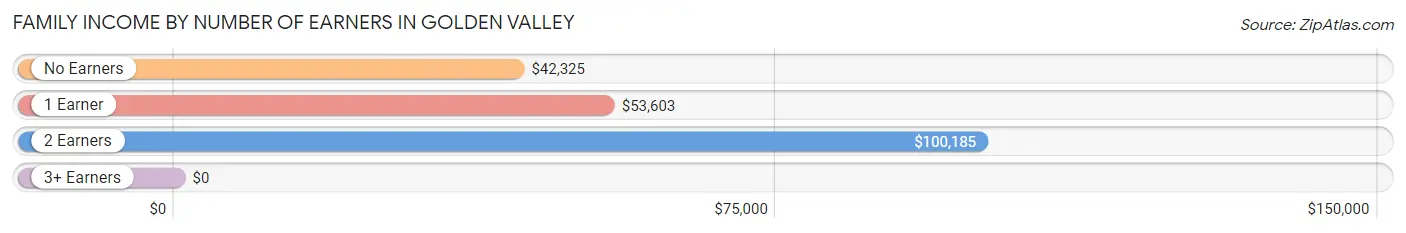
| Number of Earners | # Families | Median Income |
| No Earners | 1,027 (43.1%) | $42,325 |
| 1 Earner | 862 (36.2%) | $53,603 |
| 2 Earners | 469 (19.7%) | $100,185 |
| 3+ Earners | 23 (1.0%) | $0 |
| Total | 2,381 (100.0%) | $56,021 |
Household Income in Golden Valley
Household Income Brackets in Golden Valley
With 699 households falling in the category, the $50,000 to $74,999 income range is the most frequent in Golden Valley, accounting for 18.1% of all households. In contrast, only 12 households (0.3%) fall into the $200,000+ income bracket, making it the least populous group.
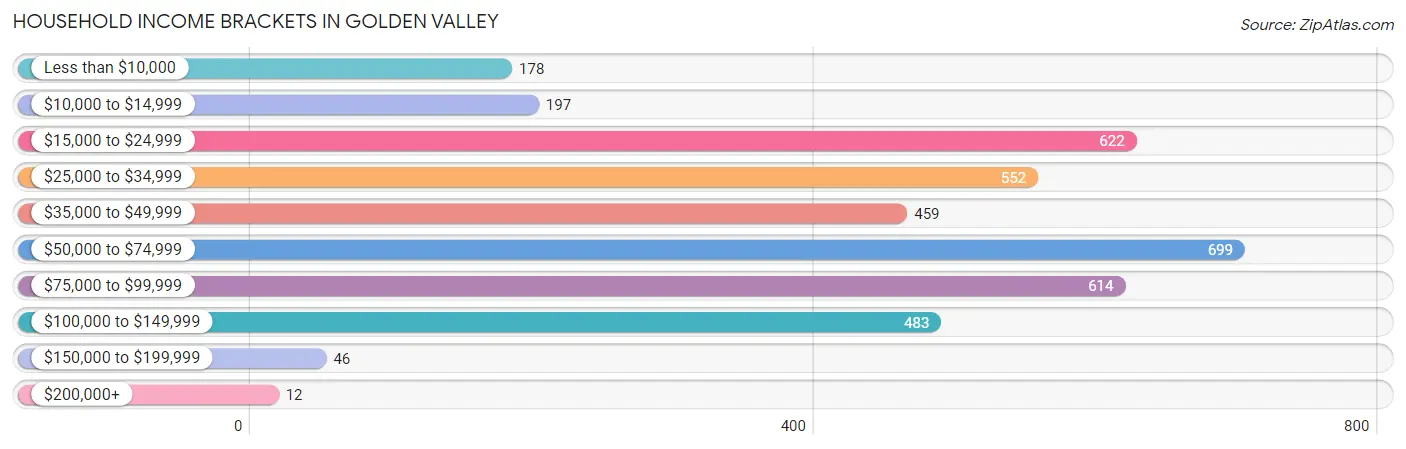
| Income Bracket | # Households | % Households |
| Less than $10,000 | 178 | 4.6% |
| $10,000 to $14,999 | 197 | 5.1% |
| $15,000 to $24,999 | 622 | 16.1% |
| $25,000 to $34,999 | 552 | 14.3% |
| $35,000 to $49,999 | 459 | 11.9% |
| $50,000 to $74,999 | 699 | 18.1% |
| $75,000 to $99,999 | 614 | 15.9% |
| $100,000 to $149,999 | 483 | 12.5% |
| $150,000 to $199,999 | 46 | 1.2% |
| $200,000+ | 12 | 0.3% |
Household Income by Householder Age in Golden Valley
The median household income in Golden Valley is $45,427, with the highest median household income of $47,344 found in the 65+ years age bracket for the primary householder. A total of 2,079 households (53.8%) fall into this category.
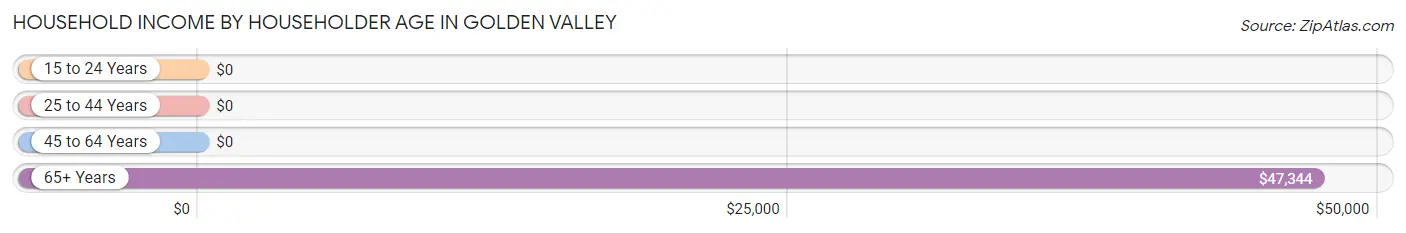
| Income Bracket | # Households | Median Income |
| 15 to 24 Years | 0 (0.0%) | $0 |
| 25 to 44 Years | 305 (7.9%) | $0 |
| 45 to 64 Years | 1,477 (38.3%) | $0 |
| 65+ Years | 2,079 (53.8%) | $47,344 |
| Total | 3,861 (100.0%) | $45,427 |
Poverty in Golden Valley
Income Below Poverty by Sex and Age in Golden Valley
With 24.2% poverty level for males and 21.2% for females among the residents of Golden Valley, 6 to 11 year old males and 12 to 14 year old females are the most vulnerable to poverty, with 131 males (100.0%) and 41 females (100.0%) in their respective age groups living below the poverty level.
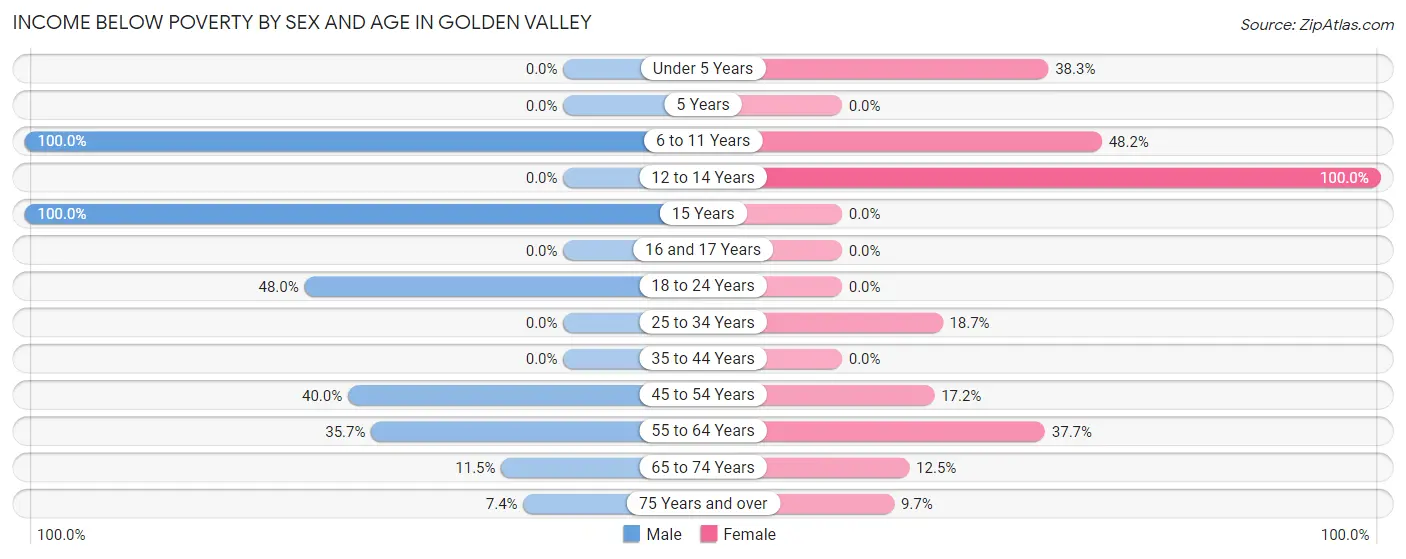
| Age Bracket | Male | Female |
| Under 5 Years | 0 (0.0%) | 41 (38.3%) |
| 5 Years | 0 (0.0%) | 0 (0.0%) |
| 6 to 11 Years | 131 (100.0%) | 41 (48.2%) |
| 12 to 14 Years | 0 (0.0%) | 41 (100.0%) |
| 15 Years | 34 (100.0%) | 0 (0.0%) |
| 16 and 17 Years | 0 (0.0%) | 0 (0.0%) |
| 18 to 24 Years | 86 (48.0%) | 0 (0.0%) |
| 25 to 34 Years | 0 (0.0%) | 68 (18.7%) |
| 35 to 44 Years | 0 (0.0%) | 0 (0.0%) |
| 45 to 54 Years | 251 (40.0%) | 119 (17.2%) |
| 55 to 64 Years | 298 (35.6%) | 326 (37.7%) |
| 65 to 74 Years | 111 (11.5%) | 115 (12.5%) |
| 75 Years and over | 71 (7.4%) | 59 (9.7%) |
| Total | 982 (24.2%) | 810 (21.2%) |
Income Above Poverty by Sex and Age in Golden Valley
According to the poverty statistics in Golden Valley, males aged under 5 years and females aged 15 years are the age groups that are most secure financially, with 100.0% of males and 100.0% of females in these age groups living above the poverty line.
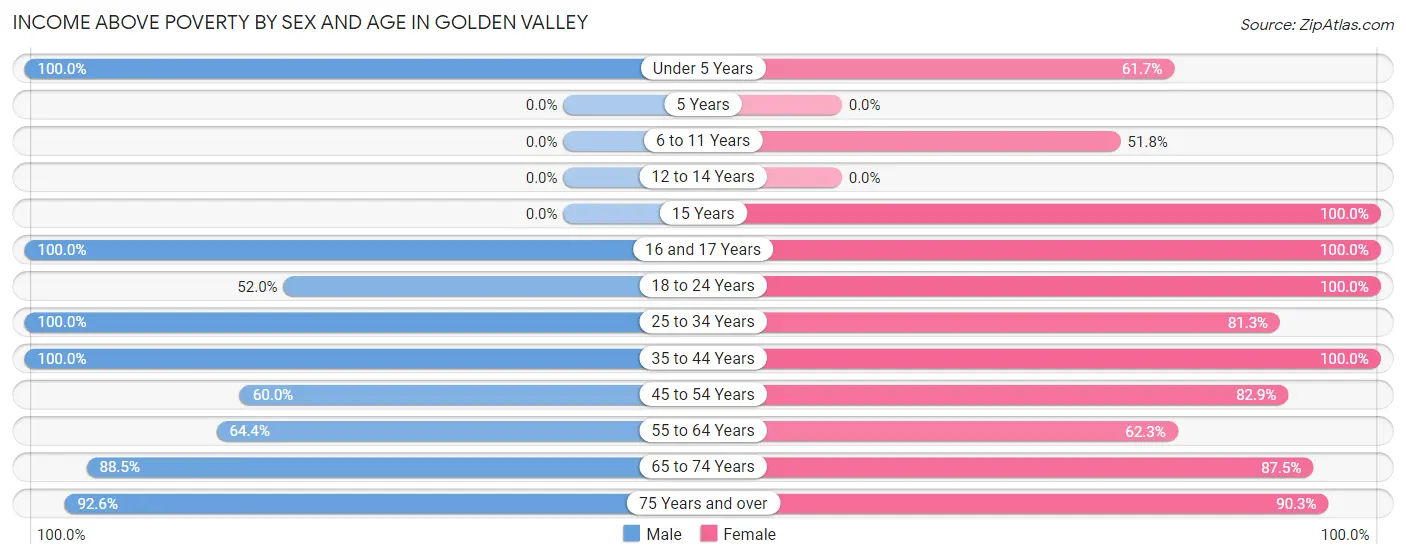
| Age Bracket | Male | Female |
| Under 5 Years | 44 (100.0%) | 66 (61.7%) |
| 5 Years | 0 (0.0%) | 0 (0.0%) |
| 6 to 11 Years | 0 (0.0%) | 44 (51.8%) |
| 12 to 14 Years | 0 (0.0%) | 0 (0.0%) |
| 15 Years | 0 (0.0%) | 16 (100.0%) |
| 16 and 17 Years | 26 (100.0%) | 20 (100.0%) |
| 18 to 24 Years | 93 (52.0%) | 99 (100.0%) |
| 25 to 34 Years | 140 (100.0%) | 296 (81.3%) |
| 35 to 44 Years | 120 (100.0%) | 6 (100.0%) |
| 45 to 54 Years | 377 (60.0%) | 575 (82.9%) |
| 55 to 64 Years | 538 (64.3%) | 539 (62.3%) |
| 65 to 74 Years | 853 (88.5%) | 805 (87.5%) |
| 75 Years and over | 887 (92.6%) | 550 (90.3%) |
| Total | 3,078 (75.8%) | 3,016 (78.8%) |
Income Below Poverty Among Married-Couple Families in Golden Valley
The poverty statistics for married-couple families in Golden Valley show that 12.7% or 223 of the total 1,762 families live below the poverty line. Families with 1 or 2 children have the highest poverty rate of 52.9%, comprising of 46 families. On the other hand, families with 3 or 4 children have the lowest poverty rate of 0.0%, which includes 0 families.
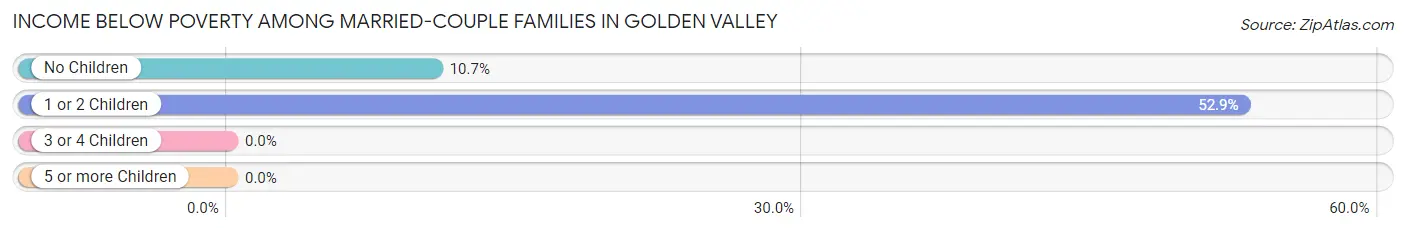
| Children | Above Poverty | Below Poverty |
| No Children | 1,479 (89.3%) | 177 (10.7%) |
| 1 or 2 Children | 41 (47.1%) | 46 (52.9%) |
| 3 or 4 Children | 19 (100.0%) | 0 (0.0%) |
| 5 or more Children | 0 (0.0%) | 0 (0.0%) |
| Total | 1,539 (87.3%) | 223 (12.7%) |
Income Below Poverty Among Single-Parent Households in Golden Valley
According to the poverty data in Golden Valley, 76.1% or 83 single-father households and 19.2% or 98 single-mother households are living below the poverty line. Among single-father households, those with no children have the highest poverty rate, with 83 households (76.1%) experiencing poverty. Likewise, among single-mother households, those with 5 or more children have the highest poverty rate, with 68 households (100.0%) falling below the poverty line.
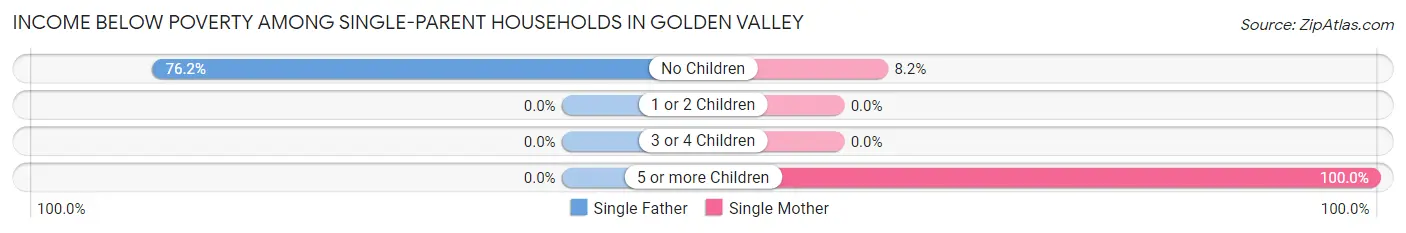
| Children | Single Father | Single Mother |
| No Children | 83 (76.1%) | 30 (8.2%) |
| 1 or 2 Children | 0 (0.0%) | 0 (0.0%) |
| 3 or 4 Children | 0 (0.0%) | 0 (0.0%) |
| 5 or more Children | 0 (0.0%) | 68 (100.0%) |
| Total | 83 (76.1%) | 98 (19.2%) |
Income Below Poverty Among Married-Couple vs Single-Parent Households in Golden Valley
The poverty data for Golden Valley shows that 223 of the married-couple family households (12.7%) and 181 of the single-parent households (29.2%) are living below the poverty level. Within the married-couple family households, those with 1 or 2 children have the highest poverty rate, with 46 households (52.9%) falling below the poverty line. Among the single-parent households, those with 5 or more children have the highest poverty rate, with 68 household (100.0%) living below poverty.
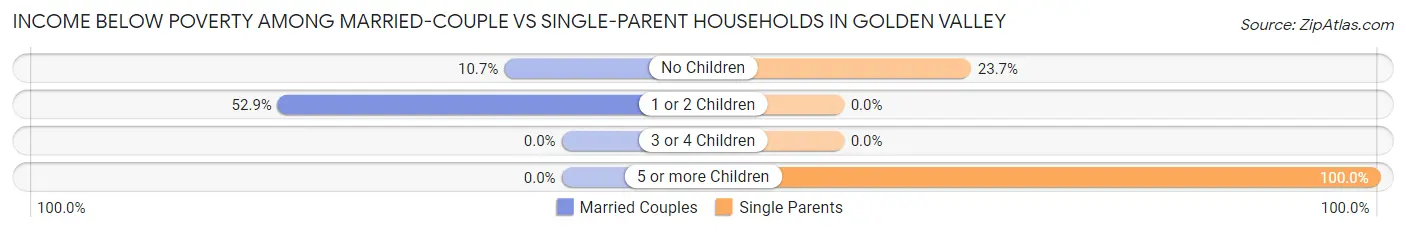
| Children | Married-Couple Families | Single-Parent Households |
| No Children | 177 (10.7%) | 113 (23.7%) |
| 1 or 2 Children | 46 (52.9%) | 0 (0.0%) |
| 3 or 4 Children | 0 (0.0%) | 0 (0.0%) |
| 5 or more Children | 0 (0.0%) | 68 (100.0%) |
| Total | 223 (12.7%) | 181 (29.2%) |
Race in Golden Valley
The most populous races in Golden Valley are White / Caucasian (7,035 | 89.0%), Hispanic or Latino (776 | 9.8%), and Two or more Races (514 | 6.5%).
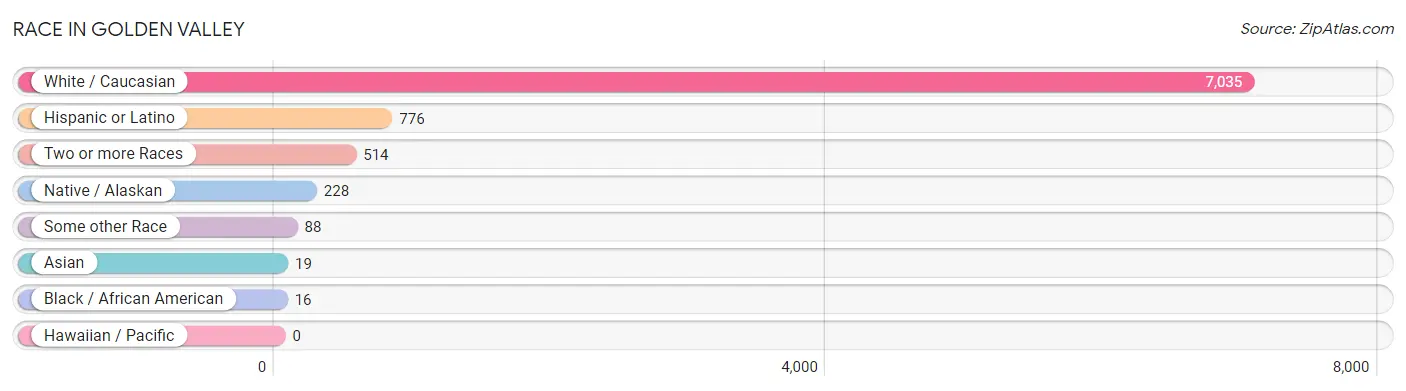
| Race | # Population | % Population |
| Asian | 19 | 0.2% |
| Black / African American | 16 | 0.2% |
| Hawaiian / Pacific | 0 | 0.0% |
| Hispanic or Latino | 776 | 9.8% |
| Native / Alaskan | 228 | 2.9% |
| White / Caucasian | 7,035 | 89.0% |
| Two or more Races | 514 | 6.5% |
| Some other Race | 88 | 1.1% |
| Total | 7,900 | 100.0% |
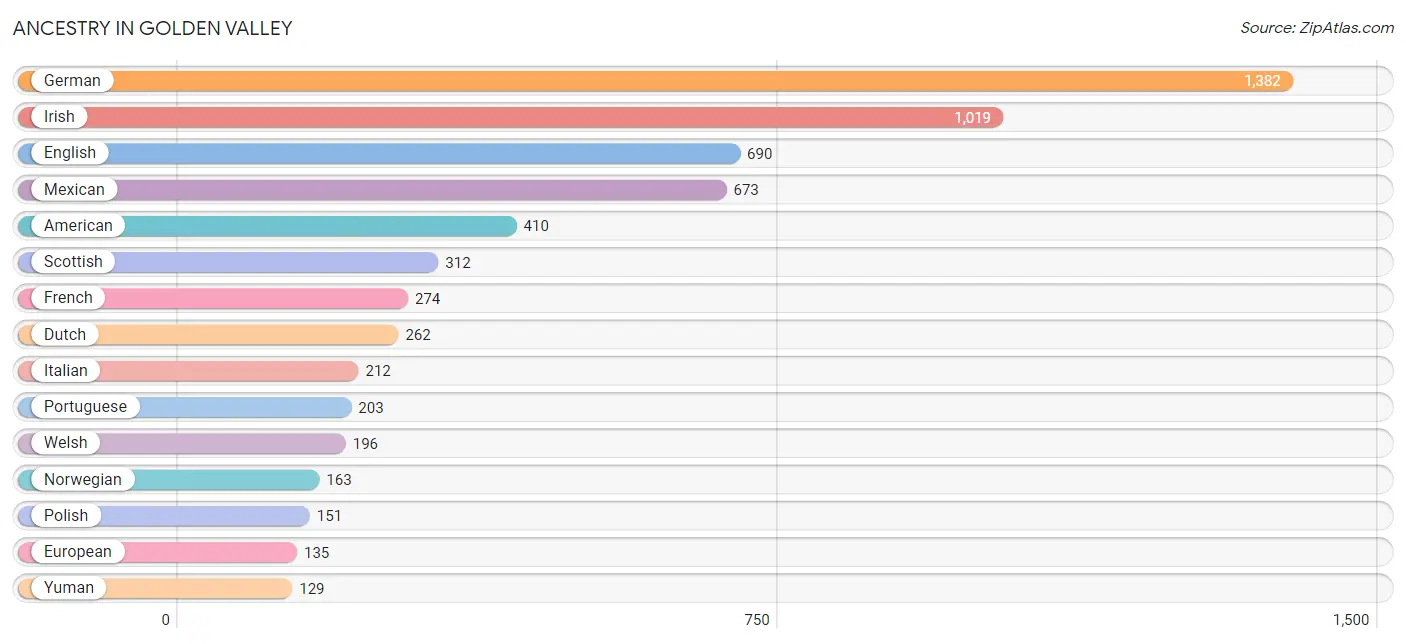
Ancestry in Golden Valley
The most populous ancestries reported in Golden Valley are German (1,382 | 17.5%), Irish (1,019 | 12.9%), English (690 | 8.7%), Mexican (673 | 8.5%), and American (410 | 5.2%), together accounting for 52.8% of all Golden Valley residents.
| Ancestry | # Population | % Population |
| American | 410 | 5.2% |
| Arab | 128 | 1.6% |
| Blackfeet | 20 | 0.3% |
| British | 24 | 0.3% |
| Burmese | 19 | 0.2% |
| Cherokee | 38 | 0.5% |
| Creek | 40 | 0.5% |
| Danish | 61 | 0.8% |
| Dutch | 262 | 3.3% |
| Egyptian | 128 | 1.6% |
| English | 690 | 8.7% |
| European | 135 | 1.7% |
| French | 274 | 3.5% |
| French Canadian | 53 | 0.7% |
| German | 1,382 | 17.5% |
| Greek | 18 | 0.2% |
| Guamanian / Chamorro | 27 | 0.3% |
| Hopi | 60 | 0.8% |
| Hungarian | 35 | 0.4% |
| Inupiat | 81 | 1.0% |
| Irish | 1,019 | 12.9% |
| Italian | 212 | 2.7% |
| Lithuanian | 15 | 0.2% |
| Mexican | 673 | 8.5% |
| Navajo | 28 | 0.4% |
| Norwegian | 163 | 2.1% |
| Pennsylvania German | 60 | 0.8% |
| Polish | 151 | 1.9% |
| Portuguese | 203 | 2.6% |
| Puerto Rican | 45 | 0.6% |
| Romanian | 26 | 0.3% |
| Russian | 49 | 0.6% |
| Scandinavian | 90 | 1.1% |
| Scotch-Irish | 57 | 0.7% |
| Scottish | 312 | 4.0% |
| Spaniard | 38 | 0.5% |
| Spanish | 20 | 0.3% |
| Subsaharan African | 13 | 0.2% |
| Swedish | 128 | 1.6% |
| Welsh | 196 | 2.5% |
| Yuman | 129 | 1.6% | View All 41 Rows |
Immigrants in Golden Valley
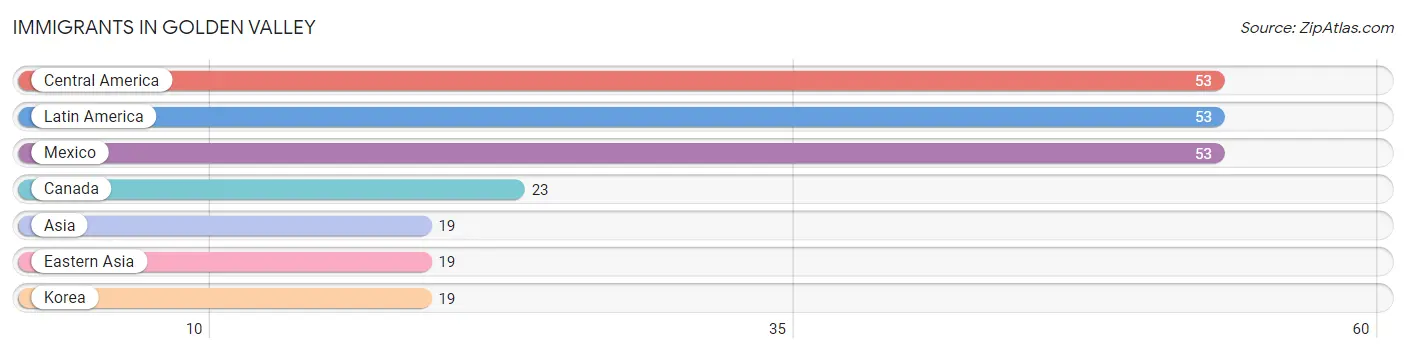
The most numerous immigrant groups reported in Golden Valley came from Central America (53 | 0.7%), Latin America (53 | 0.7%), Mexico (53 | 0.7%), Canada (23 | 0.3%), and Asia (19 | 0.2%), together accounting for 2.5% of all Golden Valley residents.
| Immigration Origin | # Population | % Population |
| Asia | 19 | 0.2% |
| Canada | 23 | 0.3% |
| Central America | 53 | 0.7% |
| Eastern Asia | 19 | 0.2% |
| Korea | 19 | 0.2% |
| Latin America | 53 | 0.7% |
| Mexico | 53 | 0.7% | View All 7 Rows |
Sex and Age in Golden Valley
Sex and Age in Golden Valley
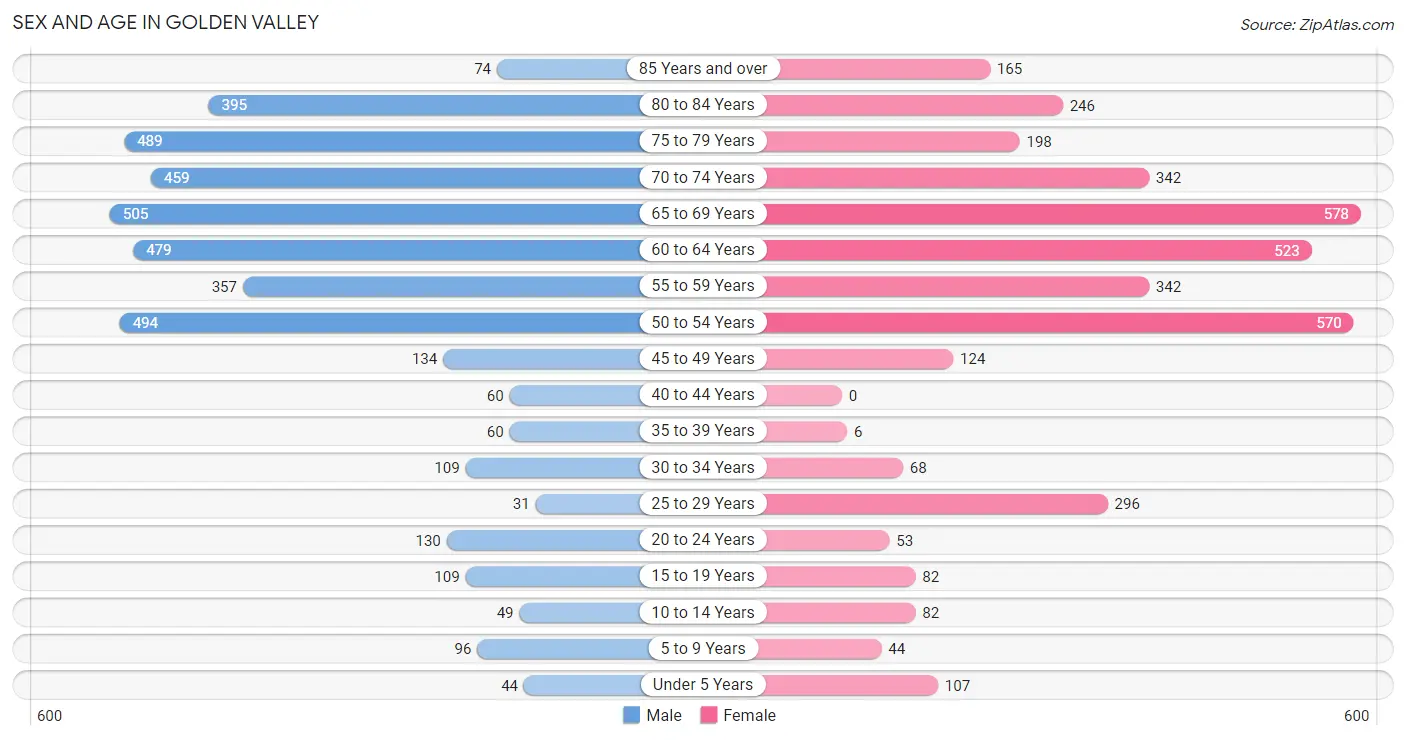
The most populous age groups in Golden Valley are 65 to 69 Years (505 | 12.4%) for men and 65 to 69 Years (578 | 15.1%) for women.
| Age Bracket | Male | Female |
| Under 5 Years | 44 (1.1%) | 107 (2.8%) |
| 5 to 9 Years | 96 (2.4%) | 44 (1.1%) |
| 10 to 14 Years | 49 (1.2%) | 82 (2.1%) |
| 15 to 19 Years | 109 (2.7%) | 82 (2.1%) |
| 20 to 24 Years | 130 (3.2%) | 53 (1.4%) |
| 25 to 29 Years | 31 (0.8%) | 296 (7.7%) |
| 30 to 34 Years | 109 (2.7%) | 68 (1.8%) |
| 35 to 39 Years | 60 (1.5%) | 6 (0.2%) |
| 40 to 44 Years | 60 (1.5%) | 0 (0.0%) |
| 45 to 49 Years | 134 (3.3%) | 124 (3.2%) |
| 50 to 54 Years | 494 (12.1%) | 570 (14.9%) |
| 55 to 59 Years | 357 (8.8%) | 342 (8.9%) |
| 60 to 64 Years | 479 (11.8%) | 523 (13.7%) |
| 65 to 69 Years | 505 (12.4%) | 578 (15.1%) |
| 70 to 74 Years | 459 (11.3%) | 342 (8.9%) |
| 75 to 79 Years | 489 (12.0%) | 198 (5.2%) |
| 80 to 84 Years | 395 (9.7%) | 246 (6.4%) |
| 85 Years and over | 74 (1.8%) | 165 (4.3%) |
| Total | 4,074 (100.0%) | 3,826 (100.0%) |
Families and Households in Golden Valley
Median Family Size in Golden Valley
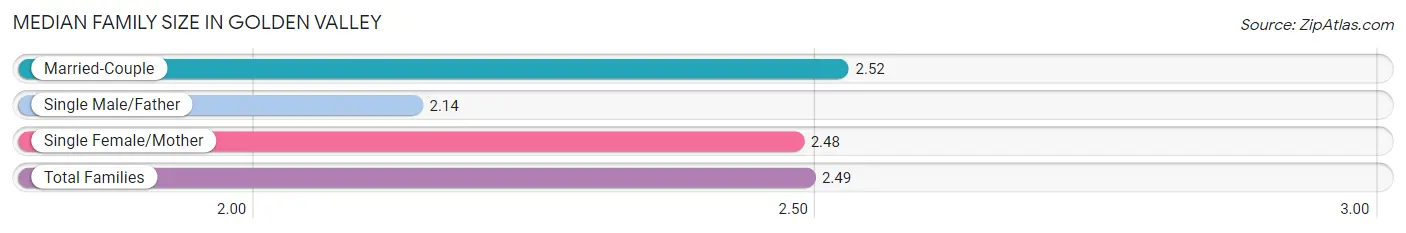
The median family size in Golden Valley is 2.49 persons per family, with married-couple families (1,762 | 74.0%) accounting for the largest median family size of 2.52 persons per family. On the other hand, single male/father families (109 | 4.6%) represent the smallest median family size with 2.14 persons per family.
| Family Type | # Families | Family Size |
| Married-Couple | 1,762 (74.0%) | 2.52 |
| Single Male/Father | 109 (4.6%) | 2.14 |
| Single Female/Mother | 510 (21.4%) | 2.48 |
| Total Families | 2,381 (100.0%) | 2.49 |
Median Household Size in Golden Valley
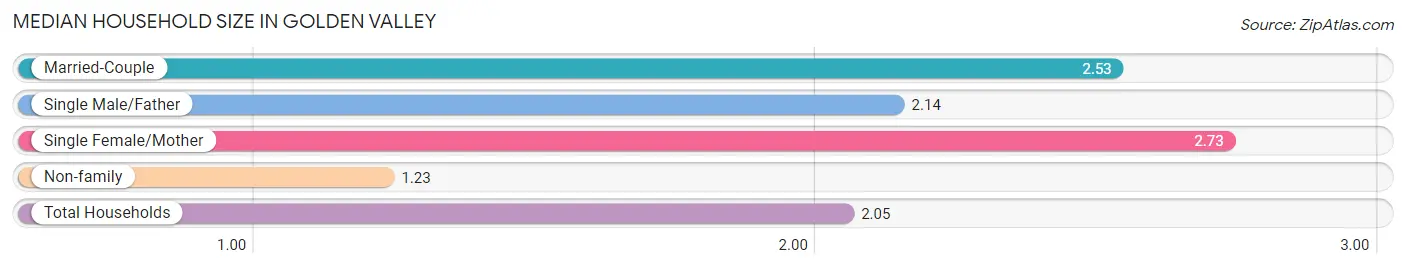
The median household size in Golden Valley is 2.05 persons per household, with single female/mother households (510 | 13.2%) accounting for the largest median household size of 2.73 persons per household. non-family households (1,480 | 38.3%) represent the smallest median household size with 1.23 persons per household.
| Household Type | # Households | Household Size |
| Married-Couple | 1,762 (45.6%) | 2.53 |
| Single Male/Father | 109 (2.8%) | 2.14 |
| Single Female/Mother | 510 (13.2%) | 2.73 |
| Non-family | 1,480 (38.3%) | 1.23 |
| Total Households | 3,861 (100.0%) | 2.05 |
Household Size by Marriage Status in Golden Valley
Out of a total of 3,861 households in Golden Valley, 2,381 (61.7%) are family households, while 1,480 (38.3%) are nonfamily households. The most numerous type of family households are 2-person households, comprising 1,513, and the most common type of nonfamily households are 1-person households, comprising 1,231.
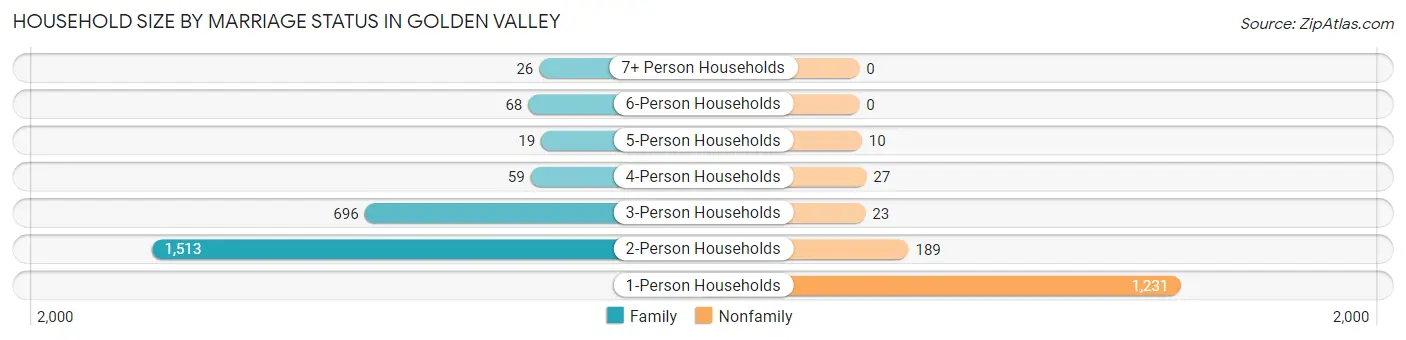
| Household Size | Family Households | Nonfamily Households |
| 1-Person Households | - | 1,231 (31.9%) |
| 2-Person Households | 1,513 (39.2%) | 189 (4.9%) |
| 3-Person Households | 696 (18.0%) | 23 (0.6%) |
| 4-Person Households | 59 (1.5%) | 27 (0.7%) |
| 5-Person Households | 19 (0.5%) | 10 (0.3%) |
| 6-Person Households | 68 (1.8%) | 0 (0.0%) |
| 7+ Person Households | 26 (0.7%) | 0 (0.0%) |
| Total | 2,381 (61.7%) | 1,480 (38.3%) |
Female Fertility in Golden Valley
Fertility by Age in Golden Valley
Average fertility rate in Golden Valley is 25.0 births per 1,000 women. Women in the age bracket of 15 to 19 years have the highest fertility rate with 244.0 births per 1,000 women. Women in the age bracket of 15 to 19 years acount for 100.0% of all women with births.
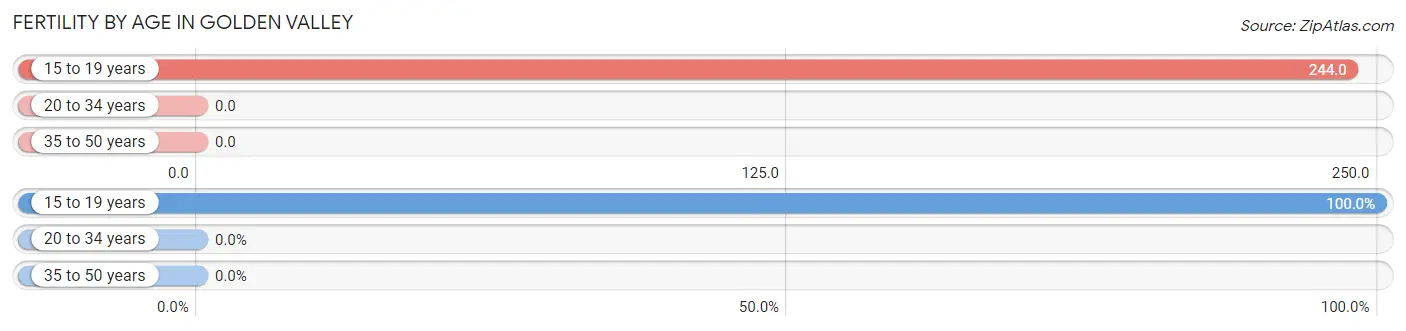
| Age Bracket | Women with Births | Births / 1,000 Women |
| 15 to 19 years | 20 (100.0%) | 244.0 |
| 20 to 34 years | 0 (0.0%) | 0.0 |
| 35 to 50 years | 0 (0.0%) | 0.0 |
| Total | 20 (100.0%) | 25.0 |
Fertility by Age by Marriage Status in Golden Valley
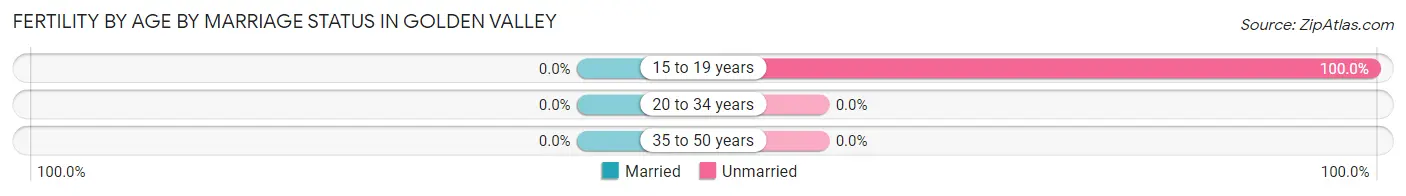
| Age Bracket | Married | Unmarried |
| 15 to 19 years | 0 (0.0%) | 20 (100.0%) |
| 20 to 34 years | 0 (0.0%) | 0 (0.0%) |
| 35 to 50 years | 0 (0.0%) | 0 (0.0%) |
| Total | 0 (0.0%) | 20 (100.0%) |
Fertility by Education in Golden Valley
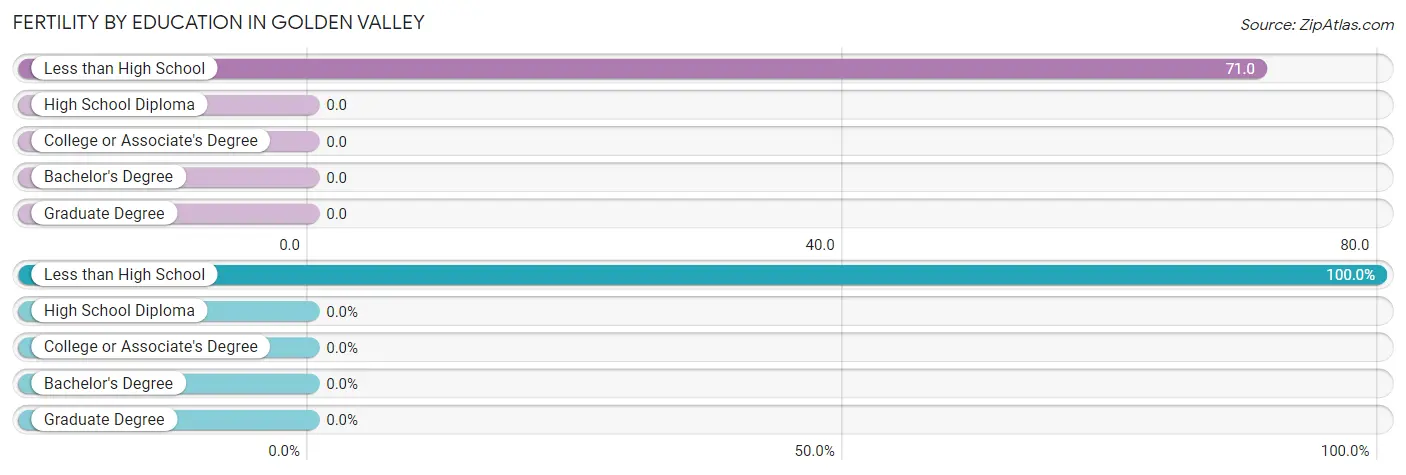
| Educational Attainment | Women with Births | Births / 1,000 Women |
| Less than High School | 20 (100.0%) | 71.0 |
| High School Diploma | 0 (0.0%) | 0.0 |
| College or Associate's Degree | 0 (0.0%) | 0.0 |
| Bachelor's Degree | 0 (0.0%) | 0.0 |
| Graduate Degree | 0 (0.0%) | 0.0 |
| Total | 20 (100.0%) | 25.0 |
Fertility by Education by Marriage Status in Golden Valley
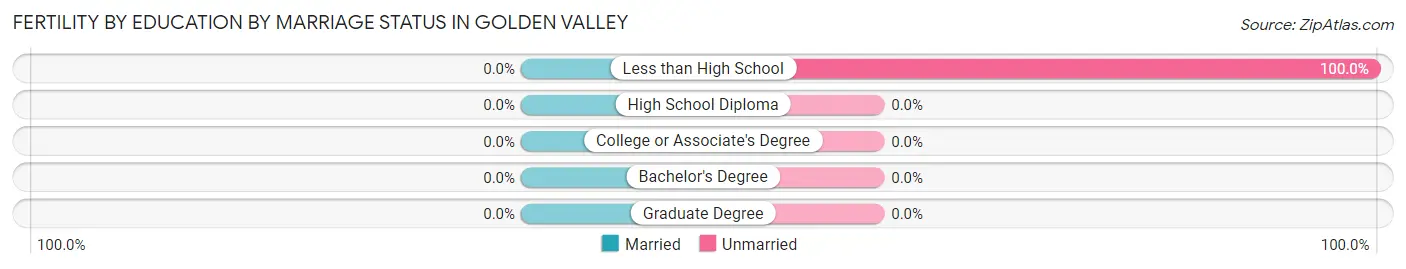
| Educational Attainment | Married | Unmarried |
| Less than High School | 0 (0.0%) | 20 (100.0%) |
| High School Diploma | 0 (0.0%) | 0 (0.0%) |
| College or Associate's Degree | 0 (0.0%) | 0 (0.0%) |
| Bachelor's Degree | 0 (0.0%) | 0 (0.0%) |
| Graduate Degree | 0 (0.0%) | 0 (0.0%) |
| Total | 0 (0.0%) | 20 (100.0%) |
Employment Characteristics in Golden Valley
Employment by Class of Employer in Golden Valley
Among the 2,094 employed individuals in Golden Valley, private company employees (1,269 | 60.6%), local government employees (395 | 18.9%), and not-for-profit organizations (182 | 8.7%) make up the most common classes of employment.
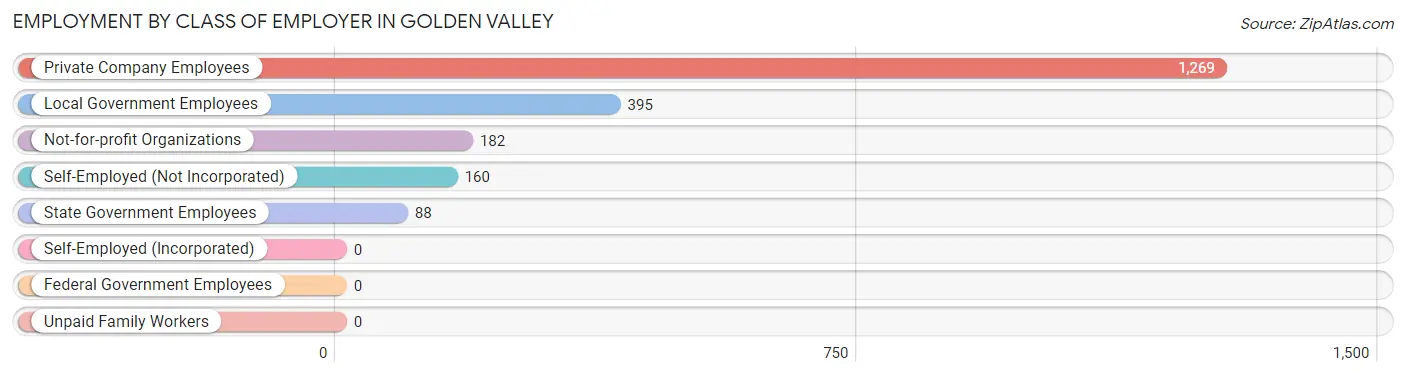
| Employer Class | # Employees | % Employees |
| Private Company Employees | 1,269 | 60.6% |
| Self-Employed (Incorporated) | 0 | 0.0% |
| Self-Employed (Not Incorporated) | 160 | 7.6% |
| Not-for-profit Organizations | 182 | 8.7% |
| Local Government Employees | 395 | 18.9% |
| State Government Employees | 88 | 4.2% |
| Federal Government Employees | 0 | 0.0% |
| Unpaid Family Workers | 0 | 0.0% |
| Total | 2,094 | 100.0% |
Employment Status by Age in Golden Valley
According to the labor force statistics for Golden Valley, out of the total population over 16 years of age (7,428), 31.8% or 2,362 individuals are in the labor force, with 7.2% or 170 of them unemployed. The age group with the highest labor force participation rate is 25 to 29 years, with 93.6% or 306 individuals in the labor force. Within the labor force, the 20 to 24 years age range has the highest percentage of unemployed individuals, with 75.6% or 62 of them being unemployed.
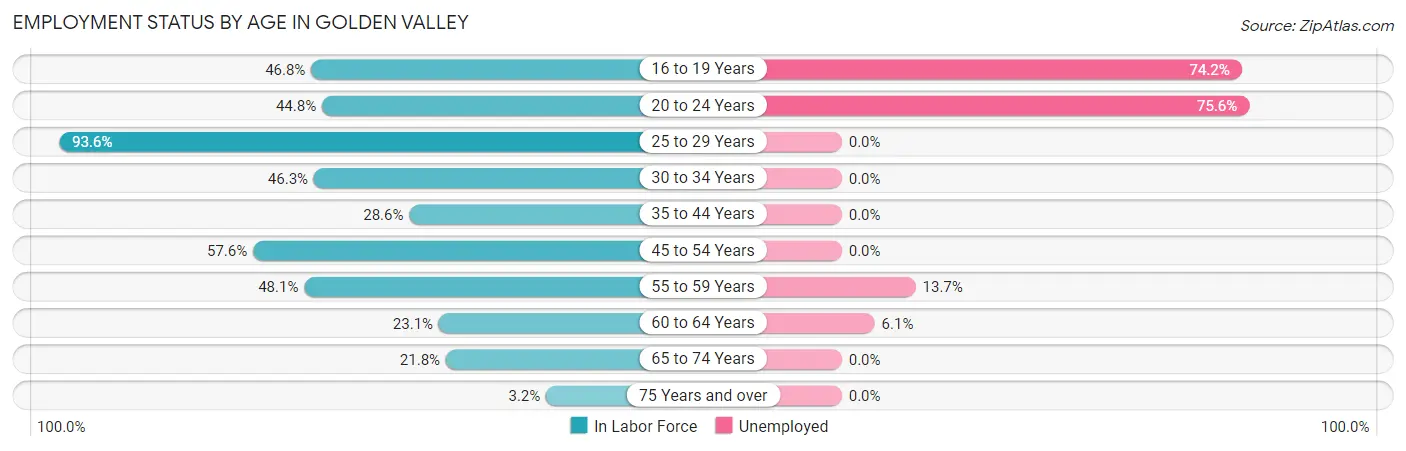
| Age Bracket | In Labor Force | Unemployed |
| 16 to 19 Years | 66 (46.8%) | 49 (74.2%) |
| 20 to 24 Years | 82 (44.8%) | 62 (75.6%) |
| 25 to 29 Years | 306 (93.6%) | 0 (0.0%) |
| 30 to 34 Years | 82 (46.3%) | 0 (0.0%) |
| 35 to 44 Years | 36 (28.6%) | 0 (0.0%) |
| 45 to 54 Years | 761 (57.6%) | 0 (0.0%) |
| 55 to 59 Years | 336 (48.1%) | 46 (13.7%) |
| 60 to 64 Years | 231 (23.1%) | 14 (6.1%) |
| 65 to 74 Years | 411 (21.8%) | 0 (0.0%) |
| 75 Years and over | 50 (3.2%) | 0 (0.0%) |
| Total | 2,362 (31.8%) | 170 (7.2%) |
Employment Status by Educational Attainment in Golden Valley
According to labor force statistics for Golden Valley, 48.0% of individuals (1,753) out of the total population between 25 and 64 years of age (3,653) are in the labor force, with 3.4% or 60 of them being unemployed. The group with the highest labor force participation rate are those with the educational attainment of college / associate degree, with 54.1% or 891 individuals in the labor force. Within the labor force, individuals with college / associate degree education have the highest percentage of unemployment, with 5.2% or 46 of them being unemployed.
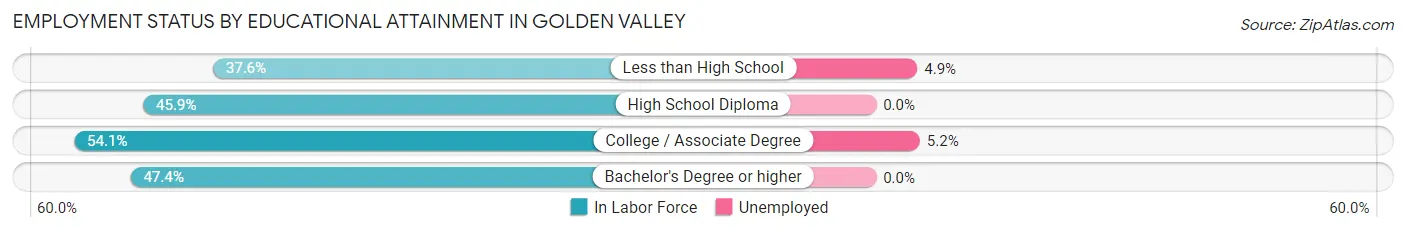
| Educational Attainment | In Labor Force | Unemployed |
| Less than High School | 287 (37.6%) | 37 (4.9%) |
| High School Diploma | 481 (45.9%) | 0 (0.0%) |
| College / Associate Degree | 891 (54.1%) | 86 (5.2%) |
| Bachelor's Degree or higher | 92 (47.4%) | 0 (0.0%) |
| Total | 1,753 (48.0%) | 124 (3.4%) |
Employment Occupations by Sex in Golden Valley
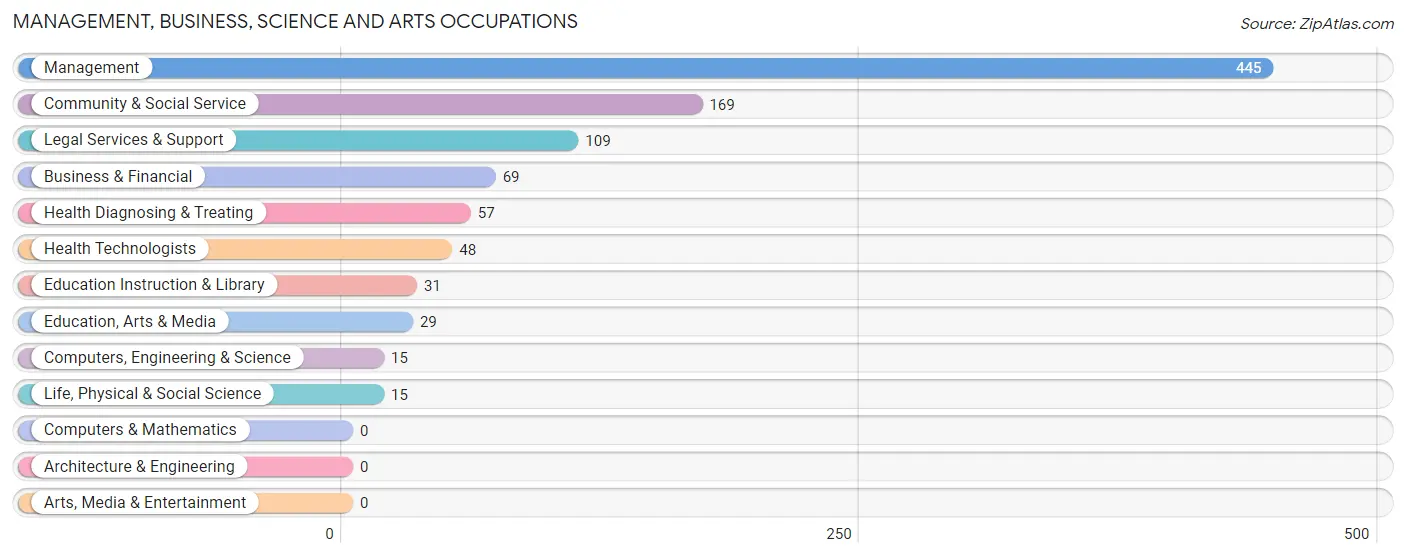
Management, Business, Science and Arts Occupations
The most common Management, Business, Science and Arts occupations in Golden Valley are Management (445 | 20.3%), Community & Social Service (169 | 7.7%), Legal Services & Support (109 | 5.0%), Business & Financial (69 | 3.2%), and Health Diagnosing & Treating (57 | 2.6%).
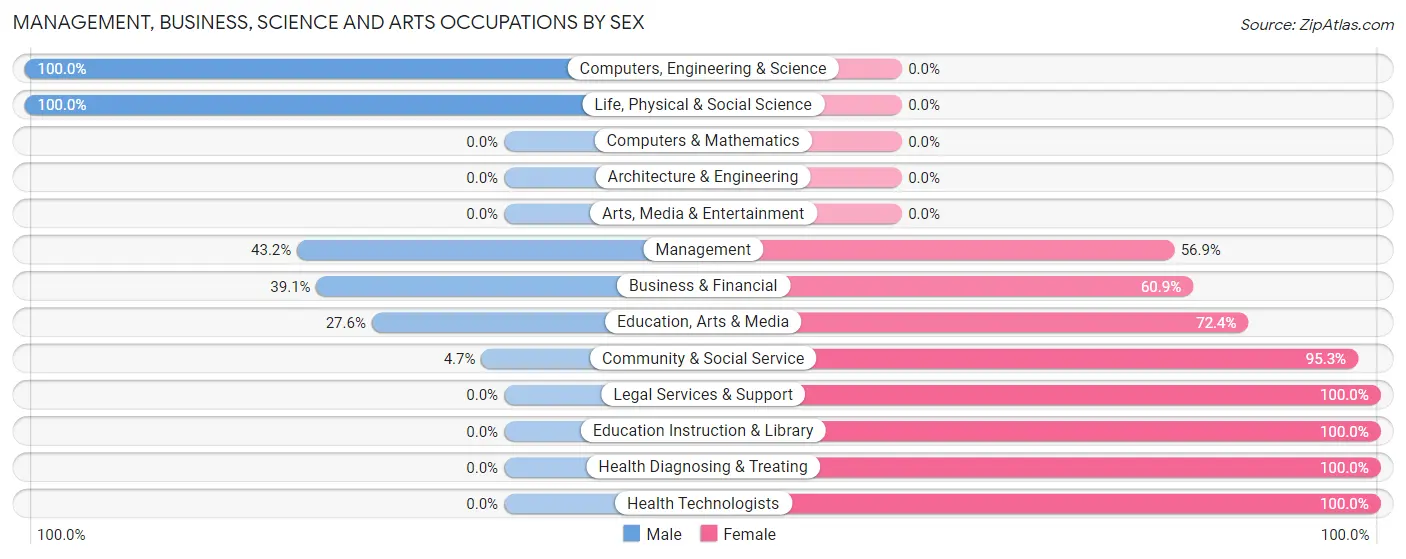
Management, Business, Science and Arts Occupations by Sex
Within the Management, Business, Science and Arts occupations in Golden Valley, the most male-oriented occupations are Computers, Engineering & Science (100.0%), Life, Physical & Social Science (100.0%), and Management (43.1%), while the most female-oriented occupations are Legal Services & Support (100.0%), Education Instruction & Library (100.0%), and Health Diagnosing & Treating (100.0%).
| Occupation | Male | Female |
| Management | 192 (43.1%) | 253 (56.9%) |
| Business & Financial | 27 (39.1%) | 42 (60.9%) |
| Computers, Engineering & Science | 15 (100.0%) | 0 (0.0%) |
| Computers & Mathematics | 0 (0.0%) | 0 (0.0%) |
| Architecture & Engineering | 0 (0.0%) | 0 (0.0%) |
| Life, Physical & Social Science | 15 (100.0%) | 0 (0.0%) |
| Community & Social Service | 8 (4.7%) | 161 (95.3%) |
| Education, Arts & Media | 8 (27.6%) | 21 (72.4%) |
| Legal Services & Support | 0 (0.0%) | 109 (100.0%) |
| Education Instruction & Library | 0 (0.0%) | 31 (100.0%) |
| Arts, Media & Entertainment | 0 (0.0%) | 0 (0.0%) |
| Health Diagnosing & Treating | 0 (0.0%) | 57 (100.0%) |
| Health Technologists | 0 (0.0%) | 48 (100.0%) |
| Total (Category) | 242 (32.1%) | 513 (67.9%) |
| Total (Overall) | 882 (40.3%) | 1,307 (59.7%) |
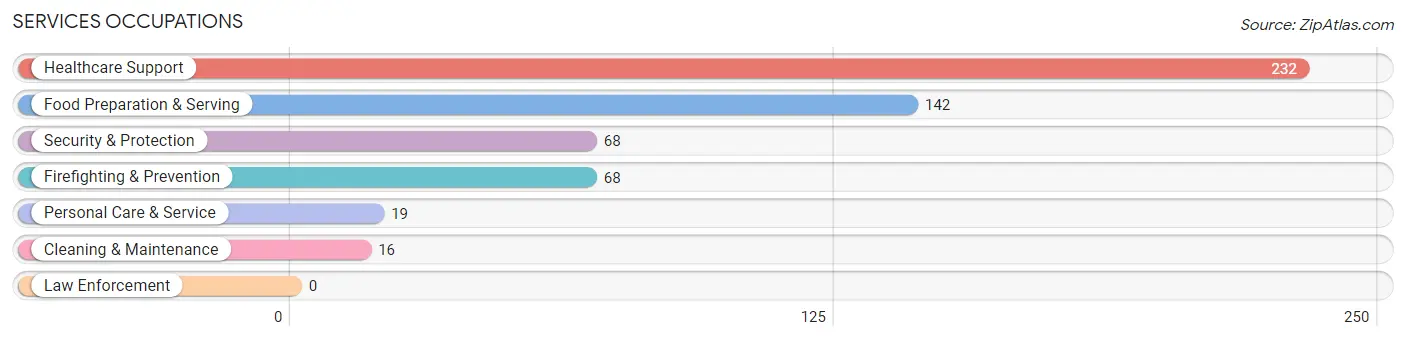
Services Occupations
The most common Services occupations in Golden Valley are Healthcare Support (232 | 10.6%), Food Preparation & Serving (142 | 6.5%), Security & Protection (68 | 3.1%), Firefighting & Prevention (68 | 3.1%), and Personal Care & Service (19 | 0.9%).
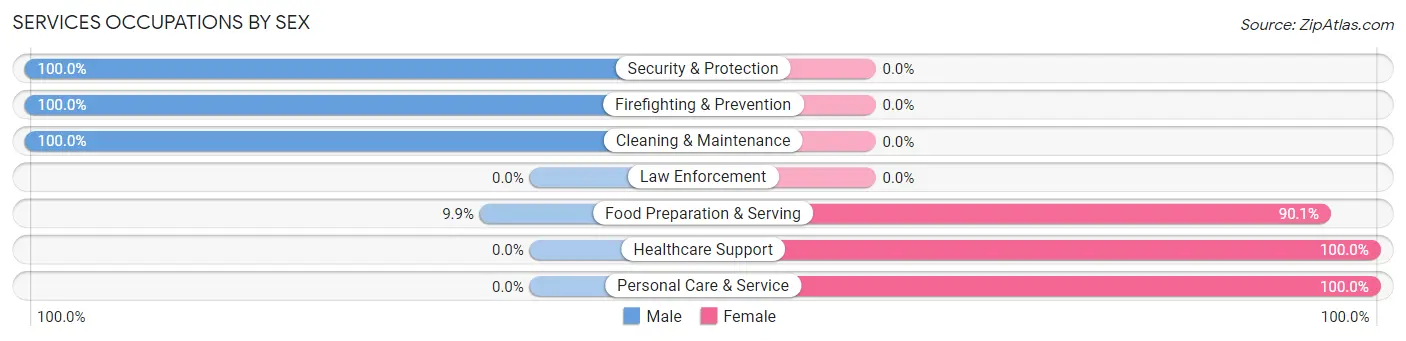
Services Occupations by Sex
Within the Services occupations in Golden Valley, the most male-oriented occupations are Security & Protection (100.0%), Firefighting & Prevention (100.0%), and Cleaning & Maintenance (100.0%), while the most female-oriented occupations are Healthcare Support (100.0%), Personal Care & Service (100.0%), and Food Preparation & Serving (90.1%).
| Occupation | Male | Female |
| Healthcare Support | 0 (0.0%) | 232 (100.0%) |
| Security & Protection | 68 (100.0%) | 0 (0.0%) |
| Firefighting & Prevention | 68 (100.0%) | 0 (0.0%) |
| Law Enforcement | 0 (0.0%) | 0 (0.0%) |
| Food Preparation & Serving | 14 (9.9%) | 128 (90.1%) |
| Cleaning & Maintenance | 16 (100.0%) | 0 (0.0%) |
| Personal Care & Service | 0 (0.0%) | 19 (100.0%) |
| Total (Category) | 98 (20.5%) | 379 (79.4%) |
| Total (Overall) | 882 (40.3%) | 1,307 (59.7%) |
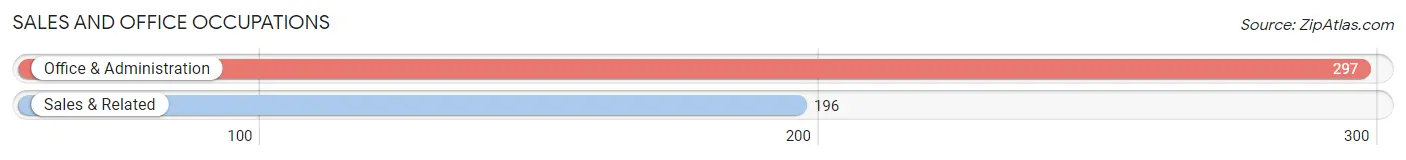
Sales and Office Occupations
The most common Sales and Office occupations in Golden Valley are Office & Administration (297 | 13.6%), and Sales & Related (196 | 8.9%).
Sales and Office Occupations by Sex
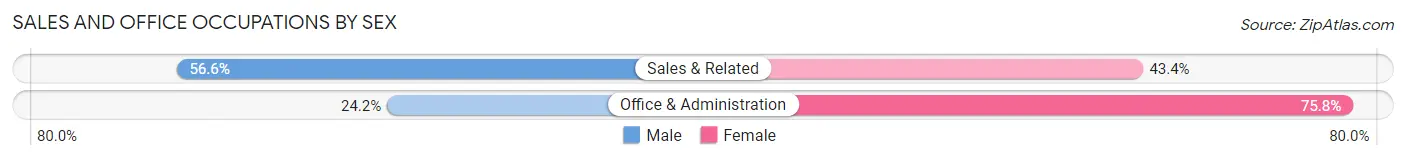
| Occupation | Male | Female |
| Sales & Related | 111 (56.6%) | 85 (43.4%) |
| Office & Administration | 72 (24.2%) | 225 (75.8%) |
| Total (Category) | 183 (37.1%) | 310 (62.9%) |
| Total (Overall) | 882 (40.3%) | 1,307 (59.7%) |
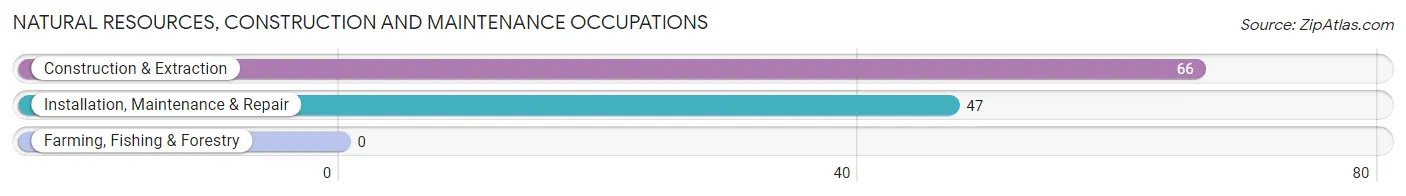
Natural Resources, Construction and Maintenance Occupations
The most common Natural Resources, Construction and Maintenance occupations in Golden Valley are Construction & Extraction (66 | 3.0%), and Installation, Maintenance & Repair (47 | 2.1%).
Natural Resources, Construction and Maintenance Occupations by Sex
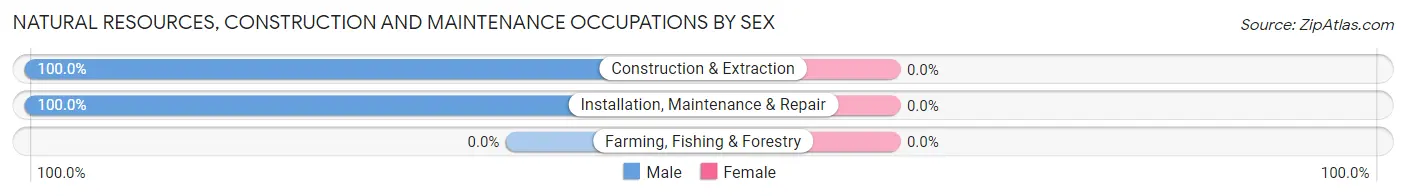
| Occupation | Male | Female |
| Farming, Fishing & Forestry | 0 (0.0%) | 0 (0.0%) |
| Construction & Extraction | 66 (100.0%) | 0 (0.0%) |
| Installation, Maintenance & Repair | 47 (100.0%) | 0 (0.0%) |
| Total (Category) | 113 (100.0%) | 0 (0.0%) |
| Total (Overall) | 882 (40.3%) | 1,307 (59.7%) |
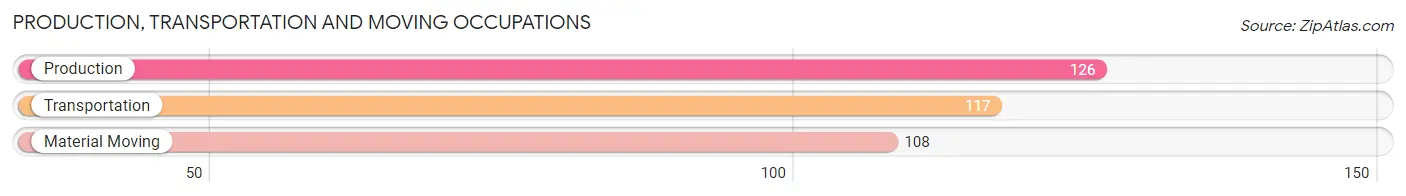
Production, Transportation and Moving Occupations
The most common Production, Transportation and Moving occupations in Golden Valley are Production (126 | 5.8%), Transportation (117 | 5.3%), and Material Moving (108 | 4.9%).
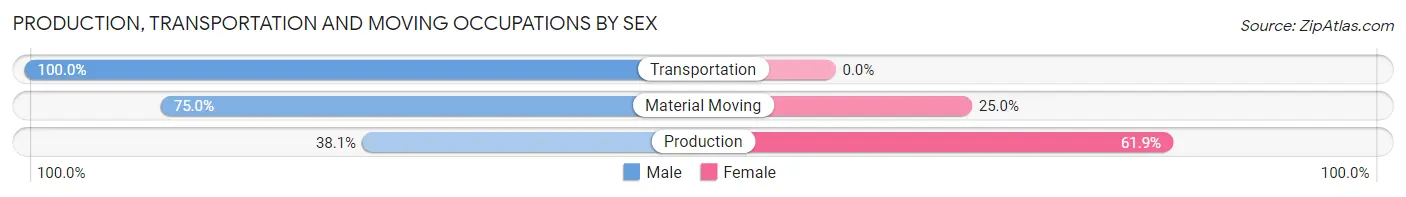
Production, Transportation and Moving Occupations by Sex
| Occupation | Male | Female |
| Production | 48 (38.1%) | 78 (61.9%) |
| Transportation | 117 (100.0%) | 0 (0.0%) |
| Material Moving | 81 (75.0%) | 27 (25.0%) |
| Total (Category) | 246 (70.1%) | 105 (29.9%) |
| Total (Overall) | 882 (40.3%) | 1,307 (59.7%) |
Employment Industries by Sex in Golden Valley
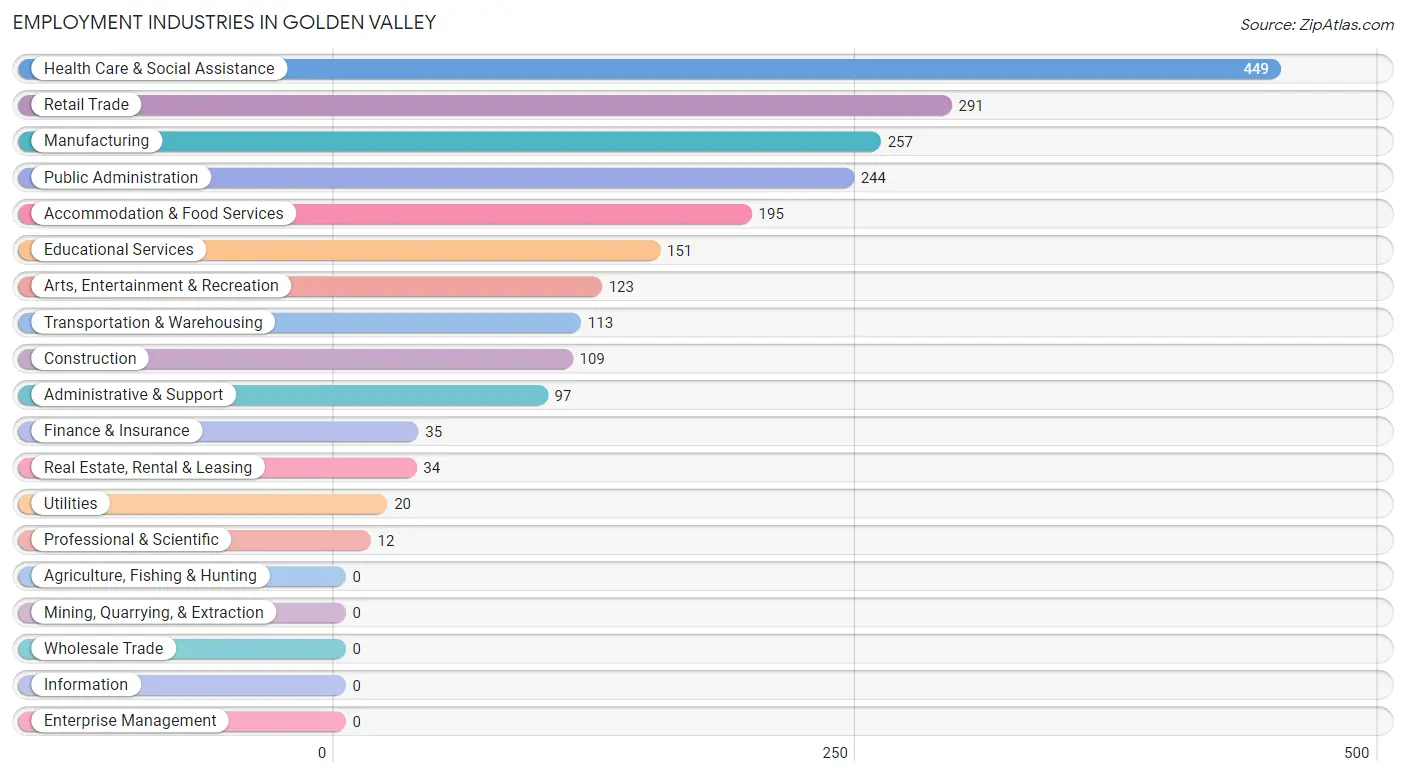
Employment Industries in Golden Valley
The major employment industries in Golden Valley include Health Care & Social Assistance (449 | 20.5%), Retail Trade (291 | 13.3%), Manufacturing (257 | 11.7%), Public Administration (244 | 11.2%), and Accommodation & Food Services (195 | 8.9%).
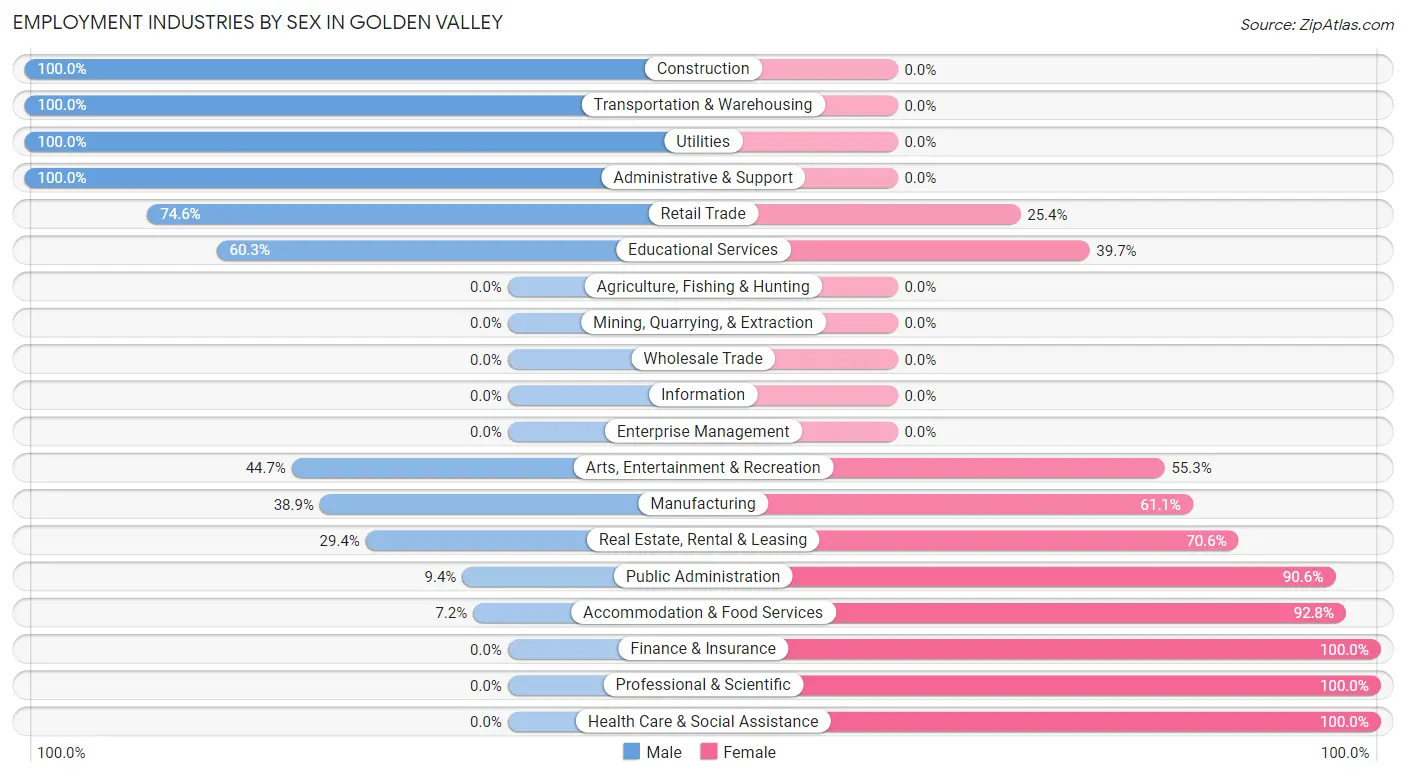
Employment Industries by Sex in Golden Valley
The Golden Valley industries that see more men than women are Construction (100.0%), Transportation & Warehousing (100.0%), and Utilities (100.0%), whereas the industries that tend to have a higher number of women are Finance & Insurance (100.0%), Professional & Scientific (100.0%), and Health Care & Social Assistance (100.0%).
| Industry | Male | Female |
| Agriculture, Fishing & Hunting | 0 (0.0%) | 0 (0.0%) |
| Mining, Quarrying, & Extraction | 0 (0.0%) | 0 (0.0%) |
| Construction | 109 (100.0%) | 0 (0.0%) |
| Manufacturing | 100 (38.9%) | 157 (61.1%) |
| Wholesale Trade | 0 (0.0%) | 0 (0.0%) |
| Retail Trade | 217 (74.6%) | 74 (25.4%) |
| Transportation & Warehousing | 113 (100.0%) | 0 (0.0%) |
| Utilities | 20 (100.0%) | 0 (0.0%) |
| Information | 0 (0.0%) | 0 (0.0%) |
| Finance & Insurance | 0 (0.0%) | 35 (100.0%) |
| Real Estate, Rental & Leasing | 10 (29.4%) | 24 (70.6%) |
| Professional & Scientific | 0 (0.0%) | 12 (100.0%) |
| Enterprise Management | 0 (0.0%) | 0 (0.0%) |
| Administrative & Support | 97 (100.0%) | 0 (0.0%) |
| Educational Services | 91 (60.3%) | 60 (39.7%) |
| Health Care & Social Assistance | 0 (0.0%) | 449 (100.0%) |
| Arts, Entertainment & Recreation | 55 (44.7%) | 68 (55.3%) |
| Accommodation & Food Services | 14 (7.2%) | 181 (92.8%) |
| Public Administration | 23 (9.4%) | 221 (90.6%) |
| Total | 882 (40.3%) | 1,307 (59.7%) |
Education in Golden Valley
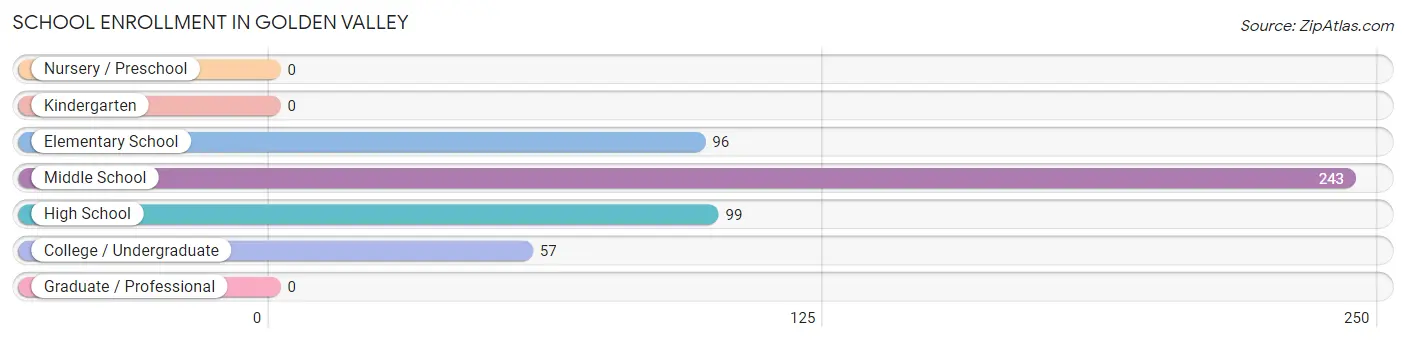
School Enrollment in Golden Valley
The most common levels of schooling among the 495 students in Golden Valley are middle school (243 | 49.1%), high school (99 | 20.0%), and elementary school (96 | 19.4%).
| School Level | # Students | % Students |
| Nursery / Preschool | 0 | 0.0% |
| Kindergarten | 0 | 0.0% |
| Elementary School | 96 | 19.4% |
| Middle School | 243 | 49.1% |
| High School | 99 | 20.0% |
| College / Undergraduate | 57 | 11.5% |
| Graduate / Professional | 0 | 0.0% |
| Total | 495 | 100.0% |
School Enrollment by Age by Funding Source in Golden Valley
Out of a total of 495 students who are enrolled in schools in Golden Valley, 71 (14.3%) attend a private institution, while the remaining 424 (85.7%) are enrolled in public schools. The age group of 20 to 24 year olds has the highest likelihood of being enrolled in private schools, with 20 (35.1% in the age bracket) enrolled. Conversely, the age group of 5 to 9 year old has the lowest likelihood of being enrolled in a private school, with 96 (100.0% in the age bracket) attending a public institution.
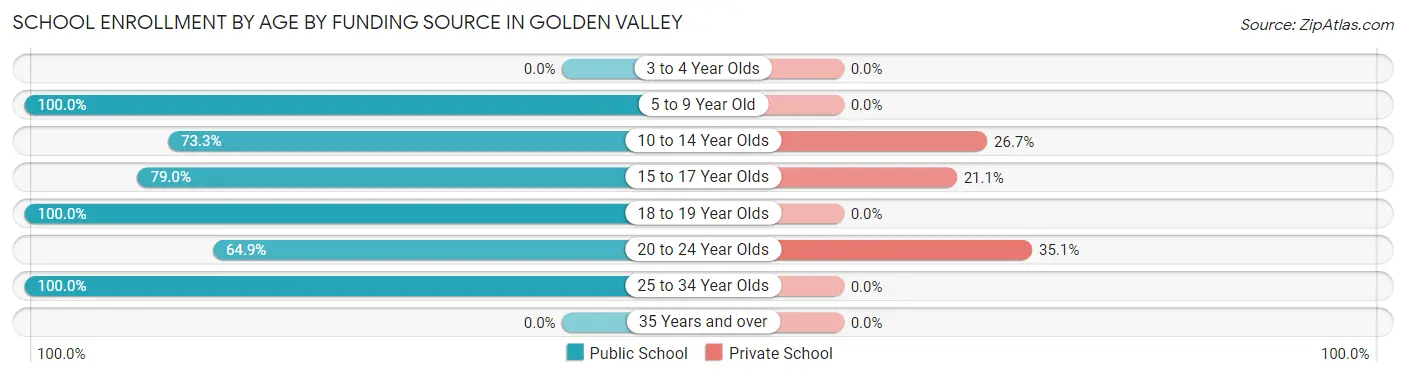
| Age Bracket | Public School | Private School |
| 3 to 4 Year Olds | 0 (0.0%) | 0 (0.0%) |
| 5 to 9 Year Old | 96 (100.0%) | 0 (0.0%) |
| 10 to 14 Year Olds | 96 (73.3%) | 35 (26.7%) |
| 15 to 17 Year Olds | 60 (78.9%) | 16 (21.0%) |
| 18 to 19 Year Olds | 26 (100.0%) | 0 (0.0%) |
| 20 to 24 Year Olds | 37 (64.9%) | 20 (35.1%) |
| 25 to 34 Year Olds | 109 (100.0%) | 0 (0.0%) |
| 35 Years and over | 0 (0.0%) | 0 (0.0%) |
| Total | 424 (85.7%) | 71 (14.3%) |
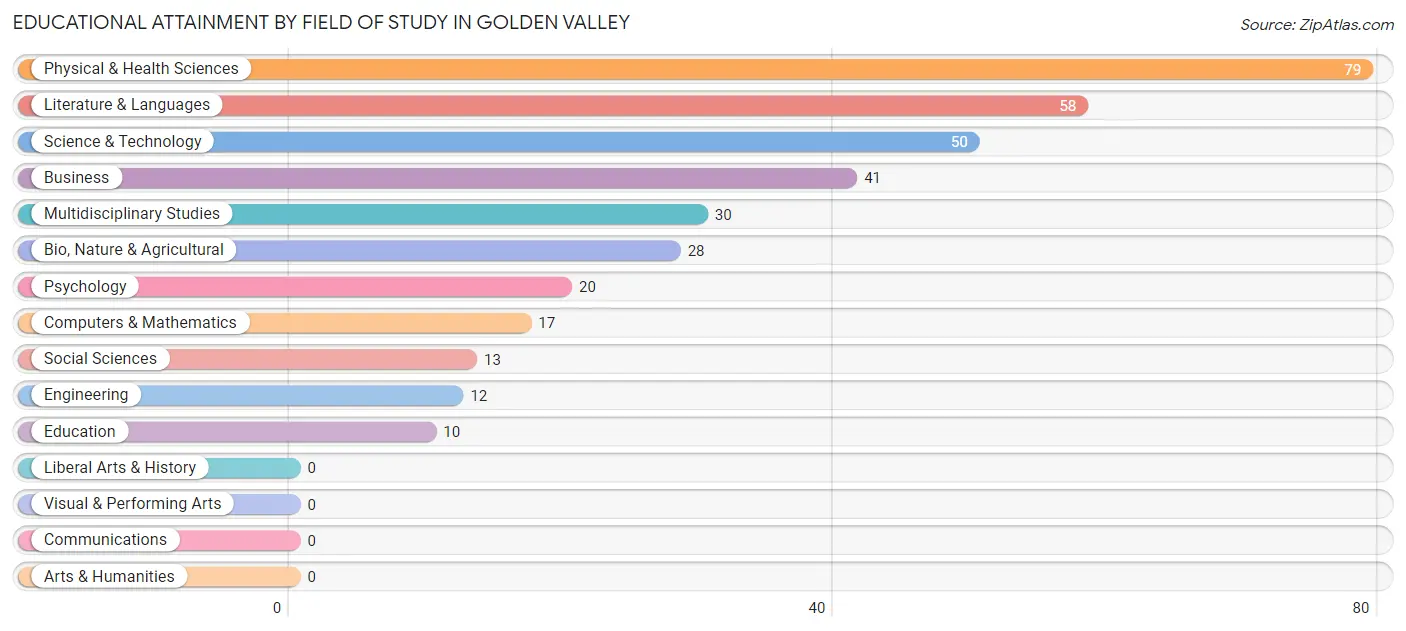
Educational Attainment by Field of Study in Golden Valley
Physical & health sciences (79 | 22.1%), literature & languages (58 | 16.2%), science & technology (50 | 14.0%), business (41 | 11.5%), and multidisciplinary studies (30 | 8.4%) are the most common fields of study among 358 individuals in Golden Valley who have obtained a bachelor's degree or higher.
| Field of Study | # Graduates | % Graduates |
| Computers & Mathematics | 17 | 4.8% |
| Bio, Nature & Agricultural | 28 | 7.8% |
| Physical & Health Sciences | 79 | 22.1% |
| Psychology | 20 | 5.6% |
| Social Sciences | 13 | 3.6% |
| Engineering | 12 | 3.4% |
| Multidisciplinary Studies | 30 | 8.4% |
| Science & Technology | 50 | 14.0% |
| Business | 41 | 11.5% |
| Education | 10 | 2.8% |
| Literature & Languages | 58 | 16.2% |
| Liberal Arts & History | 0 | 0.0% |
| Visual & Performing Arts | 0 | 0.0% |
| Communications | 0 | 0.0% |
| Arts & Humanities | 0 | 0.0% |
| Total | 358 | 100.0% |
Transportation & Commute in Golden Valley
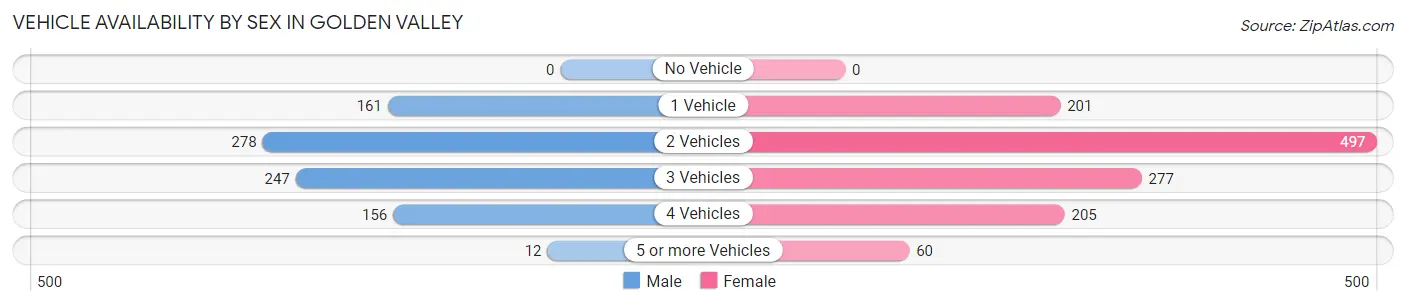
Vehicle Availability by Sex in Golden Valley
The most prevalent vehicle ownership categories in Golden Valley are males with 2 vehicles (278, accounting for 32.6%) and females with 2 vehicles (497, making up 22.4%).
| Vehicles Available | Male | Female |
| No Vehicle | 0 (0.0%) | 0 (0.0%) |
| 1 Vehicle | 161 (18.9%) | 201 (16.2%) |
| 2 Vehicles | 278 (32.6%) | 497 (40.1%) |
| 3 Vehicles | 247 (28.9%) | 277 (22.3%) |
| 4 Vehicles | 156 (18.3%) | 205 (16.5%) |
| 5 or more Vehicles | 12 (1.4%) | 60 (4.8%) |
| Total | 854 (100.0%) | 1,240 (100.0%) |
Commute Time in Golden Valley
The most frequently occuring commute durations in Golden Valley are 20 to 24 minutes (425 commuters, 22.3%), 10 to 14 minutes (284 commuters, 14.9%), and 25 to 29 minutes (227 commuters, 11.9%).
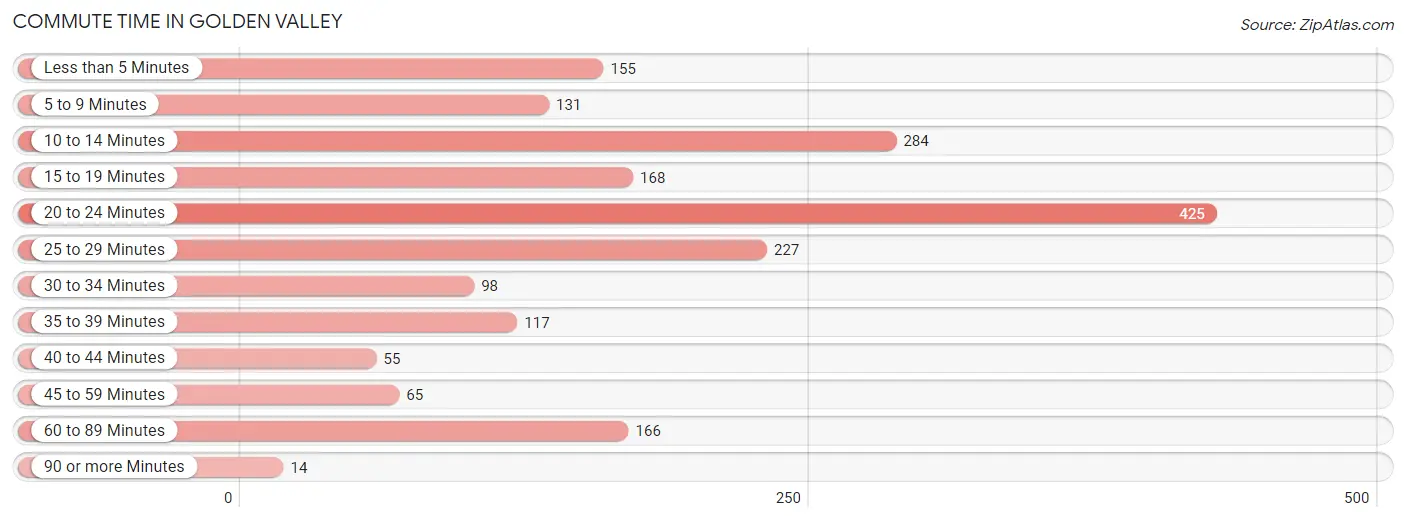
| Commute Time | # Commuters | % Commuters |
| Less than 5 Minutes | 155 | 8.1% |
| 5 to 9 Minutes | 131 | 6.9% |
| 10 to 14 Minutes | 284 | 14.9% |
| 15 to 19 Minutes | 168 | 8.8% |
| 20 to 24 Minutes | 425 | 22.3% |
| 25 to 29 Minutes | 227 | 11.9% |
| 30 to 34 Minutes | 98 | 5.1% |
| 35 to 39 Minutes | 117 | 6.1% |
| 40 to 44 Minutes | 55 | 2.9% |
| 45 to 59 Minutes | 65 | 3.4% |
| 60 to 89 Minutes | 166 | 8.7% |
| 90 or more Minutes | 14 | 0.7% |
Commute Time by Sex in Golden Valley
The most common commute times in Golden Valley are 20 to 24 minutes (176 commuters, 21.9%) for males and 10 to 14 minutes (262 commuters, 23.8%) for females.
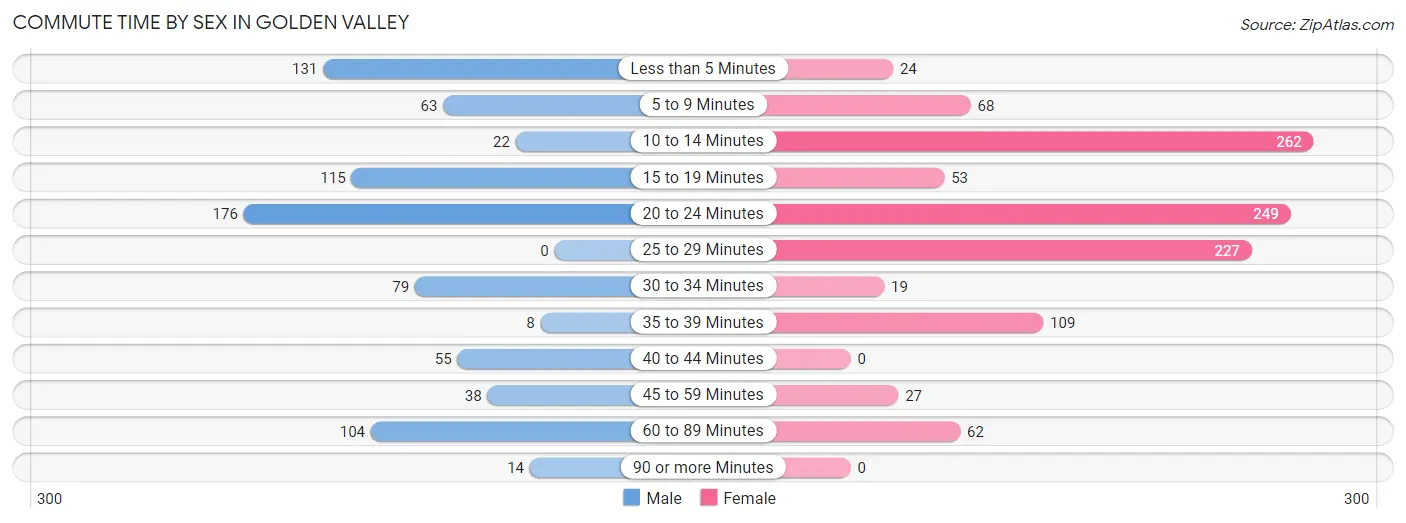
| Commute Time | Male | Female |
| Less than 5 Minutes | 131 (16.3%) | 24 (2.2%) |
| 5 to 9 Minutes | 63 (7.8%) | 68 (6.2%) |
| 10 to 14 Minutes | 22 (2.7%) | 262 (23.8%) |
| 15 to 19 Minutes | 115 (14.3%) | 53 (4.8%) |
| 20 to 24 Minutes | 176 (21.9%) | 249 (22.6%) |
| 25 to 29 Minutes | 0 (0.0%) | 227 (20.6%) |
| 30 to 34 Minutes | 79 (9.8%) | 19 (1.7%) |
| 35 to 39 Minutes | 8 (1.0%) | 109 (9.9%) |
| 40 to 44 Minutes | 55 (6.8%) | 0 (0.0%) |
| 45 to 59 Minutes | 38 (4.7%) | 27 (2.5%) |
| 60 to 89 Minutes | 104 (12.9%) | 62 (5.6%) |
| 90 or more Minutes | 14 (1.7%) | 0 (0.0%) |
Time of Departure to Work by Sex in Golden Valley
The most frequent times of departure to work in Golden Valley are 12:00 AM to 4:59 AM (173, 21.5%) for males and 4:00 PM to 11:59 PM (212, 19.3%) for females.
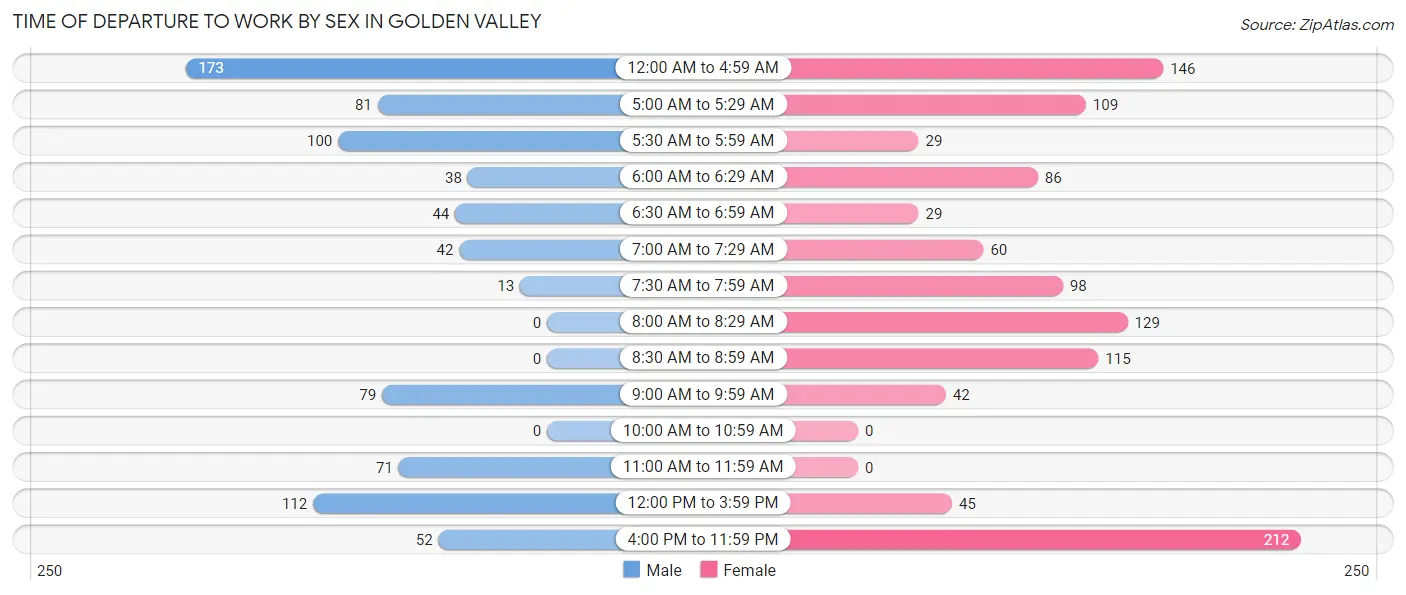
| Time of Departure | Male | Female |
| 12:00 AM to 4:59 AM | 173 (21.5%) | 146 (13.3%) |
| 5:00 AM to 5:29 AM | 81 (10.1%) | 109 (9.9%) |
| 5:30 AM to 5:59 AM | 100 (12.4%) | 29 (2.6%) |
| 6:00 AM to 6:29 AM | 38 (4.7%) | 86 (7.8%) |
| 6:30 AM to 6:59 AM | 44 (5.5%) | 29 (2.6%) |
| 7:00 AM to 7:29 AM | 42 (5.2%) | 60 (5.4%) |
| 7:30 AM to 7:59 AM | 13 (1.6%) | 98 (8.9%) |
| 8:00 AM to 8:29 AM | 0 (0.0%) | 129 (11.7%) |
| 8:30 AM to 8:59 AM | 0 (0.0%) | 115 (10.4%) |
| 9:00 AM to 9:59 AM | 79 (9.8%) | 42 (3.8%) |
| 10:00 AM to 10:59 AM | 0 (0.0%) | 0 (0.0%) |
| 11:00 AM to 11:59 AM | 71 (8.8%) | 0 (0.0%) |
| 12:00 PM to 3:59 PM | 112 (13.9%) | 45 (4.1%) |
| 4:00 PM to 11:59 PM | 52 (6.5%) | 212 (19.3%) |
| Total | 805 (100.0%) | 1,100 (100.0%) |
Housing Occupancy in Golden Valley
Occupancy by Ownership in Golden Valley
Of the total 3,861 dwellings in Golden Valley, owner-occupied units account for 3,581 (92.7%), while renter-occupied units make up 280 (7.2%).
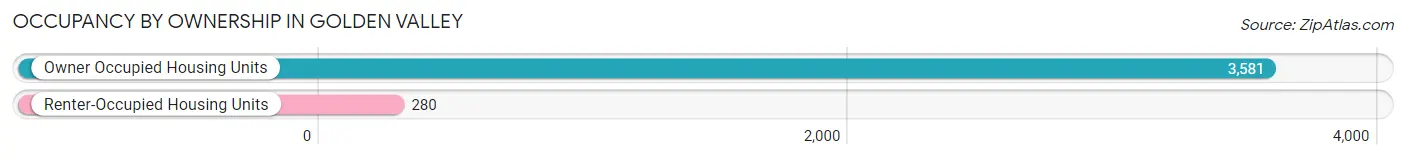
| Occupancy | # Housing Units | % Housing Units |
| Owner Occupied Housing Units | 3,581 | 92.7% |
| Renter-Occupied Housing Units | 280 | 7.2% |
| Total Occupied Housing Units | 3,861 | 100.0% |
Occupancy by Household Size in Golden Valley
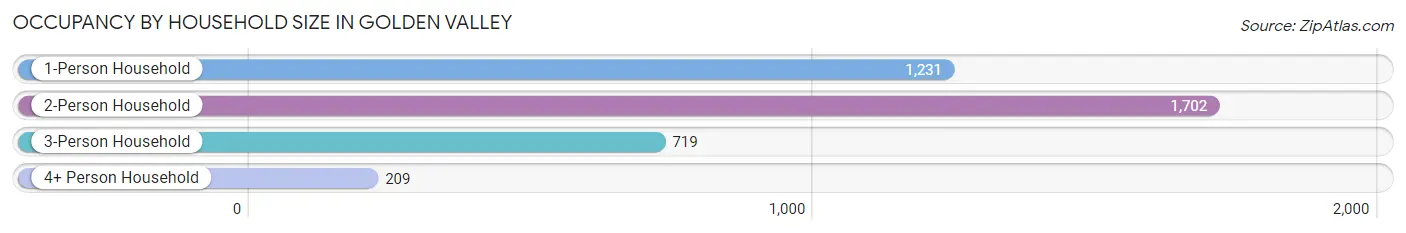
| Household Size | # Housing Units | % Housing Units |
| 1-Person Household | 1,231 | 31.9% |
| 2-Person Household | 1,702 | 44.1% |
| 3-Person Household | 719 | 18.6% |
| 4+ Person Household | 209 | 5.4% |
| Total Housing Units | 3,861 | 100.0% |
Occupancy by Ownership by Household Size in Golden Valley
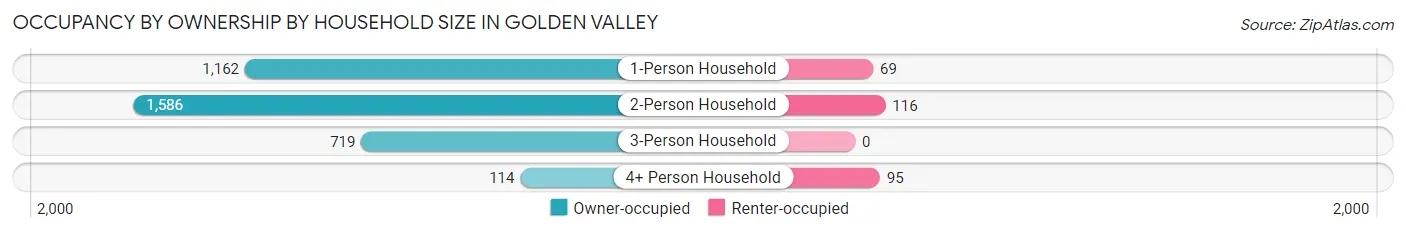
| Household Size | Owner-occupied | Renter-occupied |
| 1-Person Household | 1,162 (94.4%) | 69 (5.6%) |
| 2-Person Household | 1,586 (93.2%) | 116 (6.8%) |
| 3-Person Household | 719 (100.0%) | 0 (0.0%) |
| 4+ Person Household | 114 (54.5%) | 95 (45.5%) |
| Total Housing Units | 3,581 (92.7%) | 280 (7.2%) |
Occupancy by Educational Attainment in Golden Valley
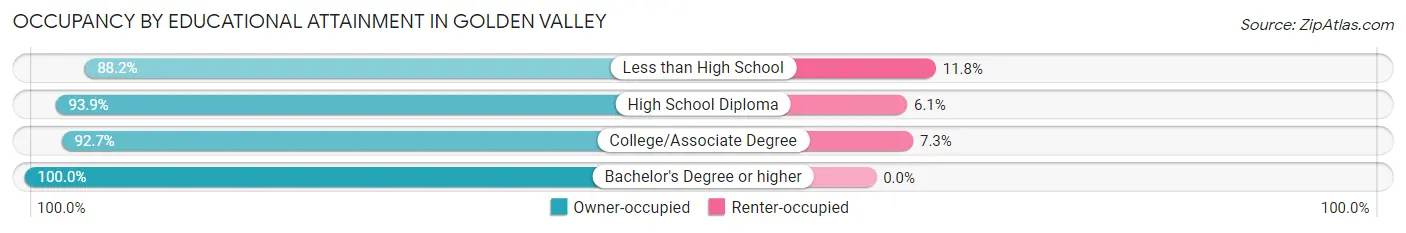
| Household Size | Owner-occupied | Renter-occupied |
| Less than High School | 634 (88.2%) | 85 (11.8%) |
| High School Diploma | 1,212 (93.9%) | 79 (6.1%) |
| College/Associate Degree | 1,471 (92.7%) | 116 (7.3%) |
| Bachelor's Degree or higher | 264 (100.0%) | 0 (0.0%) |
Occupancy by Age of Householder in Golden Valley
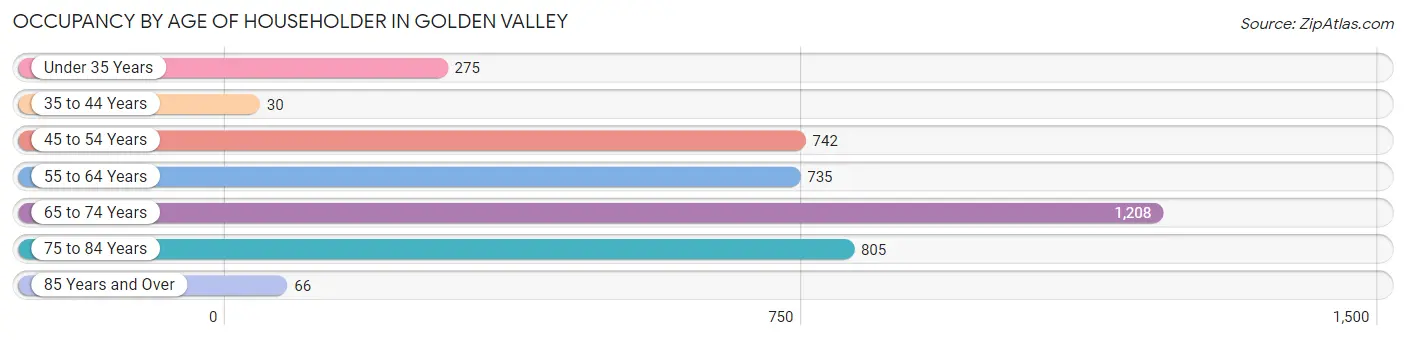
| Age Bracket | # Households | % Households |
| Under 35 Years | 275 | 7.1% |
| 35 to 44 Years | 30 | 0.8% |
| 45 to 54 Years | 742 | 19.2% |
| 55 to 64 Years | 735 | 19.0% |
| 65 to 74 Years | 1,208 | 31.3% |
| 75 to 84 Years | 805 | 20.8% |
| 85 Years and Over | 66 | 1.7% |
| Total | 3,861 | 100.0% |
Housing Finances in Golden Valley
Median Income by Occupancy in Golden Valley
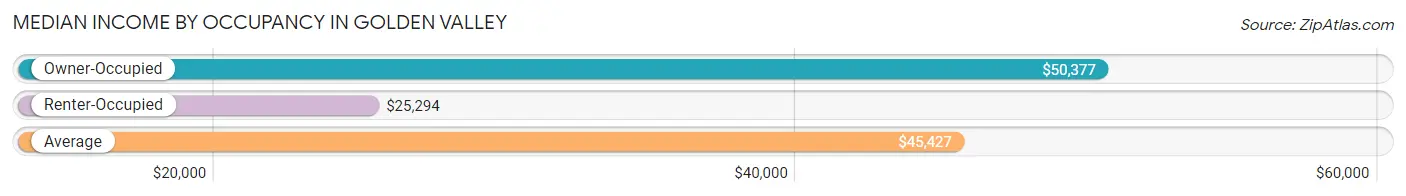
| Occupancy Type | # Households | Median Income |
| Owner-Occupied | 3,581 (92.7%) | $50,377 |
| Renter-Occupied | 280 (7.2%) | $25,294 |
| Average | 3,861 (100.0%) | $45,427 |
Occupancy by Householder Income Bracket in Golden Valley
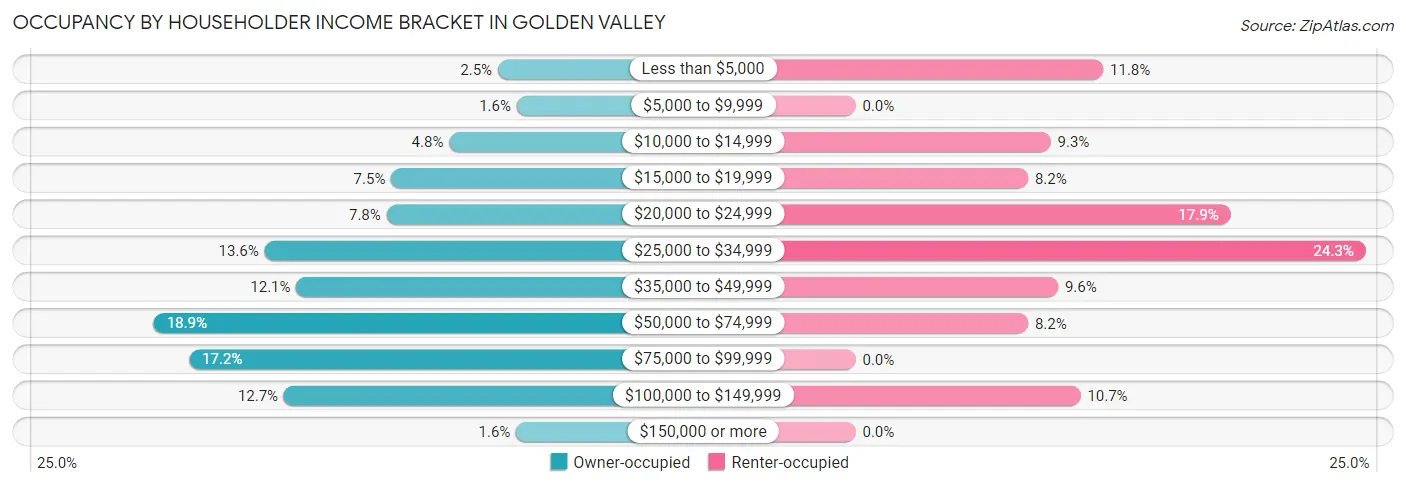
| Income Bracket | Owner-occupied | Renter-occupied |
| Less than $5,000 | 88 (2.5%) | 33 (11.8%) |
| $5,000 to $9,999 | 56 (1.6%) | 0 (0.0%) |
| $10,000 to $14,999 | 171 (4.8%) | 26 (9.3%) |
| $15,000 to $19,999 | 270 (7.5%) | 23 (8.2%) |
| $20,000 to $24,999 | 278 (7.8%) | 50 (17.9%) |
| $25,000 to $34,999 | 486 (13.6%) | 68 (24.3%) |
| $35,000 to $49,999 | 432 (12.1%) | 27 (9.6%) |
| $50,000 to $74,999 | 675 (18.9%) | 23 (8.2%) |
| $75,000 to $99,999 | 615 (17.2%) | 0 (0.0%) |
| $100,000 to $149,999 | 453 (12.7%) | 30 (10.7%) |
| $150,000 or more | 57 (1.6%) | 0 (0.0%) |
| Total | 3,581 (100.0%) | 280 (100.0%) |
Monthly Housing Cost Tiers in Golden Valley
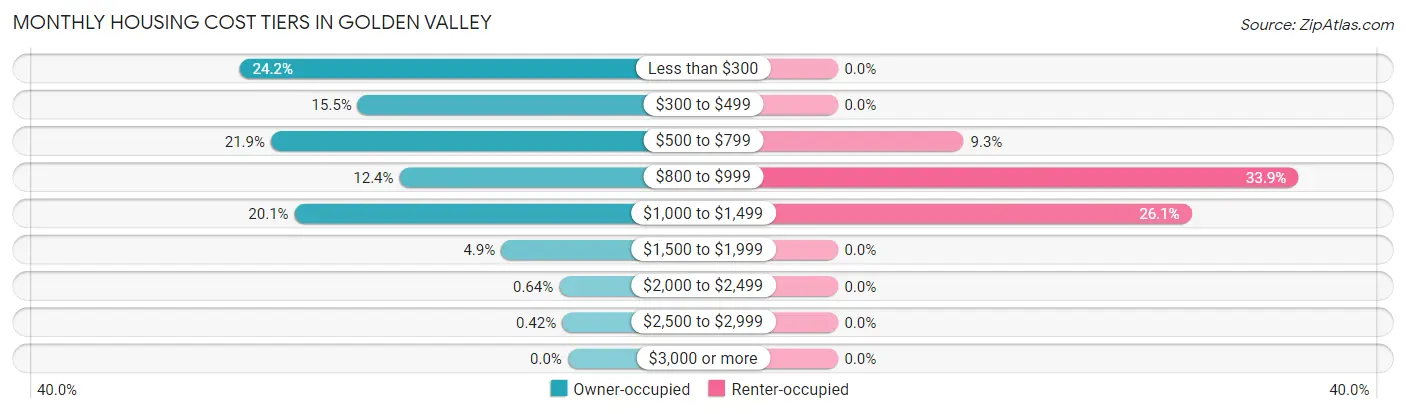
| Monthly Cost | Owner-occupied | Renter-occupied |
| Less than $300 | 865 (24.2%) | 0 (0.0%) |
| $300 to $499 | 554 (15.5%) | 0 (0.0%) |
| $500 to $799 | 783 (21.9%) | 26 (9.3%) |
| $800 to $999 | 444 (12.4%) | 95 (33.9%) |
| $1,000 to $1,499 | 721 (20.1%) | 73 (26.1%) |
| $1,500 to $1,999 | 176 (4.9%) | 0 (0.0%) |
| $2,000 to $2,499 | 23 (0.6%) | 0 (0.0%) |
| $2,500 to $2,999 | 15 (0.4%) | 0 (0.0%) |
| $3,000 or more | 0 (0.0%) | 0 (0.0%) |
| Total | 3,581 (100.0%) | 280 (100.0%) |
Physical Housing Characteristics in Golden Valley
Housing Structures in Golden Valley
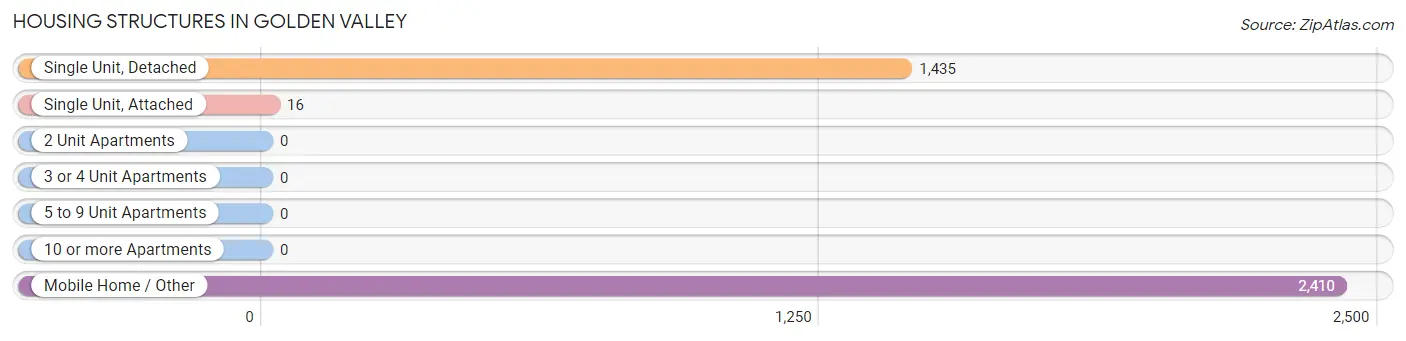
| Structure Type | # Housing Units | % Housing Units |
| Single Unit, Detached | 1,435 | 37.2% |
| Single Unit, Attached | 16 | 0.4% |
| 2 Unit Apartments | 0 | 0.0% |
| 3 or 4 Unit Apartments | 0 | 0.0% |
| 5 to 9 Unit Apartments | 0 | 0.0% |
| 10 or more Apartments | 0 | 0.0% |
| Mobile Home / Other | 2,410 | 62.4% |
| Total | 3,861 | 100.0% |
Housing Structures by Occupancy in Golden Valley
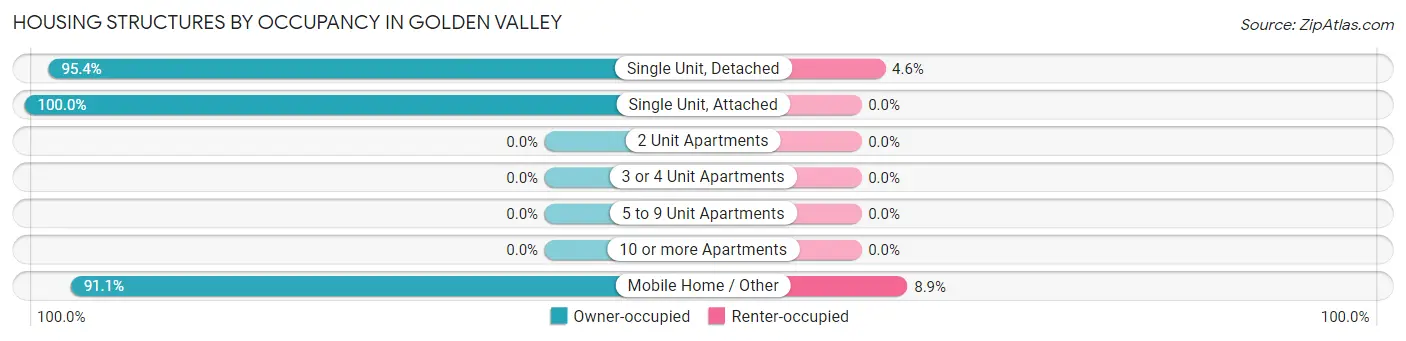
| Structure Type | Owner-occupied | Renter-occupied |
| Single Unit, Detached | 1,369 (95.4%) | 66 (4.6%) |
| Single Unit, Attached | 16 (100.0%) | 0 (0.0%) |
| 2 Unit Apartments | 0 (0.0%) | 0 (0.0%) |
| 3 or 4 Unit Apartments | 0 (0.0%) | 0 (0.0%) |
| 5 to 9 Unit Apartments | 0 (0.0%) | 0 (0.0%) |
| 10 or more Apartments | 0 (0.0%) | 0 (0.0%) |
| Mobile Home / Other | 2,196 (91.1%) | 214 (8.9%) |
| Total | 3,581 (92.7%) | 280 (7.2%) |
Housing Structures by Number of Rooms in Golden Valley
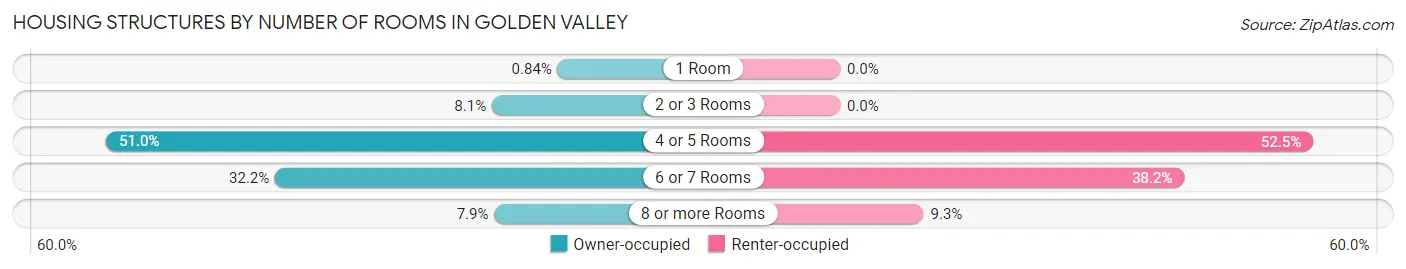
| Number of Rooms | Owner-occupied | Renter-occupied |
| 1 Room | 30 (0.8%) | 0 (0.0%) |
| 2 or 3 Rooms | 291 (8.1%) | 0 (0.0%) |
| 4 or 5 Rooms | 1,825 (51.0%) | 147 (52.5%) |
| 6 or 7 Rooms | 1,153 (32.2%) | 107 (38.2%) |
| 8 or more Rooms | 282 (7.9%) | 26 (9.3%) |
| Total | 3,581 (100.0%) | 280 (100.0%) |
Housing Structure by Heating Type in Golden Valley
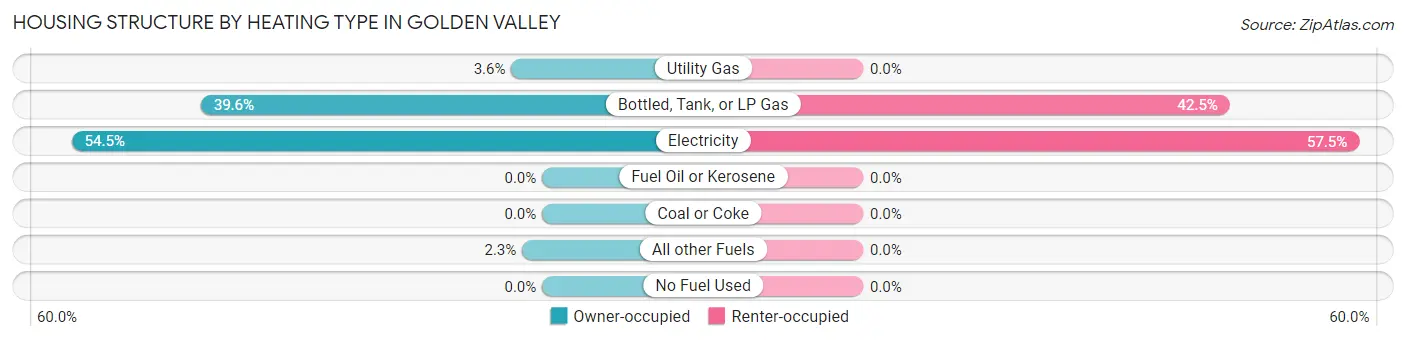
| Heating Type | Owner-occupied | Renter-occupied |
| Utility Gas | 128 (3.6%) | 0 (0.0%) |
| Bottled, Tank, or LP Gas | 1,417 (39.6%) | 119 (42.5%) |
| Electricity | 1,953 (54.5%) | 161 (57.5%) |
| Fuel Oil or Kerosene | 0 (0.0%) | 0 (0.0%) |
| Coal or Coke | 0 (0.0%) | 0 (0.0%) |
| All other Fuels | 83 (2.3%) | 0 (0.0%) |
| No Fuel Used | 0 (0.0%) | 0 (0.0%) |
| Total | 3,581 (100.0%) | 280 (100.0%) |
Household Vehicle Usage in Golden Valley
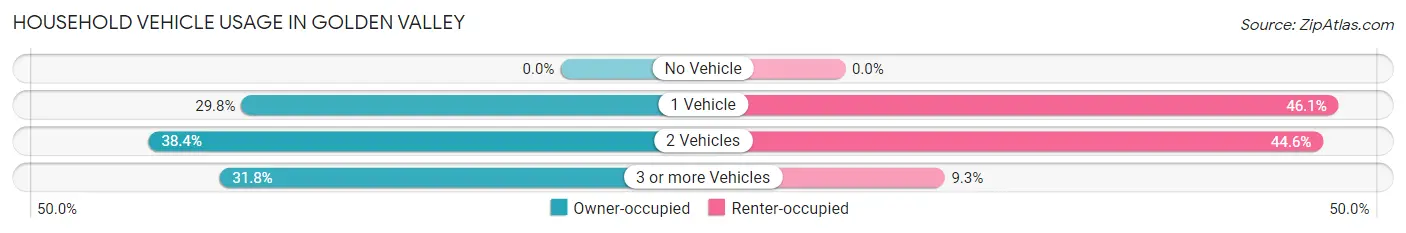
| Vehicles per Household | Owner-occupied | Renter-occupied |
| No Vehicle | 0 (0.0%) | 0 (0.0%) |
| 1 Vehicle | 1,066 (29.8%) | 129 (46.1%) |
| 2 Vehicles | 1,376 (38.4%) | 125 (44.6%) |
| 3 or more Vehicles | 1,139 (31.8%) | 26 (9.3%) |
| Total | 3,581 (100.0%) | 280 (100.0%) |
Real Estate & Mortgages in Golden Valley
Real Estate and Mortgage Overview in Golden Valley
| Characteristic | Without Mortgage | With Mortgage |
| Housing Units | 1,738 | 1,843 |
| Median Property Value | $101,500 | $116,000 |
| Median Household Income | $41,610 | $28 |
| Monthly Housing Costs | $301 | $0 |
| Real Estate Taxes | $639 | $150 |
Property Value by Mortgage Status in Golden Valley
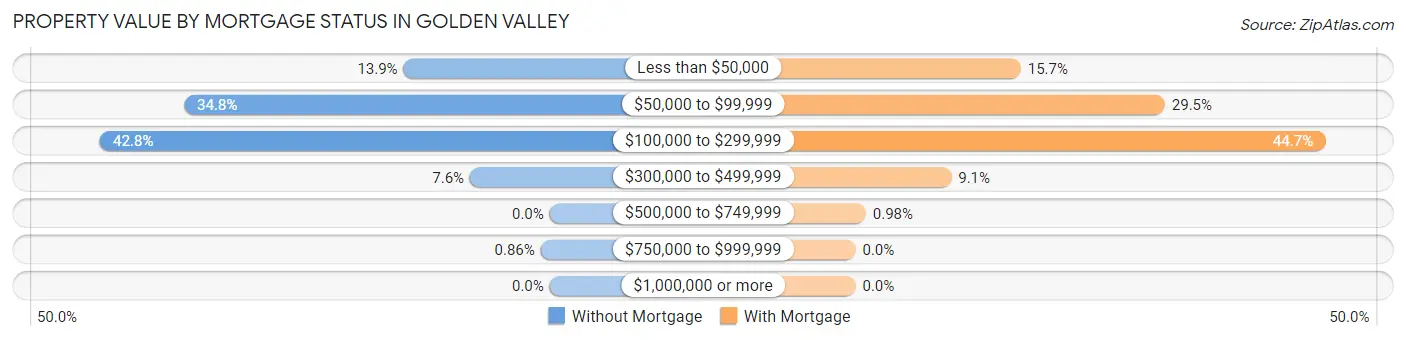
| Property Value | Without Mortgage | With Mortgage |
| Less than $50,000 | 242 (13.9%) | 290 (15.7%) |
| $50,000 to $99,999 | 605 (34.8%) | 543 (29.5%) |
| $100,000 to $299,999 | 744 (42.8%) | 824 (44.7%) |
| $300,000 to $499,999 | 132 (7.6%) | 168 (9.1%) |
| $500,000 to $749,999 | 0 (0.0%) | 18 (1.0%) |
| $750,000 to $999,999 | 15 (0.9%) | 0 (0.0%) |
| $1,000,000 or more | 0 (0.0%) | 0 (0.0%) |
| Total | 1,738 (100.0%) | 1,843 (100.0%) |
Household Income by Mortgage Status in Golden Valley
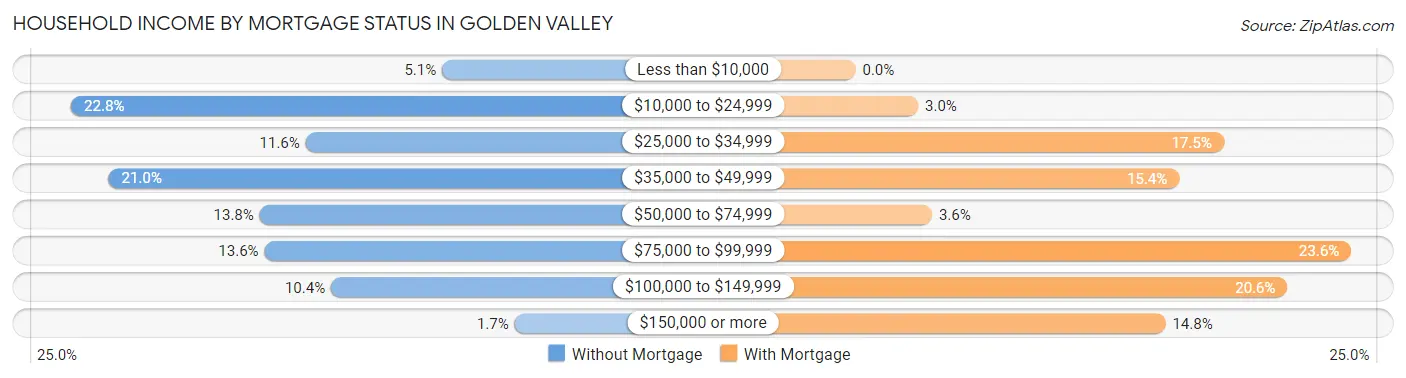
| Household Income | Without Mortgage | With Mortgage |
| Less than $10,000 | 89 (5.1%) | 0 (0.0%) |
| $10,000 to $24,999 | 396 (22.8%) | 55 (3.0%) |
| $25,000 to $34,999 | 202 (11.6%) | 323 (17.5%) |
| $35,000 to $49,999 | 365 (21.0%) | 284 (15.4%) |
| $50,000 to $74,999 | 240 (13.8%) | 67 (3.6%) |
| $75,000 to $99,999 | 236 (13.6%) | 435 (23.6%) |
| $100,000 to $149,999 | 181 (10.4%) | 379 (20.6%) |
| $150,000 or more | 29 (1.7%) | 272 (14.8%) |
| Total | 1,738 (100.0%) | 1,843 (100.0%) |
Property Value to Household Income Ratio in Golden Valley
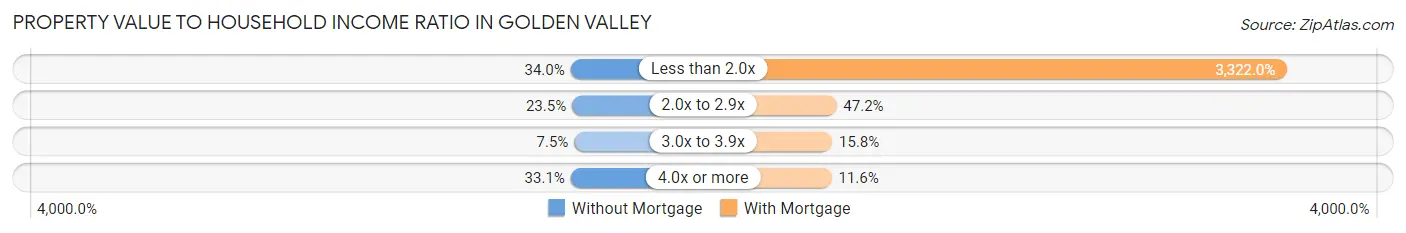
| Value-to-Income Ratio | Without Mortgage | With Mortgage |
| Less than 2.0x | 590 (34.0%) | 61,225 (3,322.0%) |
| 2.0x to 2.9x | 409 (23.5%) | 870 (47.2%) |
| 3.0x to 3.9x | 131 (7.5%) | 292 (15.8%) |
| 4.0x or more | 576 (33.1%) | 213 (11.6%) |
| Total | 1,738 (100.0%) | 1,843 (100.0%) |
Real Estate Taxes by Mortgage Status in Golden Valley
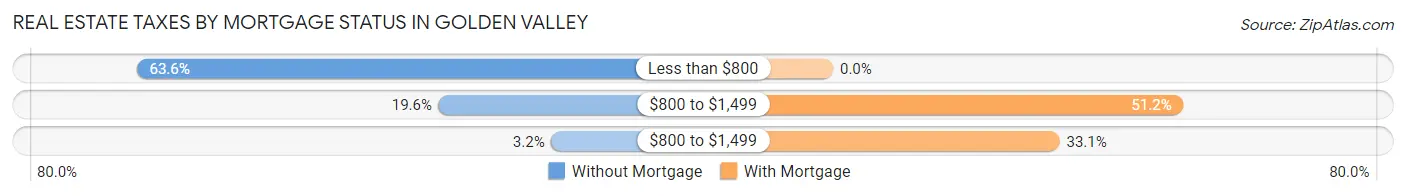
| Property Taxes | Without Mortgage | With Mortgage |
| Less than $800 | 1,106 (63.6%) | 0 (0.0%) |
| $800 to $1,499 | 341 (19.6%) | 944 (51.2%) |
| $800 to $1,499 | 55 (3.2%) | 610 (33.1%) |
| Total | 1,738 (100.0%) | 1,843 (100.0%) |
Health & Disability in Golden Valley
Health Insurance Coverage by Age in Golden Valley
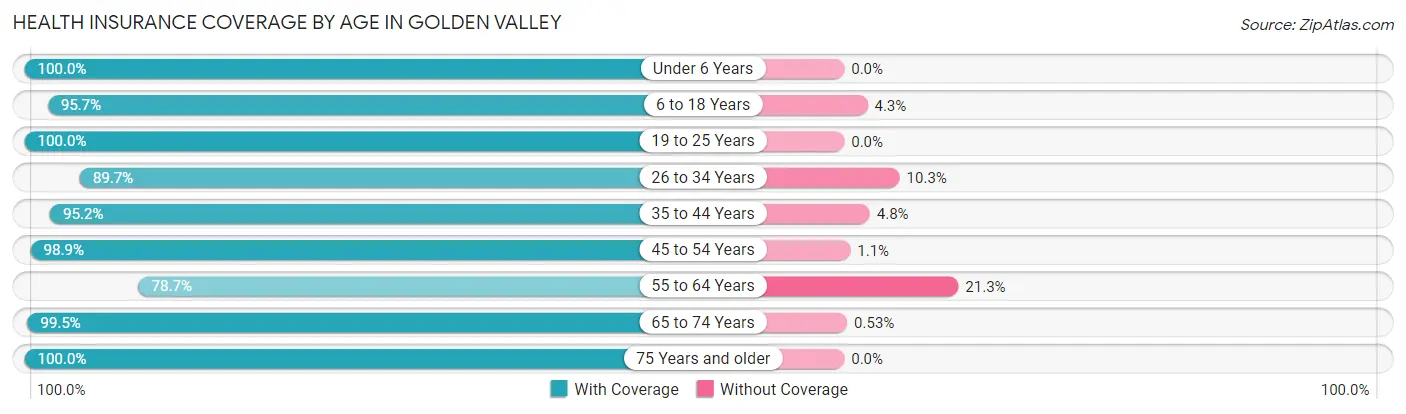
| Age Bracket | With Coverage | Without Coverage |
| Under 6 Years | 151 (100.0%) | 0 (0.0%) |
| 6 to 18 Years | 442 (95.7%) | 20 (4.3%) |
| 19 to 25 Years | 183 (100.0%) | 0 (0.0%) |
| 26 to 34 Years | 452 (89.7%) | 52 (10.3%) |
| 35 to 44 Years | 120 (95.2%) | 6 (4.8%) |
| 45 to 54 Years | 1,307 (98.9%) | 15 (1.1%) |
| 55 to 64 Years | 1,339 (78.7%) | 362 (21.3%) |
| 65 to 74 Years | 1,874 (99.5%) | 10 (0.5%) |
| 75 Years and older | 1,567 (100.0%) | 0 (0.0%) |
| Total | 7,435 (94.1%) | 465 (5.9%) |
Health Insurance Coverage by Citizenship Status in Golden Valley
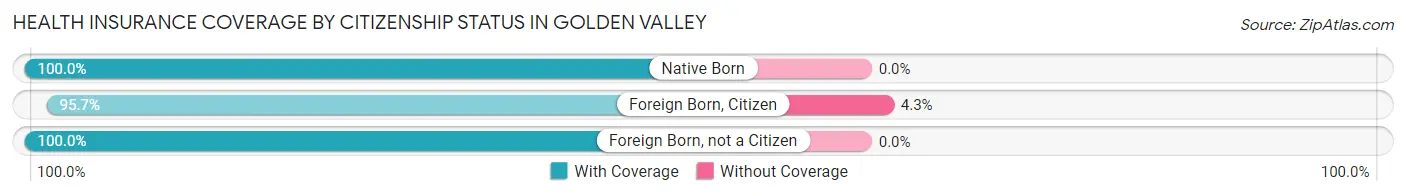
| Citizenship Status | With Coverage | Without Coverage |
| Native Born | 151 (100.0%) | 0 (0.0%) |
| Foreign Born, Citizen | 442 (95.7%) | 20 (4.3%) |
| Foreign Born, not a Citizen | 183 (100.0%) | 0 (0.0%) |
Health Insurance Coverage by Household Income in Golden Valley
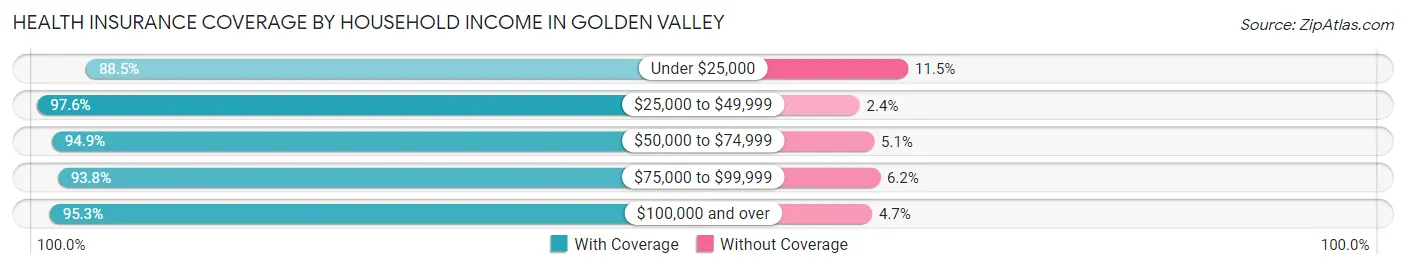
| Household Income | With Coverage | Without Coverage |
| Under $25,000 | 1,516 (88.5%) | 197 (11.5%) |
| $25,000 to $49,999 | 2,061 (97.6%) | 51 (2.4%) |
| $50,000 to $74,999 | 1,354 (94.9%) | 73 (5.1%) |
| $75,000 to $99,999 | 1,194 (93.8%) | 79 (6.2%) |
| $100,000 and over | 1,310 (95.3%) | 65 (4.7%) |
Public vs Private Health Insurance Coverage by Age in Golden Valley
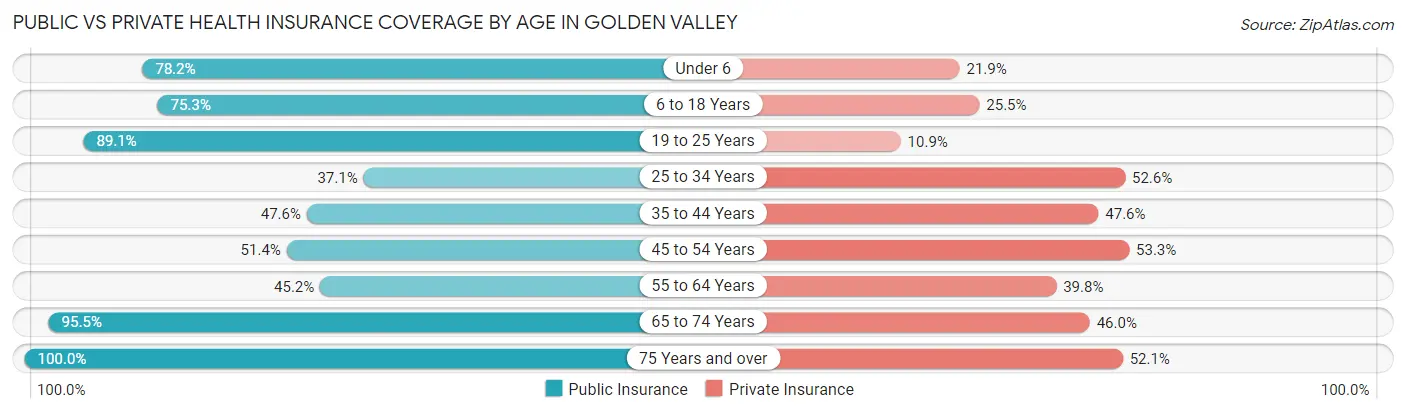
| Age Bracket | Public Insurance | Private Insurance |
| Under 6 | 118 (78.1%) | 33 (21.8%) |
| 6 to 18 Years | 348 (75.3%) | 118 (25.5%) |
| 19 to 25 Years | 163 (89.1%) | 20 (10.9%) |
| 25 to 34 Years | 187 (37.1%) | 265 (52.6%) |
| 35 to 44 Years | 60 (47.6%) | 60 (47.6%) |
| 45 to 54 Years | 679 (51.4%) | 705 (53.3%) |
| 55 to 64 Years | 768 (45.2%) | 677 (39.8%) |
| 65 to 74 Years | 1,800 (95.5%) | 867 (46.0%) |
| 75 Years and over | 1,567 (100.0%) | 817 (52.1%) |
| Total | 5,690 (72.0%) | 3,562 (45.1%) |
Disability Status by Sex by Age in Golden Valley
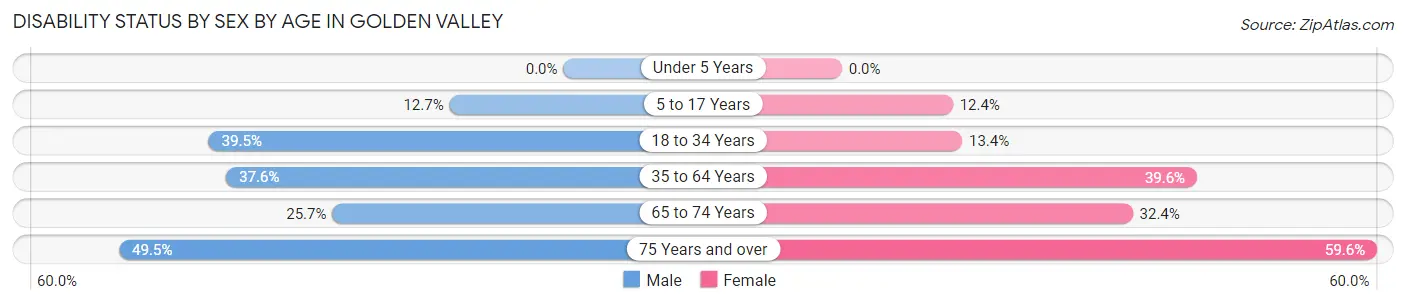
| Age Bracket | Male | Female |
| Under 5 Years | 0 (0.0%) | 0 (0.0%) |
| 5 to 17 Years | 26 (12.7%) | 20 (12.3%) |
| 18 to 34 Years | 126 (39.5%) | 62 (13.4%) |
| 35 to 64 Years | 595 (37.6%) | 619 (39.6%) |
| 65 to 74 Years | 248 (25.7%) | 298 (32.4%) |
| 75 Years and over | 474 (49.5%) | 363 (59.6%) |
Disability Class by Sex by Age in Golden Valley
Disability Class: Hearing Difficulty
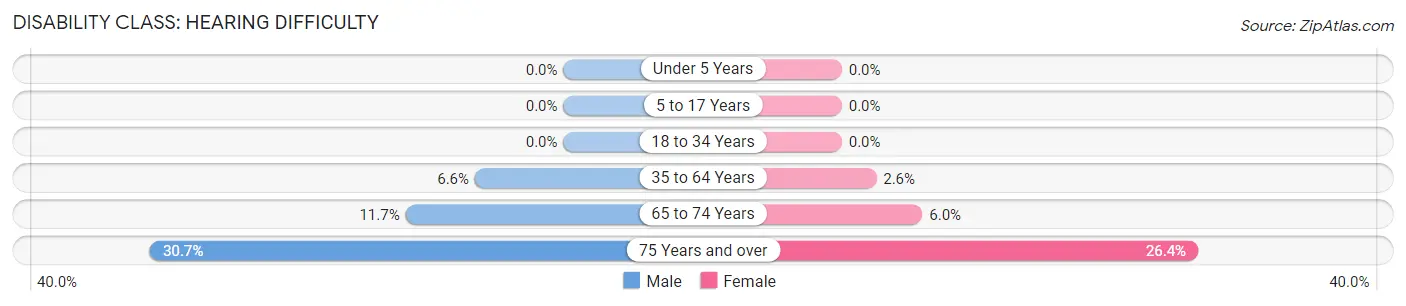
| Age Bracket | Male | Female |
| Under 5 Years | 0 (0.0%) | 0 (0.0%) |
| 5 to 17 Years | 0 (0.0%) | 0 (0.0%) |
| 18 to 34 Years | 0 (0.0%) | 0 (0.0%) |
| 35 to 64 Years | 104 (6.6%) | 40 (2.6%) |
| 65 to 74 Years | 113 (11.7%) | 55 (6.0%) |
| 75 Years and over | 294 (30.7%) | 161 (26.4%) |
Disability Class: Vision Difficulty
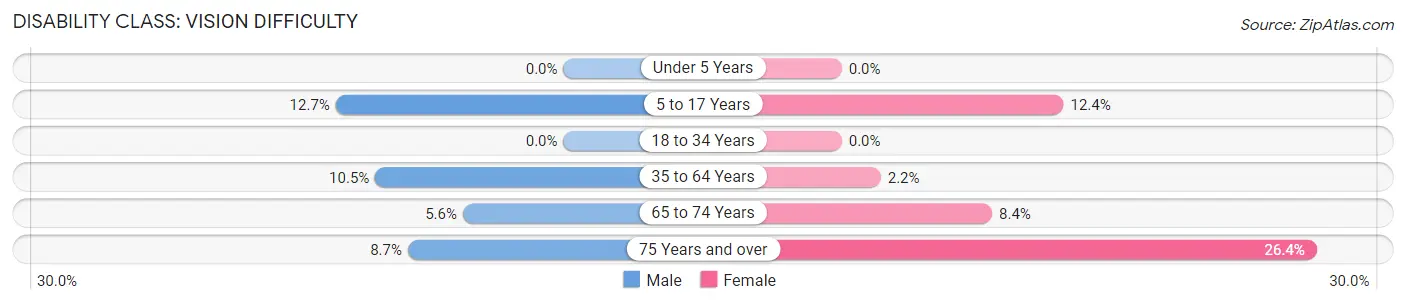
| Age Bracket | Male | Female |
| Under 5 Years | 0 (0.0%) | 0 (0.0%) |
| 5 to 17 Years | 26 (12.7%) | 20 (12.3%) |
| 18 to 34 Years | 0 (0.0%) | 0 (0.0%) |
| 35 to 64 Years | 166 (10.5%) | 34 (2.2%) |
| 65 to 74 Years | 54 (5.6%) | 77 (8.4%) |
| 75 Years and over | 83 (8.7%) | 161 (26.4%) |
Disability Class: Cognitive Difficulty
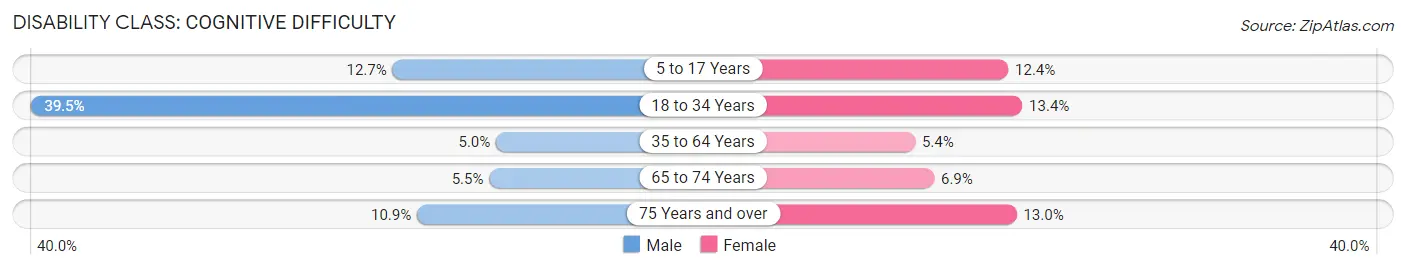
| Age Bracket | Male | Female |
| 5 to 17 Years | 26 (12.7%) | 20 (12.3%) |
| 18 to 34 Years | 126 (39.5%) | 62 (13.4%) |
| 35 to 64 Years | 79 (5.0%) | 85 (5.4%) |
| 65 to 74 Years | 53 (5.5%) | 63 (6.9%) |
| 75 Years and over | 104 (10.9%) | 79 (13.0%) |
Disability Class: Ambulatory Difficulty
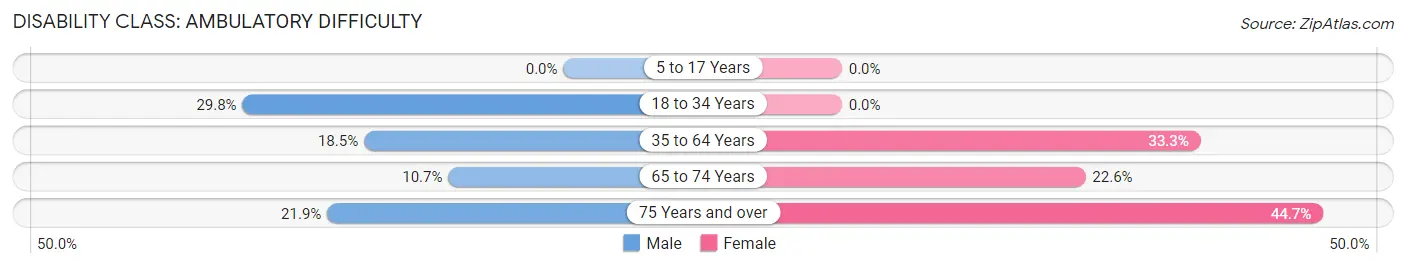
| Age Bracket | Male | Female |
| 5 to 17 Years | 0 (0.0%) | 0 (0.0%) |
| 18 to 34 Years | 95 (29.8%) | 0 (0.0%) |
| 35 to 64 Years | 293 (18.5%) | 521 (33.3%) |
| 65 to 74 Years | 103 (10.7%) | 208 (22.6%) |
| 75 Years and over | 210 (21.9%) | 272 (44.7%) |
Disability Class: Self-Care Difficulty
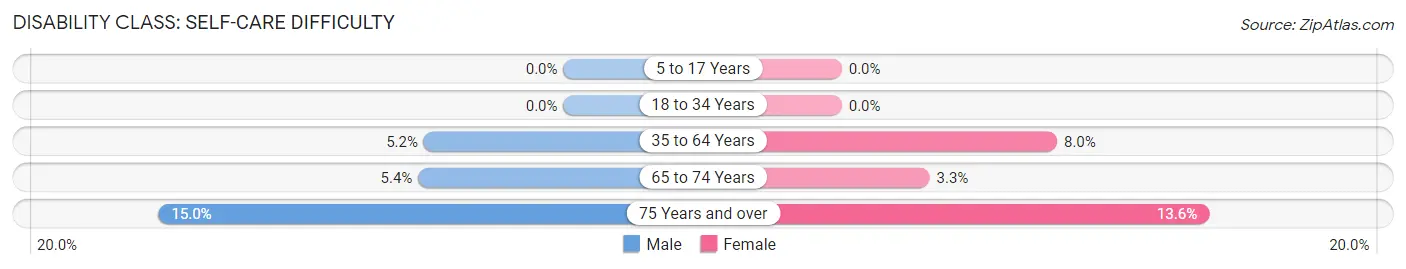
| Age Bracket | Male | Female |
| 5 to 17 Years | 0 (0.0%) | 0 (0.0%) |
| 18 to 34 Years | 0 (0.0%) | 0 (0.0%) |
| 35 to 64 Years | 82 (5.2%) | 125 (8.0%) |
| 65 to 74 Years | 52 (5.4%) | 30 (3.3%) |
| 75 Years and over | 144 (15.0%) | 83 (13.6%) |
Technology Access in Golden Valley
Computing Device Access in Golden Valley
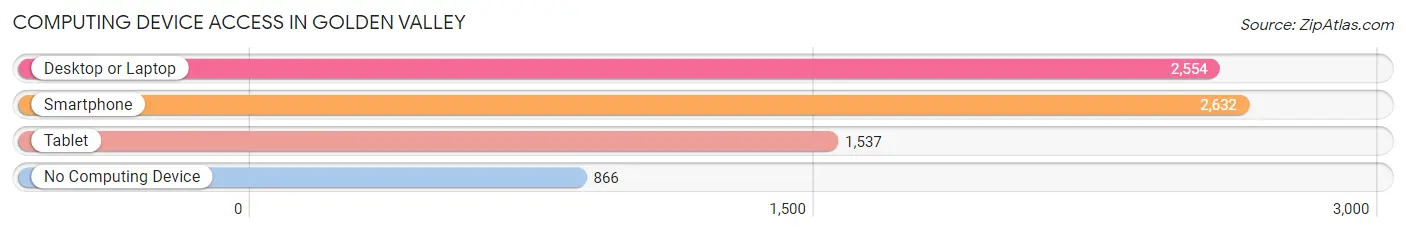
| Device Type | # Households | % Households |
| Desktop or Laptop | 2,554 | 66.1% |
| Smartphone | 2,632 | 68.2% |
| Tablet | 1,537 | 39.8% |
| No Computing Device | 866 | 22.4% |
| Total | 3,861 | 100.0% |
Internet Access in Golden Valley
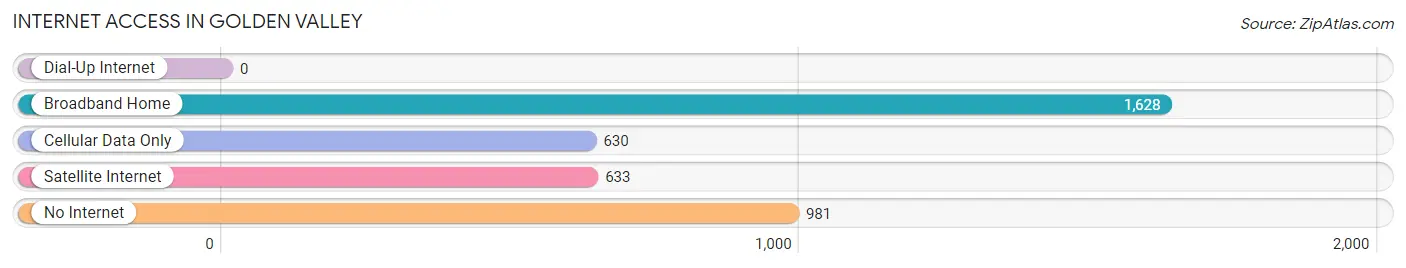
| Internet Type | # Households | % Households |
| Dial-Up Internet | 0 | 0.0% |
| Broadband Home | 1,628 | 42.2% |
| Cellular Data Only | 630 | 16.3% |
| Satellite Internet | 633 | 16.4% |
| No Internet | 981 | 25.4% |
| Total | 3,861 | 100.0% |
Golden Valley Summary
Geography
Golden Valley is a census-designated place (CDP) located in Mohave County, Arizona. It is situated in the northwestern part of the state, approximately 25 miles east of Kingman and about 100 miles southeast of Las Vegas, Nevada. The CDP has a total area of about 11.3 square miles, all of which is land. The terrain is mostly flat, with some rolling hills in the area. The elevation of the CDP is 3,845 feet above sea level.
The climate in Golden Valley is arid, with hot summers and mild winters. The average high temperature in July is 95°F, while the average low temperature in January is 33°F. The average annual precipitation is about 8.5 inches, with most of it falling in the summer months.
History
The area that is now Golden Valley was first settled in the late 1800s by miners and ranchers. The town was officially founded in 1912 and was named after the nearby Golden Valley Mine. The mine was a major producer of gold and silver, and the town quickly grew as a result.
In the early 1900s, the town was a major stop on the Santa Fe Railroad. The railroad brought in new settlers and businesses, and the town continued to grow. By the 1950s, the population had reached over 1,000 people.
In the late 20th century, the town began to decline as the mining industry declined. The population dropped to just over 500 people by the 2000 census.
Economy
The economy of Golden Valley is largely based on tourism and agriculture. The town is a popular destination for outdoor recreation, such as camping, fishing, and hunting. The nearby Grand Canyon National Park is also a major draw for tourists.
Agriculture is also an important part of the local economy. The area is known for its production of alfalfa, hay, and other crops. Livestock production is also important, with cattle and sheep being the main animals raised in the area.
Demographics
As of the 2010 census, the population of Golden Valley was 5,912. The racial makeup of the town was 94.3% White, 0.7% African American, 0.7% Native American, 0.3% Asian, 0.1% Pacific Islander, 2.2% from other races, and 1.9% from two or more races. Hispanic or Latino of any race were 6.2% of the population.
The median household income in Golden Valley was $37,917, and the median family income was $41,917. The per capita income was $17,917. About 15.3% of the population was below the poverty line.
Common Questions
What is Per Capita Income in Golden Valley?
Per Capita income in Golden Valley is $26,727.
What is the Median Family Income in Golden Valley?
Median Family Income in Golden Valley is $56,021.
What is the Median Household income in Golden Valley?
Median Household Income in Golden Valley is $45,427.
What is Income or Wage Gap in Golden Valley?
Income or Wage Gap in Golden Valley is 12.2%.
Women in Golden Valley earn 87.8 cents for every dollar earned by a man.
What is Inequality or Gini Index in Golden Valley?
Inequality or Gini Index in Golden Valley is 0.38.
What is the Total Population of Golden Valley?
Total Population of Golden Valley is 7,900.
What is the Total Male Population of Golden Valley?
Total Male Population of Golden Valley is 4,074.
What is the Total Female Population of Golden Valley?
Total Female Population of Golden Valley is 3,826.
What is the Ratio of Males per 100 Females in Golden Valley?
There are 106.48 Males per 100 Females in Golden Valley.
What is the Ratio of Females per 100 Males in Golden Valley?
There are 93.91 Females per 100 Males in Golden Valley.
What is the Median Population Age in Golden Valley?
Median Population Age in Golden Valley is 62.5 Years.
What is the Average Family Size in Golden Valley
Average Family Size in Golden Valley is 2.5 People.
What is the Average Household Size in Golden Valley
Average Household Size in Golden Valley is 2.0 People.
How Large is the Labor Force in Golden Valley?
There are 2,362 People in the Labor Forcein in Golden Valley.
What is the Percentage of People in the Labor Force in Golden Valley?
31.8% of People are in the Labor Force in Golden Valley.
What is the Unemployment Rate in Golden Valley?
Unemployment Rate in Golden Valley is 7.2%.