Roxboro, NC Map & Demographics
Roxboro Map
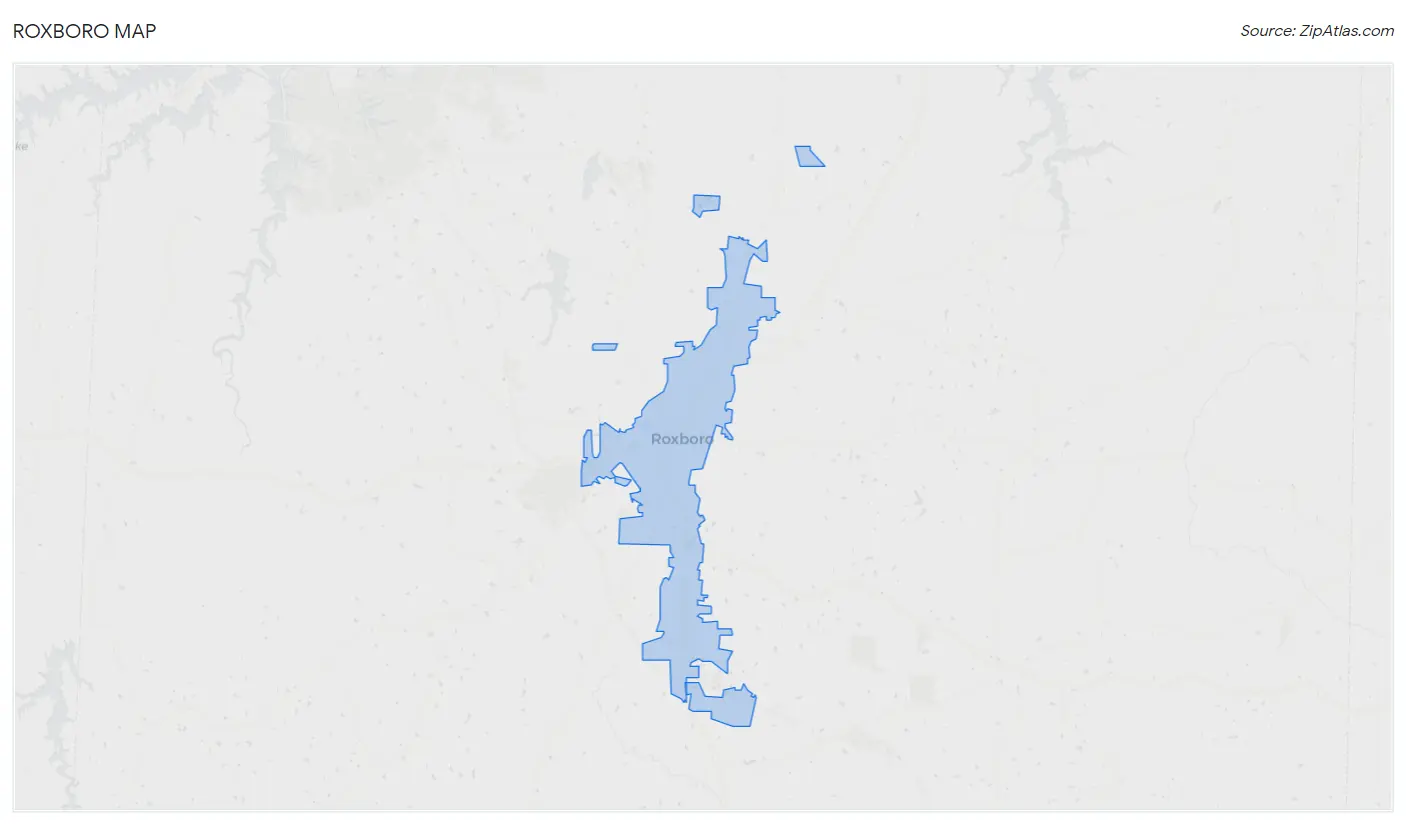
Roxboro Overview
$25,732
PER CAPITA INCOME
$54,003
AVG FAMILY INCOME
$39,787
AVG HOUSEHOLD INCOME
16.9%
WAGE / INCOME GAP [ % ]
83.1¢/ $1
WAGE / INCOME GAP [ $ ]
0.47
INEQUALITY / GINI INDEX
8,131
TOTAL POPULATION
3,807
MALE POPULATION
4,324
FEMALE POPULATION
88.04
MALES / 100 FEMALES
113.58
FEMALES / 100 MALES
40.7
MEDIAN AGE
2.9
AVG FAMILY SIZE
2.2
AVG HOUSEHOLD SIZE
3,911
LABOR FORCE [ PEOPLE ]
59.2%
PERCENT IN LABOR FORCE
4.8%
UNEMPLOYMENT RATE
Income in Roxboro
Income Overview in Roxboro
Per Capita Income in Roxboro is $25,732, while median incomes of families and households are $54,003 and $39,787 respectively.
| Characteristic | Number | Measure |
| Per Capita Income | 8,131 | $25,732 |
| Median Family Income | 1,823 | $54,003 |
| Mean Family Income | 1,823 | $62,352 |
| Median Household Income | 3,530 | $39,787 |
| Mean Household Income | 3,530 | $54,233 |
| Income Deficit | 1,823 | $0 |
| Wage / Income Gap (%) | 8,131 | 16.89% |
| Wage / Income Gap ($) | 8,131 | 83.11¢ per $1 |
| Gini / Inequality Index | 8,131 | 0.47 |
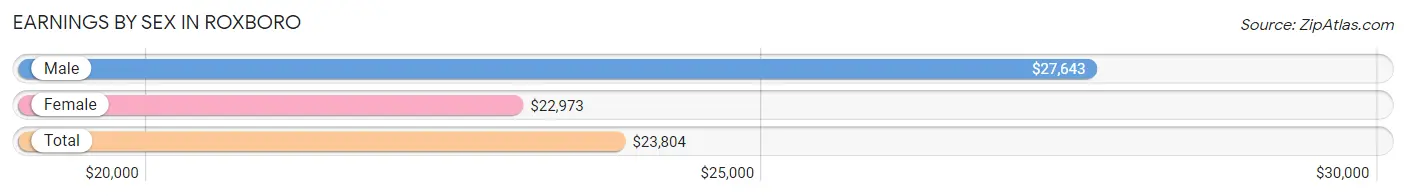
Earnings by Sex in Roxboro
Average Earnings in Roxboro are $23,804, $27,643 for men and $22,973 for women, a difference of 16.9%.
| Sex | Number | Average Earnings |
| Male | 2,086 (51.2%) | $27,643 |
| Female | 1,986 (48.8%) | $22,973 |
| Total | 4,072 (100.0%) | $23,804 |
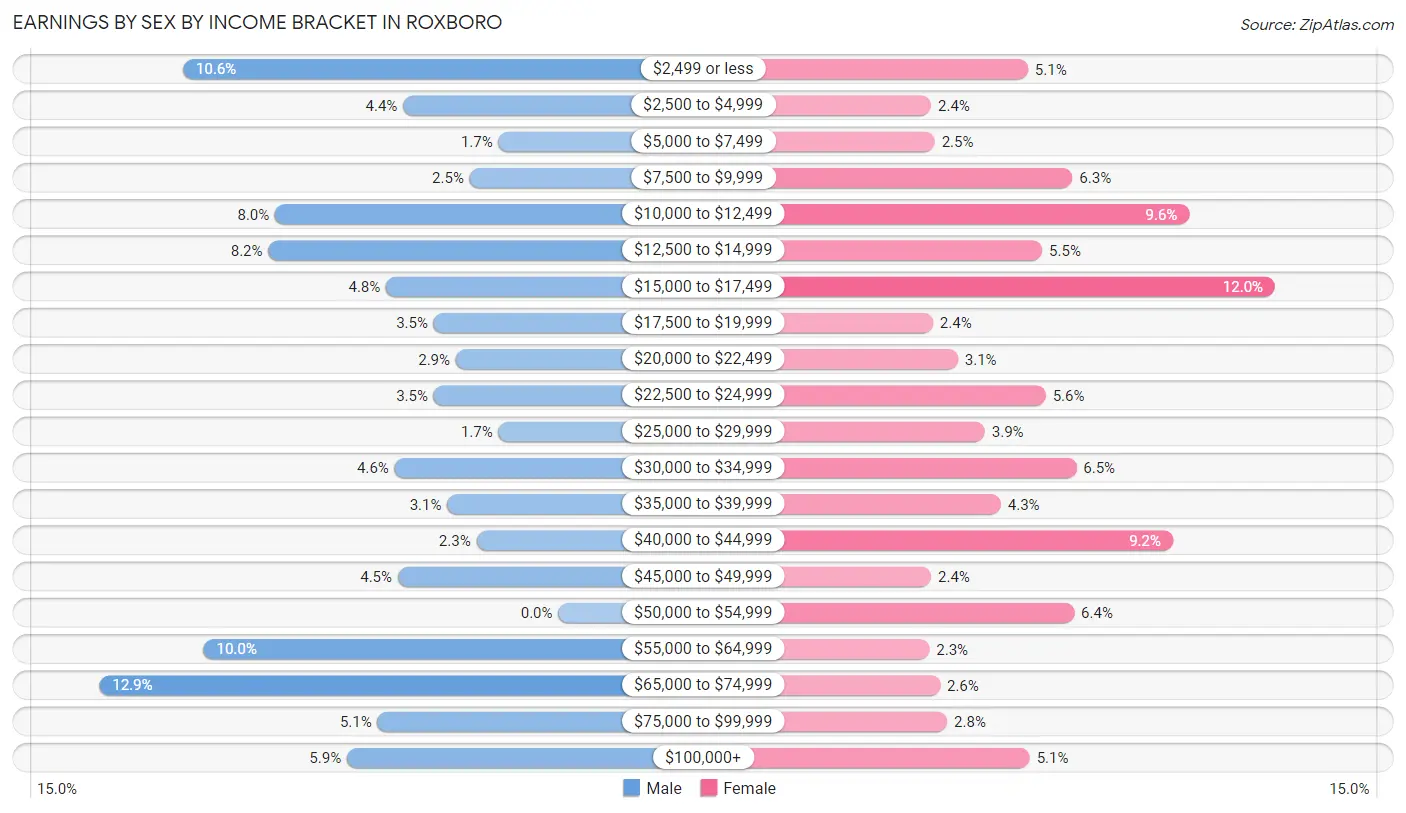
Earnings by Sex by Income Bracket in Roxboro
The most common earnings brackets in Roxboro are $65,000 to $74,999 for men (269 | 12.9%) and $15,000 to $17,499 for women (239 | 12.0%).
| Income | Male | Female |
| $2,499 or less | 220 (10.5%) | 101 (5.1%) |
| $2,500 to $4,999 | 91 (4.4%) | 47 (2.4%) |
| $5,000 to $7,499 | 35 (1.7%) | 49 (2.5%) |
| $7,500 to $9,999 | 52 (2.5%) | 126 (6.3%) |
| $10,000 to $12,499 | 166 (8.0%) | 191 (9.6%) |
| $12,500 to $14,999 | 170 (8.2%) | 109 (5.5%) |
| $15,000 to $17,499 | 101 (4.8%) | 239 (12.0%) |
| $17,500 to $19,999 | 73 (3.5%) | 48 (2.4%) |
| $20,000 to $22,499 | 60 (2.9%) | 62 (3.1%) |
| $22,500 to $24,999 | 73 (3.5%) | 111 (5.6%) |
| $25,000 to $29,999 | 35 (1.7%) | 77 (3.9%) |
| $30,000 to $34,999 | 96 (4.6%) | 128 (6.5%) |
| $35,000 to $39,999 | 65 (3.1%) | 86 (4.3%) |
| $40,000 to $44,999 | 48 (2.3%) | 182 (9.2%) |
| $45,000 to $49,999 | 94 (4.5%) | 47 (2.4%) |
| $50,000 to $54,999 | 0 (0.0%) | 127 (6.4%) |
| $55,000 to $64,999 | 208 (10.0%) | 46 (2.3%) |
| $65,000 to $74,999 | 269 (12.9%) | 52 (2.6%) |
| $75,000 to $99,999 | 106 (5.1%) | 56 (2.8%) |
| $100,000+ | 124 (5.9%) | 102 (5.1%) |
| Total | 2,086 (100.0%) | 1,986 (100.0%) |
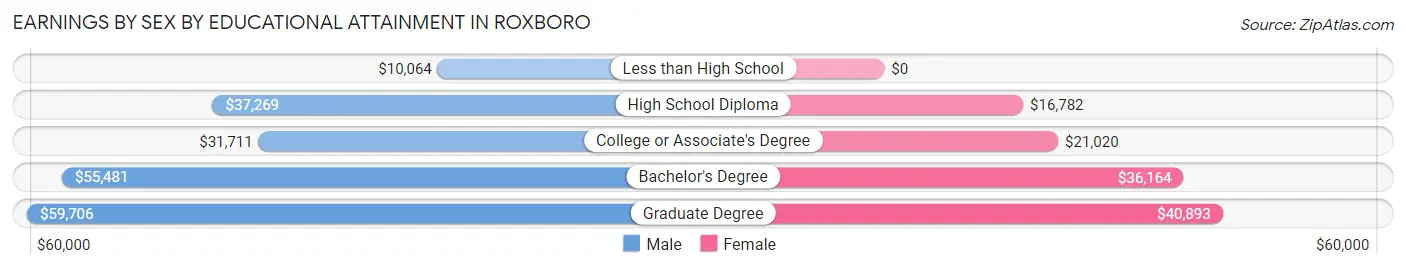
Earnings by Sex by Educational Attainment in Roxboro
Average earnings in Roxboro are $35,635 for men and $23,131 for women, a difference of 35.1%. Men with an educational attainment of graduate degree enjoy the highest average annual earnings of $59,706, while those with less than high school education earn the least with $10,064. Women with an educational attainment of graduate degree earn the most with the average annual earnings of $40,893, while those with high school diploma education have the smallest earnings of $16,782.
| Educational Attainment | Male Income | Female Income |
| Less than High School | $10,064 | $0 |
| High School Diploma | $37,269 | $16,782 |
| College or Associate's Degree | $31,711 | $21,020 |
| Bachelor's Degree | $55,481 | $36,164 |
| Graduate Degree | $59,706 | $40,893 |
| Total | $35,635 | $23,131 |
Family Income in Roxboro
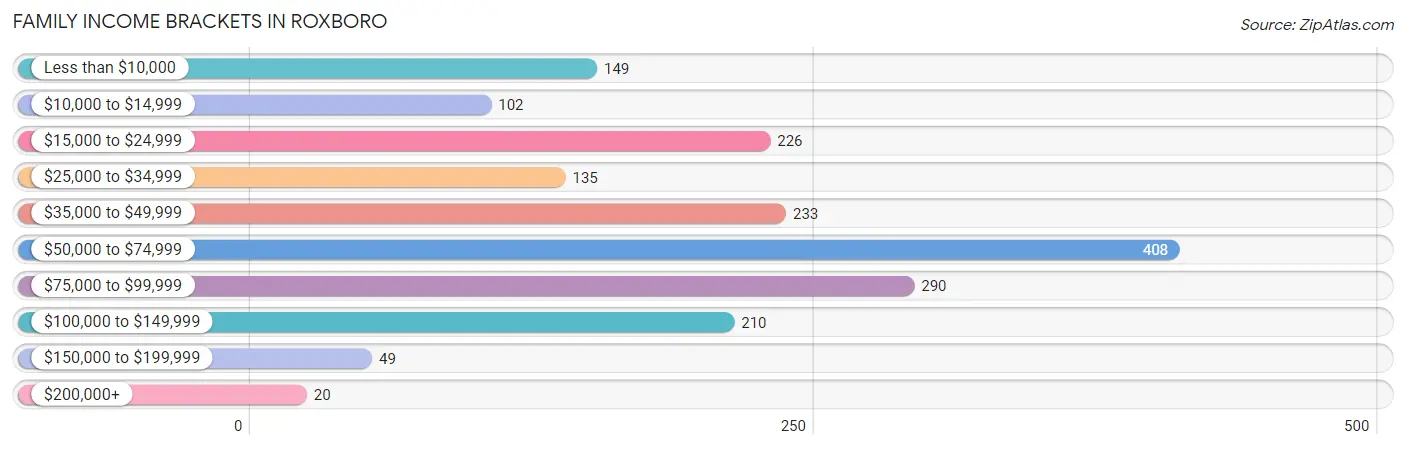
Family Income Brackets in Roxboro
According to the Roxboro family income data, there are 408 families falling into the $50,000 to $74,999 income range, which is the most common income bracket and makes up 22.4% of all families. Conversely, the $200,000+ income bracket is the least frequent group with only 20 families (1.1%) belonging to this category.
| Income Bracket | # Families | % Families |
| Less than $10,000 | 149 | 8.2% |
| $10,000 to $14,999 | 102 | 5.6% |
| $15,000 to $24,999 | 226 | 12.4% |
| $25,000 to $34,999 | 135 | 7.4% |
| $35,000 to $49,999 | 233 | 12.8% |
| $50,000 to $74,999 | 408 | 22.4% |
| $75,000 to $99,999 | 290 | 15.9% |
| $100,000 to $149,999 | 210 | 11.5% |
| $150,000 to $199,999 | 49 | 2.7% |
| $200,000+ | 20 | 1.1% |
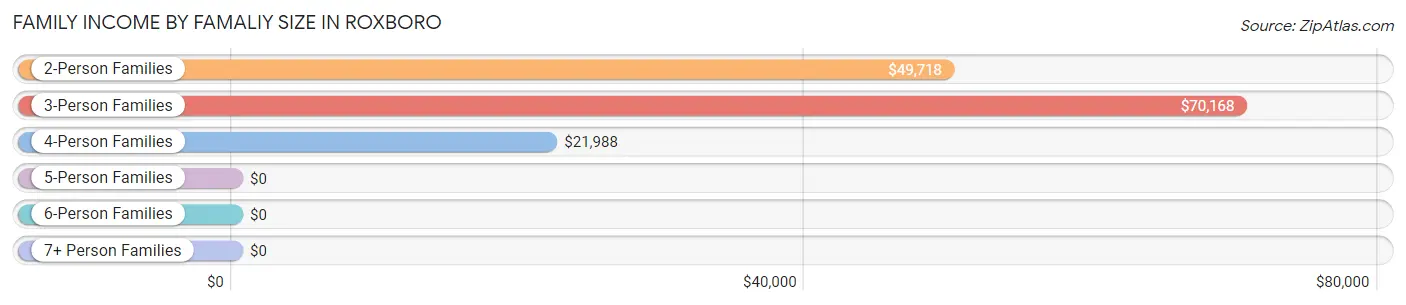
Family Income by Famaliy Size in Roxboro
3-person families (789 | 43.3%) account for the highest median family income in Roxboro with $70,168 per family, while 2-person families (675 | 37.0%) have the highest median income of $24,859 per family member.
| Income Bracket | # Families | Median Income |
| 2-Person Families | 675 (37.0%) | $49,718 |
| 3-Person Families | 789 (43.3%) | $70,168 |
| 4-Person Families | 269 (14.8%) | $21,988 |
| 5-Person Families | 69 (3.8%) | $0 |
| 6-Person Families | 21 (1.1%) | $0 |
| 7+ Person Families | 0 (0.0%) | $0 |
| Total | 1,823 (100.0%) | $54,003 |
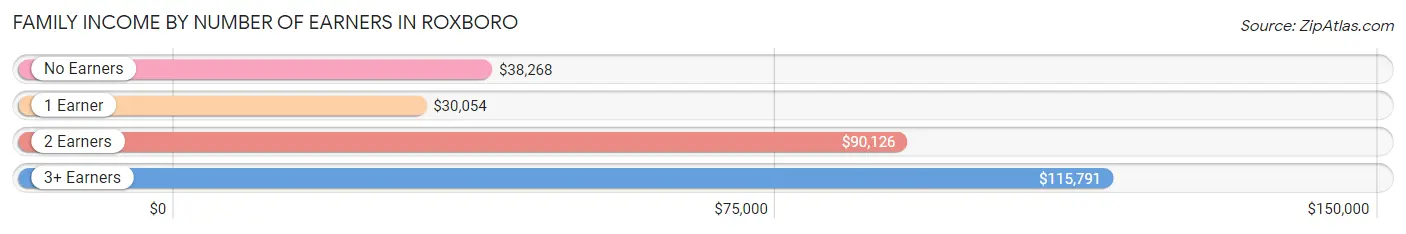
Family Income by Number of Earners in Roxboro
The median family income in Roxboro is $54,003, with families comprising 3+ earners (197) having the highest median family income of $115,791, while families with 1 earner (1,019) have the lowest median family income of $30,054, accounting for 10.8% and 55.9% of families, respectively.
| Number of Earners | # Families | Median Income |
| No Earners | 149 (8.2%) | $38,268 |
| 1 Earner | 1,019 (55.9%) | $30,054 |
| 2 Earners | 458 (25.1%) | $90,126 |
| 3+ Earners | 197 (10.8%) | $115,791 |
| Total | 1,823 (100.0%) | $54,003 |
Household Income in Roxboro
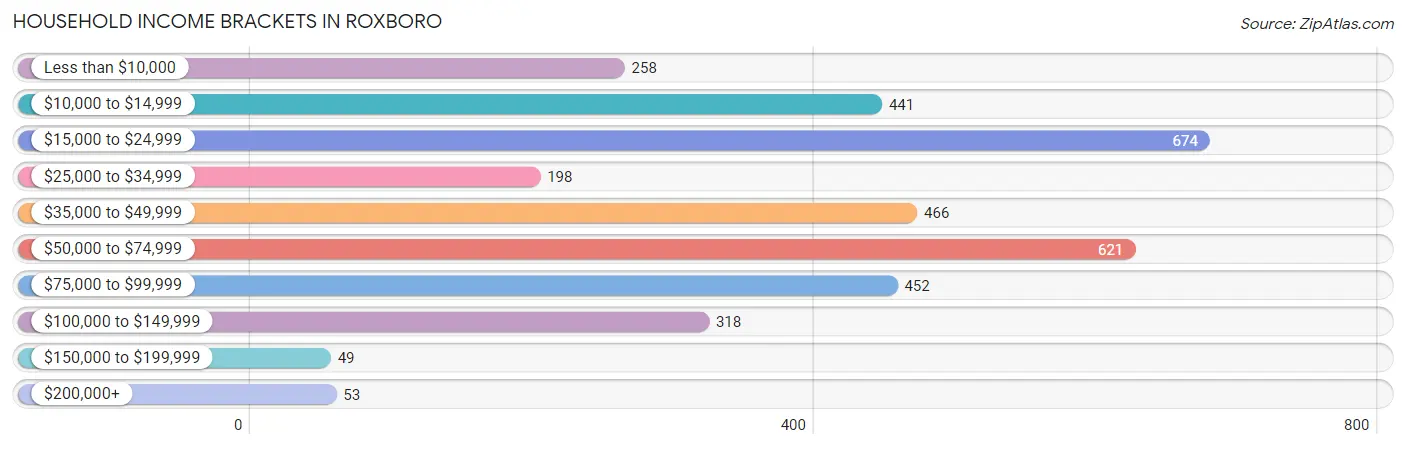
Household Income Brackets in Roxboro
With 674 households falling in the category, the $15,000 to $24,999 income range is the most frequent in Roxboro, accounting for 19.1% of all households. In contrast, only 49 households (1.4%) fall into the $150,000 to $199,999 income bracket, making it the least populous group.
| Income Bracket | # Households | % Households |
| Less than $10,000 | 258 | 7.3% |
| $10,000 to $14,999 | 441 | 12.5% |
| $15,000 to $24,999 | 674 | 19.1% |
| $25,000 to $34,999 | 198 | 5.6% |
| $35,000 to $49,999 | 466 | 13.2% |
| $50,000 to $74,999 | 621 | 17.6% |
| $75,000 to $99,999 | 452 | 12.8% |
| $100,000 to $149,999 | 318 | 9.0% |
| $150,000 to $199,999 | 49 | 1.4% |
| $200,000+ | 53 | 1.5% |
Household Income by Householder Age in Roxboro
The median household income in Roxboro is $39,787, with the highest median household income of $63,682 found in the 45 to 64 years age bracket for the primary householder. A total of 1,313 households (37.2%) fall into this category. Meanwhile, the 15 to 24 years age bracket for the primary householder has the lowest median household income of $0, with 282 households (8.0%) in this group.
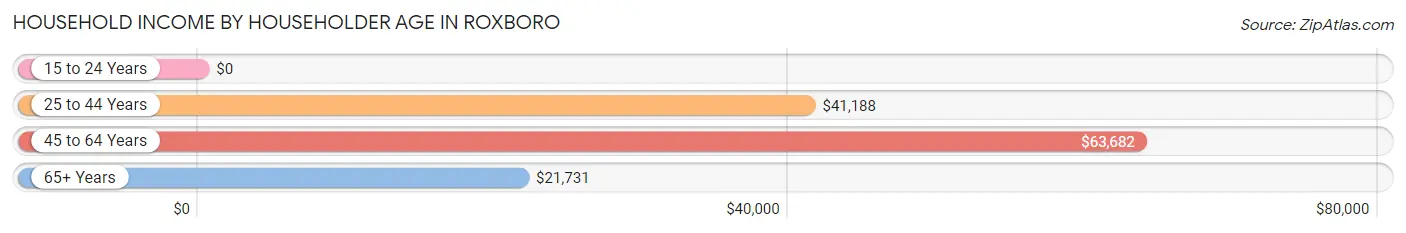
| Income Bracket | # Households | Median Income |
| 15 to 24 Years | 282 (8.0%) | $0 |
| 25 to 44 Years | 861 (24.4%) | $41,188 |
| 45 to 64 Years | 1,313 (37.2%) | $63,682 |
| 65+ Years | 1,074 (30.4%) | $21,731 |
| Total | 3,530 (100.0%) | $39,787 |
Poverty in Roxboro
Income Below Poverty by Sex and Age in Roxboro
With 28.8% poverty level for males and 35.1% for females among the residents of Roxboro, 6 to 11 year old males and 15 year old females are the most vulnerable to poverty, with 150 males (100.0%) and 15 females (100.0%) in their respective age groups living below the poverty level.
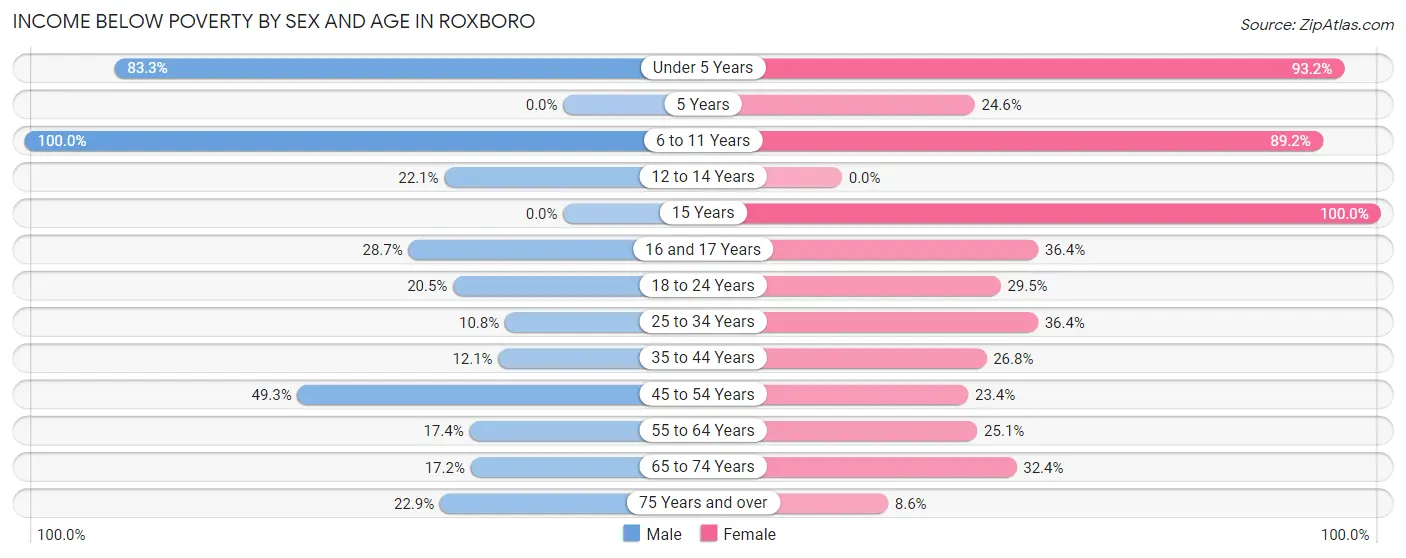
| Age Bracket | Male | Female |
| Under 5 Years | 260 (83.3%) | 261 (93.2%) |
| 5 Years | 0 (0.0%) | 17 (24.6%) |
| 6 to 11 Years | 150 (100.0%) | 199 (89.2%) |
| 12 to 14 Years | 38 (22.1%) | 0 (0.0%) |
| 15 Years | 0 (0.0%) | 15 (100.0%) |
| 16 and 17 Years | 25 (28.7%) | 47 (36.4%) |
| 18 to 24 Years | 63 (20.4%) | 86 (29.4%) |
| 25 to 34 Years | 62 (10.8%) | 272 (36.4%) |
| 35 to 44 Years | 50 (12.0%) | 85 (26.8%) |
| 45 to 54 Years | 222 (49.3%) | 93 (23.4%) |
| 55 to 64 Years | 89 (17.4%) | 144 (25.1%) |
| 65 to 74 Years | 55 (17.2%) | 217 (32.4%) |
| 75 Years and over | 35 (22.9%) | 29 (8.6%) |
| Total | 1,049 (28.8%) | 1,465 (35.1%) |
Income Above Poverty by Sex and Age in Roxboro
According to the poverty statistics in Roxboro, males aged 5 years and females aged 12 to 14 years are the age groups that are most secure financially, with 100.0% of males and 100.0% of females in these age groups living above the poverty line.
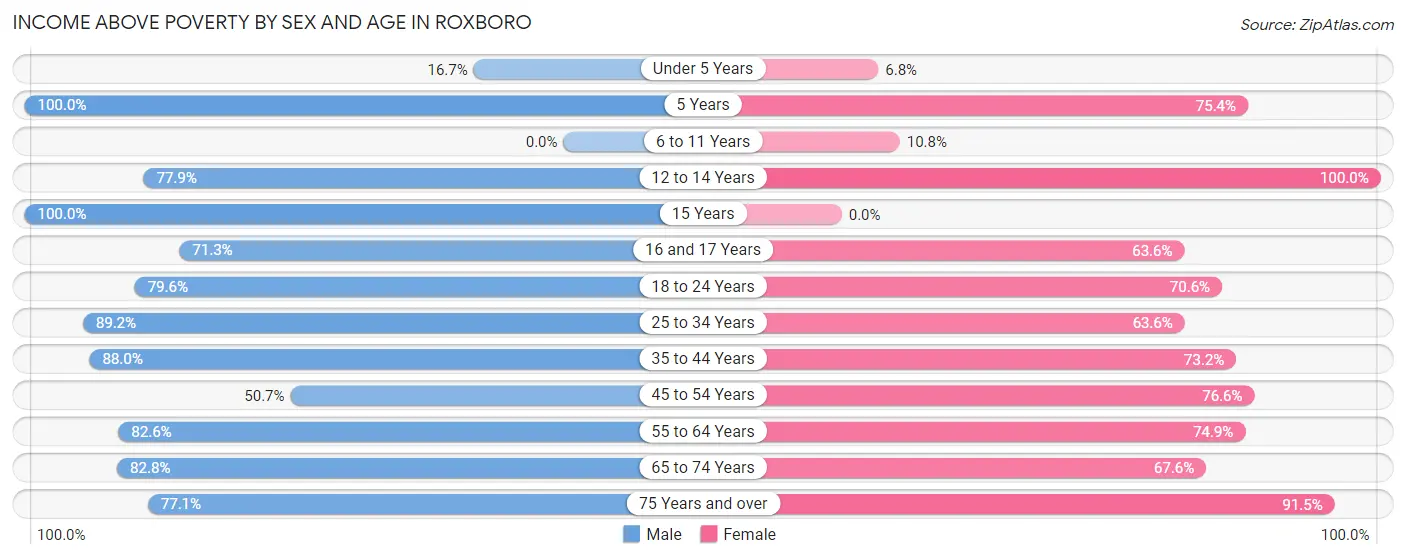
| Age Bracket | Male | Female |
| Under 5 Years | 52 (16.7%) | 19 (6.8%) |
| 5 Years | 141 (100.0%) | 52 (75.4%) |
| 6 to 11 Years | 0 (0.0%) | 24 (10.8%) |
| 12 to 14 Years | 134 (77.9%) | 118 (100.0%) |
| 15 Years | 45 (100.0%) | 0 (0.0%) |
| 16 and 17 Years | 62 (71.3%) | 82 (63.6%) |
| 18 to 24 Years | 245 (79.5%) | 206 (70.6%) |
| 25 to 34 Years | 511 (89.2%) | 476 (63.6%) |
| 35 to 44 Years | 365 (87.9%) | 232 (73.2%) |
| 45 to 54 Years | 228 (50.7%) | 304 (76.6%) |
| 55 to 64 Years | 422 (82.6%) | 429 (74.9%) |
| 65 to 74 Years | 265 (82.8%) | 453 (67.6%) |
| 75 Years and over | 118 (77.1%) | 310 (91.4%) |
| Total | 2,588 (71.2%) | 2,705 (64.9%) |
Income Below Poverty Among Married-Couple Families in Roxboro
The poverty statistics for married-couple families in Roxboro show that 3.5% or 28 of the total 804 families live below the poverty line. Families with no children have the highest poverty rate of 5.3%, comprising of 28 families. On the other hand, families with 1 or 2 children have the lowest poverty rate of 0.0%, which includes 0 families.
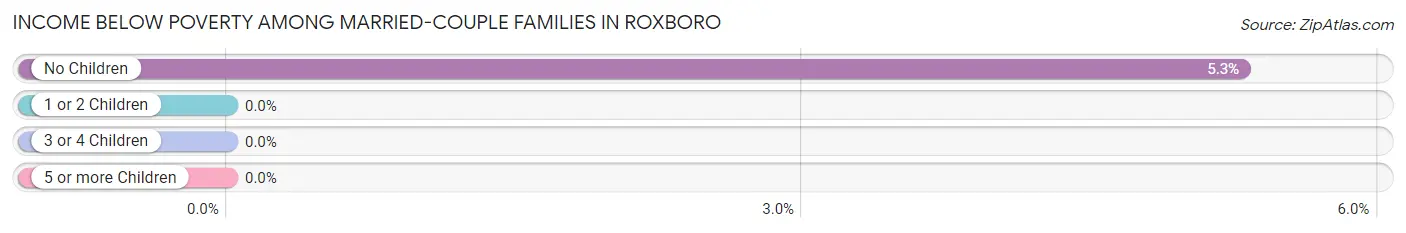
| Children | Above Poverty | Below Poverty |
| No Children | 501 (94.7%) | 28 (5.3%) |
| 1 or 2 Children | 275 (100.0%) | 0 (0.0%) |
| 3 or 4 Children | 0 (0.0%) | 0 (0.0%) |
| 5 or more Children | 0 (0.0%) | 0 (0.0%) |
| Total | 776 (96.5%) | 28 (3.5%) |
Income Below Poverty Among Single-Parent Households in Roxboro
According to the poverty data in Roxboro, 25.3% or 50 single-father households and 48.7% or 400 single-mother households are living below the poverty line. Among single-father households, those with no children have the highest poverty rate, with 50 households (100.0%) experiencing poverty. Likewise, among single-mother households, those with 3 or 4 children have the highest poverty rate, with 193 households (100.0%) falling below the poverty line.
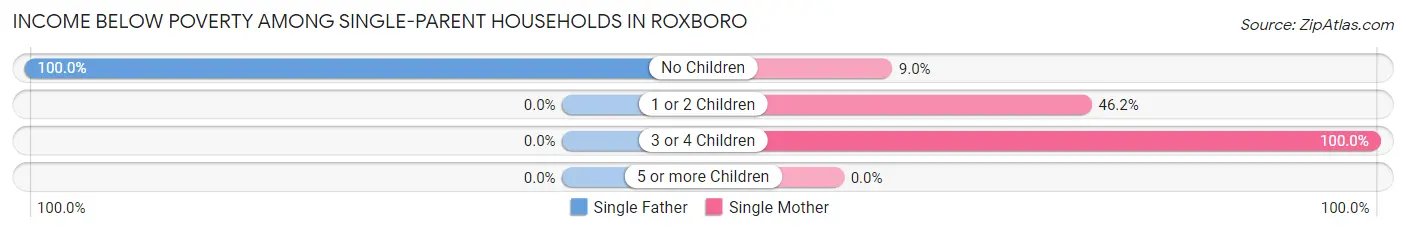
| Children | Single Father | Single Mother |
| No Children | 50 (100.0%) | 20 (9.0%) |
| 1 or 2 Children | 0 (0.0%) | 187 (46.2%) |
| 3 or 4 Children | 0 (0.0%) | 193 (100.0%) |
| 5 or more Children | 0 (0.0%) | 0 (0.0%) |
| Total | 50 (25.3%) | 400 (48.7%) |
Income Below Poverty Among Married-Couple vs Single-Parent Households in Roxboro
The poverty data for Roxboro shows that 28 of the married-couple family households (3.5%) and 450 of the single-parent households (44.2%) are living below the poverty level. Within the married-couple family households, those with no children have the highest poverty rate, with 28 households (5.3%) falling below the poverty line. Among the single-parent households, those with 3 or 4 children have the highest poverty rate, with 193 household (100.0%) living below poverty.
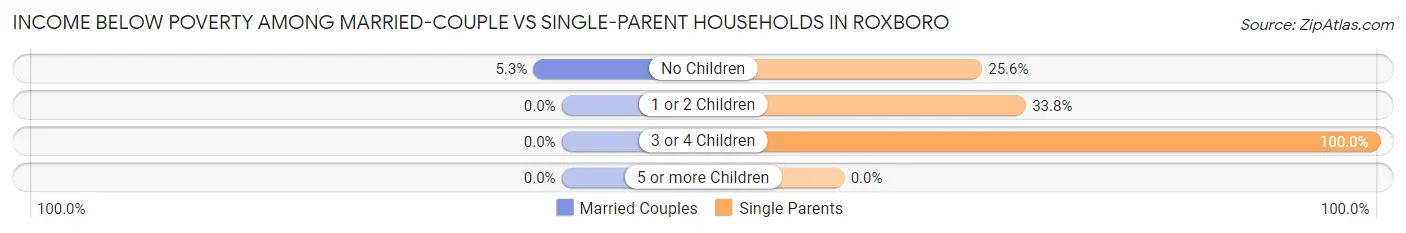
| Children | Married-Couple Families | Single-Parent Households |
| No Children | 28 (5.3%) | 70 (25.6%) |
| 1 or 2 Children | 0 (0.0%) | 187 (33.8%) |
| 3 or 4 Children | 0 (0.0%) | 193 (100.0%) |
| 5 or more Children | 0 (0.0%) | 0 (0.0%) |
| Total | 28 (3.5%) | 450 (44.2%) |
Race in Roxboro
The most populous races in Roxboro are White / Caucasian (4,104 | 50.5%), Black / African American (2,815 | 34.6%), and Two or more Races (964 | 11.9%).
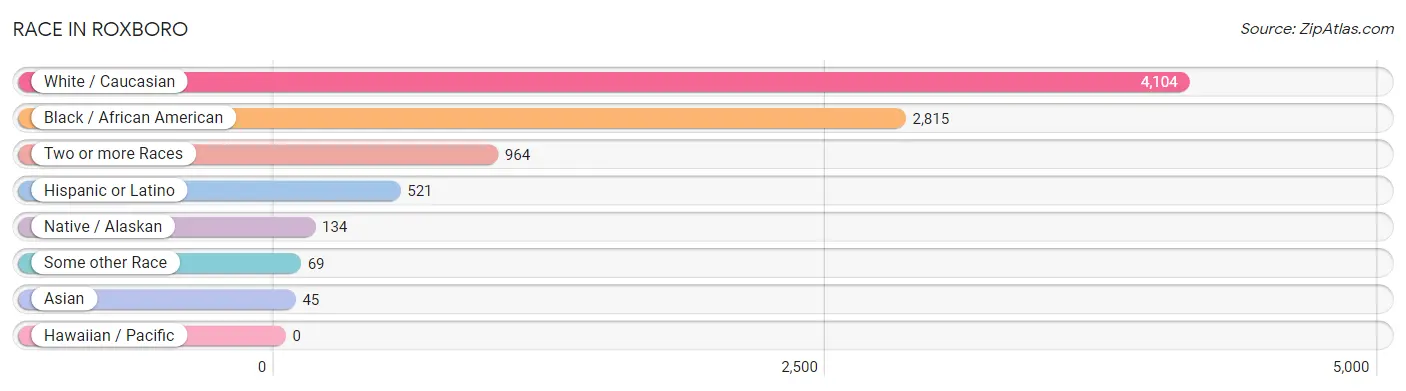
| Race | # Population | % Population |
| Asian | 45 | 0.5% |
| Black / African American | 2,815 | 34.6% |
| Hawaiian / Pacific | 0 | 0.0% |
| Hispanic or Latino | 521 | 6.4% |
| Native / Alaskan | 134 | 1.7% |
| White / Caucasian | 4,104 | 50.5% |
| Two or more Races | 964 | 11.9% |
| Some other Race | 69 | 0.9% |
| Total | 8,131 | 100.0% |
Ancestry in Roxboro
The most populous ancestries reported in Roxboro are English (915 | 11.3%), Cherokee (575 | 7.1%), American (444 | 5.5%), German (380 | 4.7%), and Mexican (354 | 4.3%), together accounting for 32.8% of all Roxboro residents.
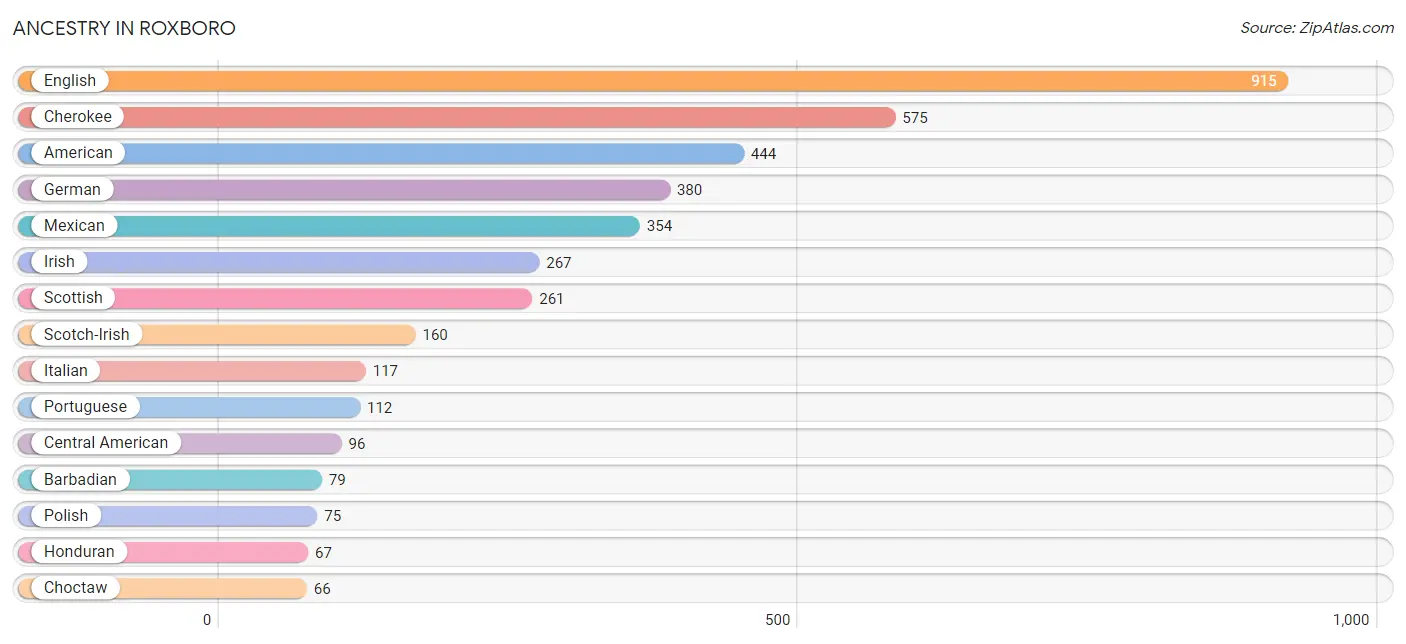
| Ancestry | # Population | % Population |
| American | 444 | 5.5% |
| Barbadian | 79 | 1.0% |
| Brazilian | 44 | 0.5% |
| Burmese | 1 | 0.0% |
| Central American | 96 | 1.2% |
| Cherokee | 575 | 7.1% |
| Choctaw | 66 | 0.8% |
| Comanche | 1 | 0.0% |
| Danish | 19 | 0.2% |
| Dutch | 19 | 0.2% |
| Eastern European | 18 | 0.2% |
| English | 915 | 11.3% |
| European | 54 | 0.7% |
| French | 9 | 0.1% |
| French Canadian | 39 | 0.5% |
| German | 380 | 4.7% |
| Honduran | 67 | 0.8% |
| Irish | 267 | 3.3% |
| Italian | 117 | 1.4% |
| Korean | 45 | 0.5% |
| Mexican | 354 | 4.3% |
| Norwegian | 21 | 0.3% |
| Polish | 75 | 0.9% |
| Portuguese | 112 | 1.4% |
| Puerto Rican | 58 | 0.7% |
| Salvadoran | 29 | 0.4% |
| Scandinavian | 34 | 0.4% |
| Scotch-Irish | 160 | 2.0% |
| Scottish | 261 | 3.2% |
| South American | 13 | 0.2% |
| Venezuelan | 13 | 0.2% | View All 31 Rows |
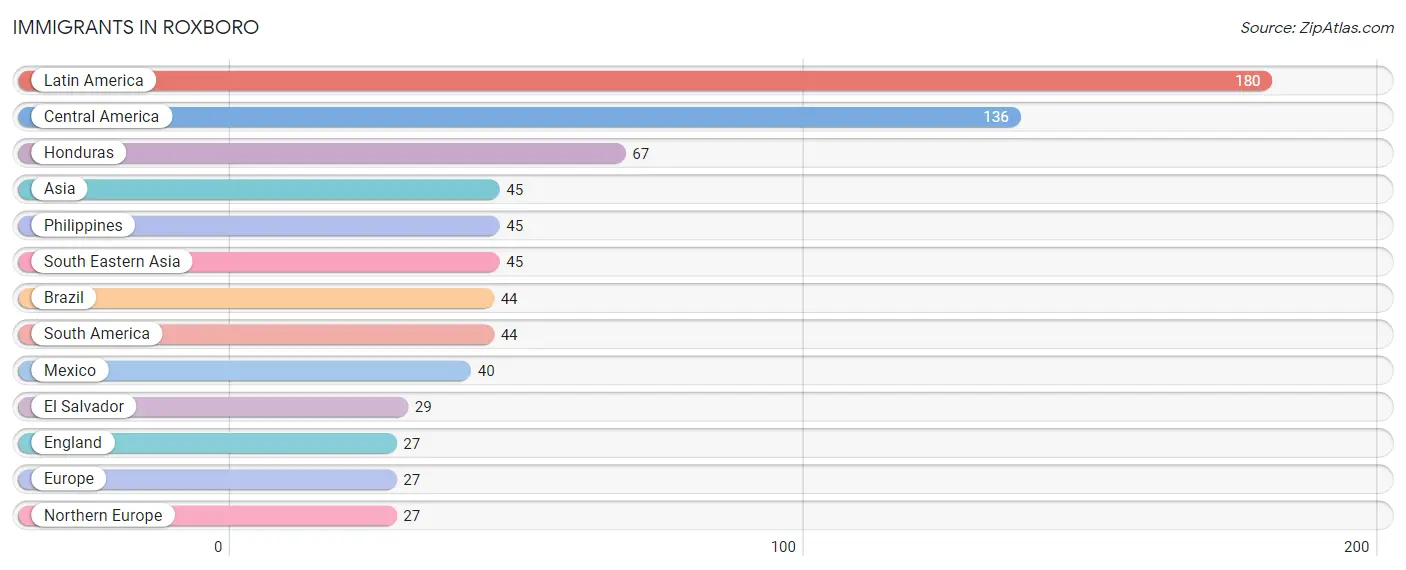
Immigrants in Roxboro
The most numerous immigrant groups reported in Roxboro came from Latin America (180 | 2.2%), Central America (136 | 1.7%), Honduras (67 | 0.8%), Asia (45 | 0.5%), and Philippines (45 | 0.5%), together accounting for 5.8% of all Roxboro residents.
| Immigration Origin | # Population | % Population |
| Asia | 45 | 0.5% |
| Brazil | 44 | 0.5% |
| Central America | 136 | 1.7% |
| El Salvador | 29 | 0.4% |
| England | 27 | 0.3% |
| Europe | 27 | 0.3% |
| Honduras | 67 | 0.8% |
| Latin America | 180 | 2.2% |
| Mexico | 40 | 0.5% |
| Northern Europe | 27 | 0.3% |
| Philippines | 45 | 0.5% |
| South America | 44 | 0.5% |
| South Eastern Asia | 45 | 0.5% | View All 13 Rows |
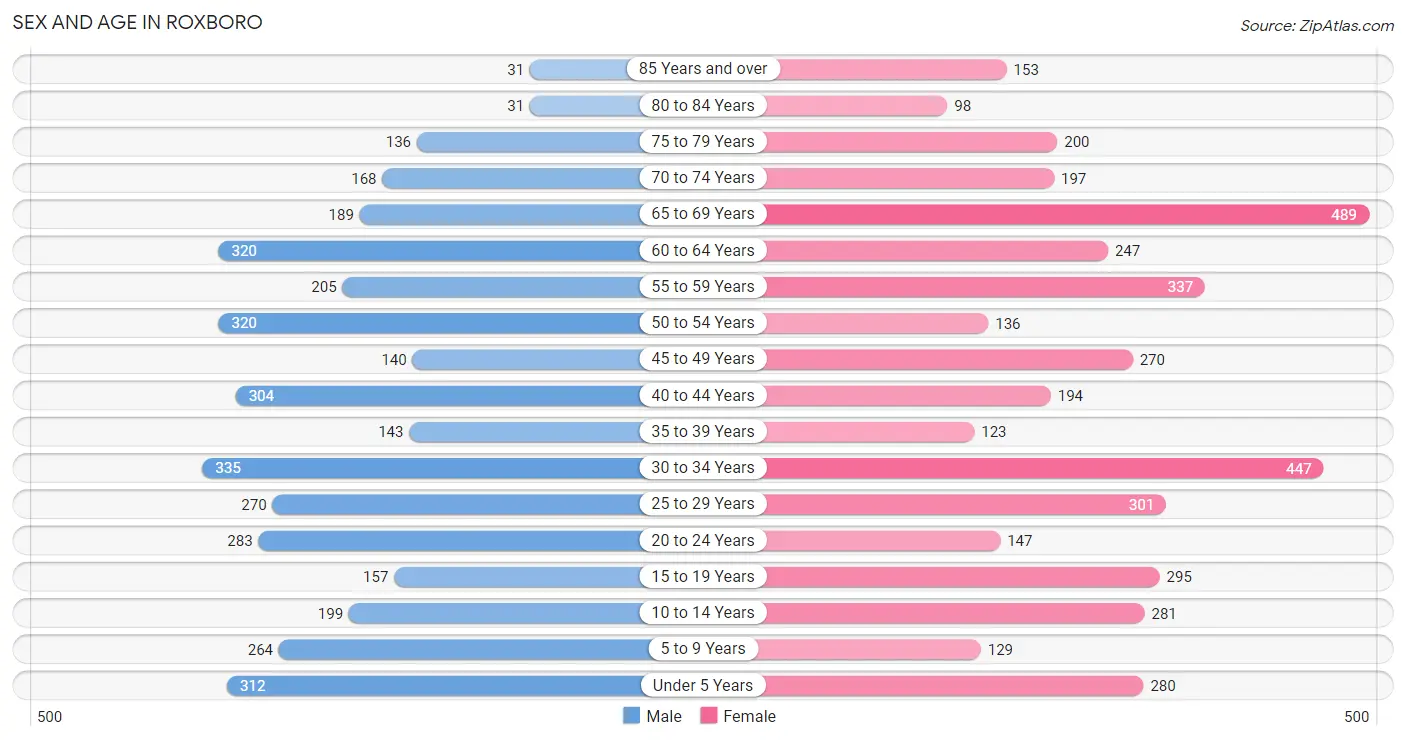
Sex and Age in Roxboro
Sex and Age in Roxboro
The most populous age groups in Roxboro are 30 to 34 Years (335 | 8.8%) for men and 65 to 69 Years (489 | 11.3%) for women.
| Age Bracket | Male | Female |
| Under 5 Years | 312 (8.2%) | 280 (6.5%) |
| 5 to 9 Years | 264 (6.9%) | 129 (3.0%) |
| 10 to 14 Years | 199 (5.2%) | 281 (6.5%) |
| 15 to 19 Years | 157 (4.1%) | 295 (6.8%) |
| 20 to 24 Years | 283 (7.4%) | 147 (3.4%) |
| 25 to 29 Years | 270 (7.1%) | 301 (7.0%) |
| 30 to 34 Years | 335 (8.8%) | 447 (10.3%) |
| 35 to 39 Years | 143 (3.8%) | 123 (2.8%) |
| 40 to 44 Years | 304 (8.0%) | 194 (4.5%) |
| 45 to 49 Years | 140 (3.7%) | 270 (6.2%) |
| 50 to 54 Years | 320 (8.4%) | 136 (3.2%) |
| 55 to 59 Years | 205 (5.4%) | 337 (7.8%) |
| 60 to 64 Years | 320 (8.4%) | 247 (5.7%) |
| 65 to 69 Years | 189 (5.0%) | 489 (11.3%) |
| 70 to 74 Years | 168 (4.4%) | 197 (4.6%) |
| 75 to 79 Years | 136 (3.6%) | 200 (4.6%) |
| 80 to 84 Years | 31 (0.8%) | 98 (2.3%) |
| 85 Years and over | 31 (0.8%) | 153 (3.5%) |
| Total | 3,807 (100.0%) | 4,324 (100.0%) |
Families and Households in Roxboro
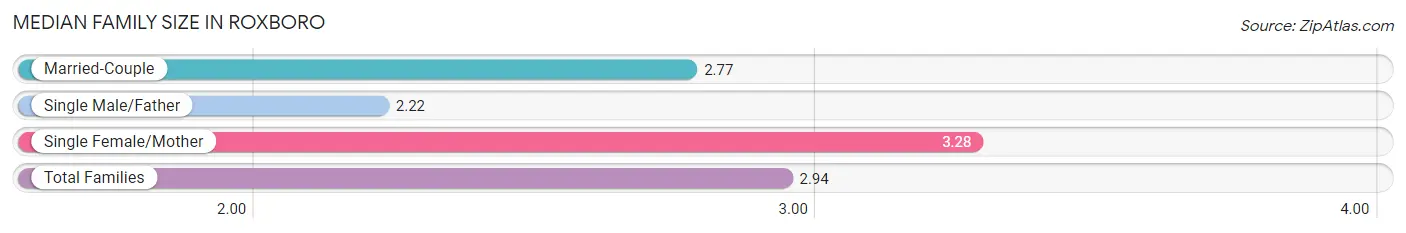
Median Family Size in Roxboro
The median family size in Roxboro is 2.94 persons per family, with single female/mother families (821 | 45.0%) accounting for the largest median family size of 3.28 persons per family. On the other hand, single male/father families (198 | 10.9%) represent the smallest median family size with 2.22 persons per family.
| Family Type | # Families | Family Size |
| Married-Couple | 804 (44.1%) | 2.77 |
| Single Male/Father | 198 (10.9%) | 2.22 |
| Single Female/Mother | 821 (45.0%) | 3.28 |
| Total Families | 1,823 (100.0%) | 2.94 |
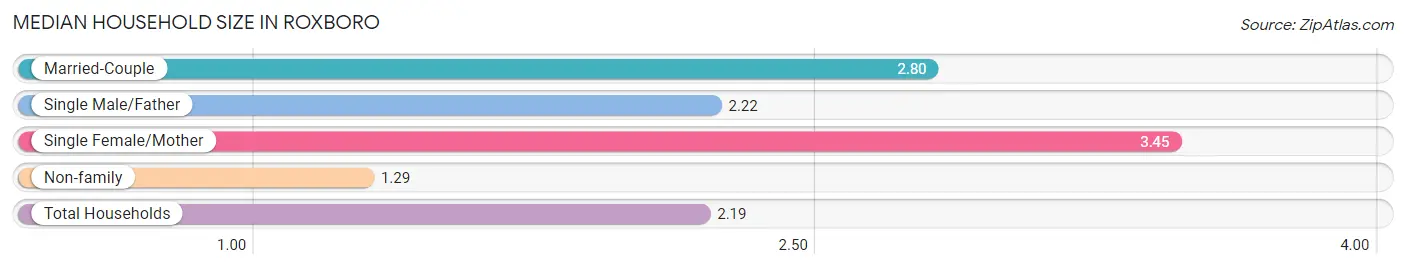
Median Household Size in Roxboro
The median household size in Roxboro is 2.19 persons per household, with single female/mother households (821 | 23.3%) accounting for the largest median household size of 3.45 persons per household. non-family households (1,707 | 48.4%) represent the smallest median household size with 1.29 persons per household.
| Household Type | # Households | Household Size |
| Married-Couple | 804 (22.8%) | 2.80 |
| Single Male/Father | 198 (5.6%) | 2.22 |
| Single Female/Mother | 821 (23.3%) | 3.45 |
| Non-family | 1,707 (48.4%) | 1.29 |
| Total Households | 3,530 (100.0%) | 2.19 |
Household Size by Marriage Status in Roxboro
Out of a total of 3,530 households in Roxboro, 1,823 (51.6%) are family households, while 1,707 (48.4%) are nonfamily households. The most numerous type of family households are 3-person households, comprising 798, and the most common type of nonfamily households are 1-person households, comprising 1,395.
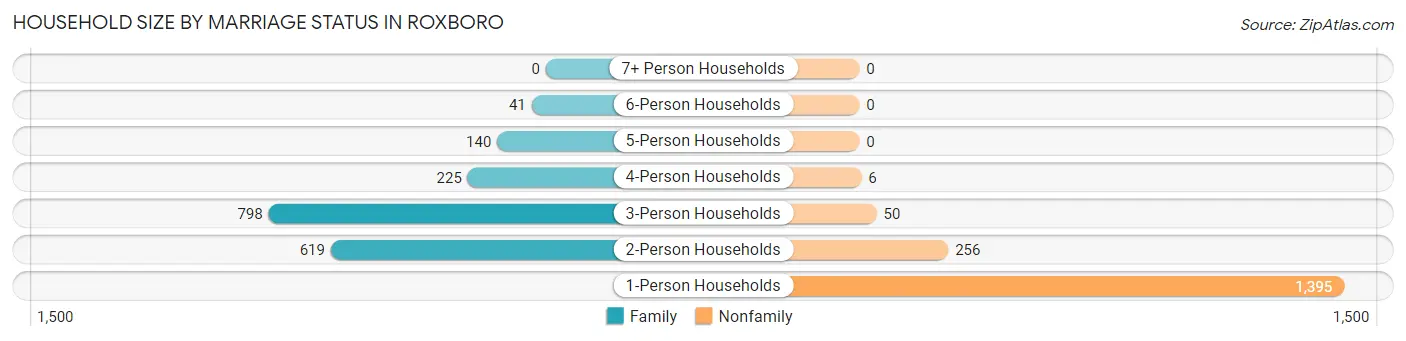
| Household Size | Family Households | Nonfamily Households |
| 1-Person Households | - | 1,395 (39.5%) |
| 2-Person Households | 619 (17.5%) | 256 (7.2%) |
| 3-Person Households | 798 (22.6%) | 50 (1.4%) |
| 4-Person Households | 225 (6.4%) | 6 (0.2%) |
| 5-Person Households | 140 (4.0%) | 0 (0.0%) |
| 6-Person Households | 41 (1.2%) | 0 (0.0%) |
| 7+ Person Households | 0 (0.0%) | 0 (0.0%) |
| Total | 1,823 (51.6%) | 1,707 (48.4%) |
Female Fertility in Roxboro
Fertility by Age in Roxboro
Average fertility rate in Roxboro is 25.0 births per 1,000 women. Women in the age bracket of 20 to 34 years have the highest fertility rate with 53.0 births per 1,000 women. Women in the age bracket of 20 to 34 years acount for 100.0% of all women with births.
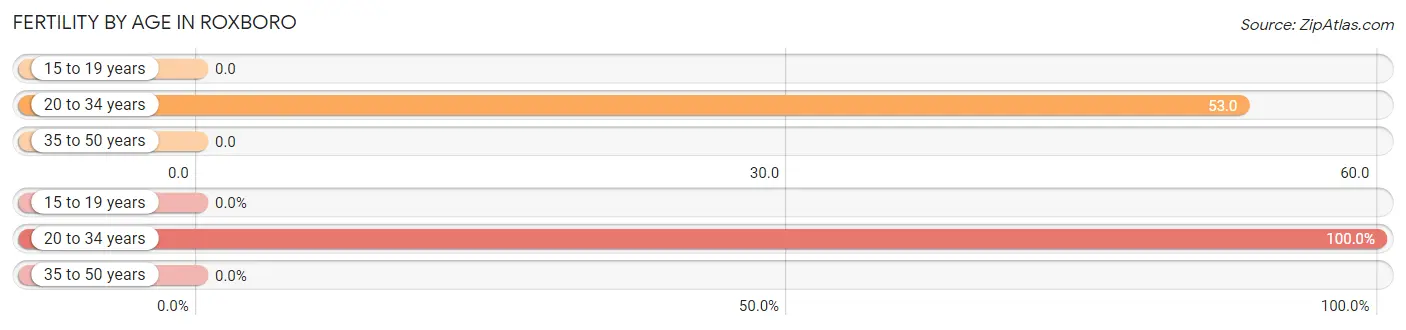
| Age Bracket | Women with Births | Births / 1,000 Women |
| 15 to 19 years | 0 (0.0%) | 0.0 |
| 20 to 34 years | 47 (100.0%) | 53.0 |
| 35 to 50 years | 0 (0.0%) | 0.0 |
| Total | 47 (100.0%) | 25.0 |
Fertility by Age by Marriage Status in Roxboro
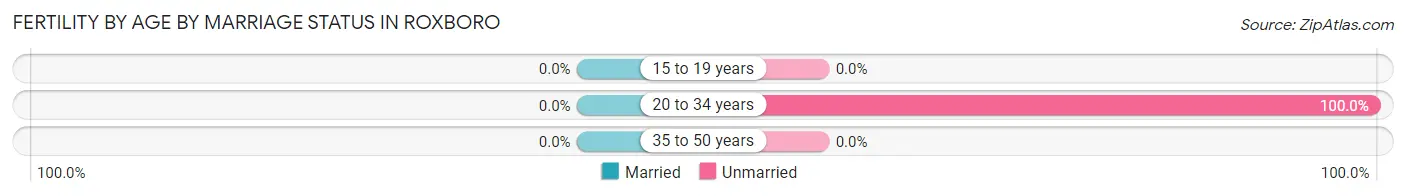
| Age Bracket | Married | Unmarried |
| 15 to 19 years | 0 (0.0%) | 0 (0.0%) |
| 20 to 34 years | 0 (0.0%) | 47 (100.0%) |
| 35 to 50 years | 0 (0.0%) | 0 (0.0%) |
| Total | 0 (0.0%) | 47 (100.0%) |
Fertility by Education in Roxboro
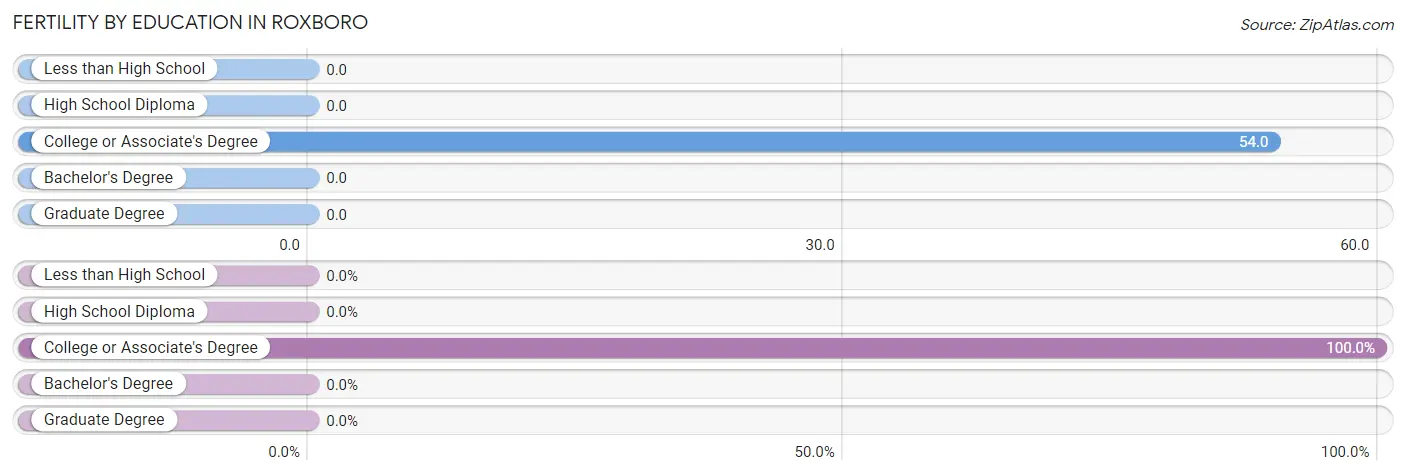
| Educational Attainment | Women with Births | Births / 1,000 Women |
| Less than High School | 0 (0.0%) | 0.0 |
| High School Diploma | 0 (0.0%) | 0.0 |
| College or Associate's Degree | 47 (100.0%) | 54.0 |
| Bachelor's Degree | 0 (0.0%) | 0.0 |
| Graduate Degree | 0 (0.0%) | 0.0 |
| Total | 47 (100.0%) | 25.0 |
Fertility by Education by Marriage Status in Roxboro
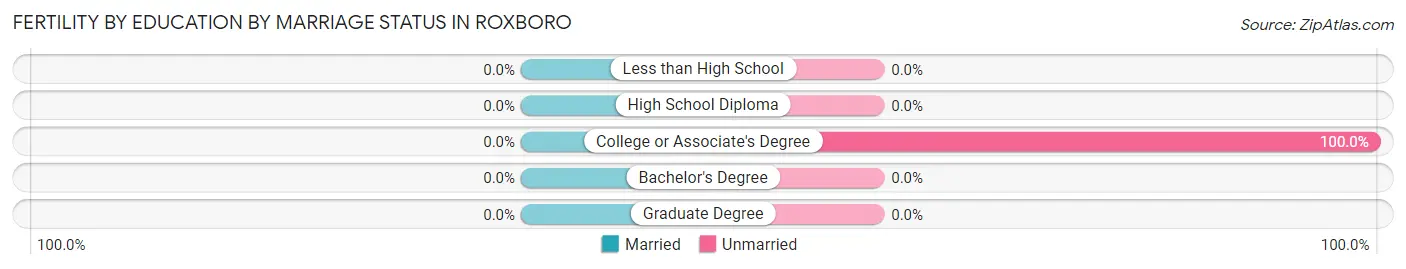
| Educational Attainment | Married | Unmarried |
| Less than High School | 0 (0.0%) | 0 (0.0%) |
| High School Diploma | 0 (0.0%) | 0 (0.0%) |
| College or Associate's Degree | 0 (0.0%) | 47 (100.0%) |
| Bachelor's Degree | 0 (0.0%) | 0 (0.0%) |
| Graduate Degree | 0 (0.0%) | 0 (0.0%) |
| Total | 0 (0.0%) | 47 (100.0%) |
Employment Characteristics in Roxboro
Employment by Class of Employer in Roxboro
Among the 3,623 employed individuals in Roxboro, private company employees (2,881 | 79.5%), not-for-profit organizations (267 | 7.4%), and local government employees (252 | 7.0%) make up the most common classes of employment.
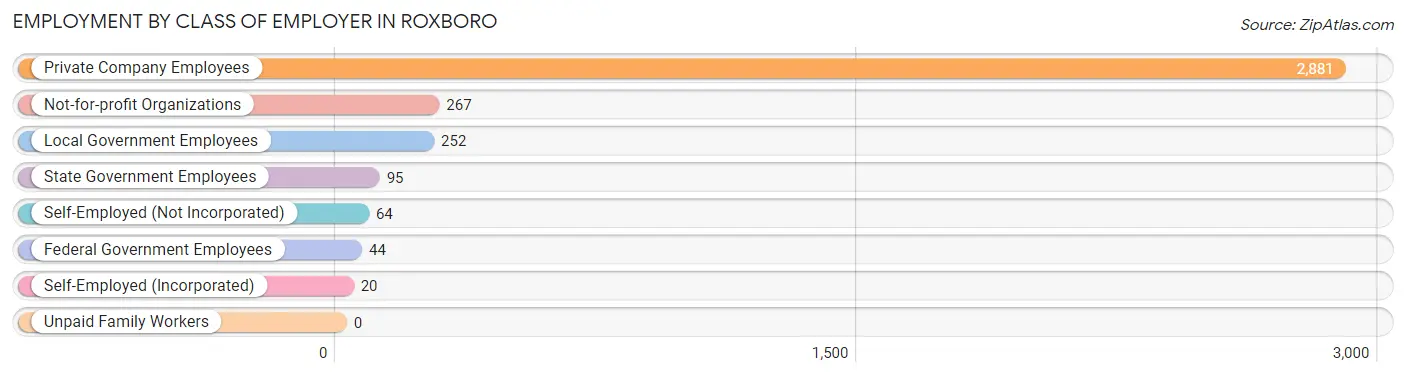
| Employer Class | # Employees | % Employees |
| Private Company Employees | 2,881 | 79.5% |
| Self-Employed (Incorporated) | 20 | 0.5% |
| Self-Employed (Not Incorporated) | 64 | 1.8% |
| Not-for-profit Organizations | 267 | 7.4% |
| Local Government Employees | 252 | 7.0% |
| State Government Employees | 95 | 2.6% |
| Federal Government Employees | 44 | 1.2% |
| Unpaid Family Workers | 0 | 0.0% |
| Total | 3,623 | 100.0% |
Employment Status by Age in Roxboro
According to the labor force statistics for Roxboro, out of the total population over 16 years of age (6,606), 59.2% or 3,911 individuals are in the labor force, with 4.8% or 188 of them unemployed. The age group with the highest labor force participation rate is 30 to 34 years, with 92.8% or 726 individuals in the labor force. Within the labor force, the 60 to 64 years age range has the highest percentage of unemployed individuals, with 21.8% or 79 of them being unemployed.
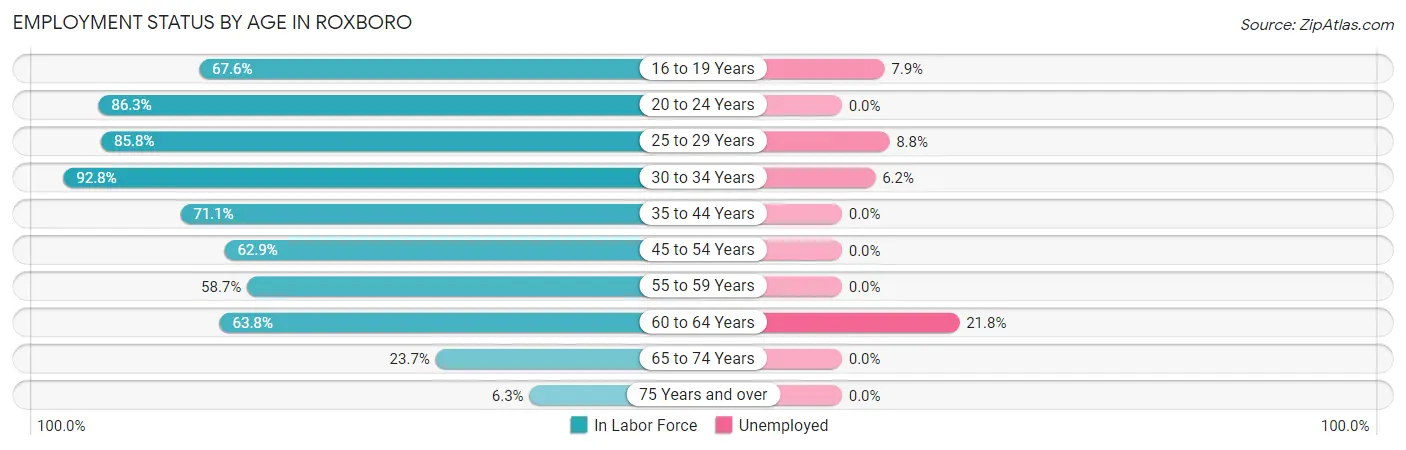
| Age Bracket | In Labor Force | Unemployed |
| 16 to 19 Years | 265 (67.6%) | 21 (7.9%) |
| 20 to 24 Years | 371 (86.3%) | 0 (0.0%) |
| 25 to 29 Years | 490 (85.8%) | 43 (8.8%) |
| 30 to 34 Years | 726 (92.8%) | 45 (6.2%) |
| 35 to 44 Years | 543 (71.1%) | 0 (0.0%) |
| 45 to 54 Years | 545 (62.9%) | 0 (0.0%) |
| 55 to 59 Years | 318 (58.7%) | 0 (0.0%) |
| 60 to 64 Years | 362 (63.8%) | 79 (21.8%) |
| 65 to 74 Years | 247 (23.7%) | 0 (0.0%) |
| 75 Years and over | 41 (6.3%) | 0 (0.0%) |
| Total | 3,911 (59.2%) | 188 (4.8%) |
Employment Status by Educational Attainment in Roxboro
According to labor force statistics for Roxboro, 72.9% of individuals (2,983) out of the total population between 25 and 64 years of age (4,092) are in the labor force, with 5.6% or 167 of them being unemployed. The group with the highest labor force participation rate are those with the educational attainment of high school diploma, with 77.3% or 1,130 individuals in the labor force. Within the labor force, individuals with bachelor's degree or higher education have the highest percentage of unemployment, with 13.8% or 69 of them being unemployed.
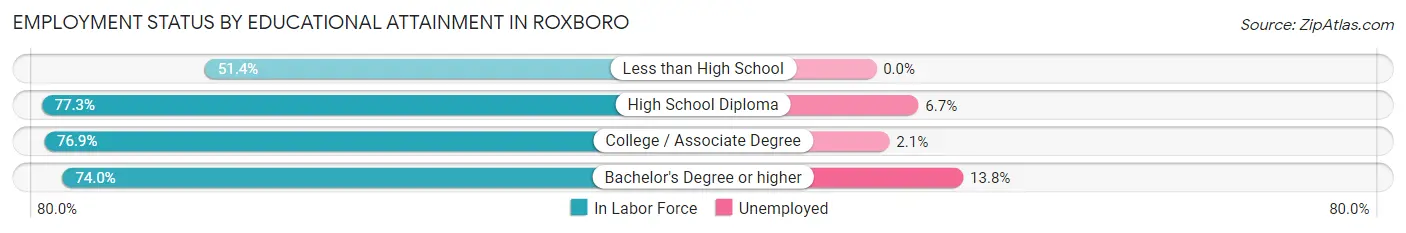
| Educational Attainment | In Labor Force | Unemployed |
| Less than High School | 302 (51.4%) | 0 (0.0%) |
| High School Diploma | 1,130 (77.3%) | 98 (6.7%) |
| College / Associate Degree | 1,050 (76.9%) | 29 (2.1%) |
| Bachelor's Degree or higher | 501 (74.0%) | 93 (13.8%) |
| Total | 2,983 (72.9%) | 229 (5.6%) |
Employment Occupations by Sex in Roxboro
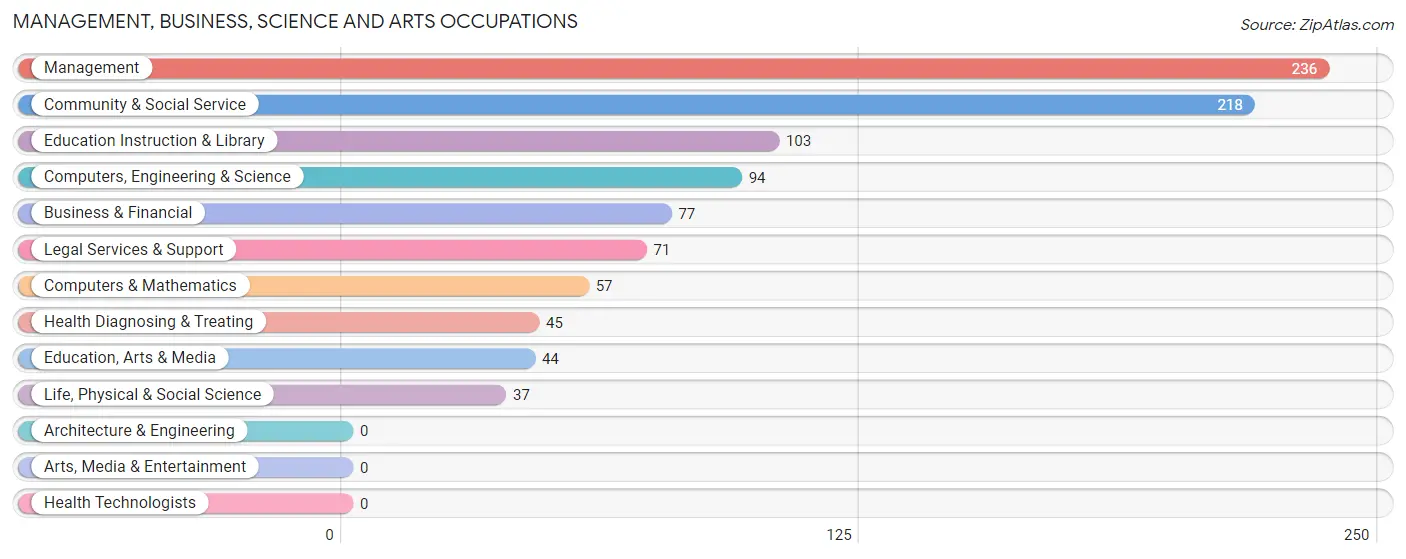
Management, Business, Science and Arts Occupations
The most common Management, Business, Science and Arts occupations in Roxboro are Management (236 | 6.4%), Community & Social Service (218 | 5.9%), Education Instruction & Library (103 | 2.8%), Computers, Engineering & Science (94 | 2.5%), and Business & Financial (77 | 2.1%).
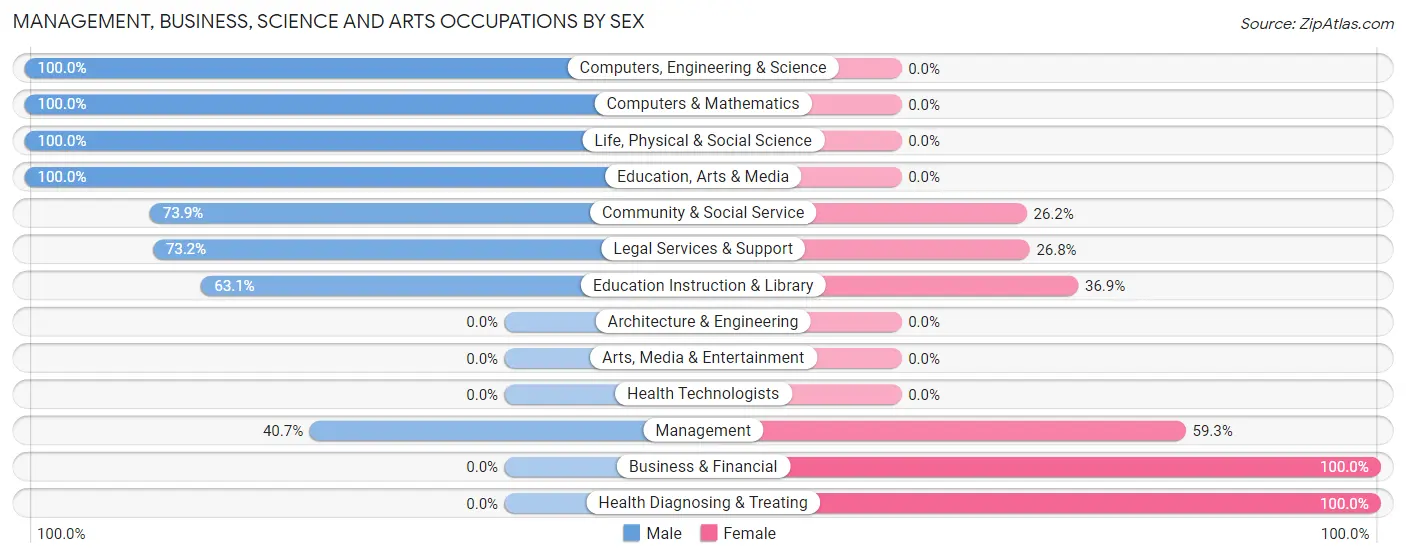
Management, Business, Science and Arts Occupations by Sex
Within the Management, Business, Science and Arts occupations in Roxboro, the most male-oriented occupations are Computers, Engineering & Science (100.0%), Computers & Mathematics (100.0%), and Life, Physical & Social Science (100.0%), while the most female-oriented occupations are Business & Financial (100.0%), Health Diagnosing & Treating (100.0%), and Management (59.3%).
| Occupation | Male | Female |
| Management | 96 (40.7%) | 140 (59.3%) |
| Business & Financial | 0 (0.0%) | 77 (100.0%) |
| Computers, Engineering & Science | 94 (100.0%) | 0 (0.0%) |
| Computers & Mathematics | 57 (100.0%) | 0 (0.0%) |
| Architecture & Engineering | 0 (0.0%) | 0 (0.0%) |
| Life, Physical & Social Science | 37 (100.0%) | 0 (0.0%) |
| Community & Social Service | 161 (73.9%) | 57 (26.2%) |
| Education, Arts & Media | 44 (100.0%) | 0 (0.0%) |
| Legal Services & Support | 52 (73.2%) | 19 (26.8%) |
| Education Instruction & Library | 65 (63.1%) | 38 (36.9%) |
| Arts, Media & Entertainment | 0 (0.0%) | 0 (0.0%) |
| Health Diagnosing & Treating | 0 (0.0%) | 45 (100.0%) |
| Health Technologists | 0 (0.0%) | 0 (0.0%) |
| Total (Category) | 351 (52.4%) | 319 (47.6%) |
| Total (Overall) | 1,865 (50.3%) | 1,842 (49.7%) |
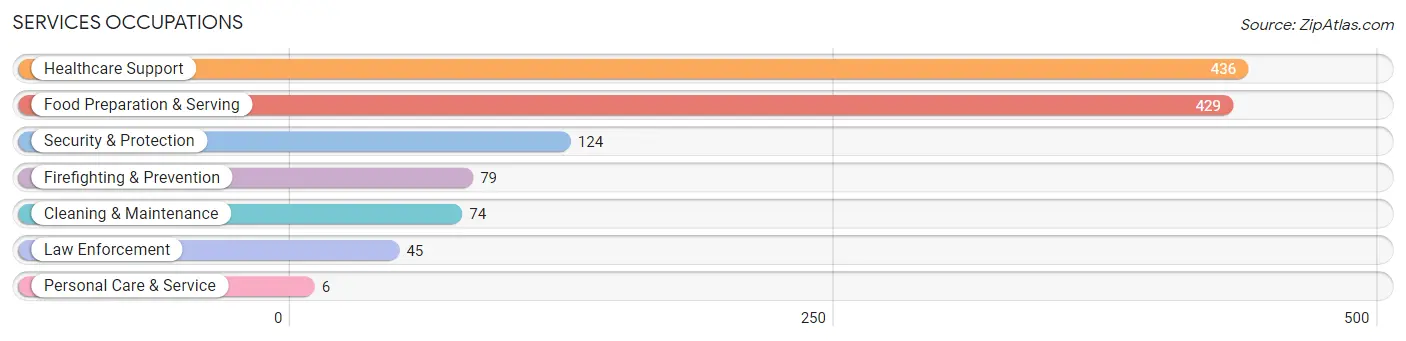
Services Occupations
The most common Services occupations in Roxboro are Healthcare Support (436 | 11.8%), Food Preparation & Serving (429 | 11.6%), Security & Protection (124 | 3.4%), Firefighting & Prevention (79 | 2.1%), and Cleaning & Maintenance (74 | 2.0%).
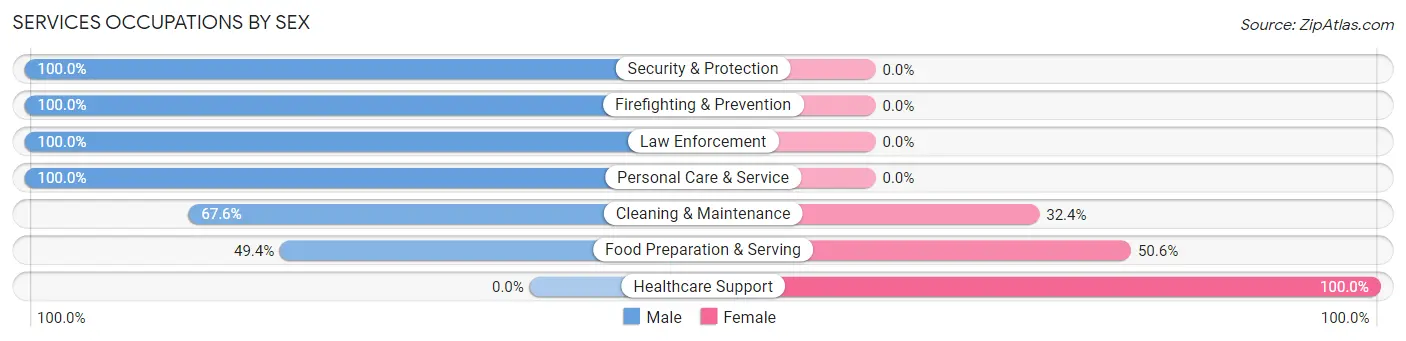
Services Occupations by Sex
Within the Services occupations in Roxboro, the most male-oriented occupations are Security & Protection (100.0%), Firefighting & Prevention (100.0%), and Law Enforcement (100.0%), while the most female-oriented occupations are Healthcare Support (100.0%), Food Preparation & Serving (50.6%), and Cleaning & Maintenance (32.4%).
| Occupation | Male | Female |
| Healthcare Support | 0 (0.0%) | 436 (100.0%) |
| Security & Protection | 124 (100.0%) | 0 (0.0%) |
| Firefighting & Prevention | 79 (100.0%) | 0 (0.0%) |
| Law Enforcement | 45 (100.0%) | 0 (0.0%) |
| Food Preparation & Serving | 212 (49.4%) | 217 (50.6%) |
| Cleaning & Maintenance | 50 (67.6%) | 24 (32.4%) |
| Personal Care & Service | 6 (100.0%) | 0 (0.0%) |
| Total (Category) | 392 (36.7%) | 677 (63.3%) |
| Total (Overall) | 1,865 (50.3%) | 1,842 (49.7%) |
Sales and Office Occupations
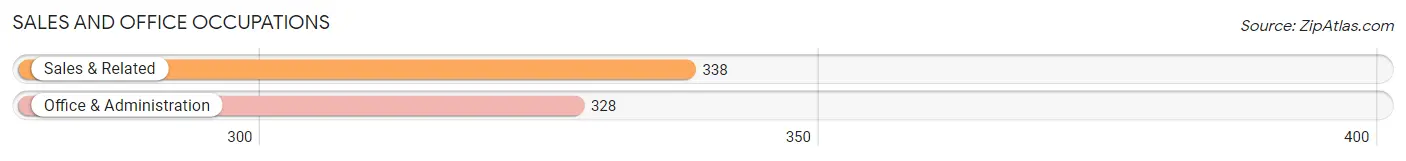
The most common Sales and Office occupations in Roxboro are Sales & Related (338 | 9.1%), and Office & Administration (328 | 8.8%).
Sales and Office Occupations by Sex
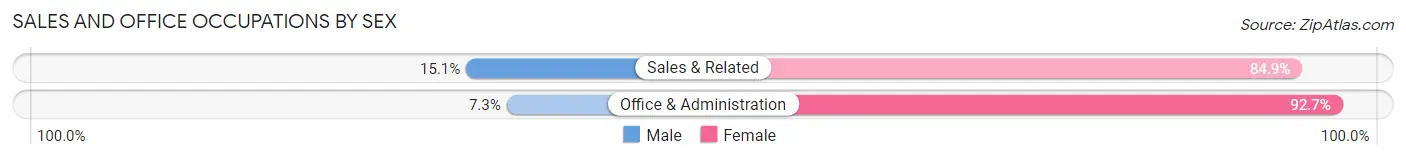
| Occupation | Male | Female |
| Sales & Related | 51 (15.1%) | 287 (84.9%) |
| Office & Administration | 24 (7.3%) | 304 (92.7%) |
| Total (Category) | 75 (11.3%) | 591 (88.7%) |
| Total (Overall) | 1,865 (50.3%) | 1,842 (49.7%) |
Natural Resources, Construction and Maintenance Occupations
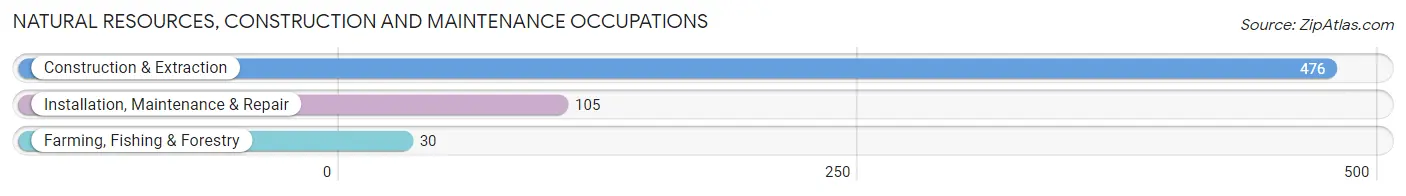
The most common Natural Resources, Construction and Maintenance occupations in Roxboro are Construction & Extraction (476 | 12.8%), Installation, Maintenance & Repair (105 | 2.8%), and Farming, Fishing & Forestry (30 | 0.8%).
Natural Resources, Construction and Maintenance Occupations by Sex
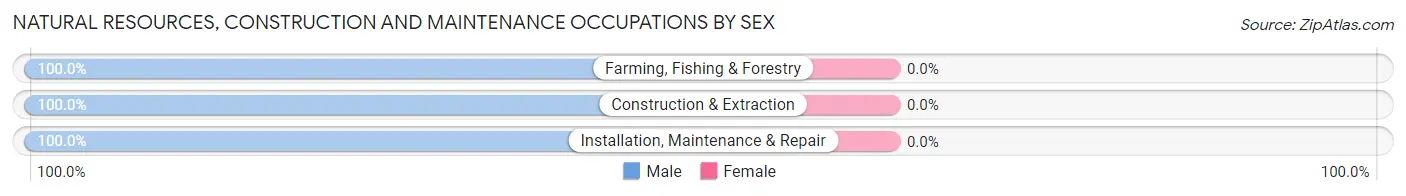
| Occupation | Male | Female |
| Farming, Fishing & Forestry | 30 (100.0%) | 0 (0.0%) |
| Construction & Extraction | 476 (100.0%) | 0 (0.0%) |
| Installation, Maintenance & Repair | 105 (100.0%) | 0 (0.0%) |
| Total (Category) | 611 (100.0%) | 0 (0.0%) |
| Total (Overall) | 1,865 (50.3%) | 1,842 (49.7%) |
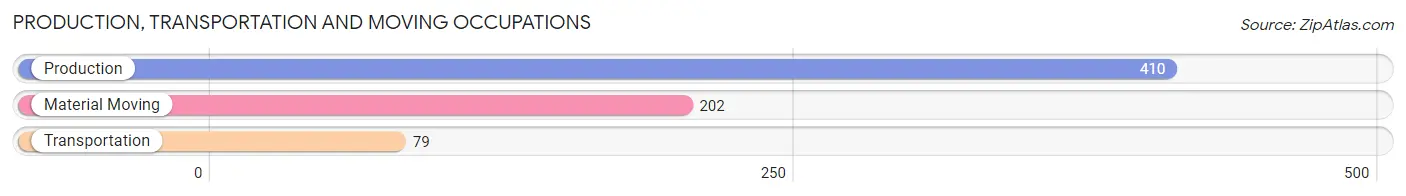
Production, Transportation and Moving Occupations
The most common Production, Transportation and Moving occupations in Roxboro are Production (410 | 11.1%), Material Moving (202 | 5.4%), and Transportation (79 | 2.1%).
Production, Transportation and Moving Occupations by Sex
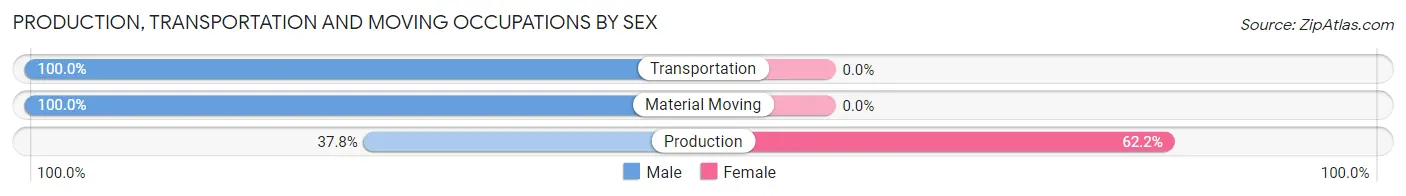
| Occupation | Male | Female |
| Production | 155 (37.8%) | 255 (62.2%) |
| Transportation | 79 (100.0%) | 0 (0.0%) |
| Material Moving | 202 (100.0%) | 0 (0.0%) |
| Total (Category) | 436 (63.1%) | 255 (36.9%) |
| Total (Overall) | 1,865 (50.3%) | 1,842 (49.7%) |
Employment Industries by Sex in Roxboro
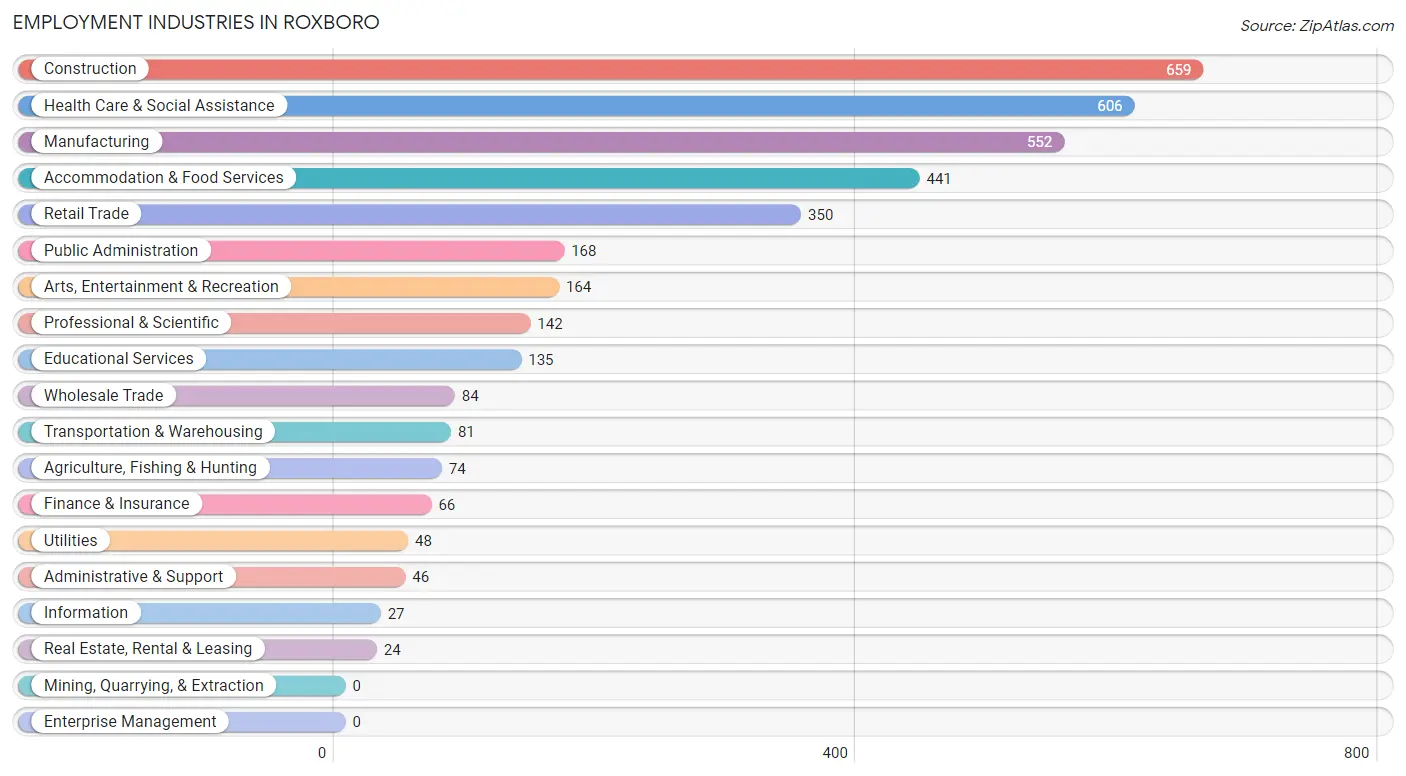
Employment Industries in Roxboro
The major employment industries in Roxboro include Construction (659 | 17.8%), Health Care & Social Assistance (606 | 16.4%), Manufacturing (552 | 14.9%), Accommodation & Food Services (441 | 11.9%), and Retail Trade (350 | 9.4%).
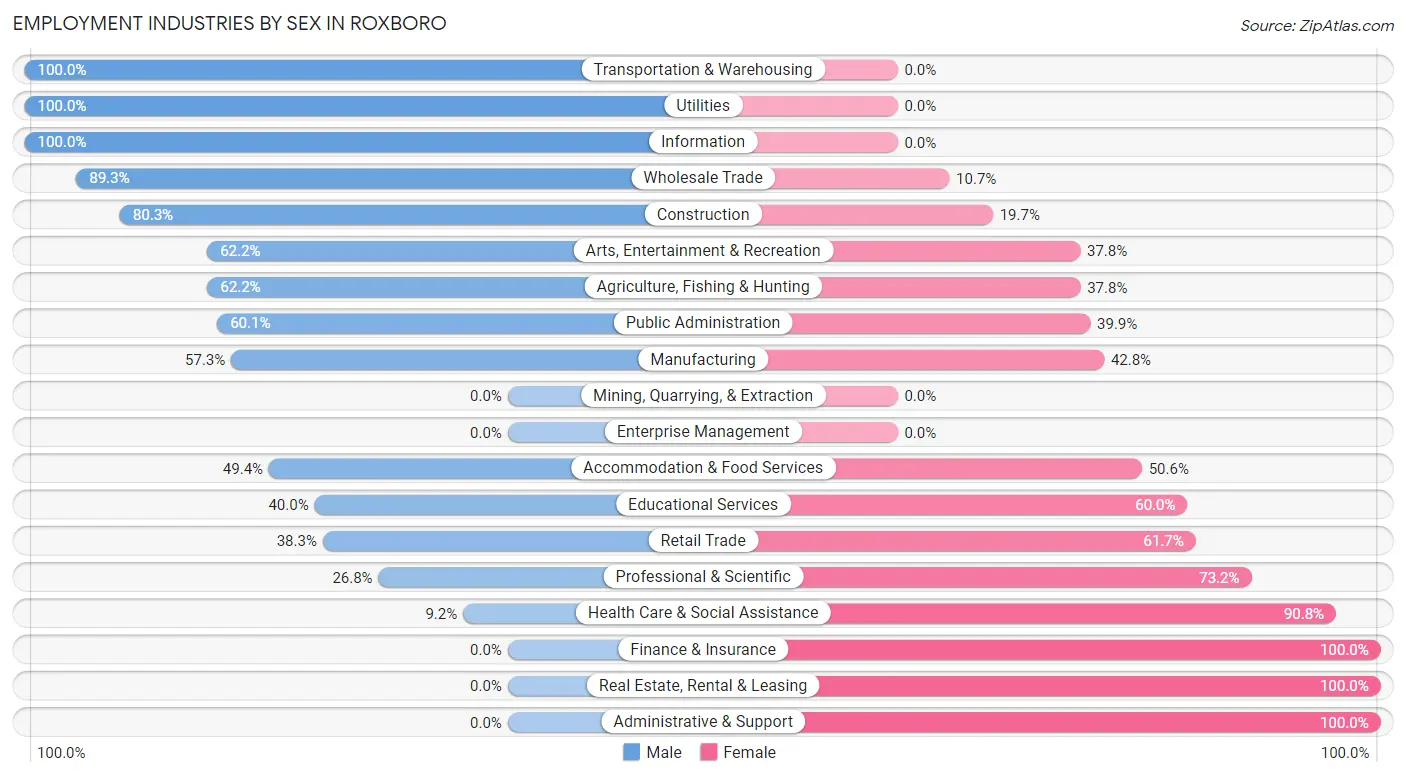
Employment Industries by Sex in Roxboro
The Roxboro industries that see more men than women are Transportation & Warehousing (100.0%), Utilities (100.0%), and Information (100.0%), whereas the industries that tend to have a higher number of women are Finance & Insurance (100.0%), Real Estate, Rental & Leasing (100.0%), and Administrative & Support (100.0%).
| Industry | Male | Female |
| Agriculture, Fishing & Hunting | 46 (62.2%) | 28 (37.8%) |
| Mining, Quarrying, & Extraction | 0 (0.0%) | 0 (0.0%) |
| Construction | 529 (80.3%) | 130 (19.7%) |
| Manufacturing | 316 (57.3%) | 236 (42.7%) |
| Wholesale Trade | 75 (89.3%) | 9 (10.7%) |
| Retail Trade | 134 (38.3%) | 216 (61.7%) |
| Transportation & Warehousing | 81 (100.0%) | 0 (0.0%) |
| Utilities | 48 (100.0%) | 0 (0.0%) |
| Information | 27 (100.0%) | 0 (0.0%) |
| Finance & Insurance | 0 (0.0%) | 66 (100.0%) |
| Real Estate, Rental & Leasing | 0 (0.0%) | 24 (100.0%) |
| Professional & Scientific | 38 (26.8%) | 104 (73.2%) |
| Enterprise Management | 0 (0.0%) | 0 (0.0%) |
| Administrative & Support | 0 (0.0%) | 46 (100.0%) |
| Educational Services | 54 (40.0%) | 81 (60.0%) |
| Health Care & Social Assistance | 56 (9.2%) | 550 (90.8%) |
| Arts, Entertainment & Recreation | 102 (62.2%) | 62 (37.8%) |
| Accommodation & Food Services | 218 (49.4%) | 223 (50.6%) |
| Public Administration | 101 (60.1%) | 67 (39.9%) |
| Total | 1,865 (50.3%) | 1,842 (49.7%) |
Education in Roxboro
School Enrollment in Roxboro
The most common levels of schooling among the 1,601 students in Roxboro are middle school (423 | 26.4%), high school (334 | 20.9%), and college / undergraduate (247 | 15.4%).
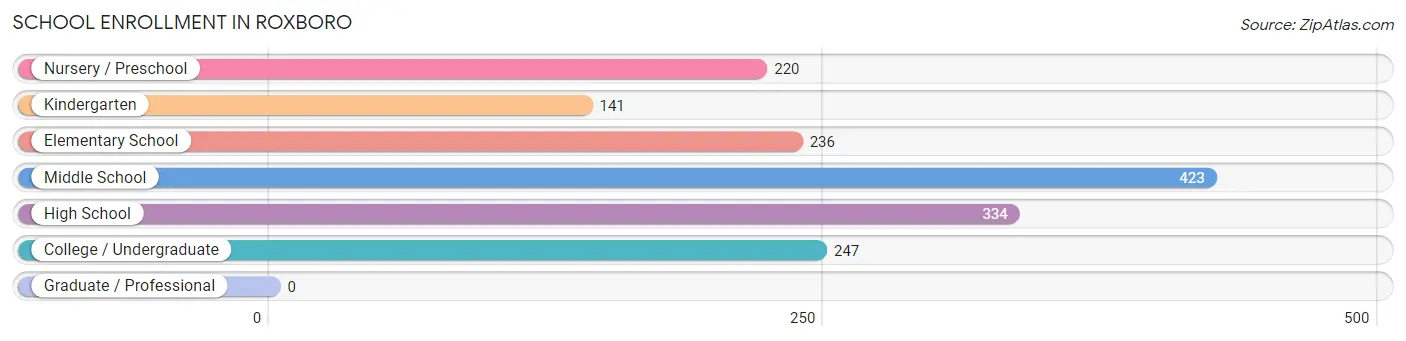
| School Level | # Students | % Students |
| Nursery / Preschool | 220 | 13.7% |
| Kindergarten | 141 | 8.8% |
| Elementary School | 236 | 14.7% |
| Middle School | 423 | 26.4% |
| High School | 334 | 20.9% |
| College / Undergraduate | 247 | 15.4% |
| Graduate / Professional | 0 | 0.0% |
| Total | 1,601 | 100.0% |
School Enrollment by Age by Funding Source in Roxboro
Out of a total of 1,601 students who are enrolled in schools in Roxboro, 146 (9.1%) attend a private institution, while the remaining 1,455 (90.9%) are enrolled in public schools. The age group of 3 to 4 year olds has the highest likelihood of being enrolled in private schools, with 120 (60.9% in the age bracket) enrolled. Conversely, the age group of 15 to 17 year olds has the lowest likelihood of being enrolled in a private school, with 255 (100.0% in the age bracket) attending a public institution.
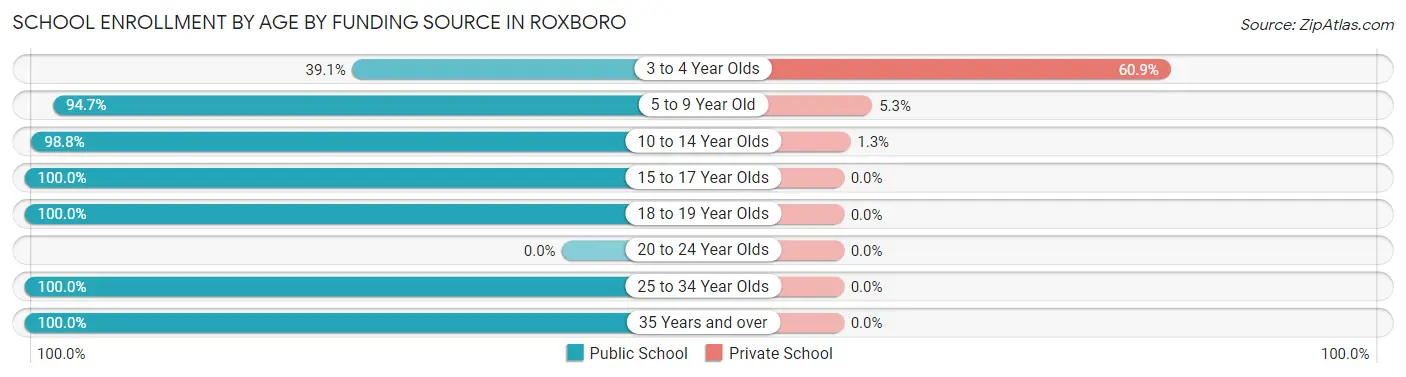
| Age Bracket | Public School | Private School |
| 3 to 4 Year Olds | 77 (39.1%) | 120 (60.9%) |
| 5 to 9 Year Old | 356 (94.7%) | 20 (5.3%) |
| 10 to 14 Year Olds | 474 (98.8%) | 6 (1.3%) |
| 15 to 17 Year Olds | 255 (100.0%) | 0 (0.0%) |
| 18 to 19 Year Olds | 146 (100.0%) | 0 (0.0%) |
| 20 to 24 Year Olds | 0 (0.0%) | 0 (0.0%) |
| 25 to 34 Year Olds | 45 (100.0%) | 0 (0.0%) |
| 35 Years and over | 102 (100.0%) | 0 (0.0%) |
| Total | 1,455 (90.9%) | 146 (9.1%) |
Educational Attainment by Field of Study in Roxboro
Business (271 | 23.9%), arts & humanities (119 | 10.5%), psychology (118 | 10.4%), social sciences (107 | 9.4%), and education (104 | 9.2%) are the most common fields of study among 1,134 individuals in Roxboro who have obtained a bachelor's degree or higher.
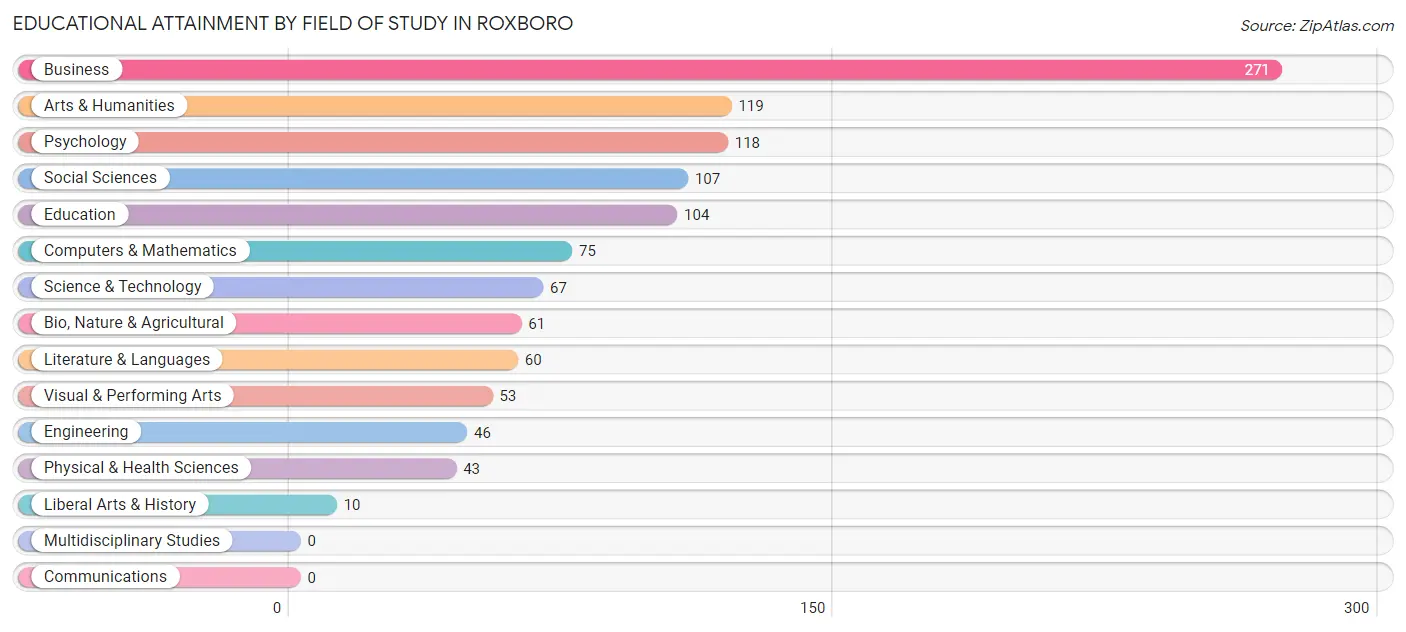
| Field of Study | # Graduates | % Graduates |
| Computers & Mathematics | 75 | 6.6% |
| Bio, Nature & Agricultural | 61 | 5.4% |
| Physical & Health Sciences | 43 | 3.8% |
| Psychology | 118 | 10.4% |
| Social Sciences | 107 | 9.4% |
| Engineering | 46 | 4.1% |
| Multidisciplinary Studies | 0 | 0.0% |
| Science & Technology | 67 | 5.9% |
| Business | 271 | 23.9% |
| Education | 104 | 9.2% |
| Literature & Languages | 60 | 5.3% |
| Liberal Arts & History | 10 | 0.9% |
| Visual & Performing Arts | 53 | 4.7% |
| Communications | 0 | 0.0% |
| Arts & Humanities | 119 | 10.5% |
| Total | 1,134 | 100.0% |
Transportation & Commute in Roxboro
Vehicle Availability by Sex in Roxboro
The most prevalent vehicle ownership categories in Roxboro are males with 2 vehicles (966, accounting for 53.0%) and females with 2 vehicles (849, making up 54.4%).
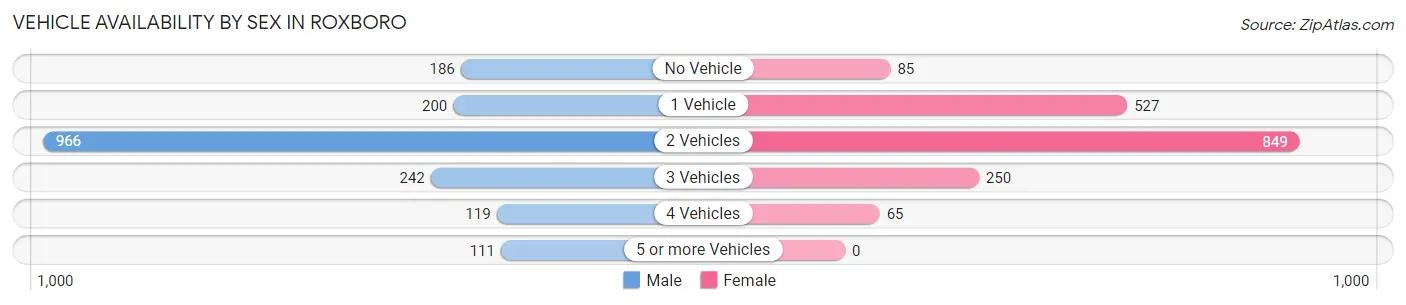
| Vehicles Available | Male | Female |
| No Vehicle | 186 (10.2%) | 85 (4.8%) |
| 1 Vehicle | 200 (11.0%) | 527 (29.7%) |
| 2 Vehicles | 966 (53.0%) | 849 (47.8%) |
| 3 Vehicles | 242 (13.3%) | 250 (14.1%) |
| 4 Vehicles | 119 (6.5%) | 65 (3.7%) |
| 5 or more Vehicles | 111 (6.1%) | 0 (0.0%) |
| Total | 1,824 (100.0%) | 1,776 (100.0%) |
Commute Time in Roxboro
The most frequently occuring commute durations in Roxboro are 30 to 34 minutes (488 commuters, 14.4%), 60 to 89 minutes (456 commuters, 13.5%), and 5 to 9 minutes (410 commuters, 12.1%).
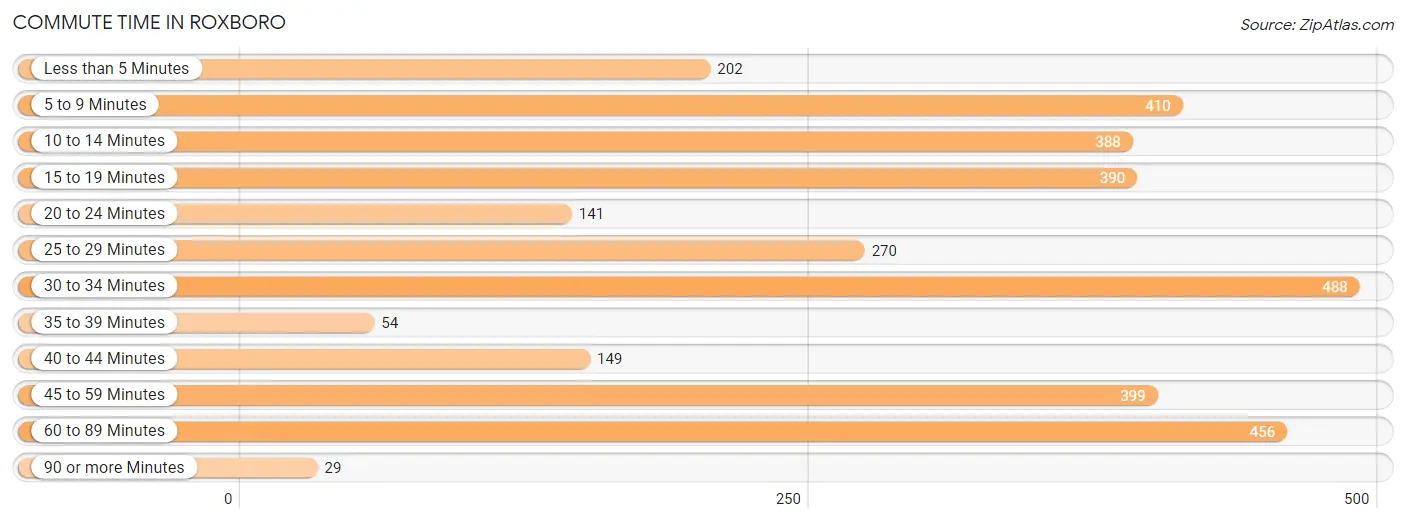
| Commute Time | # Commuters | % Commuters |
| Less than 5 Minutes | 202 | 6.0% |
| 5 to 9 Minutes | 410 | 12.1% |
| 10 to 14 Minutes | 388 | 11.5% |
| 15 to 19 Minutes | 390 | 11.6% |
| 20 to 24 Minutes | 141 | 4.2% |
| 25 to 29 Minutes | 270 | 8.0% |
| 30 to 34 Minutes | 488 | 14.4% |
| 35 to 39 Minutes | 54 | 1.6% |
| 40 to 44 Minutes | 149 | 4.4% |
| 45 to 59 Minutes | 399 | 11.8% |
| 60 to 89 Minutes | 456 | 13.5% |
| 90 or more Minutes | 29 | 0.9% |
Commute Time by Sex in Roxboro
The most common commute times in Roxboro are 60 to 89 minutes (371 commuters, 20.9%) for males and 30 to 34 minutes (351 commuters, 21.9%) for females.
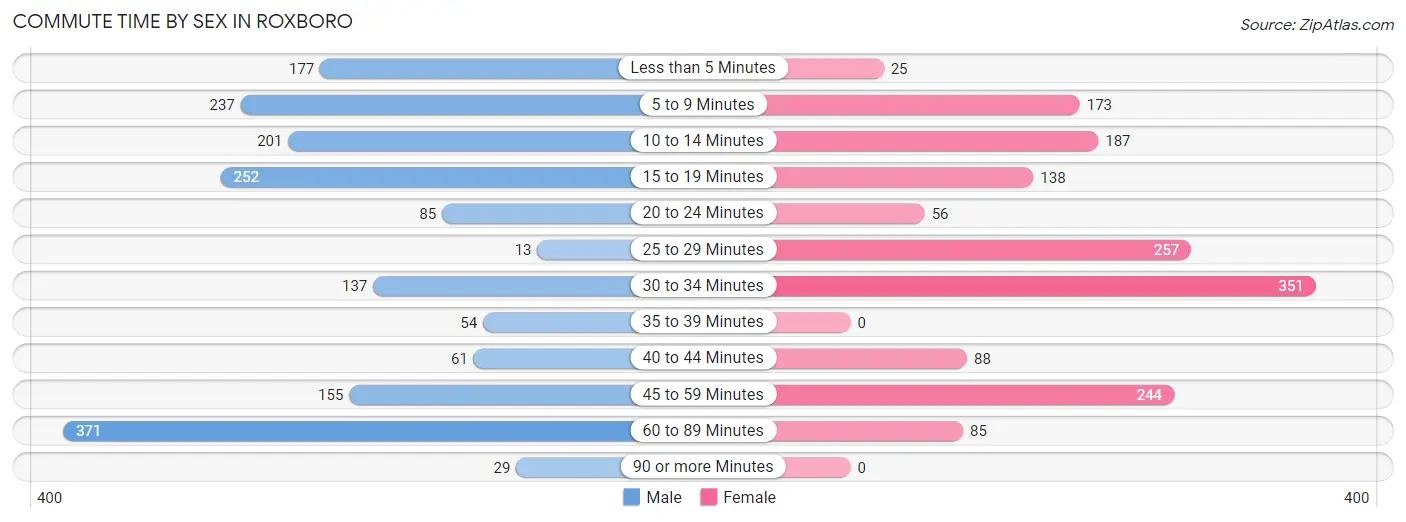
| Commute Time | Male | Female |
| Less than 5 Minutes | 177 (10.0%) | 25 (1.6%) |
| 5 to 9 Minutes | 237 (13.4%) | 173 (10.8%) |
| 10 to 14 Minutes | 201 (11.3%) | 187 (11.7%) |
| 15 to 19 Minutes | 252 (14.2%) | 138 (8.6%) |
| 20 to 24 Minutes | 85 (4.8%) | 56 (3.5%) |
| 25 to 29 Minutes | 13 (0.7%) | 257 (16.0%) |
| 30 to 34 Minutes | 137 (7.7%) | 351 (21.9%) |
| 35 to 39 Minutes | 54 (3.0%) | 0 (0.0%) |
| 40 to 44 Minutes | 61 (3.4%) | 88 (5.5%) |
| 45 to 59 Minutes | 155 (8.7%) | 244 (15.2%) |
| 60 to 89 Minutes | 371 (20.9%) | 85 (5.3%) |
| 90 or more Minutes | 29 (1.6%) | 0 (0.0%) |
Time of Departure to Work by Sex in Roxboro
The most frequent times of departure to work in Roxboro are 5:30 AM to 5:59 AM (353, 19.9%) for males and 12:00 AM to 4:59 AM (303, 18.9%) for females.
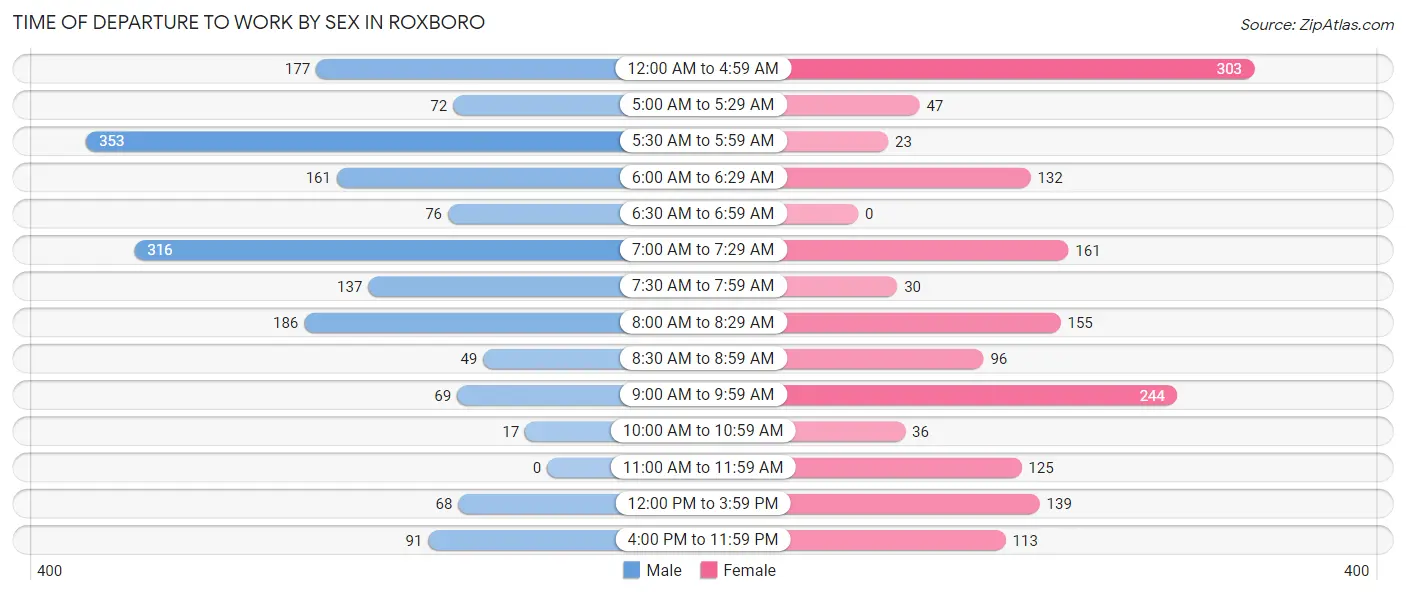
| Time of Departure | Male | Female |
| 12:00 AM to 4:59 AM | 177 (10.0%) | 303 (18.9%) |
| 5:00 AM to 5:29 AM | 72 (4.1%) | 47 (2.9%) |
| 5:30 AM to 5:59 AM | 353 (19.9%) | 23 (1.4%) |
| 6:00 AM to 6:29 AM | 161 (9.1%) | 132 (8.2%) |
| 6:30 AM to 6:59 AM | 76 (4.3%) | 0 (0.0%) |
| 7:00 AM to 7:29 AM | 316 (17.8%) | 161 (10.0%) |
| 7:30 AM to 7:59 AM | 137 (7.7%) | 30 (1.9%) |
| 8:00 AM to 8:29 AM | 186 (10.5%) | 155 (9.7%) |
| 8:30 AM to 8:59 AM | 49 (2.8%) | 96 (6.0%) |
| 9:00 AM to 9:59 AM | 69 (3.9%) | 244 (15.2%) |
| 10:00 AM to 10:59 AM | 17 (1.0%) | 36 (2.2%) |
| 11:00 AM to 11:59 AM | 0 (0.0%) | 125 (7.8%) |
| 12:00 PM to 3:59 PM | 68 (3.8%) | 139 (8.7%) |
| 4:00 PM to 11:59 PM | 91 (5.1%) | 113 (7.0%) |
| Total | 1,772 (100.0%) | 1,604 (100.0%) |
Housing Occupancy in Roxboro
Occupancy by Ownership in Roxboro
Of the total 3,530 dwellings in Roxboro, owner-occupied units account for 1,780 (50.4%), while renter-occupied units make up 1,750 (49.6%).
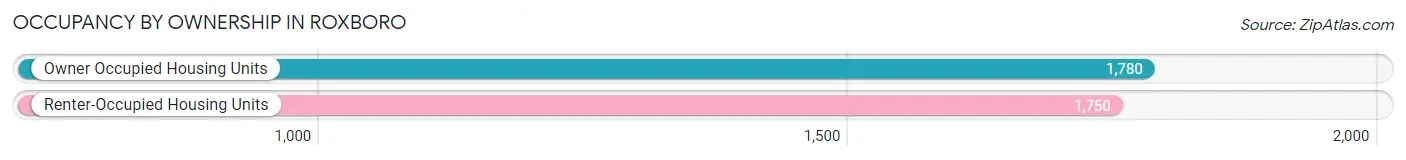
| Occupancy | # Housing Units | % Housing Units |
| Owner Occupied Housing Units | 1,780 | 50.4% |
| Renter-Occupied Housing Units | 1,750 | 49.6% |
| Total Occupied Housing Units | 3,530 | 100.0% |
Occupancy by Household Size in Roxboro
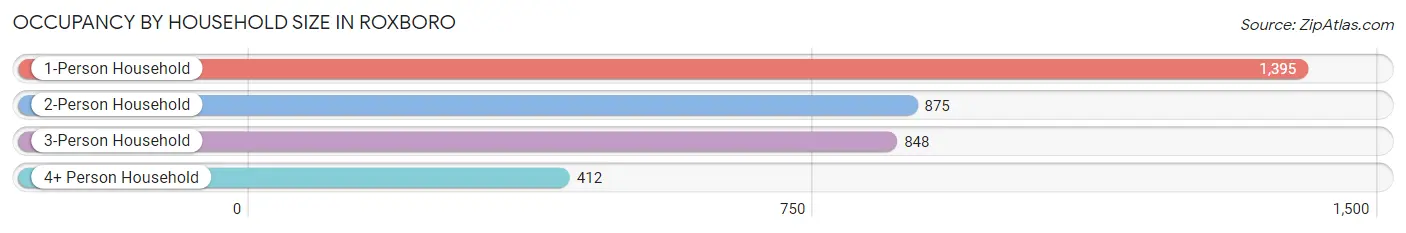
| Household Size | # Housing Units | % Housing Units |
| 1-Person Household | 1,395 | 39.5% |
| 2-Person Household | 875 | 24.8% |
| 3-Person Household | 848 | 24.0% |
| 4+ Person Household | 412 | 11.7% |
| Total Housing Units | 3,530 | 100.0% |
Occupancy by Ownership by Household Size in Roxboro
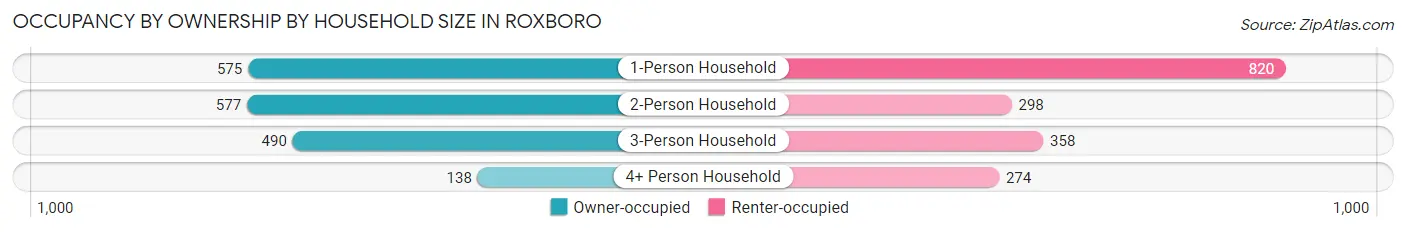
| Household Size | Owner-occupied | Renter-occupied |
| 1-Person Household | 575 (41.2%) | 820 (58.8%) |
| 2-Person Household | 577 (65.9%) | 298 (34.1%) |
| 3-Person Household | 490 (57.8%) | 358 (42.2%) |
| 4+ Person Household | 138 (33.5%) | 274 (66.5%) |
| Total Housing Units | 1,780 (50.4%) | 1,750 (49.6%) |
Occupancy by Educational Attainment in Roxboro
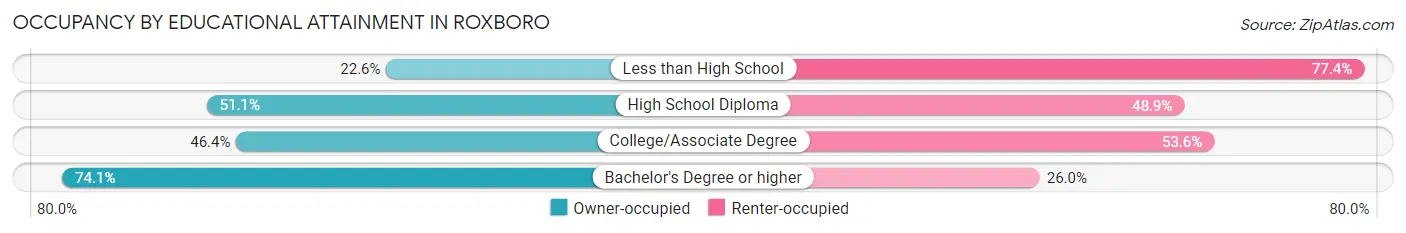
| Household Size | Owner-occupied | Renter-occupied |
| Less than High School | 95 (22.6%) | 325 (77.4%) |
| High School Diploma | 655 (51.1%) | 626 (48.9%) |
| College/Associate Degree | 545 (46.4%) | 629 (53.6%) |
| Bachelor's Degree or higher | 485 (74.1%) | 170 (26.0%) |
Occupancy by Age of Householder in Roxboro
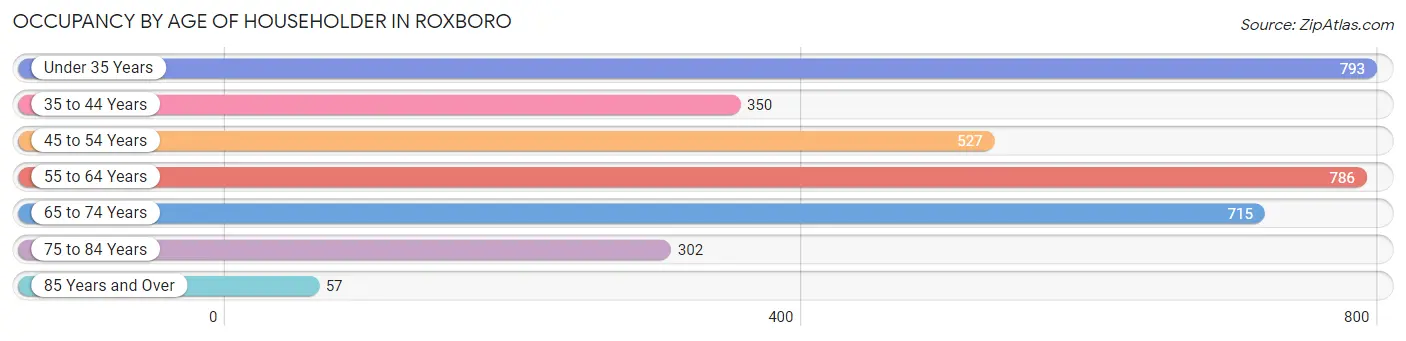
| Age Bracket | # Households | % Households |
| Under 35 Years | 793 | 22.5% |
| 35 to 44 Years | 350 | 9.9% |
| 45 to 54 Years | 527 | 14.9% |
| 55 to 64 Years | 786 | 22.3% |
| 65 to 74 Years | 715 | 20.3% |
| 75 to 84 Years | 302 | 8.6% |
| 85 Years and Over | 57 | 1.6% |
| Total | 3,530 | 100.0% |
Housing Finances in Roxboro
Median Income by Occupancy in Roxboro
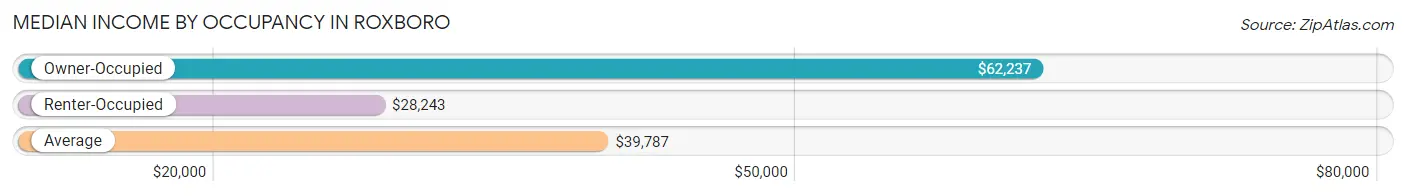
| Occupancy Type | # Households | Median Income |
| Owner-Occupied | 1,780 (50.4%) | $62,237 |
| Renter-Occupied | 1,750 (49.6%) | $28,243 |
| Average | 3,530 (100.0%) | $39,787 |
Occupancy by Householder Income Bracket in Roxboro
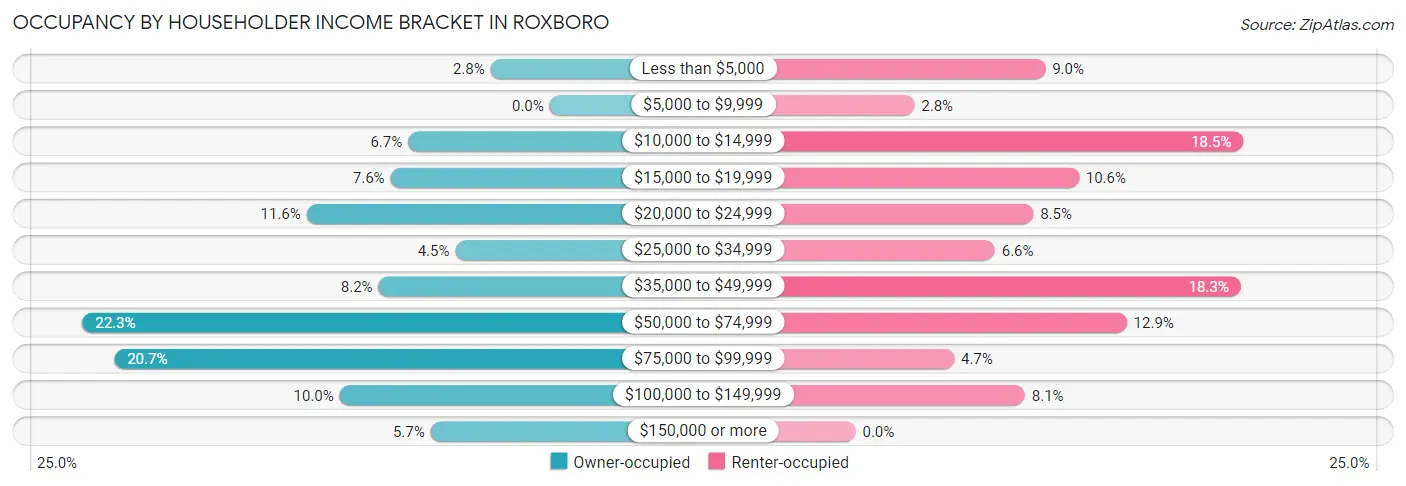
| Income Bracket | Owner-occupied | Renter-occupied |
| Less than $5,000 | 50 (2.8%) | 158 (9.0%) |
| $5,000 to $9,999 | 0 (0.0%) | 49 (2.8%) |
| $10,000 to $14,999 | 120 (6.7%) | 323 (18.5%) |
| $15,000 to $19,999 | 135 (7.6%) | 186 (10.6%) |
| $20,000 to $24,999 | 206 (11.6%) | 148 (8.5%) |
| $25,000 to $34,999 | 80 (4.5%) | 116 (6.6%) |
| $35,000 to $49,999 | 145 (8.2%) | 321 (18.3%) |
| $50,000 to $74,999 | 396 (22.3%) | 226 (12.9%) |
| $75,000 to $99,999 | 369 (20.7%) | 82 (4.7%) |
| $100,000 to $149,999 | 178 (10.0%) | 141 (8.1%) |
| $150,000 or more | 101 (5.7%) | 0 (0.0%) |
| Total | 1,780 (100.0%) | 1,750 (100.0%) |
Monthly Housing Cost Tiers in Roxboro
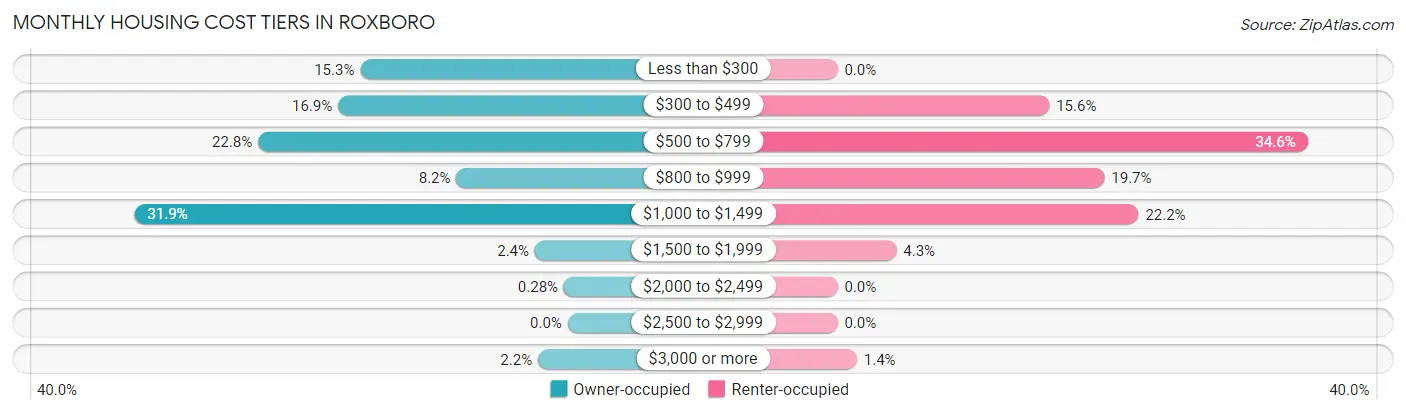
| Monthly Cost | Owner-occupied | Renter-occupied |
| Less than $300 | 272 (15.3%) | 0 (0.0%) |
| $300 to $499 | 301 (16.9%) | 273 (15.6%) |
| $500 to $799 | 406 (22.8%) | 606 (34.6%) |
| $800 to $999 | 146 (8.2%) | 344 (19.7%) |
| $1,000 to $1,499 | 568 (31.9%) | 388 (22.2%) |
| $1,500 to $1,999 | 43 (2.4%) | 76 (4.3%) |
| $2,000 to $2,499 | 5 (0.3%) | 0 (0.0%) |
| $2,500 to $2,999 | 0 (0.0%) | 0 (0.0%) |
| $3,000 or more | 39 (2.2%) | 25 (1.4%) |
| Total | 1,780 (100.0%) | 1,750 (100.0%) |
Physical Housing Characteristics in Roxboro
Housing Structures in Roxboro
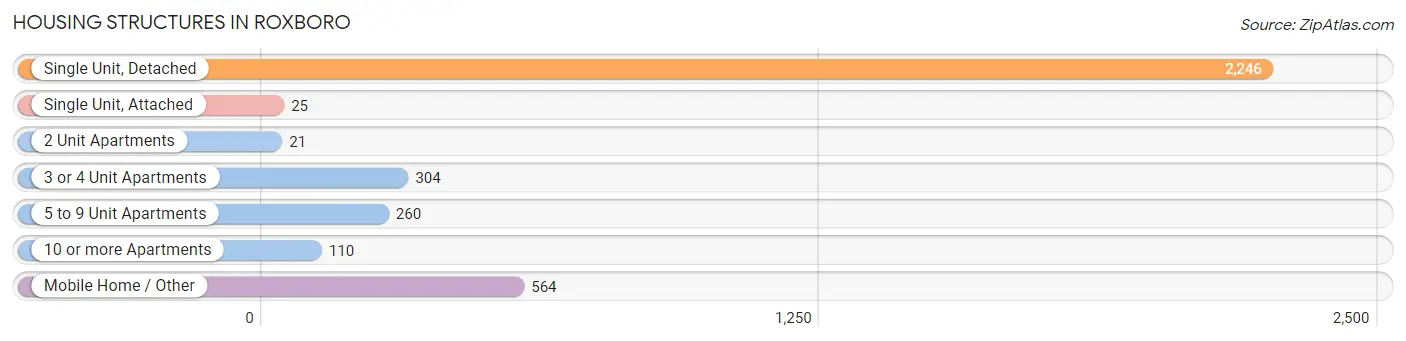
| Structure Type | # Housing Units | % Housing Units |
| Single Unit, Detached | 2,246 | 63.6% |
| Single Unit, Attached | 25 | 0.7% |
| 2 Unit Apartments | 21 | 0.6% |
| 3 or 4 Unit Apartments | 304 | 8.6% |
| 5 to 9 Unit Apartments | 260 | 7.4% |
| 10 or more Apartments | 110 | 3.1% |
| Mobile Home / Other | 564 | 16.0% |
| Total | 3,530 | 100.0% |
Housing Structures by Occupancy in Roxboro
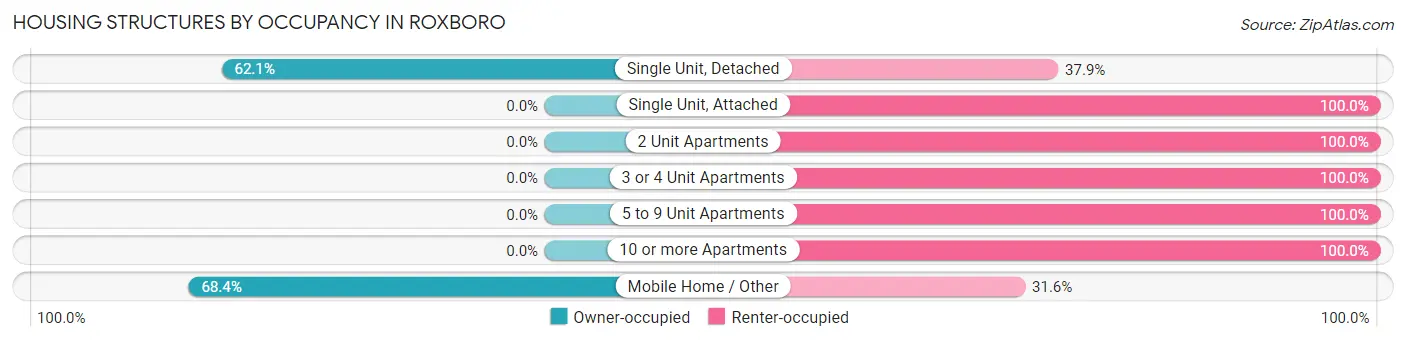
| Structure Type | Owner-occupied | Renter-occupied |
| Single Unit, Detached | 1,394 (62.1%) | 852 (37.9%) |
| Single Unit, Attached | 0 (0.0%) | 25 (100.0%) |
| 2 Unit Apartments | 0 (0.0%) | 21 (100.0%) |
| 3 or 4 Unit Apartments | 0 (0.0%) | 304 (100.0%) |
| 5 to 9 Unit Apartments | 0 (0.0%) | 260 (100.0%) |
| 10 or more Apartments | 0 (0.0%) | 110 (100.0%) |
| Mobile Home / Other | 386 (68.4%) | 178 (31.6%) |
| Total | 1,780 (50.4%) | 1,750 (49.6%) |
Housing Structures by Number of Rooms in Roxboro
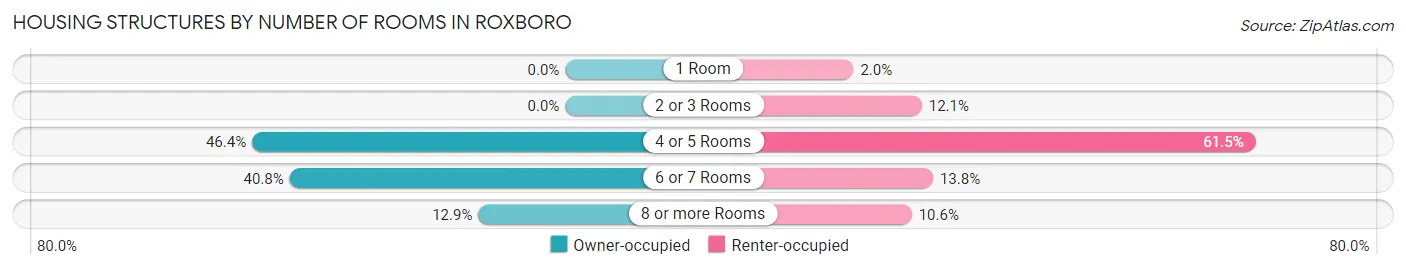
| Number of Rooms | Owner-occupied | Renter-occupied |
| 1 Room | 0 (0.0%) | 35 (2.0%) |
| 2 or 3 Rooms | 0 (0.0%) | 212 (12.1%) |
| 4 or 5 Rooms | 825 (46.4%) | 1,076 (61.5%) |
| 6 or 7 Rooms | 726 (40.8%) | 241 (13.8%) |
| 8 or more Rooms | 229 (12.9%) | 186 (10.6%) |
| Total | 1,780 (100.0%) | 1,750 (100.0%) |
Housing Structure by Heating Type in Roxboro
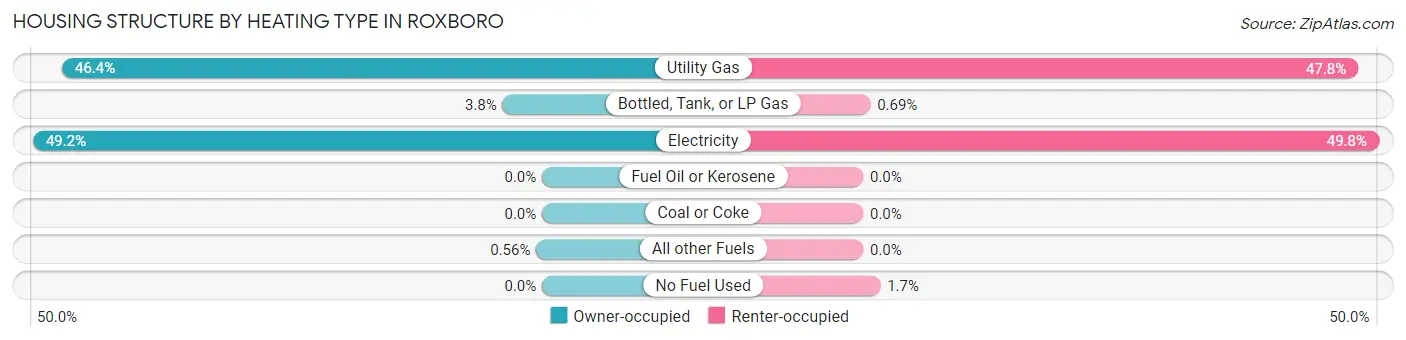
| Heating Type | Owner-occupied | Renter-occupied |
| Utility Gas | 826 (46.4%) | 837 (47.8%) |
| Bottled, Tank, or LP Gas | 68 (3.8%) | 12 (0.7%) |
| Electricity | 876 (49.2%) | 872 (49.8%) |
| Fuel Oil or Kerosene | 0 (0.0%) | 0 (0.0%) |
| Coal or Coke | 0 (0.0%) | 0 (0.0%) |
| All other Fuels | 10 (0.6%) | 0 (0.0%) |
| No Fuel Used | 0 (0.0%) | 29 (1.7%) |
| Total | 1,780 (100.0%) | 1,750 (100.0%) |
Household Vehicle Usage in Roxboro
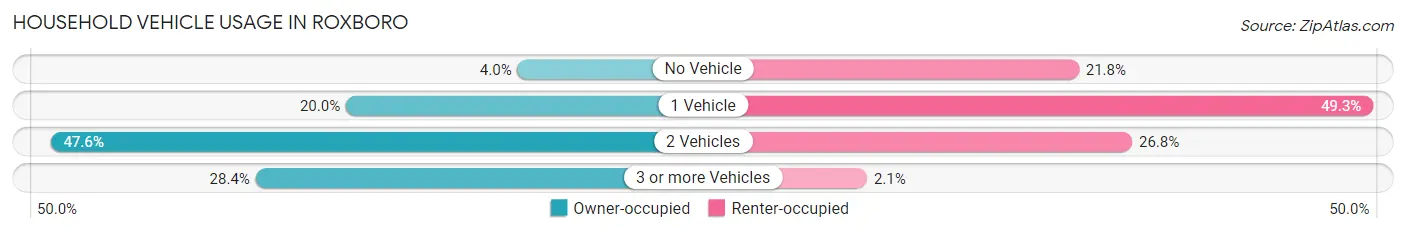
| Vehicles per Household | Owner-occupied | Renter-occupied |
| No Vehicle | 71 (4.0%) | 382 (21.8%) |
| 1 Vehicle | 356 (20.0%) | 863 (49.3%) |
| 2 Vehicles | 847 (47.6%) | 469 (26.8%) |
| 3 or more Vehicles | 506 (28.4%) | 36 (2.1%) |
| Total | 1,780 (100.0%) | 1,750 (100.0%) |
Real Estate & Mortgages in Roxboro
Real Estate and Mortgage Overview in Roxboro
| Characteristic | Without Mortgage | With Mortgage |
| Housing Units | 812 | 968 |
| Median Property Value | $69,500 | $149,600 |
| Median Household Income | $31,630 | $39 |
| Monthly Housing Costs | $408 | $39 |
| Real Estate Taxes | $843 | $26 |
Property Value by Mortgage Status in Roxboro
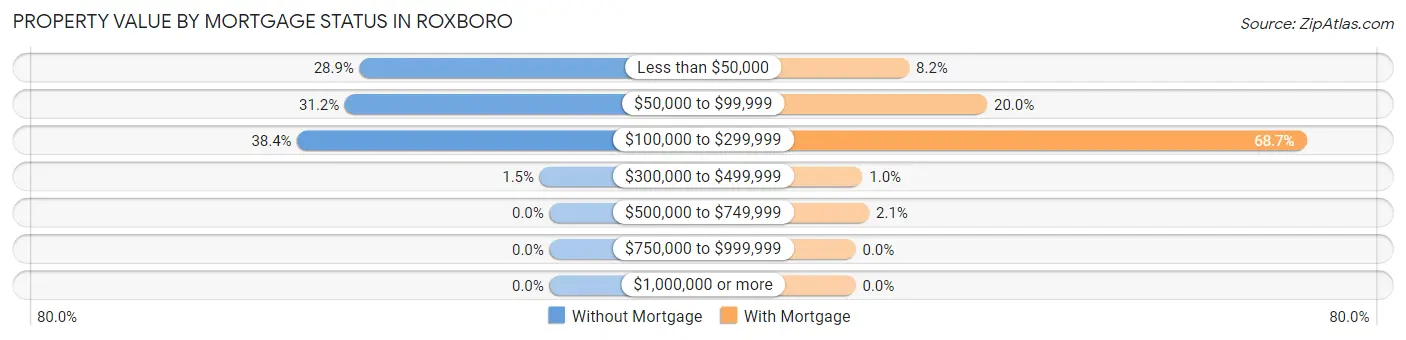
| Property Value | Without Mortgage | With Mortgage |
| Less than $50,000 | 235 (28.9%) | 79 (8.2%) |
| $50,000 to $99,999 | 253 (31.2%) | 194 (20.0%) |
| $100,000 to $299,999 | 312 (38.4%) | 665 (68.7%) |
| $300,000 to $499,999 | 12 (1.5%) | 10 (1.0%) |
| $500,000 to $749,999 | 0 (0.0%) | 20 (2.1%) |
| $750,000 to $999,999 | 0 (0.0%) | 0 (0.0%) |
| $1,000,000 or more | 0 (0.0%) | 0 (0.0%) |
| Total | 812 (100.0%) | 968 (100.0%) |
Household Income by Mortgage Status in Roxboro
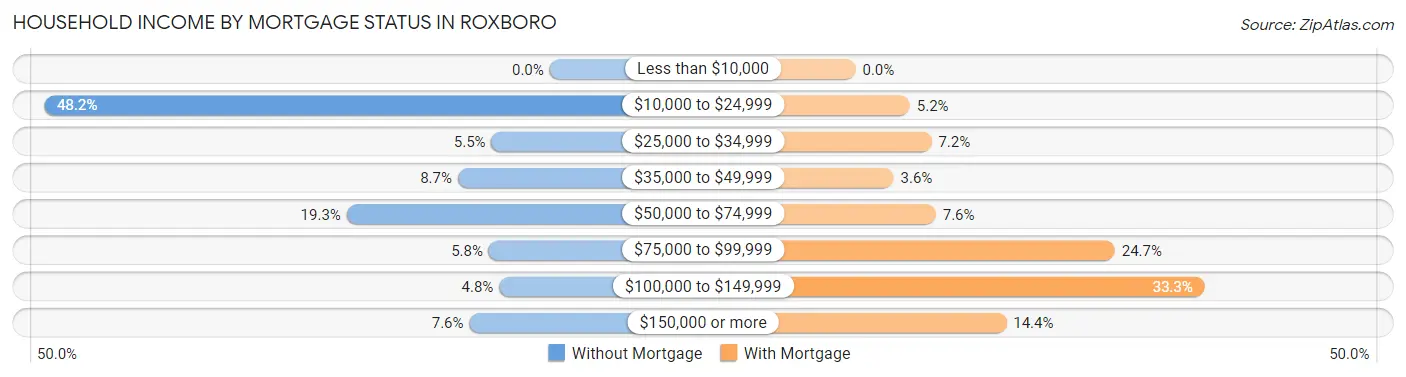
| Household Income | Without Mortgage | With Mortgage |
| Less than $10,000 | 0 (0.0%) | 0 (0.0%) |
| $10,000 to $24,999 | 391 (48.1%) | 50 (5.2%) |
| $25,000 to $34,999 | 45 (5.5%) | 70 (7.2%) |
| $35,000 to $49,999 | 71 (8.7%) | 35 (3.6%) |
| $50,000 to $74,999 | 157 (19.3%) | 74 (7.6%) |
| $75,000 to $99,999 | 47 (5.8%) | 239 (24.7%) |
| $100,000 to $149,999 | 39 (4.8%) | 322 (33.3%) |
| $150,000 or more | 62 (7.6%) | 139 (14.4%) |
| Total | 812 (100.0%) | 968 (100.0%) |
Property Value to Household Income Ratio in Roxboro
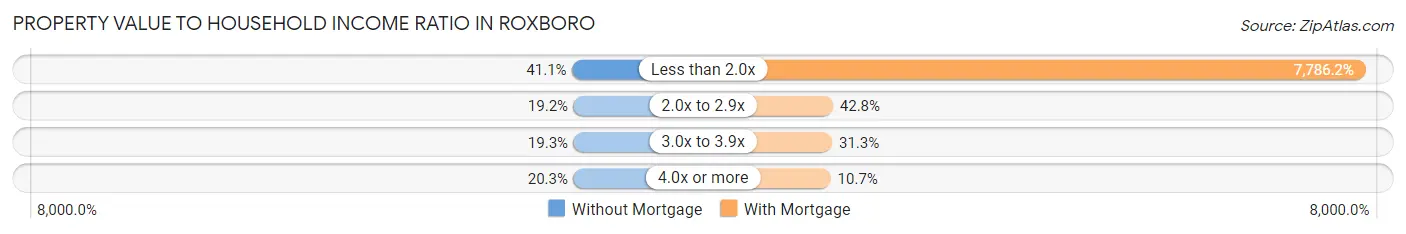
| Value-to-Income Ratio | Without Mortgage | With Mortgage |
| Less than 2.0x | 334 (41.1%) | 75,370 (7,786.2%) |
| 2.0x to 2.9x | 156 (19.2%) | 414 (42.8%) |
| 3.0x to 3.9x | 157 (19.3%) | 303 (31.3%) |
| 4.0x or more | 165 (20.3%) | 104 (10.7%) |
| Total | 812 (100.0%) | 968 (100.0%) |
Real Estate Taxes by Mortgage Status in Roxboro
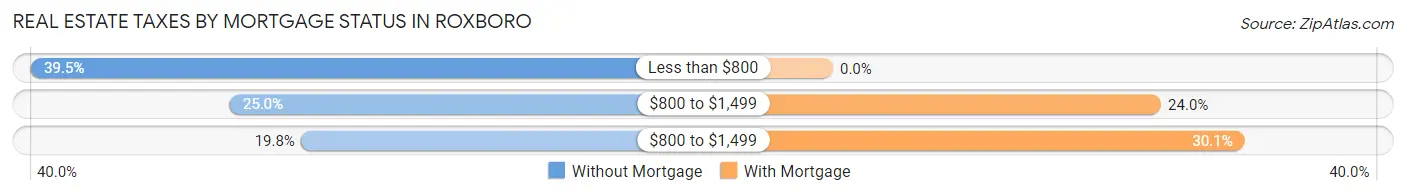
| Property Taxes | Without Mortgage | With Mortgage |
| Less than $800 | 321 (39.5%) | 0 (0.0%) |
| $800 to $1,499 | 203 (25.0%) | 232 (24.0%) |
| $800 to $1,499 | 161 (19.8%) | 291 (30.1%) |
| Total | 812 (100.0%) | 968 (100.0%) |
Health & Disability in Roxboro
Health Insurance Coverage by Age in Roxboro
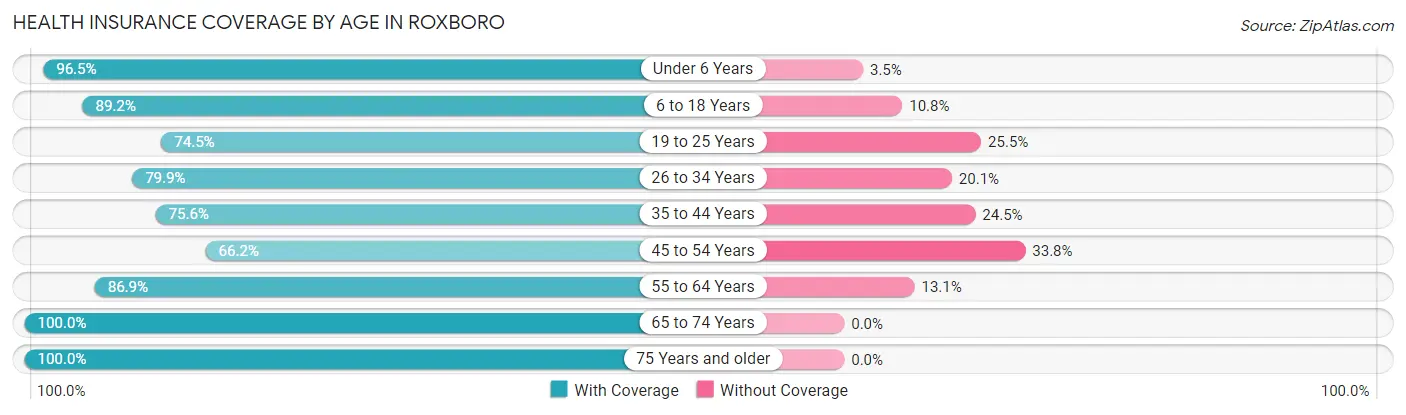
| Age Bracket | With Coverage | Without Coverage |
| Under 6 Years | 774 (96.5%) | 28 (3.5%) |
| 6 to 18 Years | 841 (89.2%) | 102 (10.8%) |
| 19 to 25 Years | 505 (74.5%) | 173 (25.5%) |
| 26 to 34 Years | 980 (79.9%) | 246 (20.1%) |
| 35 to 44 Years | 553 (75.5%) | 179 (24.4%) |
| 45 to 54 Years | 561 (66.2%) | 286 (33.8%) |
| 55 to 64 Years | 942 (86.9%) | 142 (13.1%) |
| 65 to 74 Years | 990 (100.0%) | 0 (0.0%) |
| 75 Years and older | 492 (100.0%) | 0 (0.0%) |
| Total | 6,638 (85.2%) | 1,156 (14.8%) |
Health Insurance Coverage by Citizenship Status in Roxboro
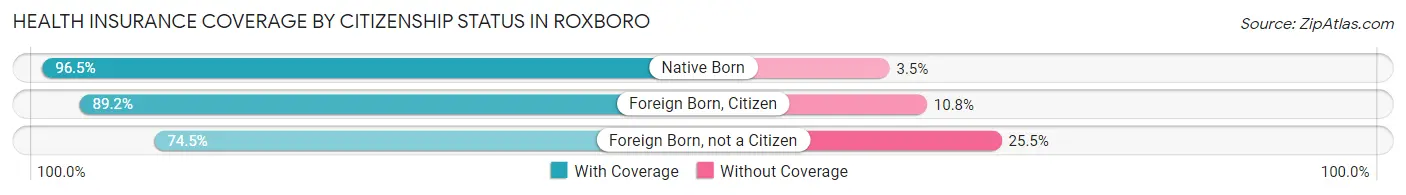
| Citizenship Status | With Coverage | Without Coverage |
| Native Born | 774 (96.5%) | 28 (3.5%) |
| Foreign Born, Citizen | 841 (89.2%) | 102 (10.8%) |
| Foreign Born, not a Citizen | 505 (74.5%) | 173 (25.5%) |
Health Insurance Coverage by Household Income in Roxboro
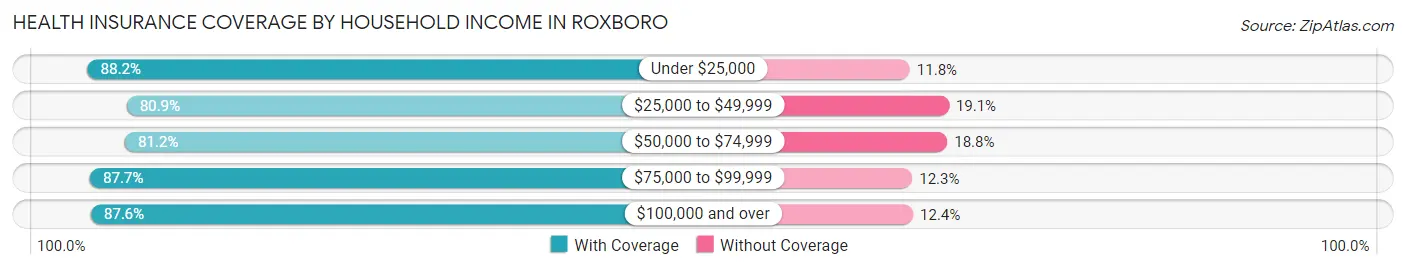
| Household Income | With Coverage | Without Coverage |
| Under $25,000 | 2,044 (88.2%) | 274 (11.8%) |
| $25,000 to $49,999 | 1,449 (80.9%) | 343 (19.1%) |
| $50,000 to $74,999 | 1,168 (81.2%) | 271 (18.8%) |
| $75,000 to $99,999 | 950 (87.7%) | 133 (12.3%) |
| $100,000 and over | 938 (87.6%) | 133 (12.4%) |
Public vs Private Health Insurance Coverage by Age in Roxboro
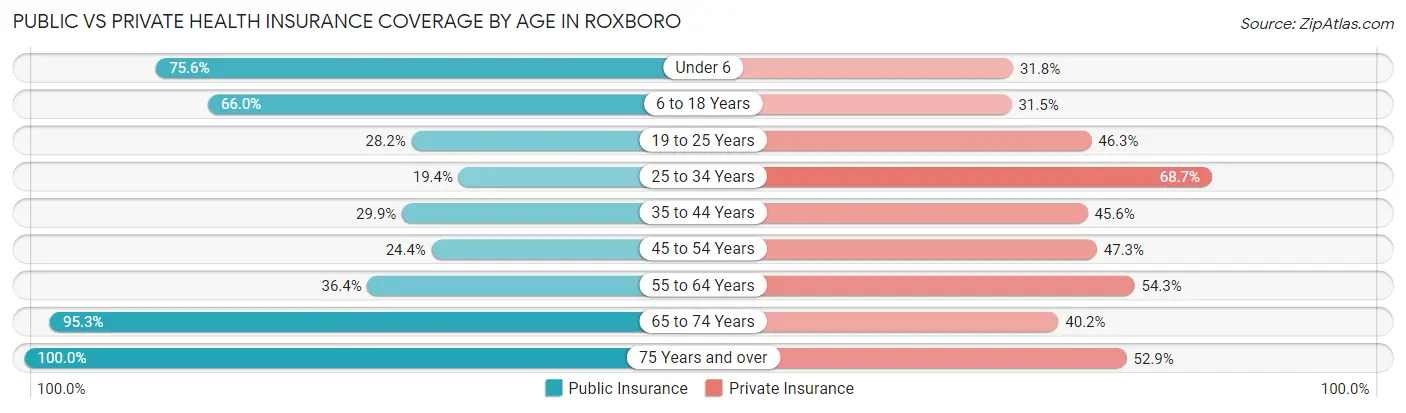
| Age Bracket | Public Insurance | Private Insurance |
| Under 6 | 606 (75.6%) | 255 (31.8%) |
| 6 to 18 Years | 622 (66.0%) | 297 (31.5%) |
| 19 to 25 Years | 191 (28.2%) | 314 (46.3%) |
| 25 to 34 Years | 238 (19.4%) | 842 (68.7%) |
| 35 to 44 Years | 219 (29.9%) | 334 (45.6%) |
| 45 to 54 Years | 207 (24.4%) | 401 (47.3%) |
| 55 to 64 Years | 394 (36.3%) | 589 (54.3%) |
| 65 to 74 Years | 943 (95.3%) | 398 (40.2%) |
| 75 Years and over | 492 (100.0%) | 260 (52.8%) |
| Total | 3,912 (50.2%) | 3,690 (47.3%) |
Disability Status by Sex by Age in Roxboro
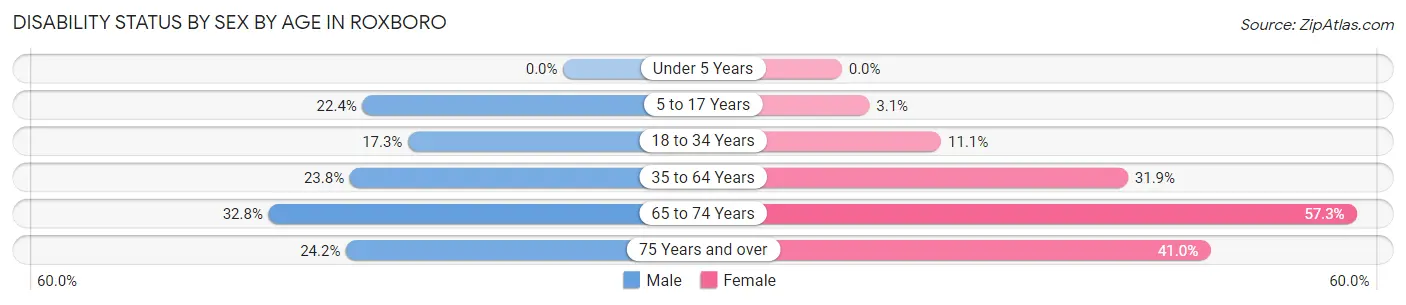
| Age Bracket | Male | Female |
| Under 5 Years | 0 (0.0%) | 0 (0.0%) |
| 5 to 17 Years | 133 (22.4%) | 17 (3.1%) |
| 18 to 34 Years | 150 (17.3%) | 115 (11.1%) |
| 35 to 64 Years | 327 (23.8%) | 410 (31.9%) |
| 65 to 74 Years | 105 (32.8%) | 384 (57.3%) |
| 75 Years and over | 37 (24.2%) | 139 (41.0%) |
Disability Class by Sex by Age in Roxboro
Disability Class: Hearing Difficulty
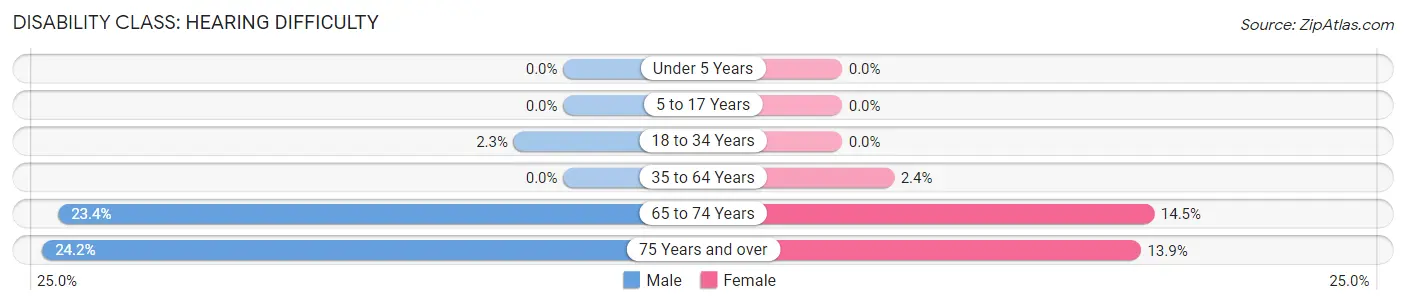
| Age Bracket | Male | Female |
| Under 5 Years | 0 (0.0%) | 0 (0.0%) |
| 5 to 17 Years | 0 (0.0%) | 0 (0.0%) |
| 18 to 34 Years | 20 (2.3%) | 0 (0.0%) |
| 35 to 64 Years | 0 (0.0%) | 31 (2.4%) |
| 65 to 74 Years | 75 (23.4%) | 97 (14.5%) |
| 75 Years and over | 37 (24.2%) | 47 (13.9%) |
Disability Class: Vision Difficulty
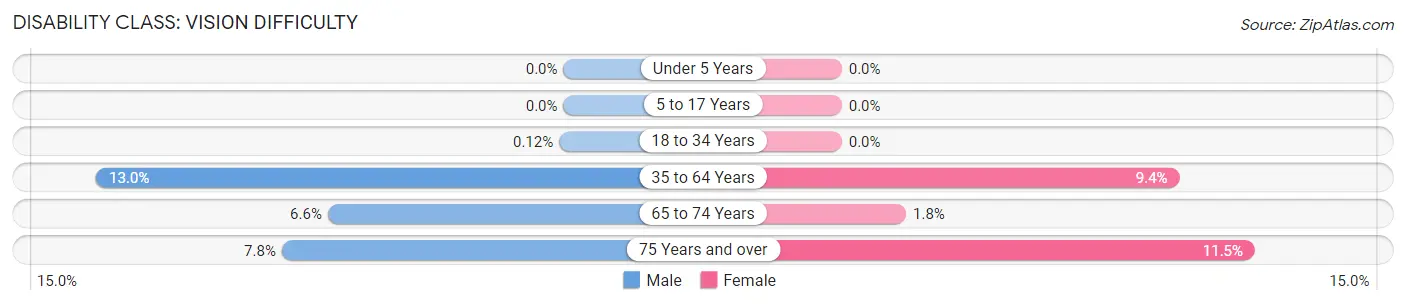
| Age Bracket | Male | Female |
| Under 5 Years | 0 (0.0%) | 0 (0.0%) |
| 5 to 17 Years | 0 (0.0%) | 0 (0.0%) |
| 18 to 34 Years | 1 (0.1%) | 0 (0.0%) |
| 35 to 64 Years | 179 (13.0%) | 121 (9.4%) |
| 65 to 74 Years | 21 (6.6%) | 12 (1.8%) |
| 75 Years and over | 12 (7.8%) | 39 (11.5%) |
Disability Class: Cognitive Difficulty
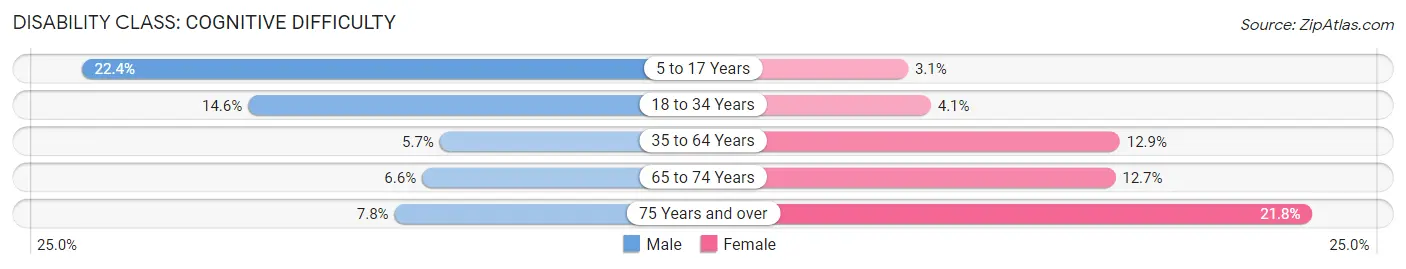
| Age Bracket | Male | Female |
| 5 to 17 Years | 133 (22.4%) | 17 (3.1%) |
| 18 to 34 Years | 127 (14.6%) | 43 (4.1%) |
| 35 to 64 Years | 79 (5.7%) | 166 (12.9%) |
| 65 to 74 Years | 21 (6.6%) | 85 (12.7%) |
| 75 Years and over | 12 (7.8%) | 74 (21.8%) |
Disability Class: Ambulatory Difficulty
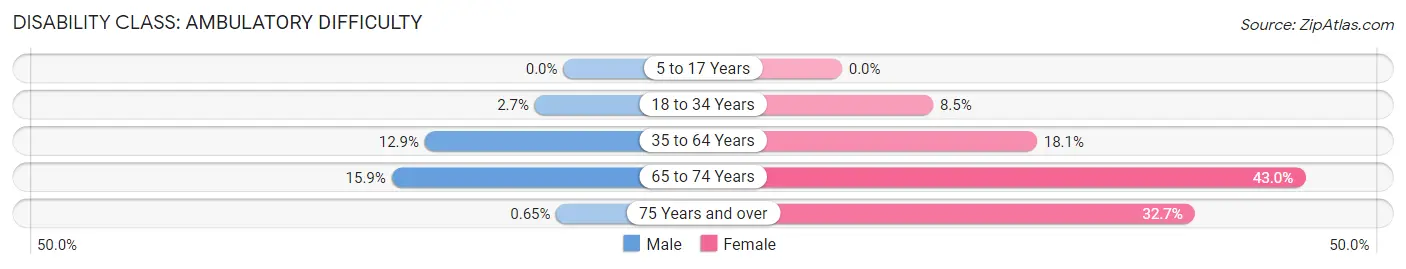
| Age Bracket | Male | Female |
| 5 to 17 Years | 0 (0.0%) | 0 (0.0%) |
| 18 to 34 Years | 23 (2.6%) | 88 (8.5%) |
| 35 to 64 Years | 177 (12.9%) | 233 (18.1%) |
| 65 to 74 Years | 51 (15.9%) | 288 (43.0%) |
| 75 Years and over | 1 (0.6%) | 111 (32.7%) |
Disability Class: Self-Care Difficulty
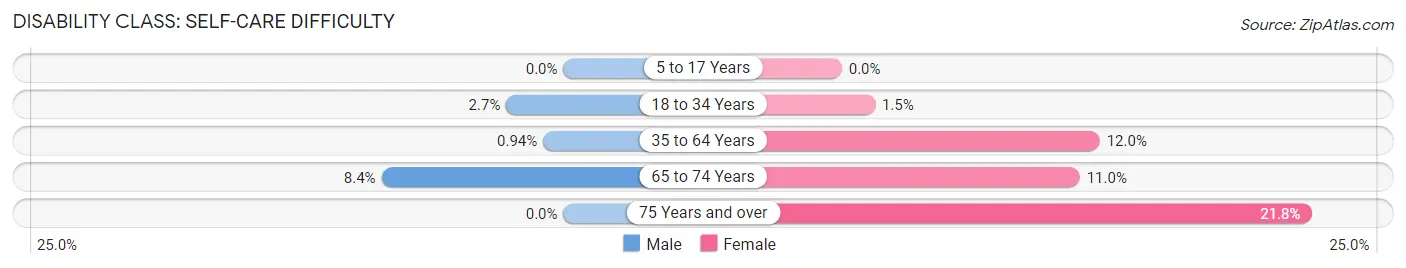
| Age Bracket | Male | Female |
| 5 to 17 Years | 0 (0.0%) | 0 (0.0%) |
| 18 to 34 Years | 23 (2.6%) | 16 (1.5%) |
| 35 to 64 Years | 13 (0.9%) | 154 (12.0%) |
| 65 to 74 Years | 27 (8.4%) | 74 (11.0%) |
| 75 Years and over | 0 (0.0%) | 74 (21.8%) |
Technology Access in Roxboro
Computing Device Access in Roxboro
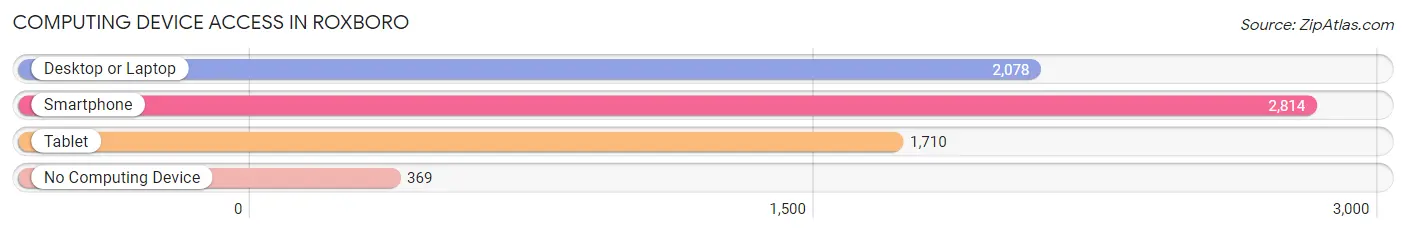
| Device Type | # Households | % Households |
| Desktop or Laptop | 2,078 | 58.9% |
| Smartphone | 2,814 | 79.7% |
| Tablet | 1,710 | 48.4% |
| No Computing Device | 369 | 10.4% |
| Total | 3,530 | 100.0% |
Internet Access in Roxboro
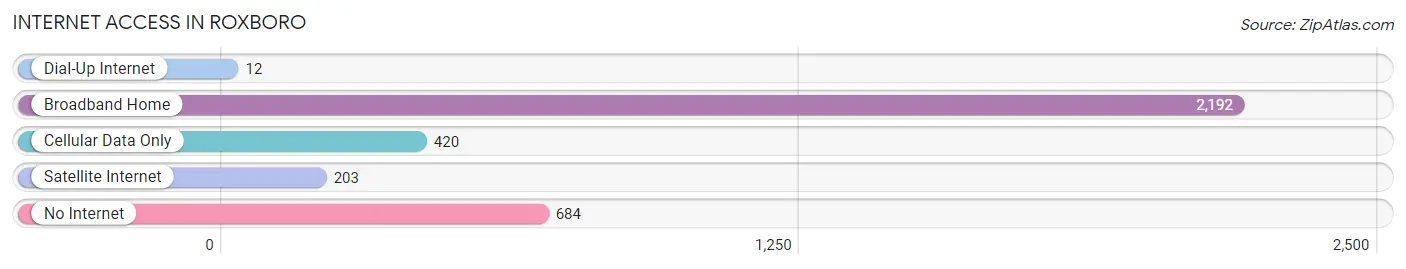
| Internet Type | # Households | % Households |
| Dial-Up Internet | 12 | 0.3% |
| Broadband Home | 2,192 | 62.1% |
| Cellular Data Only | 420 | 11.9% |
| Satellite Internet | 203 | 5.8% |
| No Internet | 684 | 19.4% |
| Total | 3,530 | 100.0% |
Roxboro Summary
Roxboro, North Carolina is a small town located in Person County, North Carolina. It is situated in the northern part of the state, about 40 miles north of Durham and about 70 miles northwest of Raleigh. The town has a population of 8,362 as of the 2010 census, making it the largest town in Person County.
Geography
Roxboro is located in the northern part of Person County, North Carolina, at the intersection of US Highway 501 and NC Highway 49. The town is situated on the banks of the Hyco River, which flows through the town and is a major source of recreation for the area. The town is surrounded by rolling hills and forests, and is located in the Piedmont region of North Carolina.
History
Roxboro was founded in 1839 and was originally known as “Roxborough”. The town was named after a local landowner, William Roxborough, who donated the land for the town. The town was incorporated in 1855 and has since grown to become the largest town in Person County.
Economy
Roxboro’s economy is largely based on manufacturing and agriculture. The town is home to several large manufacturing companies, including Person County Industries, which produces furniture, and Person County Manufacturing, which produces textiles. The town is also home to several agricultural businesses, including a large poultry farm and several dairy farms.
Demographics
As of the 2010 census, the population of Roxboro was 8,362. The racial makeup of the town was 79.3% White, 16.2% African American, 0.5% Native American, 0.7% Asian, 0.1% Pacific Islander, and 2.2% from other races. The median household income was $33,945, and the median family income was $41,945.
Conclusion
Roxboro, North Carolina is a small town located in Person County, North Carolina. It is situated in the northern part of the state, about 40 miles north of Durham and about 70 miles northwest of Raleigh. The town has a population of 8,362 as of the 2010 census, making it the largest town in Person County. The town’s economy is largely based on manufacturing and agriculture, and the town is home to several large manufacturing companies and agricultural businesses. The racial makeup of the town is 79.3% White, 16.2% African American, 0.5% Native American, 0.7% Asian, 0.1% Pacific Islander, and 2.2% from other races. The median household income was $33,945, and the median family income was $41,945.
Common Questions
What is Per Capita Income in Roxboro?
Per Capita income in Roxboro is $25,732.
What is the Median Family Income in Roxboro?
Median Family Income in Roxboro is $54,003.
What is the Median Household income in Roxboro?
Median Household Income in Roxboro is $39,787.
What is Income or Wage Gap in Roxboro?
Income or Wage Gap in Roxboro is 16.9%.
Women in Roxboro earn 83.1 cents for every dollar earned by a man.
What is Inequality or Gini Index in Roxboro?
Inequality or Gini Index in Roxboro is 0.47.
What is the Total Population of Roxboro?
Total Population of Roxboro is 8,131.
What is the Total Male Population of Roxboro?
Total Male Population of Roxboro is 3,807.
What is the Total Female Population of Roxboro?
Total Female Population of Roxboro is 4,324.
What is the Ratio of Males per 100 Females in Roxboro?
There are 88.04 Males per 100 Females in Roxboro.
What is the Ratio of Females per 100 Males in Roxboro?
There are 113.58 Females per 100 Males in Roxboro.
What is the Median Population Age in Roxboro?
Median Population Age in Roxboro is 40.7 Years.
What is the Average Family Size in Roxboro
Average Family Size in Roxboro is 2.9 People.
What is the Average Household Size in Roxboro
Average Household Size in Roxboro is 2.2 People.
How Large is the Labor Force in Roxboro?
There are 3,911 People in the Labor Forcein in Roxboro.
What is the Percentage of People in the Labor Force in Roxboro?
59.2% of People are in the Labor Force in Roxboro.
What is the Unemployment Rate in Roxboro?
Unemployment Rate in Roxboro is 4.8%.