Little River, SC Map & Demographics
Little River Map
Little River Overview
$40,263
PER CAPITA INCOME
$75,881
AVG FAMILY INCOME
$60,677
AVG HOUSEHOLD INCOME
13.4%
WAGE / INCOME GAP [ % ]
86.6¢/ $1
WAGE / INCOME GAP [ $ ]
$9,734
FAMILY INCOME DEFICIT
0.41
INEQUALITY / GINI INDEX
9,815
TOTAL POPULATION
4,605
MALE POPULATION
5,210
FEMALE POPULATION
88.39
MALES / 100 FEMALES
113.14
FEMALES / 100 MALES
62.0
MEDIAN AGE
2.5
AVG FAMILY SIZE
2.0
AVG HOUSEHOLD SIZE
3,858
LABOR FORCE [ PEOPLE ]
43.7%
PERCENT IN LABOR FORCE
4.4%
UNEMPLOYMENT RATE
Little River Zip Codes
Little River Area Codes
Income in Little River
Income Overview in Little River
Per Capita Income in Little River is $40,263, while median incomes of families and households are $75,881 and $60,677 respectively.
| Characteristic | Number | Measure |
| Per Capita Income | 9,815 | $40,263 |
| Median Family Income | 2,819 | $75,881 |
| Mean Family Income | 2,819 | $92,542 |
| Median Household Income | 4,953 | $60,677 |
| Mean Household Income | 4,953 | $77,084 |
| Income Deficit | 2,819 | $9,734 |
| Wage / Income Gap (%) | 9,815 | 13.37% |
| Wage / Income Gap ($) | 9,815 | 86.63¢ per $1 |
| Gini / Inequality Index | 9,815 | 0.41 |
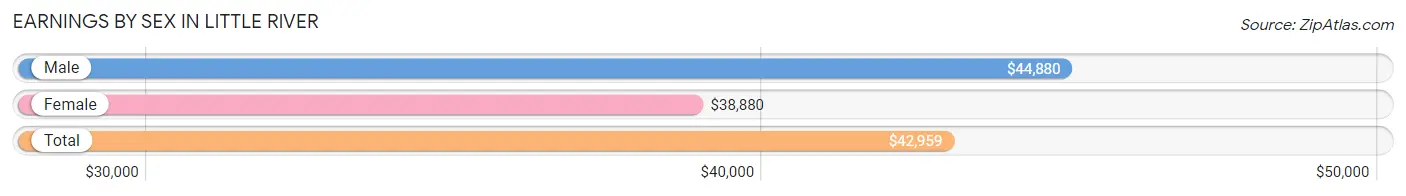
Earnings by Sex in Little River
Average Earnings in Little River are $42,959, $44,880 for men and $38,880 for women, a difference of 13.4%.
| Sex | Number | Average Earnings |
| Male | 1,939 (49.2%) | $44,880 |
| Female | 2,001 (50.8%) | $38,880 |
| Total | 3,940 (100.0%) | $42,959 |
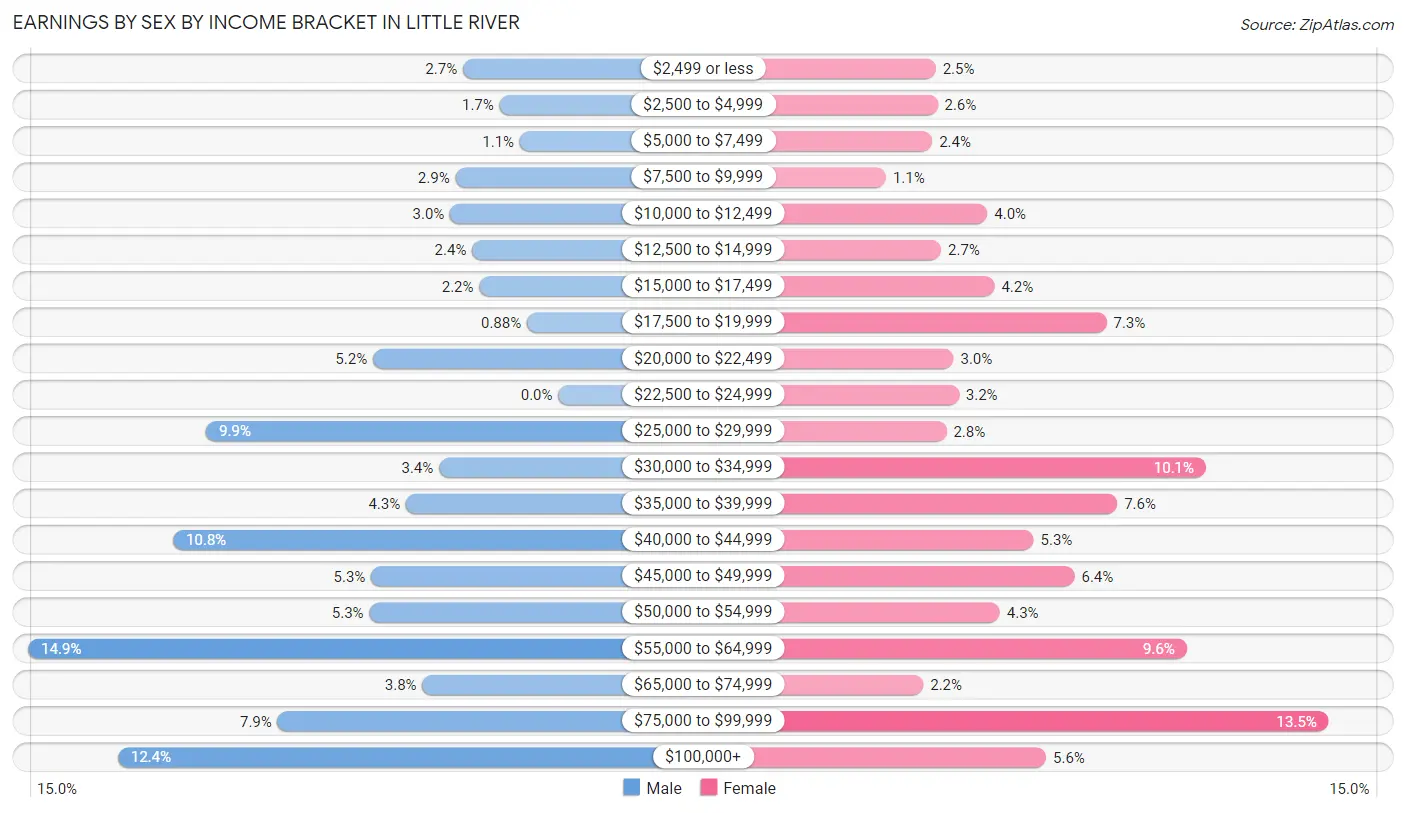
Earnings by Sex by Income Bracket in Little River
The most common earnings brackets in Little River are $55,000 to $64,999 for men (289 | 14.9%) and $75,000 to $99,999 for women (271 | 13.5%).
| Income | Male | Female |
| $2,499 or less | 52 (2.7%) | 50 (2.5%) |
| $2,500 to $4,999 | 32 (1.7%) | 51 (2.5%) |
| $5,000 to $7,499 | 21 (1.1%) | 48 (2.4%) |
| $7,500 to $9,999 | 56 (2.9%) | 22 (1.1%) |
| $10,000 to $12,499 | 59 (3.0%) | 79 (4.0%) |
| $12,500 to $14,999 | 47 (2.4%) | 53 (2.6%) |
| $15,000 to $17,499 | 43 (2.2%) | 83 (4.2%) |
| $17,500 to $19,999 | 17 (0.9%) | 146 (7.3%) |
| $20,000 to $22,499 | 101 (5.2%) | 60 (3.0%) |
| $22,500 to $24,999 | 0 (0.0%) | 63 (3.2%) |
| $25,000 to $29,999 | 192 (9.9%) | 56 (2.8%) |
| $30,000 to $34,999 | 65 (3.4%) | 202 (10.1%) |
| $35,000 to $39,999 | 83 (4.3%) | 152 (7.6%) |
| $40,000 to $44,999 | 210 (10.8%) | 105 (5.2%) |
| $45,000 to $49,999 | 102 (5.3%) | 128 (6.4%) |
| $50,000 to $54,999 | 103 (5.3%) | 86 (4.3%) |
| $55,000 to $64,999 | 289 (14.9%) | 191 (9.6%) |
| $65,000 to $74,999 | 74 (3.8%) | 43 (2.1%) |
| $75,000 to $99,999 | 153 (7.9%) | 271 (13.5%) |
| $100,000+ | 240 (12.4%) | 112 (5.6%) |
| Total | 1,939 (100.0%) | 2,001 (100.0%) |
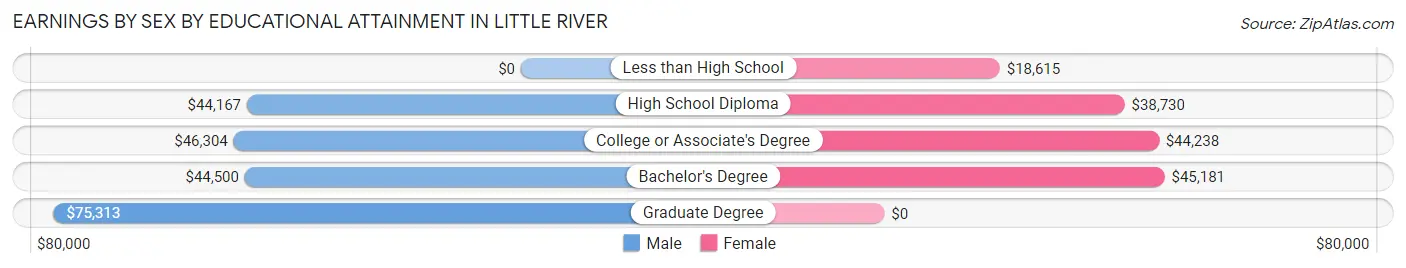
Earnings by Sex by Educational Attainment in Little River
Average earnings in Little River are $46,153 for men and $39,418 for women, a difference of 14.6%. Men with an educational attainment of graduate degree enjoy the highest average annual earnings of $75,313, while those with high school diploma education earn the least with $44,167. Women with an educational attainment of bachelor's degree earn the most with the average annual earnings of $45,181, while those with less than high school education have the smallest earnings of $18,615.
| Educational Attainment | Male Income | Female Income |
| Less than High School | - | - |
| High School Diploma | $44,167 | $38,730 |
| College or Associate's Degree | $46,304 | $44,238 |
| Bachelor's Degree | $44,500 | $45,181 |
| Graduate Degree | $75,313 | $0 |
| Total | $46,153 | $39,418 |
Family Income in Little River
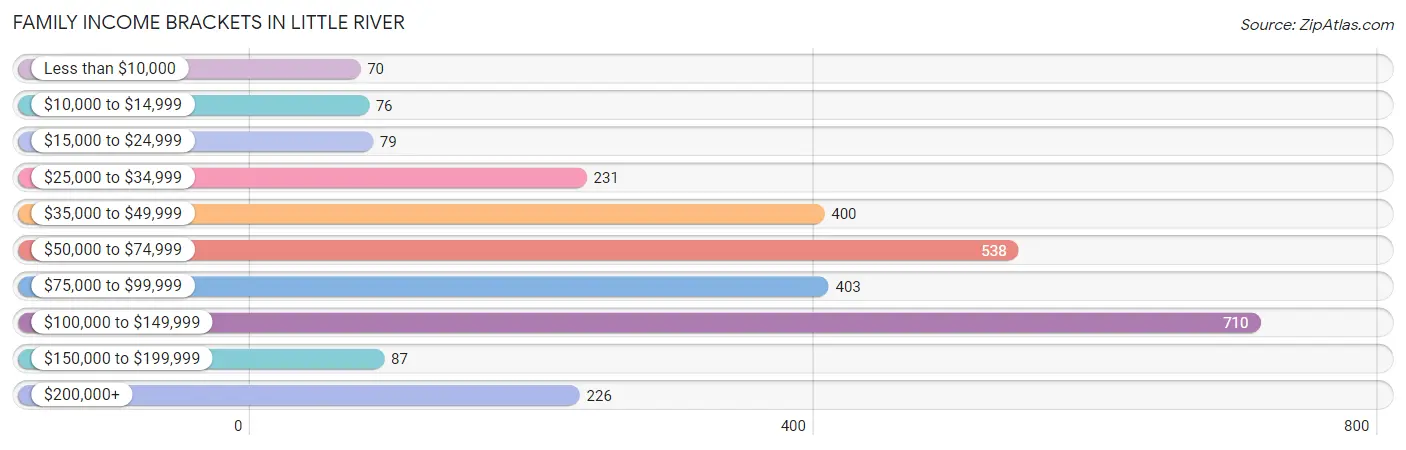
Family Income Brackets in Little River
According to the Little River family income data, there are 710 families falling into the $100,000 to $149,999 income range, which is the most common income bracket and makes up 25.2% of all families. Conversely, the less than $10,000 income bracket is the least frequent group with only 70 families (2.5%) belonging to this category.
| Income Bracket | # Families | % Families |
| Less than $10,000 | 70 | 2.5% |
| $10,000 to $14,999 | 76 | 2.7% |
| $15,000 to $24,999 | 79 | 2.8% |
| $25,000 to $34,999 | 231 | 8.2% |
| $35,000 to $49,999 | 400 | 14.2% |
| $50,000 to $74,999 | 538 | 19.1% |
| $75,000 to $99,999 | 403 | 14.3% |
| $100,000 to $149,999 | 710 | 25.2% |
| $150,000 to $199,999 | 87 | 3.1% |
| $200,000+ | 226 | 8.0% |
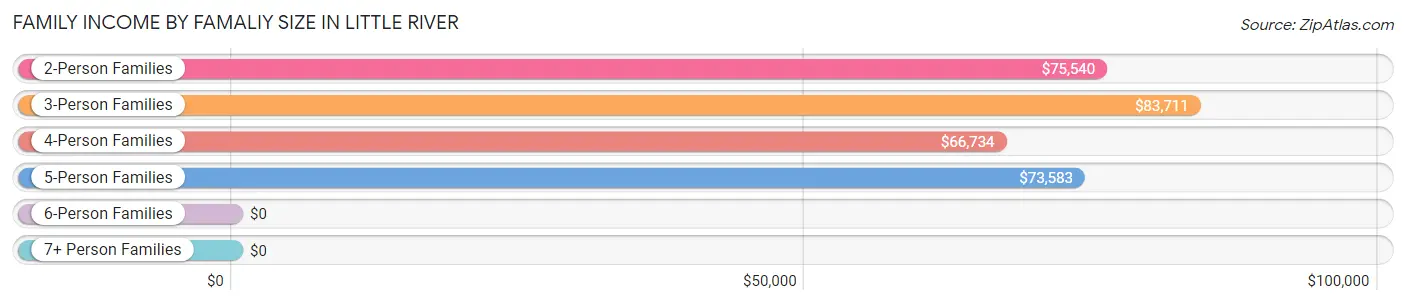
Family Income by Famaliy Size in Little River
3-person families (318 | 11.3%) account for the highest median family income in Little River with $83,711 per family, while 2-person families (2,237 | 79.3%) have the highest median income of $37,770 per family member.
| Income Bracket | # Families | Median Income |
| 2-Person Families | 2,237 (79.3%) | $75,540 |
| 3-Person Families | 318 (11.3%) | $83,711 |
| 4-Person Families | 139 (4.9%) | $66,734 |
| 5-Person Families | 111 (3.9%) | $73,583 |
| 6-Person Families | 0 (0.0%) | $0 |
| 7+ Person Families | 14 (0.5%) | $0 |
| Total | 2,819 (100.0%) | $75,881 |
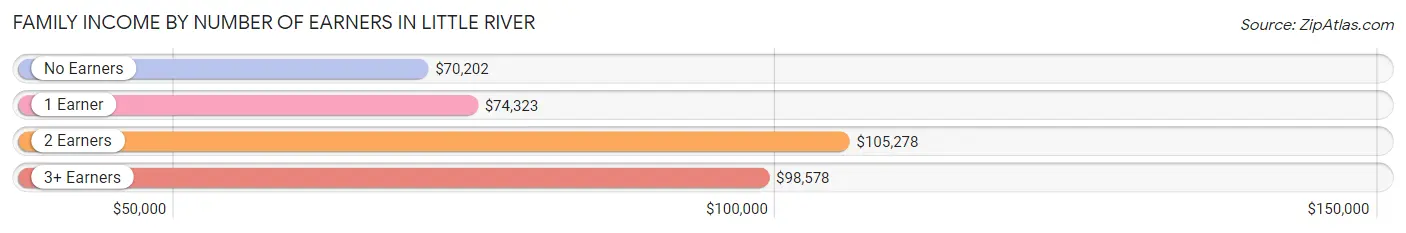
Family Income by Number of Earners in Little River
The median family income in Little River is $75,881, with families comprising 2 earners (616) having the highest median family income of $105,278, while families with no earners (1,377) have the lowest median family income of $70,202, accounting for 21.8% and 48.8% of families, respectively.
| Number of Earners | # Families | Median Income |
| No Earners | 1,377 (48.8%) | $70,202 |
| 1 Earner | 763 (27.1%) | $74,323 |
| 2 Earners | 616 (21.8%) | $105,278 |
| 3+ Earners | 63 (2.2%) | $98,578 |
| Total | 2,819 (100.0%) | $75,881 |
Household Income in Little River
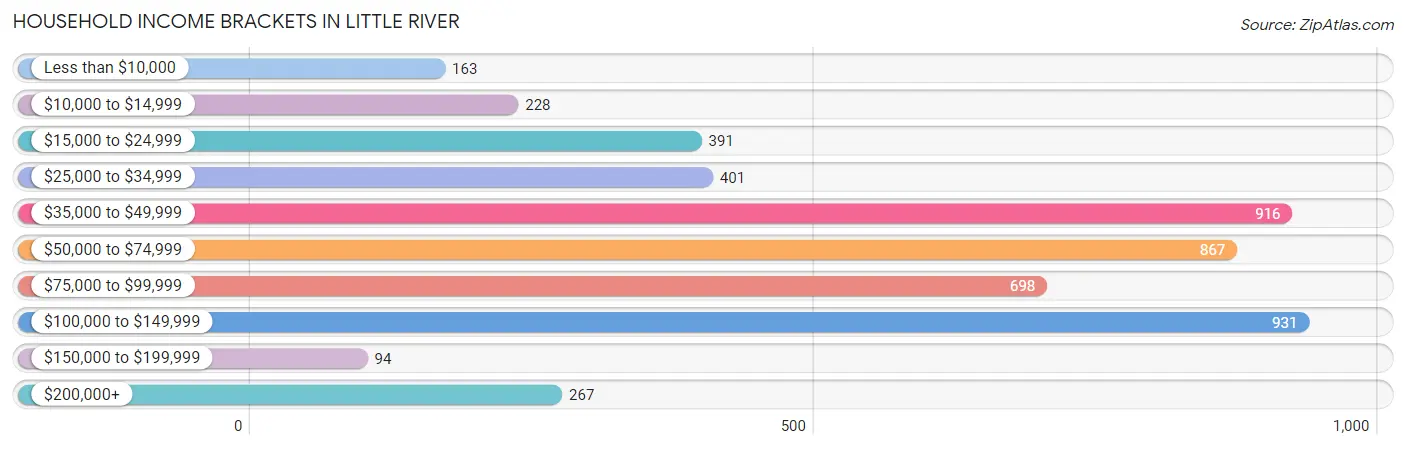
Household Income Brackets in Little River
With 931 households falling in the category, the $100,000 to $149,999 income range is the most frequent in Little River, accounting for 18.8% of all households. In contrast, only 94 households (1.9%) fall into the $150,000 to $199,999 income bracket, making it the least populous group.
| Income Bracket | # Households | % Households |
| Less than $10,000 | 163 | 3.3% |
| $10,000 to $14,999 | 228 | 4.6% |
| $15,000 to $24,999 | 391 | 7.9% |
| $25,000 to $34,999 | 401 | 8.1% |
| $35,000 to $49,999 | 916 | 18.5% |
| $50,000 to $74,999 | 867 | 17.5% |
| $75,000 to $99,999 | 698 | 14.1% |
| $100,000 to $149,999 | 931 | 18.8% |
| $150,000 to $199,999 | 94 | 1.9% |
| $200,000+ | 267 | 5.4% |
Household Income by Householder Age in Little River
The median household income in Little River is $60,677, with the highest median household income of $65,093 found in the 65+ years age bracket for the primary householder. A total of 2,770 households (55.9%) fall into this category. Meanwhile, the 15 to 24 years age bracket for the primary householder has the lowest median household income of $31,853, with 43 households (0.9%) in this group.
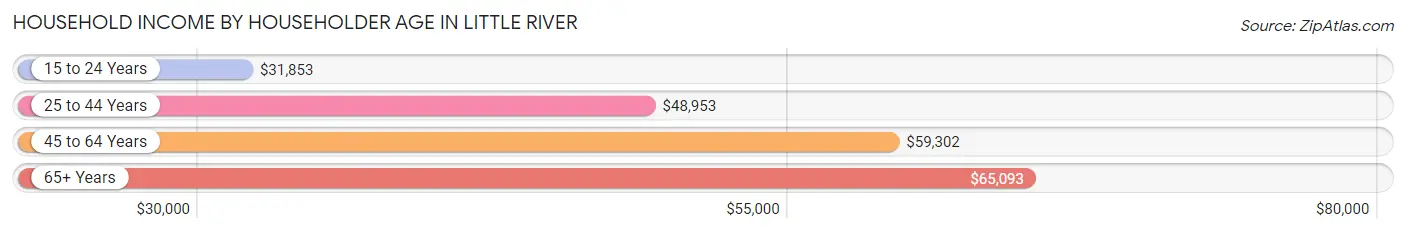
| Income Bracket | # Households | Median Income |
| 15 to 24 Years | 43 (0.9%) | $31,853 |
| 25 to 44 Years | 751 (15.2%) | $48,953 |
| 45 to 64 Years | 1,389 (28.0%) | $59,302 |
| 65+ Years | 2,770 (55.9%) | $65,093 |
| Total | 4,953 (100.0%) | $60,677 |
Poverty in Little River
Income Below Poverty by Sex and Age in Little River
With 8.4% poverty level for males and 12.2% for females among the residents of Little River, 12 to 14 year old males and 12 to 14 year old females are the most vulnerable to poverty, with 18 males (36.7%) and 64 females (78.0%) in their respective age groups living below the poverty level.
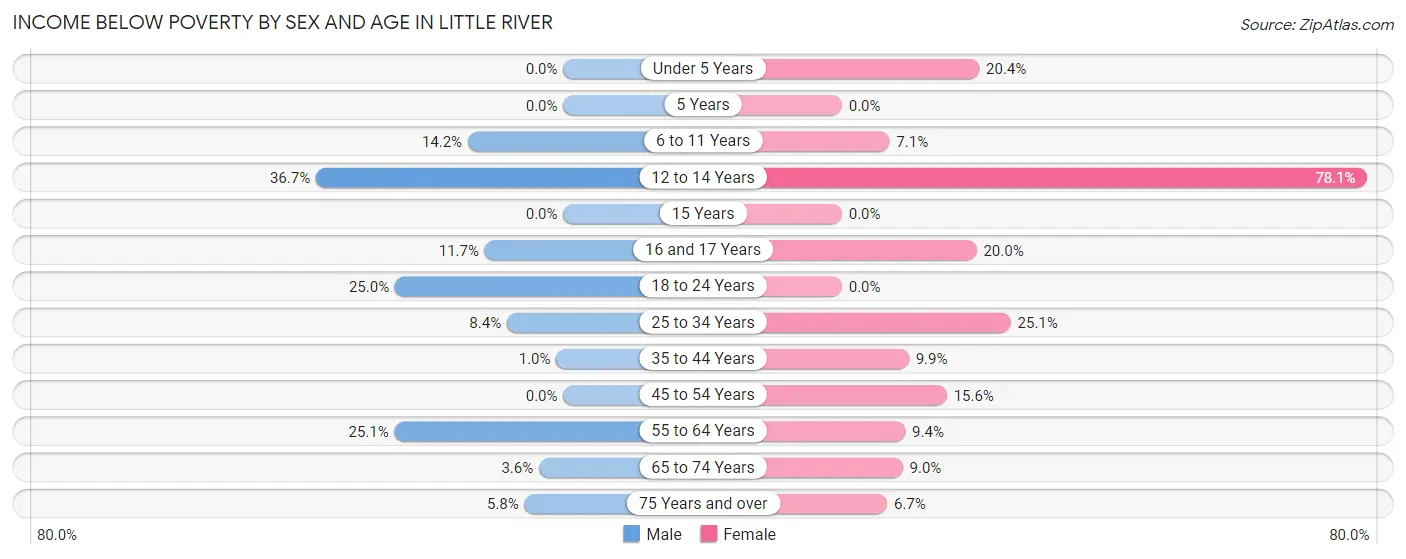
| Age Bracket | Male | Female |
| Under 5 Years | 0 (0.0%) | 42 (20.4%) |
| 5 Years | 0 (0.0%) | 0 (0.0%) |
| 6 to 11 Years | 18 (14.2%) | 22 (7.1%) |
| 12 to 14 Years | 18 (36.7%) | 64 (78.0%) |
| 15 Years | 0 (0.0%) | 0 (0.0%) |
| 16 and 17 Years | 7 (11.7%) | 18 (20.0%) |
| 18 to 24 Years | 29 (25.0%) | 0 (0.0%) |
| 25 to 34 Years | 43 (8.4%) | 87 (25.1%) |
| 35 to 44 Years | 3 (1.0%) | 34 (9.9%) |
| 45 to 54 Years | 0 (0.0%) | 108 (15.6%) |
| 55 to 64 Years | 175 (25.1%) | 93 (9.4%) |
| 65 to 74 Years | 53 (3.6%) | 119 (9.0%) |
| 75 Years and over | 41 (5.8%) | 50 (6.7%) |
| Total | 387 (8.4%) | 637 (12.2%) |
Income Above Poverty by Sex and Age in Little River
According to the poverty statistics in Little River, males aged under 5 years and females aged 18 to 24 years are the age groups that are most secure financially, with 100.0% of males and 100.0% of females in these age groups living above the poverty line.
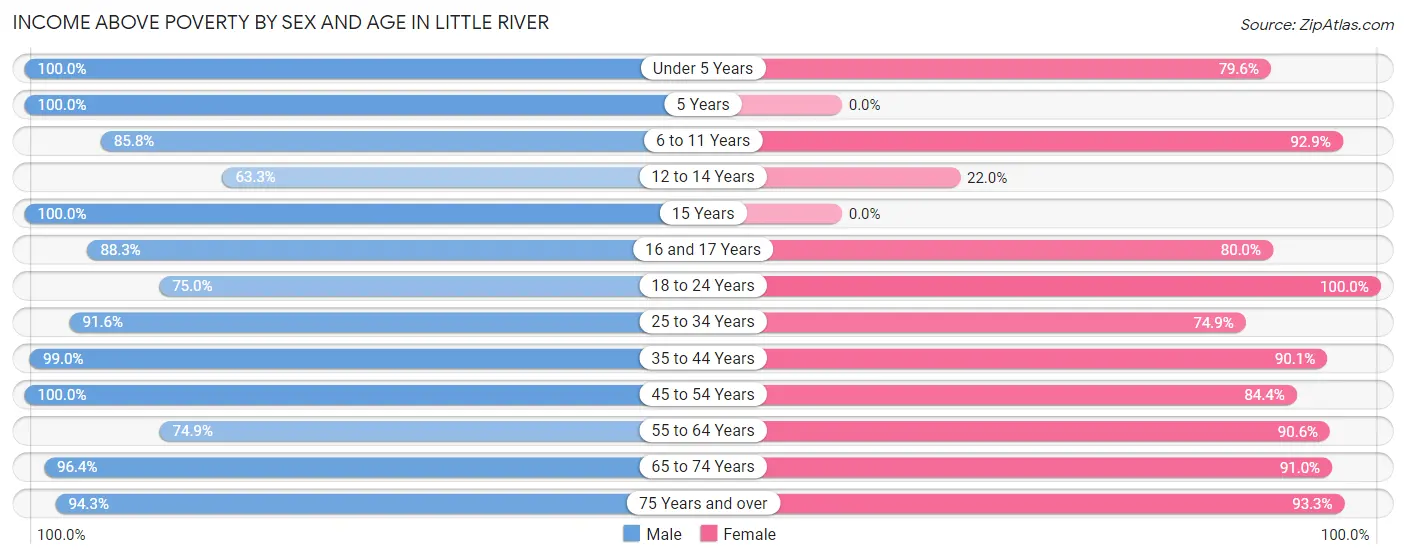
| Age Bracket | Male | Female |
| Under 5 Years | 142 (100.0%) | 164 (79.6%) |
| 5 Years | 48 (100.0%) | 0 (0.0%) |
| 6 to 11 Years | 109 (85.8%) | 289 (92.9%) |
| 12 to 14 Years | 31 (63.3%) | 18 (22.0%) |
| 15 Years | 22 (100.0%) | 0 (0.0%) |
| 16 and 17 Years | 53 (88.3%) | 72 (80.0%) |
| 18 to 24 Years | 87 (75.0%) | 89 (100.0%) |
| 25 to 34 Years | 471 (91.6%) | 260 (74.9%) |
| 35 to 44 Years | 286 (99.0%) | 308 (90.1%) |
| 45 to 54 Years | 359 (100.0%) | 585 (84.4%) |
| 55 to 64 Years | 523 (74.9%) | 895 (90.6%) |
| 65 to 74 Years | 1,415 (96.4%) | 1,199 (91.0%) |
| 75 Years and over | 672 (94.3%) | 694 (93.3%) |
| Total | 4,218 (91.6%) | 4,573 (87.8%) |
Income Below Poverty Among Married-Couple Families in Little River
The poverty statistics for married-couple families in Little River show that 3.2% or 76 of the total 2,412 families live below the poverty line. Families with no children have the highest poverty rate of 3.6%, comprising of 76 families. On the other hand, families with 1 or 2 children have the lowest poverty rate of 0.0%, which includes 0 families.
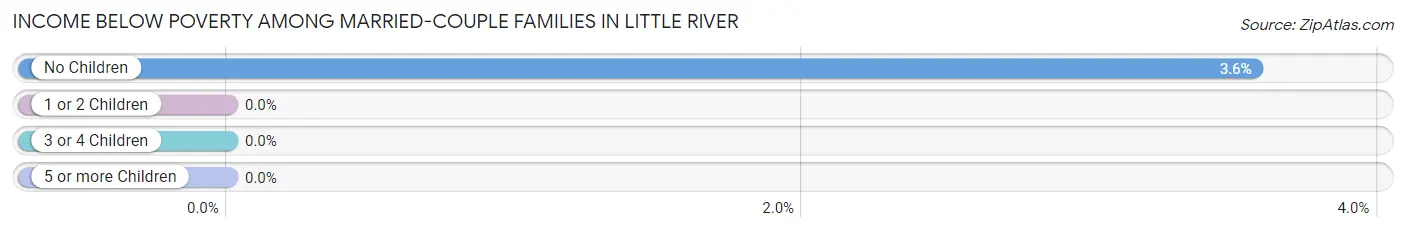
| Children | Above Poverty | Below Poverty |
| No Children | 2,052 (96.4%) | 76 (3.6%) |
| 1 or 2 Children | 254 (100.0%) | 0 (0.0%) |
| 3 or 4 Children | 30 (100.0%) | 0 (0.0%) |
| 5 or more Children | 0 (0.0%) | 0 (0.0%) |
| Total | 2,336 (96.9%) | 76 (3.2%) |
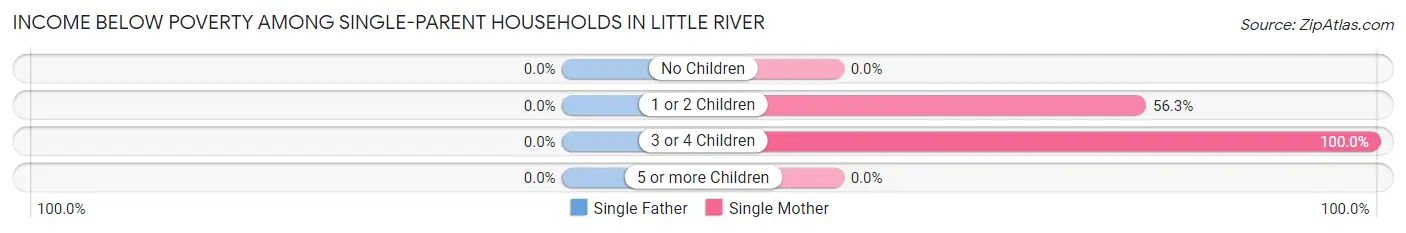
Income Below Poverty Among Single-Parent Households in Little River
| Children | Single Father | Single Mother |
| No Children | 0 (0.0%) | 0 (0.0%) |
| 1 or 2 Children | 0 (0.0%) | 107 (56.3%) |
| 3 or 4 Children | 0 (0.0%) | 16 (100.0%) |
| 5 or more Children | 0 (0.0%) | 0 (0.0%) |
| Total | 0 (0.0%) | 123 (38.2%) |
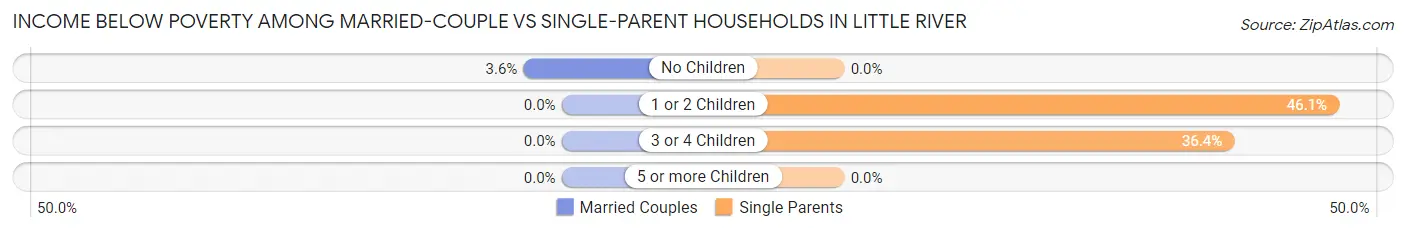
Income Below Poverty Among Married-Couple vs Single-Parent Households in Little River
The poverty data for Little River shows that 76 of the married-couple family households (3.2%) and 123 of the single-parent households (30.2%) are living below the poverty level. Within the married-couple family households, those with no children have the highest poverty rate, with 76 households (3.6%) falling below the poverty line. Among the single-parent households, those with 1 or 2 children have the highest poverty rate, with 107 household (46.1%) living below poverty.
| Children | Married-Couple Families | Single-Parent Households |
| No Children | 76 (3.6%) | 0 (0.0%) |
| 1 or 2 Children | 0 (0.0%) | 107 (46.1%) |
| 3 or 4 Children | 0 (0.0%) | 16 (36.4%) |
| 5 or more Children | 0 (0.0%) | 0 (0.0%) |
| Total | 76 (3.2%) | 123 (30.2%) |
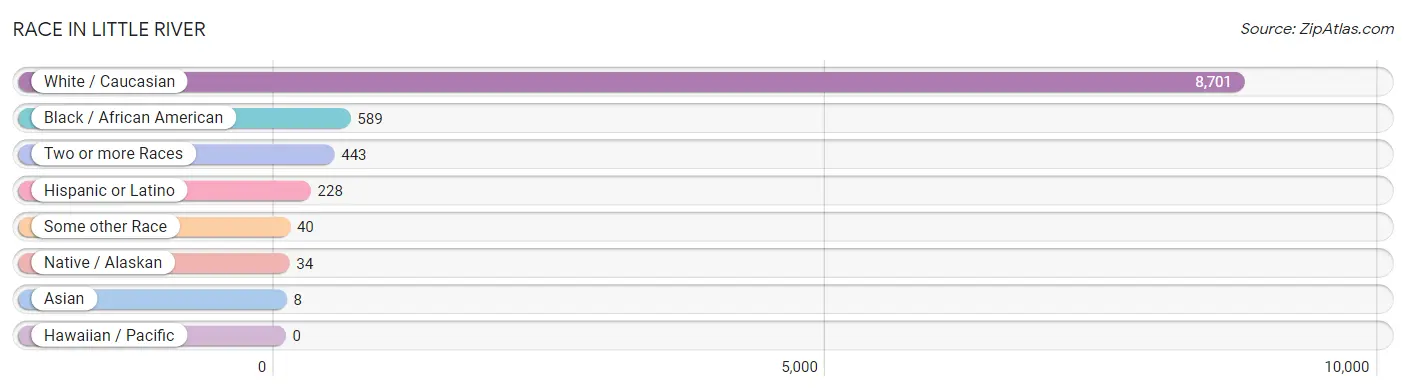
Race in Little River
The most populous races in Little River are White / Caucasian (8,701 | 88.6%), Black / African American (589 | 6.0%), and Two or more Races (443 | 4.5%).
| Race | # Population | % Population |
| Asian | 8 | 0.1% |
| Black / African American | 589 | 6.0% |
| Hawaiian / Pacific | 0 | 0.0% |
| Hispanic or Latino | 228 | 2.3% |
| Native / Alaskan | 34 | 0.4% |
| White / Caucasian | 8,701 | 88.6% |
| Two or more Races | 443 | 4.5% |
| Some other Race | 40 | 0.4% |
| Total | 9,815 | 100.0% |
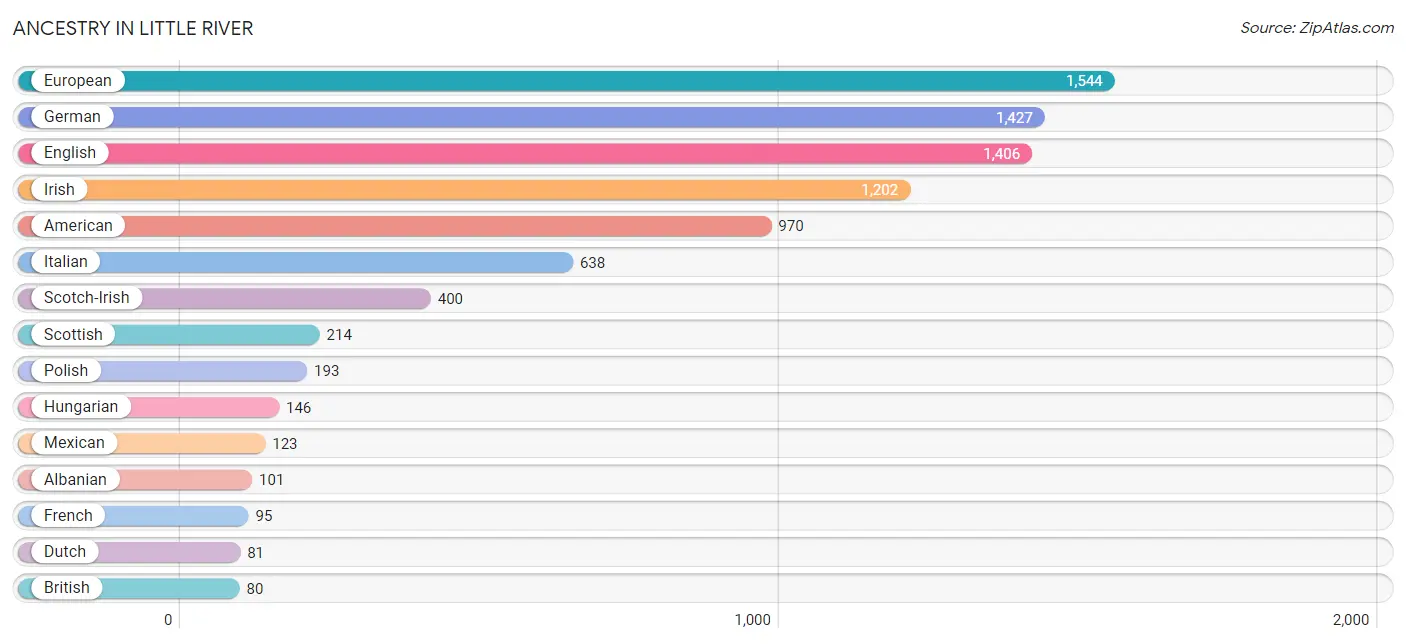
Ancestry in Little River
The most populous ancestries reported in Little River are European (1,544 | 15.7%), German (1,427 | 14.5%), English (1,406 | 14.3%), Irish (1,202 | 12.2%), and American (970 | 9.9%), together accounting for 66.7% of all Little River residents.
| Ancestry | # Population | % Population |
| African | 77 | 0.8% |
| Albanian | 101 | 1.0% |
| American | 970 | 9.9% |
| Arab | 13 | 0.1% |
| Armenian | 16 | 0.2% |
| Austrian | 43 | 0.4% |
| Bhutanese | 10 | 0.1% |
| British | 80 | 0.8% |
| Bulgarian | 26 | 0.3% |
| Canadian | 20 | 0.2% |
| Central American | 38 | 0.4% |
| Cherokee | 13 | 0.1% |
| Czech | 8 | 0.1% |
| Danish | 26 | 0.3% |
| Dominican | 14 | 0.1% |
| Dutch | 81 | 0.8% |
| English | 1,406 | 14.3% |
| European | 1,544 | 15.7% |
| French | 95 | 1.0% |
| French Canadian | 68 | 0.7% |
| German | 1,427 | 14.5% |
| Greek | 22 | 0.2% |
| Hungarian | 146 | 1.5% |
| Irish | 1,202 | 12.2% |
| Italian | 638 | 6.5% |
| Jamaican | 3 | 0.0% |
| Lebanese | 13 | 0.1% |
| Lumbee | 34 | 0.4% |
| Mexican | 123 | 1.3% |
| Northern European | 8 | 0.1% |
| Norwegian | 8 | 0.1% |
| Pennsylvania German | 8 | 0.1% |
| Polish | 193 | 2.0% |
| Puerto Rican | 46 | 0.5% |
| Romanian | 9 | 0.1% |
| Russian | 25 | 0.3% |
| Salvadoran | 38 | 0.4% |
| Scotch-Irish | 400 | 4.1% |
| Scottish | 214 | 2.2% |
| Slovak | 44 | 0.4% |
| Spaniard | 7 | 0.1% |
| Sri Lankan | 8 | 0.1% |
| Subsaharan African | 77 | 0.8% |
| Swedish | 30 | 0.3% |
| Welsh | 44 | 0.4% |
| West Indian | 3 | 0.0% | View All 46 Rows |
Immigrants in Little River
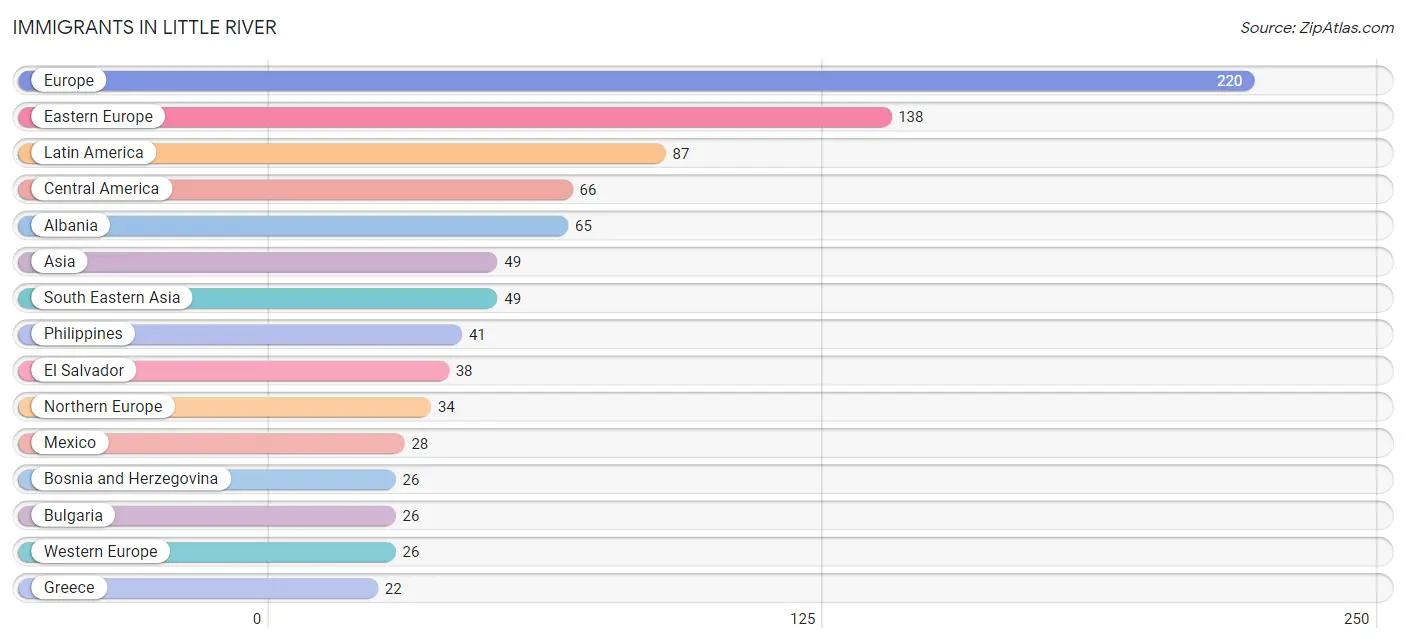
The most numerous immigrant groups reported in Little River came from Europe (220 | 2.2%), Eastern Europe (138 | 1.4%), Latin America (87 | 0.9%), Central America (66 | 0.7%), and Albania (65 | 0.7%), together accounting for 5.9% of all Little River residents.
| Immigration Origin | # Population | % Population |
| Albania | 65 | 0.7% |
| Asia | 49 | 0.5% |
| Bahamas | 7 | 0.1% |
| Bosnia and Herzegovina | 26 | 0.3% |
| Bulgaria | 26 | 0.3% |
| Canada | 9 | 0.1% |
| Caribbean | 21 | 0.2% |
| Central America | 66 | 0.7% |
| Denmark | 18 | 0.2% |
| Dominican Republic | 14 | 0.1% |
| Eastern Europe | 138 | 1.4% |
| El Salvador | 38 | 0.4% |
| England | 8 | 0.1% |
| Europe | 220 | 2.2% |
| Germany | 8 | 0.1% |
| Greece | 22 | 0.2% |
| Hungary | 21 | 0.2% |
| Latin America | 87 | 0.9% |
| Mexico | 28 | 0.3% |
| Northern Europe | 34 | 0.4% |
| Philippines | 41 | 0.4% |
| South Eastern Asia | 49 | 0.5% |
| Southern Europe | 22 | 0.2% |
| Switzerland | 18 | 0.2% |
| Vietnam | 8 | 0.1% |
| Western Europe | 26 | 0.3% | View All 26 Rows |
Sex and Age in Little River
Sex and Age in Little River
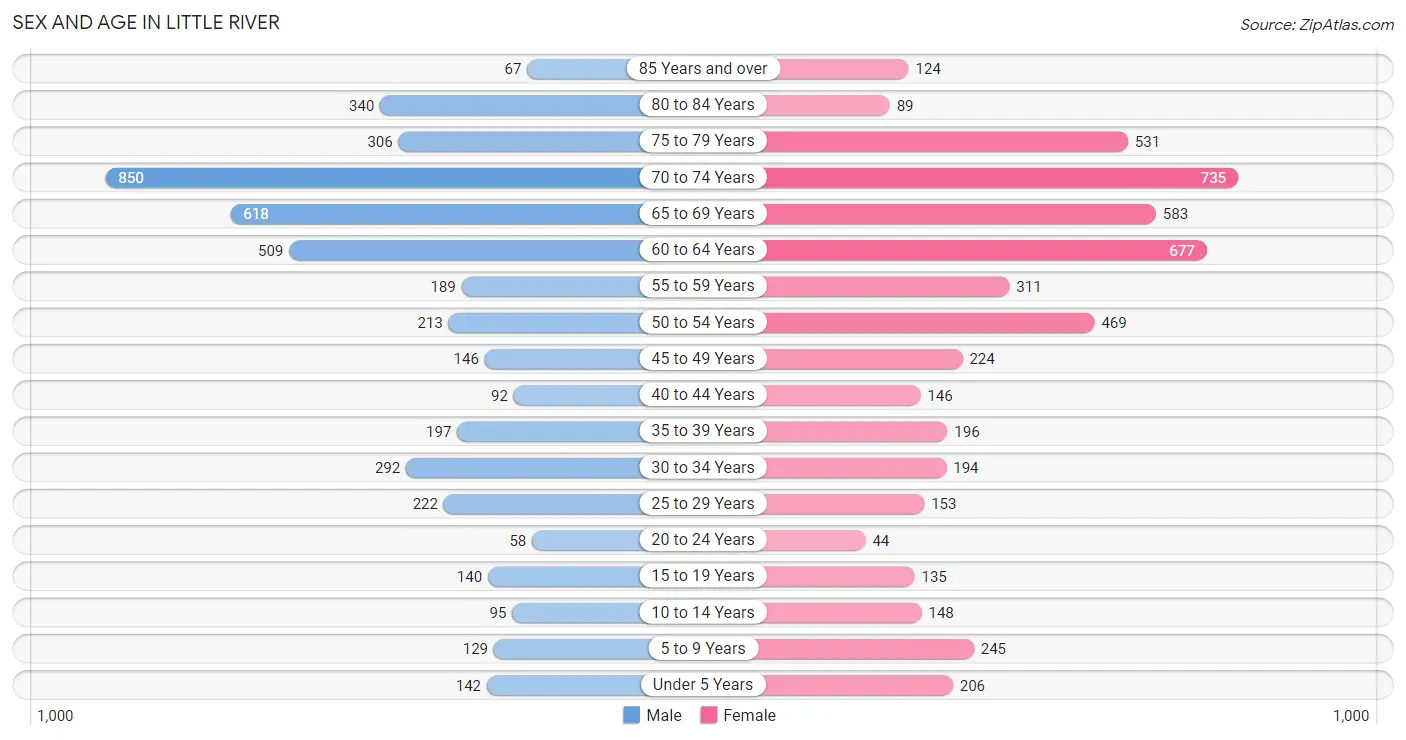
The most populous age groups in Little River are 70 to 74 Years (850 | 18.5%) for men and 70 to 74 Years (735 | 14.1%) for women.
| Age Bracket | Male | Female |
| Under 5 Years | 142 (3.1%) | 206 (4.0%) |
| 5 to 9 Years | 129 (2.8%) | 245 (4.7%) |
| 10 to 14 Years | 95 (2.1%) | 148 (2.8%) |
| 15 to 19 Years | 140 (3.0%) | 135 (2.6%) |
| 20 to 24 Years | 58 (1.3%) | 44 (0.8%) |
| 25 to 29 Years | 222 (4.8%) | 153 (2.9%) |
| 30 to 34 Years | 292 (6.3%) | 194 (3.7%) |
| 35 to 39 Years | 197 (4.3%) | 196 (3.8%) |
| 40 to 44 Years | 92 (2.0%) | 146 (2.8%) |
| 45 to 49 Years | 146 (3.2%) | 224 (4.3%) |
| 50 to 54 Years | 213 (4.6%) | 469 (9.0%) |
| 55 to 59 Years | 189 (4.1%) | 311 (6.0%) |
| 60 to 64 Years | 509 (11.1%) | 677 (13.0%) |
| 65 to 69 Years | 618 (13.4%) | 583 (11.2%) |
| 70 to 74 Years | 850 (18.5%) | 735 (14.1%) |
| 75 to 79 Years | 306 (6.6%) | 531 (10.2%) |
| 80 to 84 Years | 340 (7.4%) | 89 (1.7%) |
| 85 Years and over | 67 (1.5%) | 124 (2.4%) |
| Total | 4,605 (100.0%) | 5,210 (100.0%) |
Families and Households in Little River
Median Family Size in Little River
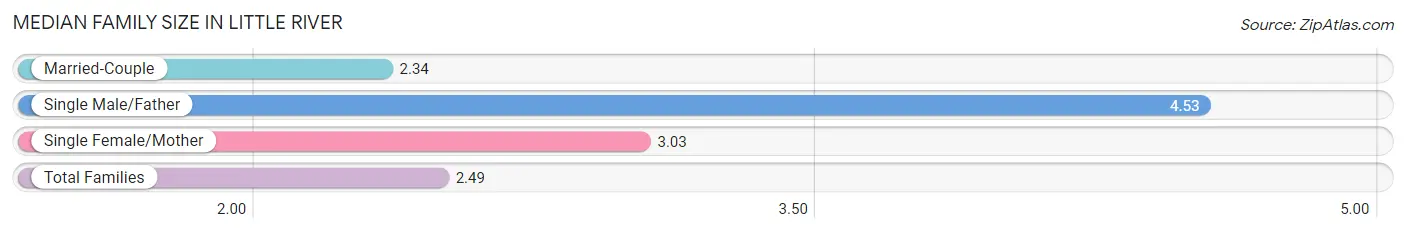
The median family size in Little River is 2.49 persons per family, with single male/father families (85 | 3.0%) accounting for the largest median family size of 4.53 persons per family. On the other hand, married-couple families (2,412 | 85.6%) represent the smallest median family size with 2.34 persons per family.
| Family Type | # Families | Family Size |
| Married-Couple | 2,412 (85.6%) | 2.34 |
| Single Male/Father | 85 (3.0%) | 4.53 |
| Single Female/Mother | 322 (11.4%) | 3.03 |
| Total Families | 2,819 (100.0%) | 2.49 |
Median Household Size in Little River
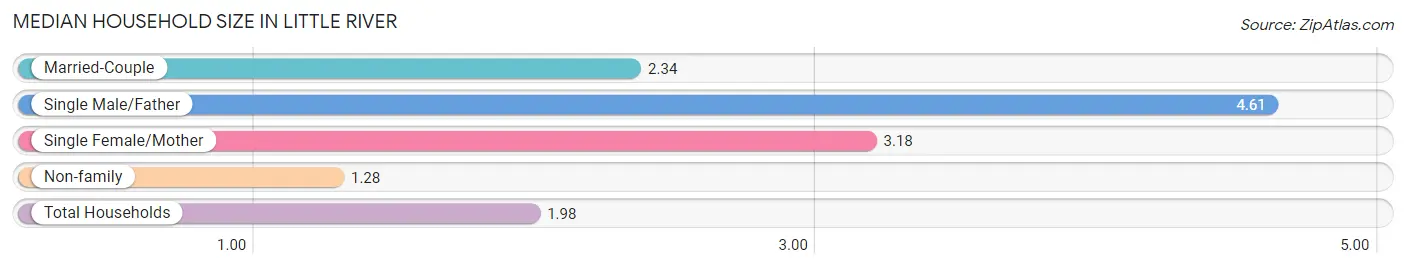
The median household size in Little River is 1.98 persons per household, with single male/father households (85 | 1.7%) accounting for the largest median household size of 4.61 persons per household. non-family households (2,134 | 43.1%) represent the smallest median household size with 1.28 persons per household.
| Household Type | # Households | Household Size |
| Married-Couple | 2,412 (48.7%) | 2.34 |
| Single Male/Father | 85 (1.7%) | 4.61 |
| Single Female/Mother | 322 (6.5%) | 3.18 |
| Non-family | 2,134 (43.1%) | 1.28 |
| Total Households | 4,953 (100.0%) | 1.98 |
Household Size by Marriage Status in Little River
Out of a total of 4,953 households in Little River, 2,819 (56.9%) are family households, while 2,134 (43.1%) are nonfamily households. The most numerous type of family households are 2-person households, comprising 2,237, and the most common type of nonfamily households are 1-person households, comprising 1,768.
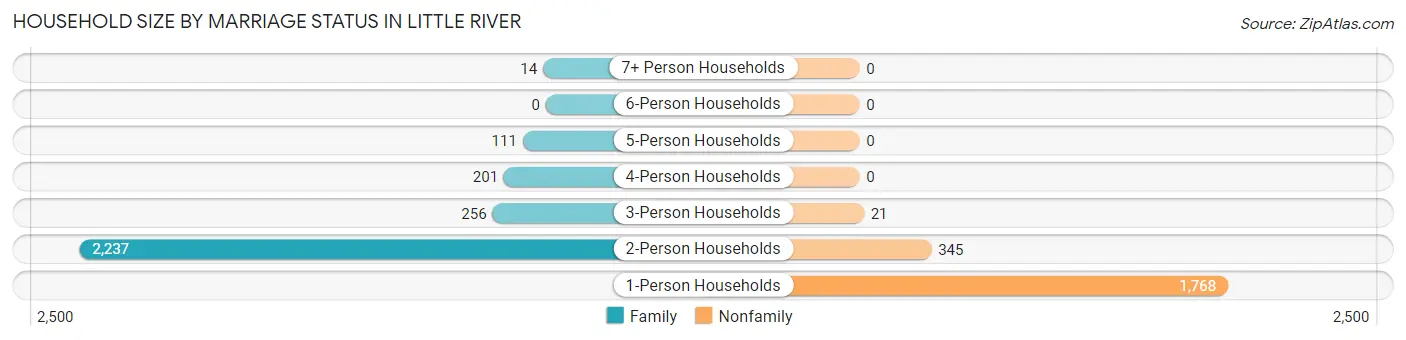
| Household Size | Family Households | Nonfamily Households |
| 1-Person Households | - | 1,768 (35.7%) |
| 2-Person Households | 2,237 (45.2%) | 345 (7.0%) |
| 3-Person Households | 256 (5.2%) | 21 (0.4%) |
| 4-Person Households | 201 (4.1%) | 0 (0.0%) |
| 5-Person Households | 111 (2.2%) | 0 (0.0%) |
| 6-Person Households | 0 (0.0%) | 0 (0.0%) |
| 7+ Person Households | 14 (0.3%) | 0 (0.0%) |
| Total | 2,819 (56.9%) | 2,134 (43.1%) |
Female Fertility in Little River
Fertility by Age in Little River
Average fertility rate in Little River is 13.0 births per 1,000 women. Women in the age bracket of 20 to 34 years have the highest fertility rate with 41.0 births per 1,000 women. Women in the age bracket of 20 to 34 years acount for 100.0% of all women with births.
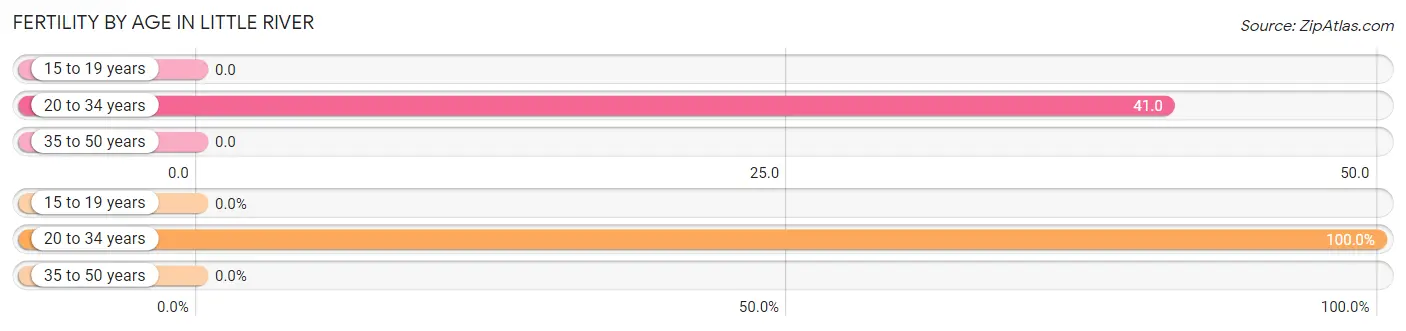
| Age Bracket | Women with Births | Births / 1,000 Women |
| 15 to 19 years | 0 (0.0%) | 0.0 |
| 20 to 34 years | 16 (100.0%) | 41.0 |
| 35 to 50 years | 0 (0.0%) | 0.0 |
| Total | 16 (100.0%) | 13.0 |
Fertility by Age by Marriage Status in Little River
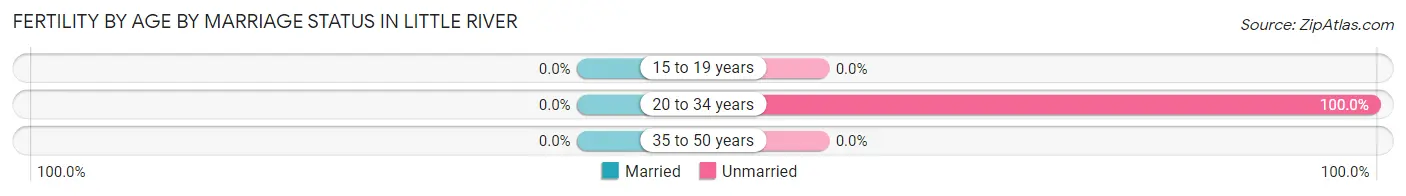
| Age Bracket | Married | Unmarried |
| 15 to 19 years | 0 (0.0%) | 0 (0.0%) |
| 20 to 34 years | 0 (0.0%) | 16 (100.0%) |
| 35 to 50 years | 0 (0.0%) | 0 (0.0%) |
| Total | 0 (0.0%) | 16 (100.0%) |
Fertility by Education in Little River
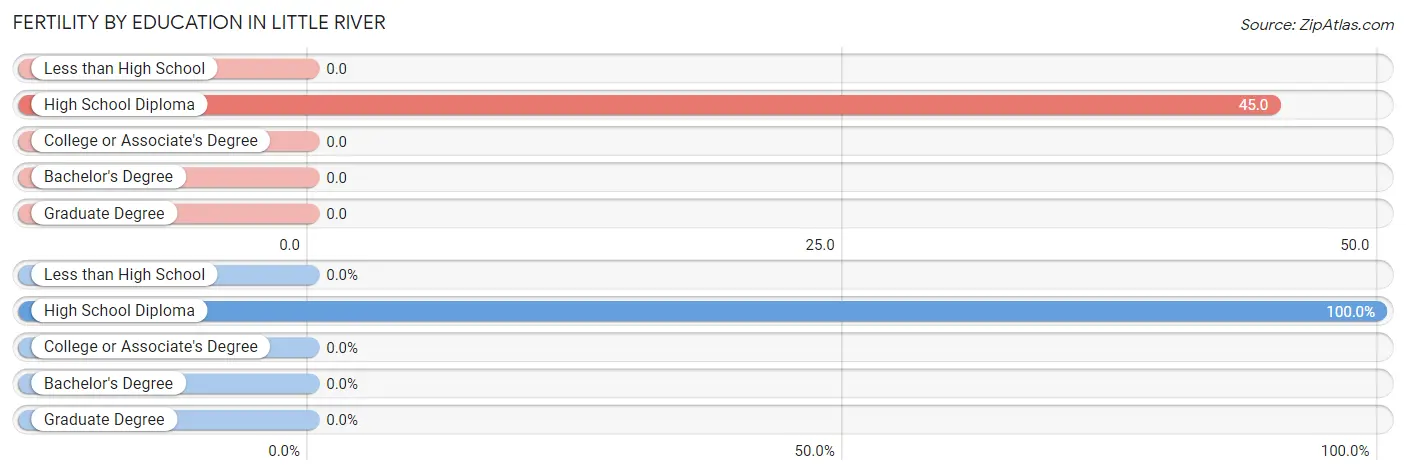
| Educational Attainment | Women with Births | Births / 1,000 Women |
| Less than High School | 0 (0.0%) | 0.0 |
| High School Diploma | 16 (100.0%) | 45.0 |
| College or Associate's Degree | 0 (0.0%) | 0.0 |
| Bachelor's Degree | 0 (0.0%) | 0.0 |
| Graduate Degree | 0 (0.0%) | 0.0 |
| Total | 16 (100.0%) | 13.0 |
Fertility by Education by Marriage Status in Little River
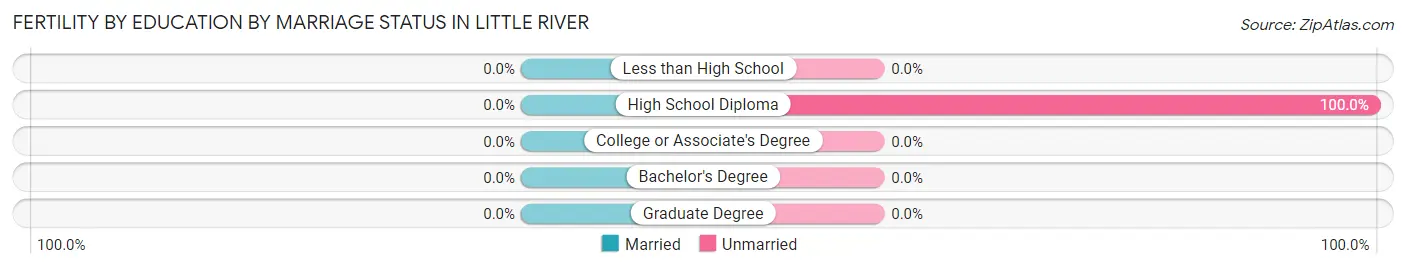
| Educational Attainment | Married | Unmarried |
| Less than High School | 0 (0.0%) | 0 (0.0%) |
| High School Diploma | 0 (0.0%) | 16 (100.0%) |
| College or Associate's Degree | 0 (0.0%) | 0 (0.0%) |
| Bachelor's Degree | 0 (0.0%) | 0 (0.0%) |
| Graduate Degree | 0 (0.0%) | 0 (0.0%) |
| Total | 0 (0.0%) | 16 (100.0%) |
Employment Characteristics in Little River
Employment by Class of Employer in Little River
Among the 3,602 employed individuals in Little River, private company employees (2,502 | 69.5%), self-employed (incorporated) (311 | 8.6%), and not-for-profit organizations (228 | 6.3%) make up the most common classes of employment.
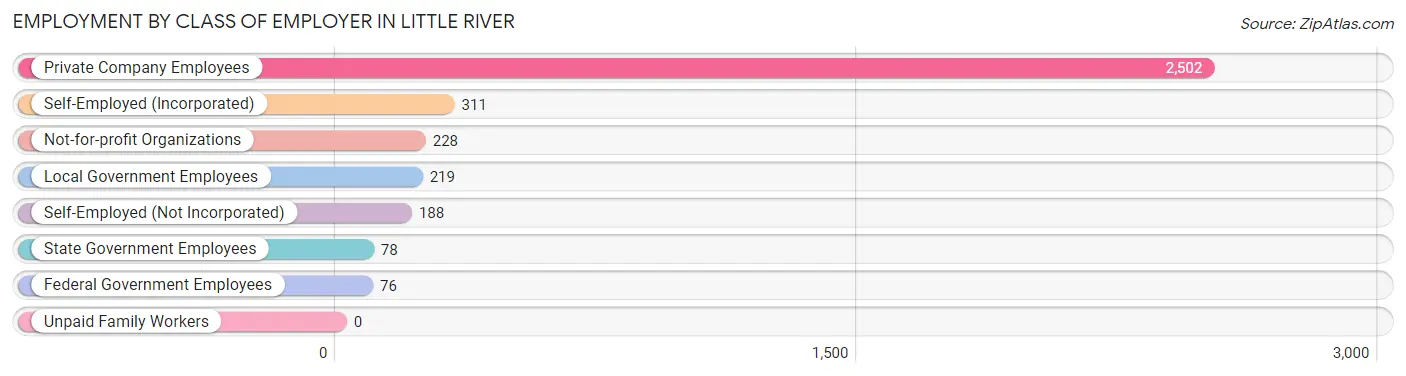
| Employer Class | # Employees | % Employees |
| Private Company Employees | 2,502 | 69.5% |
| Self-Employed (Incorporated) | 311 | 8.6% |
| Self-Employed (Not Incorporated) | 188 | 5.2% |
| Not-for-profit Organizations | 228 | 6.3% |
| Local Government Employees | 219 | 6.1% |
| State Government Employees | 78 | 2.2% |
| Federal Government Employees | 76 | 2.1% |
| Unpaid Family Workers | 0 | 0.0% |
| Total | 3,602 | 100.0% |
Employment Status by Age in Little River
According to the labor force statistics for Little River, out of the total population over 16 years of age (8,828), 43.7% or 3,858 individuals are in the labor force, with 4.4% or 170 of them unemployed. The age group with the highest labor force participation rate is 30 to 34 years, with 91.8% or 446 individuals in the labor force. Within the labor force, the 16 to 19 years age range has the highest percentage of unemployed individuals, with 29.0% or 29 of them being unemployed.
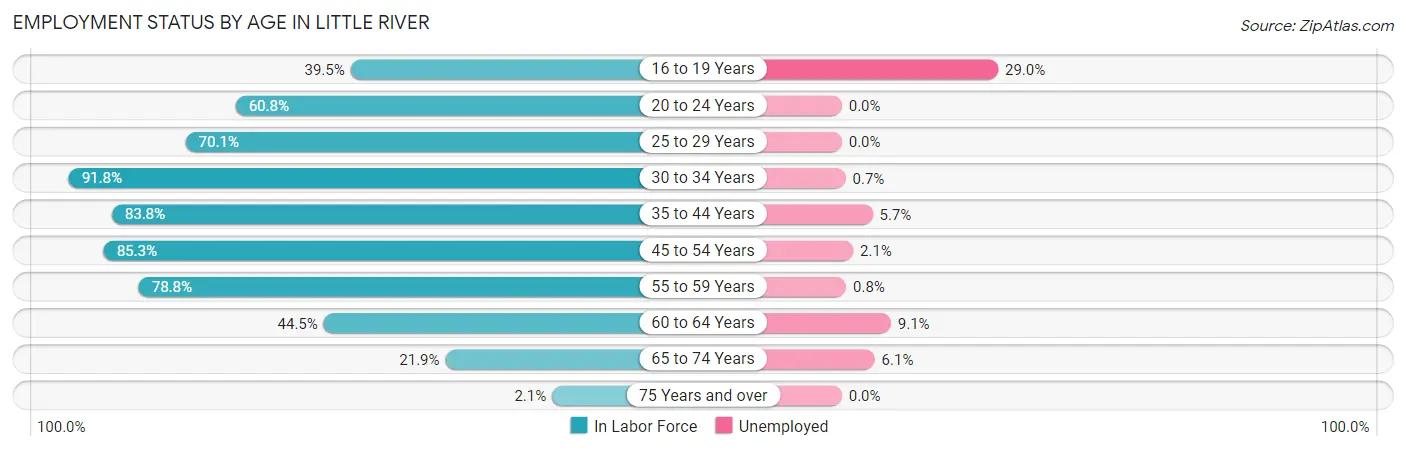
| Age Bracket | In Labor Force | Unemployed |
| 16 to 19 Years | 100 (39.5%) | 29 (29.0%) |
| 20 to 24 Years | 62 (60.8%) | 0 (0.0%) |
| 25 to 29 Years | 263 (70.1%) | 0 (0.0%) |
| 30 to 34 Years | 446 (91.8%) | 3 (0.7%) |
| 35 to 44 Years | 529 (83.8%) | 30 (5.7%) |
| 45 to 54 Years | 897 (85.3%) | 19 (2.1%) |
| 55 to 59 Years | 394 (78.8%) | 3 (0.8%) |
| 60 to 64 Years | 528 (44.5%) | 48 (9.1%) |
| 65 to 74 Years | 610 (21.9%) | 37 (6.1%) |
| 75 Years and over | 31 (2.1%) | 0 (0.0%) |
| Total | 3,858 (43.7%) | 170 (4.4%) |
Employment Status by Educational Attainment in Little River
According to labor force statistics for Little River, 72.3% of individuals (3,058) out of the total population between 25 and 64 years of age (4,230) are in the labor force, with 3.4% or 104 of them being unemployed. The group with the highest labor force participation rate are those with the educational attainment of college / associate degree, with 86.0% or 1,320 individuals in the labor force. Within the labor force, individuals with high school diploma education have the highest percentage of unemployment, with 4.9% or 39 of them being unemployed.
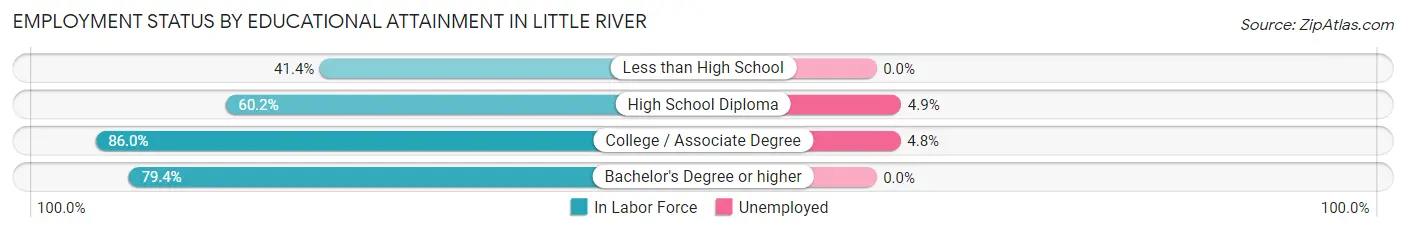
| Educational Attainment | In Labor Force | Unemployed |
| Less than High School | 164 (41.4%) | 0 (0.0%) |
| High School Diploma | 789 (60.2%) | 64 (4.9%) |
| College / Associate Degree | 1,320 (86.0%) | 74 (4.8%) |
| Bachelor's Degree or higher | 784 (79.4%) | 0 (0.0%) |
| Total | 3,058 (72.3%) | 144 (3.4%) |
Employment Occupations by Sex in Little River
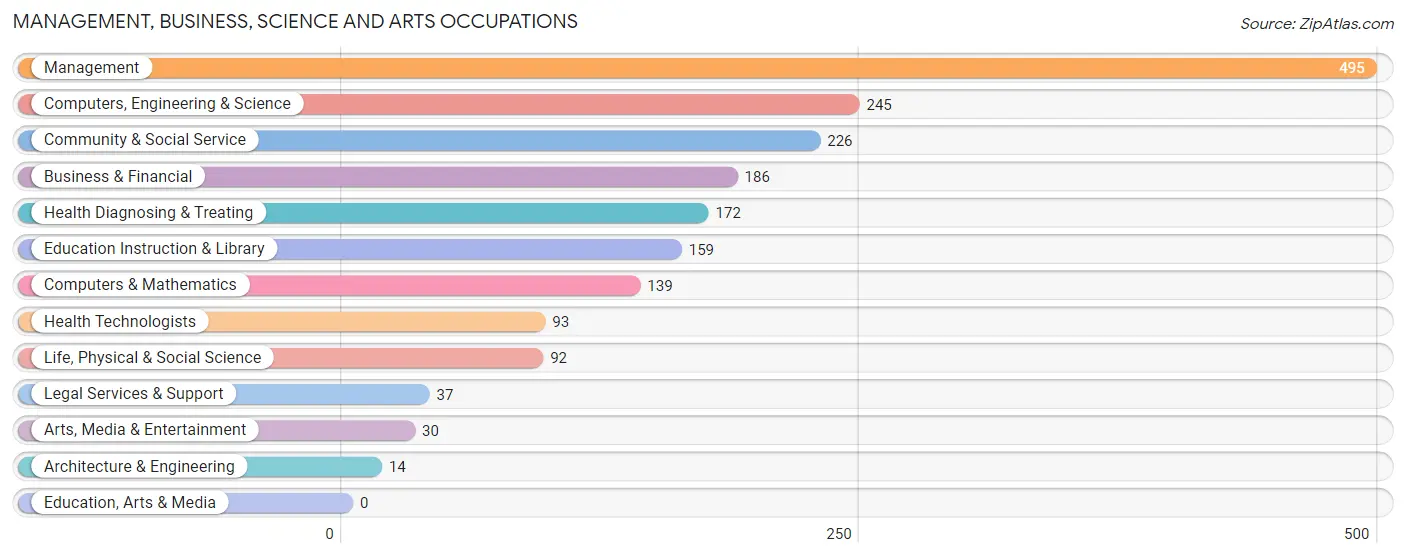
Management, Business, Science and Arts Occupations
The most common Management, Business, Science and Arts occupations in Little River are Management (495 | 13.4%), Computers, Engineering & Science (245 | 6.6%), Community & Social Service (226 | 6.1%), Business & Financial (186 | 5.0%), and Health Diagnosing & Treating (172 | 4.7%).
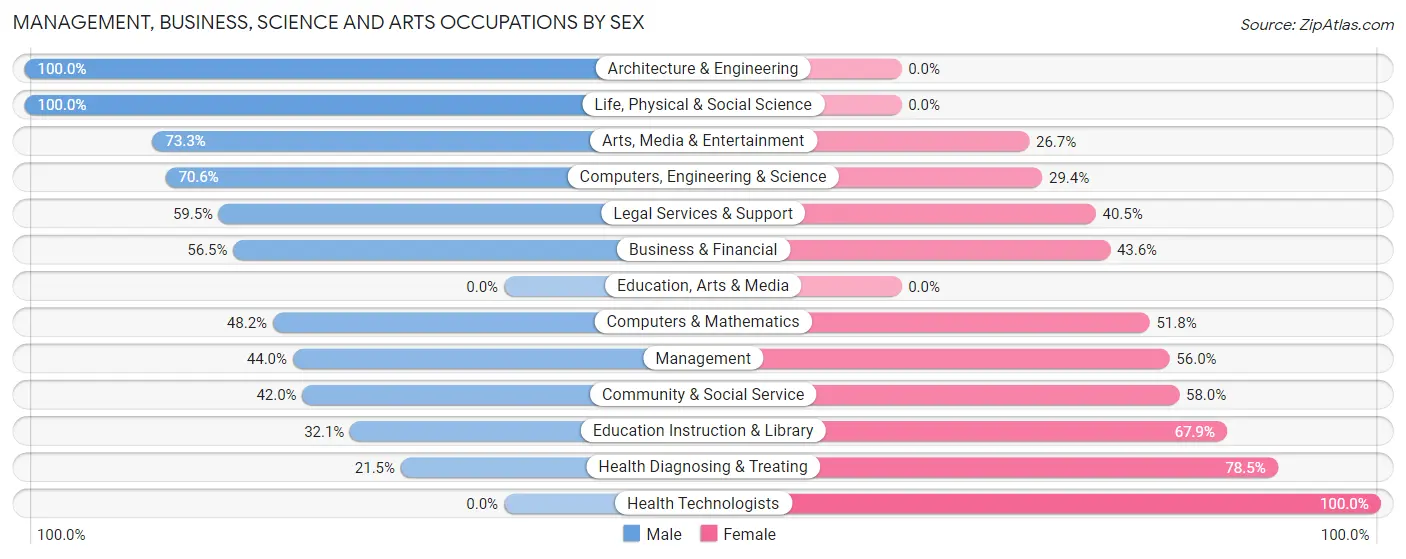
Management, Business, Science and Arts Occupations by Sex
Within the Management, Business, Science and Arts occupations in Little River, the most male-oriented occupations are Architecture & Engineering (100.0%), Life, Physical & Social Science (100.0%), and Arts, Media & Entertainment (73.3%), while the most female-oriented occupations are Health Technologists (100.0%), Health Diagnosing & Treating (78.5%), and Education Instruction & Library (67.9%).
| Occupation | Male | Female |
| Management | 218 (44.0%) | 277 (56.0%) |
| Business & Financial | 105 (56.5%) | 81 (43.5%) |
| Computers, Engineering & Science | 173 (70.6%) | 72 (29.4%) |
| Computers & Mathematics | 67 (48.2%) | 72 (51.8%) |
| Architecture & Engineering | 14 (100.0%) | 0 (0.0%) |
| Life, Physical & Social Science | 92 (100.0%) | 0 (0.0%) |
| Community & Social Service | 95 (42.0%) | 131 (58.0%) |
| Education, Arts & Media | 0 (0.0%) | 0 (0.0%) |
| Legal Services & Support | 22 (59.5%) | 15 (40.5%) |
| Education Instruction & Library | 51 (32.1%) | 108 (67.9%) |
| Arts, Media & Entertainment | 22 (73.3%) | 8 (26.7%) |
| Health Diagnosing & Treating | 37 (21.5%) | 135 (78.5%) |
| Health Technologists | 0 (0.0%) | 93 (100.0%) |
| Total (Category) | 628 (47.4%) | 696 (52.6%) |
| Total (Overall) | 1,738 (47.1%) | 1,954 (52.9%) |
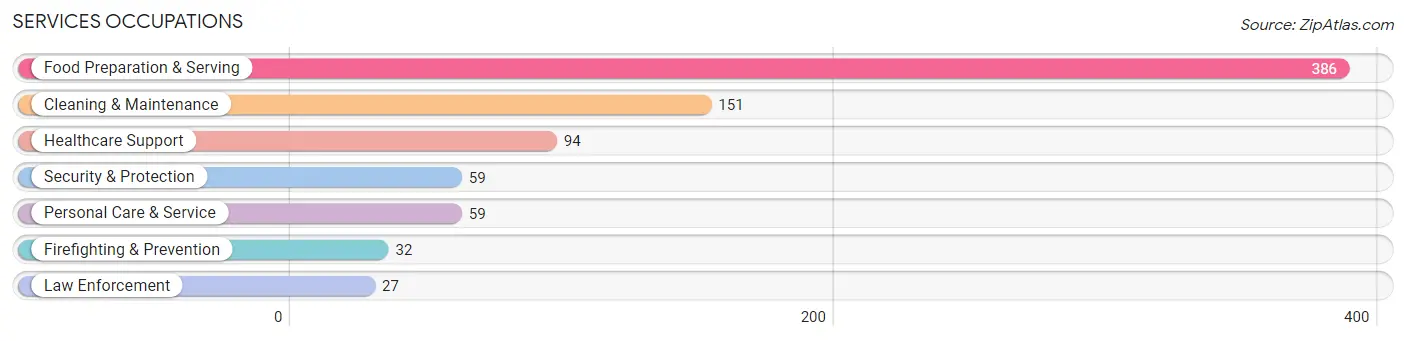
Services Occupations
The most common Services occupations in Little River are Food Preparation & Serving (386 | 10.5%), Cleaning & Maintenance (151 | 4.1%), Healthcare Support (94 | 2.5%), Security & Protection (59 | 1.6%), and Personal Care & Service (59 | 1.6%).
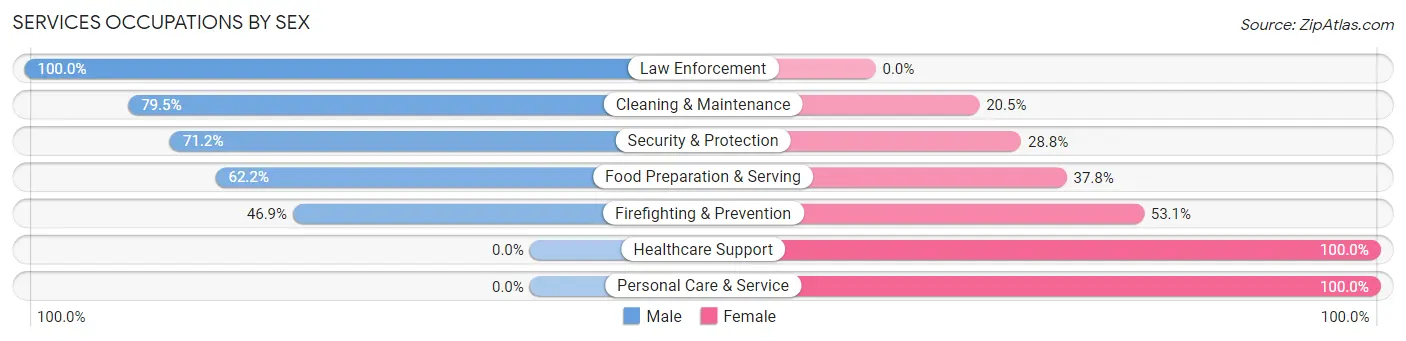
Services Occupations by Sex
Within the Services occupations in Little River, the most male-oriented occupations are Law Enforcement (100.0%), Cleaning & Maintenance (79.5%), and Security & Protection (71.2%), while the most female-oriented occupations are Healthcare Support (100.0%), Personal Care & Service (100.0%), and Firefighting & Prevention (53.1%).
| Occupation | Male | Female |
| Healthcare Support | 0 (0.0%) | 94 (100.0%) |
| Security & Protection | 42 (71.2%) | 17 (28.8%) |
| Firefighting & Prevention | 15 (46.9%) | 17 (53.1%) |
| Law Enforcement | 27 (100.0%) | 0 (0.0%) |
| Food Preparation & Serving | 240 (62.2%) | 146 (37.8%) |
| Cleaning & Maintenance | 120 (79.5%) | 31 (20.5%) |
| Personal Care & Service | 0 (0.0%) | 59 (100.0%) |
| Total (Category) | 402 (53.7%) | 347 (46.3%) |
| Total (Overall) | 1,738 (47.1%) | 1,954 (52.9%) |
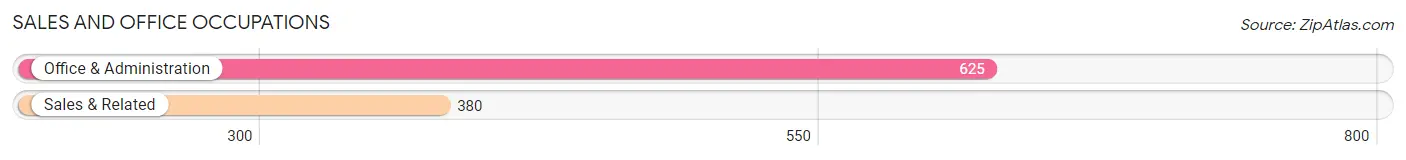
Sales and Office Occupations
The most common Sales and Office occupations in Little River are Office & Administration (625 | 16.9%), and Sales & Related (380 | 10.3%).
Sales and Office Occupations by Sex
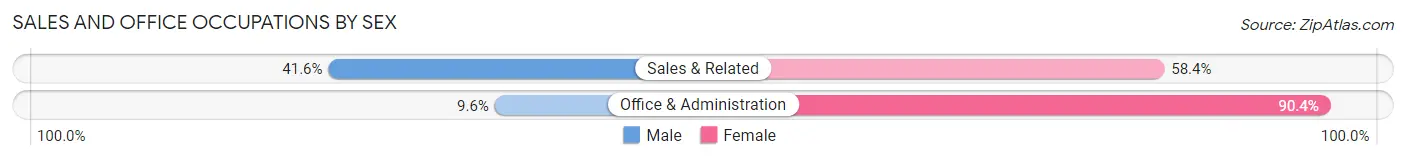
| Occupation | Male | Female |
| Sales & Related | 158 (41.6%) | 222 (58.4%) |
| Office & Administration | 60 (9.6%) | 565 (90.4%) |
| Total (Category) | 218 (21.7%) | 787 (78.3%) |
| Total (Overall) | 1,738 (47.1%) | 1,954 (52.9%) |
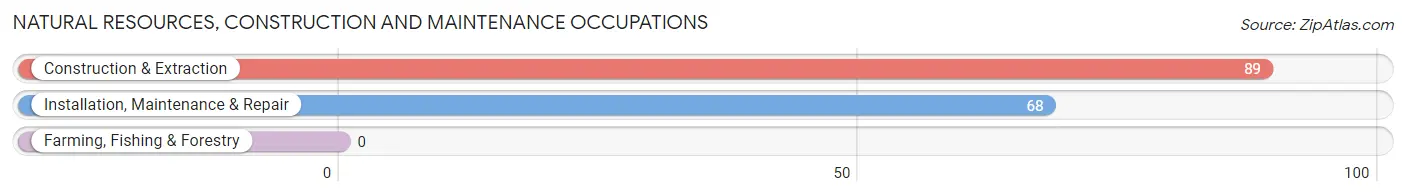
Natural Resources, Construction and Maintenance Occupations
The most common Natural Resources, Construction and Maintenance occupations in Little River are Construction & Extraction (89 | 2.4%), and Installation, Maintenance & Repair (68 | 1.8%).
Natural Resources, Construction and Maintenance Occupations by Sex
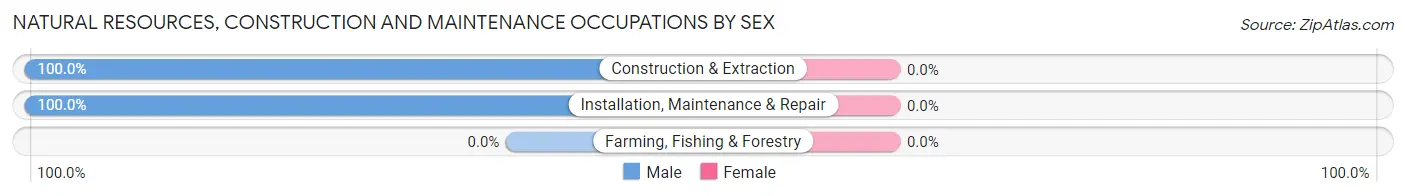
| Occupation | Male | Female |
| Farming, Fishing & Forestry | 0 (0.0%) | 0 (0.0%) |
| Construction & Extraction | 89 (100.0%) | 0 (0.0%) |
| Installation, Maintenance & Repair | 68 (100.0%) | 0 (0.0%) |
| Total (Category) | 157 (100.0%) | 0 (0.0%) |
| Total (Overall) | 1,738 (47.1%) | 1,954 (52.9%) |
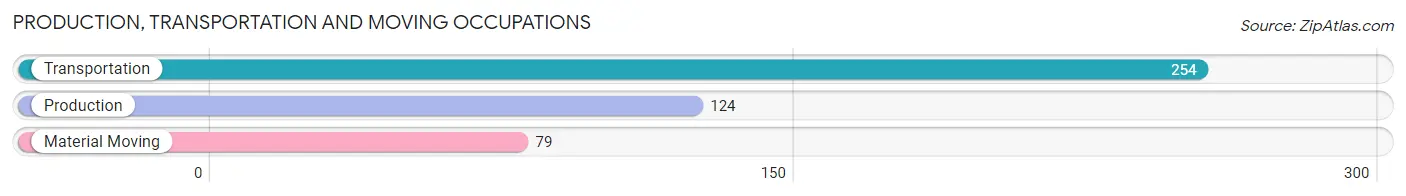
Production, Transportation and Moving Occupations
The most common Production, Transportation and Moving occupations in Little River are Transportation (254 | 6.9%), Production (124 | 3.4%), and Material Moving (79 | 2.1%).
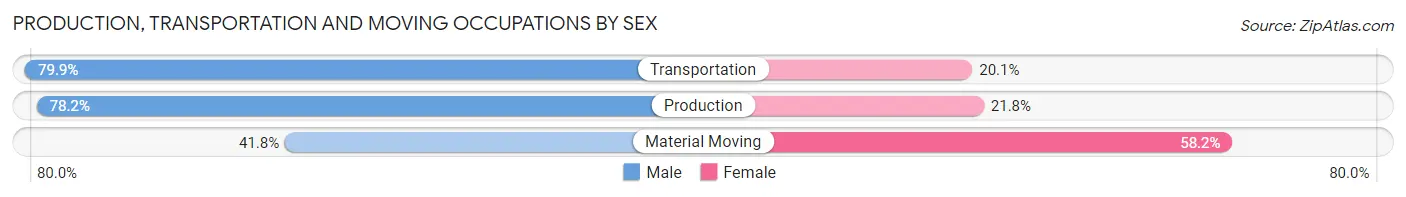
Production, Transportation and Moving Occupations by Sex
| Occupation | Male | Female |
| Production | 97 (78.2%) | 27 (21.8%) |
| Transportation | 203 (79.9%) | 51 (20.1%) |
| Material Moving | 33 (41.8%) | 46 (58.2%) |
| Total (Category) | 333 (72.9%) | 124 (27.1%) |
| Total (Overall) | 1,738 (47.1%) | 1,954 (52.9%) |
Employment Industries by Sex in Little River
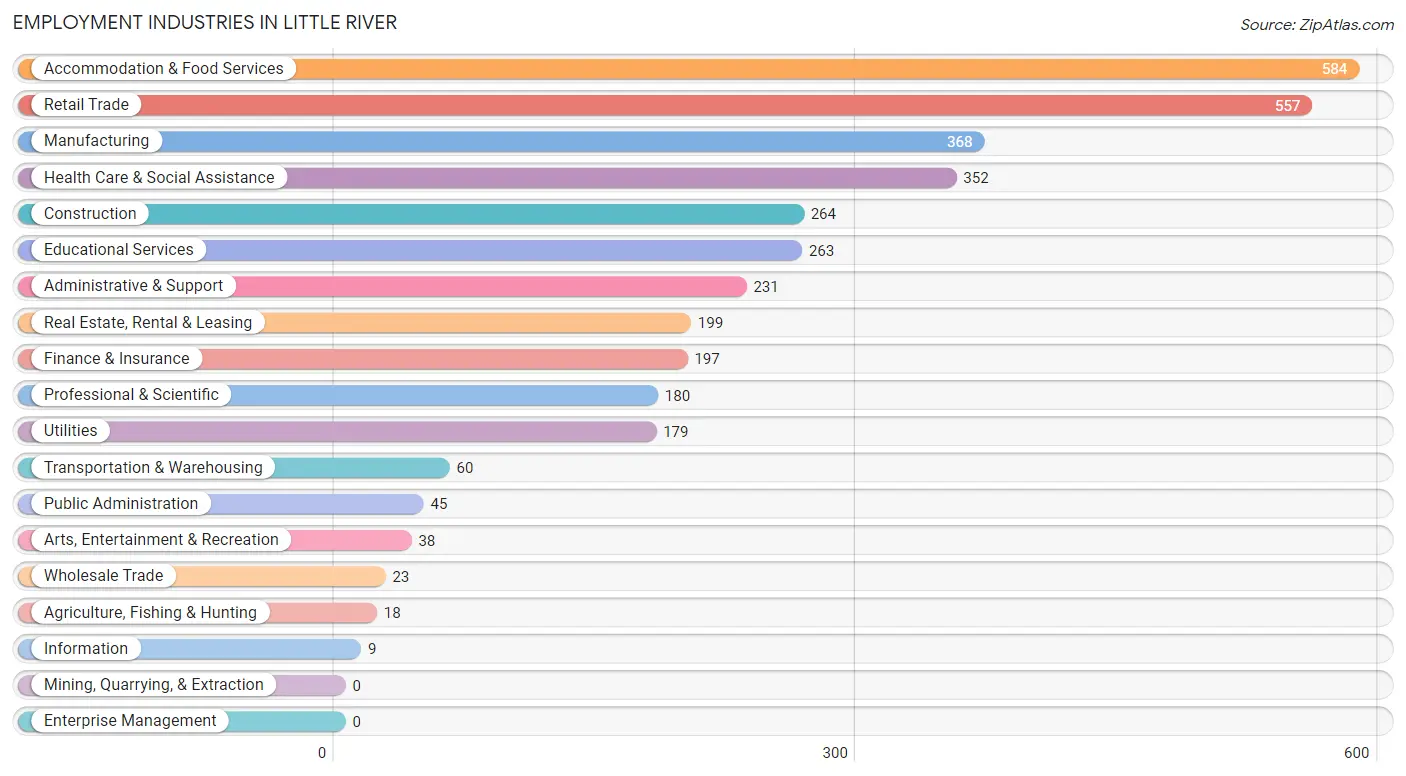
Employment Industries in Little River
The major employment industries in Little River include Accommodation & Food Services (584 | 15.8%), Retail Trade (557 | 15.1%), Manufacturing (368 | 10.0%), Health Care & Social Assistance (352 | 9.5%), and Construction (264 | 7.1%).
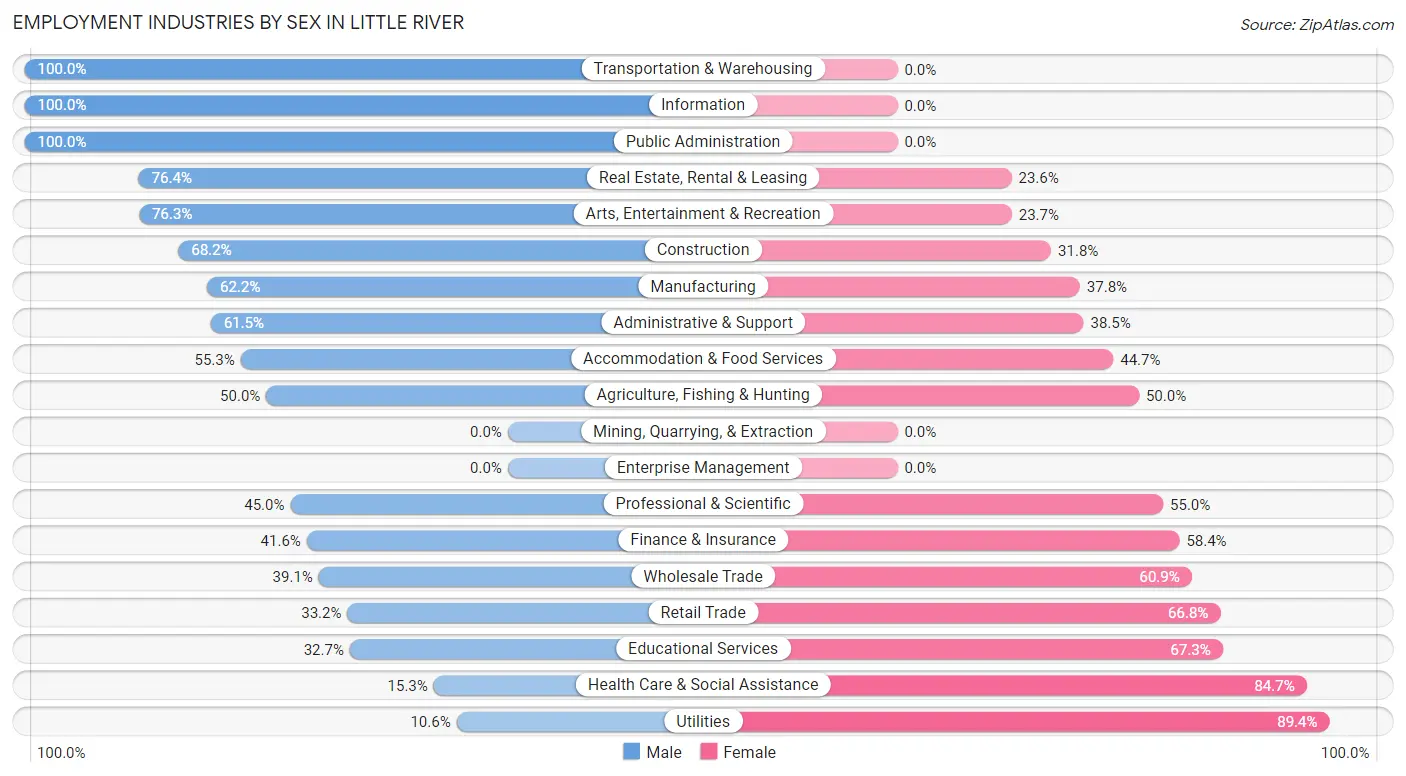
Employment Industries by Sex in Little River
The Little River industries that see more men than women are Transportation & Warehousing (100.0%), Information (100.0%), and Public Administration (100.0%), whereas the industries that tend to have a higher number of women are Utilities (89.4%), Health Care & Social Assistance (84.7%), and Educational Services (67.3%).
| Industry | Male | Female |
| Agriculture, Fishing & Hunting | 9 (50.0%) | 9 (50.0%) |
| Mining, Quarrying, & Extraction | 0 (0.0%) | 0 (0.0%) |
| Construction | 180 (68.2%) | 84 (31.8%) |
| Manufacturing | 229 (62.2%) | 139 (37.8%) |
| Wholesale Trade | 9 (39.1%) | 14 (60.9%) |
| Retail Trade | 185 (33.2%) | 372 (66.8%) |
| Transportation & Warehousing | 60 (100.0%) | 0 (0.0%) |
| Utilities | 19 (10.6%) | 160 (89.4%) |
| Information | 9 (100.0%) | 0 (0.0%) |
| Finance & Insurance | 82 (41.6%) | 115 (58.4%) |
| Real Estate, Rental & Leasing | 152 (76.4%) | 47 (23.6%) |
| Professional & Scientific | 81 (45.0%) | 99 (55.0%) |
| Enterprise Management | 0 (0.0%) | 0 (0.0%) |
| Administrative & Support | 142 (61.5%) | 89 (38.5%) |
| Educational Services | 86 (32.7%) | 177 (67.3%) |
| Health Care & Social Assistance | 54 (15.3%) | 298 (84.7%) |
| Arts, Entertainment & Recreation | 29 (76.3%) | 9 (23.7%) |
| Accommodation & Food Services | 323 (55.3%) | 261 (44.7%) |
| Public Administration | 45 (100.0%) | 0 (0.0%) |
| Total | 1,738 (47.1%) | 1,954 (52.9%) |
Education in Little River
School Enrollment in Little River
The most common levels of schooling among the 1,172 students in Little River are elementary school (310 | 26.5%), high school (240 | 20.5%), and middle school (227 | 19.4%).
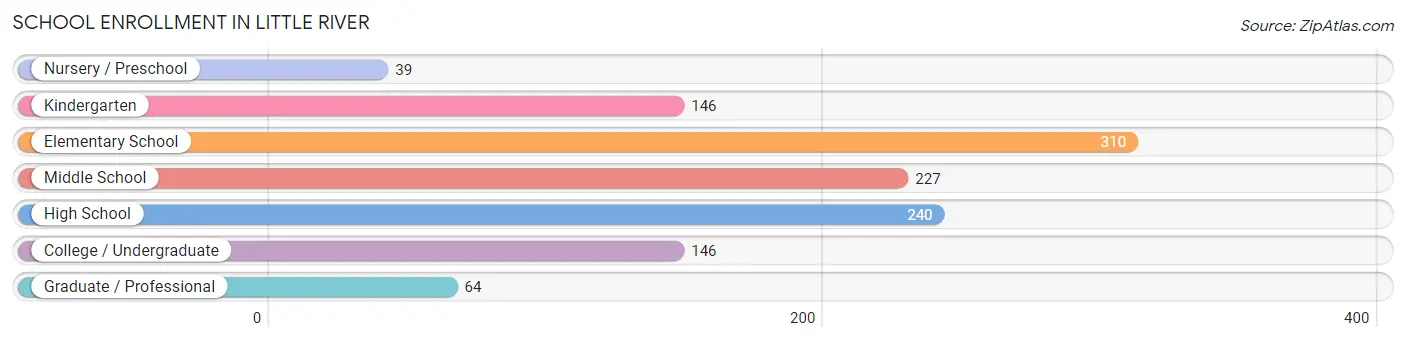
| School Level | # Students | % Students |
| Nursery / Preschool | 39 | 3.3% |
| Kindergarten | 146 | 12.5% |
| Elementary School | 310 | 26.5% |
| Middle School | 227 | 19.4% |
| High School | 240 | 20.5% |
| College / Undergraduate | 146 | 12.5% |
| Graduate / Professional | 64 | 5.5% |
| Total | 1,172 | 100.0% |
School Enrollment by Age by Funding Source in Little River
Out of a total of 1,172 students who are enrolled in schools in Little River, 107 (9.1%) attend a private institution, while the remaining 1,065 (90.9%) are enrolled in public schools. The age group of 25 to 34 year olds has the highest likelihood of being enrolled in private schools, with 14 (35.9% in the age bracket) enrolled. Conversely, the age group of 10 to 14 year olds has the lowest likelihood of being enrolled in a private school, with 243 (100.0% in the age bracket) attending a public institution.
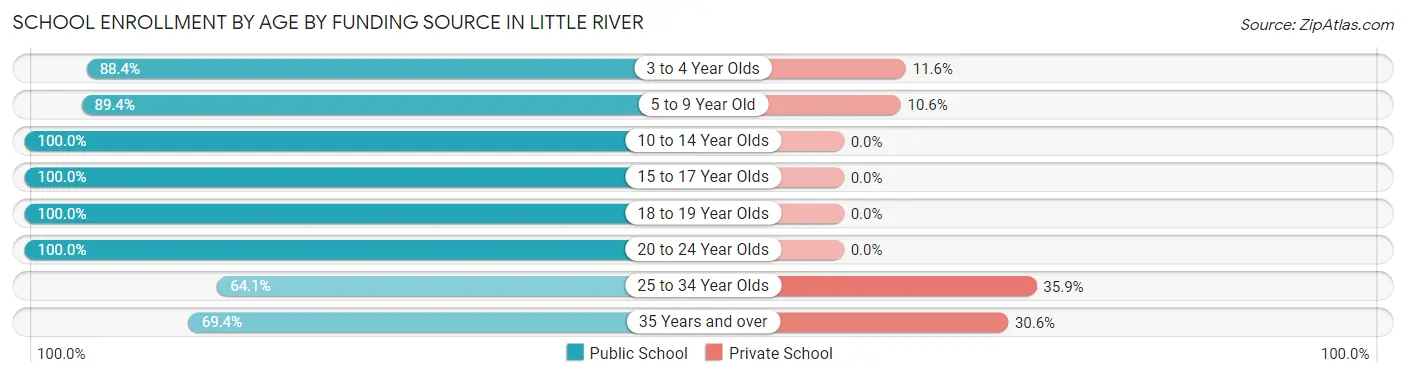
| Age Bracket | Public School | Private School |
| 3 to 4 Year Olds | 107 (88.4%) | 14 (11.6%) |
| 5 to 9 Year Old | 320 (89.4%) | 38 (10.6%) |
| 10 to 14 Year Olds | 243 (100.0%) | 0 (0.0%) |
| 15 to 17 Year Olds | 172 (100.0%) | 0 (0.0%) |
| 18 to 19 Year Olds | 68 (100.0%) | 0 (0.0%) |
| 20 to 24 Year Olds | 37 (100.0%) | 0 (0.0%) |
| 25 to 34 Year Olds | 25 (64.1%) | 14 (35.9%) |
| 35 Years and over | 93 (69.4%) | 41 (30.6%) |
| Total | 1,065 (90.9%) | 107 (9.1%) |
Educational Attainment by Field of Study in Little River
Business (480 | 21.8%), education (281 | 12.8%), bio, nature & agricultural (207 | 9.4%), science & technology (201 | 9.1%), and social sciences (198 | 9.0%) are the most common fields of study among 2,198 individuals in Little River who have obtained a bachelor's degree or higher.
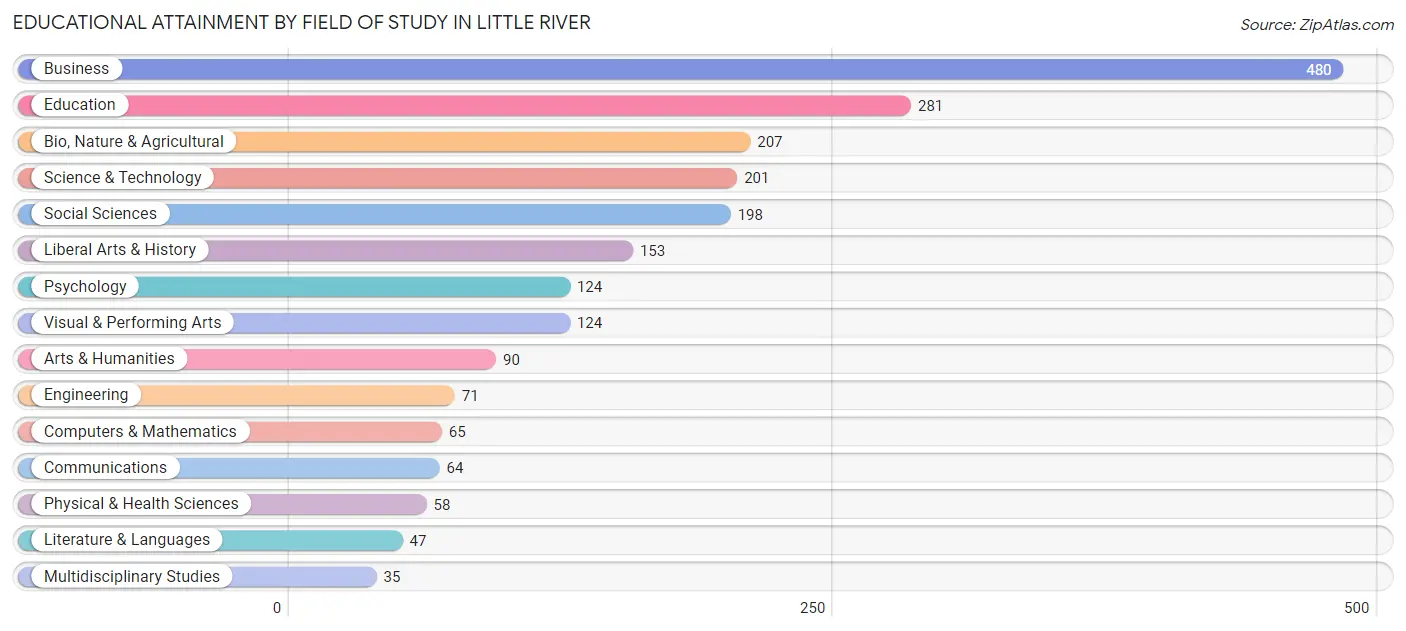
| Field of Study | # Graduates | % Graduates |
| Computers & Mathematics | 65 | 3.0% |
| Bio, Nature & Agricultural | 207 | 9.4% |
| Physical & Health Sciences | 58 | 2.6% |
| Psychology | 124 | 5.6% |
| Social Sciences | 198 | 9.0% |
| Engineering | 71 | 3.2% |
| Multidisciplinary Studies | 35 | 1.6% |
| Science & Technology | 201 | 9.1% |
| Business | 480 | 21.8% |
| Education | 281 | 12.8% |
| Literature & Languages | 47 | 2.1% |
| Liberal Arts & History | 153 | 7.0% |
| Visual & Performing Arts | 124 | 5.6% |
| Communications | 64 | 2.9% |
| Arts & Humanities | 90 | 4.1% |
| Total | 2,198 | 100.0% |
Transportation & Commute in Little River
Vehicle Availability by Sex in Little River
The most prevalent vehicle ownership categories in Little River are males with 2 vehicles (843, accounting for 49.6%) and females with 2 vehicles (815, making up 44.3%).
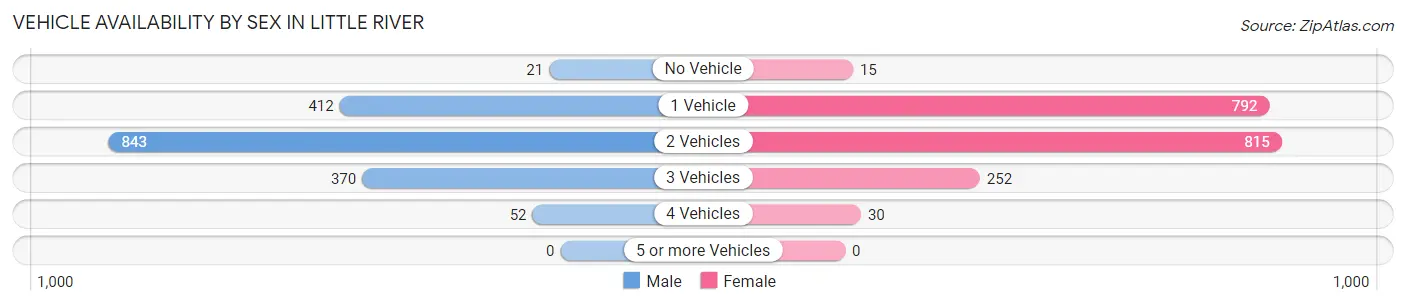
| Vehicles Available | Male | Female |
| No Vehicle | 21 (1.2%) | 15 (0.8%) |
| 1 Vehicle | 412 (24.3%) | 792 (41.6%) |
| 2 Vehicles | 843 (49.6%) | 815 (42.8%) |
| 3 Vehicles | 370 (21.8%) | 252 (13.2%) |
| 4 Vehicles | 52 (3.1%) | 30 (1.6%) |
| 5 or more Vehicles | 0 (0.0%) | 0 (0.0%) |
| Total | 1,698 (100.0%) | 1,904 (100.0%) |
Commute Time in Little River
The most frequently occuring commute durations in Little River are 15 to 19 minutes (684 commuters, 21.4%), 20 to 24 minutes (578 commuters, 18.1%), and 30 to 34 minutes (350 commuters, 11.0%).
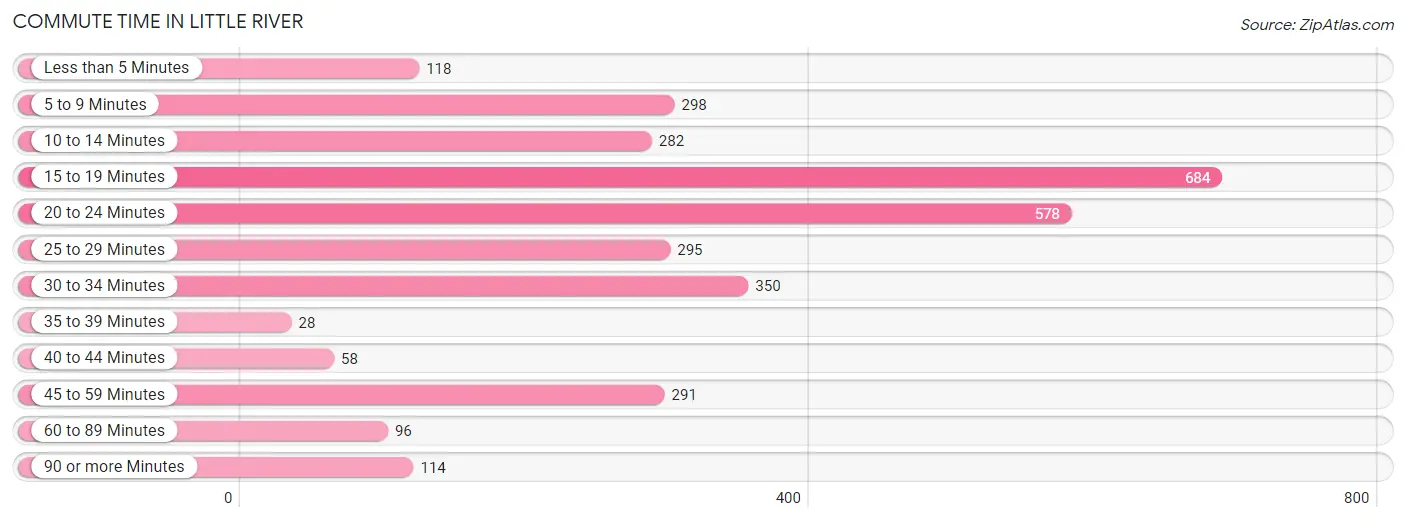
| Commute Time | # Commuters | % Commuters |
| Less than 5 Minutes | 118 | 3.7% |
| 5 to 9 Minutes | 298 | 9.3% |
| 10 to 14 Minutes | 282 | 8.8% |
| 15 to 19 Minutes | 684 | 21.4% |
| 20 to 24 Minutes | 578 | 18.1% |
| 25 to 29 Minutes | 295 | 9.2% |
| 30 to 34 Minutes | 350 | 11.0% |
| 35 to 39 Minutes | 28 | 0.9% |
| 40 to 44 Minutes | 58 | 1.8% |
| 45 to 59 Minutes | 291 | 9.1% |
| 60 to 89 Minutes | 96 | 3.0% |
| 90 or more Minutes | 114 | 3.6% |
Commute Time by Sex in Little River
The most common commute times in Little River are 20 to 24 minutes (332 commuters, 21.6%) for males and 15 to 19 minutes (359 commuters, 21.7%) for females.
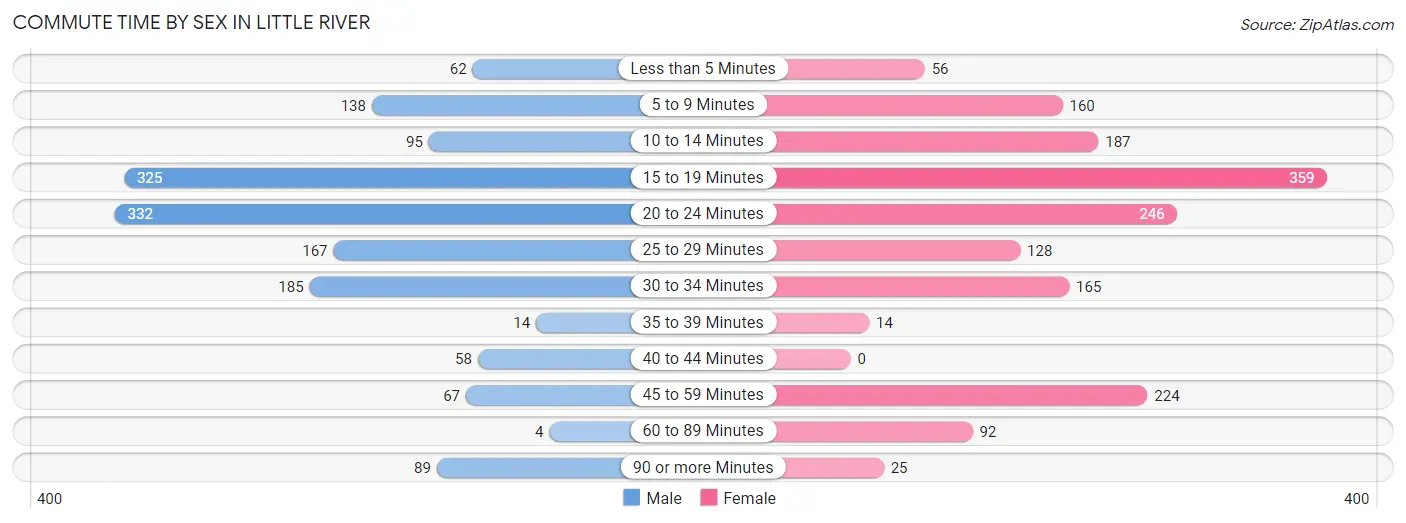
| Commute Time | Male | Female |
| Less than 5 Minutes | 62 (4.0%) | 56 (3.4%) |
| 5 to 9 Minutes | 138 (9.0%) | 160 (9.7%) |
| 10 to 14 Minutes | 95 (6.2%) | 187 (11.3%) |
| 15 to 19 Minutes | 325 (21.2%) | 359 (21.7%) |
| 20 to 24 Minutes | 332 (21.6%) | 246 (14.9%) |
| 25 to 29 Minutes | 167 (10.9%) | 128 (7.7%) |
| 30 to 34 Minutes | 185 (12.0%) | 165 (10.0%) |
| 35 to 39 Minutes | 14 (0.9%) | 14 (0.9%) |
| 40 to 44 Minutes | 58 (3.8%) | 0 (0.0%) |
| 45 to 59 Minutes | 67 (4.4%) | 224 (13.5%) |
| 60 to 89 Minutes | 4 (0.3%) | 92 (5.6%) |
| 90 or more Minutes | 89 (5.8%) | 25 (1.5%) |
Time of Departure to Work by Sex in Little River
The most frequent times of departure to work in Little River are 8:00 AM to 8:29 AM (260, 16.9%) for males and 6:30 AM to 6:59 AM (336, 20.3%) for females.
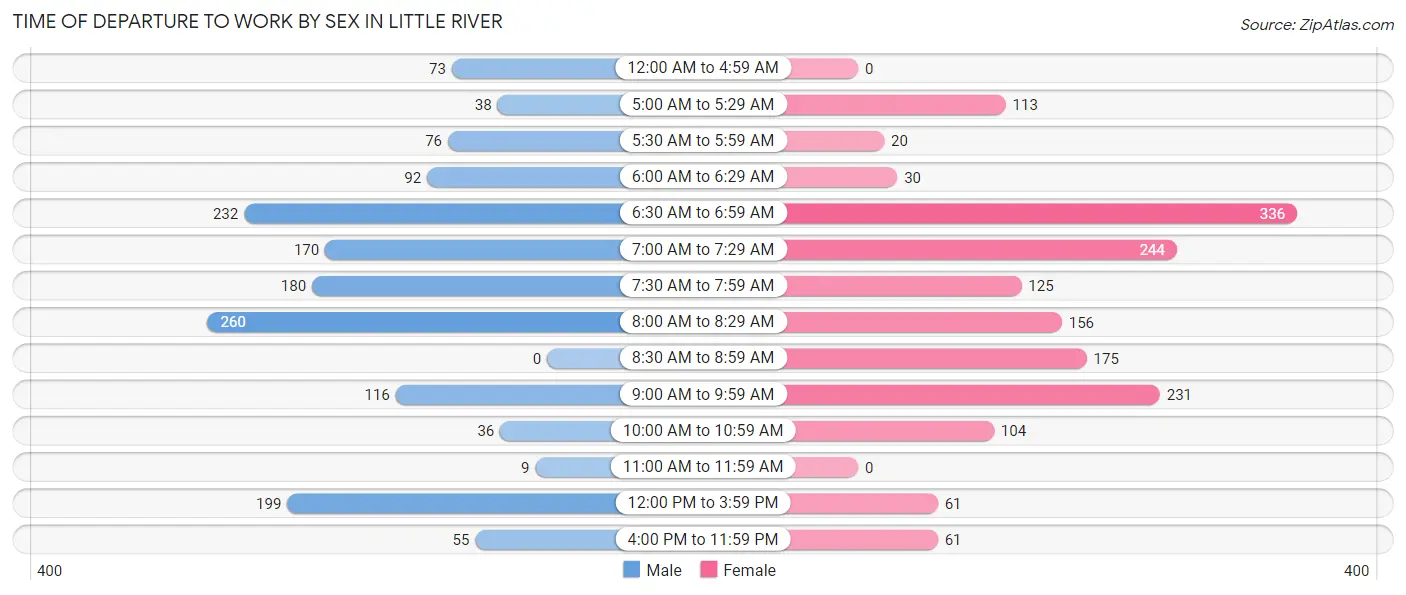
| Time of Departure | Male | Female |
| 12:00 AM to 4:59 AM | 73 (4.8%) | 0 (0.0%) |
| 5:00 AM to 5:29 AM | 38 (2.5%) | 113 (6.8%) |
| 5:30 AM to 5:59 AM | 76 (5.0%) | 20 (1.2%) |
| 6:00 AM to 6:29 AM | 92 (6.0%) | 30 (1.8%) |
| 6:30 AM to 6:59 AM | 232 (15.1%) | 336 (20.3%) |
| 7:00 AM to 7:29 AM | 170 (11.1%) | 244 (14.7%) |
| 7:30 AM to 7:59 AM | 180 (11.7%) | 125 (7.5%) |
| 8:00 AM to 8:29 AM | 260 (16.9%) | 156 (9.4%) |
| 8:30 AM to 8:59 AM | 0 (0.0%) | 175 (10.6%) |
| 9:00 AM to 9:59 AM | 116 (7.5%) | 231 (14.0%) |
| 10:00 AM to 10:59 AM | 36 (2.3%) | 104 (6.3%) |
| 11:00 AM to 11:59 AM | 9 (0.6%) | 0 (0.0%) |
| 12:00 PM to 3:59 PM | 199 (13.0%) | 61 (3.7%) |
| 4:00 PM to 11:59 PM | 55 (3.6%) | 61 (3.7%) |
| Total | 1,536 (100.0%) | 1,656 (100.0%) |
Housing Occupancy in Little River
Occupancy by Ownership in Little River
Of the total 4,953 dwellings in Little River, owner-occupied units account for 3,714 (75.0%), while renter-occupied units make up 1,239 (25.0%).
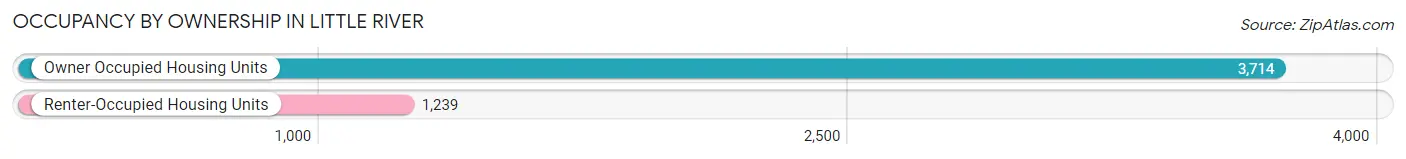
| Occupancy | # Housing Units | % Housing Units |
| Owner Occupied Housing Units | 3,714 | 75.0% |
| Renter-Occupied Housing Units | 1,239 | 25.0% |
| Total Occupied Housing Units | 4,953 | 100.0% |
Occupancy by Household Size in Little River
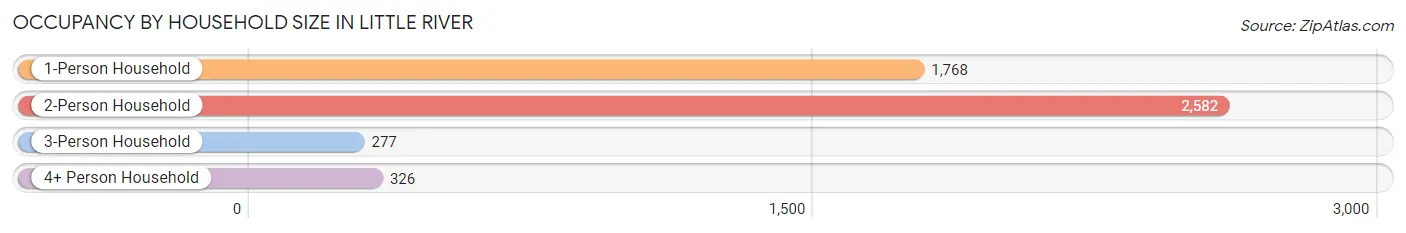
| Household Size | # Housing Units | % Housing Units |
| 1-Person Household | 1,768 | 35.7% |
| 2-Person Household | 2,582 | 52.1% |
| 3-Person Household | 277 | 5.6% |
| 4+ Person Household | 326 | 6.6% |
| Total Housing Units | 4,953 | 100.0% |
Occupancy by Ownership by Household Size in Little River
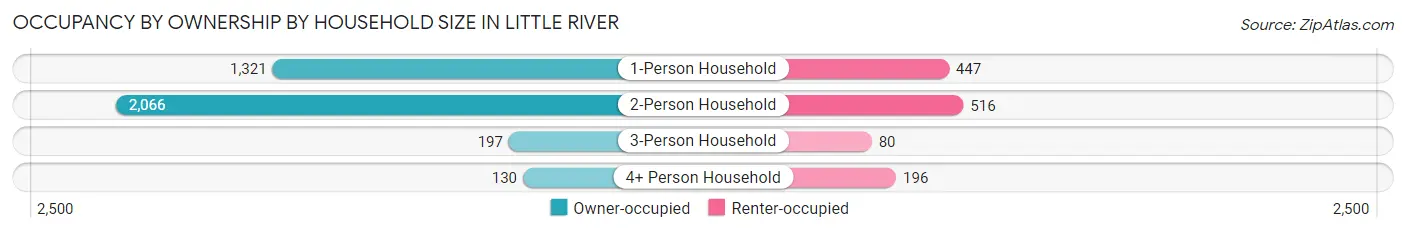
| Household Size | Owner-occupied | Renter-occupied |
| 1-Person Household | 1,321 (74.7%) | 447 (25.3%) |
| 2-Person Household | 2,066 (80.0%) | 516 (20.0%) |
| 3-Person Household | 197 (71.1%) | 80 (28.9%) |
| 4+ Person Household | 130 (39.9%) | 196 (60.1%) |
| Total Housing Units | 3,714 (75.0%) | 1,239 (25.0%) |
Occupancy by Educational Attainment in Little River
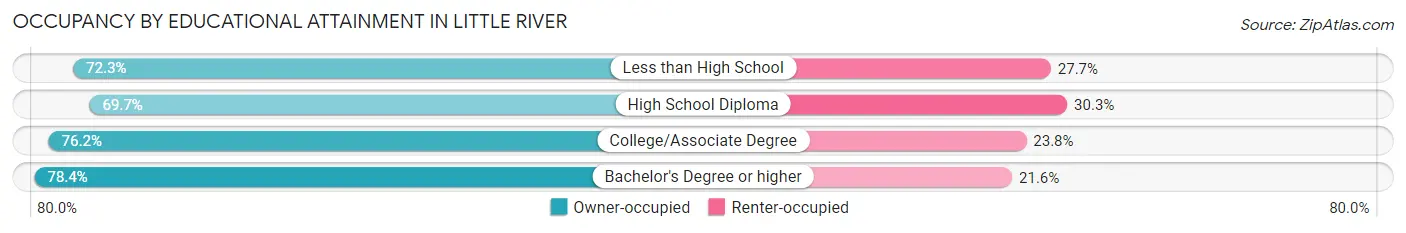
| Household Size | Owner-occupied | Renter-occupied |
| Less than High School | 167 (72.3%) | 64 (27.7%) |
| High School Diploma | 877 (69.7%) | 381 (30.3%) |
| College/Associate Degree | 1,593 (76.2%) | 498 (23.8%) |
| Bachelor's Degree or higher | 1,077 (78.4%) | 296 (21.6%) |
Occupancy by Age of Householder in Little River
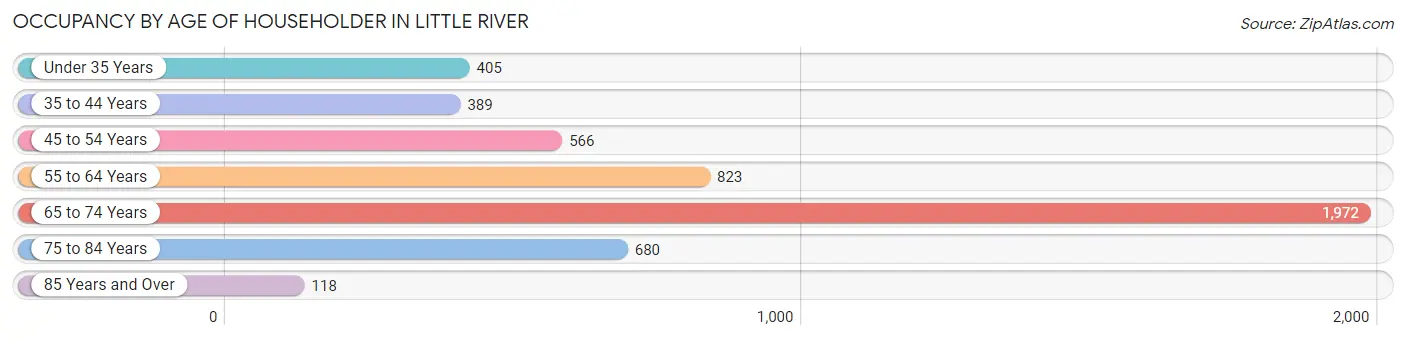
| Age Bracket | # Households | % Households |
| Under 35 Years | 405 | 8.2% |
| 35 to 44 Years | 389 | 7.9% |
| 45 to 54 Years | 566 | 11.4% |
| 55 to 64 Years | 823 | 16.6% |
| 65 to 74 Years | 1,972 | 39.8% |
| 75 to 84 Years | 680 | 13.7% |
| 85 Years and Over | 118 | 2.4% |
| Total | 4,953 | 100.0% |
Housing Finances in Little River
Median Income by Occupancy in Little River
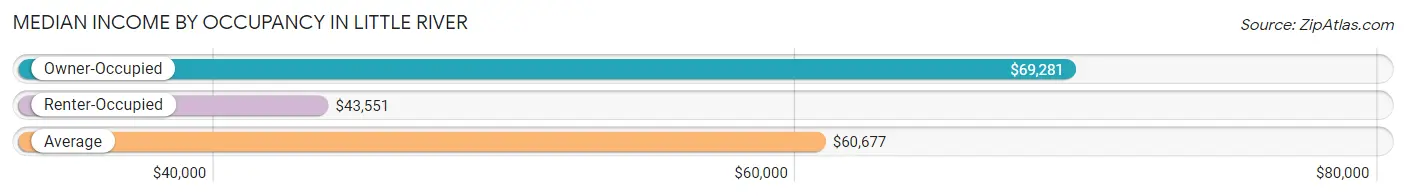
| Occupancy Type | # Households | Median Income |
| Owner-Occupied | 3,714 (75.0%) | $69,281 |
| Renter-Occupied | 1,239 (25.0%) | $43,551 |
| Average | 4,953 (100.0%) | $60,677 |
Occupancy by Householder Income Bracket in Little River
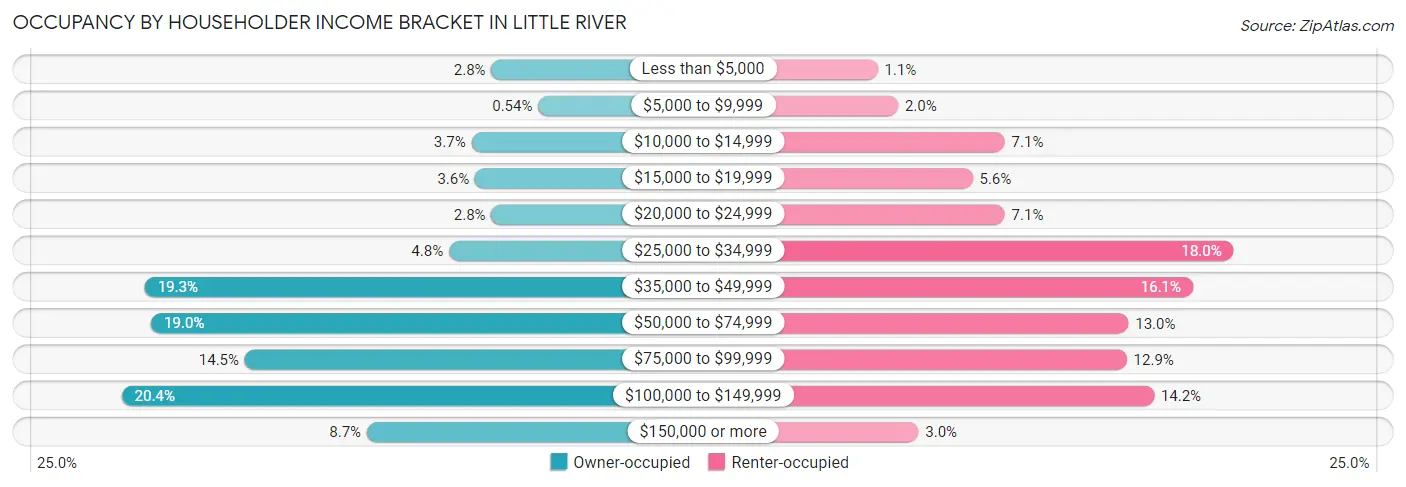
| Income Bracket | Owner-occupied | Renter-occupied |
| Less than $5,000 | 103 (2.8%) | 13 (1.1%) |
| $5,000 to $9,999 | 20 (0.5%) | 25 (2.0%) |
| $10,000 to $14,999 | 138 (3.7%) | 88 (7.1%) |
| $15,000 to $19,999 | 132 (3.5%) | 69 (5.6%) |
| $20,000 to $24,999 | 103 (2.8%) | 88 (7.1%) |
| $25,000 to $34,999 | 178 (4.8%) | 223 (18.0%) |
| $35,000 to $49,999 | 716 (19.3%) | 199 (16.1%) |
| $50,000 to $74,999 | 705 (19.0%) | 161 (13.0%) |
| $75,000 to $99,999 | 539 (14.5%) | 160 (12.9%) |
| $100,000 to $149,999 | 757 (20.4%) | 176 (14.2%) |
| $150,000 or more | 323 (8.7%) | 37 (3.0%) |
| Total | 3,714 (100.0%) | 1,239 (100.0%) |
Monthly Housing Cost Tiers in Little River
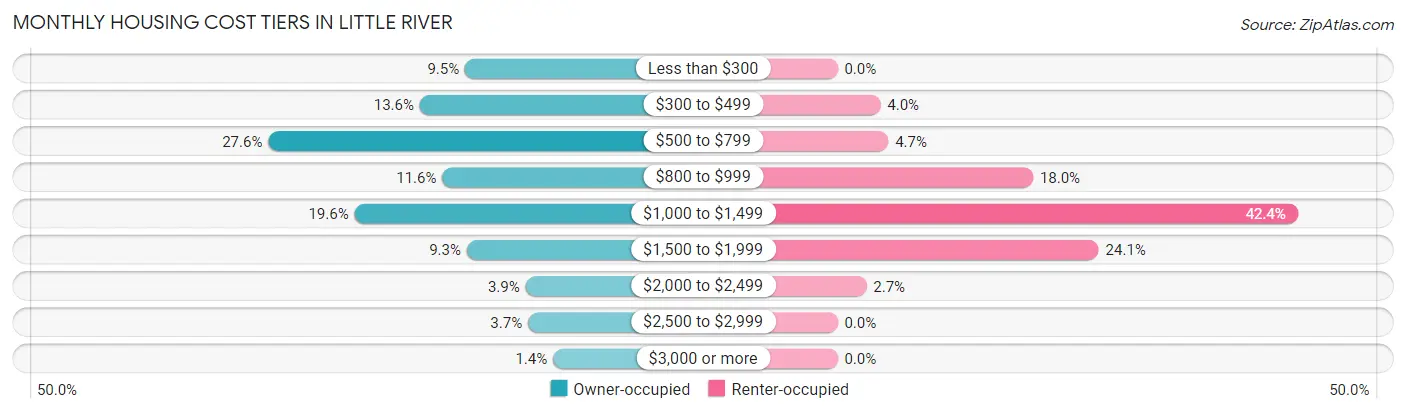
| Monthly Cost | Owner-occupied | Renter-occupied |
| Less than $300 | 351 (9.5%) | 0 (0.0%) |
| $300 to $499 | 506 (13.6%) | 49 (4.0%) |
| $500 to $799 | 1,024 (27.6%) | 58 (4.7%) |
| $800 to $999 | 429 (11.6%) | 223 (18.0%) |
| $1,000 to $1,499 | 729 (19.6%) | 525 (42.4%) |
| $1,500 to $1,999 | 345 (9.3%) | 298 (24.0%) |
| $2,000 to $2,499 | 144 (3.9%) | 33 (2.7%) |
| $2,500 to $2,999 | 136 (3.7%) | 0 (0.0%) |
| $3,000 or more | 50 (1.3%) | 0 (0.0%) |
| Total | 3,714 (100.0%) | 1,239 (100.0%) |
Physical Housing Characteristics in Little River
Housing Structures in Little River
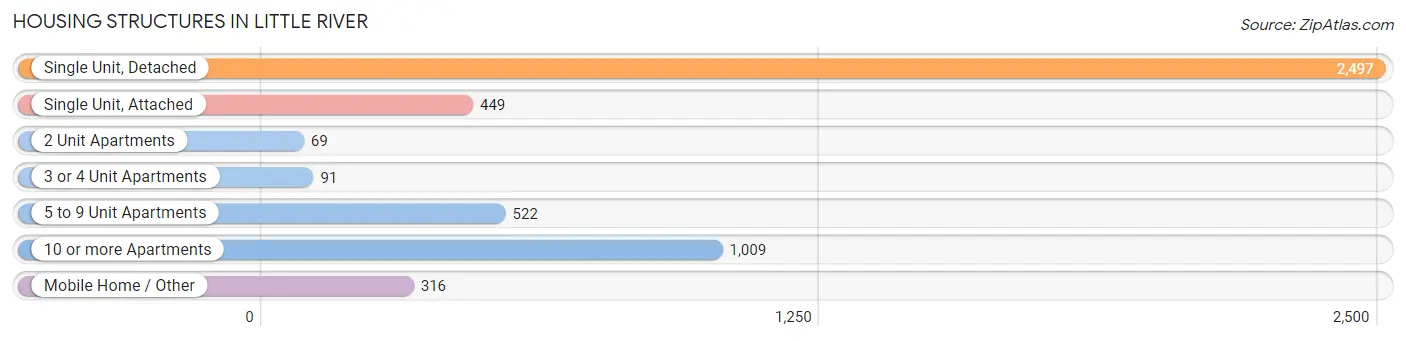
| Structure Type | # Housing Units | % Housing Units |
| Single Unit, Detached | 2,497 | 50.4% |
| Single Unit, Attached | 449 | 9.1% |
| 2 Unit Apartments | 69 | 1.4% |
| 3 or 4 Unit Apartments | 91 | 1.8% |
| 5 to 9 Unit Apartments | 522 | 10.5% |
| 10 or more Apartments | 1,009 | 20.4% |
| Mobile Home / Other | 316 | 6.4% |
| Total | 4,953 | 100.0% |
Housing Structures by Occupancy in Little River
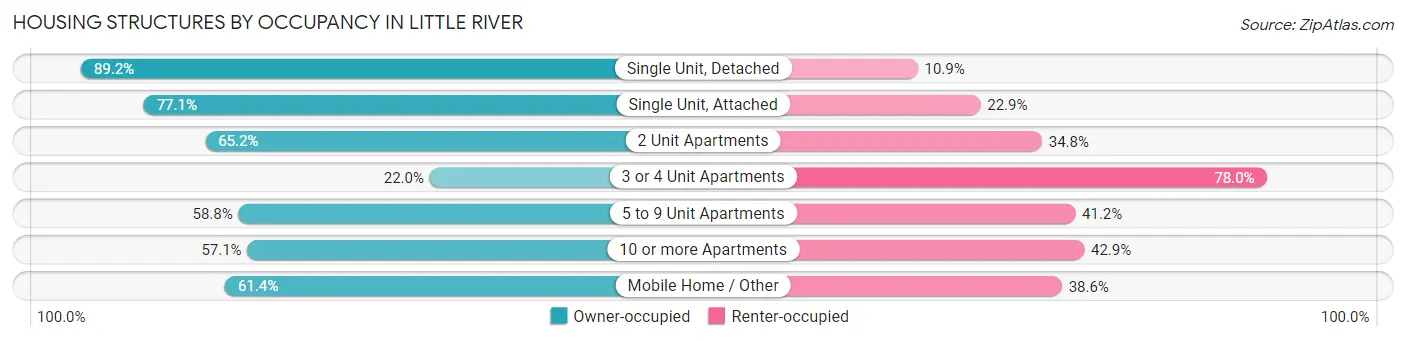
| Structure Type | Owner-occupied | Renter-occupied |
| Single Unit, Detached | 2,226 (89.1%) | 271 (10.8%) |
| Single Unit, Attached | 346 (77.1%) | 103 (22.9%) |
| 2 Unit Apartments | 45 (65.2%) | 24 (34.8%) |
| 3 or 4 Unit Apartments | 20 (22.0%) | 71 (78.0%) |
| 5 to 9 Unit Apartments | 307 (58.8%) | 215 (41.2%) |
| 10 or more Apartments | 576 (57.1%) | 433 (42.9%) |
| Mobile Home / Other | 194 (61.4%) | 122 (38.6%) |
| Total | 3,714 (75.0%) | 1,239 (25.0%) |
Housing Structures by Number of Rooms in Little River
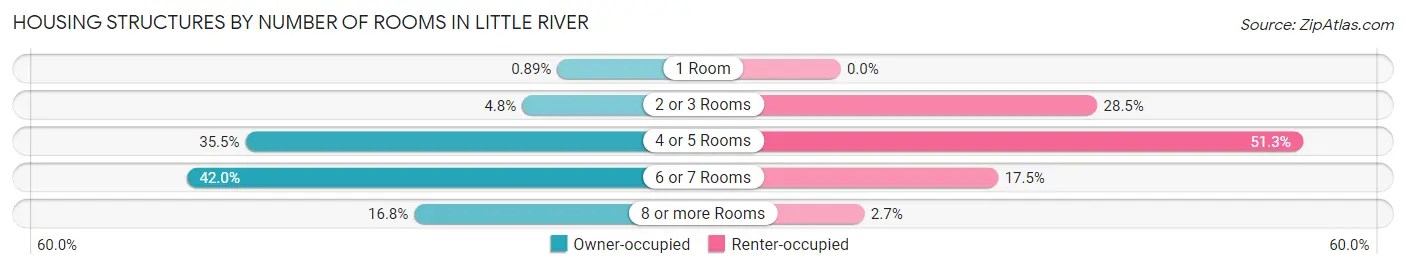
| Number of Rooms | Owner-occupied | Renter-occupied |
| 1 Room | 33 (0.9%) | 0 (0.0%) |
| 2 or 3 Rooms | 178 (4.8%) | 353 (28.5%) |
| 4 or 5 Rooms | 1,319 (35.5%) | 636 (51.3%) |
| 6 or 7 Rooms | 1,561 (42.0%) | 217 (17.5%) |
| 8 or more Rooms | 623 (16.8%) | 33 (2.7%) |
| Total | 3,714 (100.0%) | 1,239 (100.0%) |
Housing Structure by Heating Type in Little River
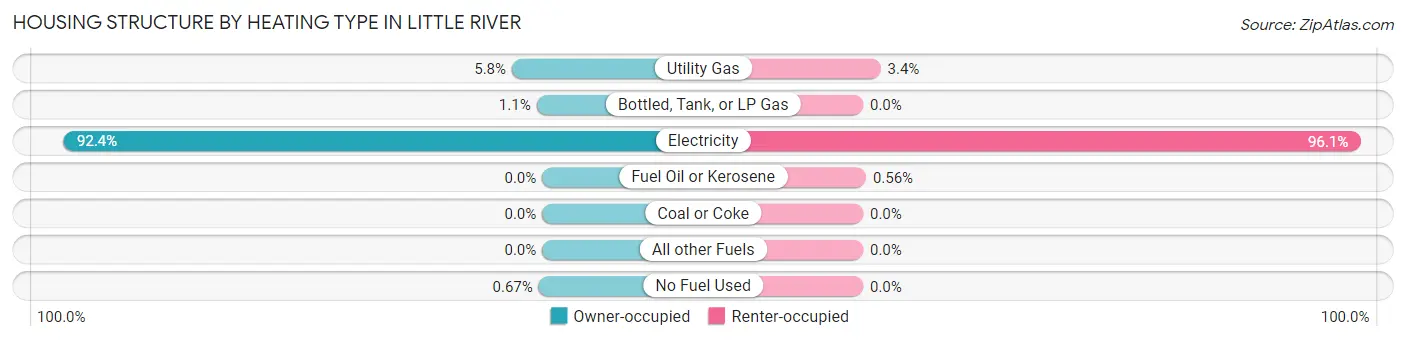
| Heating Type | Owner-occupied | Renter-occupied |
| Utility Gas | 217 (5.8%) | 42 (3.4%) |
| Bottled, Tank, or LP Gas | 40 (1.1%) | 0 (0.0%) |
| Electricity | 3,432 (92.4%) | 1,190 (96.1%) |
| Fuel Oil or Kerosene | 0 (0.0%) | 7 (0.6%) |
| Coal or Coke | 0 (0.0%) | 0 (0.0%) |
| All other Fuels | 0 (0.0%) | 0 (0.0%) |
| No Fuel Used | 25 (0.7%) | 0 (0.0%) |
| Total | 3,714 (100.0%) | 1,239 (100.0%) |
Household Vehicle Usage in Little River
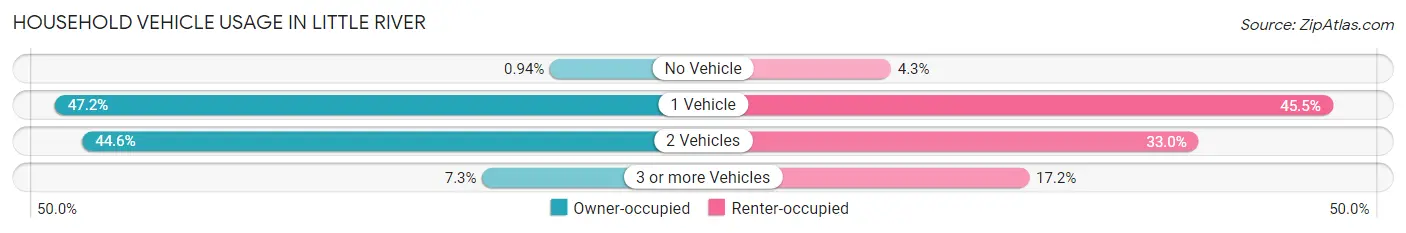
| Vehicles per Household | Owner-occupied | Renter-occupied |
| No Vehicle | 35 (0.9%) | 53 (4.3%) |
| 1 Vehicle | 1,752 (47.2%) | 564 (45.5%) |
| 2 Vehicles | 1,657 (44.6%) | 409 (33.0%) |
| 3 or more Vehicles | 270 (7.3%) | 213 (17.2%) |
| Total | 3,714 (100.0%) | 1,239 (100.0%) |
Real Estate & Mortgages in Little River
Real Estate and Mortgage Overview in Little River
| Characteristic | Without Mortgage | With Mortgage |
| Housing Units | 1,737 | 1,977 |
| Median Property Value | $250,300 | $226,300 |
| Median Household Income | $70,548 | $194 |
| Monthly Housing Costs | $517 | $50 |
| Real Estate Taxes | $600 | $82 |
Property Value by Mortgage Status in Little River
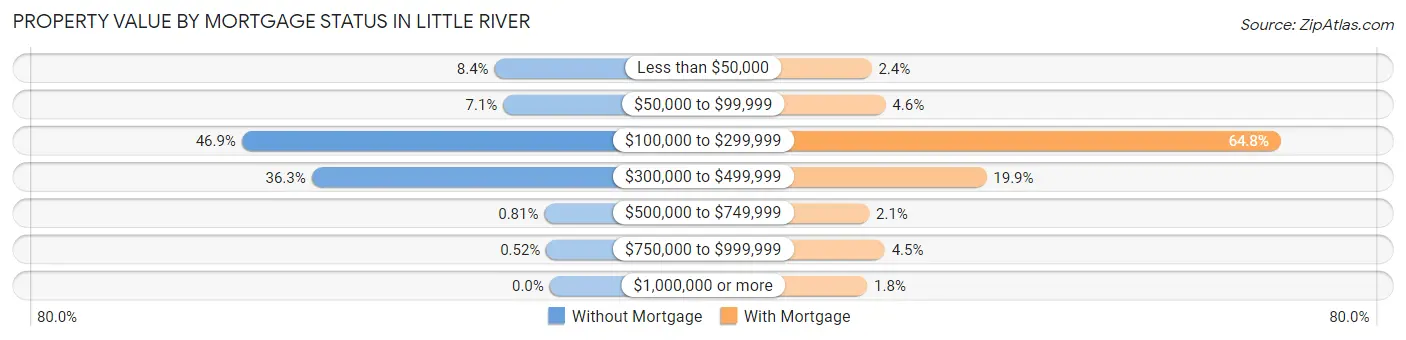
| Property Value | Without Mortgage | With Mortgage |
| Less than $50,000 | 146 (8.4%) | 48 (2.4%) |
| $50,000 to $99,999 | 123 (7.1%) | 90 (4.5%) |
| $100,000 to $299,999 | 815 (46.9%) | 1,281 (64.8%) |
| $300,000 to $499,999 | 630 (36.3%) | 394 (19.9%) |
| $500,000 to $749,999 | 14 (0.8%) | 41 (2.1%) |
| $750,000 to $999,999 | 9 (0.5%) | 88 (4.4%) |
| $1,000,000 or more | 0 (0.0%) | 35 (1.8%) |
| Total | 1,737 (100.0%) | 1,977 (100.0%) |
Household Income by Mortgage Status in Little River
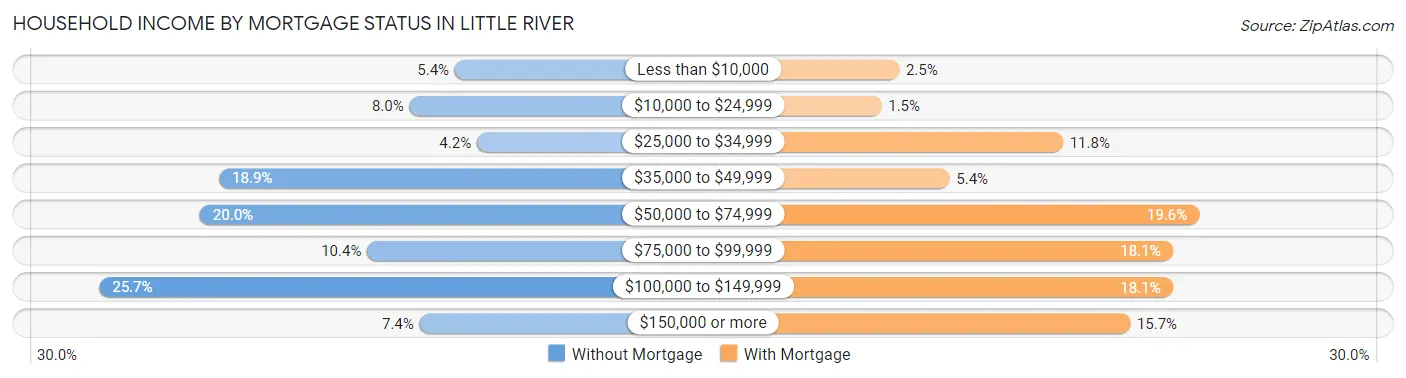
| Household Income | Without Mortgage | With Mortgage |
| Less than $10,000 | 94 (5.4%) | 49 (2.5%) |
| $10,000 to $24,999 | 139 (8.0%) | 29 (1.5%) |
| $25,000 to $34,999 | 72 (4.2%) | 234 (11.8%) |
| $35,000 to $49,999 | 328 (18.9%) | 106 (5.4%) |
| $50,000 to $74,999 | 347 (20.0%) | 388 (19.6%) |
| $75,000 to $99,999 | 181 (10.4%) | 358 (18.1%) |
| $100,000 to $149,999 | 447 (25.7%) | 358 (18.1%) |
| $150,000 or more | 129 (7.4%) | 310 (15.7%) |
| Total | 1,737 (100.0%) | 1,977 (100.0%) |
Property Value to Household Income Ratio in Little River
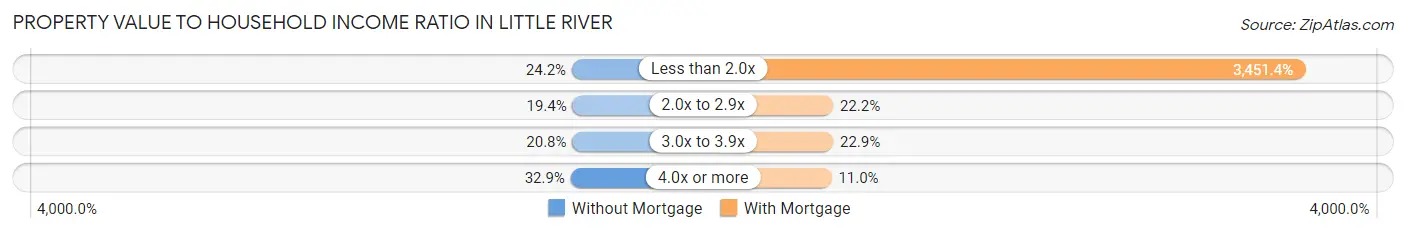
| Value-to-Income Ratio | Without Mortgage | With Mortgage |
| Less than 2.0x | 421 (24.2%) | 68,234 (3,451.4%) |
| 2.0x to 2.9x | 337 (19.4%) | 439 (22.2%) |
| 3.0x to 3.9x | 362 (20.8%) | 453 (22.9%) |
| 4.0x or more | 572 (32.9%) | 218 (11.0%) |
| Total | 1,737 (100.0%) | 1,977 (100.0%) |
Real Estate Taxes by Mortgage Status in Little River
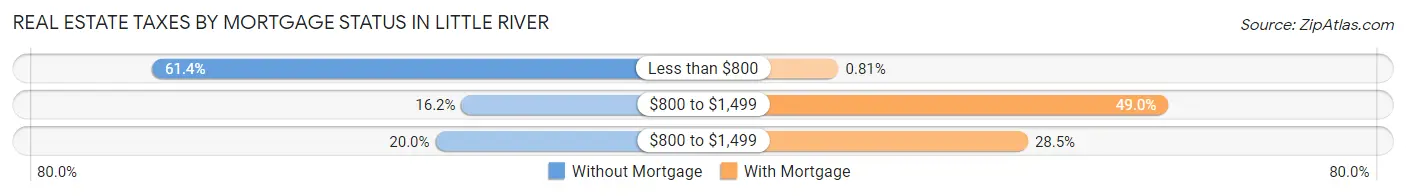
| Property Taxes | Without Mortgage | With Mortgage |
| Less than $800 | 1,066 (61.4%) | 16 (0.8%) |
| $800 to $1,499 | 281 (16.2%) | 968 (49.0%) |
| $800 to $1,499 | 347 (20.0%) | 563 (28.5%) |
| Total | 1,737 (100.0%) | 1,977 (100.0%) |
Health & Disability in Little River
Health Insurance Coverage by Age in Little River
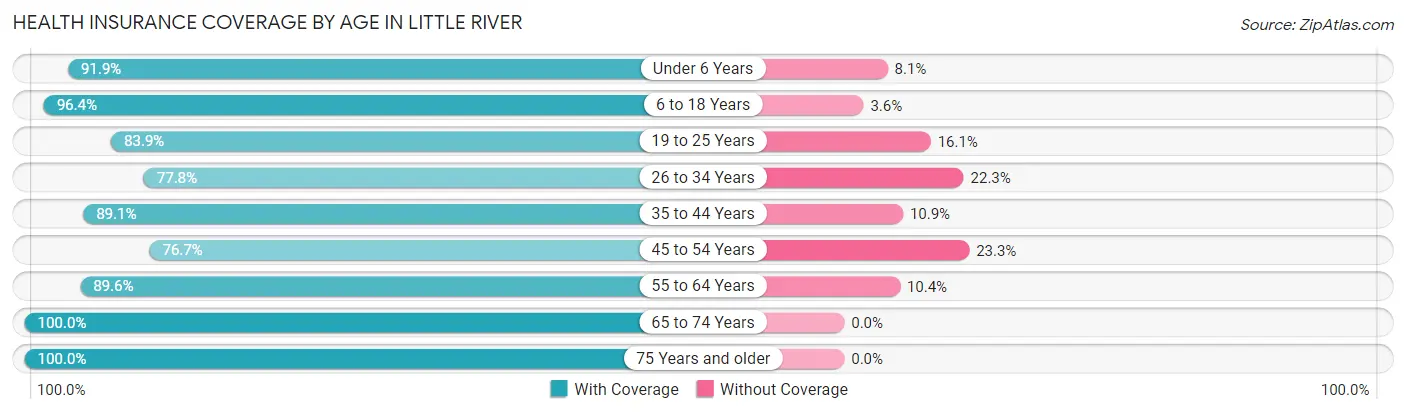
| Age Bracket | With Coverage | Without Coverage |
| Under 6 Years | 364 (91.9%) | 32 (8.1%) |
| 6 to 18 Years | 780 (96.4%) | 29 (3.6%) |
| 19 to 25 Years | 151 (83.9%) | 29 (16.1%) |
| 26 to 34 Years | 636 (77.7%) | 182 (22.3%) |
| 35 to 44 Years | 562 (89.1%) | 69 (10.9%) |
| 45 to 54 Years | 807 (76.7%) | 245 (23.3%) |
| 55 to 64 Years | 1,511 (89.6%) | 175 (10.4%) |
| 65 to 74 Years | 2,786 (100.0%) | 0 (0.0%) |
| 75 Years and older | 1,457 (100.0%) | 0 (0.0%) |
| Total | 9,054 (92.2%) | 761 (7.7%) |
Health Insurance Coverage by Citizenship Status in Little River
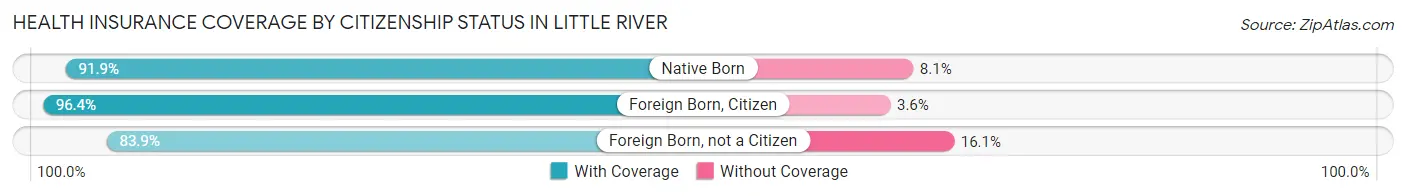
| Citizenship Status | With Coverage | Without Coverage |
| Native Born | 364 (91.9%) | 32 (8.1%) |
| Foreign Born, Citizen | 780 (96.4%) | 29 (3.6%) |
| Foreign Born, not a Citizen | 151 (83.9%) | 29 (16.1%) |
Health Insurance Coverage by Household Income in Little River
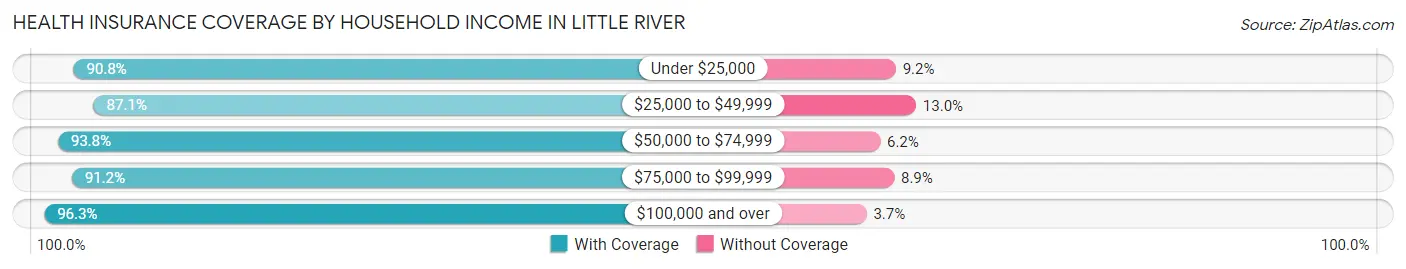
| Household Income | With Coverage | Without Coverage |
| Under $25,000 | 1,012 (90.8%) | 102 (9.2%) |
| $25,000 to $49,999 | 1,976 (87.1%) | 294 (13.0%) |
| $50,000 to $74,999 | 1,657 (93.8%) | 110 (6.2%) |
| $75,000 to $99,999 | 1,369 (91.1%) | 133 (8.8%) |
| $100,000 and over | 3,035 (96.3%) | 116 (3.7%) |
Public vs Private Health Insurance Coverage by Age in Little River
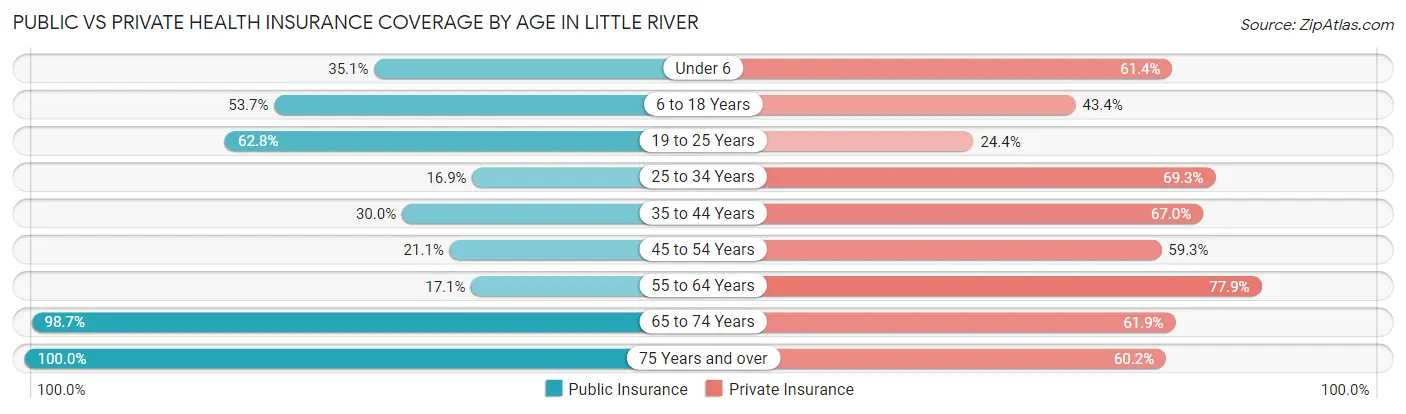
| Age Bracket | Public Insurance | Private Insurance |
| Under 6 | 139 (35.1%) | 243 (61.4%) |
| 6 to 18 Years | 434 (53.6%) | 351 (43.4%) |
| 19 to 25 Years | 113 (62.8%) | 44 (24.4%) |
| 25 to 34 Years | 138 (16.9%) | 567 (69.3%) |
| 35 to 44 Years | 189 (29.9%) | 423 (67.0%) |
| 45 to 54 Years | 222 (21.1%) | 624 (59.3%) |
| 55 to 64 Years | 288 (17.1%) | 1,313 (77.9%) |
| 65 to 74 Years | 2,750 (98.7%) | 1,725 (61.9%) |
| 75 Years and over | 1,457 (100.0%) | 877 (60.2%) |
| Total | 5,730 (58.4%) | 6,167 (62.8%) |
Disability Status by Sex by Age in Little River
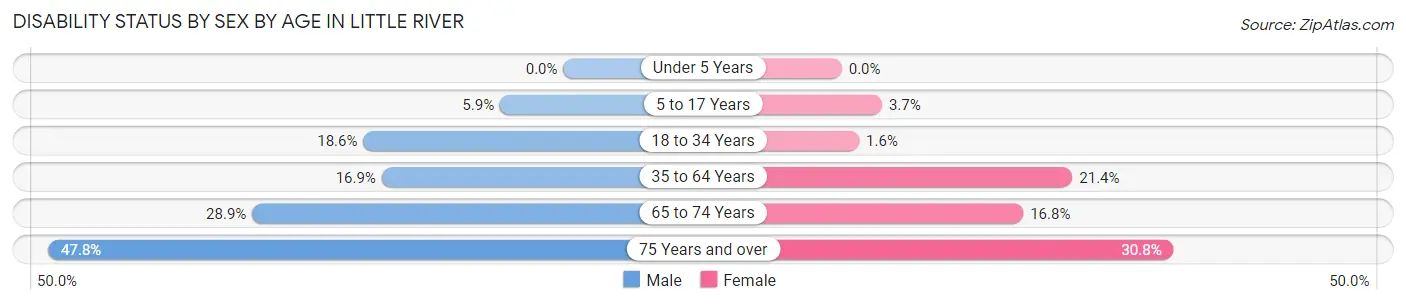
| Age Bracket | Male | Female |
| Under 5 Years | 0 (0.0%) | 0 (0.0%) |
| 5 to 17 Years | 18 (5.9%) | 18 (3.7%) |
| 18 to 34 Years | 117 (18.6%) | 7 (1.6%) |
| 35 to 64 Years | 227 (16.9%) | 433 (21.4%) |
| 65 to 74 Years | 424 (28.9%) | 222 (16.8%) |
| 75 Years and over | 341 (47.8%) | 229 (30.8%) |
Disability Class by Sex by Age in Little River
Disability Class: Hearing Difficulty
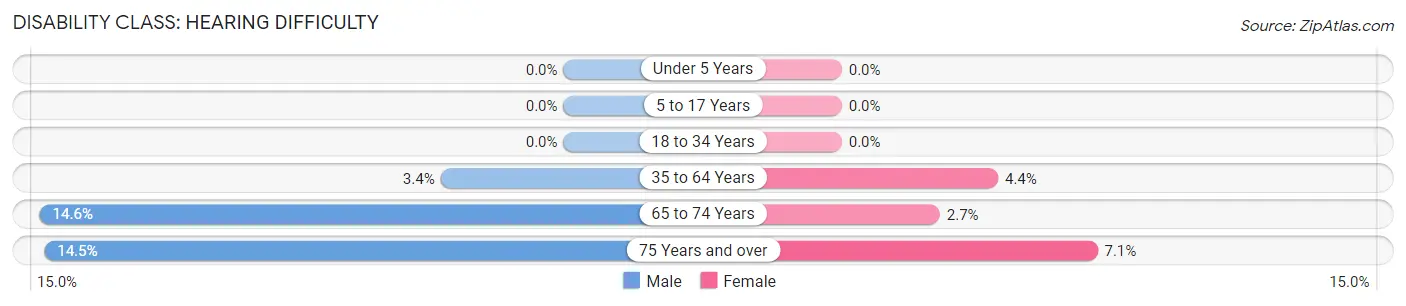
| Age Bracket | Male | Female |
| Under 5 Years | 0 (0.0%) | 0 (0.0%) |
| 5 to 17 Years | 0 (0.0%) | 0 (0.0%) |
| 18 to 34 Years | 0 (0.0%) | 0 (0.0%) |
| 35 to 64 Years | 46 (3.4%) | 88 (4.3%) |
| 65 to 74 Years | 214 (14.6%) | 36 (2.7%) |
| 75 Years and over | 103 (14.4%) | 53 (7.1%) |
Disability Class: Vision Difficulty
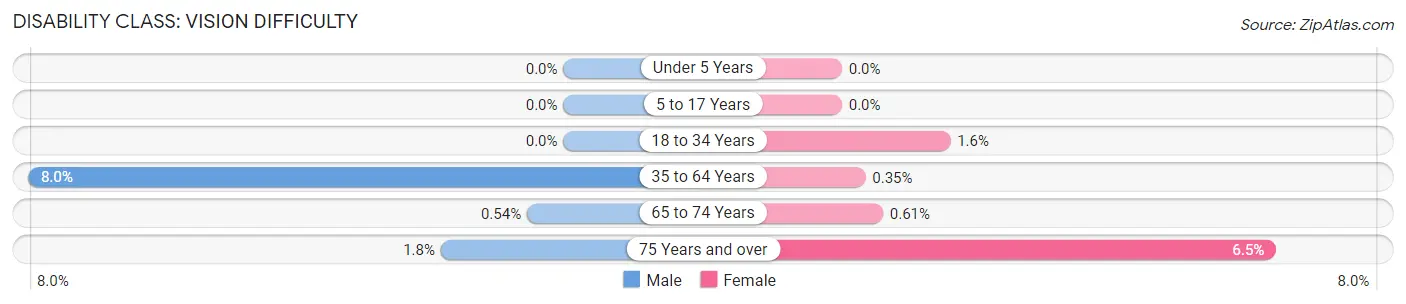
| Age Bracket | Male | Female |
| Under 5 Years | 0 (0.0%) | 0 (0.0%) |
| 5 to 17 Years | 0 (0.0%) | 0 (0.0%) |
| 18 to 34 Years | 0 (0.0%) | 7 (1.6%) |
| 35 to 64 Years | 107 (8.0%) | 7 (0.4%) |
| 65 to 74 Years | 8 (0.5%) | 8 (0.6%) |
| 75 Years and over | 13 (1.8%) | 48 (6.5%) |
Disability Class: Cognitive Difficulty
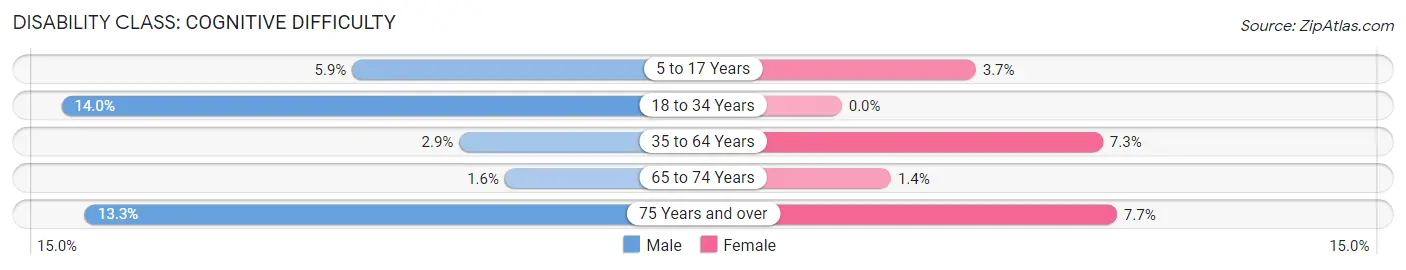
| Age Bracket | Male | Female |
| 5 to 17 Years | 18 (5.9%) | 18 (3.7%) |
| 18 to 34 Years | 88 (14.0%) | 0 (0.0%) |
| 35 to 64 Years | 39 (2.9%) | 147 (7.3%) |
| 65 to 74 Years | 24 (1.6%) | 18 (1.4%) |
| 75 Years and over | 95 (13.3%) | 57 (7.7%) |
Disability Class: Ambulatory Difficulty
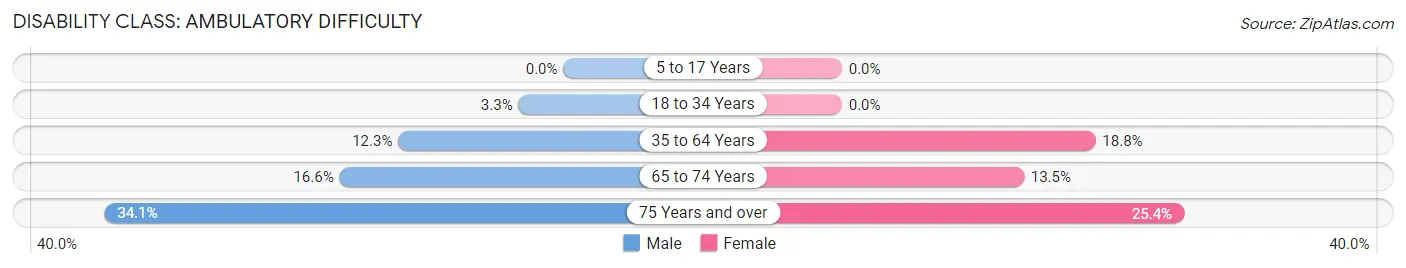
| Age Bracket | Male | Female |
| 5 to 17 Years | 0 (0.0%) | 0 (0.0%) |
| 18 to 34 Years | 21 (3.3%) | 0 (0.0%) |
| 35 to 64 Years | 165 (12.3%) | 381 (18.8%) |
| 65 to 74 Years | 244 (16.6%) | 178 (13.5%) |
| 75 Years and over | 243 (34.1%) | 189 (25.4%) |
Disability Class: Self-Care Difficulty
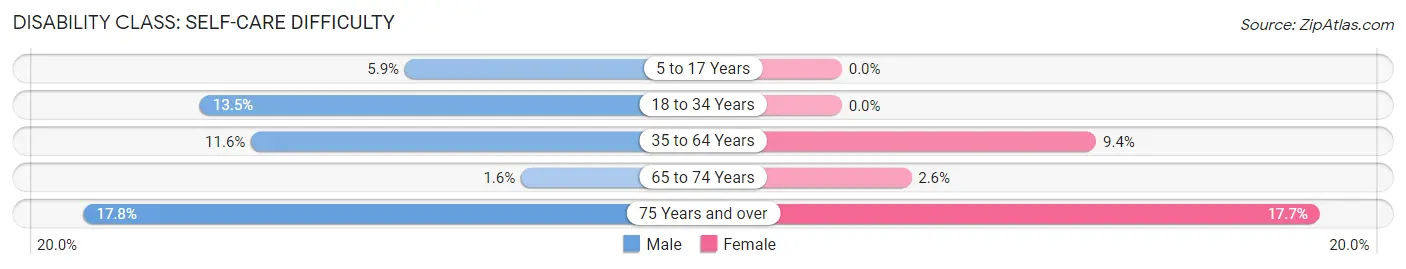
| Age Bracket | Male | Female |
| 5 to 17 Years | 18 (5.9%) | 0 (0.0%) |
| 18 to 34 Years | 85 (13.5%) | 0 (0.0%) |
| 35 to 64 Years | 156 (11.6%) | 191 (9.4%) |
| 65 to 74 Years | 23 (1.6%) | 34 (2.6%) |
| 75 Years and over | 127 (17.8%) | 132 (17.7%) |
Technology Access in Little River
Computing Device Access in Little River
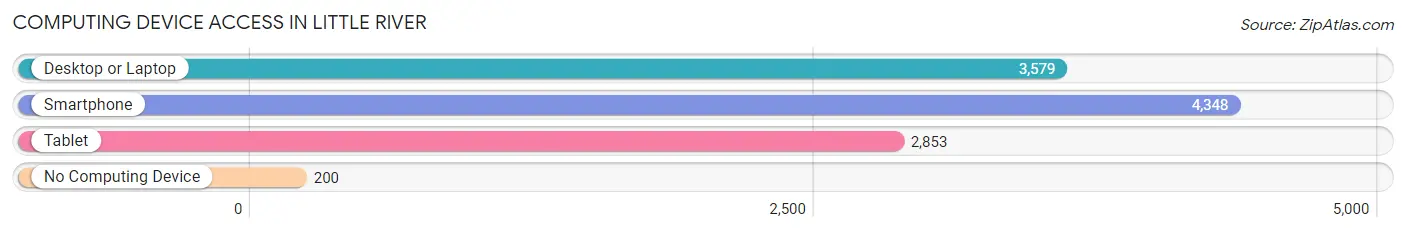
| Device Type | # Households | % Households |
| Desktop or Laptop | 3,579 | 72.3% |
| Smartphone | 4,348 | 87.8% |
| Tablet | 2,853 | 57.6% |
| No Computing Device | 200 | 4.0% |
| Total | 4,953 | 100.0% |
Internet Access in Little River
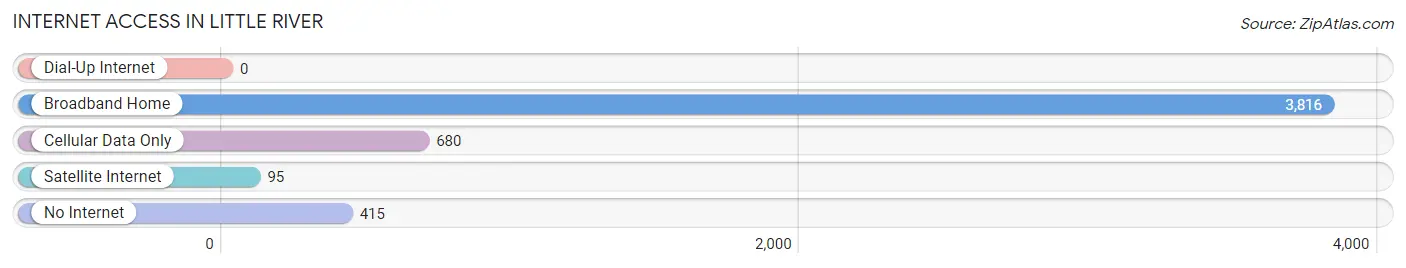
| Internet Type | # Households | % Households |
| Dial-Up Internet | 0 | 0.0% |
| Broadband Home | 3,816 | 77.0% |
| Cellular Data Only | 680 | 13.7% |
| Satellite Internet | 95 | 1.9% |
| No Internet | 415 | 8.4% |
| Total | 4,953 | 100.0% |
Little River Summary
River, SC is a small town located in Horry County, South Carolina. It is situated on the banks of the Little River, which is a tributary of the Waccamaw River. The town is located approximately 20 miles north of Myrtle Beach and is part of the Myrtle Beach metropolitan area. The population of Little River was estimated to be around 8,000 in 2020.
History
Little River was first settled in the late 1700s by a group of settlers from the British Isles. The town was originally known as Dog Bluff, but was later renamed Little River in 1845. The town was incorporated in 1883 and was a popular destination for tourists and fishermen. The town was also known for its shrimping industry, which was a major source of income for the town.
In the early 1900s, Little River was a popular destination for tourists and fishermen. The town was also known for its shrimping industry, which was a major source of income for the town. In the 1950s, the town began to experience a decline in its shrimping industry due to overfishing and pollution. This led to a decrease in the town's population and economy.
In the late 1970s, Little River began to experience a resurgence in its economy due to the development of the Myrtle Beach area. The town began to attract more tourists and businesses, which helped to revitalize the town's economy. Today, Little River is a popular tourist destination and is home to a variety of restaurants, shops, and attractions.
Geography
Little River is located in Horry County, South Carolina. The town is situated on the banks of the Little River, which is a tributary of the Waccamaw River. The town is located approximately 20 miles north of Myrtle Beach and is part of the Myrtle Beach metropolitan area. The town is bordered by the Atlantic Ocean to the east and the Intracoastal Waterway to the west.
The town has a humid subtropical climate, with hot and humid summers and mild winters. The average annual temperature is around 73°F (23°C). The town receives an average of 48 inches (122 cm) of precipitation per year.
Economy
Little River's economy is largely based on tourism and the service industry. The town is home to a variety of restaurants, shops, and attractions, which attract tourists from all over the world. The town is also home to a number of marinas, which provide services to boaters and fishermen.
The town is also home to a number of manufacturing and industrial businesses, which provide jobs to the local population. The town is home to a number of seafood processing plants, which process and package seafood for distribution throughout the United States.
Demographics
Little River has a population of around 8,000 people. The town has a diverse population, with people from a variety of backgrounds and ethnicities. The town has a median household income of around $45,000 and a poverty rate of around 15%. The town has a high rate of homeownership, with around 70% of the population owning their own homes.
The town is served by the Horry County School District, which provides education to the town's students. The town is also home to a number of private schools, which provide education to students from a variety of backgrounds.
Conclusion
Little River, SC is a small town located in Horry County, South Carolina. It is situated on the banks of the Little River, which is a tributary of the Waccamaw River. The town is located approximately 20 miles north of Myrtle Beach and is part of the Myrtle Beach metropolitan area. The population of Little River was estimated to be around 8,000 in 2020. The town has a diverse population, with people from a variety of backgrounds and ethnicities. The town's economy is largely based on tourism and the service industry, with a number of restaurants, shops, and attractions. The town is also home to a number of manufacturing and industrial businesses, which provide jobs to the local population. Little River is a popular tourist destination and is home to a variety of attractions and activities.
Common Questions
What is Per Capita Income in Little River?
Per Capita income in Little River is $40,263.
What is the Median Family Income in Little River?
Median Family Income in Little River is $75,881.
What is the Median Household income in Little River?
Median Household Income in Little River is $60,677.
What is Income or Wage Gap in Little River?
Income or Wage Gap in Little River is 13.4%.
Women in Little River earn 86.6 cents for every dollar earned by a man.
What is Family Income Deficit in Little River?
Family Income Deficit in Little River is $9,734.
Families that are below poverty line in Little River earn $9,734 less on average than the poverty threshold level.
What is Inequality or Gini Index in Little River?
Inequality or Gini Index in Little River is 0.41.
What is the Total Population of Little River?
Total Population of Little River is 9,815.
What is the Total Male Population of Little River?
Total Male Population of Little River is 4,605.
What is the Total Female Population of Little River?
Total Female Population of Little River is 5,210.
What is the Ratio of Males per 100 Females in Little River?
There are 88.39 Males per 100 Females in Little River.
What is the Ratio of Females per 100 Males in Little River?
There are 113.14 Females per 100 Males in Little River.
What is the Median Population Age in Little River?
Median Population Age in Little River is 62.0 Years.
What is the Average Family Size in Little River
Average Family Size in Little River is 2.5 People.
What is the Average Household Size in Little River
Average Household Size in Little River is 2.0 People.
How Large is the Labor Force in Little River?
There are 3,858 People in the Labor Forcein in Little River.
What is the Percentage of People in the Labor Force in Little River?
43.7% of People are in the Labor Force in Little River.
What is the Unemployment Rate in Little River?
Unemployment Rate in Little River is 4.4%.