Menominee, MI Map & Demographics
Menominee Map
Menominee Overview
$28,326
PER CAPITA INCOME
$68,767
AVG FAMILY INCOME
$46,821
AVG HOUSEHOLD INCOME
35.3%
WAGE / INCOME GAP [ % ]
64.7¢/ $1
WAGE / INCOME GAP [ $ ]
0.40
INEQUALITY / GINI INDEX
8,429
TOTAL POPULATION
4,337
MALE POPULATION
4,092
FEMALE POPULATION
105.99
MALES / 100 FEMALES
94.35
FEMALES / 100 MALES
49.0
MEDIAN AGE
2.9
AVG FAMILY SIZE
2.2
AVG HOUSEHOLD SIZE
4,316
LABOR FORCE [ PEOPLE ]
59.9%
PERCENT IN LABOR FORCE
4.1%
UNEMPLOYMENT RATE
Menominee Zip Codes
Menominee Area Codes
Income in Menominee
Income Overview in Menominee
Per Capita Income in Menominee is $28,326, while median incomes of families and households are $68,767 and $46,821 respectively.
| Characteristic | Number | Measure |
| Per Capita Income | 8,429 | $28,326 |
| Median Family Income | 1,929 | $68,767 |
| Mean Family Income | 1,929 | $73,827 |
| Median Household Income | 3,841 | $46,821 |
| Mean Household Income | 3,841 | $57,532 |
| Income Deficit | 1,929 | $0 |
| Wage / Income Gap (%) | 8,429 | 35.35% |
| Wage / Income Gap ($) | 8,429 | 64.65¢ per $1 |
| Gini / Inequality Index | 8,429 | 0.40 |
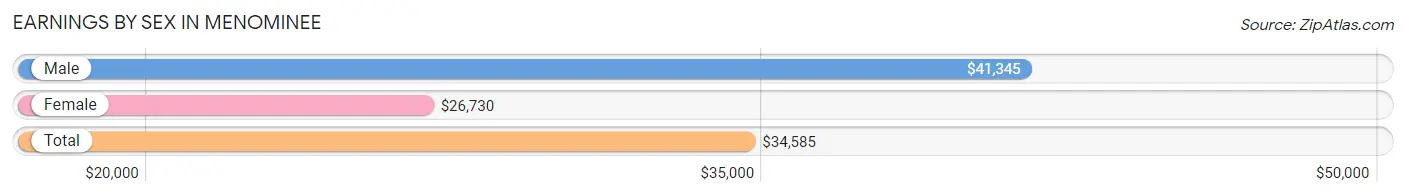
Earnings by Sex in Menominee
Average Earnings in Menominee are $34,585, $41,345 for men and $26,730 for women, a difference of 35.3%.
| Sex | Number | Average Earnings |
| Male | 2,333 (53.2%) | $41,345 |
| Female | 2,053 (46.8%) | $26,730 |
| Total | 4,386 (100.0%) | $34,585 |
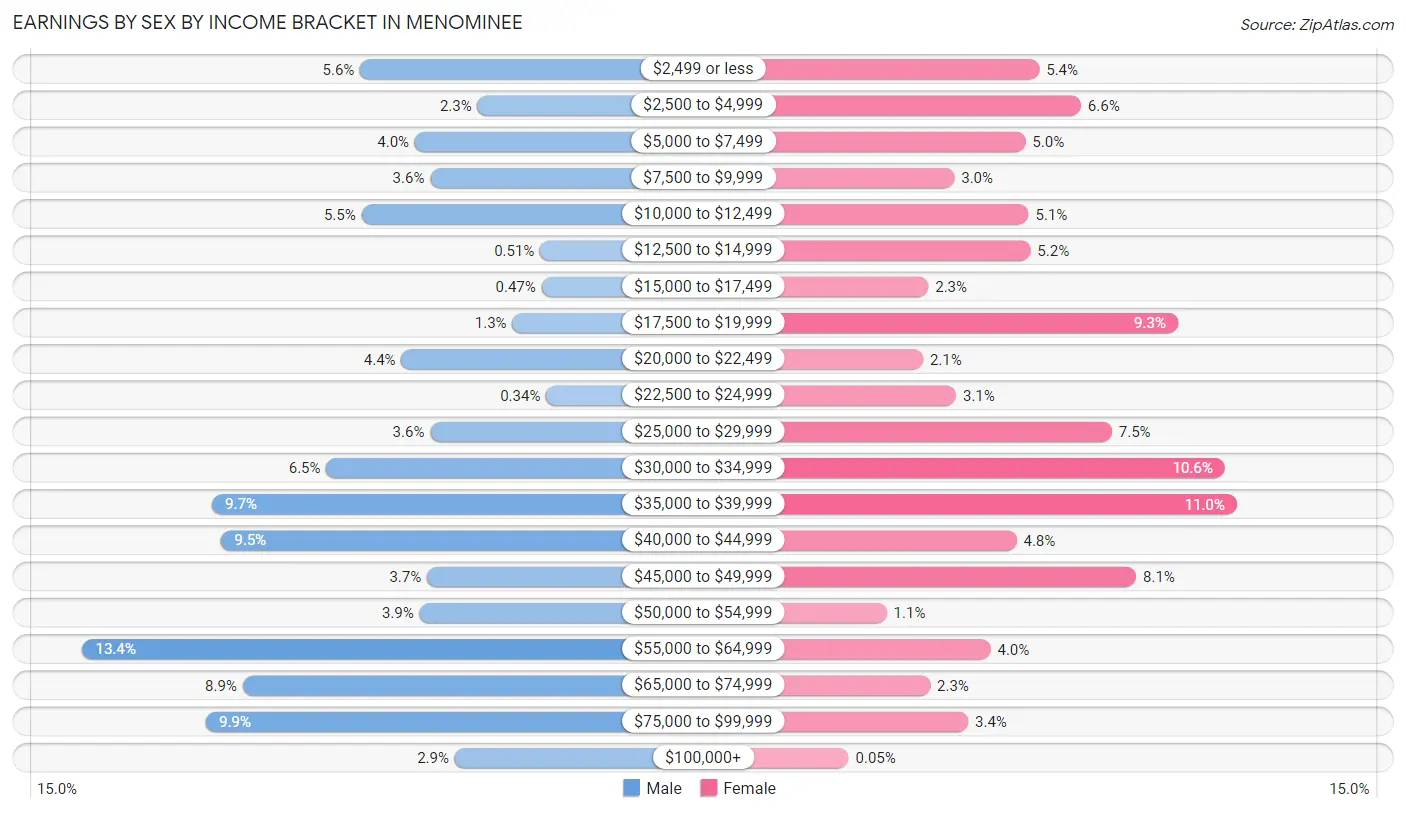
Earnings by Sex by Income Bracket in Menominee
The most common earnings brackets in Menominee are $55,000 to $64,999 for men (312 | 13.4%) and $35,000 to $39,999 for women (225 | 11.0%).
| Income | Male | Female |
| $2,499 or less | 130 (5.6%) | 111 (5.4%) |
| $2,500 to $4,999 | 53 (2.3%) | 135 (6.6%) |
| $5,000 to $7,499 | 94 (4.0%) | 103 (5.0%) |
| $7,500 to $9,999 | 84 (3.6%) | 62 (3.0%) |
| $10,000 to $12,499 | 129 (5.5%) | 105 (5.1%) |
| $12,500 to $14,999 | 12 (0.5%) | 106 (5.2%) |
| $15,000 to $17,499 | 11 (0.5%) | 47 (2.3%) |
| $17,500 to $19,999 | 30 (1.3%) | 191 (9.3%) |
| $20,000 to $22,499 | 103 (4.4%) | 44 (2.1%) |
| $22,500 to $24,999 | 8 (0.3%) | 63 (3.1%) |
| $25,000 to $29,999 | 84 (3.6%) | 153 (7.4%) |
| $30,000 to $34,999 | 152 (6.5%) | 218 (10.6%) |
| $35,000 to $39,999 | 227 (9.7%) | 225 (11.0%) |
| $40,000 to $44,999 | 221 (9.5%) | 98 (4.8%) |
| $45,000 to $49,999 | 86 (3.7%) | 167 (8.1%) |
| $50,000 to $54,999 | 91 (3.9%) | 23 (1.1%) |
| $55,000 to $64,999 | 312 (13.4%) | 83 (4.0%) |
| $65,000 to $74,999 | 207 (8.9%) | 48 (2.3%) |
| $75,000 to $99,999 | 231 (9.9%) | 70 (3.4%) |
| $100,000+ | 68 (2.9%) | 1 (0.1%) |
| Total | 2,333 (100.0%) | 2,053 (100.0%) |
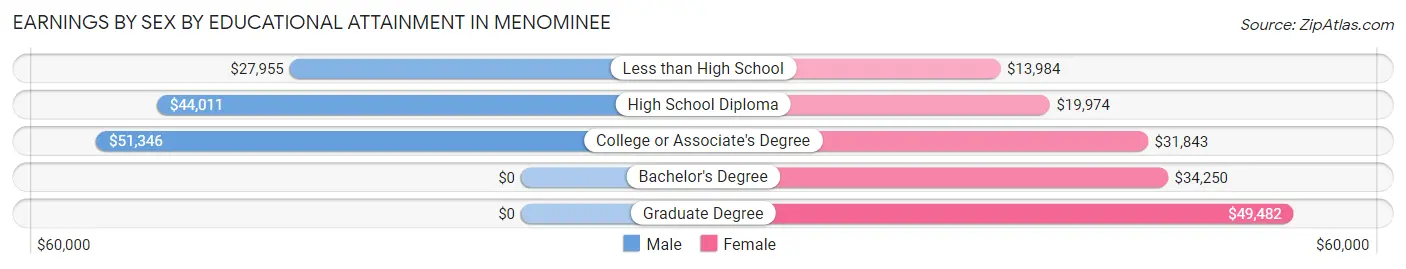
Earnings by Sex by Educational Attainment in Menominee
Average earnings in Menominee are $44,671 for men and $30,183 for women, a difference of 32.4%. Men with an educational attainment of college or associate's degree enjoy the highest average annual earnings of $51,346, while those with less than high school education earn the least with $27,955. Women with an educational attainment of graduate degree earn the most with the average annual earnings of $49,482, while those with less than high school education have the smallest earnings of $13,984.
| Educational Attainment | Male Income | Female Income |
| Less than High School | $27,955 | $13,984 |
| High School Diploma | $44,011 | $19,974 |
| College or Associate's Degree | $51,346 | $31,843 |
| Bachelor's Degree | - | - |
| Graduate Degree | - | - |
| Total | $44,671 | $30,183 |
Family Income in Menominee
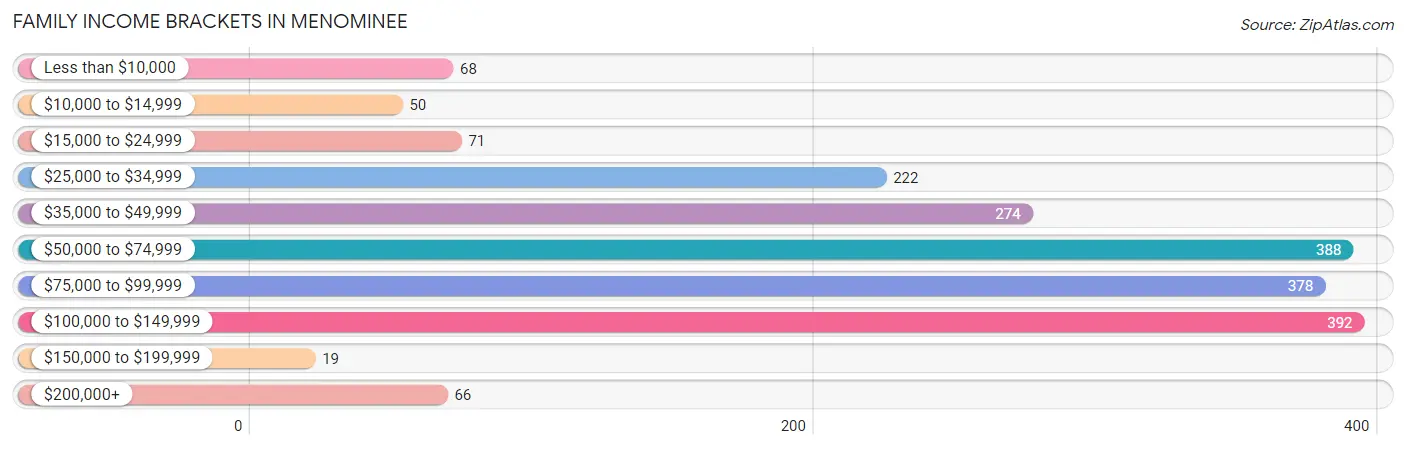
Family Income Brackets in Menominee
According to the Menominee family income data, there are 392 families falling into the $100,000 to $149,999 income range, which is the most common income bracket and makes up 20.3% of all families. Conversely, the $150,000 to $199,999 income bracket is the least frequent group with only 19 families (1.0%) belonging to this category.
| Income Bracket | # Families | % Families |
| Less than $10,000 | 68 | 3.5% |
| $10,000 to $14,999 | 50 | 2.6% |
| $15,000 to $24,999 | 71 | 3.7% |
| $25,000 to $34,999 | 222 | 11.5% |
| $35,000 to $49,999 | 274 | 14.2% |
| $50,000 to $74,999 | 388 | 20.1% |
| $75,000 to $99,999 | 378 | 19.6% |
| $100,000 to $149,999 | 392 | 20.3% |
| $150,000 to $199,999 | 19 | 1.0% |
| $200,000+ | 66 | 3.4% |
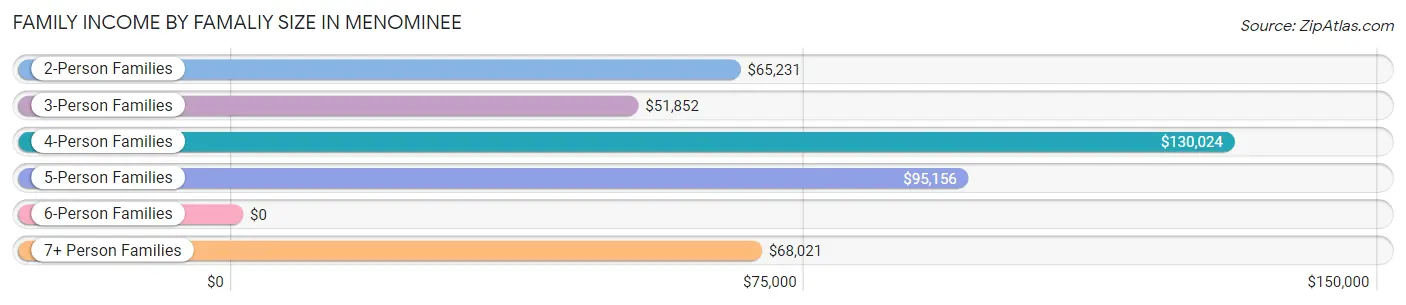
Family Income by Famaliy Size in Menominee
4-person families (127 | 6.6%) account for the highest median family income in Menominee with $130,024 per family, while 2-person families (1,189 | 61.6%) have the highest median income of $32,616 per family member.
| Income Bracket | # Families | Median Income |
| 2-Person Families | 1,189 (61.6%) | $65,231 |
| 3-Person Families | 456 (23.6%) | $51,852 |
| 4-Person Families | 127 (6.6%) | $130,024 |
| 5-Person Families | 75 (3.9%) | $95,156 |
| 6-Person Families | 32 (1.7%) | $0 |
| 7+ Person Families | 50 (2.6%) | $68,021 |
| Total | 1,929 (100.0%) | $68,767 |
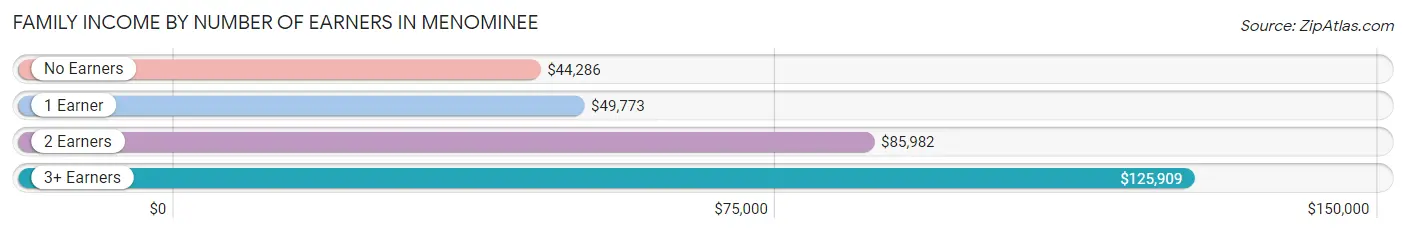
Family Income by Number of Earners in Menominee
The median family income in Menominee is $68,767, with families comprising 3+ earners (234) having the highest median family income of $125,909, while families with no earners (504) have the lowest median family income of $44,286, accounting for 12.1% and 26.1% of families, respectively.
| Number of Earners | # Families | Median Income |
| No Earners | 504 (26.1%) | $44,286 |
| 1 Earner | 582 (30.2%) | $49,773 |
| 2 Earners | 609 (31.6%) | $85,982 |
| 3+ Earners | 234 (12.1%) | $125,909 |
| Total | 1,929 (100.0%) | $68,767 |
Household Income in Menominee
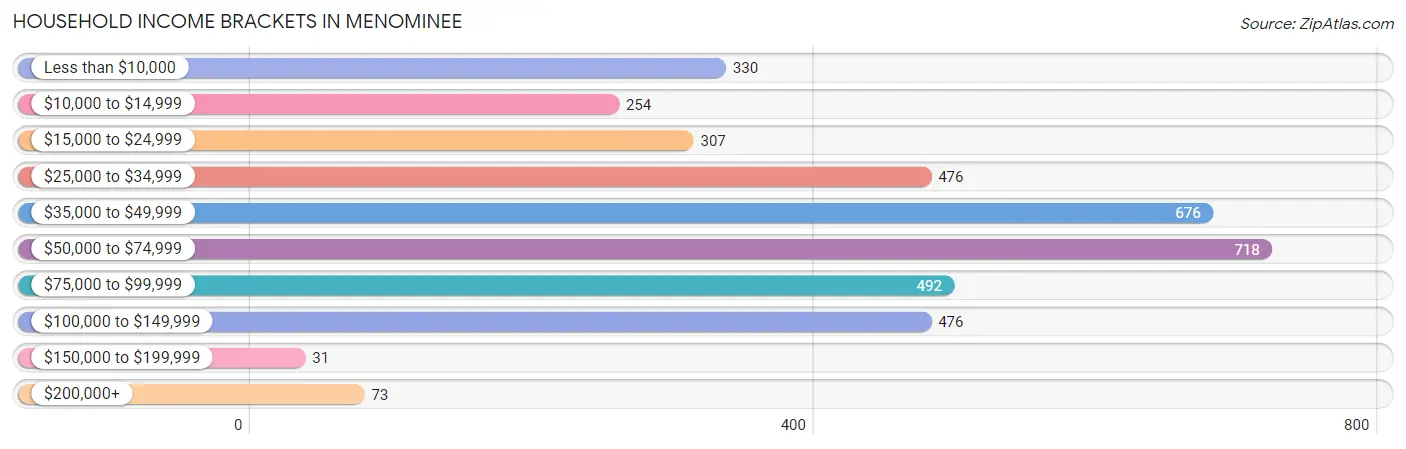
Household Income Brackets in Menominee
With 718 households falling in the category, the $50,000 to $74,999 income range is the most frequent in Menominee, accounting for 18.7% of all households. In contrast, only 31 households (0.8%) fall into the $150,000 to $199,999 income bracket, making it the least populous group.
| Income Bracket | # Households | % Households |
| Less than $10,000 | 330 | 8.6% |
| $10,000 to $14,999 | 254 | 6.6% |
| $15,000 to $24,999 | 307 | 8.0% |
| $25,000 to $34,999 | 476 | 12.4% |
| $35,000 to $49,999 | 676 | 17.6% |
| $50,000 to $74,999 | 718 | 18.7% |
| $75,000 to $99,999 | 492 | 12.8% |
| $100,000 to $149,999 | 476 | 12.4% |
| $150,000 to $199,999 | 31 | 0.8% |
| $200,000+ | 73 | 1.9% |
Household Income by Householder Age in Menominee
The median household income in Menominee is $46,821, with the highest median household income of $63,563 found in the 25 to 44 years age bracket for the primary householder. A total of 927 households (24.1%) fall into this category. Meanwhile, the 15 to 24 years age bracket for the primary householder has the lowest median household income of $21,500, with 162 households (4.2%) in this group.
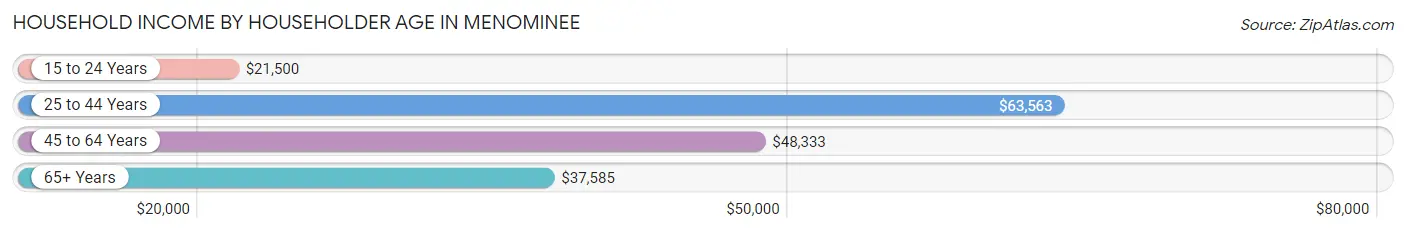
| Income Bracket | # Households | Median Income |
| 15 to 24 Years | 162 (4.2%) | $21,500 |
| 25 to 44 Years | 927 (24.1%) | $63,563 |
| 45 to 64 Years | 1,442 (37.5%) | $48,333 |
| 65+ Years | 1,310 (34.1%) | $37,585 |
| Total | 3,841 (100.0%) | $46,821 |
Poverty in Menominee
Income Below Poverty by Sex and Age in Menominee
With 13.9% poverty level for males and 13.5% for females among the residents of Menominee, 25 to 34 year old males and 12 to 14 year old females are the most vulnerable to poverty, with 123 males (31.0%) and 27 females (27.6%) in their respective age groups living below the poverty level.
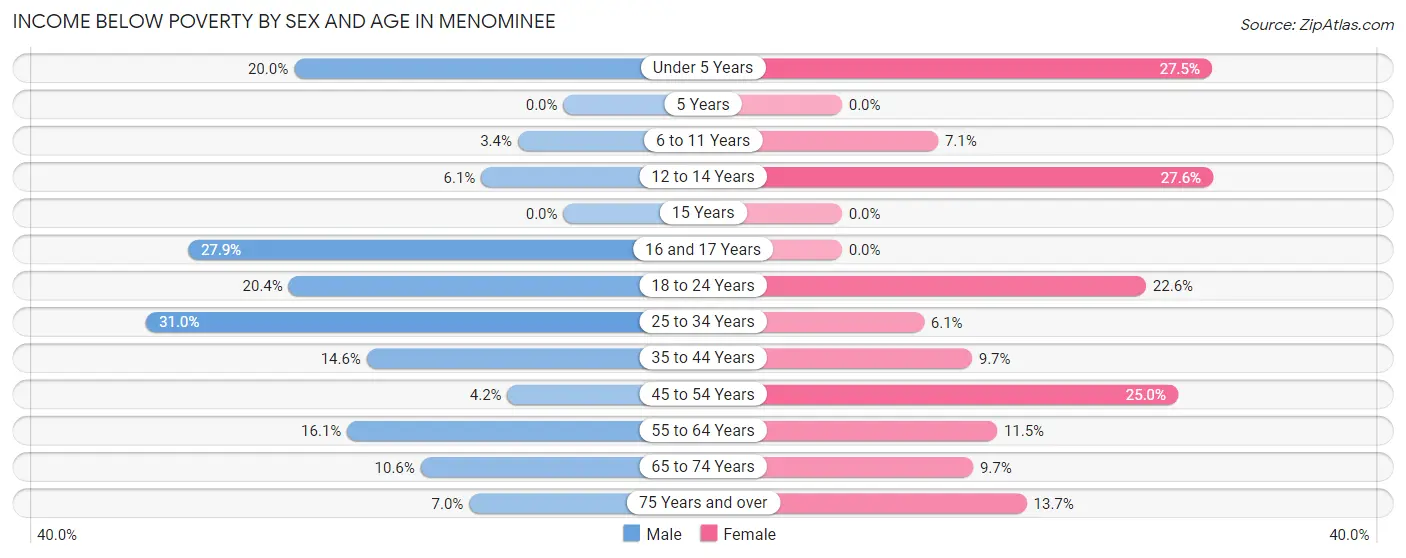
| Age Bracket | Male | Female |
| Under 5 Years | 31 (20.0%) | 25 (27.5%) |
| 5 Years | 0 (0.0%) | 0 (0.0%) |
| 6 to 11 Years | 7 (3.4%) | 11 (7.1%) |
| 12 to 14 Years | 10 (6.1%) | 27 (27.6%) |
| 15 Years | 0 (0.0%) | 0 (0.0%) |
| 16 and 17 Years | 17 (27.9%) | 0 (0.0%) |
| 18 to 24 Years | 82 (20.4%) | 70 (22.6%) |
| 25 to 34 Years | 123 (31.0%) | 29 (6.1%) |
| 35 to 44 Years | 87 (14.6%) | 33 (9.7%) |
| 45 to 54 Years | 18 (4.2%) | 130 (24.9%) |
| 55 to 64 Years | 126 (16.1%) | 84 (11.5%) |
| 65 to 74 Years | 53 (10.6%) | 56 (9.7%) |
| 75 Years and over | 30 (7.0%) | 66 (13.7%) |
| Total | 584 (13.9%) | 531 (13.5%) |
Income Above Poverty by Sex and Age in Menominee
According to the poverty statistics in Menominee, males aged 5 years and females aged 5 years are the age groups that are most secure financially, with 100.0% of males and 100.0% of females in these age groups living above the poverty line.
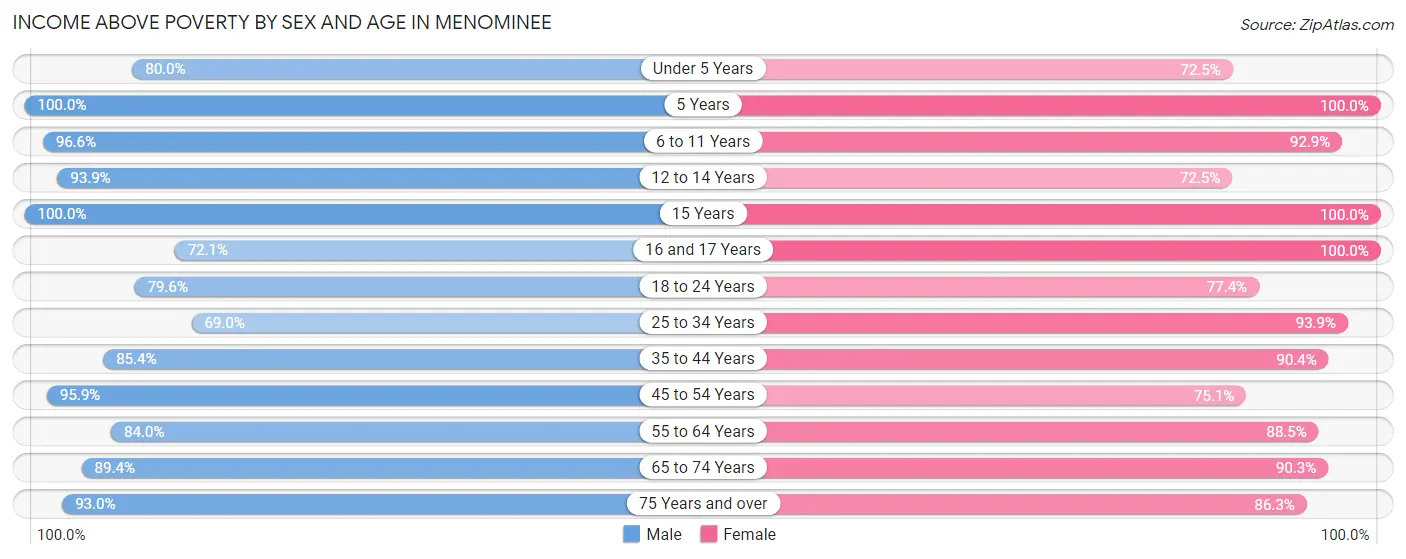
| Age Bracket | Male | Female |
| Under 5 Years | 124 (80.0%) | 66 (72.5%) |
| 5 Years | 41 (100.0%) | 10 (100.0%) |
| 6 to 11 Years | 200 (96.6%) | 143 (92.9%) |
| 12 to 14 Years | 154 (93.9%) | 71 (72.5%) |
| 15 Years | 18 (100.0%) | 77 (100.0%) |
| 16 and 17 Years | 44 (72.1%) | 76 (100.0%) |
| 18 to 24 Years | 320 (79.6%) | 240 (77.4%) |
| 25 to 34 Years | 274 (69.0%) | 447 (93.9%) |
| 35 to 44 Years | 509 (85.4%) | 309 (90.3%) |
| 45 to 54 Years | 416 (95.9%) | 391 (75.0%) |
| 55 to 64 Years | 659 (84.0%) | 645 (88.5%) |
| 65 to 74 Years | 447 (89.4%) | 519 (90.3%) |
| 75 Years and over | 399 (93.0%) | 415 (86.3%) |
| Total | 3,605 (86.1%) | 3,409 (86.5%) |
Income Below Poverty Among Married-Couple Families in Menominee
The poverty statistics for married-couple families in Menominee show that 4.2% or 60 of the total 1,421 families live below the poverty line. Families with 1 or 2 children have the highest poverty rate of 7.5%, comprising of 17 families. On the other hand, families with 3 or 4 children have the lowest poverty rate of 0.0%, which includes 0 families.
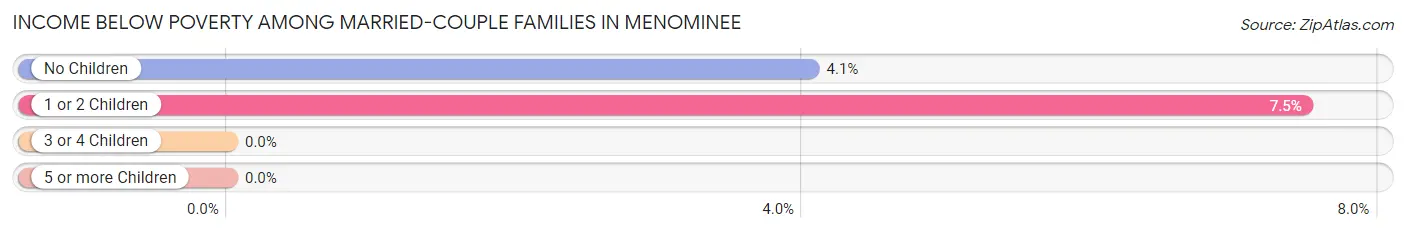
| Children | Above Poverty | Below Poverty |
| No Children | 1,020 (96.0%) | 43 (4.1%) |
| 1 or 2 Children | 210 (92.5%) | 17 (7.5%) |
| 3 or 4 Children | 81 (100.0%) | 0 (0.0%) |
| 5 or more Children | 50 (100.0%) | 0 (0.0%) |
| Total | 1,361 (95.8%) | 60 (4.2%) |
Income Below Poverty Among Single-Parent Households in Menominee
According to the poverty data in Menominee, 8.3% or 15 single-father households and 20.7% or 68 single-mother households are living below the poverty line. Among single-father households, those with 5 or more children have the highest poverty rate, with 7 households (100.0%) experiencing poverty. Likewise, among single-mother households, those with 1 or 2 children have the highest poverty rate, with 56 households (29.0%) falling below the poverty line.
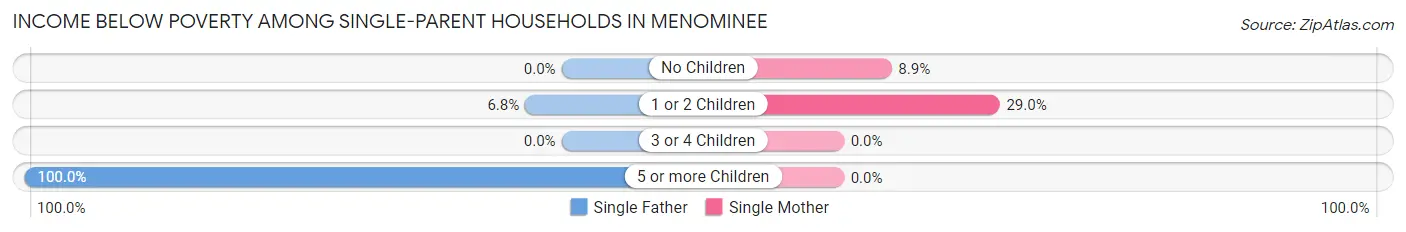
| Children | Single Father | Single Mother |
| No Children | 0 (0.0%) | 12 (8.9%) |
| 1 or 2 Children | 8 (6.8%) | 56 (29.0%) |
| 3 or 4 Children | 0 (0.0%) | 0 (0.0%) |
| 5 or more Children | 7 (100.0%) | 0 (0.0%) |
| Total | 15 (8.3%) | 68 (20.7%) |
Income Below Poverty Among Married-Couple vs Single-Parent Households in Menominee
The poverty data for Menominee shows that 60 of the married-couple family households (4.2%) and 83 of the single-parent households (16.3%) are living below the poverty level. Within the married-couple family households, those with 1 or 2 children have the highest poverty rate, with 17 households (7.5%) falling below the poverty line. Among the single-parent households, those with 5 or more children have the highest poverty rate, with 7 household (100.0%) living below poverty.
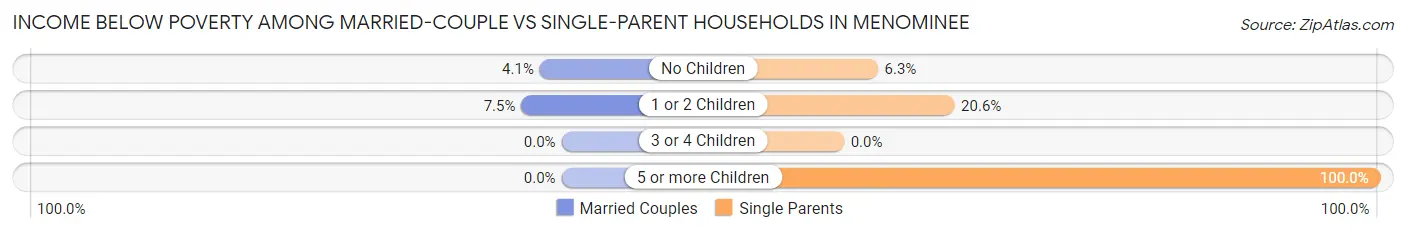
| Children | Married-Couple Families | Single-Parent Households |
| No Children | 43 (4.1%) | 12 (6.3%) |
| 1 or 2 Children | 17 (7.5%) | 64 (20.6%) |
| 3 or 4 Children | 0 (0.0%) | 0 (0.0%) |
| 5 or more Children | 0 (0.0%) | 7 (100.0%) |
| Total | 60 (4.2%) | 83 (16.3%) |
Race in Menominee
The most populous races in Menominee are White / Caucasian (8,050 | 95.5%), Two or more Races (337 | 4.0%), and Hispanic or Latino (189 | 2.2%).
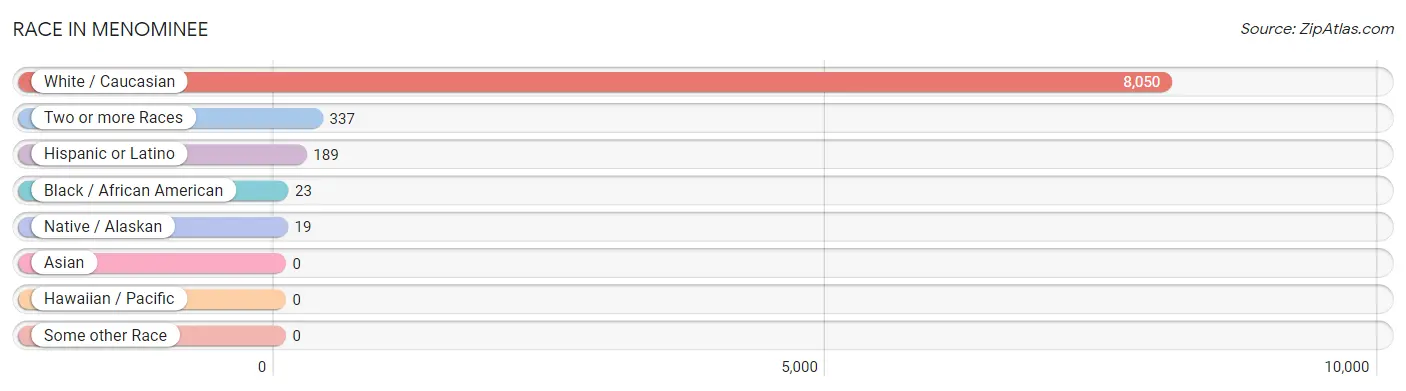
| Race | # Population | % Population |
| Asian | 0 | 0.0% |
| Black / African American | 23 | 0.3% |
| Hawaiian / Pacific | 0 | 0.0% |
| Hispanic or Latino | 189 | 2.2% |
| Native / Alaskan | 19 | 0.2% |
| White / Caucasian | 8,050 | 95.5% |
| Two or more Races | 337 | 4.0% |
| Some other Race | 0 | 0.0% |
| Total | 8,429 | 100.0% |
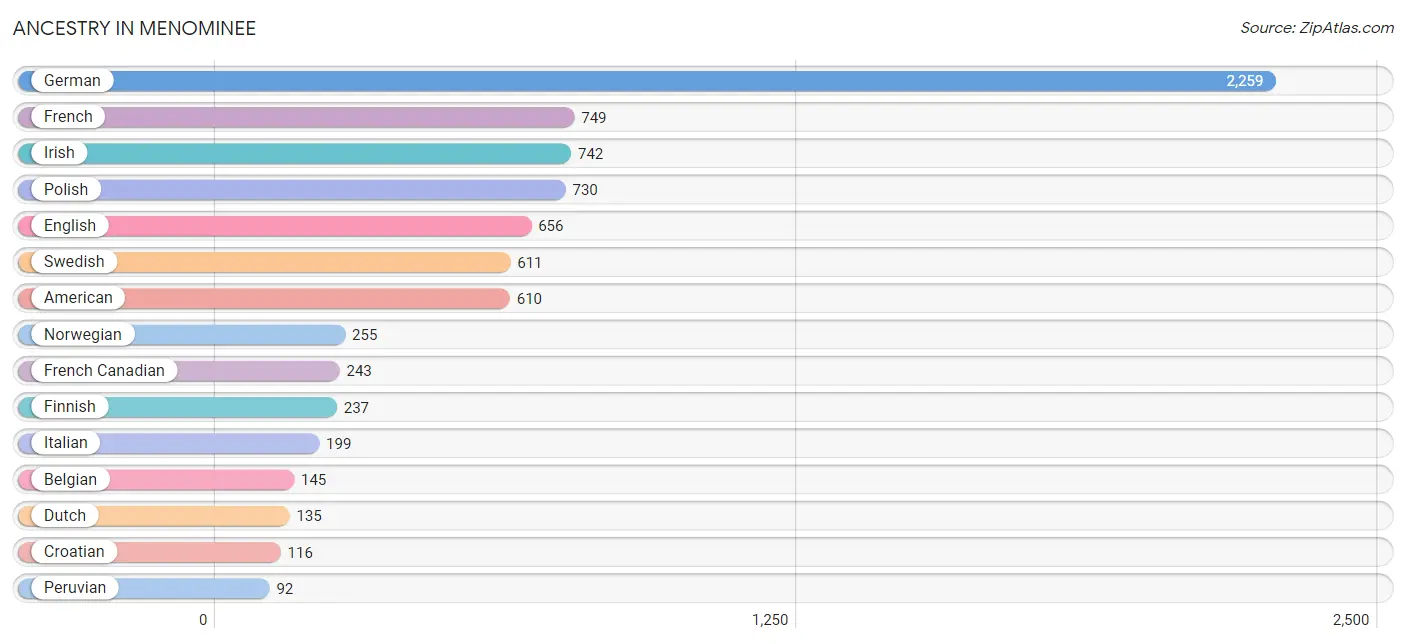
Ancestry in Menominee
The most populous ancestries reported in Menominee are German (2,259 | 26.8%), French (749 | 8.9%), Irish (742 | 8.8%), Polish (730 | 8.7%), and English (656 | 7.8%), together accounting for 60.9% of all Menominee residents.
| Ancestry | # Population | % Population |
| American | 610 | 7.2% |
| Austrian | 7 | 0.1% |
| Belgian | 145 | 1.7% |
| Burmese | 8 | 0.1% |
| Canadian | 8 | 0.1% |
| Central American | 21 | 0.3% |
| Cherokee | 8 | 0.1% |
| Chippewa | 30 | 0.4% |
| Croatian | 116 | 1.4% |
| Czech | 77 | 0.9% |
| Czechoslovakian | 15 | 0.2% |
| Danish | 68 | 0.8% |
| Dutch | 135 | 1.6% |
| Eastern European | 25 | 0.3% |
| English | 656 | 7.8% |
| European | 88 | 1.0% |
| Finnish | 237 | 2.8% |
| French | 749 | 8.9% |
| French American Indian | 1 | 0.0% |
| French Canadian | 243 | 2.9% |
| German | 2,259 | 26.8% |
| Irish | 742 | 8.8% |
| Italian | 199 | 2.4% |
| Mexican | 72 | 0.9% |
| Nicaraguan | 21 | 0.3% |
| Norwegian | 255 | 3.0% |
| Peruvian | 92 | 1.1% |
| Polish | 730 | 8.7% |
| Portuguese | 7 | 0.1% |
| Puerto Rican | 4 | 0.1% |
| Russian | 27 | 0.3% |
| Scandinavian | 68 | 0.8% |
| Scotch-Irish | 28 | 0.3% |
| Scottish | 48 | 0.6% |
| Sioux | 2 | 0.0% |
| Slavic | 8 | 0.1% |
| South American | 92 | 1.1% |
| South American Indian | 7 | 0.1% |
| Subsaharan African | 16 | 0.2% |
| Swedish | 611 | 7.2% |
| Swiss | 30 | 0.4% |
| Welsh | 15 | 0.2% |
| Yugoslavian | 11 | 0.1% | View All 43 Rows |
Immigrants in Menominee
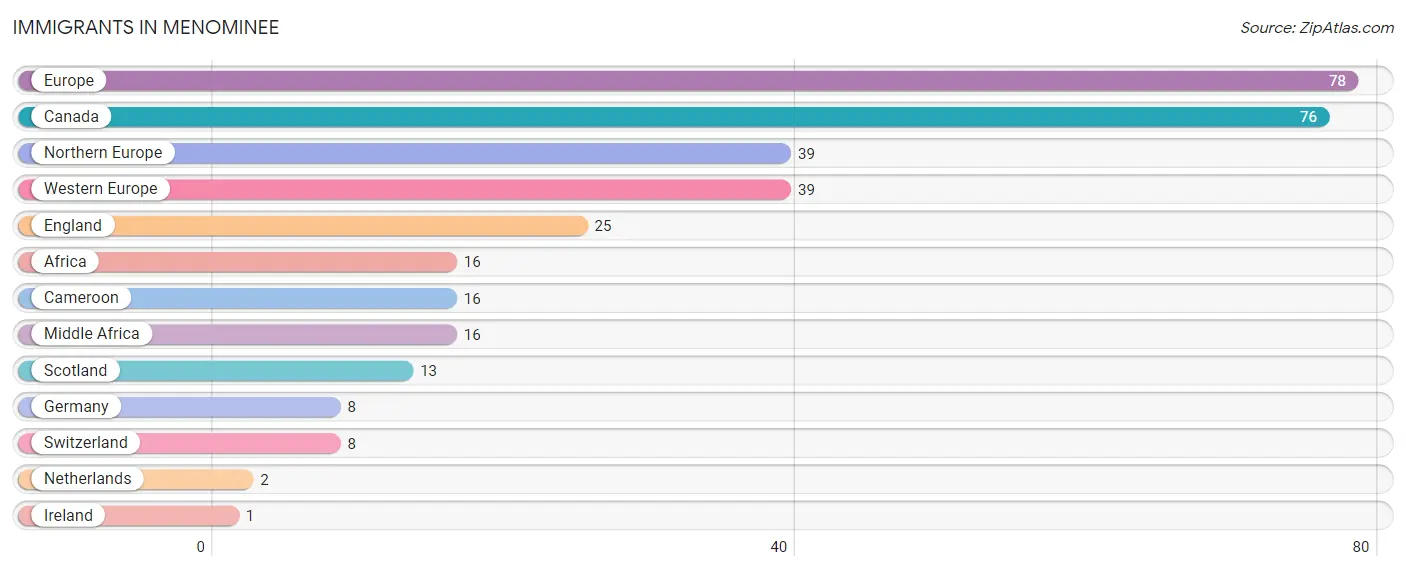
The most numerous immigrant groups reported in Menominee came from Europe (78 | 0.9%), Canada (76 | 0.9%), Northern Europe (39 | 0.5%), Western Europe (39 | 0.5%), and England (25 | 0.3%), together accounting for 3.0% of all Menominee residents.
| Immigration Origin | # Population | % Population |
| Africa | 16 | 0.2% |
| Cameroon | 16 | 0.2% |
| Canada | 76 | 0.9% |
| England | 25 | 0.3% |
| Europe | 78 | 0.9% |
| Germany | 8 | 0.1% |
| Ireland | 1 | 0.0% |
| Middle Africa | 16 | 0.2% |
| Netherlands | 2 | 0.0% |
| Northern Europe | 39 | 0.5% |
| Scotland | 13 | 0.2% |
| Switzerland | 8 | 0.1% |
| Western Europe | 39 | 0.5% | View All 13 Rows |
Sex and Age in Menominee
Sex and Age in Menominee
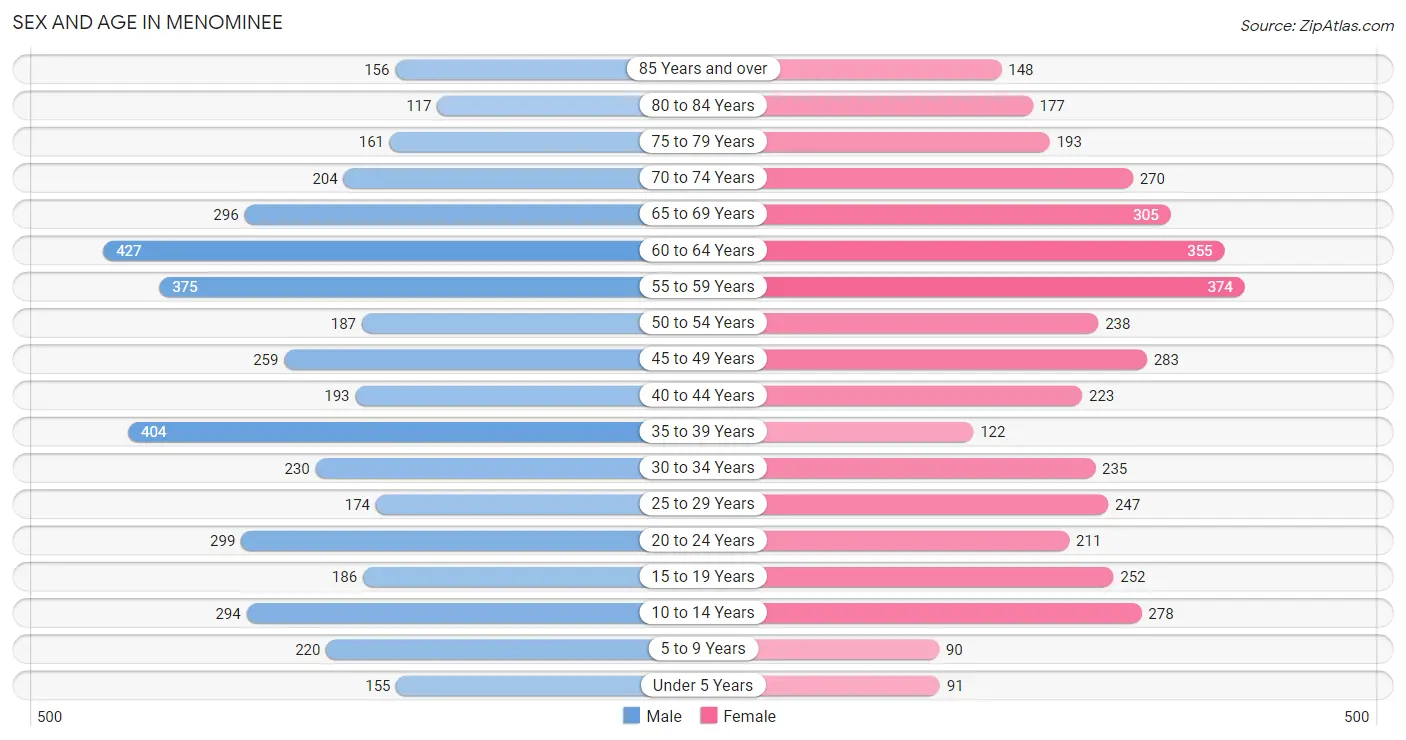
The most populous age groups in Menominee are 60 to 64 Years (427 | 9.9%) for men and 55 to 59 Years (374 | 9.1%) for women.
| Age Bracket | Male | Female |
| Under 5 Years | 155 (3.6%) | 91 (2.2%) |
| 5 to 9 Years | 220 (5.1%) | 90 (2.2%) |
| 10 to 14 Years | 294 (6.8%) | 278 (6.8%) |
| 15 to 19 Years | 186 (4.3%) | 252 (6.2%) |
| 20 to 24 Years | 299 (6.9%) | 211 (5.2%) |
| 25 to 29 Years | 174 (4.0%) | 247 (6.0%) |
| 30 to 34 Years | 230 (5.3%) | 235 (5.7%) |
| 35 to 39 Years | 404 (9.3%) | 122 (3.0%) |
| 40 to 44 Years | 193 (4.4%) | 223 (5.4%) |
| 45 to 49 Years | 259 (6.0%) | 283 (6.9%) |
| 50 to 54 Years | 187 (4.3%) | 238 (5.8%) |
| 55 to 59 Years | 375 (8.6%) | 374 (9.1%) |
| 60 to 64 Years | 427 (9.9%) | 355 (8.7%) |
| 65 to 69 Years | 296 (6.8%) | 305 (7.4%) |
| 70 to 74 Years | 204 (4.7%) | 270 (6.6%) |
| 75 to 79 Years | 161 (3.7%) | 193 (4.7%) |
| 80 to 84 Years | 117 (2.7%) | 177 (4.3%) |
| 85 Years and over | 156 (3.6%) | 148 (3.6%) |
| Total | 4,337 (100.0%) | 4,092 (100.0%) |
Families and Households in Menominee
Median Family Size in Menominee
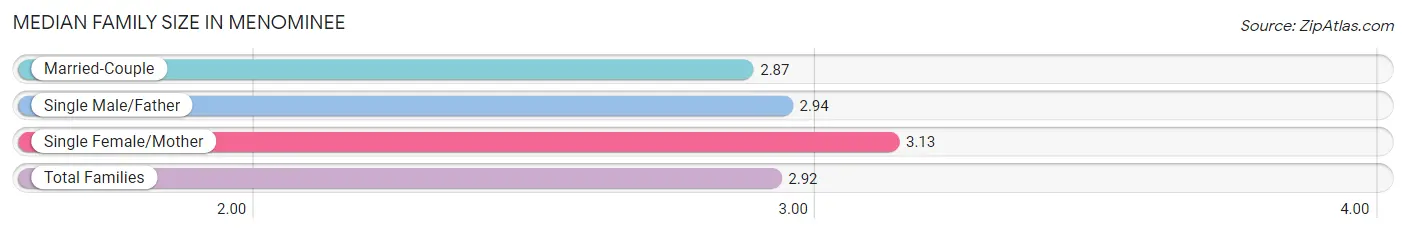
The median family size in Menominee is 2.92 persons per family, with single female/mother families (328 | 17.0%) accounting for the largest median family size of 3.13 persons per family. On the other hand, married-couple families (1,421 | 73.7%) represent the smallest median family size with 2.87 persons per family.
| Family Type | # Families | Family Size |
| Married-Couple | 1,421 (73.7%) | 2.87 |
| Single Male/Father | 180 (9.3%) | 2.94 |
| Single Female/Mother | 328 (17.0%) | 3.13 |
| Total Families | 1,929 (100.0%) | 2.92 |
Median Household Size in Menominee
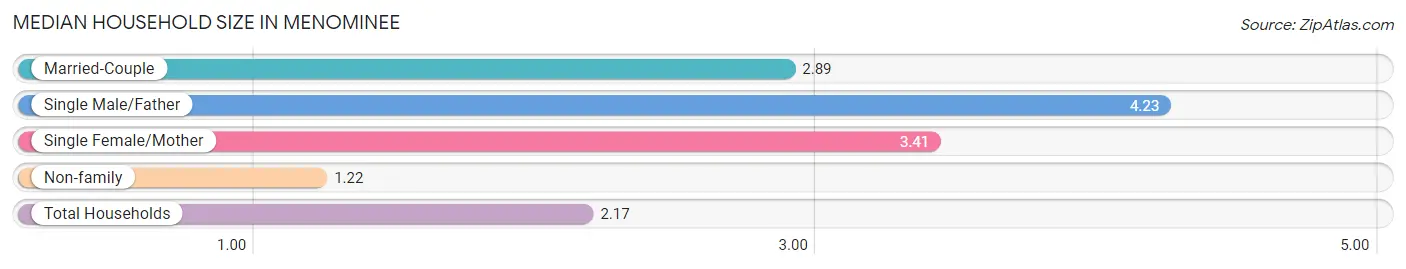
The median household size in Menominee is 2.17 persons per household, with single male/father households (180 | 4.7%) accounting for the largest median household size of 4.23 persons per household. non-family households (1,912 | 49.8%) represent the smallest median household size with 1.22 persons per household.
| Household Type | # Households | Household Size |
| Married-Couple | 1,421 (37.0%) | 2.89 |
| Single Male/Father | 180 (4.7%) | 4.23 |
| Single Female/Mother | 328 (8.5%) | 3.41 |
| Non-family | 1,912 (49.8%) | 1.22 |
| Total Households | 3,841 (100.0%) | 2.17 |
Household Size by Marriage Status in Menominee
Out of a total of 3,841 households in Menominee, 1,929 (50.2%) are family households, while 1,912 (49.8%) are nonfamily households. The most numerous type of family households are 2-person households, comprising 1,133, and the most common type of nonfamily households are 1-person households, comprising 1,639.
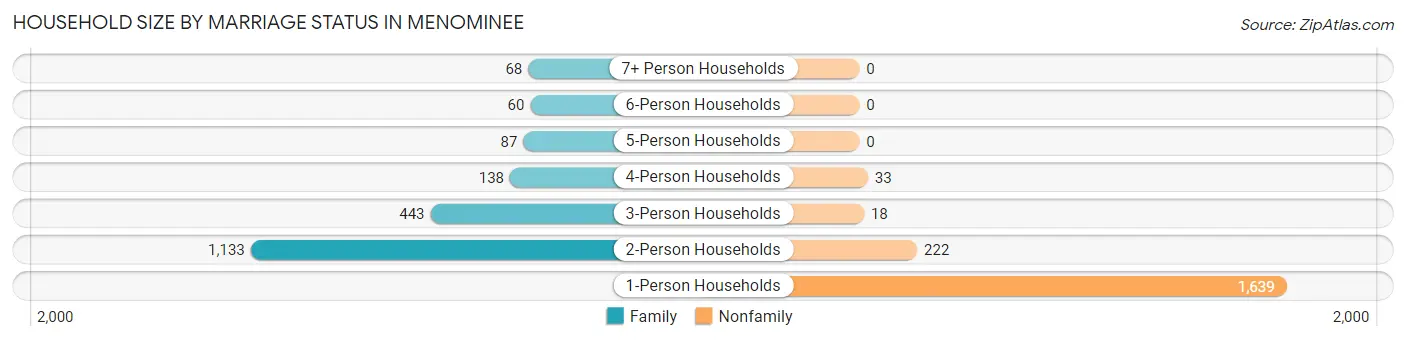
| Household Size | Family Households | Nonfamily Households |
| 1-Person Households | - | 1,639 (42.7%) |
| 2-Person Households | 1,133 (29.5%) | 222 (5.8%) |
| 3-Person Households | 443 (11.5%) | 18 (0.5%) |
| 4-Person Households | 138 (3.6%) | 33 (0.9%) |
| 5-Person Households | 87 (2.3%) | 0 (0.0%) |
| 6-Person Households | 60 (1.6%) | 0 (0.0%) |
| 7+ Person Households | 68 (1.8%) | 0 (0.0%) |
| Total | 1,929 (50.2%) | 1,912 (49.8%) |
Female Fertility in Menominee
Fertility by Age in Menominee
Average fertility rate in Menominee is 8.0 births per 1,000 women. Women in the age bracket of 20 to 34 years have the highest fertility rate with 17.0 births per 1,000 women. Women in the age bracket of 20 to 34 years acount for 100.0% of all women with births.
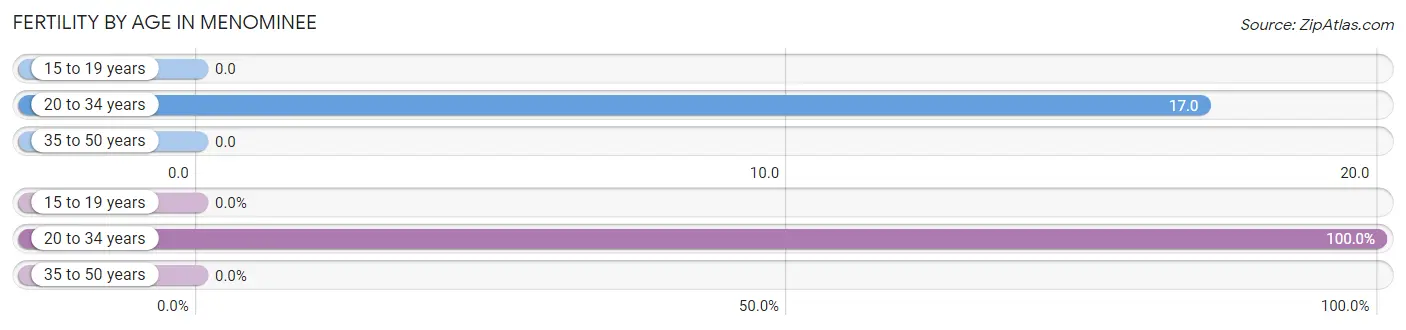
| Age Bracket | Women with Births | Births / 1,000 Women |
| 15 to 19 years | 0 (0.0%) | 0.0 |
| 20 to 34 years | 12 (100.0%) | 17.0 |
| 35 to 50 years | 0 (0.0%) | 0.0 |
| Total | 12 (100.0%) | 8.0 |
Fertility by Age by Marriage Status in Menominee
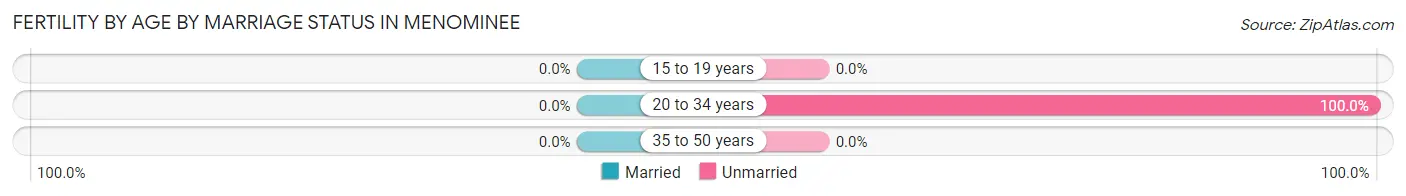
| Age Bracket | Married | Unmarried |
| 15 to 19 years | 0 (0.0%) | 0 (0.0%) |
| 20 to 34 years | 0 (0.0%) | 12 (100.0%) |
| 35 to 50 years | 0 (0.0%) | 0 (0.0%) |
| Total | 0 (0.0%) | 12 (100.0%) |
Fertility by Education in Menominee
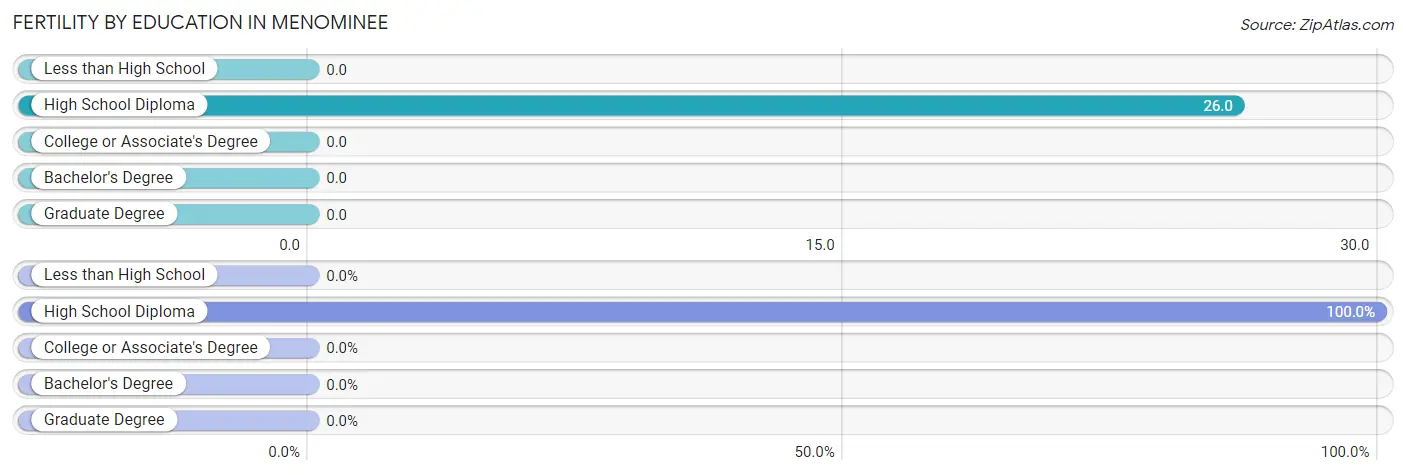
| Educational Attainment | Women with Births | Births / 1,000 Women |
| Less than High School | 0 (0.0%) | 0.0 |
| High School Diploma | 12 (100.0%) | 26.0 |
| College or Associate's Degree | 0 (0.0%) | 0.0 |
| Bachelor's Degree | 0 (0.0%) | 0.0 |
| Graduate Degree | 0 (0.0%) | 0.0 |
| Total | 12 (100.0%) | 8.0 |
Fertility by Education by Marriage Status in Menominee
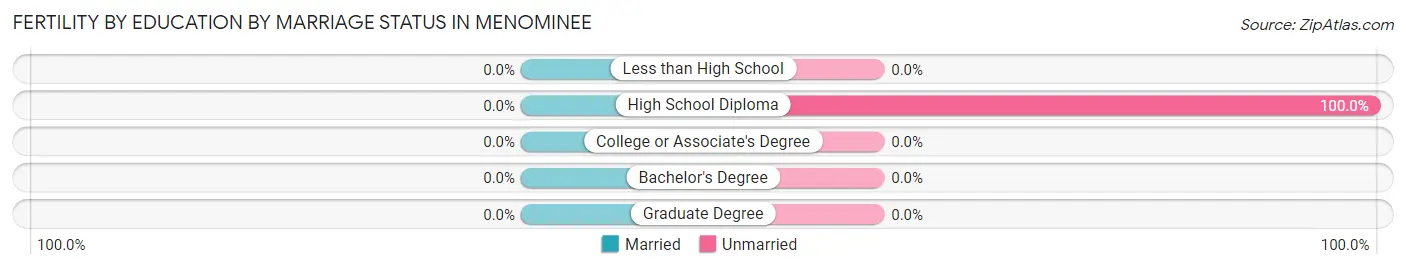
| Educational Attainment | Married | Unmarried |
| Less than High School | 0 (0.0%) | 0 (0.0%) |
| High School Diploma | 0 (0.0%) | 12 (100.0%) |
| College or Associate's Degree | 0 (0.0%) | 0 (0.0%) |
| Bachelor's Degree | 0 (0.0%) | 0 (0.0%) |
| Graduate Degree | 0 (0.0%) | 0 (0.0%) |
| Total | 0 (0.0%) | 12 (100.0%) |
Employment Characteristics in Menominee
Employment by Class of Employer in Menominee
Among the 4,088 employed individuals in Menominee, private company employees (3,259 | 79.7%), local government employees (277 | 6.8%), and self-employed (not incorporated) (165 | 4.0%) make up the most common classes of employment.
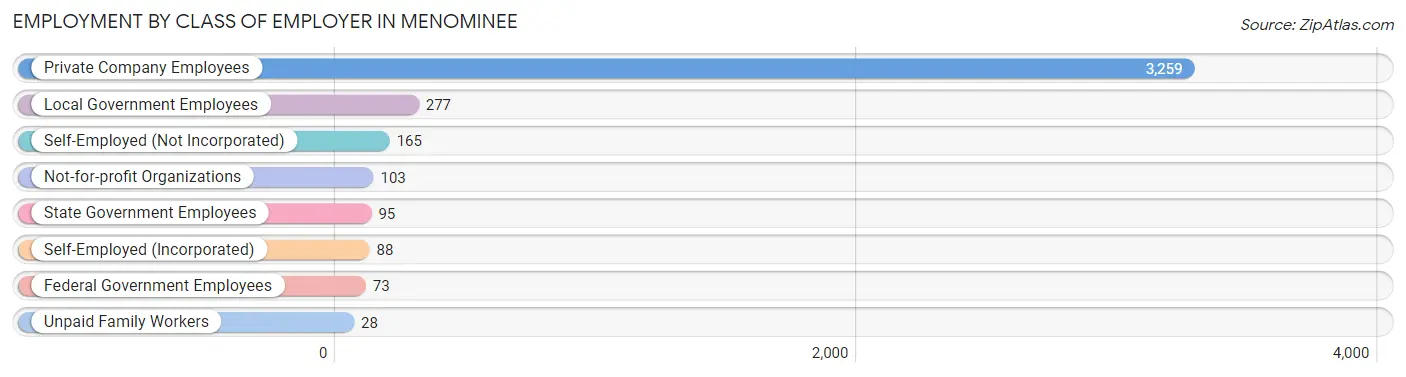
| Employer Class | # Employees | % Employees |
| Private Company Employees | 3,259 | 79.7% |
| Self-Employed (Incorporated) | 88 | 2.1% |
| Self-Employed (Not Incorporated) | 165 | 4.0% |
| Not-for-profit Organizations | 103 | 2.5% |
| Local Government Employees | 277 | 6.8% |
| State Government Employees | 95 | 2.3% |
| Federal Government Employees | 73 | 1.8% |
| Unpaid Family Workers | 28 | 0.7% |
| Total | 4,088 | 100.0% |
Employment Status by Age in Menominee
According to the labor force statistics for Menominee, out of the total population over 16 years of age (7,206), 59.9% or 4,316 individuals are in the labor force, with 4.1% or 177 of them unemployed. The age group with the highest labor force participation rate is 35 to 44 years, with 93.4% or 880 individuals in the labor force. Within the labor force, the 16 to 19 years age range has the highest percentage of unemployed individuals, with 11.6% or 30 of them being unemployed.
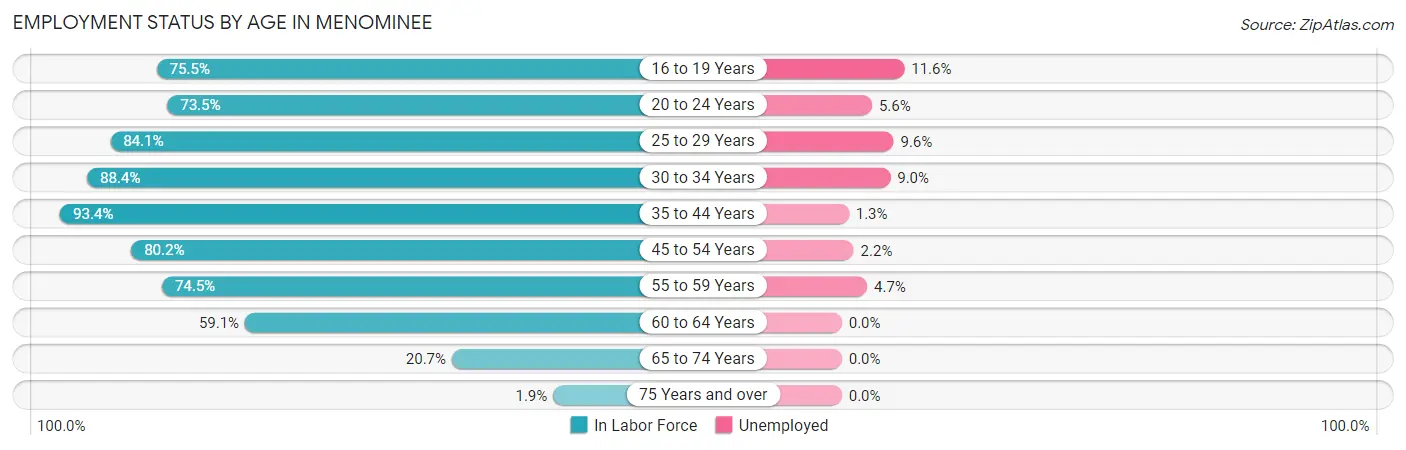
| Age Bracket | In Labor Force | Unemployed |
| 16 to 19 Years | 259 (75.5%) | 30 (11.6%) |
| 20 to 24 Years | 375 (73.5%) | 21 (5.6%) |
| 25 to 29 Years | 354 (84.1%) | 34 (9.6%) |
| 30 to 34 Years | 411 (88.4%) | 37 (9.0%) |
| 35 to 44 Years | 880 (93.4%) | 11 (1.3%) |
| 45 to 54 Years | 776 (80.2%) | 17 (2.2%) |
| 55 to 59 Years | 558 (74.5%) | 26 (4.7%) |
| 60 to 64 Years | 462 (59.1%) | 0 (0.0%) |
| 65 to 74 Years | 223 (20.7%) | 0 (0.0%) |
| 75 Years and over | 18 (1.9%) | 0 (0.0%) |
| Total | 4,316 (59.9%) | 177 (4.1%) |
Employment Status by Educational Attainment in Menominee
According to labor force statistics for Menominee, 79.5% of individuals (3,439) out of the total population between 25 and 64 years of age (4,326) are in the labor force, with 3.6% or 124 of them being unemployed. The group with the highest labor force participation rate are those with the educational attainment of bachelor's degree or higher, with 92.1% or 581 individuals in the labor force. Within the labor force, individuals with college / associate degree education have the highest percentage of unemployment, with 4.8% or 59 of them being unemployed.
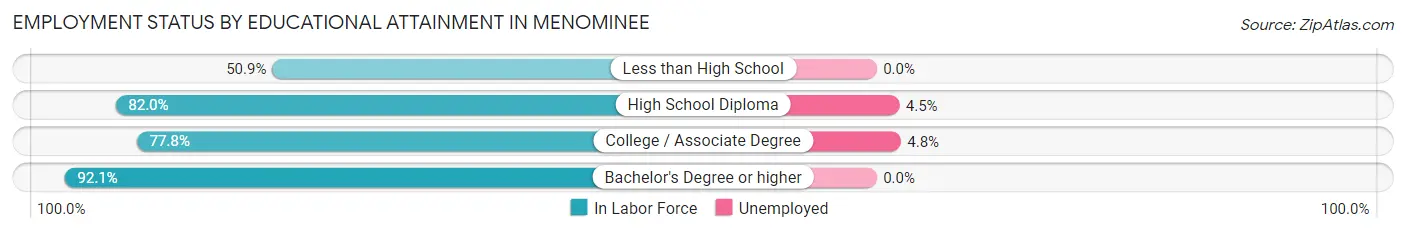
| Educational Attainment | In Labor Force | Unemployed |
| Less than High School | 170 (50.9%) | 0 (0.0%) |
| High School Diploma | 1,458 (82.0%) | 80 (4.5%) |
| College / Associate Degree | 1,232 (77.8%) | 76 (4.8%) |
| Bachelor's Degree or higher | 581 (92.1%) | 0 (0.0%) |
| Total | 3,439 (79.5%) | 156 (3.6%) |
Employment Occupations by Sex in Menominee
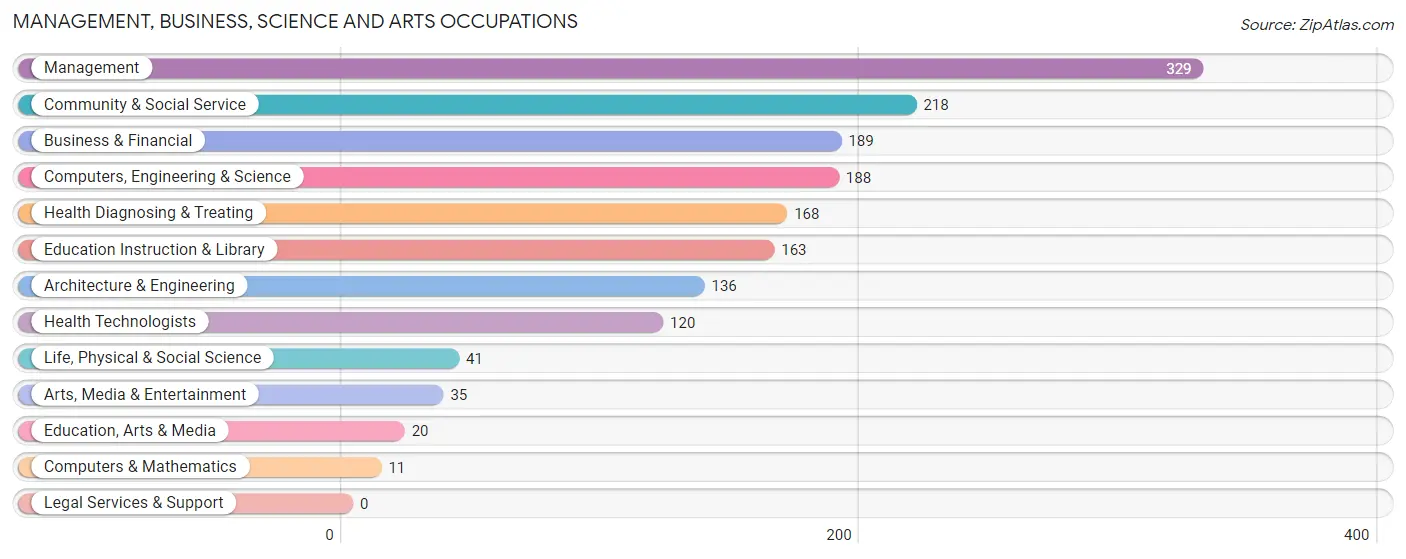
Management, Business, Science and Arts Occupations
The most common Management, Business, Science and Arts occupations in Menominee are Management (329 | 8.0%), Community & Social Service (218 | 5.3%), Business & Financial (189 | 4.6%), Computers, Engineering & Science (188 | 4.5%), and Health Diagnosing & Treating (168 | 4.1%).
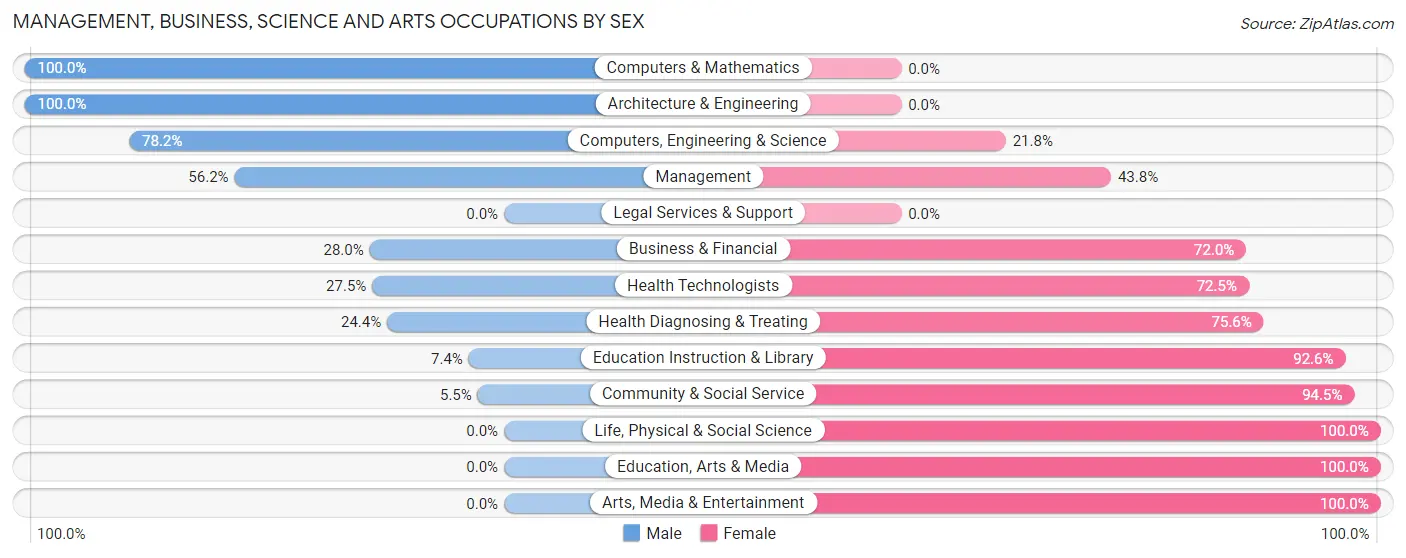
Management, Business, Science and Arts Occupations by Sex
Within the Management, Business, Science and Arts occupations in Menominee, the most male-oriented occupations are Computers & Mathematics (100.0%), Architecture & Engineering (100.0%), and Computers, Engineering & Science (78.2%), while the most female-oriented occupations are Life, Physical & Social Science (100.0%), Education, Arts & Media (100.0%), and Arts, Media & Entertainment (100.0%).
| Occupation | Male | Female |
| Management | 185 (56.2%) | 144 (43.8%) |
| Business & Financial | 53 (28.0%) | 136 (72.0%) |
| Computers, Engineering & Science | 147 (78.2%) | 41 (21.8%) |
| Computers & Mathematics | 11 (100.0%) | 0 (0.0%) |
| Architecture & Engineering | 136 (100.0%) | 0 (0.0%) |
| Life, Physical & Social Science | 0 (0.0%) | 41 (100.0%) |
| Community & Social Service | 12 (5.5%) | 206 (94.5%) |
| Education, Arts & Media | 0 (0.0%) | 20 (100.0%) |
| Legal Services & Support | 0 (0.0%) | 0 (0.0%) |
| Education Instruction & Library | 12 (7.4%) | 151 (92.6%) |
| Arts, Media & Entertainment | 0 (0.0%) | 35 (100.0%) |
| Health Diagnosing & Treating | 41 (24.4%) | 127 (75.6%) |
| Health Technologists | 33 (27.5%) | 87 (72.5%) |
| Total (Category) | 438 (40.1%) | 654 (59.9%) |
| Total (Overall) | 2,117 (51.1%) | 2,022 (48.8%) |
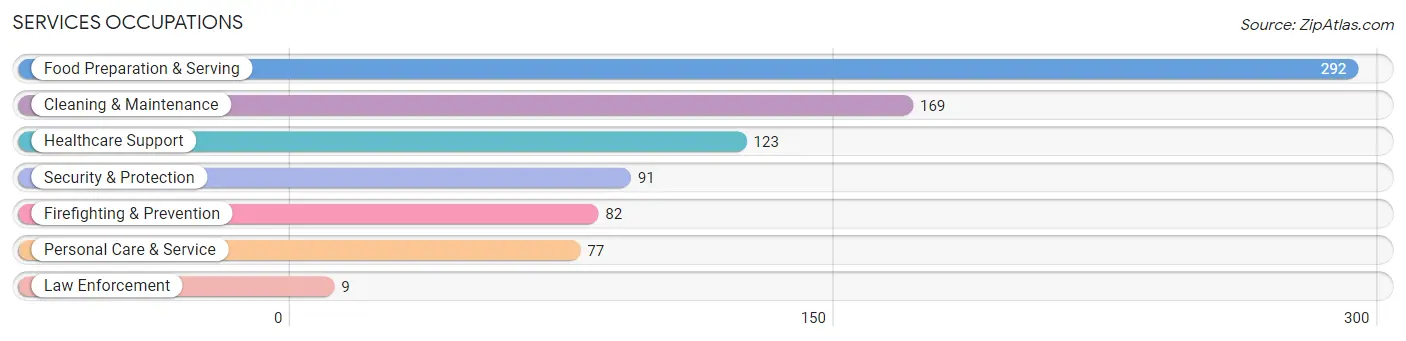
Services Occupations
The most common Services occupations in Menominee are Food Preparation & Serving (292 | 7.0%), Cleaning & Maintenance (169 | 4.1%), Healthcare Support (123 | 3.0%), Security & Protection (91 | 2.2%), and Firefighting & Prevention (82 | 2.0%).
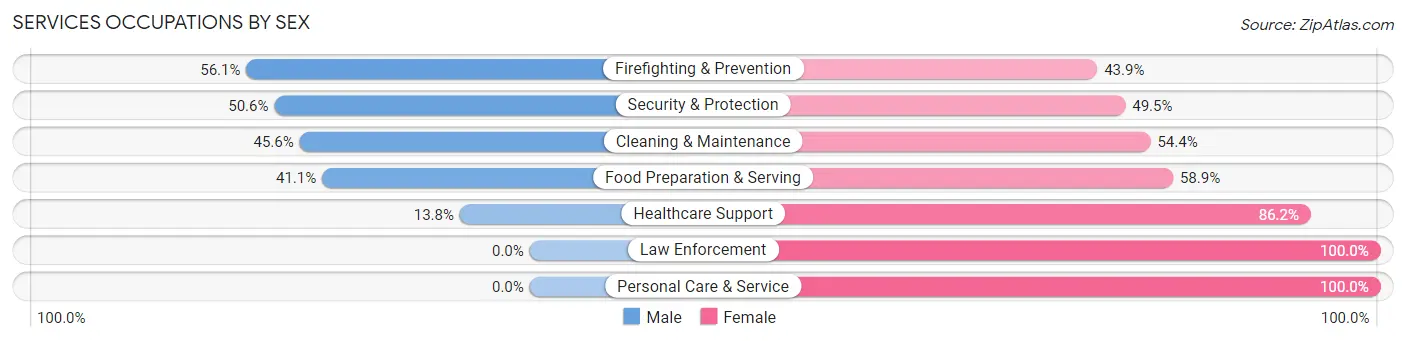
Services Occupations by Sex
Within the Services occupations in Menominee, the most male-oriented occupations are Firefighting & Prevention (56.1%), Security & Protection (50.5%), and Cleaning & Maintenance (45.6%), while the most female-oriented occupations are Law Enforcement (100.0%), Personal Care & Service (100.0%), and Healthcare Support (86.2%).
| Occupation | Male | Female |
| Healthcare Support | 17 (13.8%) | 106 (86.2%) |
| Security & Protection | 46 (50.5%) | 45 (49.4%) |
| Firefighting & Prevention | 46 (56.1%) | 36 (43.9%) |
| Law Enforcement | 0 (0.0%) | 9 (100.0%) |
| Food Preparation & Serving | 120 (41.1%) | 172 (58.9%) |
| Cleaning & Maintenance | 77 (45.6%) | 92 (54.4%) |
| Personal Care & Service | 0 (0.0%) | 77 (100.0%) |
| Total (Category) | 260 (34.6%) | 492 (65.4%) |
| Total (Overall) | 2,117 (51.1%) | 2,022 (48.8%) |
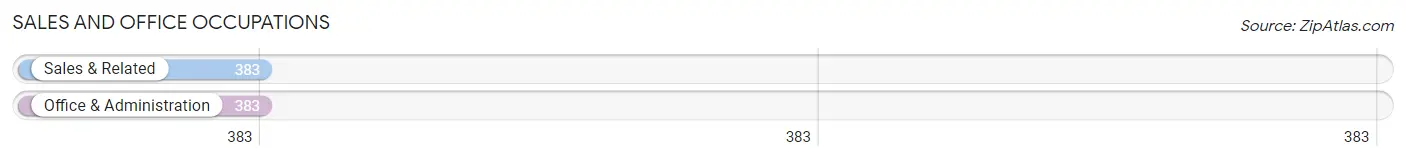
Sales and Office Occupations
The most common Sales and Office occupations in Menominee are Sales & Related (383 | 9.2%), and Office & Administration (383 | 9.2%).
Sales and Office Occupations by Sex
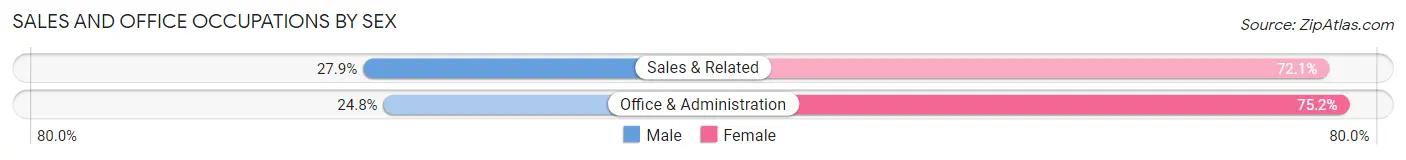
| Occupation | Male | Female |
| Sales & Related | 107 (27.9%) | 276 (72.1%) |
| Office & Administration | 95 (24.8%) | 288 (75.2%) |
| Total (Category) | 202 (26.4%) | 564 (73.6%) |
| Total (Overall) | 2,117 (51.1%) | 2,022 (48.8%) |
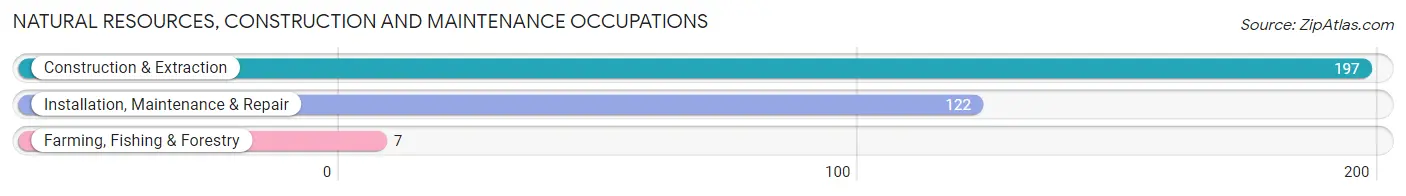
Natural Resources, Construction and Maintenance Occupations
The most common Natural Resources, Construction and Maintenance occupations in Menominee are Construction & Extraction (197 | 4.8%), Installation, Maintenance & Repair (122 | 2.9%), and Farming, Fishing & Forestry (7 | 0.2%).
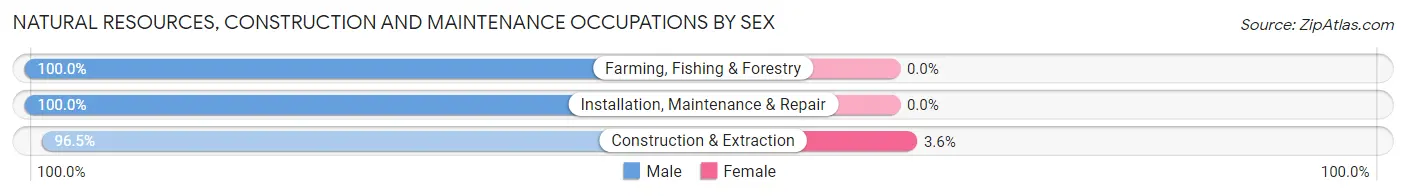
Natural Resources, Construction and Maintenance Occupations by Sex
| Occupation | Male | Female |
| Farming, Fishing & Forestry | 7 (100.0%) | 0 (0.0%) |
| Construction & Extraction | 190 (96.5%) | 7 (3.5%) |
| Installation, Maintenance & Repair | 122 (100.0%) | 0 (0.0%) |
| Total (Category) | 319 (97.9%) | 7 (2.1%) |
| Total (Overall) | 2,117 (51.1%) | 2,022 (48.8%) |
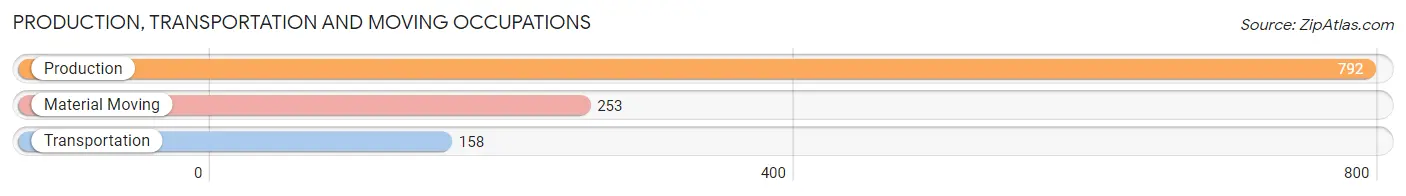
Production, Transportation and Moving Occupations
The most common Production, Transportation and Moving occupations in Menominee are Production (792 | 19.1%), Material Moving (253 | 6.1%), and Transportation (158 | 3.8%).
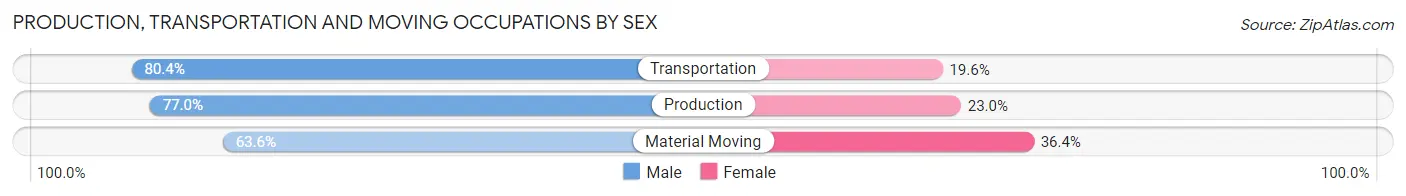
Production, Transportation and Moving Occupations by Sex
| Occupation | Male | Female |
| Production | 610 (77.0%) | 182 (23.0%) |
| Transportation | 127 (80.4%) | 31 (19.6%) |
| Material Moving | 161 (63.6%) | 92 (36.4%) |
| Total (Category) | 898 (74.7%) | 305 (25.4%) |
| Total (Overall) | 2,117 (51.1%) | 2,022 (48.8%) |
Employment Industries by Sex in Menominee
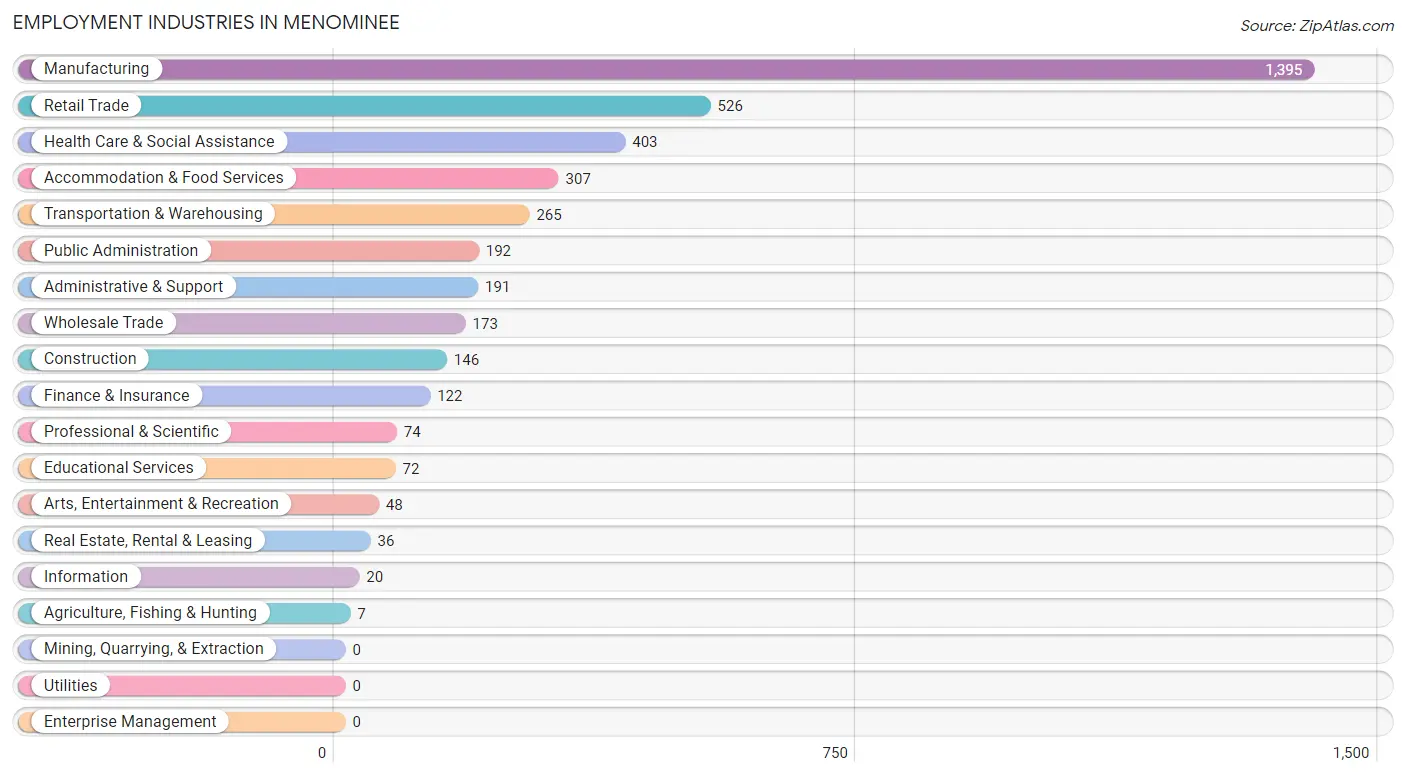
Employment Industries in Menominee
The major employment industries in Menominee include Manufacturing (1,395 | 33.7%), Retail Trade (526 | 12.7%), Health Care & Social Assistance (403 | 9.7%), Accommodation & Food Services (307 | 7.4%), and Transportation & Warehousing (265 | 6.4%).
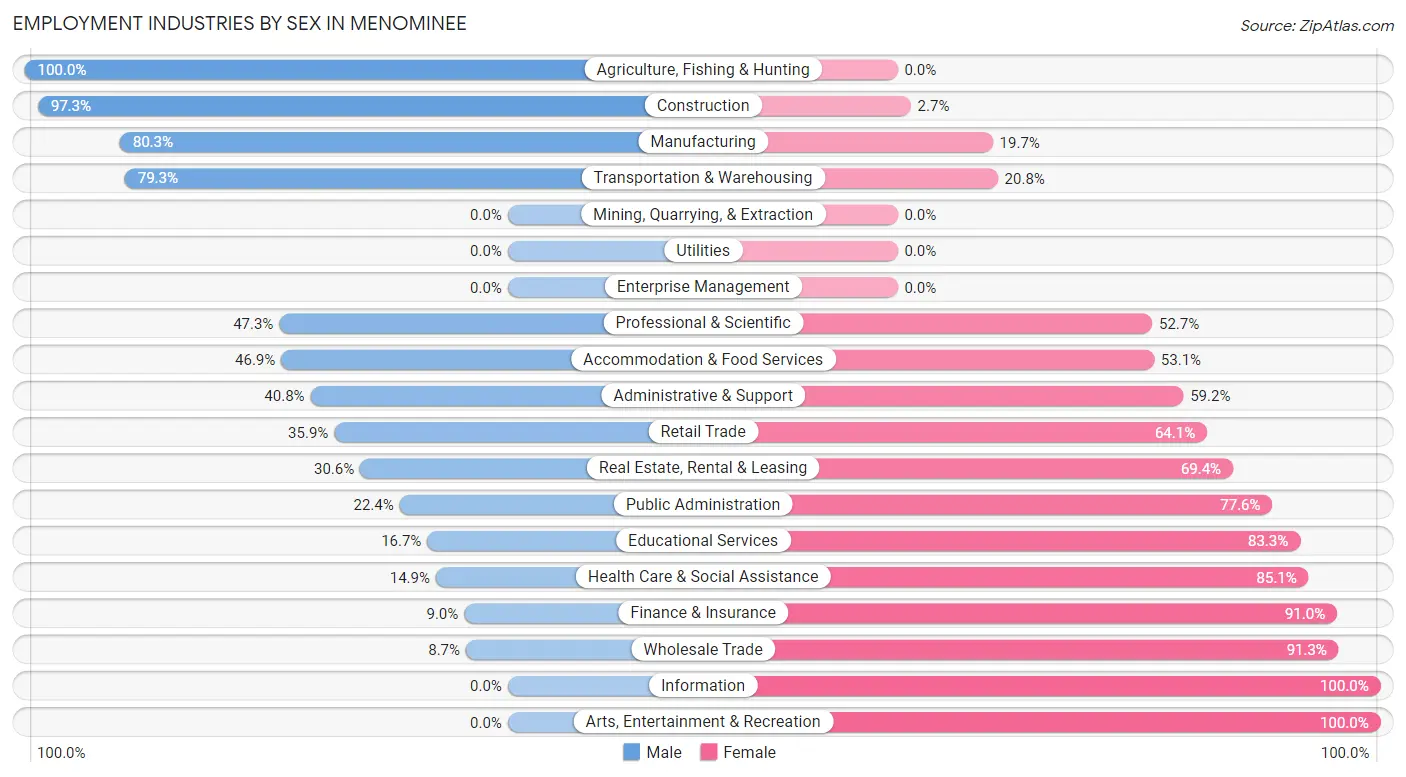
Employment Industries by Sex in Menominee
The Menominee industries that see more men than women are Agriculture, Fishing & Hunting (100.0%), Construction (97.3%), and Manufacturing (80.3%), whereas the industries that tend to have a higher number of women are Information (100.0%), Arts, Entertainment & Recreation (100.0%), and Wholesale Trade (91.3%).
| Industry | Male | Female |
| Agriculture, Fishing & Hunting | 7 (100.0%) | 0 (0.0%) |
| Mining, Quarrying, & Extraction | 0 (0.0%) | 0 (0.0%) |
| Construction | 142 (97.3%) | 4 (2.7%) |
| Manufacturing | 1,120 (80.3%) | 275 (19.7%) |
| Wholesale Trade | 15 (8.7%) | 158 (91.3%) |
| Retail Trade | 189 (35.9%) | 337 (64.1%) |
| Transportation & Warehousing | 210 (79.2%) | 55 (20.7%) |
| Utilities | 0 (0.0%) | 0 (0.0%) |
| Information | 0 (0.0%) | 20 (100.0%) |
| Finance & Insurance | 11 (9.0%) | 111 (91.0%) |
| Real Estate, Rental & Leasing | 11 (30.6%) | 25 (69.4%) |
| Professional & Scientific | 35 (47.3%) | 39 (52.7%) |
| Enterprise Management | 0 (0.0%) | 0 (0.0%) |
| Administrative & Support | 78 (40.8%) | 113 (59.2%) |
| Educational Services | 12 (16.7%) | 60 (83.3%) |
| Health Care & Social Assistance | 60 (14.9%) | 343 (85.1%) |
| Arts, Entertainment & Recreation | 0 (0.0%) | 48 (100.0%) |
| Accommodation & Food Services | 144 (46.9%) | 163 (53.1%) |
| Public Administration | 43 (22.4%) | 149 (77.6%) |
| Total | 2,117 (51.1%) | 2,022 (48.8%) |
Education in Menominee
School Enrollment in Menominee
The most common levels of schooling among the 1,557 students in Menominee are high school (471 | 30.2%), middle school (468 | 30.1%), and elementary school (306 | 19.7%).
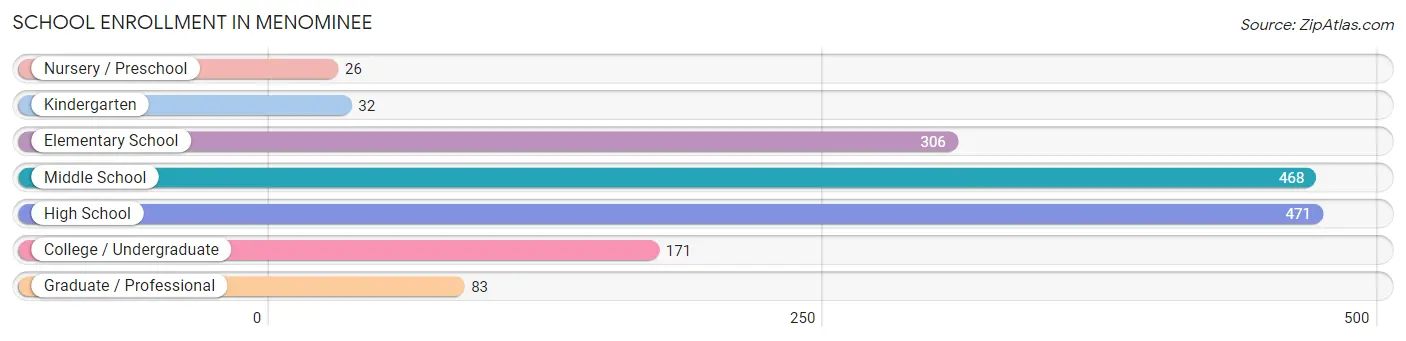
| School Level | # Students | % Students |
| Nursery / Preschool | 26 | 1.7% |
| Kindergarten | 32 | 2.1% |
| Elementary School | 306 | 19.7% |
| Middle School | 468 | 30.1% |
| High School | 471 | 30.2% |
| College / Undergraduate | 171 | 11.0% |
| Graduate / Professional | 83 | 5.3% |
| Total | 1,557 | 100.0% |
School Enrollment by Age by Funding Source in Menominee
Out of a total of 1,557 students who are enrolled in schools in Menominee, 226 (14.5%) attend a private institution, while the remaining 1,331 (85.5%) are enrolled in public schools. The age group of 35 years and over has the highest likelihood of being enrolled in private schools, with 53 (50.5% in the age bracket) enrolled. Conversely, the age group of 3 to 4 year olds has the lowest likelihood of being enrolled in a private school, with 17 (100.0% in the age bracket) attending a public institution.
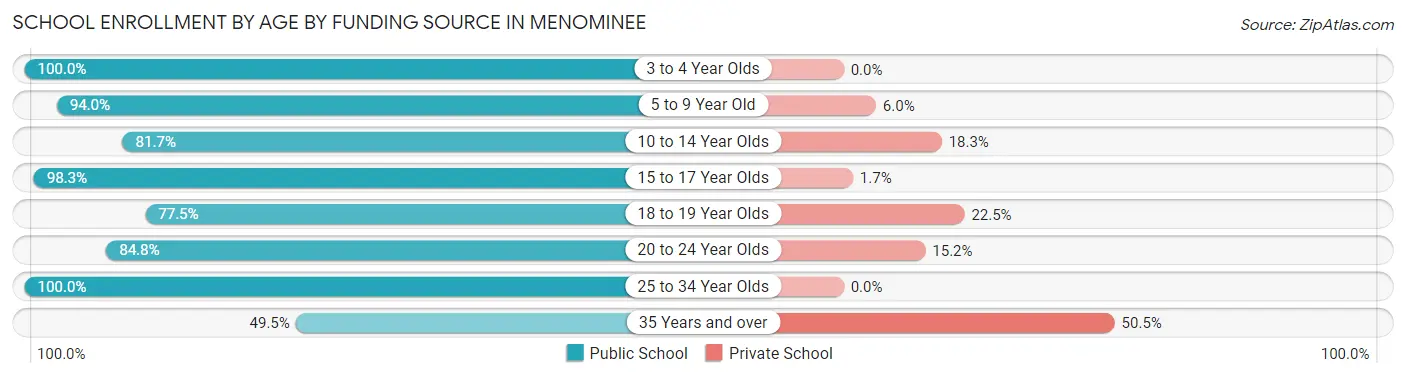
| Age Bracket | Public School | Private School |
| 3 to 4 Year Olds | 17 (100.0%) | 0 (0.0%) |
| 5 to 9 Year Old | 282 (94.0%) | 18 (6.0%) |
| 10 to 14 Year Olds | 461 (81.7%) | 103 (18.3%) |
| 15 to 17 Year Olds | 228 (98.3%) | 4 (1.7%) |
| 18 to 19 Year Olds | 93 (77.5%) | 27 (22.5%) |
| 20 to 24 Year Olds | 117 (84.8%) | 21 (15.2%) |
| 25 to 34 Year Olds | 81 (100.0%) | 0 (0.0%) |
| 35 Years and over | 52 (49.5%) | 53 (50.5%) |
| Total | 1,331 (85.5%) | 226 (14.5%) |
Educational Attainment by Field of Study in Menominee
Business (185 | 18.3%), education (163 | 16.1%), engineering (122 | 12.1%), visual & performing arts (91 | 9.0%), and science & technology (87 | 8.6%) are the most common fields of study among 1,011 individuals in Menominee who have obtained a bachelor's degree or higher.
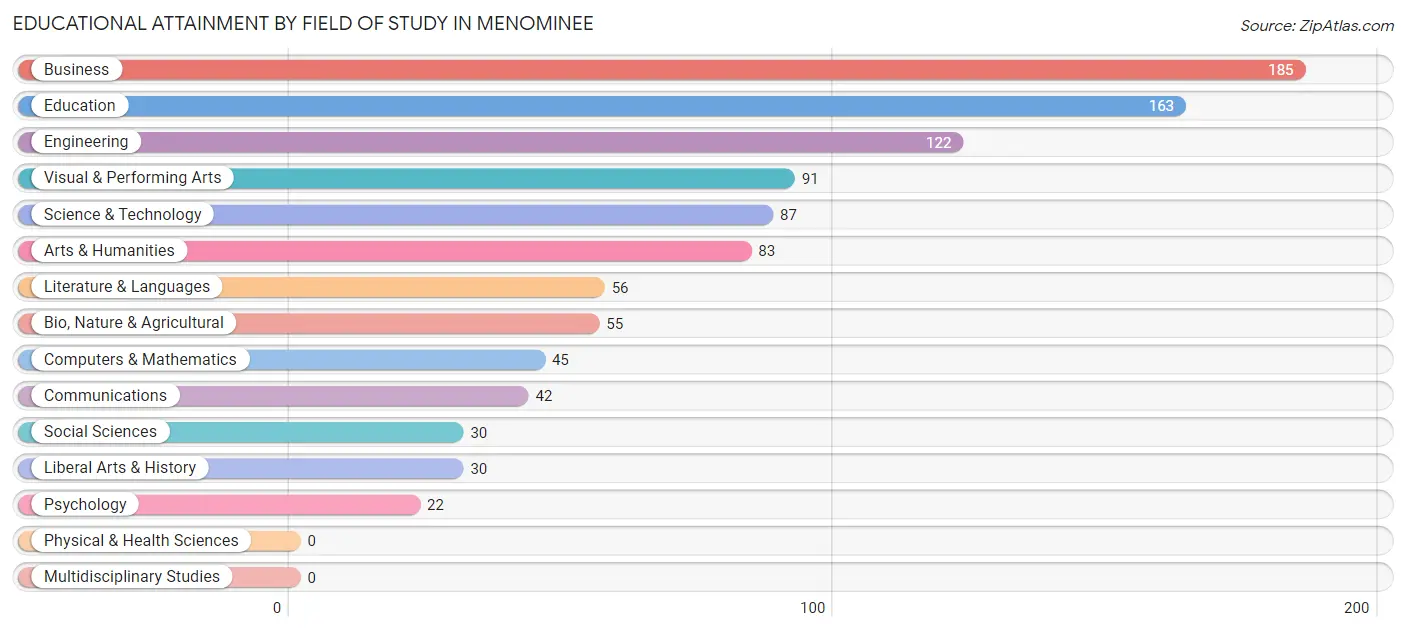
| Field of Study | # Graduates | % Graduates |
| Computers & Mathematics | 45 | 4.4% |
| Bio, Nature & Agricultural | 55 | 5.4% |
| Physical & Health Sciences | 0 | 0.0% |
| Psychology | 22 | 2.2% |
| Social Sciences | 30 | 3.0% |
| Engineering | 122 | 12.1% |
| Multidisciplinary Studies | 0 | 0.0% |
| Science & Technology | 87 | 8.6% |
| Business | 185 | 18.3% |
| Education | 163 | 16.1% |
| Literature & Languages | 56 | 5.5% |
| Liberal Arts & History | 30 | 3.0% |
| Visual & Performing Arts | 91 | 9.0% |
| Communications | 42 | 4.2% |
| Arts & Humanities | 83 | 8.2% |
| Total | 1,011 | 100.0% |
Transportation & Commute in Menominee
Vehicle Availability by Sex in Menominee
The most prevalent vehicle ownership categories in Menominee are males with 2 vehicles (752, accounting for 35.7%) and females with 2 vehicles (787, making up 38.0%).
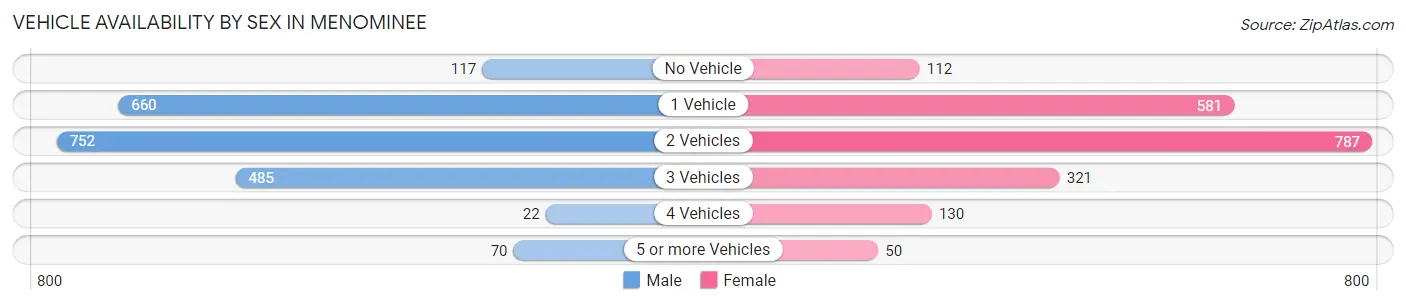
| Vehicles Available | Male | Female |
| No Vehicle | 117 (5.6%) | 112 (5.7%) |
| 1 Vehicle | 660 (31.3%) | 581 (29.3%) |
| 2 Vehicles | 752 (35.7%) | 787 (39.7%) |
| 3 Vehicles | 485 (23.0%) | 321 (16.2%) |
| 4 Vehicles | 22 (1.0%) | 130 (6.6%) |
| 5 or more Vehicles | 70 (3.3%) | 50 (2.5%) |
| Total | 2,106 (100.0%) | 1,981 (100.0%) |
Commute Time in Menominee
The most frequently occuring commute durations in Menominee are 5 to 9 minutes (1,199 commuters, 30.8%), 10 to 14 minutes (901 commuters, 23.2%), and 15 to 19 minutes (606 commuters, 15.6%).
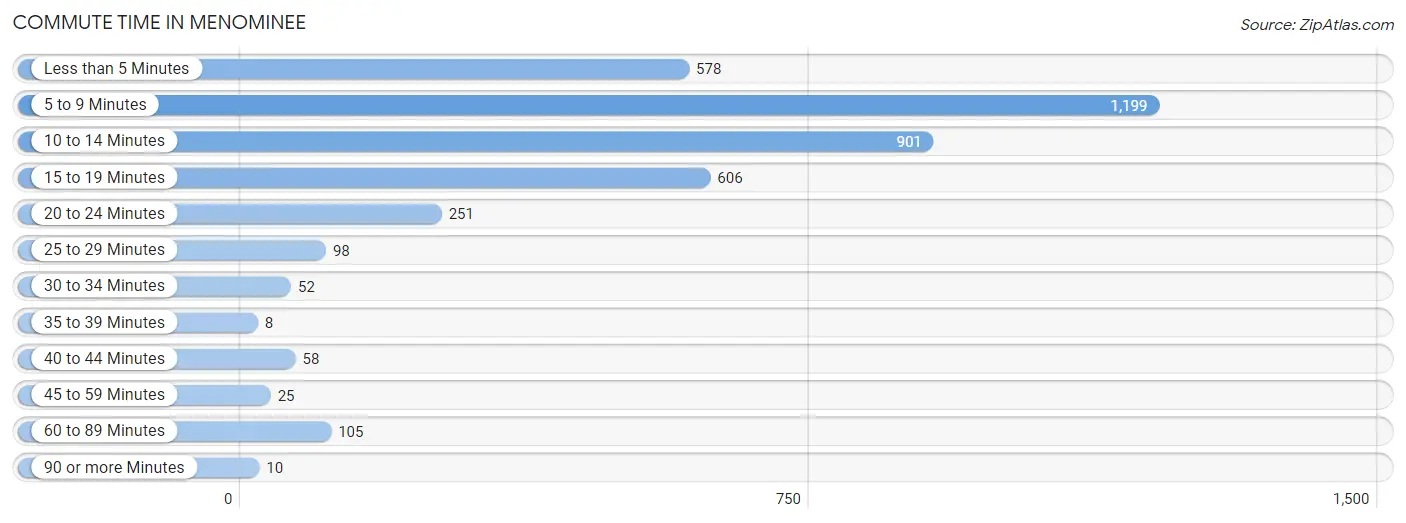
| Commute Time | # Commuters | % Commuters |
| Less than 5 Minutes | 578 | 14.8% |
| 5 to 9 Minutes | 1,199 | 30.8% |
| 10 to 14 Minutes | 901 | 23.2% |
| 15 to 19 Minutes | 606 | 15.6% |
| 20 to 24 Minutes | 251 | 6.5% |
| 25 to 29 Minutes | 98 | 2.5% |
| 30 to 34 Minutes | 52 | 1.3% |
| 35 to 39 Minutes | 8 | 0.2% |
| 40 to 44 Minutes | 58 | 1.5% |
| 45 to 59 Minutes | 25 | 0.6% |
| 60 to 89 Minutes | 105 | 2.7% |
| 90 or more Minutes | 10 | 0.3% |
Commute Time by Sex in Menominee
The most common commute times in Menominee are 5 to 9 minutes (556 commuters, 27.2%) for males and 5 to 9 minutes (643 commuters, 34.9%) for females.
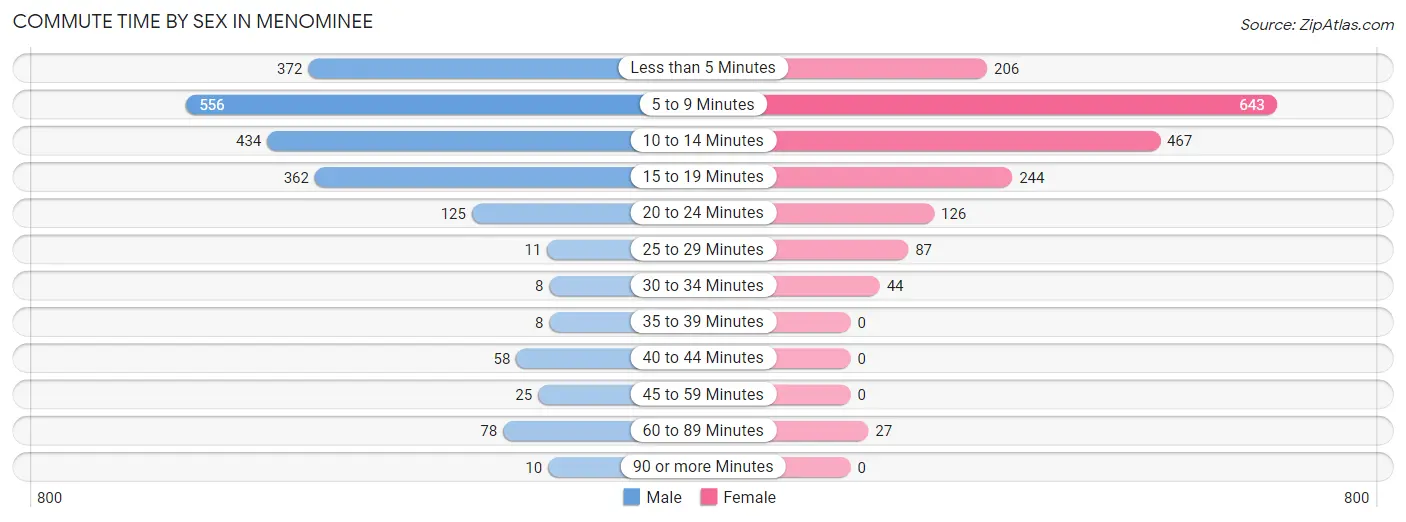
| Commute Time | Male | Female |
| Less than 5 Minutes | 372 (18.2%) | 206 (11.2%) |
| 5 to 9 Minutes | 556 (27.2%) | 643 (34.9%) |
| 10 to 14 Minutes | 434 (21.2%) | 467 (25.3%) |
| 15 to 19 Minutes | 362 (17.7%) | 244 (13.2%) |
| 20 to 24 Minutes | 125 (6.1%) | 126 (6.8%) |
| 25 to 29 Minutes | 11 (0.5%) | 87 (4.7%) |
| 30 to 34 Minutes | 8 (0.4%) | 44 (2.4%) |
| 35 to 39 Minutes | 8 (0.4%) | 0 (0.0%) |
| 40 to 44 Minutes | 58 (2.8%) | 0 (0.0%) |
| 45 to 59 Minutes | 25 (1.2%) | 0 (0.0%) |
| 60 to 89 Minutes | 78 (3.8%) | 27 (1.5%) |
| 90 or more Minutes | 10 (0.5%) | 0 (0.0%) |
Time of Departure to Work by Sex in Menominee
The most frequent times of departure to work in Menominee are 6:30 AM to 6:59 AM (354, 17.3%) for males and 12:00 PM to 3:59 PM (286, 15.5%) for females.
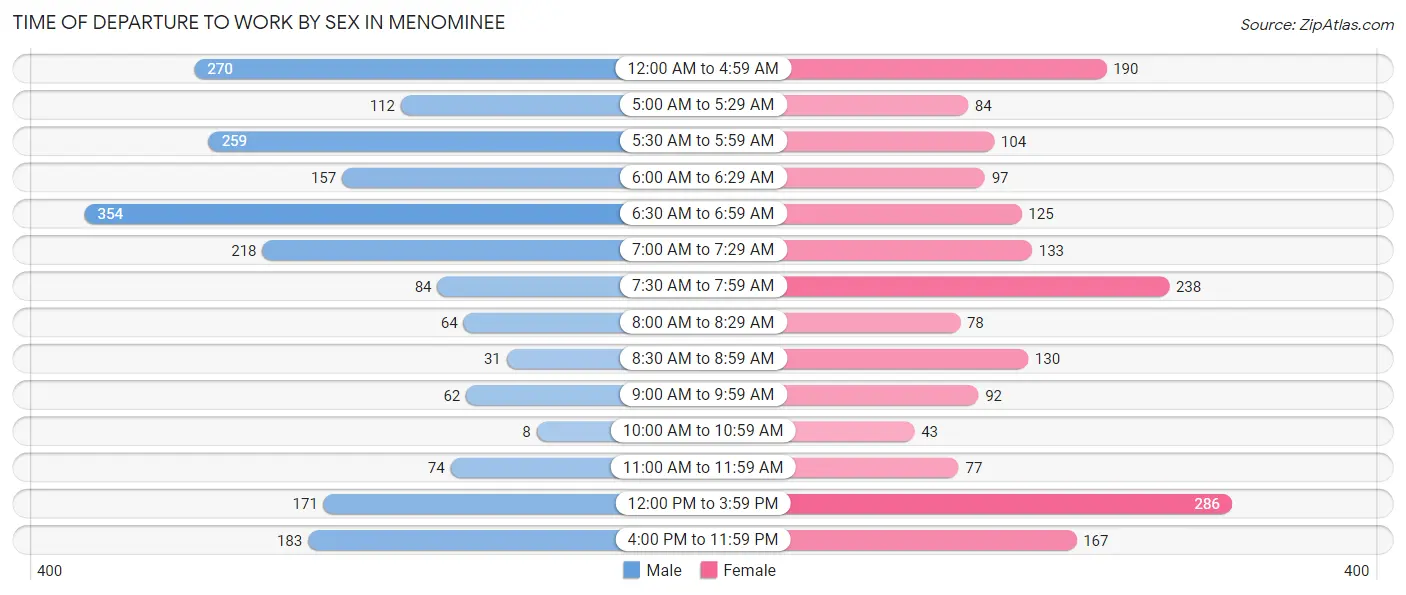
| Time of Departure | Male | Female |
| 12:00 AM to 4:59 AM | 270 (13.2%) | 190 (10.3%) |
| 5:00 AM to 5:29 AM | 112 (5.5%) | 84 (4.6%) |
| 5:30 AM to 5:59 AM | 259 (12.7%) | 104 (5.6%) |
| 6:00 AM to 6:29 AM | 157 (7.7%) | 97 (5.3%) |
| 6:30 AM to 6:59 AM | 354 (17.3%) | 125 (6.8%) |
| 7:00 AM to 7:29 AM | 218 (10.6%) | 133 (7.2%) |
| 7:30 AM to 7:59 AM | 84 (4.1%) | 238 (12.9%) |
| 8:00 AM to 8:29 AM | 64 (3.1%) | 78 (4.2%) |
| 8:30 AM to 8:59 AM | 31 (1.5%) | 130 (7.0%) |
| 9:00 AM to 9:59 AM | 62 (3.0%) | 92 (5.0%) |
| 10:00 AM to 10:59 AM | 8 (0.4%) | 43 (2.3%) |
| 11:00 AM to 11:59 AM | 74 (3.6%) | 77 (4.2%) |
| 12:00 PM to 3:59 PM | 171 (8.4%) | 286 (15.5%) |
| 4:00 PM to 11:59 PM | 183 (8.9%) | 167 (9.1%) |
| Total | 2,047 (100.0%) | 1,844 (100.0%) |
Housing Occupancy in Menominee
Occupancy by Ownership in Menominee
Of the total 3,841 dwellings in Menominee, owner-occupied units account for 2,609 (67.9%), while renter-occupied units make up 1,232 (32.1%).
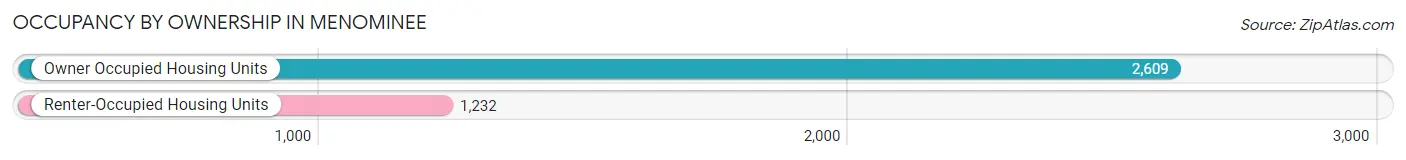
| Occupancy | # Housing Units | % Housing Units |
| Owner Occupied Housing Units | 2,609 | 67.9% |
| Renter-Occupied Housing Units | 1,232 | 32.1% |
| Total Occupied Housing Units | 3,841 | 100.0% |
Occupancy by Household Size in Menominee
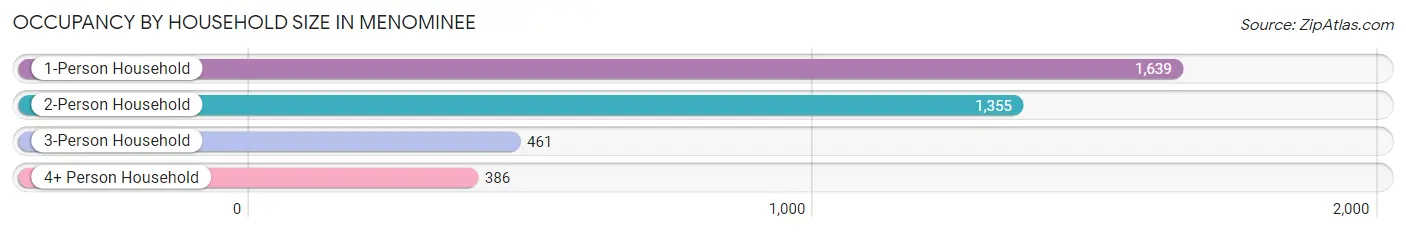
| Household Size | # Housing Units | % Housing Units |
| 1-Person Household | 1,639 | 42.7% |
| 2-Person Household | 1,355 | 35.3% |
| 3-Person Household | 461 | 12.0% |
| 4+ Person Household | 386 | 10.1% |
| Total Housing Units | 3,841 | 100.0% |
Occupancy by Ownership by Household Size in Menominee
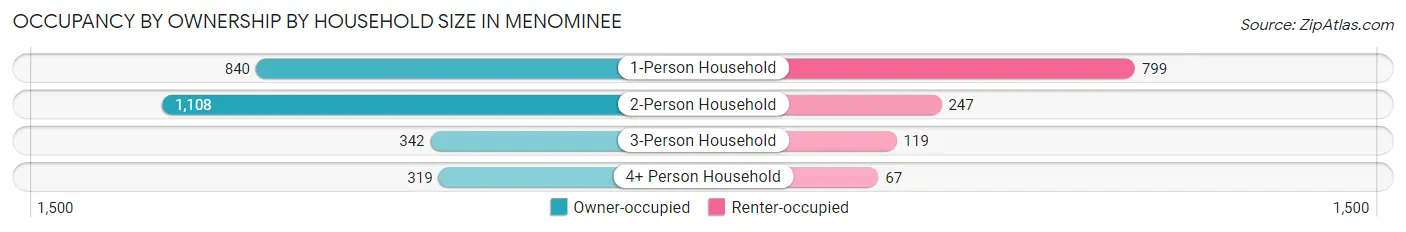
| Household Size | Owner-occupied | Renter-occupied |
| 1-Person Household | 840 (51.2%) | 799 (48.7%) |
| 2-Person Household | 1,108 (81.8%) | 247 (18.2%) |
| 3-Person Household | 342 (74.2%) | 119 (25.8%) |
| 4+ Person Household | 319 (82.6%) | 67 (17.4%) |
| Total Housing Units | 2,609 (67.9%) | 1,232 (32.1%) |
Occupancy by Educational Attainment in Menominee
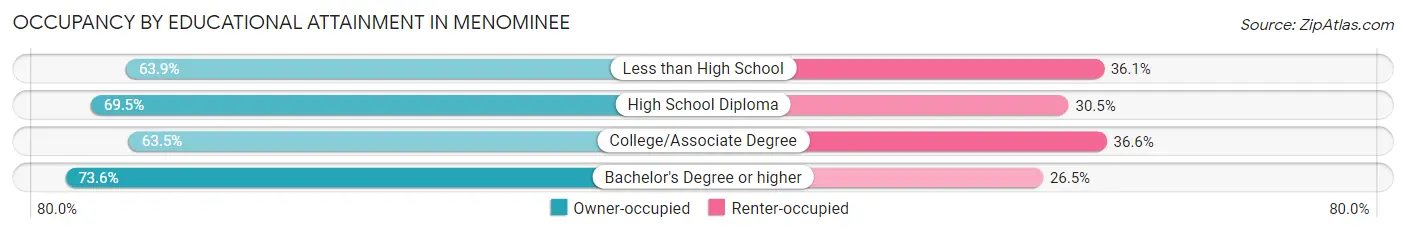
| Household Size | Owner-occupied | Renter-occupied |
| Less than High School | 85 (63.9%) | 48 (36.1%) |
| High School Diploma | 1,291 (69.5%) | 567 (30.5%) |
| College/Associate Degree | 802 (63.4%) | 462 (36.5%) |
| Bachelor's Degree or higher | 431 (73.6%) | 155 (26.5%) |
Occupancy by Age of Householder in Menominee
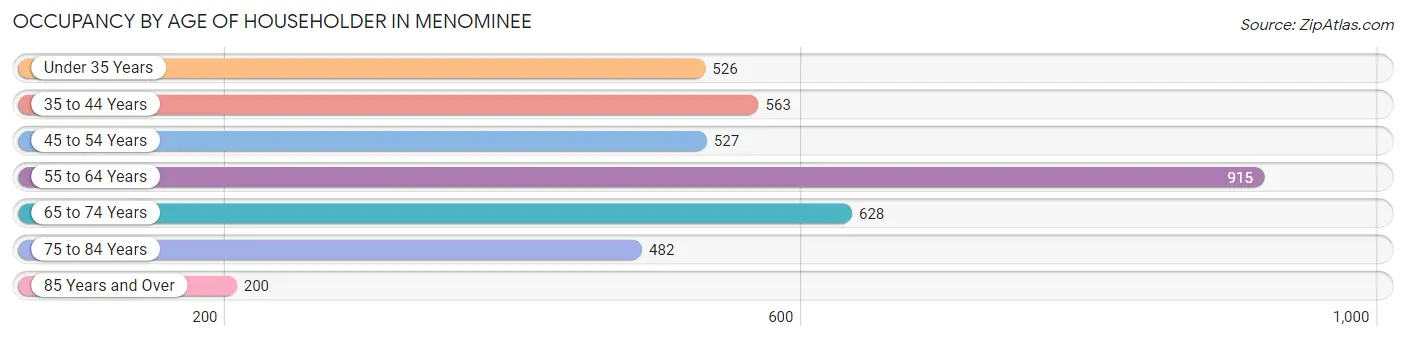
| Age Bracket | # Households | % Households |
| Under 35 Years | 526 | 13.7% |
| 35 to 44 Years | 563 | 14.7% |
| 45 to 54 Years | 527 | 13.7% |
| 55 to 64 Years | 915 | 23.8% |
| 65 to 74 Years | 628 | 16.4% |
| 75 to 84 Years | 482 | 12.6% |
| 85 Years and Over | 200 | 5.2% |
| Total | 3,841 | 100.0% |
Housing Finances in Menominee
Median Income by Occupancy in Menominee
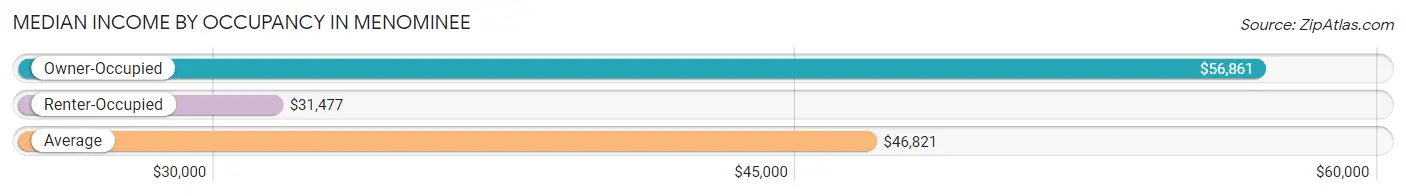
| Occupancy Type | # Households | Median Income |
| Owner-Occupied | 2,609 (67.9%) | $56,861 |
| Renter-Occupied | 1,232 (32.1%) | $31,477 |
| Average | 3,841 (100.0%) | $46,821 |
Occupancy by Householder Income Bracket in Menominee
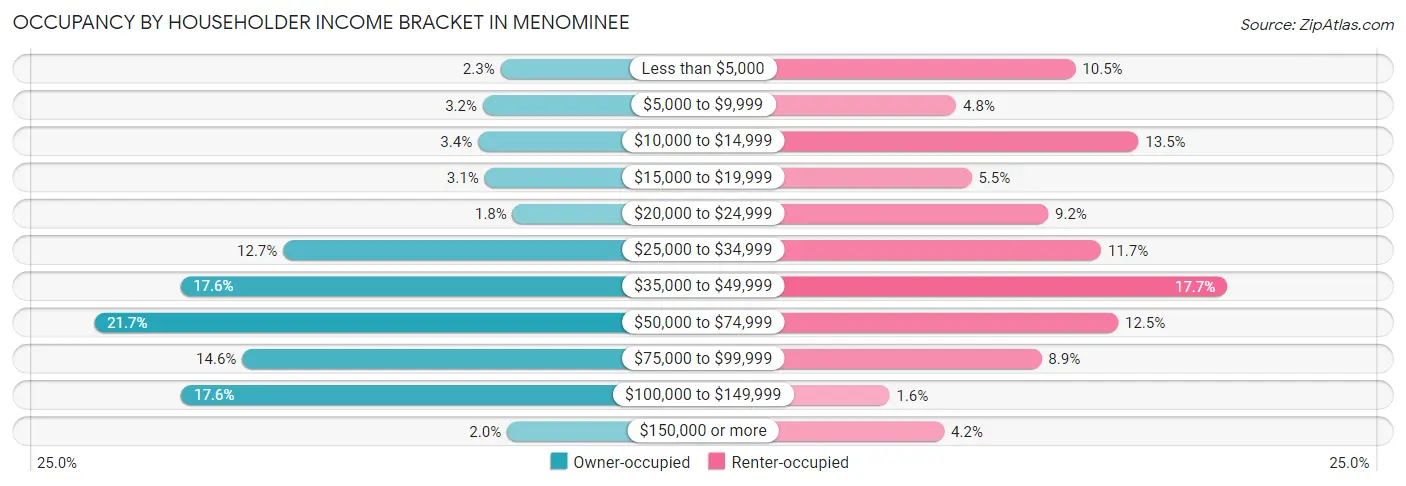
| Income Bracket | Owner-occupied | Renter-occupied |
| Less than $5,000 | 61 (2.3%) | 129 (10.5%) |
| $5,000 to $9,999 | 83 (3.2%) | 59 (4.8%) |
| $10,000 to $14,999 | 89 (3.4%) | 166 (13.5%) |
| $15,000 to $19,999 | 81 (3.1%) | 68 (5.5%) |
| $20,000 to $24,999 | 46 (1.8%) | 113 (9.2%) |
| $25,000 to $34,999 | 331 (12.7%) | 144 (11.7%) |
| $35,000 to $49,999 | 459 (17.6%) | 218 (17.7%) |
| $50,000 to $74,999 | 566 (21.7%) | 154 (12.5%) |
| $75,000 to $99,999 | 382 (14.6%) | 109 (8.8%) |
| $100,000 to $149,999 | 458 (17.5%) | 20 (1.6%) |
| $150,000 or more | 53 (2.0%) | 52 (4.2%) |
| Total | 2,609 (100.0%) | 1,232 (100.0%) |
Monthly Housing Cost Tiers in Menominee
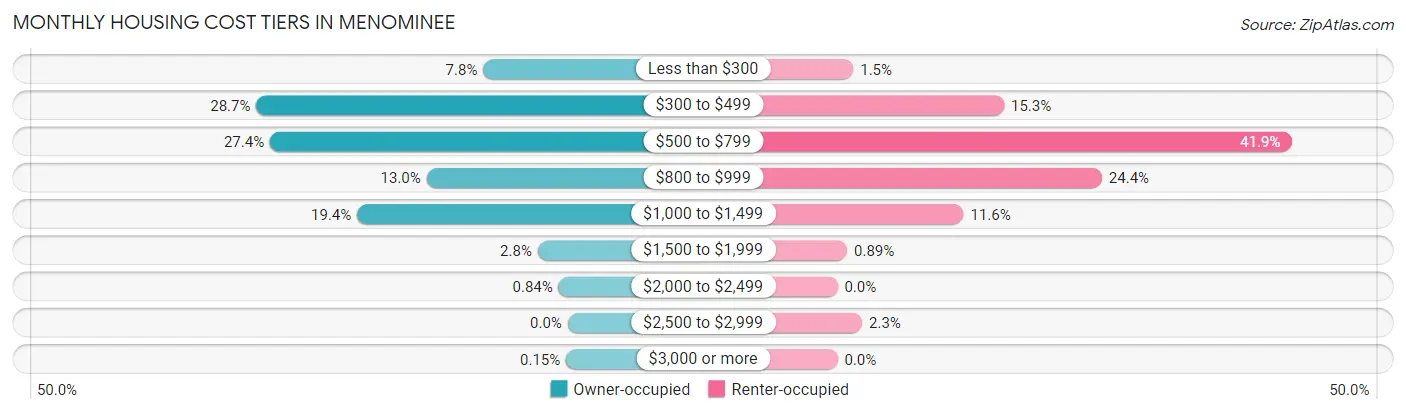
| Monthly Cost | Owner-occupied | Renter-occupied |
| Less than $300 | 203 (7.8%) | 18 (1.5%) |
| $300 to $499 | 748 (28.7%) | 189 (15.3%) |
| $500 to $799 | 715 (27.4%) | 516 (41.9%) |
| $800 to $999 | 339 (13.0%) | 300 (24.3%) |
| $1,000 to $1,499 | 506 (19.4%) | 143 (11.6%) |
| $1,500 to $1,999 | 72 (2.8%) | 11 (0.9%) |
| $2,000 to $2,499 | 22 (0.8%) | 0 (0.0%) |
| $2,500 to $2,999 | 0 (0.0%) | 28 (2.3%) |
| $3,000 or more | 4 (0.2%) | 0 (0.0%) |
| Total | 2,609 (100.0%) | 1,232 (100.0%) |
Physical Housing Characteristics in Menominee
Housing Structures in Menominee
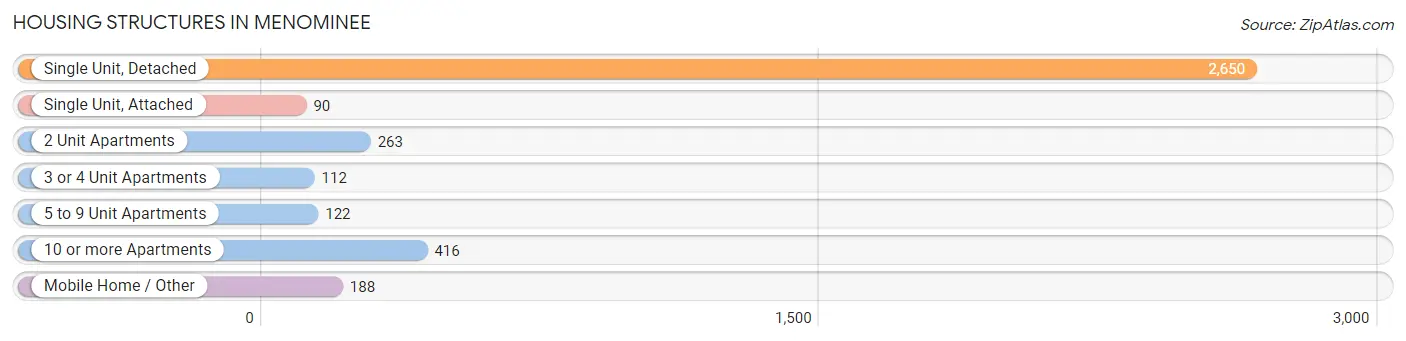
| Structure Type | # Housing Units | % Housing Units |
| Single Unit, Detached | 2,650 | 69.0% |
| Single Unit, Attached | 90 | 2.3% |
| 2 Unit Apartments | 263 | 6.9% |
| 3 or 4 Unit Apartments | 112 | 2.9% |
| 5 to 9 Unit Apartments | 122 | 3.2% |
| 10 or more Apartments | 416 | 10.8% |
| Mobile Home / Other | 188 | 4.9% |
| Total | 3,841 | 100.0% |
Housing Structures by Occupancy in Menominee
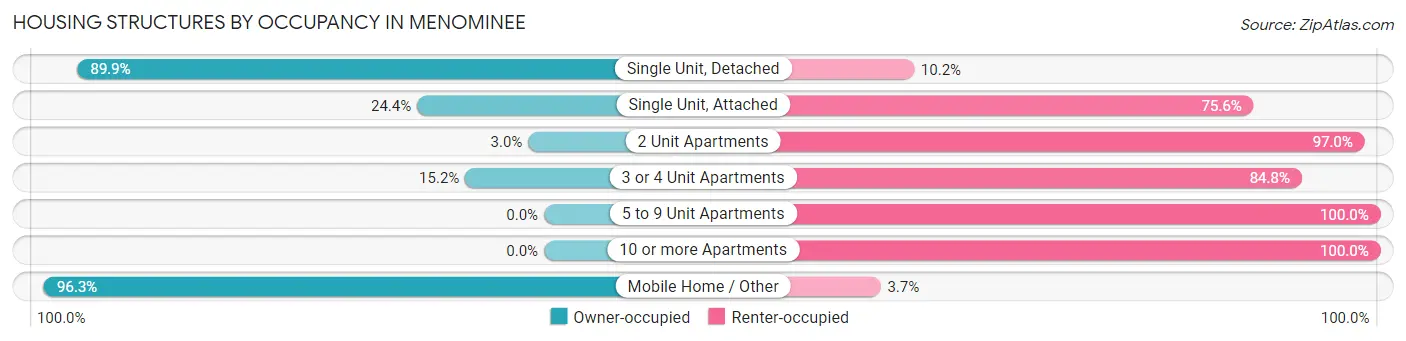
| Structure Type | Owner-occupied | Renter-occupied |
| Single Unit, Detached | 2,381 (89.8%) | 269 (10.2%) |
| Single Unit, Attached | 22 (24.4%) | 68 (75.6%) |
| 2 Unit Apartments | 8 (3.0%) | 255 (97.0%) |
| 3 or 4 Unit Apartments | 17 (15.2%) | 95 (84.8%) |
| 5 to 9 Unit Apartments | 0 (0.0%) | 122 (100.0%) |
| 10 or more Apartments | 0 (0.0%) | 416 (100.0%) |
| Mobile Home / Other | 181 (96.3%) | 7 (3.7%) |
| Total | 2,609 (67.9%) | 1,232 (32.1%) |
Housing Structures by Number of Rooms in Menominee
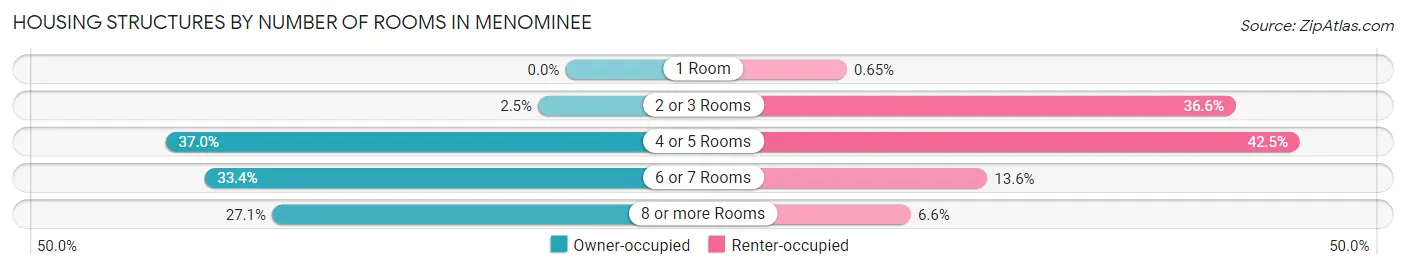
| Number of Rooms | Owner-occupied | Renter-occupied |
| 1 Room | 0 (0.0%) | 8 (0.6%) |
| 2 or 3 Rooms | 66 (2.5%) | 451 (36.6%) |
| 4 or 5 Rooms | 964 (36.9%) | 524 (42.5%) |
| 6 or 7 Rooms | 871 (33.4%) | 168 (13.6%) |
| 8 or more Rooms | 708 (27.1%) | 81 (6.6%) |
| Total | 2,609 (100.0%) | 1,232 (100.0%) |
Housing Structure by Heating Type in Menominee
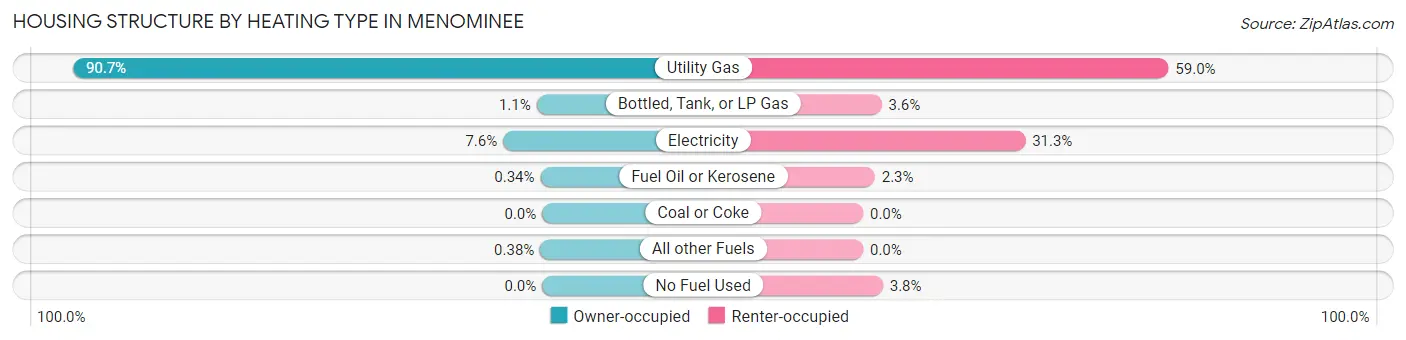
| Heating Type | Owner-occupied | Renter-occupied |
| Utility Gas | 2,365 (90.6%) | 727 (59.0%) |
| Bottled, Tank, or LP Gas | 28 (1.1%) | 44 (3.6%) |
| Electricity | 197 (7.5%) | 386 (31.3%) |
| Fuel Oil or Kerosene | 9 (0.3%) | 28 (2.3%) |
| Coal or Coke | 0 (0.0%) | 0 (0.0%) |
| All other Fuels | 10 (0.4%) | 0 (0.0%) |
| No Fuel Used | 0 (0.0%) | 47 (3.8%) |
| Total | 2,609 (100.0%) | 1,232 (100.0%) |
Household Vehicle Usage in Menominee
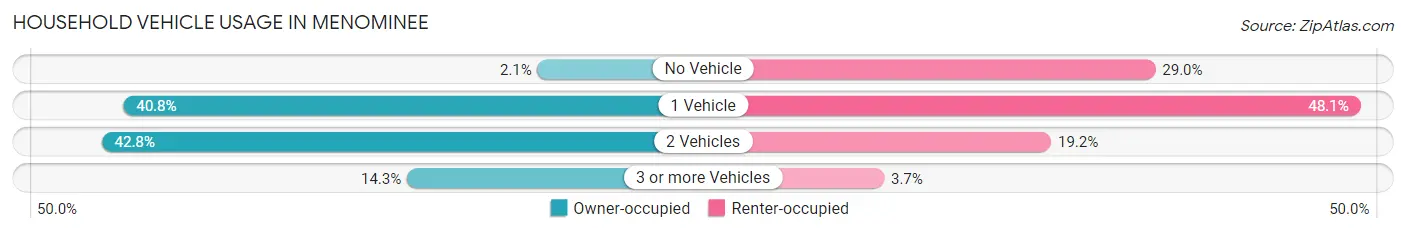
| Vehicles per Household | Owner-occupied | Renter-occupied |
| No Vehicle | 55 (2.1%) | 357 (29.0%) |
| 1 Vehicle | 1,064 (40.8%) | 593 (48.1%) |
| 2 Vehicles | 1,117 (42.8%) | 237 (19.2%) |
| 3 or more Vehicles | 373 (14.3%) | 45 (3.6%) |
| Total | 2,609 (100.0%) | 1,232 (100.0%) |
Real Estate & Mortgages in Menominee
Real Estate and Mortgage Overview in Menominee
| Characteristic | Without Mortgage | With Mortgage |
| Housing Units | 1,383 | 1,226 |
| Median Property Value | $85,200 | $101,900 |
| Median Household Income | $45,479 | $19 |
| Monthly Housing Costs | $447 | $0 |
| Real Estate Taxes | $1,564 | $63 |
Property Value by Mortgage Status in Menominee
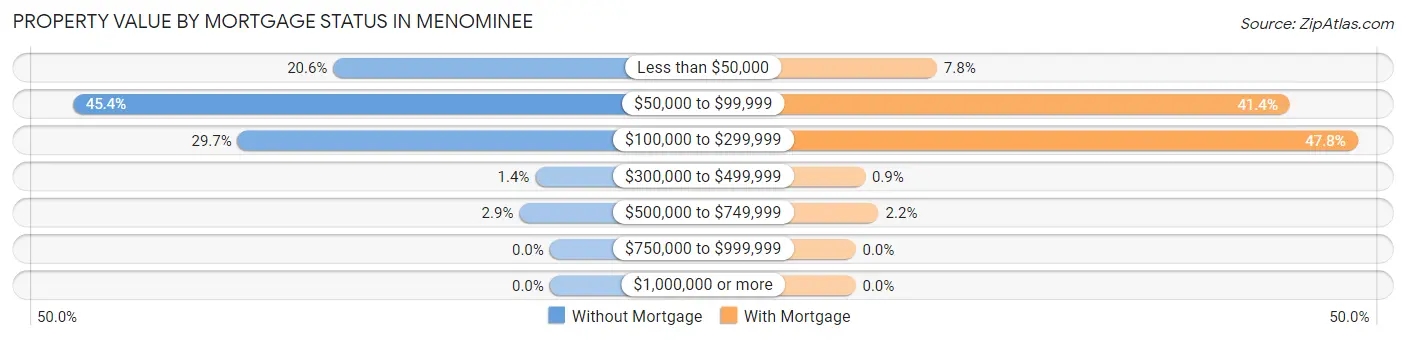
| Property Value | Without Mortgage | With Mortgage |
| Less than $50,000 | 285 (20.6%) | 95 (7.7%) |
| $50,000 to $99,999 | 628 (45.4%) | 507 (41.3%) |
| $100,000 to $299,999 | 411 (29.7%) | 586 (47.8%) |
| $300,000 to $499,999 | 19 (1.4%) | 11 (0.9%) |
| $500,000 to $749,999 | 40 (2.9%) | 27 (2.2%) |
| $750,000 to $999,999 | 0 (0.0%) | 0 (0.0%) |
| $1,000,000 or more | 0 (0.0%) | 0 (0.0%) |
| Total | 1,383 (100.0%) | 1,226 (100.0%) |
Household Income by Mortgage Status in Menominee
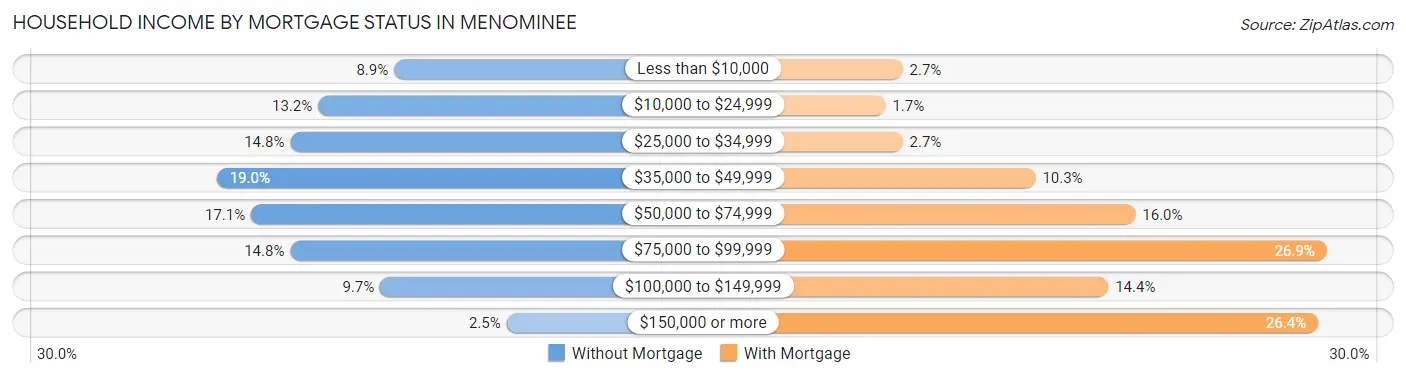
| Household Income | Without Mortgage | With Mortgage |
| Less than $10,000 | 123 (8.9%) | 33 (2.7%) |
| $10,000 to $24,999 | 183 (13.2%) | 21 (1.7%) |
| $25,000 to $34,999 | 205 (14.8%) | 33 (2.7%) |
| $35,000 to $49,999 | 263 (19.0%) | 126 (10.3%) |
| $50,000 to $74,999 | 236 (17.1%) | 196 (16.0%) |
| $75,000 to $99,999 | 205 (14.8%) | 330 (26.9%) |
| $100,000 to $149,999 | 134 (9.7%) | 177 (14.4%) |
| $150,000 or more | 34 (2.5%) | 324 (26.4%) |
| Total | 1,383 (100.0%) | 1,226 (100.0%) |
Property Value to Household Income Ratio in Menominee
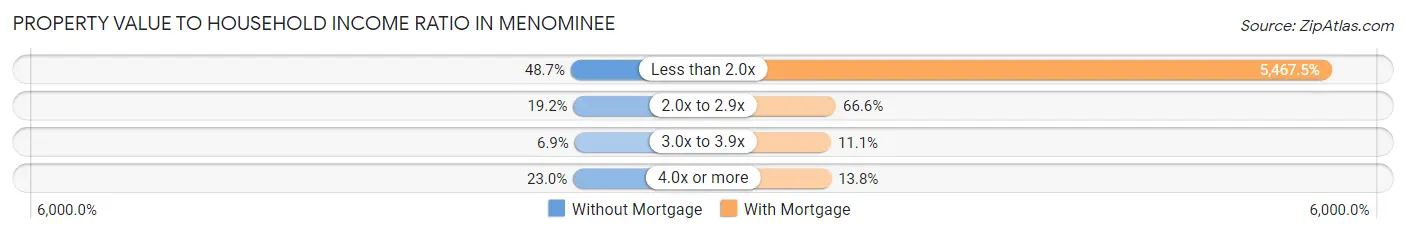
| Value-to-Income Ratio | Without Mortgage | With Mortgage |
| Less than 2.0x | 673 (48.7%) | 67,031 (5,467.5%) |
| 2.0x to 2.9x | 266 (19.2%) | 817 (66.6%) |
| 3.0x to 3.9x | 95 (6.9%) | 136 (11.1%) |
| 4.0x or more | 318 (23.0%) | 169 (13.8%) |
| Total | 1,383 (100.0%) | 1,226 (100.0%) |
Real Estate Taxes by Mortgage Status in Menominee
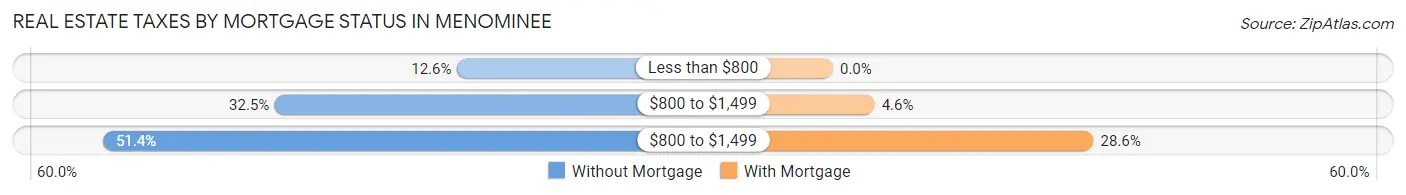
| Property Taxes | Without Mortgage | With Mortgage |
| Less than $800 | 174 (12.6%) | 0 (0.0%) |
| $800 to $1,499 | 450 (32.5%) | 56 (4.6%) |
| $800 to $1,499 | 711 (51.4%) | 350 (28.5%) |
| Total | 1,383 (100.0%) | 1,226 (100.0%) |
Health & Disability in Menominee
Health Insurance Coverage by Age in Menominee
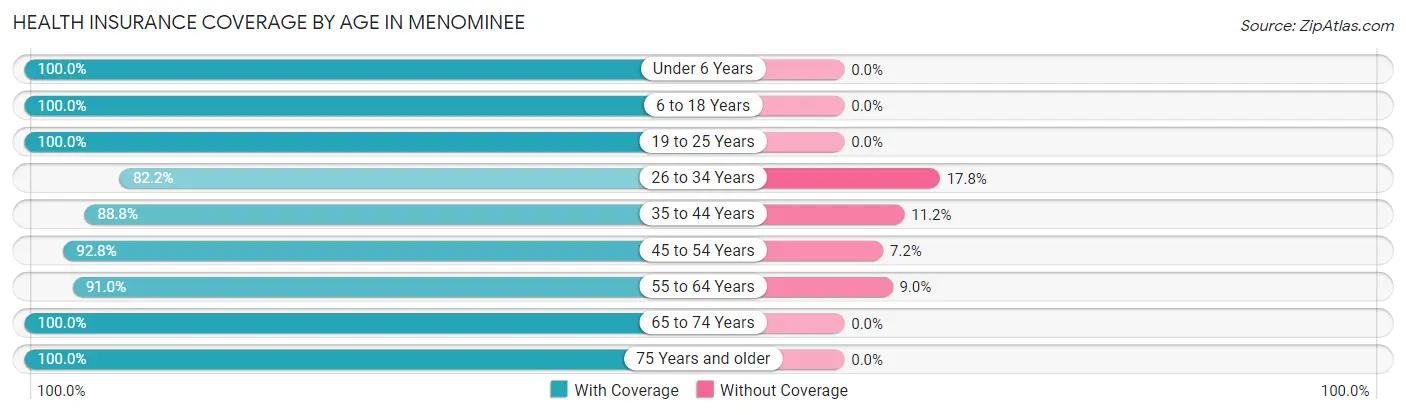
| Age Bracket | With Coverage | Without Coverage |
| Under 6 Years | 297 (100.0%) | 0 (0.0%) |
| 6 to 18 Years | 1,183 (100.0%) | 0 (0.0%) |
| 19 to 25 Years | 667 (100.0%) | 0 (0.0%) |
| 26 to 34 Years | 656 (82.2%) | 142 (17.8%) |
| 35 to 44 Years | 833 (88.8%) | 105 (11.2%) |
| 45 to 54 Years | 886 (92.8%) | 69 (7.2%) |
| 55 to 64 Years | 1,378 (91.0%) | 136 (9.0%) |
| 65 to 74 Years | 1,075 (100.0%) | 0 (0.0%) |
| 75 Years and older | 910 (100.0%) | 0 (0.0%) |
| Total | 7,885 (94.6%) | 452 (5.4%) |
Health Insurance Coverage by Citizenship Status in Menominee
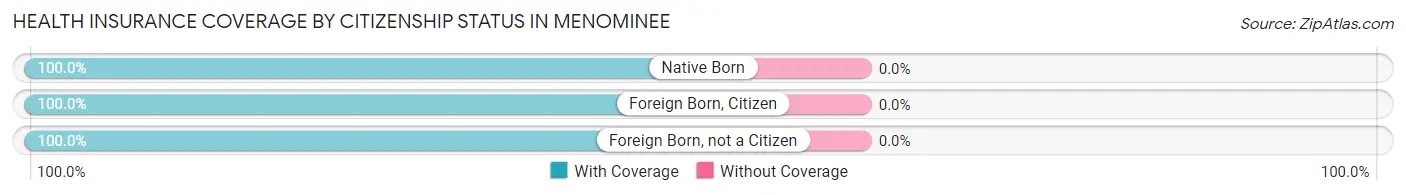
| Citizenship Status | With Coverage | Without Coverage |
| Native Born | 297 (100.0%) | 0 (0.0%) |
| Foreign Born, Citizen | 1,183 (100.0%) | 0 (0.0%) |
| Foreign Born, not a Citizen | 667 (100.0%) | 0 (0.0%) |
Health Insurance Coverage by Household Income in Menominee
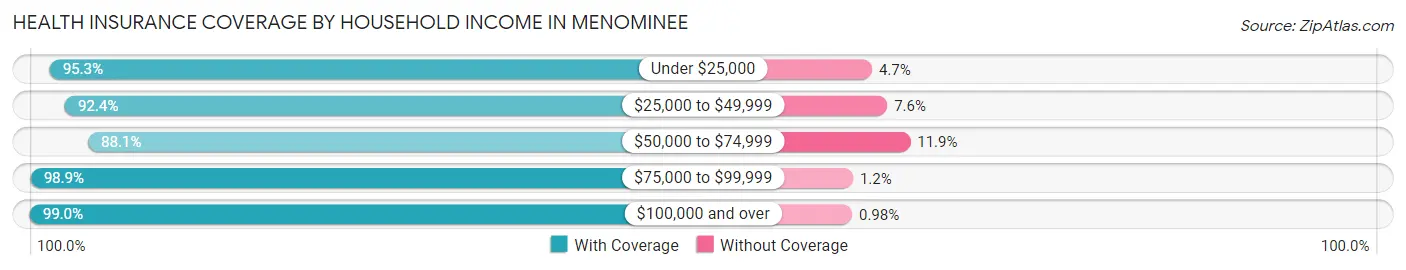
| Household Income | With Coverage | Without Coverage |
| Under $25,000 | 1,131 (95.3%) | 56 (4.7%) |
| $25,000 to $49,999 | 1,905 (92.4%) | 156 (7.6%) |
| $50,000 to $74,999 | 1,517 (88.1%) | 205 (11.9%) |
| $75,000 to $99,999 | 1,291 (98.9%) | 15 (1.1%) |
| $100,000 and over | 2,031 (99.0%) | 20 (1.0%) |
Public vs Private Health Insurance Coverage by Age in Menominee
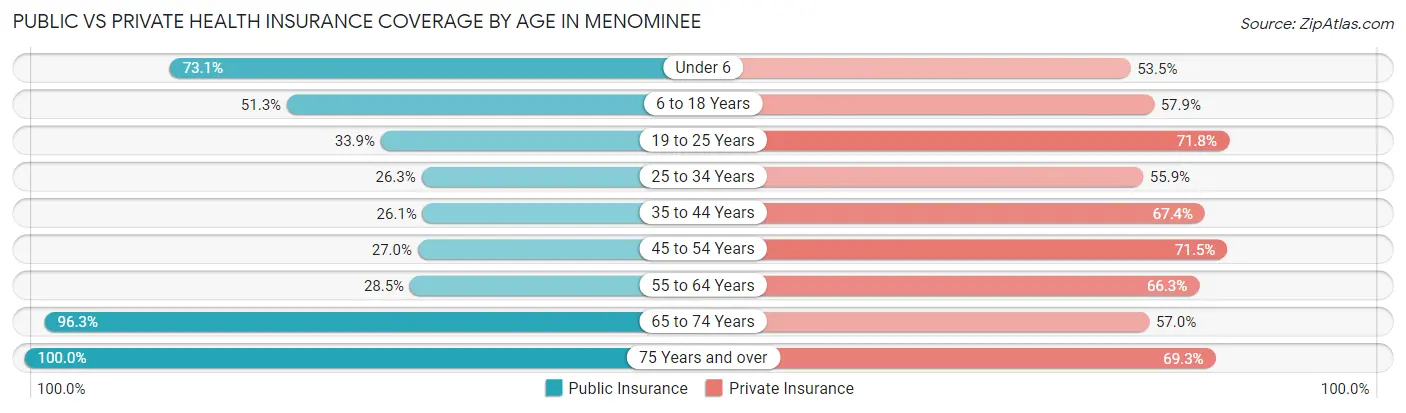
| Age Bracket | Public Insurance | Private Insurance |
| Under 6 | 217 (73.1%) | 159 (53.5%) |
| 6 to 18 Years | 607 (51.3%) | 685 (57.9%) |
| 19 to 25 Years | 226 (33.9%) | 479 (71.8%) |
| 25 to 34 Years | 210 (26.3%) | 446 (55.9%) |
| 35 to 44 Years | 245 (26.1%) | 632 (67.4%) |
| 45 to 54 Years | 258 (27.0%) | 683 (71.5%) |
| 55 to 64 Years | 431 (28.5%) | 1,004 (66.3%) |
| 65 to 74 Years | 1,035 (96.3%) | 613 (57.0%) |
| 75 Years and over | 910 (100.0%) | 631 (69.3%) |
| Total | 4,139 (49.6%) | 5,332 (64.0%) |
Disability Status by Sex by Age in Menominee
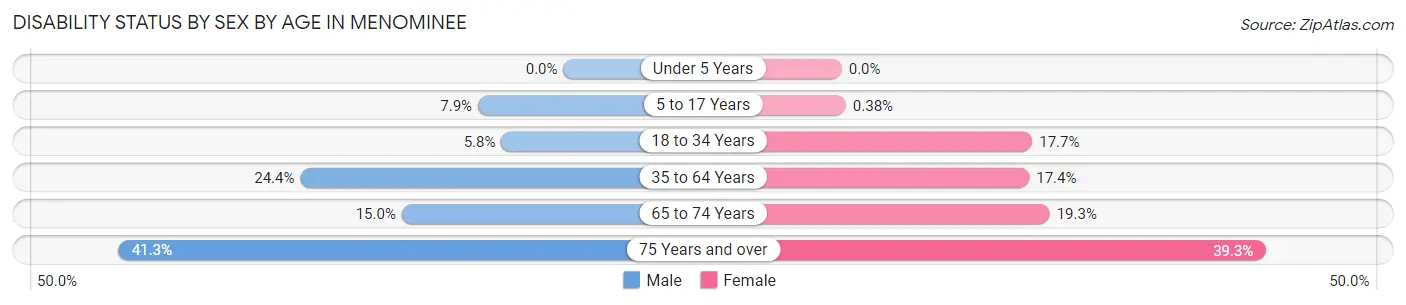
| Age Bracket | Male | Female |
| Under 5 Years | 0 (0.0%) | 0 (0.0%) |
| 5 to 17 Years | 47 (7.9%) | 2 (0.4%) |
| 18 to 34 Years | 46 (5.8%) | 139 (17.7%) |
| 35 to 64 Years | 443 (24.4%) | 277 (17.4%) |
| 65 to 74 Years | 75 (15.0%) | 111 (19.3%) |
| 75 Years and over | 177 (41.3%) | 189 (39.3%) |
Disability Class by Sex by Age in Menominee
Disability Class: Hearing Difficulty
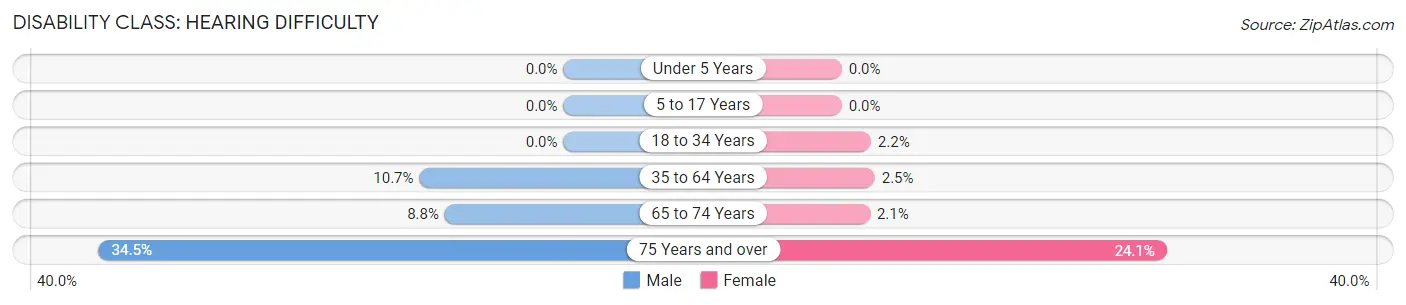
| Age Bracket | Male | Female |
| Under 5 Years | 0 (0.0%) | 0 (0.0%) |
| 5 to 17 Years | 0 (0.0%) | 0 (0.0%) |
| 18 to 34 Years | 0 (0.0%) | 17 (2.2%) |
| 35 to 64 Years | 194 (10.7%) | 39 (2.5%) |
| 65 to 74 Years | 44 (8.8%) | 12 (2.1%) |
| 75 Years and over | 148 (34.5%) | 116 (24.1%) |
Disability Class: Vision Difficulty
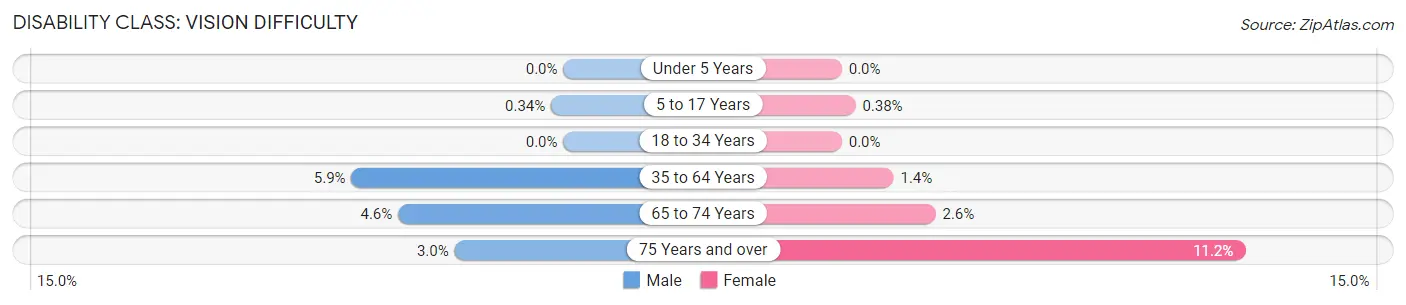
| Age Bracket | Male | Female |
| Under 5 Years | 0 (0.0%) | 0 (0.0%) |
| 5 to 17 Years | 2 (0.3%) | 2 (0.4%) |
| 18 to 34 Years | 0 (0.0%) | 0 (0.0%) |
| 35 to 64 Years | 107 (5.9%) | 23 (1.4%) |
| 65 to 74 Years | 23 (4.6%) | 15 (2.6%) |
| 75 Years and over | 13 (3.0%) | 54 (11.2%) |
Disability Class: Cognitive Difficulty
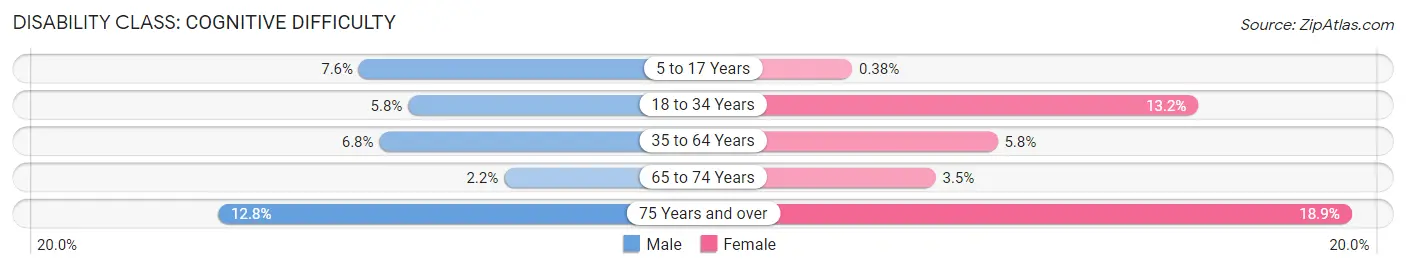
| Age Bracket | Male | Female |
| 5 to 17 Years | 45 (7.6%) | 2 (0.4%) |
| 18 to 34 Years | 46 (5.8%) | 104 (13.2%) |
| 35 to 64 Years | 124 (6.8%) | 92 (5.8%) |
| 65 to 74 Years | 11 (2.2%) | 20 (3.5%) |
| 75 Years and over | 55 (12.8%) | 91 (18.9%) |
Disability Class: Ambulatory Difficulty
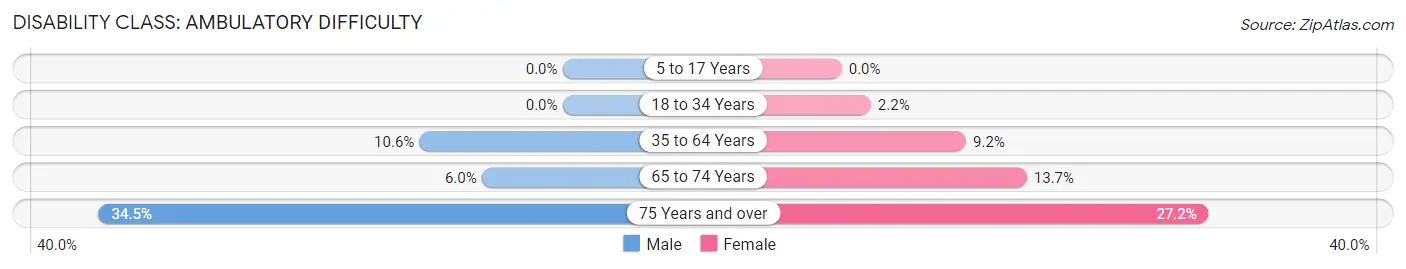
| Age Bracket | Male | Female |
| 5 to 17 Years | 0 (0.0%) | 0 (0.0%) |
| 18 to 34 Years | 0 (0.0%) | 17 (2.2%) |
| 35 to 64 Years | 193 (10.6%) | 147 (9.2%) |
| 65 to 74 Years | 30 (6.0%) | 79 (13.7%) |
| 75 Years and over | 148 (34.5%) | 131 (27.2%) |
Disability Class: Self-Care Difficulty
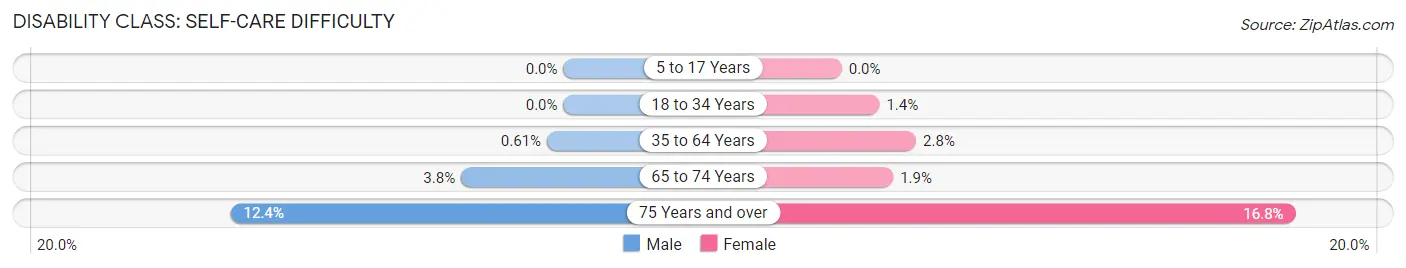
| Age Bracket | Male | Female |
| 5 to 17 Years | 0 (0.0%) | 0 (0.0%) |
| 18 to 34 Years | 0 (0.0%) | 11 (1.4%) |
| 35 to 64 Years | 11 (0.6%) | 44 (2.8%) |
| 65 to 74 Years | 19 (3.8%) | 11 (1.9%) |
| 75 Years and over | 53 (12.3%) | 81 (16.8%) |
Technology Access in Menominee
Computing Device Access in Menominee
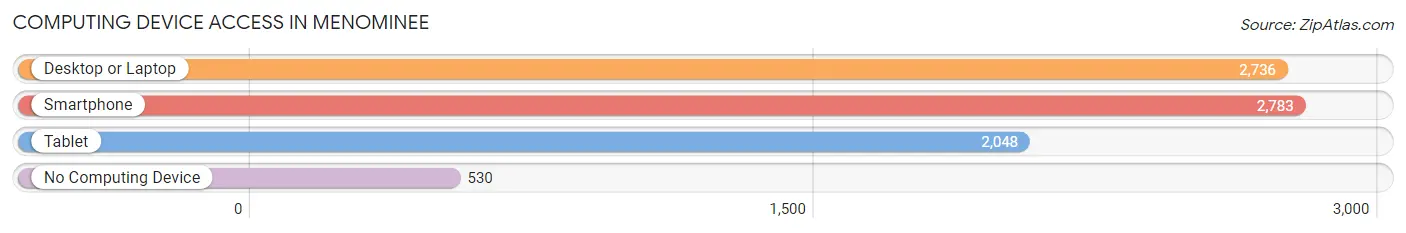
| Device Type | # Households | % Households |
| Desktop or Laptop | 2,736 | 71.2% |
| Smartphone | 2,783 | 72.5% |
| Tablet | 2,048 | 53.3% |
| No Computing Device | 530 | 13.8% |
| Total | 3,841 | 100.0% |
Internet Access in Menominee
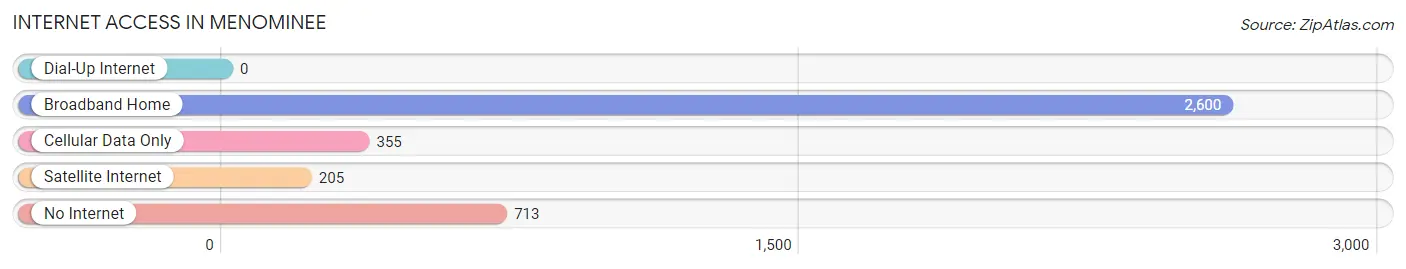
| Internet Type | # Households | % Households |
| Dial-Up Internet | 0 | 0.0% |
| Broadband Home | 2,600 | 67.7% |
| Cellular Data Only | 355 | 9.2% |
| Satellite Internet | 205 | 5.3% |
| No Internet | 713 | 18.6% |
| Total | 3,841 | 100.0% |
Menominee Summary
Menominee, Michigan is a small city located in the Upper Peninsula of Michigan. It is the county seat of Menominee County and is situated on the Menominee River, which flows into Lake Michigan. The city has a population of 8,599 as of the 2010 census.
History
The area that is now Menominee was originally inhabited by the Menominee Native American tribe. The tribe was part of the Algonquian language family and was one of the largest tribes in the Great Lakes region. The tribe was known for its fishing and hunting skills, and the area was a major trading center for the tribe.
In the early 1800s, the area was explored by French fur traders and missionaries. In 1836, the US government established the Menominee Indian Reservation in the area. The reservation was established to protect the tribe from further encroachment by settlers.
In 1854, the city of Menominee was founded by a group of settlers from New England. The city was named after the Menominee tribe and was incorporated in 1871.
Geography
Menominee is located in the Upper Peninsula of Michigan, on the Menominee River. The city is situated on the northern shore of Lake Michigan, and is bordered by the cities of Marinette, Wisconsin and Escanaba, Michigan. The city has a total area of 8.2 square miles, of which 7.9 square miles is land and 0.3 square miles is water.
The city has a humid continental climate, with cold winters and warm summers. The average temperature in January is 18°F, and the average temperature in July is 71°F. The average annual precipitation is 33 inches.
Economy
Menominee’s economy is largely based on manufacturing and tourism. The city is home to several manufacturing companies, including Menominee Iron Works, Menominee Paper Company, and Menominee Machine Works. The city is also home to several tourist attractions, including the Menominee County Historical Museum, the Menominee River Museum, and the Menominee County Fairgrounds.
Demographics
As of the 2010 census, Menominee had a population of 8,599. The racial makeup of the city was 94.2% White, 0.7% African American, 0.7% Native American, 0.7% Asian, 0.1% Pacific Islander, 1.3% from other races, and 2.3% from two or more races. Hispanic or Latino of any race were 3.2% of the population.
The median income for a household in the city was $37,917, and the median income for a family was $45,938. The per capita income for the city was $19,945. About 11.2% of families and 14.2% of the population were below the poverty line, including 19.2% of those under age 18 and 8.2% of those age 65 or over.
Common Questions
What is Per Capita Income in Menominee?
Per Capita income in Menominee is $28,326.
What is the Median Family Income in Menominee?
Median Family Income in Menominee is $68,767.
What is the Median Household income in Menominee?
Median Household Income in Menominee is $46,821.
What is Income or Wage Gap in Menominee?
Income or Wage Gap in Menominee is 35.3%.
Women in Menominee earn 64.7 cents for every dollar earned by a man.
What is Inequality or Gini Index in Menominee?
Inequality or Gini Index in Menominee is 0.40.
What is the Total Population of Menominee?
Total Population of Menominee is 8,429.
What is the Total Male Population of Menominee?
Total Male Population of Menominee is 4,337.
What is the Total Female Population of Menominee?
Total Female Population of Menominee is 4,092.
What is the Ratio of Males per 100 Females in Menominee?
There are 105.99 Males per 100 Females in Menominee.
What is the Ratio of Females per 100 Males in Menominee?
There are 94.35 Females per 100 Males in Menominee.
What is the Median Population Age in Menominee?
Median Population Age in Menominee is 49.0 Years.
What is the Average Family Size in Menominee
Average Family Size in Menominee is 2.9 People.
What is the Average Household Size in Menominee
Average Household Size in Menominee is 2.2 People.
How Large is the Labor Force in Menominee?
There are 4,316 People in the Labor Forcein in Menominee.
What is the Percentage of People in the Labor Force in Menominee?
59.9% of People are in the Labor Force in Menominee.
What is the Unemployment Rate in Menominee?
Unemployment Rate in Menominee is 4.1%.