Taft, CA Map & Demographics
Taft Map
Taft Overview
$27,539
PER CAPITA INCOME
$67,830
AVG FAMILY INCOME
$52,414
AVG HOUSEHOLD INCOME
62.5%
WAGE / INCOME GAP [ % ]
37.5¢/ $1
WAGE / INCOME GAP [ $ ]
0.48
INEQUALITY / GINI INDEX
7,414
TOTAL POPULATION
3,796
MALE POPULATION
3,618
FEMALE POPULATION
104.92
MALES / 100 FEMALES
95.31
FEMALES / 100 MALES
32.9
MEDIAN AGE
3.2
AVG FAMILY SIZE
2.6
AVG HOUSEHOLD SIZE
2,787
LABOR FORCE [ PEOPLE ]
47.4%
PERCENT IN LABOR FORCE
4.8%
UNEMPLOYMENT RATE
Taft Zip Codes
Taft Area Codes
Income in Taft
Income Overview in Taft
Per Capita Income in Taft is $27,539, while median incomes of families and households are $67,830 and $52,414 respectively.
| Characteristic | Number | Measure |
| Per Capita Income | 7,414 | $27,539 |
| Median Family Income | 1,702 | $67,830 |
| Mean Family Income | 1,702 | $89,668 |
| Median Household Income | 2,674 | $52,414 |
| Mean Household Income | 2,674 | $74,447 |
| Income Deficit | 1,702 | $0 |
| Wage / Income Gap (%) | 7,414 | 62.51% |
| Wage / Income Gap ($) | 7,414 | 37.49¢ per $1 |
| Gini / Inequality Index | 7,414 | 0.48 |
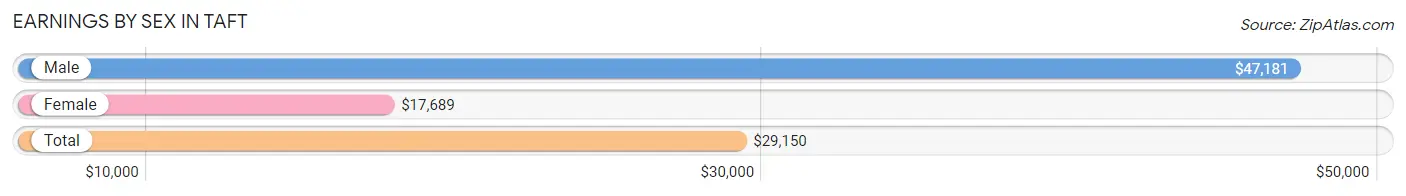
Earnings by Sex in Taft
Average Earnings in Taft are $29,150, $47,181 for men and $17,689 for women, a difference of 62.5%.
| Sex | Number | Average Earnings |
| Male | 1,575 (55.0%) | $47,181 |
| Female | 1,286 (45.0%) | $17,689 |
| Total | 2,861 (100.0%) | $29,150 |
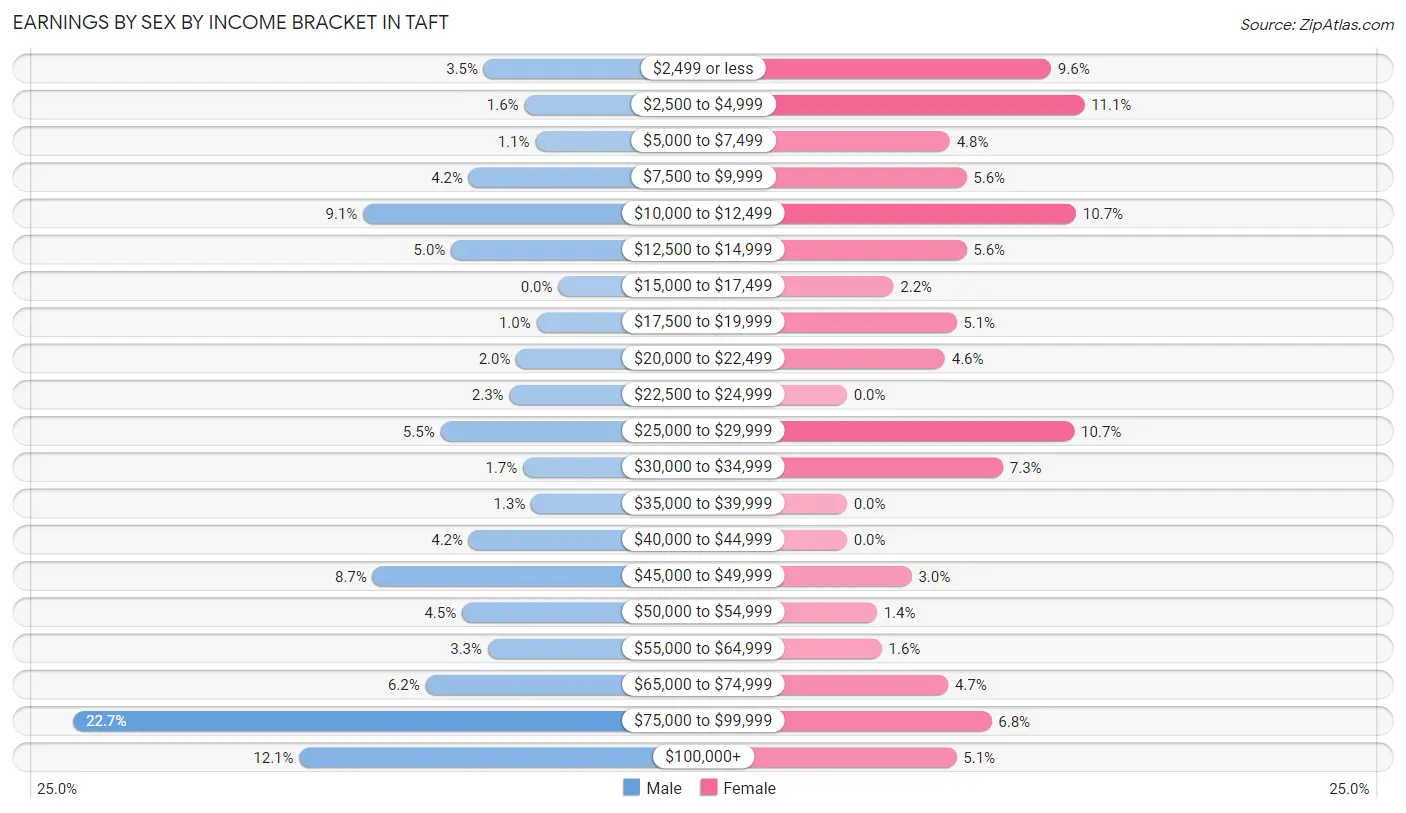
Earnings by Sex by Income Bracket in Taft
The most common earnings brackets in Taft are $75,000 to $99,999 for men (358 | 22.7%) and $2,500 to $4,999 for women (143 | 11.1%).
| Income | Male | Female |
| $2,499 or less | 55 (3.5%) | 123 (9.6%) |
| $2,500 to $4,999 | 25 (1.6%) | 143 (11.1%) |
| $5,000 to $7,499 | 17 (1.1%) | 62 (4.8%) |
| $7,500 to $9,999 | 66 (4.2%) | 72 (5.6%) |
| $10,000 to $12,499 | 144 (9.1%) | 138 (10.7%) |
| $12,500 to $14,999 | 79 (5.0%) | 72 (5.6%) |
| $15,000 to $17,499 | 0 (0.0%) | 28 (2.2%) |
| $17,500 to $19,999 | 16 (1.0%) | 66 (5.1%) |
| $20,000 to $22,499 | 31 (2.0%) | 59 (4.6%) |
| $22,500 to $24,999 | 36 (2.3%) | 0 (0.0%) |
| $25,000 to $29,999 | 87 (5.5%) | 137 (10.6%) |
| $30,000 to $34,999 | 26 (1.7%) | 94 (7.3%) |
| $35,000 to $39,999 | 20 (1.3%) | 0 (0.0%) |
| $40,000 to $44,999 | 66 (4.2%) | 0 (0.0%) |
| $45,000 to $49,999 | 137 (8.7%) | 39 (3.0%) |
| $50,000 to $54,999 | 71 (4.5%) | 18 (1.4%) |
| $55,000 to $64,999 | 52 (3.3%) | 21 (1.6%) |
| $65,000 to $74,999 | 98 (6.2%) | 61 (4.7%) |
| $75,000 to $99,999 | 358 (22.7%) | 87 (6.8%) |
| $100,000+ | 191 (12.1%) | 66 (5.1%) |
| Total | 1,575 (100.0%) | 1,286 (100.0%) |
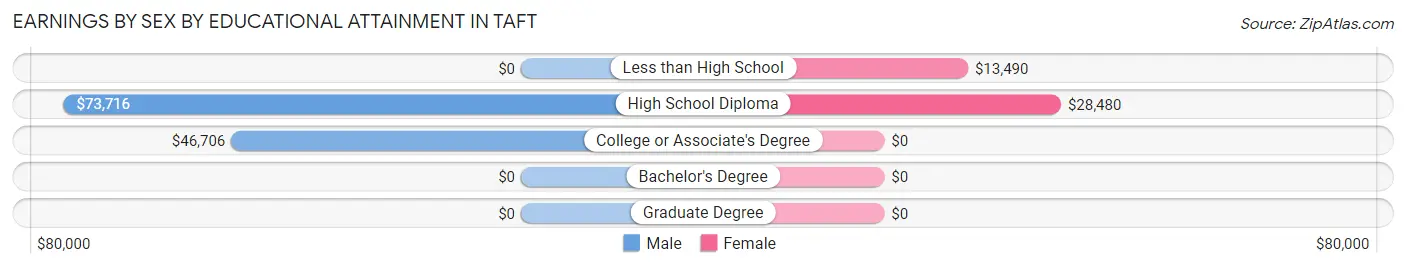
Earnings by Sex by Educational Attainment in Taft
| Educational Attainment | Male Income | Female Income |
| Less than High School | - | - |
| High School Diploma | $73,716 | $28,480 |
| College or Associate's Degree | $46,706 | $0 |
| Bachelor's Degree | - | - |
| Graduate Degree | - | - |
| Total | $57,717 | $0 |
Family Income in Taft
Family Income Brackets in Taft
According to the Taft family income data, there are 492 families falling into the $50,000 to $74,999 income range, which is the most common income bracket and makes up 28.9% of all families. Conversely, the $15,000 to $24,999 income bracket is the least frequent group with only 31 families (1.8%) belonging to this category.
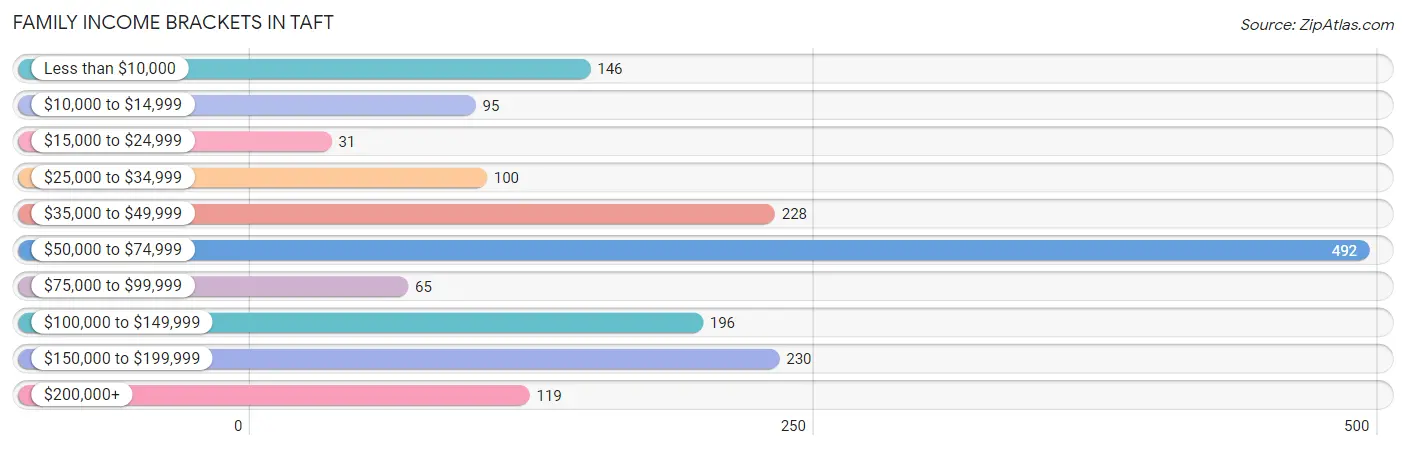
| Income Bracket | # Families | % Families |
| Less than $10,000 | 146 | 8.6% |
| $10,000 to $14,999 | 95 | 5.6% |
| $15,000 to $24,999 | 31 | 1.8% |
| $25,000 to $34,999 | 100 | 5.9% |
| $35,000 to $49,999 | 228 | 13.4% |
| $50,000 to $74,999 | 492 | 28.9% |
| $75,000 to $99,999 | 65 | 3.8% |
| $100,000 to $149,999 | 196 | 11.5% |
| $150,000 to $199,999 | 230 | 13.5% |
| $200,000+ | 119 | 7.0% |
Family Income by Famaliy Size in Taft
4-person families (378 | 22.2%) account for the highest median family income in Taft with $151,321 per family, while 4-person families (378 | 22.2%) have the highest median income of $37,830 per family member.
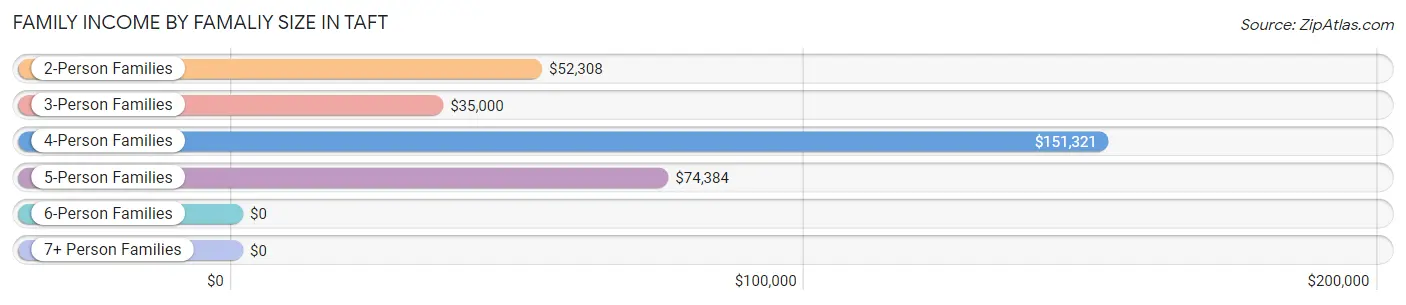
| Income Bracket | # Families | Median Income |
| 2-Person Families | 757 (44.5%) | $52,308 |
| 3-Person Families | 334 (19.6%) | $35,000 |
| 4-Person Families | 378 (22.2%) | $151,321 |
| 5-Person Families | 232 (13.6%) | $74,384 |
| 6-Person Families | 1 (0.1%) | $0 |
| 7+ Person Families | 0 (0.0%) | $0 |
| Total | 1,702 (100.0%) | $67,830 |
Family Income by Number of Earners in Taft
The median family income in Taft is $67,830, with families comprising 3+ earners (154) having the highest median family income of $196,542, while families with 1 earner (878) have the lowest median family income of $47,105, accounting for 9.0% and 51.6% of families, respectively.
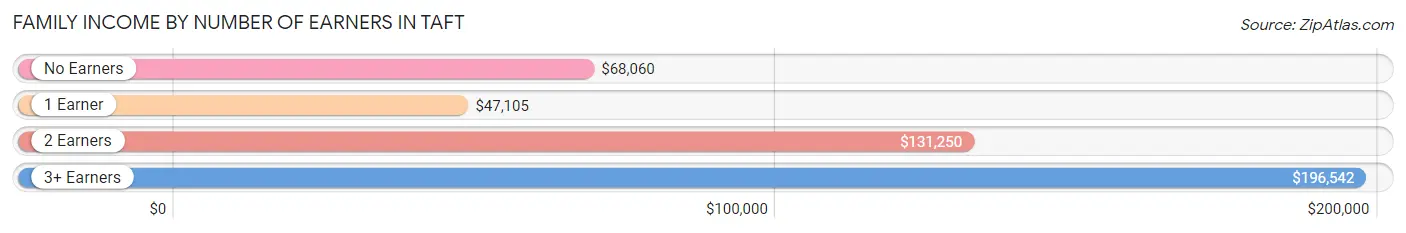
| Number of Earners | # Families | Median Income |
| No Earners | 364 (21.4%) | $68,060 |
| 1 Earner | 878 (51.6%) | $47,105 |
| 2 Earners | 306 (18.0%) | $131,250 |
| 3+ Earners | 154 (9.0%) | $196,542 |
| Total | 1,702 (100.0%) | $67,830 |
Household Income in Taft
Household Income Brackets in Taft
With 551 households falling in the category, the $50,000 to $74,999 income range is the most frequent in Taft, accounting for 20.6% of all households. In contrast, only 120 households (4.5%) fall into the $200,000+ income bracket, making it the least populous group.
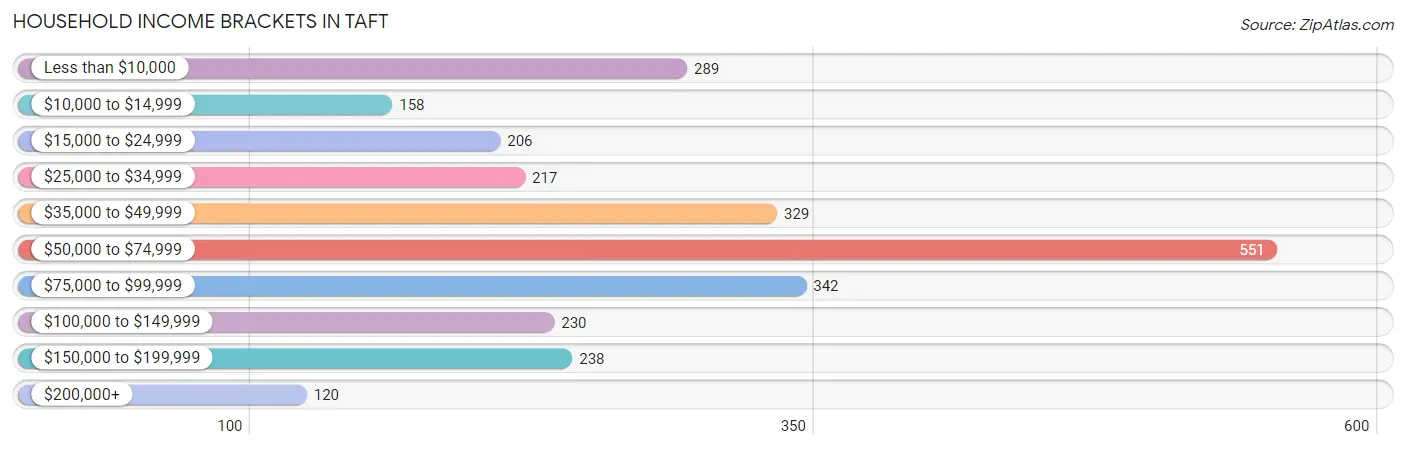
| Income Bracket | # Households | % Households |
| Less than $10,000 | 289 | 10.8% |
| $10,000 to $14,999 | 158 | 5.9% |
| $15,000 to $24,999 | 206 | 7.7% |
| $25,000 to $34,999 | 217 | 8.1% |
| $35,000 to $49,999 | 329 | 12.3% |
| $50,000 to $74,999 | 551 | 20.6% |
| $75,000 to $99,999 | 342 | 12.8% |
| $100,000 to $149,999 | 230 | 8.6% |
| $150,000 to $199,999 | 238 | 8.9% |
| $200,000+ | 120 | 4.5% |
Household Income by Householder Age in Taft
The median household income in Taft is $52,414, with the highest median household income of $61,569 found in the 45 to 64 years age bracket for the primary householder. A total of 852 households (31.9%) fall into this category.
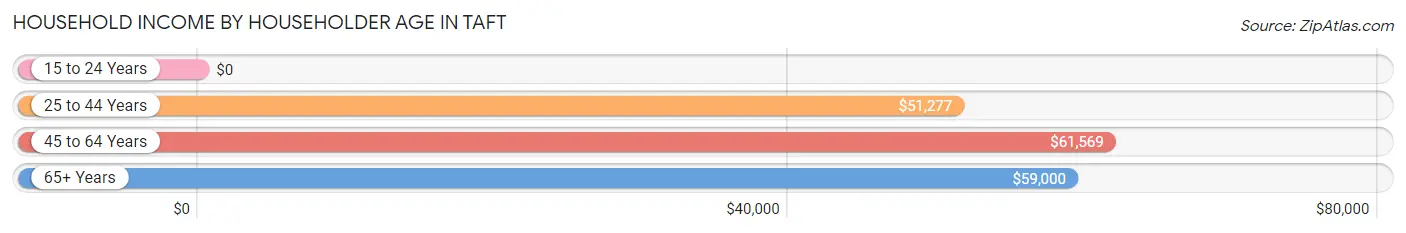
| Income Bracket | # Households | Median Income |
| 15 to 24 Years | 0 (0.0%) | $0 |
| 25 to 44 Years | 1,054 (39.4%) | $51,277 |
| 45 to 64 Years | 852 (31.9%) | $61,569 |
| 65+ Years | 768 (28.7%) | $59,000 |
| Total | 2,674 (100.0%) | $52,414 |
Poverty in Taft
Income Below Poverty by Sex and Age in Taft
With 19.8% poverty level for males and 23.7% for females among the residents of Taft, under 5 year old males and under 5 year old females are the most vulnerable to poverty, with 162 males (63.3%) and 52 females (64.2%) in their respective age groups living below the poverty level.
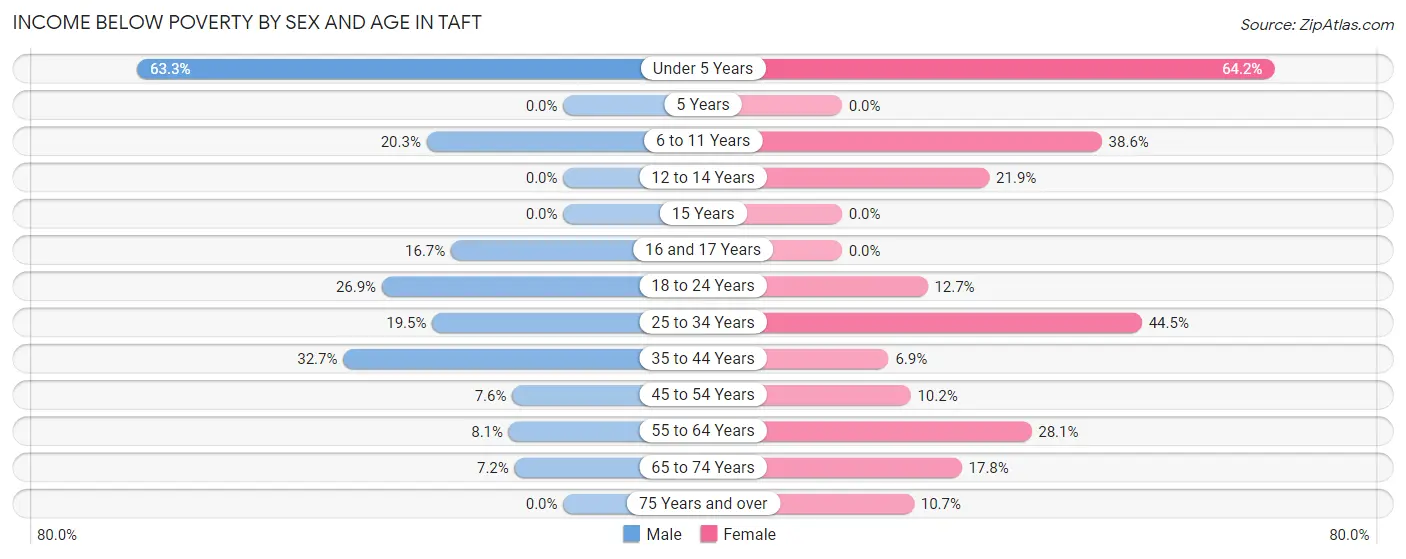
| Age Bracket | Male | Female |
| Under 5 Years | 162 (63.3%) | 52 (64.2%) |
| 5 Years | 0 (0.0%) | 0 (0.0%) |
| 6 to 11 Years | 42 (20.3%) | 186 (38.6%) |
| 12 to 14 Years | 0 (0.0%) | 42 (21.9%) |
| 15 Years | 0 (0.0%) | 0 (0.0%) |
| 16 and 17 Years | 21 (16.7%) | 0 (0.0%) |
| 18 to 24 Years | 52 (26.9%) | 50 (12.7%) |
| 25 to 34 Years | 130 (19.5%) | 253 (44.5%) |
| 35 to 44 Years | 184 (32.7%) | 19 (6.9%) |
| 45 to 54 Years | 21 (7.6%) | 31 (10.2%) |
| 55 to 64 Years | 36 (8.1%) | 94 (28.1%) |
| 65 to 74 Years | 16 (7.2%) | 92 (17.8%) |
| 75 Years and over | 0 (0.0%) | 14 (10.7%) |
| Total | 664 (19.8%) | 833 (23.7%) |
Income Above Poverty by Sex and Age in Taft
According to the poverty statistics in Taft, males aged 12 to 14 years and females aged 5 years are the age groups that are most secure financially, with 100.0% of males and 100.0% of females in these age groups living above the poverty line.
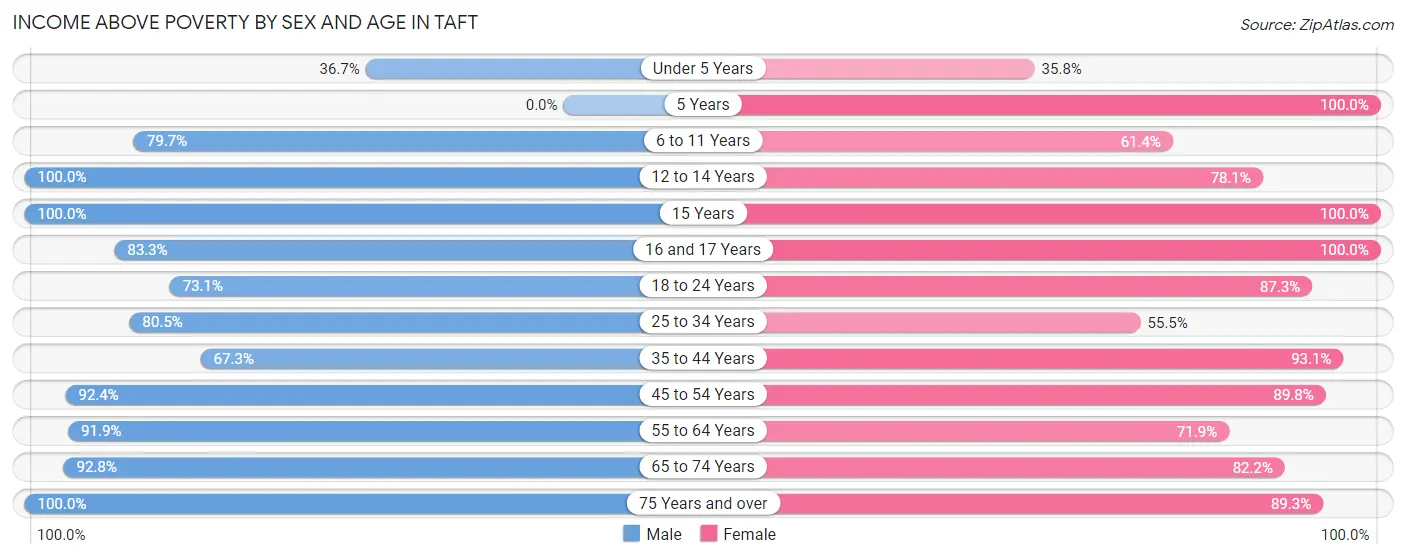
| Age Bracket | Male | Female |
| Under 5 Years | 94 (36.7%) | 29 (35.8%) |
| 5 Years | 0 (0.0%) | 166 (100.0%) |
| 6 to 11 Years | 165 (79.7%) | 296 (61.4%) |
| 12 to 14 Years | 58 (100.0%) | 150 (78.1%) |
| 15 Years | 48 (100.0%) | 10 (100.0%) |
| 16 and 17 Years | 105 (83.3%) | 66 (100.0%) |
| 18 to 24 Years | 141 (73.1%) | 343 (87.3%) |
| 25 to 34 Years | 538 (80.5%) | 315 (55.5%) |
| 35 to 44 Years | 379 (67.3%) | 255 (93.1%) |
| 45 to 54 Years | 256 (92.4%) | 273 (89.8%) |
| 55 to 64 Years | 409 (91.9%) | 240 (71.9%) |
| 65 to 74 Years | 205 (92.8%) | 425 (82.2%) |
| 75 Years and over | 298 (100.0%) | 117 (89.3%) |
| Total | 2,696 (80.2%) | 2,685 (76.3%) |
Income Below Poverty Among Married-Couple Families in Taft
The poverty statistics for married-couple families in Taft show that 1.9% or 20 of the total 1,059 families live below the poverty line. Families with 1 or 2 children have the highest poverty rate of 10.1%, comprising of 20 families. On the other hand, families with no children have the lowest poverty rate of 0.0%, which includes 0 families.
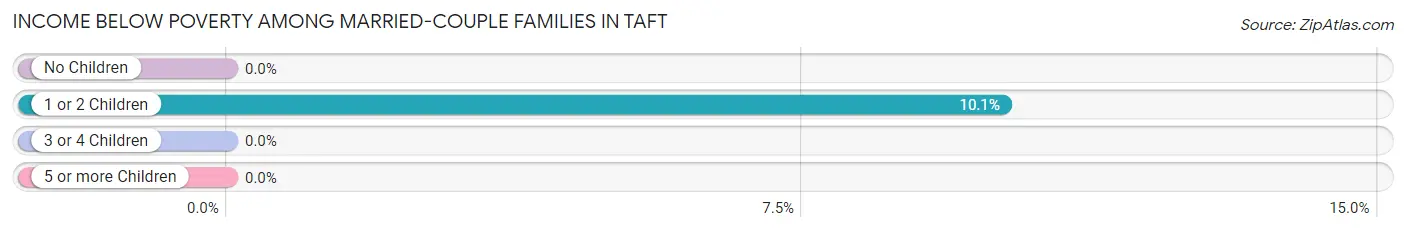
| Children | Above Poverty | Below Poverty |
| No Children | 679 (100.0%) | 0 (0.0%) |
| 1 or 2 Children | 178 (89.9%) | 20 (10.1%) |
| 3 or 4 Children | 182 (100.0%) | 0 (0.0%) |
| 5 or more Children | 0 (0.0%) | 0 (0.0%) |
| Total | 1,039 (98.1%) | 20 (1.9%) |
Income Below Poverty Among Single-Parent Households in Taft
According to the poverty data in Taft, 45.0% or 165 single-father households and 25.7% or 71 single-mother households are living below the poverty line. Among single-father households, those with 3 or 4 children have the highest poverty rate, with 50 households (86.2%) experiencing poverty. Likewise, among single-mother households, those with 3 or 4 children have the highest poverty rate, with 40 households (100.0%) falling below the poverty line.
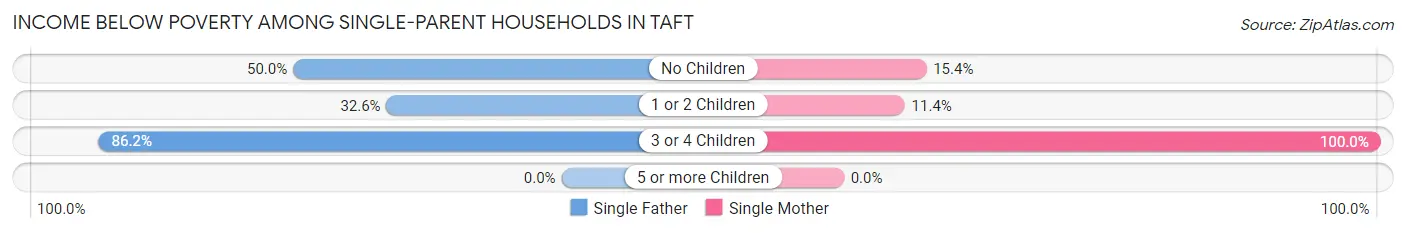
| Children | Single Father | Single Mother |
| No Children | 41 (50.0%) | 16 (15.4%) |
| 1 or 2 Children | 74 (32.6%) | 15 (11.4%) |
| 3 or 4 Children | 50 (86.2%) | 40 (100.0%) |
| 5 or more Children | 0 (0.0%) | 0 (0.0%) |
| Total | 165 (45.0%) | 71 (25.7%) |
Income Below Poverty Among Married-Couple vs Single-Parent Households in Taft
The poverty data for Taft shows that 20 of the married-couple family households (1.9%) and 236 of the single-parent households (36.7%) are living below the poverty level. Within the married-couple family households, those with 1 or 2 children have the highest poverty rate, with 20 households (10.1%) falling below the poverty line. Among the single-parent households, those with 3 or 4 children have the highest poverty rate, with 90 household (91.8%) living below poverty.
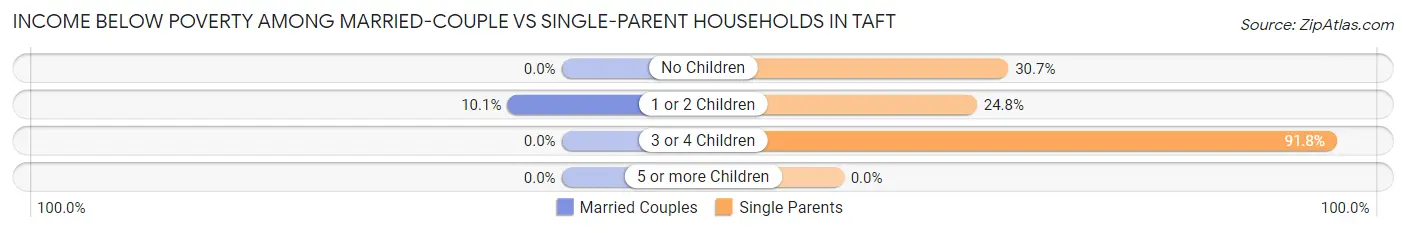
| Children | Married-Couple Families | Single-Parent Households |
| No Children | 0 (0.0%) | 57 (30.6%) |
| 1 or 2 Children | 20 (10.1%) | 89 (24.8%) |
| 3 or 4 Children | 0 (0.0%) | 90 (91.8%) |
| 5 or more Children | 0 (0.0%) | 0 (0.0%) |
| Total | 20 (1.9%) | 236 (36.7%) |
Race in Taft
The most populous races in Taft are White / Caucasian (6,109 | 82.4%), Hispanic or Latino (2,309 | 31.1%), and Some other Race (576 | 7.8%).
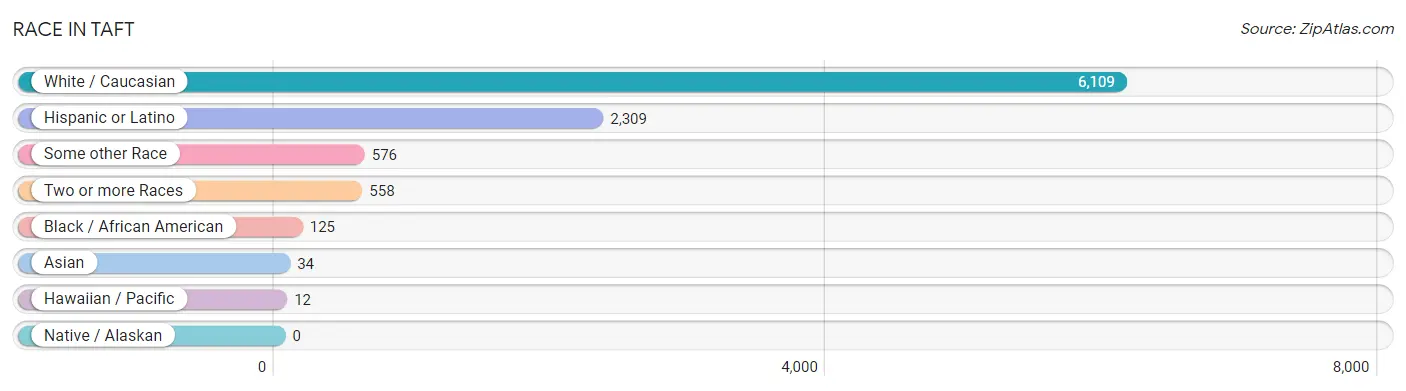
| Race | # Population | % Population |
| Asian | 34 | 0.5% |
| Black / African American | 125 | 1.7% |
| Hawaiian / Pacific | 12 | 0.2% |
| Hispanic or Latino | 2,309 | 31.1% |
| Native / Alaskan | 0 | 0.0% |
| White / Caucasian | 6,109 | 82.4% |
| Two or more Races | 558 | 7.5% |
| Some other Race | 576 | 7.8% |
| Total | 7,414 | 100.0% |
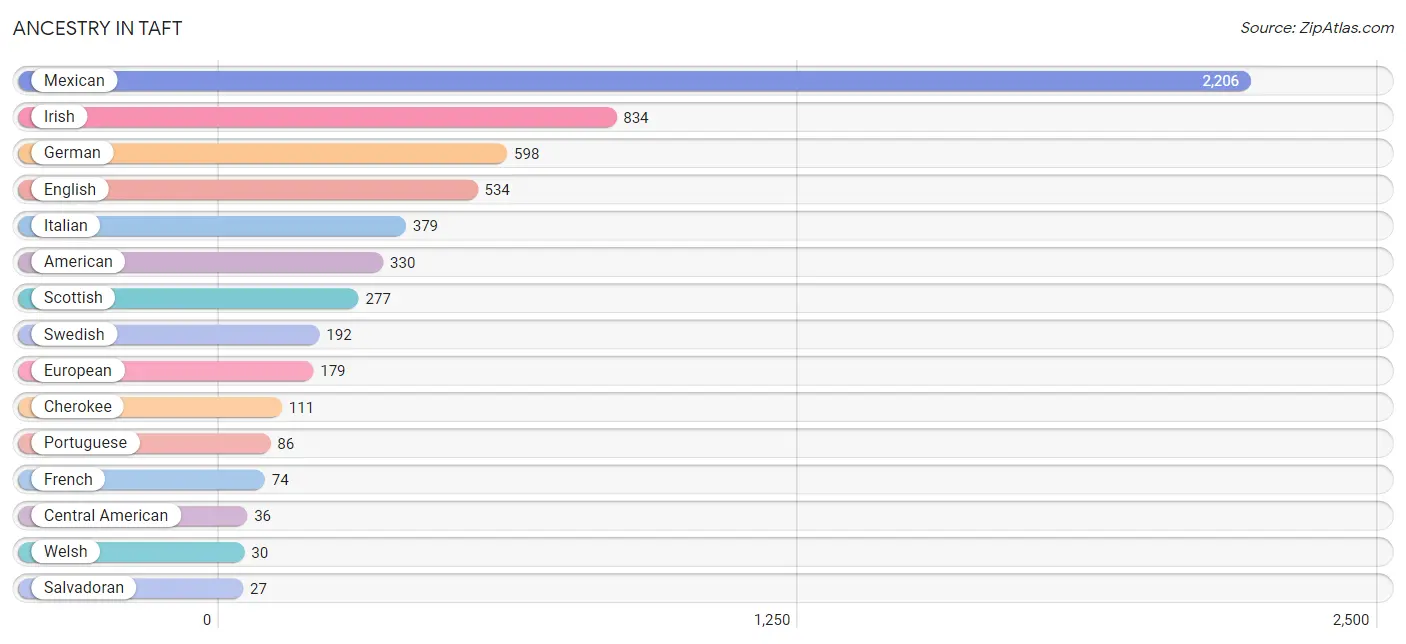
Ancestry in Taft
The most populous ancestries reported in Taft are Mexican (2,206 | 29.7%), Irish (834 | 11.3%), German (598 | 8.1%), English (534 | 7.2%), and Italian (379 | 5.1%), together accounting for 61.4% of all Taft residents.
| Ancestry | # Population | % Population |
| American | 330 | 4.4% |
| Bhutanese | 11 | 0.2% |
| British | 21 | 0.3% |
| Central American | 36 | 0.5% |
| Cherokee | 111 | 1.5% |
| Choctaw | 8 | 0.1% |
| Danish | 22 | 0.3% |
| Dutch | 17 | 0.2% |
| Eastern European | 11 | 0.2% |
| English | 534 | 7.2% |
| European | 179 | 2.4% |
| French | 74 | 1.0% |
| French Canadian | 6 | 0.1% |
| German | 598 | 8.1% |
| Guamanian / Chamorro | 4 | 0.1% |
| Guatemalan | 5 | 0.1% |
| Honduran | 4 | 0.1% |
| Iranian | 8 | 0.1% |
| Irish | 834 | 11.3% |
| Italian | 379 | 5.1% |
| Korean | 14 | 0.2% |
| Malaysian | 16 | 0.2% |
| Mexican | 2,206 | 29.7% |
| Mexican American Indian | 8 | 0.1% |
| Portuguese | 86 | 1.2% |
| Puerto Rican | 9 | 0.1% |
| Salvadoran | 27 | 0.4% |
| Samoan | 8 | 0.1% |
| Scandinavian | 18 | 0.2% |
| Scottish | 277 | 3.7% |
| Spaniard | 19 | 0.3% |
| Sri Lankan | 4 | 0.1% |
| Swedish | 192 | 2.6% |
| Thai | 4 | 0.1% |
| Welsh | 30 | 0.4% | View All 35 Rows |
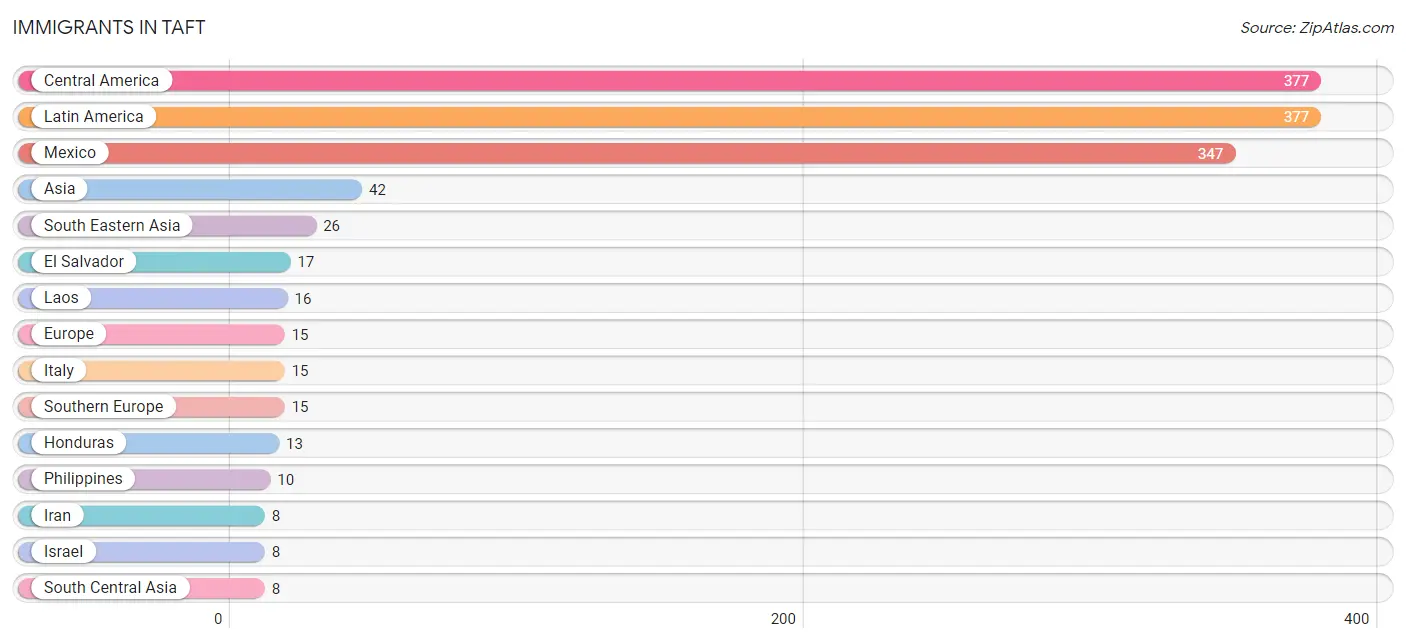
Immigrants in Taft
The most numerous immigrant groups reported in Taft came from Central America (377 | 5.1%), Latin America (377 | 5.1%), Mexico (347 | 4.7%), Asia (42 | 0.6%), and South Eastern Asia (26 | 0.4%), together accounting for 15.8% of all Taft residents.
| Immigration Origin | # Population | % Population |
| Asia | 42 | 0.6% |
| Central America | 377 | 5.1% |
| El Salvador | 17 | 0.2% |
| Europe | 15 | 0.2% |
| Honduras | 13 | 0.2% |
| Iran | 8 | 0.1% |
| Israel | 8 | 0.1% |
| Italy | 15 | 0.2% |
| Laos | 16 | 0.2% |
| Latin America | 377 | 5.1% |
| Mexico | 347 | 4.7% |
| Philippines | 10 | 0.1% |
| South Central Asia | 8 | 0.1% |
| South Eastern Asia | 26 | 0.4% |
| Southern Europe | 15 | 0.2% |
| Western Asia | 8 | 0.1% | View All 16 Rows |
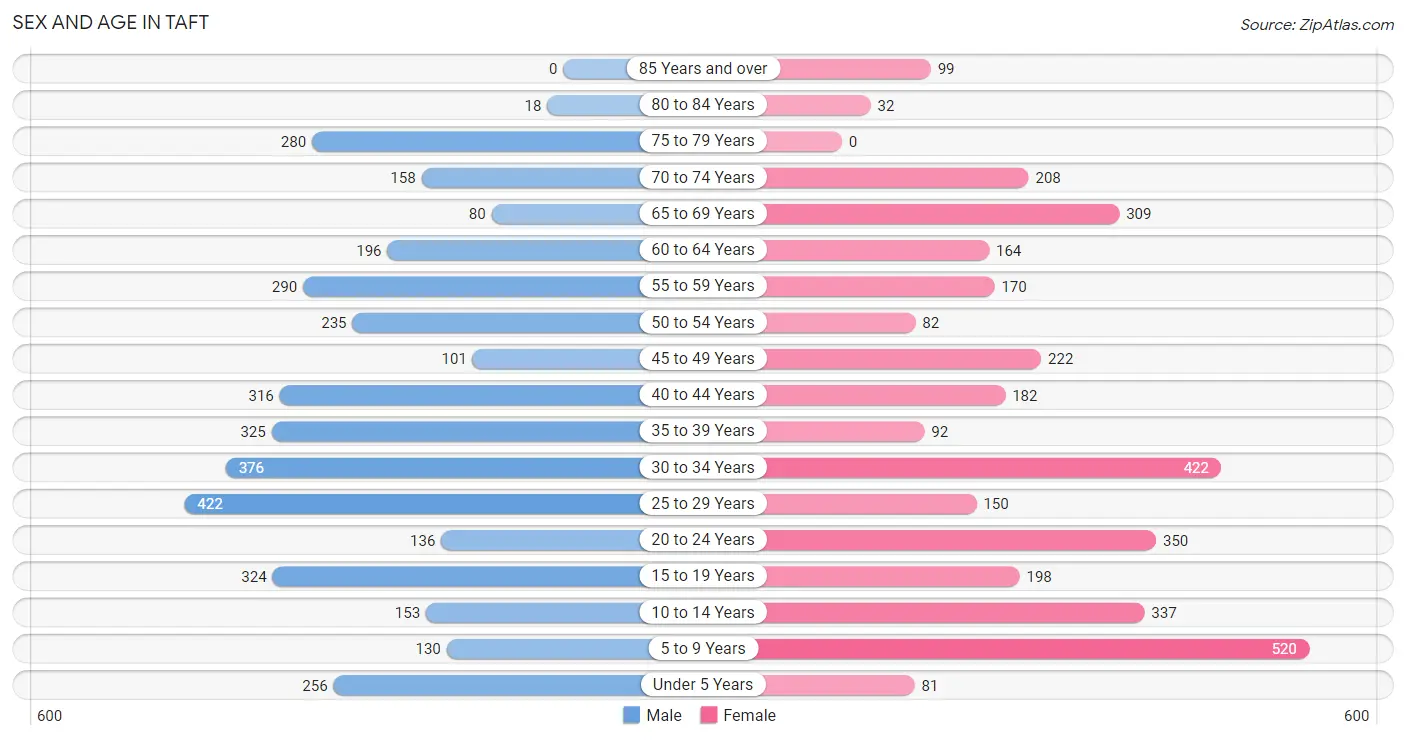
Sex and Age in Taft
Sex and Age in Taft
The most populous age groups in Taft are 25 to 29 Years (422 | 11.1%) for men and 5 to 9 Years (520 | 14.4%) for women.
| Age Bracket | Male | Female |
| Under 5 Years | 256 (6.7%) | 81 (2.2%) |
| 5 to 9 Years | 130 (3.4%) | 520 (14.4%) |
| 10 to 14 Years | 153 (4.0%) | 337 (9.3%) |
| 15 to 19 Years | 324 (8.5%) | 198 (5.5%) |
| 20 to 24 Years | 136 (3.6%) | 350 (9.7%) |
| 25 to 29 Years | 422 (11.1%) | 150 (4.2%) |
| 30 to 34 Years | 376 (9.9%) | 422 (11.7%) |
| 35 to 39 Years | 325 (8.6%) | 92 (2.5%) |
| 40 to 44 Years | 316 (8.3%) | 182 (5.0%) |
| 45 to 49 Years | 101 (2.7%) | 222 (6.1%) |
| 50 to 54 Years | 235 (6.2%) | 82 (2.3%) |
| 55 to 59 Years | 290 (7.6%) | 170 (4.7%) |
| 60 to 64 Years | 196 (5.2%) | 164 (4.5%) |
| 65 to 69 Years | 80 (2.1%) | 309 (8.5%) |
| 70 to 74 Years | 158 (4.2%) | 208 (5.8%) |
| 75 to 79 Years | 280 (7.4%) | 0 (0.0%) |
| 80 to 84 Years | 18 (0.5%) | 32 (0.9%) |
| 85 Years and over | 0 (0.0%) | 99 (2.7%) |
| Total | 3,796 (100.0%) | 3,618 (100.0%) |
Families and Households in Taft
Median Family Size in Taft
The median family size in Taft is 3.20 persons per family, with married-couple families (1,059 | 62.2%) accounting for the largest median family size of 3.42 persons per family. On the other hand, single male/father families (367 | 21.6%) represent the smallest median family size with 2.51 persons per family.
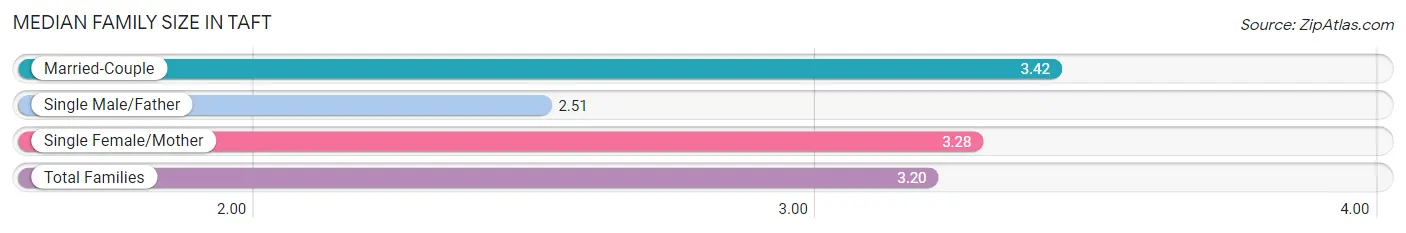
| Family Type | # Families | Family Size |
| Married-Couple | 1,059 (62.2%) | 3.42 |
| Single Male/Father | 367 (21.6%) | 2.51 |
| Single Female/Mother | 276 (16.2%) | 3.28 |
| Total Families | 1,702 (100.0%) | 3.20 |
Median Household Size in Taft
The median household size in Taft is 2.59 persons per household, with single female/mother households (276 | 10.3%) accounting for the largest median household size of 3.57 persons per household. non-family households (972 | 36.3%) represent the smallest median household size with 1.10 persons per household.
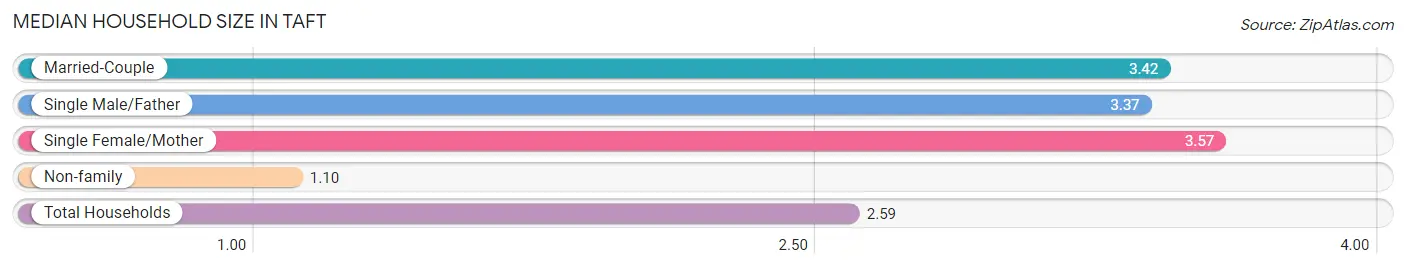
| Household Type | # Households | Household Size |
| Married-Couple | 1,059 (39.6%) | 3.42 |
| Single Male/Father | 367 (13.7%) | 3.37 |
| Single Female/Mother | 276 (10.3%) | 3.57 |
| Non-family | 972 (36.3%) | 1.10 |
| Total Households | 2,674 (100.0%) | 2.59 |
Household Size by Marriage Status in Taft
Out of a total of 2,674 households in Taft, 1,702 (63.6%) are family households, while 972 (36.3%) are nonfamily households. The most numerous type of family households are 2-person households, comprising 568, and the most common type of nonfamily households are 1-person households, comprising 872.
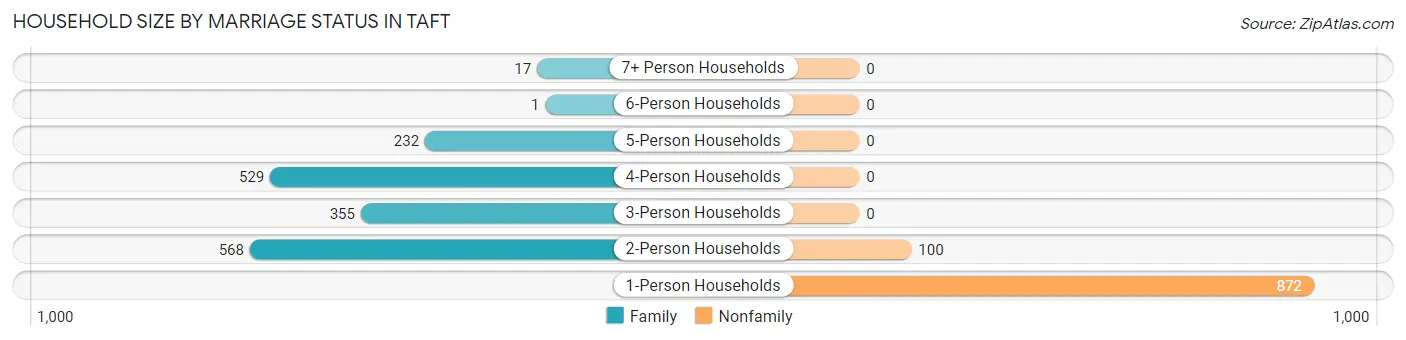
| Household Size | Family Households | Nonfamily Households |
| 1-Person Households | - | 872 (32.6%) |
| 2-Person Households | 568 (21.2%) | 100 (3.7%) |
| 3-Person Households | 355 (13.3%) | 0 (0.0%) |
| 4-Person Households | 529 (19.8%) | 0 (0.0%) |
| 5-Person Households | 232 (8.7%) | 0 (0.0%) |
| 6-Person Households | 1 (0.0%) | 0 (0.0%) |
| 7+ Person Households | 17 (0.6%) | 0 (0.0%) |
| Total | 1,702 (63.6%) | 972 (36.3%) |
Female Fertility in Taft
Fertility by Age in Taft
Average fertility rate in Taft is 77.0 births per 1,000 women. Women in the age bracket of 20 to 34 years have the highest fertility rate with 136.0 births per 1,000 women. Women in the age bracket of 20 to 34 years acount for 100.0% of all women with births.
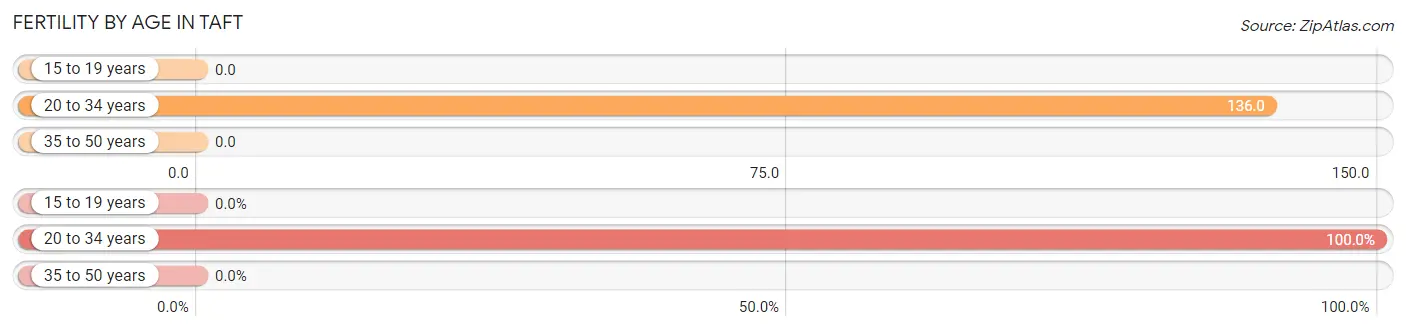
| Age Bracket | Women with Births | Births / 1,000 Women |
| 15 to 19 years | 0 (0.0%) | 0.0 |
| 20 to 34 years | 125 (100.0%) | 136.0 |
| 35 to 50 years | 0 (0.0%) | 0.0 |
| Total | 125 (100.0%) | 77.0 |
Fertility by Age by Marriage Status in Taft
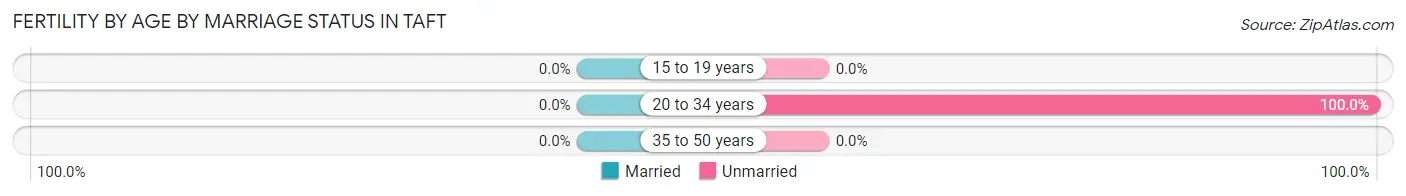
| Age Bracket | Married | Unmarried |
| 15 to 19 years | 0 (0.0%) | 0 (0.0%) |
| 20 to 34 years | 0 (0.0%) | 125 (100.0%) |
| 35 to 50 years | 0 (0.0%) | 0 (0.0%) |
| Total | 0 (0.0%) | 125 (100.0%) |
Fertility by Education in Taft
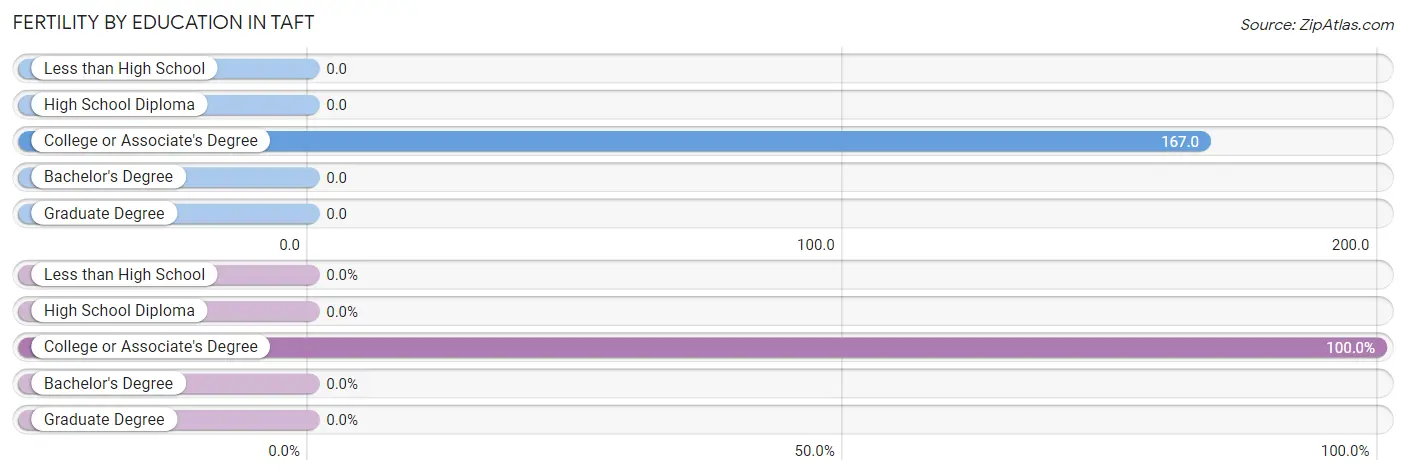
| Educational Attainment | Women with Births | Births / 1,000 Women |
| Less than High School | 0 (0.0%) | 0.0 |
| High School Diploma | 0 (0.0%) | 0.0 |
| College or Associate's Degree | 125 (100.0%) | 167.0 |
| Bachelor's Degree | 0 (0.0%) | 0.0 |
| Graduate Degree | 0 (0.0%) | 0.0 |
| Total | 125 (100.0%) | 77.0 |
Fertility by Education by Marriage Status in Taft
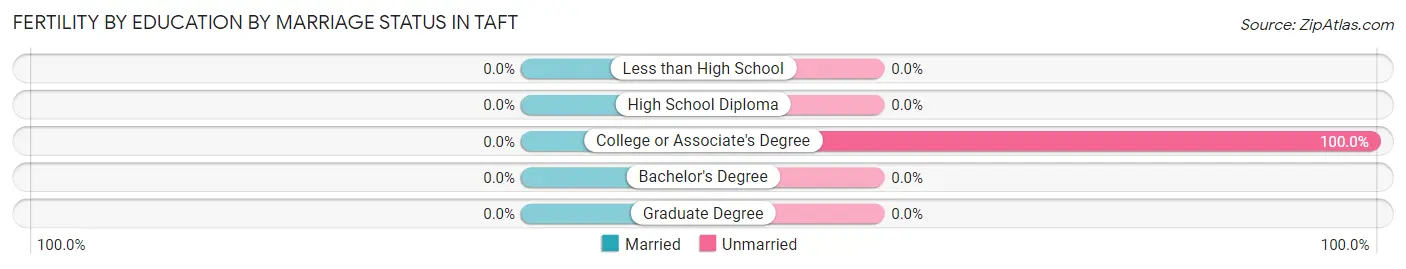
| Educational Attainment | Married | Unmarried |
| Less than High School | 0 (0.0%) | 0 (0.0%) |
| High School Diploma | 0 (0.0%) | 0 (0.0%) |
| College or Associate's Degree | 0 (0.0%) | 125 (100.0%) |
| Bachelor's Degree | 0 (0.0%) | 0 (0.0%) |
| Graduate Degree | 0 (0.0%) | 0 (0.0%) |
| Total | 0 (0.0%) | 125 (100.0%) |
Employment Characteristics in Taft
Employment by Class of Employer in Taft
Among the 2,601 employed individuals in Taft, private company employees (1,633 | 62.8%), local government employees (579 | 22.3%), and state government employees (152 | 5.8%) make up the most common classes of employment.
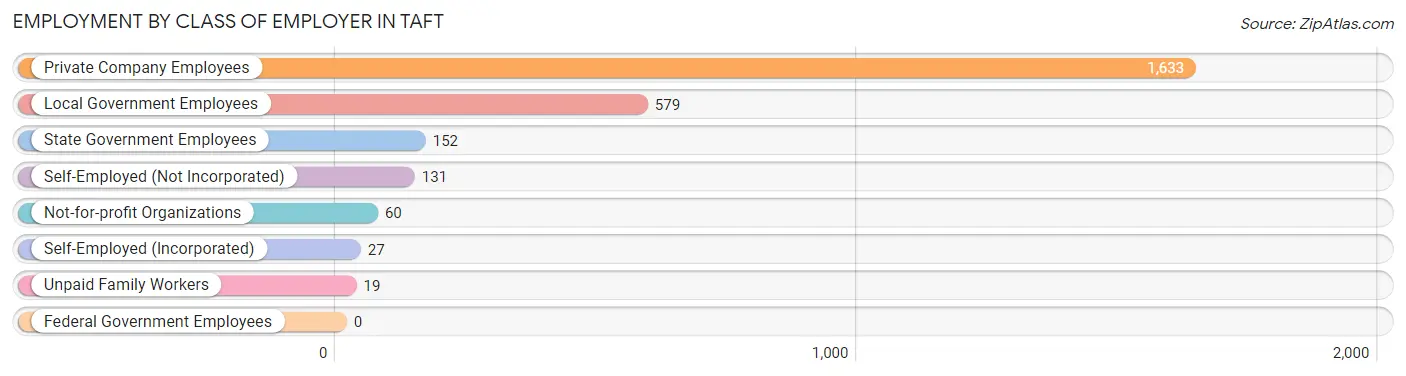
| Employer Class | # Employees | % Employees |
| Private Company Employees | 1,633 | 62.8% |
| Self-Employed (Incorporated) | 27 | 1.0% |
| Self-Employed (Not Incorporated) | 131 | 5.0% |
| Not-for-profit Organizations | 60 | 2.3% |
| Local Government Employees | 579 | 22.3% |
| State Government Employees | 152 | 5.8% |
| Federal Government Employees | 0 | 0.0% |
| Unpaid Family Workers | 19 | 0.7% |
| Total | 2,601 | 100.0% |
Employment Status by Age in Taft
According to the labor force statistics for Taft, out of the total population over 16 years of age (5,879), 47.4% or 2,787 individuals are in the labor force, with 4.8% or 134 of them unemployed. The age group with the highest labor force participation rate is 20 to 24 years, with 78.2% or 380 individuals in the labor force. Within the labor force, the 16 to 19 years age range has the highest percentage of unemployed individuals, with 33.6% or 72 of them being unemployed.
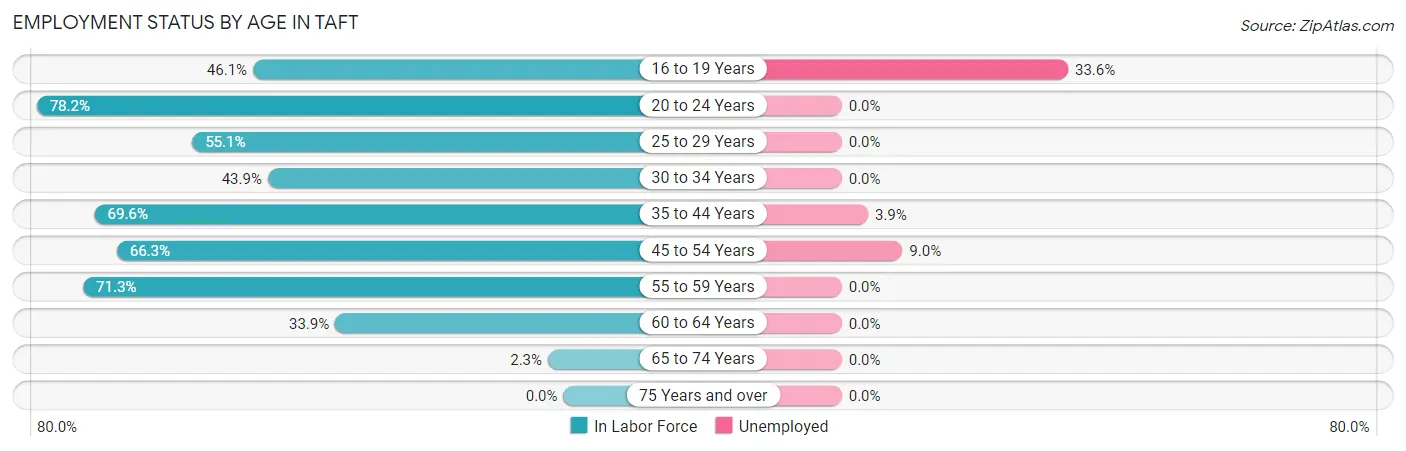
| Age Bracket | In Labor Force | Unemployed |
| 16 to 19 Years | 214 (46.1%) | 72 (33.6%) |
| 20 to 24 Years | 380 (78.2%) | 0 (0.0%) |
| 25 to 29 Years | 315 (55.1%) | 0 (0.0%) |
| 30 to 34 Years | 350 (43.9%) | 0 (0.0%) |
| 35 to 44 Years | 637 (69.6%) | 25 (3.9%) |
| 45 to 54 Years | 424 (66.3%) | 38 (9.0%) |
| 55 to 59 Years | 328 (71.3%) | 0 (0.0%) |
| 60 to 64 Years | 122 (33.9%) | 0 (0.0%) |
| 65 to 74 Years | 17 (2.3%) | 0 (0.0%) |
| 75 Years and over | 0 (0.0%) | 0 (0.0%) |
| Total | 2,787 (47.4%) | 134 (4.8%) |
Employment Status by Educational Attainment in Taft
According to labor force statistics for Taft, 58.1% of individuals (2,176) out of the total population between 25 and 64 years of age (3,745) are in the labor force, with 2.9% or 63 of them being unemployed. The group with the highest labor force participation rate are those with the educational attainment of college / associate degree, with 67.0% or 909 individuals in the labor force. Within the labor force, individuals with college / associate degree education have the highest percentage of unemployment, with 4.2% or 38 of them being unemployed.
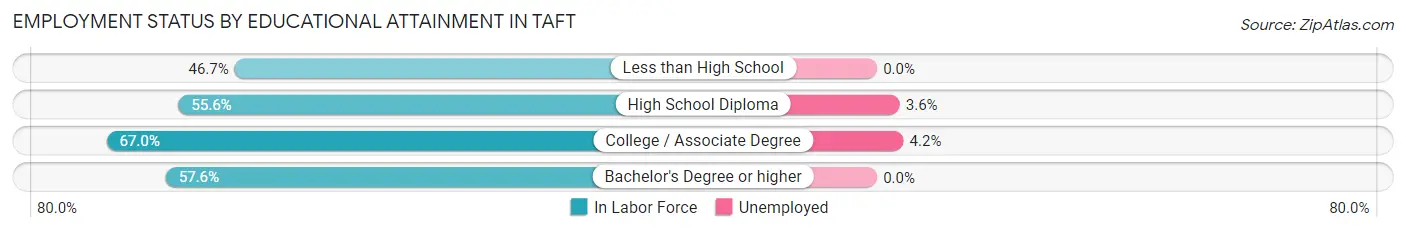
| Educational Attainment | In Labor Force | Unemployed |
| Less than High School | 355 (46.7%) | 0 (0.0%) |
| High School Diploma | 692 (55.6%) | 45 (3.6%) |
| College / Associate Degree | 909 (67.0%) | 57 (4.2%) |
| Bachelor's Degree or higher | 221 (57.6%) | 0 (0.0%) |
| Total | 2,176 (58.1%) | 109 (2.9%) |
Employment Occupations by Sex in Taft
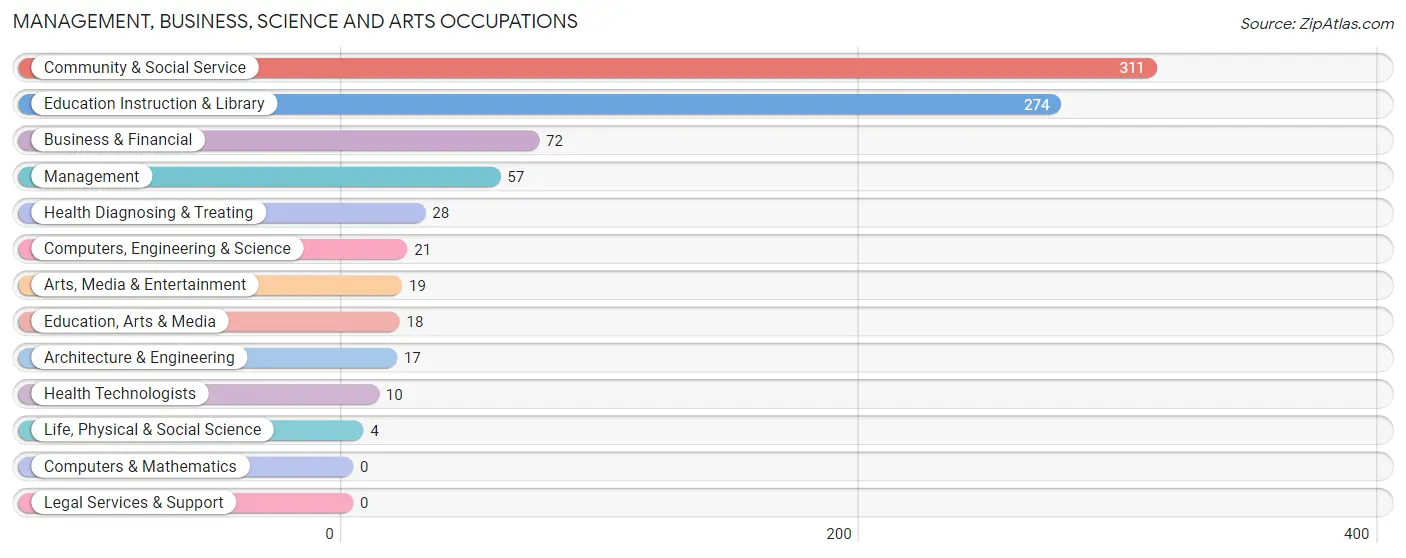
Management, Business, Science and Arts Occupations
The most common Management, Business, Science and Arts occupations in Taft are Community & Social Service (311 | 11.7%), Education Instruction & Library (274 | 10.3%), Business & Financial (72 | 2.7%), Management (57 | 2.1%), and Health Diagnosing & Treating (28 | 1.1%).
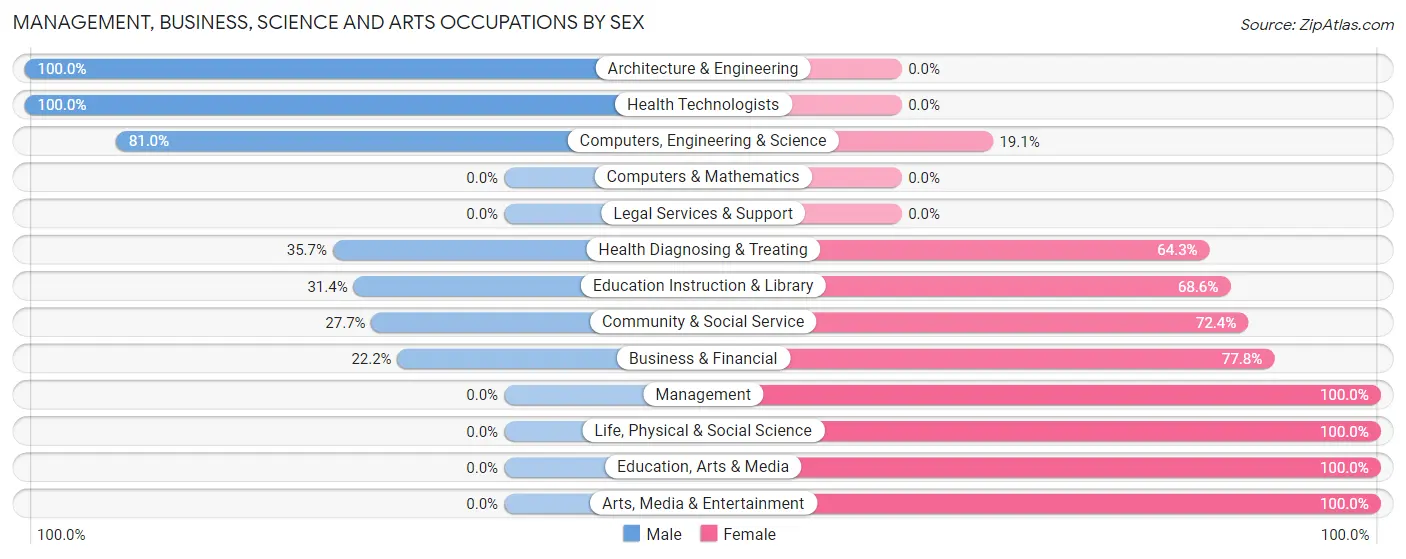
Management, Business, Science and Arts Occupations by Sex
Within the Management, Business, Science and Arts occupations in Taft, the most male-oriented occupations are Architecture & Engineering (100.0%), Health Technologists (100.0%), and Computers, Engineering & Science (80.9%), while the most female-oriented occupations are Management (100.0%), Life, Physical & Social Science (100.0%), and Education, Arts & Media (100.0%).
| Occupation | Male | Female |
| Management | 0 (0.0%) | 57 (100.0%) |
| Business & Financial | 16 (22.2%) | 56 (77.8%) |
| Computers, Engineering & Science | 17 (80.9%) | 4 (19.1%) |
| Computers & Mathematics | 0 (0.0%) | 0 (0.0%) |
| Architecture & Engineering | 17 (100.0%) | 0 (0.0%) |
| Life, Physical & Social Science | 0 (0.0%) | 4 (100.0%) |
| Community & Social Service | 86 (27.7%) | 225 (72.4%) |
| Education, Arts & Media | 0 (0.0%) | 18 (100.0%) |
| Legal Services & Support | 0 (0.0%) | 0 (0.0%) |
| Education Instruction & Library | 86 (31.4%) | 188 (68.6%) |
| Arts, Media & Entertainment | 0 (0.0%) | 19 (100.0%) |
| Health Diagnosing & Treating | 10 (35.7%) | 18 (64.3%) |
| Health Technologists | 10 (100.0%) | 0 (0.0%) |
| Total (Category) | 129 (26.4%) | 360 (73.6%) |
| Total (Overall) | 1,506 (56.8%) | 1,146 (43.2%) |
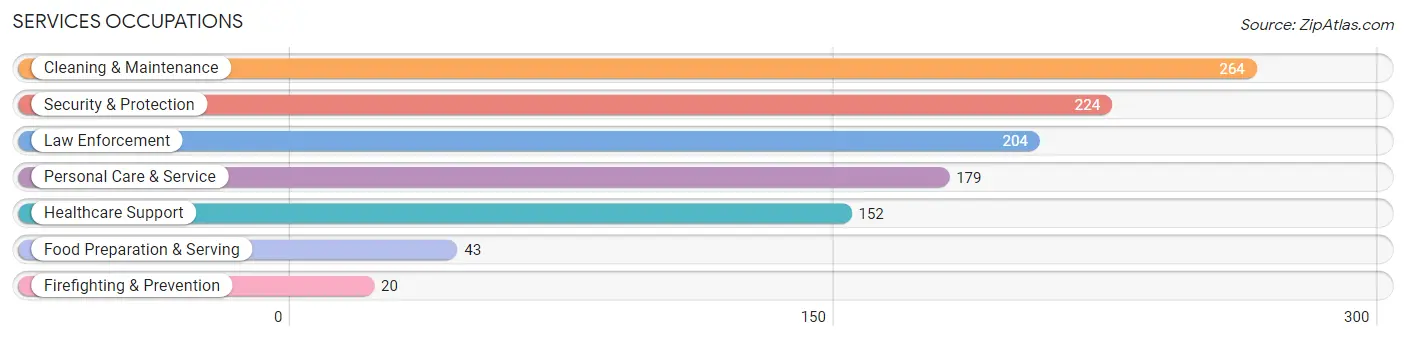
Services Occupations
The most common Services occupations in Taft are Cleaning & Maintenance (264 | 10.0%), Security & Protection (224 | 8.5%), Law Enforcement (204 | 7.7%), Personal Care & Service (179 | 6.8%), and Healthcare Support (152 | 5.7%).
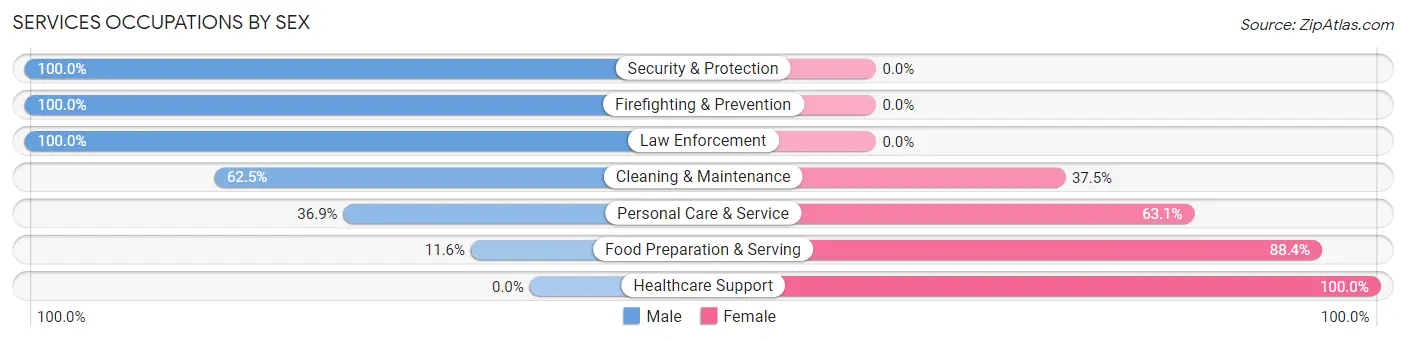
Services Occupations by Sex
Within the Services occupations in Taft, the most male-oriented occupations are Security & Protection (100.0%), Firefighting & Prevention (100.0%), and Law Enforcement (100.0%), while the most female-oriented occupations are Healthcare Support (100.0%), Food Preparation & Serving (88.4%), and Personal Care & Service (63.1%).
| Occupation | Male | Female |
| Healthcare Support | 0 (0.0%) | 152 (100.0%) |
| Security & Protection | 224 (100.0%) | 0 (0.0%) |
| Firefighting & Prevention | 20 (100.0%) | 0 (0.0%) |
| Law Enforcement | 204 (100.0%) | 0 (0.0%) |
| Food Preparation & Serving | 5 (11.6%) | 38 (88.4%) |
| Cleaning & Maintenance | 165 (62.5%) | 99 (37.5%) |
| Personal Care & Service | 66 (36.9%) | 113 (63.1%) |
| Total (Category) | 460 (53.4%) | 402 (46.6%) |
| Total (Overall) | 1,506 (56.8%) | 1,146 (43.2%) |
Sales and Office Occupations
The most common Sales and Office occupations in Taft are Sales & Related (184 | 6.9%), and Office & Administration (117 | 4.4%).
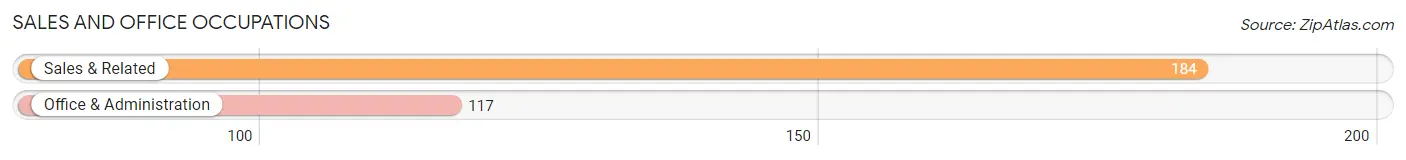
Sales and Office Occupations by Sex
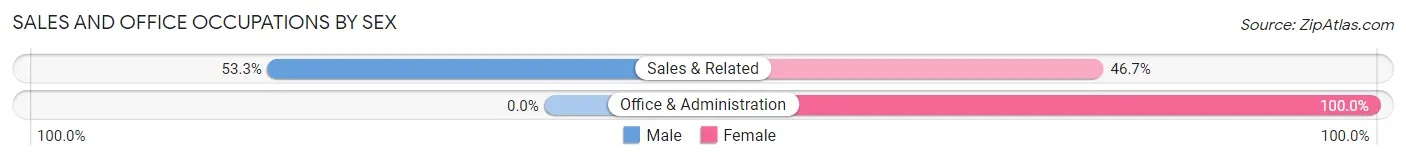
| Occupation | Male | Female |
| Sales & Related | 98 (53.3%) | 86 (46.7%) |
| Office & Administration | 0 (0.0%) | 117 (100.0%) |
| Total (Category) | 98 (32.6%) | 203 (67.4%) |
| Total (Overall) | 1,506 (56.8%) | 1,146 (43.2%) |
Natural Resources, Construction and Maintenance Occupations
The most common Natural Resources, Construction and Maintenance occupations in Taft are Construction & Extraction (284 | 10.7%), Farming, Fishing & Forestry (162 | 6.1%), and Installation, Maintenance & Repair (97 | 3.7%).
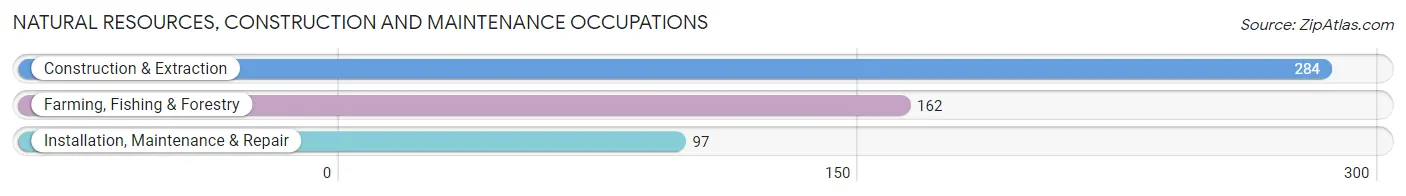
Natural Resources, Construction and Maintenance Occupations by Sex
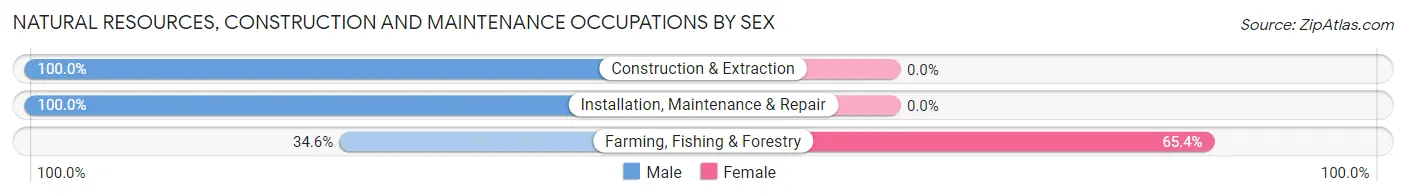
| Occupation | Male | Female |
| Farming, Fishing & Forestry | 56 (34.6%) | 106 (65.4%) |
| Construction & Extraction | 284 (100.0%) | 0 (0.0%) |
| Installation, Maintenance & Repair | 97 (100.0%) | 0 (0.0%) |
| Total (Category) | 437 (80.5%) | 106 (19.5%) |
| Total (Overall) | 1,506 (56.8%) | 1,146 (43.2%) |
Production, Transportation and Moving Occupations
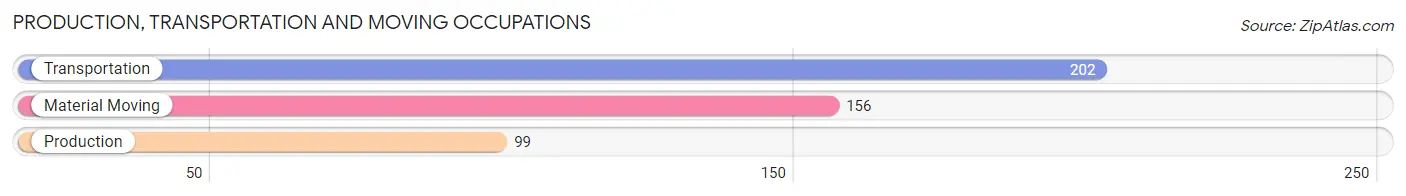
The most common Production, Transportation and Moving occupations in Taft are Transportation (202 | 7.6%), Material Moving (156 | 5.9%), and Production (99 | 3.7%).
Production, Transportation and Moving Occupations by Sex
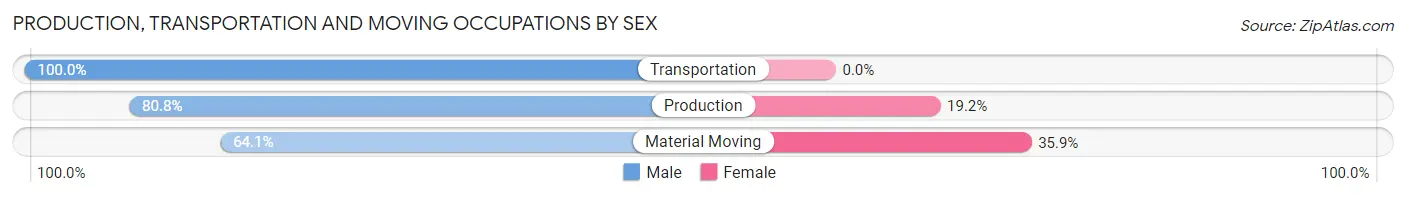
| Occupation | Male | Female |
| Production | 80 (80.8%) | 19 (19.2%) |
| Transportation | 202 (100.0%) | 0 (0.0%) |
| Material Moving | 100 (64.1%) | 56 (35.9%) |
| Total (Category) | 382 (83.6%) | 75 (16.4%) |
| Total (Overall) | 1,506 (56.8%) | 1,146 (43.2%) |
Employment Industries by Sex in Taft
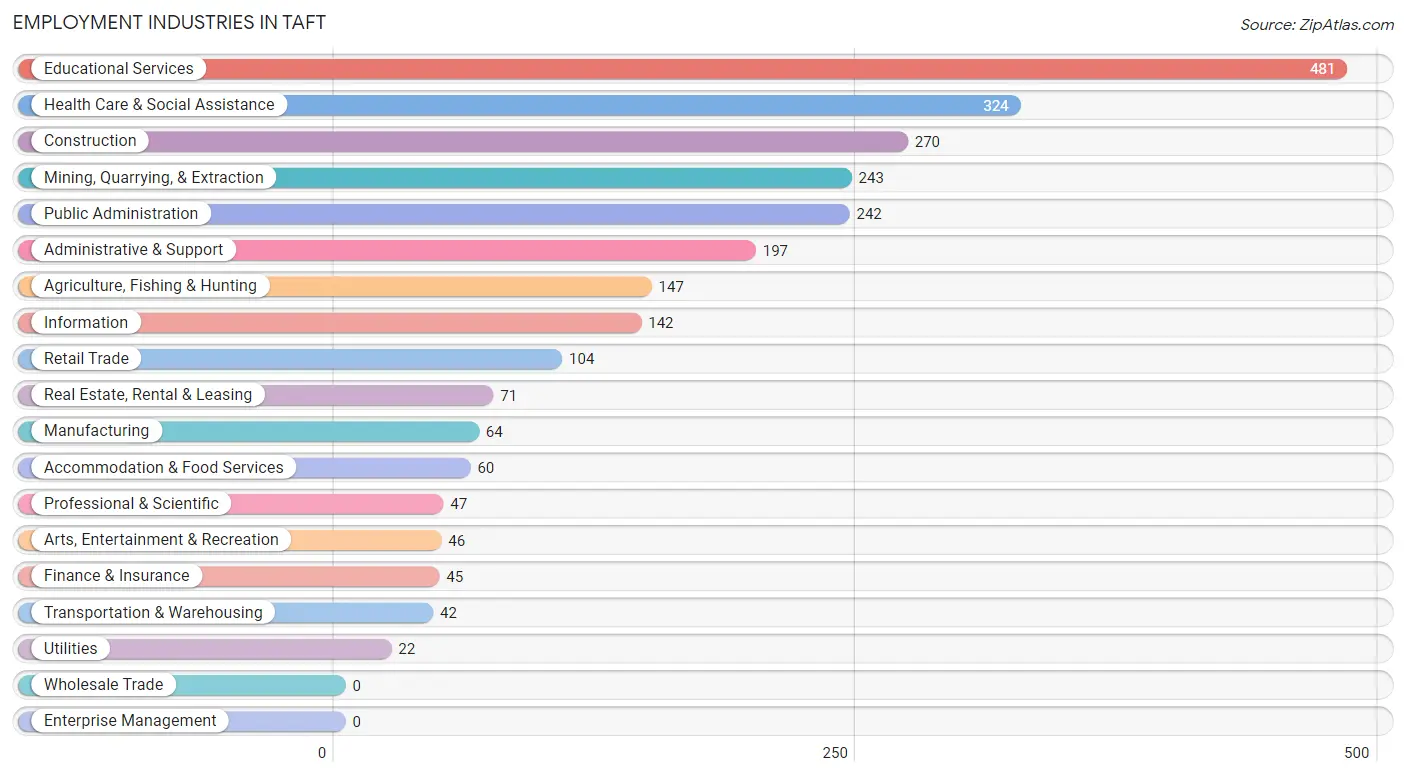
Employment Industries in Taft
The major employment industries in Taft include Educational Services (481 | 18.1%), Health Care & Social Assistance (324 | 12.2%), Construction (270 | 10.2%), Mining, Quarrying, & Extraction (243 | 9.2%), and Public Administration (242 | 9.1%).
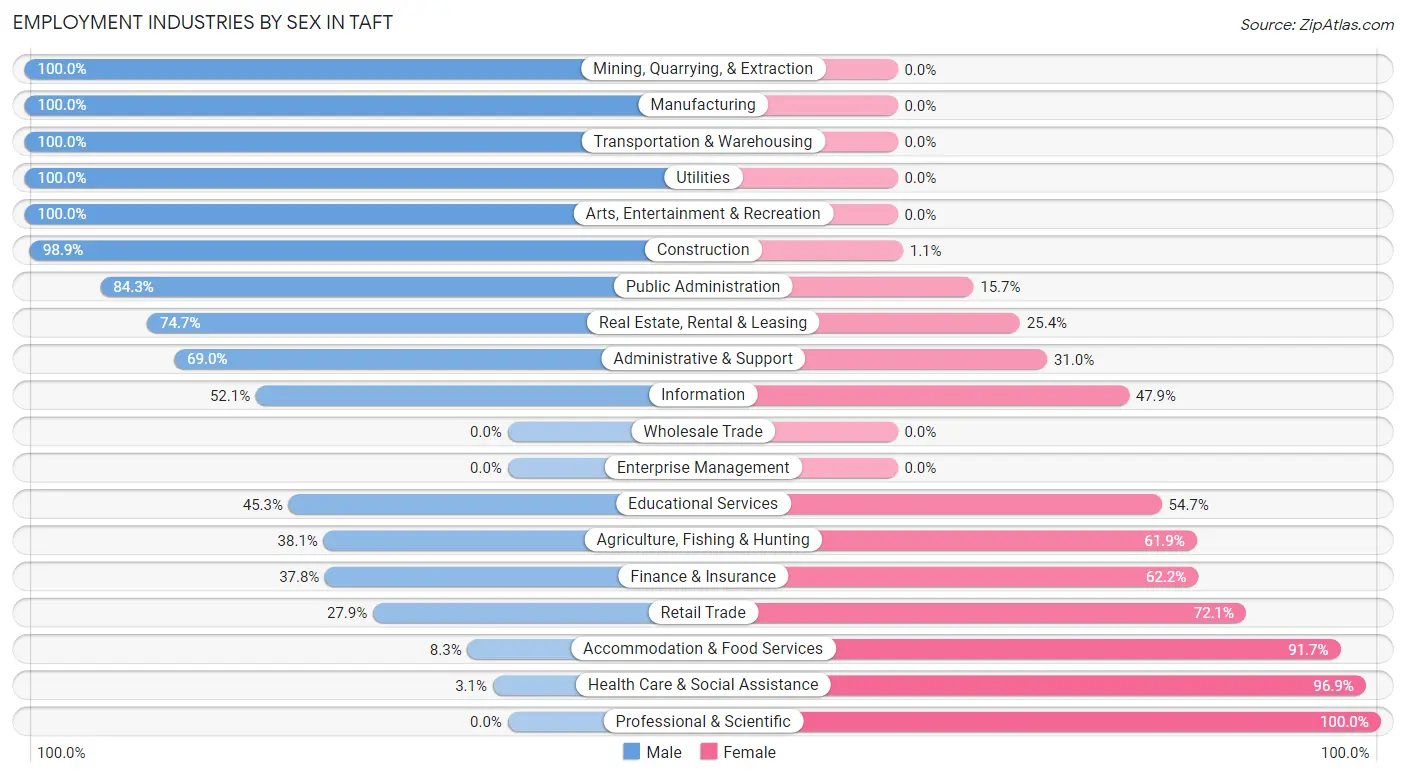
Employment Industries by Sex in Taft
The Taft industries that see more men than women are Mining, Quarrying, & Extraction (100.0%), Manufacturing (100.0%), and Transportation & Warehousing (100.0%), whereas the industries that tend to have a higher number of women are Professional & Scientific (100.0%), Health Care & Social Assistance (96.9%), and Accommodation & Food Services (91.7%).
| Industry | Male | Female |
| Agriculture, Fishing & Hunting | 56 (38.1%) | 91 (61.9%) |
| Mining, Quarrying, & Extraction | 243 (100.0%) | 0 (0.0%) |
| Construction | 267 (98.9%) | 3 (1.1%) |
| Manufacturing | 64 (100.0%) | 0 (0.0%) |
| Wholesale Trade | 0 (0.0%) | 0 (0.0%) |
| Retail Trade | 29 (27.9%) | 75 (72.1%) |
| Transportation & Warehousing | 42 (100.0%) | 0 (0.0%) |
| Utilities | 22 (100.0%) | 0 (0.0%) |
| Information | 74 (52.1%) | 68 (47.9%) |
| Finance & Insurance | 17 (37.8%) | 28 (62.2%) |
| Real Estate, Rental & Leasing | 53 (74.7%) | 18 (25.4%) |
| Professional & Scientific | 0 (0.0%) | 47 (100.0%) |
| Enterprise Management | 0 (0.0%) | 0 (0.0%) |
| Administrative & Support | 136 (69.0%) | 61 (31.0%) |
| Educational Services | 218 (45.3%) | 263 (54.7%) |
| Health Care & Social Assistance | 10 (3.1%) | 314 (96.9%) |
| Arts, Entertainment & Recreation | 46 (100.0%) | 0 (0.0%) |
| Accommodation & Food Services | 5 (8.3%) | 55 (91.7%) |
| Public Administration | 204 (84.3%) | 38 (15.7%) |
| Total | 1,506 (56.8%) | 1,146 (43.2%) |
Education in Taft
School Enrollment in Taft
The most common levels of schooling among the 2,076 students in Taft are college / undergraduate (657 | 31.7%), elementary school (530 | 25.5%), and middle school (388 | 18.7%).
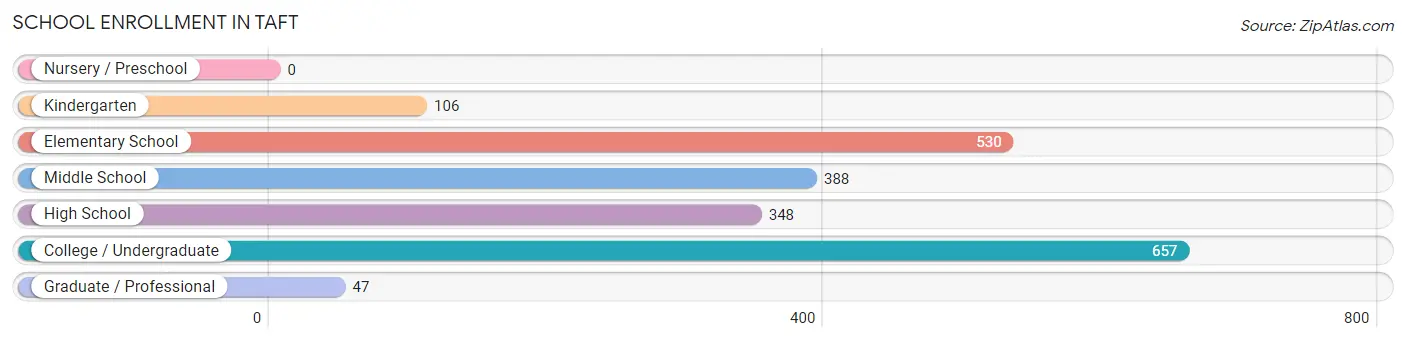
| School Level | # Students | % Students |
| Nursery / Preschool | 0 | 0.0% |
| Kindergarten | 106 | 5.1% |
| Elementary School | 530 | 25.5% |
| Middle School | 388 | 18.7% |
| High School | 348 | 16.8% |
| College / Undergraduate | 657 | 31.7% |
| Graduate / Professional | 47 | 2.3% |
| Total | 2,076 | 100.0% |
School Enrollment by Age by Funding Source in Taft
Out of a total of 2,076 students who are enrolled in schools in Taft, 131 (6.3%) attend a private institution, while the remaining 1,945 (93.7%) are enrolled in public schools. The age group of 25 to 34 year olds has the highest likelihood of being enrolled in private schools, with 18 (13.0% in the age bracket) enrolled. Conversely, the age group of 10 to 14 year olds has the lowest likelihood of being enrolled in a private school, with 490 (100.0% in the age bracket) attending a public institution.
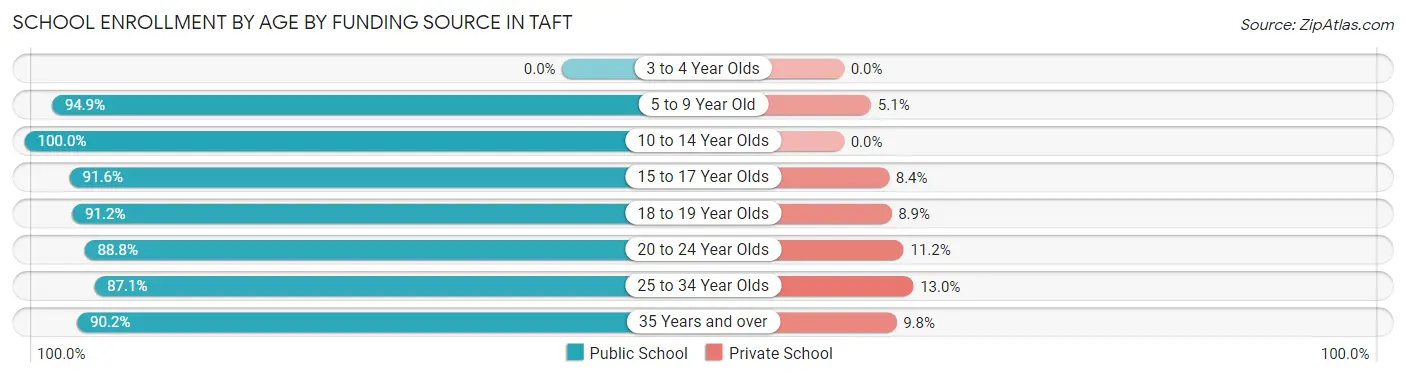
| Age Bracket | Public School | Private School |
| 3 to 4 Year Olds | 0 (0.0%) | 0 (0.0%) |
| 5 to 9 Year Old | 543 (94.9%) | 29 (5.1%) |
| 10 to 14 Year Olds | 490 (100.0%) | 0 (0.0%) |
| 15 to 17 Year Olds | 229 (91.6%) | 21 (8.4%) |
| 18 to 19 Year Olds | 206 (91.1%) | 20 (8.8%) |
| 20 to 24 Year Olds | 191 (88.8%) | 24 (11.2%) |
| 25 to 34 Year Olds | 121 (87.1%) | 18 (13.0%) |
| 35 Years and over | 166 (90.2%) | 18 (9.8%) |
| Total | 1,945 (93.7%) | 131 (6.3%) |
Educational Attainment by Field of Study in Taft
Business (108 | 19.7%), education (101 | 18.5%), literature & languages (81 | 14.8%), liberal arts & history (62 | 11.3%), and science & technology (45 | 8.2%) are the most common fields of study among 547 individuals in Taft who have obtained a bachelor's degree or higher.
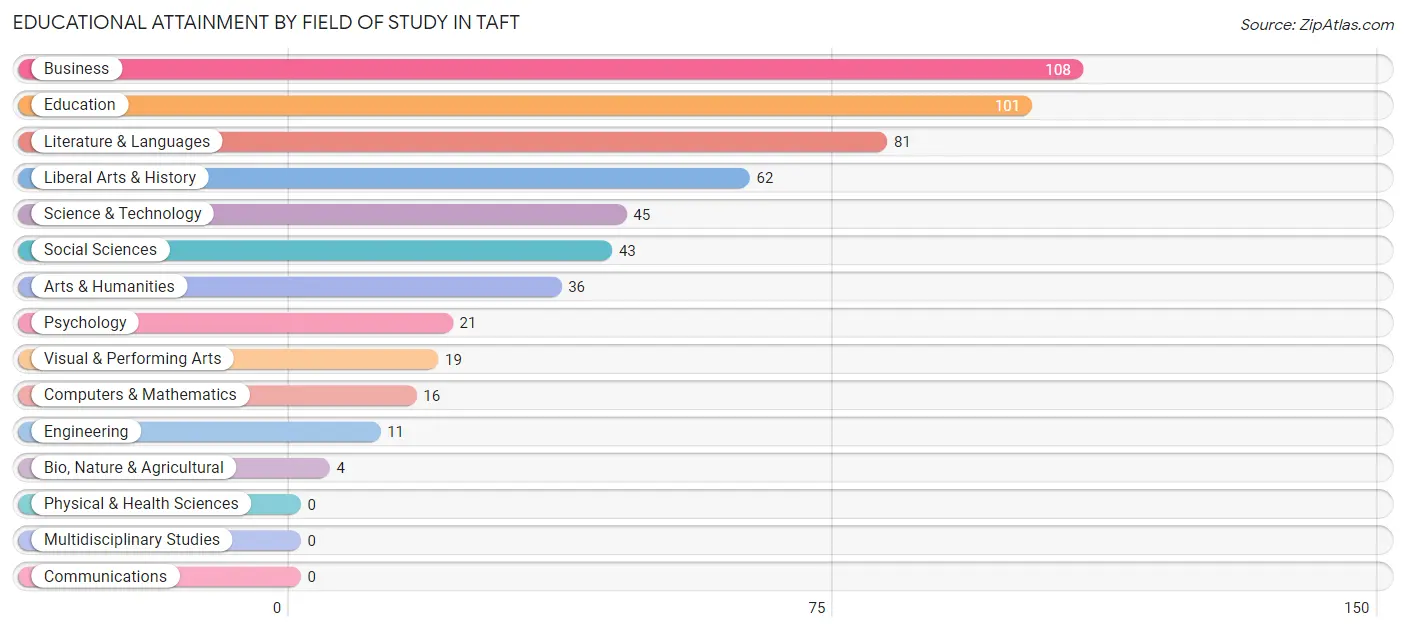
| Field of Study | # Graduates | % Graduates |
| Computers & Mathematics | 16 | 2.9% |
| Bio, Nature & Agricultural | 4 | 0.7% |
| Physical & Health Sciences | 0 | 0.0% |
| Psychology | 21 | 3.8% |
| Social Sciences | 43 | 7.9% |
| Engineering | 11 | 2.0% |
| Multidisciplinary Studies | 0 | 0.0% |
| Science & Technology | 45 | 8.2% |
| Business | 108 | 19.7% |
| Education | 101 | 18.5% |
| Literature & Languages | 81 | 14.8% |
| Liberal Arts & History | 62 | 11.3% |
| Visual & Performing Arts | 19 | 3.5% |
| Communications | 0 | 0.0% |
| Arts & Humanities | 36 | 6.6% |
| Total | 547 | 100.0% |
Transportation & Commute in Taft
Vehicle Availability by Sex in Taft
The most prevalent vehicle ownership categories in Taft are males with 2 vehicles (621, accounting for 41.6%) and females with 2 vehicles (239, making up 59.6%).
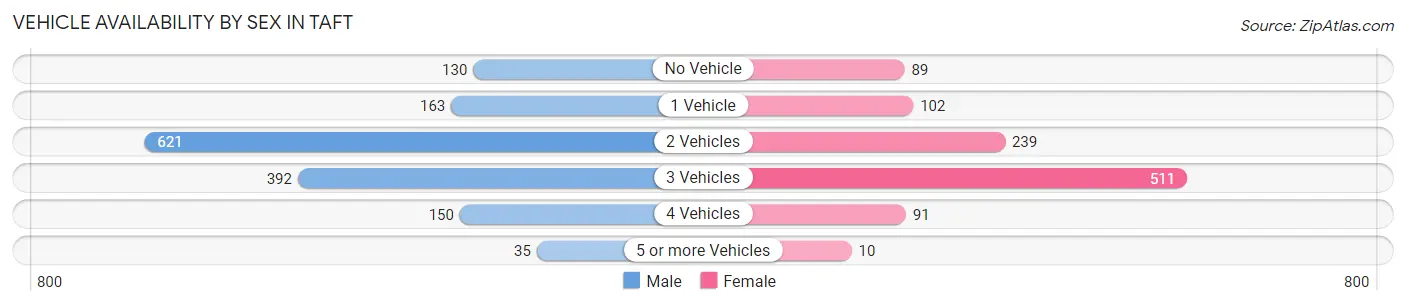
| Vehicles Available | Male | Female |
| No Vehicle | 130 (8.7%) | 89 (8.5%) |
| 1 Vehicle | 163 (10.9%) | 102 (9.8%) |
| 2 Vehicles | 621 (41.6%) | 239 (22.9%) |
| 3 Vehicles | 392 (26.3%) | 511 (49.0%) |
| 4 Vehicles | 150 (10.1%) | 91 (8.7%) |
| 5 or more Vehicles | 35 (2.4%) | 10 (1.0%) |
| Total | 1,491 (100.0%) | 1,042 (100.0%) |
Commute Time in Taft
The most frequently occuring commute durations in Taft are 5 to 9 minutes (638 commuters, 25.9%), 10 to 14 minutes (403 commuters, 16.4%), and 15 to 19 minutes (394 commuters, 16.0%).
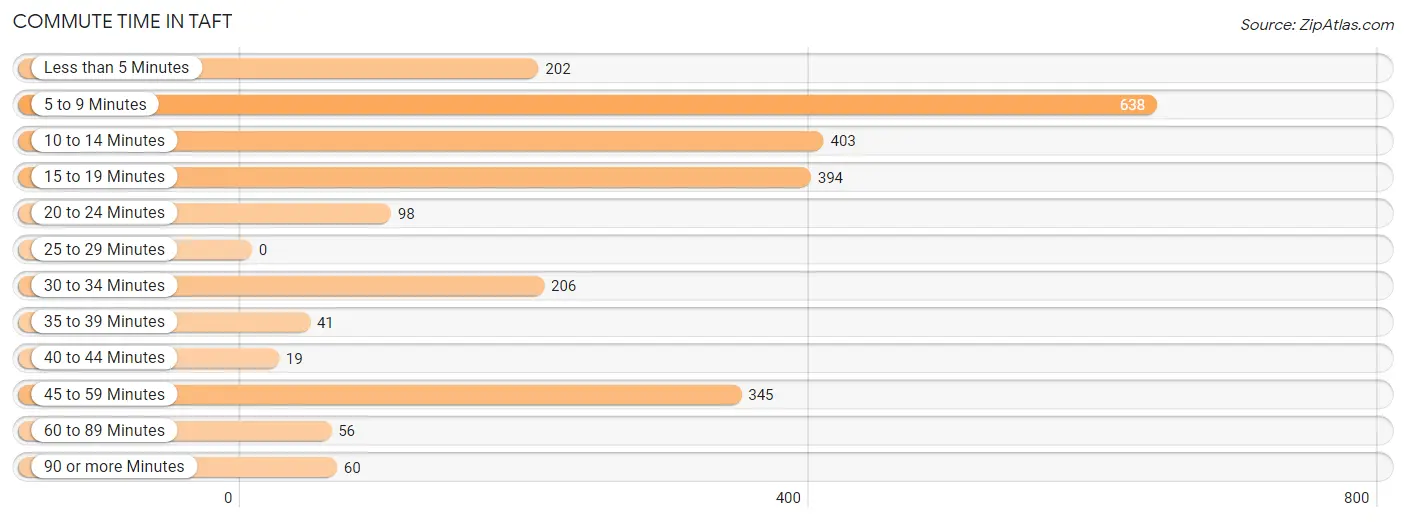
| Commute Time | # Commuters | % Commuters |
| Less than 5 Minutes | 202 | 8.2% |
| 5 to 9 Minutes | 638 | 25.9% |
| 10 to 14 Minutes | 403 | 16.4% |
| 15 to 19 Minutes | 394 | 16.0% |
| 20 to 24 Minutes | 98 | 4.0% |
| 25 to 29 Minutes | 0 | 0.0% |
| 30 to 34 Minutes | 206 | 8.4% |
| 35 to 39 Minutes | 41 | 1.7% |
| 40 to 44 Minutes | 19 | 0.8% |
| 45 to 59 Minutes | 345 | 14.0% |
| 60 to 89 Minutes | 56 | 2.3% |
| 90 or more Minutes | 60 | 2.4% |
Commute Time by Sex in Taft
The most common commute times in Taft are 5 to 9 minutes (439 commuters, 29.2%) for males and 10 to 14 minutes (219 commuters, 22.8%) for females.
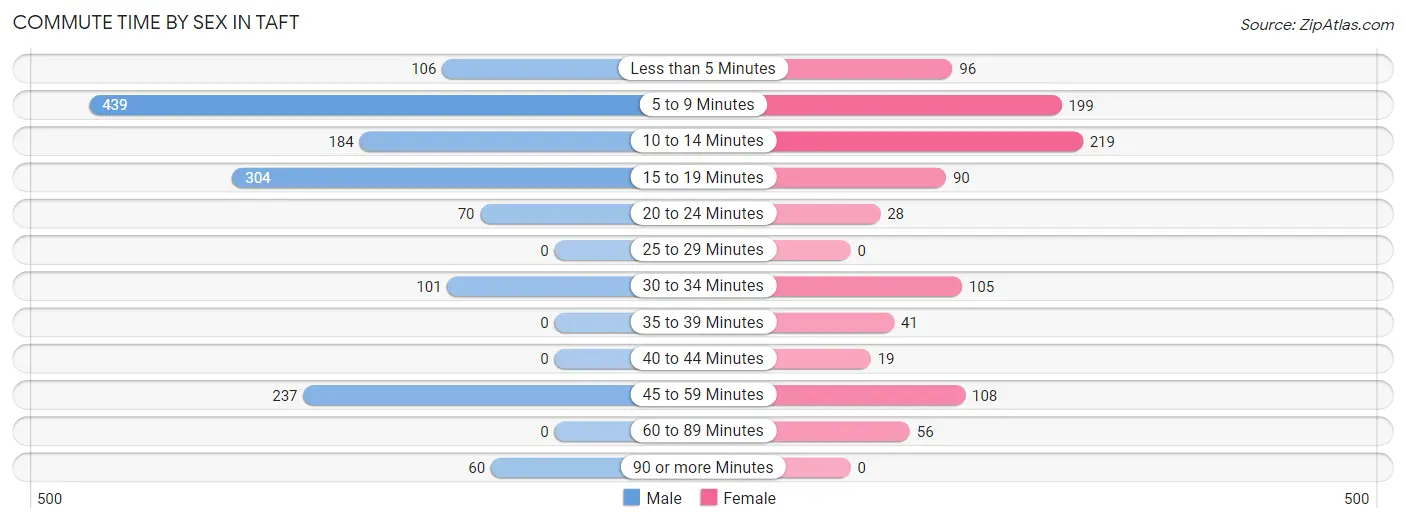
| Commute Time | Male | Female |
| Less than 5 Minutes | 106 (7.1%) | 96 (10.0%) |
| 5 to 9 Minutes | 439 (29.2%) | 199 (20.7%) |
| 10 to 14 Minutes | 184 (12.3%) | 219 (22.8%) |
| 15 to 19 Minutes | 304 (20.3%) | 90 (9.4%) |
| 20 to 24 Minutes | 70 (4.7%) | 28 (2.9%) |
| 25 to 29 Minutes | 0 (0.0%) | 0 (0.0%) |
| 30 to 34 Minutes | 101 (6.7%) | 105 (10.9%) |
| 35 to 39 Minutes | 0 (0.0%) | 41 (4.3%) |
| 40 to 44 Minutes | 0 (0.0%) | 19 (2.0%) |
| 45 to 59 Minutes | 237 (15.8%) | 108 (11.2%) |
| 60 to 89 Minutes | 0 (0.0%) | 56 (5.8%) |
| 90 or more Minutes | 60 (4.0%) | 0 (0.0%) |
Time of Departure to Work by Sex in Taft
The most frequent times of departure to work in Taft are 12:00 AM to 4:59 AM (343, 22.9%) for males and 6:30 AM to 6:59 AM (185, 19.3%) for females.
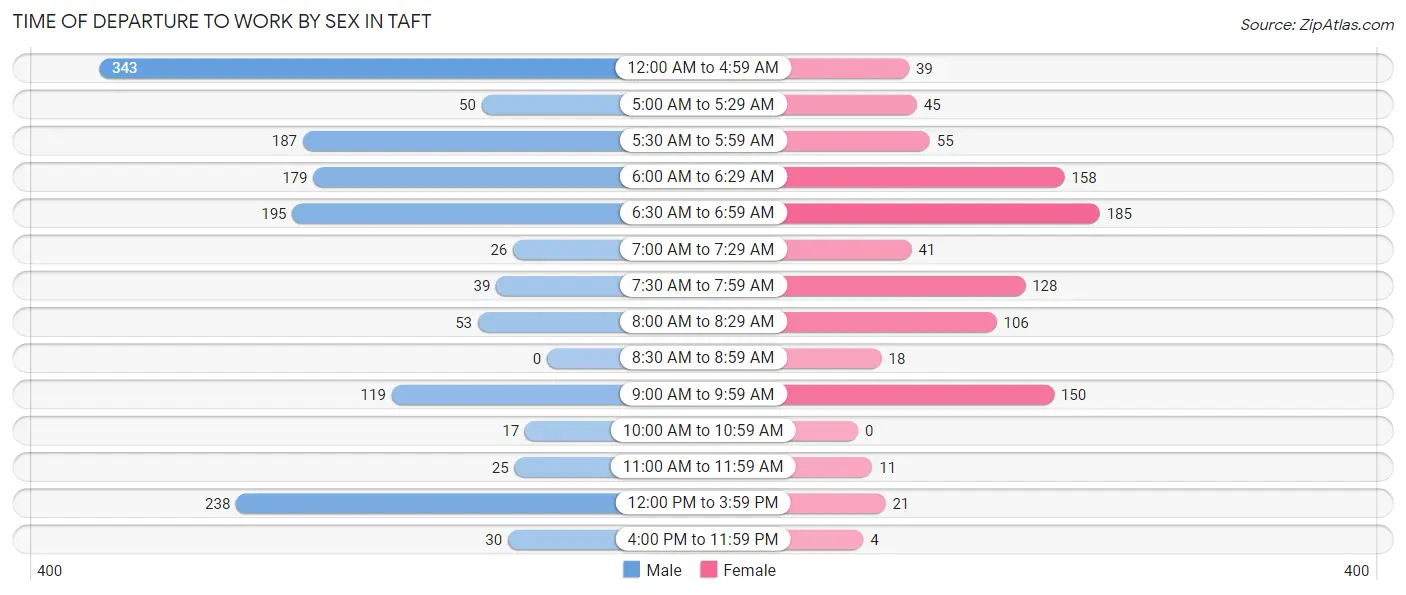
| Time of Departure | Male | Female |
| 12:00 AM to 4:59 AM | 343 (22.9%) | 39 (4.1%) |
| 5:00 AM to 5:29 AM | 50 (3.3%) | 45 (4.7%) |
| 5:30 AM to 5:59 AM | 187 (12.5%) | 55 (5.7%) |
| 6:00 AM to 6:29 AM | 179 (11.9%) | 158 (16.4%) |
| 6:30 AM to 6:59 AM | 195 (13.0%) | 185 (19.3%) |
| 7:00 AM to 7:29 AM | 26 (1.7%) | 41 (4.3%) |
| 7:30 AM to 7:59 AM | 39 (2.6%) | 128 (13.3%) |
| 8:00 AM to 8:29 AM | 53 (3.5%) | 106 (11.0%) |
| 8:30 AM to 8:59 AM | 0 (0.0%) | 18 (1.9%) |
| 9:00 AM to 9:59 AM | 119 (7.9%) | 150 (15.6%) |
| 10:00 AM to 10:59 AM | 17 (1.1%) | 0 (0.0%) |
| 11:00 AM to 11:59 AM | 25 (1.7%) | 11 (1.1%) |
| 12:00 PM to 3:59 PM | 238 (15.9%) | 21 (2.2%) |
| 4:00 PM to 11:59 PM | 30 (2.0%) | 4 (0.4%) |
| Total | 1,501 (100.0%) | 961 (100.0%) |
Housing Occupancy in Taft
Occupancy by Ownership in Taft
Of the total 2,674 dwellings in Taft, owner-occupied units account for 1,325 (49.5%), while renter-occupied units make up 1,349 (50.4%).
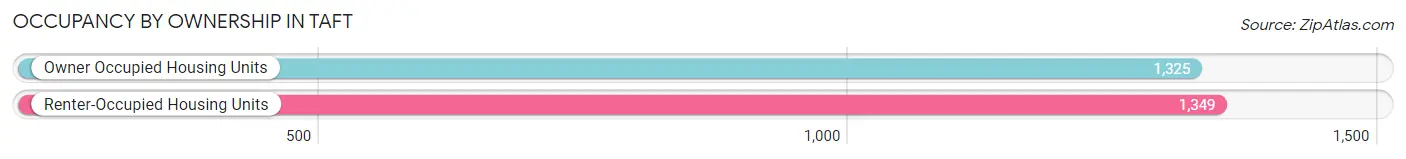
| Occupancy | # Housing Units | % Housing Units |
| Owner Occupied Housing Units | 1,325 | 49.5% |
| Renter-Occupied Housing Units | 1,349 | 50.4% |
| Total Occupied Housing Units | 2,674 | 100.0% |
Occupancy by Household Size in Taft
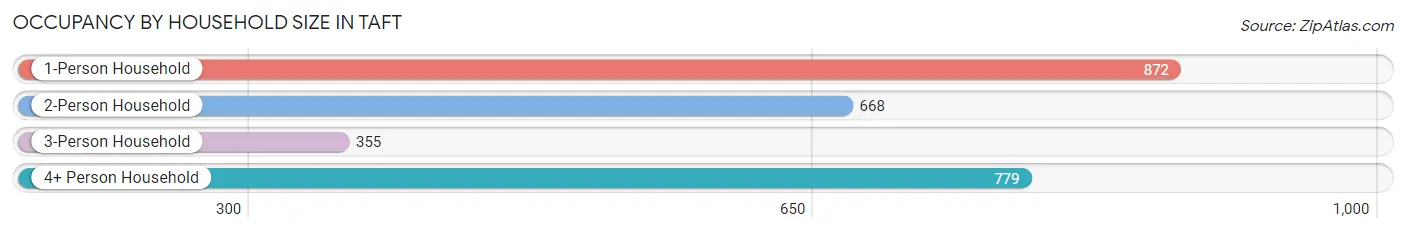
| Household Size | # Housing Units | % Housing Units |
| 1-Person Household | 872 | 32.6% |
| 2-Person Household | 668 | 25.0% |
| 3-Person Household | 355 | 13.3% |
| 4+ Person Household | 779 | 29.1% |
| Total Housing Units | 2,674 | 100.0% |
Occupancy by Ownership by Household Size in Taft
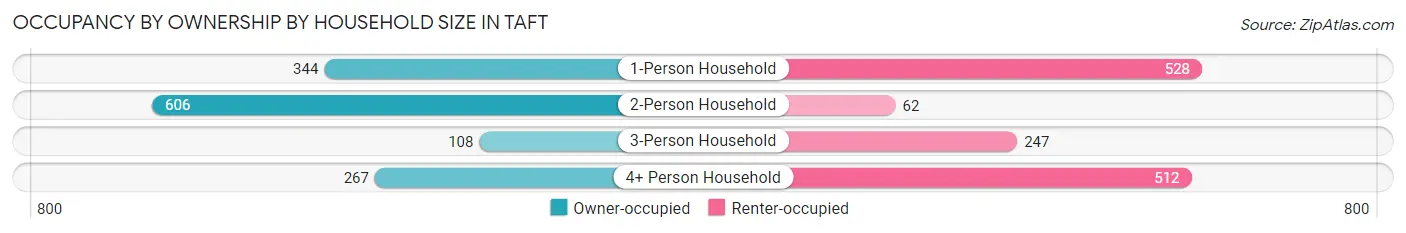
| Household Size | Owner-occupied | Renter-occupied |
| 1-Person Household | 344 (39.5%) | 528 (60.6%) |
| 2-Person Household | 606 (90.7%) | 62 (9.3%) |
| 3-Person Household | 108 (30.4%) | 247 (69.6%) |
| 4+ Person Household | 267 (34.3%) | 512 (65.7%) |
| Total Housing Units | 1,325 (49.5%) | 1,349 (50.4%) |
Occupancy by Educational Attainment in Taft
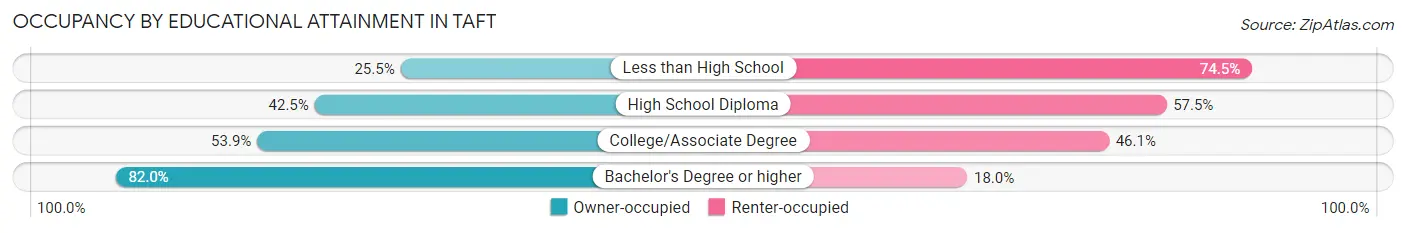
| Household Size | Owner-occupied | Renter-occupied |
| Less than High School | 79 (25.5%) | 231 (74.5%) |
| High School Diploma | 337 (42.5%) | 456 (57.5%) |
| College/Associate Degree | 727 (53.9%) | 622 (46.1%) |
| Bachelor's Degree or higher | 182 (82.0%) | 40 (18.0%) |
Occupancy by Age of Householder in Taft
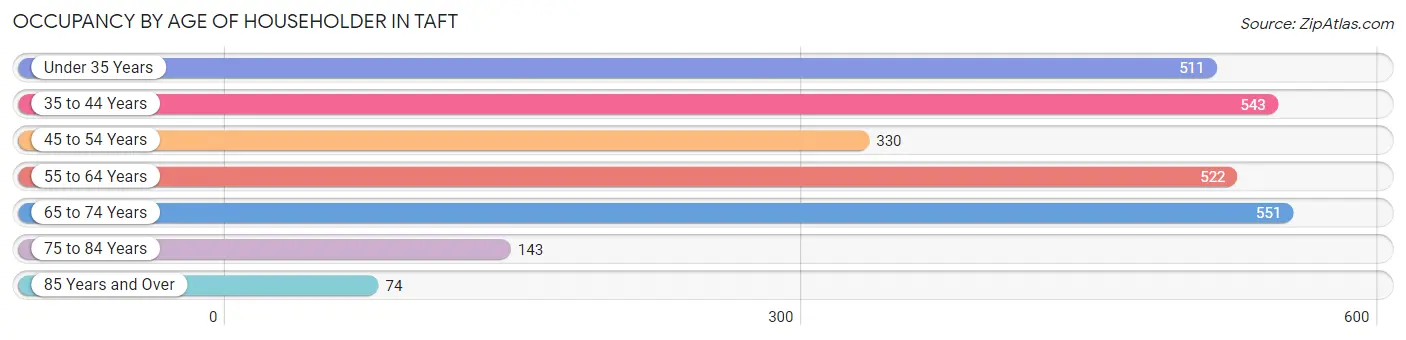
| Age Bracket | # Households | % Households |
| Under 35 Years | 511 | 19.1% |
| 35 to 44 Years | 543 | 20.3% |
| 45 to 54 Years | 330 | 12.3% |
| 55 to 64 Years | 522 | 19.5% |
| 65 to 74 Years | 551 | 20.6% |
| 75 to 84 Years | 143 | 5.3% |
| 85 Years and Over | 74 | 2.8% |
| Total | 2,674 | 100.0% |
Housing Finances in Taft
Median Income by Occupancy in Taft
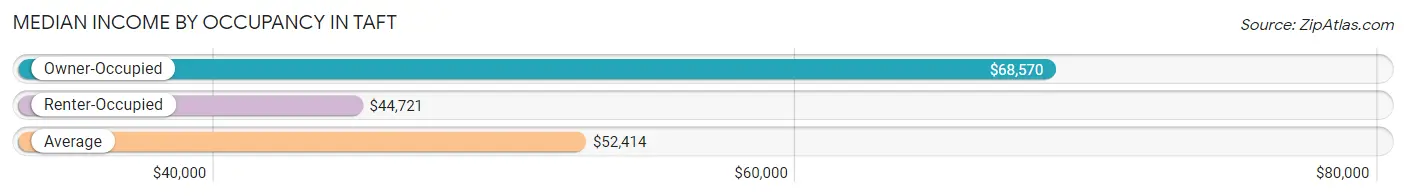
| Occupancy Type | # Households | Median Income |
| Owner-Occupied | 1,325 (49.5%) | $68,570 |
| Renter-Occupied | 1,349 (50.4%) | $44,721 |
| Average | 2,674 (100.0%) | $52,414 |
Occupancy by Householder Income Bracket in Taft
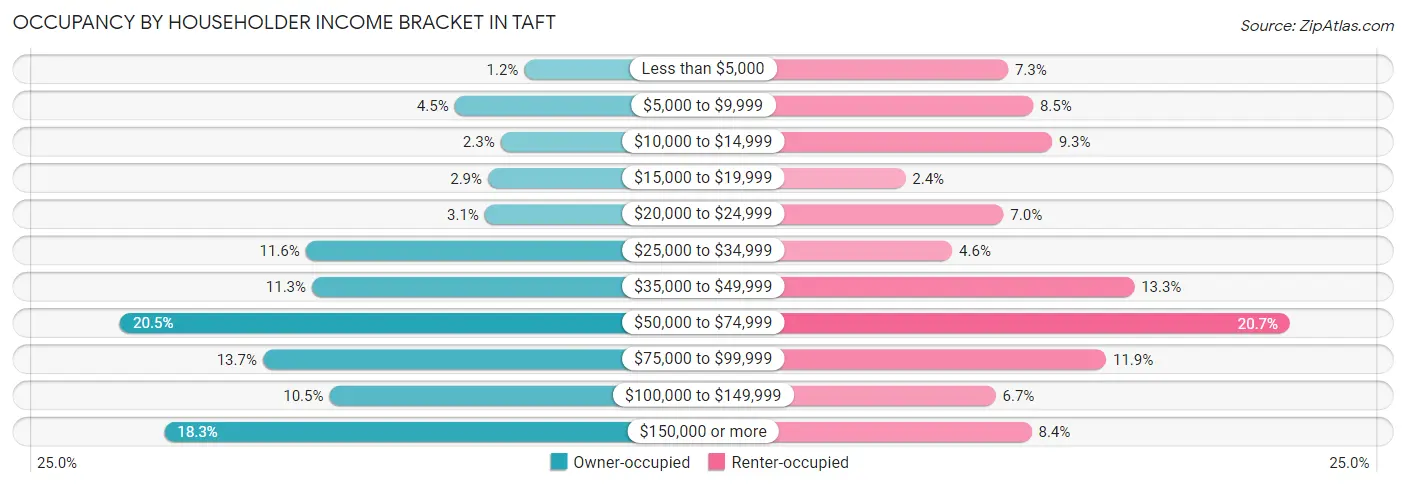
| Income Bracket | Owner-occupied | Renter-occupied |
| Less than $5,000 | 16 (1.2%) | 98 (7.3%) |
| $5,000 to $9,999 | 60 (4.5%) | 114 (8.5%) |
| $10,000 to $14,999 | 31 (2.3%) | 126 (9.3%) |
| $15,000 to $19,999 | 39 (2.9%) | 32 (2.4%) |
| $20,000 to $24,999 | 41 (3.1%) | 95 (7.0%) |
| $25,000 to $34,999 | 154 (11.6%) | 62 (4.6%) |
| $35,000 to $49,999 | 150 (11.3%) | 179 (13.3%) |
| $50,000 to $74,999 | 271 (20.4%) | 279 (20.7%) |
| $75,000 to $99,999 | 181 (13.7%) | 161 (11.9%) |
| $100,000 to $149,999 | 139 (10.5%) | 90 (6.7%) |
| $150,000 or more | 243 (18.3%) | 113 (8.4%) |
| Total | 1,325 (100.0%) | 1,349 (100.0%) |
Monthly Housing Cost Tiers in Taft
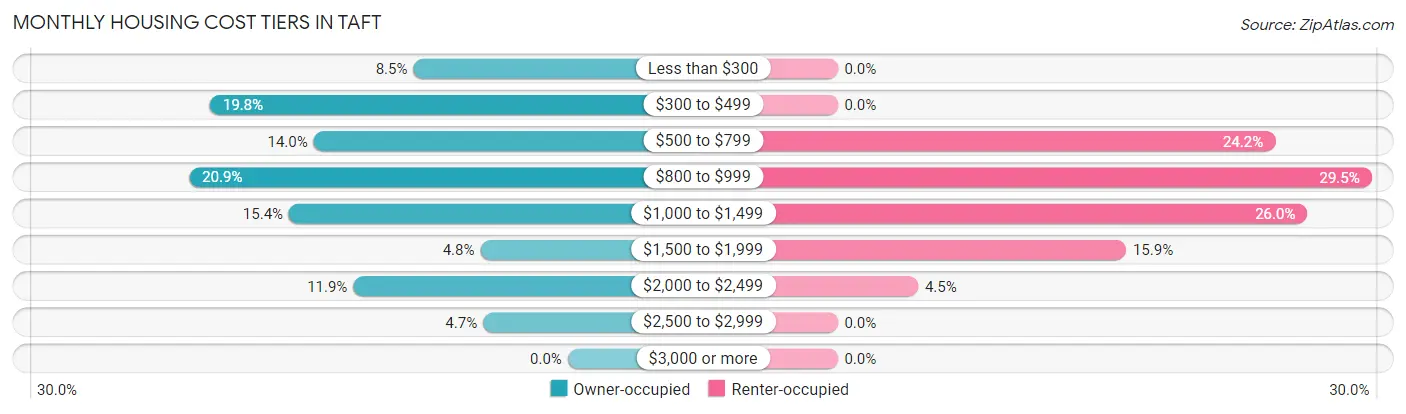
| Monthly Cost | Owner-occupied | Renter-occupied |
| Less than $300 | 113 (8.5%) | 0 (0.0%) |
| $300 to $499 | 262 (19.8%) | 0 (0.0%) |
| $500 to $799 | 186 (14.0%) | 326 (24.2%) |
| $800 to $999 | 277 (20.9%) | 398 (29.5%) |
| $1,000 to $1,499 | 204 (15.4%) | 350 (26.0%) |
| $1,500 to $1,999 | 64 (4.8%) | 215 (15.9%) |
| $2,000 to $2,499 | 157 (11.8%) | 60 (4.4%) |
| $2,500 to $2,999 | 62 (4.7%) | 0 (0.0%) |
| $3,000 or more | 0 (0.0%) | 0 (0.0%) |
| Total | 1,325 (100.0%) | 1,349 (100.0%) |
Physical Housing Characteristics in Taft
Housing Structures in Taft
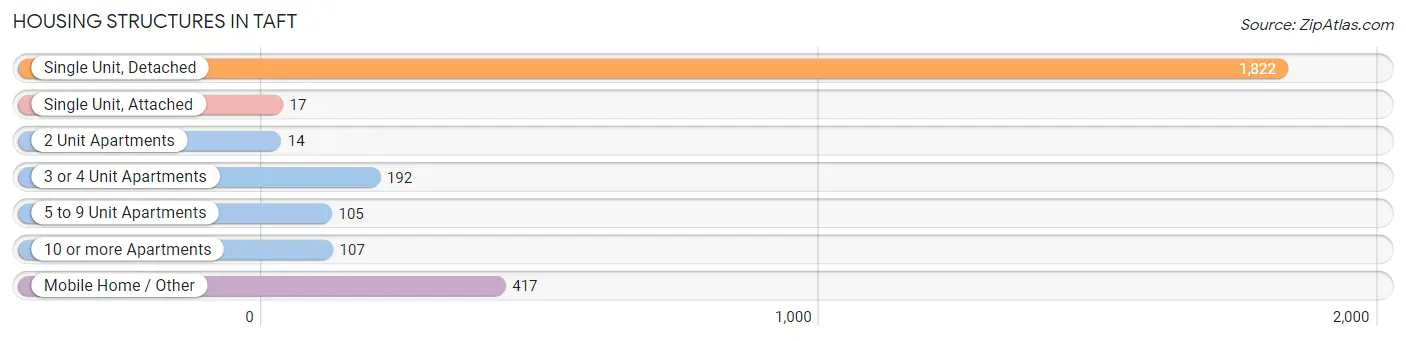
| Structure Type | # Housing Units | % Housing Units |
| Single Unit, Detached | 1,822 | 68.1% |
| Single Unit, Attached | 17 | 0.6% |
| 2 Unit Apartments | 14 | 0.5% |
| 3 or 4 Unit Apartments | 192 | 7.2% |
| 5 to 9 Unit Apartments | 105 | 3.9% |
| 10 or more Apartments | 107 | 4.0% |
| Mobile Home / Other | 417 | 15.6% |
| Total | 2,674 | 100.0% |
Housing Structures by Occupancy in Taft
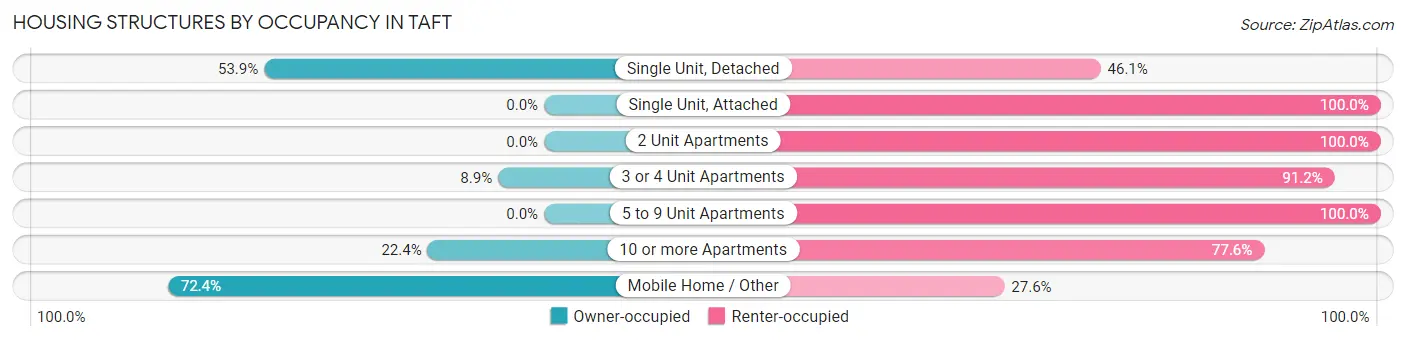
| Structure Type | Owner-occupied | Renter-occupied |
| Single Unit, Detached | 982 (53.9%) | 840 (46.1%) |
| Single Unit, Attached | 0 (0.0%) | 17 (100.0%) |
| 2 Unit Apartments | 0 (0.0%) | 14 (100.0%) |
| 3 or 4 Unit Apartments | 17 (8.8%) | 175 (91.1%) |
| 5 to 9 Unit Apartments | 0 (0.0%) | 105 (100.0%) |
| 10 or more Apartments | 24 (22.4%) | 83 (77.6%) |
| Mobile Home / Other | 302 (72.4%) | 115 (27.6%) |
| Total | 1,325 (49.5%) | 1,349 (50.4%) |
Housing Structures by Number of Rooms in Taft
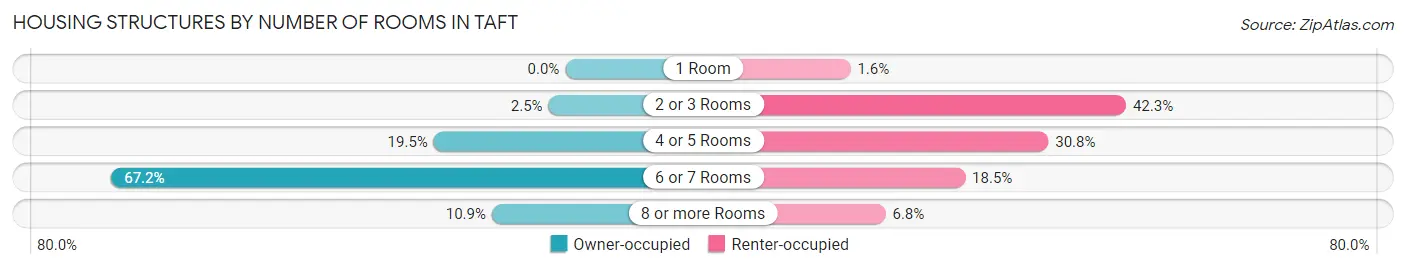
| Number of Rooms | Owner-occupied | Renter-occupied |
| 1 Room | 0 (0.0%) | 21 (1.6%) |
| 2 or 3 Rooms | 33 (2.5%) | 571 (42.3%) |
| 4 or 5 Rooms | 258 (19.5%) | 416 (30.8%) |
| 6 or 7 Rooms | 890 (67.2%) | 250 (18.5%) |
| 8 or more Rooms | 144 (10.9%) | 91 (6.8%) |
| Total | 1,325 (100.0%) | 1,349 (100.0%) |
Housing Structure by Heating Type in Taft
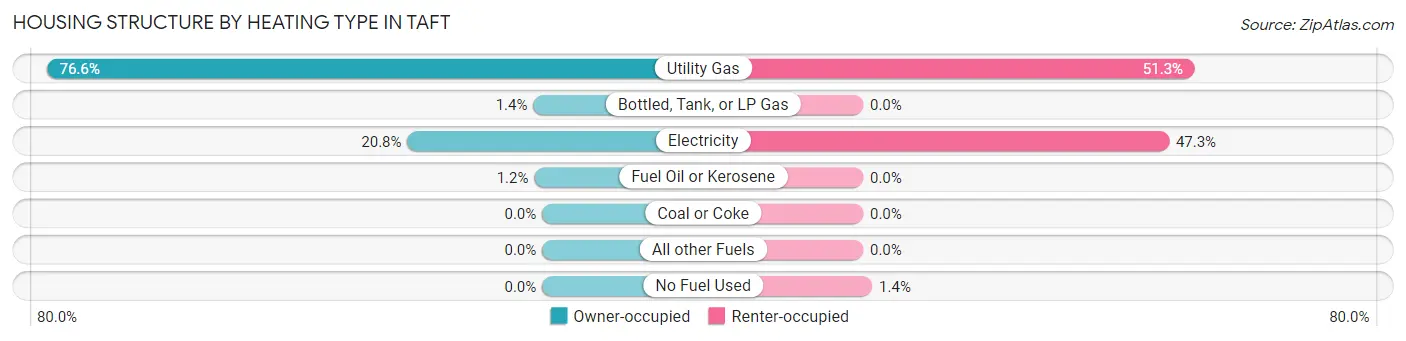
| Heating Type | Owner-occupied | Renter-occupied |
| Utility Gas | 1,015 (76.6%) | 692 (51.3%) |
| Bottled, Tank, or LP Gas | 18 (1.4%) | 0 (0.0%) |
| Electricity | 276 (20.8%) | 638 (47.3%) |
| Fuel Oil or Kerosene | 16 (1.2%) | 0 (0.0%) |
| Coal or Coke | 0 (0.0%) | 0 (0.0%) |
| All other Fuels | 0 (0.0%) | 0 (0.0%) |
| No Fuel Used | 0 (0.0%) | 19 (1.4%) |
| Total | 1,325 (100.0%) | 1,349 (100.0%) |
Household Vehicle Usage in Taft
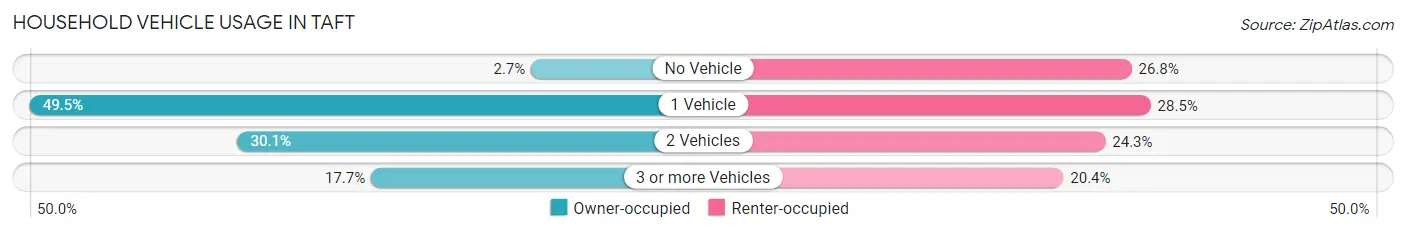
| Vehicles per Household | Owner-occupied | Renter-occupied |
| No Vehicle | 36 (2.7%) | 361 (26.8%) |
| 1 Vehicle | 656 (49.5%) | 385 (28.5%) |
| 2 Vehicles | 399 (30.1%) | 328 (24.3%) |
| 3 or more Vehicles | 234 (17.7%) | 275 (20.4%) |
| Total | 1,325 (100.0%) | 1,349 (100.0%) |
Real Estate & Mortgages in Taft
Real Estate and Mortgage Overview in Taft
| Characteristic | Without Mortgage | With Mortgage |
| Housing Units | 817 | 508 |
| Median Property Value | $207,300 | $245,900 |
| Median Household Income | $67,694 | $154 |
| Monthly Housing Costs | $566 | $0 |
| Real Estate Taxes | $1,663 | $16 |
Property Value by Mortgage Status in Taft
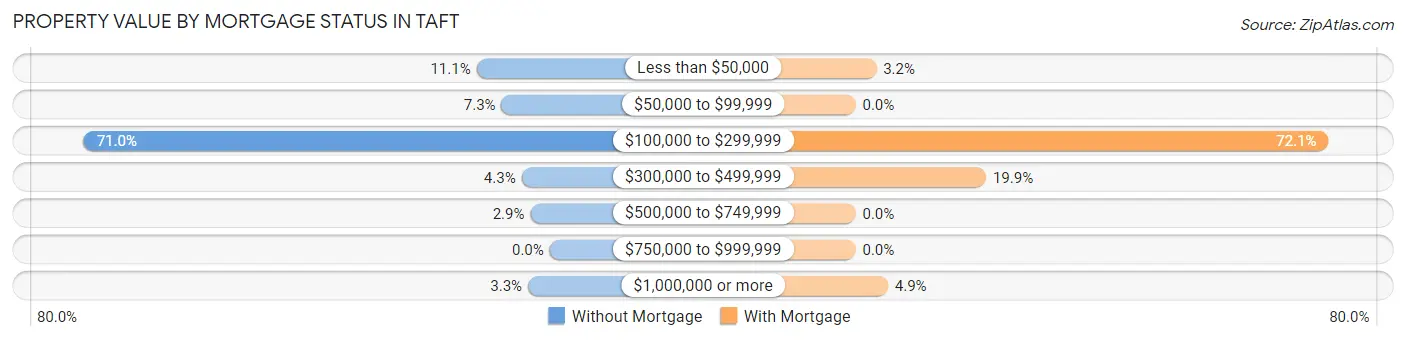
| Property Value | Without Mortgage | With Mortgage |
| Less than $50,000 | 91 (11.1%) | 16 (3.2%) |
| $50,000 to $99,999 | 60 (7.3%) | 0 (0.0%) |
| $100,000 to $299,999 | 580 (71.0%) | 366 (72.1%) |
| $300,000 to $499,999 | 35 (4.3%) | 101 (19.9%) |
| $500,000 to $749,999 | 24 (2.9%) | 0 (0.0%) |
| $750,000 to $999,999 | 0 (0.0%) | 0 (0.0%) |
| $1,000,000 or more | 27 (3.3%) | 25 (4.9%) |
| Total | 817 (100.0%) | 508 (100.0%) |
Household Income by Mortgage Status in Taft
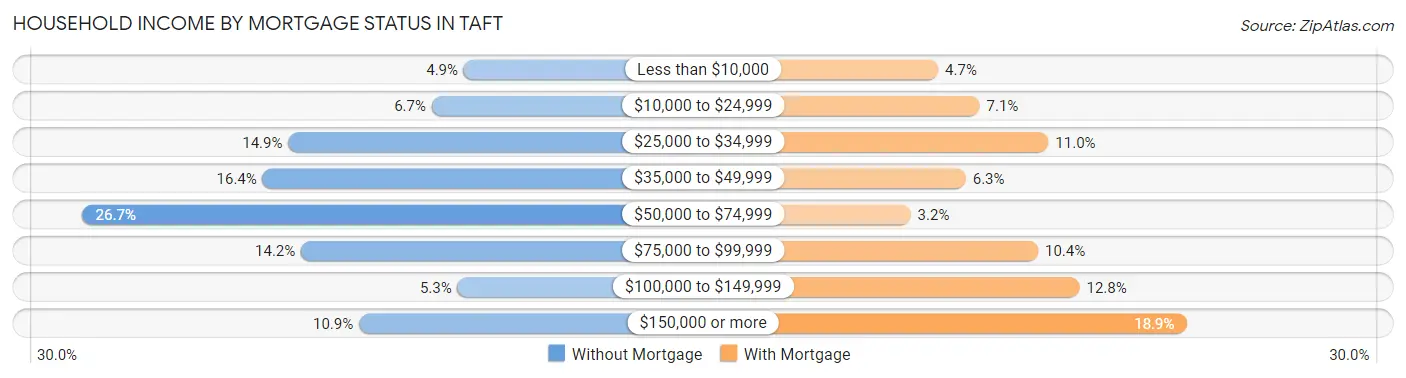
| Household Income | Without Mortgage | With Mortgage |
| Less than $10,000 | 40 (4.9%) | 24 (4.7%) |
| $10,000 to $24,999 | 55 (6.7%) | 36 (7.1%) |
| $25,000 to $34,999 | 122 (14.9%) | 56 (11.0%) |
| $35,000 to $49,999 | 134 (16.4%) | 32 (6.3%) |
| $50,000 to $74,999 | 218 (26.7%) | 16 (3.2%) |
| $75,000 to $99,999 | 116 (14.2%) | 53 (10.4%) |
| $100,000 to $149,999 | 43 (5.3%) | 65 (12.8%) |
| $150,000 or more | 89 (10.9%) | 96 (18.9%) |
| Total | 817 (100.0%) | 508 (100.0%) |
Property Value to Household Income Ratio in Taft
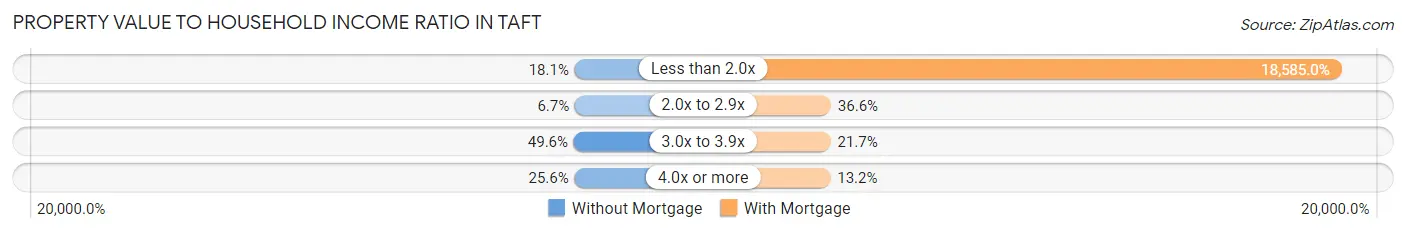
| Value-to-Income Ratio | Without Mortgage | With Mortgage |
| Less than 2.0x | 148 (18.1%) | 94,412 (18,585.0%) |
| 2.0x to 2.9x | 55 (6.7%) | 186 (36.6%) |
| 3.0x to 3.9x | 405 (49.6%) | 110 (21.6%) |
| 4.0x or more | 209 (25.6%) | 67 (13.2%) |
| Total | 817 (100.0%) | 508 (100.0%) |
Real Estate Taxes by Mortgage Status in Taft
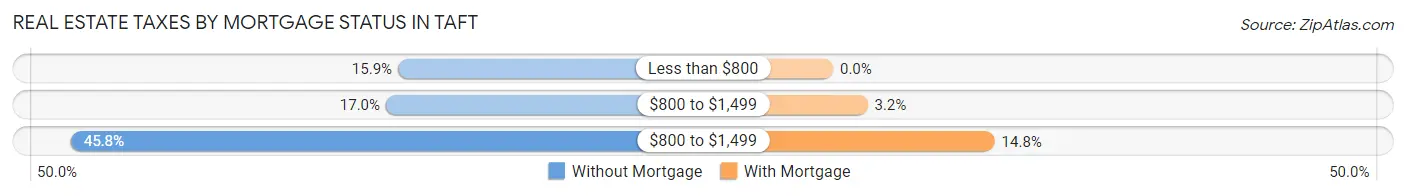
| Property Taxes | Without Mortgage | With Mortgage |
| Less than $800 | 130 (15.9%) | 0 (0.0%) |
| $800 to $1,499 | 139 (17.0%) | 16 (3.2%) |
| $800 to $1,499 | 374 (45.8%) | 75 (14.8%) |
| Total | 817 (100.0%) | 508 (100.0%) |
Health & Disability in Taft
Health Insurance Coverage by Age in Taft
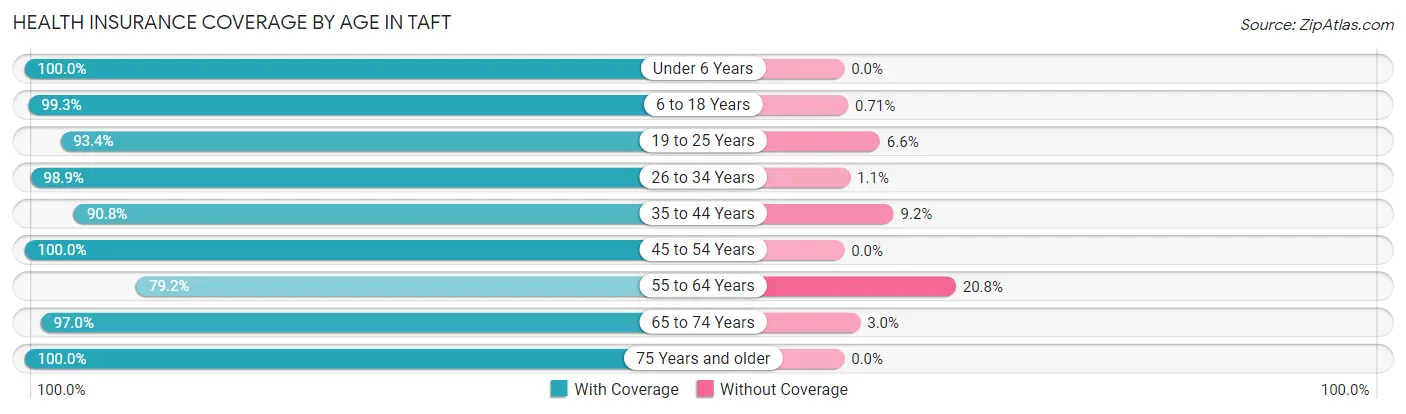
| Age Bracket | With Coverage | Without Coverage |
| Under 6 Years | 521 (100.0%) | 0 (0.0%) |
| 6 to 18 Years | 1,389 (99.3%) | 10 (0.7%) |
| 19 to 25 Years | 787 (93.4%) | 56 (6.6%) |
| 26 to 34 Years | 907 (98.9%) | 10 (1.1%) |
| 35 to 44 Years | 760 (90.8%) | 77 (9.2%) |
| 45 to 54 Years | 581 (100.0%) | 0 (0.0%) |
| 55 to 64 Years | 617 (79.2%) | 162 (20.8%) |
| 65 to 74 Years | 716 (97.0%) | 22 (3.0%) |
| 75 Years and older | 429 (100.0%) | 0 (0.0%) |
| Total | 6,707 (95.2%) | 337 (4.8%) |
Health Insurance Coverage by Citizenship Status in Taft

| Citizenship Status | With Coverage | Without Coverage |
| Native Born | 521 (100.0%) | 0 (0.0%) |
| Foreign Born, Citizen | 1,389 (99.3%) | 10 (0.7%) |
| Foreign Born, not a Citizen | 787 (93.4%) | 56 (6.6%) |
Health Insurance Coverage by Household Income in Taft
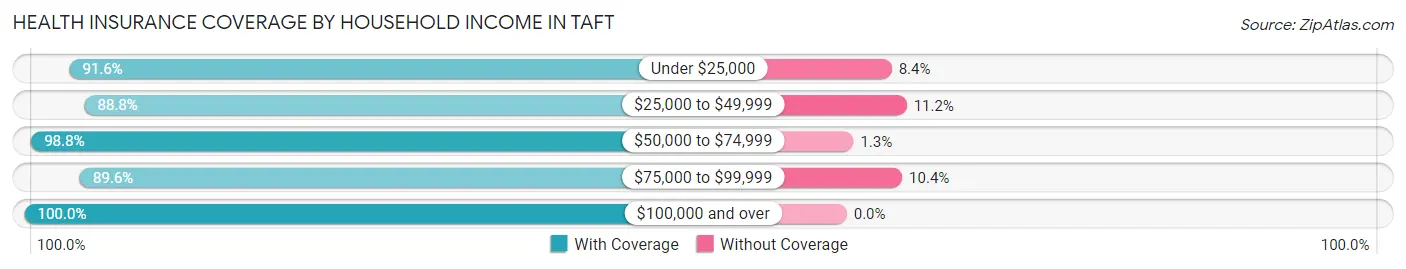
| Household Income | With Coverage | Without Coverage |
| Under $25,000 | 1,285 (91.6%) | 118 (8.4%) |
| $25,000 to $49,999 | 831 (88.8%) | 105 (11.2%) |
| $50,000 to $74,999 | 1,584 (98.8%) | 20 (1.3%) |
| $75,000 to $99,999 | 726 (89.6%) | 84 (10.4%) |
| $100,000 and over | 2,160 (100.0%) | 0 (0.0%) |
Public vs Private Health Insurance Coverage by Age in Taft
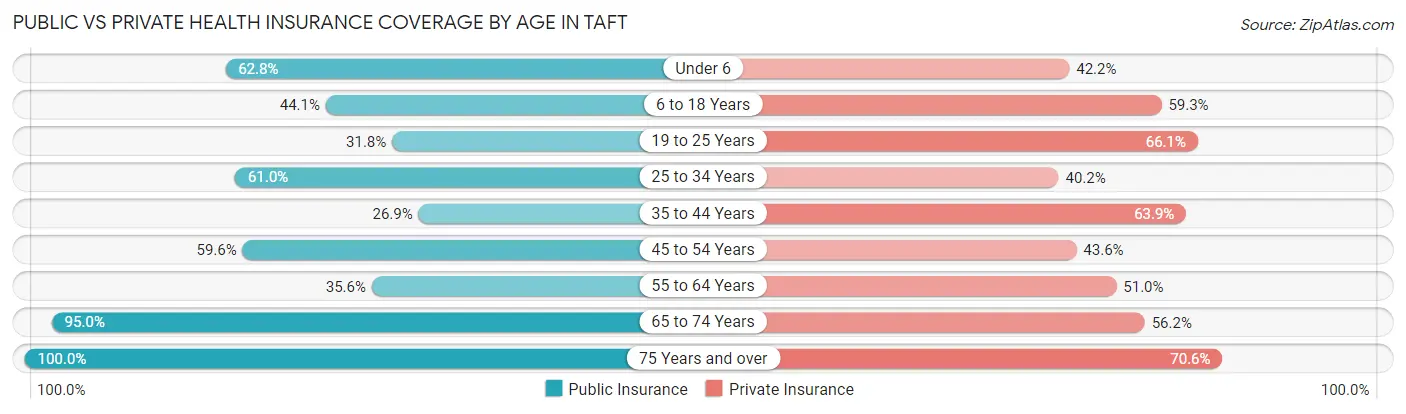
| Age Bracket | Public Insurance | Private Insurance |
| Under 6 | 327 (62.8%) | 220 (42.2%) |
| 6 to 18 Years | 617 (44.1%) | 830 (59.3%) |
| 19 to 25 Years | 268 (31.8%) | 557 (66.1%) |
| 25 to 34 Years | 559 (61.0%) | 369 (40.2%) |
| 35 to 44 Years | 225 (26.9%) | 535 (63.9%) |
| 45 to 54 Years | 346 (59.6%) | 253 (43.5%) |
| 55 to 64 Years | 277 (35.6%) | 397 (51.0%) |
| 65 to 74 Years | 701 (95.0%) | 415 (56.2%) |
| 75 Years and over | 429 (100.0%) | 303 (70.6%) |
| Total | 3,749 (53.2%) | 3,879 (55.1%) |
Disability Status by Sex by Age in Taft
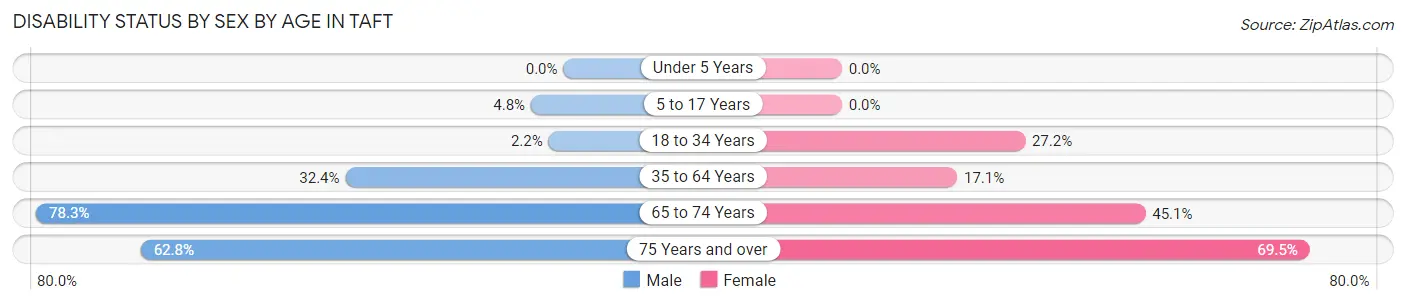
| Age Bracket | Male | Female |
| Under 5 Years | 0 (0.0%) | 0 (0.0%) |
| 5 to 17 Years | 22 (4.8%) | 0 (0.0%) |
| 18 to 34 Years | 20 (2.2%) | 284 (27.2%) |
| 35 to 64 Years | 416 (32.4%) | 156 (17.1%) |
| 65 to 74 Years | 173 (78.3%) | 233 (45.1%) |
| 75 Years and over | 187 (62.7%) | 91 (69.5%) |
Disability Class by Sex by Age in Taft
Disability Class: Hearing Difficulty
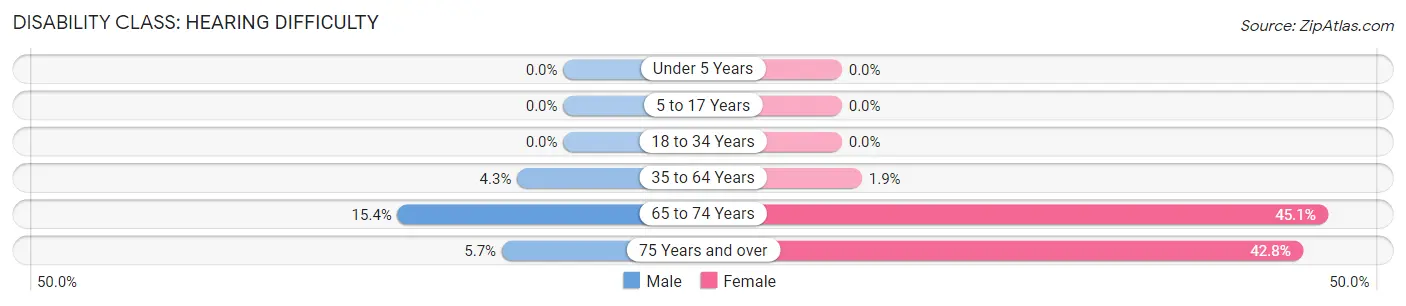
| Age Bracket | Male | Female |
| Under 5 Years | 0 (0.0%) | 0 (0.0%) |
| 5 to 17 Years | 0 (0.0%) | 0 (0.0%) |
| 18 to 34 Years | 0 (0.0%) | 0 (0.0%) |
| 35 to 64 Years | 55 (4.3%) | 17 (1.9%) |
| 65 to 74 Years | 34 (15.4%) | 233 (45.1%) |
| 75 Years and over | 17 (5.7%) | 56 (42.7%) |
Disability Class: Vision Difficulty
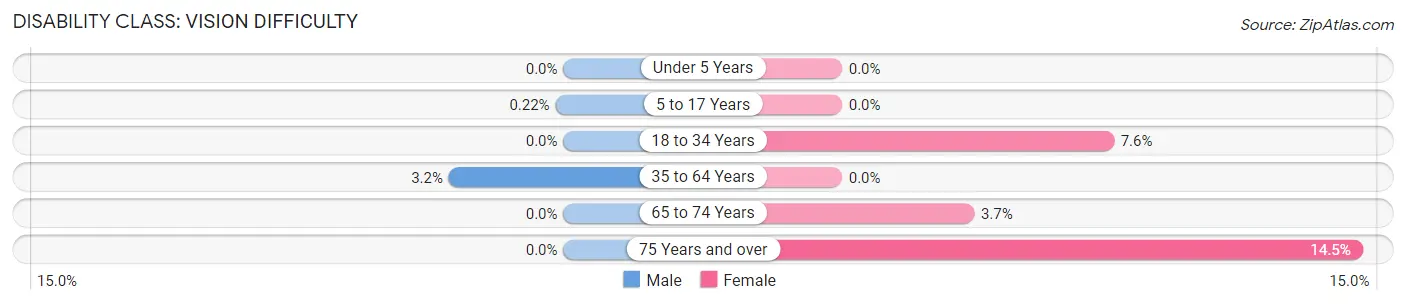
| Age Bracket | Male | Female |
| Under 5 Years | 0 (0.0%) | 0 (0.0%) |
| 5 to 17 Years | 1 (0.2%) | 0 (0.0%) |
| 18 to 34 Years | 0 (0.0%) | 79 (7.6%) |
| 35 to 64 Years | 41 (3.2%) | 0 (0.0%) |
| 65 to 74 Years | 0 (0.0%) | 19 (3.7%) |
| 75 Years and over | 0 (0.0%) | 19 (14.5%) |
Disability Class: Cognitive Difficulty
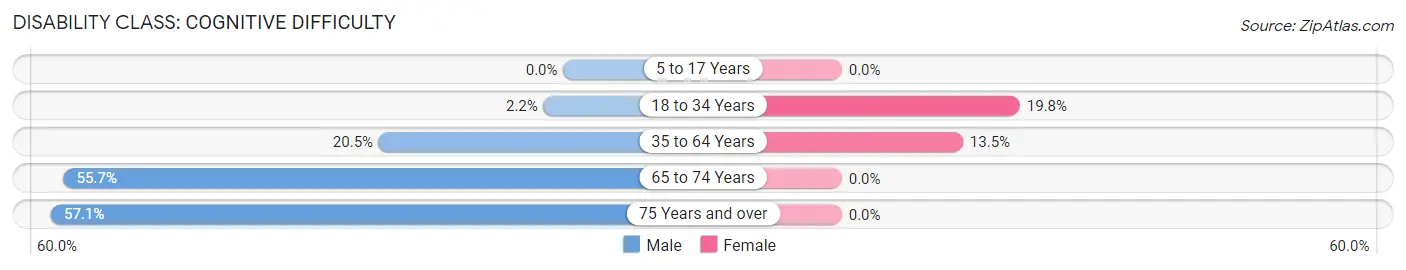
| Age Bracket | Male | Female |
| 5 to 17 Years | 0 (0.0%) | 0 (0.0%) |
| 18 to 34 Years | 20 (2.2%) | 207 (19.8%) |
| 35 to 64 Years | 264 (20.5%) | 123 (13.5%) |
| 65 to 74 Years | 123 (55.7%) | 0 (0.0%) |
| 75 Years and over | 170 (57.1%) | 0 (0.0%) |
Disability Class: Ambulatory Difficulty
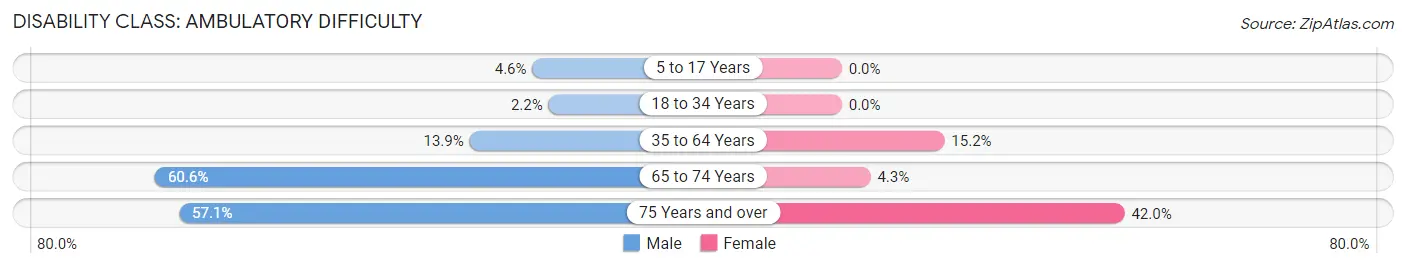
| Age Bracket | Male | Female |
| 5 to 17 Years | 21 (4.6%) | 0 (0.0%) |
| 18 to 34 Years | 20 (2.2%) | 0 (0.0%) |
| 35 to 64 Years | 179 (13.9%) | 139 (15.2%) |
| 65 to 74 Years | 134 (60.6%) | 22 (4.3%) |
| 75 Years and over | 170 (57.1%) | 55 (42.0%) |
Disability Class: Self-Care Difficulty
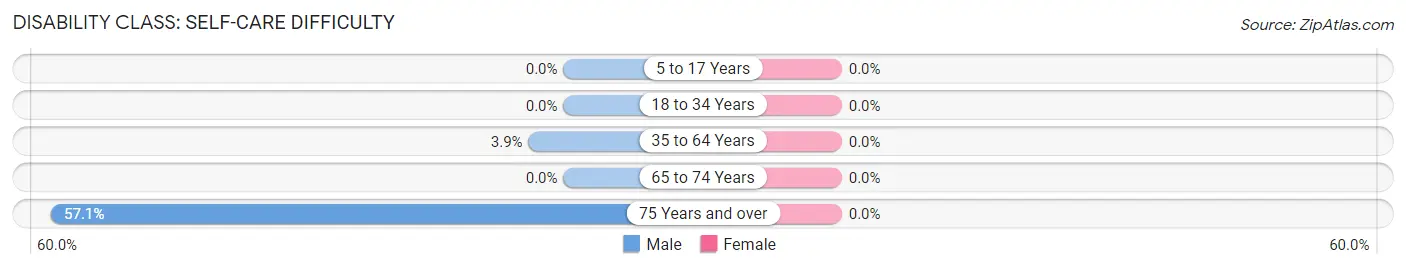
| Age Bracket | Male | Female |
| 5 to 17 Years | 0 (0.0%) | 0 (0.0%) |
| 18 to 34 Years | 0 (0.0%) | 0 (0.0%) |
| 35 to 64 Years | 50 (3.9%) | 0 (0.0%) |
| 65 to 74 Years | 0 (0.0%) | 0 (0.0%) |
| 75 Years and over | 170 (57.1%) | 0 (0.0%) |
Technology Access in Taft
Computing Device Access in Taft
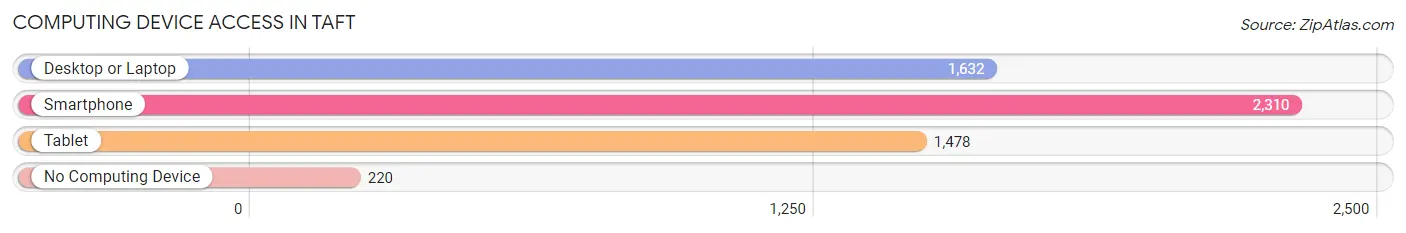
| Device Type | # Households | % Households |
| Desktop or Laptop | 1,632 | 61.0% |
| Smartphone | 2,310 | 86.4% |
| Tablet | 1,478 | 55.3% |
| No Computing Device | 220 | 8.2% |
| Total | 2,674 | 100.0% |
Internet Access in Taft
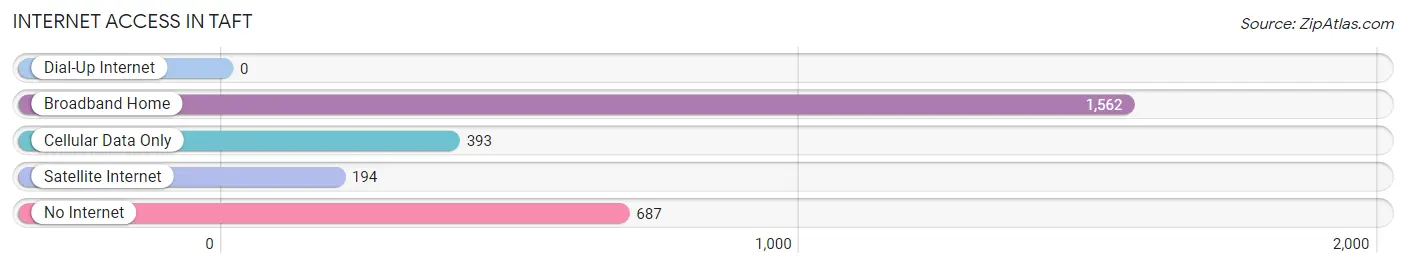
| Internet Type | # Households | % Households |
| Dial-Up Internet | 0 | 0.0% |
| Broadband Home | 1,562 | 58.4% |
| Cellular Data Only | 393 | 14.7% |
| Satellite Internet | 194 | 7.3% |
| No Internet | 687 | 25.7% |
| Total | 2,674 | 100.0% |
Taft Summary
Taft is a small city located in the southern part of the San Joaquin Valley in Kern County, California. It is situated at the base of the Temblor Range, approximately 30 miles southwest of Bakersfield. The city has a population of approximately 9,327 people, according to the 2010 census.
History
Taft was founded in 1910 by Edward Taft, a former mayor of Bakersfield. The city was named after him and was incorporated in 1910. The city was originally a railroad town, with the Southern Pacific Railroad running through it. The railroad was the main source of employment for the city's residents.
In the early 1900s, Taft was a major oil-producing region. The first oil well was drilled in 1910 and the city quickly became a major oil-producing center. The oil industry was the main source of employment for the city's residents.
In the 1950s, Taft began to experience a decline in the oil industry. This led to a decrease in the city's population and economy. However, in the late 1970s, the city experienced a resurgence in the oil industry, which led to an increase in population and economic activity.
Geography
Taft is located in the southern part of the San Joaquin Valley in Kern County, California. It is situated at the base of the Temblor Range, approximately 30 miles southwest of Bakersfield. The city has a total area of 4.2 square miles, all of which is land.
The climate in Taft is hot and dry, with temperatures ranging from the mid-90s in the summer to the mid-50s in the winter. The city receives an average of 8.5 inches of precipitation per year.
Economy
Taft's economy is largely based on the oil industry. The city is home to several oil refineries and is a major oil-producing center. The city also has a large agricultural sector, with crops such as cotton, alfalfa, and grapes being grown in the area.
The city also has a growing tourism industry, with visitors coming to the city to visit the nearby Carrizo Plain National Monument and the nearby Sequoia National Forest.
Demographics
According to the 2010 census, Taft has a population of 9,327 people. The racial makeup of the city is 73.3% White, 1.3% African American, 0.7% Native American, 0.7% Asian, 0.1% Pacific Islander, 20.2% from other races, and 4.1% from two or more races. The median household income in the city is $37,917.
Taft is a predominantly Hispanic city, with the majority of the population being of Mexican descent. The city also has a large population of Native Americans, with the largest group being the Chumash.
Conclusion
Taft is a small city located in the southern part of the San Joaquin Valley in Kern County, California. It was founded in 1910 and has a population of approximately 9,327 people, according to the 2010 census. The city's economy is largely based on the oil industry, with agriculture and tourism also playing a role. The city is predominantly Hispanic, with the majority of the population being of Mexican descent.
Common Questions
What is Per Capita Income in Taft?
Per Capita income in Taft is $27,539.
What is the Median Family Income in Taft?
Median Family Income in Taft is $67,830.
What is the Median Household income in Taft?
Median Household Income in Taft is $52,414.
What is Income or Wage Gap in Taft?
Income or Wage Gap in Taft is 62.5%.
Women in Taft earn 37.5 cents for every dollar earned by a man.
What is Inequality or Gini Index in Taft?
Inequality or Gini Index in Taft is 0.48.
What is the Total Population of Taft?
Total Population of Taft is 7,414.
What is the Total Male Population of Taft?
Total Male Population of Taft is 3,796.
What is the Total Female Population of Taft?
Total Female Population of Taft is 3,618.
What is the Ratio of Males per 100 Females in Taft?
There are 104.92 Males per 100 Females in Taft.
What is the Ratio of Females per 100 Males in Taft?
There are 95.31 Females per 100 Males in Taft.
What is the Median Population Age in Taft?
Median Population Age in Taft is 32.9 Years.
What is the Average Family Size in Taft
Average Family Size in Taft is 3.2 People.
What is the Average Household Size in Taft
Average Household Size in Taft is 2.6 People.
How Large is the Labor Force in Taft?
There are 2,787 People in the Labor Forcein in Taft.
What is the Percentage of People in the Labor Force in Taft?
47.4% of People are in the Labor Force in Taft.
What is the Unemployment Rate in Taft?
Unemployment Rate in Taft is 4.8%.