Stone Mountain, GA Map & Demographics
Stone Mountain Map

Stone Mountain Overview
$25,142
PER CAPITA INCOME
$54,886
AVG FAMILY INCOME
$44,950
AVG HOUSEHOLD INCOME
10.2%
WAGE / INCOME GAP [ % ]
89.8¢/ $1
WAGE / INCOME GAP [ $ ]
0.43
INEQUALITY / GINI INDEX
6,638
TOTAL POPULATION
3,271
MALE POPULATION
3,367
FEMALE POPULATION
97.15
MALES / 100 FEMALES
102.93
FEMALES / 100 MALES
34.4
MEDIAN AGE
3.6
AVG FAMILY SIZE
2.6
AVG HOUSEHOLD SIZE
3,460
LABOR FORCE [ PEOPLE ]
66.5%
PERCENT IN LABOR FORCE
5.6%
UNEMPLOYMENT RATE
Income in Stone Mountain
Income Overview in Stone Mountain
Per Capita Income in Stone Mountain is $25,142, while median incomes of families and households are $54,886 and $44,950 respectively.
| Characteristic | Number | Measure |
| Per Capita Income | 6,638 | $25,142 |
| Median Family Income | 1,432 | $54,886 |
| Mean Family Income | 1,432 | $70,925 |
| Median Household Income | 2,513 | $44,950 |
| Mean Household Income | 2,513 | $61,407 |
| Income Deficit | 1,432 | $0 |
| Wage / Income Gap (%) | 6,638 | 10.16% |
| Wage / Income Gap ($) | 6,638 | 89.84¢ per $1 |
| Gini / Inequality Index | 6,638 | 0.43 |
Earnings by Sex in Stone Mountain
Average Earnings in Stone Mountain are $30,304, $31,418 for men and $28,227 for women, a difference of 10.2%.
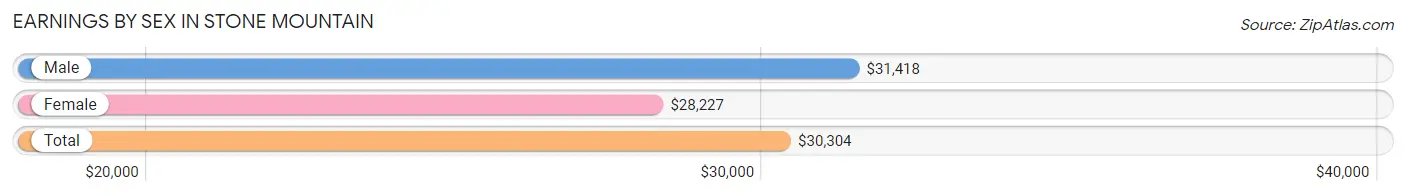
| Sex | Number | Average Earnings |
| Male | 1,708 (48.6%) | $31,418 |
| Female | 1,806 (51.4%) | $28,227 |
| Total | 3,514 (100.0%) | $30,304 |
Earnings by Sex by Income Bracket in Stone Mountain
The most common earnings brackets in Stone Mountain are $30,000 to $34,999 for men (270 | 15.8%) and $30,000 to $34,999 for women (257 | 14.2%).
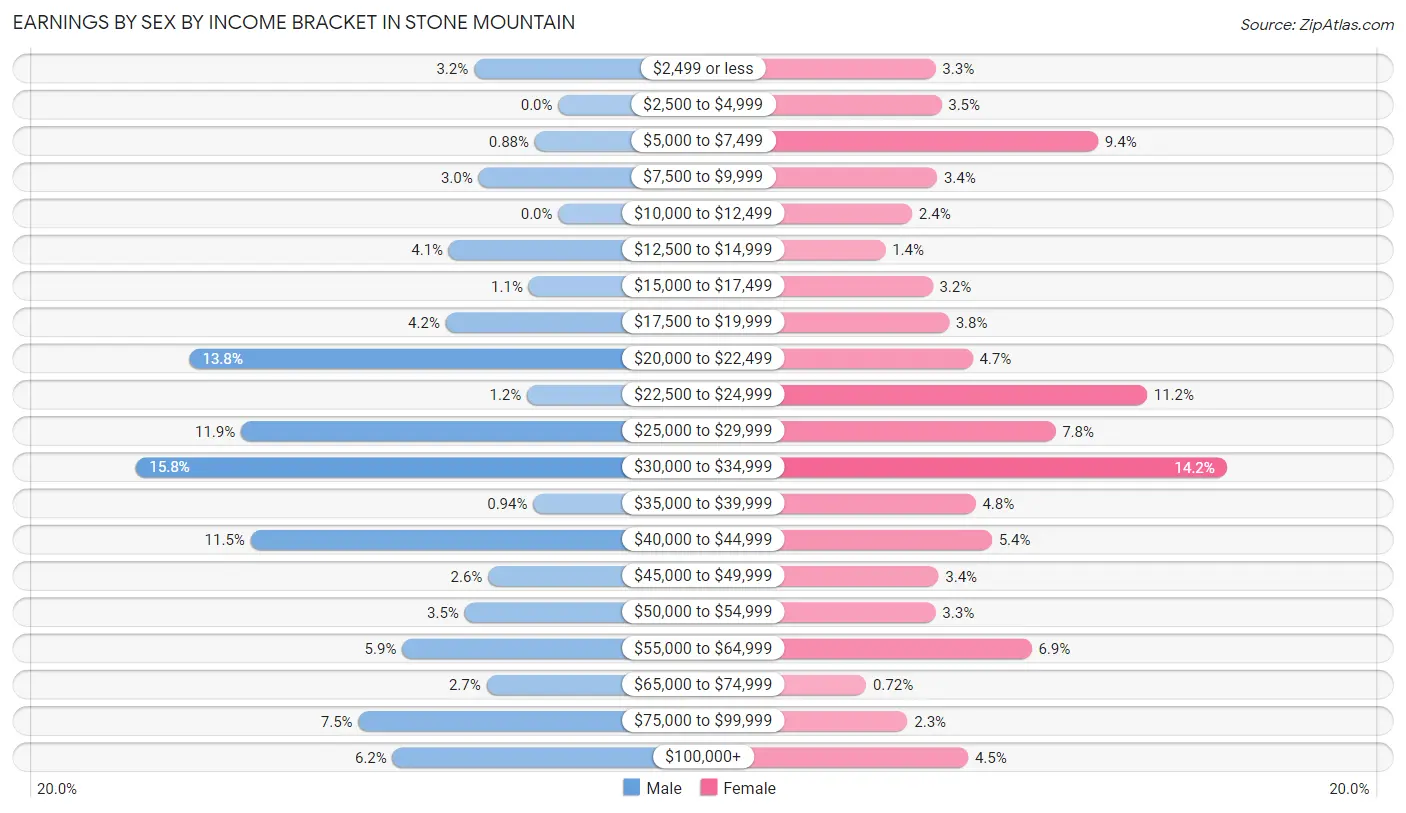
| Income | Male | Female |
| $2,499 or less | 54 (3.2%) | 60 (3.3%) |
| $2,500 to $4,999 | 0 (0.0%) | 64 (3.5%) |
| $5,000 to $7,499 | 15 (0.9%) | 170 (9.4%) |
| $7,500 to $9,999 | 51 (3.0%) | 61 (3.4%) |
| $10,000 to $12,499 | 0 (0.0%) | 44 (2.4%) |
| $12,500 to $14,999 | 70 (4.1%) | 26 (1.4%) |
| $15,000 to $17,499 | 19 (1.1%) | 58 (3.2%) |
| $17,500 to $19,999 | 72 (4.2%) | 69 (3.8%) |
| $20,000 to $22,499 | 236 (13.8%) | 85 (4.7%) |
| $22,500 to $24,999 | 20 (1.2%) | 203 (11.2%) |
| $25,000 to $29,999 | 203 (11.9%) | 141 (7.8%) |
| $30,000 to $34,999 | 270 (15.8%) | 257 (14.2%) |
| $35,000 to $39,999 | 16 (0.9%) | 87 (4.8%) |
| $40,000 to $44,999 | 197 (11.5%) | 98 (5.4%) |
| $45,000 to $49,999 | 45 (2.6%) | 62 (3.4%) |
| $50,000 to $54,999 | 60 (3.5%) | 60 (3.3%) |
| $55,000 to $64,999 | 100 (5.9%) | 125 (6.9%) |
| $65,000 to $74,999 | 46 (2.7%) | 13 (0.7%) |
| $75,000 to $99,999 | 128 (7.5%) | 41 (2.3%) |
| $100,000+ | 106 (6.2%) | 82 (4.5%) |
| Total | 1,708 (100.0%) | 1,806 (100.0%) |
Earnings by Sex by Educational Attainment in Stone Mountain
Average earnings in Stone Mountain are $31,593 for men and $30,079 for women, a difference of 4.8%. Men with an educational attainment of graduate degree enjoy the highest average annual earnings of $98,935, while those with high school diploma education earn the least with $28,750. Women with an educational attainment of bachelor's degree earn the most with the average annual earnings of $46,759, while those with less than high school education have the smallest earnings of $23,564.
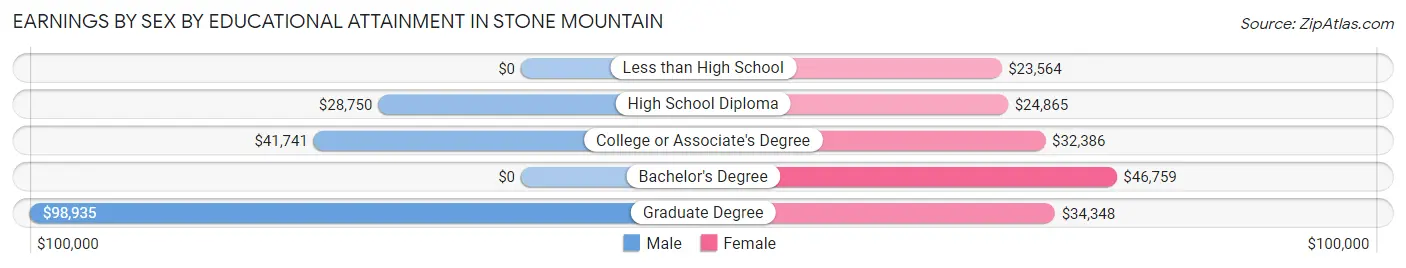
| Educational Attainment | Male Income | Female Income |
| Less than High School | - | - |
| High School Diploma | $28,750 | $24,865 |
| College or Associate's Degree | $41,741 | $32,386 |
| Bachelor's Degree | - | - |
| Graduate Degree | $98,935 | $34,348 |
| Total | $31,593 | $30,079 |
Family Income in Stone Mountain
Family Income Brackets in Stone Mountain
According to the Stone Mountain family income data, there are 322 families falling into the $50,000 to $74,999 income range, which is the most common income bracket and makes up 22.5% of all families. Conversely, the $10,000 to $14,999 income bracket is the least frequent group with only 14 families (1.0%) belonging to this category.
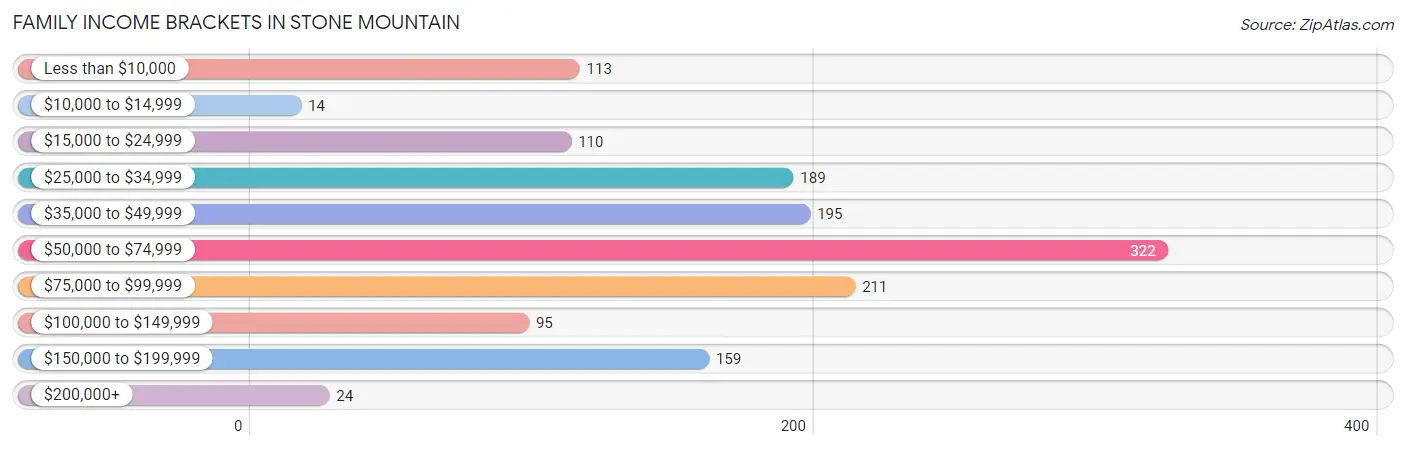
| Income Bracket | # Families | % Families |
| Less than $10,000 | 113 | 7.9% |
| $10,000 to $14,999 | 14 | 1.0% |
| $15,000 to $24,999 | 110 | 7.7% |
| $25,000 to $34,999 | 189 | 13.2% |
| $35,000 to $49,999 | 195 | 13.6% |
| $50,000 to $74,999 | 322 | 22.5% |
| $75,000 to $99,999 | 211 | 14.7% |
| $100,000 to $149,999 | 95 | 6.6% |
| $150,000 to $199,999 | 159 | 11.1% |
| $200,000+ | 24 | 1.7% |
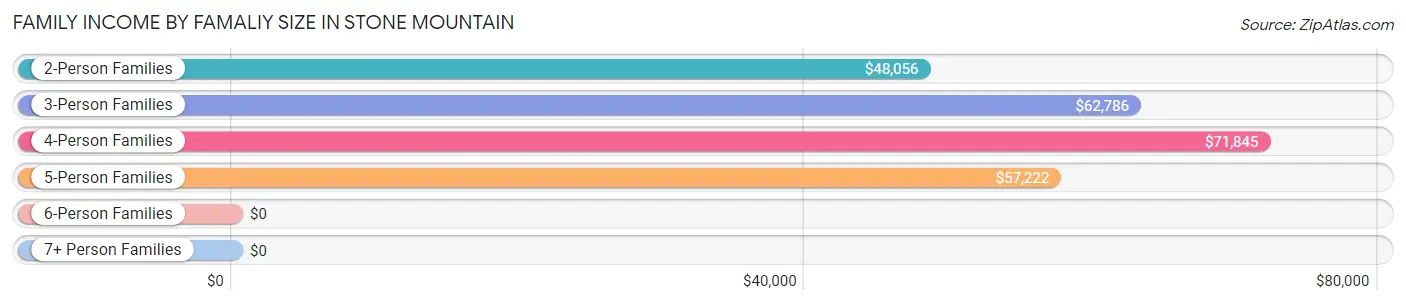
Family Income by Famaliy Size in Stone Mountain
4-person families (313 | 21.9%) account for the highest median family income in Stone Mountain with $71,845 per family, while 2-person families (638 | 44.6%) have the highest median income of $24,028 per family member.
| Income Bracket | # Families | Median Income |
| 2-Person Families | 638 (44.6%) | $48,056 |
| 3-Person Families | 370 (25.8%) | $62,786 |
| 4-Person Families | 313 (21.9%) | $71,845 |
| 5-Person Families | 82 (5.7%) | $57,222 |
| 6-Person Families | 0 (0.0%) | $0 |
| 7+ Person Families | 29 (2.0%) | $0 |
| Total | 1,432 (100.0%) | $54,886 |
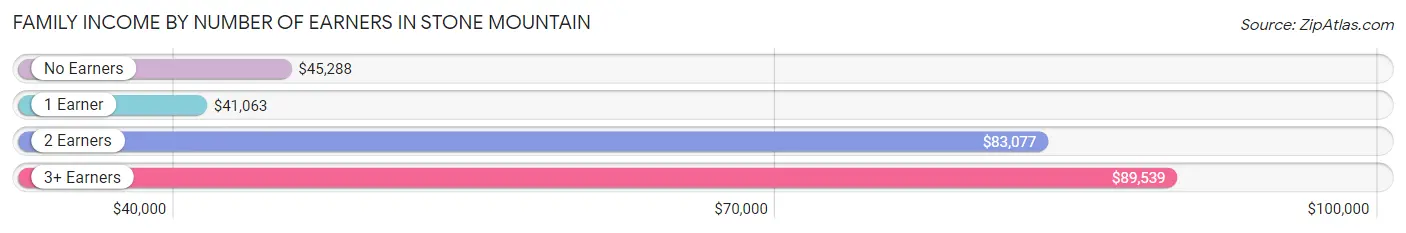
Family Income by Number of Earners in Stone Mountain
The median family income in Stone Mountain is $54,886, with families comprising 3+ earners (141) having the highest median family income of $89,539, while families with 1 earner (640) have the lowest median family income of $41,063, accounting for 9.9% and 44.7% of families, respectively.
| Number of Earners | # Families | Median Income |
| No Earners | 167 (11.7%) | $45,288 |
| 1 Earner | 640 (44.7%) | $41,063 |
| 2 Earners | 484 (33.8%) | $83,077 |
| 3+ Earners | 141 (9.9%) | $89,539 |
| Total | 1,432 (100.0%) | $54,886 |
Household Income in Stone Mountain
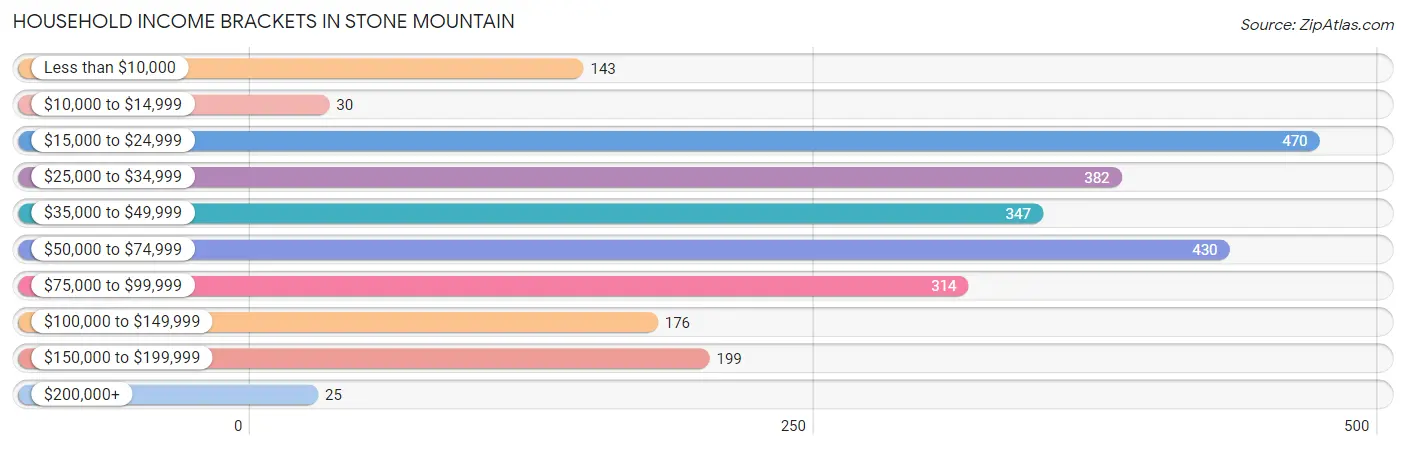
Household Income Brackets in Stone Mountain
With 470 households falling in the category, the $15,000 to $24,999 income range is the most frequent in Stone Mountain, accounting for 18.7% of all households. In contrast, only 25 households (1.0%) fall into the $200,000+ income bracket, making it the least populous group.
| Income Bracket | # Households | % Households |
| Less than $10,000 | 143 | 5.7% |
| $10,000 to $14,999 | 30 | 1.2% |
| $15,000 to $24,999 | 470 | 18.7% |
| $25,000 to $34,999 | 382 | 15.2% |
| $35,000 to $49,999 | 347 | 13.8% |
| $50,000 to $74,999 | 430 | 17.1% |
| $75,000 to $99,999 | 314 | 12.5% |
| $100,000 to $149,999 | 176 | 7.0% |
| $150,000 to $199,999 | 199 | 7.9% |
| $200,000+ | 25 | 1.0% |
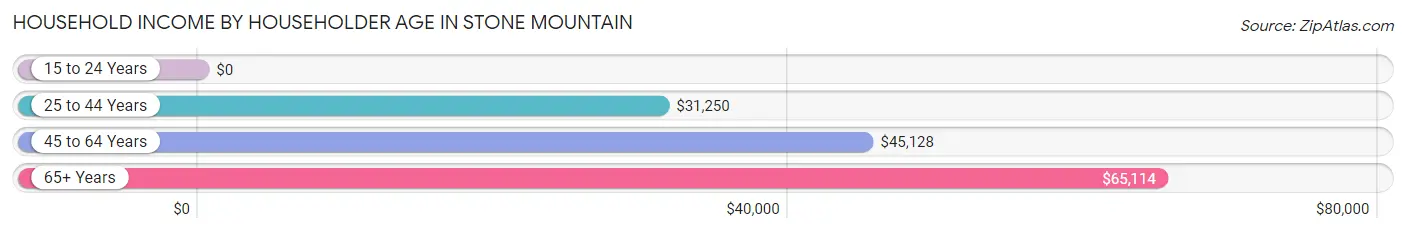
Household Income by Householder Age in Stone Mountain
The median household income in Stone Mountain is $44,950, with the highest median household income of $65,114 found in the 65+ years age bracket for the primary householder. A total of 484 households (19.3%) fall into this category. Meanwhile, the 15 to 24 years age bracket for the primary householder has the lowest median household income of $0, with 48 households (1.9%) in this group.
| Income Bracket | # Households | Median Income |
| 15 to 24 Years | 48 (1.9%) | $0 |
| 25 to 44 Years | 1,188 (47.3%) | $31,250 |
| 45 to 64 Years | 793 (31.6%) | $45,128 |
| 65+ Years | 484 (19.3%) | $65,114 |
| Total | 2,513 (100.0%) | $44,950 |
Poverty in Stone Mountain
Income Below Poverty by Sex and Age in Stone Mountain
With 12.6% poverty level for males and 18.6% for females among the residents of Stone Mountain, under 5 year old males and under 5 year old females are the most vulnerable to poverty, with 99 males (35.1%) and 156 females (42.4%) in their respective age groups living below the poverty level.
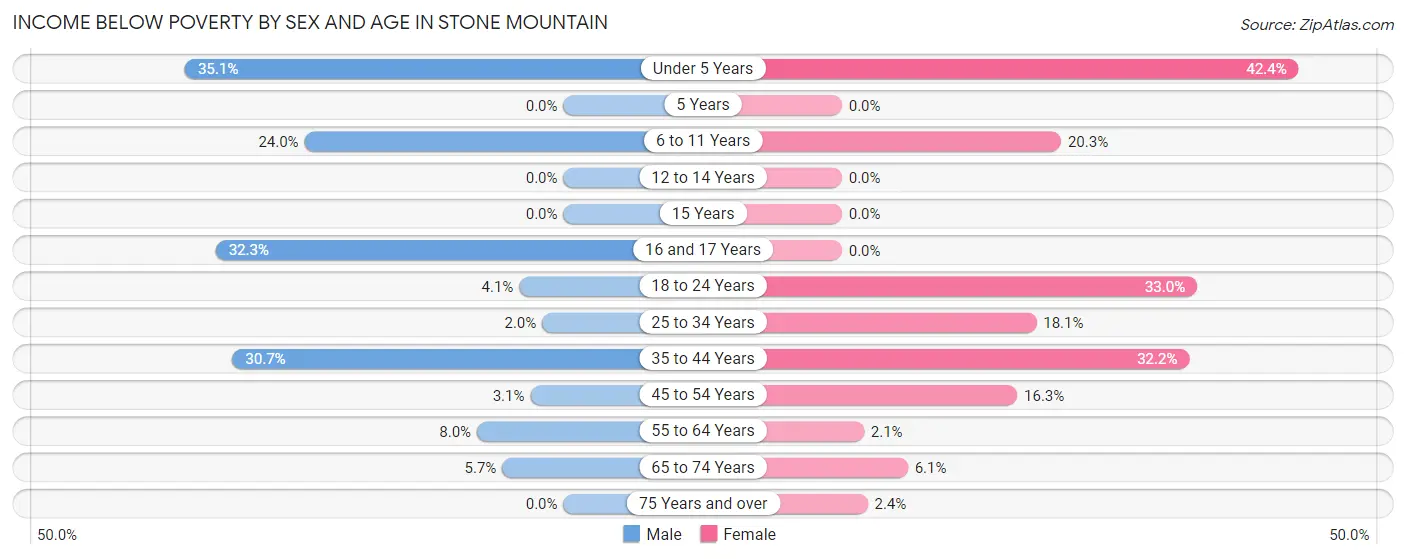
| Age Bracket | Male | Female |
| Under 5 Years | 99 (35.1%) | 156 (42.4%) |
| 5 Years | 0 (0.0%) | 0 (0.0%) |
| 6 to 11 Years | 87 (24.0%) | 48 (20.3%) |
| 12 to 14 Years | 0 (0.0%) | 0 (0.0%) |
| 15 Years | 0 (0.0%) | 0 (0.0%) |
| 16 and 17 Years | 30 (32.3%) | 0 (0.0%) |
| 18 to 24 Years | 5 (4.1%) | 89 (33.0%) |
| 25 to 34 Years | 16 (2.0%) | 141 (18.0%) |
| 35 to 44 Years | 113 (30.7%) | 118 (32.2%) |
| 45 to 54 Years | 10 (3.1%) | 41 (16.3%) |
| 55 to 64 Years | 41 (8.0%) | 10 (2.1%) |
| 65 to 74 Years | 10 (5.7%) | 17 (6.1%) |
| 75 Years and over | 0 (0.0%) | 5 (2.4%) |
| Total | 411 (12.6%) | 625 (18.6%) |
Income Above Poverty by Sex and Age in Stone Mountain
According to the poverty statistics in Stone Mountain, males aged 12 to 14 years and females aged 12 to 14 years are the age groups that are most secure financially, with 100.0% of males and 100.0% of females in these age groups living above the poverty line.
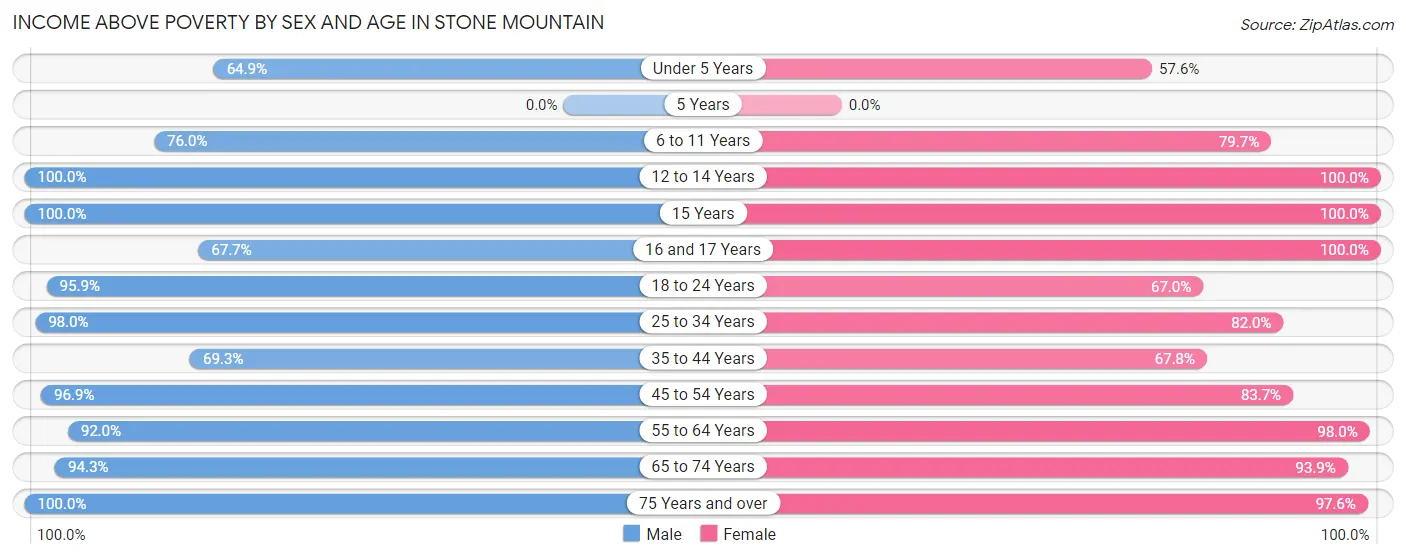
| Age Bracket | Male | Female |
| Under 5 Years | 183 (64.9%) | 212 (57.6%) |
| 5 Years | 0 (0.0%) | 0 (0.0%) |
| 6 to 11 Years | 275 (76.0%) | 188 (79.7%) |
| 12 to 14 Years | 70 (100.0%) | 83 (100.0%) |
| 15 Years | 16 (100.0%) | 16 (100.0%) |
| 16 and 17 Years | 63 (67.7%) | 19 (100.0%) |
| 18 to 24 Years | 117 (95.9%) | 181 (67.0%) |
| 25 to 34 Years | 795 (98.0%) | 640 (82.0%) |
| 35 to 44 Years | 255 (69.3%) | 248 (67.8%) |
| 45 to 54 Years | 316 (96.9%) | 211 (83.7%) |
| 55 to 64 Years | 470 (92.0%) | 478 (98.0%) |
| 65 to 74 Years | 166 (94.3%) | 261 (93.9%) |
| 75 Years and over | 131 (100.0%) | 204 (97.6%) |
| Total | 2,857 (87.4%) | 2,741 (81.4%) |
Income Below Poverty Among Married-Couple Families in Stone Mountain
The poverty statistics for married-couple families in Stone Mountain show that 5.1% or 29 of the total 572 families live below the poverty line. Families with no children have the highest poverty rate of 6.6%, comprising of 29 families. On the other hand, families with 1 or 2 children have the lowest poverty rate of 0.0%, which includes 0 families.
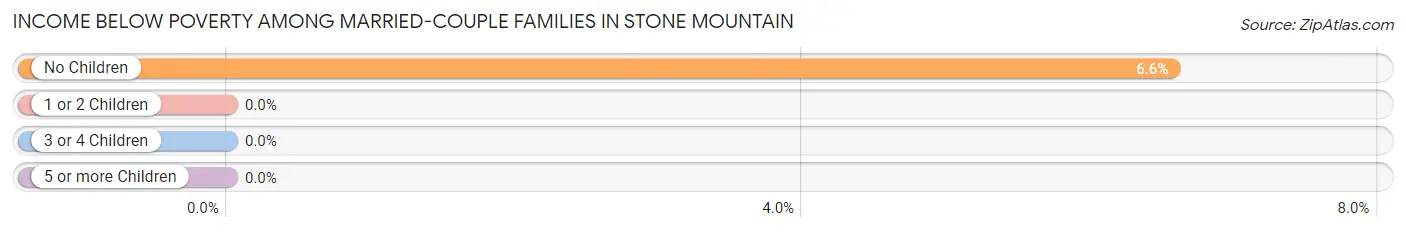
| Children | Above Poverty | Below Poverty |
| No Children | 413 (93.4%) | 29 (6.6%) |
| 1 or 2 Children | 130 (100.0%) | 0 (0.0%) |
| 3 or 4 Children | 0 (0.0%) | 0 (0.0%) |
| 5 or more Children | 0 (0.0%) | 0 (0.0%) |
| Total | 543 (94.9%) | 29 (5.1%) |
Income Below Poverty Among Single-Parent Households in Stone Mountain
According to the poverty data in Stone Mountain, 4.3% or 10 single-father households and 24.1% or 152 single-mother households are living below the poverty line. Among single-father households, those with 1 or 2 children have the highest poverty rate, with 10 households (11.5%) experiencing poverty. Likewise, among single-mother households, those with 5 or more children have the highest poverty rate, with 29 households (100.0%) falling below the poverty line.
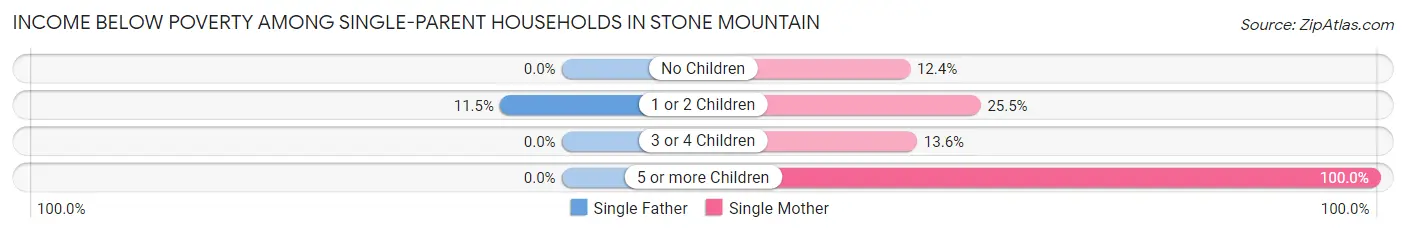
| Children | Single Father | Single Mother |
| No Children | 0 (0.0%) | 21 (12.3%) |
| 1 or 2 Children | 10 (11.5%) | 93 (25.5%) |
| 3 or 4 Children | 0 (0.0%) | 9 (13.6%) |
| 5 or more Children | 0 (0.0%) | 29 (100.0%) |
| Total | 10 (4.3%) | 152 (24.1%) |
Income Below Poverty Among Married-Couple vs Single-Parent Households in Stone Mountain
The poverty data for Stone Mountain shows that 29 of the married-couple family households (5.1%) and 162 of the single-parent households (18.8%) are living below the poverty level. Within the married-couple family households, those with no children have the highest poverty rate, with 29 households (6.6%) falling below the poverty line. Among the single-parent households, those with 5 or more children have the highest poverty rate, with 29 household (100.0%) living below poverty.
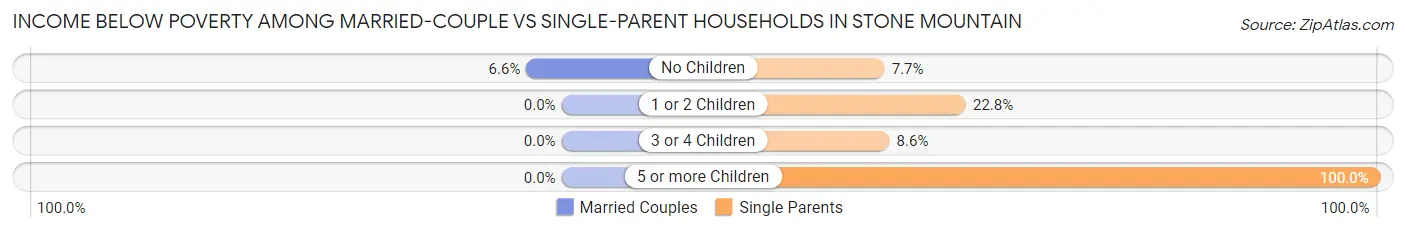
| Children | Married-Couple Families | Single-Parent Households |
| No Children | 29 (6.6%) | 21 (7.7%) |
| 1 or 2 Children | 0 (0.0%) | 103 (22.8%) |
| 3 or 4 Children | 0 (0.0%) | 9 (8.6%) |
| 5 or more Children | 0 (0.0%) | 29 (100.0%) |
| Total | 29 (5.1%) | 162 (18.8%) |
Race in Stone Mountain
The most populous races in Stone Mountain are Black / African American (5,671 | 85.4%), White / Caucasian (827 | 12.5%), and Two or more Races (96 | 1.5%).
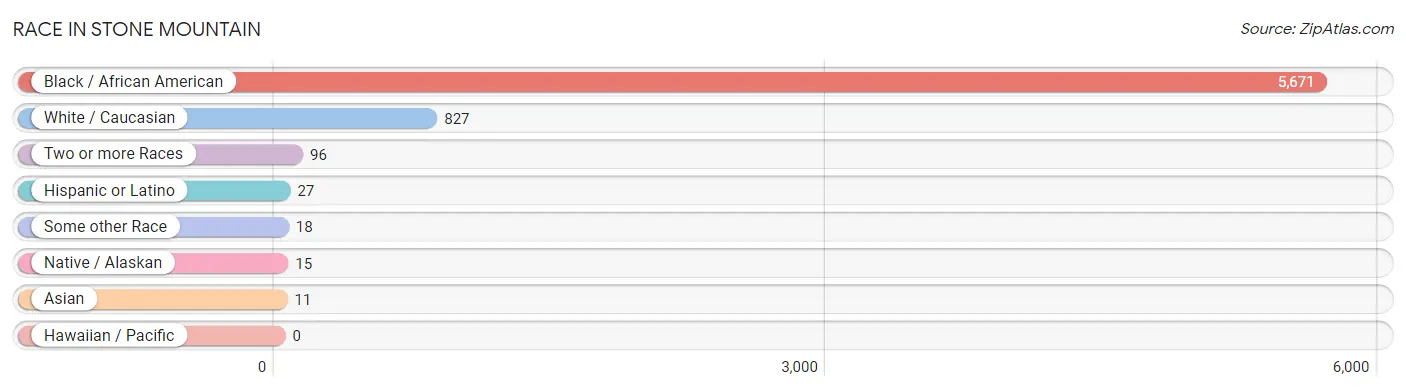
| Race | # Population | % Population |
| Asian | 11 | 0.2% |
| Black / African American | 5,671 | 85.4% |
| Hawaiian / Pacific | 0 | 0.0% |
| Hispanic or Latino | 27 | 0.4% |
| Native / Alaskan | 15 | 0.2% |
| White / Caucasian | 827 | 12.5% |
| Two or more Races | 96 | 1.5% |
| Some other Race | 18 | 0.3% |
| Total | 6,638 | 100.0% |
Ancestry in Stone Mountain
The most populous ancestries reported in Stone Mountain are American (520 | 7.8%), Subsaharan African (473 | 7.1%), Jamaican (458 | 6.9%), Irish (129 | 1.9%), and German (128 | 1.9%), together accounting for 25.7% of all Stone Mountain residents.
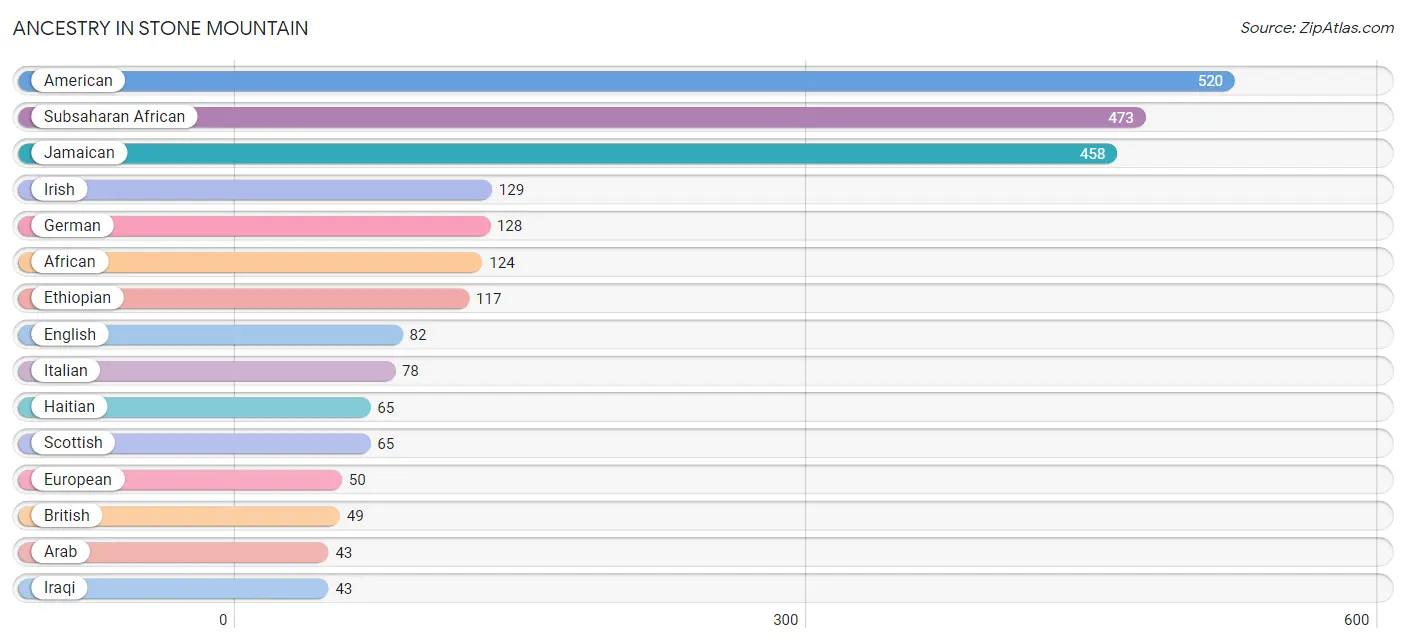
| Ancestry | # Population | % Population |
| African | 124 | 1.9% |
| American | 520 | 7.8% |
| Arab | 43 | 0.6% |
| Australian | 10 | 0.2% |
| British | 49 | 0.7% |
| British West Indian | 16 | 0.2% |
| Burmese | 11 | 0.2% |
| Creek | 15 | 0.2% |
| Danish | 10 | 0.2% |
| English | 82 | 1.2% |
| Ethiopian | 117 | 1.8% |
| European | 50 | 0.7% |
| French | 37 | 0.6% |
| French Canadian | 9 | 0.1% |
| German | 128 | 1.9% |
| Guyanese | 17 | 0.3% |
| Haitian | 65 | 1.0% |
| Hungarian | 5 | 0.1% |
| Iraqi | 43 | 0.6% |
| Irish | 129 | 1.9% |
| Italian | 78 | 1.2% |
| Jamaican | 458 | 6.9% |
| Mexican | 22 | 0.3% |
| Nigerian | 1 | 0.0% |
| Polish | 23 | 0.4% |
| Puerto Rican | 5 | 0.1% |
| Romanian | 9 | 0.1% |
| Scotch-Irish | 20 | 0.3% |
| Scottish | 65 | 1.0% |
| Slavic | 11 | 0.2% |
| Subsaharan African | 473 | 7.1% |
| Swedish | 8 | 0.1% |
| Swiss | 17 | 0.3% |
| West Indian | 16 | 0.2% | View All 34 Rows |
Immigrants in Stone Mountain
The most numerous immigrant groups reported in Stone Mountain came from Africa (509 | 7.7%), Latin America (479 | 7.2%), Caribbean (454 | 6.8%), Jamaica (438 | 6.6%), and Middle Africa (238 | 3.6%), together accounting for 31.9% of all Stone Mountain residents.
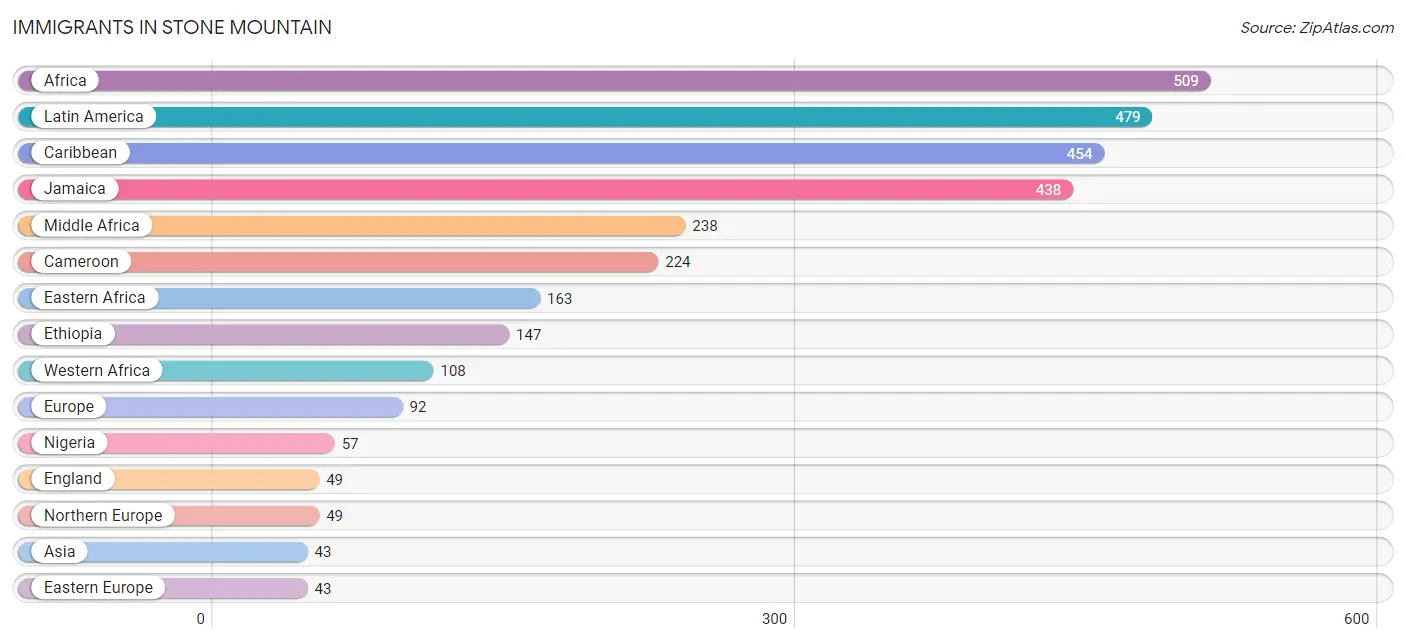
| Immigration Origin | # Population | % Population |
| Africa | 509 | 7.7% |
| Asia | 43 | 0.6% |
| Cameroon | 224 | 3.4% |
| Caribbean | 454 | 6.8% |
| Central America | 16 | 0.2% |
| Dominica | 16 | 0.2% |
| Eastern Africa | 163 | 2.5% |
| Eastern Europe | 43 | 0.6% |
| England | 49 | 0.7% |
| Eritrea | 16 | 0.2% |
| Ethiopia | 147 | 2.2% |
| Europe | 92 | 1.4% |
| Ghana | 36 | 0.5% |
| Guyana | 9 | 0.1% |
| Iraq | 43 | 0.6% |
| Jamaica | 438 | 6.6% |
| Latin America | 479 | 7.2% |
| Mexico | 16 | 0.2% |
| Middle Africa | 238 | 3.6% |
| Nigeria | 57 | 0.9% |
| Northern Europe | 49 | 0.7% |
| Poland | 8 | 0.1% |
| Serbia | 35 | 0.5% |
| South America | 9 | 0.1% |
| Western Africa | 108 | 1.6% |
| Western Asia | 43 | 0.6% |
| Zaire | 14 | 0.2% | View All 27 Rows |
Sex and Age in Stone Mountain
Sex and Age in Stone Mountain
The most populous age groups in Stone Mountain are 30 to 34 Years (621 | 19.0%) for men and 30 to 34 Years (436 | 13.0%) for women.
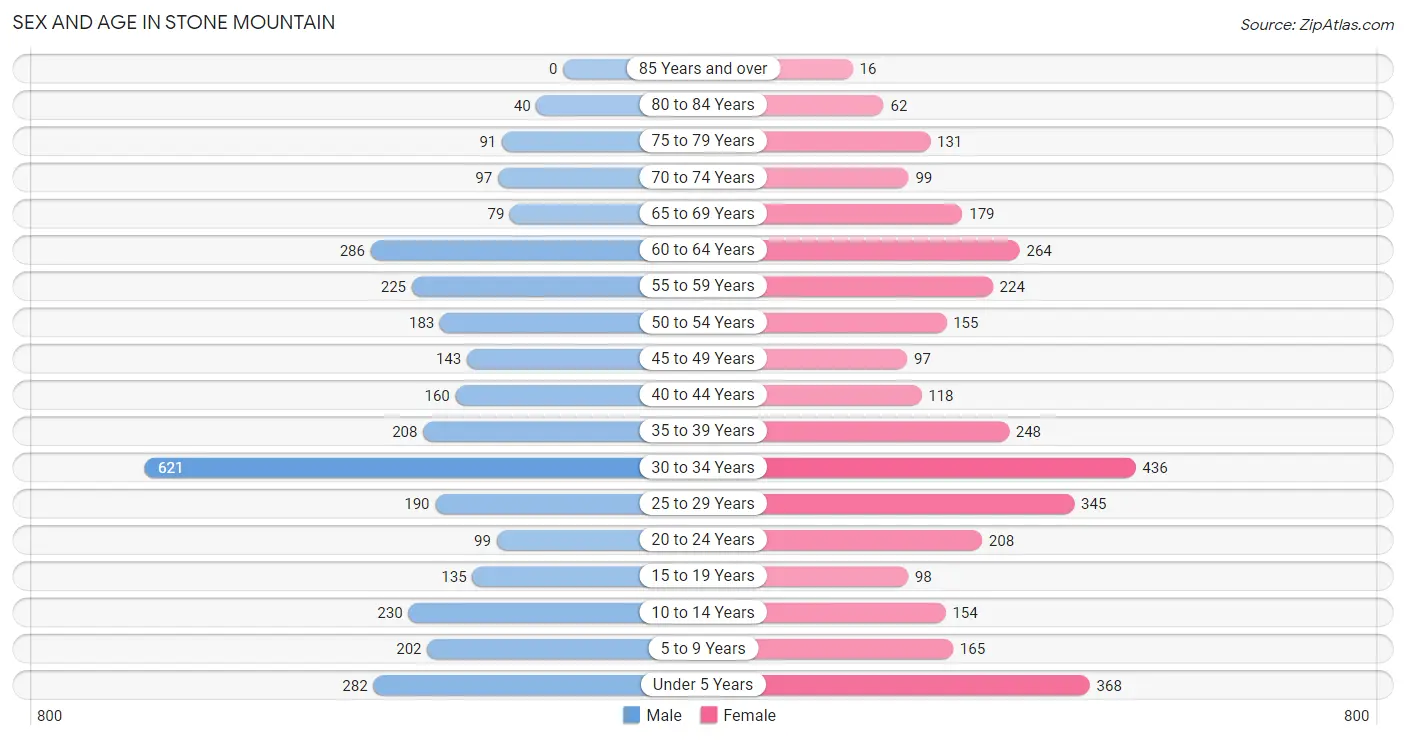
| Age Bracket | Male | Female |
| Under 5 Years | 282 (8.6%) | 368 (10.9%) |
| 5 to 9 Years | 202 (6.2%) | 165 (4.9%) |
| 10 to 14 Years | 230 (7.0%) | 154 (4.6%) |
| 15 to 19 Years | 135 (4.1%) | 98 (2.9%) |
| 20 to 24 Years | 99 (3.0%) | 208 (6.2%) |
| 25 to 29 Years | 190 (5.8%) | 345 (10.2%) |
| 30 to 34 Years | 621 (19.0%) | 436 (13.0%) |
| 35 to 39 Years | 208 (6.4%) | 248 (7.4%) |
| 40 to 44 Years | 160 (4.9%) | 118 (3.5%) |
| 45 to 49 Years | 143 (4.4%) | 97 (2.9%) |
| 50 to 54 Years | 183 (5.6%) | 155 (4.6%) |
| 55 to 59 Years | 225 (6.9%) | 224 (6.7%) |
| 60 to 64 Years | 286 (8.7%) | 264 (7.8%) |
| 65 to 69 Years | 79 (2.4%) | 179 (5.3%) |
| 70 to 74 Years | 97 (3.0%) | 99 (2.9%) |
| 75 to 79 Years | 91 (2.8%) | 131 (3.9%) |
| 80 to 84 Years | 40 (1.2%) | 62 (1.8%) |
| 85 Years and over | 0 (0.0%) | 16 (0.5%) |
| Total | 3,271 (100.0%) | 3,367 (100.0%) |
Families and Households in Stone Mountain
Median Family Size in Stone Mountain
The median family size in Stone Mountain is 3.63 persons per family, with single male/father families (230 | 16.1%) accounting for the largest median family size of 4.36 persons per family. On the other hand, married-couple families (572 | 39.9%) represent the smallest median family size with 3.38 persons per family.
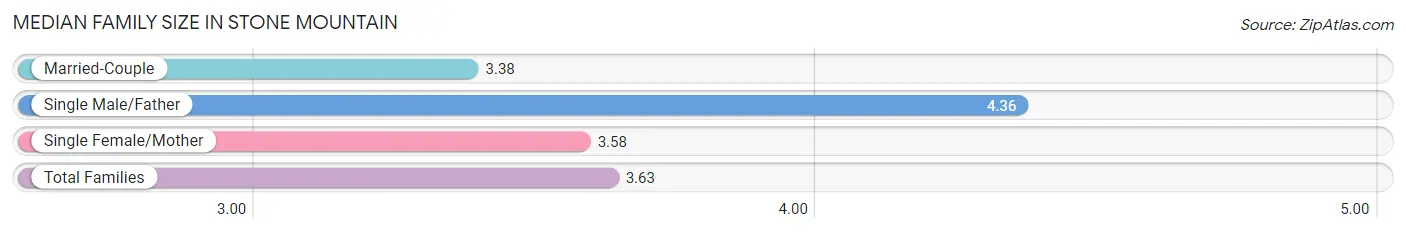
| Family Type | # Families | Family Size |
| Married-Couple | 572 (39.9%) | 3.38 |
| Single Male/Father | 230 (16.1%) | 4.36 |
| Single Female/Mother | 630 (44.0%) | 3.58 |
| Total Families | 1,432 (100.0%) | 3.63 |
Median Household Size in Stone Mountain
The median household size in Stone Mountain is 2.64 persons per household, with single male/father households (230 | 9.1%) accounting for the largest median household size of 4.84 persons per household. non-family households (1,081 | 43.0%) represent the smallest median household size with 1.08 persons per household.
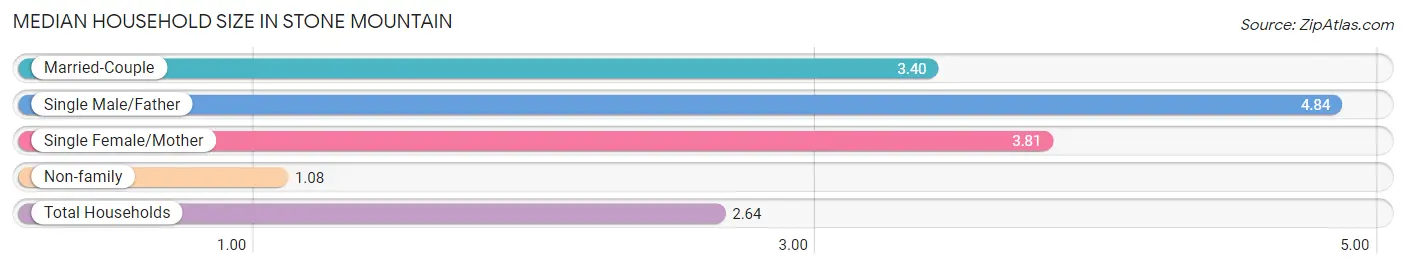
| Household Type | # Households | Household Size |
| Married-Couple | 572 (22.8%) | 3.40 |
| Single Male/Father | 230 (9.1%) | 4.84 |
| Single Female/Mother | 630 (25.1%) | 3.81 |
| Non-family | 1,081 (43.0%) | 1.08 |
| Total Households | 2,513 (100.0%) | 2.64 |
Household Size by Marriage Status in Stone Mountain
Out of a total of 2,513 households in Stone Mountain, 1,432 (57.0%) are family households, while 1,081 (43.0%) are nonfamily households. The most numerous type of family households are 2-person households, comprising 536, and the most common type of nonfamily households are 1-person households, comprising 1,005.
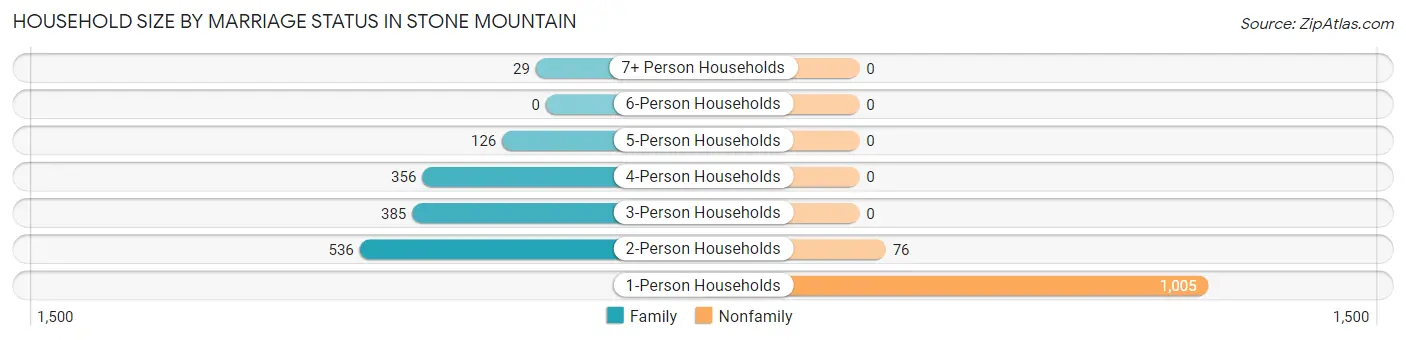
| Household Size | Family Households | Nonfamily Households |
| 1-Person Households | - | 1,005 (40.0%) |
| 2-Person Households | 536 (21.3%) | 76 (3.0%) |
| 3-Person Households | 385 (15.3%) | 0 (0.0%) |
| 4-Person Households | 356 (14.2%) | 0 (0.0%) |
| 5-Person Households | 126 (5.0%) | 0 (0.0%) |
| 6-Person Households | 0 (0.0%) | 0 (0.0%) |
| 7+ Person Households | 29 (1.1%) | 0 (0.0%) |
| Total | 1,432 (57.0%) | 1,081 (43.0%) |
Female Fertility in Stone Mountain
Fertility by Age in Stone Mountain
Average fertility rate in Stone Mountain is 61.0 births per 1,000 women. Women in the age bracket of 20 to 34 years have the highest fertility rate with 96.0 births per 1,000 women. Women in the age bracket of 20 to 34 years acount for 100.0% of all women with births.
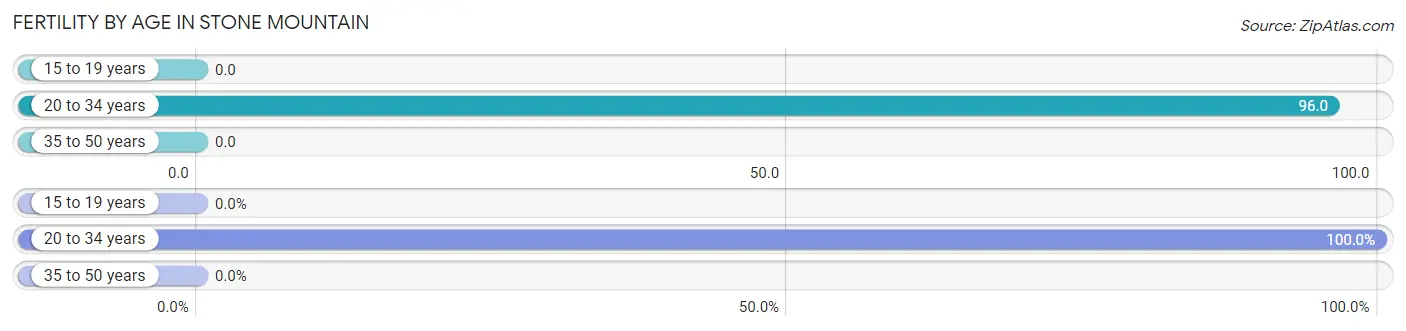
| Age Bracket | Women with Births | Births / 1,000 Women |
| 15 to 19 years | 0 (0.0%) | 0.0 |
| 20 to 34 years | 95 (100.0%) | 96.0 |
| 35 to 50 years | 0 (0.0%) | 0.0 |
| Total | 95 (100.0%) | 61.0 |
Fertility by Age by Marriage Status in Stone Mountain
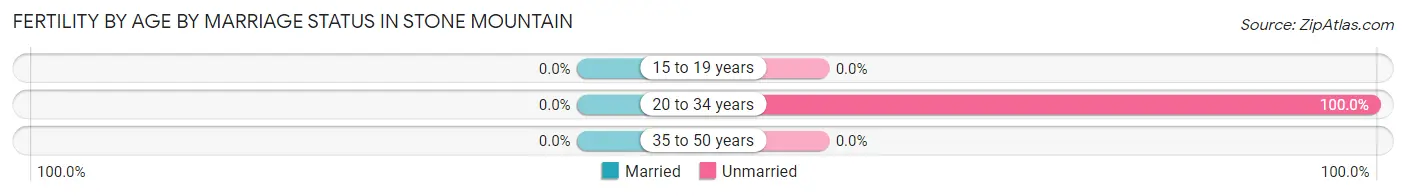
| Age Bracket | Married | Unmarried |
| 15 to 19 years | 0 (0.0%) | 0 (0.0%) |
| 20 to 34 years | 0 (0.0%) | 95 (100.0%) |
| 35 to 50 years | 0 (0.0%) | 0 (0.0%) |
| Total | 0 (0.0%) | 95 (100.0%) |
Fertility by Education in Stone Mountain
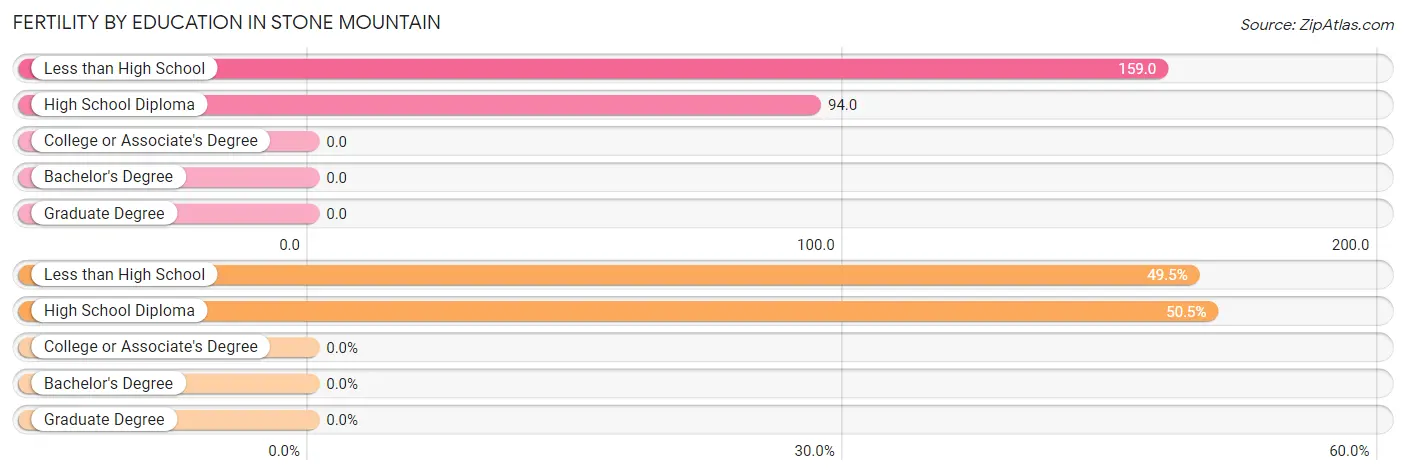
| Educational Attainment | Women with Births | Births / 1,000 Women |
| Less than High School | 47 (49.5%) | 159.0 |
| High School Diploma | 48 (50.5%) | 94.0 |
| College or Associate's Degree | 0 (0.0%) | 0.0 |
| Bachelor's Degree | 0 (0.0%) | 0.0 |
| Graduate Degree | 0 (0.0%) | 0.0 |
| Total | 95 (100.0%) | 61.0 |
Fertility by Education by Marriage Status in Stone Mountain
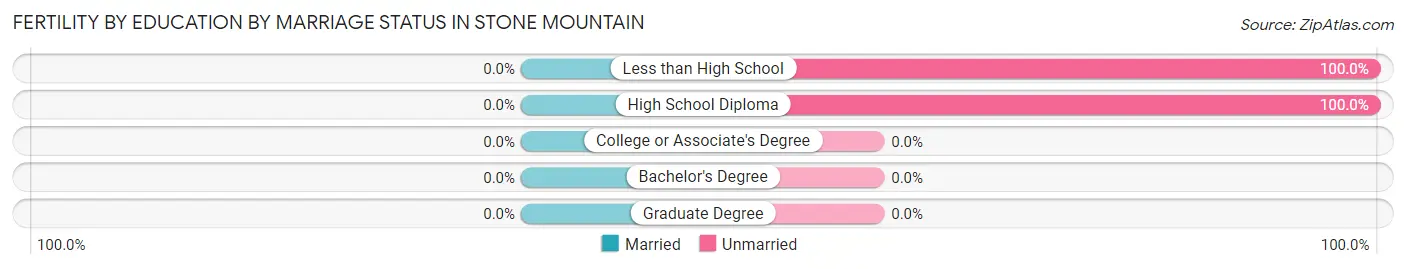
| Educational Attainment | Married | Unmarried |
| Less than High School | 0 (0.0%) | 47 (100.0%) |
| High School Diploma | 0 (0.0%) | 48 (100.0%) |
| College or Associate's Degree | 0 (0.0%) | 0 (0.0%) |
| Bachelor's Degree | 0 (0.0%) | 0 (0.0%) |
| Graduate Degree | 0 (0.0%) | 0 (0.0%) |
| Total | 0 (0.0%) | 95 (100.0%) |
Employment Characteristics in Stone Mountain
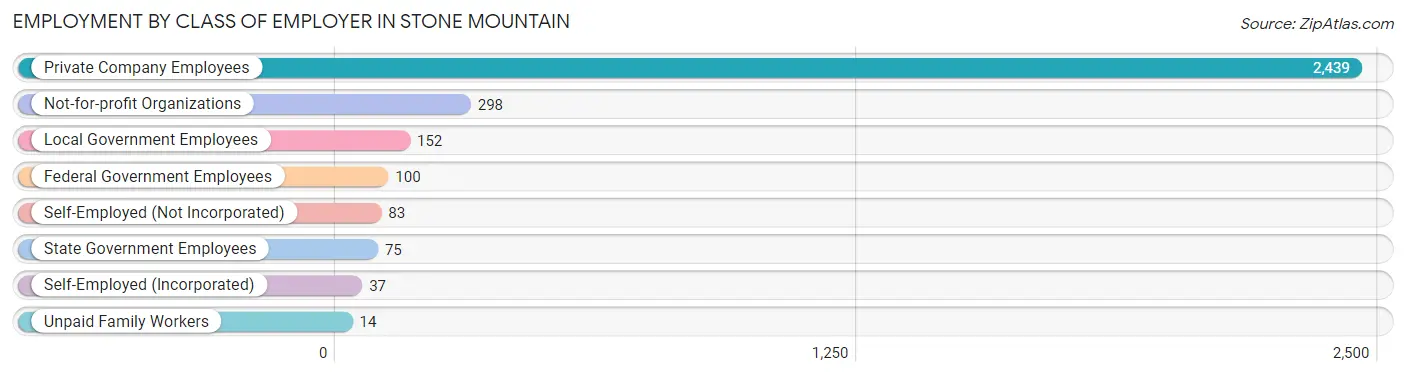
Employment by Class of Employer in Stone Mountain
Among the 3,198 employed individuals in Stone Mountain, private company employees (2,439 | 76.3%), not-for-profit organizations (298 | 9.3%), and local government employees (152 | 4.8%) make up the most common classes of employment.
| Employer Class | # Employees | % Employees |
| Private Company Employees | 2,439 | 76.3% |
| Self-Employed (Incorporated) | 37 | 1.2% |
| Self-Employed (Not Incorporated) | 83 | 2.6% |
| Not-for-profit Organizations | 298 | 9.3% |
| Local Government Employees | 152 | 4.8% |
| State Government Employees | 75 | 2.4% |
| Federal Government Employees | 100 | 3.1% |
| Unpaid Family Workers | 14 | 0.4% |
| Total | 3,198 | 100.0% |
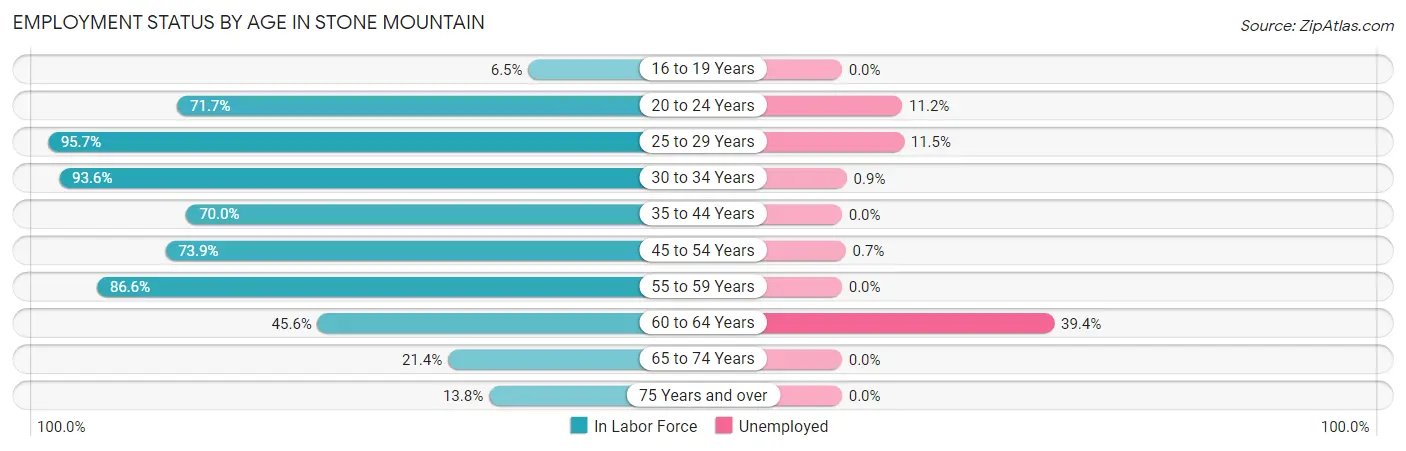
Employment Status by Age in Stone Mountain
According to the labor force statistics for Stone Mountain, out of the total population over 16 years of age (5,203), 66.5% or 3,460 individuals are in the labor force, with 5.6% or 194 of them unemployed. The age group with the highest labor force participation rate is 25 to 29 years, with 95.7% or 512 individuals in the labor force. Within the labor force, the 60 to 64 years age range has the highest percentage of unemployed individuals, with 39.4% or 99 of them being unemployed.
| Age Bracket | In Labor Force | Unemployed |
| 16 to 19 Years | 13 (6.5%) | 0 (0.0%) |
| 20 to 24 Years | 220 (71.7%) | 25 (11.2%) |
| 25 to 29 Years | 512 (95.7%) | 59 (11.5%) |
| 30 to 34 Years | 989 (93.6%) | 9 (0.9%) |
| 35 to 44 Years | 514 (70.0%) | 0 (0.0%) |
| 45 to 54 Years | 427 (73.9%) | 3 (0.7%) |
| 55 to 59 Years | 389 (86.6%) | 0 (0.0%) |
| 60 to 64 Years | 251 (45.6%) | 99 (39.4%) |
| 65 to 74 Years | 97 (21.4%) | 0 (0.0%) |
| 75 Years and over | 47 (13.8%) | 0 (0.0%) |
| Total | 3,460 (66.5%) | 194 (5.6%) |
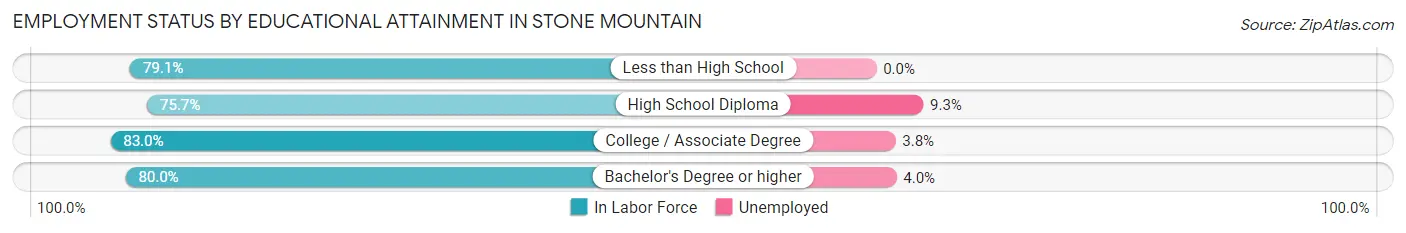
Employment Status by Educational Attainment in Stone Mountain
According to labor force statistics for Stone Mountain, 79.0% of individuals (3,083) out of the total population between 25 and 64 years of age (3,903) are in the labor force, with 5.5% or 170 of them being unemployed. The group with the highest labor force participation rate are those with the educational attainment of college / associate degree, with 83.0% or 869 individuals in the labor force. Within the labor force, individuals with high school diploma education have the highest percentage of unemployment, with 9.3% or 111 of them being unemployed.
| Educational Attainment | In Labor Force | Unemployed |
| Less than High School | 368 (79.1%) | 0 (0.0%) |
| High School Diploma | 1,193 (75.7%) | 147 (9.3%) |
| College / Associate Degree | 869 (83.0%) | 40 (3.8%) |
| Bachelor's Degree or higher | 652 (80.0%) | 33 (4.0%) |
| Total | 3,083 (79.0%) | 215 (5.5%) |
Employment Occupations by Sex in Stone Mountain
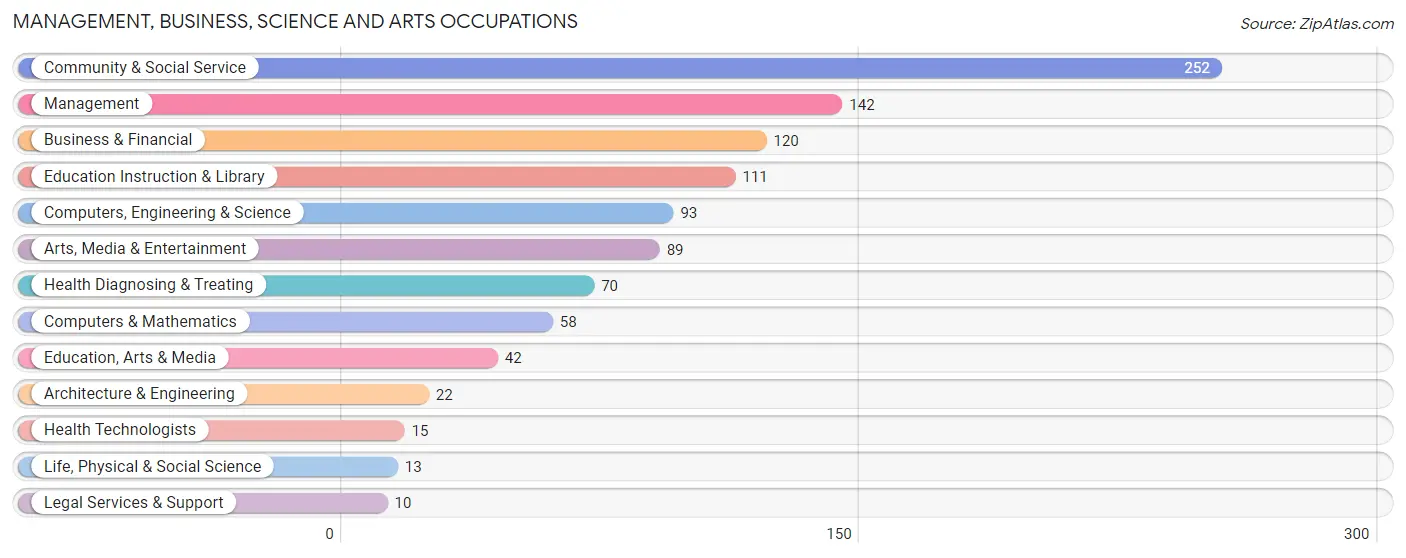
Management, Business, Science and Arts Occupations
The most common Management, Business, Science and Arts occupations in Stone Mountain are Community & Social Service (252 | 7.7%), Management (142 | 4.4%), Business & Financial (120 | 3.7%), Education Instruction & Library (111 | 3.4%), and Computers, Engineering & Science (93 | 2.9%).
Management, Business, Science and Arts Occupations by Sex
Within the Management, Business, Science and Arts occupations in Stone Mountain, the most male-oriented occupations are Architecture & Engineering (100.0%), Life, Physical & Social Science (100.0%), and Computers, Engineering & Science (90.3%), while the most female-oriented occupations are Legal Services & Support (100.0%), Education Instruction & Library (100.0%), and Health Diagnosing & Treating (87.1%).
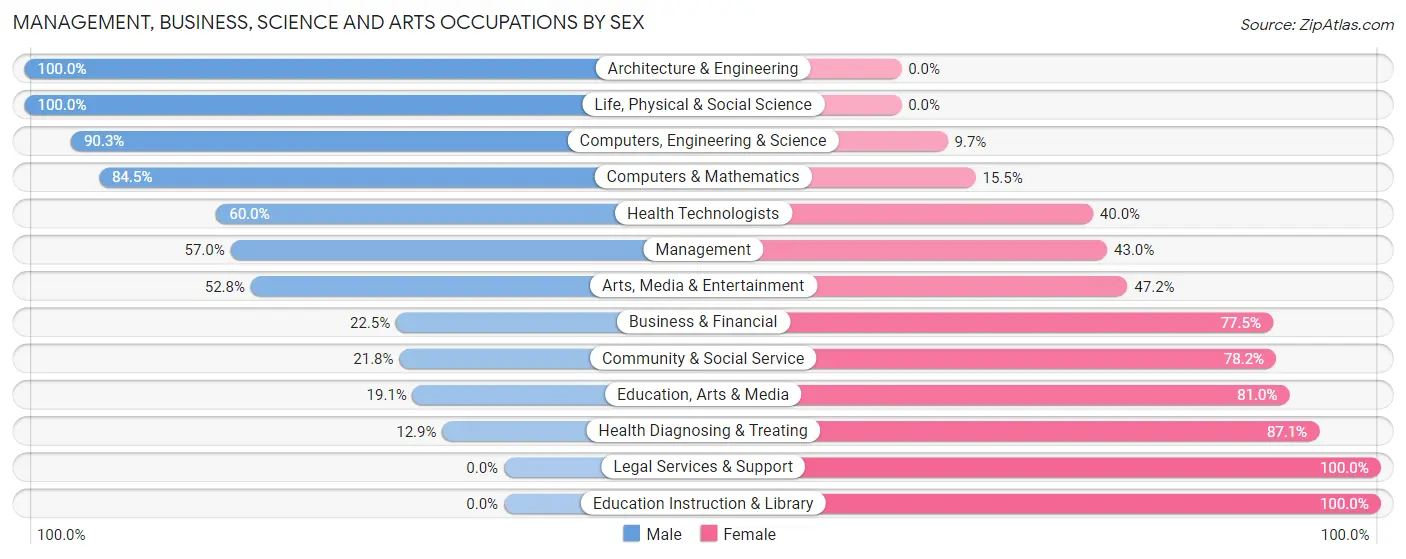
| Occupation | Male | Female |
| Management | 81 (57.0%) | 61 (43.0%) |
| Business & Financial | 27 (22.5%) | 93 (77.5%) |
| Computers, Engineering & Science | 84 (90.3%) | 9 (9.7%) |
| Computers & Mathematics | 49 (84.5%) | 9 (15.5%) |
| Architecture & Engineering | 22 (100.0%) | 0 (0.0%) |
| Life, Physical & Social Science | 13 (100.0%) | 0 (0.0%) |
| Community & Social Service | 55 (21.8%) | 197 (78.2%) |
| Education, Arts & Media | 8 (19.1%) | 34 (80.9%) |
| Legal Services & Support | 0 (0.0%) | 10 (100.0%) |
| Education Instruction & Library | 0 (0.0%) | 111 (100.0%) |
| Arts, Media & Entertainment | 47 (52.8%) | 42 (47.2%) |
| Health Diagnosing & Treating | 9 (12.9%) | 61 (87.1%) |
| Health Technologists | 9 (60.0%) | 6 (40.0%) |
| Total (Category) | 256 (37.8%) | 421 (62.2%) |
| Total (Overall) | 1,633 (50.2%) | 1,618 (49.8%) |
Services Occupations
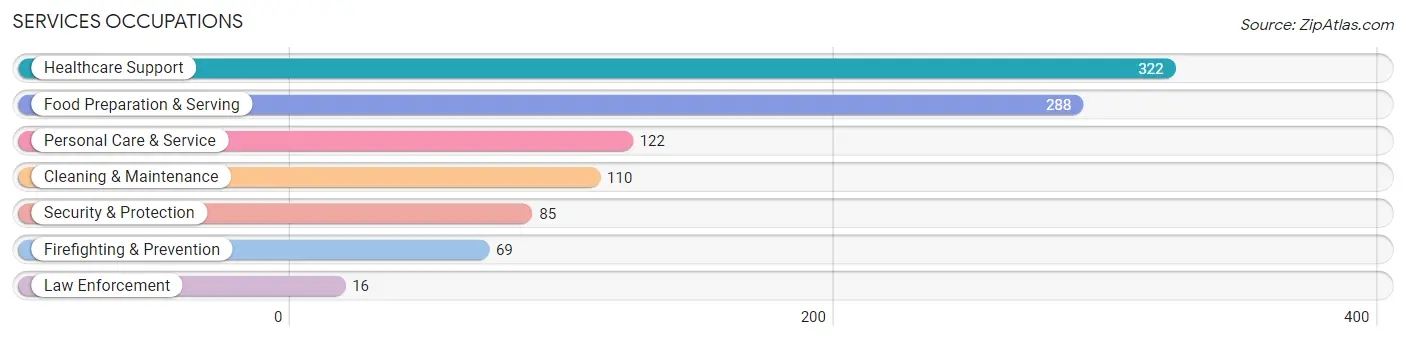
The most common Services occupations in Stone Mountain are Healthcare Support (322 | 9.9%), Food Preparation & Serving (288 | 8.9%), Personal Care & Service (122 | 3.7%), Cleaning & Maintenance (110 | 3.4%), and Security & Protection (85 | 2.6%).
Services Occupations by Sex
Within the Services occupations in Stone Mountain, the most male-oriented occupations are Law Enforcement (100.0%), Security & Protection (75.3%), and Firefighting & Prevention (69.6%), while the most female-oriented occupations are Healthcare Support (100.0%), Personal Care & Service (93.4%), and Food Preparation & Serving (56.6%).
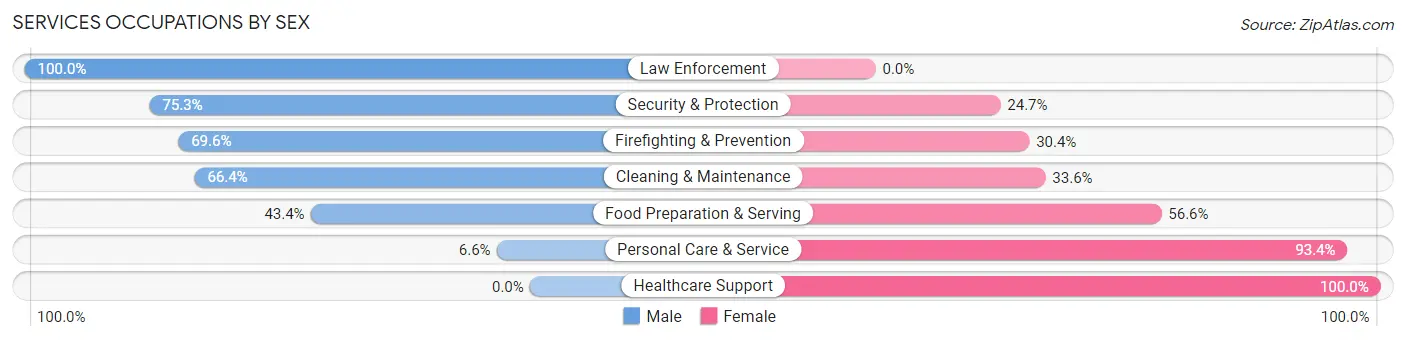
| Occupation | Male | Female |
| Healthcare Support | 0 (0.0%) | 322 (100.0%) |
| Security & Protection | 64 (75.3%) | 21 (24.7%) |
| Firefighting & Prevention | 48 (69.6%) | 21 (30.4%) |
| Law Enforcement | 16 (100.0%) | 0 (0.0%) |
| Food Preparation & Serving | 125 (43.4%) | 163 (56.6%) |
| Cleaning & Maintenance | 73 (66.4%) | 37 (33.6%) |
| Personal Care & Service | 8 (6.6%) | 114 (93.4%) |
| Total (Category) | 270 (29.1%) | 657 (70.9%) |
| Total (Overall) | 1,633 (50.2%) | 1,618 (49.8%) |
Sales and Office Occupations
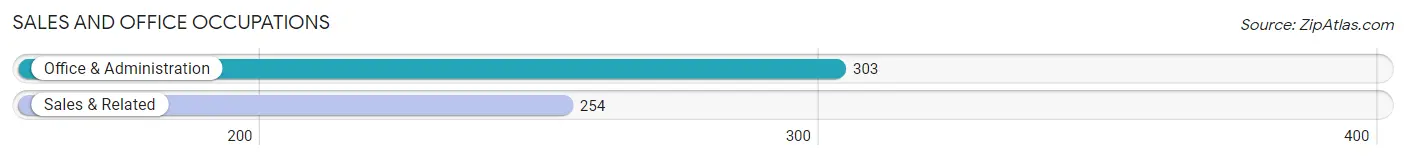
The most common Sales and Office occupations in Stone Mountain are Office & Administration (303 | 9.3%), and Sales & Related (254 | 7.8%).
Sales and Office Occupations by Sex
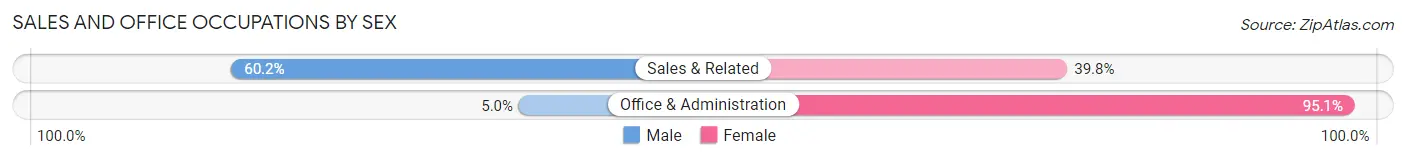
| Occupation | Male | Female |
| Sales & Related | 153 (60.2%) | 101 (39.8%) |
| Office & Administration | 15 (5.0%) | 288 (95.1%) |
| Total (Category) | 168 (30.2%) | 389 (69.8%) |
| Total (Overall) | 1,633 (50.2%) | 1,618 (49.8%) |
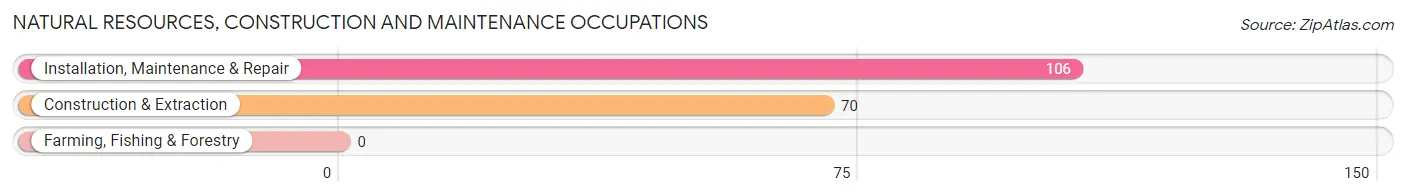
Natural Resources, Construction and Maintenance Occupations
The most common Natural Resources, Construction and Maintenance occupations in Stone Mountain are Installation, Maintenance & Repair (106 | 3.3%), and Construction & Extraction (70 | 2.1%).
Natural Resources, Construction and Maintenance Occupations by Sex
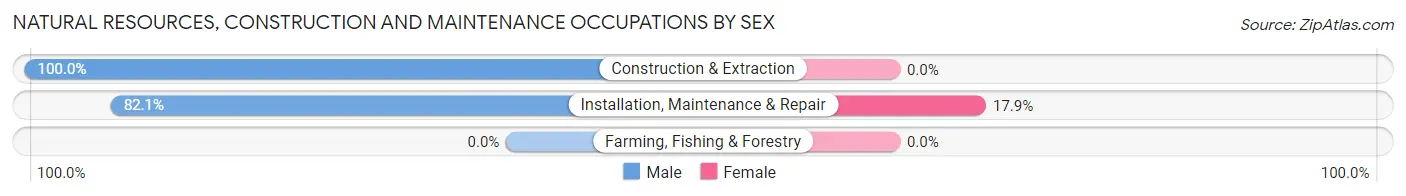
| Occupation | Male | Female |
| Farming, Fishing & Forestry | 0 (0.0%) | 0 (0.0%) |
| Construction & Extraction | 70 (100.0%) | 0 (0.0%) |
| Installation, Maintenance & Repair | 87 (82.1%) | 19 (17.9%) |
| Total (Category) | 157 (89.2%) | 19 (10.8%) |
| Total (Overall) | 1,633 (50.2%) | 1,618 (49.8%) |
Production, Transportation and Moving Occupations
The most common Production, Transportation and Moving occupations in Stone Mountain are Production (406 | 12.5%), Transportation (296 | 9.1%), and Material Moving (212 | 6.5%).
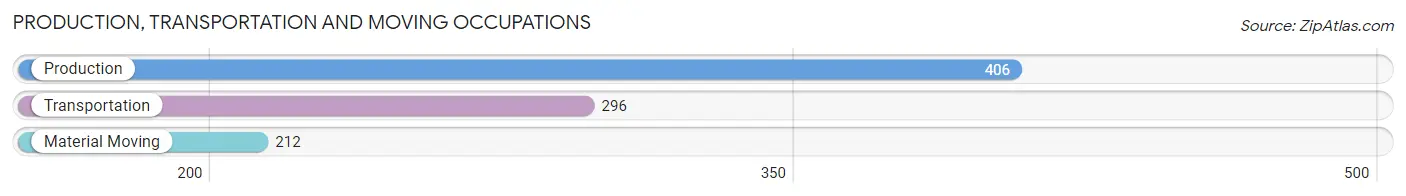
Production, Transportation and Moving Occupations by Sex
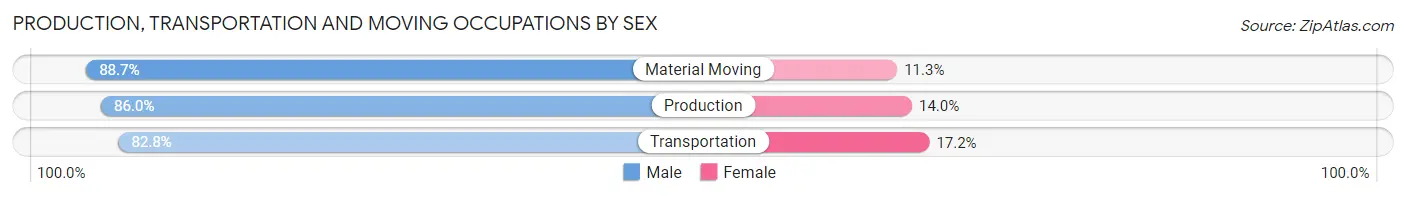
| Occupation | Male | Female |
| Production | 349 (86.0%) | 57 (14.0%) |
| Transportation | 245 (82.8%) | 51 (17.2%) |
| Material Moving | 188 (88.7%) | 24 (11.3%) |
| Total (Category) | 782 (85.6%) | 132 (14.4%) |
| Total (Overall) | 1,633 (50.2%) | 1,618 (49.8%) |
Employment Industries by Sex in Stone Mountain
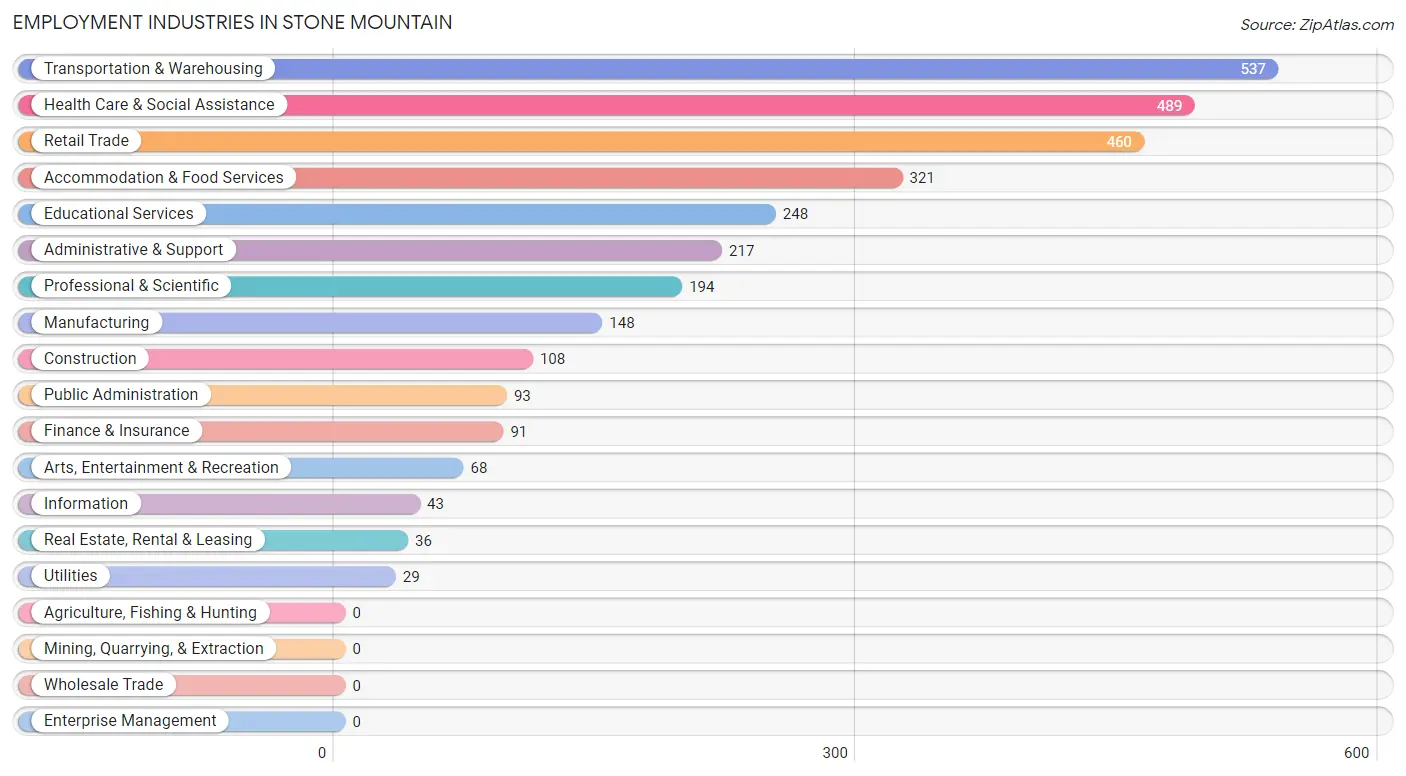
Employment Industries in Stone Mountain
The major employment industries in Stone Mountain include Transportation & Warehousing (537 | 16.5%), Health Care & Social Assistance (489 | 15.0%), Retail Trade (460 | 14.1%), Accommodation & Food Services (321 | 9.9%), and Educational Services (248 | 7.6%).
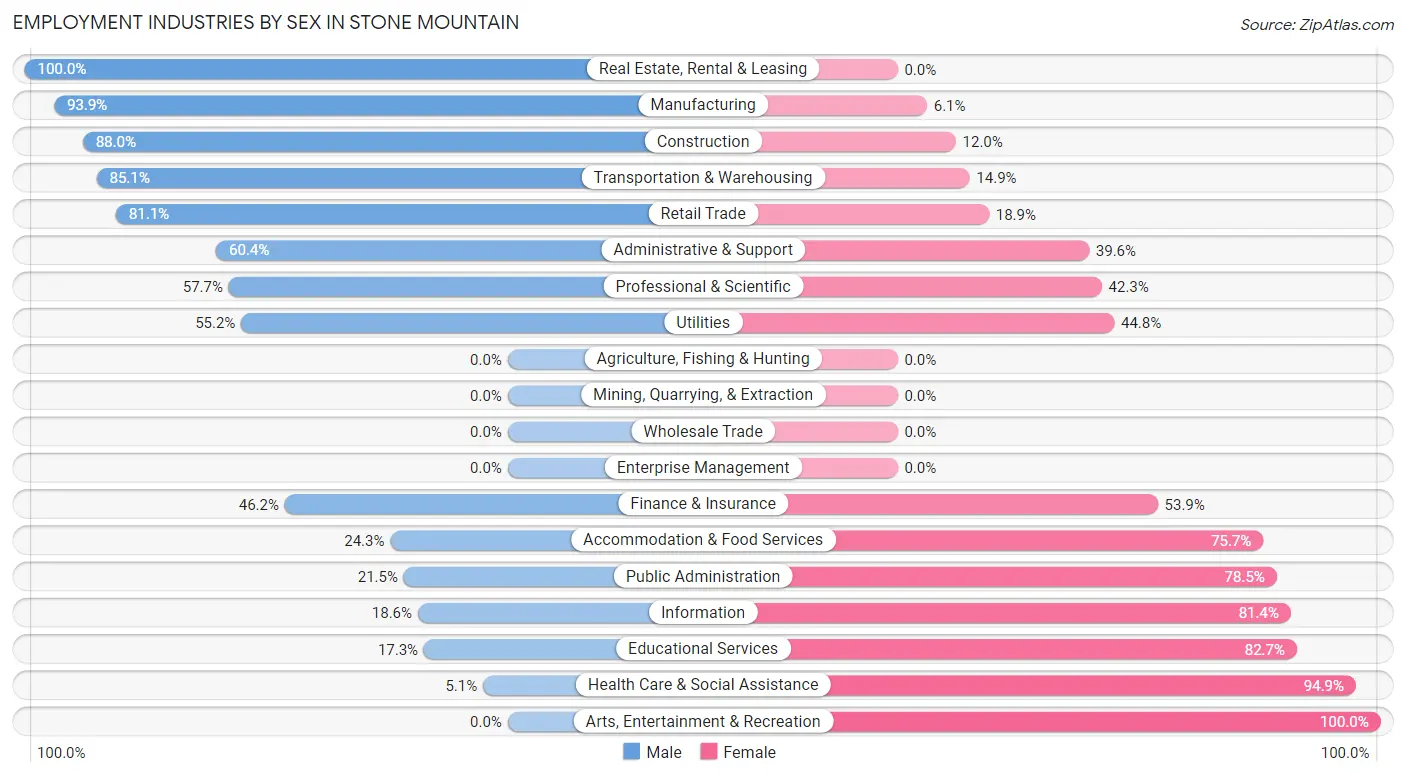
Employment Industries by Sex in Stone Mountain
The Stone Mountain industries that see more men than women are Real Estate, Rental & Leasing (100.0%), Manufacturing (93.9%), and Construction (88.0%), whereas the industries that tend to have a higher number of women are Arts, Entertainment & Recreation (100.0%), Health Care & Social Assistance (94.9%), and Educational Services (82.7%).
| Industry | Male | Female |
| Agriculture, Fishing & Hunting | 0 (0.0%) | 0 (0.0%) |
| Mining, Quarrying, & Extraction | 0 (0.0%) | 0 (0.0%) |
| Construction | 95 (88.0%) | 13 (12.0%) |
| Manufacturing | 139 (93.9%) | 9 (6.1%) |
| Wholesale Trade | 0 (0.0%) | 0 (0.0%) |
| Retail Trade | 373 (81.1%) | 87 (18.9%) |
| Transportation & Warehousing | 457 (85.1%) | 80 (14.9%) |
| Utilities | 16 (55.2%) | 13 (44.8%) |
| Information | 8 (18.6%) | 35 (81.4%) |
| Finance & Insurance | 42 (46.2%) | 49 (53.8%) |
| Real Estate, Rental & Leasing | 36 (100.0%) | 0 (0.0%) |
| Professional & Scientific | 112 (57.7%) | 82 (42.3%) |
| Enterprise Management | 0 (0.0%) | 0 (0.0%) |
| Administrative & Support | 131 (60.4%) | 86 (39.6%) |
| Educational Services | 43 (17.3%) | 205 (82.7%) |
| Health Care & Social Assistance | 25 (5.1%) | 464 (94.9%) |
| Arts, Entertainment & Recreation | 0 (0.0%) | 68 (100.0%) |
| Accommodation & Food Services | 78 (24.3%) | 243 (75.7%) |
| Public Administration | 20 (21.5%) | 73 (78.5%) |
| Total | 1,633 (50.2%) | 1,618 (49.8%) |
Education in Stone Mountain
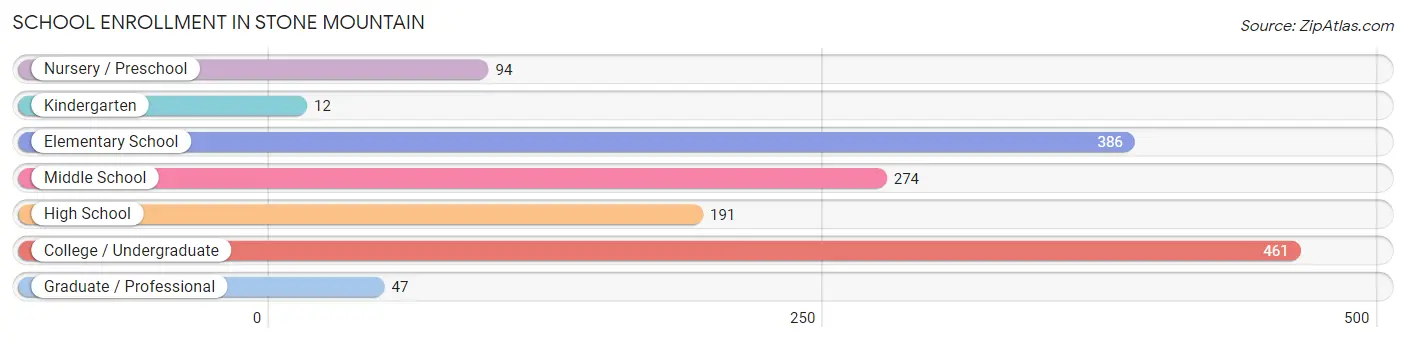
School Enrollment in Stone Mountain
The most common levels of schooling among the 1,465 students in Stone Mountain are college / undergraduate (461 | 31.5%), elementary school (386 | 26.4%), and middle school (274 | 18.7%).
| School Level | # Students | % Students |
| Nursery / Preschool | 94 | 6.4% |
| Kindergarten | 12 | 0.8% |
| Elementary School | 386 | 26.4% |
| Middle School | 274 | 18.7% |
| High School | 191 | 13.0% |
| College / Undergraduate | 461 | 31.5% |
| Graduate / Professional | 47 | 3.2% |
| Total | 1,465 | 100.0% |
School Enrollment by Age by Funding Source in Stone Mountain
Out of a total of 1,465 students who are enrolled in schools in Stone Mountain, 208 (14.2%) attend a private institution, while the remaining 1,257 (85.8%) are enrolled in public schools. The age group of 3 to 4 year olds has the highest likelihood of being enrolled in private schools, with 57 (60.6% in the age bracket) enrolled. Conversely, the age group of 10 to 14 year olds has the lowest likelihood of being enrolled in a private school, with 349 (100.0% in the age bracket) attending a public institution.
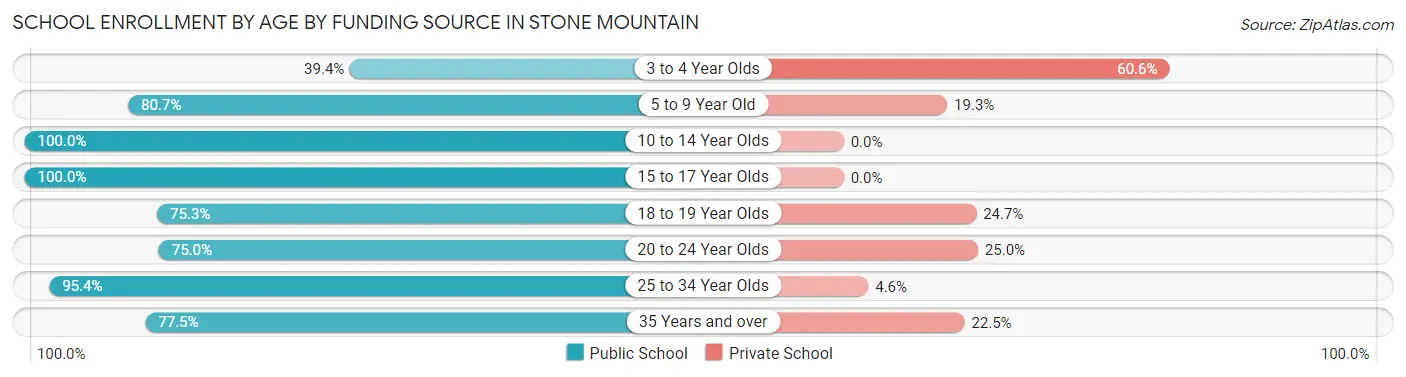
| Age Bracket | Public School | Private School |
| 3 to 4 Year Olds | 37 (39.4%) | 57 (60.6%) |
| 5 to 9 Year Old | 268 (80.7%) | 64 (19.3%) |
| 10 to 14 Year Olds | 349 (100.0%) | 0 (0.0%) |
| 15 to 17 Year Olds | 147 (100.0%) | 0 (0.0%) |
| 18 to 19 Year Olds | 58 (75.3%) | 19 (24.7%) |
| 20 to 24 Year Olds | 66 (75.0%) | 22 (25.0%) |
| 25 to 34 Year Olds | 208 (95.4%) | 10 (4.6%) |
| 35 Years and over | 124 (77.5%) | 36 (22.5%) |
| Total | 1,257 (85.8%) | 208 (14.2%) |
Educational Attainment by Field of Study in Stone Mountain
Business (205 | 19.2%), arts & humanities (168 | 15.7%), science & technology (136 | 12.7%), visual & performing arts (108 | 10.1%), and psychology (96 | 9.0%) are the most common fields of study among 1,069 individuals in Stone Mountain who have obtained a bachelor's degree or higher.
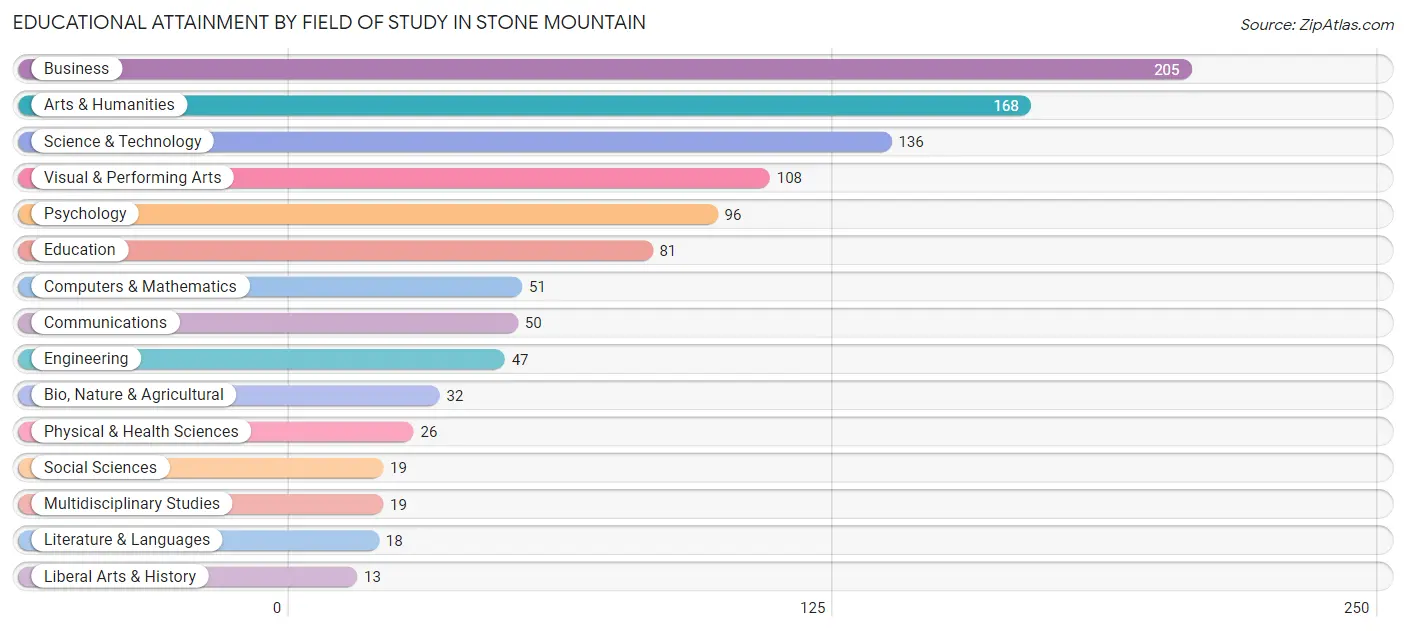
| Field of Study | # Graduates | % Graduates |
| Computers & Mathematics | 51 | 4.8% |
| Bio, Nature & Agricultural | 32 | 3.0% |
| Physical & Health Sciences | 26 | 2.4% |
| Psychology | 96 | 9.0% |
| Social Sciences | 19 | 1.8% |
| Engineering | 47 | 4.4% |
| Multidisciplinary Studies | 19 | 1.8% |
| Science & Technology | 136 | 12.7% |
| Business | 205 | 19.2% |
| Education | 81 | 7.6% |
| Literature & Languages | 18 | 1.7% |
| Liberal Arts & History | 13 | 1.2% |
| Visual & Performing Arts | 108 | 10.1% |
| Communications | 50 | 4.7% |
| Arts & Humanities | 168 | 15.7% |
| Total | 1,069 | 100.0% |
Transportation & Commute in Stone Mountain
Vehicle Availability by Sex in Stone Mountain
The most prevalent vehicle ownership categories in Stone Mountain are males with 2 vehicles (580, accounting for 35.8%) and females with 2 vehicles (660, making up 36.7%).
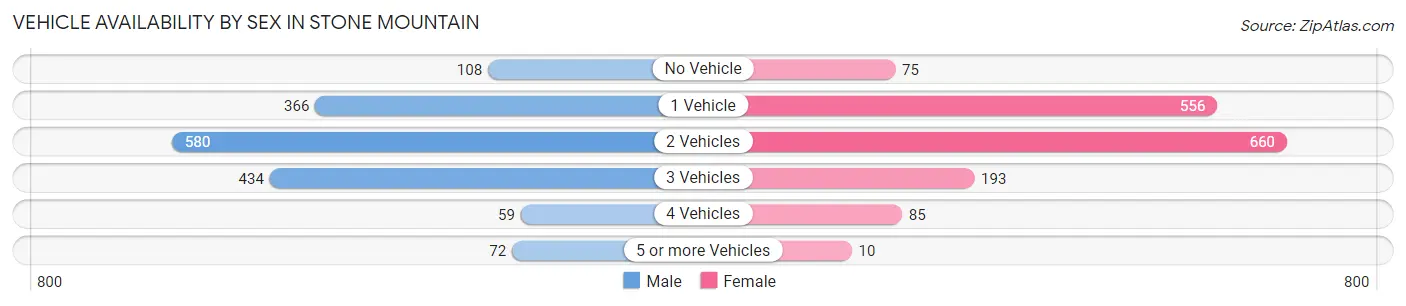
| Vehicles Available | Male | Female |
| No Vehicle | 108 (6.7%) | 75 (4.8%) |
| 1 Vehicle | 366 (22.6%) | 556 (35.2%) |
| 2 Vehicles | 580 (35.8%) | 660 (41.8%) |
| 3 Vehicles | 434 (26.8%) | 193 (12.2%) |
| 4 Vehicles | 59 (3.6%) | 85 (5.4%) |
| 5 or more Vehicles | 72 (4.4%) | 10 (0.6%) |
| Total | 1,619 (100.0%) | 1,579 (100.0%) |
Commute Time in Stone Mountain
The most frequently occuring commute durations in Stone Mountain are 30 to 34 minutes (668 commuters, 22.7%), 45 to 59 minutes (505 commuters, 17.1%), and 10 to 14 minutes (359 commuters, 12.2%).
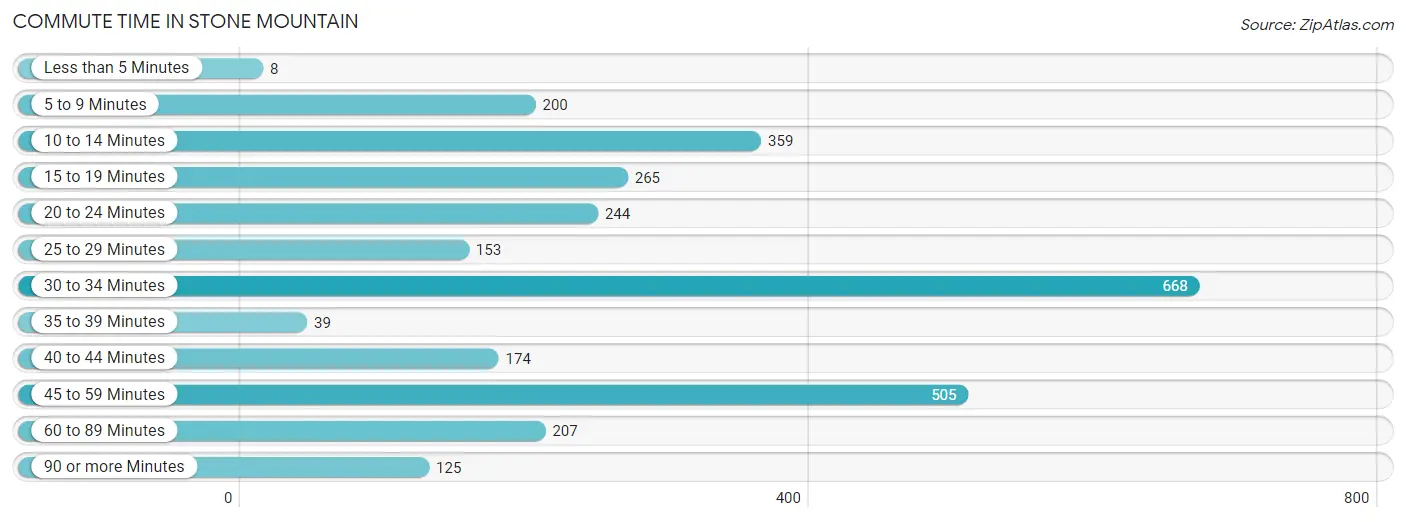
| Commute Time | # Commuters | % Commuters |
| Less than 5 Minutes | 8 | 0.3% |
| 5 to 9 Minutes | 200 | 6.8% |
| 10 to 14 Minutes | 359 | 12.2% |
| 15 to 19 Minutes | 265 | 9.0% |
| 20 to 24 Minutes | 244 | 8.3% |
| 25 to 29 Minutes | 153 | 5.2% |
| 30 to 34 Minutes | 668 | 22.7% |
| 35 to 39 Minutes | 39 | 1.3% |
| 40 to 44 Minutes | 174 | 5.9% |
| 45 to 59 Minutes | 505 | 17.1% |
| 60 to 89 Minutes | 207 | 7.0% |
| 90 or more Minutes | 125 | 4.2% |
Commute Time by Sex in Stone Mountain
The most common commute times in Stone Mountain are 30 to 34 minutes (434 commuters, 29.0%) for males and 45 to 59 minutes (396 commuters, 27.3%) for females.
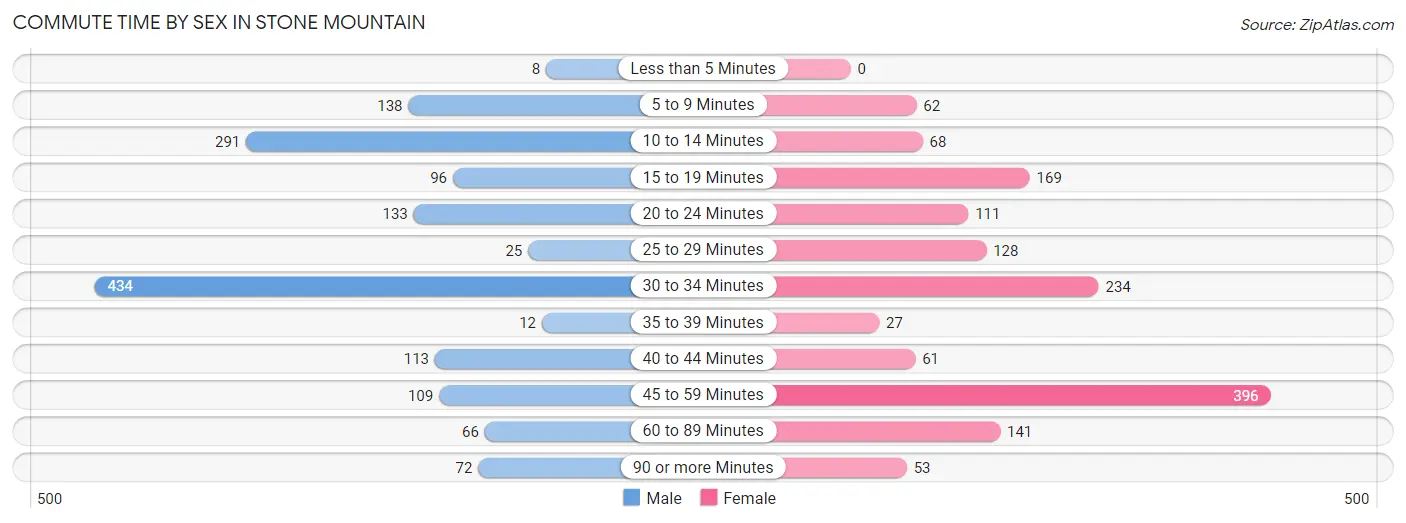
| Commute Time | Male | Female |
| Less than 5 Minutes | 8 (0.5%) | 0 (0.0%) |
| 5 to 9 Minutes | 138 (9.2%) | 62 (4.3%) |
| 10 to 14 Minutes | 291 (19.4%) | 68 (4.7%) |
| 15 to 19 Minutes | 96 (6.4%) | 169 (11.7%) |
| 20 to 24 Minutes | 133 (8.9%) | 111 (7.7%) |
| 25 to 29 Minutes | 25 (1.7%) | 128 (8.8%) |
| 30 to 34 Minutes | 434 (29.0%) | 234 (16.1%) |
| 35 to 39 Minutes | 12 (0.8%) | 27 (1.9%) |
| 40 to 44 Minutes | 113 (7.5%) | 61 (4.2%) |
| 45 to 59 Minutes | 109 (7.3%) | 396 (27.3%) |
| 60 to 89 Minutes | 66 (4.4%) | 141 (9.7%) |
| 90 or more Minutes | 72 (4.8%) | 53 (3.7%) |
Time of Departure to Work by Sex in Stone Mountain
The most frequent times of departure to work in Stone Mountain are 7:00 AM to 7:29 AM (359, 24.0%) for males and 7:00 AM to 7:29 AM (298, 20.5%) for females.
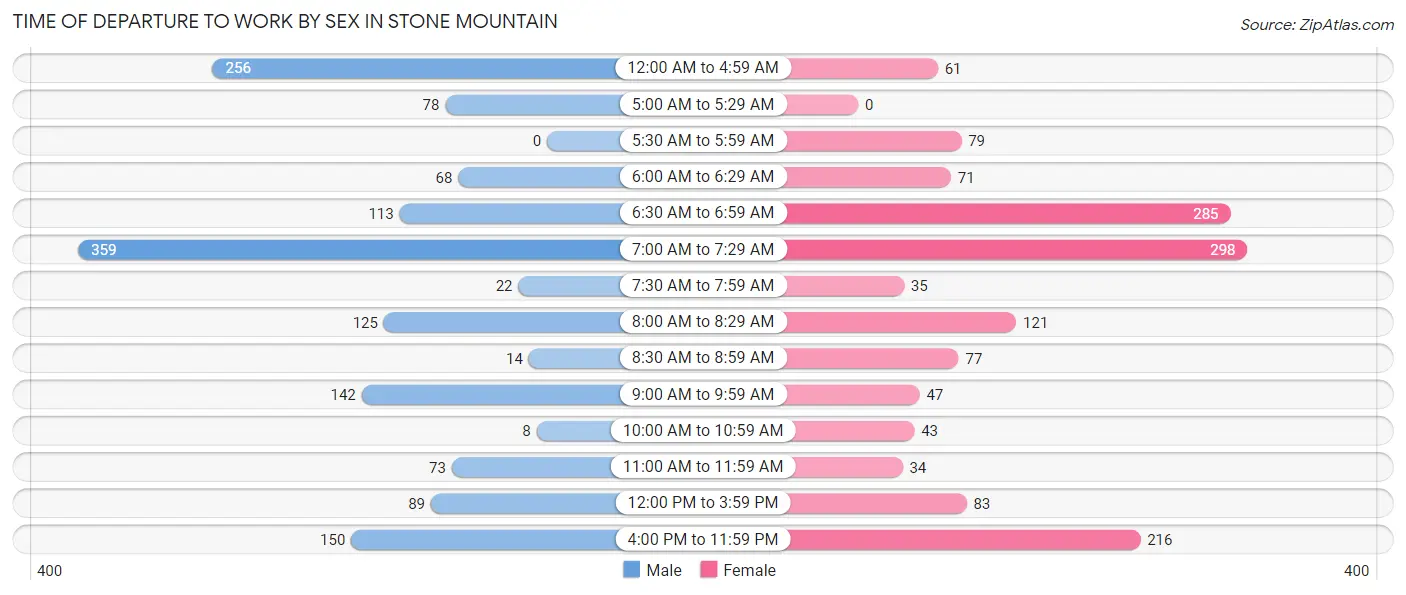
| Time of Departure | Male | Female |
| 12:00 AM to 4:59 AM | 256 (17.1%) | 61 (4.2%) |
| 5:00 AM to 5:29 AM | 78 (5.2%) | 0 (0.0%) |
| 5:30 AM to 5:59 AM | 0 (0.0%) | 79 (5.4%) |
| 6:00 AM to 6:29 AM | 68 (4.5%) | 71 (4.9%) |
| 6:30 AM to 6:59 AM | 113 (7.5%) | 285 (19.7%) |
| 7:00 AM to 7:29 AM | 359 (24.0%) | 298 (20.5%) |
| 7:30 AM to 7:59 AM | 22 (1.5%) | 35 (2.4%) |
| 8:00 AM to 8:29 AM | 125 (8.4%) | 121 (8.3%) |
| 8:30 AM to 8:59 AM | 14 (0.9%) | 77 (5.3%) |
| 9:00 AM to 9:59 AM | 142 (9.5%) | 47 (3.2%) |
| 10:00 AM to 10:59 AM | 8 (0.5%) | 43 (3.0%) |
| 11:00 AM to 11:59 AM | 73 (4.9%) | 34 (2.3%) |
| 12:00 PM to 3:59 PM | 89 (5.9%) | 83 (5.7%) |
| 4:00 PM to 11:59 PM | 150 (10.0%) | 216 (14.9%) |
| Total | 1,497 (100.0%) | 1,450 (100.0%) |
Housing Occupancy in Stone Mountain
Occupancy by Ownership in Stone Mountain
Of the total 2,513 dwellings in Stone Mountain, owner-occupied units account for 1,216 (48.4%), while renter-occupied units make up 1,297 (51.6%).
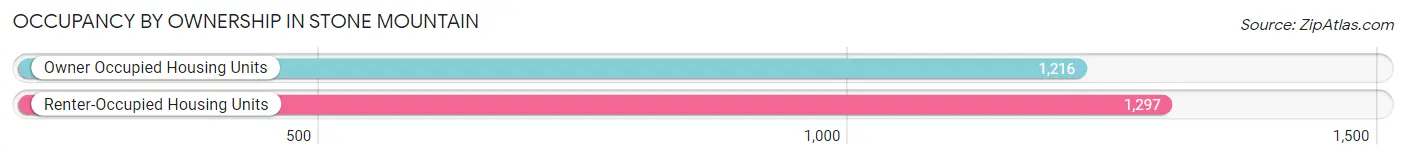
| Occupancy | # Housing Units | % Housing Units |
| Owner Occupied Housing Units | 1,216 | 48.4% |
| Renter-Occupied Housing Units | 1,297 | 51.6% |
| Total Occupied Housing Units | 2,513 | 100.0% |
Occupancy by Household Size in Stone Mountain
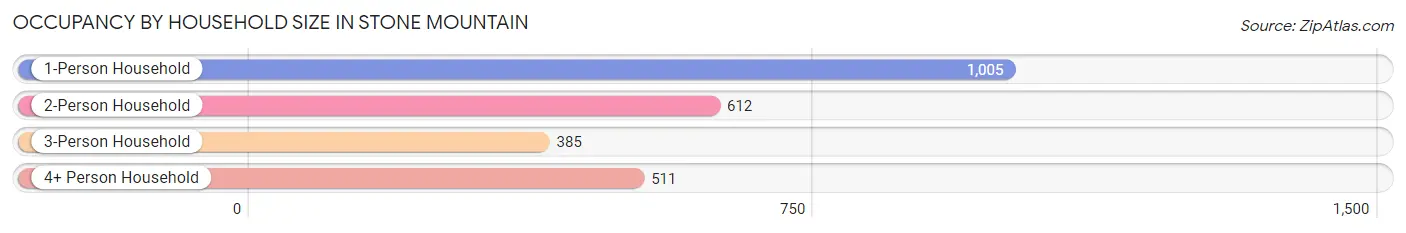
| Household Size | # Housing Units | % Housing Units |
| 1-Person Household | 1,005 | 40.0% |
| 2-Person Household | 612 | 24.3% |
| 3-Person Household | 385 | 15.3% |
| 4+ Person Household | 511 | 20.3% |
| Total Housing Units | 2,513 | 100.0% |
Occupancy by Ownership by Household Size in Stone Mountain
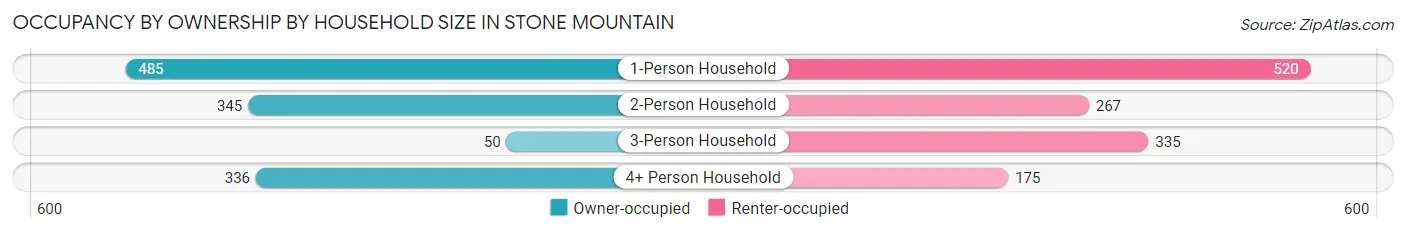
| Household Size | Owner-occupied | Renter-occupied |
| 1-Person Household | 485 (48.3%) | 520 (51.7%) |
| 2-Person Household | 345 (56.4%) | 267 (43.6%) |
| 3-Person Household | 50 (13.0%) | 335 (87.0%) |
| 4+ Person Household | 336 (65.7%) | 175 (34.3%) |
| Total Housing Units | 1,216 (48.4%) | 1,297 (51.6%) |
Occupancy by Educational Attainment in Stone Mountain
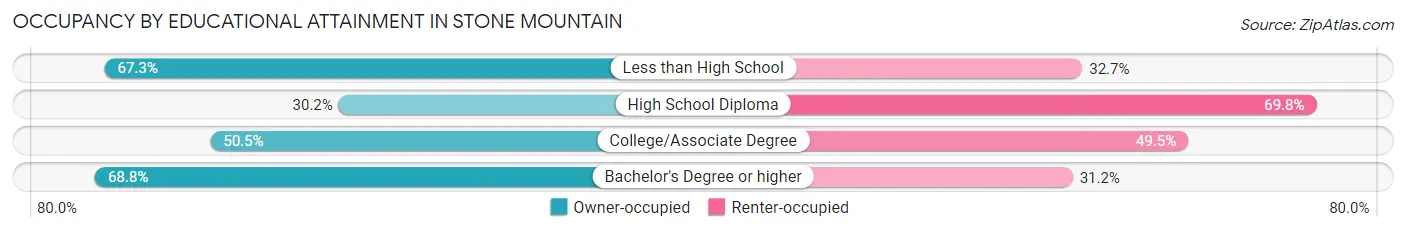
| Household Size | Owner-occupied | Renter-occupied |
| Less than High School | 140 (67.3%) | 68 (32.7%) |
| High School Diploma | 266 (30.2%) | 615 (69.8%) |
| College/Associate Degree | 470 (50.5%) | 460 (49.5%) |
| Bachelor's Degree or higher | 340 (68.8%) | 154 (31.2%) |
Occupancy by Age of Householder in Stone Mountain
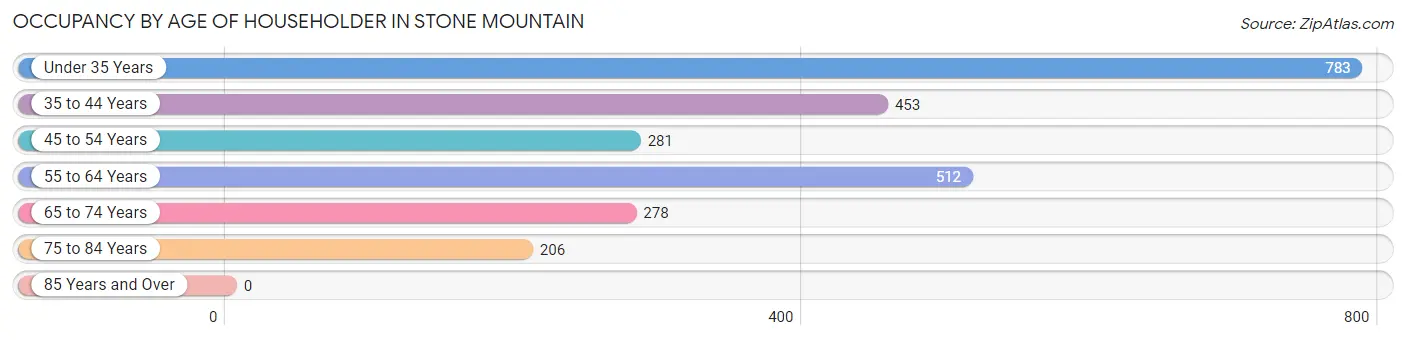
| Age Bracket | # Households | % Households |
| Under 35 Years | 783 | 31.2% |
| 35 to 44 Years | 453 | 18.0% |
| 45 to 54 Years | 281 | 11.2% |
| 55 to 64 Years | 512 | 20.4% |
| 65 to 74 Years | 278 | 11.1% |
| 75 to 84 Years | 206 | 8.2% |
| 85 Years and Over | 0 | 0.0% |
| Total | 2,513 | 100.0% |
Housing Finances in Stone Mountain
Median Income by Occupancy in Stone Mountain
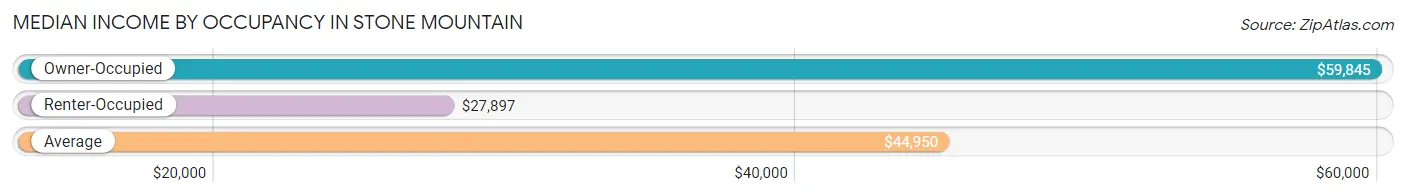
| Occupancy Type | # Households | Median Income |
| Owner-Occupied | 1,216 (48.4%) | $59,845 |
| Renter-Occupied | 1,297 (51.6%) | $27,897 |
| Average | 2,513 (100.0%) | $44,950 |
Occupancy by Householder Income Bracket in Stone Mountain
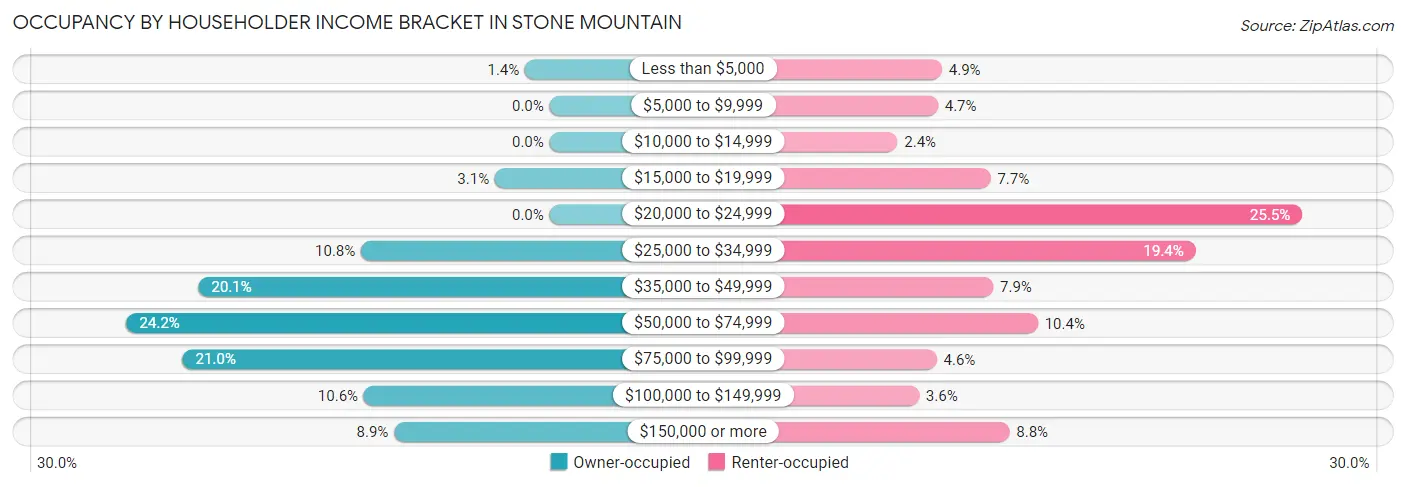
| Income Bracket | Owner-occupied | Renter-occupied |
| Less than $5,000 | 17 (1.4%) | 64 (4.9%) |
| $5,000 to $9,999 | 0 (0.0%) | 61 (4.7%) |
| $10,000 to $14,999 | 0 (0.0%) | 31 (2.4%) |
| $15,000 to $19,999 | 38 (3.1%) | 100 (7.7%) |
| $20,000 to $24,999 | 0 (0.0%) | 331 (25.5%) |
| $25,000 to $34,999 | 131 (10.8%) | 252 (19.4%) |
| $35,000 to $49,999 | 244 (20.1%) | 102 (7.9%) |
| $50,000 to $74,999 | 294 (24.2%) | 135 (10.4%) |
| $75,000 to $99,999 | 255 (21.0%) | 60 (4.6%) |
| $100,000 to $149,999 | 129 (10.6%) | 47 (3.6%) |
| $150,000 or more | 108 (8.9%) | 114 (8.8%) |
| Total | 1,216 (100.0%) | 1,297 (100.0%) |
Monthly Housing Cost Tiers in Stone Mountain
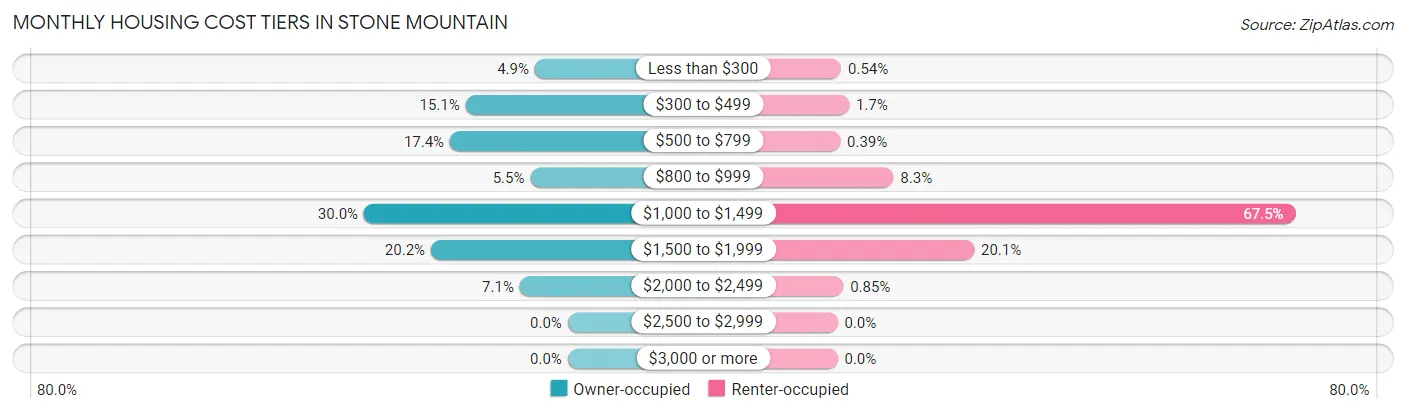
| Monthly Cost | Owner-occupied | Renter-occupied |
| Less than $300 | 59 (4.9%) | 7 (0.5%) |
| $300 to $499 | 183 (15.0%) | 22 (1.7%) |
| $500 to $799 | 211 (17.3%) | 5 (0.4%) |
| $800 to $999 | 67 (5.5%) | 107 (8.3%) |
| $1,000 to $1,499 | 365 (30.0%) | 875 (67.5%) |
| $1,500 to $1,999 | 245 (20.2%) | 261 (20.1%) |
| $2,000 to $2,499 | 86 (7.1%) | 11 (0.9%) |
| $2,500 to $2,999 | 0 (0.0%) | 0 (0.0%) |
| $3,000 or more | 0 (0.0%) | 0 (0.0%) |
| Total | 1,216 (100.0%) | 1,297 (100.0%) |
Physical Housing Characteristics in Stone Mountain
Housing Structures in Stone Mountain
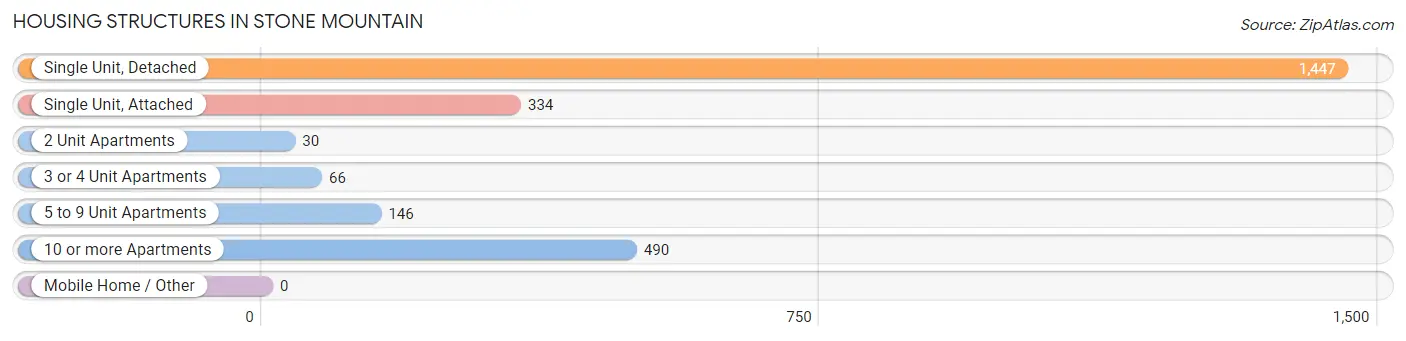
| Structure Type | # Housing Units | % Housing Units |
| Single Unit, Detached | 1,447 | 57.6% |
| Single Unit, Attached | 334 | 13.3% |
| 2 Unit Apartments | 30 | 1.2% |
| 3 or 4 Unit Apartments | 66 | 2.6% |
| 5 to 9 Unit Apartments | 146 | 5.8% |
| 10 or more Apartments | 490 | 19.5% |
| Mobile Home / Other | 0 | 0.0% |
| Total | 2,513 | 100.0% |
Housing Structures by Occupancy in Stone Mountain
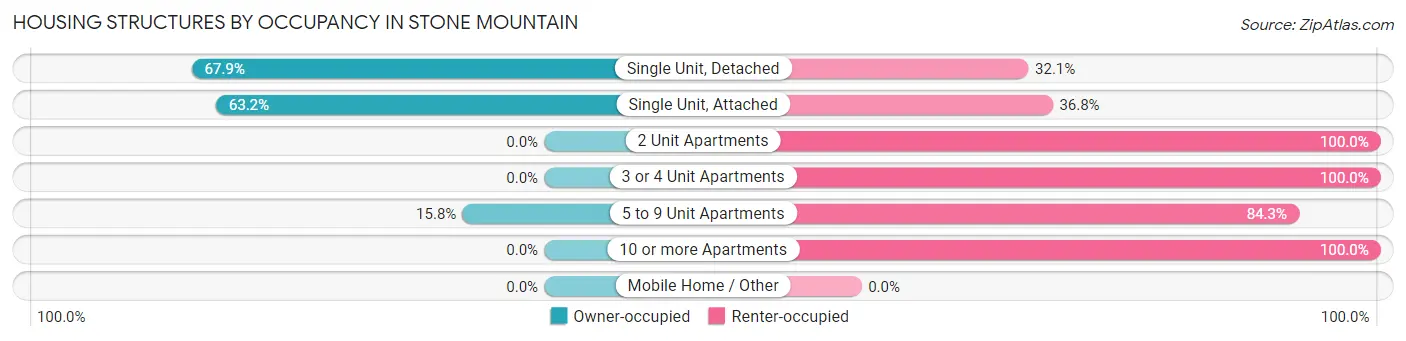
| Structure Type | Owner-occupied | Renter-occupied |
| Single Unit, Detached | 982 (67.9%) | 465 (32.1%) |
| Single Unit, Attached | 211 (63.2%) | 123 (36.8%) |
| 2 Unit Apartments | 0 (0.0%) | 30 (100.0%) |
| 3 or 4 Unit Apartments | 0 (0.0%) | 66 (100.0%) |
| 5 to 9 Unit Apartments | 23 (15.8%) | 123 (84.3%) |
| 10 or more Apartments | 0 (0.0%) | 490 (100.0%) |
| Mobile Home / Other | 0 (0.0%) | 0 (0.0%) |
| Total | 1,216 (48.4%) | 1,297 (51.6%) |
Housing Structures by Number of Rooms in Stone Mountain
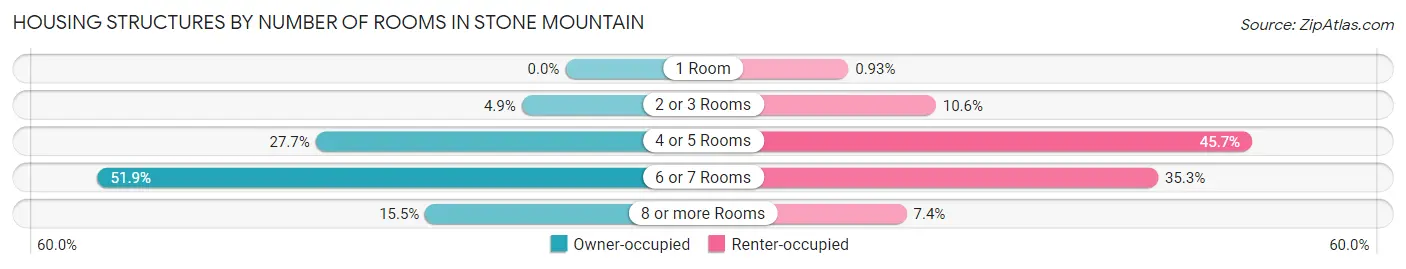
| Number of Rooms | Owner-occupied | Renter-occupied |
| 1 Room | 0 (0.0%) | 12 (0.9%) |
| 2 or 3 Rooms | 59 (4.9%) | 138 (10.6%) |
| 4 or 5 Rooms | 337 (27.7%) | 593 (45.7%) |
| 6 or 7 Rooms | 631 (51.9%) | 458 (35.3%) |
| 8 or more Rooms | 189 (15.5%) | 96 (7.4%) |
| Total | 1,216 (100.0%) | 1,297 (100.0%) |
Housing Structure by Heating Type in Stone Mountain
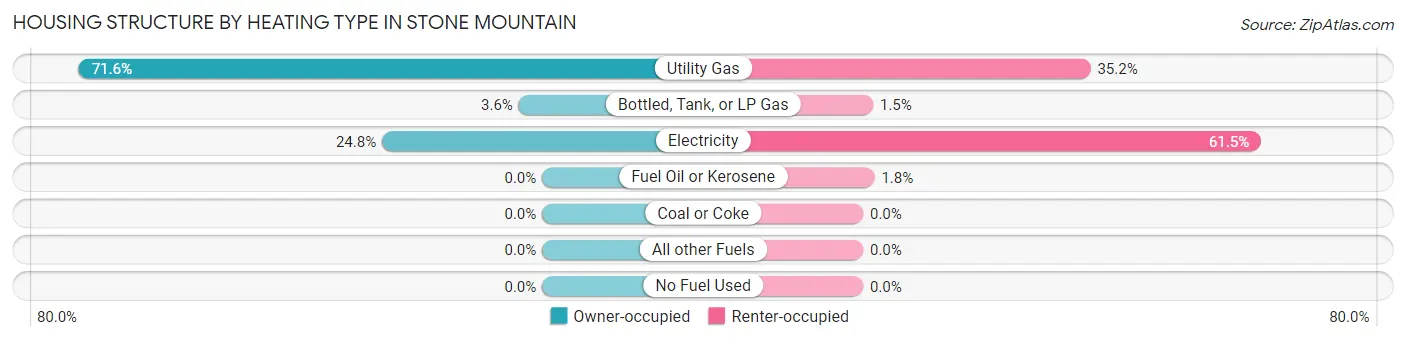
| Heating Type | Owner-occupied | Renter-occupied |
| Utility Gas | 871 (71.6%) | 456 (35.2%) |
| Bottled, Tank, or LP Gas | 44 (3.6%) | 20 (1.5%) |
| Electricity | 301 (24.7%) | 798 (61.5%) |
| Fuel Oil or Kerosene | 0 (0.0%) | 23 (1.8%) |
| Coal or Coke | 0 (0.0%) | 0 (0.0%) |
| All other Fuels | 0 (0.0%) | 0 (0.0%) |
| No Fuel Used | 0 (0.0%) | 0 (0.0%) |
| Total | 1,216 (100.0%) | 1,297 (100.0%) |
Household Vehicle Usage in Stone Mountain

| Vehicles per Household | Owner-occupied | Renter-occupied |
| No Vehicle | 53 (4.4%) | 262 (20.2%) |
| 1 Vehicle | 526 (43.3%) | 469 (36.2%) |
| 2 Vehicles | 361 (29.7%) | 308 (23.7%) |
| 3 or more Vehicles | 276 (22.7%) | 258 (19.9%) |
| Total | 1,216 (100.0%) | 1,297 (100.0%) |
Real Estate & Mortgages in Stone Mountain
Real Estate and Mortgage Overview in Stone Mountain
| Characteristic | Without Mortgage | With Mortgage |
| Housing Units | 452 | 764 |
| Median Property Value | $119,600 | $183,900 |
| Median Household Income | $59,457 | $67 |
| Monthly Housing Costs | $509 | $0 |
| Real Estate Taxes | $1,431 | $25 |
Property Value by Mortgage Status in Stone Mountain
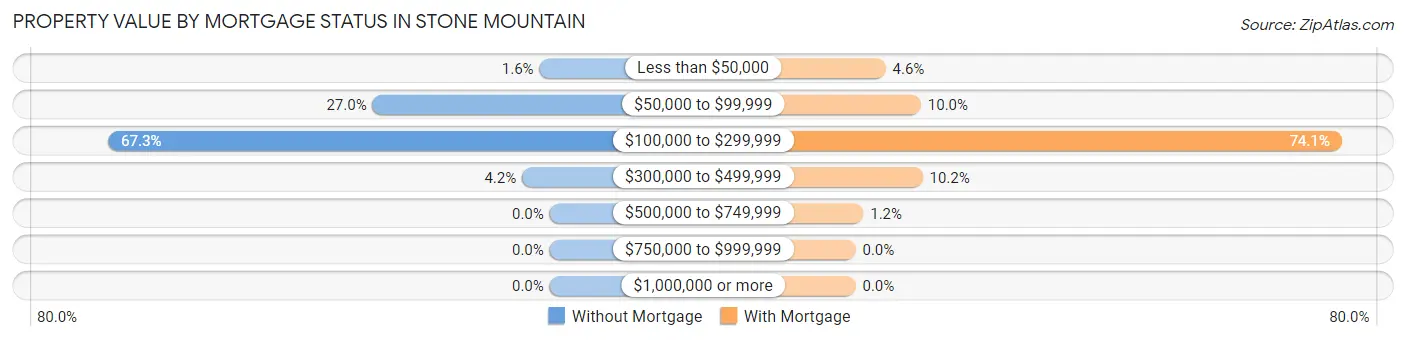
| Property Value | Without Mortgage | With Mortgage |
| Less than $50,000 | 7 (1.5%) | 35 (4.6%) |
| $50,000 to $99,999 | 122 (27.0%) | 76 (10.0%) |
| $100,000 to $299,999 | 304 (67.3%) | 566 (74.1%) |
| $300,000 to $499,999 | 19 (4.2%) | 78 (10.2%) |
| $500,000 to $749,999 | 0 (0.0%) | 9 (1.2%) |
| $750,000 to $999,999 | 0 (0.0%) | 0 (0.0%) |
| $1,000,000 or more | 0 (0.0%) | 0 (0.0%) |
| Total | 452 (100.0%) | 764 (100.0%) |
Household Income by Mortgage Status in Stone Mountain
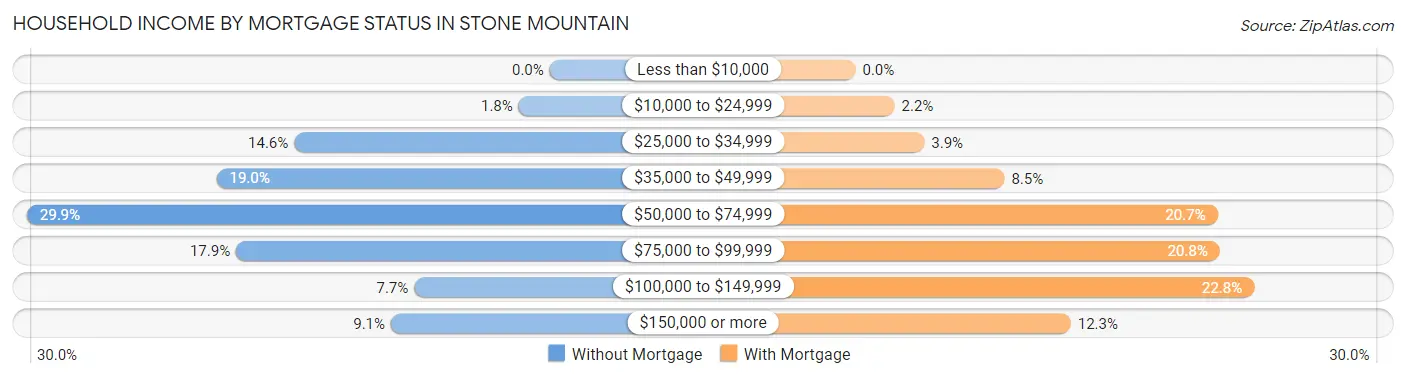
| Household Income | Without Mortgage | With Mortgage |
| Less than $10,000 | 0 (0.0%) | 0 (0.0%) |
| $10,000 to $24,999 | 8 (1.8%) | 17 (2.2%) |
| $25,000 to $34,999 | 66 (14.6%) | 30 (3.9%) |
| $35,000 to $49,999 | 86 (19.0%) | 65 (8.5%) |
| $50,000 to $74,999 | 135 (29.9%) | 158 (20.7%) |
| $75,000 to $99,999 | 81 (17.9%) | 159 (20.8%) |
| $100,000 to $149,999 | 35 (7.7%) | 174 (22.8%) |
| $150,000 or more | 41 (9.1%) | 94 (12.3%) |
| Total | 452 (100.0%) | 764 (100.0%) |
Property Value to Household Income Ratio in Stone Mountain
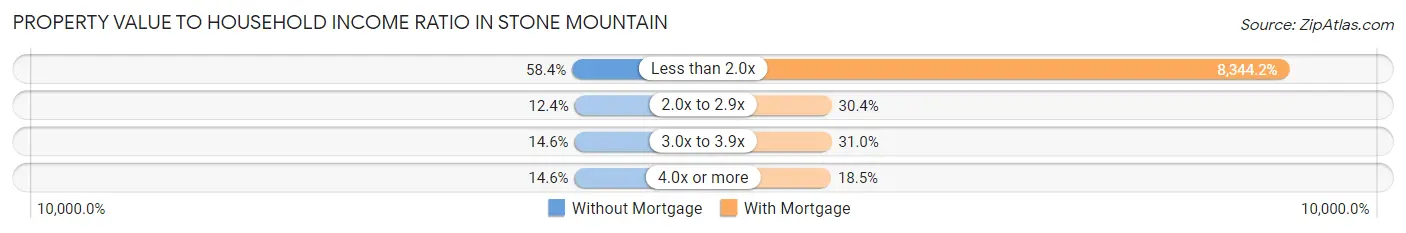
| Value-to-Income Ratio | Without Mortgage | With Mortgage |
| Less than 2.0x | 264 (58.4%) | 63,750 (8,344.2%) |
| 2.0x to 2.9x | 56 (12.4%) | 232 (30.4%) |
| 3.0x to 3.9x | 66 (14.6%) | 237 (31.0%) |
| 4.0x or more | 66 (14.6%) | 141 (18.5%) |
| Total | 452 (100.0%) | 764 (100.0%) |
Real Estate Taxes by Mortgage Status in Stone Mountain
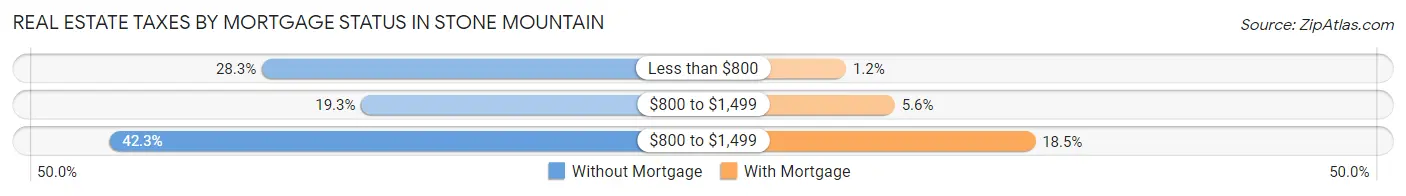
| Property Taxes | Without Mortgage | With Mortgage |
| Less than $800 | 128 (28.3%) | 9 (1.2%) |
| $800 to $1,499 | 87 (19.3%) | 43 (5.6%) |
| $800 to $1,499 | 191 (42.3%) | 141 (18.5%) |
| Total | 452 (100.0%) | 764 (100.0%) |
Health & Disability in Stone Mountain
Health Insurance Coverage by Age in Stone Mountain
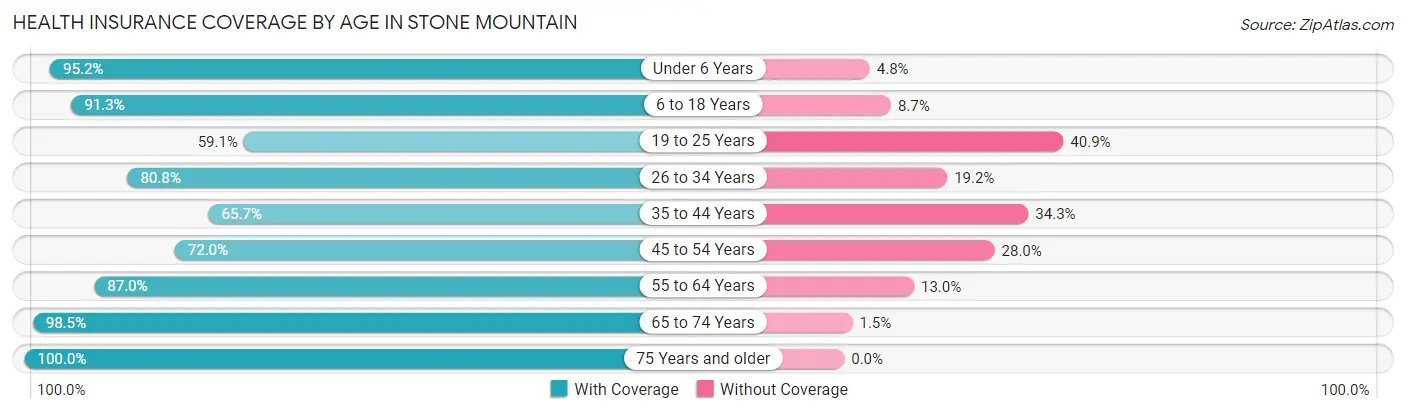
| Age Bracket | With Coverage | Without Coverage |
| Under 6 Years | 619 (95.2%) | 31 (4.8%) |
| 6 to 18 Years | 870 (91.3%) | 83 (8.7%) |
| 19 to 25 Years | 249 (59.1%) | 172 (40.9%) |
| 26 to 34 Years | 1,204 (80.8%) | 286 (19.2%) |
| 35 to 44 Years | 482 (65.7%) | 252 (34.3%) |
| 45 to 54 Years | 416 (72.0%) | 162 (28.0%) |
| 55 to 64 Years | 869 (87.0%) | 130 (13.0%) |
| 65 to 74 Years | 447 (98.5%) | 7 (1.5%) |
| 75 Years and older | 340 (100.0%) | 0 (0.0%) |
| Total | 5,496 (83.0%) | 1,123 (17.0%) |
Health Insurance Coverage by Citizenship Status in Stone Mountain
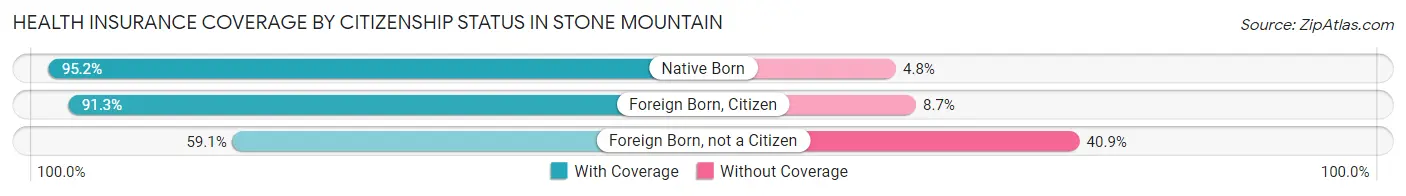
| Citizenship Status | With Coverage | Without Coverage |
| Native Born | 619 (95.2%) | 31 (4.8%) |
| Foreign Born, Citizen | 870 (91.3%) | 83 (8.7%) |
| Foreign Born, not a Citizen | 249 (59.1%) | 172 (40.9%) |
Health Insurance Coverage by Household Income in Stone Mountain
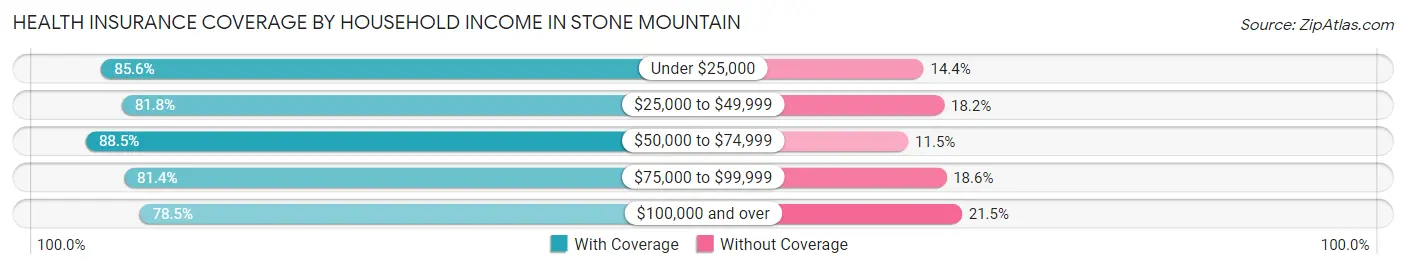
| Household Income | With Coverage | Without Coverage |
| Under $25,000 | 1,060 (85.6%) | 178 (14.4%) |
| $25,000 to $49,999 | 1,436 (81.8%) | 320 (18.2%) |
| $50,000 to $74,999 | 1,100 (88.5%) | 143 (11.5%) |
| $75,000 to $99,999 | 821 (81.4%) | 188 (18.6%) |
| $100,000 and over | 1,071 (78.5%) | 294 (21.5%) |
Public vs Private Health Insurance Coverage by Age in Stone Mountain
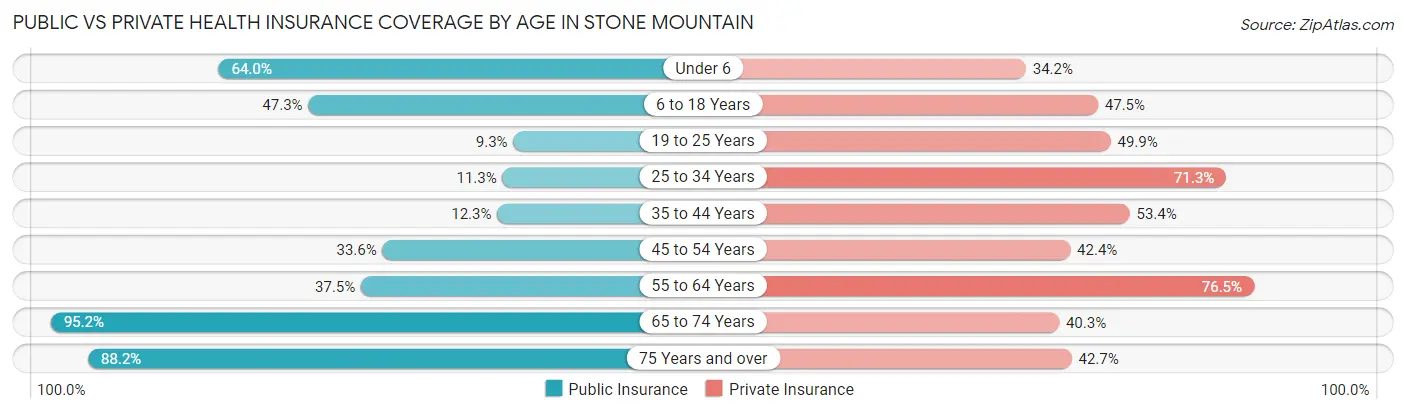
| Age Bracket | Public Insurance | Private Insurance |
| Under 6 | 416 (64.0%) | 222 (34.2%) |
| 6 to 18 Years | 451 (47.3%) | 453 (47.5%) |
| 19 to 25 Years | 39 (9.3%) | 210 (49.9%) |
| 25 to 34 Years | 168 (11.3%) | 1,063 (71.3%) |
| 35 to 44 Years | 90 (12.3%) | 392 (53.4%) |
| 45 to 54 Years | 194 (33.6%) | 245 (42.4%) |
| 55 to 64 Years | 375 (37.5%) | 764 (76.5%) |
| 65 to 74 Years | 432 (95.2%) | 183 (40.3%) |
| 75 Years and over | 300 (88.2%) | 145 (42.6%) |
| Total | 2,465 (37.2%) | 3,677 (55.5%) |
Disability Status by Sex by Age in Stone Mountain
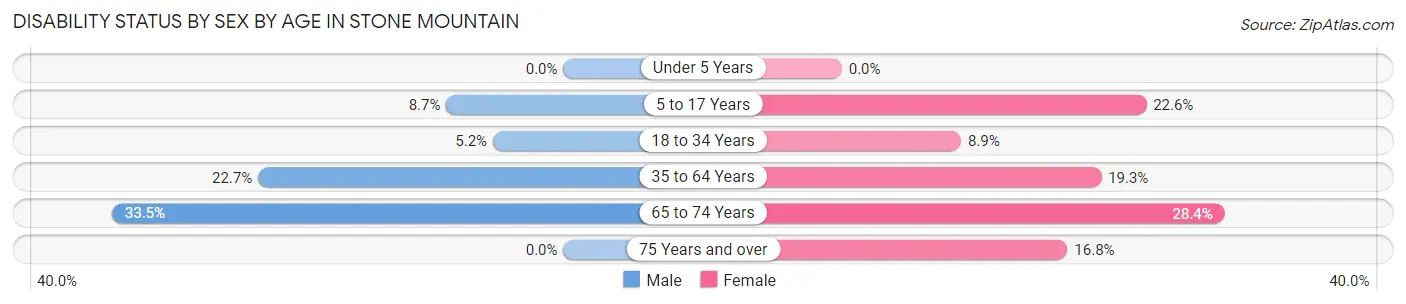
| Age Bracket | Male | Female |
| Under 5 Years | 0 (0.0%) | 0 (0.0%) |
| 5 to 17 Years | 47 (8.7%) | 80 (22.6%) |
| 18 to 34 Years | 48 (5.2%) | 93 (8.8%) |
| 35 to 64 Years | 273 (22.7%) | 213 (19.3%) |
| 65 to 74 Years | 59 (33.5%) | 79 (28.4%) |
| 75 Years and over | 0 (0.0%) | 35 (16.8%) |
Disability Class by Sex by Age in Stone Mountain
Disability Class: Hearing Difficulty
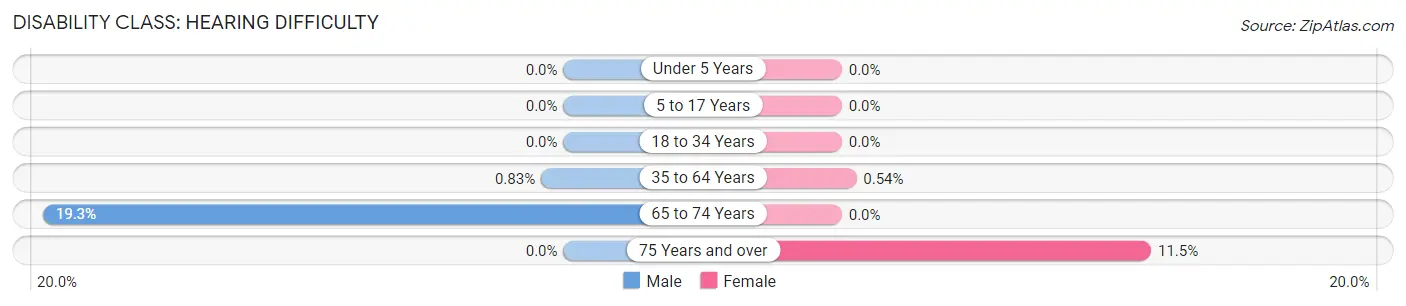
| Age Bracket | Male | Female |
| Under 5 Years | 0 (0.0%) | 0 (0.0%) |
| 5 to 17 Years | 0 (0.0%) | 0 (0.0%) |
| 18 to 34 Years | 0 (0.0%) | 0 (0.0%) |
| 35 to 64 Years | 10 (0.8%) | 6 (0.5%) |
| 65 to 74 Years | 34 (19.3%) | 0 (0.0%) |
| 75 Years and over | 0 (0.0%) | 24 (11.5%) |
Disability Class: Vision Difficulty
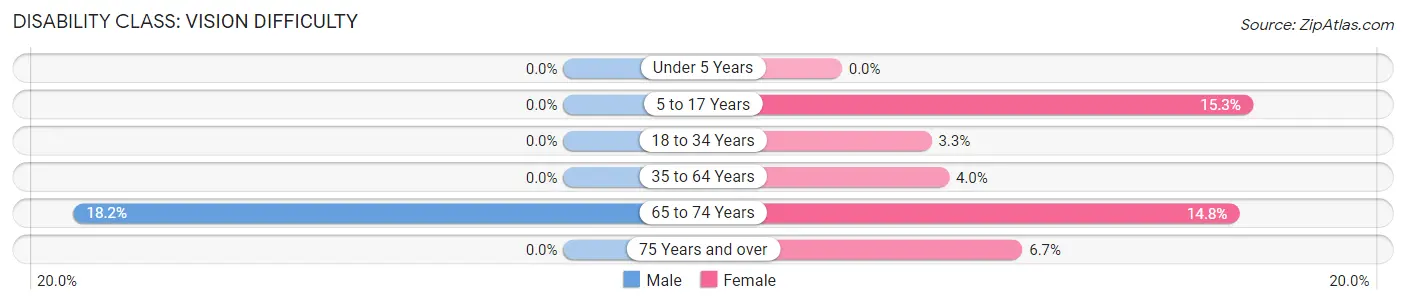
| Age Bracket | Male | Female |
| Under 5 Years | 0 (0.0%) | 0 (0.0%) |
| 5 to 17 Years | 0 (0.0%) | 54 (15.2%) |
| 18 to 34 Years | 0 (0.0%) | 35 (3.3%) |
| 35 to 64 Years | 0 (0.0%) | 44 (4.0%) |
| 65 to 74 Years | 32 (18.2%) | 41 (14.7%) |
| 75 Years and over | 0 (0.0%) | 14 (6.7%) |
Disability Class: Cognitive Difficulty
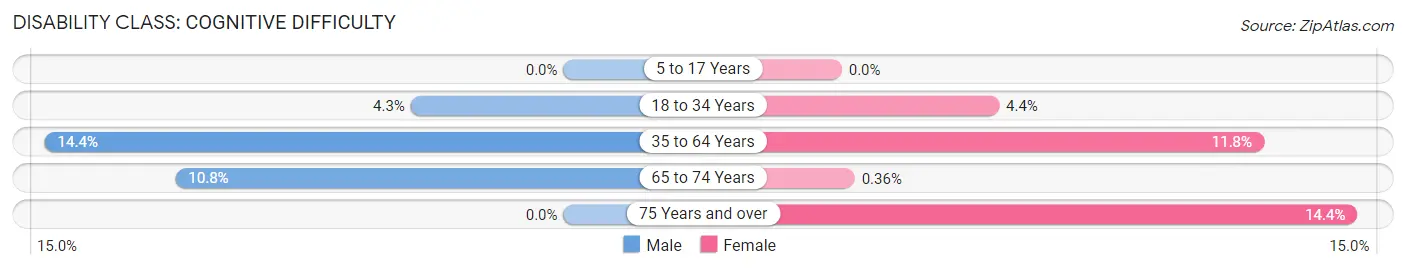
| Age Bracket | Male | Female |
| 5 to 17 Years | 0 (0.0%) | 0 (0.0%) |
| 18 to 34 Years | 39 (4.3%) | 46 (4.4%) |
| 35 to 64 Years | 174 (14.4%) | 130 (11.7%) |
| 65 to 74 Years | 19 (10.8%) | 1 (0.4%) |
| 75 Years and over | 0 (0.0%) | 30 (14.3%) |
Disability Class: Ambulatory Difficulty
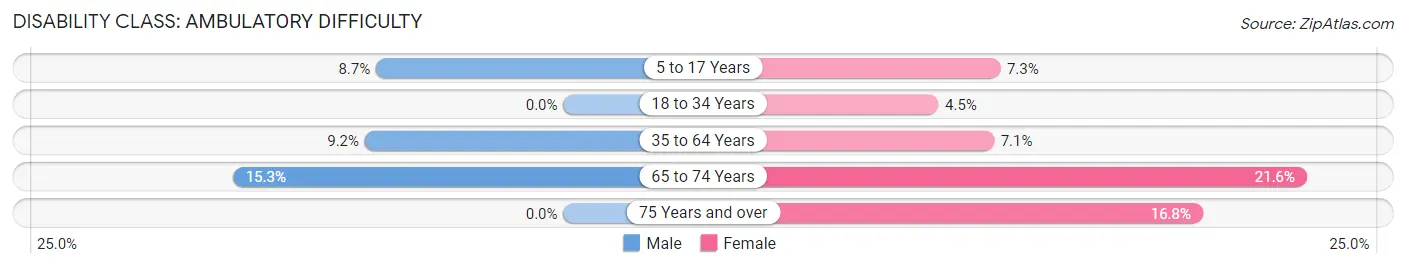
| Age Bracket | Male | Female |
| 5 to 17 Years | 47 (8.7%) | 26 (7.3%) |
| 18 to 34 Years | 0 (0.0%) | 47 (4.5%) |
| 35 to 64 Years | 111 (9.2%) | 78 (7.0%) |
| 65 to 74 Years | 27 (15.3%) | 60 (21.6%) |
| 75 Years and over | 0 (0.0%) | 35 (16.8%) |
Disability Class: Self-Care Difficulty
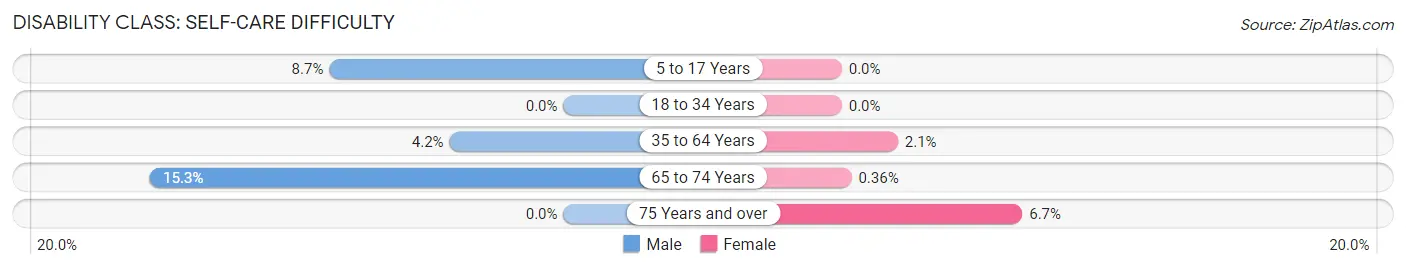
| Age Bracket | Male | Female |
| 5 to 17 Years | 47 (8.7%) | 0 (0.0%) |
| 18 to 34 Years | 0 (0.0%) | 0 (0.0%) |
| 35 to 64 Years | 51 (4.2%) | 23 (2.1%) |
| 65 to 74 Years | 27 (15.3%) | 1 (0.4%) |
| 75 Years and over | 0 (0.0%) | 14 (6.7%) |
Technology Access in Stone Mountain
Computing Device Access in Stone Mountain
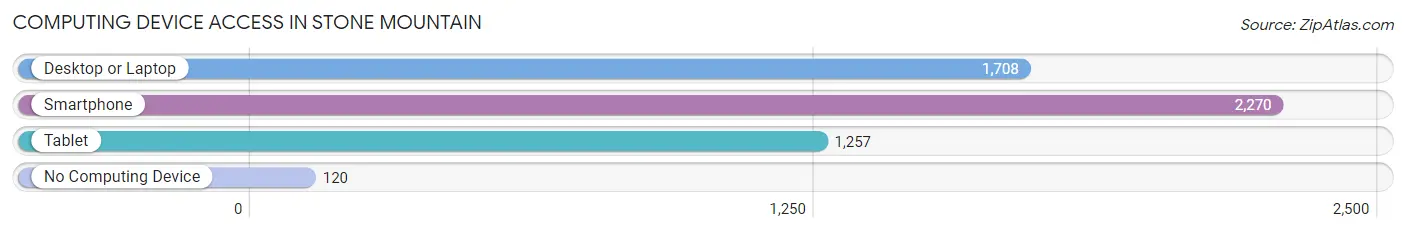
| Device Type | # Households | % Households |
| Desktop or Laptop | 1,708 | 68.0% |
| Smartphone | 2,270 | 90.3% |
| Tablet | 1,257 | 50.0% |
| No Computing Device | 120 | 4.8% |
| Total | 2,513 | 100.0% |
Internet Access in Stone Mountain
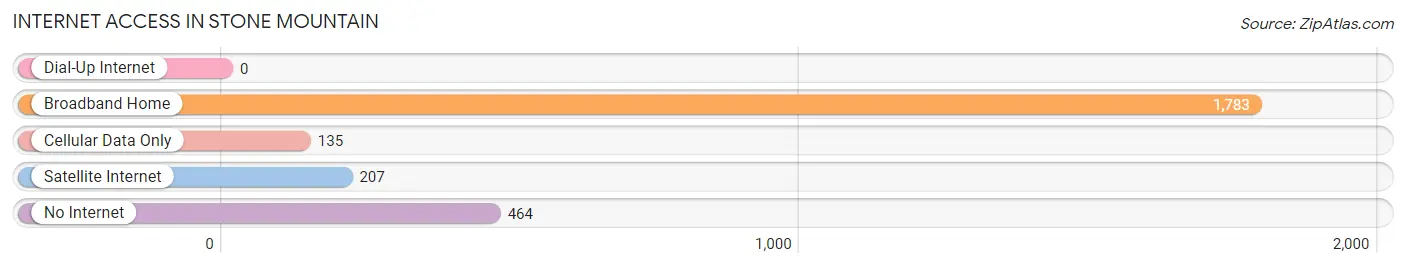
| Internet Type | # Households | % Households |
| Dial-Up Internet | 0 | 0.0% |
| Broadband Home | 1,783 | 71.0% |
| Cellular Data Only | 135 | 5.4% |
| Satellite Internet | 207 | 8.2% |
| No Internet | 464 | 18.5% |
| Total | 2,513 | 100.0% |
Stone Mountain Summary
History
Stone Mountain is a small city located in the state of Georgia, United States. It is located in the eastern part of the state, about 20 miles east of Atlanta. The city is named after the nearby Stone Mountain, a large granite dome that rises 825 feet above the surrounding area. The city was founded in 1839 and incorporated in 1887.
The area around Stone Mountain has a long and varied history. The area was originally inhabited by the Creek and Cherokee Native American tribes. The Creek were the first to settle in the area, and the Cherokee followed shortly after. The area was part of the Cherokee Nation until the Indian Removal Act of 1830, which forced the Native Americans to relocate to Oklahoma.
The area was then settled by European-American settlers, who established farms and plantations in the area. The city of Stone Mountain was founded in 1839 and was named after the nearby Stone Mountain. The city was incorporated in 1887 and quickly grew in population.
Geography
Stone Mountain is located in the eastern part of the state of Georgia, about 20 miles east of Atlanta. The city is situated on the eastern edge of the Atlanta metropolitan area. The city is located in DeKalb County and is bordered by the cities of Tucker, Lilburn, and Snellville.
The city of Stone Mountain covers an area of 8.3 square miles and has an elevation of 1,067 feet. The city is located in the Piedmont region of Georgia and is surrounded by rolling hills and forests. The city is located near the Stone Mountain Park, which is a 3,200-acre park that features a variety of outdoor activities, including hiking, camping, and golf.
Economy
The economy of Stone Mountain is largely based on tourism and retail. The city is home to the Stone Mountain Park, which is a popular tourist destination. The park attracts over 4 million visitors each year and is the most visited attraction in the state of Georgia. The park features a variety of outdoor activities, including hiking, camping, and golf.
The city is also home to a variety of retail stores, restaurants, and other businesses. The city is home to the Stone Mountain Mall, which is a large shopping center that features a variety of stores and restaurants. The city is also home to a variety of other businesses, including manufacturing, healthcare, and education.
Demographics
As of the 2010 census, the population of Stone Mountain was 5,802. The city has a population density of 699 people per square mile. The racial makeup of the city is 63.3% White, 28.2% African American, 0.3% Native American, 2.2% Asian, and 5.9% from other races.
The median household income in Stone Mountain is $50,945 and the median family income is $60,945. The per capita income in the city is $25,945. The city has a poverty rate of 15.3%.
Conclusion
Stone Mountain is a small city located in the state of Georgia, United States. It is located in the eastern part of the state, about 20 miles east of Atlanta. The city is named after the nearby Stone Mountain, a large granite dome that rises 825 feet above the surrounding area. The city was founded in 1839 and incorporated in 1887. The economy of Stone Mountain is largely based on tourism and retail. The city is home to the Stone Mountain Park, which is a popular tourist destination. The city is also home to a variety of retail stores, restaurants, and other businesses. As of the 2010 census, the population of Stone Mountain was 5,802. The racial makeup of the city is 63.3% White, 28.2% African American, 0.3% Native American, 2.2% Asian, and 5.9% from other races. The median household income in Stone Mountain is $50,945 and the median family income is $60,945. The per capita income in the city is $25,945. The city has a poverty rate of 15.3%.
Common Questions
What is Per Capita Income in Stone Mountain?
Per Capita income in Stone Mountain is $25,142.
What is the Median Family Income in Stone Mountain?
Median Family Income in Stone Mountain is $54,886.
What is the Median Household income in Stone Mountain?
Median Household Income in Stone Mountain is $44,950.
What is Income or Wage Gap in Stone Mountain?
Income or Wage Gap in Stone Mountain is 10.2%.
Women in Stone Mountain earn 89.8 cents for every dollar earned by a man.
What is Inequality or Gini Index in Stone Mountain?
Inequality or Gini Index in Stone Mountain is 0.43.
What is the Total Population of Stone Mountain?
Total Population of Stone Mountain is 6,638.
What is the Total Male Population of Stone Mountain?
Total Male Population of Stone Mountain is 3,271.
What is the Total Female Population of Stone Mountain?
Total Female Population of Stone Mountain is 3,367.
What is the Ratio of Males per 100 Females in Stone Mountain?
There are 97.15 Males per 100 Females in Stone Mountain.
What is the Ratio of Females per 100 Males in Stone Mountain?
There are 102.93 Females per 100 Males in Stone Mountain.
What is the Median Population Age in Stone Mountain?
Median Population Age in Stone Mountain is 34.4 Years.
What is the Average Family Size in Stone Mountain
Average Family Size in Stone Mountain is 3.6 People.
What is the Average Household Size in Stone Mountain
Average Household Size in Stone Mountain is 2.6 People.
How Large is the Labor Force in Stone Mountain?
There are 3,460 People in the Labor Forcein in Stone Mountain.
What is the Percentage of People in the Labor Force in Stone Mountain?
66.5% of People are in the Labor Force in Stone Mountain.
What is the Unemployment Rate in Stone Mountain?
Unemployment Rate in Stone Mountain is 5.6%.