Clinton, MO Map & Demographics
Clinton Map
Clinton Overview
$27,433
PER CAPITA INCOME
$59,711
AVG FAMILY INCOME
$48,116
AVG HOUSEHOLD INCOME
18.5%
WAGE / INCOME GAP [ % ]
81.5¢/ $1
WAGE / INCOME GAP [ $ ]
0.44
INEQUALITY / GINI INDEX
8,908
TOTAL POPULATION
4,085
MALE POPULATION
4,823
FEMALE POPULATION
84.70
MALES / 100 FEMALES
118.07
FEMALES / 100 MALES
42.5
MEDIAN AGE
2.8
AVG FAMILY SIZE
2.2
AVG HOUSEHOLD SIZE
4,182
LABOR FORCE [ PEOPLE ]
57.4%
PERCENT IN LABOR FORCE
9.9%
UNEMPLOYMENT RATE
Clinton Zip Codes
Clinton Area Codes
Income in Clinton
Income Overview in Clinton
Per Capita Income in Clinton is $27,433, while median incomes of families and households are $59,711 and $48,116 respectively.
| Characteristic | Number | Measure |
| Per Capita Income | 8,908 | $27,433 |
| Median Family Income | 2,207 | $59,711 |
| Mean Family Income | 2,207 | $73,912 |
| Median Household Income | 3,910 | $48,116 |
| Mean Household Income | 3,910 | $61,356 |
| Income Deficit | 2,207 | $0 |
| Wage / Income Gap (%) | 8,908 | 18.49% |
| Wage / Income Gap ($) | 8,908 | 81.51¢ per $1 |
| Gini / Inequality Index | 8,908 | 0.44 |
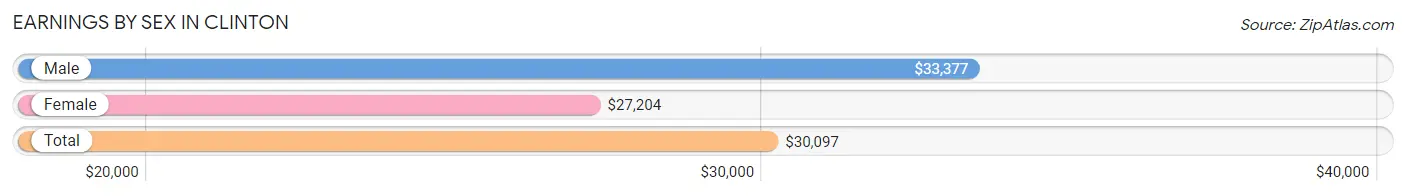
Earnings by Sex in Clinton
Average Earnings in Clinton are $30,097, $33,377 for men and $27,204 for women, a difference of 18.5%.
| Sex | Number | Average Earnings |
| Male | 2,208 (51.6%) | $33,377 |
| Female | 2,074 (48.4%) | $27,204 |
| Total | 4,282 (100.0%) | $30,097 |
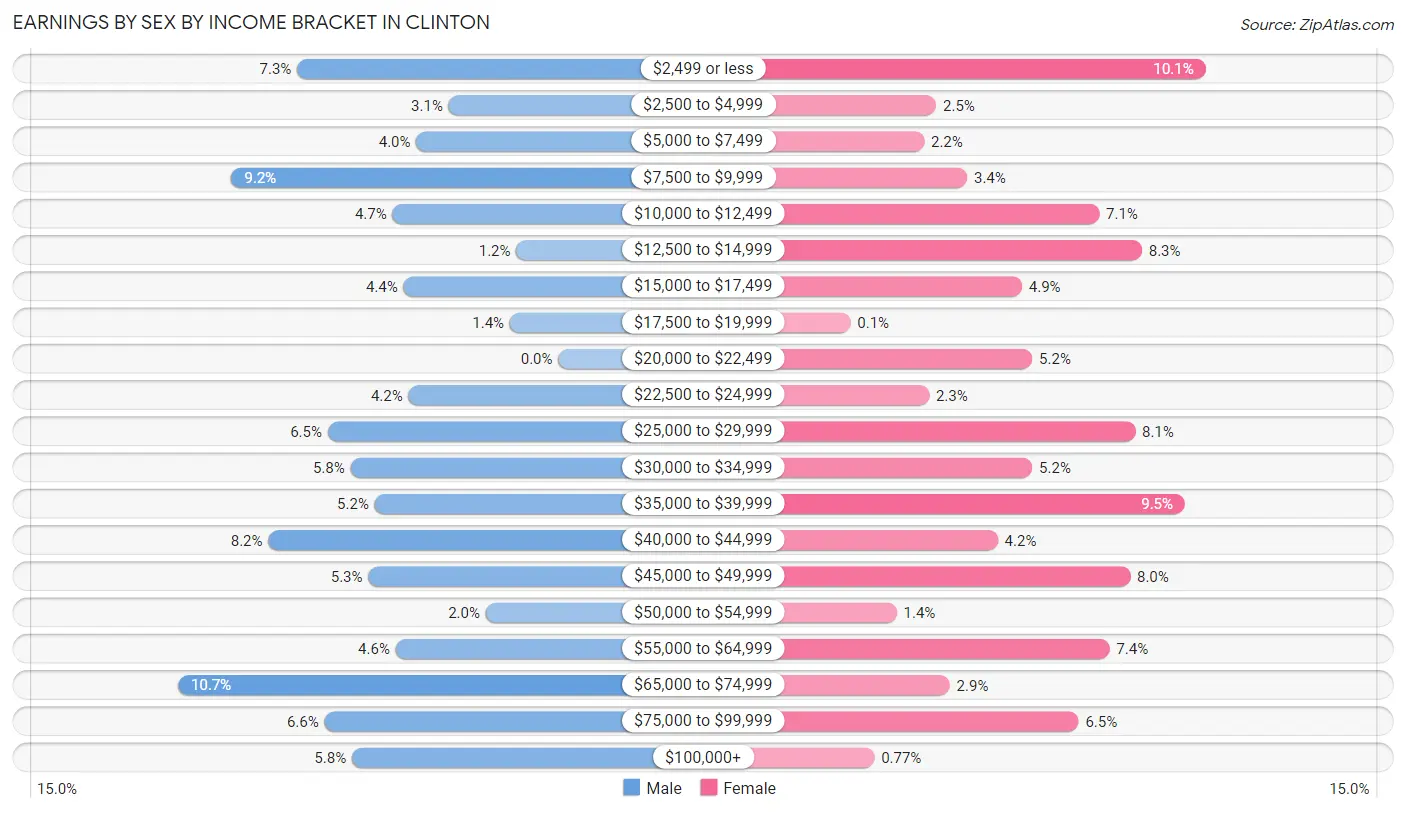
Earnings by Sex by Income Bracket in Clinton
The most common earnings brackets in Clinton are $65,000 to $74,999 for men (236 | 10.7%) and $2,499 or less for women (209 | 10.1%).
| Income | Male | Female |
| $2,499 or less | 162 (7.3%) | 209 (10.1%) |
| $2,500 to $4,999 | 68 (3.1%) | 52 (2.5%) |
| $5,000 to $7,499 | 88 (4.0%) | 45 (2.2%) |
| $7,500 to $9,999 | 203 (9.2%) | 70 (3.4%) |
| $10,000 to $12,499 | 103 (4.7%) | 147 (7.1%) |
| $12,500 to $14,999 | 26 (1.2%) | 172 (8.3%) |
| $15,000 to $17,499 | 96 (4.3%) | 102 (4.9%) |
| $17,500 to $19,999 | 30 (1.4%) | 2 (0.1%) |
| $20,000 to $22,499 | 0 (0.0%) | 108 (5.2%) |
| $22,500 to $24,999 | 93 (4.2%) | 48 (2.3%) |
| $25,000 to $29,999 | 143 (6.5%) | 168 (8.1%) |
| $30,000 to $34,999 | 129 (5.8%) | 108 (5.2%) |
| $35,000 to $39,999 | 114 (5.2%) | 197 (9.5%) |
| $40,000 to $44,999 | 180 (8.2%) | 88 (4.2%) |
| $45,000 to $49,999 | 118 (5.3%) | 165 (8.0%) |
| $50,000 to $54,999 | 45 (2.0%) | 29 (1.4%) |
| $55,000 to $64,999 | 101 (4.6%) | 153 (7.4%) |
| $65,000 to $74,999 | 236 (10.7%) | 60 (2.9%) |
| $75,000 to $99,999 | 145 (6.6%) | 135 (6.5%) |
| $100,000+ | 128 (5.8%) | 16 (0.8%) |
| Total | 2,208 (100.0%) | 2,074 (100.0%) |
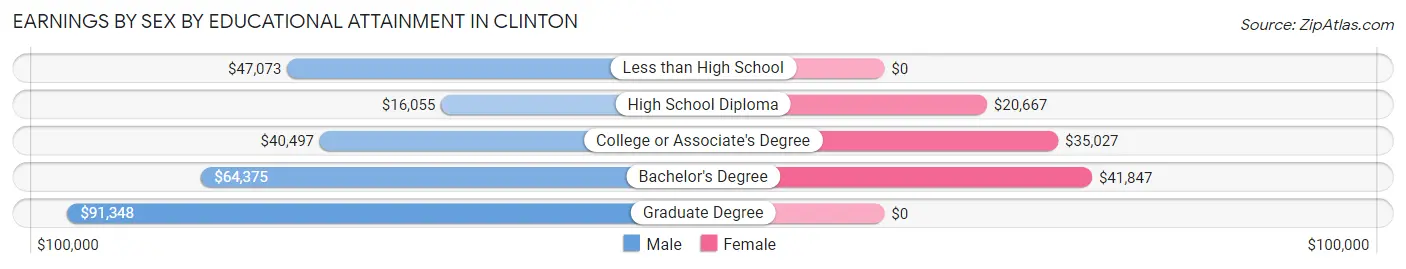
Earnings by Sex by Educational Attainment in Clinton
Average earnings in Clinton are $40,201 for men and $29,745 for women, a difference of 26.0%. Men with an educational attainment of graduate degree enjoy the highest average annual earnings of $91,348, while those with high school diploma education earn the least with $16,055. Women with an educational attainment of bachelor's degree earn the most with the average annual earnings of $41,847, while those with high school diploma education have the smallest earnings of $20,667.
| Educational Attainment | Male Income | Female Income |
| Less than High School | $47,073 | $0 |
| High School Diploma | $16,055 | $20,667 |
| College or Associate's Degree | $40,497 | $35,027 |
| Bachelor's Degree | $64,375 | $41,847 |
| Graduate Degree | $91,348 | $0 |
| Total | $40,201 | $29,745 |
Family Income in Clinton
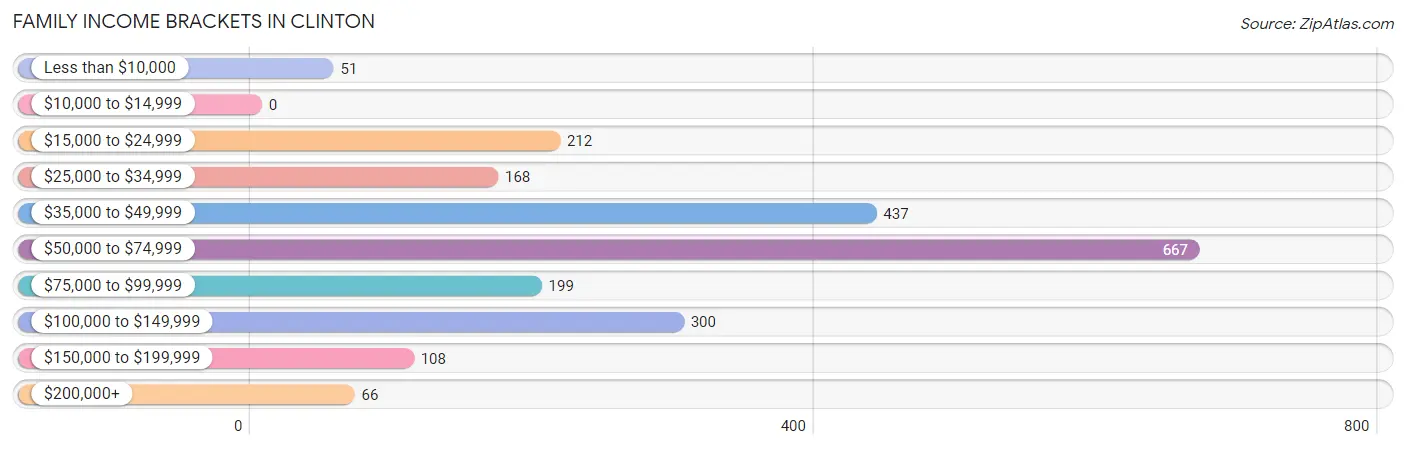
Family Income Brackets in Clinton
According to the Clinton family income data, there are 667 families falling into the $50,000 to $74,999 income range, which is the most common income bracket and makes up 30.2% of all families.
| Income Bracket | # Families | % Families |
| Less than $10,000 | 51 | 2.3% |
| $10,000 to $14,999 | 0 | 0.0% |
| $15,000 to $24,999 | 212 | 9.6% |
| $25,000 to $34,999 | 168 | 7.6% |
| $35,000 to $49,999 | 437 | 19.8% |
| $50,000 to $74,999 | 667 | 30.2% |
| $75,000 to $99,999 | 199 | 9.0% |
| $100,000 to $149,999 | 300 | 13.6% |
| $150,000 to $199,999 | 108 | 4.9% |
| $200,000+ | 66 | 3.0% |
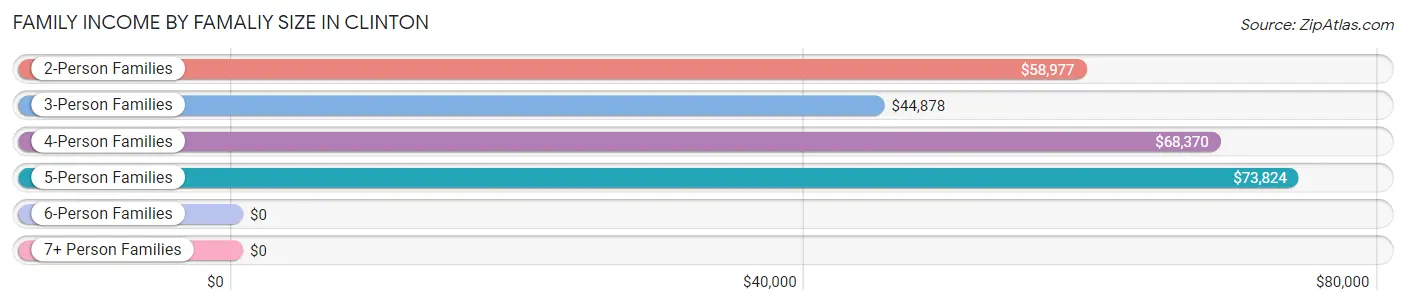
Family Income by Famaliy Size in Clinton
5-person families (118 | 5.3%) account for the highest median family income in Clinton with $73,824 per family, while 2-person families (1,127 | 51.1%) have the highest median income of $29,488 per family member.
| Income Bracket | # Families | Median Income |
| 2-Person Families | 1,127 (51.1%) | $58,977 |
| 3-Person Families | 606 (27.5%) | $44,878 |
| 4-Person Families | 278 (12.6%) | $68,370 |
| 5-Person Families | 118 (5.3%) | $73,824 |
| 6-Person Families | 28 (1.3%) | $0 |
| 7+ Person Families | 50 (2.3%) | $0 |
| Total | 2,207 (100.0%) | $59,711 |
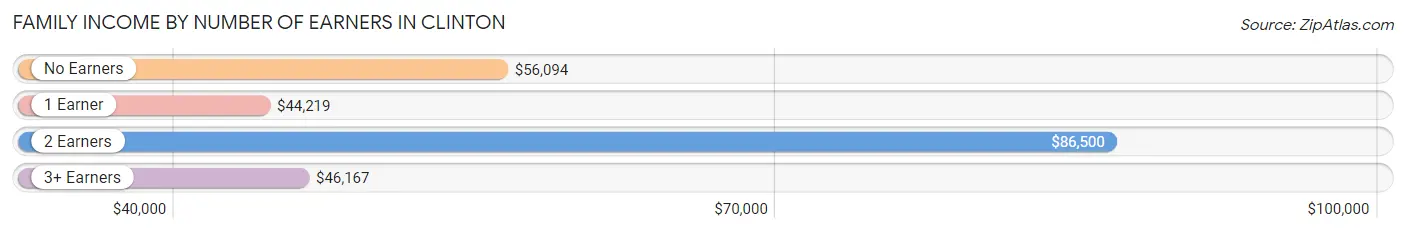
Family Income by Number of Earners in Clinton
The median family income in Clinton is $59,711, with families comprising 2 earners (800) having the highest median family income of $86,500, while families with 1 earner (813) have the lowest median family income of $44,219, accounting for 36.2% and 36.8% of families, respectively.
| Number of Earners | # Families | Median Income |
| No Earners | 360 (16.3%) | $56,094 |
| 1 Earner | 813 (36.8%) | $44,219 |
| 2 Earners | 800 (36.2%) | $86,500 |
| 3+ Earners | 234 (10.6%) | $46,167 |
| Total | 2,207 (100.0%) | $59,711 |
Household Income in Clinton
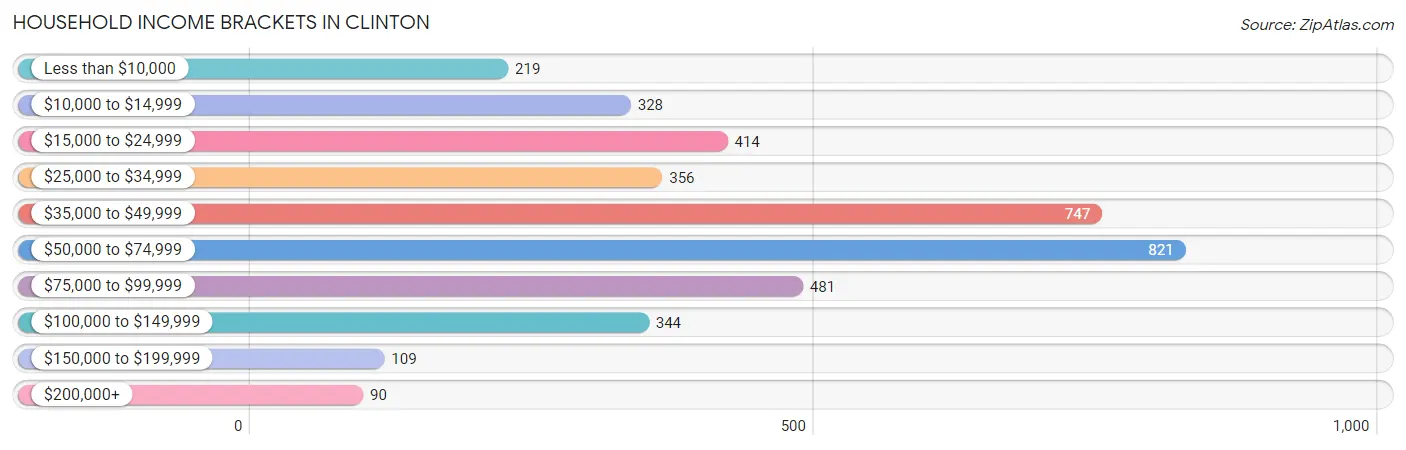
Household Income Brackets in Clinton
With 821 households falling in the category, the $50,000 to $74,999 income range is the most frequent in Clinton, accounting for 21.0% of all households. In contrast, only 90 households (2.3%) fall into the $200,000+ income bracket, making it the least populous group.
| Income Bracket | # Households | % Households |
| Less than $10,000 | 219 | 5.6% |
| $10,000 to $14,999 | 328 | 8.4% |
| $15,000 to $24,999 | 414 | 10.6% |
| $25,000 to $34,999 | 356 | 9.1% |
| $35,000 to $49,999 | 747 | 19.1% |
| $50,000 to $74,999 | 821 | 21.0% |
| $75,000 to $99,999 | 481 | 12.3% |
| $100,000 to $149,999 | 344 | 8.8% |
| $150,000 to $199,999 | 109 | 2.8% |
| $200,000+ | 90 | 2.3% |
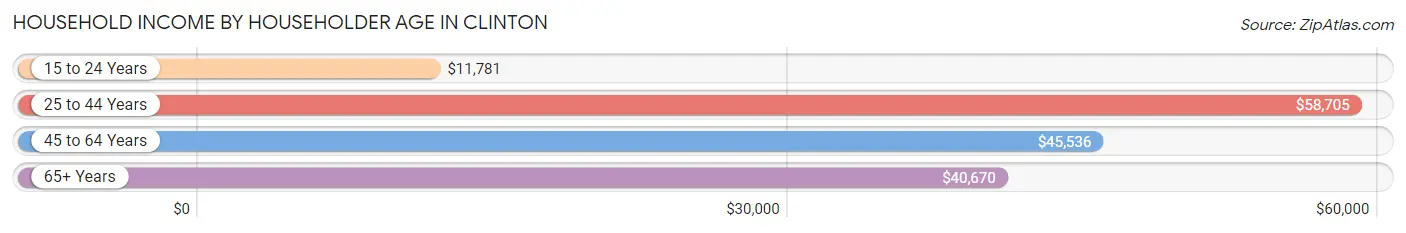
Household Income by Householder Age in Clinton
The median household income in Clinton is $48,116, with the highest median household income of $58,705 found in the 25 to 44 years age bracket for the primary householder. A total of 1,276 households (32.6%) fall into this category. Meanwhile, the 15 to 24 years age bracket for the primary householder has the lowest median household income of $11,781, with 93 households (2.4%) in this group.
| Income Bracket | # Households | Median Income |
| 15 to 24 Years | 93 (2.4%) | $11,781 |
| 25 to 44 Years | 1,276 (32.6%) | $58,705 |
| 45 to 64 Years | 1,240 (31.7%) | $45,536 |
| 65+ Years | 1,301 (33.3%) | $40,670 |
| Total | 3,910 (100.0%) | $48,116 |
Poverty in Clinton
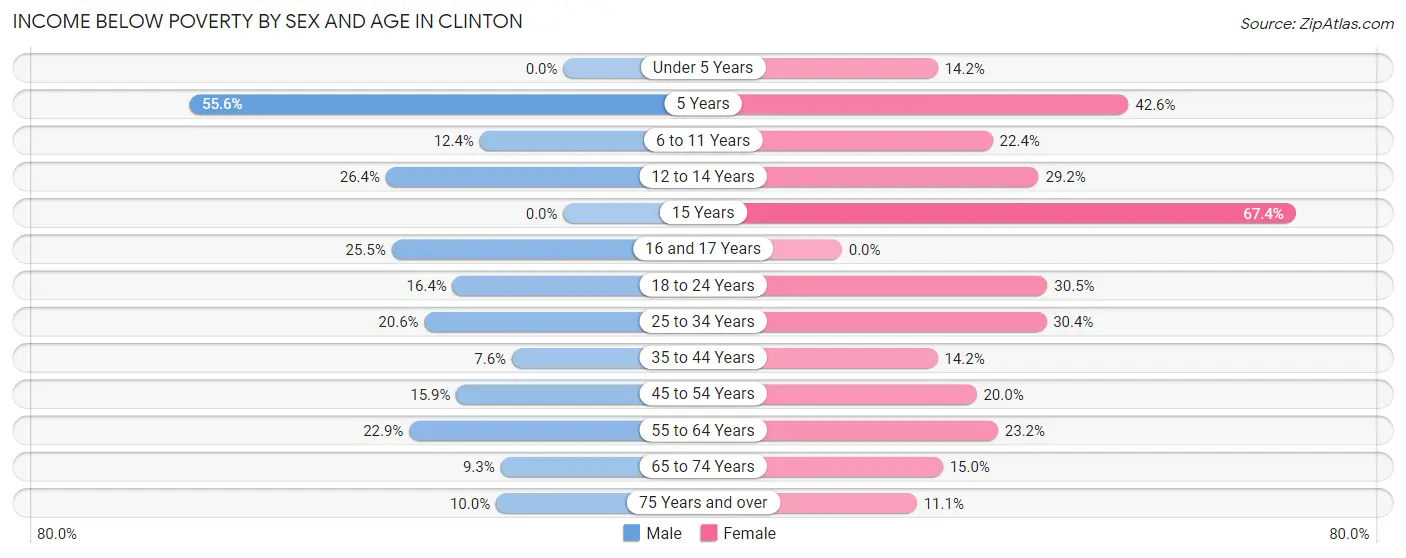
Income Below Poverty by Sex and Age in Clinton
With 14.6% poverty level for males and 20.8% for females among the residents of Clinton, 5 year old males and 15 year old females are the most vulnerable to poverty, with 15 males (55.6%) and 31 females (67.4%) in their respective age groups living below the poverty level.
| Age Bracket | Male | Female |
| Under 5 Years | 0 (0.0%) | 43 (14.2%) |
| 5 Years | 15 (55.6%) | 40 (42.5%) |
| 6 to 11 Years | 19 (12.4%) | 69 (22.4%) |
| 12 to 14 Years | 24 (26.4%) | 45 (29.2%) |
| 15 Years | 0 (0.0%) | 31 (67.4%) |
| 16 and 17 Years | 51 (25.5%) | 0 (0.0%) |
| 18 to 24 Years | 48 (16.4%) | 109 (30.5%) |
| 25 to 34 Years | 117 (20.6%) | 163 (30.3%) |
| 35 to 44 Years | 42 (7.6%) | 85 (14.2%) |
| 45 to 54 Years | 79 (15.9%) | 72 (20.0%) |
| 55 to 64 Years | 111 (22.9%) | 171 (23.2%) |
| 65 to 74 Years | 49 (9.3%) | 99 (15.0%) |
| 75 Years and over | 22 (10.0%) | 52 (11.1%) |
| Total | 577 (14.6%) | 979 (20.8%) |
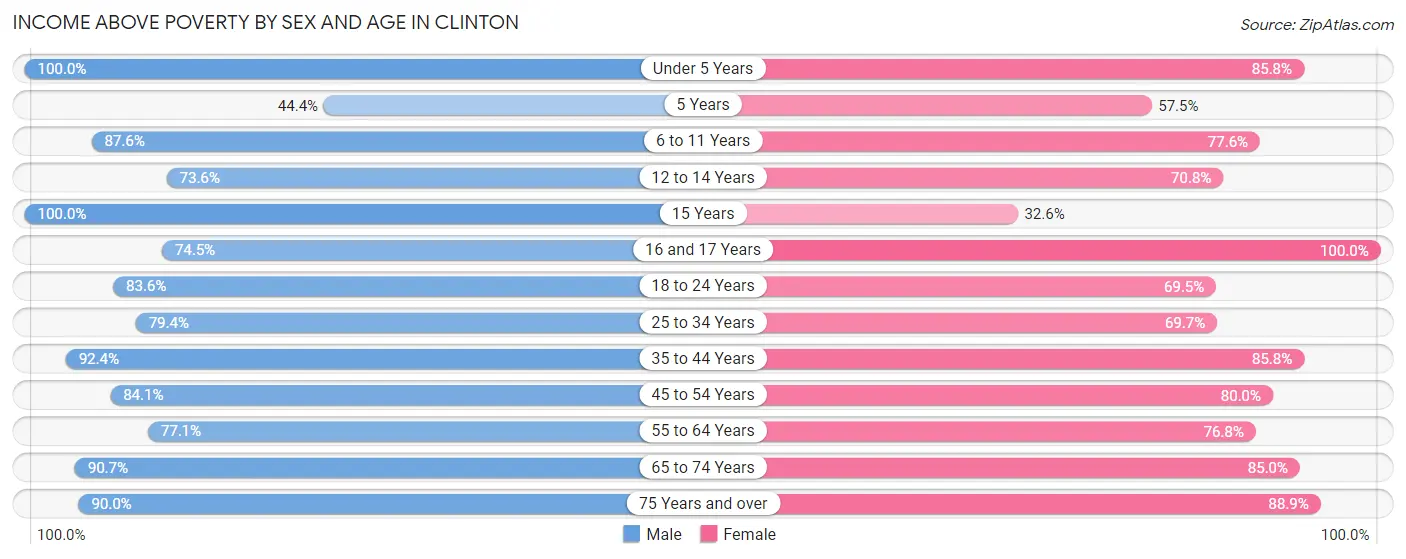
Income Above Poverty by Sex and Age in Clinton
According to the poverty statistics in Clinton, males aged under 5 years and females aged 16 and 17 years are the age groups that are most secure financially, with 100.0% of males and 100.0% of females in these age groups living above the poverty line.
| Age Bracket | Male | Female |
| Under 5 Years | 303 (100.0%) | 259 (85.8%) |
| 5 Years | 12 (44.4%) | 54 (57.5%) |
| 6 to 11 Years | 134 (87.6%) | 239 (77.6%) |
| 12 to 14 Years | 67 (73.6%) | 109 (70.8%) |
| 15 Years | 44 (100.0%) | 15 (32.6%) |
| 16 and 17 Years | 149 (74.5%) | 75 (100.0%) |
| 18 to 24 Years | 244 (83.6%) | 248 (69.5%) |
| 25 to 34 Years | 450 (79.4%) | 374 (69.7%) |
| 35 to 44 Years | 508 (92.4%) | 513 (85.8%) |
| 45 to 54 Years | 418 (84.1%) | 288 (80.0%) |
| 55 to 64 Years | 374 (77.1%) | 567 (76.8%) |
| 65 to 74 Years | 477 (90.7%) | 562 (85.0%) |
| 75 Years and over | 198 (90.0%) | 415 (88.9%) |
| Total | 3,378 (85.4%) | 3,718 (79.2%) |
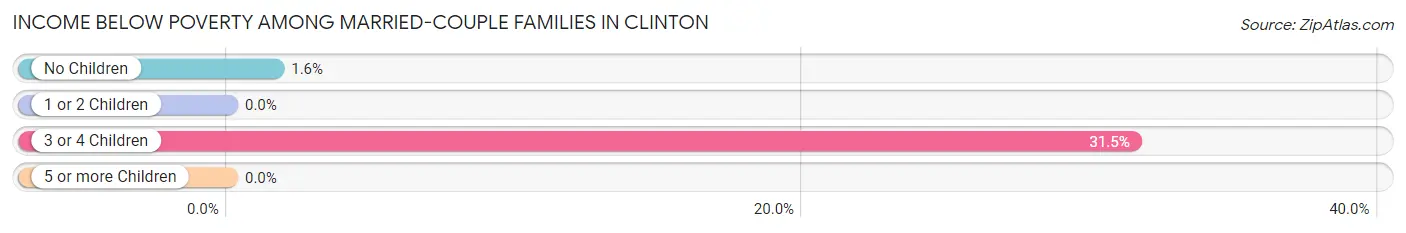
Income Below Poverty Among Married-Couple Families in Clinton
The poverty statistics for married-couple families in Clinton show that 3.0% or 43 of the total 1,431 families live below the poverty line. Families with 3 or 4 children have the highest poverty rate of 31.5%, comprising of 28 families. On the other hand, families with 1 or 2 children have the lowest poverty rate of 0.0%, which includes 0 families.
| Children | Above Poverty | Below Poverty |
| No Children | 917 (98.4%) | 15 (1.6%) |
| 1 or 2 Children | 360 (100.0%) | 0 (0.0%) |
| 3 or 4 Children | 61 (68.5%) | 28 (31.5%) |
| 5 or more Children | 50 (100.0%) | 0 (0.0%) |
| Total | 1,388 (97.0%) | 43 (3.0%) |
Income Below Poverty Among Single-Parent Households in Clinton
According to the poverty data in Clinton, 23.1% or 56 single-father households and 24.3% or 130 single-mother households are living below the poverty line. Among single-father households, those with 1 or 2 children have the highest poverty rate, with 56 households (27.6%) experiencing poverty. Likewise, among single-mother households, those with 3 or 4 children have the highest poverty rate, with 32 households (100.0%) falling below the poverty line.
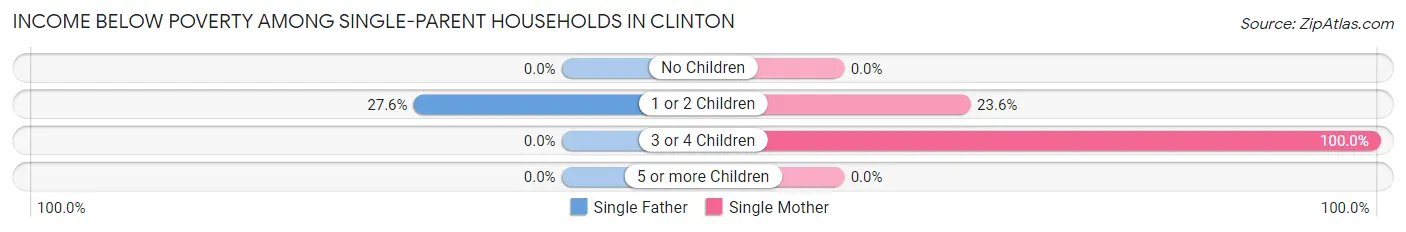
| Children | Single Father | Single Mother |
| No Children | 0 (0.0%) | 0 (0.0%) |
| 1 or 2 Children | 56 (27.6%) | 98 (23.6%) |
| 3 or 4 Children | 0 (0.0%) | 32 (100.0%) |
| 5 or more Children | 0 (0.0%) | 0 (0.0%) |
| Total | 56 (23.1%) | 130 (24.3%) |
Income Below Poverty Among Married-Couple vs Single-Parent Households in Clinton
The poverty data for Clinton shows that 43 of the married-couple family households (3.0%) and 186 of the single-parent households (24.0%) are living below the poverty level. Within the married-couple family households, those with 3 or 4 children have the highest poverty rate, with 28 households (31.5%) falling below the poverty line. Among the single-parent households, those with 3 or 4 children have the highest poverty rate, with 32 household (100.0%) living below poverty.
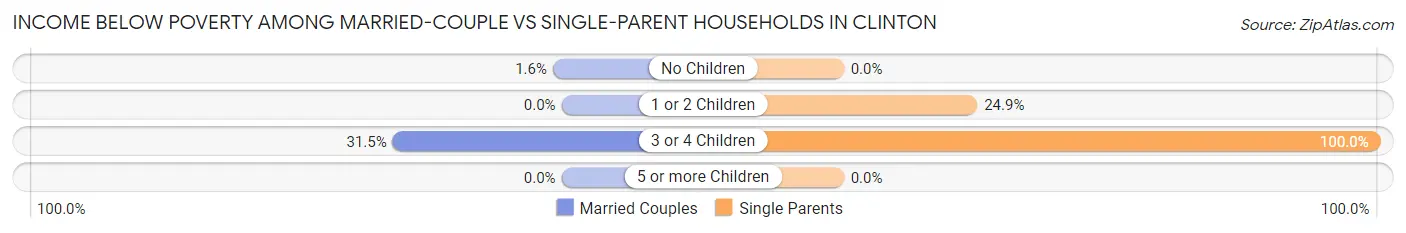
| Children | Married-Couple Families | Single-Parent Households |
| No Children | 15 (1.6%) | 0 (0.0%) |
| 1 or 2 Children | 0 (0.0%) | 154 (24.9%) |
| 3 or 4 Children | 28 (31.5%) | 32 (100.0%) |
| 5 or more Children | 0 (0.0%) | 0 (0.0%) |
| Total | 43 (3.0%) | 186 (24.0%) |
Race in Clinton
The most populous races in Clinton are White / Caucasian (8,286 | 93.0%), Two or more Races (428 | 4.8%), and Hispanic or Latino (166 | 1.9%).
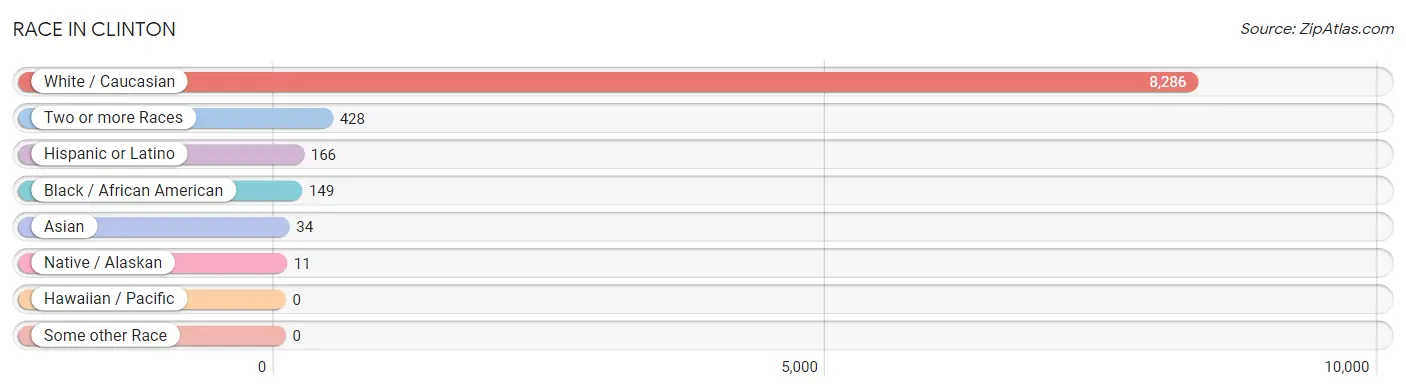
| Race | # Population | % Population |
| Asian | 34 | 0.4% |
| Black / African American | 149 | 1.7% |
| Hawaiian / Pacific | 0 | 0.0% |
| Hispanic or Latino | 166 | 1.9% |
| Native / Alaskan | 11 | 0.1% |
| White / Caucasian | 8,286 | 93.0% |
| Two or more Races | 428 | 4.8% |
| Some other Race | 0 | 0.0% |
| Total | 8,908 | 100.0% |
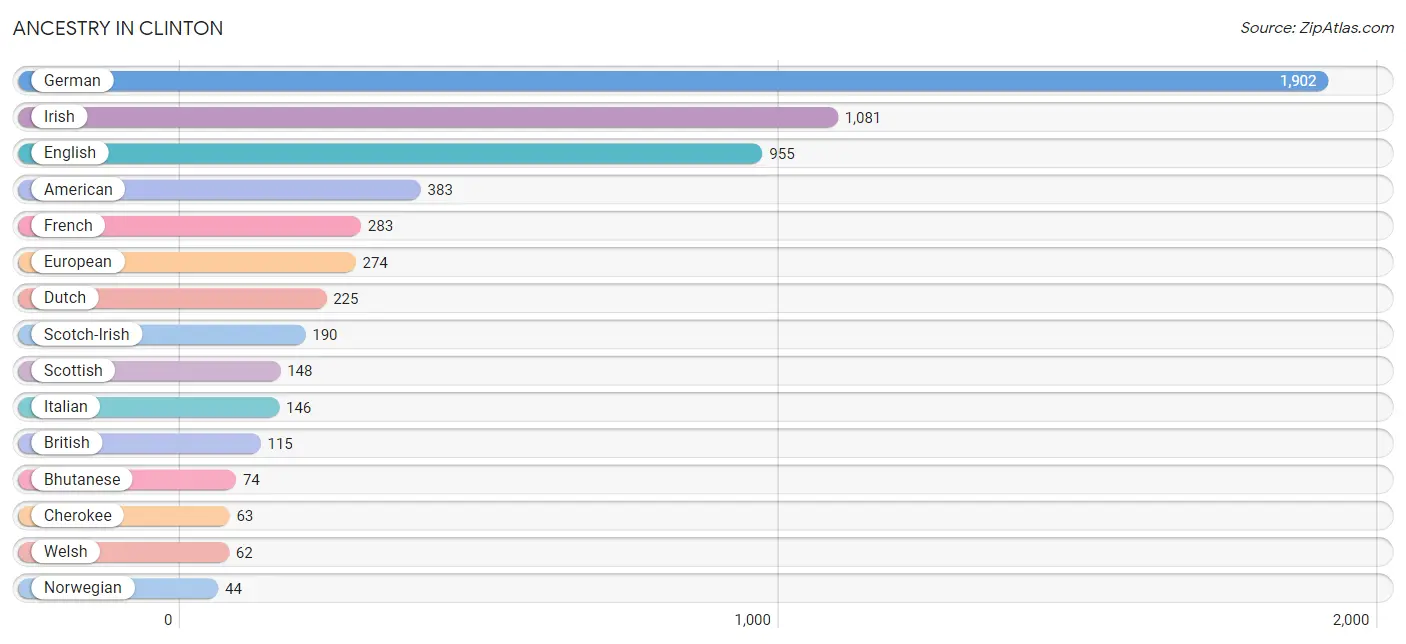
Ancestry in Clinton
The most populous ancestries reported in Clinton are German (1,902 | 21.3%), Irish (1,081 | 12.1%), English (955 | 10.7%), American (383 | 4.3%), and French (283 | 3.2%), together accounting for 51.7% of all Clinton residents.
| Ancestry | # Population | % Population |
| African | 1 | 0.0% |
| American | 383 | 4.3% |
| Arab | 6 | 0.1% |
| Austrian | 16 | 0.2% |
| Bhutanese | 74 | 0.8% |
| Bolivian | 23 | 0.3% |
| British | 115 | 1.3% |
| Cherokee | 63 | 0.7% |
| Choctaw | 6 | 0.1% |
| Czech | 3 | 0.0% |
| Czechoslovakian | 20 | 0.2% |
| Dutch | 225 | 2.5% |
| English | 955 | 10.7% |
| European | 274 | 3.1% |
| French | 283 | 3.2% |
| French Canadian | 20 | 0.2% |
| German | 1,902 | 21.3% |
| Greek | 10 | 0.1% |
| Hungarian | 22 | 0.3% |
| Indian (Asian) | 10 | 0.1% |
| Irish | 1,081 | 12.1% |
| Israeli | 18 | 0.2% |
| Italian | 146 | 1.6% |
| Northern European | 19 | 0.2% |
| Norwegian | 44 | 0.5% |
| Polish | 39 | 0.4% |
| Puerto Rican | 33 | 0.4% |
| Scandinavian | 23 | 0.3% |
| Scotch-Irish | 190 | 2.1% |
| Scottish | 148 | 1.7% |
| Sioux | 6 | 0.1% |
| South American | 23 | 0.3% |
| South American Indian | 23 | 0.3% |
| Spanish | 20 | 0.2% |
| Subsaharan African | 1 | 0.0% |
| Swiss | 21 | 0.2% |
| Thai | 24 | 0.3% |
| Welsh | 62 | 0.7% | View All 38 Rows |
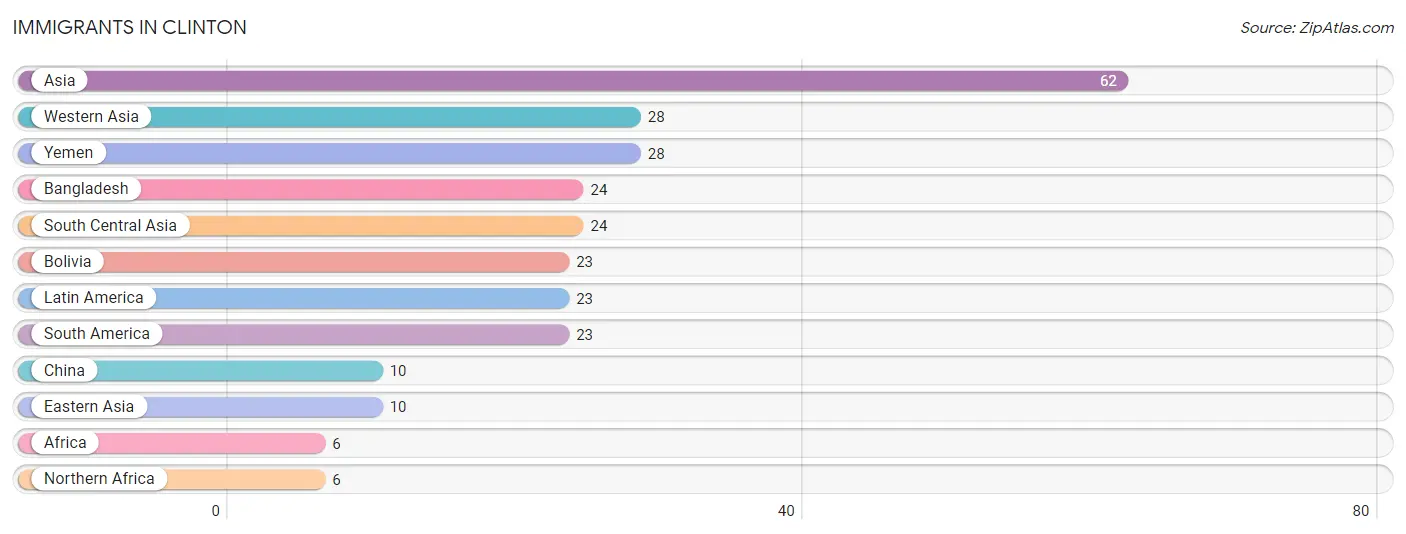
Immigrants in Clinton
The most numerous immigrant groups reported in Clinton came from Asia (62 | 0.7%), Western Asia (28 | 0.3%), Yemen (28 | 0.3%), Bangladesh (24 | 0.3%), and South Central Asia (24 | 0.3%), together accounting for 1.9% of all Clinton residents.
| Immigration Origin | # Population | % Population |
| Africa | 6 | 0.1% |
| Asia | 62 | 0.7% |
| Bangladesh | 24 | 0.3% |
| Bolivia | 23 | 0.3% |
| China | 10 | 0.1% |
| Eastern Asia | 10 | 0.1% |
| Latin America | 23 | 0.3% |
| Northern Africa | 6 | 0.1% |
| South America | 23 | 0.3% |
| South Central Asia | 24 | 0.3% |
| Western Asia | 28 | 0.3% |
| Yemen | 28 | 0.3% | View All 12 Rows |
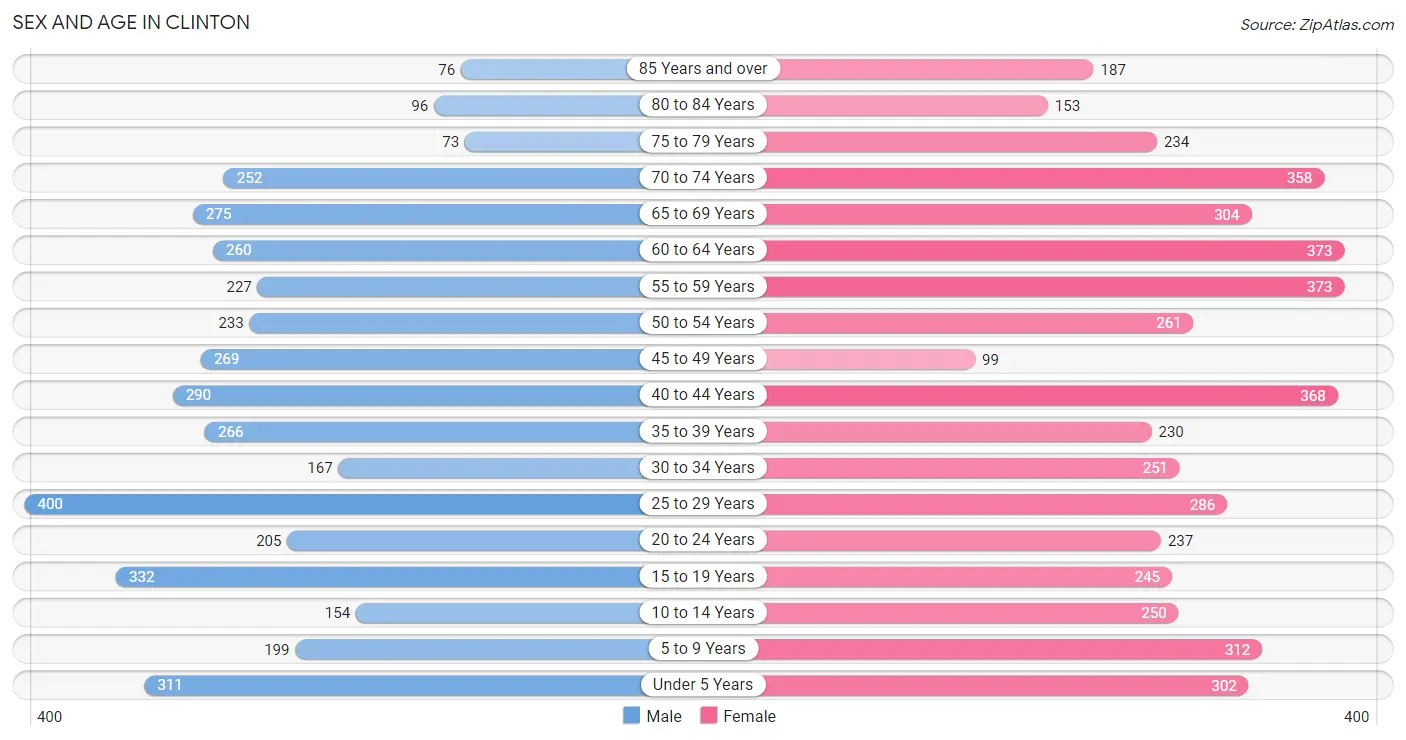
Sex and Age in Clinton
Sex and Age in Clinton
The most populous age groups in Clinton are 25 to 29 Years (400 | 9.8%) for men and 55 to 59 Years (373 | 7.7%) for women.
| Age Bracket | Male | Female |
| Under 5 Years | 311 (7.6%) | 302 (6.3%) |
| 5 to 9 Years | 199 (4.9%) | 312 (6.5%) |
| 10 to 14 Years | 154 (3.8%) | 250 (5.2%) |
| 15 to 19 Years | 332 (8.1%) | 245 (5.1%) |
| 20 to 24 Years | 205 (5.0%) | 237 (4.9%) |
| 25 to 29 Years | 400 (9.8%) | 286 (5.9%) |
| 30 to 34 Years | 167 (4.1%) | 251 (5.2%) |
| 35 to 39 Years | 266 (6.5%) | 230 (4.8%) |
| 40 to 44 Years | 290 (7.1%) | 368 (7.6%) |
| 45 to 49 Years | 269 (6.6%) | 99 (2.1%) |
| 50 to 54 Years | 233 (5.7%) | 261 (5.4%) |
| 55 to 59 Years | 227 (5.6%) | 373 (7.7%) |
| 60 to 64 Years | 260 (6.4%) | 373 (7.7%) |
| 65 to 69 Years | 275 (6.7%) | 304 (6.3%) |
| 70 to 74 Years | 252 (6.2%) | 358 (7.4%) |
| 75 to 79 Years | 73 (1.8%) | 234 (4.9%) |
| 80 to 84 Years | 96 (2.4%) | 153 (3.2%) |
| 85 Years and over | 76 (1.9%) | 187 (3.9%) |
| Total | 4,085 (100.0%) | 4,823 (100.0%) |
Families and Households in Clinton
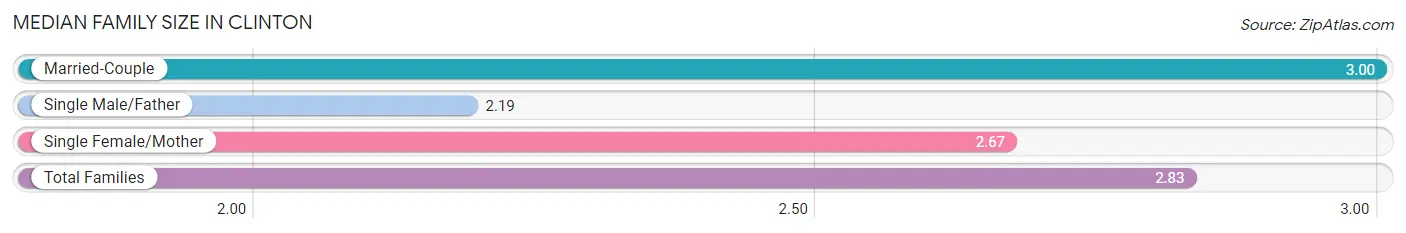
Median Family Size in Clinton
The median family size in Clinton is 2.83 persons per family, with married-couple families (1,431 | 64.8%) accounting for the largest median family size of 3 persons per family. On the other hand, single male/father families (242 | 11.0%) represent the smallest median family size with 2.19 persons per family.
| Family Type | # Families | Family Size |
| Married-Couple | 1,431 (64.8%) | 3.00 |
| Single Male/Father | 242 (11.0%) | 2.19 |
| Single Female/Mother | 534 (24.2%) | 2.67 |
| Total Families | 2,207 (100.0%) | 2.83 |
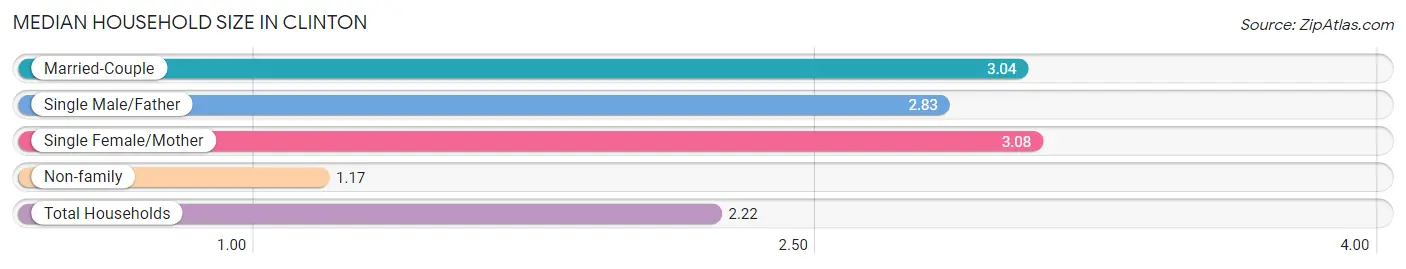
Median Household Size in Clinton
The median household size in Clinton is 2.22 persons per household, with single female/mother households (534 | 13.7%) accounting for the largest median household size of 3.08 persons per household. non-family households (1,703 | 43.5%) represent the smallest median household size with 1.17 persons per household.
| Household Type | # Households | Household Size |
| Married-Couple | 1,431 (36.6%) | 3.04 |
| Single Male/Father | 242 (6.2%) | 2.83 |
| Single Female/Mother | 534 (13.7%) | 3.08 |
| Non-family | 1,703 (43.5%) | 1.17 |
| Total Households | 3,910 (100.0%) | 2.22 |
Household Size by Marriage Status in Clinton
Out of a total of 3,910 households in Clinton, 2,207 (56.5%) are family households, while 1,703 (43.5%) are nonfamily households. The most numerous type of family households are 2-person households, comprising 963, and the most common type of nonfamily households are 1-person households, comprising 1,495.
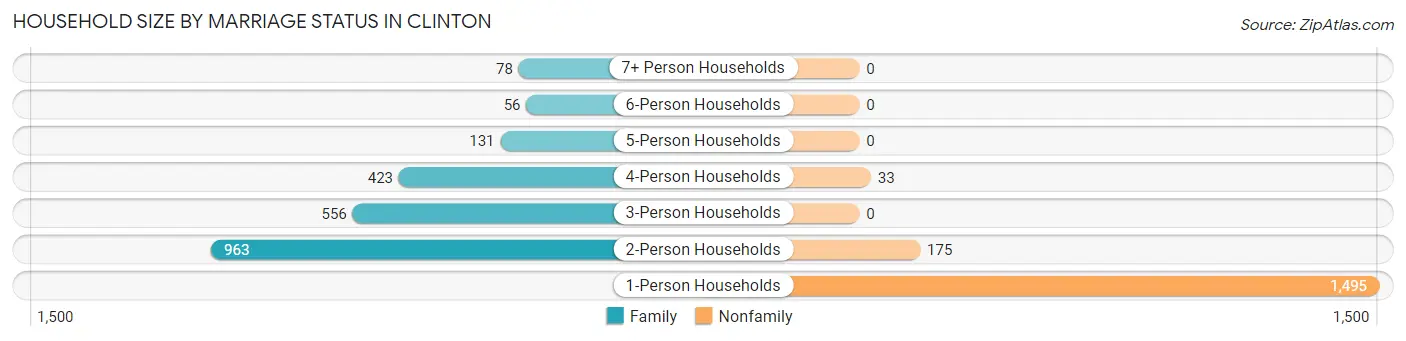
| Household Size | Family Households | Nonfamily Households |
| 1-Person Households | - | 1,495 (38.2%) |
| 2-Person Households | 963 (24.6%) | 175 (4.5%) |
| 3-Person Households | 556 (14.2%) | 0 (0.0%) |
| 4-Person Households | 423 (10.8%) | 33 (0.8%) |
| 5-Person Households | 131 (3.4%) | 0 (0.0%) |
| 6-Person Households | 56 (1.4%) | 0 (0.0%) |
| 7+ Person Households | 78 (2.0%) | 0 (0.0%) |
| Total | 2,207 (56.5%) | 1,703 (43.5%) |
Female Fertility in Clinton
Fertility by Age in Clinton
Average fertility rate in Clinton is 24.0 births per 1,000 women. Women in the age bracket of 20 to 34 years have the highest fertility rate with 54.0 births per 1,000 women. Women in the age bracket of 20 to 34 years acount for 100.0% of all women with births.
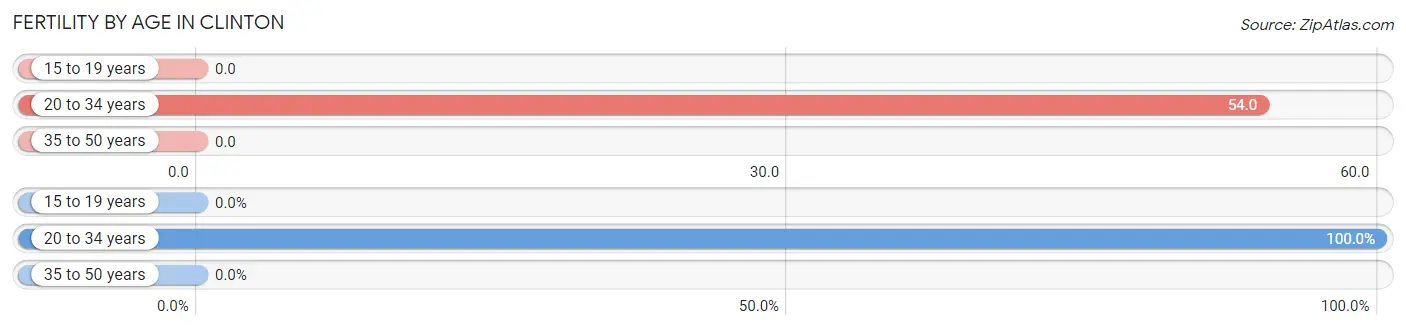
| Age Bracket | Women with Births | Births / 1,000 Women |
| 15 to 19 years | 0 (0.0%) | 0.0 |
| 20 to 34 years | 42 (100.0%) | 54.0 |
| 35 to 50 years | 0 (0.0%) | 0.0 |
| Total | 42 (100.0%) | 24.0 |
Fertility by Age by Marriage Status in Clinton
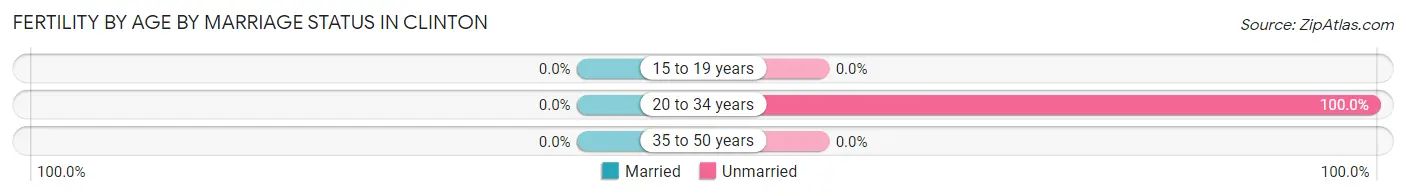
| Age Bracket | Married | Unmarried |
| 15 to 19 years | 0 (0.0%) | 0 (0.0%) |
| 20 to 34 years | 0 (0.0%) | 42 (100.0%) |
| 35 to 50 years | 0 (0.0%) | 0 (0.0%) |
| Total | 0 (0.0%) | 42 (100.0%) |
Fertility by Education in Clinton
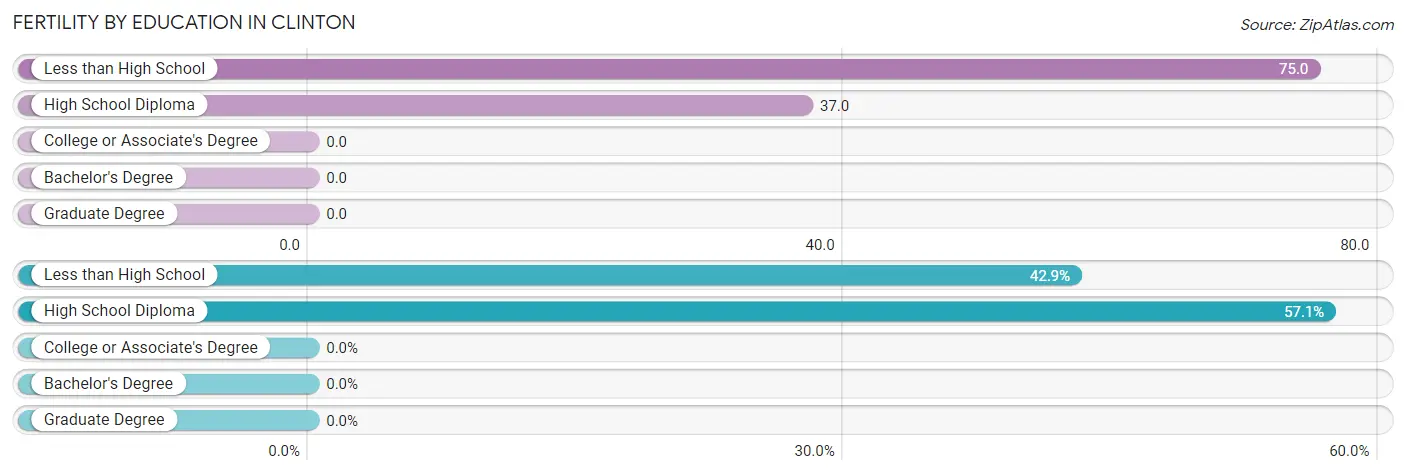
| Educational Attainment | Women with Births | Births / 1,000 Women |
| Less than High School | 18 (42.9%) | 75.0 |
| High School Diploma | 24 (57.1%) | 37.0 |
| College or Associate's Degree | 0 (0.0%) | 0.0 |
| Bachelor's Degree | 0 (0.0%) | 0.0 |
| Graduate Degree | 0 (0.0%) | 0.0 |
| Total | 42 (100.0%) | 24.0 |
Fertility by Education by Marriage Status in Clinton
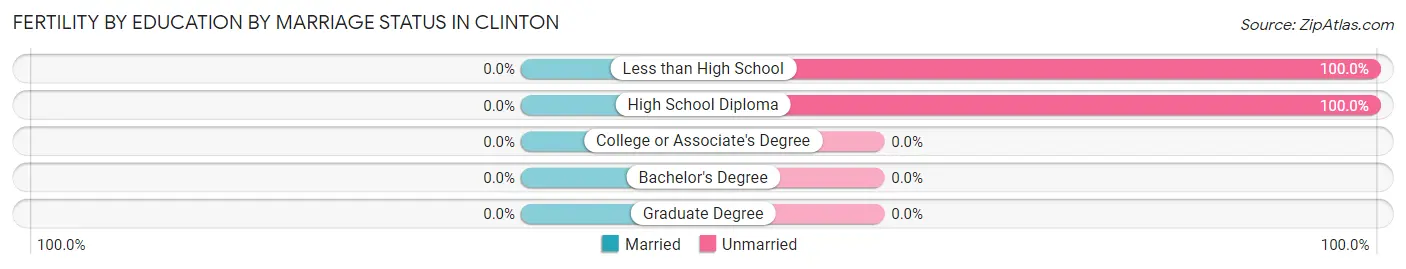
| Educational Attainment | Married | Unmarried |
| Less than High School | 0 (0.0%) | 18 (100.0%) |
| High School Diploma | 0 (0.0%) | 24 (100.0%) |
| College or Associate's Degree | 0 (0.0%) | 0 (0.0%) |
| Bachelor's Degree | 0 (0.0%) | 0 (0.0%) |
| Graduate Degree | 0 (0.0%) | 0 (0.0%) |
| Total | 0 (0.0%) | 42 (100.0%) |
Employment Characteristics in Clinton
Employment by Class of Employer in Clinton
Among the 3,713 employed individuals in Clinton, private company employees (2,427 | 65.4%), not-for-profit organizations (411 | 11.1%), and local government employees (363 | 9.8%) make up the most common classes of employment.
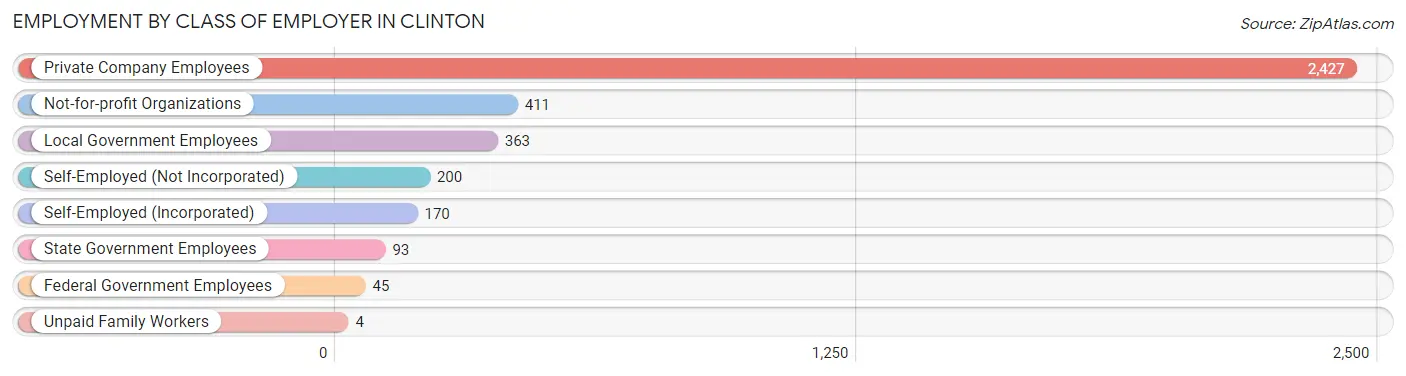
| Employer Class | # Employees | % Employees |
| Private Company Employees | 2,427 | 65.4% |
| Self-Employed (Incorporated) | 170 | 4.6% |
| Self-Employed (Not Incorporated) | 200 | 5.4% |
| Not-for-profit Organizations | 411 | 11.1% |
| Local Government Employees | 363 | 9.8% |
| State Government Employees | 93 | 2.5% |
| Federal Government Employees | 45 | 1.2% |
| Unpaid Family Workers | 4 | 0.1% |
| Total | 3,713 | 100.0% |
Employment Status by Age in Clinton
According to the labor force statistics for Clinton, out of the total population over 16 years of age (7,286), 57.4% or 4,182 individuals are in the labor force, with 9.9% or 414 of them unemployed. The age group with the highest labor force participation rate is 35 to 44 years, with 91.4% or 1,055 individuals in the labor force. Within the labor force, the 16 to 19 years age range has the highest percentage of unemployed individuals, with 42.2% or 117 of them being unemployed.
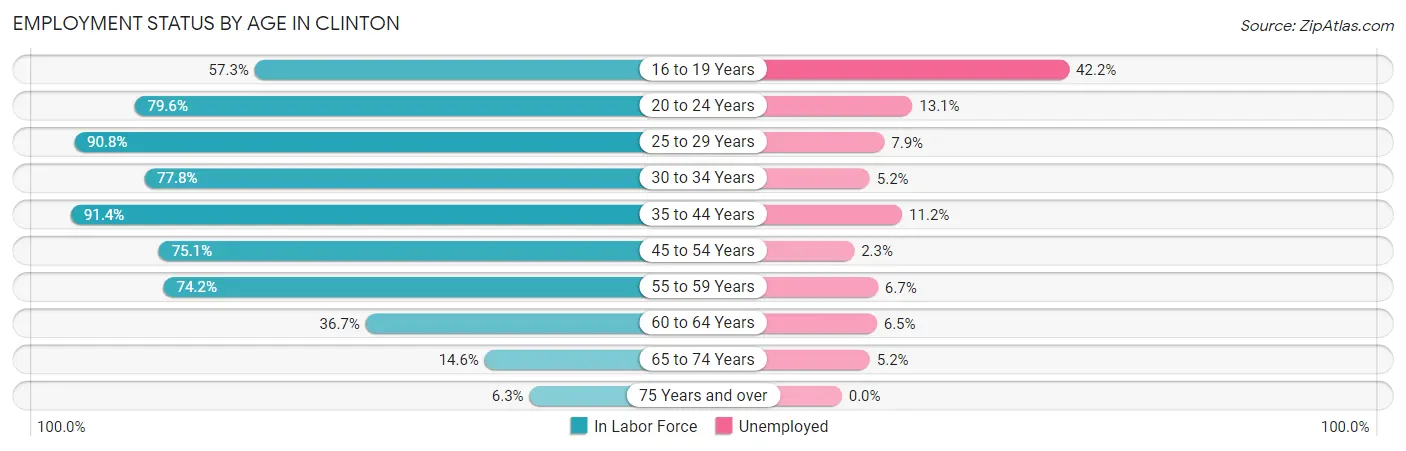
| Age Bracket | In Labor Force | Unemployed |
| 16 to 19 Years | 277 (57.3%) | 117 (42.2%) |
| 20 to 24 Years | 352 (79.6%) | 46 (13.1%) |
| 25 to 29 Years | 623 (90.8%) | 49 (7.9%) |
| 30 to 34 Years | 325 (77.8%) | 17 (5.2%) |
| 35 to 44 Years | 1,055 (91.4%) | 118 (11.2%) |
| 45 to 54 Years | 647 (75.1%) | 15 (2.3%) |
| 55 to 59 Years | 445 (74.2%) | 30 (6.7%) |
| 60 to 64 Years | 232 (36.7%) | 15 (6.5%) |
| 65 to 74 Years | 174 (14.6%) | 9 (5.2%) |
| 75 Years and over | 52 (6.3%) | 0 (0.0%) |
| Total | 4,182 (57.4%) | 414 (9.9%) |
Employment Status by Educational Attainment in Clinton
According to labor force statistics for Clinton, 76.4% of individuals (3,326) out of the total population between 25 and 64 years of age (4,353) are in the labor force, with 7.3% or 243 of them being unemployed. The group with the highest labor force participation rate are those with the educational attainment of college / associate degree, with 83.5% or 1,369 individuals in the labor force. Within the labor force, individuals with less than high school education have the highest percentage of unemployment, with 8.7% or 18 of them being unemployed.
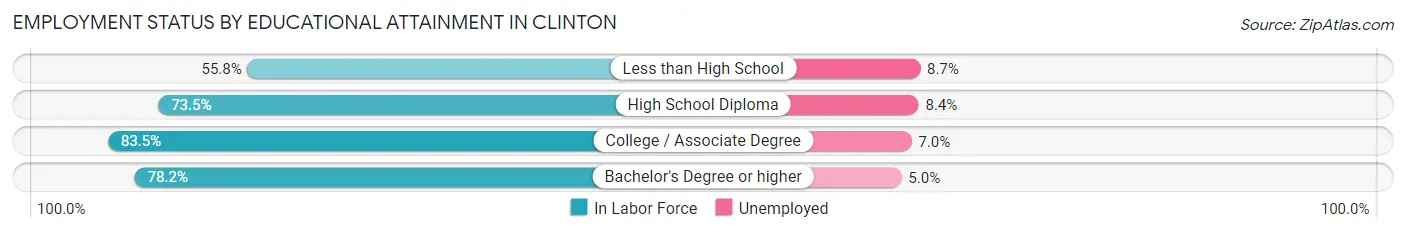
| Educational Attainment | In Labor Force | Unemployed |
| Less than High School | 206 (55.8%) | 32 (8.7%) |
| High School Diploma | 1,257 (73.5%) | 144 (8.4%) |
| College / Associate Degree | 1,369 (83.5%) | 115 (7.0%) |
| Bachelor's Degree or higher | 496 (78.2%) | 32 (5.0%) |
| Total | 3,326 (76.4%) | 318 (7.3%) |
Employment Occupations by Sex in Clinton
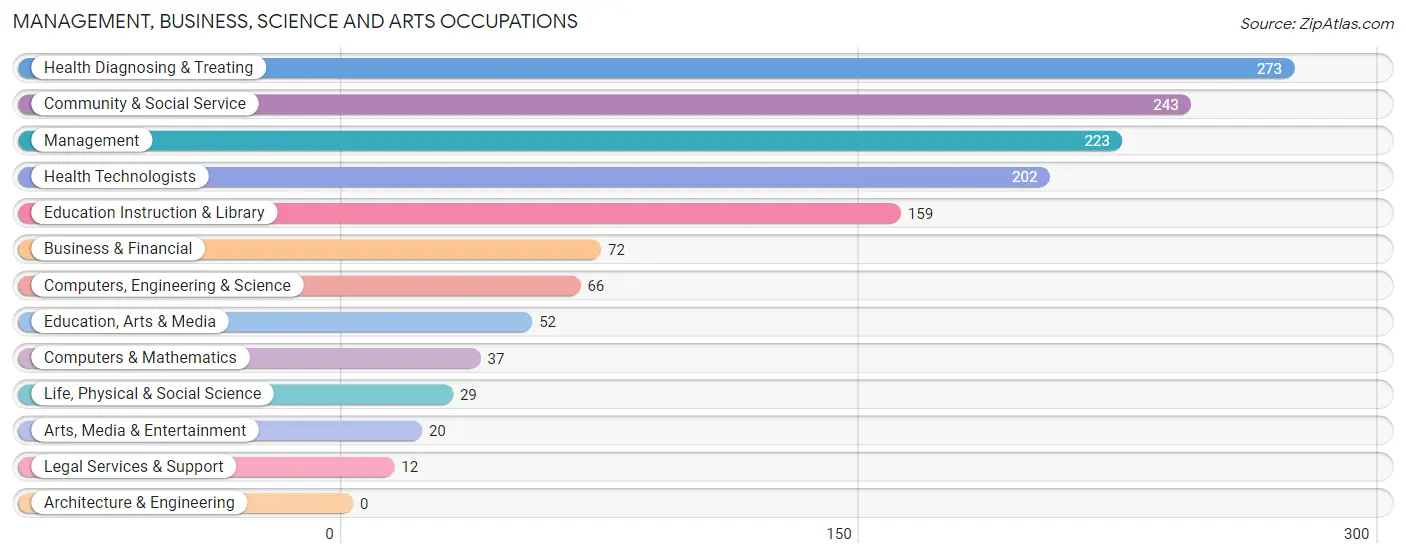
Management, Business, Science and Arts Occupations
The most common Management, Business, Science and Arts occupations in Clinton are Health Diagnosing & Treating (273 | 7.3%), Community & Social Service (243 | 6.5%), Management (223 | 5.9%), Health Technologists (202 | 5.4%), and Education Instruction & Library (159 | 4.2%).
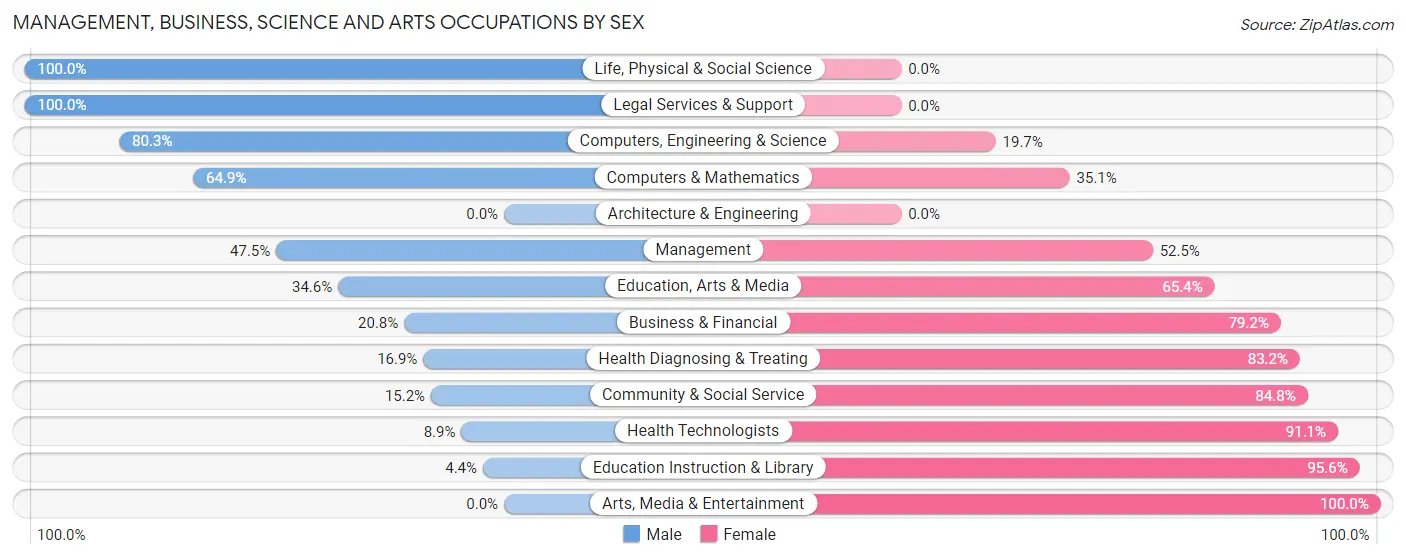
Management, Business, Science and Arts Occupations by Sex
Within the Management, Business, Science and Arts occupations in Clinton, the most male-oriented occupations are Life, Physical & Social Science (100.0%), Legal Services & Support (100.0%), and Computers, Engineering & Science (80.3%), while the most female-oriented occupations are Arts, Media & Entertainment (100.0%), Education Instruction & Library (95.6%), and Health Technologists (91.1%).
| Occupation | Male | Female |
| Management | 106 (47.5%) | 117 (52.5%) |
| Business & Financial | 15 (20.8%) | 57 (79.2%) |
| Computers, Engineering & Science | 53 (80.3%) | 13 (19.7%) |
| Computers & Mathematics | 24 (64.9%) | 13 (35.1%) |
| Architecture & Engineering | 0 (0.0%) | 0 (0.0%) |
| Life, Physical & Social Science | 29 (100.0%) | 0 (0.0%) |
| Community & Social Service | 37 (15.2%) | 206 (84.8%) |
| Education, Arts & Media | 18 (34.6%) | 34 (65.4%) |
| Legal Services & Support | 12 (100.0%) | 0 (0.0%) |
| Education Instruction & Library | 7 (4.4%) | 152 (95.6%) |
| Arts, Media & Entertainment | 0 (0.0%) | 20 (100.0%) |
| Health Diagnosing & Treating | 46 (16.9%) | 227 (83.2%) |
| Health Technologists | 18 (8.9%) | 184 (91.1%) |
| Total (Category) | 257 (29.3%) | 620 (70.7%) |
| Total (Overall) | 1,956 (52.0%) | 1,804 (48.0%) |
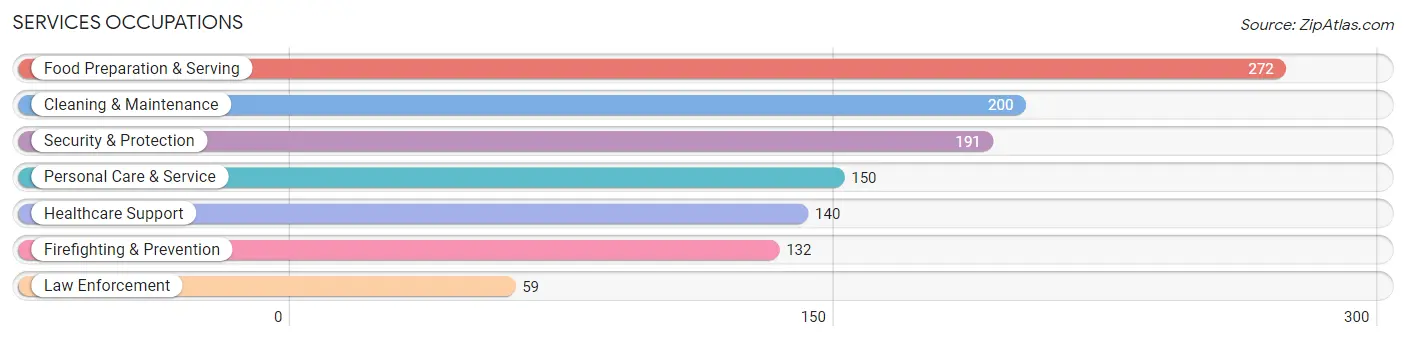
Services Occupations
The most common Services occupations in Clinton are Food Preparation & Serving (272 | 7.2%), Cleaning & Maintenance (200 | 5.3%), Security & Protection (191 | 5.1%), Personal Care & Service (150 | 4.0%), and Healthcare Support (140 | 3.7%).
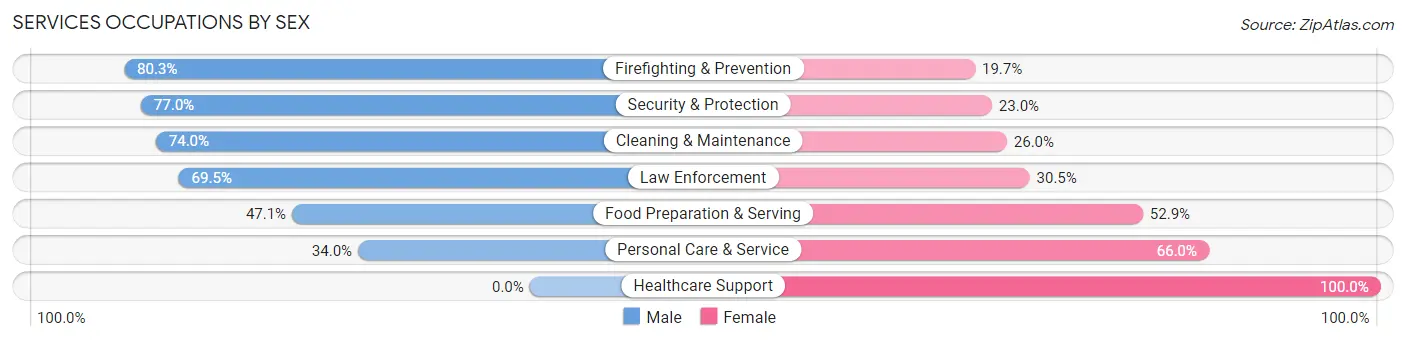
Services Occupations by Sex
Within the Services occupations in Clinton, the most male-oriented occupations are Firefighting & Prevention (80.3%), Security & Protection (77.0%), and Cleaning & Maintenance (74.0%), while the most female-oriented occupations are Healthcare Support (100.0%), Personal Care & Service (66.0%), and Food Preparation & Serving (52.9%).
| Occupation | Male | Female |
| Healthcare Support | 0 (0.0%) | 140 (100.0%) |
| Security & Protection | 147 (77.0%) | 44 (23.0%) |
| Firefighting & Prevention | 106 (80.3%) | 26 (19.7%) |
| Law Enforcement | 41 (69.5%) | 18 (30.5%) |
| Food Preparation & Serving | 128 (47.1%) | 144 (52.9%) |
| Cleaning & Maintenance | 148 (74.0%) | 52 (26.0%) |
| Personal Care & Service | 51 (34.0%) | 99 (66.0%) |
| Total (Category) | 474 (49.7%) | 479 (50.3%) |
| Total (Overall) | 1,956 (52.0%) | 1,804 (48.0%) |
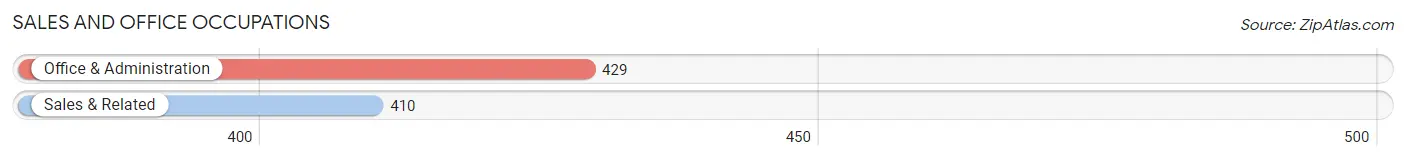
Sales and Office Occupations
The most common Sales and Office occupations in Clinton are Office & Administration (429 | 11.4%), and Sales & Related (410 | 10.9%).
Sales and Office Occupations by Sex
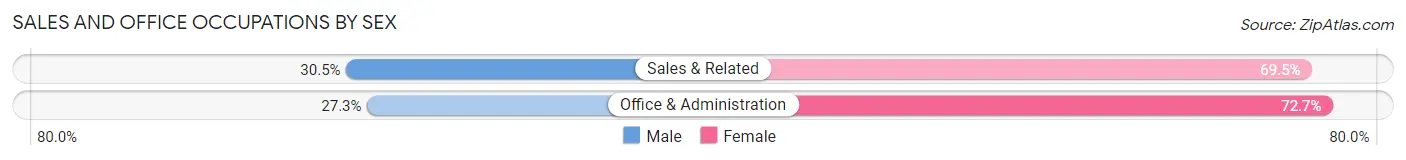
| Occupation | Male | Female |
| Sales & Related | 125 (30.5%) | 285 (69.5%) |
| Office & Administration | 117 (27.3%) | 312 (72.7%) |
| Total (Category) | 242 (28.8%) | 597 (71.2%) |
| Total (Overall) | 1,956 (52.0%) | 1,804 (48.0%) |
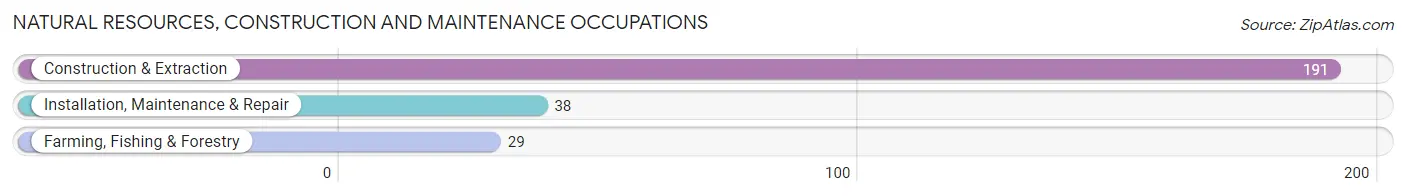
Natural Resources, Construction and Maintenance Occupations
The most common Natural Resources, Construction and Maintenance occupations in Clinton are Construction & Extraction (191 | 5.1%), Installation, Maintenance & Repair (38 | 1.0%), and Farming, Fishing & Forestry (29 | 0.8%).
Natural Resources, Construction and Maintenance Occupations by Sex
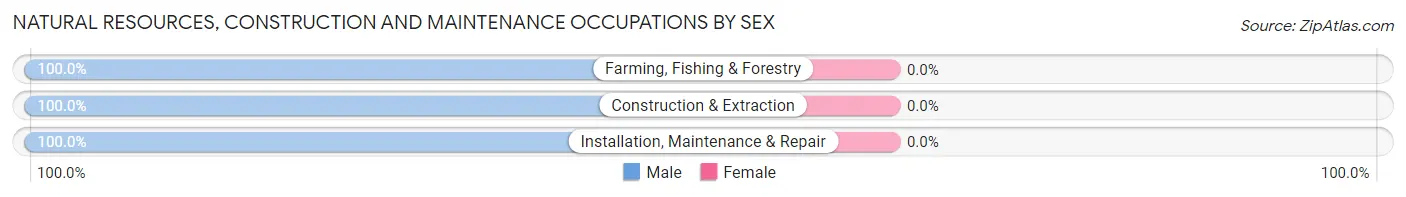
| Occupation | Male | Female |
| Farming, Fishing & Forestry | 29 (100.0%) | 0 (0.0%) |
| Construction & Extraction | 191 (100.0%) | 0 (0.0%) |
| Installation, Maintenance & Repair | 38 (100.0%) | 0 (0.0%) |
| Total (Category) | 258 (100.0%) | 0 (0.0%) |
| Total (Overall) | 1,956 (52.0%) | 1,804 (48.0%) |
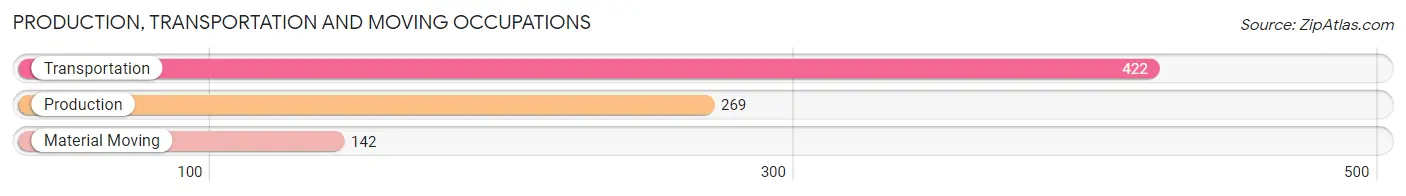
Production, Transportation and Moving Occupations
The most common Production, Transportation and Moving occupations in Clinton are Transportation (422 | 11.2%), Production (269 | 7.1%), and Material Moving (142 | 3.8%).
Production, Transportation and Moving Occupations by Sex
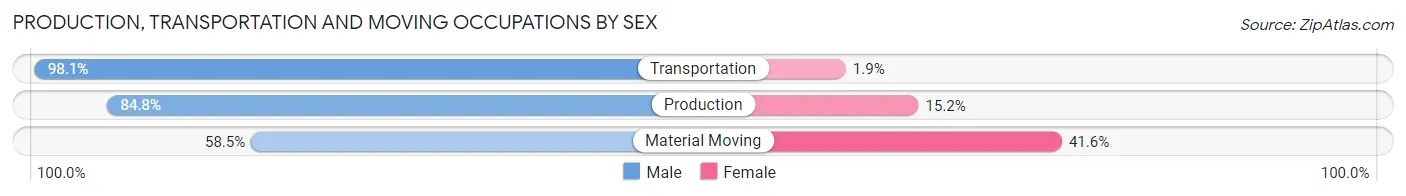
| Occupation | Male | Female |
| Production | 228 (84.8%) | 41 (15.2%) |
| Transportation | 414 (98.1%) | 8 (1.9%) |
| Material Moving | 83 (58.5%) | 59 (41.5%) |
| Total (Category) | 725 (87.0%) | 108 (13.0%) |
| Total (Overall) | 1,956 (52.0%) | 1,804 (48.0%) |
Employment Industries by Sex in Clinton
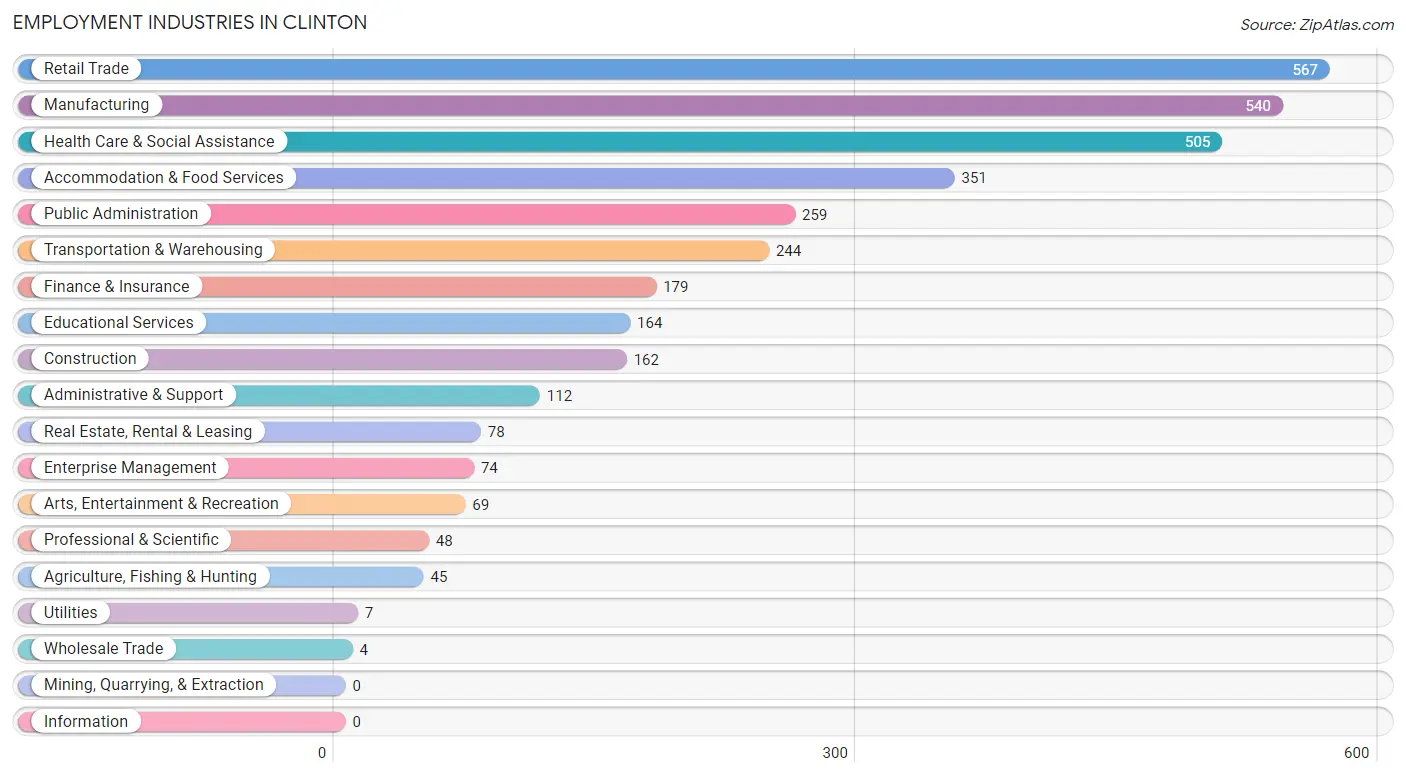
Employment Industries in Clinton
The major employment industries in Clinton include Retail Trade (567 | 15.1%), Manufacturing (540 | 14.4%), Health Care & Social Assistance (505 | 13.4%), Accommodation & Food Services (351 | 9.3%), and Public Administration (259 | 6.9%).
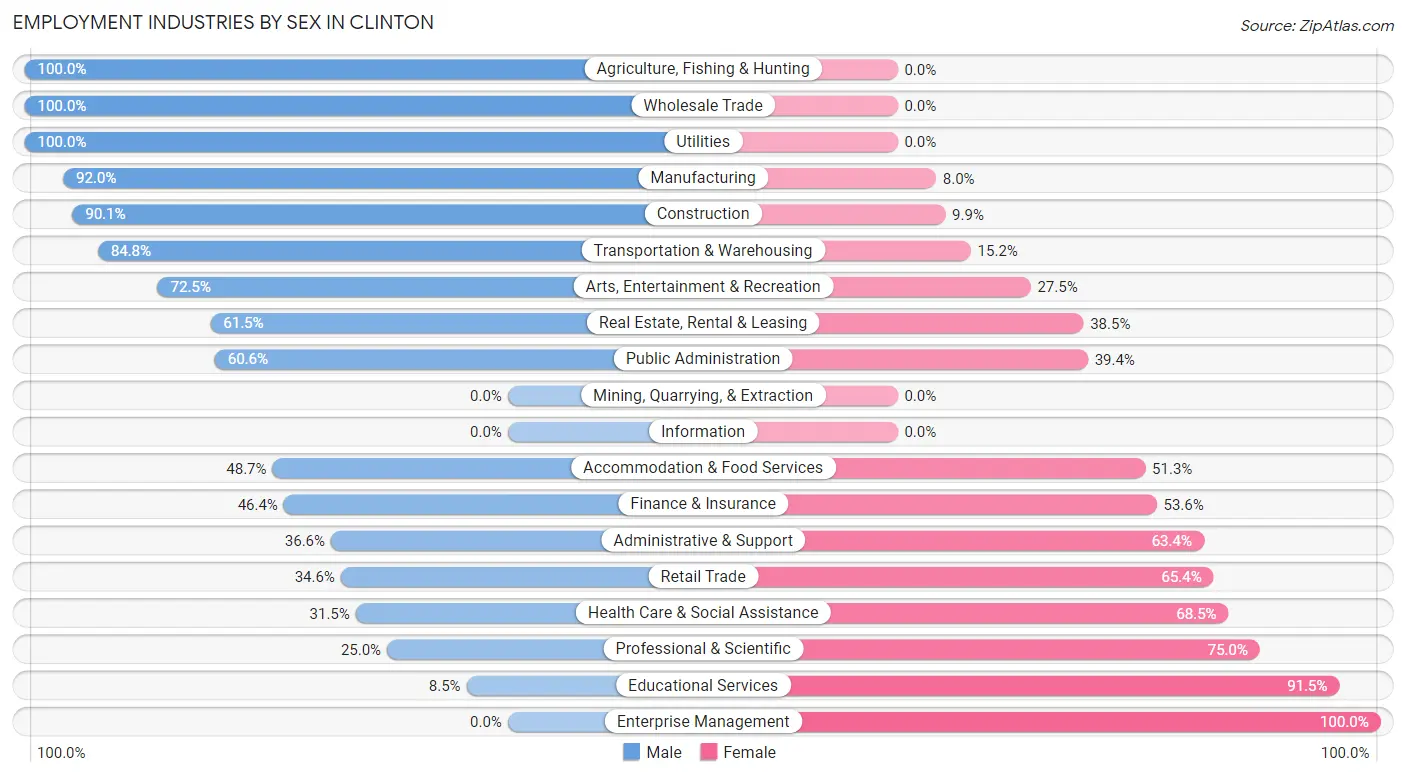
Employment Industries by Sex in Clinton
The Clinton industries that see more men than women are Agriculture, Fishing & Hunting (100.0%), Wholesale Trade (100.0%), and Utilities (100.0%), whereas the industries that tend to have a higher number of women are Enterprise Management (100.0%), Educational Services (91.5%), and Professional & Scientific (75.0%).
| Industry | Male | Female |
| Agriculture, Fishing & Hunting | 45 (100.0%) | 0 (0.0%) |
| Mining, Quarrying, & Extraction | 0 (0.0%) | 0 (0.0%) |
| Construction | 146 (90.1%) | 16 (9.9%) |
| Manufacturing | 497 (92.0%) | 43 (8.0%) |
| Wholesale Trade | 4 (100.0%) | 0 (0.0%) |
| Retail Trade | 196 (34.6%) | 371 (65.4%) |
| Transportation & Warehousing | 207 (84.8%) | 37 (15.2%) |
| Utilities | 7 (100.0%) | 0 (0.0%) |
| Information | 0 (0.0%) | 0 (0.0%) |
| Finance & Insurance | 83 (46.4%) | 96 (53.6%) |
| Real Estate, Rental & Leasing | 48 (61.5%) | 30 (38.5%) |
| Professional & Scientific | 12 (25.0%) | 36 (75.0%) |
| Enterprise Management | 0 (0.0%) | 74 (100.0%) |
| Administrative & Support | 41 (36.6%) | 71 (63.4%) |
| Educational Services | 14 (8.5%) | 150 (91.5%) |
| Health Care & Social Assistance | 159 (31.5%) | 346 (68.5%) |
| Arts, Entertainment & Recreation | 50 (72.5%) | 19 (27.5%) |
| Accommodation & Food Services | 171 (48.7%) | 180 (51.3%) |
| Public Administration | 157 (60.6%) | 102 (39.4%) |
| Total | 1,956 (52.0%) | 1,804 (48.0%) |
Education in Clinton
School Enrollment in Clinton
The most common levels of schooling among the 1,650 students in Clinton are high school (546 | 33.1%), elementary school (337 | 20.4%), and middle school (306 | 18.5%).
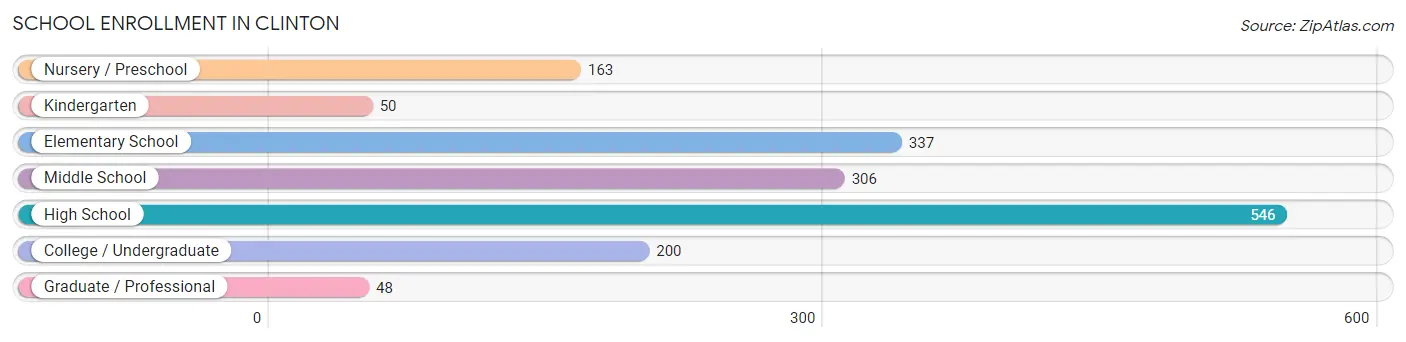
| School Level | # Students | % Students |
| Nursery / Preschool | 163 | 9.9% |
| Kindergarten | 50 | 3.0% |
| Elementary School | 337 | 20.4% |
| Middle School | 306 | 18.5% |
| High School | 546 | 33.1% |
| College / Undergraduate | 200 | 12.1% |
| Graduate / Professional | 48 | 2.9% |
| Total | 1,650 | 100.0% |
School Enrollment by Age by Funding Source in Clinton
Out of a total of 1,650 students who are enrolled in schools in Clinton, 213 (12.9%) attend a private institution, while the remaining 1,437 (87.1%) are enrolled in public schools. The age group of 3 to 4 year olds has the highest likelihood of being enrolled in private schools, with 82 (71.3% in the age bracket) enrolled. Conversely, the age group of 18 to 19 year olds has the lowest likelihood of being enrolled in a private school, with 149 (100.0% in the age bracket) attending a public institution.
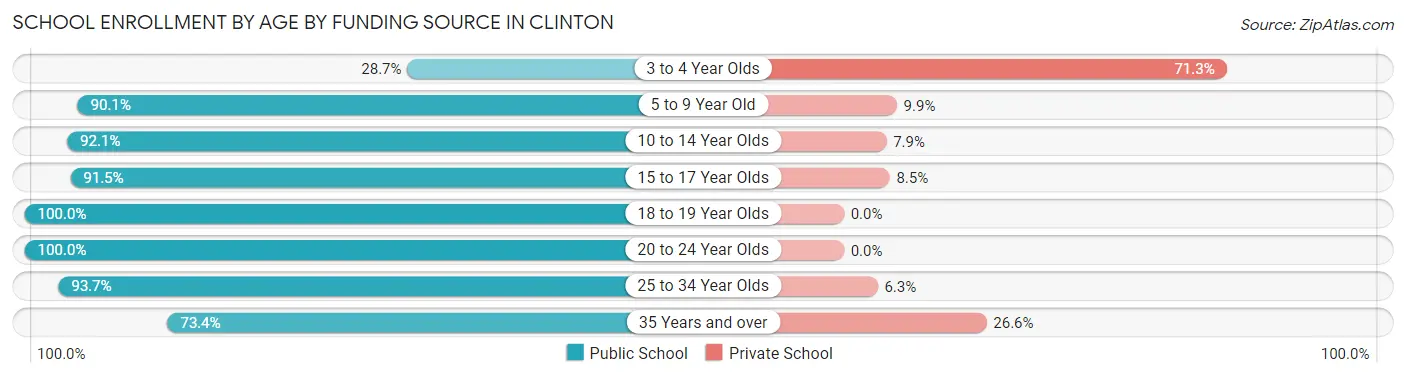
| Age Bracket | Public School | Private School |
| 3 to 4 Year Olds | 33 (28.7%) | 82 (71.3%) |
| 5 to 9 Year Old | 356 (90.1%) | 39 (9.9%) |
| 10 to 14 Year Olds | 372 (92.1%) | 32 (7.9%) |
| 15 to 17 Year Olds | 311 (91.5%) | 29 (8.5%) |
| 18 to 19 Year Olds | 149 (100.0%) | 0 (0.0%) |
| 20 to 24 Year Olds | 9 (100.0%) | 0 (0.0%) |
| 25 to 34 Year Olds | 149 (93.7%) | 10 (6.3%) |
| 35 Years and over | 58 (73.4%) | 21 (26.6%) |
| Total | 1,437 (87.1%) | 213 (12.9%) |
Educational Attainment by Field of Study in Clinton
Education (307 | 29.6%), business (136 | 13.1%), arts & humanities (134 | 12.9%), science & technology (94 | 9.1%), and liberal arts & history (84 | 8.1%) are the most common fields of study among 1,038 individuals in Clinton who have obtained a bachelor's degree or higher.
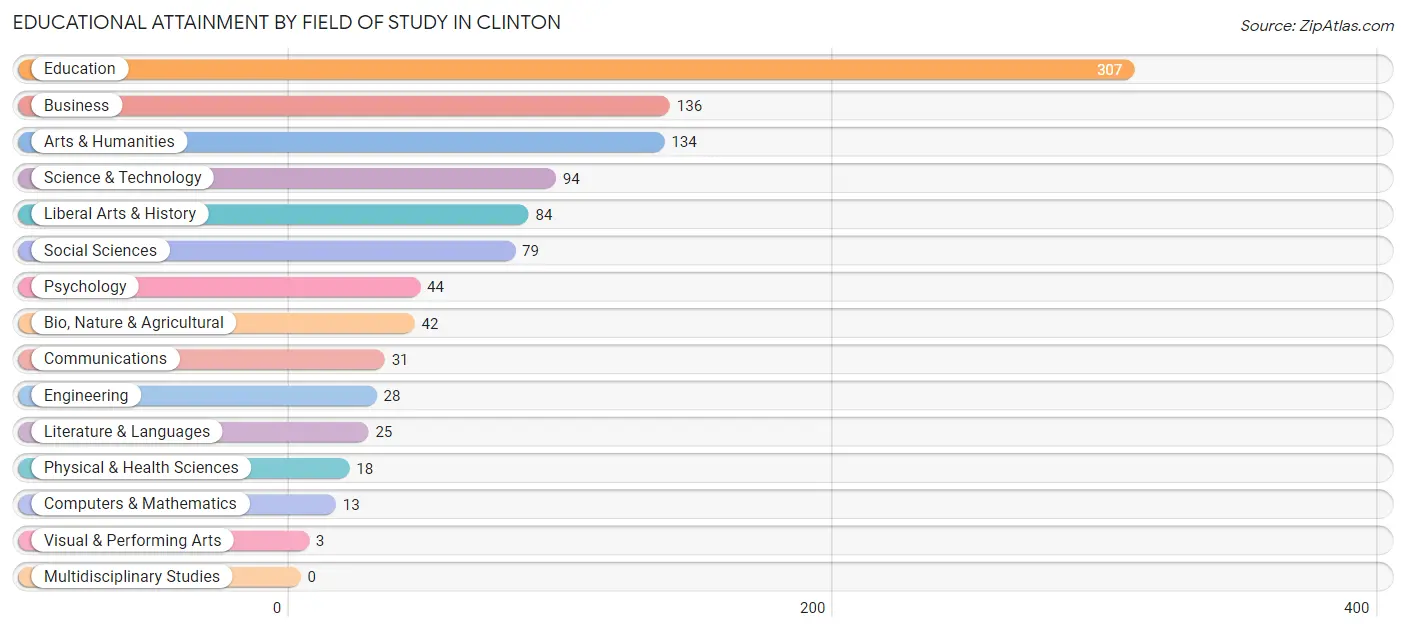
| Field of Study | # Graduates | % Graduates |
| Computers & Mathematics | 13 | 1.3% |
| Bio, Nature & Agricultural | 42 | 4.1% |
| Physical & Health Sciences | 18 | 1.7% |
| Psychology | 44 | 4.2% |
| Social Sciences | 79 | 7.6% |
| Engineering | 28 | 2.7% |
| Multidisciplinary Studies | 0 | 0.0% |
| Science & Technology | 94 | 9.1% |
| Business | 136 | 13.1% |
| Education | 307 | 29.6% |
| Literature & Languages | 25 | 2.4% |
| Liberal Arts & History | 84 | 8.1% |
| Visual & Performing Arts | 3 | 0.3% |
| Communications | 31 | 3.0% |
| Arts & Humanities | 134 | 12.9% |
| Total | 1,038 | 100.0% |
Transportation & Commute in Clinton
Vehicle Availability by Sex in Clinton
The most prevalent vehicle ownership categories in Clinton are males with 2 vehicles (655, accounting for 34.0%) and females with 2 vehicles (753, making up 36.7%).
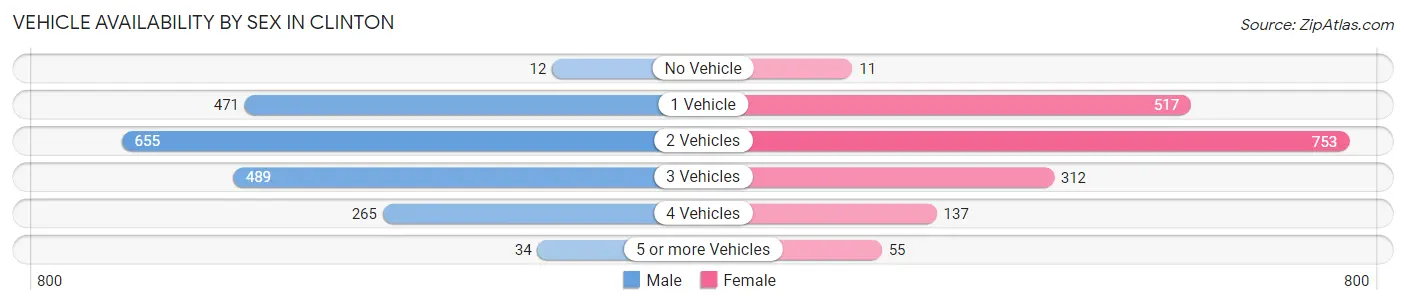
| Vehicles Available | Male | Female |
| No Vehicle | 12 (0.6%) | 11 (0.6%) |
| 1 Vehicle | 471 (24.4%) | 517 (29.0%) |
| 2 Vehicles | 655 (34.0%) | 753 (42.2%) |
| 3 Vehicles | 489 (25.4%) | 312 (17.5%) |
| 4 Vehicles | 265 (13.8%) | 137 (7.7%) |
| 5 or more Vehicles | 34 (1.8%) | 55 (3.1%) |
| Total | 1,926 (100.0%) | 1,785 (100.0%) |
Commute Time in Clinton
The most frequently occuring commute durations in Clinton are 5 to 9 minutes (1,156 commuters, 33.2%), 10 to 14 minutes (1,019 commuters, 29.3%), and less than 5 minutes (466 commuters, 13.4%).
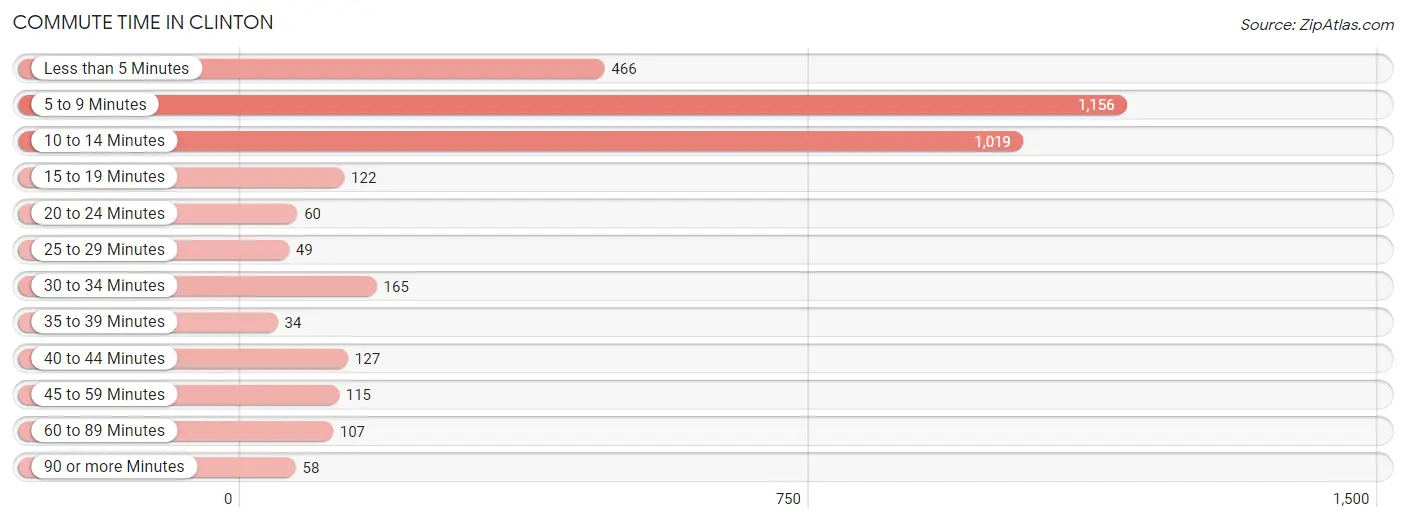
| Commute Time | # Commuters | % Commuters |
| Less than 5 Minutes | 466 | 13.4% |
| 5 to 9 Minutes | 1,156 | 33.2% |
| 10 to 14 Minutes | 1,019 | 29.3% |
| 15 to 19 Minutes | 122 | 3.5% |
| 20 to 24 Minutes | 60 | 1.7% |
| 25 to 29 Minutes | 49 | 1.4% |
| 30 to 34 Minutes | 165 | 4.7% |
| 35 to 39 Minutes | 34 | 1.0% |
| 40 to 44 Minutes | 127 | 3.6% |
| 45 to 59 Minutes | 115 | 3.3% |
| 60 to 89 Minutes | 107 | 3.1% |
| 90 or more Minutes | 58 | 1.7% |
Commute Time by Sex in Clinton
The most common commute times in Clinton are 10 to 14 minutes (672 commuters, 36.3%) for males and 5 to 9 minutes (738 commuters, 45.4%) for females.
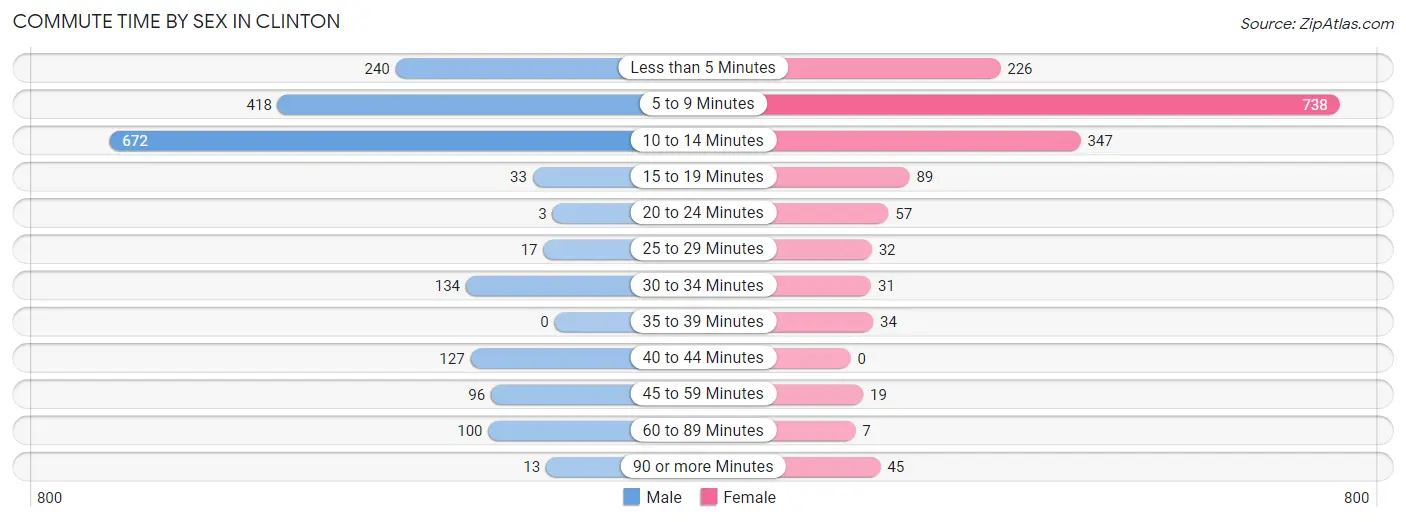
| Commute Time | Male | Female |
| Less than 5 Minutes | 240 (13.0%) | 226 (13.9%) |
| 5 to 9 Minutes | 418 (22.6%) | 738 (45.4%) |
| 10 to 14 Minutes | 672 (36.3%) | 347 (21.3%) |
| 15 to 19 Minutes | 33 (1.8%) | 89 (5.5%) |
| 20 to 24 Minutes | 3 (0.2%) | 57 (3.5%) |
| 25 to 29 Minutes | 17 (0.9%) | 32 (2.0%) |
| 30 to 34 Minutes | 134 (7.2%) | 31 (1.9%) |
| 35 to 39 Minutes | 0 (0.0%) | 34 (2.1%) |
| 40 to 44 Minutes | 127 (6.9%) | 0 (0.0%) |
| 45 to 59 Minutes | 96 (5.2%) | 19 (1.2%) |
| 60 to 89 Minutes | 100 (5.4%) | 7 (0.4%) |
| 90 or more Minutes | 13 (0.7%) | 45 (2.8%) |
Time of Departure to Work by Sex in Clinton
The most frequent times of departure to work in Clinton are 7:30 AM to 7:59 AM (467, 25.2%) for males and 7:00 AM to 7:29 AM (237, 14.6%) for females.
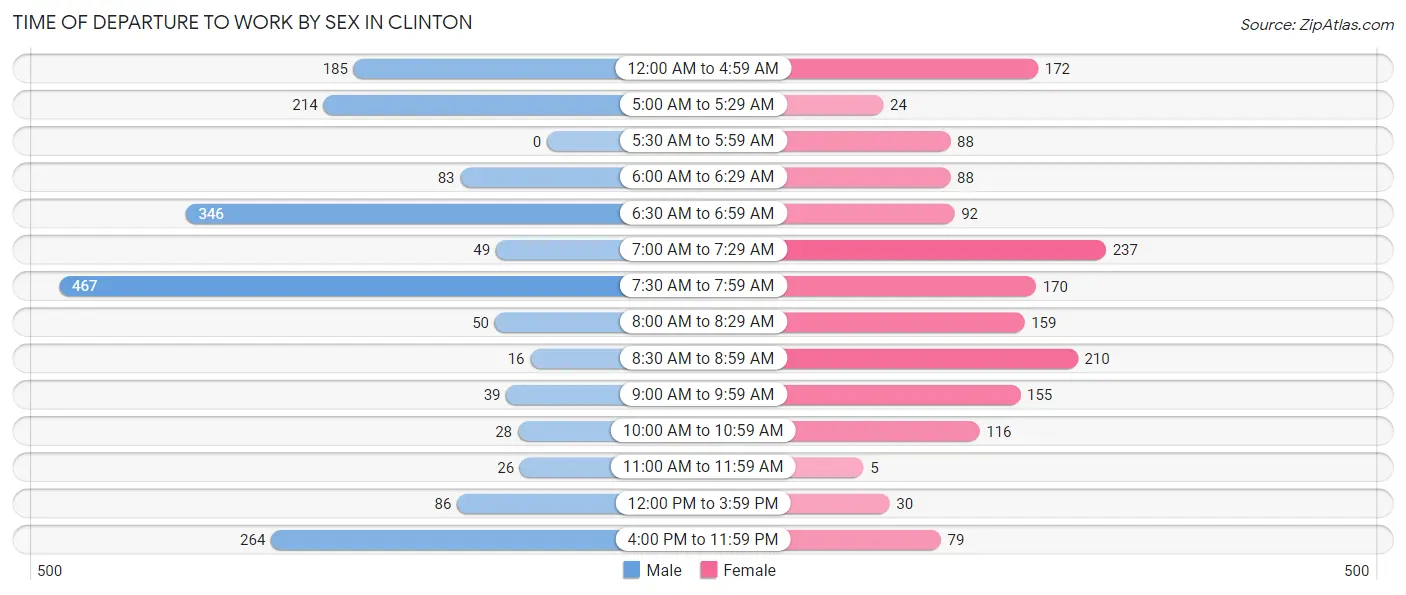
| Time of Departure | Male | Female |
| 12:00 AM to 4:59 AM | 185 (10.0%) | 172 (10.6%) |
| 5:00 AM to 5:29 AM | 214 (11.6%) | 24 (1.5%) |
| 5:30 AM to 5:59 AM | 0 (0.0%) | 88 (5.4%) |
| 6:00 AM to 6:29 AM | 83 (4.5%) | 88 (5.4%) |
| 6:30 AM to 6:59 AM | 346 (18.7%) | 92 (5.7%) |
| 7:00 AM to 7:29 AM | 49 (2.6%) | 237 (14.6%) |
| 7:30 AM to 7:59 AM | 467 (25.2%) | 170 (10.5%) |
| 8:00 AM to 8:29 AM | 50 (2.7%) | 159 (9.8%) |
| 8:30 AM to 8:59 AM | 16 (0.9%) | 210 (12.9%) |
| 9:00 AM to 9:59 AM | 39 (2.1%) | 155 (9.5%) |
| 10:00 AM to 10:59 AM | 28 (1.5%) | 116 (7.1%) |
| 11:00 AM to 11:59 AM | 26 (1.4%) | 5 (0.3%) |
| 12:00 PM to 3:59 PM | 86 (4.6%) | 30 (1.8%) |
| 4:00 PM to 11:59 PM | 264 (14.2%) | 79 (4.9%) |
| Total | 1,853 (100.0%) | 1,625 (100.0%) |
Housing Occupancy in Clinton
Occupancy by Ownership in Clinton
Of the total 3,910 dwellings in Clinton, owner-occupied units account for 2,354 (60.2%), while renter-occupied units make up 1,556 (39.8%).
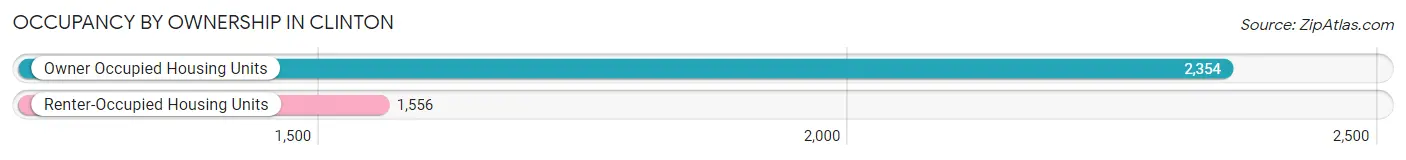
| Occupancy | # Housing Units | % Housing Units |
| Owner Occupied Housing Units | 2,354 | 60.2% |
| Renter-Occupied Housing Units | 1,556 | 39.8% |
| Total Occupied Housing Units | 3,910 | 100.0% |
Occupancy by Household Size in Clinton
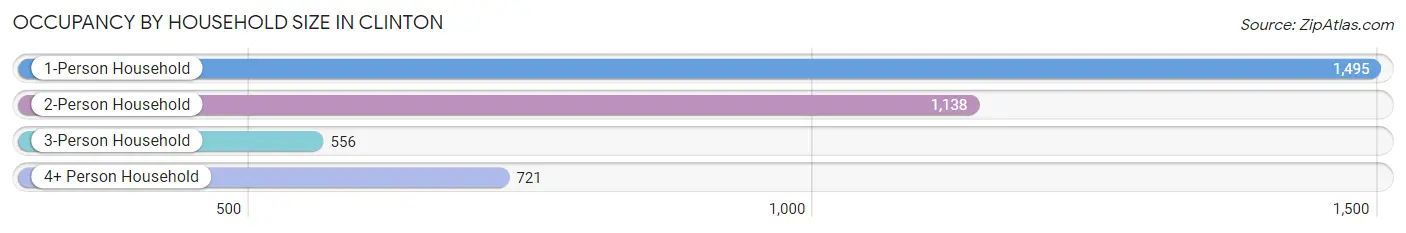
| Household Size | # Housing Units | % Housing Units |
| 1-Person Household | 1,495 | 38.2% |
| 2-Person Household | 1,138 | 29.1% |
| 3-Person Household | 556 | 14.2% |
| 4+ Person Household | 721 | 18.4% |
| Total Housing Units | 3,910 | 100.0% |
Occupancy by Ownership by Household Size in Clinton
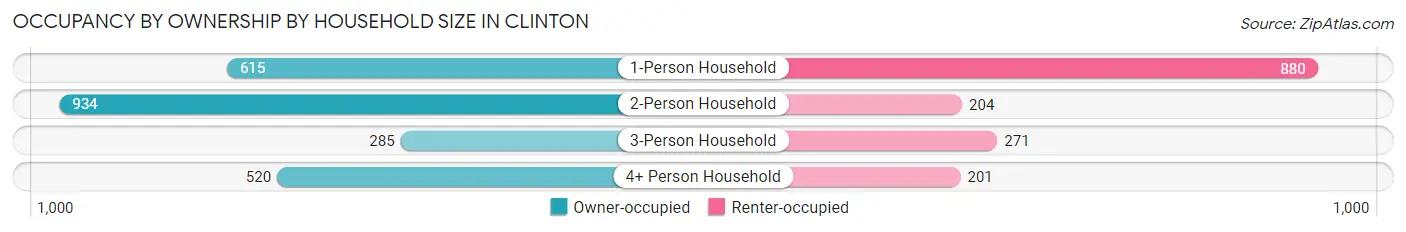
| Household Size | Owner-occupied | Renter-occupied |
| 1-Person Household | 615 (41.1%) | 880 (58.9%) |
| 2-Person Household | 934 (82.1%) | 204 (17.9%) |
| 3-Person Household | 285 (51.3%) | 271 (48.7%) |
| 4+ Person Household | 520 (72.1%) | 201 (27.9%) |
| Total Housing Units | 2,354 (60.2%) | 1,556 (39.8%) |
Occupancy by Educational Attainment in Clinton
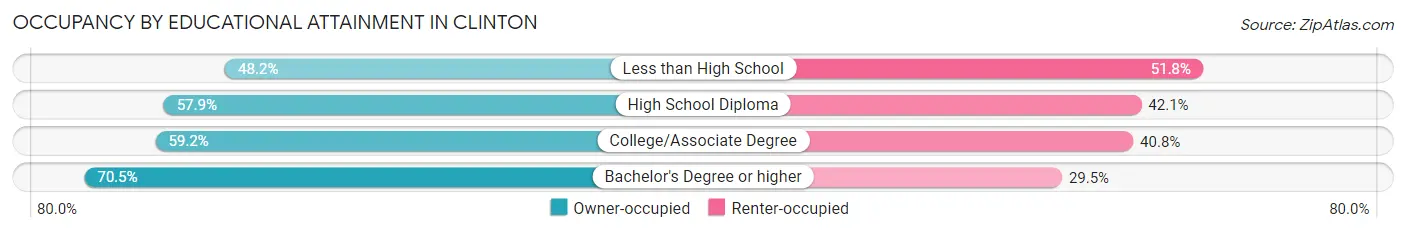
| Household Size | Owner-occupied | Renter-occupied |
| Less than High School | 133 (48.2%) | 143 (51.8%) |
| High School Diploma | 862 (57.9%) | 626 (42.1%) |
| College/Associate Degree | 811 (59.2%) | 558 (40.8%) |
| Bachelor's Degree or higher | 548 (70.5%) | 229 (29.5%) |
Occupancy by Age of Householder in Clinton
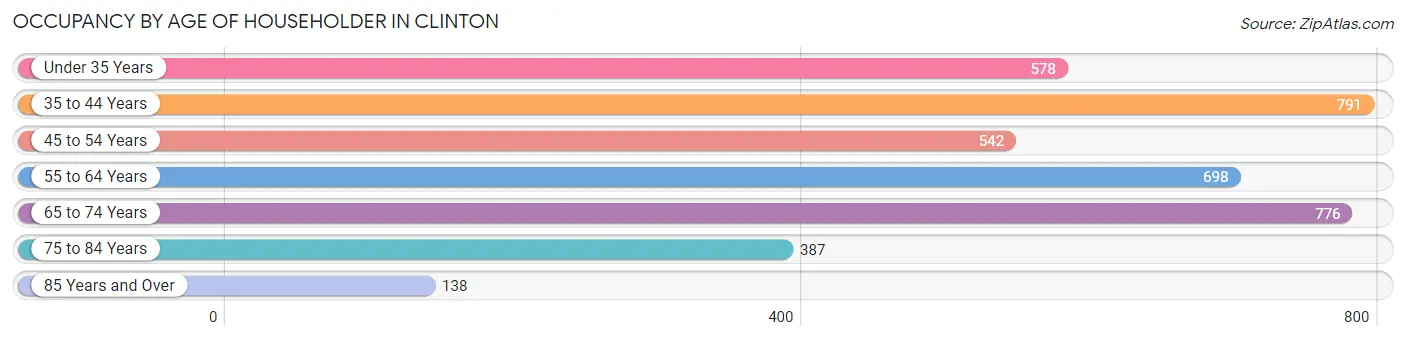
| Age Bracket | # Households | % Households |
| Under 35 Years | 578 | 14.8% |
| 35 to 44 Years | 791 | 20.2% |
| 45 to 54 Years | 542 | 13.9% |
| 55 to 64 Years | 698 | 17.8% |
| 65 to 74 Years | 776 | 19.9% |
| 75 to 84 Years | 387 | 9.9% |
| 85 Years and Over | 138 | 3.5% |
| Total | 3,910 | 100.0% |
Housing Finances in Clinton
Median Income by Occupancy in Clinton
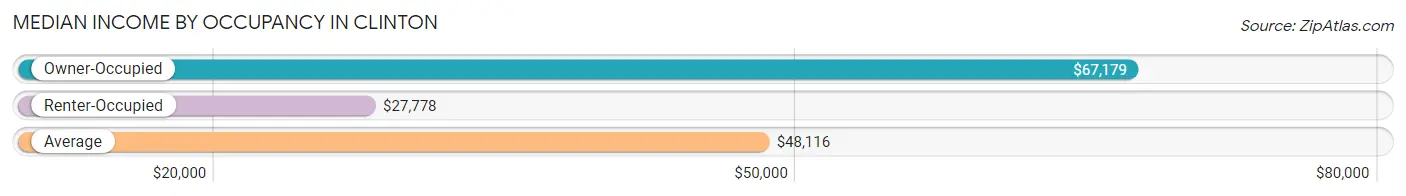
| Occupancy Type | # Households | Median Income |
| Owner-Occupied | 2,354 (60.2%) | $67,179 |
| Renter-Occupied | 1,556 (39.8%) | $27,778 |
| Average | 3,910 (100.0%) | $48,116 |
Occupancy by Householder Income Bracket in Clinton
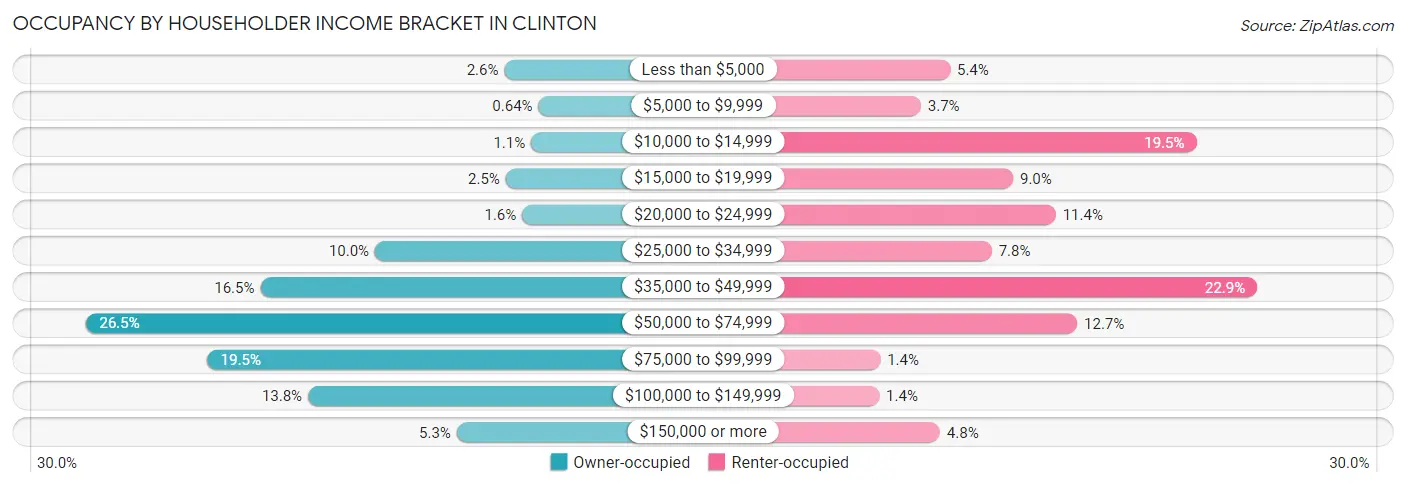
| Income Bracket | Owner-occupied | Renter-occupied |
| Less than $5,000 | 61 (2.6%) | 84 (5.4%) |
| $5,000 to $9,999 | 15 (0.6%) | 58 (3.7%) |
| $10,000 to $14,999 | 25 (1.1%) | 303 (19.5%) |
| $15,000 to $19,999 | 59 (2.5%) | 140 (9.0%) |
| $20,000 to $24,999 | 37 (1.6%) | 178 (11.4%) |
| $25,000 to $34,999 | 235 (10.0%) | 121 (7.8%) |
| $35,000 to $49,999 | 389 (16.5%) | 357 (22.9%) |
| $50,000 to $74,999 | 623 (26.5%) | 197 (12.7%) |
| $75,000 to $99,999 | 460 (19.5%) | 22 (1.4%) |
| $100,000 to $149,999 | 325 (13.8%) | 21 (1.3%) |
| $150,000 or more | 125 (5.3%) | 75 (4.8%) |
| Total | 2,354 (100.0%) | 1,556 (100.0%) |
Monthly Housing Cost Tiers in Clinton
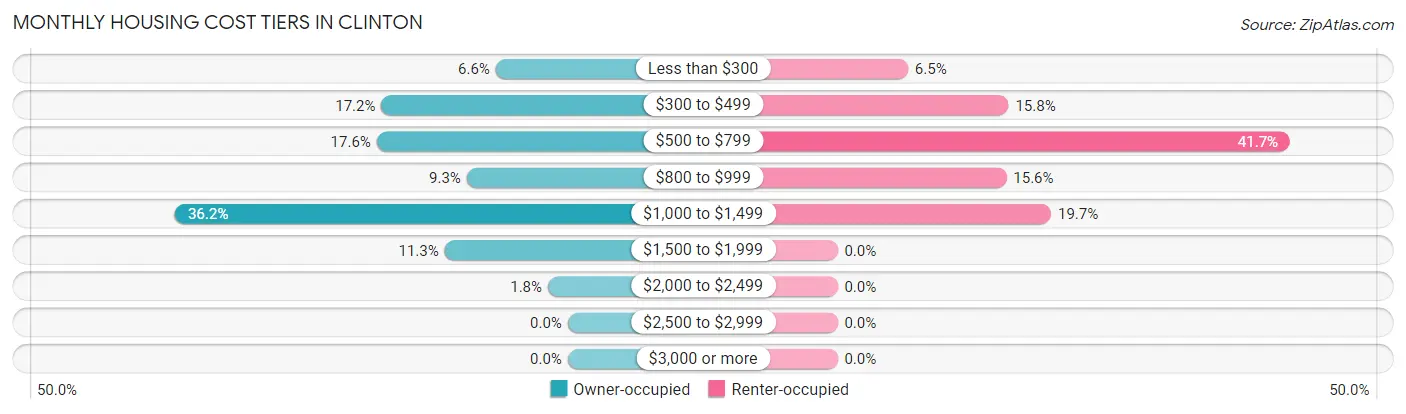
| Monthly Cost | Owner-occupied | Renter-occupied |
| Less than $300 | 156 (6.6%) | 101 (6.5%) |
| $300 to $499 | 404 (17.2%) | 245 (15.8%) |
| $500 to $799 | 414 (17.6%) | 648 (41.6%) |
| $800 to $999 | 219 (9.3%) | 242 (15.5%) |
| $1,000 to $1,499 | 851 (36.1%) | 306 (19.7%) |
| $1,500 to $1,999 | 267 (11.3%) | 0 (0.0%) |
| $2,000 to $2,499 | 43 (1.8%) | 0 (0.0%) |
| $2,500 to $2,999 | 0 (0.0%) | 0 (0.0%) |
| $3,000 or more | 0 (0.0%) | 0 (0.0%) |
| Total | 2,354 (100.0%) | 1,556 (100.0%) |
Physical Housing Characteristics in Clinton
Housing Structures in Clinton
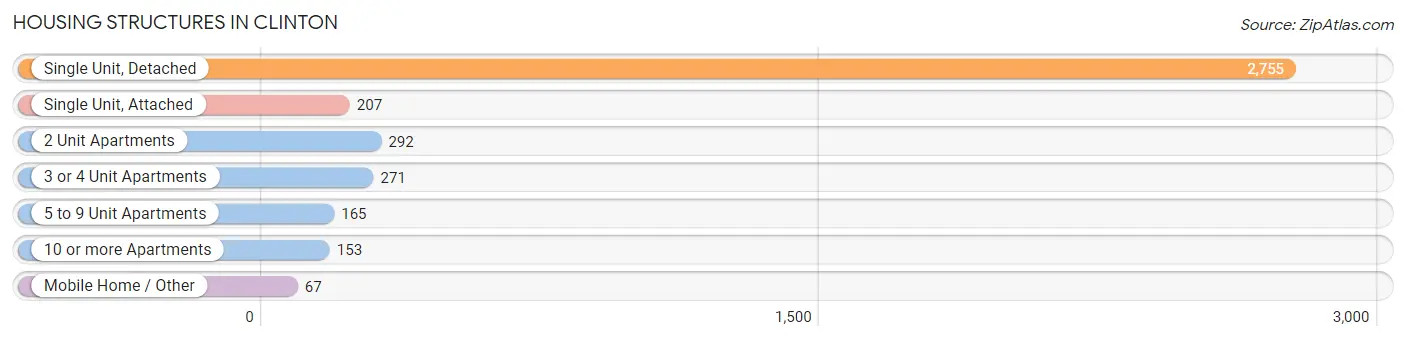
| Structure Type | # Housing Units | % Housing Units |
| Single Unit, Detached | 2,755 | 70.5% |
| Single Unit, Attached | 207 | 5.3% |
| 2 Unit Apartments | 292 | 7.5% |
| 3 or 4 Unit Apartments | 271 | 6.9% |
| 5 to 9 Unit Apartments | 165 | 4.2% |
| 10 or more Apartments | 153 | 3.9% |
| Mobile Home / Other | 67 | 1.7% |
| Total | 3,910 | 100.0% |
Housing Structures by Occupancy in Clinton
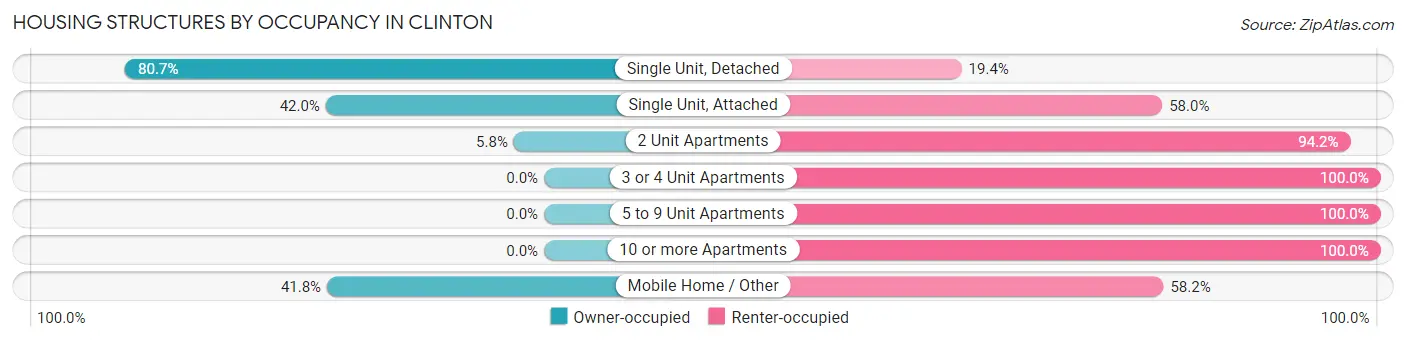
| Structure Type | Owner-occupied | Renter-occupied |
| Single Unit, Detached | 2,222 (80.6%) | 533 (19.4%) |
| Single Unit, Attached | 87 (42.0%) | 120 (58.0%) |
| 2 Unit Apartments | 17 (5.8%) | 275 (94.2%) |
| 3 or 4 Unit Apartments | 0 (0.0%) | 271 (100.0%) |
| 5 to 9 Unit Apartments | 0 (0.0%) | 165 (100.0%) |
| 10 or more Apartments | 0 (0.0%) | 153 (100.0%) |
| Mobile Home / Other | 28 (41.8%) | 39 (58.2%) |
| Total | 2,354 (60.2%) | 1,556 (39.8%) |
Housing Structures by Number of Rooms in Clinton
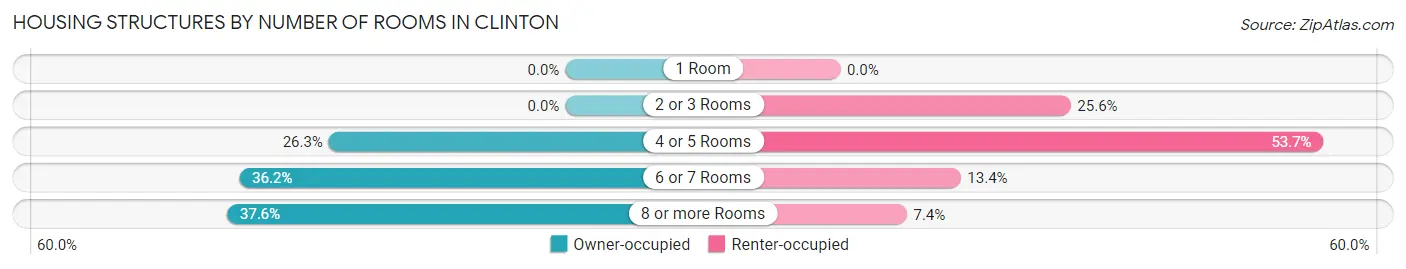
| Number of Rooms | Owner-occupied | Renter-occupied |
| 1 Room | 0 (0.0%) | 0 (0.0%) |
| 2 or 3 Rooms | 0 (0.0%) | 398 (25.6%) |
| 4 or 5 Rooms | 618 (26.3%) | 835 (53.7%) |
| 6 or 7 Rooms | 852 (36.2%) | 208 (13.4%) |
| 8 or more Rooms | 884 (37.6%) | 115 (7.4%) |
| Total | 2,354 (100.0%) | 1,556 (100.0%) |
Housing Structure by Heating Type in Clinton
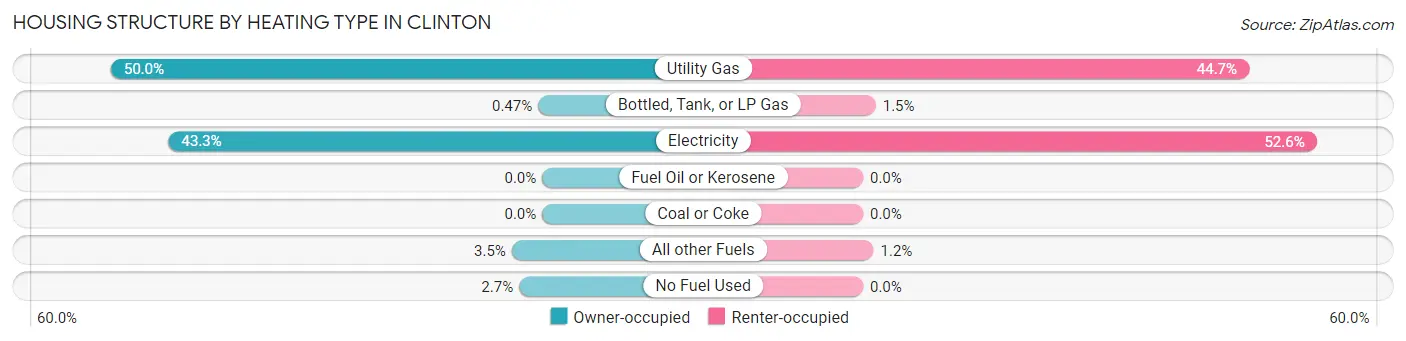
| Heating Type | Owner-occupied | Renter-occupied |
| Utility Gas | 1,177 (50.0%) | 696 (44.7%) |
| Bottled, Tank, or LP Gas | 11 (0.5%) | 23 (1.5%) |
| Electricity | 1,020 (43.3%) | 818 (52.6%) |
| Fuel Oil or Kerosene | 0 (0.0%) | 0 (0.0%) |
| Coal or Coke | 0 (0.0%) | 0 (0.0%) |
| All other Fuels | 83 (3.5%) | 19 (1.2%) |
| No Fuel Used | 63 (2.7%) | 0 (0.0%) |
| Total | 2,354 (100.0%) | 1,556 (100.0%) |
Household Vehicle Usage in Clinton
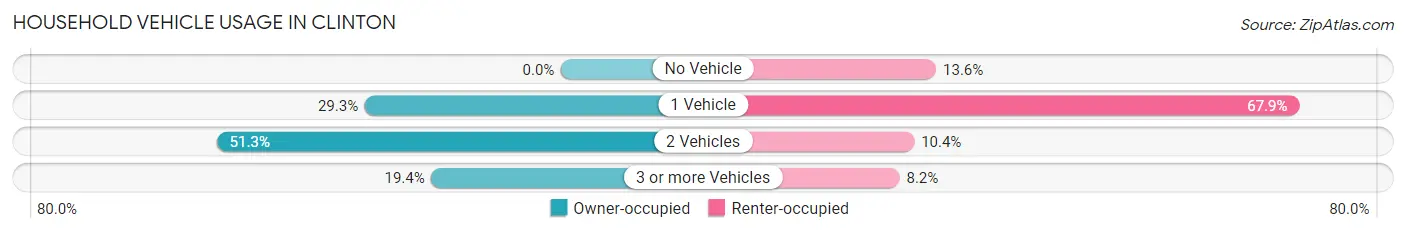
| Vehicles per Household | Owner-occupied | Renter-occupied |
| No Vehicle | 0 (0.0%) | 212 (13.6%) |
| 1 Vehicle | 690 (29.3%) | 1,056 (67.9%) |
| 2 Vehicles | 1,208 (51.3%) | 161 (10.3%) |
| 3 or more Vehicles | 456 (19.4%) | 127 (8.2%) |
| Total | 2,354 (100.0%) | 1,556 (100.0%) |
Real Estate & Mortgages in Clinton
Real Estate and Mortgage Overview in Clinton
| Characteristic | Without Mortgage | With Mortgage |
| Housing Units | 902 | 1,452 |
| Median Property Value | $160,900 | $150,100 |
| Median Household Income | $45,179 | $83 |
| Monthly Housing Costs | $460 | $0 |
| Real Estate Taxes | $1,256 | $65 |
Property Value by Mortgage Status in Clinton
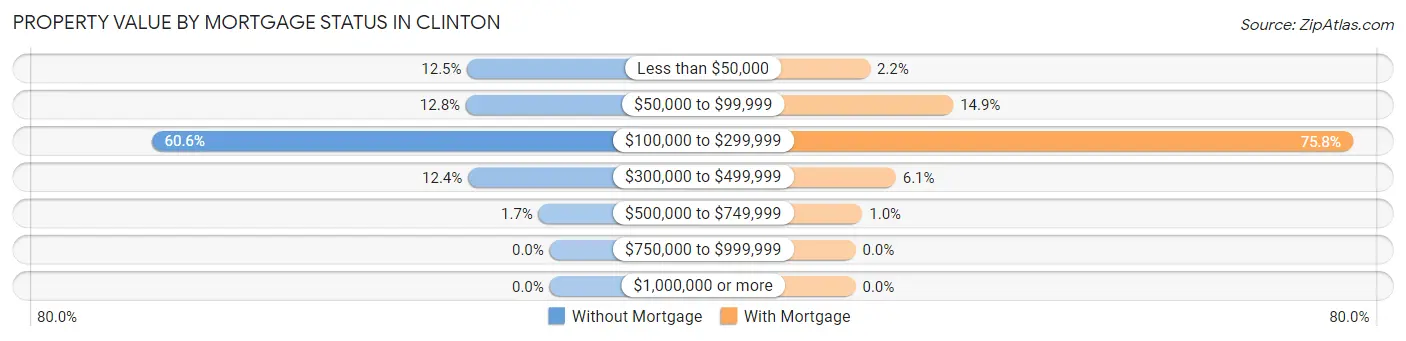
| Property Value | Without Mortgage | With Mortgage |
| Less than $50,000 | 113 (12.5%) | 32 (2.2%) |
| $50,000 to $99,999 | 115 (12.8%) | 216 (14.9%) |
| $100,000 to $299,999 | 547 (60.6%) | 1,100 (75.8%) |
| $300,000 to $499,999 | 112 (12.4%) | 89 (6.1%) |
| $500,000 to $749,999 | 15 (1.7%) | 15 (1.0%) |
| $750,000 to $999,999 | 0 (0.0%) | 0 (0.0%) |
| $1,000,000 or more | 0 (0.0%) | 0 (0.0%) |
| Total | 902 (100.0%) | 1,452 (100.0%) |
Household Income by Mortgage Status in Clinton
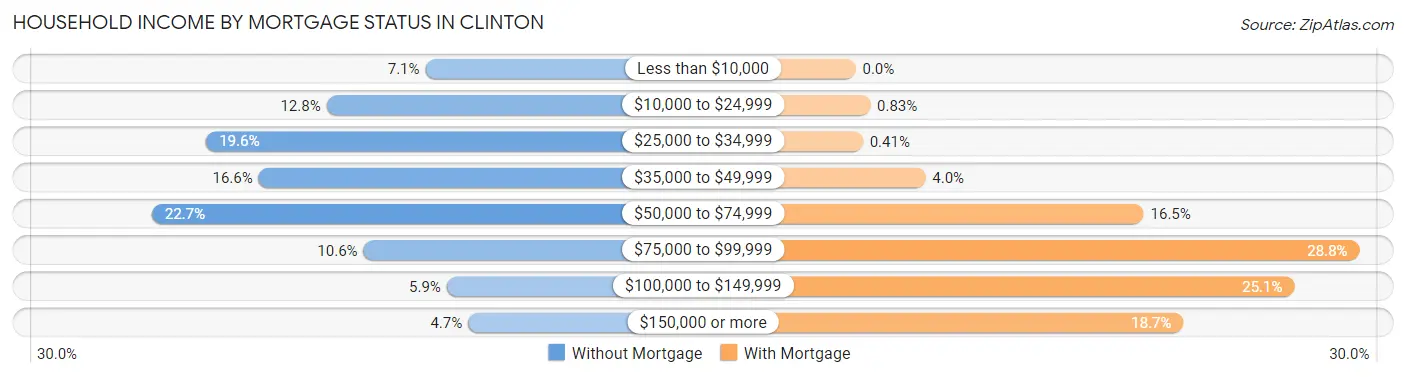
| Household Income | Without Mortgage | With Mortgage |
| Less than $10,000 | 64 (7.1%) | 0 (0.0%) |
| $10,000 to $24,999 | 115 (12.8%) | 12 (0.8%) |
| $25,000 to $34,999 | 177 (19.6%) | 6 (0.4%) |
| $35,000 to $49,999 | 150 (16.6%) | 58 (4.0%) |
| $50,000 to $74,999 | 205 (22.7%) | 239 (16.5%) |
| $75,000 to $99,999 | 96 (10.6%) | 418 (28.8%) |
| $100,000 to $149,999 | 53 (5.9%) | 364 (25.1%) |
| $150,000 or more | 42 (4.7%) | 272 (18.7%) |
| Total | 902 (100.0%) | 1,452 (100.0%) |
Property Value to Household Income Ratio in Clinton
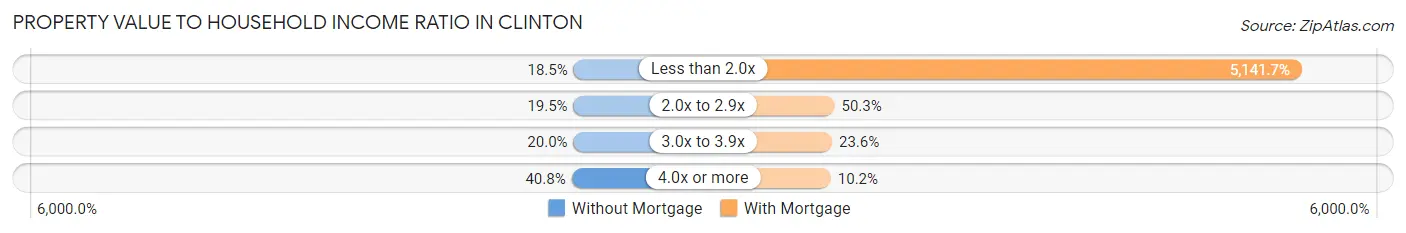
| Value-to-Income Ratio | Without Mortgage | With Mortgage |
| Less than 2.0x | 167 (18.5%) | 74,657 (5,141.7%) |
| 2.0x to 2.9x | 176 (19.5%) | 731 (50.3%) |
| 3.0x to 3.9x | 180 (20.0%) | 343 (23.6%) |
| 4.0x or more | 368 (40.8%) | 148 (10.2%) |
| Total | 902 (100.0%) | 1,452 (100.0%) |
Real Estate Taxes by Mortgage Status in Clinton
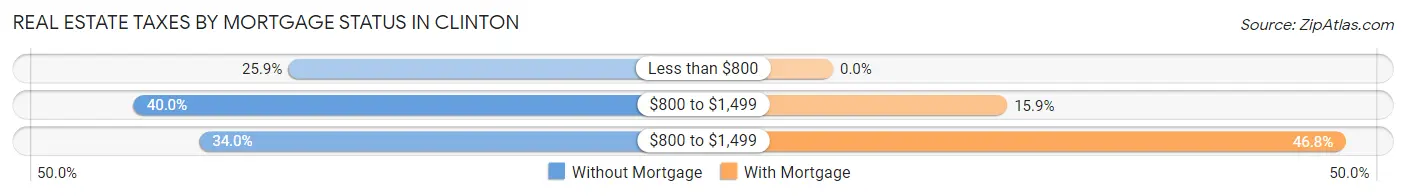
| Property Taxes | Without Mortgage | With Mortgage |
| Less than $800 | 234 (25.9%) | 0 (0.0%) |
| $800 to $1,499 | 361 (40.0%) | 231 (15.9%) |
| $800 to $1,499 | 307 (34.0%) | 679 (46.8%) |
| Total | 902 (100.0%) | 1,452 (100.0%) |
Health & Disability in Clinton
Health Insurance Coverage by Age in Clinton
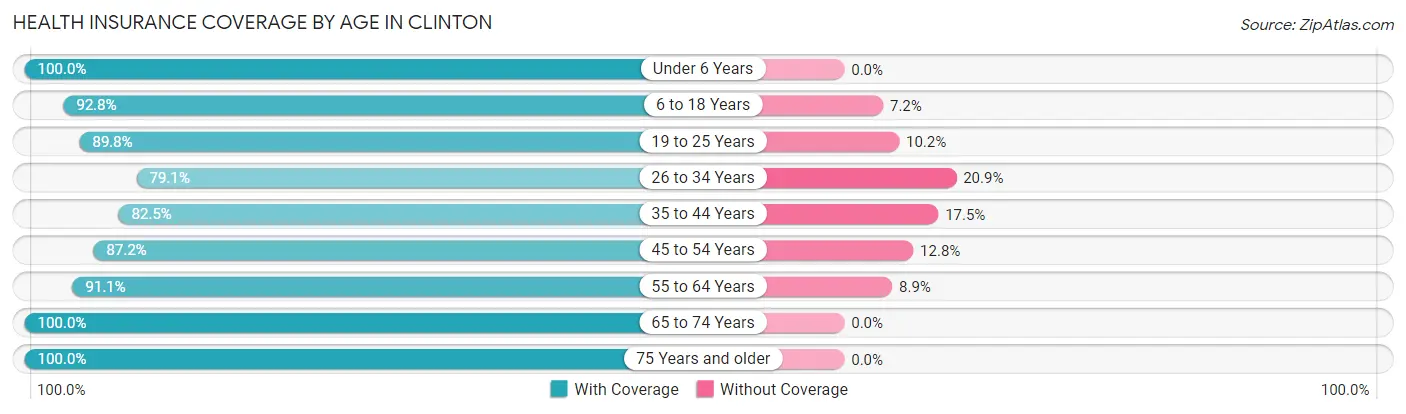
| Age Bracket | With Coverage | Without Coverage |
| Under 6 Years | 734 (100.0%) | 0 (0.0%) |
| 6 to 18 Years | 1,221 (92.8%) | 95 (7.2%) |
| 19 to 25 Years | 510 (89.8%) | 58 (10.2%) |
| 26 to 34 Years | 804 (79.1%) | 212 (20.9%) |
| 35 to 44 Years | 942 (82.5%) | 200 (17.5%) |
| 45 to 54 Years | 747 (87.2%) | 110 (12.8%) |
| 55 to 64 Years | 1,114 (91.1%) | 109 (8.9%) |
| 65 to 74 Years | 1,187 (100.0%) | 0 (0.0%) |
| 75 Years and older | 687 (100.0%) | 0 (0.0%) |
| Total | 7,946 (91.0%) | 784 (9.0%) |
Health Insurance Coverage by Citizenship Status in Clinton
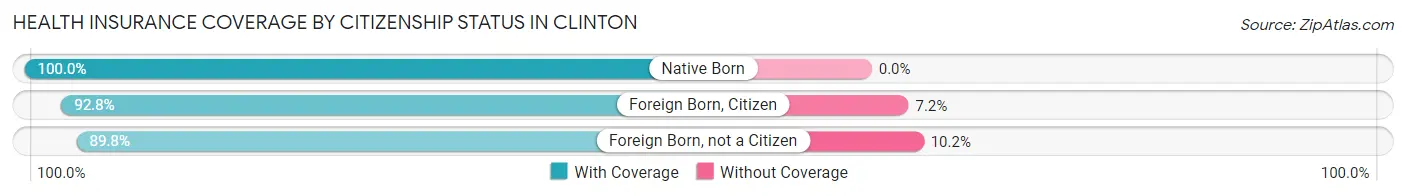
| Citizenship Status | With Coverage | Without Coverage |
| Native Born | 734 (100.0%) | 0 (0.0%) |
| Foreign Born, Citizen | 1,221 (92.8%) | 95 (7.2%) |
| Foreign Born, not a Citizen | 510 (89.8%) | 58 (10.2%) |
Health Insurance Coverage by Household Income in Clinton
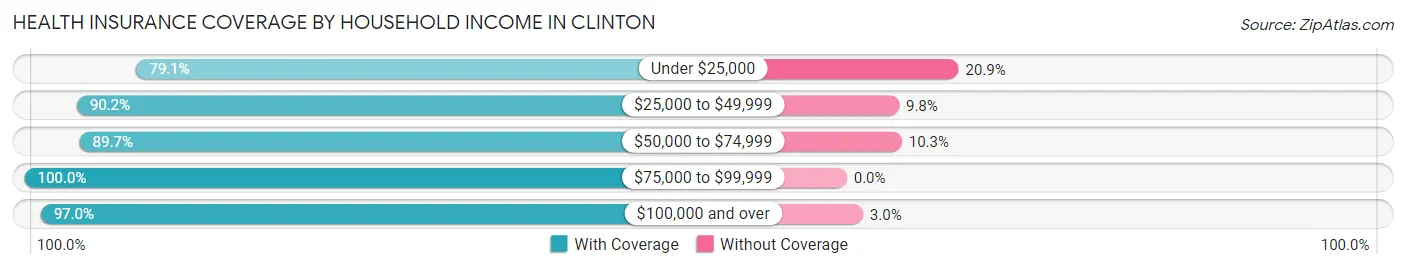
| Household Income | With Coverage | Without Coverage |
| Under $25,000 | 959 (79.1%) | 254 (20.9%) |
| $25,000 to $49,999 | 2,341 (90.2%) | 254 (9.8%) |
| $50,000 to $74,999 | 1,835 (89.7%) | 211 (10.3%) |
| $75,000 to $99,999 | 1,159 (100.0%) | 0 (0.0%) |
| $100,000 and over | 1,607 (97.0%) | 50 (3.0%) |
Public vs Private Health Insurance Coverage by Age in Clinton
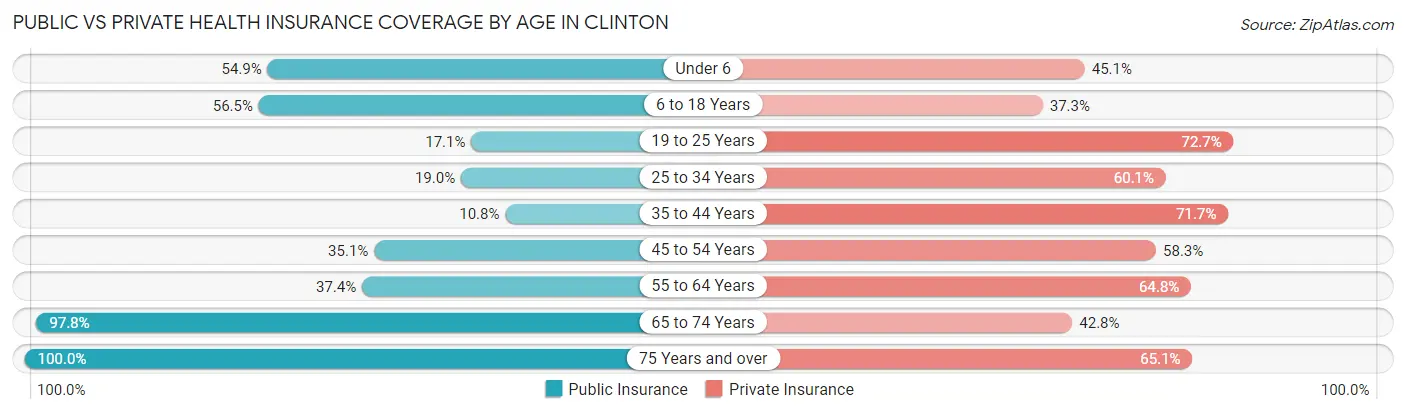
| Age Bracket | Public Insurance | Private Insurance |
| Under 6 | 403 (54.9%) | 331 (45.1%) |
| 6 to 18 Years | 744 (56.5%) | 491 (37.3%) |
| 19 to 25 Years | 97 (17.1%) | 413 (72.7%) |
| 25 to 34 Years | 193 (19.0%) | 611 (60.1%) |
| 35 to 44 Years | 123 (10.8%) | 819 (71.7%) |
| 45 to 54 Years | 301 (35.1%) | 500 (58.3%) |
| 55 to 64 Years | 457 (37.4%) | 793 (64.8%) |
| 65 to 74 Years | 1,161 (97.8%) | 508 (42.8%) |
| 75 Years and over | 687 (100.0%) | 447 (65.1%) |
| Total | 4,166 (47.7%) | 4,913 (56.3%) |
Disability Status by Sex by Age in Clinton
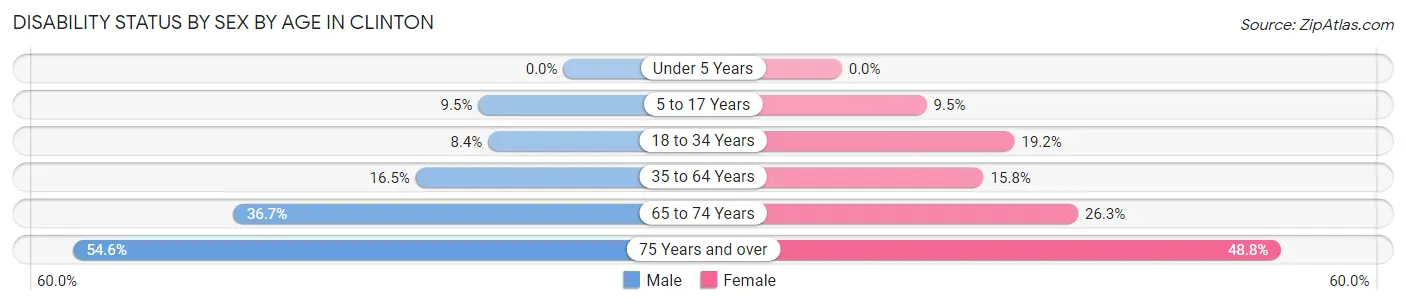
| Age Bracket | Male | Female |
| Under 5 Years | 0 (0.0%) | 0 (0.0%) |
| 5 to 17 Years | 56 (9.5%) | 64 (9.5%) |
| 18 to 34 Years | 72 (8.4%) | 172 (19.2%) |
| 35 to 64 Years | 251 (16.5%) | 268 (15.8%) |
| 65 to 74 Years | 193 (36.7%) | 174 (26.3%) |
| 75 Years and over | 120 (54.5%) | 228 (48.8%) |
Disability Class by Sex by Age in Clinton
Disability Class: Hearing Difficulty
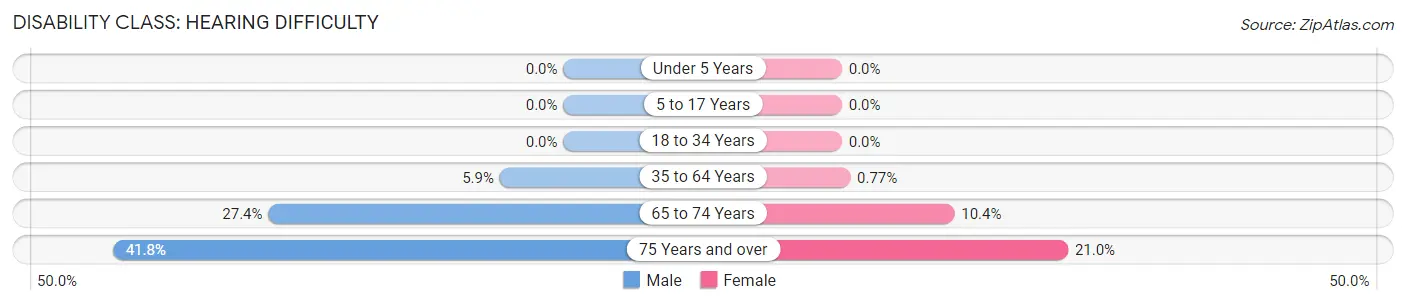
| Age Bracket | Male | Female |
| Under 5 Years | 0 (0.0%) | 0 (0.0%) |
| 5 to 17 Years | 0 (0.0%) | 0 (0.0%) |
| 18 to 34 Years | 0 (0.0%) | 0 (0.0%) |
| 35 to 64 Years | 90 (5.9%) | 13 (0.8%) |
| 65 to 74 Years | 144 (27.4%) | 69 (10.4%) |
| 75 Years and over | 92 (41.8%) | 98 (21.0%) |
Disability Class: Vision Difficulty
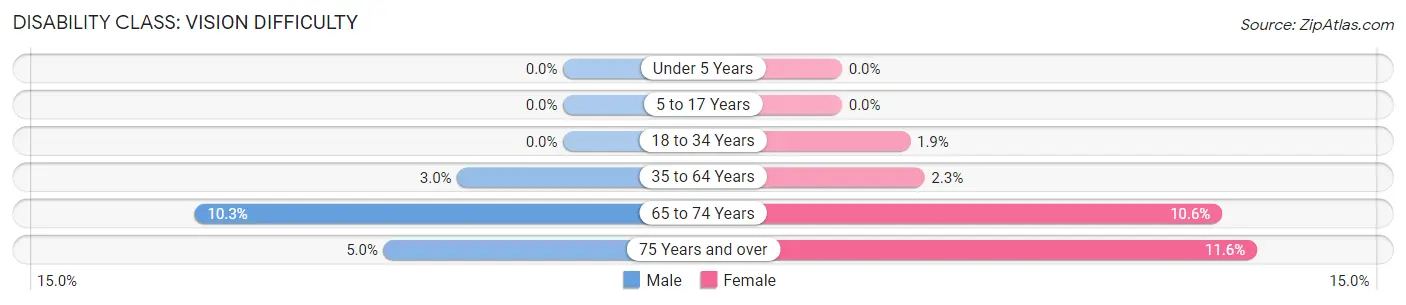
| Age Bracket | Male | Female |
| Under 5 Years | 0 (0.0%) | 0 (0.0%) |
| 5 to 17 Years | 0 (0.0%) | 0 (0.0%) |
| 18 to 34 Years | 0 (0.0%) | 17 (1.9%) |
| 35 to 64 Years | 45 (2.9%) | 39 (2.3%) |
| 65 to 74 Years | 54 (10.3%) | 70 (10.6%) |
| 75 Years and over | 11 (5.0%) | 54 (11.6%) |
Disability Class: Cognitive Difficulty
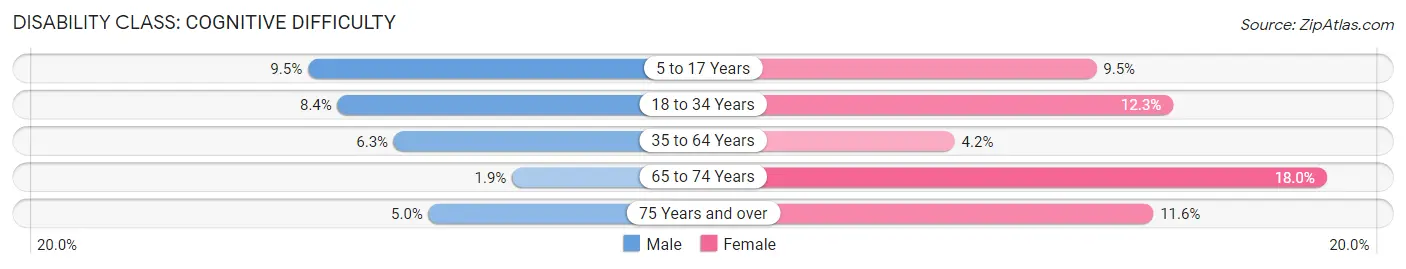
| Age Bracket | Male | Female |
| 5 to 17 Years | 56 (9.5%) | 64 (9.5%) |
| 18 to 34 Years | 72 (8.4%) | 110 (12.3%) |
| 35 to 64 Years | 96 (6.3%) | 71 (4.2%) |
| 65 to 74 Years | 10 (1.9%) | 119 (18.0%) |
| 75 Years and over | 11 (5.0%) | 54 (11.6%) |
Disability Class: Ambulatory Difficulty
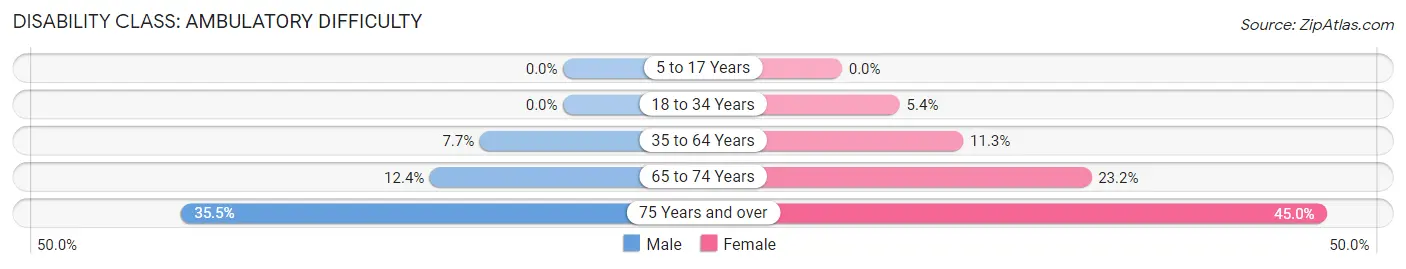
| Age Bracket | Male | Female |
| 5 to 17 Years | 0 (0.0%) | 0 (0.0%) |
| 18 to 34 Years | 0 (0.0%) | 48 (5.4%) |
| 35 to 64 Years | 118 (7.7%) | 191 (11.3%) |
| 65 to 74 Years | 65 (12.4%) | 153 (23.2%) |
| 75 Years and over | 78 (35.4%) | 210 (45.0%) |
Disability Class: Self-Care Difficulty
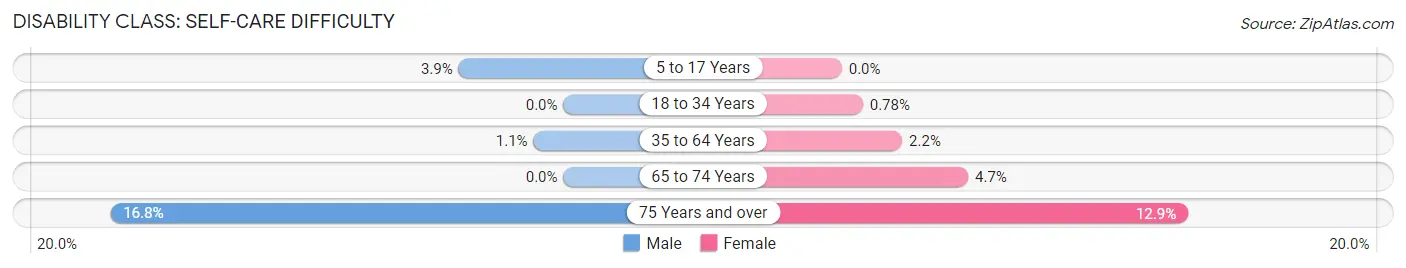
| Age Bracket | Male | Female |
| 5 to 17 Years | 23 (3.9%) | 0 (0.0%) |
| 18 to 34 Years | 0 (0.0%) | 7 (0.8%) |
| 35 to 64 Years | 17 (1.1%) | 38 (2.2%) |
| 65 to 74 Years | 0 (0.0%) | 31 (4.7%) |
| 75 Years and over | 37 (16.8%) | 60 (12.9%) |
Technology Access in Clinton
Computing Device Access in Clinton
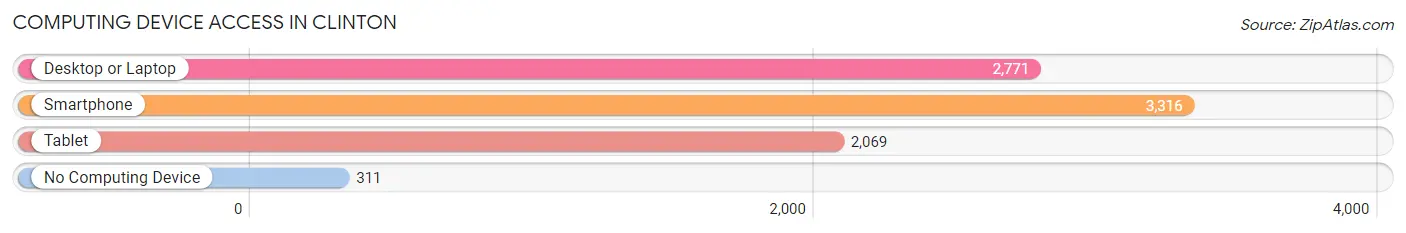
| Device Type | # Households | % Households |
| Desktop or Laptop | 2,771 | 70.9% |
| Smartphone | 3,316 | 84.8% |
| Tablet | 2,069 | 52.9% |
| No Computing Device | 311 | 8.0% |
| Total | 3,910 | 100.0% |
Internet Access in Clinton
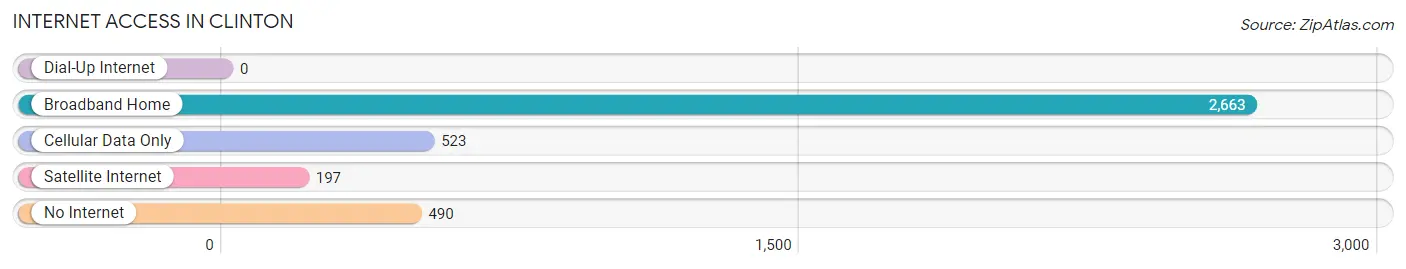
| Internet Type | # Households | % Households |
| Dial-Up Internet | 0 | 0.0% |
| Broadband Home | 2,663 | 68.1% |
| Cellular Data Only | 523 | 13.4% |
| Satellite Internet | 197 | 5.0% |
| No Internet | 490 | 12.5% |
| Total | 3,910 | 100.0% |
Clinton Summary
Clinton, Missouri is a small city located in Henry County in the western part of the state. It is situated along the Missouri River, approximately 40 miles east of Kansas City. The city has a population of 8,876 as of the 2020 census, making it the largest city in Henry County.
History
The area that is now Clinton was first settled in 1829 by a group of settlers from Kentucky. The town was originally known as Chilhowee, but was later renamed Clinton in honor of DeWitt Clinton, the former governor of New York. The town was officially incorporated in 1855.
During the Civil War, Clinton was a major supply center for the Union Army. The town was also the site of a major battle in 1862, when Confederate forces attempted to capture the city. The Union forces were able to repel the attack and the city remained in Union hands for the remainder of the war.
In the late 19th century, Clinton became an important railroad hub, with several lines running through the city. This allowed the city to become an important center for commerce and industry. The city also became a popular tourist destination, with several hotels and resorts being built in the area.
Geography
Clinton is located in western Missouri, in Henry County. The city is situated along the Missouri River, approximately 40 miles east of Kansas City. The city has a total area of 8.3 square miles, all of which is land.
The climate in Clinton is humid continental, with hot, humid summers and cold, dry winters. The average annual temperature is 54 degrees Fahrenheit, with an average high of 79 degrees in the summer and an average low of 28 degrees in the winter.
Economy
The economy of Clinton is largely based on agriculture and manufacturing. The city is home to several large agricultural companies, including Tyson Foods, Cargill, and Smithfield Foods. The city is also home to several manufacturing companies, including a large automotive parts plant operated by General Motors.
The city also has a growing tourism industry, with several hotels and resorts located in the area. The city is also home to several museums, including the Clinton County Historical Museum and the Henry County Museum.
Demographics
As of the 2020 census, Clinton had a population of 8,876. The racial makeup of the city was 87.3% White, 8.2% African American, 0.7% Native American, 0.6% Asian, 0.1% Pacific Islander, and 2.1% from other races. Hispanic or Latino of any race were 2.7% of the population.
The median household income in Clinton was $41,945, and the median family income was $50,945. The per capita income was $20,945. About 15.3% of the population was below the poverty line.
Common Questions
What is Per Capita Income in Clinton?
Per Capita income in Clinton is $27,433.
What is the Median Family Income in Clinton?
Median Family Income in Clinton is $59,711.
What is the Median Household income in Clinton?
Median Household Income in Clinton is $48,116.
What is Income or Wage Gap in Clinton?
Income or Wage Gap in Clinton is 18.5%.
Women in Clinton earn 81.5 cents for every dollar earned by a man.
What is Inequality or Gini Index in Clinton?
Inequality or Gini Index in Clinton is 0.44.
What is the Total Population of Clinton?
Total Population of Clinton is 8,908.
What is the Total Male Population of Clinton?
Total Male Population of Clinton is 4,085.
What is the Total Female Population of Clinton?
Total Female Population of Clinton is 4,823.
What is the Ratio of Males per 100 Females in Clinton?
There are 84.70 Males per 100 Females in Clinton.
What is the Ratio of Females per 100 Males in Clinton?
There are 118.07 Females per 100 Males in Clinton.
What is the Median Population Age in Clinton?
Median Population Age in Clinton is 42.5 Years.
What is the Average Family Size in Clinton
Average Family Size in Clinton is 2.8 People.
What is the Average Household Size in Clinton
Average Household Size in Clinton is 2.2 People.
How Large is the Labor Force in Clinton?
There are 4,182 People in the Labor Forcein in Clinton.
What is the Percentage of People in the Labor Force in Clinton?
57.4% of People are in the Labor Force in Clinton.
What is the Unemployment Rate in Clinton?
Unemployment Rate in Clinton is 9.9%.