Fallon, NV Map & Demographics
Fallon Map
Fallon Overview
$34,811
PER CAPITA INCOME
$80,750
AVG FAMILY INCOME
$63,490
AVG HOUSEHOLD INCOME
34.7%
WAGE / INCOME GAP [ % ]
65.3¢/ $1
WAGE / INCOME GAP [ $ ]
0.38
INEQUALITY / GINI INDEX
9,243
TOTAL POPULATION
4,840
MALE POPULATION
4,403
FEMALE POPULATION
109.93
MALES / 100 FEMALES
90.97
FEMALES / 100 MALES
37.3
MEDIAN AGE
3.0
AVG FAMILY SIZE
2.2
AVG HOUSEHOLD SIZE
5,012
LABOR FORCE [ PEOPLE ]
67.8%
PERCENT IN LABOR FORCE
4.4%
UNEMPLOYMENT RATE
Fallon Area Codes
Income in Fallon
Income Overview in Fallon
Per Capita Income in Fallon is $34,811, while median incomes of families and households are $80,750 and $63,490 respectively.
| Characteristic | Number | Measure |
| Per Capita Income | 9,243 | $34,811 |
| Median Family Income | 1,991 | $80,750 |
| Mean Family Income | 1,991 | $92,688 |
| Median Household Income | 4,029 | $63,490 |
| Mean Household Income | 4,029 | $75,237 |
| Income Deficit | 1,991 | $0 |
| Wage / Income Gap (%) | 9,243 | 34.71% |
| Wage / Income Gap ($) | 9,243 | 65.29¢ per $1 |
| Gini / Inequality Index | 9,243 | 0.38 |
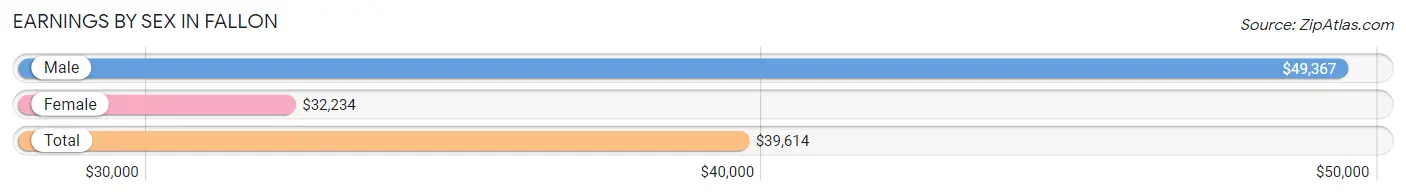
Earnings by Sex in Fallon
Average Earnings in Fallon are $39,614, $49,367 for men and $32,234 for women, a difference of 34.7%.
| Sex | Number | Average Earnings |
| Male | 2,943 (57.4%) | $49,367 |
| Female | 2,188 (42.6%) | $32,234 |
| Total | 5,131 (100.0%) | $39,614 |
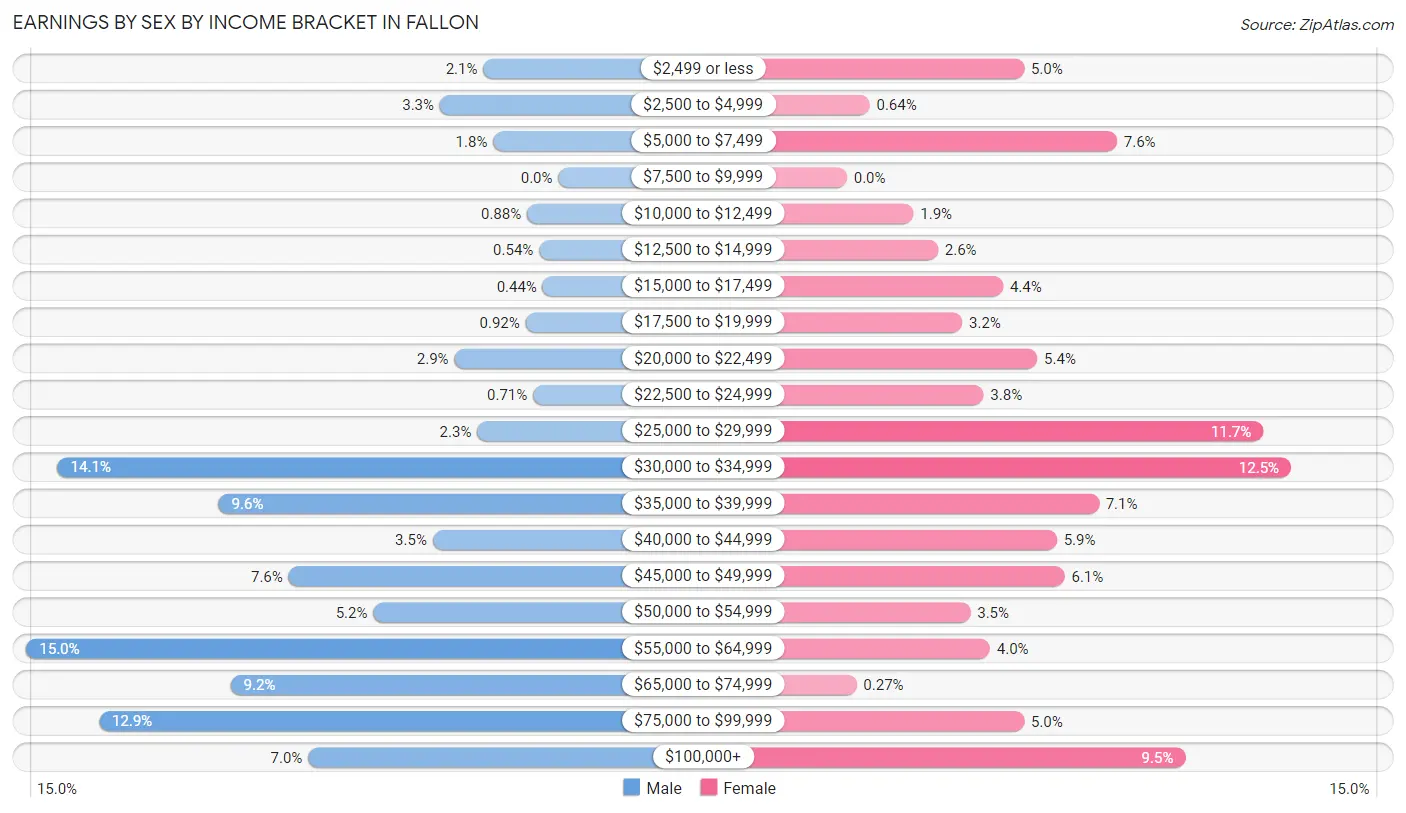
Earnings by Sex by Income Bracket in Fallon
The most common earnings brackets in Fallon are $55,000 to $64,999 for men (440 | 14.9%) and $30,000 to $34,999 for women (273 | 12.5%).
| Income | Male | Female |
| $2,499 or less | 62 (2.1%) | 109 (5.0%) |
| $2,500 to $4,999 | 98 (3.3%) | 14 (0.6%) |
| $5,000 to $7,499 | 54 (1.8%) | 166 (7.6%) |
| $7,500 to $9,999 | 0 (0.0%) | 0 (0.0%) |
| $10,000 to $12,499 | 26 (0.9%) | 41 (1.9%) |
| $12,500 to $14,999 | 16 (0.5%) | 56 (2.6%) |
| $15,000 to $17,499 | 13 (0.4%) | 96 (4.4%) |
| $17,500 to $19,999 | 27 (0.9%) | 71 (3.2%) |
| $20,000 to $22,499 | 86 (2.9%) | 117 (5.3%) |
| $22,500 to $24,999 | 21 (0.7%) | 84 (3.8%) |
| $25,000 to $29,999 | 67 (2.3%) | 256 (11.7%) |
| $30,000 to $34,999 | 414 (14.1%) | 273 (12.5%) |
| $35,000 to $39,999 | 281 (9.6%) | 155 (7.1%) |
| $40,000 to $44,999 | 104 (3.5%) | 129 (5.9%) |
| $45,000 to $49,999 | 223 (7.6%) | 134 (6.1%) |
| $50,000 to $54,999 | 153 (5.2%) | 76 (3.5%) |
| $55,000 to $64,999 | 440 (14.9%) | 88 (4.0%) |
| $65,000 to $74,999 | 271 (9.2%) | 6 (0.3%) |
| $75,000 to $99,999 | 380 (12.9%) | 109 (5.0%) |
| $100,000+ | 207 (7.0%) | 208 (9.5%) |
| Total | 2,943 (100.0%) | 2,188 (100.0%) |
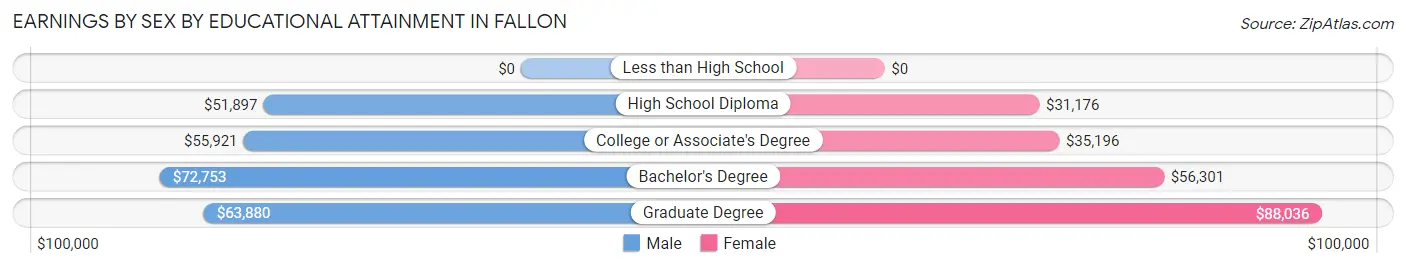
Earnings by Sex by Educational Attainment in Fallon
Average earnings in Fallon are $55,271 for men and $34,747 for women, a difference of 37.1%. Men with an educational attainment of bachelor's degree enjoy the highest average annual earnings of $72,753, while those with high school diploma education earn the least with $51,897. Women with an educational attainment of graduate degree earn the most with the average annual earnings of $88,036, while those with high school diploma education have the smallest earnings of $31,176.
| Educational Attainment | Male Income | Female Income |
| Less than High School | - | - |
| High School Diploma | $51,897 | $31,176 |
| College or Associate's Degree | $55,921 | $35,196 |
| Bachelor's Degree | $72,753 | $56,301 |
| Graduate Degree | $63,880 | $88,036 |
| Total | $55,271 | $34,747 |
Family Income in Fallon
Family Income Brackets in Fallon
According to the Fallon family income data, there are 552 families falling into the $50,000 to $74,999 income range, which is the most common income bracket and makes up 27.7% of all families. Conversely, the $10,000 to $14,999 income bracket is the least frequent group with only 8 families (0.4%) belonging to this category.
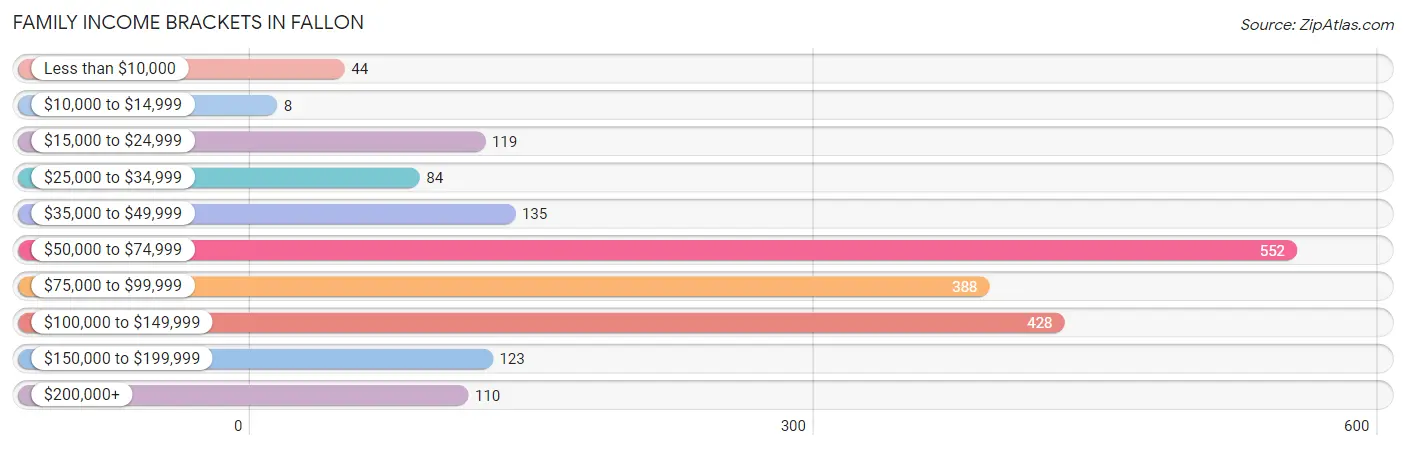
| Income Bracket | # Families | % Families |
| Less than $10,000 | 44 | 2.2% |
| $10,000 to $14,999 | 8 | 0.4% |
| $15,000 to $24,999 | 119 | 6.0% |
| $25,000 to $34,999 | 84 | 4.2% |
| $35,000 to $49,999 | 135 | 6.8% |
| $50,000 to $74,999 | 552 | 27.7% |
| $75,000 to $99,999 | 388 | 19.5% |
| $100,000 to $149,999 | 428 | 21.5% |
| $150,000 to $199,999 | 123 | 6.2% |
| $200,000+ | 110 | 5.5% |
Family Income by Famaliy Size in Fallon
5-person families (103 | 5.2%) account for the highest median family income in Fallon with $118,030 per family, while 2-person families (953 | 47.9%) have the highest median income of $35,014 per family member.
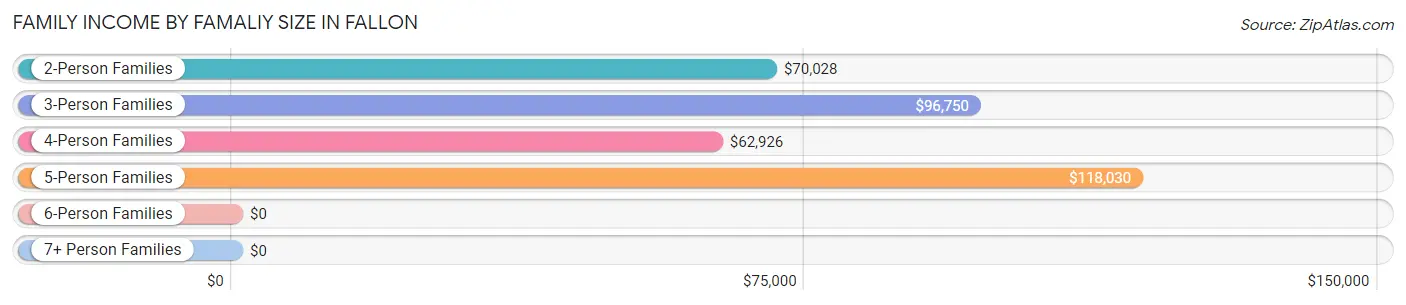
| Income Bracket | # Families | Median Income |
| 2-Person Families | 953 (47.9%) | $70,028 |
| 3-Person Families | 580 (29.1%) | $96,750 |
| 4-Person Families | 336 (16.9%) | $62,926 |
| 5-Person Families | 103 (5.2%) | $118,030 |
| 6-Person Families | 0 (0.0%) | $0 |
| 7+ Person Families | 19 (0.9%) | $0 |
| Total | 1,991 (100.0%) | $80,750 |
Family Income by Number of Earners in Fallon
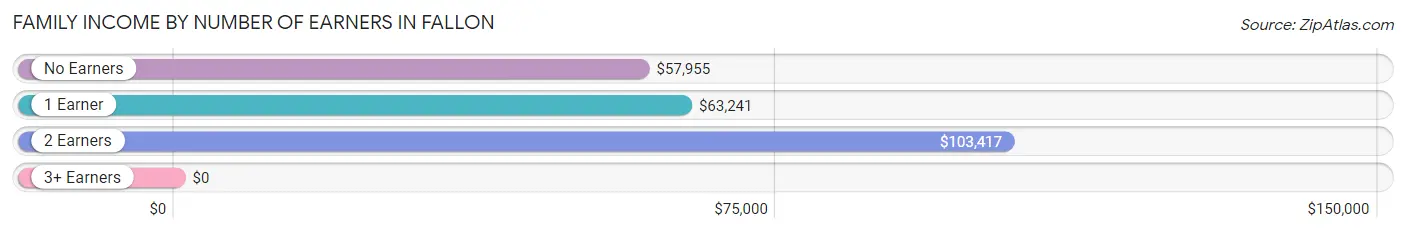
| Number of Earners | # Families | Median Income |
| No Earners | 200 (10.1%) | $57,955 |
| 1 Earner | 762 (38.3%) | $63,241 |
| 2 Earners | 909 (45.7%) | $103,417 |
| 3+ Earners | 120 (6.0%) | $0 |
| Total | 1,991 (100.0%) | $80,750 |
Household Income in Fallon
Household Income Brackets in Fallon
With 862 households falling in the category, the $50,000 to $74,999 income range is the most frequent in Fallon, accounting for 21.4% of all households. In contrast, only 113 households (2.8%) fall into the $10,000 to $14,999 income bracket, making it the least populous group.
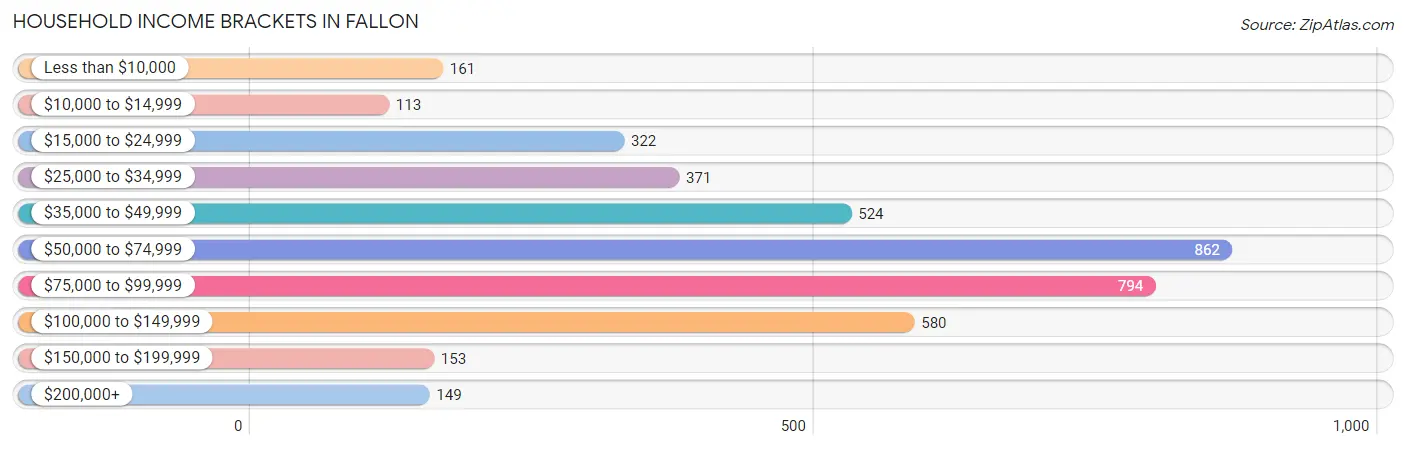
| Income Bracket | # Households | % Households |
| Less than $10,000 | 161 | 4.0% |
| $10,000 to $14,999 | 113 | 2.8% |
| $15,000 to $24,999 | 322 | 8.0% |
| $25,000 to $34,999 | 371 | 9.2% |
| $35,000 to $49,999 | 524 | 13.0% |
| $50,000 to $74,999 | 862 | 21.4% |
| $75,000 to $99,999 | 794 | 19.7% |
| $100,000 to $149,999 | 580 | 14.4% |
| $150,000 to $199,999 | 153 | 3.8% |
| $200,000+ | 149 | 3.7% |
Household Income by Householder Age in Fallon
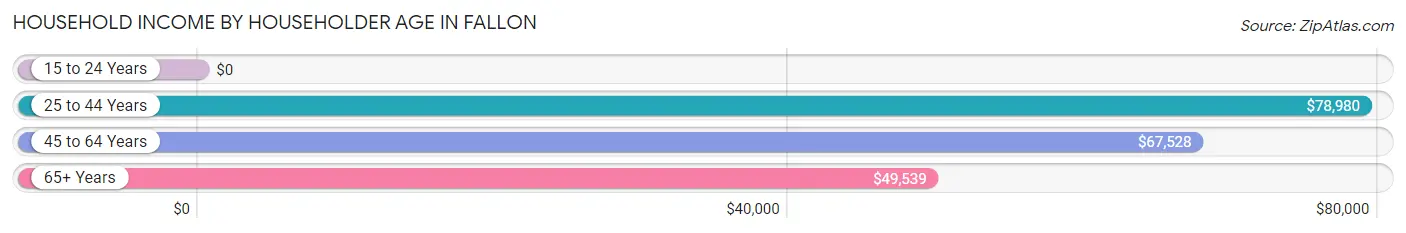
The median household income in Fallon is $63,490, with the highest median household income of $78,980 found in the 25 to 44 years age bracket for the primary householder. A total of 1,565 households (38.8%) fall into this category. Meanwhile, the 15 to 24 years age bracket for the primary householder has the lowest median household income of $0, with 279 households (6.9%) in this group.
| Income Bracket | # Households | Median Income |
| 15 to 24 Years | 279 (6.9%) | $0 |
| 25 to 44 Years | 1,565 (38.8%) | $78,980 |
| 45 to 64 Years | 1,077 (26.7%) | $67,528 |
| 65+ Years | 1,108 (27.5%) | $49,539 |
| Total | 4,029 (100.0%) | $63,490 |
Poverty in Fallon
Income Below Poverty by Sex and Age in Fallon
With 9.2% poverty level for males and 13.7% for females among the residents of Fallon, 55 to 64 year old males and 12 to 14 year old females are the most vulnerable to poverty, with 253 males (39.2%) and 48 females (39.7%) in their respective age groups living below the poverty level.
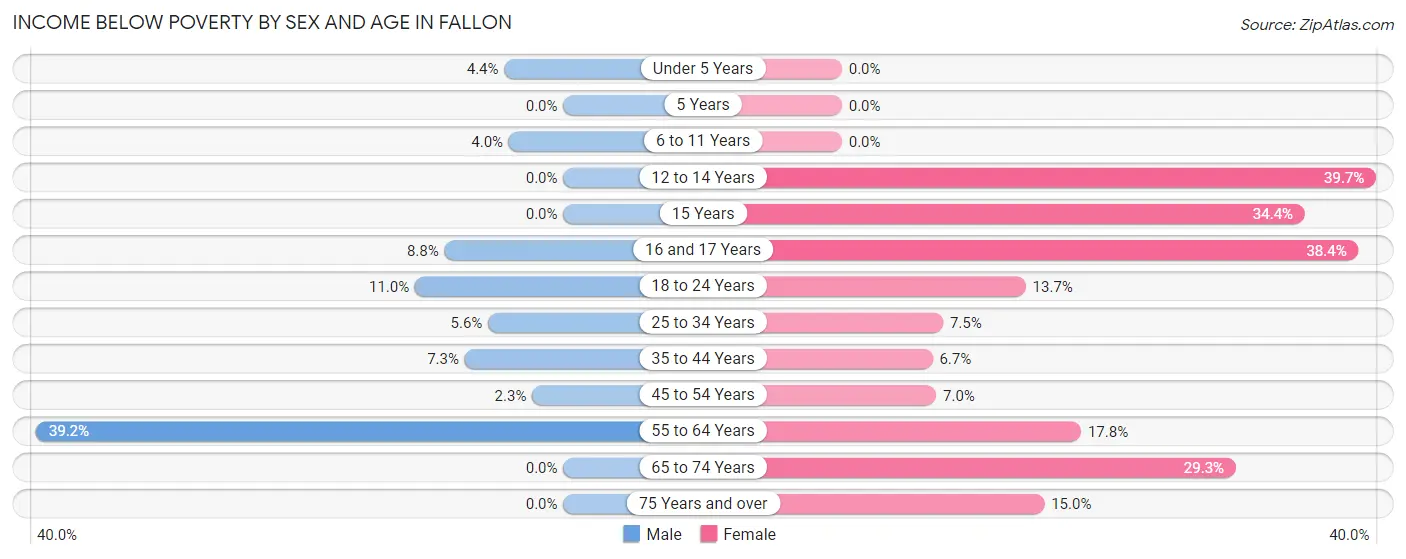
| Age Bracket | Male | Female |
| Under 5 Years | 12 (4.4%) | 0 (0.0%) |
| 5 Years | 0 (0.0%) | 0 (0.0%) |
| 6 to 11 Years | 18 (4.0%) | 0 (0.0%) |
| 12 to 14 Years | 0 (0.0%) | 48 (39.7%) |
| 15 Years | 0 (0.0%) | 33 (34.4%) |
| 16 and 17 Years | 3 (8.8%) | 56 (38.4%) |
| 18 to 24 Years | 47 (11.0%) | 49 (13.7%) |
| 25 to 34 Years | 51 (5.6%) | 47 (7.5%) |
| 35 to 44 Years | 39 (7.3%) | 23 (6.7%) |
| 45 to 54 Years | 15 (2.3%) | 43 (7.0%) |
| 55 to 64 Years | 253 (39.2%) | 84 (17.8%) |
| 65 to 74 Years | 0 (0.0%) | 163 (29.3%) |
| 75 Years and over | 0 (0.0%) | 46 (15.0%) |
| Total | 438 (9.2%) | 592 (13.7%) |
Income Above Poverty by Sex and Age in Fallon
According to the poverty statistics in Fallon, males aged 5 years and females aged under 5 years are the age groups that are most secure financially, with 100.0% of males and 100.0% of females in these age groups living above the poverty line.
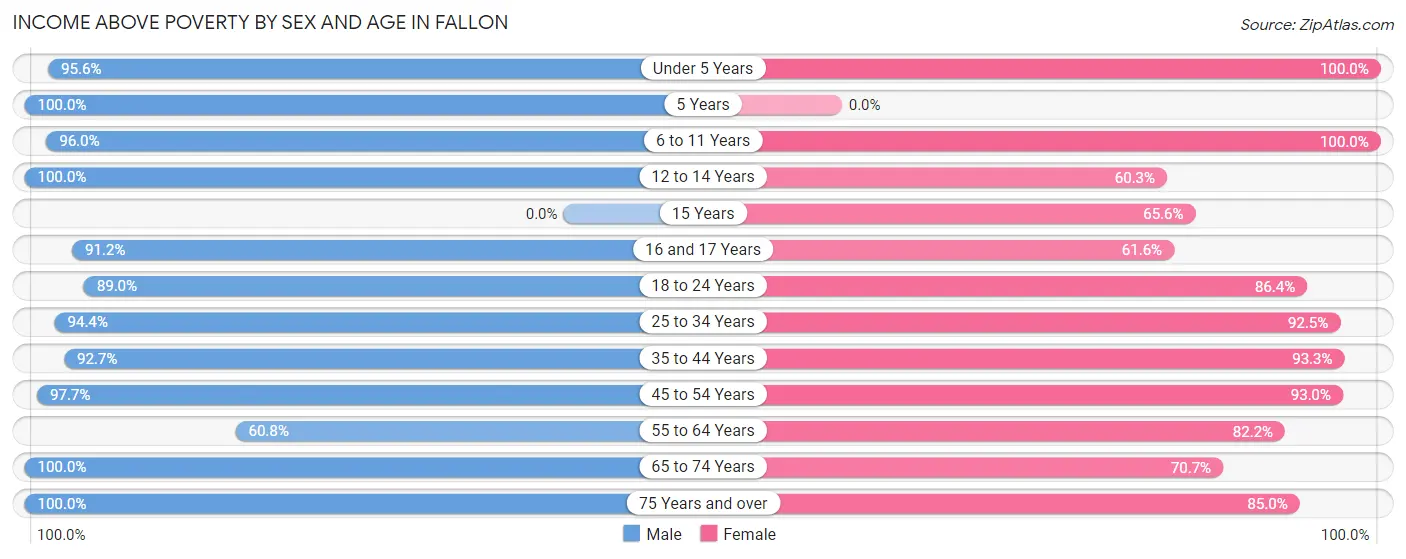
| Age Bracket | Male | Female |
| Under 5 Years | 262 (95.6%) | 280 (100.0%) |
| 5 Years | 53 (100.0%) | 0 (0.0%) |
| 6 to 11 Years | 427 (96.0%) | 390 (100.0%) |
| 12 to 14 Years | 155 (100.0%) | 73 (60.3%) |
| 15 Years | 0 (0.0%) | 63 (65.6%) |
| 16 and 17 Years | 31 (91.2%) | 90 (61.6%) |
| 18 to 24 Years | 380 (89.0%) | 310 (86.4%) |
| 25 to 34 Years | 863 (94.4%) | 579 (92.5%) |
| 35 to 44 Years | 494 (92.7%) | 319 (93.3%) |
| 45 to 54 Years | 633 (97.7%) | 571 (93.0%) |
| 55 to 64 Years | 393 (60.8%) | 389 (82.2%) |
| 65 to 74 Years | 258 (100.0%) | 394 (70.7%) |
| 75 Years and over | 365 (100.0%) | 260 (85.0%) |
| Total | 4,314 (90.8%) | 3,718 (86.3%) |
Income Below Poverty Among Married-Couple Families in Fallon
The poverty statistics for married-couple families in Fallon show that 1.0% or 12 of the total 1,211 families live below the poverty line. Families with 1 or 2 children have the highest poverty rate of 2.3%, comprising of 12 families. On the other hand, families with no children have the lowest poverty rate of 0.0%, which includes 0 families.
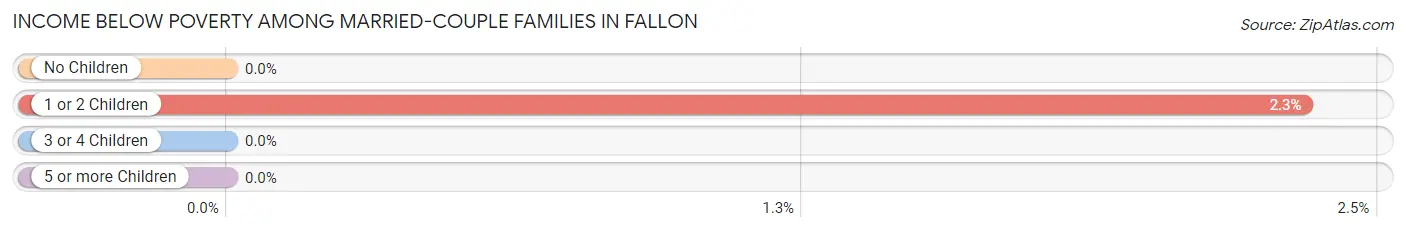
| Children | Above Poverty | Below Poverty |
| No Children | 641 (100.0%) | 0 (0.0%) |
| 1 or 2 Children | 500 (97.7%) | 12 (2.3%) |
| 3 or 4 Children | 39 (100.0%) | 0 (0.0%) |
| 5 or more Children | 19 (100.0%) | 0 (0.0%) |
| Total | 1,199 (99.0%) | 12 (1.0%) |
Income Below Poverty Among Single-Parent Households in Fallon
According to the poverty data in Fallon, 6.4% or 23 single-father households and 16.5% or 69 single-mother households are living below the poverty line. Among single-father households, those with no children have the highest poverty rate, with 15 households (10.4%) experiencing poverty. Likewise, among single-mother households, those with 1 or 2 children have the highest poverty rate, with 69 households (32.4%) falling below the poverty line.
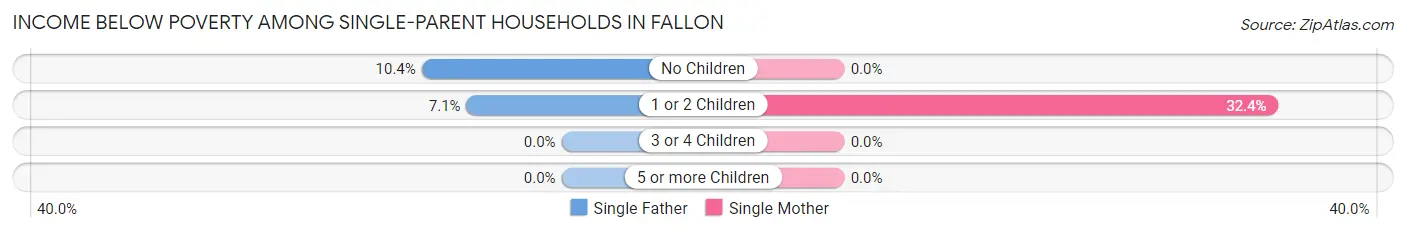
| Children | Single Father | Single Mother |
| No Children | 15 (10.4%) | 0 (0.0%) |
| 1 or 2 Children | 8 (7.1%) | 69 (32.4%) |
| 3 or 4 Children | 0 (0.0%) | 0 (0.0%) |
| 5 or more Children | 0 (0.0%) | 0 (0.0%) |
| Total | 23 (6.4%) | 69 (16.5%) |
Income Below Poverty Among Married-Couple vs Single-Parent Households in Fallon
The poverty data for Fallon shows that 12 of the married-couple family households (1.0%) and 92 of the single-parent households (11.8%) are living below the poverty level. Within the married-couple family households, those with 1 or 2 children have the highest poverty rate, with 12 households (2.3%) falling below the poverty line. Among the single-parent households, those with 1 or 2 children have the highest poverty rate, with 77 household (23.6%) living below poverty.
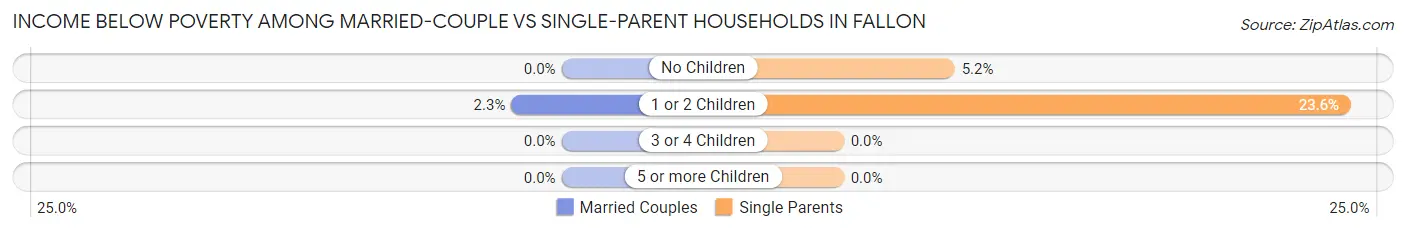
| Children | Married-Couple Families | Single-Parent Households |
| No Children | 0 (0.0%) | 15 (5.2%) |
| 1 or 2 Children | 12 (2.3%) | 77 (23.6%) |
| 3 or 4 Children | 0 (0.0%) | 0 (0.0%) |
| 5 or more Children | 0 (0.0%) | 0 (0.0%) |
| Total | 12 (1.0%) | 92 (11.8%) |
Race in Fallon
The most populous races in Fallon are White / Caucasian (7,312 | 79.1%), Hispanic or Latino (1,015 | 11.0%), and Two or more Races (596 | 6.5%).
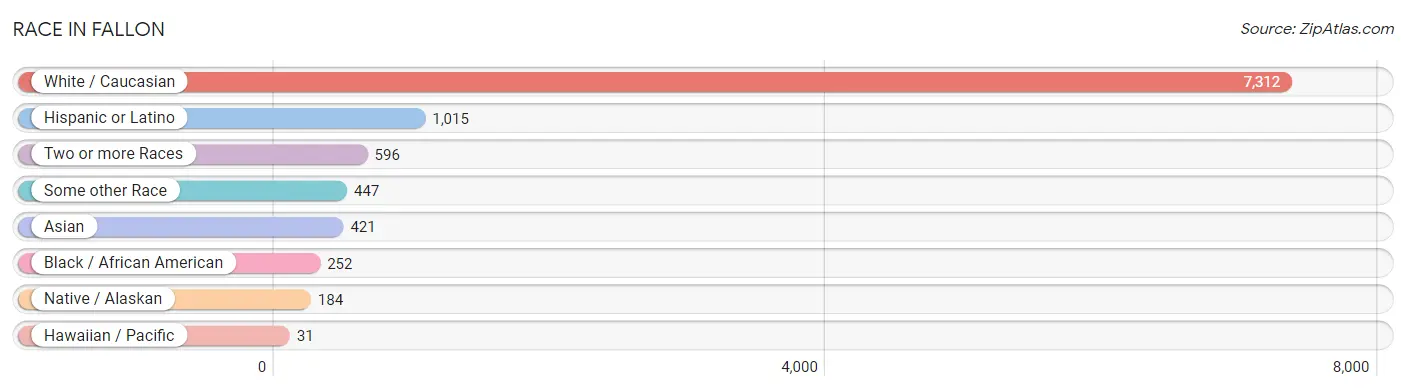
| Race | # Population | % Population |
| Asian | 421 | 4.5% |
| Black / African American | 252 | 2.7% |
| Hawaiian / Pacific | 31 | 0.3% |
| Hispanic or Latino | 1,015 | 11.0% |
| Native / Alaskan | 184 | 2.0% |
| White / Caucasian | 7,312 | 79.1% |
| Two or more Races | 596 | 6.5% |
| Some other Race | 447 | 4.8% |
| Total | 9,243 | 100.0% |
Ancestry in Fallon
The most populous ancestries reported in Fallon are German (1,957 | 21.2%), English (1,386 | 15.0%), Irish (1,327 | 14.4%), Mexican (636 | 6.9%), and American (588 | 6.4%), together accounting for 63.8% of all Fallon residents.
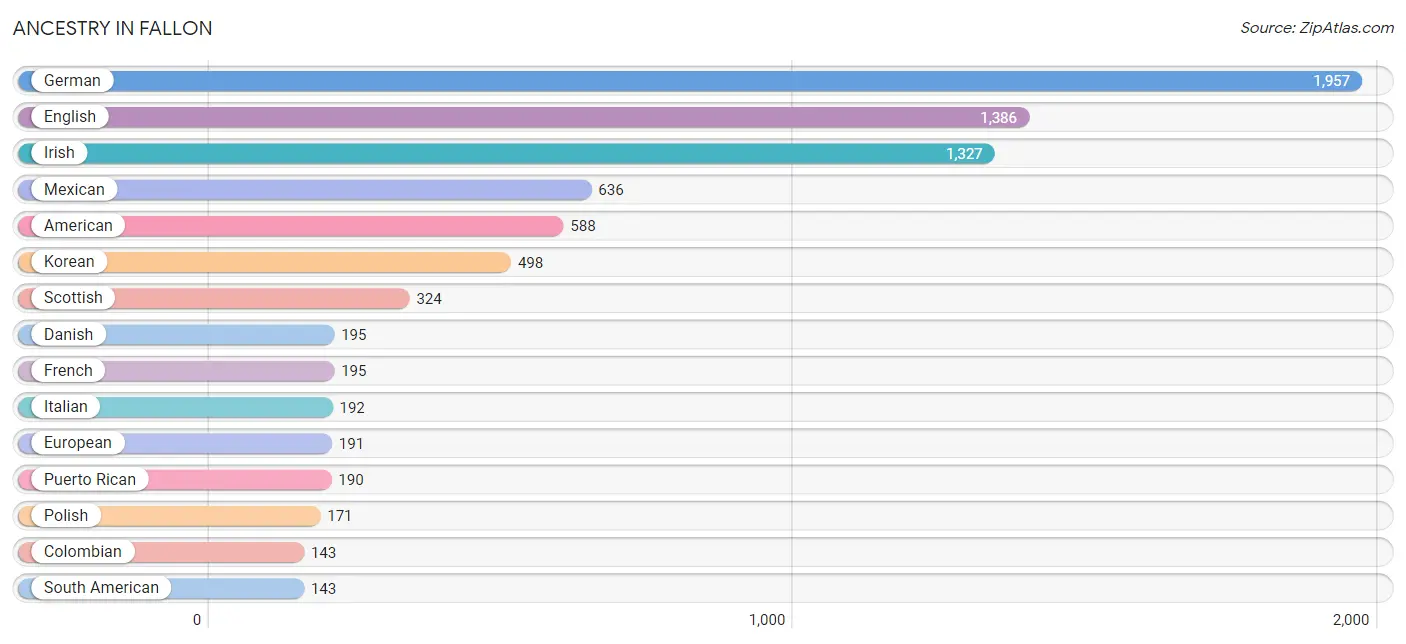
| Ancestry | # Population | % Population |
| African | 4 | 0.0% |
| American | 588 | 6.4% |
| Apache | 44 | 0.5% |
| Austrian | 10 | 0.1% |
| Basque | 51 | 0.5% |
| Bhutanese | 72 | 0.8% |
| Blackfeet | 4 | 0.0% |
| British | 35 | 0.4% |
| Bulgarian | 22 | 0.2% |
| Canadian | 13 | 0.1% |
| Cherokee | 14 | 0.2% |
| Choctaw | 27 | 0.3% |
| Colombian | 143 | 1.5% |
| Czech | 51 | 0.5% |
| Danish | 195 | 2.1% |
| Dutch | 32 | 0.4% |
| Eastern European | 7 | 0.1% |
| English | 1,386 | 15.0% |
| European | 191 | 2.1% |
| Finnish | 48 | 0.5% |
| French | 195 | 2.1% |
| French Canadian | 19 | 0.2% |
| German | 1,957 | 21.2% |
| Greek | 59 | 0.6% |
| Hungarian | 53 | 0.6% |
| Irish | 1,327 | 14.4% |
| Italian | 192 | 2.1% |
| Korean | 498 | 5.4% |
| Lithuanian | 10 | 0.1% |
| Mexican | 636 | 6.9% |
| Mexican American Indian | 23 | 0.3% |
| Native Hawaiian | 31 | 0.3% |
| Navajo | 9 | 0.1% |
| Norwegian | 102 | 1.1% |
| Paiute | 5 | 0.1% |
| Polish | 171 | 1.8% |
| Portuguese | 80 | 0.9% |
| Puerto Rican | 190 | 2.1% |
| Romanian | 5 | 0.1% |
| Russian | 47 | 0.5% |
| Scotch-Irish | 53 | 0.6% |
| Scottish | 324 | 3.5% |
| Shoshone | 5 | 0.1% |
| Slovak | 32 | 0.4% |
| South American | 143 | 1.5% |
| Spaniard | 9 | 0.1% |
| Spanish | 18 | 0.2% |
| Sri Lankan | 36 | 0.4% |
| Subsaharan African | 4 | 0.0% |
| Swedish | 74 | 0.8% |
| Swiss | 5 | 0.1% |
| Tongan | 9 | 0.1% |
| Welsh | 24 | 0.3% |
| West Indian | 38 | 0.4% | View All 54 Rows |
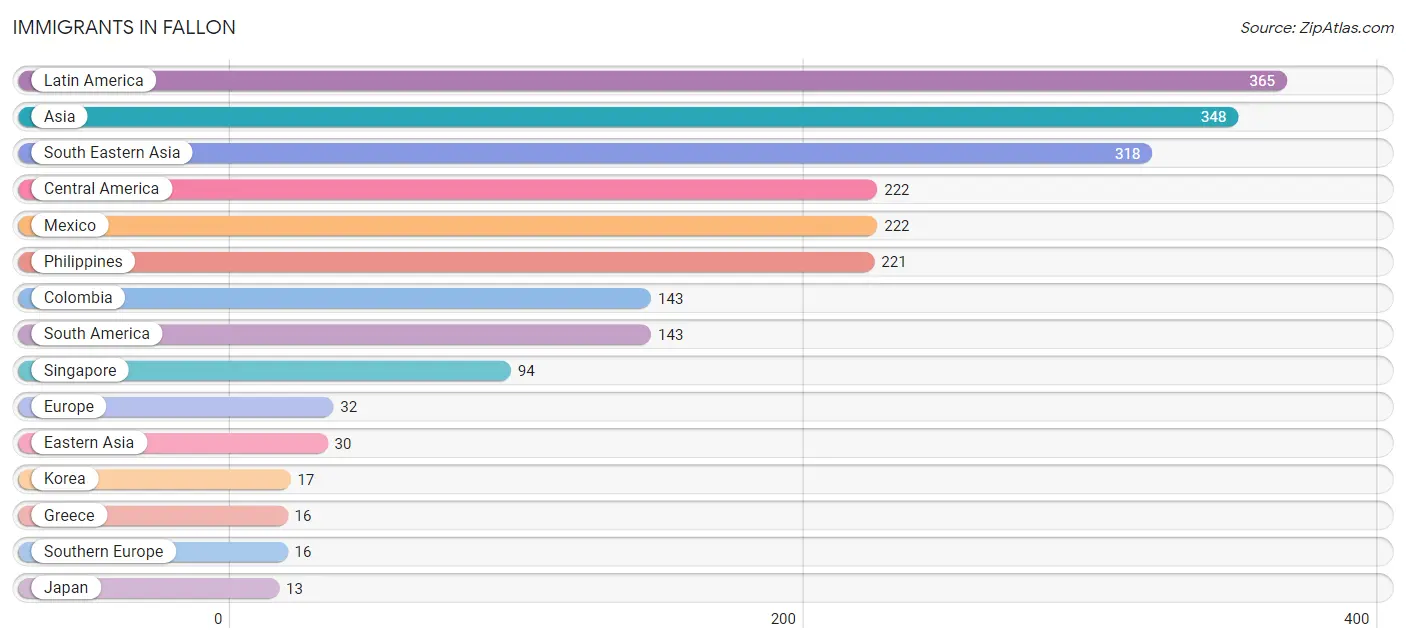
Immigrants in Fallon
The most numerous immigrant groups reported in Fallon came from Latin America (365 | 4.0%), Asia (348 | 3.8%), South Eastern Asia (318 | 3.4%), Central America (222 | 2.4%), and Mexico (222 | 2.4%), together accounting for 16.0% of all Fallon residents.
| Immigration Origin | # Population | % Population |
| Asia | 348 | 3.8% |
| Central America | 222 | 2.4% |
| Colombia | 143 | 1.5% |
| Eastern Asia | 30 | 0.3% |
| England | 6 | 0.1% |
| Europe | 32 | 0.4% |
| Germany | 5 | 0.1% |
| Greece | 16 | 0.2% |
| Indonesia | 3 | 0.0% |
| Japan | 13 | 0.1% |
| Korea | 17 | 0.2% |
| Latin America | 365 | 4.0% |
| Mexico | 222 | 2.4% |
| Northern Europe | 11 | 0.1% |
| Philippines | 221 | 2.4% |
| Singapore | 94 | 1.0% |
| South America | 143 | 1.5% |
| South Eastern Asia | 318 | 3.4% |
| Southern Europe | 16 | 0.2% |
| Western Europe | 5 | 0.1% | View All 20 Rows |
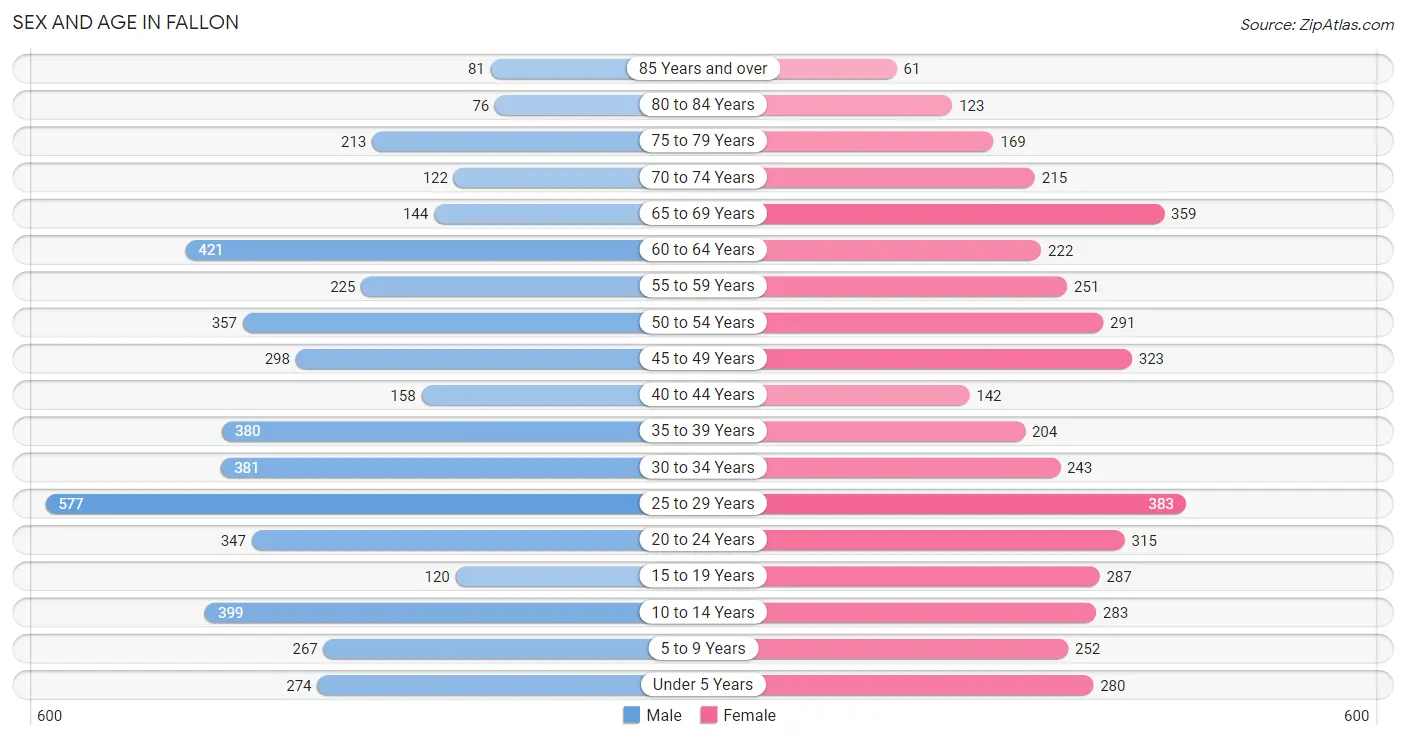
Sex and Age in Fallon
Sex and Age in Fallon
The most populous age groups in Fallon are 25 to 29 Years (577 | 11.9%) for men and 25 to 29 Years (383 | 8.7%) for women.
| Age Bracket | Male | Female |
| Under 5 Years | 274 (5.7%) | 280 (6.4%) |
| 5 to 9 Years | 267 (5.5%) | 252 (5.7%) |
| 10 to 14 Years | 399 (8.2%) | 283 (6.4%) |
| 15 to 19 Years | 120 (2.5%) | 287 (6.5%) |
| 20 to 24 Years | 347 (7.2%) | 315 (7.1%) |
| 25 to 29 Years | 577 (11.9%) | 383 (8.7%) |
| 30 to 34 Years | 381 (7.9%) | 243 (5.5%) |
| 35 to 39 Years | 380 (7.9%) | 204 (4.6%) |
| 40 to 44 Years | 158 (3.3%) | 142 (3.2%) |
| 45 to 49 Years | 298 (6.2%) | 323 (7.3%) |
| 50 to 54 Years | 357 (7.4%) | 291 (6.6%) |
| 55 to 59 Years | 225 (4.6%) | 251 (5.7%) |
| 60 to 64 Years | 421 (8.7%) | 222 (5.0%) |
| 65 to 69 Years | 144 (3.0%) | 359 (8.2%) |
| 70 to 74 Years | 122 (2.5%) | 215 (4.9%) |
| 75 to 79 Years | 213 (4.4%) | 169 (3.8%) |
| 80 to 84 Years | 76 (1.6%) | 123 (2.8%) |
| 85 Years and over | 81 (1.7%) | 61 (1.4%) |
| Total | 4,840 (100.0%) | 4,403 (100.0%) |
Families and Households in Fallon
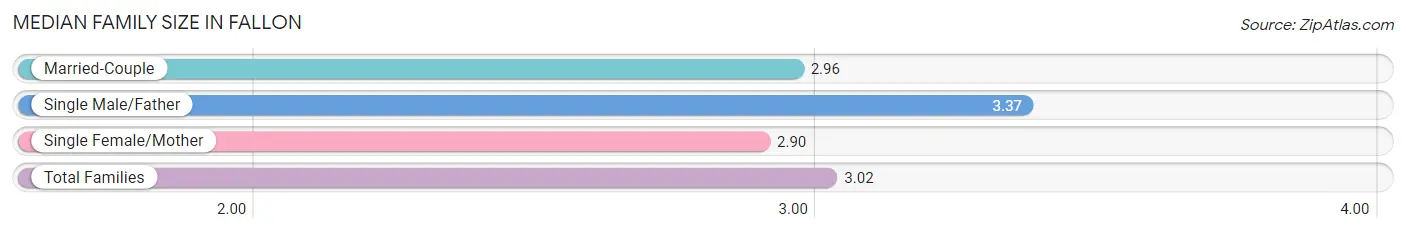
Median Family Size in Fallon
The median family size in Fallon is 3.02 persons per family, with single male/father families (362 | 18.2%) accounting for the largest median family size of 3.37 persons per family. On the other hand, single female/mother families (418 | 21.0%) represent the smallest median family size with 2.90 persons per family.
| Family Type | # Families | Family Size |
| Married-Couple | 1,211 (60.8%) | 2.96 |
| Single Male/Father | 362 (18.2%) | 3.37 |
| Single Female/Mother | 418 (21.0%) | 2.90 |
| Total Families | 1,991 (100.0%) | 3.02 |
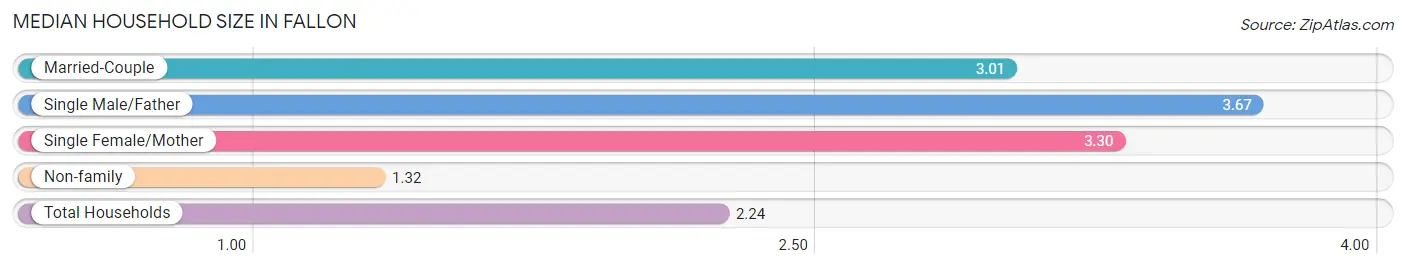
Median Household Size in Fallon
The median household size in Fallon is 2.24 persons per household, with single male/father households (362 | 9.0%) accounting for the largest median household size of 3.67 persons per household. non-family households (2,038 | 50.6%) represent the smallest median household size with 1.32 persons per household.
| Household Type | # Households | Household Size |
| Married-Couple | 1,211 (30.1%) | 3.01 |
| Single Male/Father | 362 (9.0%) | 3.67 |
| Single Female/Mother | 418 (10.4%) | 3.30 |
| Non-family | 2,038 (50.6%) | 1.32 |
| Total Households | 4,029 (100.0%) | 2.24 |
Household Size by Marriage Status in Fallon
Out of a total of 4,029 households in Fallon, 1,991 (49.4%) are family households, while 2,038 (50.6%) are nonfamily households. The most numerous type of family households are 2-person households, comprising 788, and the most common type of nonfamily households are 1-person households, comprising 1,472.
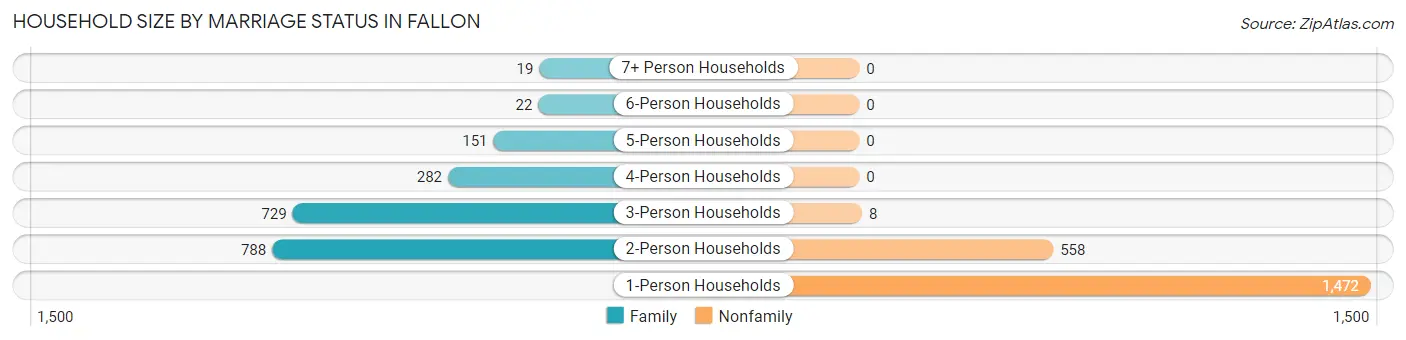
| Household Size | Family Households | Nonfamily Households |
| 1-Person Households | - | 1,472 (36.5%) |
| 2-Person Households | 788 (19.6%) | 558 (13.9%) |
| 3-Person Households | 729 (18.1%) | 8 (0.2%) |
| 4-Person Households | 282 (7.0%) | 0 (0.0%) |
| 5-Person Households | 151 (3.7%) | 0 (0.0%) |
| 6-Person Households | 22 (0.5%) | 0 (0.0%) |
| 7+ Person Households | 19 (0.5%) | 0 (0.0%) |
| Total | 1,991 (49.4%) | 2,038 (50.6%) |
Female Fertility in Fallon
Fertility by Age in Fallon
Average fertility rate in Fallon is 51.0 births per 1,000 women. Women in the age bracket of 20 to 34 years have the highest fertility rate with 61.0 births per 1,000 women. Women in the age bracket of 20 to 34 years acount for 54.8% of all women with births.
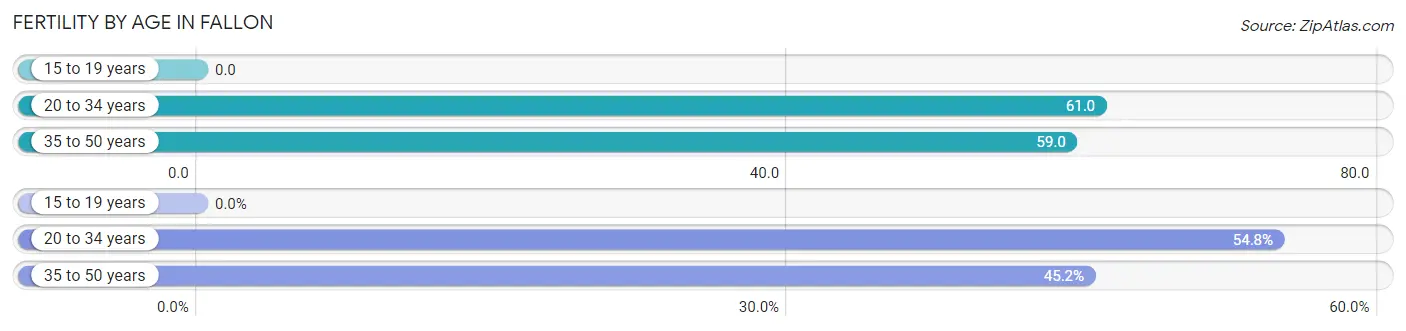
| Age Bracket | Women with Births | Births / 1,000 Women |
| 15 to 19 years | 0 (0.0%) | 0.0 |
| 20 to 34 years | 57 (54.8%) | 61.0 |
| 35 to 50 years | 47 (45.2%) | 59.0 |
| Total | 104 (100.0%) | 51.0 |
Fertility by Age by Marriage Status in Fallon
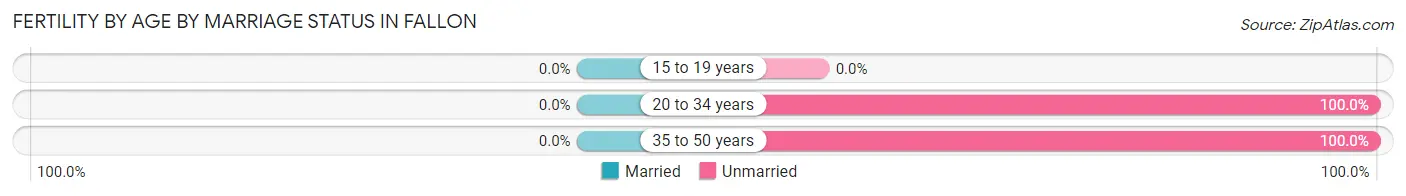
| Age Bracket | Married | Unmarried |
| 15 to 19 years | 0 (0.0%) | 0 (0.0%) |
| 20 to 34 years | 0 (0.0%) | 57 (100.0%) |
| 35 to 50 years | 0 (0.0%) | 47 (100.0%) |
| Total | 0 (0.0%) | 104 (100.0%) |
Fertility by Education in Fallon
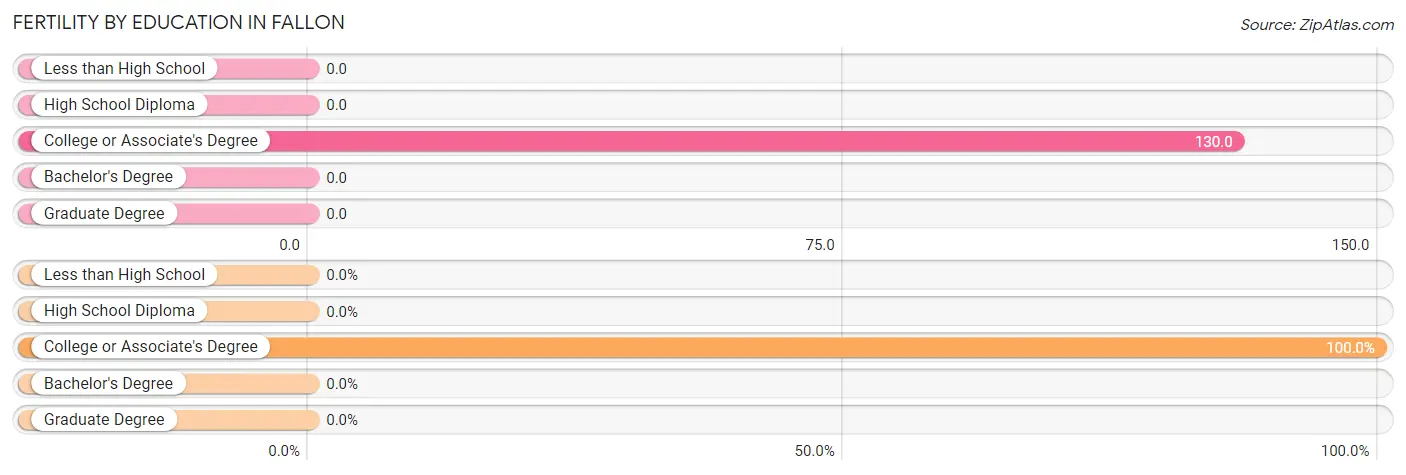
| Educational Attainment | Women with Births | Births / 1,000 Women |
| Less than High School | 0 (0.0%) | 0.0 |
| High School Diploma | 0 (0.0%) | 0.0 |
| College or Associate's Degree | 104 (100.0%) | 130.0 |
| Bachelor's Degree | 0 (0.0%) | 0.0 |
| Graduate Degree | 0 (0.0%) | 0.0 |
| Total | 104 (100.0%) | 51.0 |
Fertility by Education by Marriage Status in Fallon
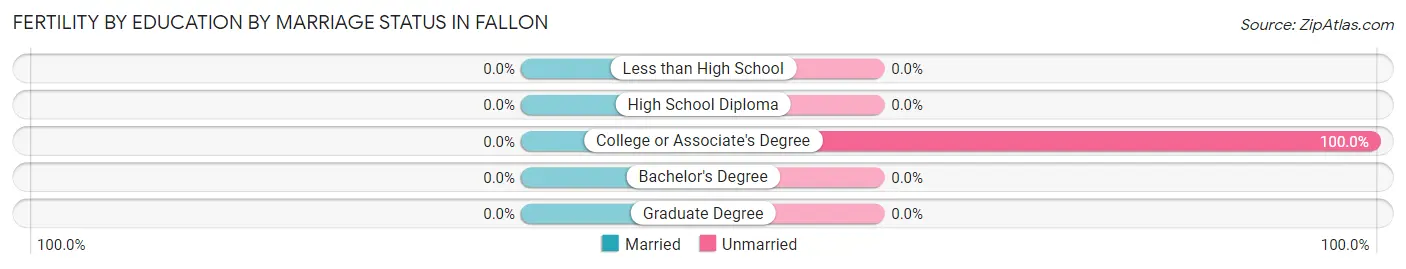
| Educational Attainment | Married | Unmarried |
| Less than High School | 0 (0.0%) | 0 (0.0%) |
| High School Diploma | 0 (0.0%) | 0 (0.0%) |
| College or Associate's Degree | 0 (0.0%) | 104 (100.0%) |
| Bachelor's Degree | 0 (0.0%) | 0 (0.0%) |
| Graduate Degree | 0 (0.0%) | 0 (0.0%) |
| Total | 0 (0.0%) | 104 (100.0%) |
Employment Characteristics in Fallon
Employment by Class of Employer in Fallon
Among the 4,774 employed individuals in Fallon, private company employees (2,314 | 48.5%), federal government employees (1,261 | 26.4%), and not-for-profit organizations (412 | 8.6%) make up the most common classes of employment.
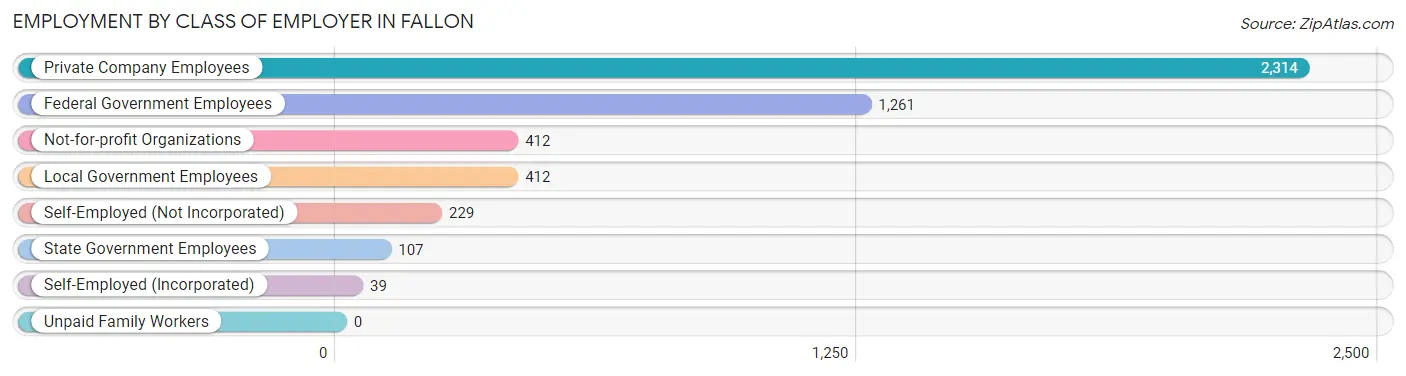
| Employer Class | # Employees | % Employees |
| Private Company Employees | 2,314 | 48.5% |
| Self-Employed (Incorporated) | 39 | 0.8% |
| Self-Employed (Not Incorporated) | 229 | 4.8% |
| Not-for-profit Organizations | 412 | 8.6% |
| Local Government Employees | 412 | 8.6% |
| State Government Employees | 107 | 2.2% |
| Federal Government Employees | 1,261 | 26.4% |
| Unpaid Family Workers | 0 | 0.0% |
| Total | 4,774 | 100.0% |
Employment Status by Age in Fallon
According to the labor force statistics for Fallon, out of the total population over 16 years of age (7,392), 67.8% or 5,012 individuals are in the labor force, with 4.4% or 221 of them unemployed. The age group with the highest labor force participation rate is 20 to 24 years, with 99.1% or 656 individuals in the labor force. Within the labor force, the 20 to 24 years age range has the highest percentage of unemployed individuals, with 14.0% or 92 of them being unemployed.
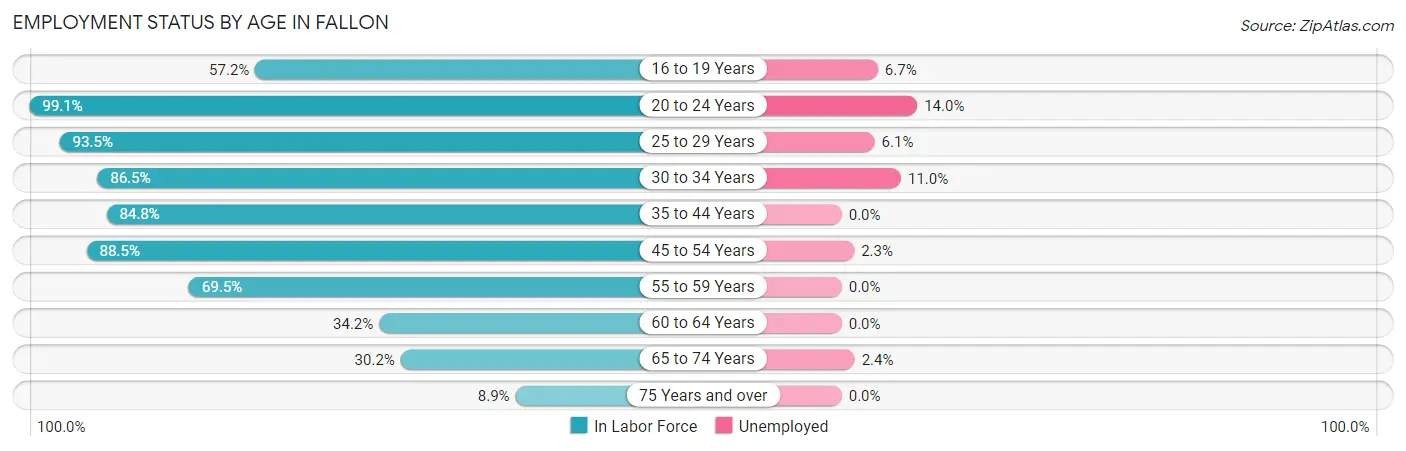
| Age Bracket | In Labor Force | Unemployed |
| 16 to 19 Years | 178 (57.2%) | 12 (6.7%) |
| 20 to 24 Years | 656 (99.1%) | 92 (14.0%) |
| 25 to 29 Years | 898 (93.5%) | 55 (6.1%) |
| 30 to 34 Years | 540 (86.5%) | 59 (11.0%) |
| 35 to 44 Years | 750 (84.8%) | 0 (0.0%) |
| 45 to 54 Years | 1,123 (88.5%) | 26 (2.3%) |
| 55 to 59 Years | 331 (69.5%) | 0 (0.0%) |
| 60 to 64 Years | 220 (34.2%) | 0 (0.0%) |
| 65 to 74 Years | 254 (30.2%) | 6 (2.4%) |
| 75 Years and over | 64 (8.9%) | 0 (0.0%) |
| Total | 5,012 (67.8%) | 221 (4.4%) |
Employment Status by Educational Attainment in Fallon
According to labor force statistics for Fallon, 79.5% of individuals (3,861) out of the total population between 25 and 64 years of age (4,856) are in the labor force, with 3.3% or 127 of them being unemployed. The group with the highest labor force participation rate are those with the educational attainment of bachelor's degree or higher, with 94.5% or 853 individuals in the labor force. Within the labor force, individuals with college / associate degree education have the highest percentage of unemployment, with 5.6% or 85 of them being unemployed.
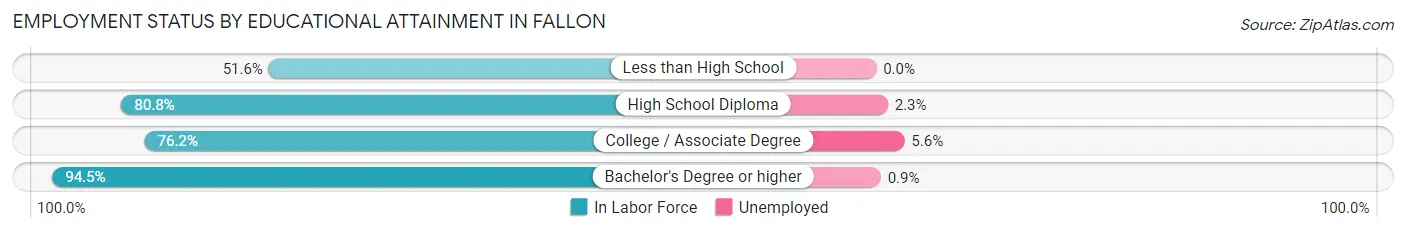
| Educational Attainment | In Labor Force | Unemployed |
| Less than High School | 165 (51.6%) | 0 (0.0%) |
| High School Diploma | 1,336 (80.8%) | 38 (2.3%) |
| College / Associate Degree | 1,509 (76.2%) | 111 (5.6%) |
| Bachelor's Degree or higher | 853 (94.5%) | 8 (0.9%) |
| Total | 3,861 (79.5%) | 160 (3.3%) |
Employment Occupations by Sex in Fallon
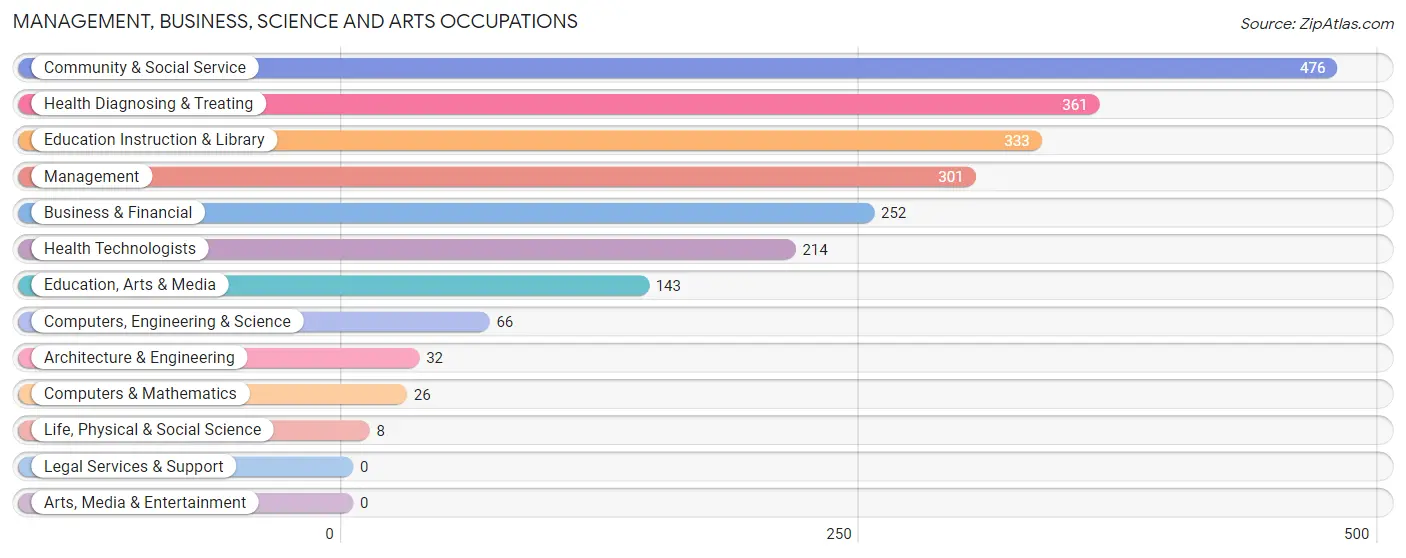
Management, Business, Science and Arts Occupations
The most common Management, Business, Science and Arts occupations in Fallon are Community & Social Service (476 | 11.7%), Health Diagnosing & Treating (361 | 8.9%), Education Instruction & Library (333 | 8.2%), Management (301 | 7.4%), and Business & Financial (252 | 6.2%).
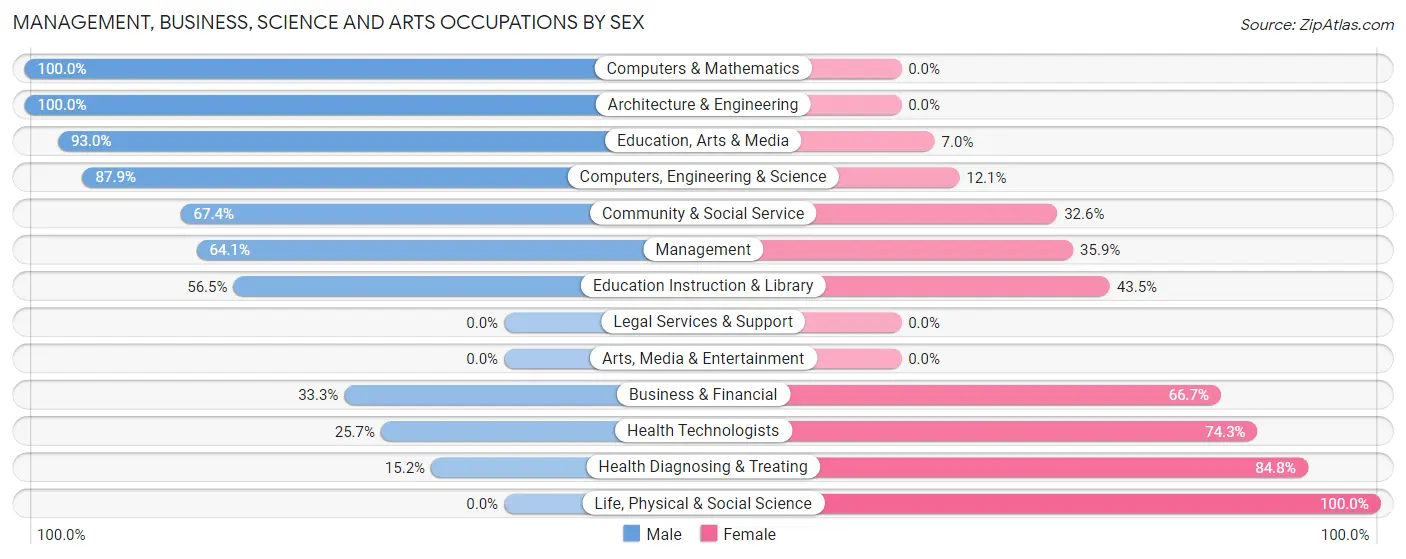
Management, Business, Science and Arts Occupations by Sex
Within the Management, Business, Science and Arts occupations in Fallon, the most male-oriented occupations are Computers & Mathematics (100.0%), Architecture & Engineering (100.0%), and Education, Arts & Media (93.0%), while the most female-oriented occupations are Life, Physical & Social Science (100.0%), Health Diagnosing & Treating (84.8%), and Health Technologists (74.3%).
| Occupation | Male | Female |
| Management | 193 (64.1%) | 108 (35.9%) |
| Business & Financial | 84 (33.3%) | 168 (66.7%) |
| Computers, Engineering & Science | 58 (87.9%) | 8 (12.1%) |
| Computers & Mathematics | 26 (100.0%) | 0 (0.0%) |
| Architecture & Engineering | 32 (100.0%) | 0 (0.0%) |
| Life, Physical & Social Science | 0 (0.0%) | 8 (100.0%) |
| Community & Social Service | 321 (67.4%) | 155 (32.6%) |
| Education, Arts & Media | 133 (93.0%) | 10 (7.0%) |
| Legal Services & Support | 0 (0.0%) | 0 (0.0%) |
| Education Instruction & Library | 188 (56.5%) | 145 (43.5%) |
| Arts, Media & Entertainment | 0 (0.0%) | 0 (0.0%) |
| Health Diagnosing & Treating | 55 (15.2%) | 306 (84.8%) |
| Health Technologists | 55 (25.7%) | 159 (74.3%) |
| Total (Category) | 711 (48.8%) | 745 (51.2%) |
| Total (Overall) | 2,164 (53.1%) | 1,908 (46.9%) |
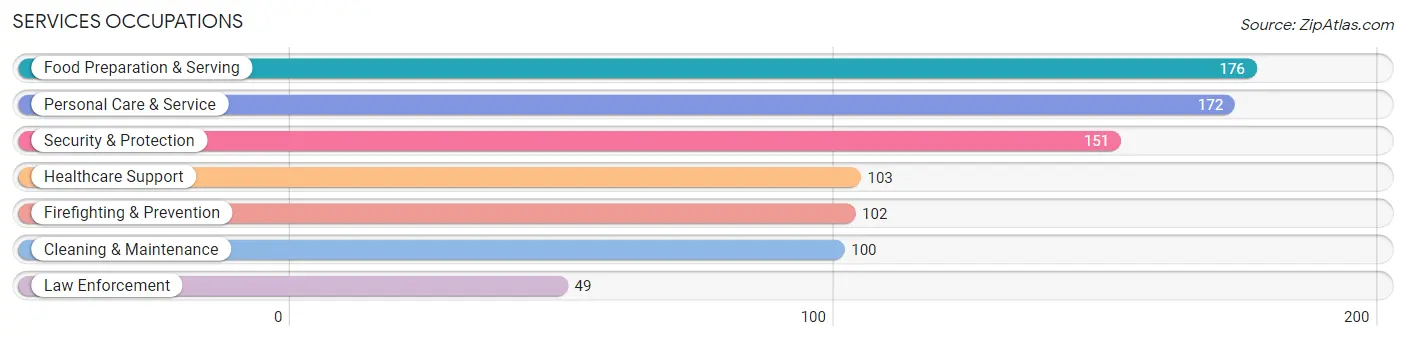
Services Occupations
The most common Services occupations in Fallon are Food Preparation & Serving (176 | 4.3%), Personal Care & Service (172 | 4.2%), Security & Protection (151 | 3.7%), Healthcare Support (103 | 2.5%), and Firefighting & Prevention (102 | 2.5%).
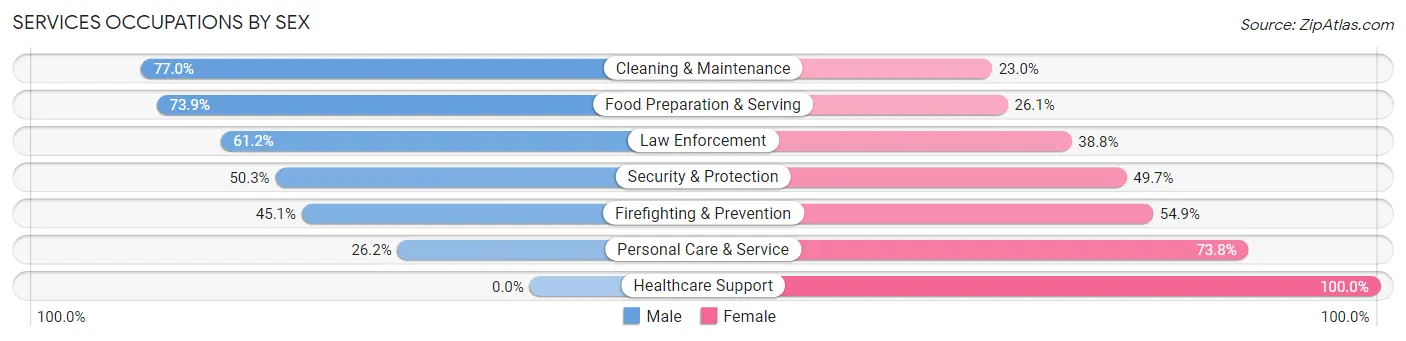
Services Occupations by Sex
Within the Services occupations in Fallon, the most male-oriented occupations are Cleaning & Maintenance (77.0%), Food Preparation & Serving (73.9%), and Law Enforcement (61.2%), while the most female-oriented occupations are Healthcare Support (100.0%), Personal Care & Service (73.8%), and Firefighting & Prevention (54.9%).
| Occupation | Male | Female |
| Healthcare Support | 0 (0.0%) | 103 (100.0%) |
| Security & Protection | 76 (50.3%) | 75 (49.7%) |
| Firefighting & Prevention | 46 (45.1%) | 56 (54.9%) |
| Law Enforcement | 30 (61.2%) | 19 (38.8%) |
| Food Preparation & Serving | 130 (73.9%) | 46 (26.1%) |
| Cleaning & Maintenance | 77 (77.0%) | 23 (23.0%) |
| Personal Care & Service | 45 (26.2%) | 127 (73.8%) |
| Total (Category) | 328 (46.7%) | 374 (53.3%) |
| Total (Overall) | 2,164 (53.1%) | 1,908 (46.9%) |
Sales and Office Occupations
The most common Sales and Office occupations in Fallon are Office & Administration (561 | 13.8%), and Sales & Related (204 | 5.0%).
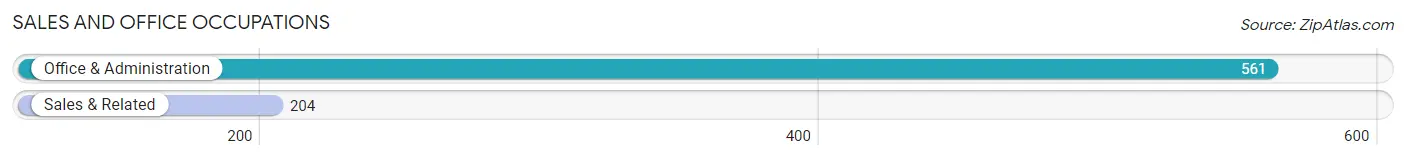
Sales and Office Occupations by Sex

| Occupation | Male | Female |
| Sales & Related | 52 (25.5%) | 152 (74.5%) |
| Office & Administration | 81 (14.4%) | 480 (85.6%) |
| Total (Category) | 133 (17.4%) | 632 (82.6%) |
| Total (Overall) | 2,164 (53.1%) | 1,908 (46.9%) |
Natural Resources, Construction and Maintenance Occupations
The most common Natural Resources, Construction and Maintenance occupations in Fallon are Construction & Extraction (293 | 7.2%), Installation, Maintenance & Repair (147 | 3.6%), and Farming, Fishing & Forestry (3 | 0.1%).
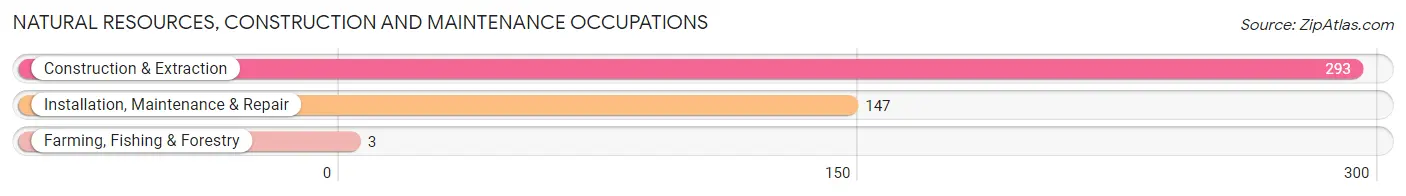
Natural Resources, Construction and Maintenance Occupations by Sex
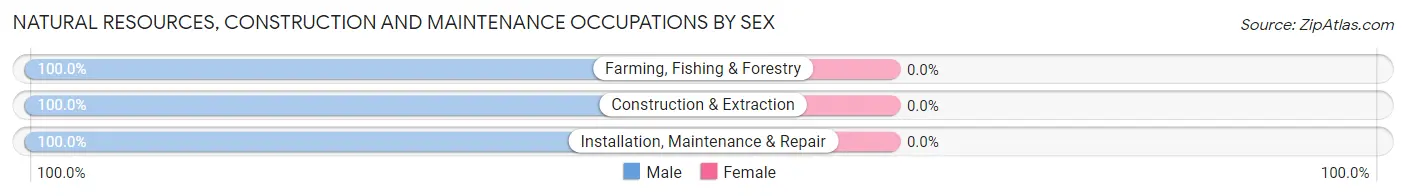
| Occupation | Male | Female |
| Farming, Fishing & Forestry | 3 (100.0%) | 0 (0.0%) |
| Construction & Extraction | 293 (100.0%) | 0 (0.0%) |
| Installation, Maintenance & Repair | 147 (100.0%) | 0 (0.0%) |
| Total (Category) | 443 (100.0%) | 0 (0.0%) |
| Total (Overall) | 2,164 (53.1%) | 1,908 (46.9%) |
Production, Transportation and Moving Occupations
The most common Production, Transportation and Moving occupations in Fallon are Production (307 | 7.5%), Transportation (267 | 6.6%), and Material Moving (132 | 3.2%).
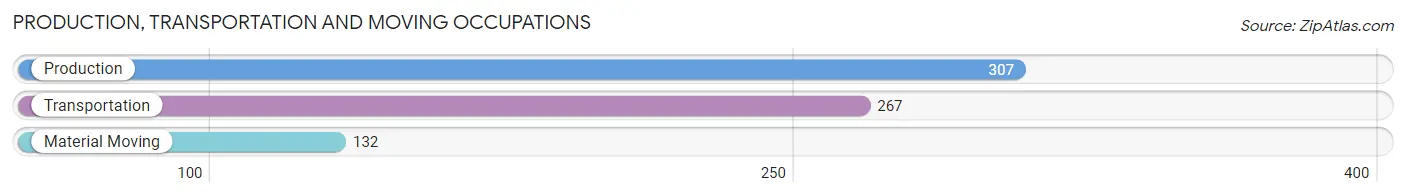
Production, Transportation and Moving Occupations by Sex
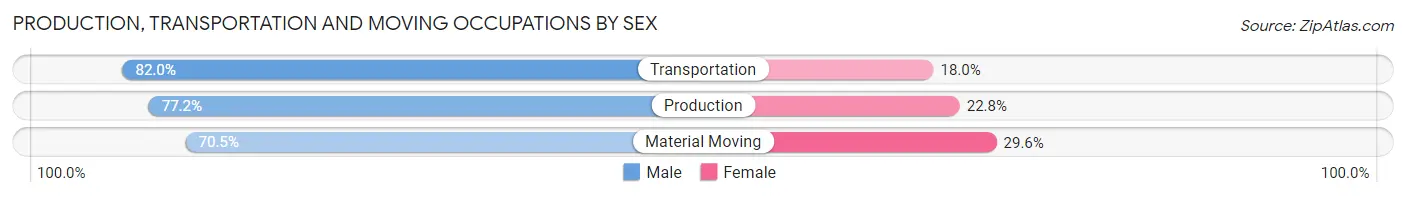
| Occupation | Male | Female |
| Production | 237 (77.2%) | 70 (22.8%) |
| Transportation | 219 (82.0%) | 48 (18.0%) |
| Material Moving | 93 (70.5%) | 39 (29.5%) |
| Total (Category) | 549 (77.8%) | 157 (22.2%) |
| Total (Overall) | 2,164 (53.1%) | 1,908 (46.9%) |
Employment Industries by Sex in Fallon
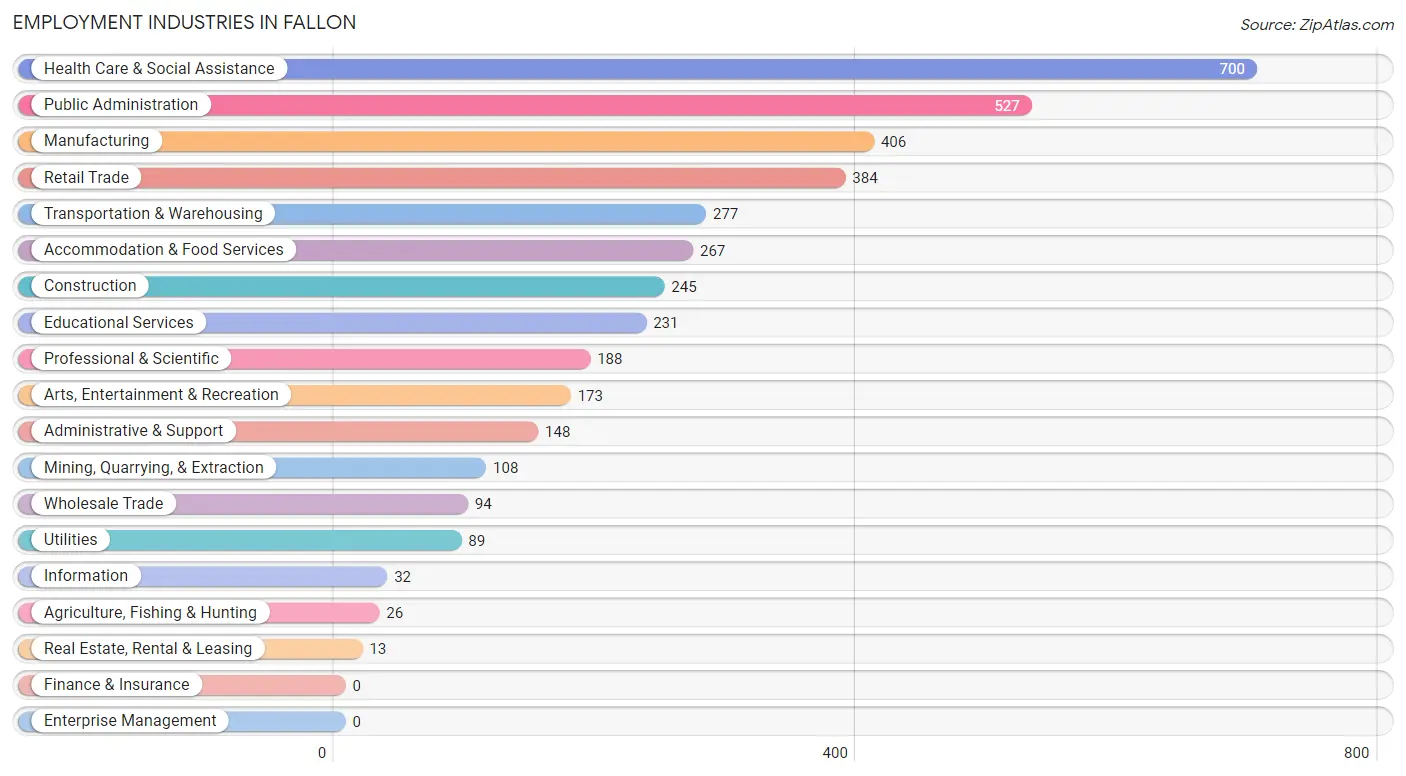
Employment Industries in Fallon
The major employment industries in Fallon include Health Care & Social Assistance (700 | 17.2%), Public Administration (527 | 12.9%), Manufacturing (406 | 10.0%), Retail Trade (384 | 9.4%), and Transportation & Warehousing (277 | 6.8%).
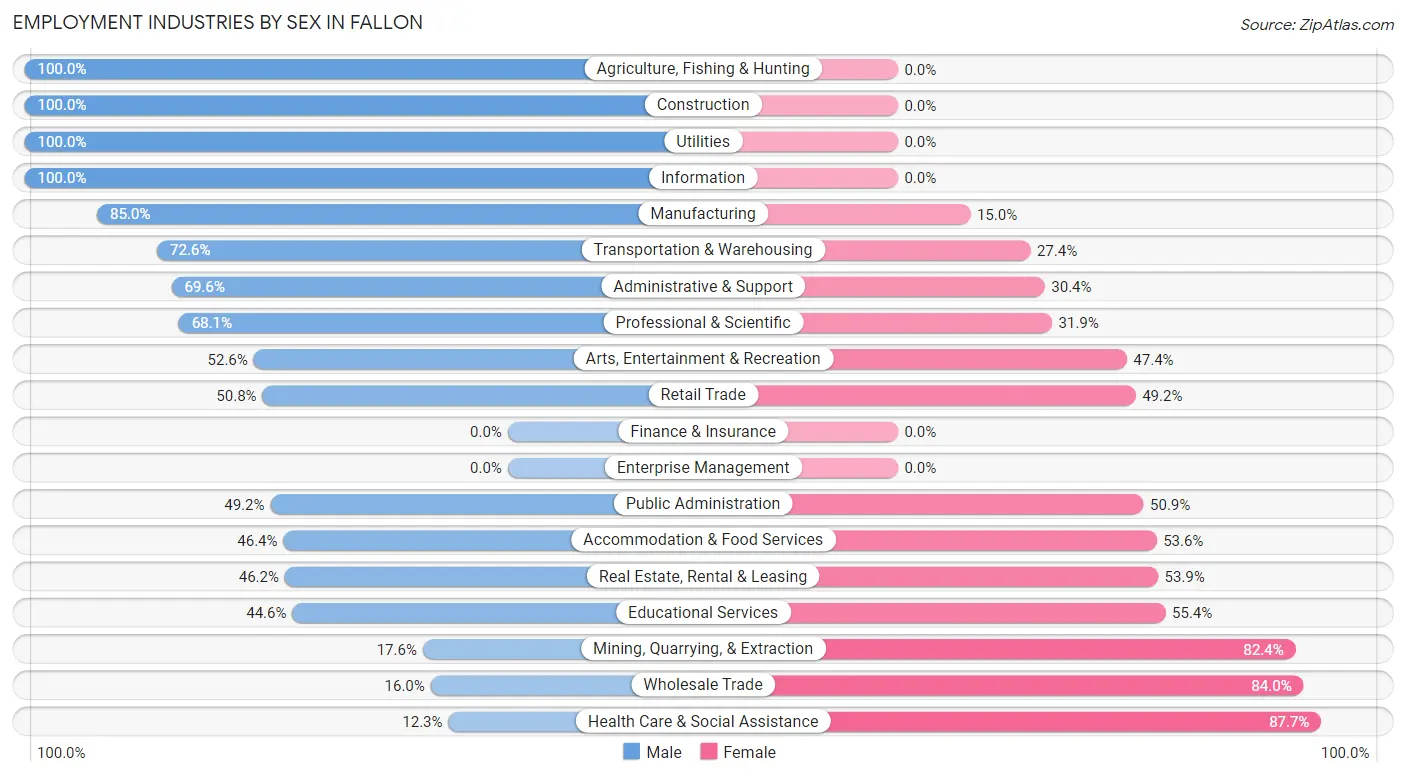
Employment Industries by Sex in Fallon
The Fallon industries that see more men than women are Agriculture, Fishing & Hunting (100.0%), Construction (100.0%), and Utilities (100.0%), whereas the industries that tend to have a higher number of women are Health Care & Social Assistance (87.7%), Wholesale Trade (84.0%), and Mining, Quarrying, & Extraction (82.4%).
| Industry | Male | Female |
| Agriculture, Fishing & Hunting | 26 (100.0%) | 0 (0.0%) |
| Mining, Quarrying, & Extraction | 19 (17.6%) | 89 (82.4%) |
| Construction | 245 (100.0%) | 0 (0.0%) |
| Manufacturing | 345 (85.0%) | 61 (15.0%) |
| Wholesale Trade | 15 (16.0%) | 79 (84.0%) |
| Retail Trade | 195 (50.8%) | 189 (49.2%) |
| Transportation & Warehousing | 201 (72.6%) | 76 (27.4%) |
| Utilities | 89 (100.0%) | 0 (0.0%) |
| Information | 32 (100.0%) | 0 (0.0%) |
| Finance & Insurance | 0 (0.0%) | 0 (0.0%) |
| Real Estate, Rental & Leasing | 6 (46.2%) | 7 (53.8%) |
| Professional & Scientific | 128 (68.1%) | 60 (31.9%) |
| Enterprise Management | 0 (0.0%) | 0 (0.0%) |
| Administrative & Support | 103 (69.6%) | 45 (30.4%) |
| Educational Services | 103 (44.6%) | 128 (55.4%) |
| Health Care & Social Assistance | 86 (12.3%) | 614 (87.7%) |
| Arts, Entertainment & Recreation | 91 (52.6%) | 82 (47.4%) |
| Accommodation & Food Services | 124 (46.4%) | 143 (53.6%) |
| Public Administration | 259 (49.1%) | 268 (50.8%) |
| Total | 2,164 (53.1%) | 1,908 (46.9%) |
Education in Fallon
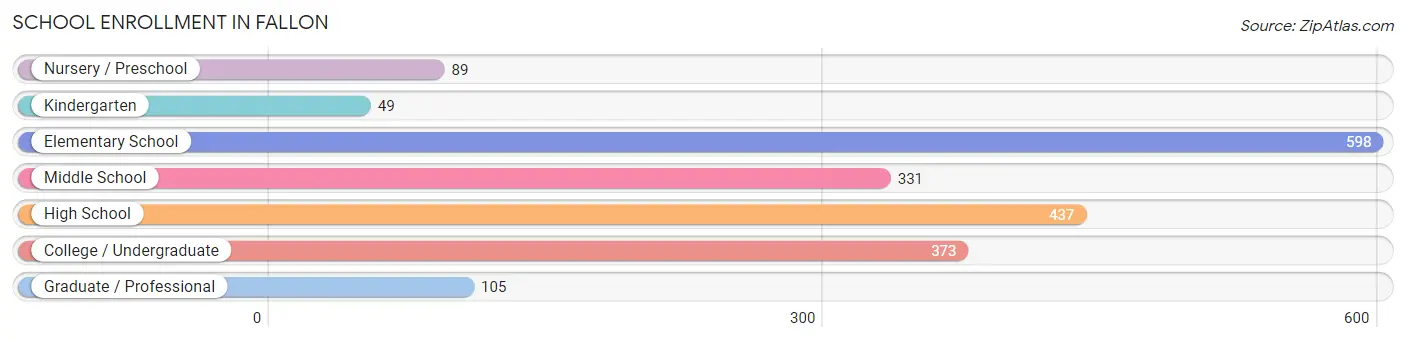
School Enrollment in Fallon
The most common levels of schooling among the 1,982 students in Fallon are elementary school (598 | 30.2%), high school (437 | 22.1%), and college / undergraduate (373 | 18.8%).
| School Level | # Students | % Students |
| Nursery / Preschool | 89 | 4.5% |
| Kindergarten | 49 | 2.5% |
| Elementary School | 598 | 30.2% |
| Middle School | 331 | 16.7% |
| High School | 437 | 22.1% |
| College / Undergraduate | 373 | 18.8% |
| Graduate / Professional | 105 | 5.3% |
| Total | 1,982 | 100.0% |
School Enrollment by Age by Funding Source in Fallon
Out of a total of 1,982 students who are enrolled in schools in Fallon, 192 (9.7%) attend a private institution, while the remaining 1,790 (90.3%) are enrolled in public schools. The age group of 20 to 24 year olds has the highest likelihood of being enrolled in private schools, with 154 (73.7% in the age bracket) enrolled. Conversely, the age group of 15 to 17 year olds has the lowest likelihood of being enrolled in a private school, with 277 (100.0% in the age bracket) attending a public institution.
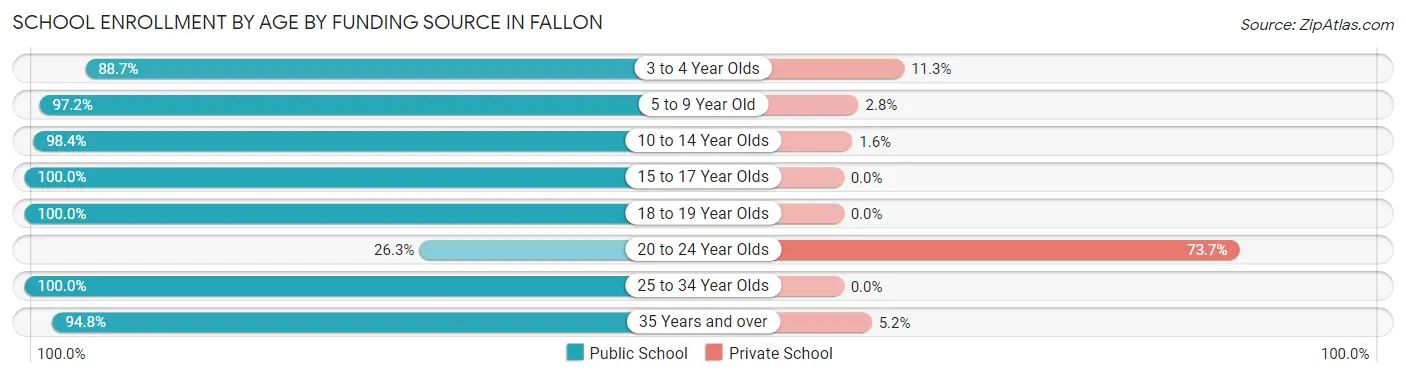
| Age Bracket | Public School | Private School |
| 3 to 4 Year Olds | 55 (88.7%) | 7 (11.3%) |
| 5 to 9 Year Old | 419 (97.2%) | 12 (2.8%) |
| 10 to 14 Year Olds | 671 (98.4%) | 11 (1.6%) |
| 15 to 17 Year Olds | 277 (100.0%) | 0 (0.0%) |
| 18 to 19 Year Olds | 52 (100.0%) | 0 (0.0%) |
| 20 to 24 Year Olds | 55 (26.3%) | 154 (73.7%) |
| 25 to 34 Year Olds | 97 (100.0%) | 0 (0.0%) |
| 35 Years and over | 163 (94.8%) | 9 (5.2%) |
| Total | 1,790 (90.3%) | 192 (9.7%) |
Educational Attainment by Field of Study in Fallon
Computers & mathematics (232 | 21.0%), science & technology (218 | 19.7%), education (207 | 18.7%), liberal arts & history (128 | 11.6%), and business (116 | 10.5%) are the most common fields of study among 1,107 individuals in Fallon who have obtained a bachelor's degree or higher.
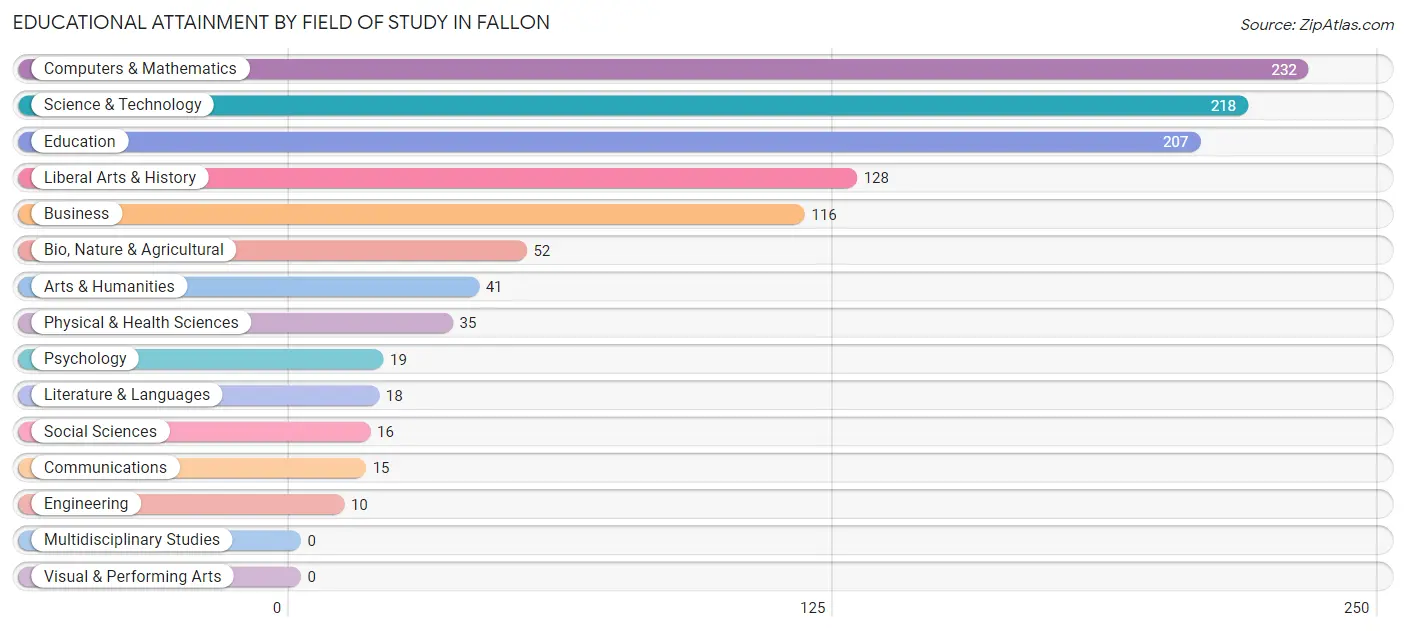
| Field of Study | # Graduates | % Graduates |
| Computers & Mathematics | 232 | 21.0% |
| Bio, Nature & Agricultural | 52 | 4.7% |
| Physical & Health Sciences | 35 | 3.2% |
| Psychology | 19 | 1.7% |
| Social Sciences | 16 | 1.5% |
| Engineering | 10 | 0.9% |
| Multidisciplinary Studies | 0 | 0.0% |
| Science & Technology | 218 | 19.7% |
| Business | 116 | 10.5% |
| Education | 207 | 18.7% |
| Literature & Languages | 18 | 1.6% |
| Liberal Arts & History | 128 | 11.6% |
| Visual & Performing Arts | 0 | 0.0% |
| Communications | 15 | 1.4% |
| Arts & Humanities | 41 | 3.7% |
| Total | 1,107 | 100.0% |
Transportation & Commute in Fallon
Vehicle Availability by Sex in Fallon
The most prevalent vehicle ownership categories in Fallon are males with 2 vehicles (1,348, accounting for 50.2%) and females with 2 vehicles (1,136, making up 64.6%).
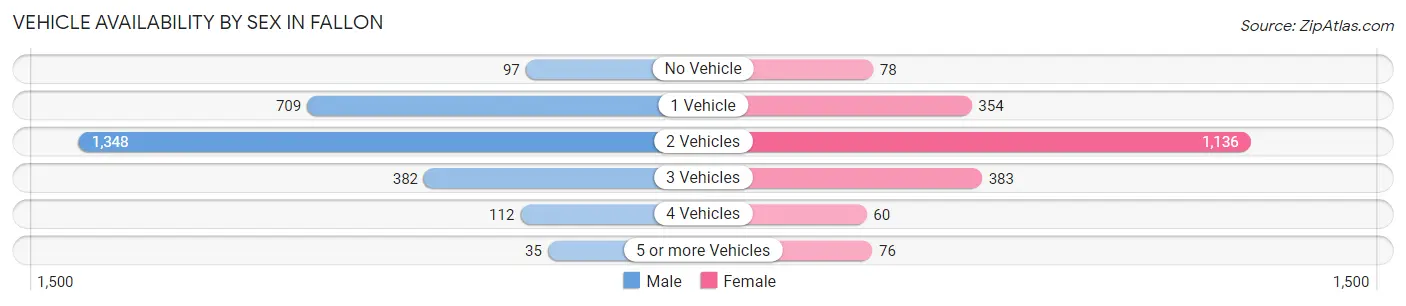
| Vehicles Available | Male | Female |
| No Vehicle | 97 (3.6%) | 78 (3.7%) |
| 1 Vehicle | 709 (26.4%) | 354 (17.0%) |
| 2 Vehicles | 1,348 (50.2%) | 1,136 (54.4%) |
| 3 Vehicles | 382 (14.2%) | 383 (18.3%) |
| 4 Vehicles | 112 (4.2%) | 60 (2.9%) |
| 5 or more Vehicles | 35 (1.3%) | 76 (3.6%) |
| Total | 2,683 (100.0%) | 2,087 (100.0%) |
Commute Time in Fallon
The most frequently occuring commute durations in Fallon are 10 to 14 minutes (1,122 commuters, 25.0%), 5 to 9 minutes (936 commuters, 20.9%), and 15 to 19 minutes (829 commuters, 18.5%).
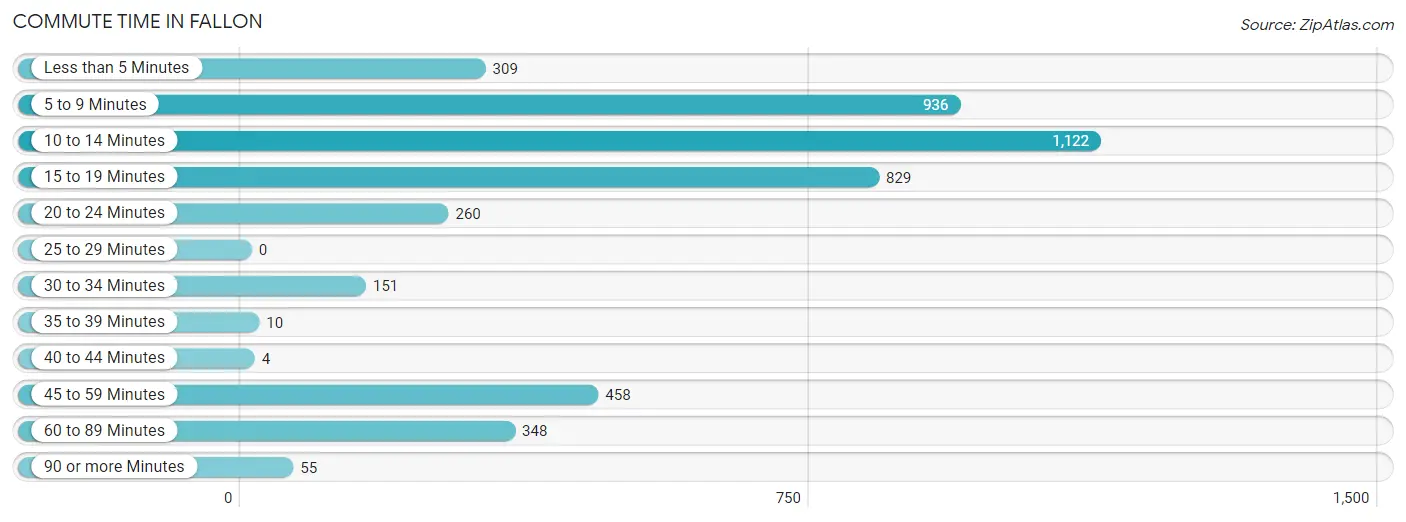
| Commute Time | # Commuters | % Commuters |
| Less than 5 Minutes | 309 | 6.9% |
| 5 to 9 Minutes | 936 | 20.9% |
| 10 to 14 Minutes | 1,122 | 25.0% |
| 15 to 19 Minutes | 829 | 18.5% |
| 20 to 24 Minutes | 260 | 5.8% |
| 25 to 29 Minutes | 0 | 0.0% |
| 30 to 34 Minutes | 151 | 3.4% |
| 35 to 39 Minutes | 10 | 0.2% |
| 40 to 44 Minutes | 4 | 0.1% |
| 45 to 59 Minutes | 458 | 10.2% |
| 60 to 89 Minutes | 348 | 7.8% |
| 90 or more Minutes | 55 | 1.2% |
Commute Time by Sex in Fallon
The most common commute times in Fallon are 15 to 19 minutes (588 commuters, 22.6%) for males and 10 to 14 minutes (592 commuters, 31.5%) for females.
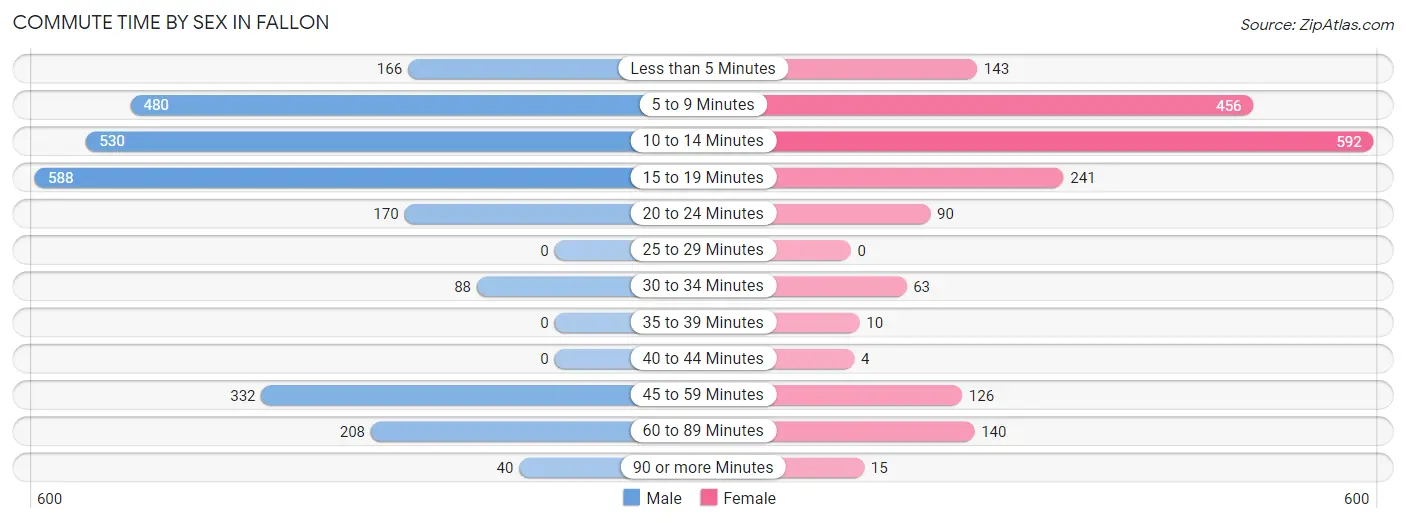
| Commute Time | Male | Female |
| Less than 5 Minutes | 166 (6.4%) | 143 (7.6%) |
| 5 to 9 Minutes | 480 (18.4%) | 456 (24.3%) |
| 10 to 14 Minutes | 530 (20.4%) | 592 (31.5%) |
| 15 to 19 Minutes | 588 (22.6%) | 241 (12.8%) |
| 20 to 24 Minutes | 170 (6.5%) | 90 (4.8%) |
| 25 to 29 Minutes | 0 (0.0%) | 0 (0.0%) |
| 30 to 34 Minutes | 88 (3.4%) | 63 (3.4%) |
| 35 to 39 Minutes | 0 (0.0%) | 10 (0.5%) |
| 40 to 44 Minutes | 0 (0.0%) | 4 (0.2%) |
| 45 to 59 Minutes | 332 (12.8%) | 126 (6.7%) |
| 60 to 89 Minutes | 208 (8.0%) | 140 (7.4%) |
| 90 or more Minutes | 40 (1.5%) | 15 (0.8%) |
Time of Departure to Work by Sex in Fallon
The most frequent times of departure to work in Fallon are 7:30 AM to 7:59 AM (466, 17.9%) for males and 7:30 AM to 7:59 AM (452, 24.0%) for females.
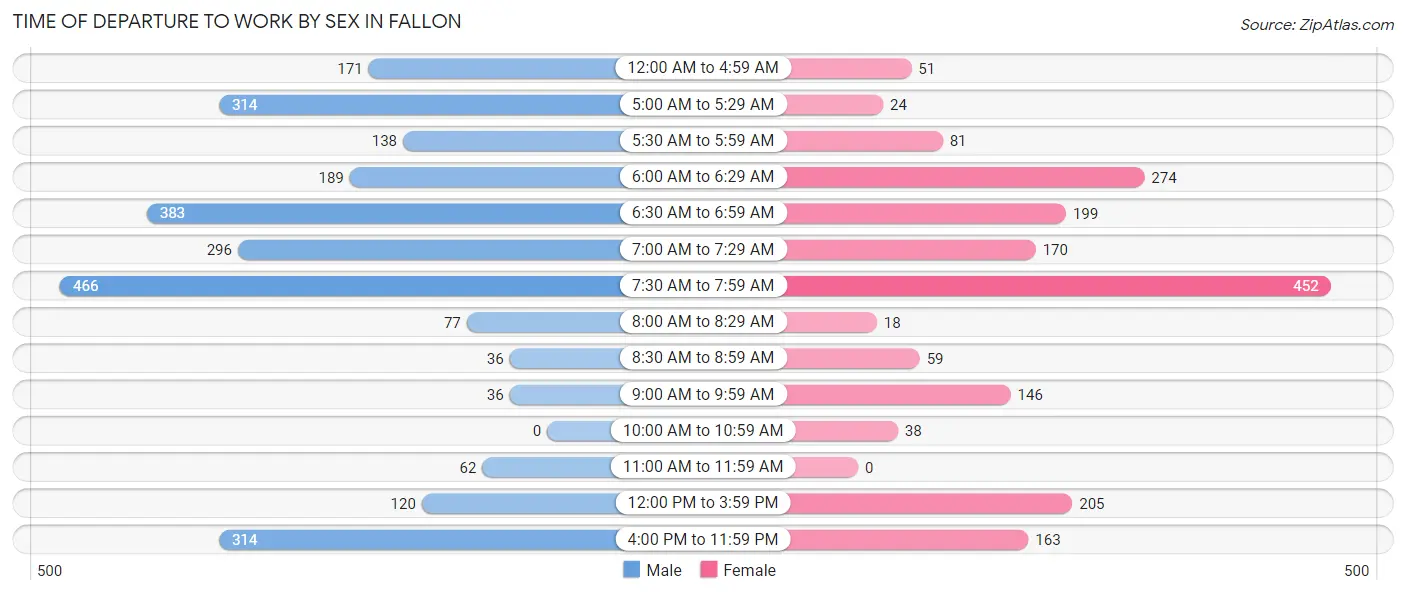
| Time of Departure | Male | Female |
| 12:00 AM to 4:59 AM | 171 (6.6%) | 51 (2.7%) |
| 5:00 AM to 5:29 AM | 314 (12.1%) | 24 (1.3%) |
| 5:30 AM to 5:59 AM | 138 (5.3%) | 81 (4.3%) |
| 6:00 AM to 6:29 AM | 189 (7.3%) | 274 (14.6%) |
| 6:30 AM to 6:59 AM | 383 (14.7%) | 199 (10.6%) |
| 7:00 AM to 7:29 AM | 296 (11.4%) | 170 (9.0%) |
| 7:30 AM to 7:59 AM | 466 (17.9%) | 452 (24.0%) |
| 8:00 AM to 8:29 AM | 77 (3.0%) | 18 (1.0%) |
| 8:30 AM to 8:59 AM | 36 (1.4%) | 59 (3.1%) |
| 9:00 AM to 9:59 AM | 36 (1.4%) | 146 (7.8%) |
| 10:00 AM to 10:59 AM | 0 (0.0%) | 38 (2.0%) |
| 11:00 AM to 11:59 AM | 62 (2.4%) | 0 (0.0%) |
| 12:00 PM to 3:59 PM | 120 (4.6%) | 205 (10.9%) |
| 4:00 PM to 11:59 PM | 314 (12.1%) | 163 (8.7%) |
| Total | 2,602 (100.0%) | 1,880 (100.0%) |
Housing Occupancy in Fallon
Occupancy by Ownership in Fallon
Of the total 4,029 dwellings in Fallon, owner-occupied units account for 1,820 (45.2%), while renter-occupied units make up 2,209 (54.8%).
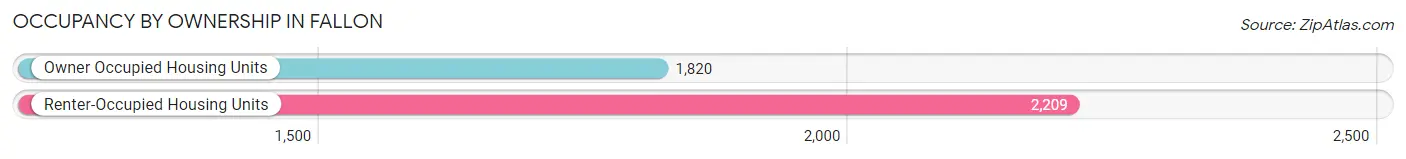
| Occupancy | # Housing Units | % Housing Units |
| Owner Occupied Housing Units | 1,820 | 45.2% |
| Renter-Occupied Housing Units | 2,209 | 54.8% |
| Total Occupied Housing Units | 4,029 | 100.0% |
Occupancy by Household Size in Fallon
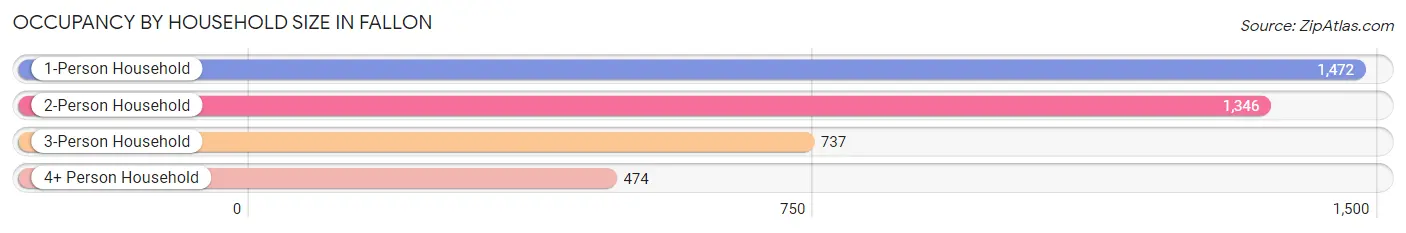
| Household Size | # Housing Units | % Housing Units |
| 1-Person Household | 1,472 | 36.5% |
| 2-Person Household | 1,346 | 33.4% |
| 3-Person Household | 737 | 18.3% |
| 4+ Person Household | 474 | 11.8% |
| Total Housing Units | 4,029 | 100.0% |
Occupancy by Ownership by Household Size in Fallon
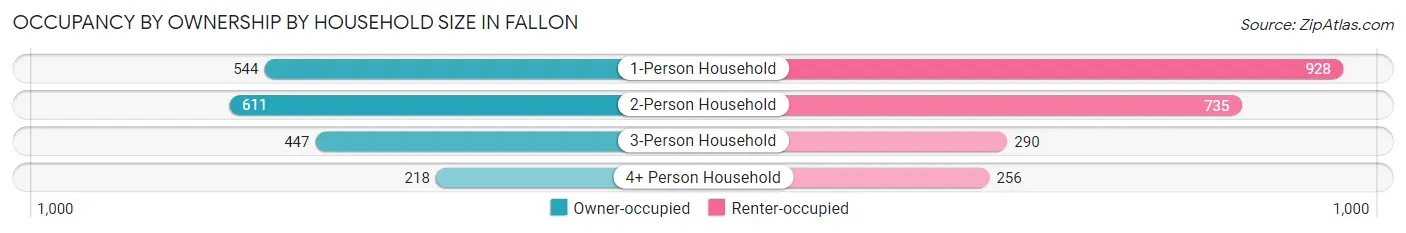
| Household Size | Owner-occupied | Renter-occupied |
| 1-Person Household | 544 (37.0%) | 928 (63.0%) |
| 2-Person Household | 611 (45.4%) | 735 (54.6%) |
| 3-Person Household | 447 (60.7%) | 290 (39.4%) |
| 4+ Person Household | 218 (46.0%) | 256 (54.0%) |
| Total Housing Units | 1,820 (45.2%) | 2,209 (54.8%) |
Occupancy by Educational Attainment in Fallon
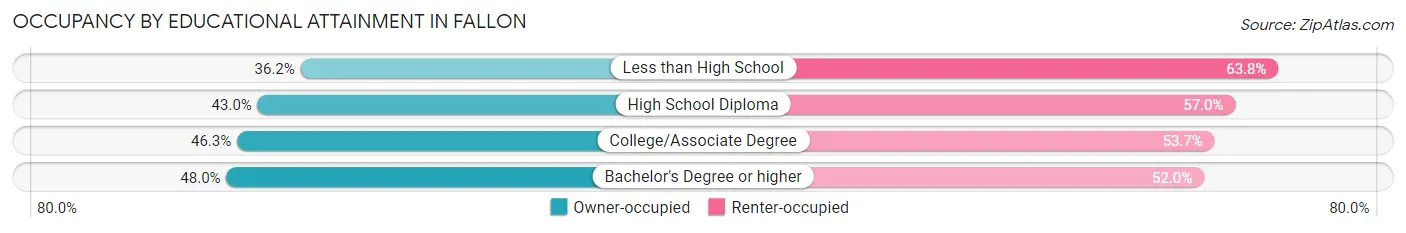
| Household Size | Owner-occupied | Renter-occupied |
| Less than High School | 46 (36.2%) | 81 (63.8%) |
| High School Diploma | 580 (43.0%) | 768 (57.0%) |
| College/Associate Degree | 872 (46.3%) | 1,011 (53.7%) |
| Bachelor's Degree or higher | 322 (48.0%) | 349 (52.0%) |
Occupancy by Age of Householder in Fallon
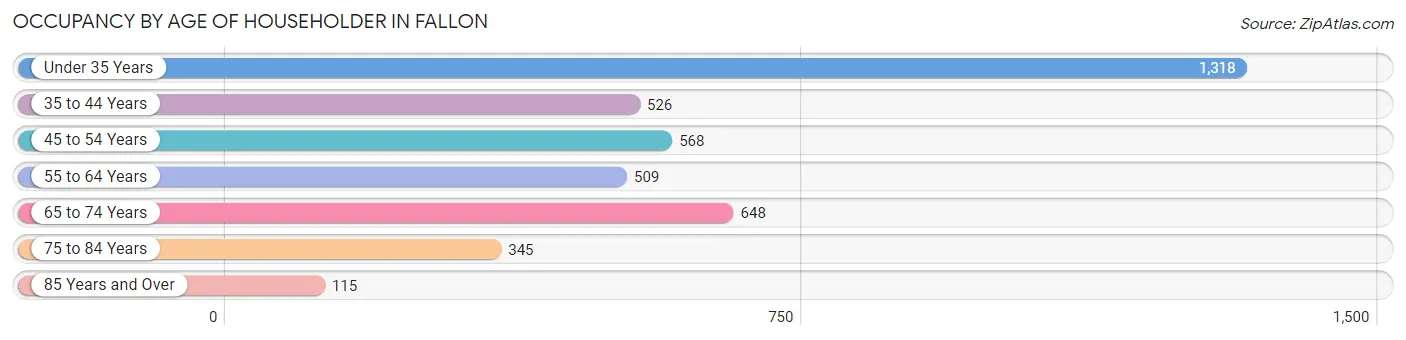
| Age Bracket | # Households | % Households |
| Under 35 Years | 1,318 | 32.7% |
| 35 to 44 Years | 526 | 13.1% |
| 45 to 54 Years | 568 | 14.1% |
| 55 to 64 Years | 509 | 12.6% |
| 65 to 74 Years | 648 | 16.1% |
| 75 to 84 Years | 345 | 8.6% |
| 85 Years and Over | 115 | 2.9% |
| Total | 4,029 | 100.0% |
Housing Finances in Fallon
Median Income by Occupancy in Fallon
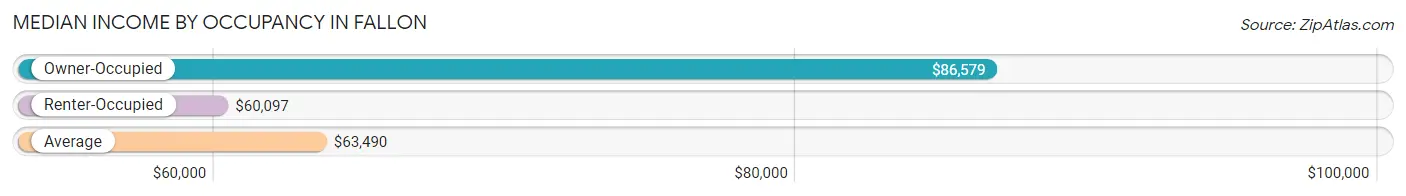
| Occupancy Type | # Households | Median Income |
| Owner-Occupied | 1,820 (45.2%) | $86,579 |
| Renter-Occupied | 2,209 (54.8%) | $60,097 |
| Average | 4,029 (100.0%) | $63,490 |
Occupancy by Householder Income Bracket in Fallon
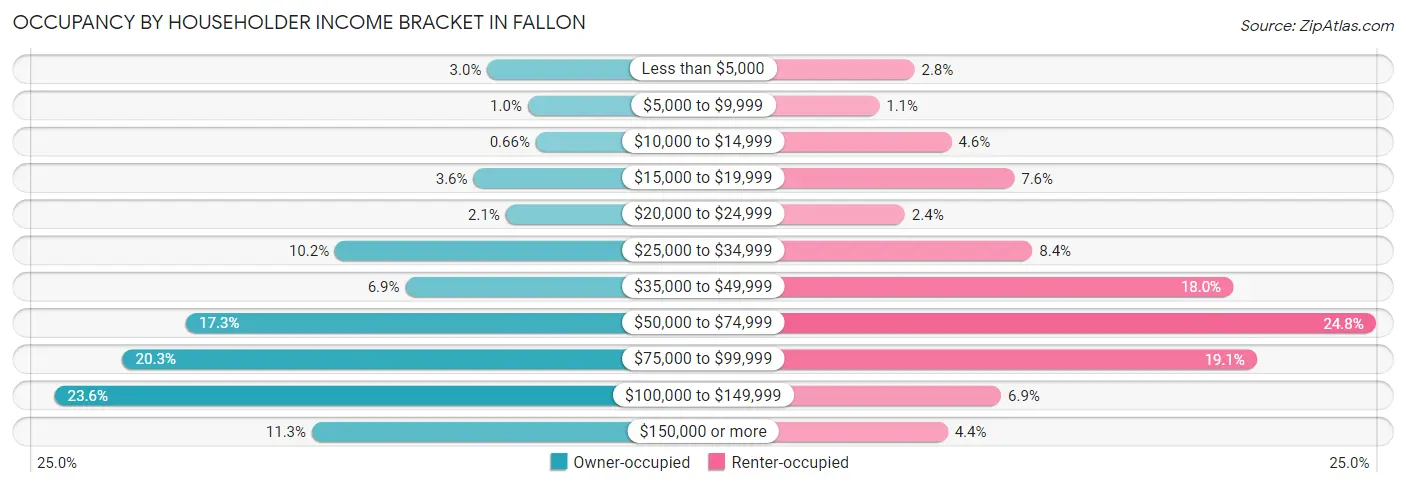
| Income Bracket | Owner-occupied | Renter-occupied |
| Less than $5,000 | 54 (3.0%) | 62 (2.8%) |
| $5,000 to $9,999 | 19 (1.0%) | 25 (1.1%) |
| $10,000 to $14,999 | 12 (0.7%) | 101 (4.6%) |
| $15,000 to $19,999 | 66 (3.6%) | 167 (7.6%) |
| $20,000 to $24,999 | 38 (2.1%) | 52 (2.4%) |
| $25,000 to $34,999 | 186 (10.2%) | 186 (8.4%) |
| $35,000 to $49,999 | 125 (6.9%) | 397 (18.0%) |
| $50,000 to $74,999 | 315 (17.3%) | 547 (24.8%) |
| $75,000 to $99,999 | 370 (20.3%) | 422 (19.1%) |
| $100,000 to $149,999 | 429 (23.6%) | 153 (6.9%) |
| $150,000 or more | 206 (11.3%) | 97 (4.4%) |
| Total | 1,820 (100.0%) | 2,209 (100.0%) |
Monthly Housing Cost Tiers in Fallon
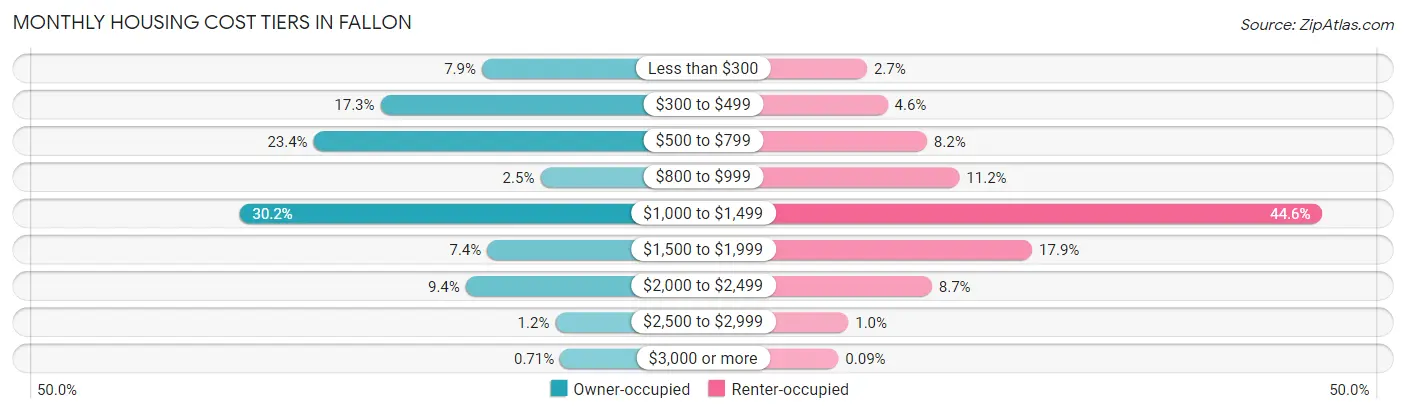
| Monthly Cost | Owner-occupied | Renter-occupied |
| Less than $300 | 144 (7.9%) | 60 (2.7%) |
| $300 to $499 | 314 (17.2%) | 102 (4.6%) |
| $500 to $799 | 426 (23.4%) | 182 (8.2%) |
| $800 to $999 | 46 (2.5%) | 248 (11.2%) |
| $1,000 to $1,499 | 550 (30.2%) | 986 (44.6%) |
| $1,500 to $1,999 | 135 (7.4%) | 396 (17.9%) |
| $2,000 to $2,499 | 171 (9.4%) | 192 (8.7%) |
| $2,500 to $2,999 | 21 (1.1%) | 22 (1.0%) |
| $3,000 or more | 13 (0.7%) | 2 (0.1%) |
| Total | 1,820 (100.0%) | 2,209 (100.0%) |
Physical Housing Characteristics in Fallon
Housing Structures in Fallon
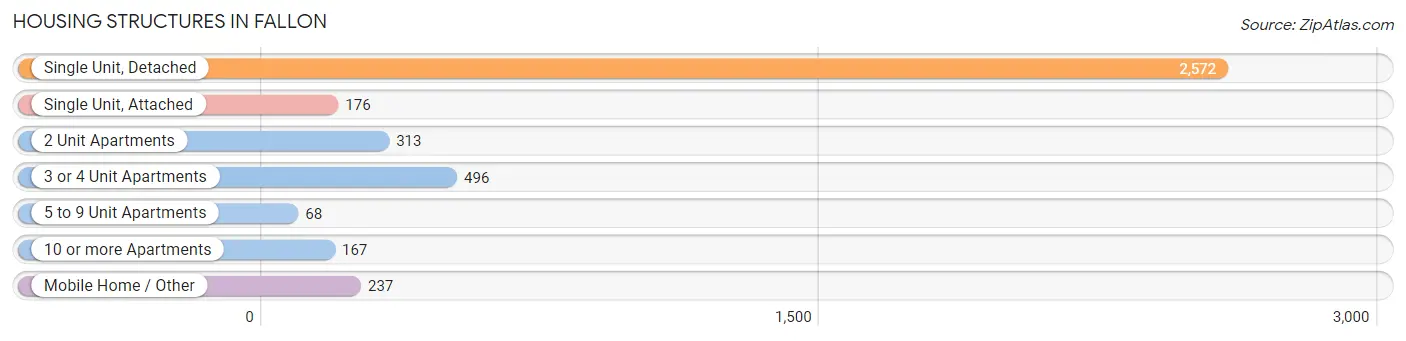
| Structure Type | # Housing Units | % Housing Units |
| Single Unit, Detached | 2,572 | 63.8% |
| Single Unit, Attached | 176 | 4.4% |
| 2 Unit Apartments | 313 | 7.8% |
| 3 or 4 Unit Apartments | 496 | 12.3% |
| 5 to 9 Unit Apartments | 68 | 1.7% |
| 10 or more Apartments | 167 | 4.1% |
| Mobile Home / Other | 237 | 5.9% |
| Total | 4,029 | 100.0% |
Housing Structures by Occupancy in Fallon
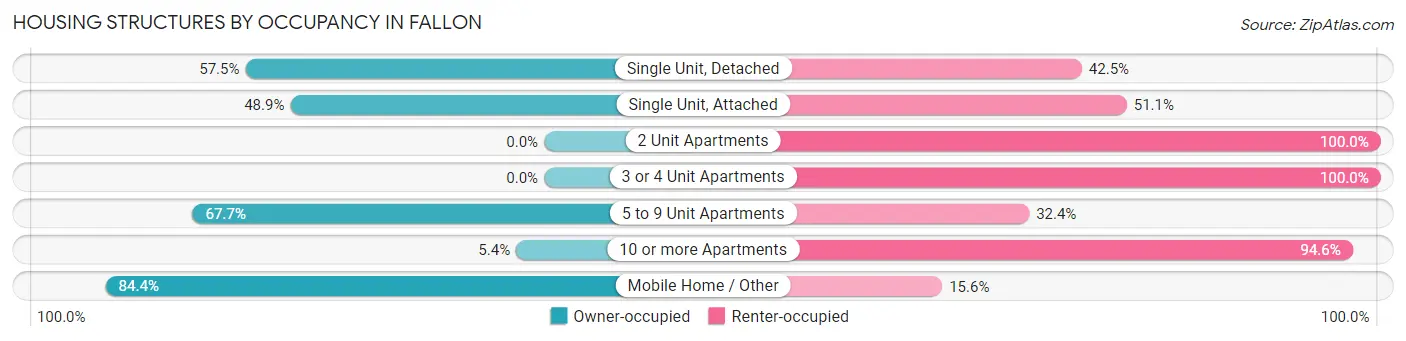
| Structure Type | Owner-occupied | Renter-occupied |
| Single Unit, Detached | 1,479 (57.5%) | 1,093 (42.5%) |
| Single Unit, Attached | 86 (48.9%) | 90 (51.1%) |
| 2 Unit Apartments | 0 (0.0%) | 313 (100.0%) |
| 3 or 4 Unit Apartments | 0 (0.0%) | 496 (100.0%) |
| 5 to 9 Unit Apartments | 46 (67.6%) | 22 (32.4%) |
| 10 or more Apartments | 9 (5.4%) | 158 (94.6%) |
| Mobile Home / Other | 200 (84.4%) | 37 (15.6%) |
| Total | 1,820 (45.2%) | 2,209 (54.8%) |
Housing Structures by Number of Rooms in Fallon
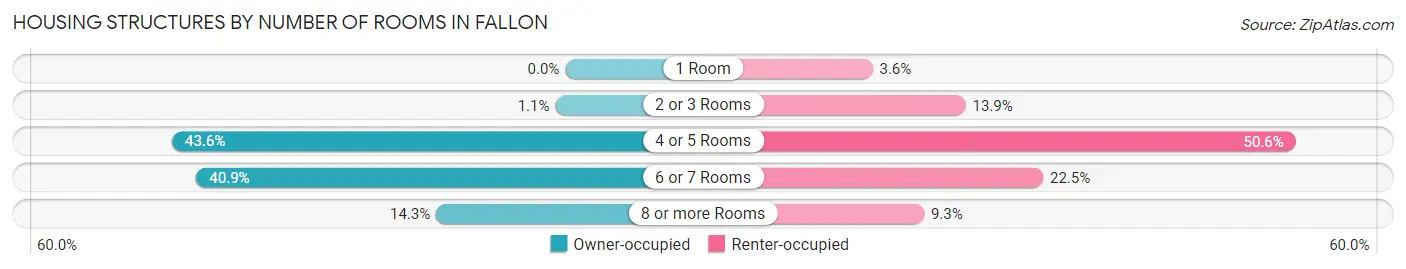
| Number of Rooms | Owner-occupied | Renter-occupied |
| 1 Room | 0 (0.0%) | 80 (3.6%) |
| 2 or 3 Rooms | 20 (1.1%) | 308 (13.9%) |
| 4 or 5 Rooms | 794 (43.6%) | 1,117 (50.6%) |
| 6 or 7 Rooms | 745 (40.9%) | 498 (22.5%) |
| 8 or more Rooms | 261 (14.3%) | 206 (9.3%) |
| Total | 1,820 (100.0%) | 2,209 (100.0%) |
Housing Structure by Heating Type in Fallon
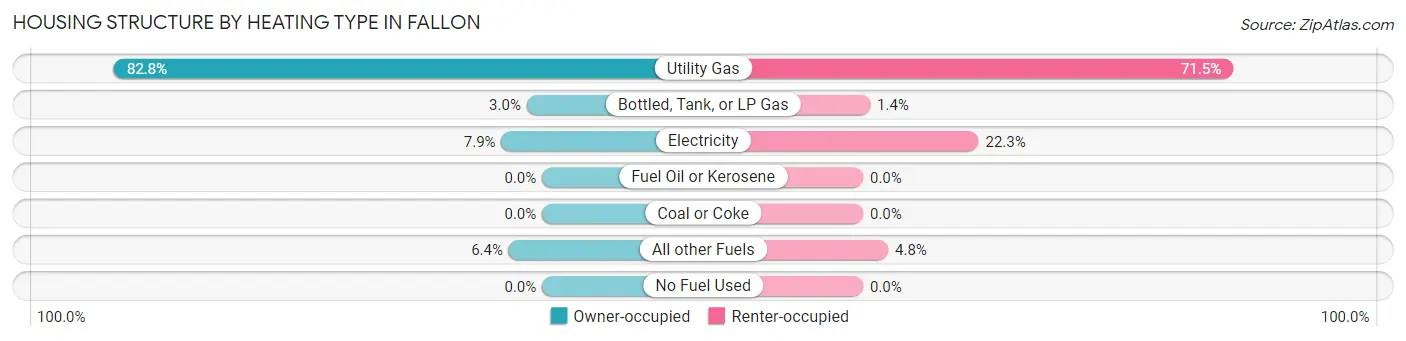
| Heating Type | Owner-occupied | Renter-occupied |
| Utility Gas | 1,506 (82.8%) | 1,579 (71.5%) |
| Bottled, Tank, or LP Gas | 54 (3.0%) | 30 (1.4%) |
| Electricity | 143 (7.9%) | 493 (22.3%) |
| Fuel Oil or Kerosene | 0 (0.0%) | 0 (0.0%) |
| Coal or Coke | 0 (0.0%) | 0 (0.0%) |
| All other Fuels | 117 (6.4%) | 107 (4.8%) |
| No Fuel Used | 0 (0.0%) | 0 (0.0%) |
| Total | 1,820 (100.0%) | 2,209 (100.0%) |
Household Vehicle Usage in Fallon
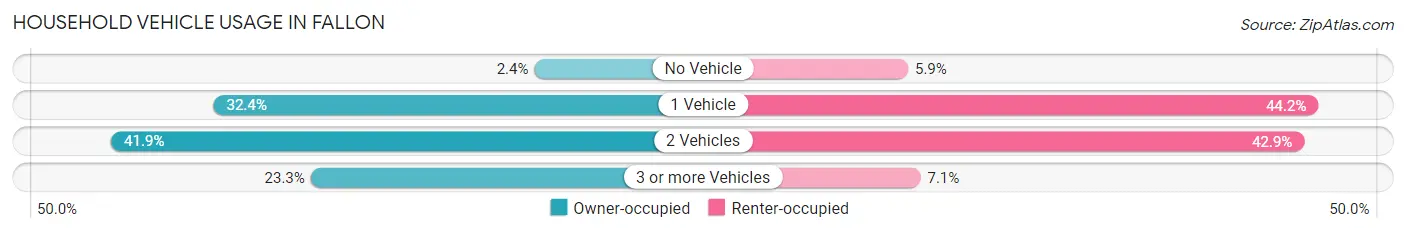
| Vehicles per Household | Owner-occupied | Renter-occupied |
| No Vehicle | 44 (2.4%) | 130 (5.9%) |
| 1 Vehicle | 589 (32.4%) | 976 (44.2%) |
| 2 Vehicles | 763 (41.9%) | 947 (42.9%) |
| 3 or more Vehicles | 424 (23.3%) | 156 (7.1%) |
| Total | 1,820 (100.0%) | 2,209 (100.0%) |
Real Estate & Mortgages in Fallon
Real Estate and Mortgage Overview in Fallon
| Characteristic | Without Mortgage | With Mortgage |
| Housing Units | 868 | 952 |
| Median Property Value | $219,700 | $260,700 |
| Median Household Income | $58,828 | $142 |
| Monthly Housing Costs | $491 | $13 |
| Real Estate Taxes | $1,564 | $10 |
Property Value by Mortgage Status in Fallon
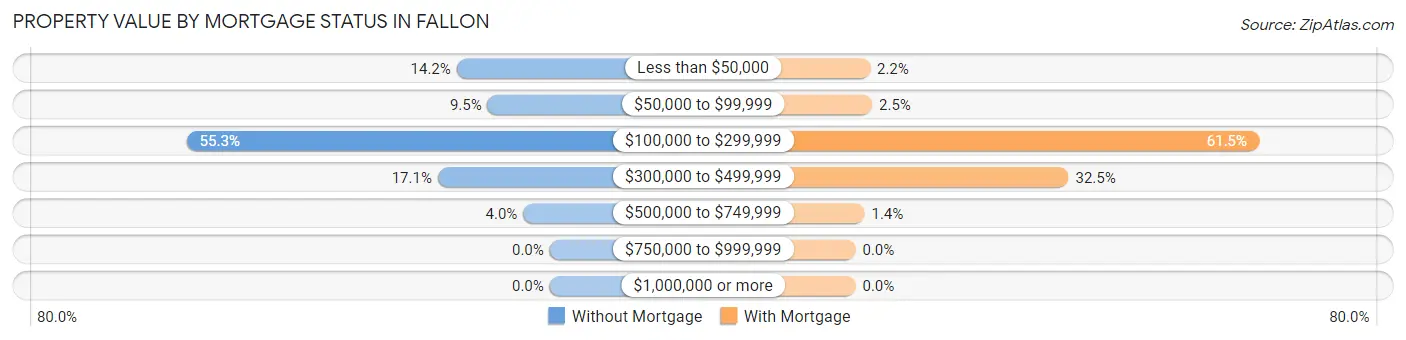
| Property Value | Without Mortgage | With Mortgage |
| Less than $50,000 | 123 (14.2%) | 21 (2.2%) |
| $50,000 to $99,999 | 82 (9.5%) | 24 (2.5%) |
| $100,000 to $299,999 | 480 (55.3%) | 585 (61.5%) |
| $300,000 to $499,999 | 148 (17.1%) | 309 (32.5%) |
| $500,000 to $749,999 | 35 (4.0%) | 13 (1.4%) |
| $750,000 to $999,999 | 0 (0.0%) | 0 (0.0%) |
| $1,000,000 or more | 0 (0.0%) | 0 (0.0%) |
| Total | 868 (100.0%) | 952 (100.0%) |
Household Income by Mortgage Status in Fallon
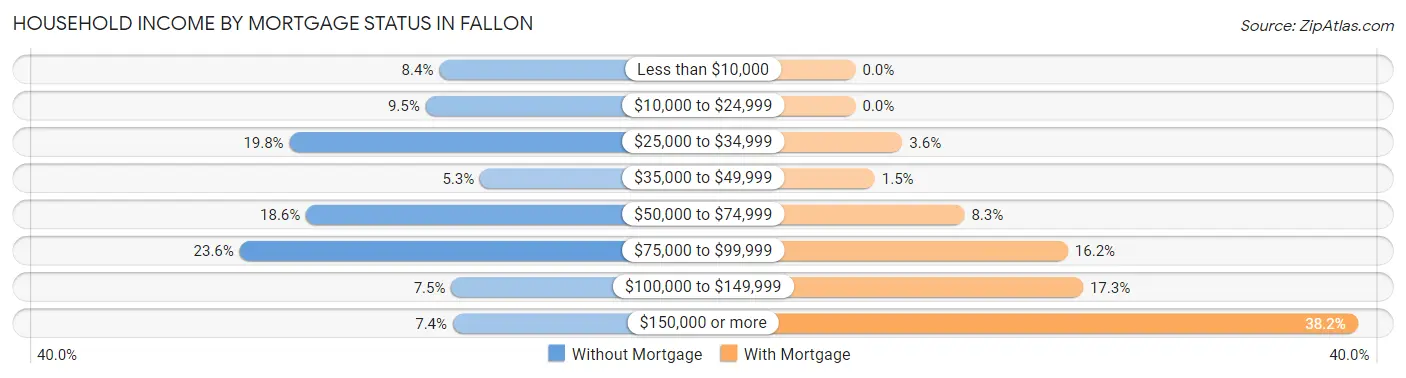
| Household Income | Without Mortgage | With Mortgage |
| Less than $10,000 | 73 (8.4%) | 0 (0.0%) |
| $10,000 to $24,999 | 82 (9.5%) | 0 (0.0%) |
| $25,000 to $34,999 | 172 (19.8%) | 34 (3.6%) |
| $35,000 to $49,999 | 46 (5.3%) | 14 (1.5%) |
| $50,000 to $74,999 | 161 (18.5%) | 79 (8.3%) |
| $75,000 to $99,999 | 205 (23.6%) | 154 (16.2%) |
| $100,000 to $149,999 | 65 (7.5%) | 165 (17.3%) |
| $150,000 or more | 64 (7.4%) | 364 (38.2%) |
| Total | 868 (100.0%) | 952 (100.0%) |
Property Value to Household Income Ratio in Fallon
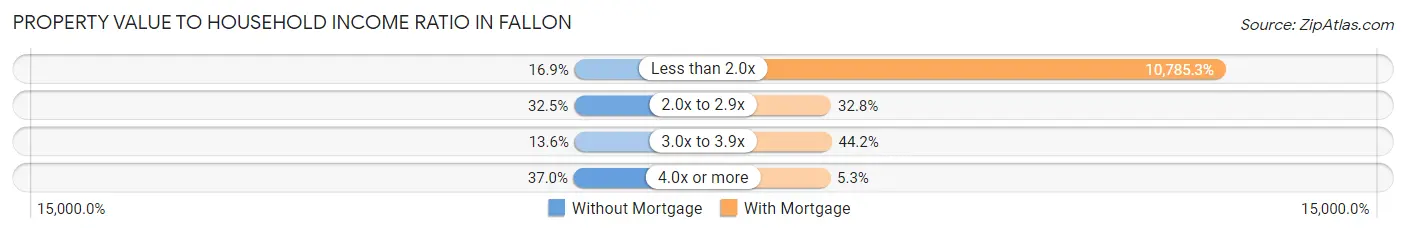
| Value-to-Income Ratio | Without Mortgage | With Mortgage |
| Less than 2.0x | 147 (16.9%) | 102,676 (10,785.3%) |
| 2.0x to 2.9x | 282 (32.5%) | 312 (32.8%) |
| 3.0x to 3.9x | 118 (13.6%) | 421 (44.2%) |
| 4.0x or more | 321 (37.0%) | 50 (5.2%) |
| Total | 868 (100.0%) | 952 (100.0%) |
Real Estate Taxes by Mortgage Status in Fallon
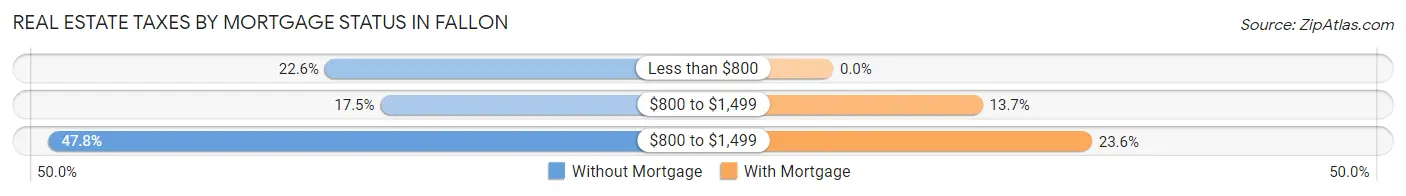
| Property Taxes | Without Mortgage | With Mortgage |
| Less than $800 | 196 (22.6%) | 0 (0.0%) |
| $800 to $1,499 | 152 (17.5%) | 130 (13.7%) |
| $800 to $1,499 | 415 (47.8%) | 225 (23.6%) |
| Total | 868 (100.0%) | 952 (100.0%) |
Health & Disability in Fallon
Health Insurance Coverage by Age in Fallon
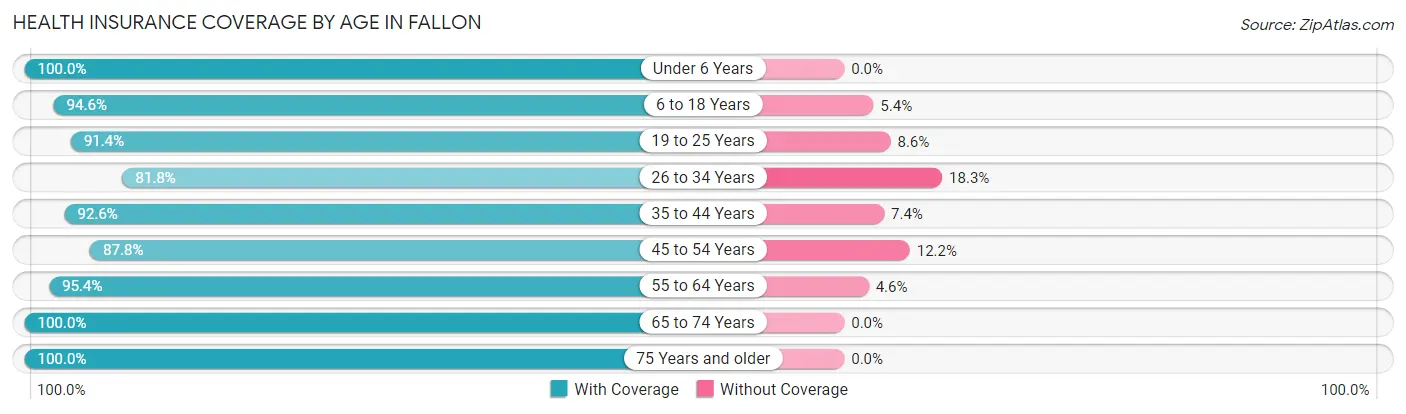
| Age Bracket | With Coverage | Without Coverage |
| Under 6 Years | 634 (100.0%) | 0 (0.0%) |
| 6 to 18 Years | 1,412 (94.6%) | 81 (5.4%) |
| 19 to 25 Years | 551 (91.4%) | 52 (8.6%) |
| 26 to 34 Years | 815 (81.8%) | 182 (18.2%) |
| 35 to 44 Years | 748 (92.6%) | 60 (7.4%) |
| 45 to 54 Years | 1,057 (87.8%) | 147 (12.2%) |
| 55 to 64 Years | 1,068 (95.4%) | 51 (4.6%) |
| 65 to 74 Years | 815 (100.0%) | 0 (0.0%) |
| 75 Years and older | 671 (100.0%) | 0 (0.0%) |
| Total | 7,771 (93.1%) | 573 (6.9%) |
Health Insurance Coverage by Citizenship Status in Fallon
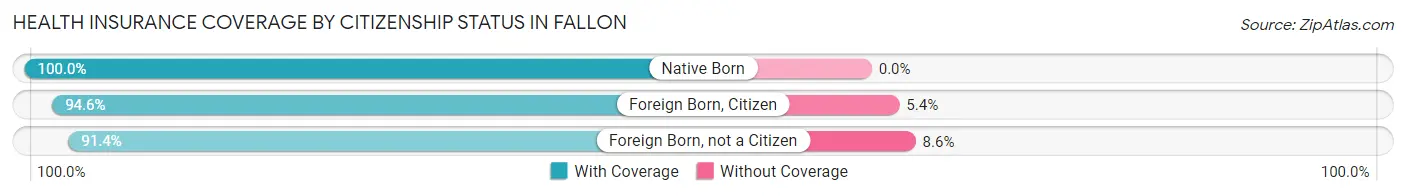
| Citizenship Status | With Coverage | Without Coverage |
| Native Born | 634 (100.0%) | 0 (0.0%) |
| Foreign Born, Citizen | 1,412 (94.6%) | 81 (5.4%) |
| Foreign Born, not a Citizen | 551 (91.4%) | 52 (8.6%) |
Health Insurance Coverage by Household Income in Fallon
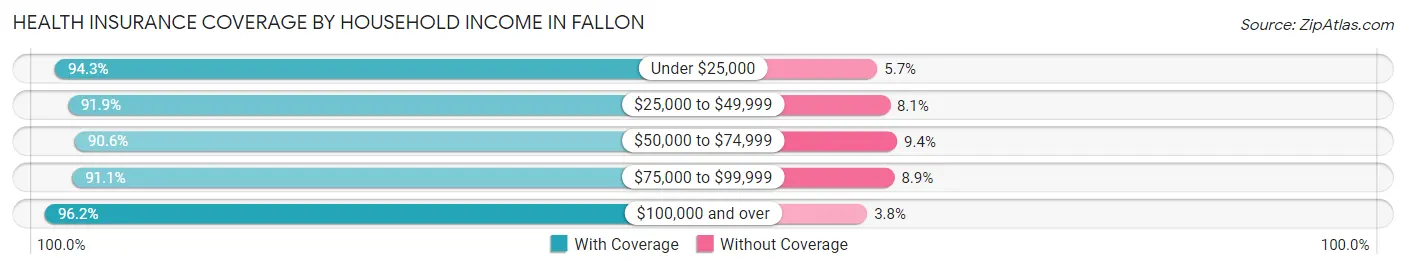
| Household Income | With Coverage | Without Coverage |
| Under $25,000 | 971 (94.3%) | 59 (5.7%) |
| $25,000 to $49,999 | 1,170 (91.9%) | 103 (8.1%) |
| $50,000 to $74,999 | 1,296 (90.6%) | 135 (9.4%) |
| $75,000 to $99,999 | 1,815 (91.1%) | 178 (8.9%) |
| $100,000 and over | 2,461 (96.2%) | 98 (3.8%) |
Public vs Private Health Insurance Coverage by Age in Fallon
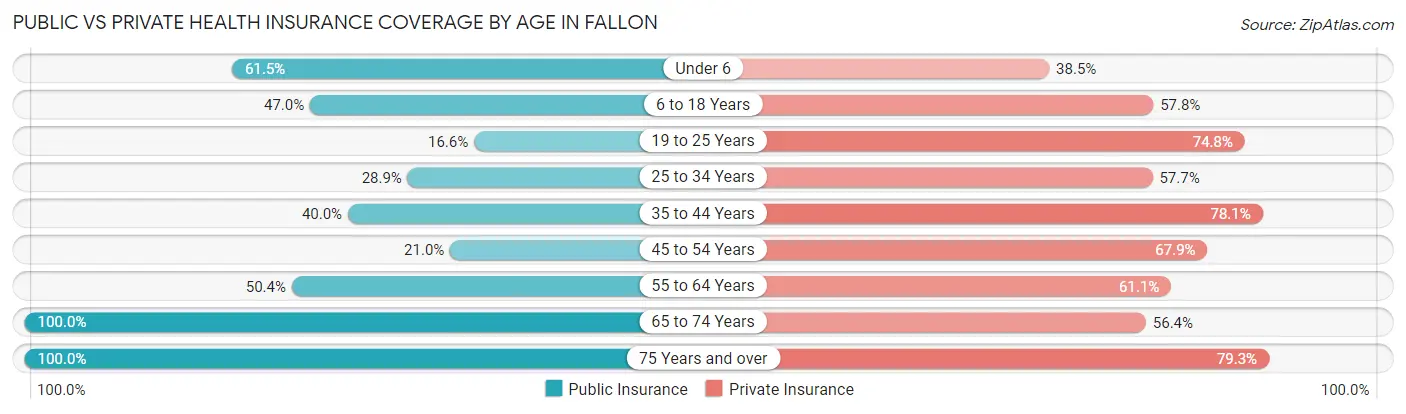
| Age Bracket | Public Insurance | Private Insurance |
| Under 6 | 390 (61.5%) | 244 (38.5%) |
| 6 to 18 Years | 702 (47.0%) | 863 (57.8%) |
| 19 to 25 Years | 100 (16.6%) | 451 (74.8%) |
| 25 to 34 Years | 288 (28.9%) | 575 (57.7%) |
| 35 to 44 Years | 323 (40.0%) | 631 (78.1%) |
| 45 to 54 Years | 253 (21.0%) | 817 (67.9%) |
| 55 to 64 Years | 564 (50.4%) | 684 (61.1%) |
| 65 to 74 Years | 815 (100.0%) | 460 (56.4%) |
| 75 Years and over | 671 (100.0%) | 532 (79.3%) |
| Total | 4,106 (49.2%) | 5,257 (63.0%) |
Disability Status by Sex by Age in Fallon
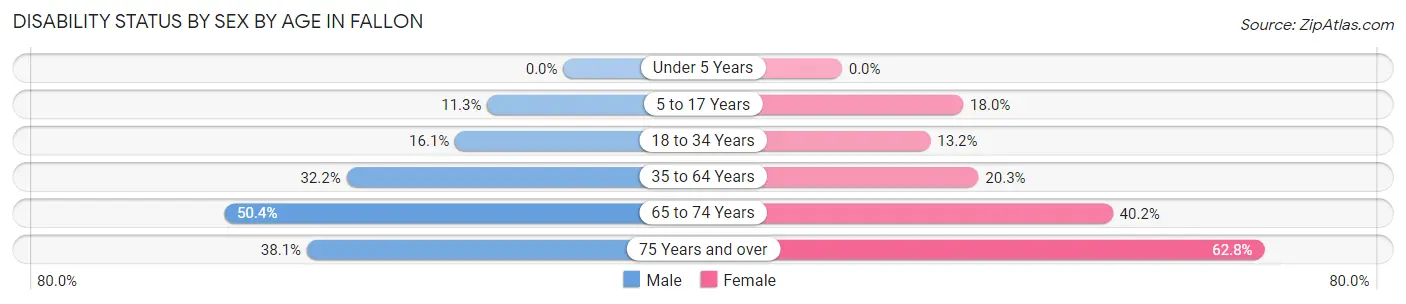
| Age Bracket | Male | Female |
| Under 5 Years | 0 (0.0%) | 0 (0.0%) |
| 5 to 17 Years | 79 (11.3%) | 140 (18.0%) |
| 18 to 34 Years | 143 (16.1%) | 106 (13.2%) |
| 35 to 64 Years | 548 (32.2%) | 290 (20.3%) |
| 65 to 74 Years | 130 (50.4%) | 224 (40.2%) |
| 75 Years and over | 139 (38.1%) | 192 (62.7%) |
Disability Class by Sex by Age in Fallon
Disability Class: Hearing Difficulty
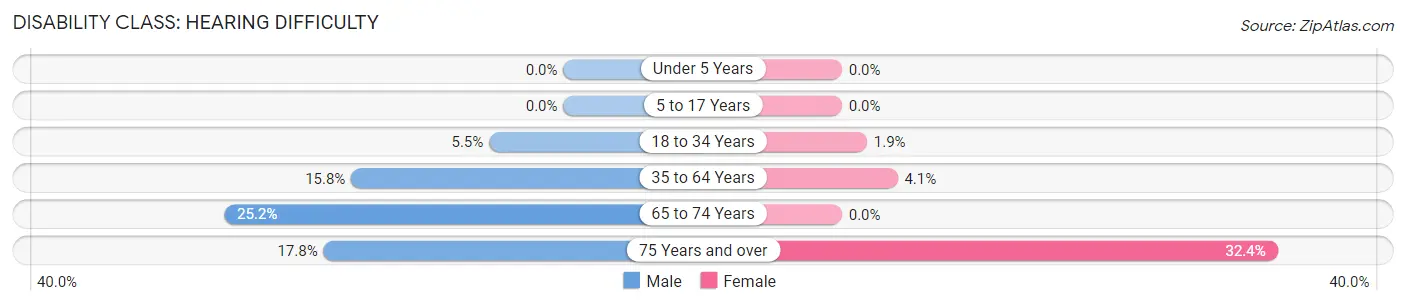
| Age Bracket | Male | Female |
| Under 5 Years | 0 (0.0%) | 0 (0.0%) |
| 5 to 17 Years | 0 (0.0%) | 0 (0.0%) |
| 18 to 34 Years | 49 (5.5%) | 15 (1.9%) |
| 35 to 64 Years | 268 (15.8%) | 59 (4.1%) |
| 65 to 74 Years | 65 (25.2%) | 0 (0.0%) |
| 75 Years and over | 65 (17.8%) | 99 (32.4%) |
Disability Class: Vision Difficulty
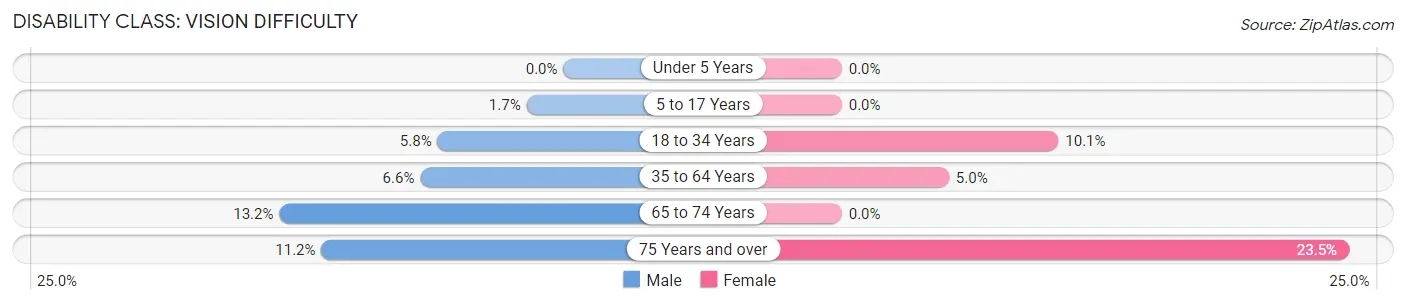
| Age Bracket | Male | Female |
| Under 5 Years | 0 (0.0%) | 0 (0.0%) |
| 5 to 17 Years | 12 (1.7%) | 0 (0.0%) |
| 18 to 34 Years | 52 (5.8%) | 81 (10.1%) |
| 35 to 64 Years | 113 (6.6%) | 71 (5.0%) |
| 65 to 74 Years | 34 (13.2%) | 0 (0.0%) |
| 75 Years and over | 41 (11.2%) | 72 (23.5%) |
Disability Class: Cognitive Difficulty
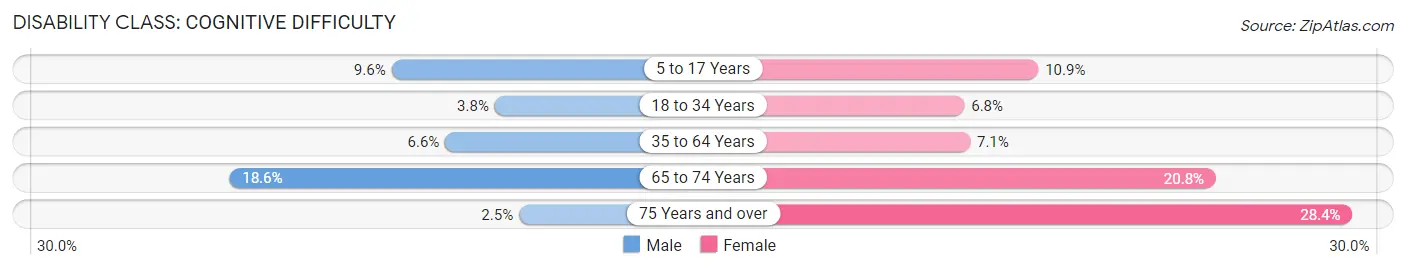
| Age Bracket | Male | Female |
| 5 to 17 Years | 67 (9.6%) | 85 (10.9%) |
| 18 to 34 Years | 34 (3.8%) | 55 (6.8%) |
| 35 to 64 Years | 112 (6.6%) | 102 (7.1%) |
| 65 to 74 Years | 48 (18.6%) | 116 (20.8%) |
| 75 Years and over | 9 (2.5%) | 87 (28.4%) |
Disability Class: Ambulatory Difficulty
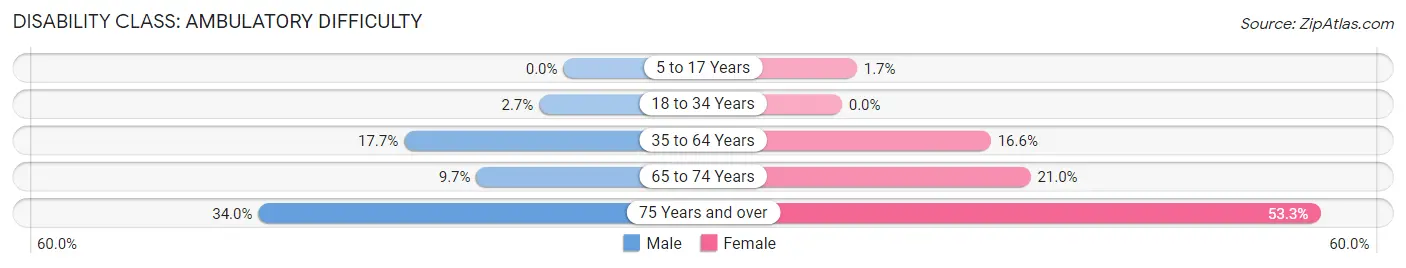
| Age Bracket | Male | Female |
| 5 to 17 Years | 0 (0.0%) | 13 (1.7%) |
| 18 to 34 Years | 24 (2.7%) | 0 (0.0%) |
| 35 to 64 Years | 302 (17.7%) | 237 (16.6%) |
| 65 to 74 Years | 25 (9.7%) | 117 (21.0%) |
| 75 Years and over | 124 (34.0%) | 163 (53.3%) |
Disability Class: Self-Care Difficulty
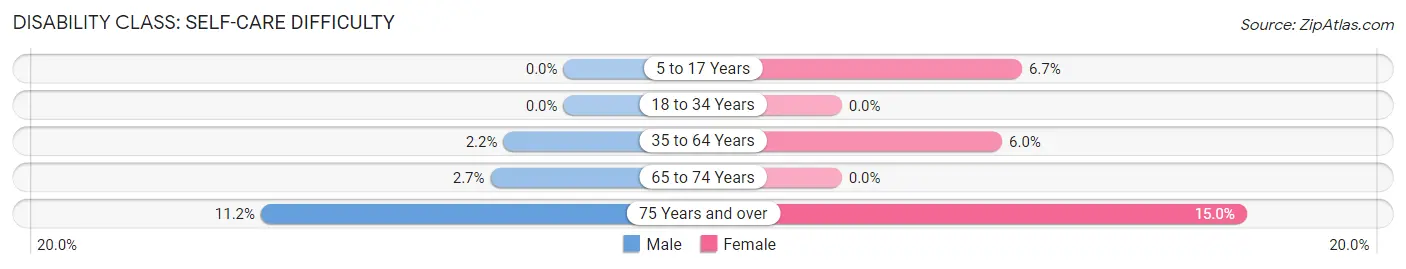
| Age Bracket | Male | Female |
| 5 to 17 Years | 0 (0.0%) | 52 (6.7%) |
| 18 to 34 Years | 0 (0.0%) | 0 (0.0%) |
| 35 to 64 Years | 38 (2.2%) | 85 (5.9%) |
| 65 to 74 Years | 7 (2.7%) | 0 (0.0%) |
| 75 Years and over | 41 (11.2%) | 46 (15.0%) |
Technology Access in Fallon
Computing Device Access in Fallon
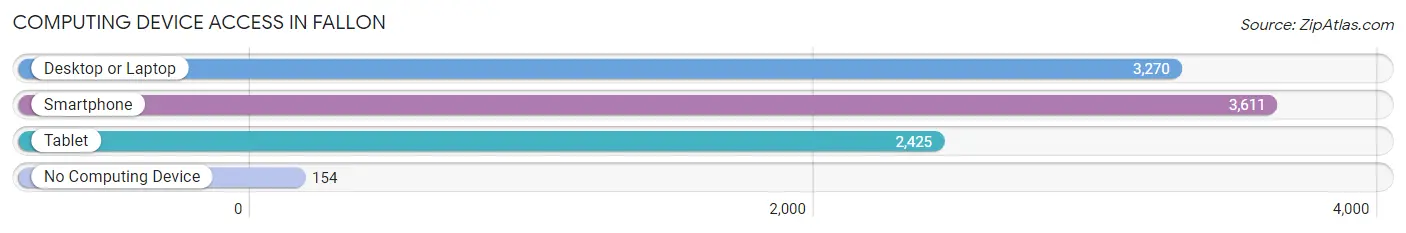
| Device Type | # Households | % Households |
| Desktop or Laptop | 3,270 | 81.2% |
| Smartphone | 3,611 | 89.6% |
| Tablet | 2,425 | 60.2% |
| No Computing Device | 154 | 3.8% |
| Total | 4,029 | 100.0% |
Internet Access in Fallon
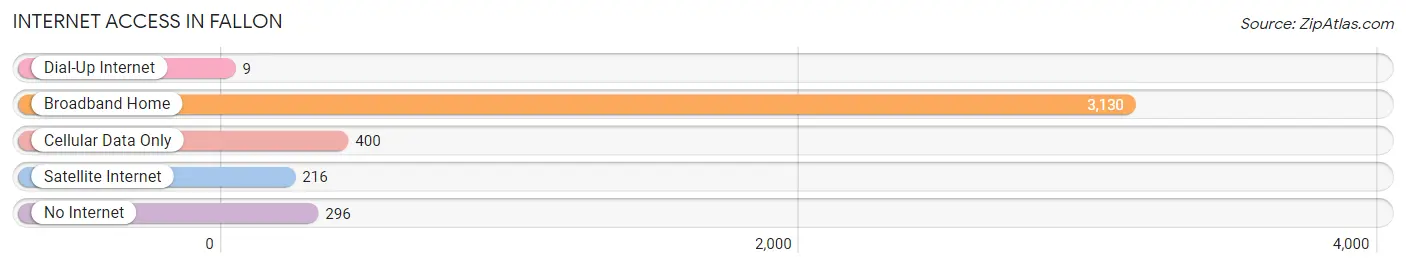
| Internet Type | # Households | % Households |
| Dial-Up Internet | 9 | 0.2% |
| Broadband Home | 3,130 | 77.7% |
| Cellular Data Only | 400 | 9.9% |
| Satellite Internet | 216 | 5.4% |
| No Internet | 296 | 7.3% |
| Total | 4,029 | 100.0% |
Fallon Summary
Fallon, Nevada is a small city located in the western part of the state, about 60 miles east of Reno. It is the county seat of Churchill County and is part of the Reno-Sparks metropolitan area. The city has a population of 8,606 as of the 2020 census, making it the largest city in Churchill County.
Geography
Fallon is located in the Lahontan Valley, a large desert valley in western Nevada. The city is situated at the intersection of U.S. Route 50 and U.S. Route 95, and is about 60 miles east of Reno. The city is surrounded by the Stillwater Range to the east, the Carson Range to the west, and the Hot Springs Range to the south. The city is located at an elevation of 4,541 feet above sea level.
Climate
Fallon has a semi-arid climate, with hot summers and cold winters. The average high temperature in July is 92°F, and the average low temperature in January is 24°F. The city receives an average of 8.5 inches of precipitation per year, with most of it falling in the winter months.
Demographics
As of the 2020 census, Fallon had a population of 8,606. The racial makeup of the city was 79.2% White, 1.3% African American, 1.2% Native American, 0.7% Asian, 0.2% Pacific Islander, 15.2% from other races, and 2.4% from two or more races. Hispanic or Latino of any race were 24.3% of the population.
Economy
Fallon is the economic center of Churchill County, and the city's economy is largely based on agriculture and military activities. The city is home to the Naval Air Station Fallon, which is the Navy's premier air-to-air and air-to-ground training facility. The base is the largest employer in the city, and it also serves as a major economic driver for the region.
Agriculture is also an important part of the local economy. The city is located in the heart of the Lahontan Valley, which is one of the most productive agricultural regions in the state. The valley is home to a variety of crops, including alfalfa, potatoes, onions, and wheat.
In addition to agriculture and military activities, Fallon is also home to a variety of other businesses, including manufacturing, retail, and tourism. The city is home to several wineries, and it is also a popular destination for outdoor recreation, such as hunting, fishing, and camping.
Conclusion
Fallon, Nevada is a small city located in the western part of the state, about 60 miles east of Reno. It is the county seat of Churchill County and is part of the Reno-Sparks metropolitan area. The city has a population of 8,606 as of the 2020 census, making it the largest city in Churchill County. The city is situated at the intersection of U.S. Route 50 and U.S. Route 95, and is surrounded by the Stillwater Range to the east, the Carson Range to the west, and the Hot Springs Range to the south. The city has a semi-arid climate, with hot summers and cold winters. The city's economy is largely based on agriculture and military activities, with the Naval Air Station Fallon being the largest employer in the city. Agriculture is also an important part of the local economy, and the city is home to a variety of other businesses, including manufacturing, retail, and tourism.
Common Questions
What is Per Capita Income in Fallon?
Per Capita income in Fallon is $34,811.
What is the Median Family Income in Fallon?
Median Family Income in Fallon is $80,750.
What is the Median Household income in Fallon?
Median Household Income in Fallon is $63,490.
What is Income or Wage Gap in Fallon?
Income or Wage Gap in Fallon is 34.7%.
Women in Fallon earn 65.3 cents for every dollar earned by a man.
What is Inequality or Gini Index in Fallon?
Inequality or Gini Index in Fallon is 0.38.
What is the Total Population of Fallon?
Total Population of Fallon is 9,243.
What is the Total Male Population of Fallon?
Total Male Population of Fallon is 4,840.
What is the Total Female Population of Fallon?
Total Female Population of Fallon is 4,403.
What is the Ratio of Males per 100 Females in Fallon?
There are 109.93 Males per 100 Females in Fallon.
What is the Ratio of Females per 100 Males in Fallon?
There are 90.97 Females per 100 Males in Fallon.
What is the Median Population Age in Fallon?
Median Population Age in Fallon is 37.3 Years.
What is the Average Family Size in Fallon
Average Family Size in Fallon is 3.0 People.
What is the Average Household Size in Fallon
Average Household Size in Fallon is 2.2 People.
How Large is the Labor Force in Fallon?
There are 5,012 People in the Labor Forcein in Fallon.
What is the Percentage of People in the Labor Force in Fallon?
67.8% of People are in the Labor Force in Fallon.
What is the Unemployment Rate in Fallon?
Unemployment Rate in Fallon is 4.4%.