Atmore, AL Map & Demographics
Atmore Map
Atmore Overview
$15,060
PER CAPITA INCOME
$48,542
AVG FAMILY INCOME
$30,472
AVG HOUSEHOLD INCOME
30.3%
WAGE / INCOME GAP [ % ]
69.7¢/ $1
WAGE / INCOME GAP [ $ ]
0.50
INEQUALITY / GINI INDEX
8,465
TOTAL POPULATION
5,228
MALE POPULATION
3,237
FEMALE POPULATION
161.51
MALES / 100 FEMALES
61.92
FEMALES / 100 MALES
43.3
MEDIAN AGE
4.1
AVG FAMILY SIZE
2.3
AVG HOUSEHOLD SIZE
2,341
LABOR FORCE [ PEOPLE ]
31.9%
PERCENT IN LABOR FORCE
8.3%
UNEMPLOYMENT RATE
Atmore Area Codes
Income in Atmore
Income Overview in Atmore
Per Capita Income in Atmore is $15,060, while median incomes of families and households are $48,542 and $30,472 respectively.
| Characteristic | Number | Measure |
| Per Capita Income | 8,465 | $15,060 |
| Median Family Income | 1,108 | $48,542 |
| Mean Family Income | 1,108 | $59,680 |
| Median Household Income | 2,725 | $30,472 |
| Mean Household Income | 2,725 | $40,409 |
| Income Deficit | 1,108 | $0 |
| Wage / Income Gap (%) | 8,465 | 30.28% |
| Wage / Income Gap ($) | 8,465 | 69.72¢ per $1 |
| Gini / Inequality Index | 8,465 | 0.50 |
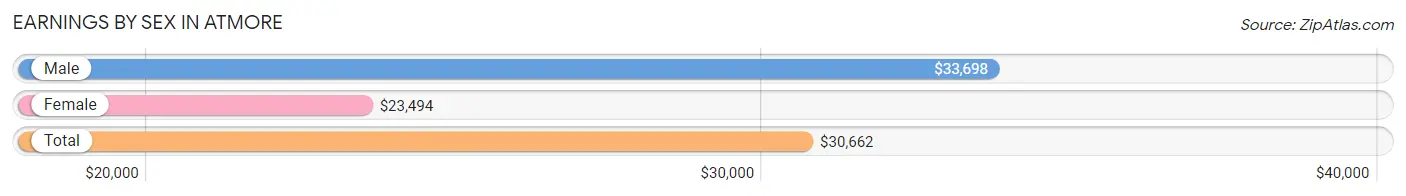
Earnings by Sex in Atmore
Average Earnings in Atmore are $30,662, $33,698 for men and $23,494 for women, a difference of 30.3%.
| Sex | Number | Average Earnings |
| Male | 1,442 (56.3%) | $33,698 |
| Female | 1,119 (43.7%) | $23,494 |
| Total | 2,561 (100.0%) | $30,662 |
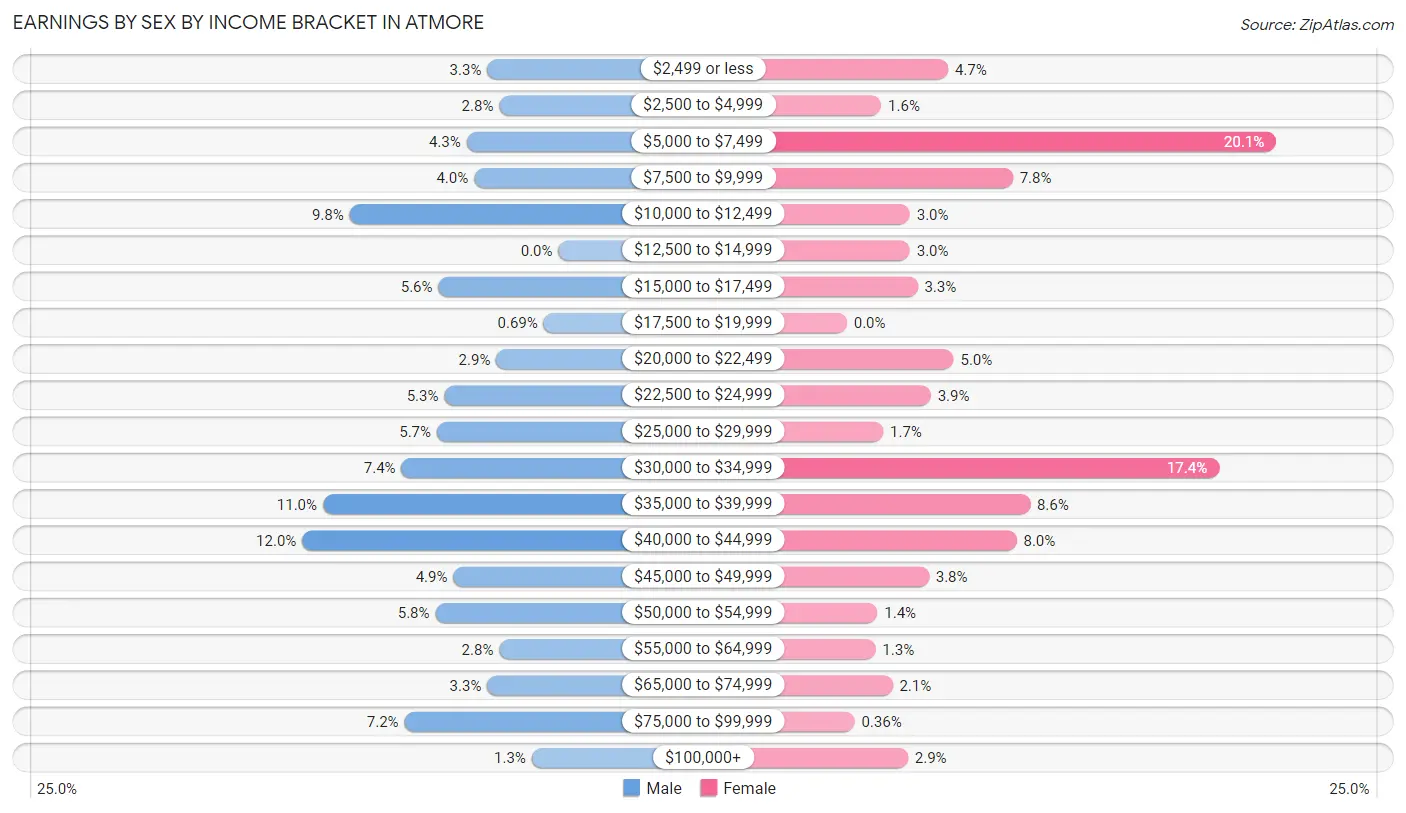
Earnings by Sex by Income Bracket in Atmore
The most common earnings brackets in Atmore are $40,000 to $44,999 for men (173 | 12.0%) and $5,000 to $7,499 for women (225 | 20.1%).
| Income | Male | Female |
| $2,499 or less | 48 (3.3%) | 53 (4.7%) |
| $2,500 to $4,999 | 40 (2.8%) | 18 (1.6%) |
| $5,000 to $7,499 | 62 (4.3%) | 225 (20.1%) |
| $7,500 to $9,999 | 57 (4.0%) | 87 (7.8%) |
| $10,000 to $12,499 | 141 (9.8%) | 33 (2.9%) |
| $12,500 to $14,999 | 0 (0.0%) | 33 (2.9%) |
| $15,000 to $17,499 | 81 (5.6%) | 37 (3.3%) |
| $17,500 to $19,999 | 10 (0.7%) | 0 (0.0%) |
| $20,000 to $22,499 | 42 (2.9%) | 56 (5.0%) |
| $22,500 to $24,999 | 77 (5.3%) | 44 (3.9%) |
| $25,000 to $29,999 | 82 (5.7%) | 19 (1.7%) |
| $30,000 to $34,999 | 106 (7.3%) | 195 (17.4%) |
| $35,000 to $39,999 | 159 (11.0%) | 96 (8.6%) |
| $40,000 to $44,999 | 173 (12.0%) | 89 (8.0%) |
| $45,000 to $49,999 | 71 (4.9%) | 43 (3.8%) |
| $50,000 to $54,999 | 83 (5.8%) | 16 (1.4%) |
| $55,000 to $64,999 | 40 (2.8%) | 15 (1.3%) |
| $65,000 to $74,999 | 48 (3.3%) | 24 (2.1%) |
| $75,000 to $99,999 | 104 (7.2%) | 4 (0.4%) |
| $100,000+ | 18 (1.3%) | 32 (2.9%) |
| Total | 1,442 (100.0%) | 1,119 (100.0%) |
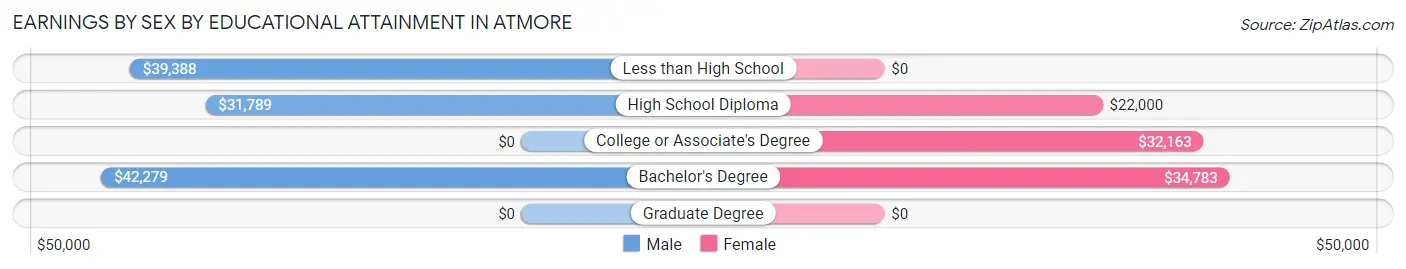
Earnings by Sex by Educational Attainment in Atmore
Average earnings in Atmore are $34,839 for men and $31,277 for women, a difference of 10.2%. Men with an educational attainment of bachelor's degree enjoy the highest average annual earnings of $42,279, while those with high school diploma education earn the least with $31,789. Women with an educational attainment of bachelor's degree earn the most with the average annual earnings of $34,783, while those with high school diploma education have the smallest earnings of $22,000.
| Educational Attainment | Male Income | Female Income |
| Less than High School | $39,388 | $0 |
| High School Diploma | $31,789 | $22,000 |
| College or Associate's Degree | - | - |
| Bachelor's Degree | $42,279 | $34,783 |
| Graduate Degree | - | - |
| Total | $34,839 | $31,277 |
Family Income in Atmore
Family Income Brackets in Atmore
According to the Atmore family income data, there are 202 families falling into the $50,000 to $74,999 income range, which is the most common income bracket and makes up 18.2% of all families. Conversely, the $200,000+ income bracket is the least frequent group with only 8 families (0.7%) belonging to this category.
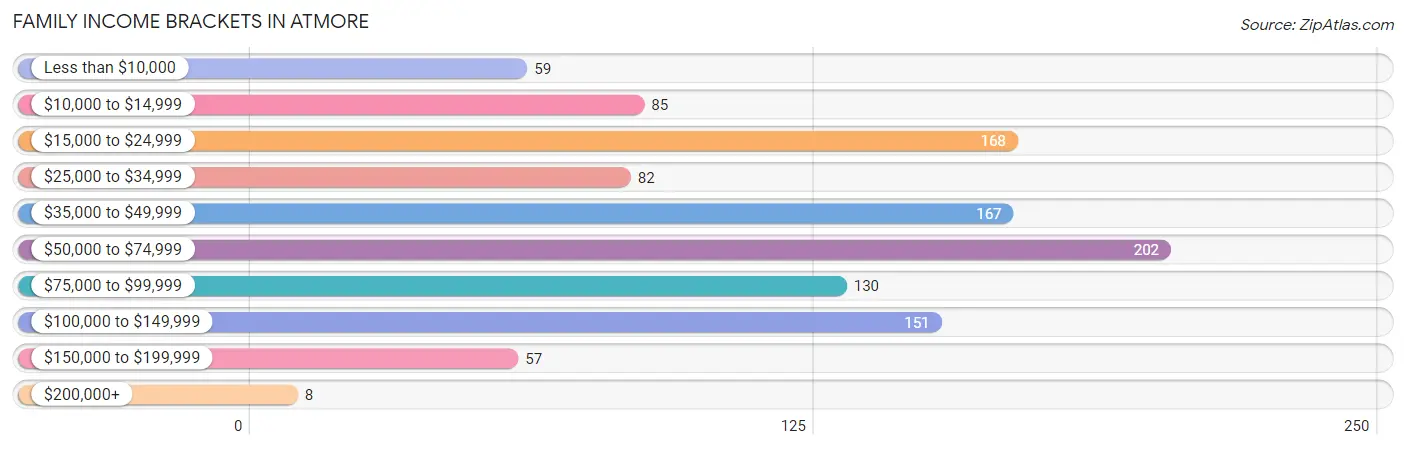
| Income Bracket | # Families | % Families |
| Less than $10,000 | 59 | 5.3% |
| $10,000 to $14,999 | 85 | 7.7% |
| $15,000 to $24,999 | 168 | 15.2% |
| $25,000 to $34,999 | 82 | 7.4% |
| $35,000 to $49,999 | 167 | 15.1% |
| $50,000 to $74,999 | 202 | 18.2% |
| $75,000 to $99,999 | 130 | 11.7% |
| $100,000 to $149,999 | 151 | 13.6% |
| $150,000 to $199,999 | 57 | 5.1% |
| $200,000+ | 8 | 0.7% |
Family Income by Famaliy Size in Atmore
3-person families (262 | 23.6%) account for the highest median family income in Atmore with $57,000 per family, while 2-person families (512 | 46.2%) have the highest median income of $20,766 per family member.
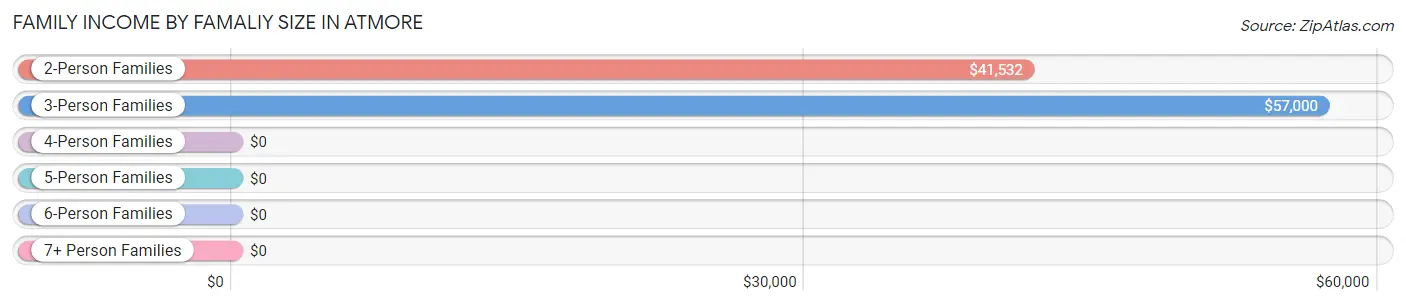
| Income Bracket | # Families | Median Income |
| 2-Person Families | 512 (46.2%) | $41,532 |
| 3-Person Families | 262 (23.6%) | $57,000 |
| 4-Person Families | 215 (19.4%) | $0 |
| 5-Person Families | 70 (6.3%) | $0 |
| 6-Person Families | 24 (2.2%) | $0 |
| 7+ Person Families | 25 (2.3%) | $0 |
| Total | 1,108 (100.0%) | $48,542 |
Family Income by Number of Earners in Atmore
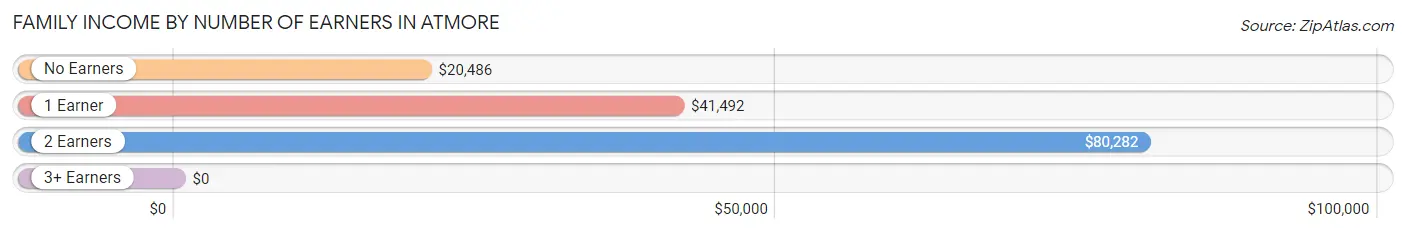
| Number of Earners | # Families | Median Income |
| No Earners | 284 (25.6%) | $20,486 |
| 1 Earner | 363 (32.8%) | $41,492 |
| 2 Earners | 375 (33.8%) | $80,282 |
| 3+ Earners | 86 (7.8%) | $0 |
| Total | 1,108 (100.0%) | $48,542 |
Household Income in Atmore
Household Income Brackets in Atmore
With 441 households falling in the category, the $15,000 to $24,999 income range is the most frequent in Atmore, accounting for 16.2% of all households. In contrast, only 8 households (0.3%) fall into the $200,000+ income bracket, making it the least populous group.
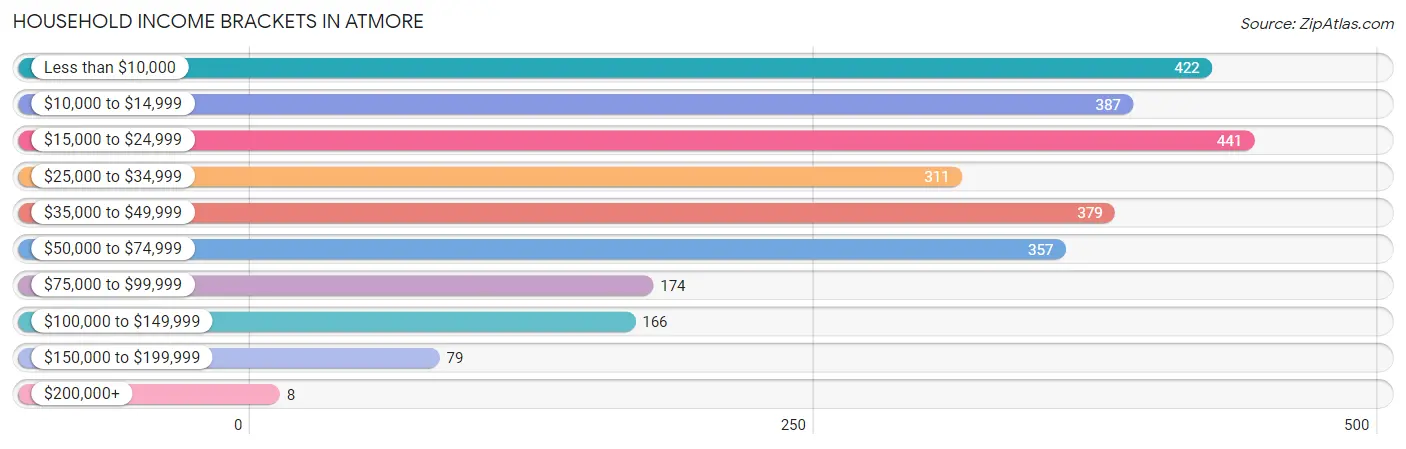
| Income Bracket | # Households | % Households |
| Less than $10,000 | 422 | 15.5% |
| $10,000 to $14,999 | 387 | 14.2% |
| $15,000 to $24,999 | 441 | 16.2% |
| $25,000 to $34,999 | 311 | 11.4% |
| $35,000 to $49,999 | 379 | 13.9% |
| $50,000 to $74,999 | 357 | 13.1% |
| $75,000 to $99,999 | 174 | 6.4% |
| $100,000 to $149,999 | 166 | 6.1% |
| $150,000 to $199,999 | 79 | 2.9% |
| $200,000+ | 8 | 0.3% |
Household Income by Householder Age in Atmore
The median household income in Atmore is $30,472, with the highest median household income of $33,761 found in the 65+ years age bracket for the primary householder. A total of 1,082 households (39.7%) fall into this category. Meanwhile, the 15 to 24 years age bracket for the primary householder has the lowest median household income of $0, with 169 households (6.2%) in this group.
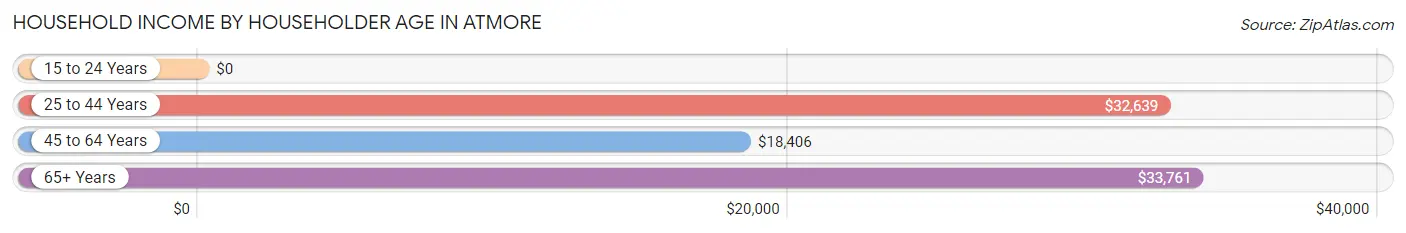
| Income Bracket | # Households | Median Income |
| 15 to 24 Years | 169 (6.2%) | $0 |
| 25 to 44 Years | 501 (18.4%) | $32,639 |
| 45 to 64 Years | 973 (35.7%) | $18,406 |
| 65+ Years | 1,082 (39.7%) | $33,761 |
| Total | 2,725 (100.0%) | $30,472 |
Poverty in Atmore
Income Below Poverty by Sex and Age in Atmore
With 37.6% poverty level for males and 38.9% for females among the residents of Atmore, 12 to 14 year old males and 6 to 11 year old females are the most vulnerable to poverty, with 86 males (94.5%) and 33 females (100.0%) in their respective age groups living below the poverty level.
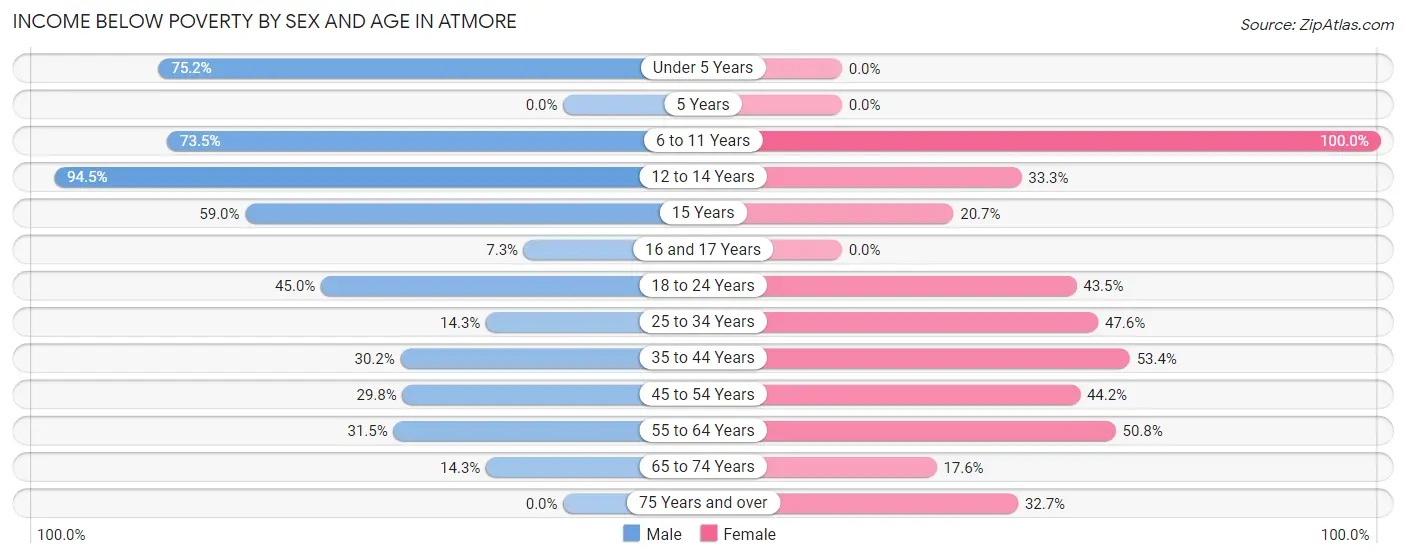
| Age Bracket | Male | Female |
| Under 5 Years | 357 (75.2%) | 0 (0.0%) |
| 5 Years | 0 (0.0%) | 0 (0.0%) |
| 6 to 11 Years | 164 (73.5%) | 33 (100.0%) |
| 12 to 14 Years | 86 (94.5%) | 63 (33.3%) |
| 15 Years | 36 (59.0%) | 6 (20.7%) |
| 16 and 17 Years | 6 (7.3%) | 0 (0.0%) |
| 18 to 24 Years | 89 (45.0%) | 138 (43.5%) |
| 25 to 34 Years | 52 (14.3%) | 205 (47.6%) |
| 35 to 44 Years | 123 (30.2%) | 171 (53.4%) |
| 45 to 54 Years | 94 (29.8%) | 183 (44.2%) |
| 55 to 64 Years | 116 (31.5%) | 214 (50.8%) |
| 65 to 74 Years | 46 (14.3%) | 52 (17.6%) |
| 75 Years and over | 0 (0.0%) | 172 (32.7%) |
| Total | 1,169 (37.6%) | 1,237 (38.9%) |
Income Above Poverty by Sex and Age in Atmore
According to the poverty statistics in Atmore, males aged 75 years and over and females aged under 5 years are the age groups that are most secure financially, with 100.0% of males and 100.0% of females in these age groups living above the poverty line.
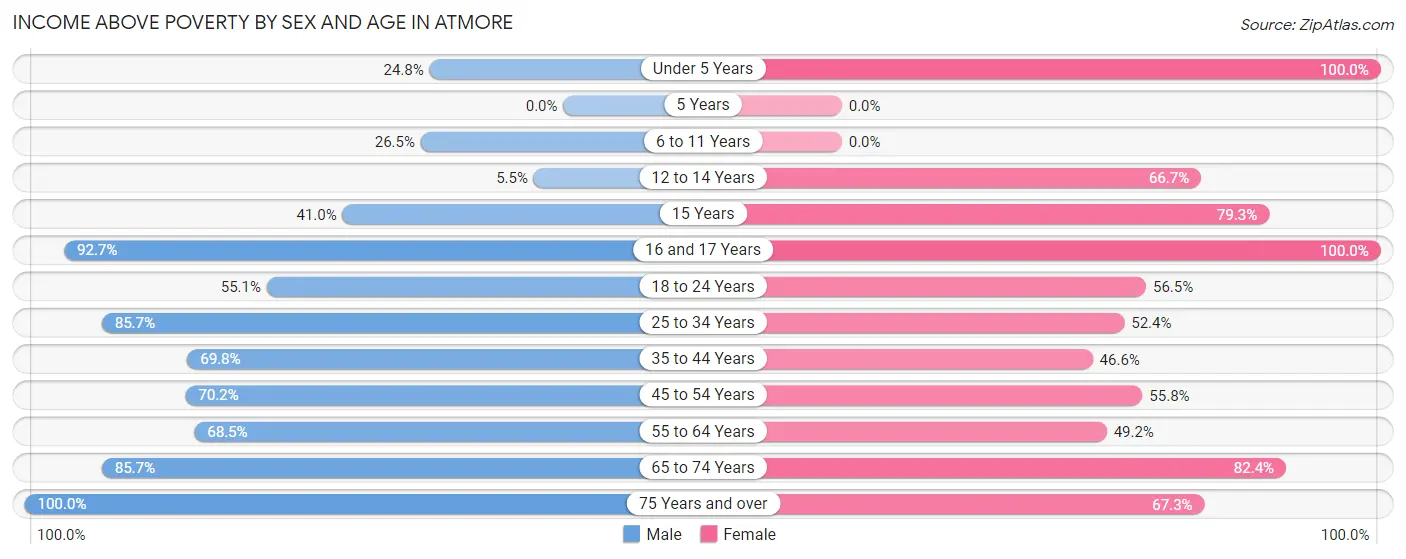
| Age Bracket | Male | Female |
| Under 5 Years | 118 (24.8%) | 26 (100.0%) |
| 5 Years | 0 (0.0%) | 0 (0.0%) |
| 6 to 11 Years | 59 (26.5%) | 0 (0.0%) |
| 12 to 14 Years | 5 (5.5%) | 126 (66.7%) |
| 15 Years | 25 (41.0%) | 23 (79.3%) |
| 16 and 17 Years | 76 (92.7%) | 180 (100.0%) |
| 18 to 24 Years | 109 (55.0%) | 179 (56.5%) |
| 25 to 34 Years | 311 (85.7%) | 226 (52.4%) |
| 35 to 44 Years | 284 (69.8%) | 149 (46.6%) |
| 45 to 54 Years | 221 (70.2%) | 231 (55.8%) |
| 55 to 64 Years | 252 (68.5%) | 207 (49.2%) |
| 65 to 74 Years | 275 (85.7%) | 244 (82.4%) |
| 75 Years and over | 209 (100.0%) | 354 (67.3%) |
| Total | 1,944 (62.5%) | 1,945 (61.1%) |
Income Below Poverty Among Married-Couple Families in Atmore
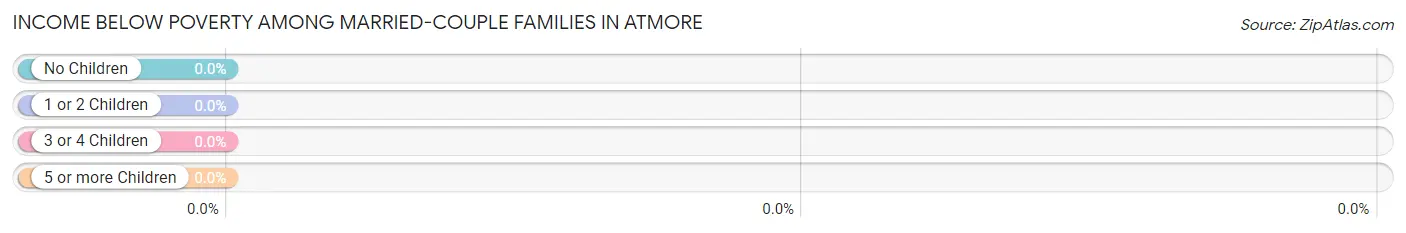
| Children | Above Poverty | Below Poverty |
| No Children | 355 (100.0%) | 0 (0.0%) |
| 1 or 2 Children | 249 (100.0%) | 0 (0.0%) |
| 3 or 4 Children | 10 (100.0%) | 0 (0.0%) |
| 5 or more Children | 0 (0.0%) | 0 (0.0%) |
| Total | 614 (100.0%) | 0 (0.0%) |
Income Below Poverty Among Single-Parent Households in Atmore
According to the poverty data in Atmore, 69.7% or 46 single-father households and 59.1% or 253 single-mother households are living below the poverty line. Among single-father households, those with no children have the highest poverty rate, with 46 households (83.6%) experiencing poverty. Likewise, among single-mother households, those with 3 or 4 children have the highest poverty rate, with 21 households (100.0%) falling below the poverty line.
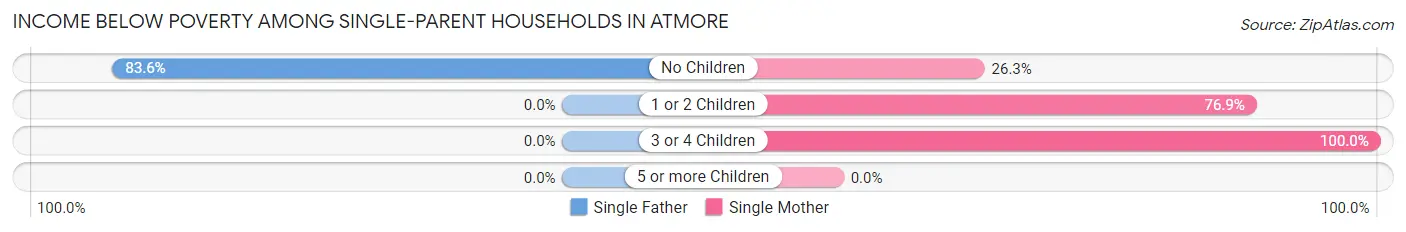
| Children | Single Father | Single Mother |
| No Children | 46 (83.6%) | 42 (26.3%) |
| 1 or 2 Children | 0 (0.0%) | 190 (76.9%) |
| 3 or 4 Children | 0 (0.0%) | 21 (100.0%) |
| 5 or more Children | 0 (0.0%) | 0 (0.0%) |
| Total | 46 (69.7%) | 253 (59.1%) |
Income Below Poverty Among Married-Couple vs Single-Parent Households in Atmore
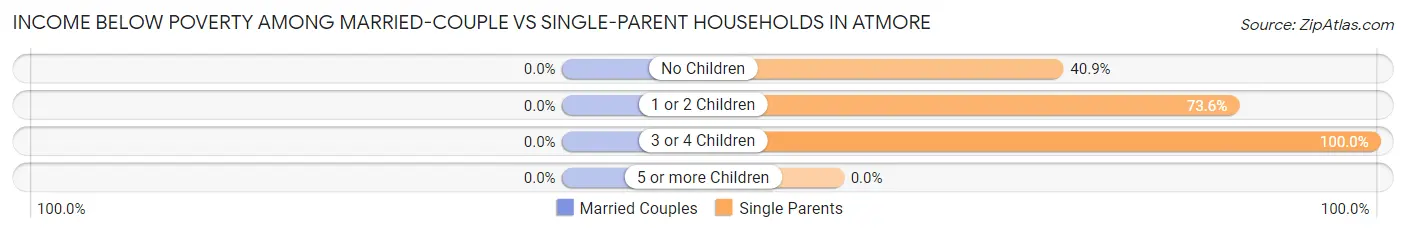
| Children | Married-Couple Families | Single-Parent Households |
| No Children | 0 (0.0%) | 88 (40.9%) |
| 1 or 2 Children | 0 (0.0%) | 190 (73.6%) |
| 3 or 4 Children | 0 (0.0%) | 21 (100.0%) |
| 5 or more Children | 0 (0.0%) | 0 (0.0%) |
| Total | 0 (0.0%) | 299 (60.5%) |
Race in Atmore
The most populous races in Atmore are Black / African American (4,660 | 55.0%), White / Caucasian (3,484 | 41.2%), and Two or more Races (162 | 1.9%).
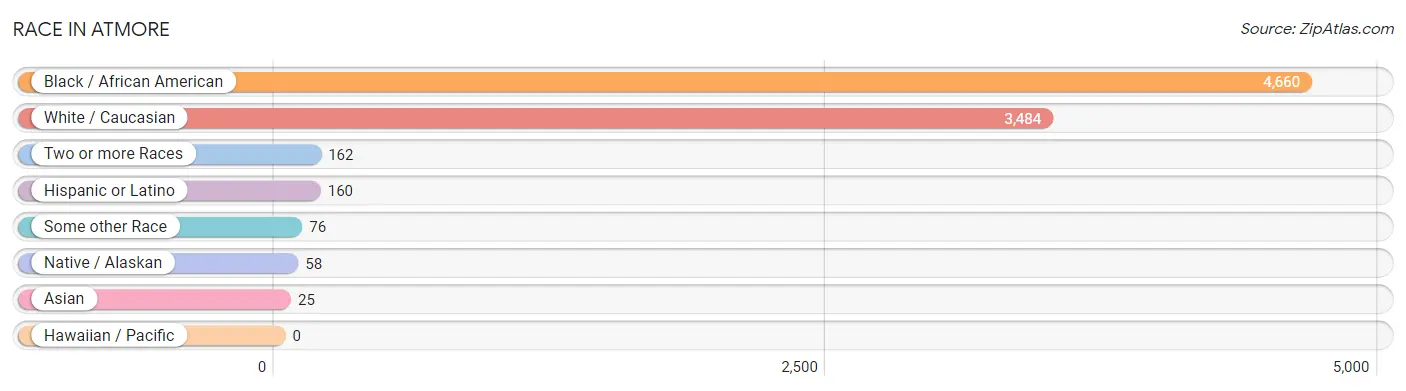
| Race | # Population | % Population |
| Asian | 25 | 0.3% |
| Black / African American | 4,660 | 55.0% |
| Hawaiian / Pacific | 0 | 0.0% |
| Hispanic or Latino | 160 | 1.9% |
| Native / Alaskan | 58 | 0.7% |
| White / Caucasian | 3,484 | 41.2% |
| Two or more Races | 162 | 1.9% |
| Some other Race | 76 | 0.9% |
| Total | 8,465 | 100.0% |
Ancestry in Atmore
The most populous ancestries reported in Atmore are American (604 | 7.1%), German (405 | 4.8%), Irish (367 | 4.3%), Dutch (263 | 3.1%), and English (257 | 3.0%), together accounting for 22.4% of all Atmore residents.
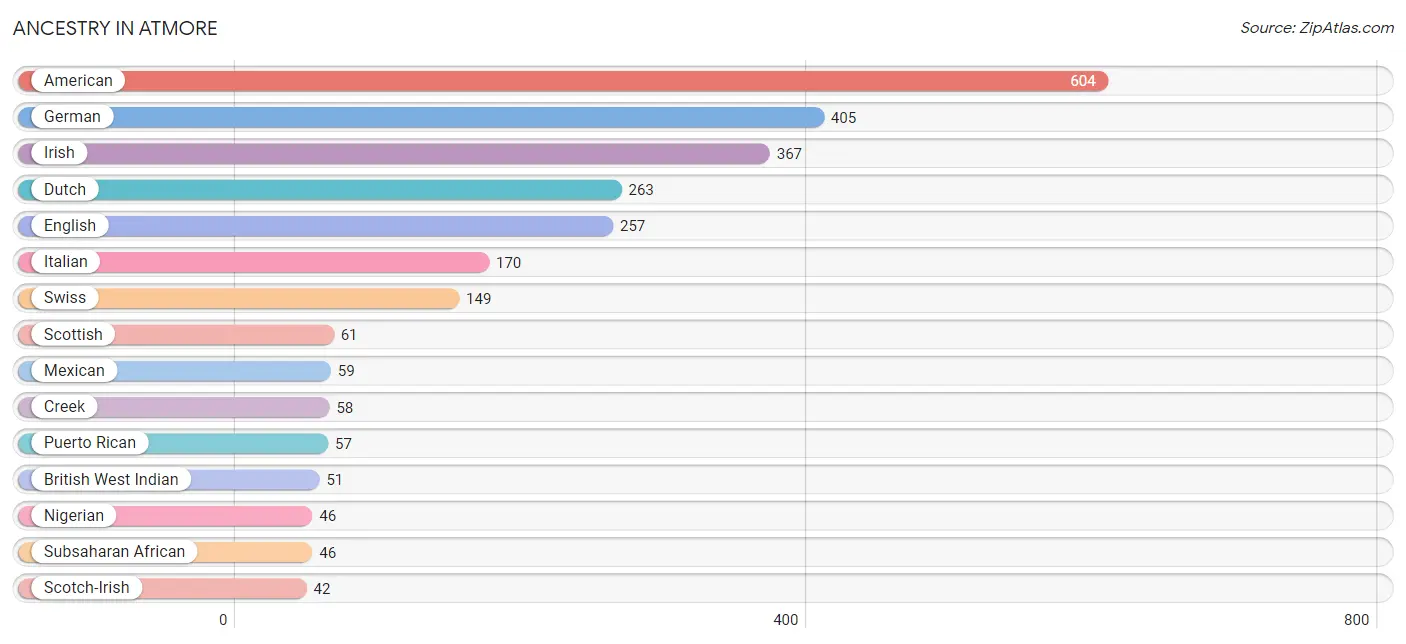
| Ancestry | # Population | % Population |
| American | 604 | 7.1% |
| British West Indian | 51 | 0.6% |
| Central American | 34 | 0.4% |
| Cherokee | 21 | 0.3% |
| Colombian | 10 | 0.1% |
| Creek | 58 | 0.7% |
| Danish | 6 | 0.1% |
| Dutch | 263 | 3.1% |
| English | 257 | 3.0% |
| European | 8 | 0.1% |
| French | 30 | 0.4% |
| German | 405 | 4.8% |
| Honduran | 5 | 0.1% |
| Irish | 367 | 4.3% |
| Italian | 170 | 2.0% |
| Jamaican | 10 | 0.1% |
| Korean | 30 | 0.4% |
| Mexican | 59 | 0.7% |
| Nigerian | 46 | 0.5% |
| Panamanian | 29 | 0.3% |
| Polish | 9 | 0.1% |
| Puerto Rican | 57 | 0.7% |
| Russian | 5 | 0.1% |
| Scandinavian | 26 | 0.3% |
| Scotch-Irish | 42 | 0.5% |
| Scottish | 61 | 0.7% |
| Sioux | 10 | 0.1% |
| South American | 10 | 0.1% |
| Subsaharan African | 46 | 0.5% |
| Swiss | 149 | 1.8% | View All 30 Rows |
Immigrants in Atmore
The most numerous immigrant groups reported in Atmore came from Latin America (76 | 0.9%), Caribbean (56 | 0.7%), Grenada (51 | 0.6%), Europe (14 | 0.2%), and Central America (10 | 0.1%), together accounting for 2.5% of all Atmore residents.
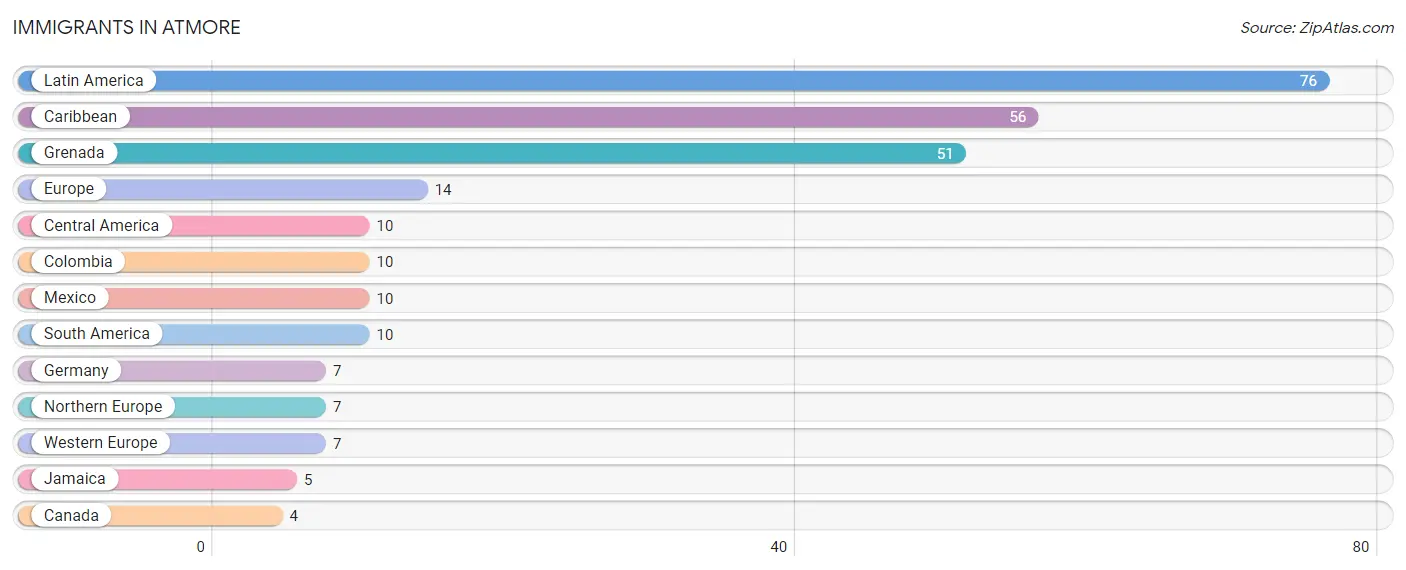
| Immigration Origin | # Population | % Population |
| Canada | 4 | 0.1% |
| Caribbean | 56 | 0.7% |
| Central America | 10 | 0.1% |
| Colombia | 10 | 0.1% |
| Europe | 14 | 0.2% |
| Germany | 7 | 0.1% |
| Grenada | 51 | 0.6% |
| Jamaica | 5 | 0.1% |
| Latin America | 76 | 0.9% |
| Mexico | 10 | 0.1% |
| Northern Europe | 7 | 0.1% |
| South America | 10 | 0.1% |
| Western Europe | 7 | 0.1% | View All 13 Rows |
Sex and Age in Atmore
Sex and Age in Atmore
The most populous age groups in Atmore are 40 to 44 Years (743 | 14.2%) for men and 15 to 19 Years (376 | 11.6%) for women.
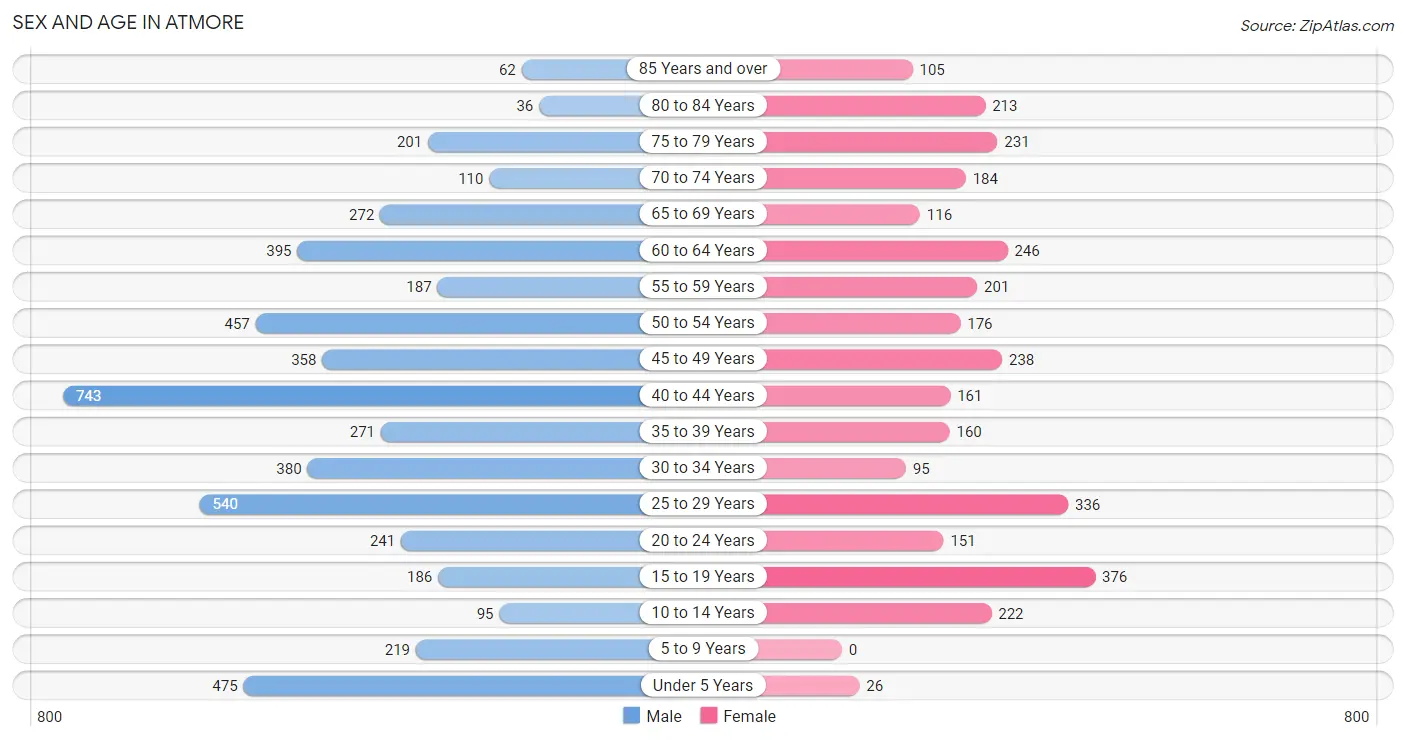
| Age Bracket | Male | Female |
| Under 5 Years | 475 (9.1%) | 26 (0.8%) |
| 5 to 9 Years | 219 (4.2%) | 0 (0.0%) |
| 10 to 14 Years | 95 (1.8%) | 222 (6.9%) |
| 15 to 19 Years | 186 (3.6%) | 376 (11.6%) |
| 20 to 24 Years | 241 (4.6%) | 151 (4.7%) |
| 25 to 29 Years | 540 (10.3%) | 336 (10.4%) |
| 30 to 34 Years | 380 (7.3%) | 95 (2.9%) |
| 35 to 39 Years | 271 (5.2%) | 160 (4.9%) |
| 40 to 44 Years | 743 (14.2%) | 161 (5.0%) |
| 45 to 49 Years | 358 (6.9%) | 238 (7.3%) |
| 50 to 54 Years | 457 (8.7%) | 176 (5.4%) |
| 55 to 59 Years | 187 (3.6%) | 201 (6.2%) |
| 60 to 64 Years | 395 (7.6%) | 246 (7.6%) |
| 65 to 69 Years | 272 (5.2%) | 116 (3.6%) |
| 70 to 74 Years | 110 (2.1%) | 184 (5.7%) |
| 75 to 79 Years | 201 (3.8%) | 231 (7.1%) |
| 80 to 84 Years | 36 (0.7%) | 213 (6.6%) |
| 85 Years and over | 62 (1.2%) | 105 (3.2%) |
| Total | 5,228 (100.0%) | 3,237 (100.0%) |
Families and Households in Atmore
Median Family Size in Atmore
The median family size in Atmore is 4.10 persons per family, with single female/mother families (428 | 38.6%) accounting for the largest median family size of 5.13 persons per family. On the other hand, married-couple families (614 | 55.4%) represent the smallest median family size with 3.43 persons per family.
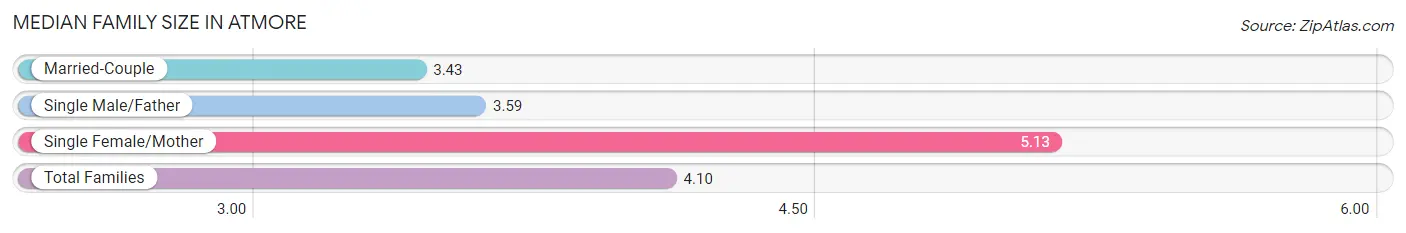
| Family Type | # Families | Family Size |
| Married-Couple | 614 (55.4%) | 3.43 |
| Single Male/Father | 66 (6.0%) | 3.59 |
| Single Female/Mother | 428 (38.6%) | 5.13 |
| Total Families | 1,108 (100.0%) | 4.10 |
Median Household Size in Atmore
The median household size in Atmore is 2.31 persons per household, with single female/mother households (428 | 15.7%) accounting for the largest median household size of 5.23 persons per household. non-family households (1,617 | 59.3%) represent the smallest median household size with 1.05 persons per household.
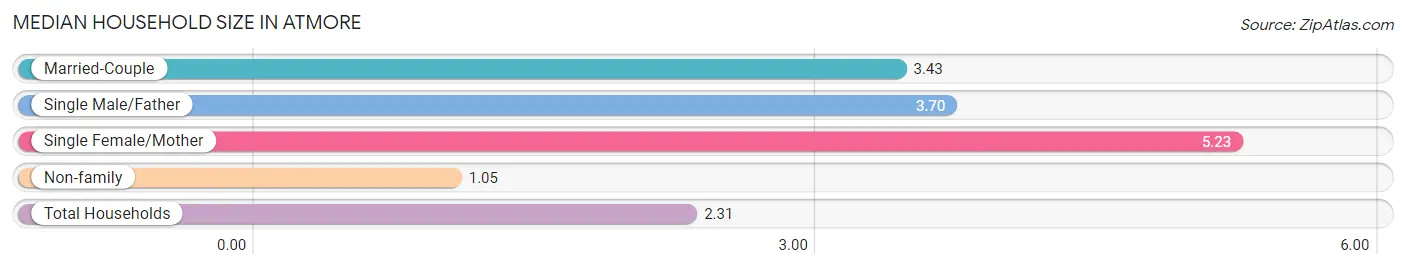
| Household Type | # Households | Household Size |
| Married-Couple | 614 (22.5%) | 3.43 |
| Single Male/Father | 66 (2.4%) | 3.70 |
| Single Female/Mother | 428 (15.7%) | 5.23 |
| Non-family | 1,617 (59.3%) | 1.05 |
| Total Households | 2,725 (100.0%) | 2.31 |
Household Size by Marriage Status in Atmore
Out of a total of 2,725 households in Atmore, 1,108 (40.7%) are family households, while 1,617 (59.3%) are nonfamily households. The most numerous type of family households are 2-person households, comprising 483, and the most common type of nonfamily households are 1-person households, comprising 1,561.
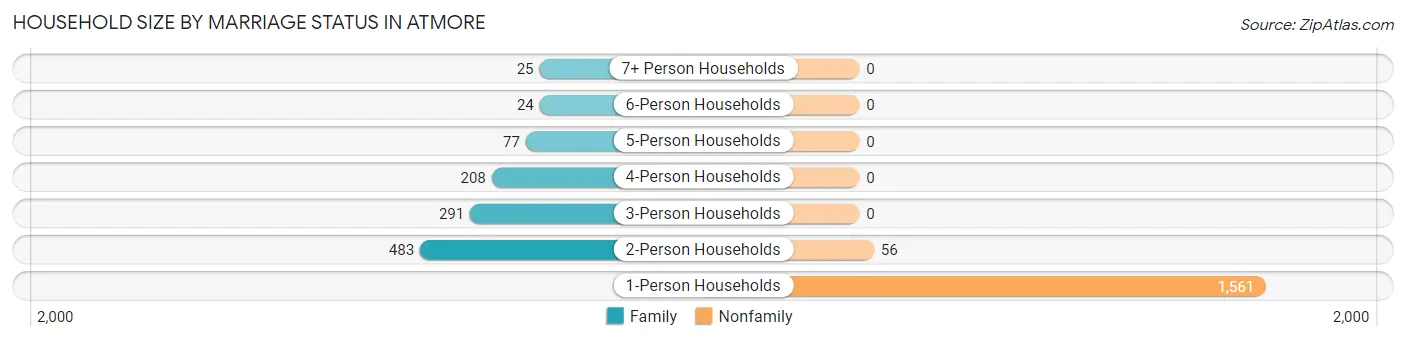
| Household Size | Family Households | Nonfamily Households |
| 1-Person Households | - | 1,561 (57.3%) |
| 2-Person Households | 483 (17.7%) | 56 (2.1%) |
| 3-Person Households | 291 (10.7%) | 0 (0.0%) |
| 4-Person Households | 208 (7.6%) | 0 (0.0%) |
| 5-Person Households | 77 (2.8%) | 0 (0.0%) |
| 6-Person Households | 24 (0.9%) | 0 (0.0%) |
| 7+ Person Households | 25 (0.9%) | 0 (0.0%) |
| Total | 1,108 (40.7%) | 1,617 (59.3%) |
Female Fertility in Atmore
Fertility by Age in Atmore
Average fertility rate in Atmore is 18.0 births per 1,000 women. Women in the age bracket of 20 to 34 years have the highest fertility rate with 46.0 births per 1,000 women. Women in the age bracket of 20 to 34 years acount for 100.0% of all women with births.
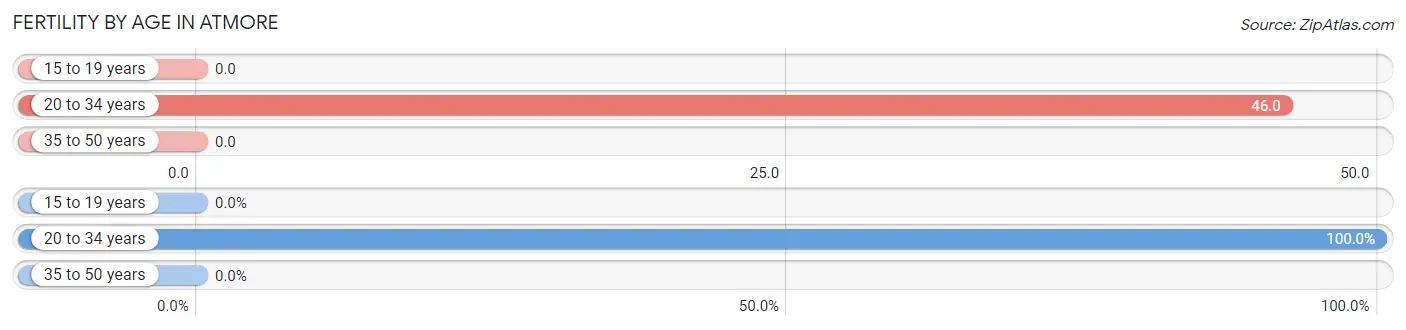
| Age Bracket | Women with Births | Births / 1,000 Women |
| 15 to 19 years | 0 (0.0%) | 0.0 |
| 20 to 34 years | 27 (100.0%) | 46.0 |
| 35 to 50 years | 0 (0.0%) | 0.0 |
| Total | 27 (100.0%) | 18.0 |
Fertility by Age by Marriage Status in Atmore
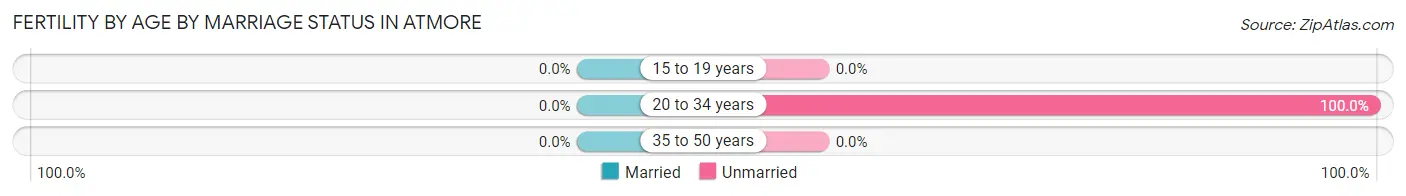
| Age Bracket | Married | Unmarried |
| 15 to 19 years | 0 (0.0%) | 0 (0.0%) |
| 20 to 34 years | 0 (0.0%) | 27 (100.0%) |
| 35 to 50 years | 0 (0.0%) | 0 (0.0%) |
| Total | 0 (0.0%) | 27 (100.0%) |
Fertility by Education in Atmore
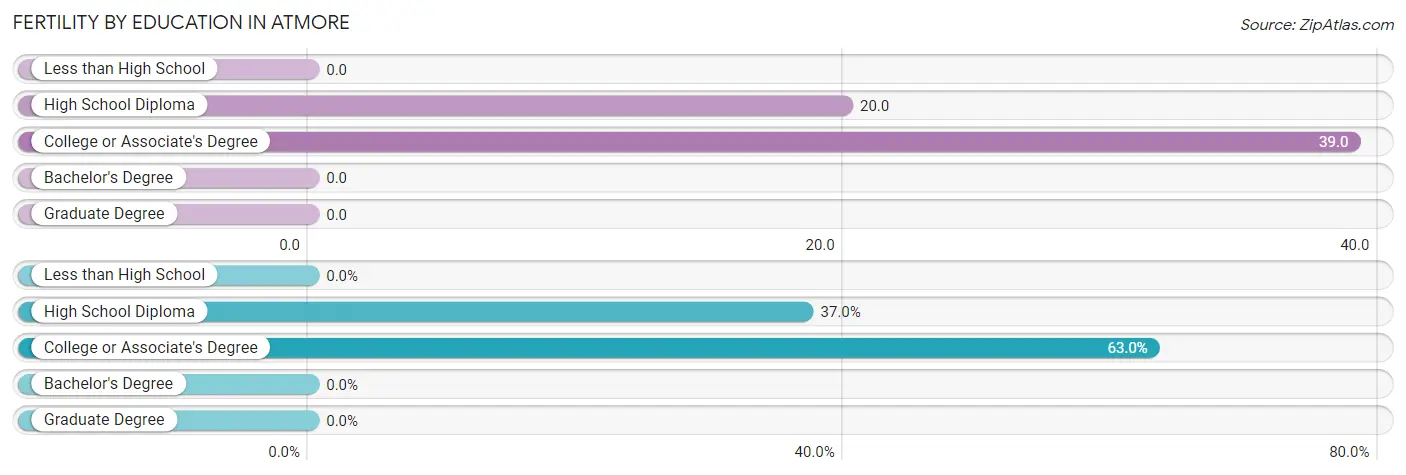
| Educational Attainment | Women with Births | Births / 1,000 Women |
| Less than High School | 0 (0.0%) | 0.0 |
| High School Diploma | 10 (37.0%) | 20.0 |
| College or Associate's Degree | 17 (63.0%) | 39.0 |
| Bachelor's Degree | 0 (0.0%) | 0.0 |
| Graduate Degree | 0 (0.0%) | 0.0 |
| Total | 27 (100.0%) | 18.0 |
Fertility by Education by Marriage Status in Atmore
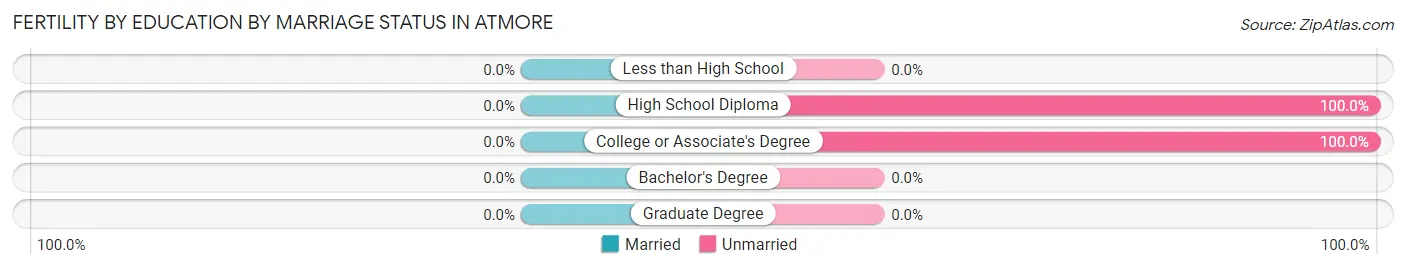
| Educational Attainment | Married | Unmarried |
| Less than High School | 0 (0.0%) | 0 (0.0%) |
| High School Diploma | 0 (0.0%) | 10 (100.0%) |
| College or Associate's Degree | 0 (0.0%) | 17 (100.0%) |
| Bachelor's Degree | 0 (0.0%) | 0 (0.0%) |
| Graduate Degree | 0 (0.0%) | 0 (0.0%) |
| Total | 0 (0.0%) | 27 (100.0%) |
Employment Characteristics in Atmore
Employment by Class of Employer in Atmore
Among the 2,150 employed individuals in Atmore, private company employees (1,595 | 74.2%), not-for-profit organizations (231 | 10.7%), and self-employed (not incorporated) (153 | 7.1%) make up the most common classes of employment.
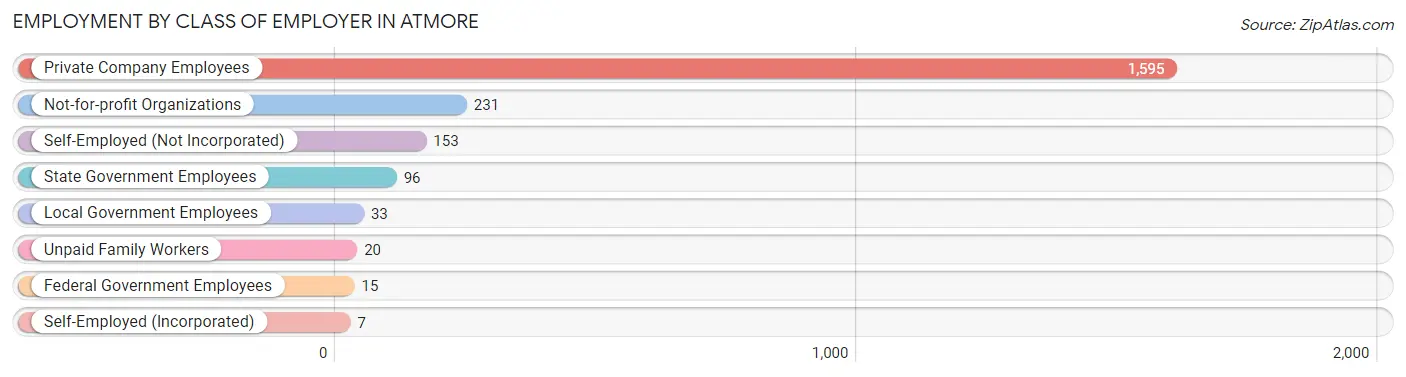
| Employer Class | # Employees | % Employees |
| Private Company Employees | 1,595 | 74.2% |
| Self-Employed (Incorporated) | 7 | 0.3% |
| Self-Employed (Not Incorporated) | 153 | 7.1% |
| Not-for-profit Organizations | 231 | 10.7% |
| Local Government Employees | 33 | 1.5% |
| State Government Employees | 96 | 4.5% |
| Federal Government Employees | 15 | 0.7% |
| Unpaid Family Workers | 20 | 0.9% |
| Total | 2,150 | 100.0% |
Employment Status by Age in Atmore
According to the labor force statistics for Atmore, out of the total population over 16 years of age (7,337), 31.9% or 2,341 individuals are in the labor force, with 8.3% or 194 of them unemployed. The age group with the highest labor force participation rate is 20 to 24 years, with 61.2% or 240 individuals in the labor force. Within the labor force, the 20 to 24 years age range has the highest percentage of unemployed individuals, with 39.2% or 94 of them being unemployed.
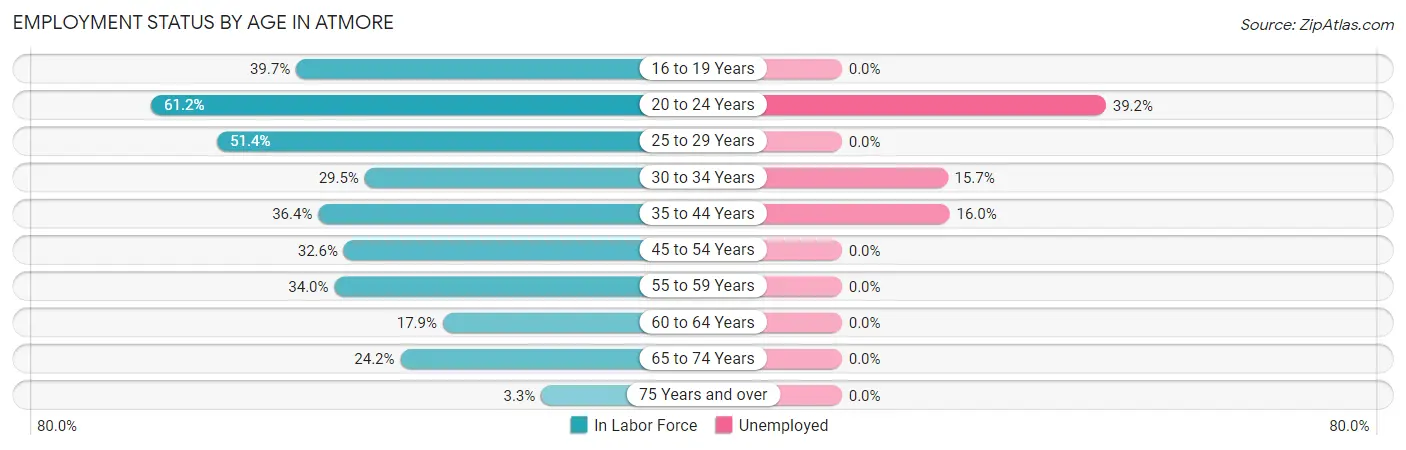
| Age Bracket | In Labor Force | Unemployed |
| 16 to 19 Years | 187 (39.7%) | 0 (0.0%) |
| 20 to 24 Years | 240 (61.2%) | 94 (39.2%) |
| 25 to 29 Years | 450 (51.4%) | 0 (0.0%) |
| 30 to 34 Years | 140 (29.5%) | 22 (15.7%) |
| 35 to 44 Years | 486 (36.4%) | 78 (16.0%) |
| 45 to 54 Years | 401 (32.6%) | 0 (0.0%) |
| 55 to 59 Years | 132 (34.0%) | 0 (0.0%) |
| 60 to 64 Years | 115 (17.9%) | 0 (0.0%) |
| 65 to 74 Years | 165 (24.2%) | 0 (0.0%) |
| 75 Years and over | 28 (3.3%) | 0 (0.0%) |
| Total | 2,341 (31.9%) | 194 (8.3%) |
Employment Status by Educational Attainment in Atmore
According to labor force statistics for Atmore, 34.9% of individuals (1,725) out of the total population between 25 and 64 years of age (4,944) are in the labor force, with 5.8% or 100 of them being unemployed. The group with the highest labor force participation rate are those with the educational attainment of bachelor's degree or higher, with 60.8% or 192 individuals in the labor force. Within the labor force, individuals with high school diploma education have the highest percentage of unemployment, with 9.0% or 78 of them being unemployed.
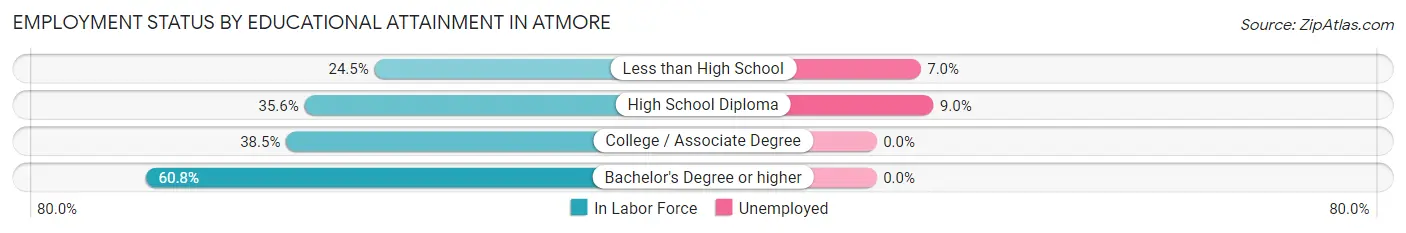
| Educational Attainment | In Labor Force | Unemployed |
| Less than High School | 313 (24.5%) | 89 (7.0%) |
| High School Diploma | 867 (35.6%) | 219 (9.0%) |
| College / Associate Degree | 353 (38.5%) | 0 (0.0%) |
| Bachelor's Degree or higher | 192 (60.8%) | 0 (0.0%) |
| Total | 1,725 (34.9%) | 287 (5.8%) |
Employment Occupations by Sex in Atmore
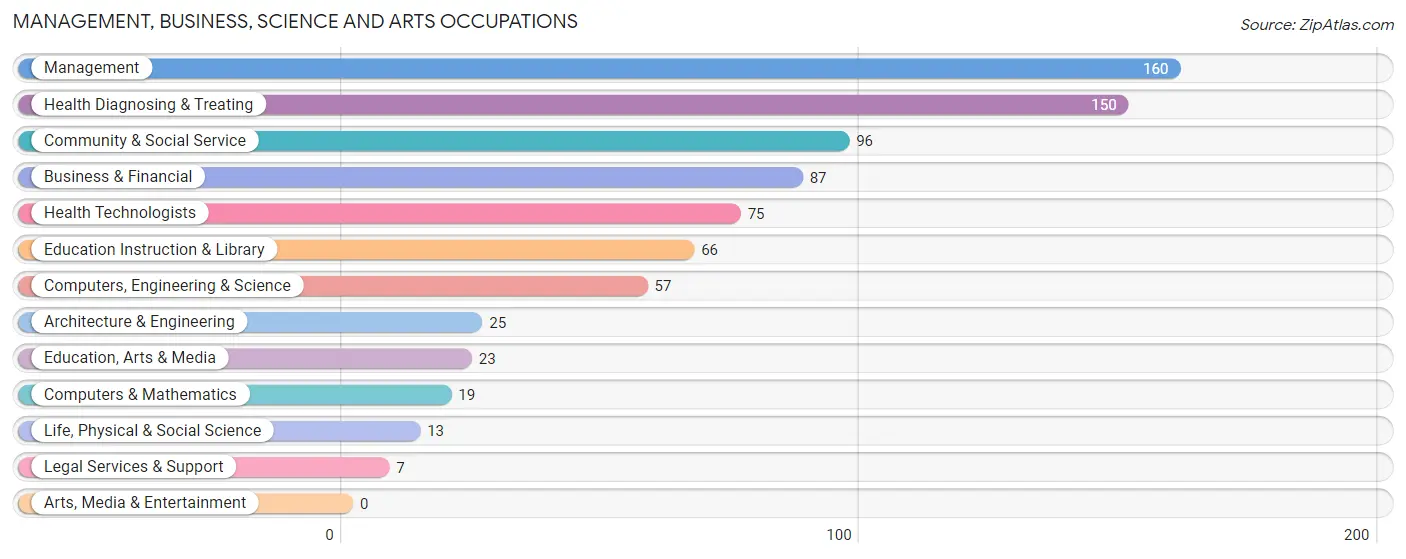
Management, Business, Science and Arts Occupations
The most common Management, Business, Science and Arts occupations in Atmore are Management (160 | 7.4%), Health Diagnosing & Treating (150 | 7.0%), Community & Social Service (96 | 4.5%), Business & Financial (87 | 4.1%), and Health Technologists (75 | 3.5%).
Management, Business, Science and Arts Occupations by Sex
Within the Management, Business, Science and Arts occupations in Atmore, the most male-oriented occupations are Computers & Mathematics (100.0%), Architecture & Engineering (100.0%), and Management (78.1%), while the most female-oriented occupations are Life, Physical & Social Science (100.0%), Legal Services & Support (100.0%), and Health Diagnosing & Treating (91.3%).

| Occupation | Male | Female |
| Management | 125 (78.1%) | 35 (21.9%) |
| Business & Financial | 31 (35.6%) | 56 (64.4%) |
| Computers, Engineering & Science | 44 (77.2%) | 13 (22.8%) |
| Computers & Mathematics | 19 (100.0%) | 0 (0.0%) |
| Architecture & Engineering | 25 (100.0%) | 0 (0.0%) |
| Life, Physical & Social Science | 0 (0.0%) | 13 (100.0%) |
| Community & Social Service | 37 (38.5%) | 59 (61.5%) |
| Education, Arts & Media | 13 (56.5%) | 10 (43.5%) |
| Legal Services & Support | 0 (0.0%) | 7 (100.0%) |
| Education Instruction & Library | 24 (36.4%) | 42 (63.6%) |
| Arts, Media & Entertainment | 0 (0.0%) | 0 (0.0%) |
| Health Diagnosing & Treating | 13 (8.7%) | 137 (91.3%) |
| Health Technologists | 13 (17.3%) | 62 (82.7%) |
| Total (Category) | 250 (45.5%) | 300 (54.5%) |
| Total (Overall) | 1,104 (51.3%) | 1,046 (48.6%) |
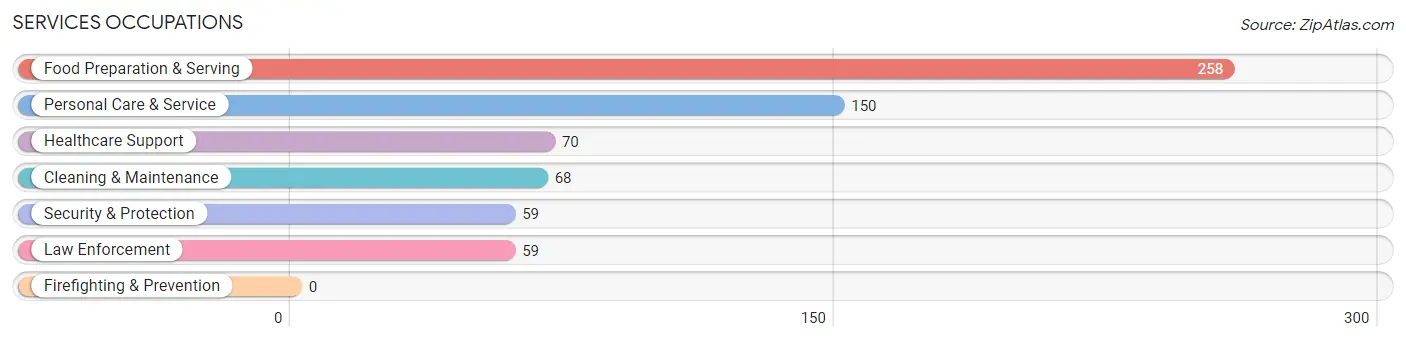
Services Occupations
The most common Services occupations in Atmore are Food Preparation & Serving (258 | 12.0%), Personal Care & Service (150 | 7.0%), Healthcare Support (70 | 3.3%), Cleaning & Maintenance (68 | 3.2%), and Security & Protection (59 | 2.7%).
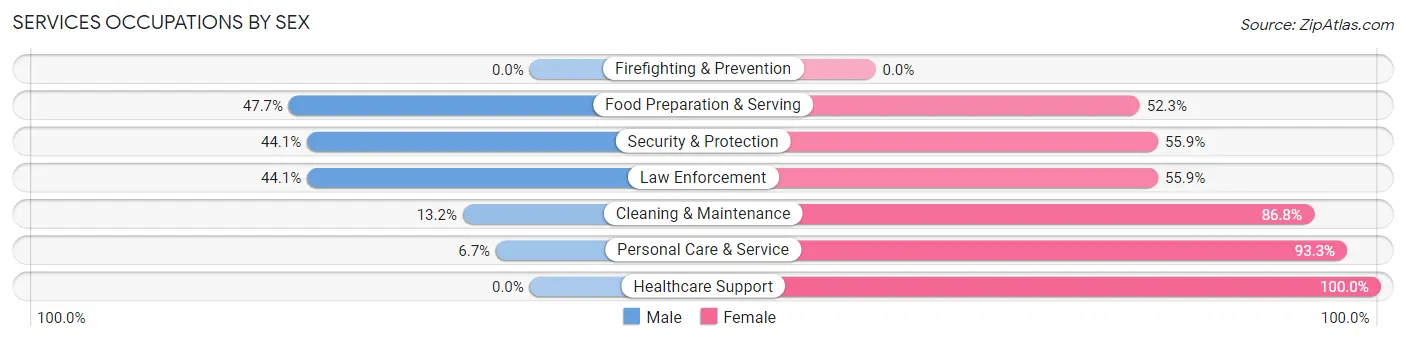
Services Occupations by Sex
Within the Services occupations in Atmore, the most male-oriented occupations are Food Preparation & Serving (47.7%), Security & Protection (44.1%), and Law Enforcement (44.1%), while the most female-oriented occupations are Healthcare Support (100.0%), Personal Care & Service (93.3%), and Cleaning & Maintenance (86.8%).
| Occupation | Male | Female |
| Healthcare Support | 0 (0.0%) | 70 (100.0%) |
| Security & Protection | 26 (44.1%) | 33 (55.9%) |
| Firefighting & Prevention | 0 (0.0%) | 0 (0.0%) |
| Law Enforcement | 26 (44.1%) | 33 (55.9%) |
| Food Preparation & Serving | 123 (47.7%) | 135 (52.3%) |
| Cleaning & Maintenance | 9 (13.2%) | 59 (86.8%) |
| Personal Care & Service | 10 (6.7%) | 140 (93.3%) |
| Total (Category) | 168 (27.8%) | 437 (72.2%) |
| Total (Overall) | 1,104 (51.3%) | 1,046 (48.6%) |
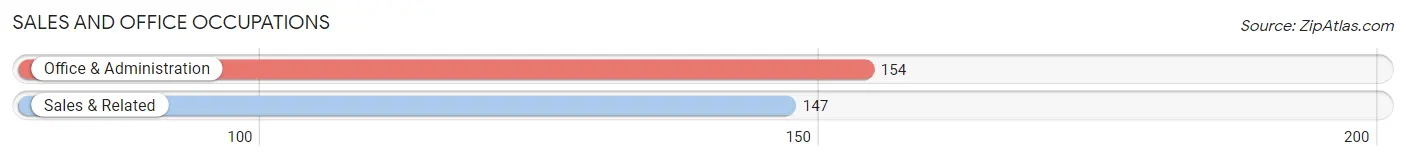
Sales and Office Occupations
The most common Sales and Office occupations in Atmore are Office & Administration (154 | 7.2%), and Sales & Related (147 | 6.8%).
Sales and Office Occupations by Sex
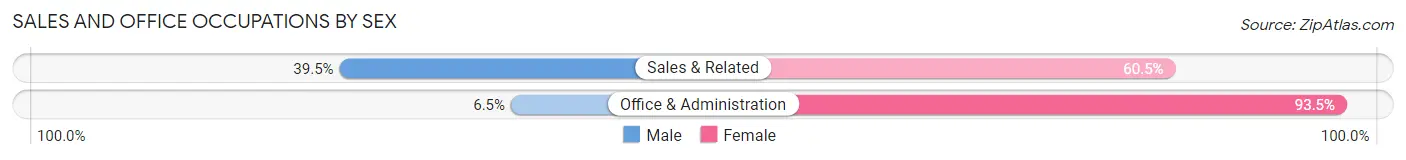
| Occupation | Male | Female |
| Sales & Related | 58 (39.5%) | 89 (60.5%) |
| Office & Administration | 10 (6.5%) | 144 (93.5%) |
| Total (Category) | 68 (22.6%) | 233 (77.4%) |
| Total (Overall) | 1,104 (51.3%) | 1,046 (48.6%) |
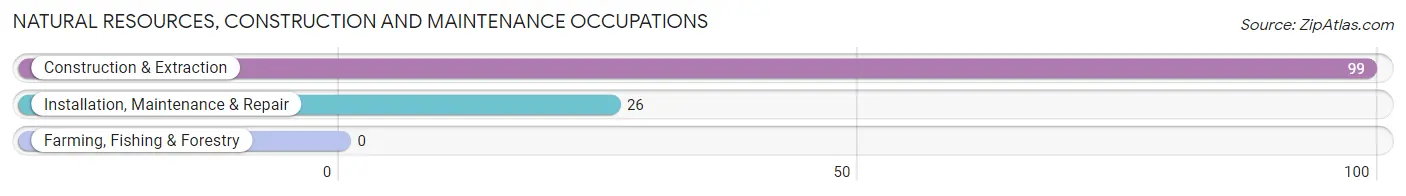
Natural Resources, Construction and Maintenance Occupations
The most common Natural Resources, Construction and Maintenance occupations in Atmore are Construction & Extraction (99 | 4.6%), and Installation, Maintenance & Repair (26 | 1.2%).
Natural Resources, Construction and Maintenance Occupations by Sex
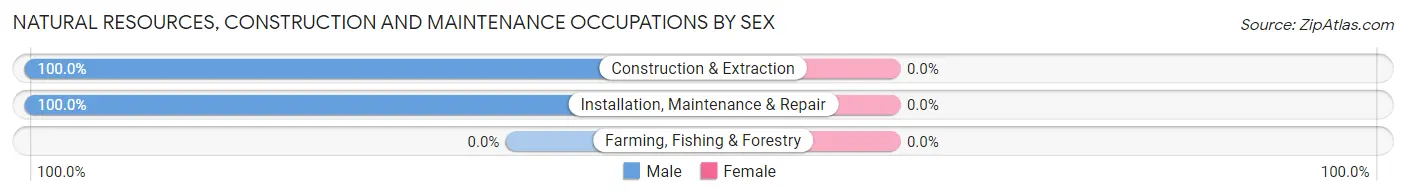
| Occupation | Male | Female |
| Farming, Fishing & Forestry | 0 (0.0%) | 0 (0.0%) |
| Construction & Extraction | 99 (100.0%) | 0 (0.0%) |
| Installation, Maintenance & Repair | 26 (100.0%) | 0 (0.0%) |
| Total (Category) | 125 (100.0%) | 0 (0.0%) |
| Total (Overall) | 1,104 (51.3%) | 1,046 (48.6%) |
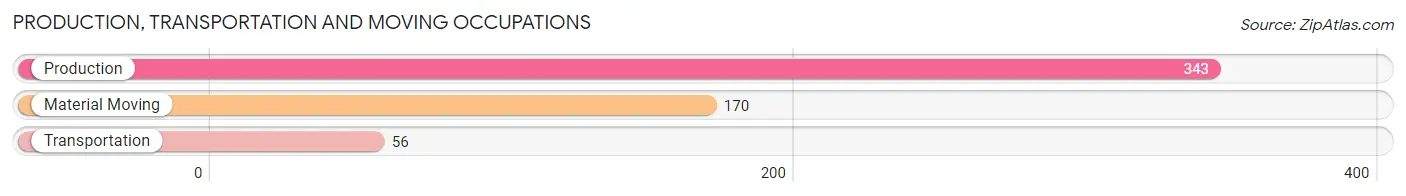
Production, Transportation and Moving Occupations
The most common Production, Transportation and Moving occupations in Atmore are Production (343 | 16.0%), Material Moving (170 | 7.9%), and Transportation (56 | 2.6%).
Production, Transportation and Moving Occupations by Sex
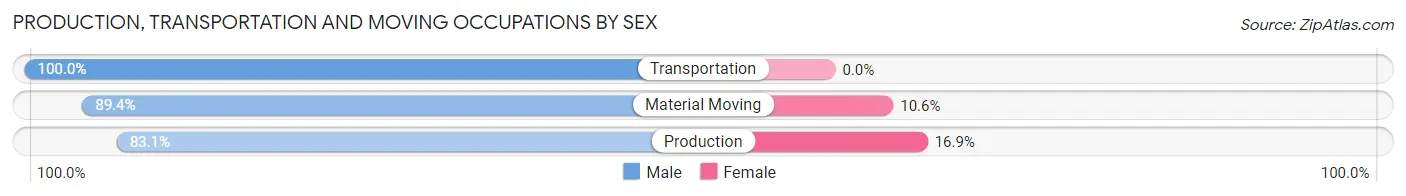
| Occupation | Male | Female |
| Production | 285 (83.1%) | 58 (16.9%) |
| Transportation | 56 (100.0%) | 0 (0.0%) |
| Material Moving | 152 (89.4%) | 18 (10.6%) |
| Total (Category) | 493 (86.6%) | 76 (13.4%) |
| Total (Overall) | 1,104 (51.3%) | 1,046 (48.6%) |
Employment Industries by Sex in Atmore
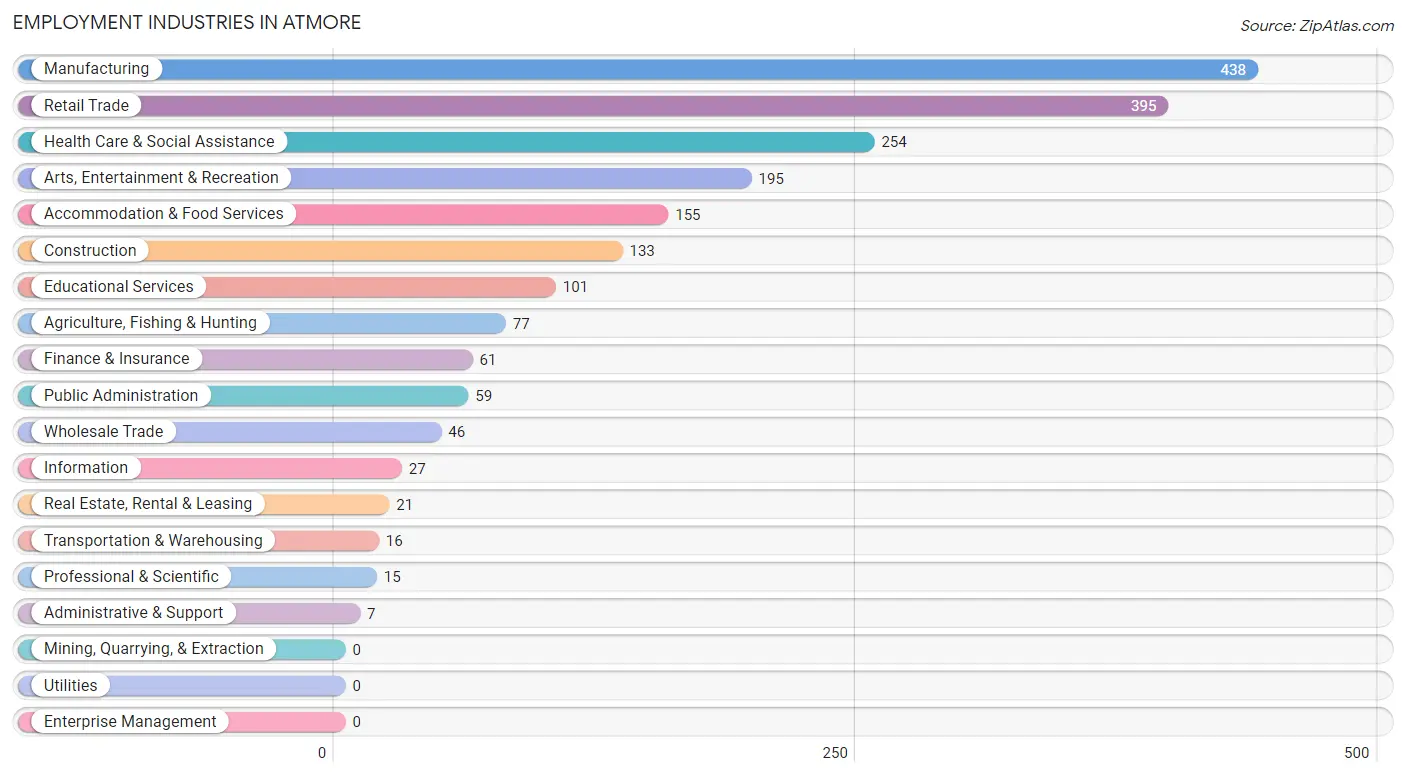
Employment Industries in Atmore
The major employment industries in Atmore include Manufacturing (438 | 20.4%), Retail Trade (395 | 18.4%), Health Care & Social Assistance (254 | 11.8%), Arts, Entertainment & Recreation (195 | 9.1%), and Accommodation & Food Services (155 | 7.2%).
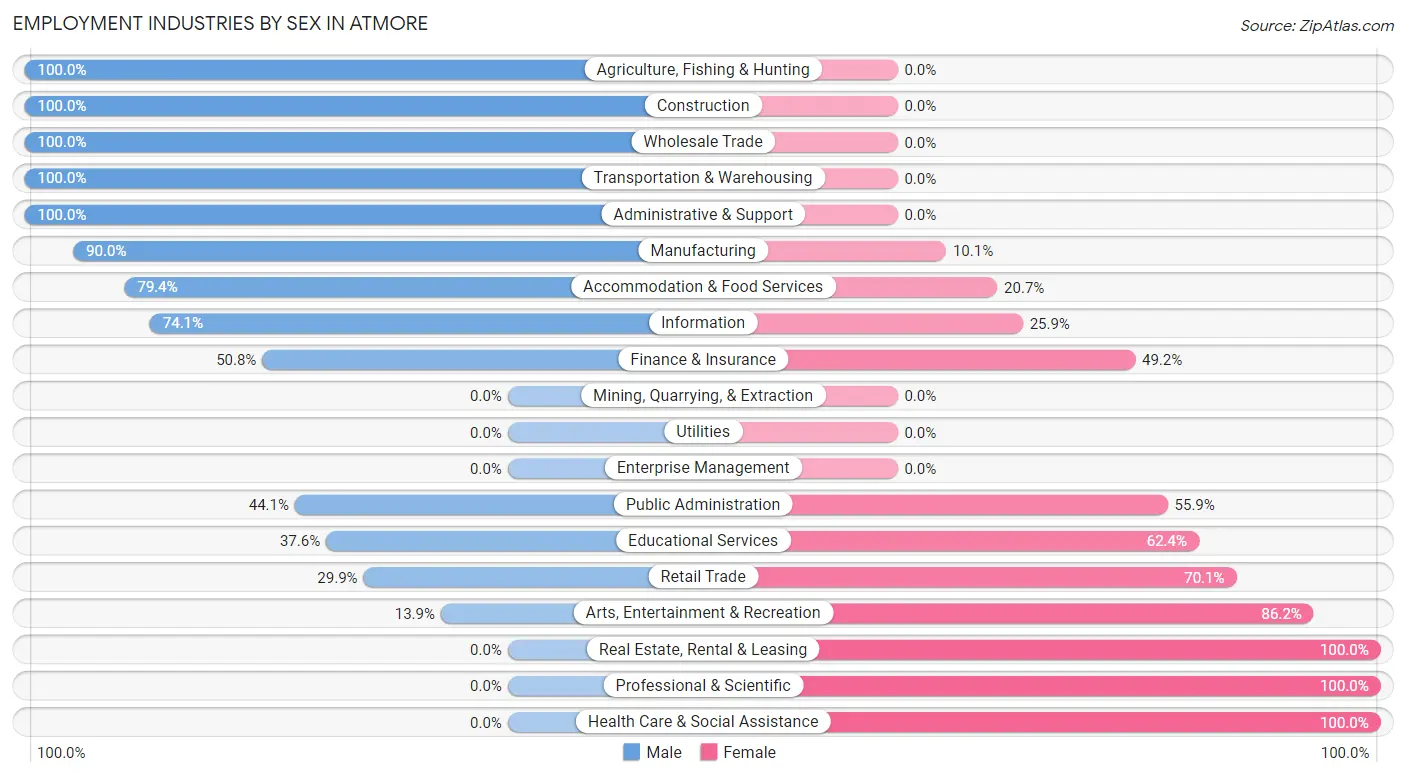
Employment Industries by Sex in Atmore
The Atmore industries that see more men than women are Agriculture, Fishing & Hunting (100.0%), Construction (100.0%), and Wholesale Trade (100.0%), whereas the industries that tend to have a higher number of women are Real Estate, Rental & Leasing (100.0%), Professional & Scientific (100.0%), and Health Care & Social Assistance (100.0%).
| Industry | Male | Female |
| Agriculture, Fishing & Hunting | 77 (100.0%) | 0 (0.0%) |
| Mining, Quarrying, & Extraction | 0 (0.0%) | 0 (0.0%) |
| Construction | 133 (100.0%) | 0 (0.0%) |
| Manufacturing | 394 (89.9%) | 44 (10.1%) |
| Wholesale Trade | 46 (100.0%) | 0 (0.0%) |
| Retail Trade | 118 (29.9%) | 277 (70.1%) |
| Transportation & Warehousing | 16 (100.0%) | 0 (0.0%) |
| Utilities | 0 (0.0%) | 0 (0.0%) |
| Information | 20 (74.1%) | 7 (25.9%) |
| Finance & Insurance | 31 (50.8%) | 30 (49.2%) |
| Real Estate, Rental & Leasing | 0 (0.0%) | 21 (100.0%) |
| Professional & Scientific | 0 (0.0%) | 15 (100.0%) |
| Enterprise Management | 0 (0.0%) | 0 (0.0%) |
| Administrative & Support | 7 (100.0%) | 0 (0.0%) |
| Educational Services | 38 (37.6%) | 63 (62.4%) |
| Health Care & Social Assistance | 0 (0.0%) | 254 (100.0%) |
| Arts, Entertainment & Recreation | 27 (13.9%) | 168 (86.2%) |
| Accommodation & Food Services | 123 (79.3%) | 32 (20.6%) |
| Public Administration | 26 (44.1%) | 33 (55.9%) |
| Total | 1,104 (51.3%) | 1,046 (48.6%) |
Education in Atmore
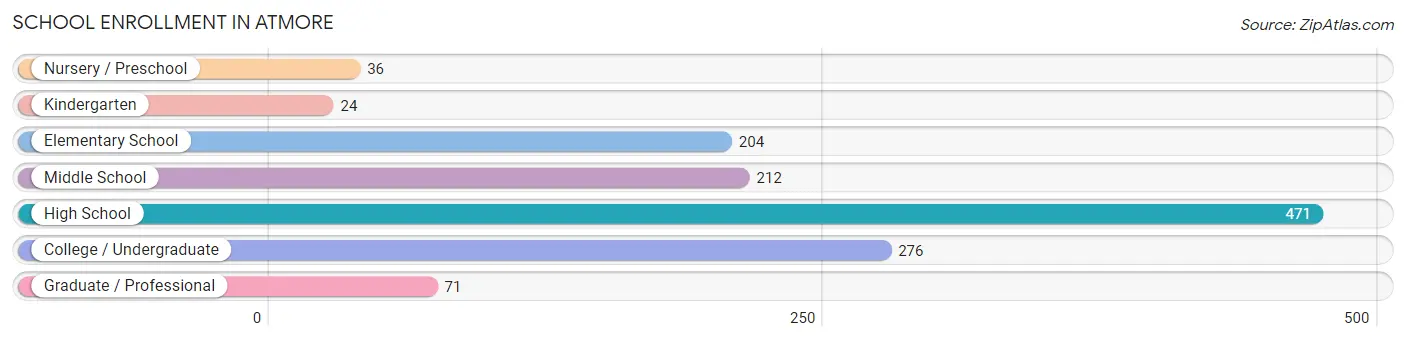
School Enrollment in Atmore
The most common levels of schooling among the 1,294 students in Atmore are high school (471 | 36.4%), college / undergraduate (276 | 21.3%), and middle school (212 | 16.4%).
| School Level | # Students | % Students |
| Nursery / Preschool | 36 | 2.8% |
| Kindergarten | 24 | 1.8% |
| Elementary School | 204 | 15.8% |
| Middle School | 212 | 16.4% |
| High School | 471 | 36.4% |
| College / Undergraduate | 276 | 21.3% |
| Graduate / Professional | 71 | 5.5% |
| Total | 1,294 | 100.0% |
School Enrollment by Age by Funding Source in Atmore
Out of a total of 1,294 students who are enrolled in schools in Atmore, 149 (11.5%) attend a private institution, while the remaining 1,145 (88.5%) are enrolled in public schools. The age group of 15 to 17 year olds has the highest likelihood of being enrolled in private schools, with 83 (25.7% in the age bracket) enrolled. Conversely, the age group of 3 to 4 year olds has the lowest likelihood of being enrolled in a private school, with 36 (100.0% in the age bracket) attending a public institution.
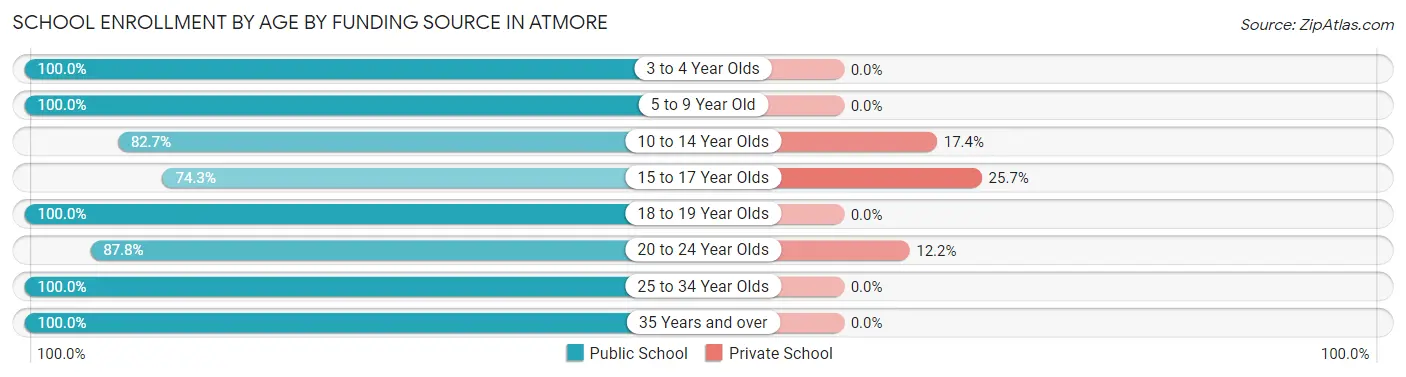
| Age Bracket | Public School | Private School |
| 3 to 4 Year Olds | 36 (100.0%) | 0 (0.0%) |
| 5 to 9 Year Old | 219 (100.0%) | 0 (0.0%) |
| 10 to 14 Year Olds | 262 (82.7%) | 55 (17.3%) |
| 15 to 17 Year Olds | 240 (74.3%) | 83 (25.7%) |
| 18 to 19 Year Olds | 118 (100.0%) | 0 (0.0%) |
| 20 to 24 Year Olds | 79 (87.8%) | 11 (12.2%) |
| 25 to 34 Year Olds | 174 (100.0%) | 0 (0.0%) |
| 35 Years and over | 17 (100.0%) | 0 (0.0%) |
| Total | 1,145 (88.5%) | 149 (11.5%) |
Educational Attainment by Field of Study in Atmore
Business (128 | 24.7%), science & technology (106 | 20.5%), education (94 | 18.1%), liberal arts & history (67 | 12.9%), and bio, nature & agricultural (33 | 6.4%) are the most common fields of study among 518 individuals in Atmore who have obtained a bachelor's degree or higher.
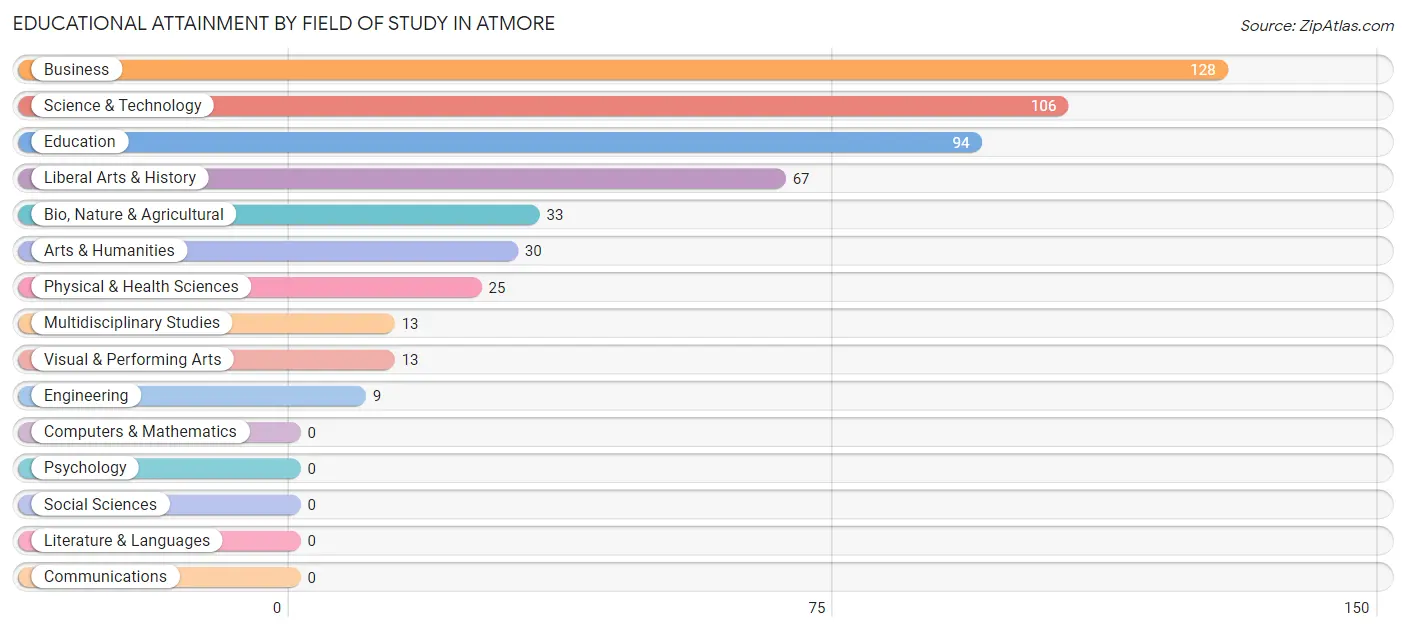
| Field of Study | # Graduates | % Graduates |
| Computers & Mathematics | 0 | 0.0% |
| Bio, Nature & Agricultural | 33 | 6.4% |
| Physical & Health Sciences | 25 | 4.8% |
| Psychology | 0 | 0.0% |
| Social Sciences | 0 | 0.0% |
| Engineering | 9 | 1.7% |
| Multidisciplinary Studies | 13 | 2.5% |
| Science & Technology | 106 | 20.5% |
| Business | 128 | 24.7% |
| Education | 94 | 18.1% |
| Literature & Languages | 0 | 0.0% |
| Liberal Arts & History | 67 | 12.9% |
| Visual & Performing Arts | 13 | 2.5% |
| Communications | 0 | 0.0% |
| Arts & Humanities | 30 | 5.8% |
| Total | 518 | 100.0% |
Transportation & Commute in Atmore
Vehicle Availability by Sex in Atmore
The most prevalent vehicle ownership categories in Atmore are males with 2 vehicles (390, accounting for 35.3%) and females with 2 vehicles (396, making up 37.3%).
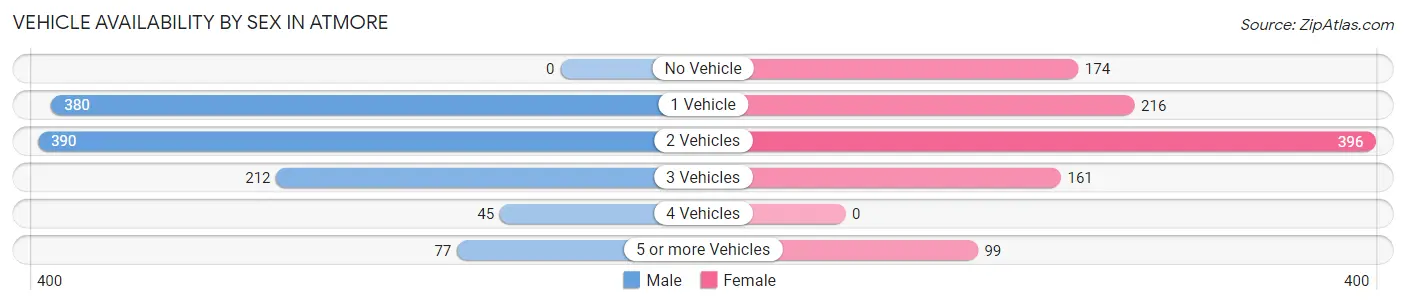
| Vehicles Available | Male | Female |
| No Vehicle | 0 (0.0%) | 174 (16.6%) |
| 1 Vehicle | 380 (34.4%) | 216 (20.6%) |
| 2 Vehicles | 390 (35.3%) | 396 (37.9%) |
| 3 Vehicles | 212 (19.2%) | 161 (15.4%) |
| 4 Vehicles | 45 (4.1%) | 0 (0.0%) |
| 5 or more Vehicles | 77 (7.0%) | 99 (9.5%) |
| Total | 1,104 (100.0%) | 1,046 (100.0%) |
Commute Time in Atmore
The most frequently occuring commute durations in Atmore are 10 to 14 minutes (606 commuters, 28.3%), 20 to 24 minutes (340 commuters, 15.9%), and 15 to 19 minutes (304 commuters, 14.2%).
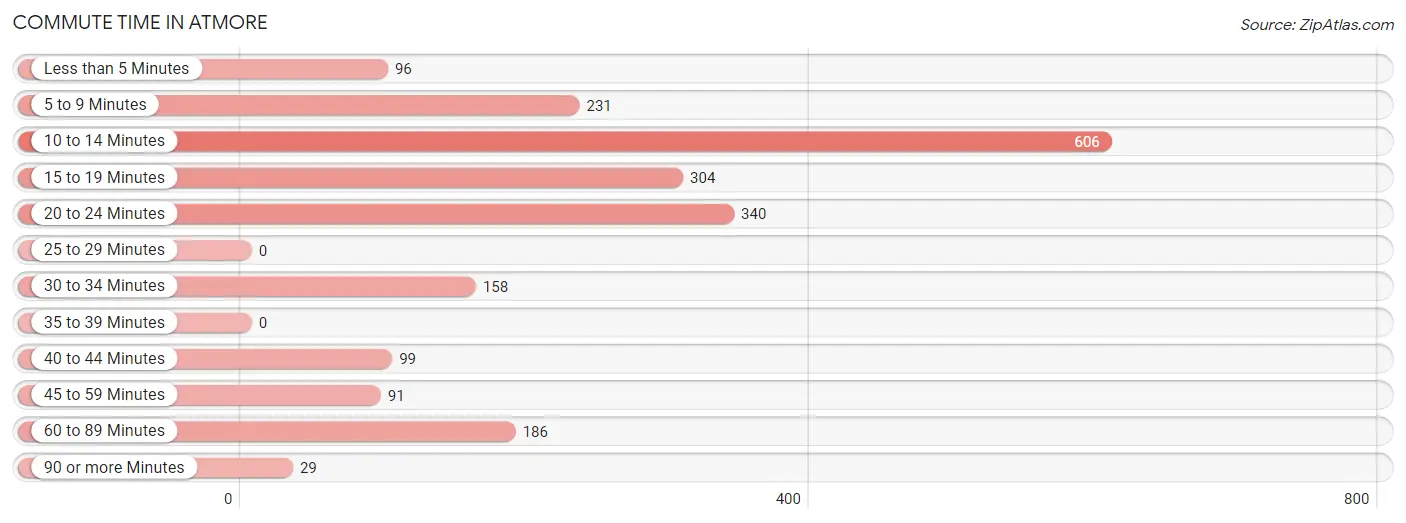
| Commute Time | # Commuters | % Commuters |
| Less than 5 Minutes | 96 | 4.5% |
| 5 to 9 Minutes | 231 | 10.8% |
| 10 to 14 Minutes | 606 | 28.3% |
| 15 to 19 Minutes | 304 | 14.2% |
| 20 to 24 Minutes | 340 | 15.9% |
| 25 to 29 Minutes | 0 | 0.0% |
| 30 to 34 Minutes | 158 | 7.4% |
| 35 to 39 Minutes | 0 | 0.0% |
| 40 to 44 Minutes | 99 | 4.6% |
| 45 to 59 Minutes | 91 | 4.3% |
| 60 to 89 Minutes | 186 | 8.7% |
| 90 or more Minutes | 29 | 1.4% |
Commute Time by Sex in Atmore
The most common commute times in Atmore are 10 to 14 minutes (389 commuters, 35.6%) for males and 20 to 24 minutes (274 commuters, 26.2%) for females.
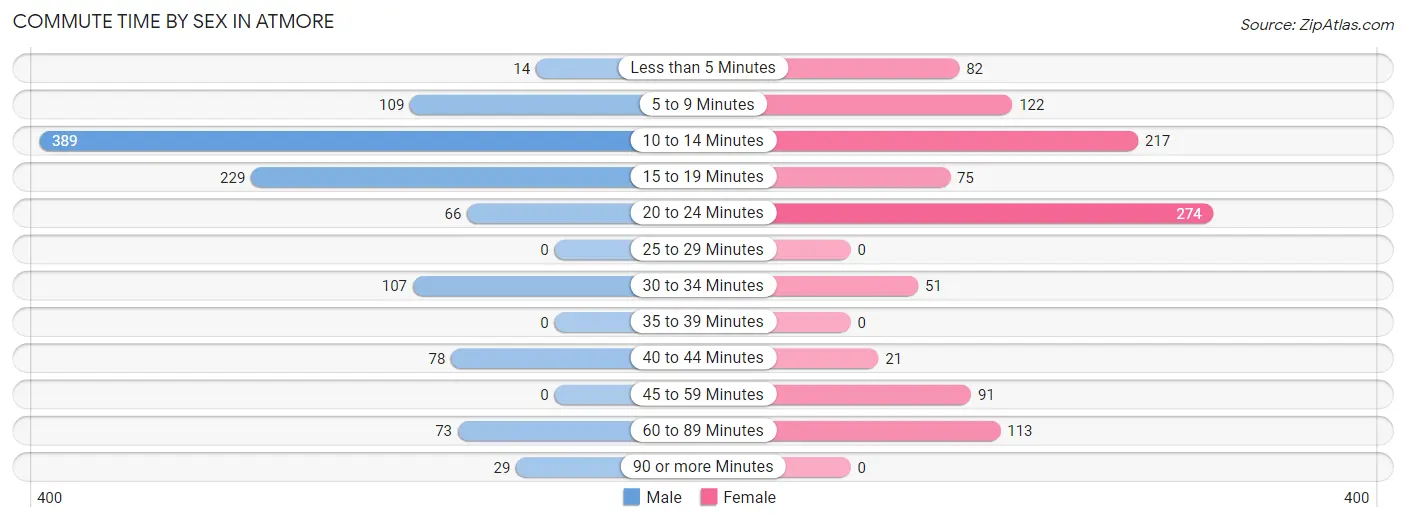
| Commute Time | Male | Female |
| Less than 5 Minutes | 14 (1.3%) | 82 (7.8%) |
| 5 to 9 Minutes | 109 (10.0%) | 122 (11.7%) |
| 10 to 14 Minutes | 389 (35.6%) | 217 (20.7%) |
| 15 to 19 Minutes | 229 (20.9%) | 75 (7.2%) |
| 20 to 24 Minutes | 66 (6.0%) | 274 (26.2%) |
| 25 to 29 Minutes | 0 (0.0%) | 0 (0.0%) |
| 30 to 34 Minutes | 107 (9.8%) | 51 (4.9%) |
| 35 to 39 Minutes | 0 (0.0%) | 0 (0.0%) |
| 40 to 44 Minutes | 78 (7.1%) | 21 (2.0%) |
| 45 to 59 Minutes | 0 (0.0%) | 91 (8.7%) |
| 60 to 89 Minutes | 73 (6.7%) | 113 (10.8%) |
| 90 or more Minutes | 29 (2.6%) | 0 (0.0%) |
Time of Departure to Work by Sex in Atmore
The most frequent times of departure to work in Atmore are 6:30 AM to 6:59 AM (221, 20.2%) for males and 8:00 AM to 8:29 AM (257, 24.6%) for females.
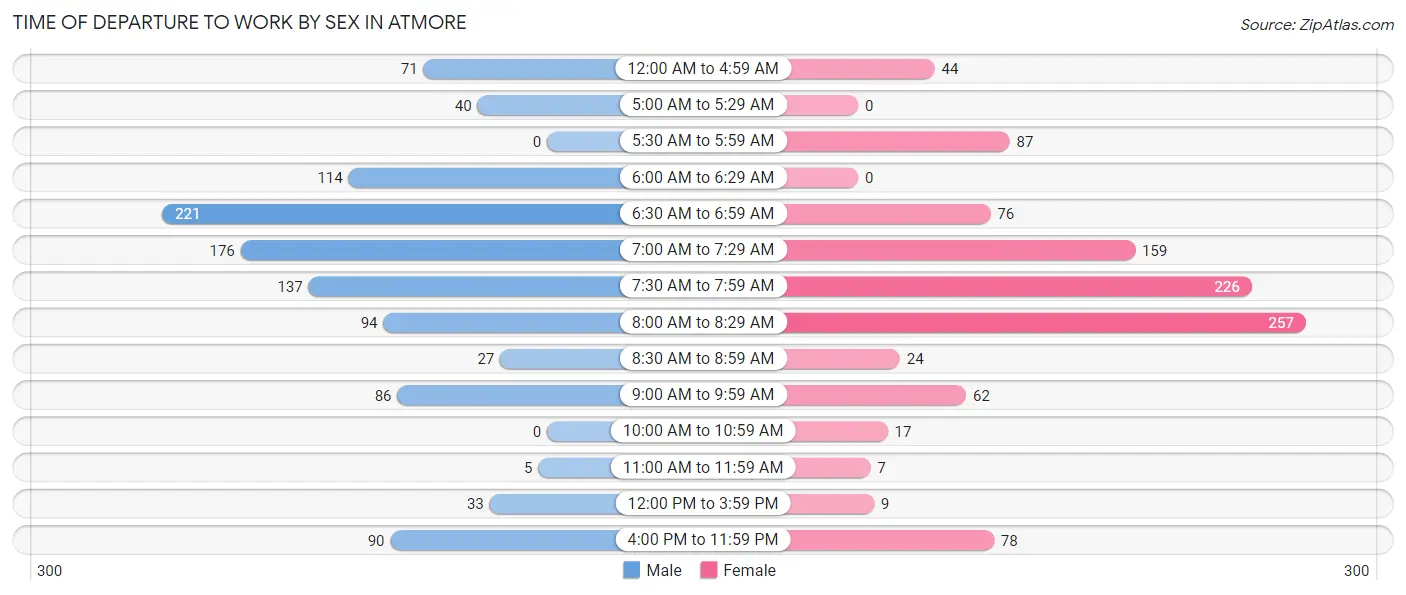
| Time of Departure | Male | Female |
| 12:00 AM to 4:59 AM | 71 (6.5%) | 44 (4.2%) |
| 5:00 AM to 5:29 AM | 40 (3.7%) | 0 (0.0%) |
| 5:30 AM to 5:59 AM | 0 (0.0%) | 87 (8.3%) |
| 6:00 AM to 6:29 AM | 114 (10.4%) | 0 (0.0%) |
| 6:30 AM to 6:59 AM | 221 (20.2%) | 76 (7.3%) |
| 7:00 AM to 7:29 AM | 176 (16.1%) | 159 (15.2%) |
| 7:30 AM to 7:59 AM | 137 (12.5%) | 226 (21.6%) |
| 8:00 AM to 8:29 AM | 94 (8.6%) | 257 (24.6%) |
| 8:30 AM to 8:59 AM | 27 (2.5%) | 24 (2.3%) |
| 9:00 AM to 9:59 AM | 86 (7.9%) | 62 (5.9%) |
| 10:00 AM to 10:59 AM | 0 (0.0%) | 17 (1.6%) |
| 11:00 AM to 11:59 AM | 5 (0.5%) | 7 (0.7%) |
| 12:00 PM to 3:59 PM | 33 (3.0%) | 9 (0.9%) |
| 4:00 PM to 11:59 PM | 90 (8.2%) | 78 (7.5%) |
| Total | 1,094 (100.0%) | 1,046 (100.0%) |
Housing Occupancy in Atmore
Occupancy by Ownership in Atmore
Of the total 2,725 dwellings in Atmore, owner-occupied units account for 1,470 (53.9%), while renter-occupied units make up 1,255 (46.1%).
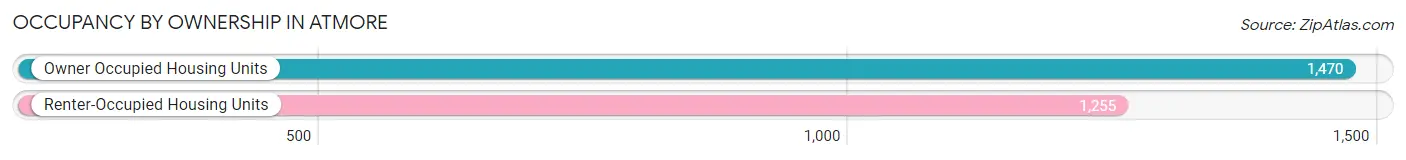
| Occupancy | # Housing Units | % Housing Units |
| Owner Occupied Housing Units | 1,470 | 53.9% |
| Renter-Occupied Housing Units | 1,255 | 46.1% |
| Total Occupied Housing Units | 2,725 | 100.0% |
Occupancy by Household Size in Atmore
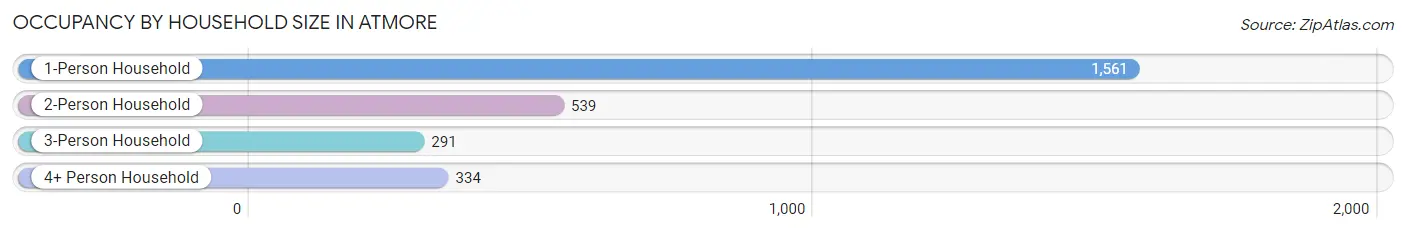
| Household Size | # Housing Units | % Housing Units |
| 1-Person Household | 1,561 | 57.3% |
| 2-Person Household | 539 | 19.8% |
| 3-Person Household | 291 | 10.7% |
| 4+ Person Household | 334 | 12.3% |
| Total Housing Units | 2,725 | 100.0% |
Occupancy by Ownership by Household Size in Atmore
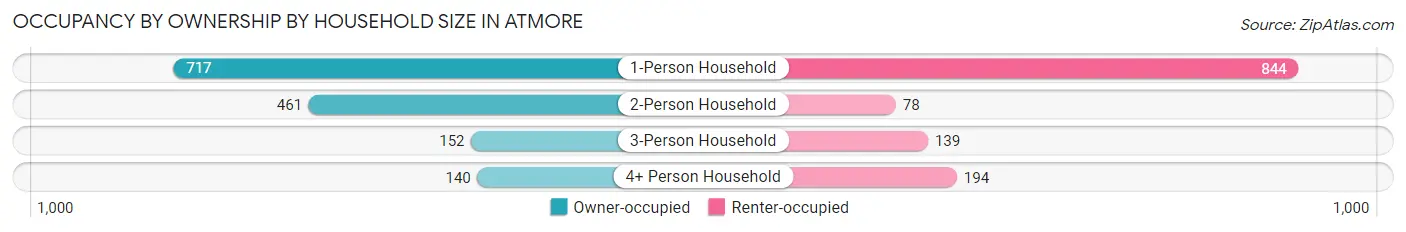
| Household Size | Owner-occupied | Renter-occupied |
| 1-Person Household | 717 (45.9%) | 844 (54.1%) |
| 2-Person Household | 461 (85.5%) | 78 (14.5%) |
| 3-Person Household | 152 (52.2%) | 139 (47.8%) |
| 4+ Person Household | 140 (41.9%) | 194 (58.1%) |
| Total Housing Units | 1,470 (53.9%) | 1,255 (46.1%) |
Occupancy by Educational Attainment in Atmore
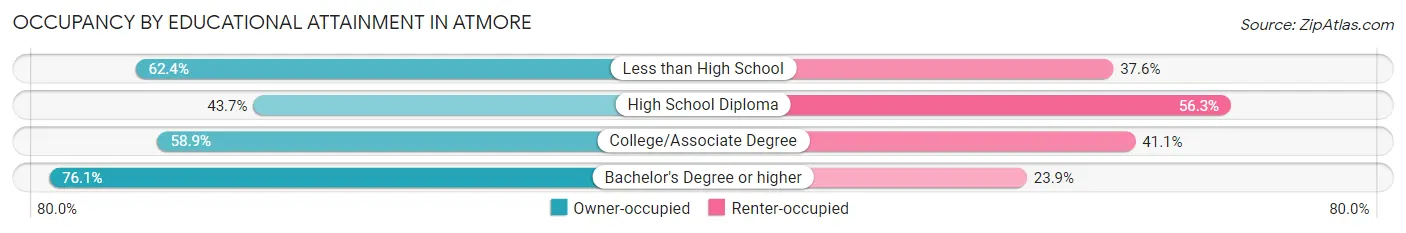
| Household Size | Owner-occupied | Renter-occupied |
| Less than High School | 317 (62.4%) | 191 (37.6%) |
| High School Diploma | 575 (43.7%) | 740 (56.3%) |
| College/Associate Degree | 371 (58.9%) | 259 (41.1%) |
| Bachelor's Degree or higher | 207 (76.1%) | 65 (23.9%) |
Occupancy by Age of Householder in Atmore
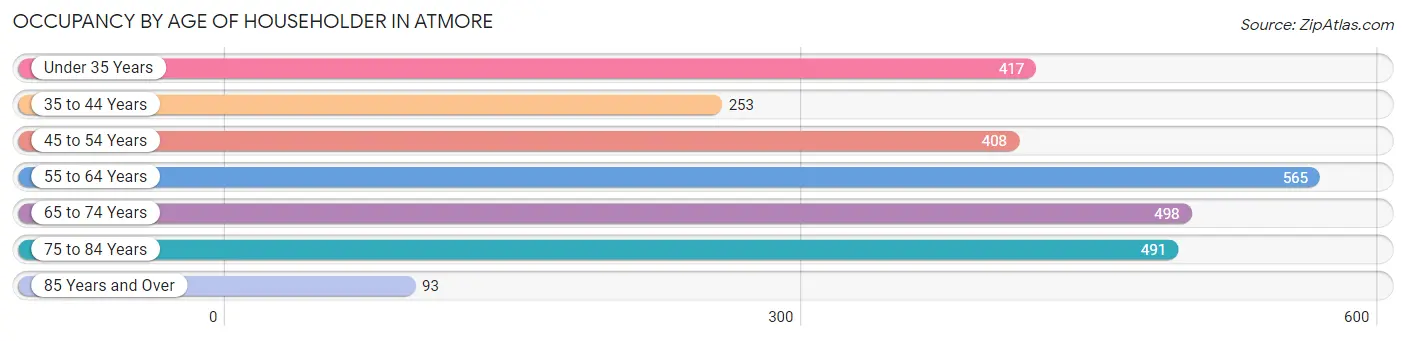
| Age Bracket | # Households | % Households |
| Under 35 Years | 417 | 15.3% |
| 35 to 44 Years | 253 | 9.3% |
| 45 to 54 Years | 408 | 15.0% |
| 55 to 64 Years | 565 | 20.7% |
| 65 to 74 Years | 498 | 18.3% |
| 75 to 84 Years | 491 | 18.0% |
| 85 Years and Over | 93 | 3.4% |
| Total | 2,725 | 100.0% |
Housing Finances in Atmore
Median Income by Occupancy in Atmore
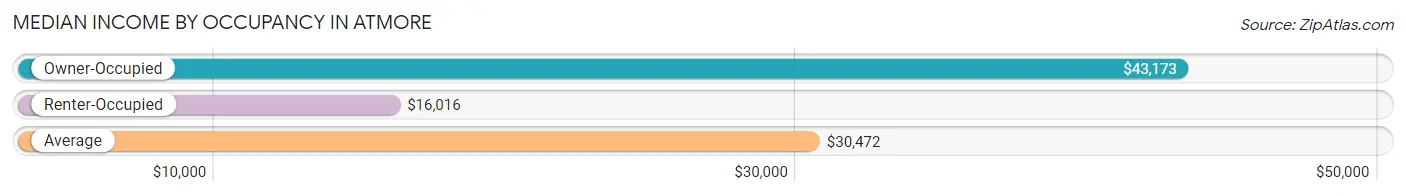
| Occupancy Type | # Households | Median Income |
| Owner-Occupied | 1,470 (53.9%) | $43,173 |
| Renter-Occupied | 1,255 (46.1%) | $16,016 |
| Average | 2,725 (100.0%) | $30,472 |
Occupancy by Householder Income Bracket in Atmore
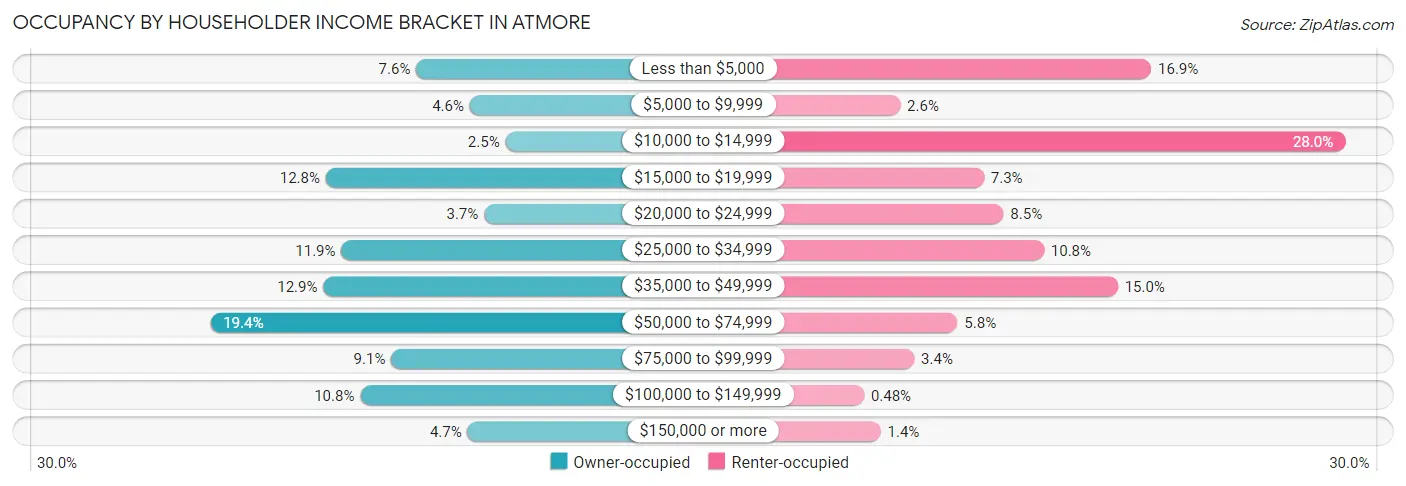
| Income Bracket | Owner-occupied | Renter-occupied |
| Less than $5,000 | 112 (7.6%) | 212 (16.9%) |
| $5,000 to $9,999 | 67 (4.6%) | 32 (2.5%) |
| $10,000 to $14,999 | 37 (2.5%) | 351 (28.0%) |
| $15,000 to $19,999 | 188 (12.8%) | 92 (7.3%) |
| $20,000 to $24,999 | 55 (3.7%) | 106 (8.5%) |
| $25,000 to $34,999 | 175 (11.9%) | 135 (10.8%) |
| $35,000 to $49,999 | 190 (12.9%) | 188 (15.0%) |
| $50,000 to $74,999 | 285 (19.4%) | 73 (5.8%) |
| $75,000 to $99,999 | 133 (9.0%) | 42 (3.4%) |
| $100,000 to $149,999 | 159 (10.8%) | 6 (0.5%) |
| $150,000 or more | 69 (4.7%) | 18 (1.4%) |
| Total | 1,470 (100.0%) | 1,255 (100.0%) |
Monthly Housing Cost Tiers in Atmore
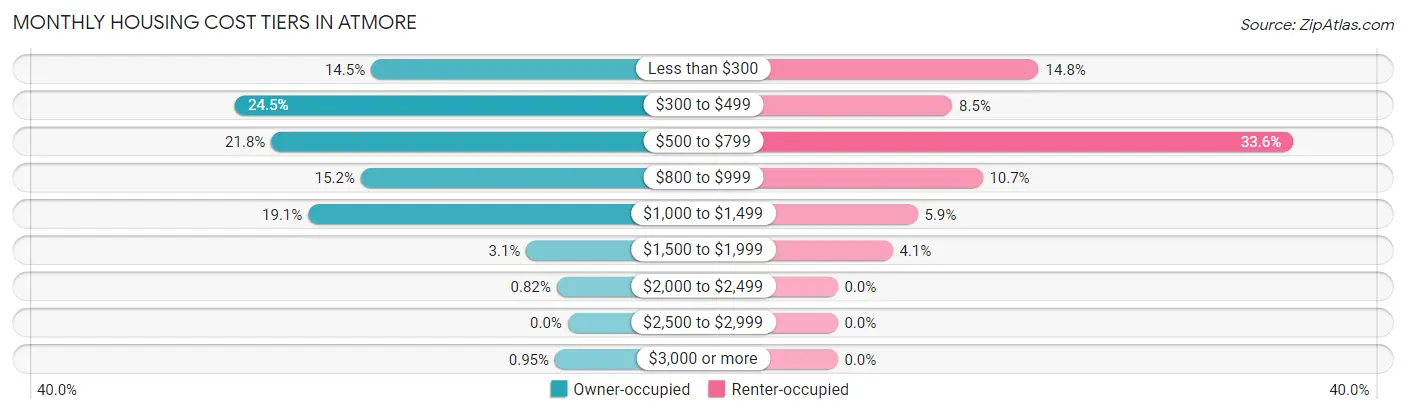
| Monthly Cost | Owner-occupied | Renter-occupied |
| Less than $300 | 213 (14.5%) | 186 (14.8%) |
| $300 to $499 | 360 (24.5%) | 106 (8.5%) |
| $500 to $799 | 321 (21.8%) | 421 (33.6%) |
| $800 to $999 | 224 (15.2%) | 134 (10.7%) |
| $1,000 to $1,499 | 281 (19.1%) | 74 (5.9%) |
| $1,500 to $1,999 | 45 (3.1%) | 51 (4.1%) |
| $2,000 to $2,499 | 12 (0.8%) | 0 (0.0%) |
| $2,500 to $2,999 | 0 (0.0%) | 0 (0.0%) |
| $3,000 or more | 14 (0.9%) | 0 (0.0%) |
| Total | 1,470 (100.0%) | 1,255 (100.0%) |
Physical Housing Characteristics in Atmore
Housing Structures in Atmore
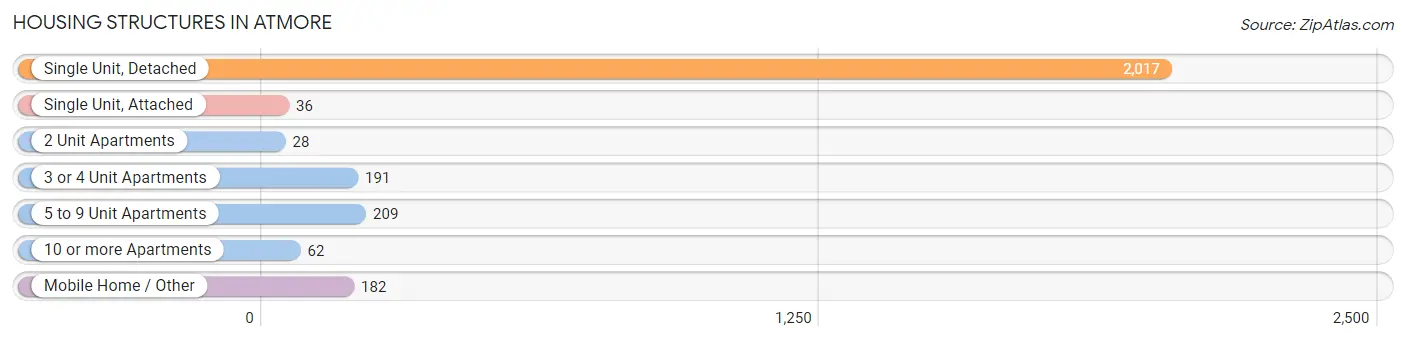
| Structure Type | # Housing Units | % Housing Units |
| Single Unit, Detached | 2,017 | 74.0% |
| Single Unit, Attached | 36 | 1.3% |
| 2 Unit Apartments | 28 | 1.0% |
| 3 or 4 Unit Apartments | 191 | 7.0% |
| 5 to 9 Unit Apartments | 209 | 7.7% |
| 10 or more Apartments | 62 | 2.3% |
| Mobile Home / Other | 182 | 6.7% |
| Total | 2,725 | 100.0% |
Housing Structures by Occupancy in Atmore
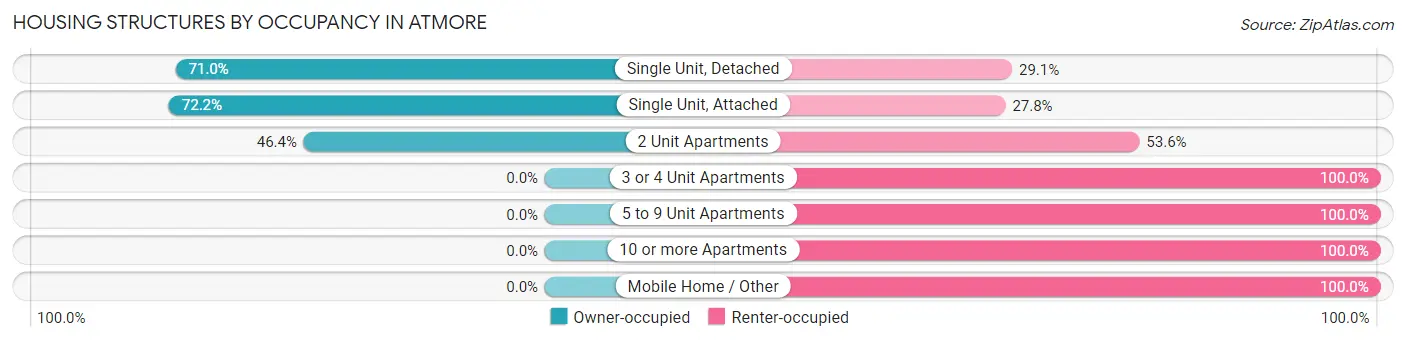
| Structure Type | Owner-occupied | Renter-occupied |
| Single Unit, Detached | 1,431 (71.0%) | 586 (29.0%) |
| Single Unit, Attached | 26 (72.2%) | 10 (27.8%) |
| 2 Unit Apartments | 13 (46.4%) | 15 (53.6%) |
| 3 or 4 Unit Apartments | 0 (0.0%) | 191 (100.0%) |
| 5 to 9 Unit Apartments | 0 (0.0%) | 209 (100.0%) |
| 10 or more Apartments | 0 (0.0%) | 62 (100.0%) |
| Mobile Home / Other | 0 (0.0%) | 182 (100.0%) |
| Total | 1,470 (53.9%) | 1,255 (46.1%) |
Housing Structures by Number of Rooms in Atmore
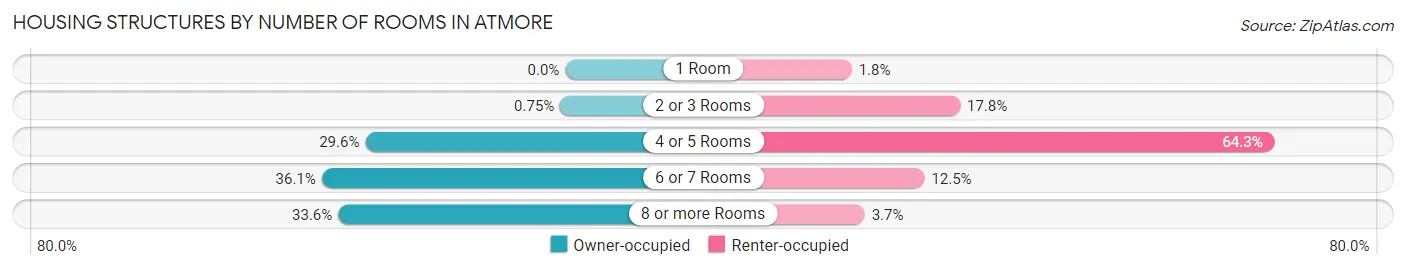
| Number of Rooms | Owner-occupied | Renter-occupied |
| 1 Room | 0 (0.0%) | 22 (1.8%) |
| 2 or 3 Rooms | 11 (0.7%) | 223 (17.8%) |
| 4 or 5 Rooms | 435 (29.6%) | 807 (64.3%) |
| 6 or 7 Rooms | 530 (36.0%) | 157 (12.5%) |
| 8 or more Rooms | 494 (33.6%) | 46 (3.7%) |
| Total | 1,470 (100.0%) | 1,255 (100.0%) |
Housing Structure by Heating Type in Atmore
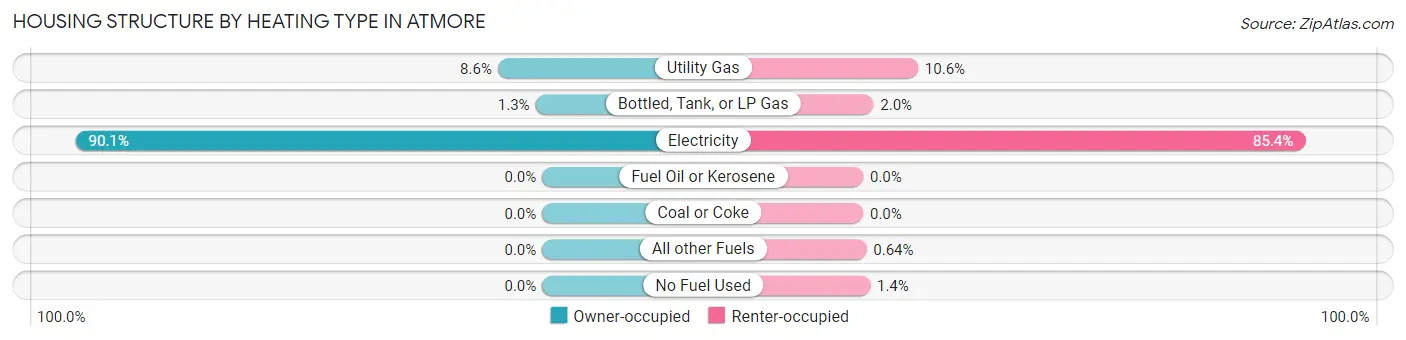
| Heating Type | Owner-occupied | Renter-occupied |
| Utility Gas | 126 (8.6%) | 133 (10.6%) |
| Bottled, Tank, or LP Gas | 19 (1.3%) | 25 (2.0%) |
| Electricity | 1,325 (90.1%) | 1,072 (85.4%) |
| Fuel Oil or Kerosene | 0 (0.0%) | 0 (0.0%) |
| Coal or Coke | 0 (0.0%) | 0 (0.0%) |
| All other Fuels | 0 (0.0%) | 8 (0.6%) |
| No Fuel Used | 0 (0.0%) | 17 (1.3%) |
| Total | 1,470 (100.0%) | 1,255 (100.0%) |
Household Vehicle Usage in Atmore
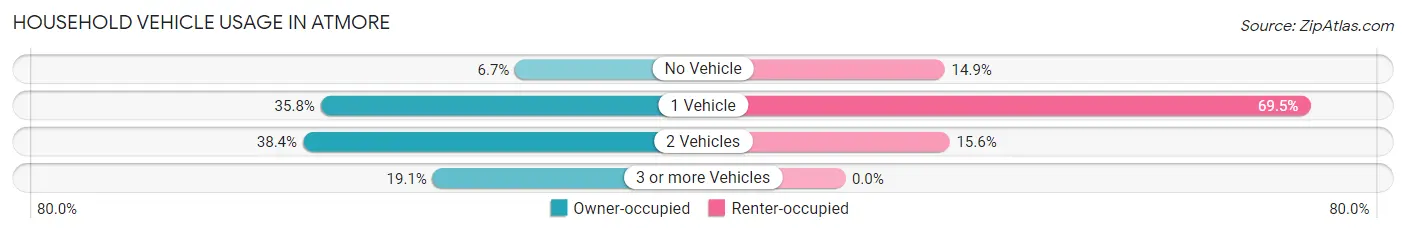
| Vehicles per Household | Owner-occupied | Renter-occupied |
| No Vehicle | 99 (6.7%) | 187 (14.9%) |
| 1 Vehicle | 526 (35.8%) | 872 (69.5%) |
| 2 Vehicles | 565 (38.4%) | 196 (15.6%) |
| 3 or more Vehicles | 280 (19.1%) | 0 (0.0%) |
| Total | 1,470 (100.0%) | 1,255 (100.0%) |
Real Estate & Mortgages in Atmore
Real Estate and Mortgage Overview in Atmore
| Characteristic | Without Mortgage | With Mortgage |
| Housing Units | 752 | 718 |
| Median Property Value | $105,200 | $158,900 |
| Median Household Income | $34,063 | $49 |
| Monthly Housing Costs | $408 | $14 |
| Real Estate Taxes | $394 | $170 |
Property Value by Mortgage Status in Atmore
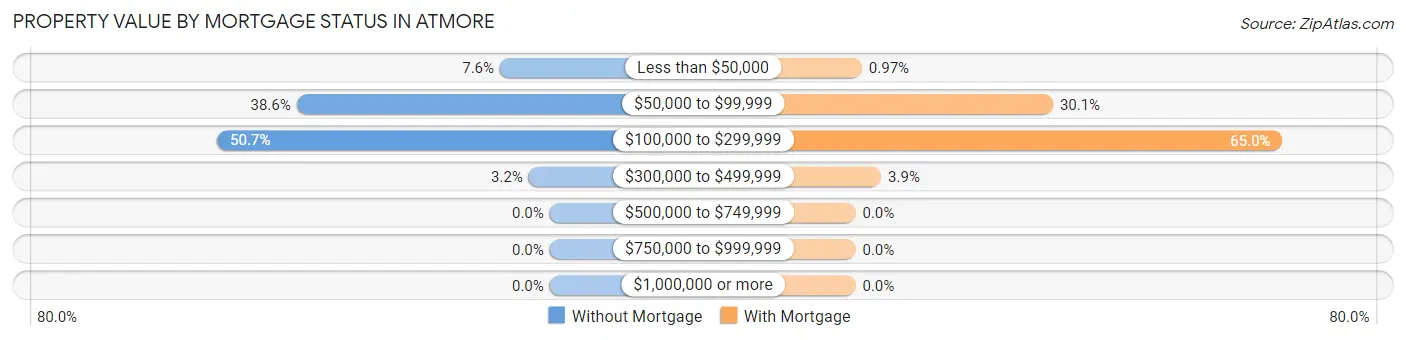
| Property Value | Without Mortgage | With Mortgage |
| Less than $50,000 | 57 (7.6%) | 7 (1.0%) |
| $50,000 to $99,999 | 290 (38.6%) | 216 (30.1%) |
| $100,000 to $299,999 | 381 (50.7%) | 467 (65.0%) |
| $300,000 to $499,999 | 24 (3.2%) | 28 (3.9%) |
| $500,000 to $749,999 | 0 (0.0%) | 0 (0.0%) |
| $750,000 to $999,999 | 0 (0.0%) | 0 (0.0%) |
| $1,000,000 or more | 0 (0.0%) | 0 (0.0%) |
| Total | 752 (100.0%) | 718 (100.0%) |
Household Income by Mortgage Status in Atmore
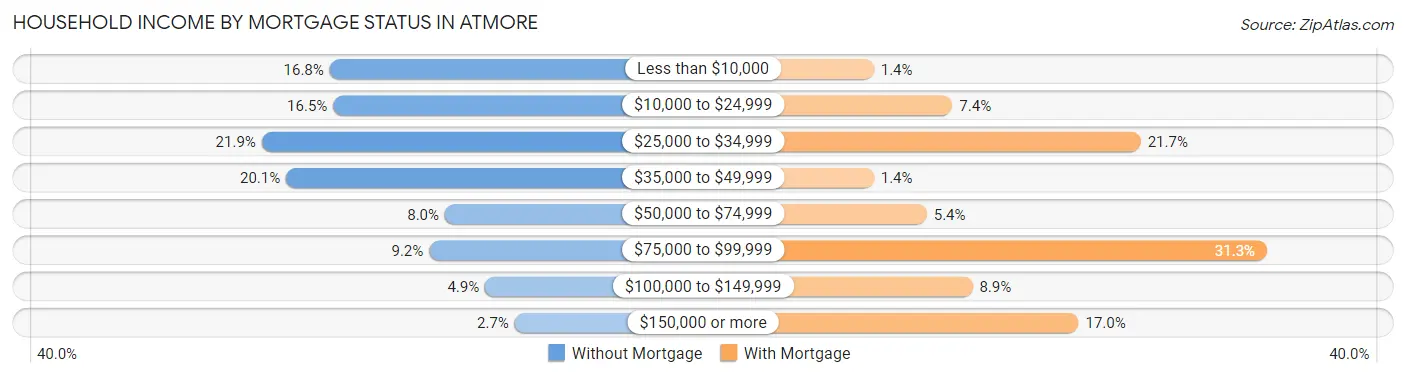
| Household Income | Without Mortgage | With Mortgage |
| Less than $10,000 | 126 (16.8%) | 10 (1.4%) |
| $10,000 to $24,999 | 124 (16.5%) | 53 (7.4%) |
| $25,000 to $34,999 | 165 (21.9%) | 156 (21.7%) |
| $35,000 to $49,999 | 151 (20.1%) | 10 (1.4%) |
| $50,000 to $74,999 | 60 (8.0%) | 39 (5.4%) |
| $75,000 to $99,999 | 69 (9.2%) | 225 (31.3%) |
| $100,000 to $149,999 | 37 (4.9%) | 64 (8.9%) |
| $150,000 or more | 20 (2.7%) | 122 (17.0%) |
| Total | 752 (100.0%) | 718 (100.0%) |
Property Value to Household Income Ratio in Atmore
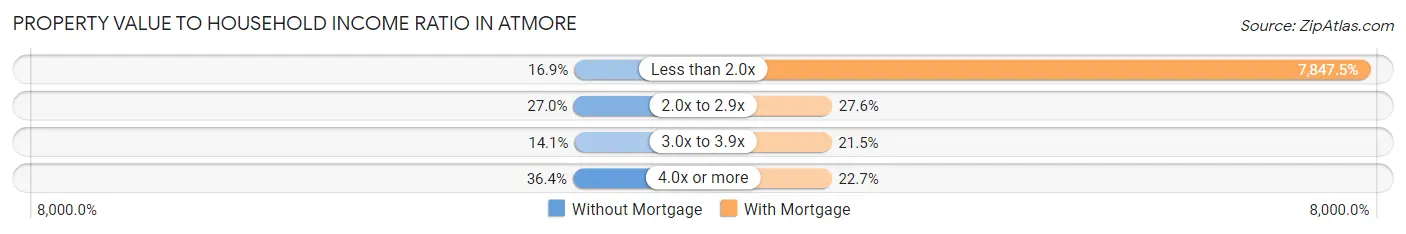
| Value-to-Income Ratio | Without Mortgage | With Mortgage |
| Less than 2.0x | 127 (16.9%) | 56,345 (7,847.5%) |
| 2.0x to 2.9x | 203 (27.0%) | 198 (27.6%) |
| 3.0x to 3.9x | 106 (14.1%) | 154 (21.4%) |
| 4.0x or more | 274 (36.4%) | 163 (22.7%) |
| Total | 752 (100.0%) | 718 (100.0%) |
Real Estate Taxes by Mortgage Status in Atmore
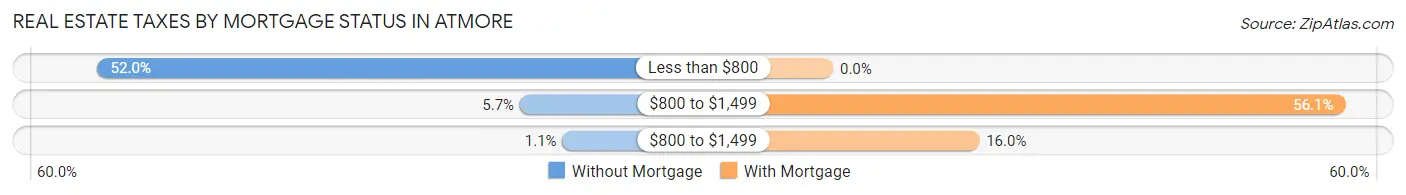
| Property Taxes | Without Mortgage | With Mortgage |
| Less than $800 | 391 (52.0%) | 0 (0.0%) |
| $800 to $1,499 | 43 (5.7%) | 403 (56.1%) |
| $800 to $1,499 | 8 (1.1%) | 115 (16.0%) |
| Total | 752 (100.0%) | 718 (100.0%) |
Health & Disability in Atmore
Health Insurance Coverage by Age in Atmore
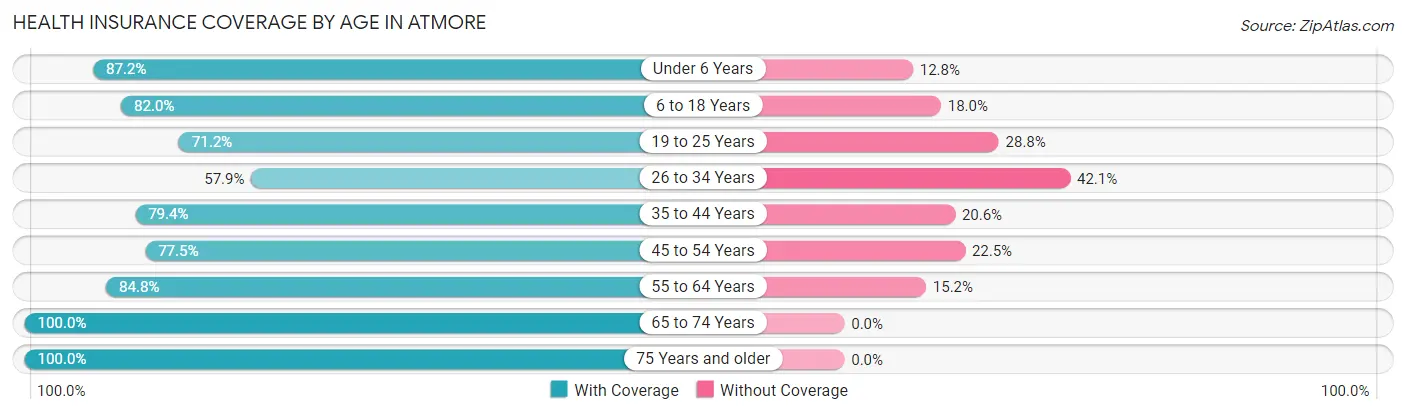
| Age Bracket | With Coverage | Without Coverage |
| Under 6 Years | 437 (87.2%) | 64 (12.8%) |
| 6 to 18 Years | 793 (82.0%) | 174 (18.0%) |
| 19 to 25 Years | 480 (71.2%) | 194 (28.8%) |
| 26 to 34 Years | 322 (57.9%) | 234 (42.1%) |
| 35 to 44 Years | 577 (79.4%) | 150 (20.6%) |
| 45 to 54 Years | 565 (77.5%) | 164 (22.5%) |
| 55 to 64 Years | 669 (84.8%) | 120 (15.2%) |
| 65 to 74 Years | 617 (100.0%) | 0 (0.0%) |
| 75 Years and older | 735 (100.0%) | 0 (0.0%) |
| Total | 5,195 (82.5%) | 1,100 (17.5%) |
Health Insurance Coverage by Citizenship Status in Atmore
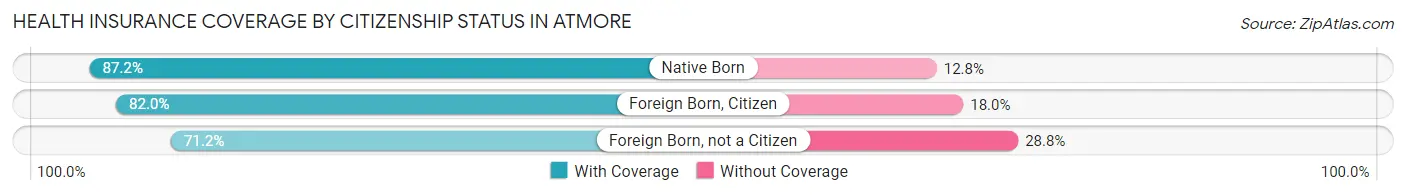
| Citizenship Status | With Coverage | Without Coverage |
| Native Born | 437 (87.2%) | 64 (12.8%) |
| Foreign Born, Citizen | 793 (82.0%) | 174 (18.0%) |
| Foreign Born, not a Citizen | 480 (71.2%) | 194 (28.8%) |
Health Insurance Coverage by Household Income in Atmore
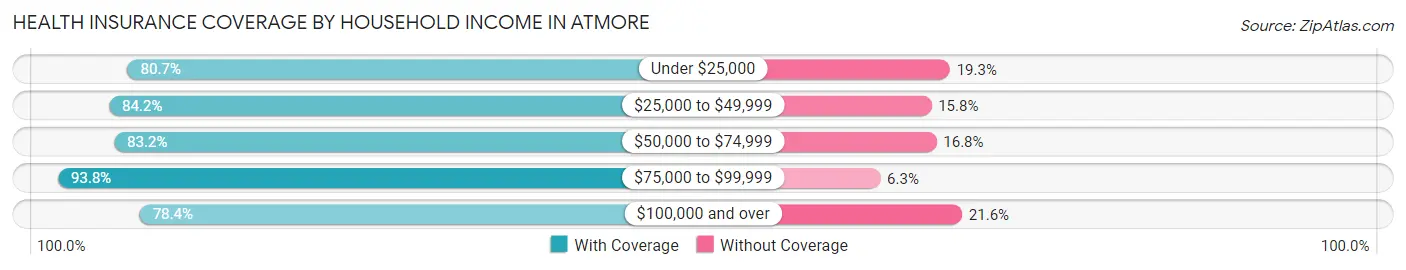
| Household Income | With Coverage | Without Coverage |
| Under $25,000 | 1,991 (80.7%) | 476 (19.3%) |
| $25,000 to $49,999 | 1,272 (84.2%) | 239 (15.8%) |
| $50,000 to $74,999 | 724 (83.2%) | 146 (16.8%) |
| $75,000 to $99,999 | 450 (93.8%) | 30 (6.2%) |
| $100,000 and over | 749 (78.4%) | 206 (21.6%) |
Public vs Private Health Insurance Coverage by Age in Atmore
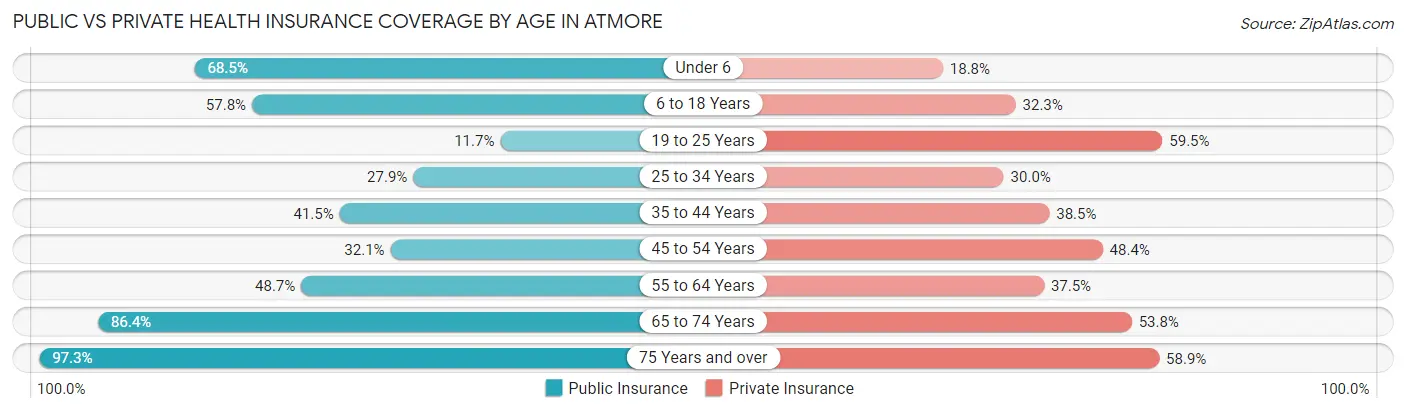
| Age Bracket | Public Insurance | Private Insurance |
| Under 6 | 343 (68.5%) | 94 (18.8%) |
| 6 to 18 Years | 559 (57.8%) | 312 (32.3%) |
| 19 to 25 Years | 79 (11.7%) | 401 (59.5%) |
| 25 to 34 Years | 155 (27.9%) | 167 (30.0%) |
| 35 to 44 Years | 302 (41.5%) | 280 (38.5%) |
| 45 to 54 Years | 234 (32.1%) | 353 (48.4%) |
| 55 to 64 Years | 384 (48.7%) | 296 (37.5%) |
| 65 to 74 Years | 533 (86.4%) | 332 (53.8%) |
| 75 Years and over | 715 (97.3%) | 433 (58.9%) |
| Total | 3,304 (52.5%) | 2,668 (42.4%) |
Disability Status by Sex by Age in Atmore
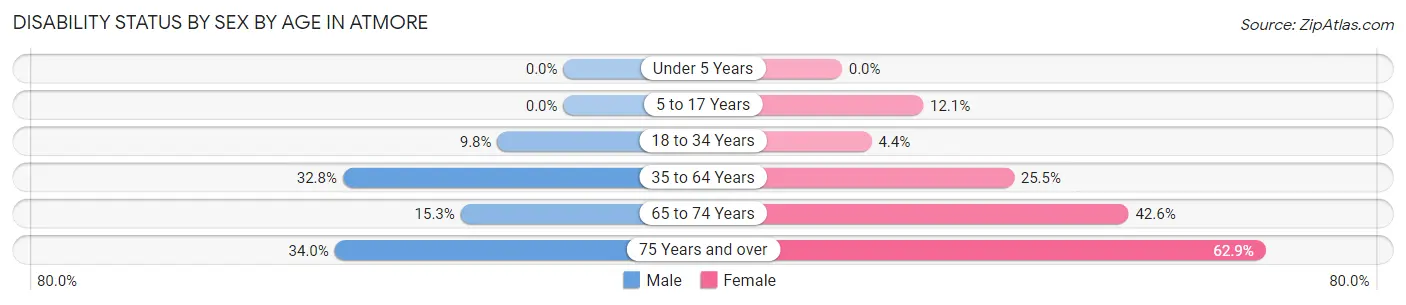
| Age Bracket | Male | Female |
| Under 5 Years | 0 (0.0%) | 0 (0.0%) |
| 5 to 17 Years | 0 (0.0%) | 52 (12.1%) |
| 18 to 34 Years | 55 (9.8%) | 33 (4.4%) |
| 35 to 64 Years | 357 (32.8%) | 295 (25.5%) |
| 65 to 74 Years | 49 (15.3%) | 126 (42.6%) |
| 75 Years and over | 71 (34.0%) | 331 (62.9%) |
Disability Class by Sex by Age in Atmore
Disability Class: Hearing Difficulty
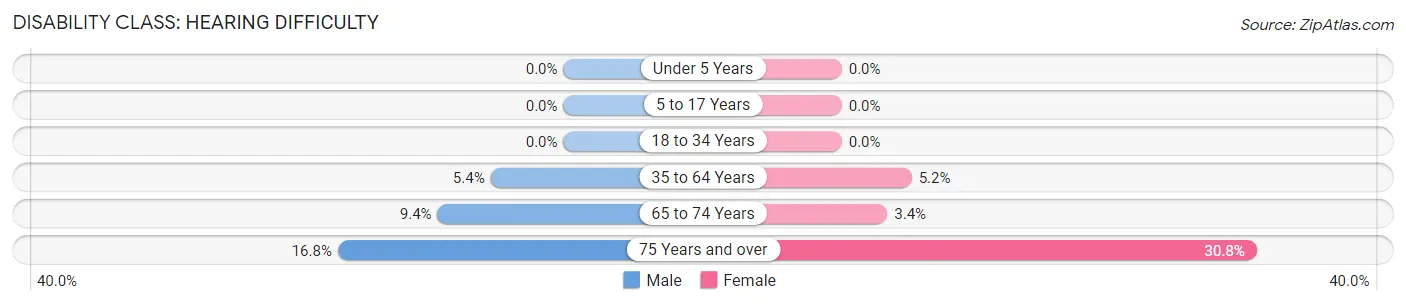
| Age Bracket | Male | Female |
| Under 5 Years | 0 (0.0%) | 0 (0.0%) |
| 5 to 17 Years | 0 (0.0%) | 0 (0.0%) |
| 18 to 34 Years | 0 (0.0%) | 0 (0.0%) |
| 35 to 64 Years | 59 (5.4%) | 60 (5.2%) |
| 65 to 74 Years | 30 (9.3%) | 10 (3.4%) |
| 75 Years and over | 35 (16.8%) | 162 (30.8%) |
Disability Class: Vision Difficulty
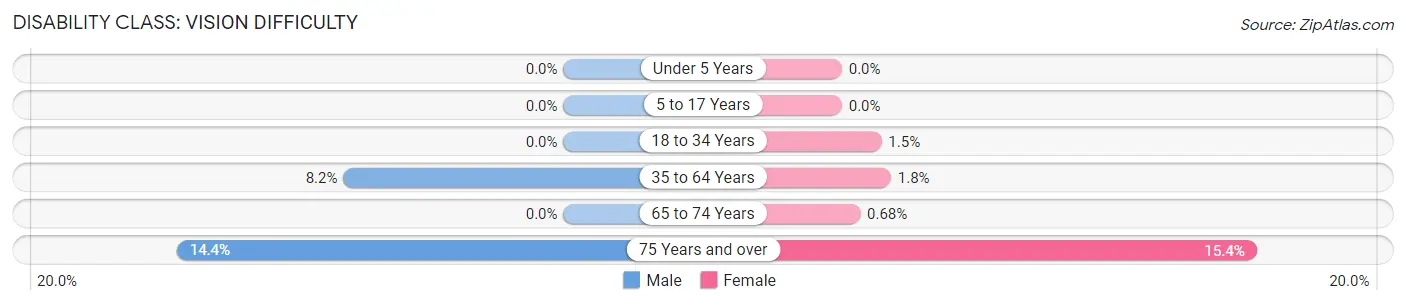
| Age Bracket | Male | Female |
| Under 5 Years | 0 (0.0%) | 0 (0.0%) |
| 5 to 17 Years | 0 (0.0%) | 0 (0.0%) |
| 18 to 34 Years | 0 (0.0%) | 11 (1.5%) |
| 35 to 64 Years | 89 (8.2%) | 21 (1.8%) |
| 65 to 74 Years | 0 (0.0%) | 2 (0.7%) |
| 75 Years and over | 30 (14.3%) | 81 (15.4%) |
Disability Class: Cognitive Difficulty
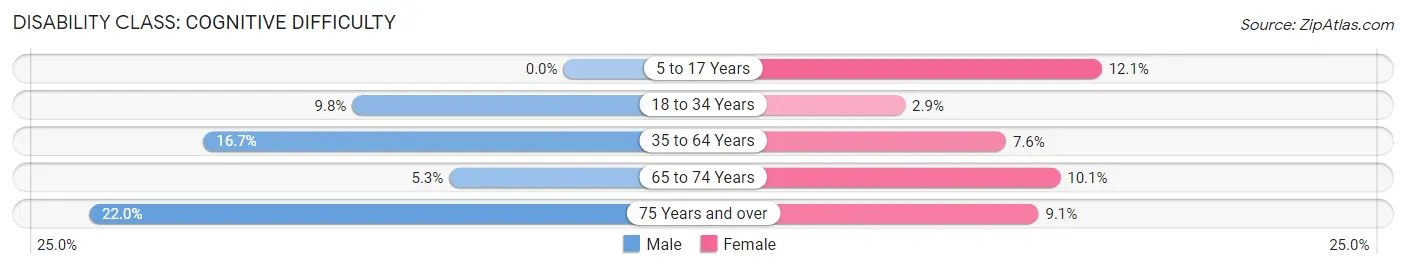
| Age Bracket | Male | Female |
| 5 to 17 Years | 0 (0.0%) | 52 (12.1%) |
| 18 to 34 Years | 55 (9.8%) | 22 (2.9%) |
| 35 to 64 Years | 182 (16.7%) | 88 (7.6%) |
| 65 to 74 Years | 17 (5.3%) | 30 (10.1%) |
| 75 Years and over | 46 (22.0%) | 48 (9.1%) |
Disability Class: Ambulatory Difficulty
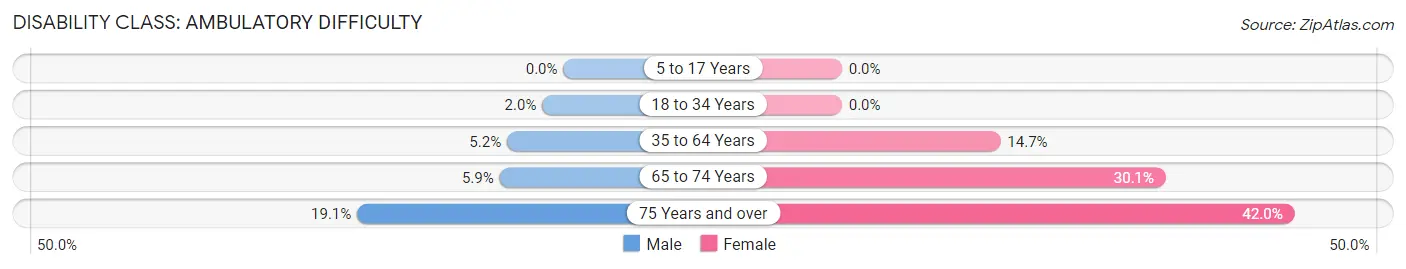
| Age Bracket | Male | Female |
| 5 to 17 Years | 0 (0.0%) | 0 (0.0%) |
| 18 to 34 Years | 11 (2.0%) | 0 (0.0%) |
| 35 to 64 Years | 57 (5.2%) | 170 (14.7%) |
| 65 to 74 Years | 19 (5.9%) | 89 (30.1%) |
| 75 Years and over | 40 (19.1%) | 221 (42.0%) |
Disability Class: Self-Care Difficulty
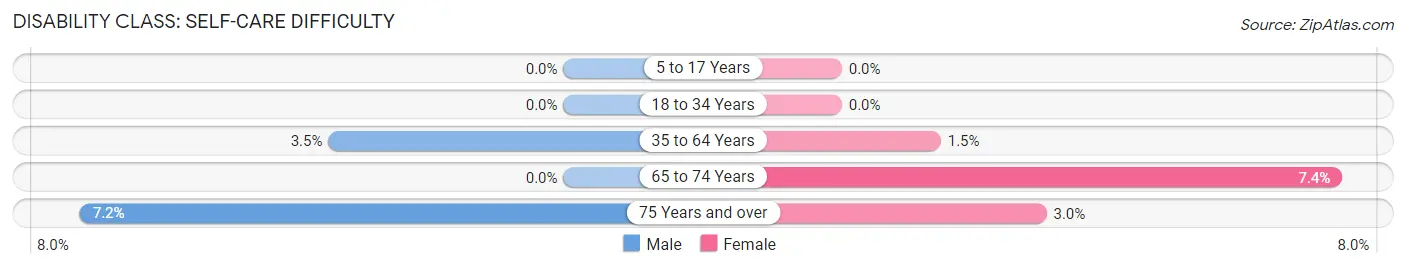
| Age Bracket | Male | Female |
| 5 to 17 Years | 0 (0.0%) | 0 (0.0%) |
| 18 to 34 Years | 0 (0.0%) | 0 (0.0%) |
| 35 to 64 Years | 38 (3.5%) | 17 (1.5%) |
| 65 to 74 Years | 0 (0.0%) | 22 (7.4%) |
| 75 Years and over | 15 (7.2%) | 16 (3.0%) |
Technology Access in Atmore
Computing Device Access in Atmore
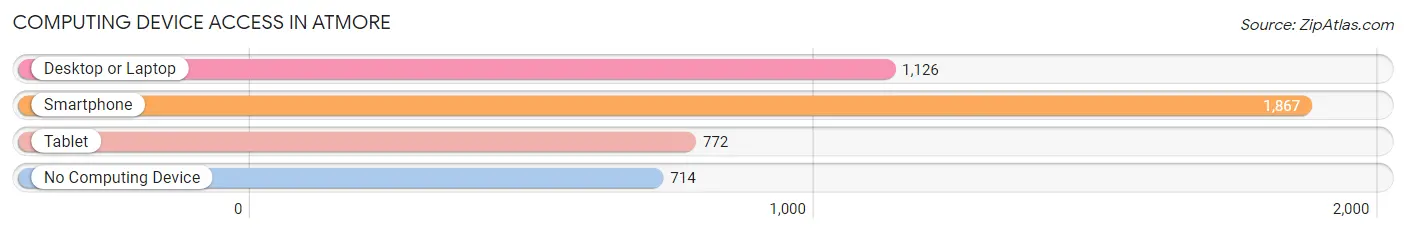
| Device Type | # Households | % Households |
| Desktop or Laptop | 1,126 | 41.3% |
| Smartphone | 1,867 | 68.5% |
| Tablet | 772 | 28.3% |
| No Computing Device | 714 | 26.2% |
| Total | 2,725 | 100.0% |
Internet Access in Atmore
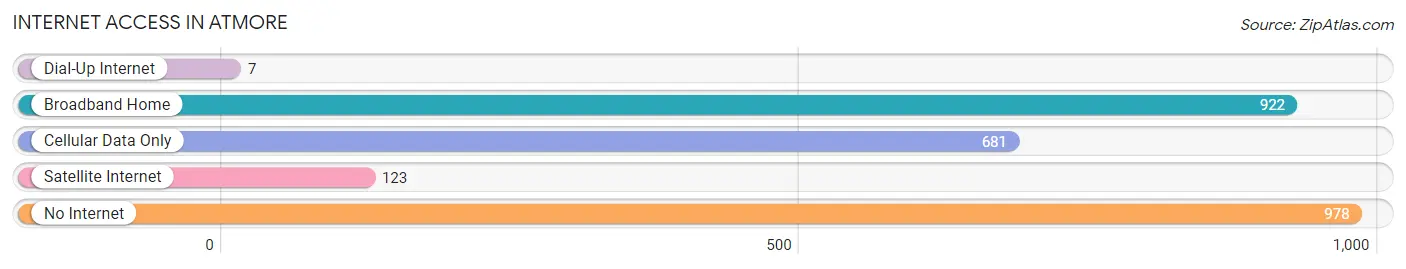
| Internet Type | # Households | % Households |
| Dial-Up Internet | 7 | 0.3% |
| Broadband Home | 922 | 33.8% |
| Cellular Data Only | 681 | 25.0% |
| Satellite Internet | 123 | 4.5% |
| No Internet | 978 | 35.9% |
| Total | 2,725 | 100.0% |
Atmore Summary
Atmore is a city located in Escambia County, Alabama, United States. It is the county seat of Escambia County and is located in the southeastern corner of the state. The population was 10,194 at the 2010 census. It is part of the Pensacola–Ferry Pass–Brent Metropolitan Statistical Area.
History
Atmore was founded in 1866 by William H. Atmore, a wealthy businessman from Mobile, Alabama. He purchased the land from the Creek Indians and named the town after himself. The town was incorporated in 1887.
Atmore was a major railroad hub in the late 19th and early 20th centuries. The Louisville and Nashville Railroad ran through the town, connecting it to Mobile and Pensacola. The town was also the site of a major cotton mill, which was destroyed by fire in the early 1900s.
Atmore was the site of a major battle during the Civil War. On April 8, 1865, Confederate forces under General Nathan Bedford Forrest attacked a Union garrison at the town. The Union forces were forced to retreat, and the Confederate forces occupied the town for the remainder of the war.
Geography
Atmore is located at 31°1′17″N 87°30′17″W (31.0213, -87.5047). According to the U.S. Census Bureau, the city has a total area of 11.2 square miles (29.0 km2), of which 11.1 square miles (28.7 km2) is land and 0.1 square miles (0.3 km2) (0.72%) is water.
Economy
Atmore is a major center for the paper and pulp industry. The city is home to the International Paper Company, which produces paper products for the automotive, construction, and packaging industries. The city is also home to the Atmore Industrial Park, which is home to several manufacturing and distribution companies.
Atmore is also home to several retail stores, including Walmart, Lowe's, and Home Depot. The city is also home to several restaurants, including McDonald's, Burger King, and Sonic.
Demographics
As of the census of 2010, there were 10,194 people, 3,945 households, and 2,619 families residing in the city. The population density was 917.2 people per square mile (354.2/km2). There were 4,521 housing units at an average density of 406.3 per square mile (156.7/km2). The racial makeup of the city was 57.2% White, 37.7% African American, 0.4% Native American, 0.7% Asian, 0.1% Pacific Islander, 1.7% from other races, and 2.2% from two or more races. Hispanic or Latino of any race were 4.2% of the population.
There were 3,945 households, out of which 30.2% had children under the age of 18 living with them, 41.2% were married couples living together, 20.2% had a female householder with no husband present, and 33.7% were non-families. 29.2% of all households were made up of individuals, and 12.3% had someone living alone who was 65 years of age or older. The average household size was 2.48 and the average family size was 3.05.
In the city, the population was spread out, with 25.7% under the age of 18, 8.7% from 18 to 24, 25.3% from 25 to 44, 24.2% from 45 to 64, and 16.1% who were 65 years of age or older. The median age was 38 years. For every 100 females, there were 87.2 males. For every 100 females age 18 and over, there were 82.3 males.
The median income for a household in the city was $27,813, and the median income for a family was $35,938. Males had a median income of $30,917 versus $20,972 for females. The per capita income for the city was $15,845. About 17.2% of families and 20.7% of the population were below the poverty line, including 28.2% of those under age 18 and 16.2% of those age 65 or over.
Common Questions
What is Per Capita Income in Atmore?
Per Capita income in Atmore is $15,060.
What is the Median Family Income in Atmore?
Median Family Income in Atmore is $48,542.
What is the Median Household income in Atmore?
Median Household Income in Atmore is $30,472.
What is Income or Wage Gap in Atmore?
Income or Wage Gap in Atmore is 30.3%.
Women in Atmore earn 69.7 cents for every dollar earned by a man.
What is Inequality or Gini Index in Atmore?
Inequality or Gini Index in Atmore is 0.50.
What is the Total Population of Atmore?
Total Population of Atmore is 8,465.
What is the Total Male Population of Atmore?
Total Male Population of Atmore is 5,228.
What is the Total Female Population of Atmore?
Total Female Population of Atmore is 3,237.
What is the Ratio of Males per 100 Females in Atmore?
There are 161.51 Males per 100 Females in Atmore.
What is the Ratio of Females per 100 Males in Atmore?
There are 61.92 Females per 100 Males in Atmore.
What is the Median Population Age in Atmore?
Median Population Age in Atmore is 43.3 Years.
What is the Average Family Size in Atmore
Average Family Size in Atmore is 4.1 People.
What is the Average Household Size in Atmore
Average Household Size in Atmore is 2.3 People.
How Large is the Labor Force in Atmore?
There are 2,341 People in the Labor Forcein in Atmore.
What is the Percentage of People in the Labor Force in Atmore?
31.9% of People are in the Labor Force in Atmore.
What is the Unemployment Rate in Atmore?
Unemployment Rate in Atmore is 8.3%.