Hernando, FL Map & Demographics
Hernando Map

Hernando Overview
$25,404
PER CAPITA INCOME
$55,031
AVG FAMILY INCOME
$41,019
AVG HOUSEHOLD INCOME
18.6%
WAGE / INCOME GAP [ % ]
81.4¢/ $1
WAGE / INCOME GAP [ $ ]
$7,744
FAMILY INCOME DEFICIT
0.41
INEQUALITY / GINI INDEX
8,911
TOTAL POPULATION
4,817
MALE POPULATION
4,094
FEMALE POPULATION
117.66
MALES / 100 FEMALES
84.99
FEMALES / 100 MALES
60.0
MEDIAN AGE
2.7
AVG FAMILY SIZE
2.1
AVG HOUSEHOLD SIZE
2,712
LABOR FORCE [ PEOPLE ]
34.4%
PERCENT IN LABOR FORCE
9.1%
UNEMPLOYMENT RATE
Hernando Zip Codes
Hernando Area Codes
Income in Hernando
Income Overview in Hernando
Per Capita Income in Hernando is $25,404, while median incomes of families and households are $55,031 and $41,019 respectively.
| Characteristic | Number | Measure |
| Per Capita Income | 8,911 | $25,404 |
| Median Family Income | 2,495 | $55,031 |
| Mean Family Income | 2,495 | $61,522 |
| Median Household Income | 4,183 | $41,019 |
| Mean Household Income | 4,183 | $51,987 |
| Income Deficit | 2,495 | $7,744 |
| Wage / Income Gap (%) | 8,911 | 18.56% |
| Wage / Income Gap ($) | 8,911 | 81.44¢ per $1 |
| Gini / Inequality Index | 8,911 | 0.41 |
Earnings by Sex in Hernando
Average Earnings in Hernando are $33,220, $37,711 for men and $30,713 for women, a difference of 18.6%.
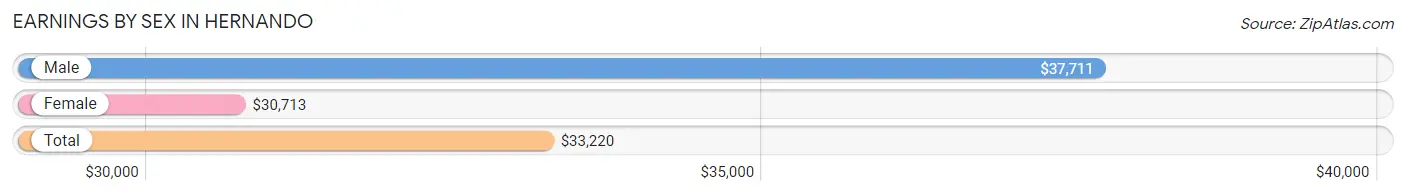
| Sex | Number | Average Earnings |
| Male | 1,597 (58.2%) | $37,711 |
| Female | 1,149 (41.8%) | $30,713 |
| Total | 2,746 (100.0%) | $33,220 |
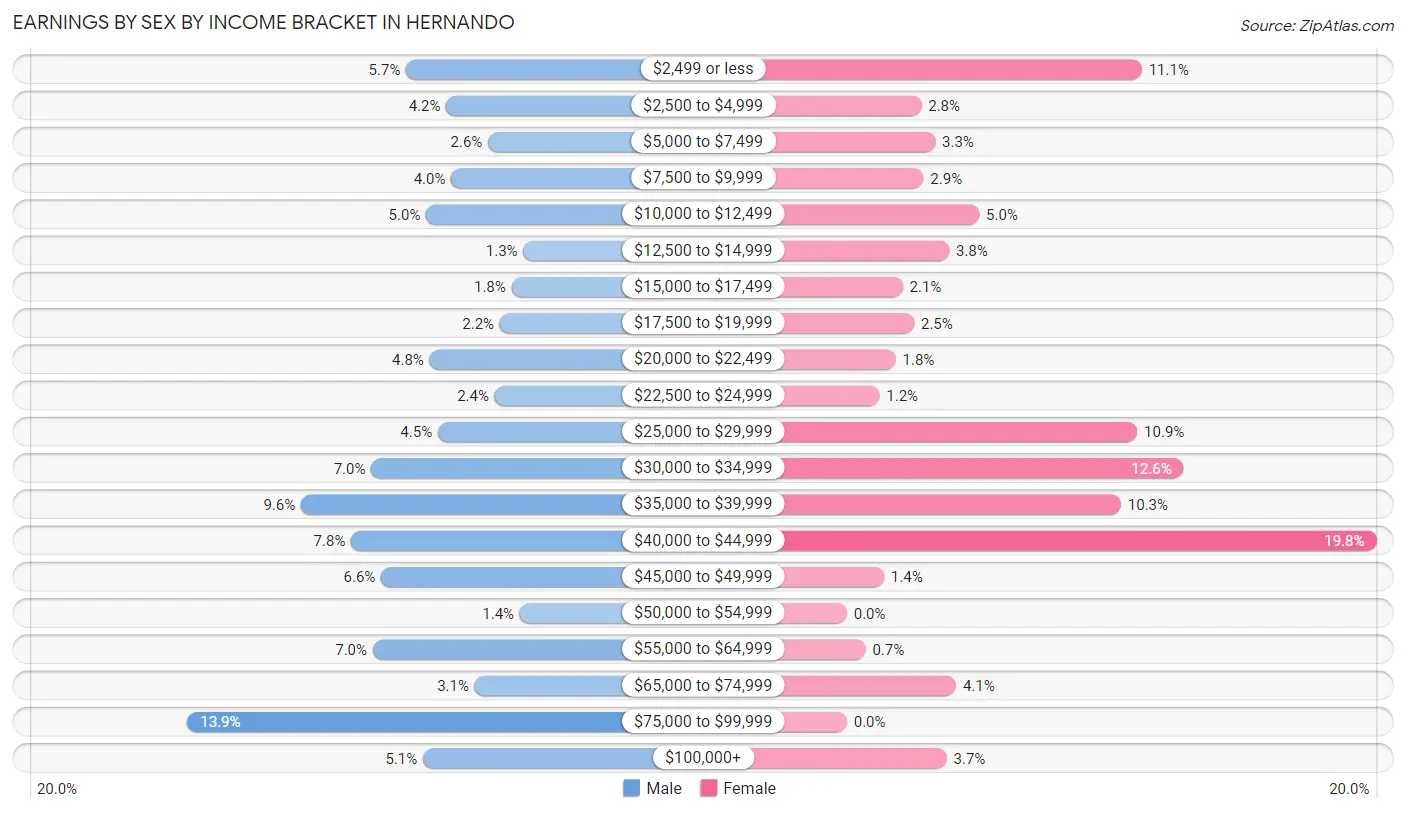
Earnings by Sex by Income Bracket in Hernando
The most common earnings brackets in Hernando are $75,000 to $99,999 for men (222 | 13.9%) and $40,000 to $44,999 for women (228 | 19.8%).
| Income | Male | Female |
| $2,499 or less | 91 (5.7%) | 127 (11.1%) |
| $2,500 to $4,999 | 67 (4.2%) | 32 (2.8%) |
| $5,000 to $7,499 | 42 (2.6%) | 38 (3.3%) |
| $7,500 to $9,999 | 64 (4.0%) | 33 (2.9%) |
| $10,000 to $12,499 | 79 (5.0%) | 57 (5.0%) |
| $12,500 to $14,999 | 21 (1.3%) | 44 (3.8%) |
| $15,000 to $17,499 | 28 (1.8%) | 24 (2.1%) |
| $17,500 to $19,999 | 35 (2.2%) | 29 (2.5%) |
| $20,000 to $22,499 | 77 (4.8%) | 21 (1.8%) |
| $22,500 to $24,999 | 38 (2.4%) | 14 (1.2%) |
| $25,000 to $29,999 | 72 (4.5%) | 125 (10.9%) |
| $30,000 to $34,999 | 112 (7.0%) | 145 (12.6%) |
| $35,000 to $39,999 | 154 (9.6%) | 118 (10.3%) |
| $40,000 to $44,999 | 124 (7.8%) | 228 (19.8%) |
| $45,000 to $49,999 | 106 (6.6%) | 16 (1.4%) |
| $50,000 to $54,999 | 23 (1.4%) | 0 (0.0%) |
| $55,000 to $64,999 | 111 (7.0%) | 8 (0.7%) |
| $65,000 to $74,999 | 50 (3.1%) | 47 (4.1%) |
| $75,000 to $99,999 | 222 (13.9%) | 0 (0.0%) |
| $100,000+ | 81 (5.1%) | 43 (3.7%) |
| Total | 1,597 (100.0%) | 1,149 (100.0%) |
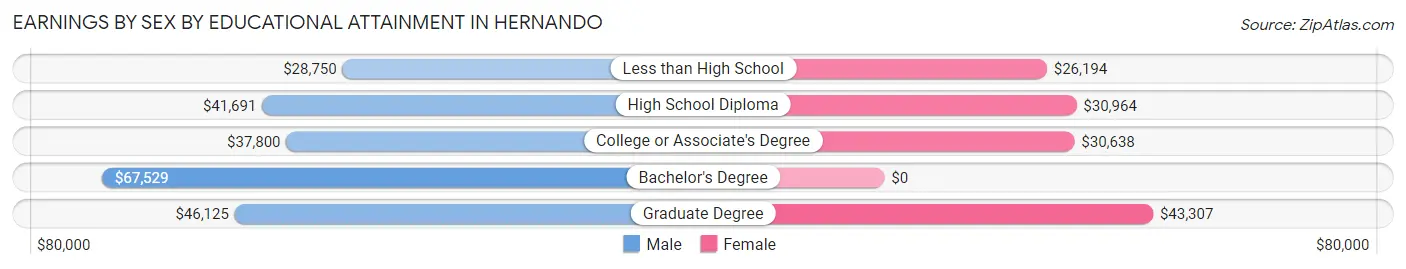
Earnings by Sex by Educational Attainment in Hernando
Average earnings in Hernando are $39,199 for men and $31,647 for women, a difference of 19.3%. Men with an educational attainment of bachelor's degree enjoy the highest average annual earnings of $67,529, while those with less than high school education earn the least with $28,750. Women with an educational attainment of graduate degree earn the most with the average annual earnings of $43,307, while those with less than high school education have the smallest earnings of $26,194.
| Educational Attainment | Male Income | Female Income |
| Less than High School | $28,750 | $26,194 |
| High School Diploma | $41,691 | $30,964 |
| College or Associate's Degree | $37,800 | $30,638 |
| Bachelor's Degree | $67,529 | $0 |
| Graduate Degree | $46,125 | $43,307 |
| Total | $39,199 | $31,647 |
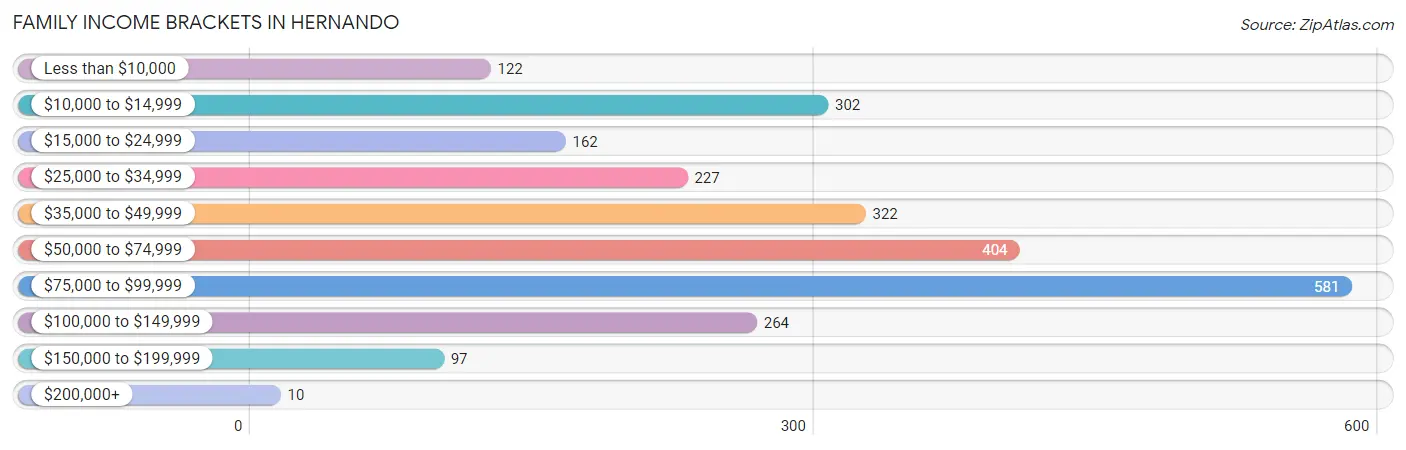
Family Income in Hernando
Family Income Brackets in Hernando
According to the Hernando family income data, there are 581 families falling into the $75,000 to $99,999 income range, which is the most common income bracket and makes up 23.3% of all families. Conversely, the $200,000+ income bracket is the least frequent group with only 10 families (0.4%) belonging to this category.
| Income Bracket | # Families | % Families |
| Less than $10,000 | 122 | 4.9% |
| $10,000 to $14,999 | 302 | 12.1% |
| $15,000 to $24,999 | 162 | 6.5% |
| $25,000 to $34,999 | 227 | 9.1% |
| $35,000 to $49,999 | 322 | 12.9% |
| $50,000 to $74,999 | 404 | 16.2% |
| $75,000 to $99,999 | 581 | 23.3% |
| $100,000 to $149,999 | 264 | 10.6% |
| $150,000 to $199,999 | 97 | 3.9% |
| $200,000+ | 10 | 0.4% |
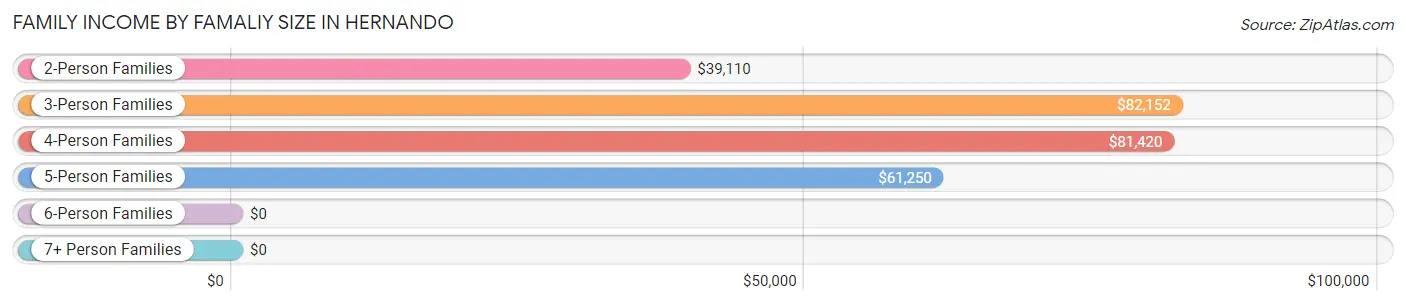
Family Income by Famaliy Size in Hernando
3-person families (523 | 21.0%) account for the highest median family income in Hernando with $82,152 per family, while 3-person families (523 | 21.0%) have the highest median income of $27,384 per family member.
| Income Bracket | # Families | Median Income |
| 2-Person Families | 1,687 (67.6%) | $39,110 |
| 3-Person Families | 523 (21.0%) | $82,152 |
| 4-Person Families | 143 (5.7%) | $81,420 |
| 5-Person Families | 65 (2.6%) | $61,250 |
| 6-Person Families | 77 (3.1%) | $0 |
| 7+ Person Families | 0 (0.0%) | $0 |
| Total | 2,495 (100.0%) | $55,031 |
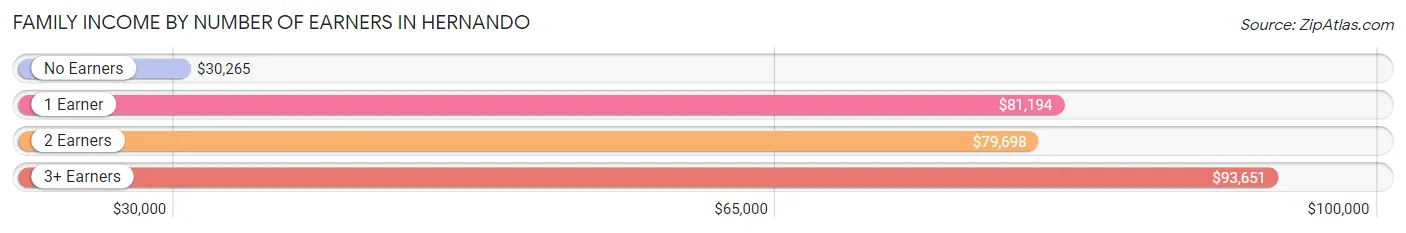
Family Income by Number of Earners in Hernando
The median family income in Hernando is $55,031, with families comprising 3+ earners (155) having the highest median family income of $93,651, while families with no earners (1,206) have the lowest median family income of $30,265, accounting for 6.2% and 48.3% of families, respectively.
| Number of Earners | # Families | Median Income |
| No Earners | 1,206 (48.3%) | $30,265 |
| 1 Earner | 789 (31.6%) | $81,194 |
| 2 Earners | 345 (13.8%) | $79,698 |
| 3+ Earners | 155 (6.2%) | $93,651 |
| Total | 2,495 (100.0%) | $55,031 |
Household Income in Hernando
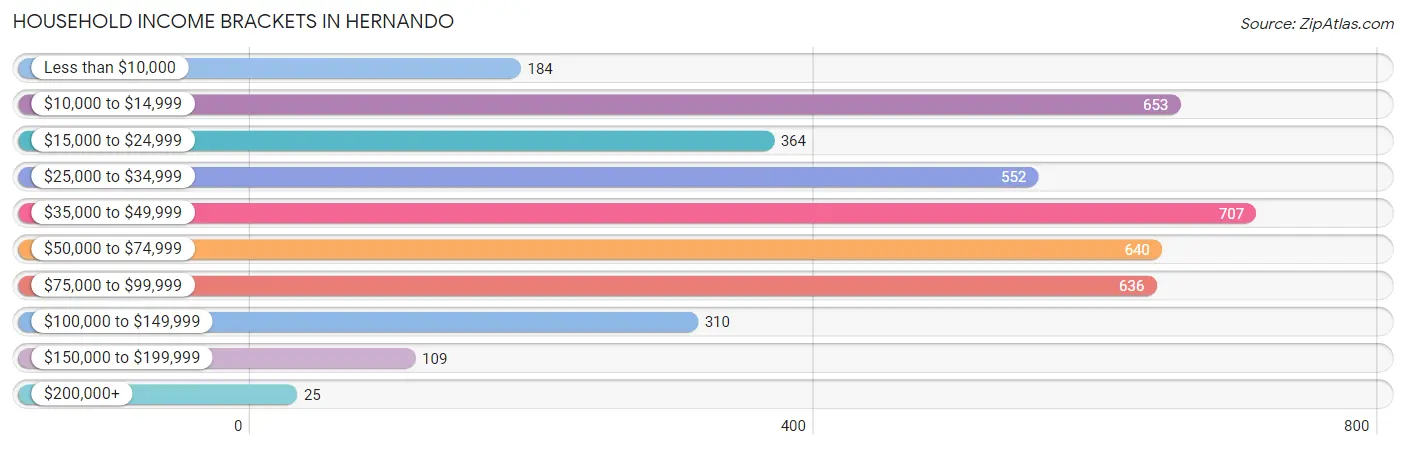
Household Income Brackets in Hernando
With 707 households falling in the category, the $35,000 to $49,999 income range is the most frequent in Hernando, accounting for 16.9% of all households. In contrast, only 25 households (0.6%) fall into the $200,000+ income bracket, making it the least populous group.
| Income Bracket | # Households | % Households |
| Less than $10,000 | 184 | 4.4% |
| $10,000 to $14,999 | 653 | 15.6% |
| $15,000 to $24,999 | 364 | 8.7% |
| $25,000 to $34,999 | 552 | 13.2% |
| $35,000 to $49,999 | 707 | 16.9% |
| $50,000 to $74,999 | 640 | 15.3% |
| $75,000 to $99,999 | 636 | 15.2% |
| $100,000 to $149,999 | 310 | 7.4% |
| $150,000 to $199,999 | 109 | 2.6% |
| $200,000+ | 25 | 0.6% |
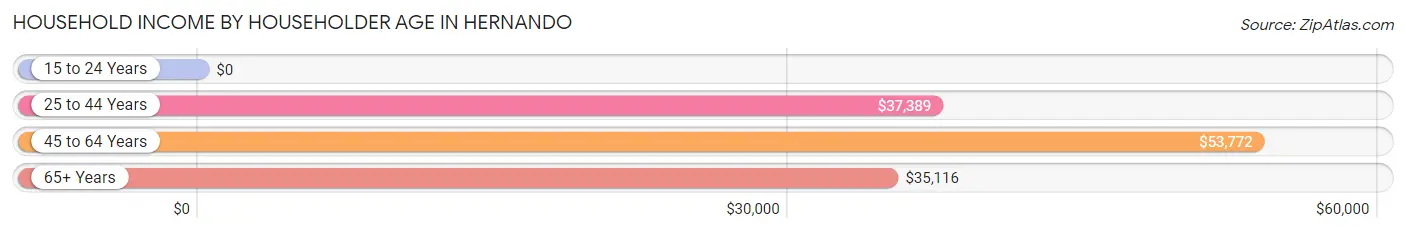
Household Income by Householder Age in Hernando
The median household income in Hernando is $41,019, with the highest median household income of $53,772 found in the 45 to 64 years age bracket for the primary householder. A total of 1,326 households (31.7%) fall into this category.
| Income Bracket | # Households | Median Income |
| 15 to 24 Years | 0 (0.0%) | $0 |
| 25 to 44 Years | 501 (12.0%) | $37,389 |
| 45 to 64 Years | 1,326 (31.7%) | $53,772 |
| 65+ Years | 2,356 (56.3%) | $35,116 |
| Total | 4,183 (100.0%) | $41,019 |
Poverty in Hernando
Income Below Poverty by Sex and Age in Hernando
With 27.6% poverty level for males and 15.5% for females among the residents of Hernando, under 5 year old males and 15 year old females are the most vulnerable to poverty, with 45 males (76.3%) and 12 females (40.0%) in their respective age groups living below the poverty level.
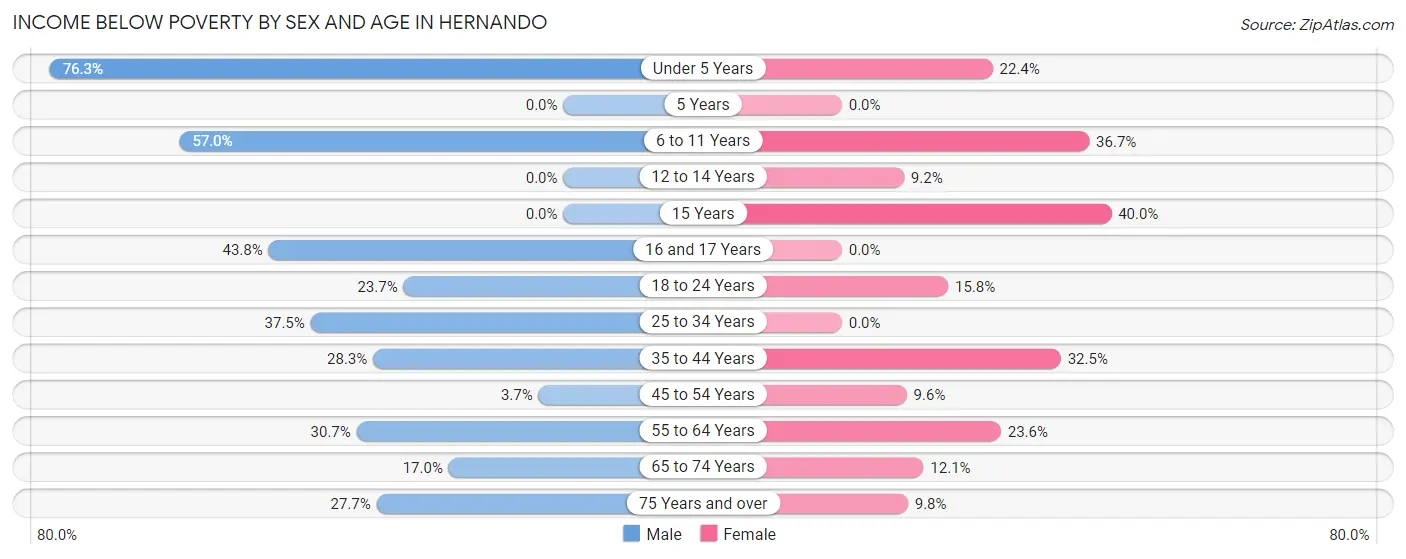
| Age Bracket | Male | Female |
| Under 5 Years | 45 (76.3%) | 15 (22.4%) |
| 5 Years | 0 (0.0%) | 0 (0.0%) |
| 6 to 11 Years | 207 (57.0%) | 72 (36.7%) |
| 12 to 14 Years | 0 (0.0%) | 13 (9.2%) |
| 15 Years | 0 (0.0%) | 12 (40.0%) |
| 16 and 17 Years | 88 (43.8%) | 0 (0.0%) |
| 18 to 24 Years | 33 (23.7%) | 15 (15.8%) |
| 25 to 34 Years | 164 (37.5%) | 0 (0.0%) |
| 35 to 44 Years | 100 (28.2%) | 105 (32.5%) |
| 45 to 54 Years | 17 (3.7%) | 31 (9.6%) |
| 55 to 64 Years | 257 (30.7%) | 179 (23.6%) |
| 65 to 74 Years | 137 (17.0%) | 103 (12.1%) |
| 75 Years and over | 281 (27.7%) | 90 (9.8%) |
| Total | 1,329 (27.6%) | 635 (15.5%) |
Income Above Poverty by Sex and Age in Hernando
According to the poverty statistics in Hernando, males aged 5 years and females aged 5 years are the age groups that are most secure financially, with 100.0% of males and 100.0% of females in these age groups living above the poverty line.
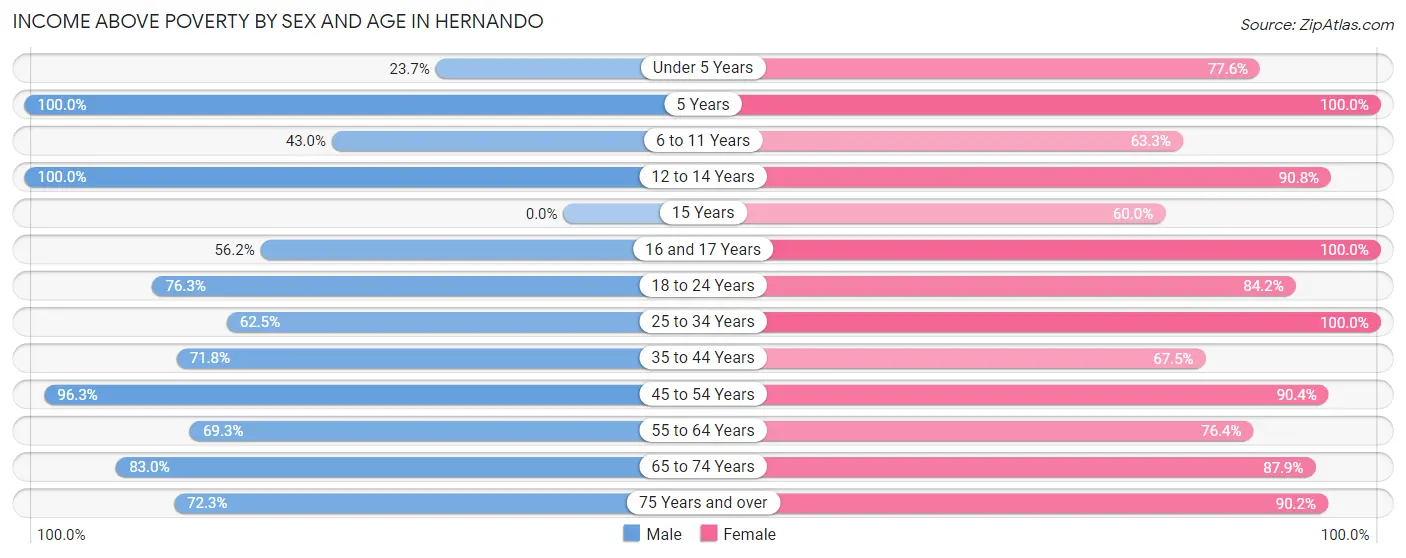
| Age Bracket | Male | Female |
| Under 5 Years | 14 (23.7%) | 52 (77.6%) |
| 5 Years | 19 (100.0%) | 23 (100.0%) |
| 6 to 11 Years | 156 (43.0%) | 124 (63.3%) |
| 12 to 14 Years | 128 (100.0%) | 128 (90.8%) |
| 15 Years | 0 (0.0%) | 18 (60.0%) |
| 16 and 17 Years | 113 (56.2%) | 60 (100.0%) |
| 18 to 24 Years | 106 (76.3%) | 80 (84.2%) |
| 25 to 34 Years | 273 (62.5%) | 311 (100.0%) |
| 35 to 44 Years | 254 (71.8%) | 218 (67.5%) |
| 45 to 54 Years | 445 (96.3%) | 291 (90.4%) |
| 55 to 64 Years | 580 (69.3%) | 579 (76.4%) |
| 65 to 74 Years | 668 (83.0%) | 747 (87.9%) |
| 75 Years and over | 732 (72.3%) | 828 (90.2%) |
| Total | 3,488 (72.4%) | 3,459 (84.5%) |
Income Below Poverty Among Married-Couple Families in Hernando
The poverty statistics for married-couple families in Hernando show that 11.2% or 197 of the total 1,752 families live below the poverty line. Families with 3 or 4 children have the highest poverty rate of 42.5%, comprising of 34 families. On the other hand, families with 1 or 2 children have the lowest poverty rate of 0.0%, which includes 0 families.
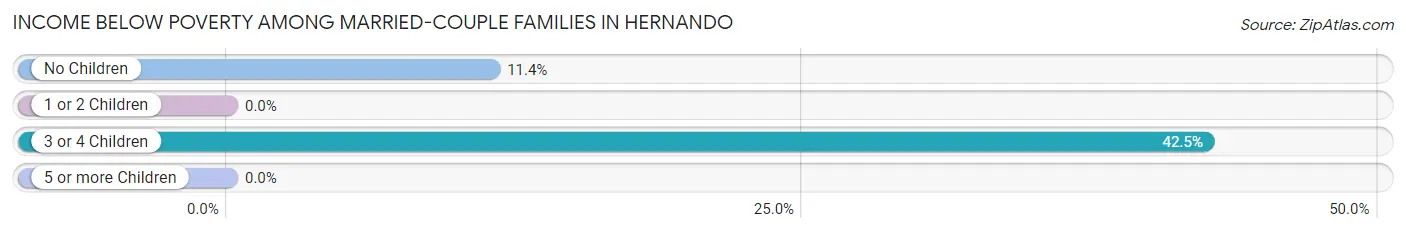
| Children | Above Poverty | Below Poverty |
| No Children | 1,266 (88.6%) | 163 (11.4%) |
| 1 or 2 Children | 243 (100.0%) | 0 (0.0%) |
| 3 or 4 Children | 46 (57.5%) | 34 (42.5%) |
| 5 or more Children | 0 (0.0%) | 0 (0.0%) |
| Total | 1,555 (88.8%) | 197 (11.2%) |
Income Below Poverty Among Single-Parent Households in Hernando
According to the poverty data in Hernando, 51.3% or 234 single-father households and 38.7% or 111 single-mother households are living below the poverty line. Among single-father households, those with 1 or 2 children have the highest poverty rate, with 191 households (73.2%) experiencing poverty. Likewise, among single-mother households, those with no children have the highest poverty rate, with 86 households (43.4%) falling below the poverty line.
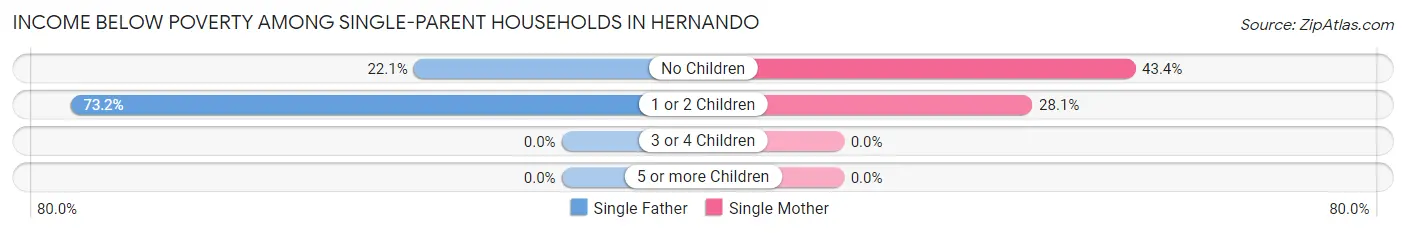
| Children | Single Father | Single Mother |
| No Children | 43 (22.1%) | 86 (43.4%) |
| 1 or 2 Children | 191 (73.2%) | 25 (28.1%) |
| 3 or 4 Children | 0 (0.0%) | 0 (0.0%) |
| 5 or more Children | 0 (0.0%) | 0 (0.0%) |
| Total | 234 (51.3%) | 111 (38.7%) |
Income Below Poverty Among Married-Couple vs Single-Parent Households in Hernando
The poverty data for Hernando shows that 197 of the married-couple family households (11.2%) and 345 of the single-parent households (46.4%) are living below the poverty level. Within the married-couple family households, those with 3 or 4 children have the highest poverty rate, with 34 households (42.5%) falling below the poverty line. Among the single-parent households, those with 1 or 2 children have the highest poverty rate, with 216 household (61.7%) living below poverty.
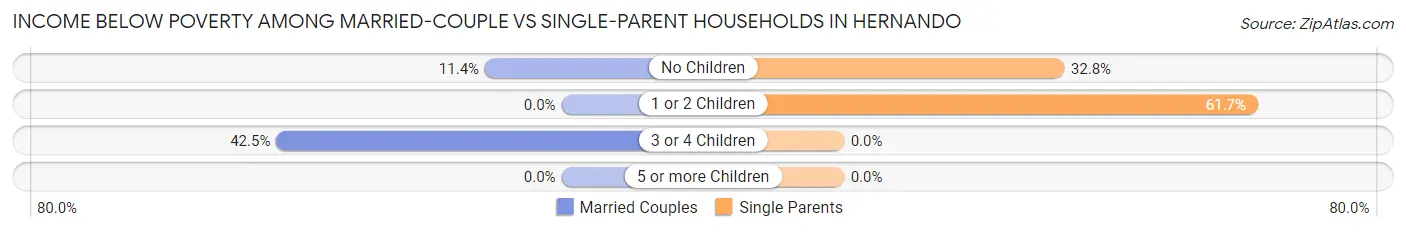
| Children | Married-Couple Families | Single-Parent Households |
| No Children | 163 (11.4%) | 129 (32.8%) |
| 1 or 2 Children | 0 (0.0%) | 216 (61.7%) |
| 3 or 4 Children | 34 (42.5%) | 0 (0.0%) |
| 5 or more Children | 0 (0.0%) | 0 (0.0%) |
| Total | 197 (11.2%) | 345 (46.4%) |
Race in Hernando
The most populous races in Hernando are White / Caucasian (8,054 | 90.4%), Two or more Races (420 | 4.7%), and Black / African American (330 | 3.7%).
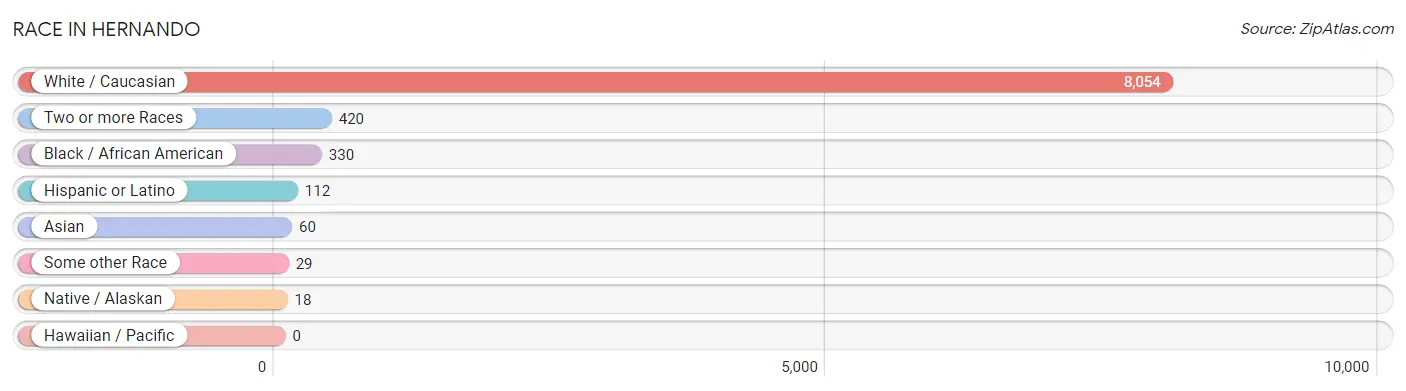
| Race | # Population | % Population |
| Asian | 60 | 0.7% |
| Black / African American | 330 | 3.7% |
| Hawaiian / Pacific | 0 | 0.0% |
| Hispanic or Latino | 112 | 1.3% |
| Native / Alaskan | 18 | 0.2% |
| White / Caucasian | 8,054 | 90.4% |
| Two or more Races | 420 | 4.7% |
| Some other Race | 29 | 0.3% |
| Total | 8,911 | 100.0% |
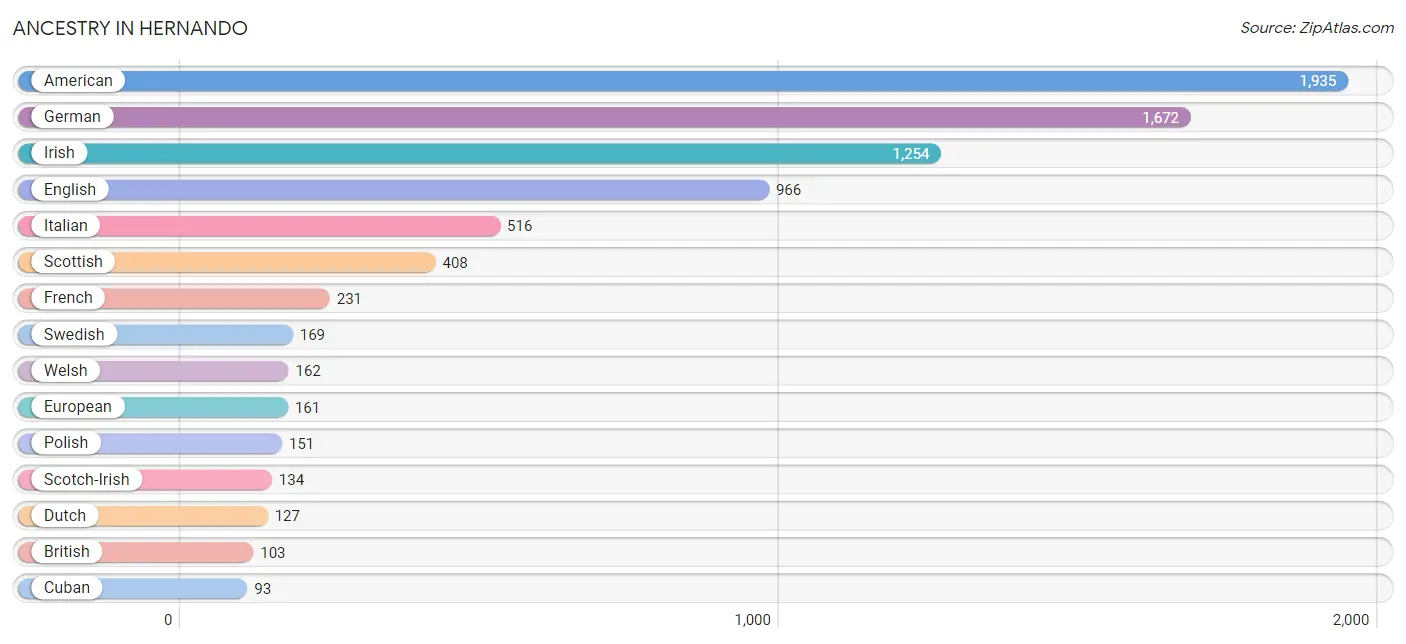
Ancestry in Hernando
The most populous ancestries reported in Hernando are American (1,935 | 21.7%), German (1,672 | 18.8%), Irish (1,254 | 14.1%), English (966 | 10.8%), and Italian (516 | 5.8%), together accounting for 71.2% of all Hernando residents.
| Ancestry | # Population | % Population |
| African | 18 | 0.2% |
| American | 1,935 | 21.7% |
| Austrian | 12 | 0.1% |
| British | 103 | 1.2% |
| Burmese | 22 | 0.3% |
| Canadian | 37 | 0.4% |
| Croatian | 11 | 0.1% |
| Cuban | 93 | 1.0% |
| Czech | 41 | 0.5% |
| Danish | 17 | 0.2% |
| Dutch | 127 | 1.4% |
| English | 966 | 10.8% |
| European | 161 | 1.8% |
| French | 231 | 2.6% |
| French Canadian | 77 | 0.9% |
| German | 1,672 | 18.8% |
| Hungarian | 47 | 0.5% |
| Irish | 1,254 | 14.1% |
| Italian | 516 | 5.8% |
| Lithuanian | 12 | 0.1% |
| Norwegian | 37 | 0.4% |
| Polish | 151 | 1.7% |
| Portuguese | 26 | 0.3% |
| Russian | 26 | 0.3% |
| Scotch-Irish | 134 | 1.5% |
| Scottish | 408 | 4.6% |
| Sioux | 20 | 0.2% |
| Sri Lankan | 38 | 0.4% |
| Subsaharan African | 31 | 0.4% |
| Swedish | 169 | 1.9% |
| Tlingit-Haida | 18 | 0.2% |
| Turkish | 12 | 0.1% |
| Ukrainian | 21 | 0.2% |
| Welsh | 162 | 1.8% | View All 34 Rows |
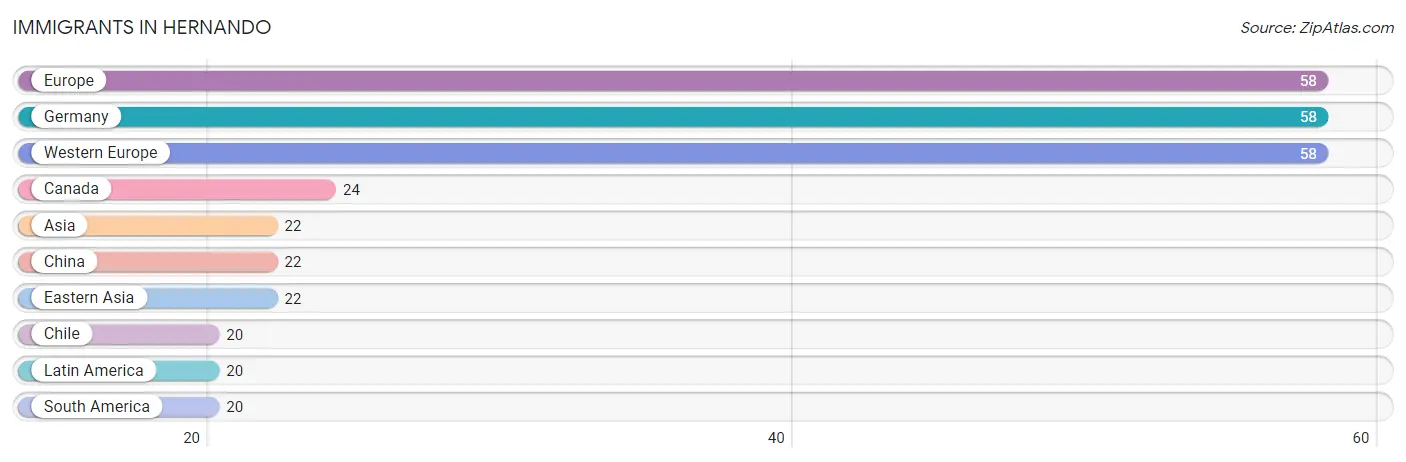
Immigrants in Hernando
The most numerous immigrant groups reported in Hernando came from Europe (58 | 0.6%), Germany (58 | 0.6%), Western Europe (58 | 0.6%), Canada (24 | 0.3%), and Asia (22 | 0.3%), together accounting for 2.5% of all Hernando residents.
| Immigration Origin | # Population | % Population |
| Asia | 22 | 0.3% |
| Canada | 24 | 0.3% |
| Chile | 20 | 0.2% |
| China | 22 | 0.3% |
| Eastern Asia | 22 | 0.3% |
| Europe | 58 | 0.6% |
| Germany | 58 | 0.6% |
| Latin America | 20 | 0.2% |
| South America | 20 | 0.2% |
| Western Europe | 58 | 0.6% | View All 10 Rows |
Sex and Age in Hernando
Sex and Age in Hernando
The most populous age groups in Hernando are 75 to 79 Years (496 | 10.3%) for men and 65 to 69 Years (461 | 11.3%) for women.
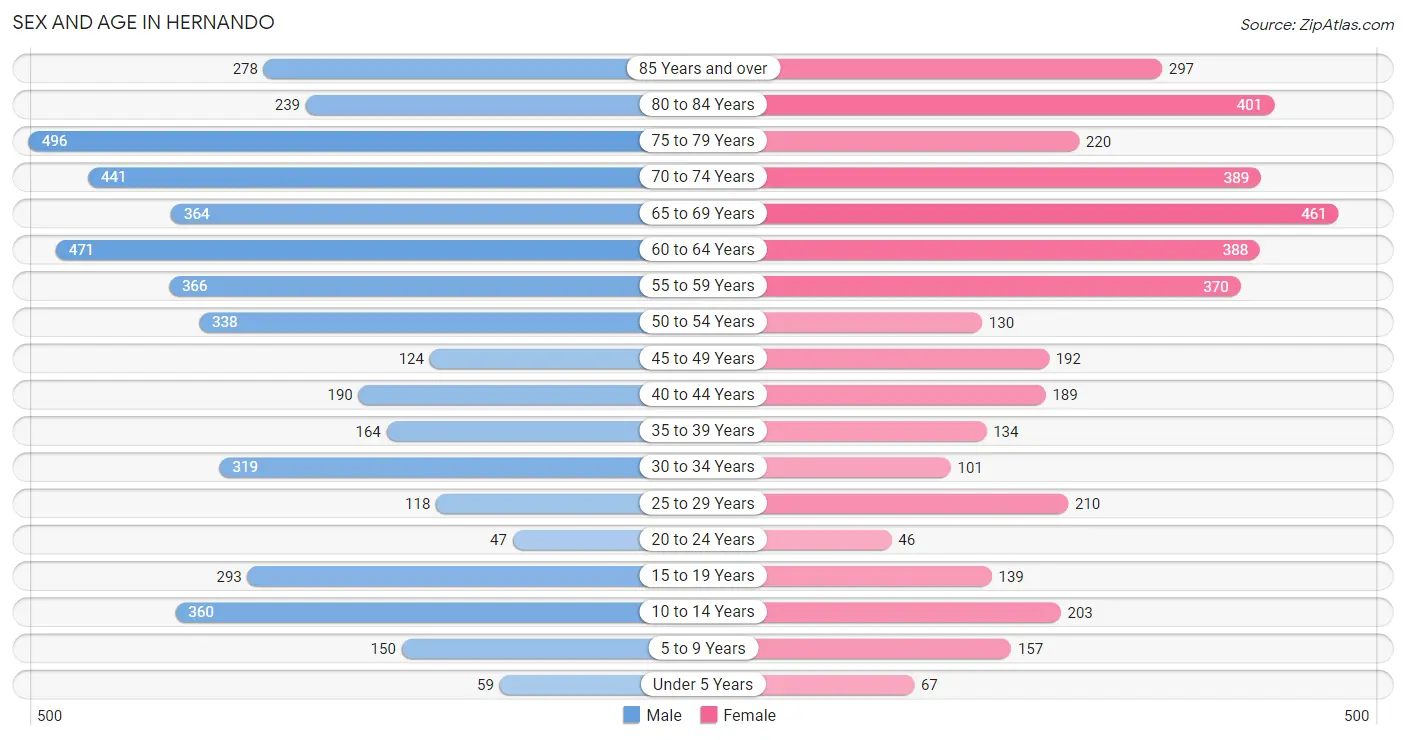
| Age Bracket | Male | Female |
| Under 5 Years | 59 (1.2%) | 67 (1.6%) |
| 5 to 9 Years | 150 (3.1%) | 157 (3.8%) |
| 10 to 14 Years | 360 (7.5%) | 203 (5.0%) |
| 15 to 19 Years | 293 (6.1%) | 139 (3.4%) |
| 20 to 24 Years | 47 (1.0%) | 46 (1.1%) |
| 25 to 29 Years | 118 (2.5%) | 210 (5.1%) |
| 30 to 34 Years | 319 (6.6%) | 101 (2.5%) |
| 35 to 39 Years | 164 (3.4%) | 134 (3.3%) |
| 40 to 44 Years | 190 (3.9%) | 189 (4.6%) |
| 45 to 49 Years | 124 (2.6%) | 192 (4.7%) |
| 50 to 54 Years | 338 (7.0%) | 130 (3.2%) |
| 55 to 59 Years | 366 (7.6%) | 370 (9.0%) |
| 60 to 64 Years | 471 (9.8%) | 388 (9.5%) |
| 65 to 69 Years | 364 (7.6%) | 461 (11.3%) |
| 70 to 74 Years | 441 (9.2%) | 389 (9.5%) |
| 75 to 79 Years | 496 (10.3%) | 220 (5.4%) |
| 80 to 84 Years | 239 (5.0%) | 401 (9.8%) |
| 85 Years and over | 278 (5.8%) | 297 (7.2%) |
| Total | 4,817 (100.0%) | 4,094 (100.0%) |
Families and Households in Hernando
Median Family Size in Hernando
The median family size in Hernando is 2.72 persons per family, with single female/mother families (287 | 11.5%) accounting for the largest median family size of 2.82 persons per family. On the other hand, single male/father families (456 | 18.3%) represent the smallest median family size with 2.64 persons per family.
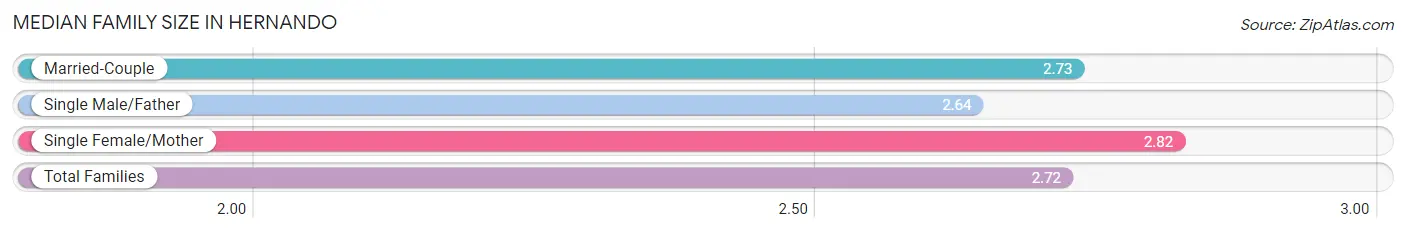
| Family Type | # Families | Family Size |
| Married-Couple | 1,752 (70.2%) | 2.73 |
| Single Male/Father | 456 (18.3%) | 2.64 |
| Single Female/Mother | 287 (11.5%) | 2.82 |
| Total Families | 2,495 (100.0%) | 2.72 |
Median Household Size in Hernando
The median household size in Hernando is 2.13 persons per household, with single male/father households (456 | 10.9%) accounting for the largest median household size of 3.05 persons per household. non-family households (1,688 | 40.4%) represent the smallest median household size with 1.11 persons per household.
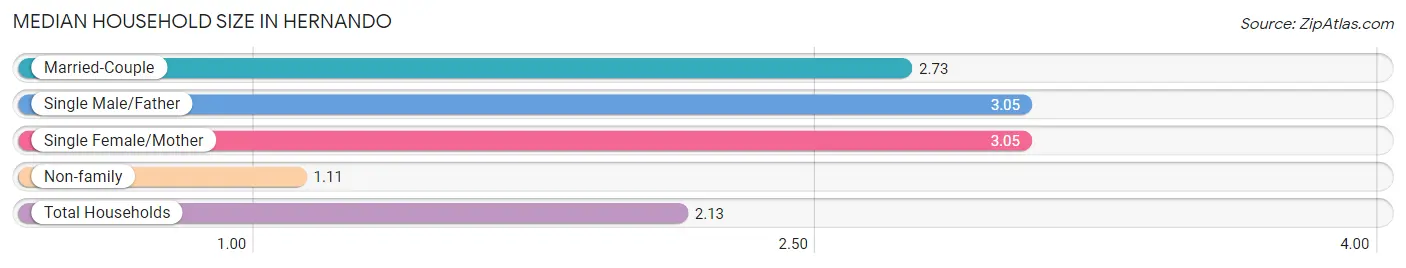
| Household Type | # Households | Household Size |
| Married-Couple | 1,752 (41.9%) | 2.73 |
| Single Male/Father | 456 (10.9%) | 3.05 |
| Single Female/Mother | 287 (6.9%) | 3.05 |
| Non-family | 1,688 (40.4%) | 1.11 |
| Total Households | 4,183 (100.0%) | 2.13 |
Household Size by Marriage Status in Hernando
Out of a total of 4,183 households in Hernando, 2,495 (59.7%) are family households, while 1,688 (40.4%) are nonfamily households. The most numerous type of family households are 2-person households, comprising 1,591, and the most common type of nonfamily households are 1-person households, comprising 1,537.
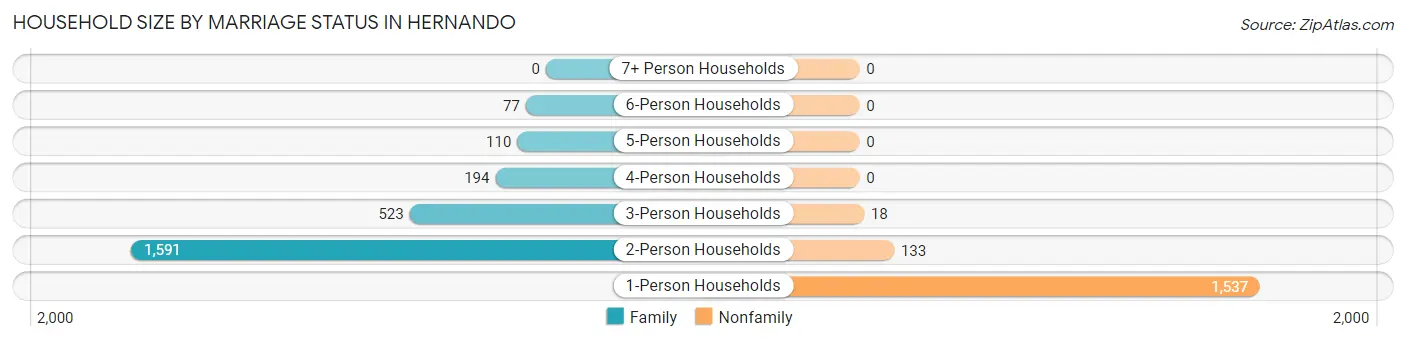
| Household Size | Family Households | Nonfamily Households |
| 1-Person Households | - | 1,537 (36.7%) |
| 2-Person Households | 1,591 (38.0%) | 133 (3.2%) |
| 3-Person Households | 523 (12.5%) | 18 (0.4%) |
| 4-Person Households | 194 (4.6%) | 0 (0.0%) |
| 5-Person Households | 110 (2.6%) | 0 (0.0%) |
| 6-Person Households | 77 (1.8%) | 0 (0.0%) |
| 7+ Person Households | 0 (0.0%) | 0 (0.0%) |
| Total | 2,495 (59.7%) | 1,688 (40.4%) |
Female Fertility in Hernando
Fertility by Age in Hernando
Average fertility rate in Hernando is 58.0 births per 1,000 women. Women in the age bracket of 35 to 50 years have the highest fertility rate with 82.0 births per 1,000 women. Women in the age bracket of 35 to 50 years acount for 73.8% of all women with births.
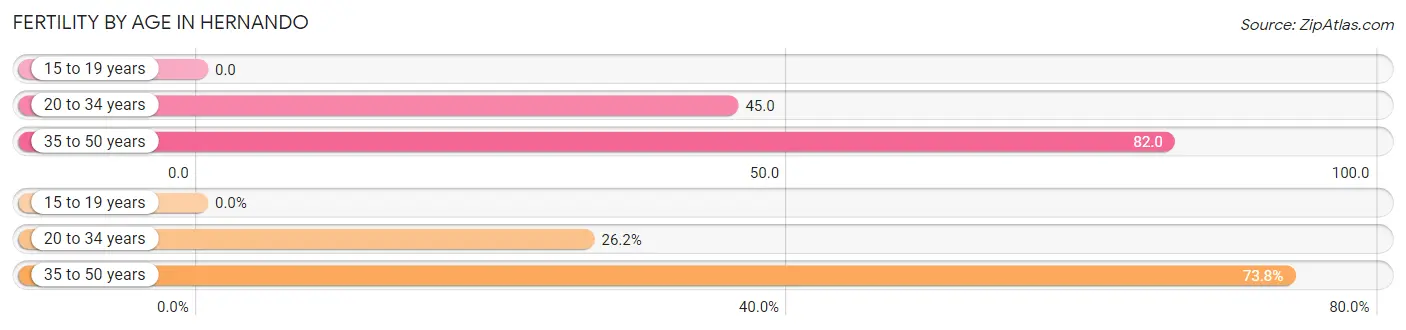
| Age Bracket | Women with Births | Births / 1,000 Women |
| 15 to 19 years | 0 (0.0%) | 0.0 |
| 20 to 34 years | 16 (26.2%) | 45.0 |
| 35 to 50 years | 45 (73.8%) | 82.0 |
| Total | 61 (100.0%) | 58.0 |
Fertility by Age by Marriage Status in Hernando
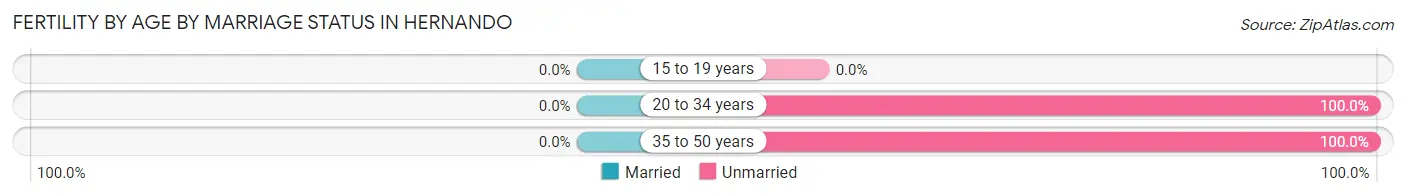
| Age Bracket | Married | Unmarried |
| 15 to 19 years | 0 (0.0%) | 0 (0.0%) |
| 20 to 34 years | 0 (0.0%) | 16 (100.0%) |
| 35 to 50 years | 0 (0.0%) | 45 (100.0%) |
| Total | 0 (0.0%) | 61 (100.0%) |
Fertility by Education in Hernando
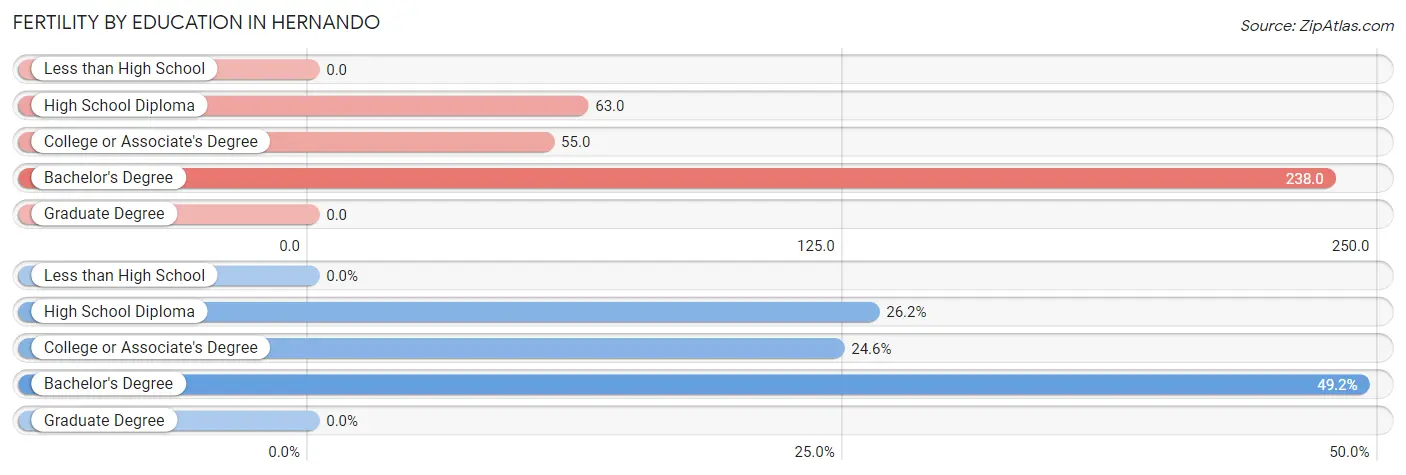
| Educational Attainment | Women with Births | Births / 1,000 Women |
| Less than High School | 0 (0.0%) | 0.0 |
| High School Diploma | 16 (26.2%) | 63.0 |
| College or Associate's Degree | 15 (24.6%) | 55.0 |
| Bachelor's Degree | 30 (49.2%) | 238.0 |
| Graduate Degree | 0 (0.0%) | 0.0 |
| Total | 61 (100.0%) | 58.0 |
Fertility by Education by Marriage Status in Hernando
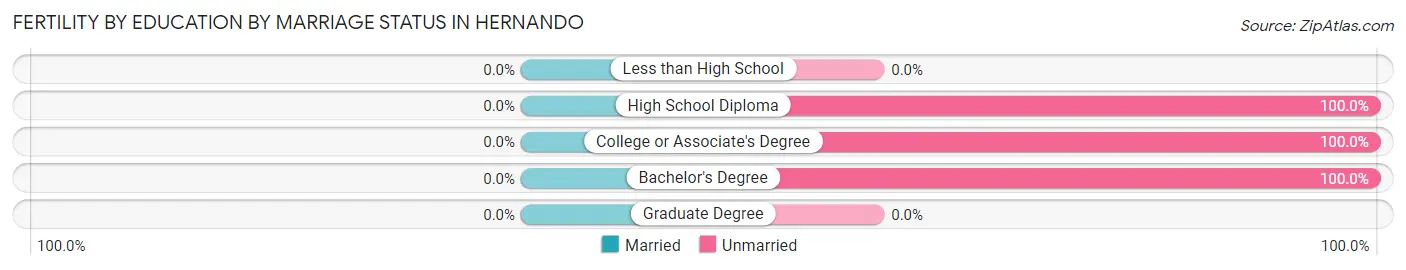
| Educational Attainment | Married | Unmarried |
| Less than High School | 0 (0.0%) | 0 (0.0%) |
| High School Diploma | 0 (0.0%) | 16 (100.0%) |
| College or Associate's Degree | 0 (0.0%) | 15 (100.0%) |
| Bachelor's Degree | 0 (0.0%) | 30 (100.0%) |
| Graduate Degree | 0 (0.0%) | 0 (0.0%) |
| Total | 0 (0.0%) | 61 (100.0%) |
Employment Characteristics in Hernando
Employment by Class of Employer in Hernando
Among the 2,448 employed individuals in Hernando, private company employees (1,715 | 70.1%), self-employed (not incorporated) (278 | 11.4%), and local government employees (264 | 10.8%) make up the most common classes of employment.
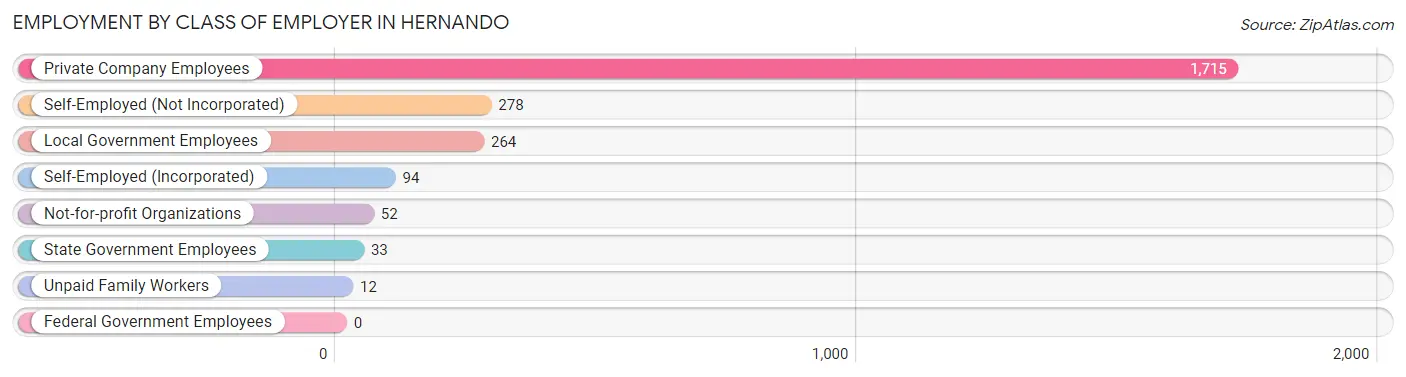
| Employer Class | # Employees | % Employees |
| Private Company Employees | 1,715 | 70.1% |
| Self-Employed (Incorporated) | 94 | 3.8% |
| Self-Employed (Not Incorporated) | 278 | 11.4% |
| Not-for-profit Organizations | 52 | 2.1% |
| Local Government Employees | 264 | 10.8% |
| State Government Employees | 33 | 1.3% |
| Federal Government Employees | 0 | 0.0% |
| Unpaid Family Workers | 12 | 0.5% |
| Total | 2,448 | 100.0% |
Employment Status by Age in Hernando
According to the labor force statistics for Hernando, out of the total population over 16 years of age (7,885), 34.4% or 2,712 individuals are in the labor force, with 9.1% or 247 of them unemployed. The age group with the highest labor force participation rate is 25 to 29 years, with 88.7% or 291 individuals in the labor force. Within the labor force, the 16 to 19 years age range has the highest percentage of unemployed individuals, with 23.1% or 28 of them being unemployed.
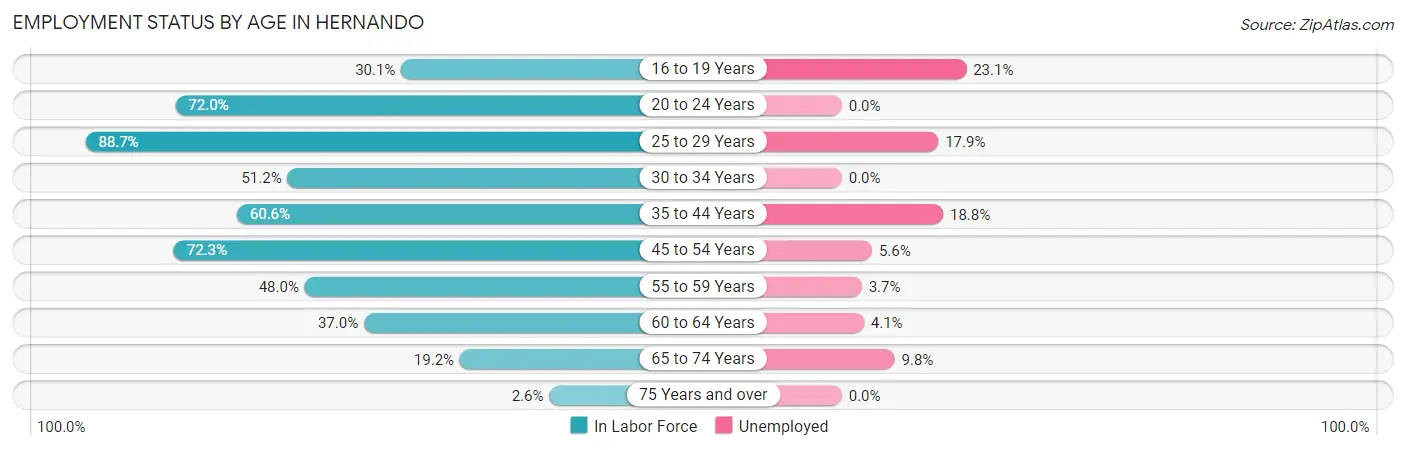
| Age Bracket | In Labor Force | Unemployed |
| 16 to 19 Years | 121 (30.1%) | 28 (23.1%) |
| 20 to 24 Years | 67 (72.0%) | 0 (0.0%) |
| 25 to 29 Years | 291 (88.7%) | 52 (17.9%) |
| 30 to 34 Years | 215 (51.2%) | 0 (0.0%) |
| 35 to 44 Years | 410 (60.6%) | 77 (18.8%) |
| 45 to 54 Years | 567 (72.3%) | 32 (5.6%) |
| 55 to 59 Years | 353 (48.0%) | 13 (3.7%) |
| 60 to 64 Years | 318 (37.0%) | 13 (4.1%) |
| 65 to 74 Years | 318 (19.2%) | 31 (9.8%) |
| 75 Years and over | 50 (2.6%) | 0 (0.0%) |
| Total | 2,712 (34.4%) | 247 (9.1%) |
Employment Status by Educational Attainment in Hernando
According to labor force statistics for Hernando, 56.6% of individuals (2,153) out of the total population between 25 and 64 years of age (3,804) are in the labor force, with 8.7% or 187 of them being unemployed. The group with the highest labor force participation rate are those with the educational attainment of bachelor's degree or higher, with 89.6% or 467 individuals in the labor force. Within the labor force, individuals with high school diploma education have the highest percentage of unemployment, with 13.7% or 117 of them being unemployed.
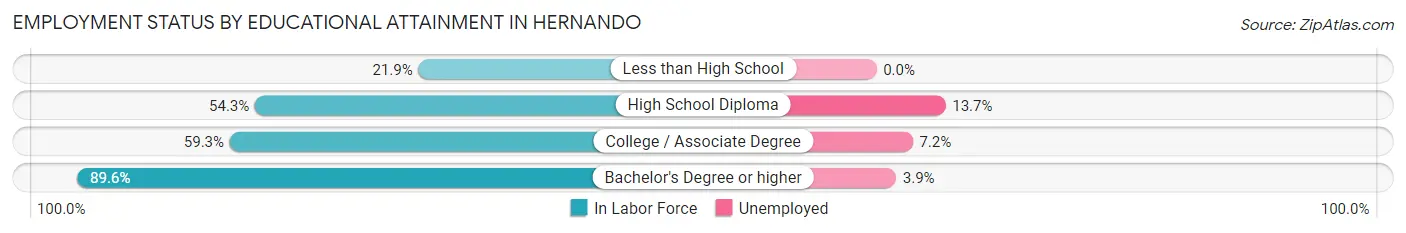
| Educational Attainment | In Labor Force | Unemployed |
| Less than High School | 106 (21.9%) | 0 (0.0%) |
| High School Diploma | 857 (54.3%) | 216 (13.7%) |
| College / Associate Degree | 723 (59.3%) | 88 (7.2%) |
| Bachelor's Degree or higher | 467 (89.6%) | 20 (3.9%) |
| Total | 2,153 (56.6%) | 331 (8.7%) |
Employment Occupations by Sex in Hernando
Management, Business, Science and Arts Occupations
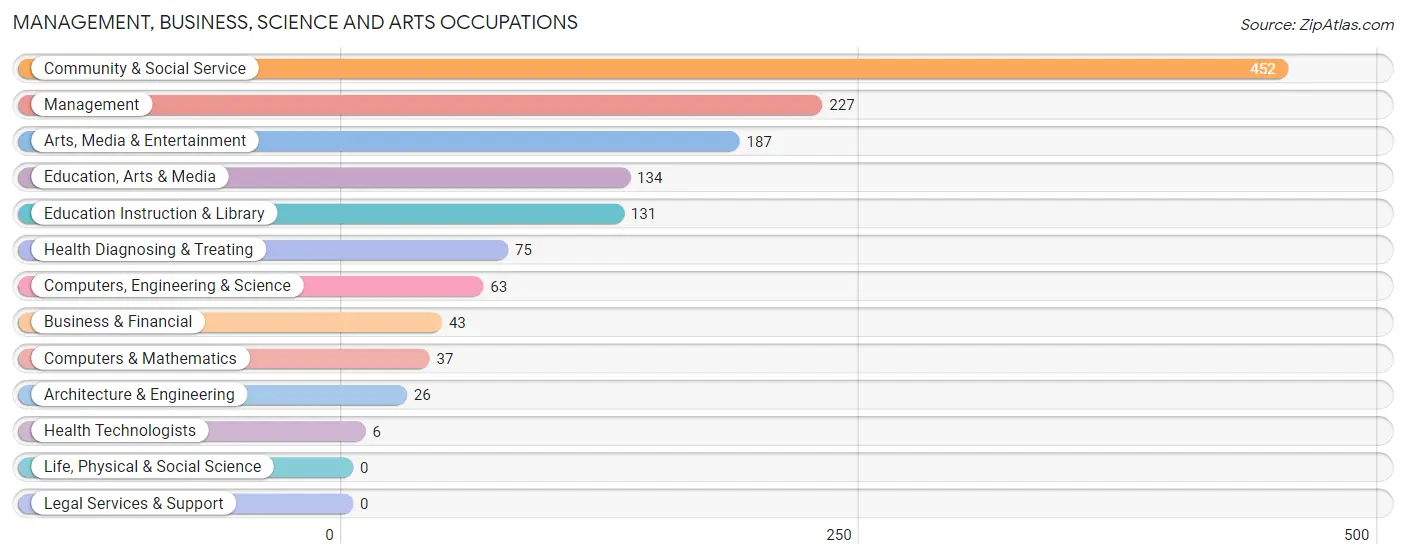
The most common Management, Business, Science and Arts occupations in Hernando are Community & Social Service (452 | 18.3%), Management (227 | 9.2%), Arts, Media & Entertainment (187 | 7.6%), Education, Arts & Media (134 | 5.4%), and Education Instruction & Library (131 | 5.3%).
Management, Business, Science and Arts Occupations by Sex
Within the Management, Business, Science and Arts occupations in Hernando, the most male-oriented occupations are Computers, Engineering & Science (100.0%), Computers & Mathematics (100.0%), and Architecture & Engineering (100.0%), while the most female-oriented occupations are Arts, Media & Entertainment (93.0%), Education Instruction & Library (61.1%), and Community & Social Service (56.2%).
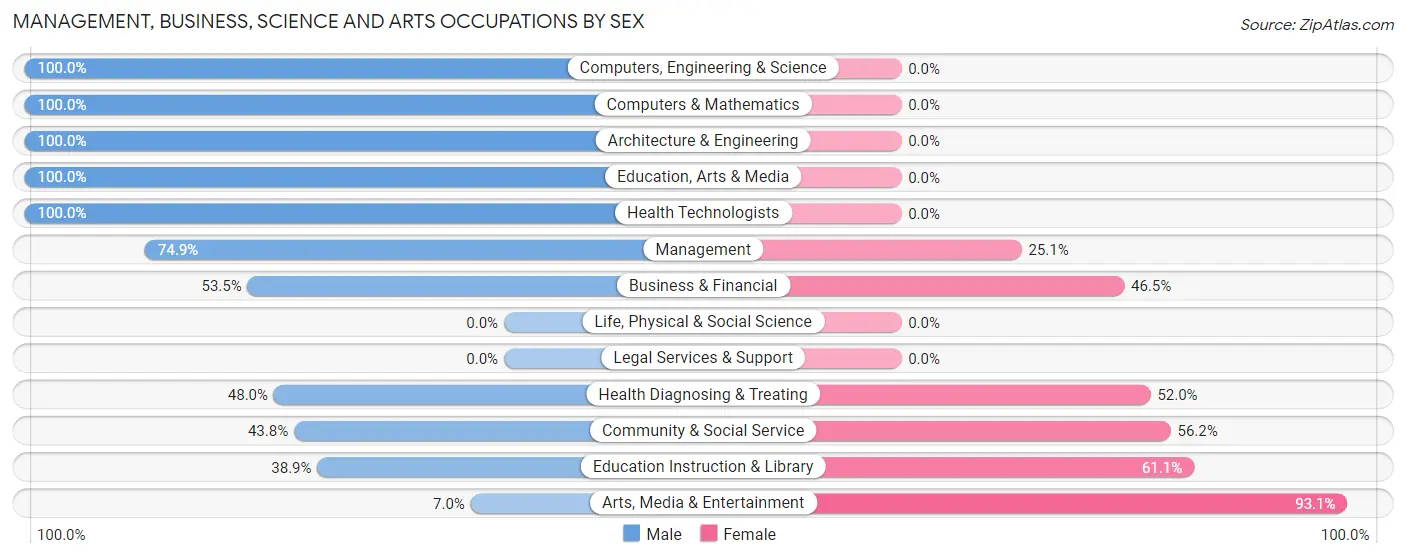
| Occupation | Male | Female |
| Management | 170 (74.9%) | 57 (25.1%) |
| Business & Financial | 23 (53.5%) | 20 (46.5%) |
| Computers, Engineering & Science | 63 (100.0%) | 0 (0.0%) |
| Computers & Mathematics | 37 (100.0%) | 0 (0.0%) |
| Architecture & Engineering | 26 (100.0%) | 0 (0.0%) |
| Life, Physical & Social Science | 0 (0.0%) | 0 (0.0%) |
| Community & Social Service | 198 (43.8%) | 254 (56.2%) |
| Education, Arts & Media | 134 (100.0%) | 0 (0.0%) |
| Legal Services & Support | 0 (0.0%) | 0 (0.0%) |
| Education Instruction & Library | 51 (38.9%) | 80 (61.1%) |
| Arts, Media & Entertainment | 13 (7.0%) | 174 (93.0%) |
| Health Diagnosing & Treating | 36 (48.0%) | 39 (52.0%) |
| Health Technologists | 6 (100.0%) | 0 (0.0%) |
| Total (Category) | 490 (57.0%) | 370 (43.0%) |
| Total (Overall) | 1,389 (56.4%) | 1,074 (43.6%) |
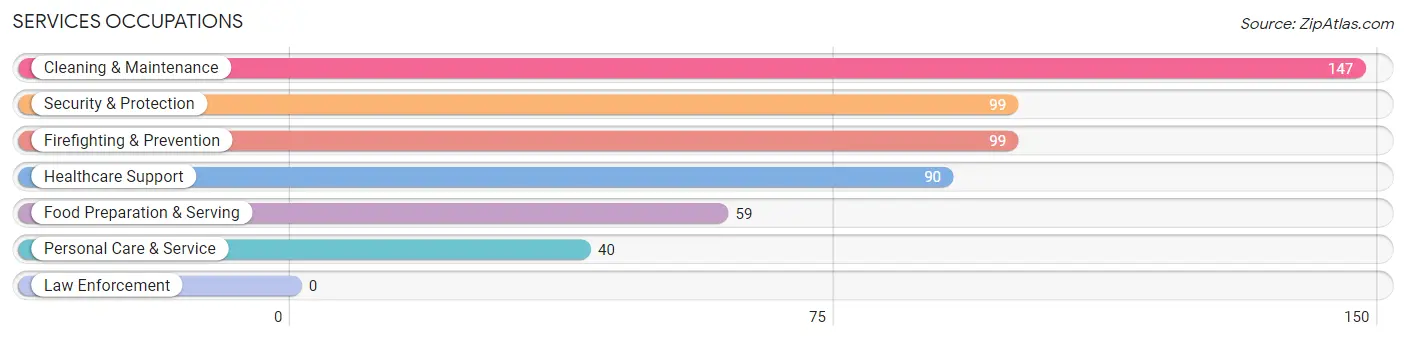
Services Occupations
The most common Services occupations in Hernando are Cleaning & Maintenance (147 | 6.0%), Security & Protection (99 | 4.0%), Firefighting & Prevention (99 | 4.0%), Healthcare Support (90 | 3.6%), and Food Preparation & Serving (59 | 2.4%).
Services Occupations by Sex
Within the Services occupations in Hernando, the most male-oriented occupations are Security & Protection (100.0%), Firefighting & Prevention (100.0%), and Personal Care & Service (72.5%), while the most female-oriented occupations are Food Preparation & Serving (86.4%), Healthcare Support (81.1%), and Cleaning & Maintenance (40.1%).
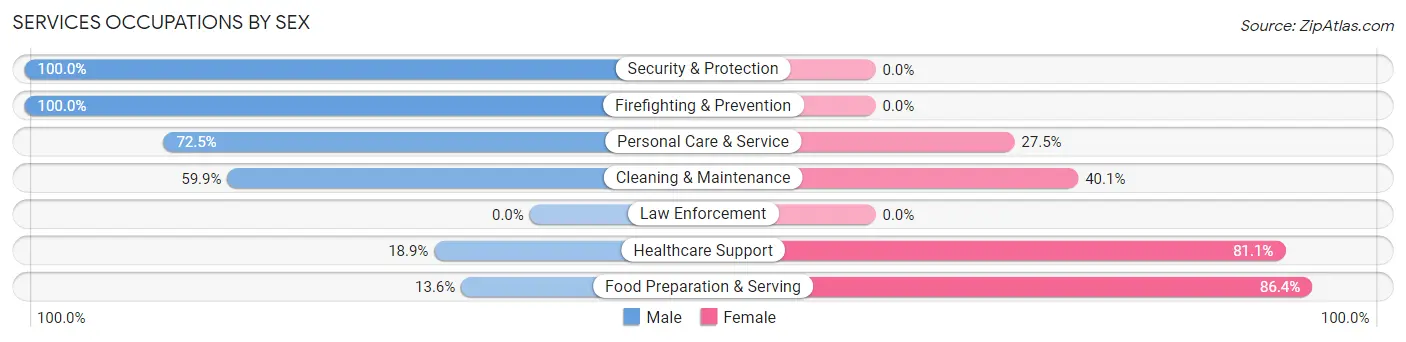
| Occupation | Male | Female |
| Healthcare Support | 17 (18.9%) | 73 (81.1%) |
| Security & Protection | 99 (100.0%) | 0 (0.0%) |
| Firefighting & Prevention | 99 (100.0%) | 0 (0.0%) |
| Law Enforcement | 0 (0.0%) | 0 (0.0%) |
| Food Preparation & Serving | 8 (13.6%) | 51 (86.4%) |
| Cleaning & Maintenance | 88 (59.9%) | 59 (40.1%) |
| Personal Care & Service | 29 (72.5%) | 11 (27.5%) |
| Total (Category) | 241 (55.4%) | 194 (44.6%) |
| Total (Overall) | 1,389 (56.4%) | 1,074 (43.6%) |
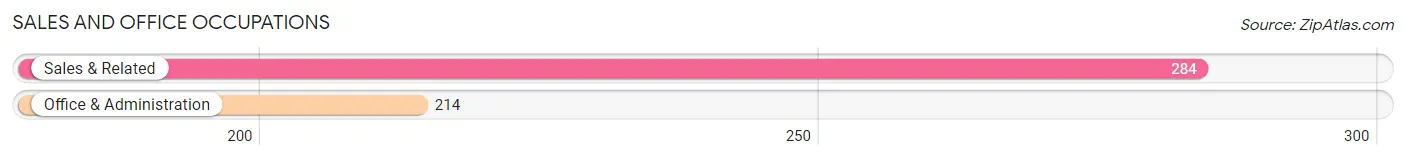
Sales and Office Occupations
The most common Sales and Office occupations in Hernando are Sales & Related (284 | 11.5%), and Office & Administration (214 | 8.7%).
Sales and Office Occupations by Sex

| Occupation | Male | Female |
| Sales & Related | 95 (33.5%) | 189 (66.5%) |
| Office & Administration | 42 (19.6%) | 172 (80.4%) |
| Total (Category) | 137 (27.5%) | 361 (72.5%) |
| Total (Overall) | 1,389 (56.4%) | 1,074 (43.6%) |
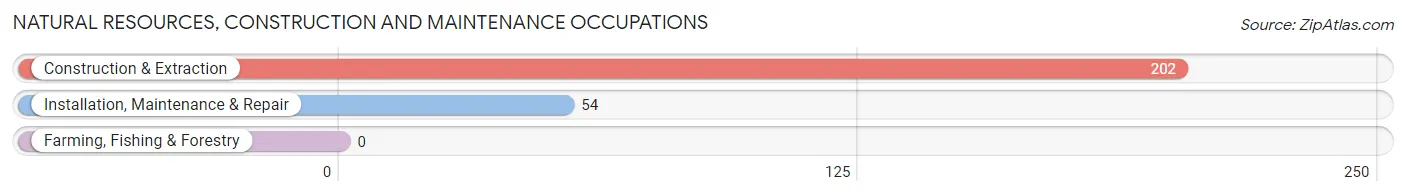
Natural Resources, Construction and Maintenance Occupations
The most common Natural Resources, Construction and Maintenance occupations in Hernando are Construction & Extraction (202 | 8.2%), and Installation, Maintenance & Repair (54 | 2.2%).
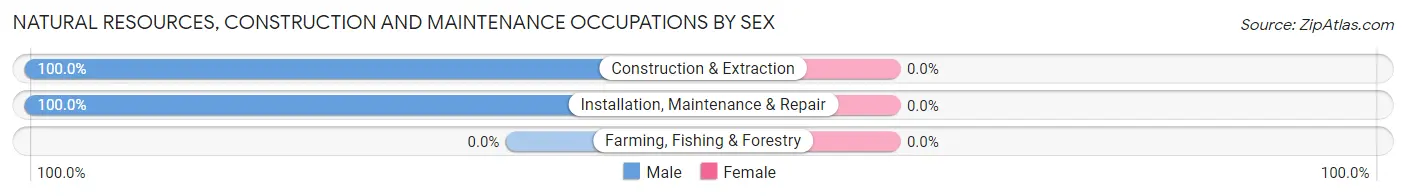
Natural Resources, Construction and Maintenance Occupations by Sex
| Occupation | Male | Female |
| Farming, Fishing & Forestry | 0 (0.0%) | 0 (0.0%) |
| Construction & Extraction | 202 (100.0%) | 0 (0.0%) |
| Installation, Maintenance & Repair | 54 (100.0%) | 0 (0.0%) |
| Total (Category) | 256 (100.0%) | 0 (0.0%) |
| Total (Overall) | 1,389 (56.4%) | 1,074 (43.6%) |
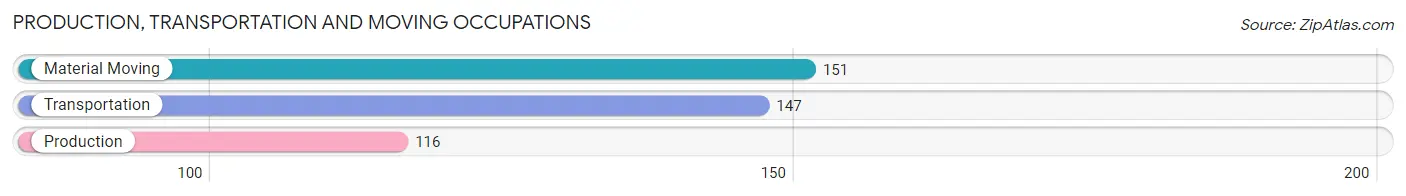
Production, Transportation and Moving Occupations
The most common Production, Transportation and Moving occupations in Hernando are Material Moving (151 | 6.1%), Transportation (147 | 6.0%), and Production (116 | 4.7%).
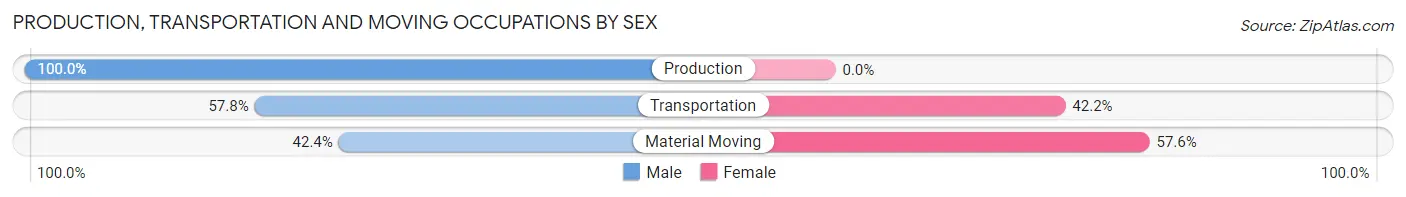
Production, Transportation and Moving Occupations by Sex
| Occupation | Male | Female |
| Production | 116 (100.0%) | 0 (0.0%) |
| Transportation | 85 (57.8%) | 62 (42.2%) |
| Material Moving | 64 (42.4%) | 87 (57.6%) |
| Total (Category) | 265 (64.0%) | 149 (36.0%) |
| Total (Overall) | 1,389 (56.4%) | 1,074 (43.6%) |
Employment Industries by Sex in Hernando
Employment Industries in Hernando
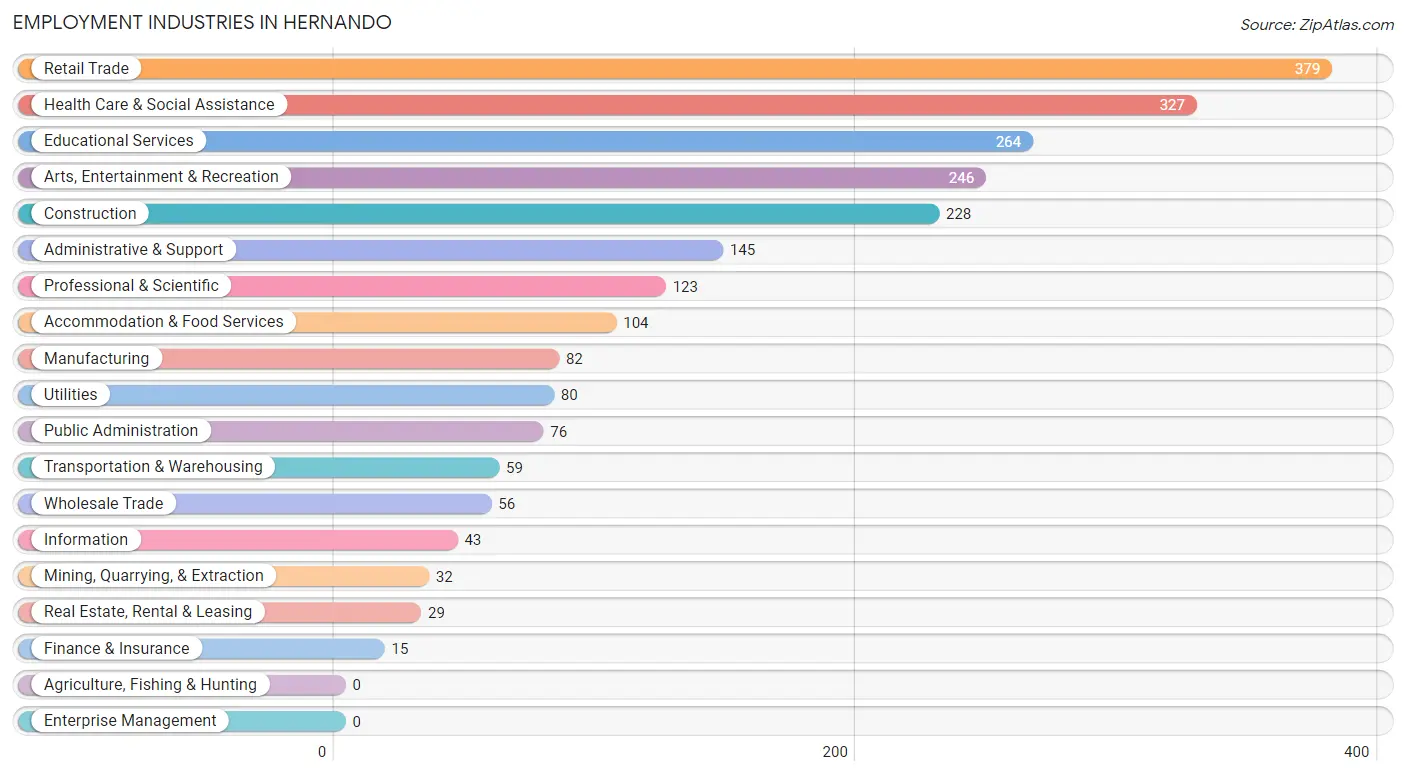
The major employment industries in Hernando include Retail Trade (379 | 15.4%), Health Care & Social Assistance (327 | 13.3%), Educational Services (264 | 10.7%), Arts, Entertainment & Recreation (246 | 10.0%), and Construction (228 | 9.3%).
Employment Industries by Sex in Hernando
The Hernando industries that see more men than women are Mining, Quarrying, & Extraction (100.0%), Transportation & Warehousing (100.0%), and Utilities (85.0%), whereas the industries that tend to have a higher number of women are Finance & Insurance (100.0%), Arts, Entertainment & Recreation (76.4%), and Accommodation & Food Services (72.1%).
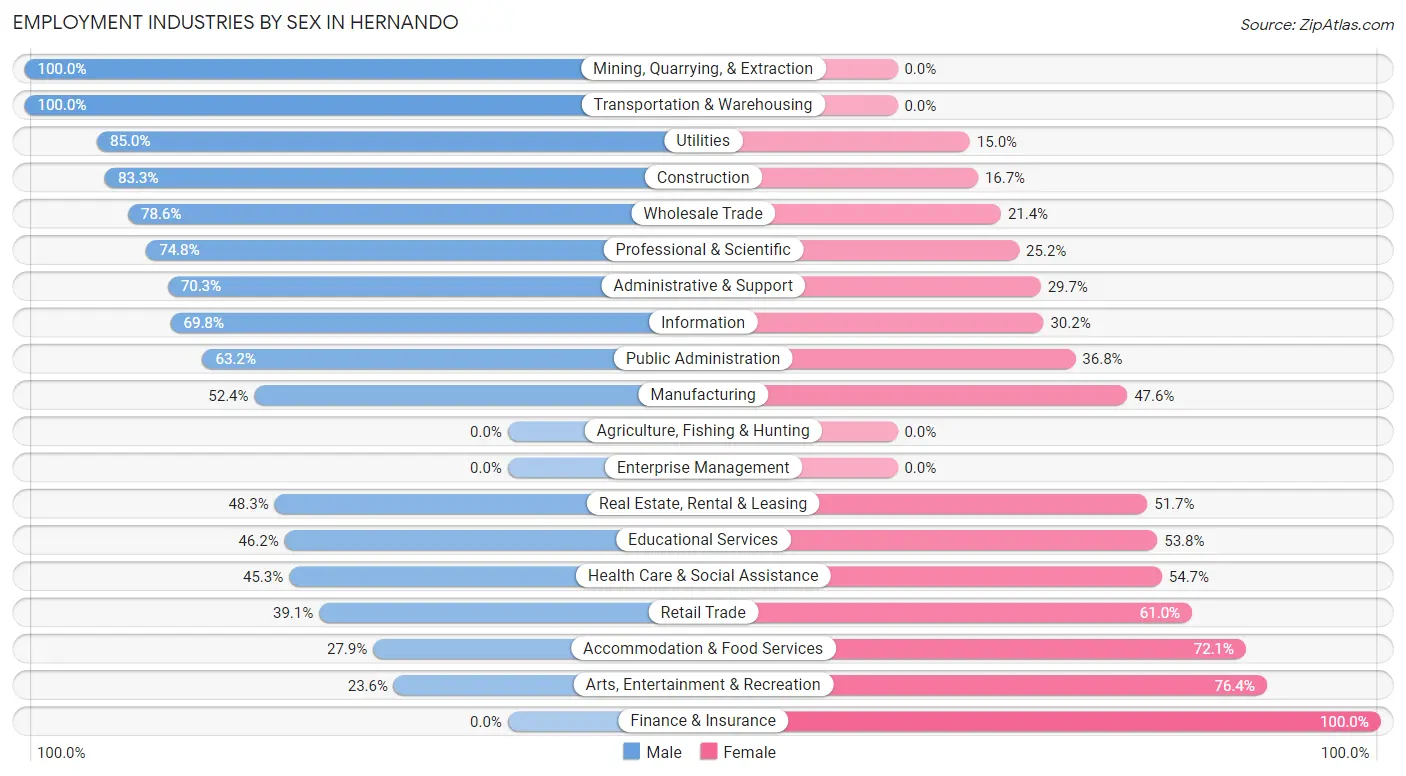
| Industry | Male | Female |
| Agriculture, Fishing & Hunting | 0 (0.0%) | 0 (0.0%) |
| Mining, Quarrying, & Extraction | 32 (100.0%) | 0 (0.0%) |
| Construction | 190 (83.3%) | 38 (16.7%) |
| Manufacturing | 43 (52.4%) | 39 (47.6%) |
| Wholesale Trade | 44 (78.6%) | 12 (21.4%) |
| Retail Trade | 148 (39.1%) | 231 (61.0%) |
| Transportation & Warehousing | 59 (100.0%) | 0 (0.0%) |
| Utilities | 68 (85.0%) | 12 (15.0%) |
| Information | 30 (69.8%) | 13 (30.2%) |
| Finance & Insurance | 0 (0.0%) | 15 (100.0%) |
| Real Estate, Rental & Leasing | 14 (48.3%) | 15 (51.7%) |
| Professional & Scientific | 92 (74.8%) | 31 (25.2%) |
| Enterprise Management | 0 (0.0%) | 0 (0.0%) |
| Administrative & Support | 102 (70.3%) | 43 (29.7%) |
| Educational Services | 122 (46.2%) | 142 (53.8%) |
| Health Care & Social Assistance | 148 (45.3%) | 179 (54.7%) |
| Arts, Entertainment & Recreation | 58 (23.6%) | 188 (76.4%) |
| Accommodation & Food Services | 29 (27.9%) | 75 (72.1%) |
| Public Administration | 48 (63.2%) | 28 (36.8%) |
| Total | 1,389 (56.4%) | 1,074 (43.6%) |
Education in Hernando
School Enrollment in Hernando
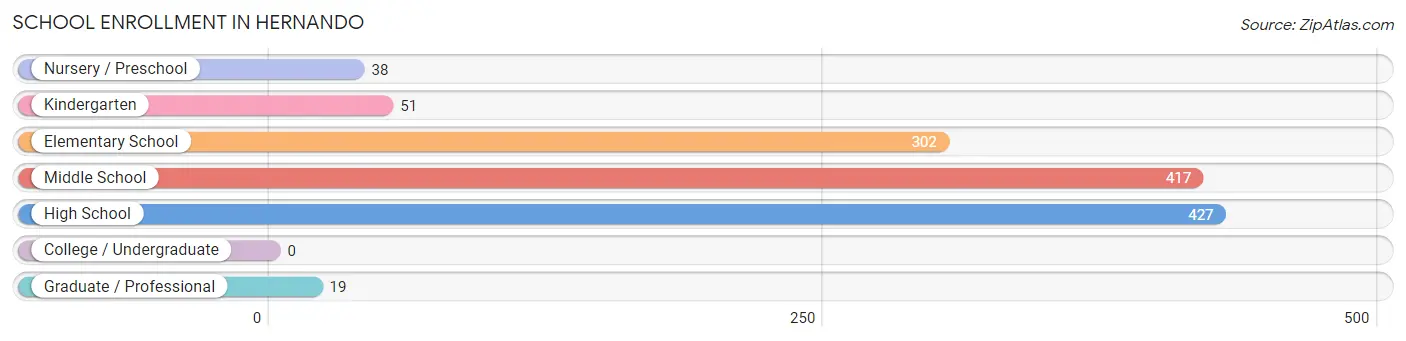
The most common levels of schooling among the 1,254 students in Hernando are high school (427 | 34.1%), middle school (417 | 33.3%), and elementary school (302 | 24.1%).
| School Level | # Students | % Students |
| Nursery / Preschool | 38 | 3.0% |
| Kindergarten | 51 | 4.1% |
| Elementary School | 302 | 24.1% |
| Middle School | 417 | 33.3% |
| High School | 427 | 34.1% |
| College / Undergraduate | 0 | 0.0% |
| Graduate / Professional | 19 | 1.5% |
| Total | 1,254 | 100.0% |
School Enrollment by Age by Funding Source in Hernando
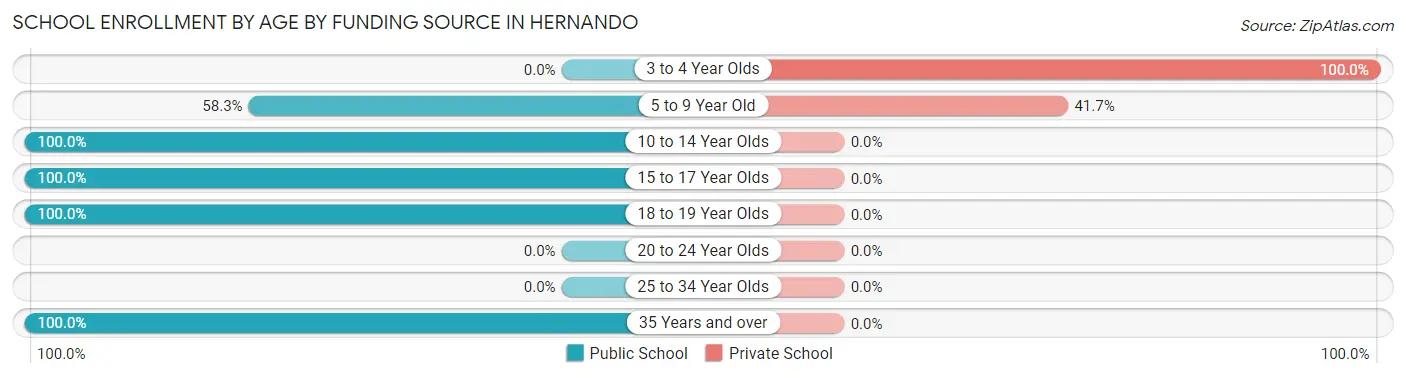
Out of a total of 1,254 students who are enrolled in schools in Hernando, 143 (11.4%) attend a private institution, while the remaining 1,111 (88.6%) are enrolled in public schools. The age group of 3 to 4 year olds has the highest likelihood of being enrolled in private schools, with 15 (100.0% in the age bracket) enrolled. Conversely, the age group of 10 to 14 year olds has the lowest likelihood of being enrolled in a private school, with 563 (100.0% in the age bracket) attending a public institution.
| Age Bracket | Public School | Private School |
| 3 to 4 Year Olds | 0 (0.0%) | 15 (100.0%) |
| 5 to 9 Year Old | 179 (58.3%) | 128 (41.7%) |
| 10 to 14 Year Olds | 563 (100.0%) | 0 (0.0%) |
| 15 to 17 Year Olds | 291 (100.0%) | 0 (0.0%) |
| 18 to 19 Year Olds | 59 (100.0%) | 0 (0.0%) |
| 20 to 24 Year Olds | 0 (0.0%) | 0 (0.0%) |
| 25 to 34 Year Olds | 0 (0.0%) | 0 (0.0%) |
| 35 Years and over | 19 (100.0%) | 0 (0.0%) |
| Total | 1,111 (88.6%) | 143 (11.4%) |
Educational Attainment by Field of Study in Hernando
Education (267 | 24.1%), business (190 | 17.2%), visual & performing arts (174 | 15.7%), bio, nature & agricultural (96 | 8.7%), and social sciences (78 | 7.0%) are the most common fields of study among 1,108 individuals in Hernando who have obtained a bachelor's degree or higher.
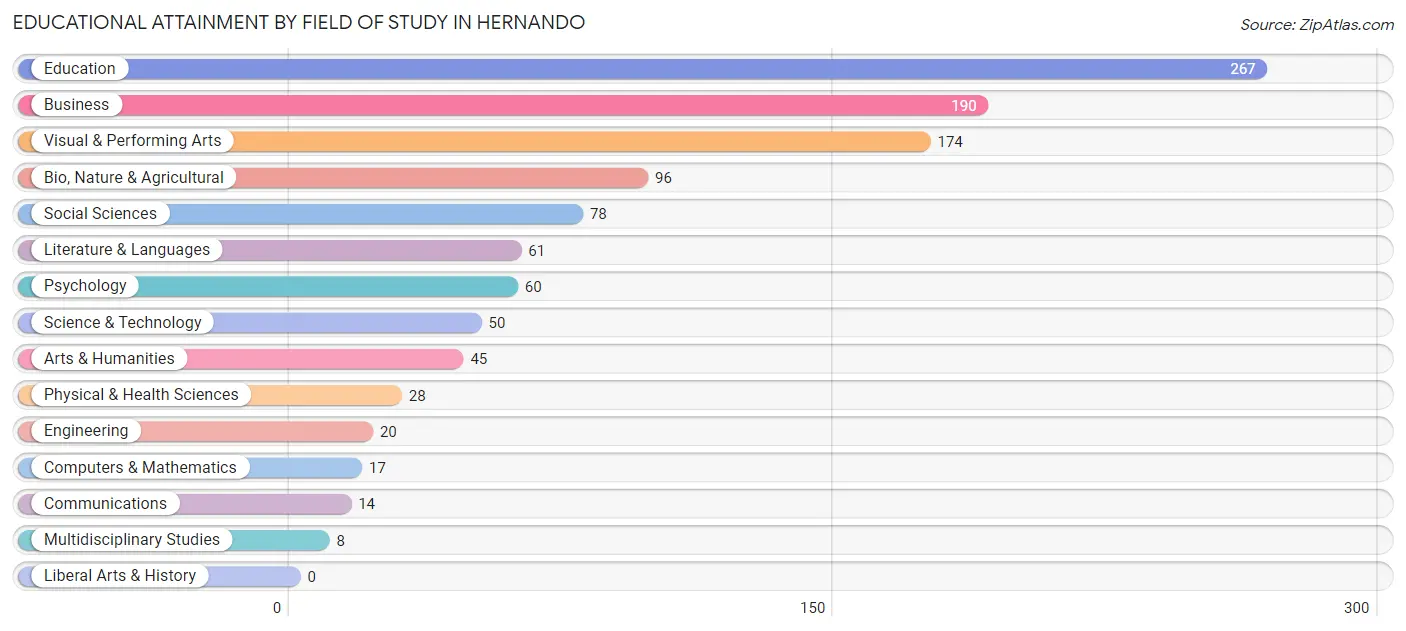
| Field of Study | # Graduates | % Graduates |
| Computers & Mathematics | 17 | 1.5% |
| Bio, Nature & Agricultural | 96 | 8.7% |
| Physical & Health Sciences | 28 | 2.5% |
| Psychology | 60 | 5.4% |
| Social Sciences | 78 | 7.0% |
| Engineering | 20 | 1.8% |
| Multidisciplinary Studies | 8 | 0.7% |
| Science & Technology | 50 | 4.5% |
| Business | 190 | 17.2% |
| Education | 267 | 24.1% |
| Literature & Languages | 61 | 5.5% |
| Liberal Arts & History | 0 | 0.0% |
| Visual & Performing Arts | 174 | 15.7% |
| Communications | 14 | 1.3% |
| Arts & Humanities | 45 | 4.1% |
| Total | 1,108 | 100.0% |
Transportation & Commute in Hernando
Vehicle Availability by Sex in Hernando
The most prevalent vehicle ownership categories in Hernando are males with 2 vehicles (466, accounting for 33.6%) and females with 2 vehicles (347, making up 44.0%).
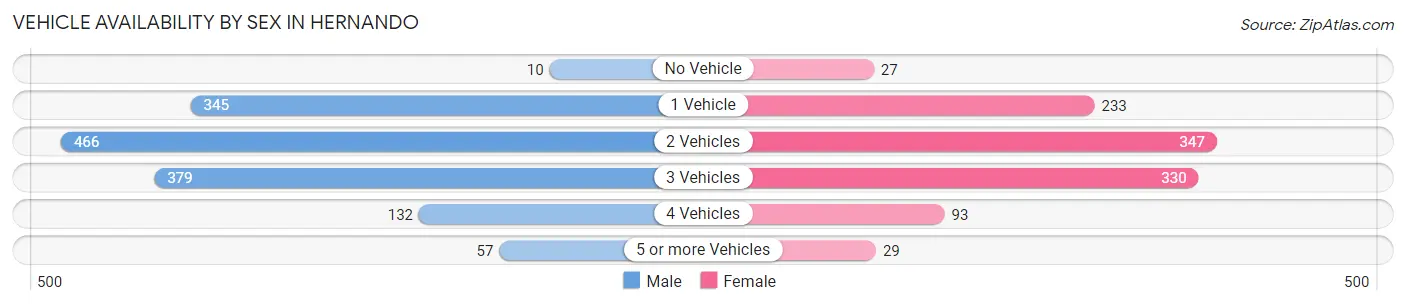
| Vehicles Available | Male | Female |
| No Vehicle | 10 (0.7%) | 27 (2.5%) |
| 1 Vehicle | 345 (24.8%) | 233 (22.0%) |
| 2 Vehicles | 466 (33.6%) | 347 (32.8%) |
| 3 Vehicles | 379 (27.3%) | 330 (31.2%) |
| 4 Vehicles | 132 (9.5%) | 93 (8.8%) |
| 5 or more Vehicles | 57 (4.1%) | 29 (2.7%) |
| Total | 1,389 (100.0%) | 1,059 (100.0%) |
Commute Time in Hernando
The most frequently occuring commute durations in Hernando are 20 to 24 minutes (355 commuters, 16.6%), 60 to 89 minutes (349 commuters, 16.3%), and 15 to 19 minutes (341 commuters, 15.9%).
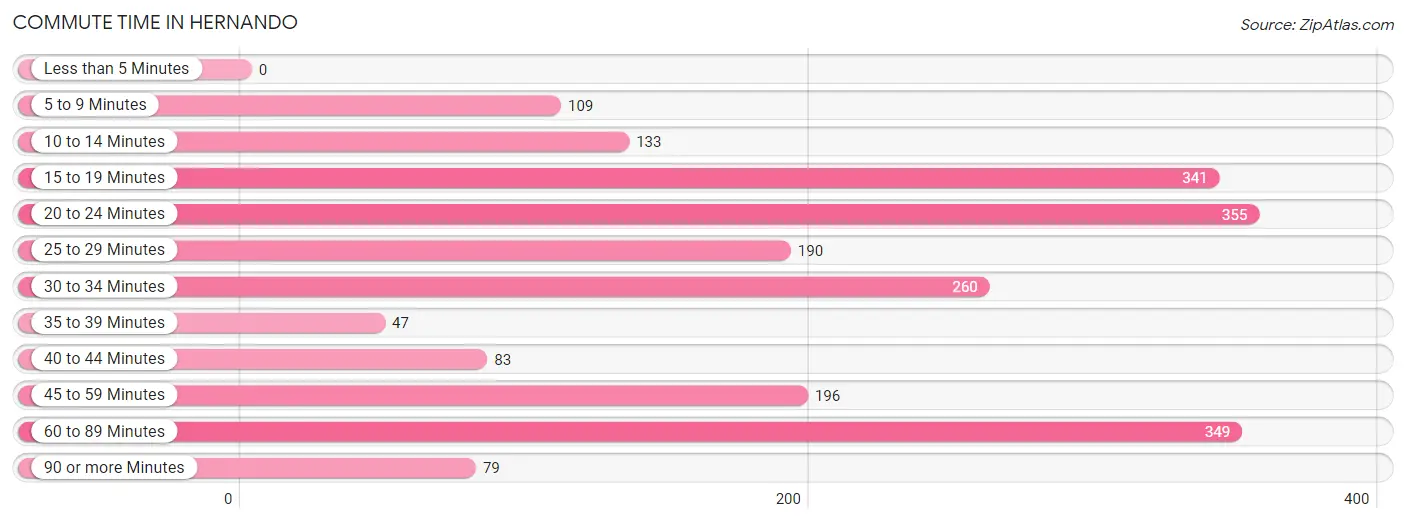
| Commute Time | # Commuters | % Commuters |
| Less than 5 Minutes | 0 | 0.0% |
| 5 to 9 Minutes | 109 | 5.1% |
| 10 to 14 Minutes | 133 | 6.2% |
| 15 to 19 Minutes | 341 | 15.9% |
| 20 to 24 Minutes | 355 | 16.6% |
| 25 to 29 Minutes | 190 | 8.9% |
| 30 to 34 Minutes | 260 | 12.1% |
| 35 to 39 Minutes | 47 | 2.2% |
| 40 to 44 Minutes | 83 | 3.9% |
| 45 to 59 Minutes | 196 | 9.1% |
| 60 to 89 Minutes | 349 | 16.3% |
| 90 or more Minutes | 79 | 3.7% |
Commute Time by Sex in Hernando
The most common commute times in Hernando are 20 to 24 minutes (268 commuters, 21.1%) for males and 60 to 89 minutes (208 commuters, 23.8%) for females.
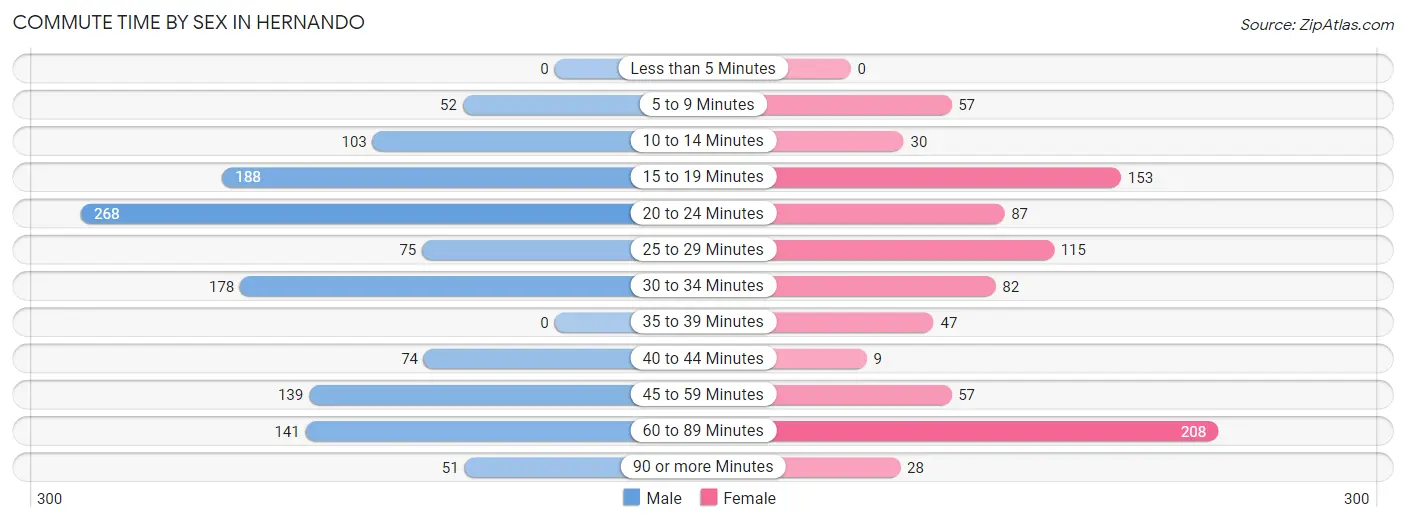
| Commute Time | Male | Female |
| Less than 5 Minutes | 0 (0.0%) | 0 (0.0%) |
| 5 to 9 Minutes | 52 (4.1%) | 57 (6.5%) |
| 10 to 14 Minutes | 103 (8.1%) | 30 (3.4%) |
| 15 to 19 Minutes | 188 (14.8%) | 153 (17.5%) |
| 20 to 24 Minutes | 268 (21.1%) | 87 (10.0%) |
| 25 to 29 Minutes | 75 (5.9%) | 115 (13.2%) |
| 30 to 34 Minutes | 178 (14.0%) | 82 (9.4%) |
| 35 to 39 Minutes | 0 (0.0%) | 47 (5.4%) |
| 40 to 44 Minutes | 74 (5.8%) | 9 (1.0%) |
| 45 to 59 Minutes | 139 (11.0%) | 57 (6.5%) |
| 60 to 89 Minutes | 141 (11.1%) | 208 (23.8%) |
| 90 or more Minutes | 51 (4.0%) | 28 (3.2%) |
Time of Departure to Work by Sex in Hernando
The most frequent times of departure to work in Hernando are 7:00 AM to 7:29 AM (254, 20.0%) for males and 7:00 AM to 7:29 AM (190, 21.8%) for females.
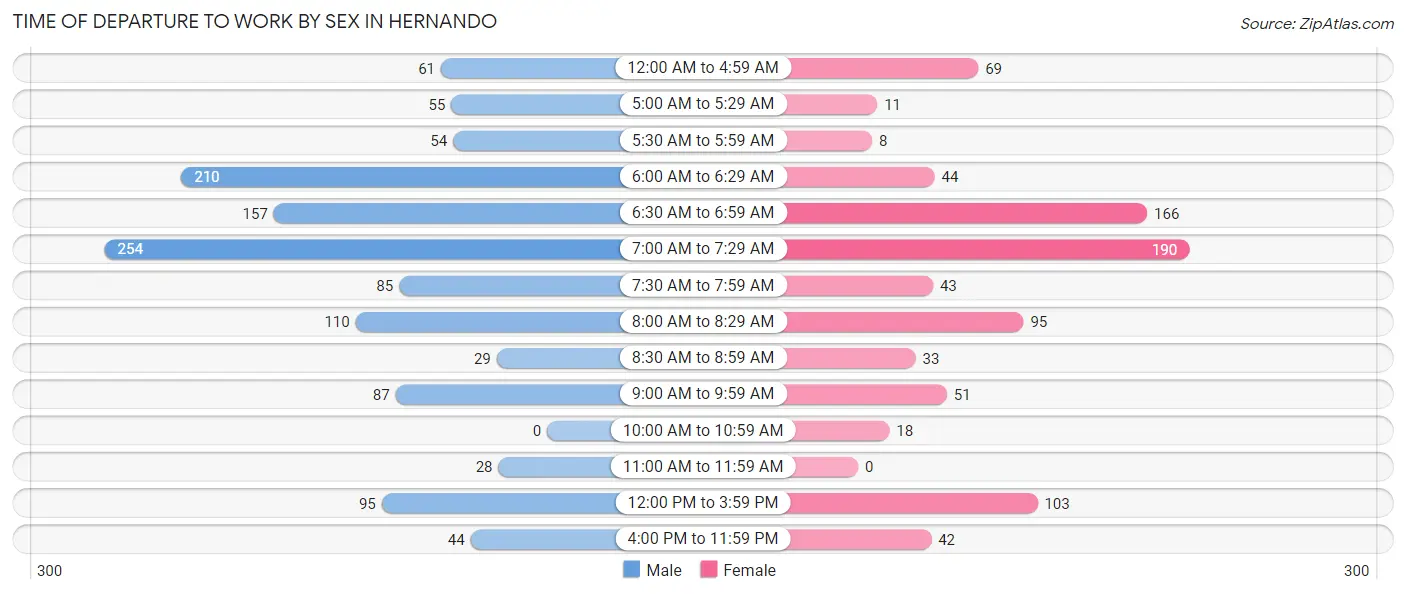
| Time of Departure | Male | Female |
| 12:00 AM to 4:59 AM | 61 (4.8%) | 69 (7.9%) |
| 5:00 AM to 5:29 AM | 55 (4.3%) | 11 (1.3%) |
| 5:30 AM to 5:59 AM | 54 (4.3%) | 8 (0.9%) |
| 6:00 AM to 6:29 AM | 210 (16.6%) | 44 (5.0%) |
| 6:30 AM to 6:59 AM | 157 (12.4%) | 166 (19.0%) |
| 7:00 AM to 7:29 AM | 254 (20.0%) | 190 (21.8%) |
| 7:30 AM to 7:59 AM | 85 (6.7%) | 43 (4.9%) |
| 8:00 AM to 8:29 AM | 110 (8.7%) | 95 (10.9%) |
| 8:30 AM to 8:59 AM | 29 (2.3%) | 33 (3.8%) |
| 9:00 AM to 9:59 AM | 87 (6.9%) | 51 (5.8%) |
| 10:00 AM to 10:59 AM | 0 (0.0%) | 18 (2.1%) |
| 11:00 AM to 11:59 AM | 28 (2.2%) | 0 (0.0%) |
| 12:00 PM to 3:59 PM | 95 (7.5%) | 103 (11.8%) |
| 4:00 PM to 11:59 PM | 44 (3.5%) | 42 (4.8%) |
| Total | 1,269 (100.0%) | 873 (100.0%) |
Housing Occupancy in Hernando
Occupancy by Ownership in Hernando
Of the total 4,183 dwellings in Hernando, owner-occupied units account for 3,570 (85.4%), while renter-occupied units make up 613 (14.6%).
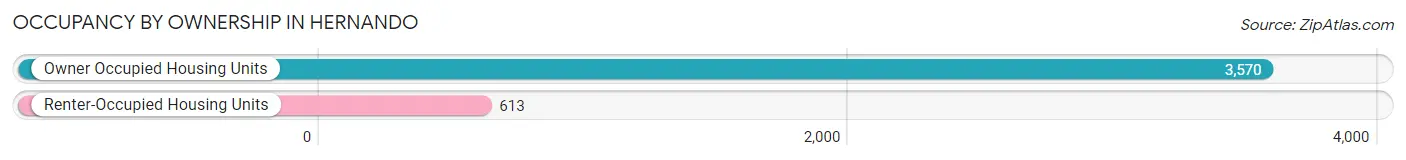
| Occupancy | # Housing Units | % Housing Units |
| Owner Occupied Housing Units | 3,570 | 85.4% |
| Renter-Occupied Housing Units | 613 | 14.6% |
| Total Occupied Housing Units | 4,183 | 100.0% |
Occupancy by Household Size in Hernando
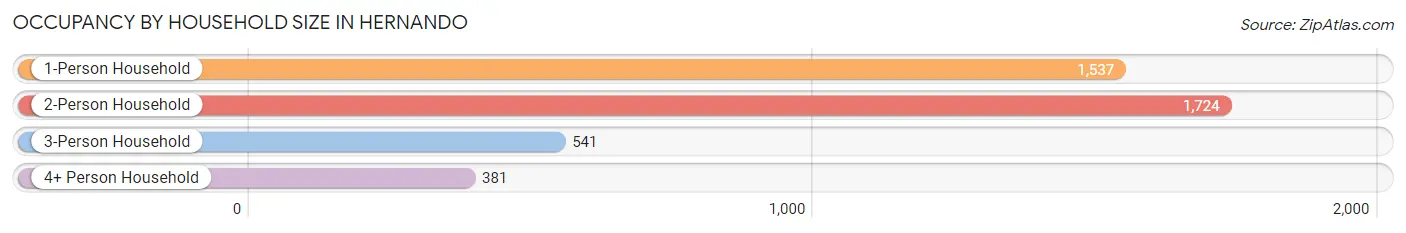
| Household Size | # Housing Units | % Housing Units |
| 1-Person Household | 1,537 | 36.7% |
| 2-Person Household | 1,724 | 41.2% |
| 3-Person Household | 541 | 12.9% |
| 4+ Person Household | 381 | 9.1% |
| Total Housing Units | 4,183 | 100.0% |
Occupancy by Ownership by Household Size in Hernando
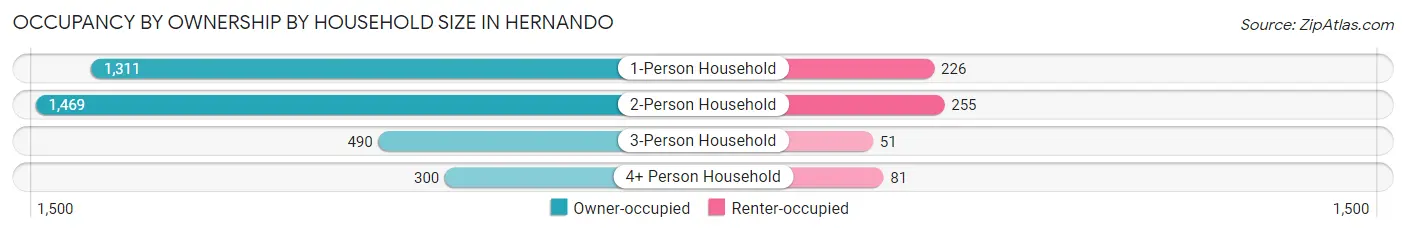
| Household Size | Owner-occupied | Renter-occupied |
| 1-Person Household | 1,311 (85.3%) | 226 (14.7%) |
| 2-Person Household | 1,469 (85.2%) | 255 (14.8%) |
| 3-Person Household | 490 (90.6%) | 51 (9.4%) |
| 4+ Person Household | 300 (78.7%) | 81 (21.3%) |
| Total Housing Units | 3,570 (85.4%) | 613 (14.6%) |
Occupancy by Educational Attainment in Hernando
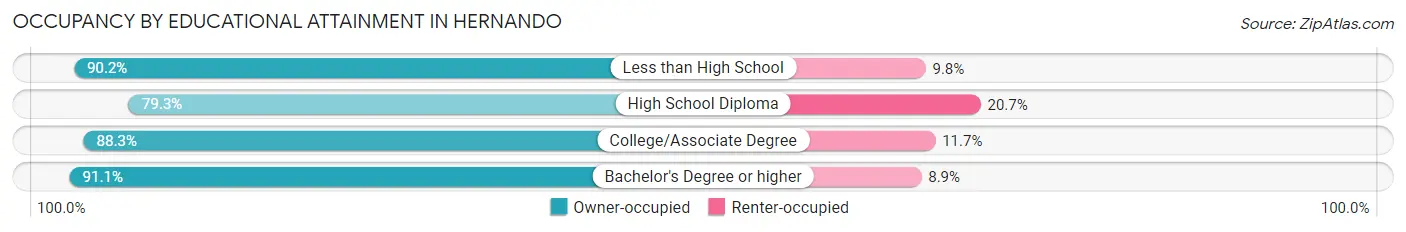
| Household Size | Owner-occupied | Renter-occupied |
| Less than High School | 387 (90.2%) | 42 (9.8%) |
| High School Diploma | 1,280 (79.3%) | 334 (20.7%) |
| College/Associate Degree | 1,455 (88.3%) | 193 (11.7%) |
| Bachelor's Degree or higher | 448 (91.1%) | 44 (8.9%) |
Occupancy by Age of Householder in Hernando
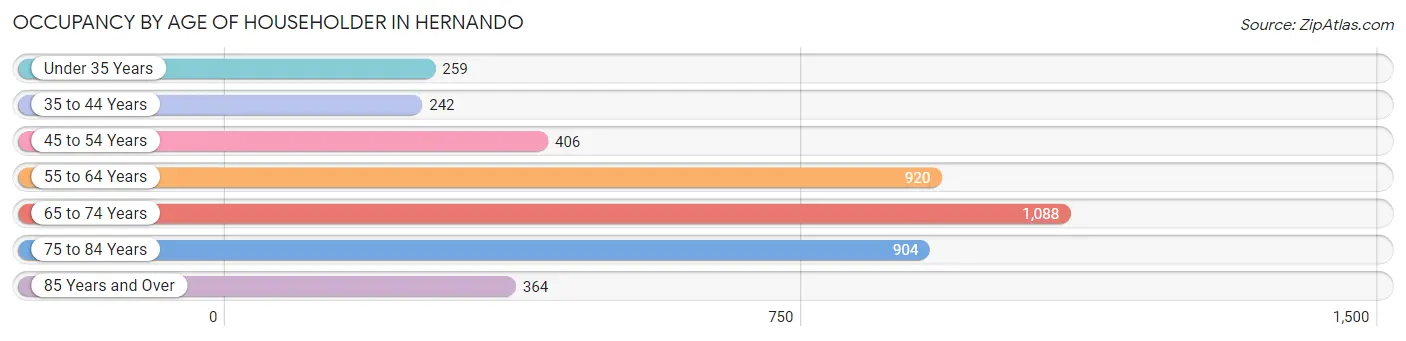
| Age Bracket | # Households | % Households |
| Under 35 Years | 259 | 6.2% |
| 35 to 44 Years | 242 | 5.8% |
| 45 to 54 Years | 406 | 9.7% |
| 55 to 64 Years | 920 | 22.0% |
| 65 to 74 Years | 1,088 | 26.0% |
| 75 to 84 Years | 904 | 21.6% |
| 85 Years and Over | 364 | 8.7% |
| Total | 4,183 | 100.0% |
Housing Finances in Hernando
Median Income by Occupancy in Hernando
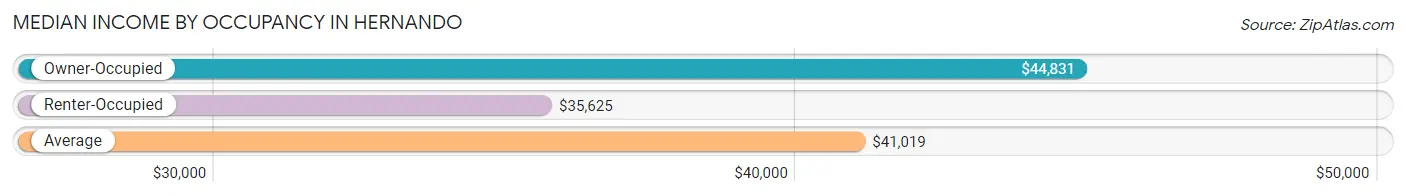
| Occupancy Type | # Households | Median Income |
| Owner-Occupied | 3,570 (85.4%) | $44,831 |
| Renter-Occupied | 613 (14.6%) | $35,625 |
| Average | 4,183 (100.0%) | $41,019 |
Occupancy by Householder Income Bracket in Hernando
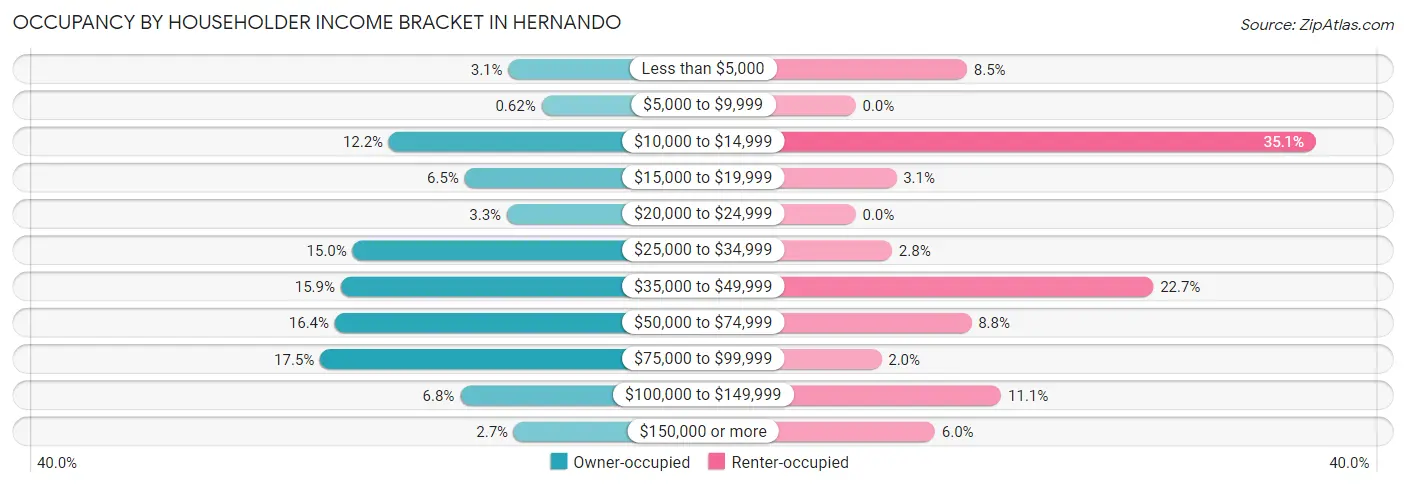
| Income Bracket | Owner-occupied | Renter-occupied |
| Less than $5,000 | 112 (3.1%) | 52 (8.5%) |
| $5,000 to $9,999 | 22 (0.6%) | 0 (0.0%) |
| $10,000 to $14,999 | 437 (12.2%) | 215 (35.1%) |
| $15,000 to $19,999 | 231 (6.5%) | 19 (3.1%) |
| $20,000 to $24,999 | 116 (3.3%) | 0 (0.0%) |
| $25,000 to $34,999 | 536 (15.0%) | 17 (2.8%) |
| $35,000 to $49,999 | 568 (15.9%) | 139 (22.7%) |
| $50,000 to $74,999 | 584 (16.4%) | 54 (8.8%) |
| $75,000 to $99,999 | 624 (17.5%) | 12 (2.0%) |
| $100,000 to $149,999 | 243 (6.8%) | 68 (11.1%) |
| $150,000 or more | 97 (2.7%) | 37 (6.0%) |
| Total | 3,570 (100.0%) | 613 (100.0%) |
Monthly Housing Cost Tiers in Hernando
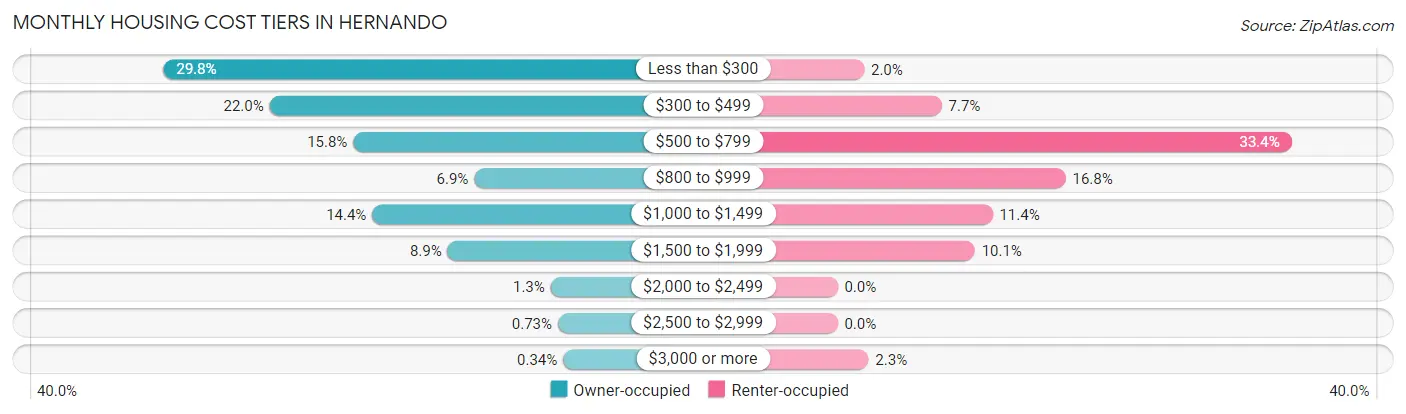
| Monthly Cost | Owner-occupied | Renter-occupied |
| Less than $300 | 1,063 (29.8%) | 12 (2.0%) |
| $300 to $499 | 784 (22.0%) | 47 (7.7%) |
| $500 to $799 | 564 (15.8%) | 205 (33.4%) |
| $800 to $999 | 246 (6.9%) | 103 (16.8%) |
| $1,000 to $1,499 | 514 (14.4%) | 70 (11.4%) |
| $1,500 to $1,999 | 316 (8.8%) | 62 (10.1%) |
| $2,000 to $2,499 | 45 (1.3%) | 0 (0.0%) |
| $2,500 to $2,999 | 26 (0.7%) | 0 (0.0%) |
| $3,000 or more | 12 (0.3%) | 14 (2.3%) |
| Total | 3,570 (100.0%) | 613 (100.0%) |
Physical Housing Characteristics in Hernando
Housing Structures in Hernando
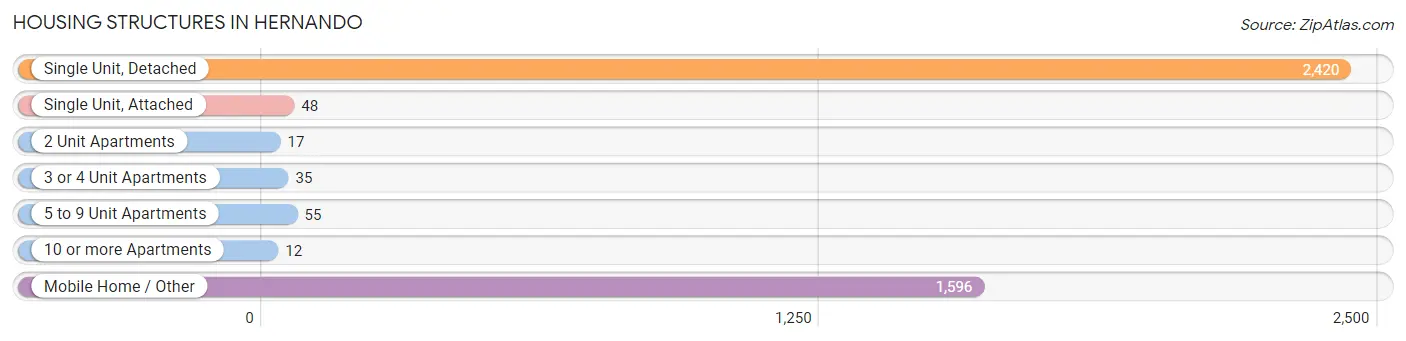
| Structure Type | # Housing Units | % Housing Units |
| Single Unit, Detached | 2,420 | 57.9% |
| Single Unit, Attached | 48 | 1.1% |
| 2 Unit Apartments | 17 | 0.4% |
| 3 or 4 Unit Apartments | 35 | 0.8% |
| 5 to 9 Unit Apartments | 55 | 1.3% |
| 10 or more Apartments | 12 | 0.3% |
| Mobile Home / Other | 1,596 | 38.2% |
| Total | 4,183 | 100.0% |
Housing Structures by Occupancy in Hernando
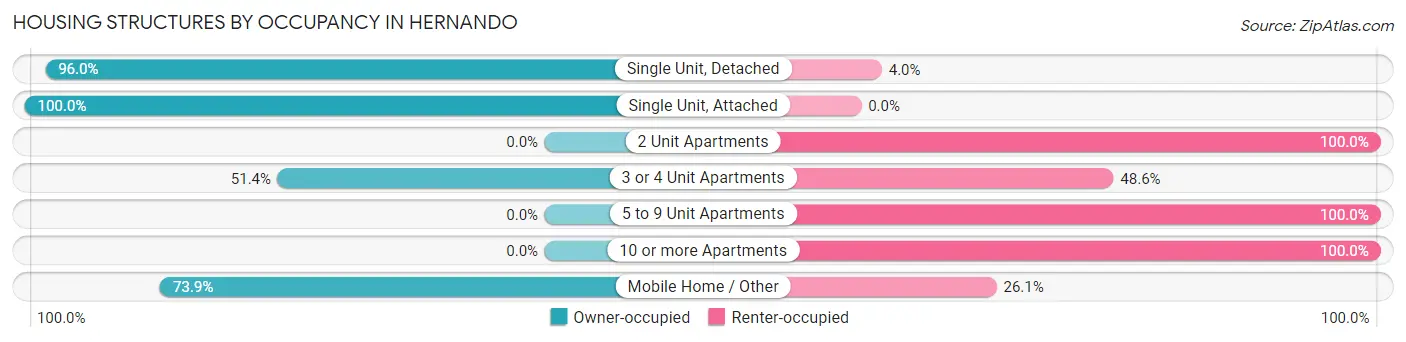
| Structure Type | Owner-occupied | Renter-occupied |
| Single Unit, Detached | 2,324 (96.0%) | 96 (4.0%) |
| Single Unit, Attached | 48 (100.0%) | 0 (0.0%) |
| 2 Unit Apartments | 0 (0.0%) | 17 (100.0%) |
| 3 or 4 Unit Apartments | 18 (51.4%) | 17 (48.6%) |
| 5 to 9 Unit Apartments | 0 (0.0%) | 55 (100.0%) |
| 10 or more Apartments | 0 (0.0%) | 12 (100.0%) |
| Mobile Home / Other | 1,180 (73.9%) | 416 (26.1%) |
| Total | 3,570 (85.4%) | 613 (14.6%) |
Housing Structures by Number of Rooms in Hernando
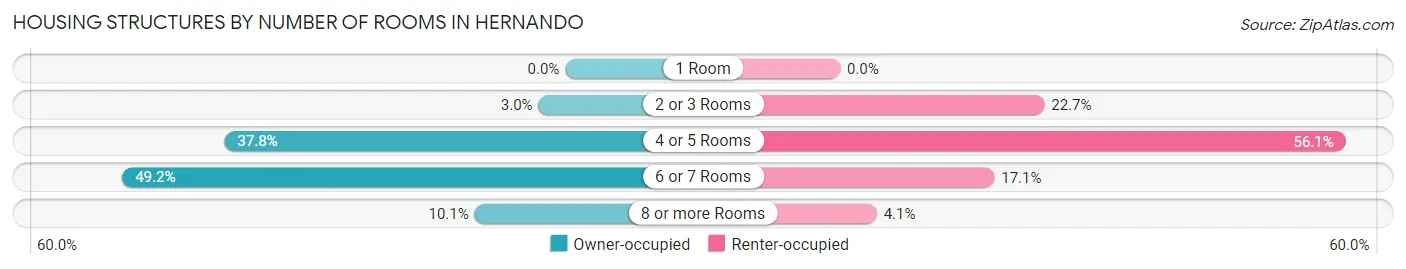
| Number of Rooms | Owner-occupied | Renter-occupied |
| 1 Room | 0 (0.0%) | 0 (0.0%) |
| 2 or 3 Rooms | 106 (3.0%) | 139 (22.7%) |
| 4 or 5 Rooms | 1,350 (37.8%) | 344 (56.1%) |
| 6 or 7 Rooms | 1,755 (49.2%) | 105 (17.1%) |
| 8 or more Rooms | 359 (10.1%) | 25 (4.1%) |
| Total | 3,570 (100.0%) | 613 (100.0%) |
Housing Structure by Heating Type in Hernando
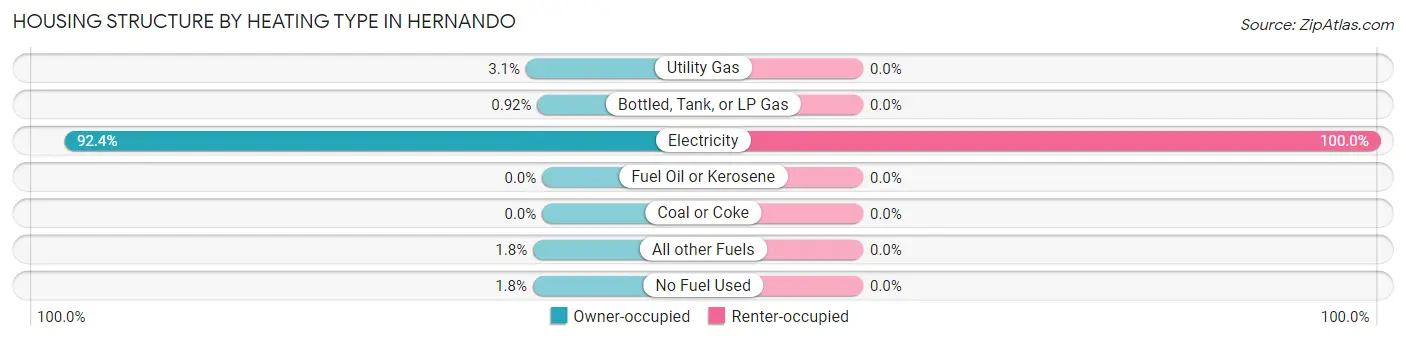
| Heating Type | Owner-occupied | Renter-occupied |
| Utility Gas | 112 (3.1%) | 0 (0.0%) |
| Bottled, Tank, or LP Gas | 33 (0.9%) | 0 (0.0%) |
| Electricity | 3,298 (92.4%) | 613 (100.0%) |
| Fuel Oil or Kerosene | 0 (0.0%) | 0 (0.0%) |
| Coal or Coke | 0 (0.0%) | 0 (0.0%) |
| All other Fuels | 63 (1.8%) | 0 (0.0%) |
| No Fuel Used | 64 (1.8%) | 0 (0.0%) |
| Total | 3,570 (100.0%) | 613 (100.0%) |
Household Vehicle Usage in Hernando
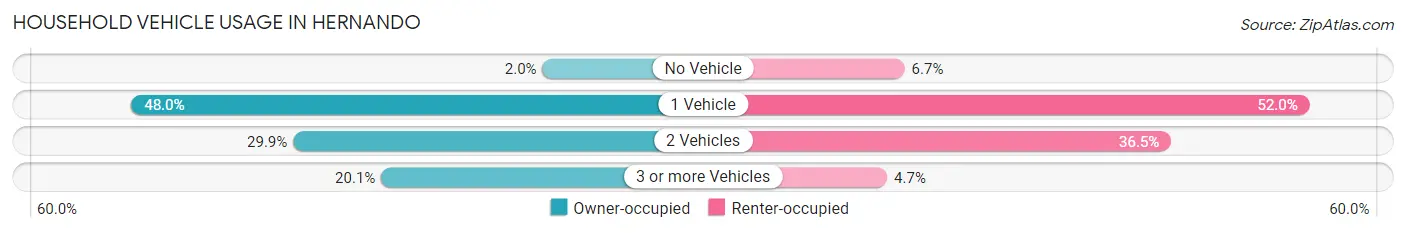
| Vehicles per Household | Owner-occupied | Renter-occupied |
| No Vehicle | 71 (2.0%) | 41 (6.7%) |
| 1 Vehicle | 1,715 (48.0%) | 319 (52.0%) |
| 2 Vehicles | 1,068 (29.9%) | 224 (36.5%) |
| 3 or more Vehicles | 716 (20.1%) | 29 (4.7%) |
| Total | 3,570 (100.0%) | 613 (100.0%) |
Real Estate & Mortgages in Hernando
Real Estate and Mortgage Overview in Hernando
| Characteristic | Without Mortgage | With Mortgage |
| Housing Units | 2,130 | 1,440 |
| Median Property Value | $142,600 | $214,500 |
| Median Household Income | $39,257 | $50 |
| Monthly Housing Costs | $301 | $12 |
| Real Estate Taxes | $805 | $76 |
Property Value by Mortgage Status in Hernando
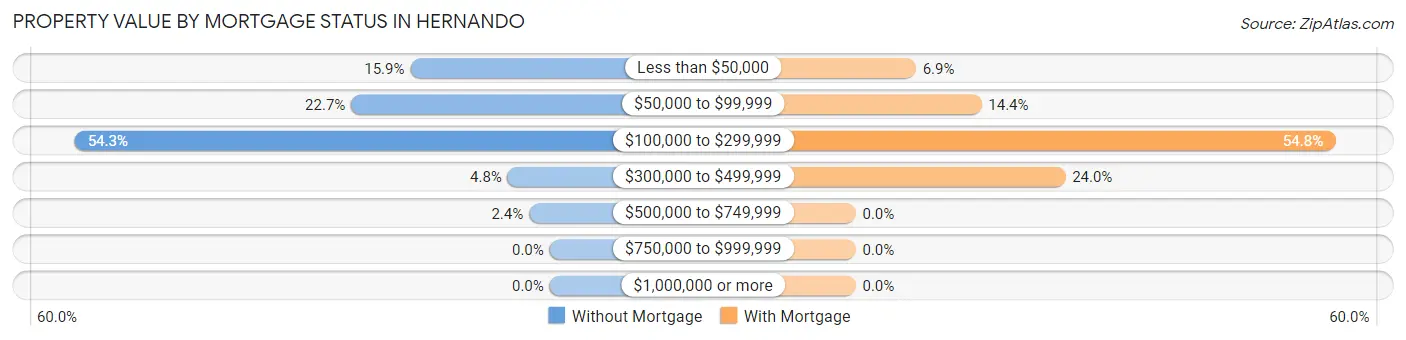
| Property Value | Without Mortgage | With Mortgage |
| Less than $50,000 | 339 (15.9%) | 99 (6.9%) |
| $50,000 to $99,999 | 483 (22.7%) | 207 (14.4%) |
| $100,000 to $299,999 | 1,156 (54.3%) | 789 (54.8%) |
| $300,000 to $499,999 | 102 (4.8%) | 345 (24.0%) |
| $500,000 to $749,999 | 50 (2.4%) | 0 (0.0%) |
| $750,000 to $999,999 | 0 (0.0%) | 0 (0.0%) |
| $1,000,000 or more | 0 (0.0%) | 0 (0.0%) |
| Total | 2,130 (100.0%) | 1,440 (100.0%) |
Household Income by Mortgage Status in Hernando
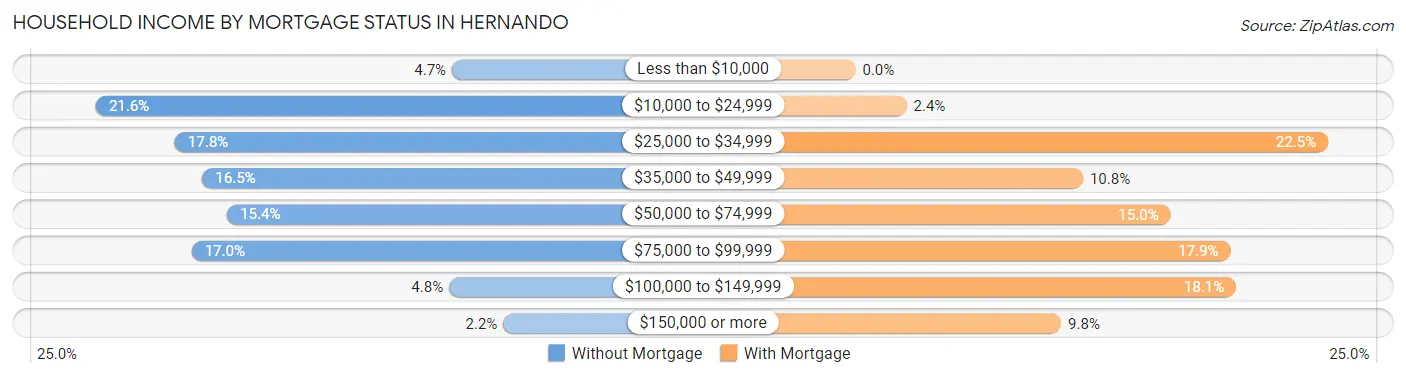
| Household Income | Without Mortgage | With Mortgage |
| Less than $10,000 | 99 (4.6%) | 0 (0.0%) |
| $10,000 to $24,999 | 460 (21.6%) | 35 (2.4%) |
| $25,000 to $34,999 | 380 (17.8%) | 324 (22.5%) |
| $35,000 to $49,999 | 352 (16.5%) | 156 (10.8%) |
| $50,000 to $74,999 | 327 (15.3%) | 216 (15.0%) |
| $75,000 to $99,999 | 363 (17.0%) | 257 (17.8%) |
| $100,000 to $149,999 | 102 (4.8%) | 261 (18.1%) |
| $150,000 or more | 47 (2.2%) | 141 (9.8%) |
| Total | 2,130 (100.0%) | 1,440 (100.0%) |
Property Value to Household Income Ratio in Hernando
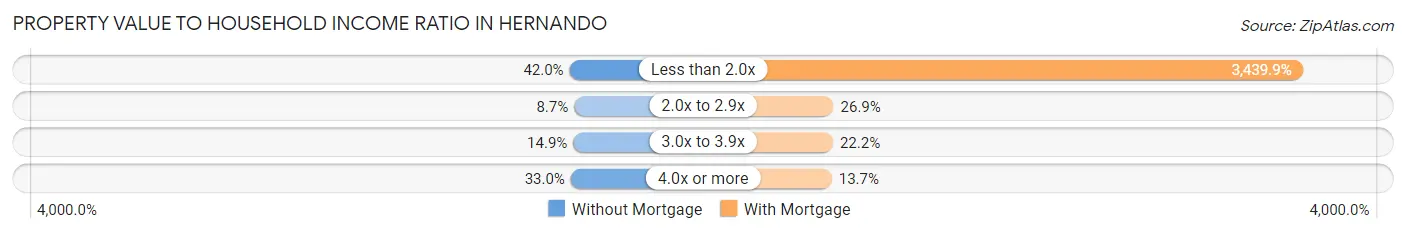
| Value-to-Income Ratio | Without Mortgage | With Mortgage |
| Less than 2.0x | 894 (42.0%) | 49,534 (3,439.9%) |
| 2.0x to 2.9x | 186 (8.7%) | 387 (26.9%) |
| 3.0x to 3.9x | 318 (14.9%) | 319 (22.2%) |
| 4.0x or more | 702 (33.0%) | 197 (13.7%) |
| Total | 2,130 (100.0%) | 1,440 (100.0%) |
Real Estate Taxes by Mortgage Status in Hernando
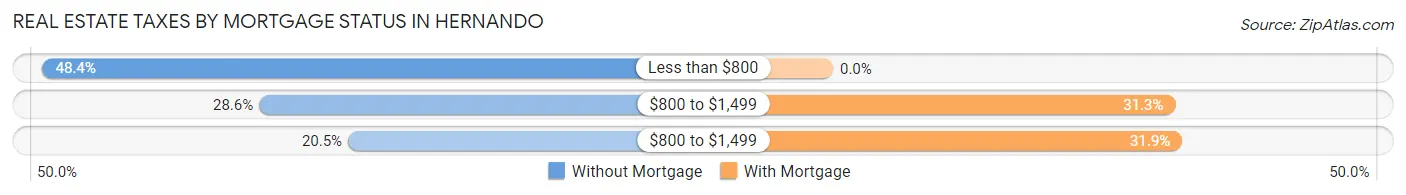
| Property Taxes | Without Mortgage | With Mortgage |
| Less than $800 | 1,030 (48.4%) | 0 (0.0%) |
| $800 to $1,499 | 609 (28.6%) | 450 (31.2%) |
| $800 to $1,499 | 436 (20.5%) | 459 (31.9%) |
| Total | 2,130 (100.0%) | 1,440 (100.0%) |
Health & Disability in Hernando
Health Insurance Coverage by Age in Hernando
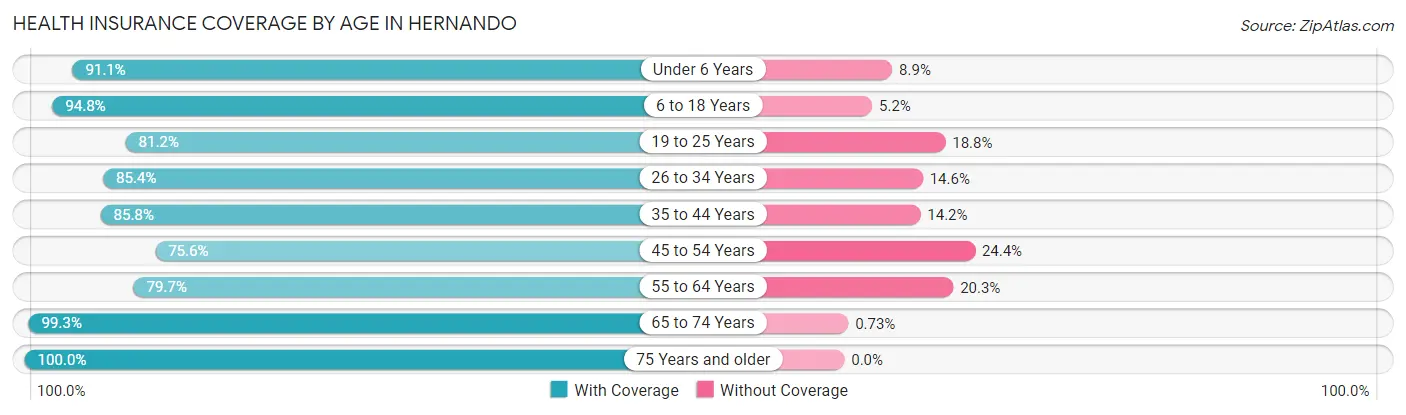
| Age Bracket | With Coverage | Without Coverage |
| Under 6 Years | 153 (91.1%) | 15 (8.9%) |
| 6 to 18 Years | 1,187 (94.8%) | 65 (5.2%) |
| 19 to 25 Years | 112 (81.2%) | 26 (18.8%) |
| 26 to 34 Years | 607 (85.4%) | 104 (14.6%) |
| 35 to 44 Years | 581 (85.8%) | 96 (14.2%) |
| 45 to 54 Years | 593 (75.6%) | 191 (24.4%) |
| 55 to 64 Years | 1,271 (79.7%) | 324 (20.3%) |
| 65 to 74 Years | 1,643 (99.3%) | 12 (0.7%) |
| 75 Years and older | 1,931 (100.0%) | 0 (0.0%) |
| Total | 8,078 (90.6%) | 833 (9.3%) |
Health Insurance Coverage by Citizenship Status in Hernando
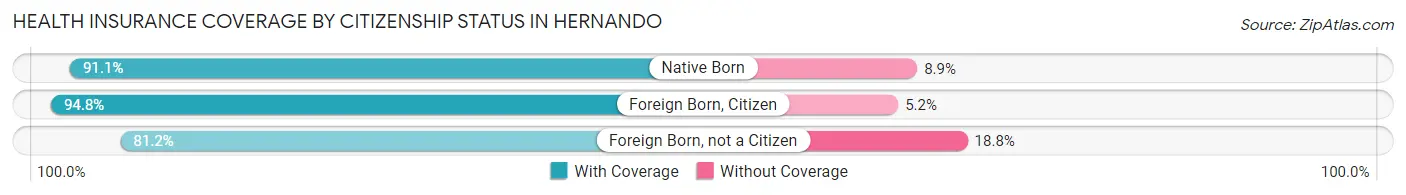
| Citizenship Status | With Coverage | Without Coverage |
| Native Born | 153 (91.1%) | 15 (8.9%) |
| Foreign Born, Citizen | 1,187 (94.8%) | 65 (5.2%) |
| Foreign Born, not a Citizen | 112 (81.2%) | 26 (18.8%) |
Health Insurance Coverage by Household Income in Hernando
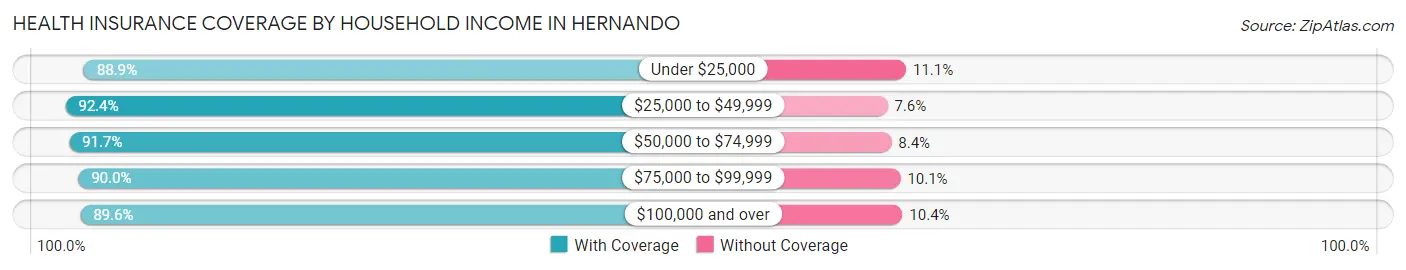
| Household Income | With Coverage | Without Coverage |
| Under $25,000 | 1,594 (88.9%) | 199 (11.1%) |
| $25,000 to $49,999 | 2,336 (92.4%) | 193 (7.6%) |
| $50,000 to $74,999 | 1,328 (91.6%) | 121 (8.4%) |
| $75,000 to $99,999 | 1,728 (89.9%) | 193 (10.1%) |
| $100,000 and over | 1,092 (89.6%) | 127 (10.4%) |
Public vs Private Health Insurance Coverage by Age in Hernando
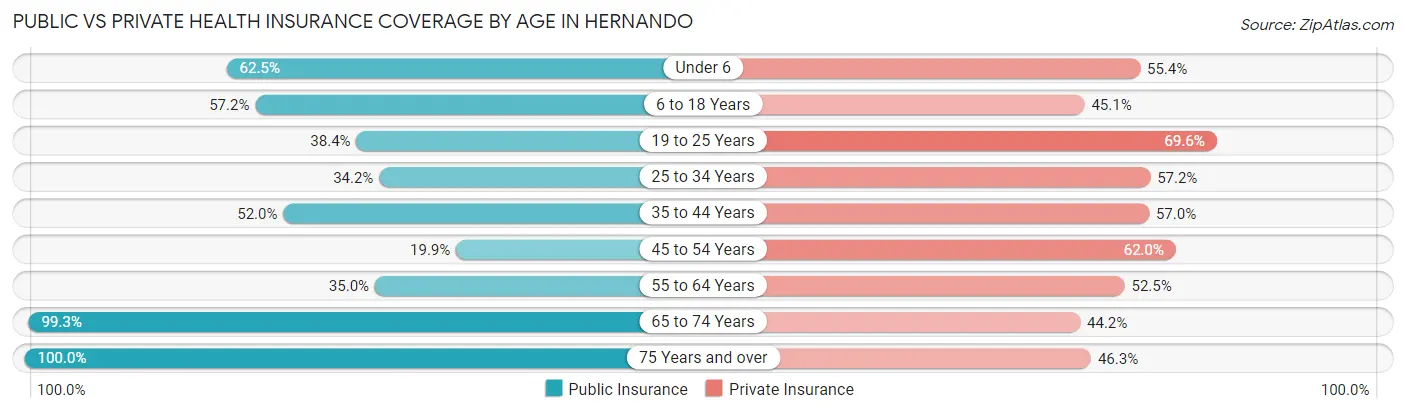
| Age Bracket | Public Insurance | Private Insurance |
| Under 6 | 105 (62.5%) | 93 (55.4%) |
| 6 to 18 Years | 716 (57.2%) | 564 (45.1%) |
| 19 to 25 Years | 53 (38.4%) | 96 (69.6%) |
| 25 to 34 Years | 243 (34.2%) | 407 (57.2%) |
| 35 to 44 Years | 352 (52.0%) | 386 (57.0%) |
| 45 to 54 Years | 156 (19.9%) | 486 (62.0%) |
| 55 to 64 Years | 558 (35.0%) | 837 (52.5%) |
| 65 to 74 Years | 1,643 (99.3%) | 732 (44.2%) |
| 75 Years and over | 1,931 (100.0%) | 893 (46.3%) |
| Total | 5,757 (64.6%) | 4,494 (50.4%) |
Disability Status by Sex by Age in Hernando
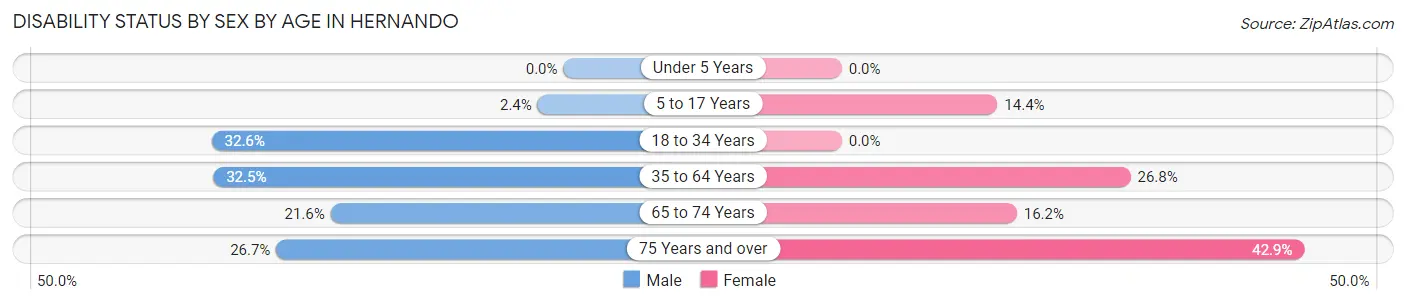
| Age Bracket | Male | Female |
| Under 5 Years | 0 (0.0%) | 0 (0.0%) |
| 5 to 17 Years | 17 (2.4%) | 65 (14.4%) |
| 18 to 34 Years | 188 (32.6%) | 0 (0.0%) |
| 35 to 64 Years | 537 (32.5%) | 376 (26.8%) |
| 65 to 74 Years | 174 (21.6%) | 138 (16.2%) |
| 75 Years and over | 270 (26.7%) | 394 (42.9%) |
Disability Class by Sex by Age in Hernando
Disability Class: Hearing Difficulty
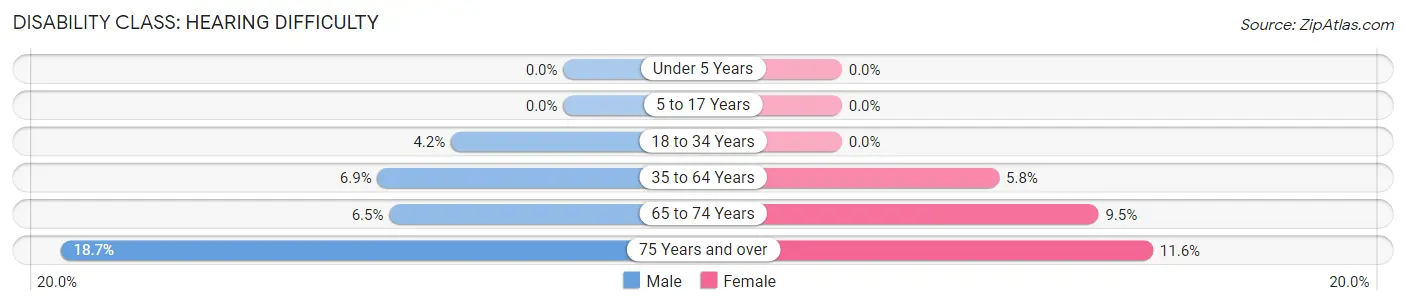
| Age Bracket | Male | Female |
| Under 5 Years | 0 (0.0%) | 0 (0.0%) |
| 5 to 17 Years | 0 (0.0%) | 0 (0.0%) |
| 18 to 34 Years | 24 (4.2%) | 0 (0.0%) |
| 35 to 64 Years | 114 (6.9%) | 82 (5.8%) |
| 65 to 74 Years | 52 (6.5%) | 81 (9.5%) |
| 75 Years and over | 189 (18.7%) | 106 (11.6%) |
Disability Class: Vision Difficulty
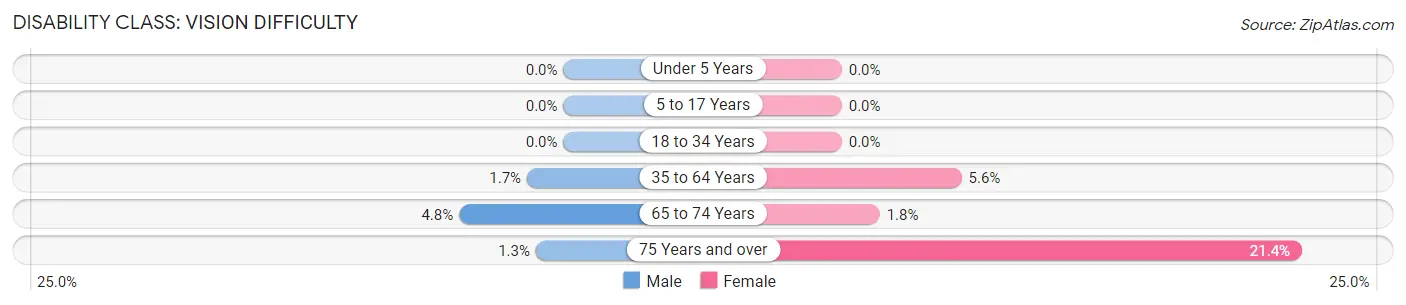
| Age Bracket | Male | Female |
| Under 5 Years | 0 (0.0%) | 0 (0.0%) |
| 5 to 17 Years | 0 (0.0%) | 0 (0.0%) |
| 18 to 34 Years | 0 (0.0%) | 0 (0.0%) |
| 35 to 64 Years | 28 (1.7%) | 78 (5.6%) |
| 65 to 74 Years | 39 (4.8%) | 15 (1.8%) |
| 75 Years and over | 13 (1.3%) | 196 (21.3%) |
Disability Class: Cognitive Difficulty
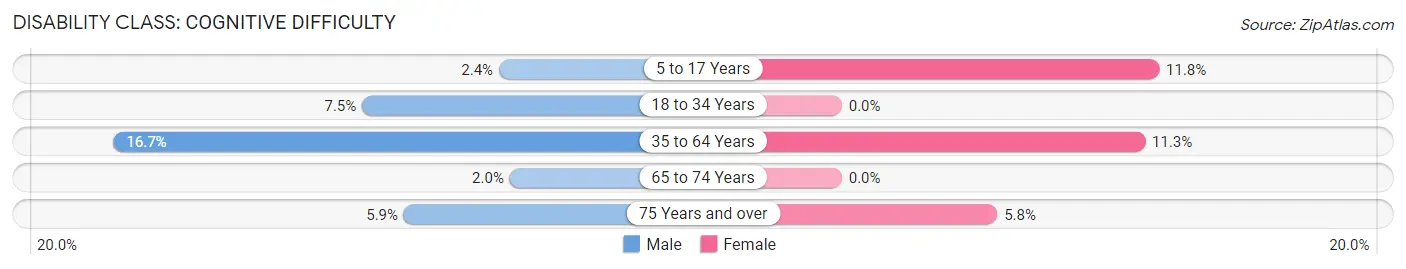
| Age Bracket | Male | Female |
| 5 to 17 Years | 17 (2.4%) | 53 (11.8%) |
| 18 to 34 Years | 43 (7.5%) | 0 (0.0%) |
| 35 to 64 Years | 276 (16.7%) | 158 (11.3%) |
| 65 to 74 Years | 16 (2.0%) | 0 (0.0%) |
| 75 Years and over | 60 (5.9%) | 53 (5.8%) |
Disability Class: Ambulatory Difficulty
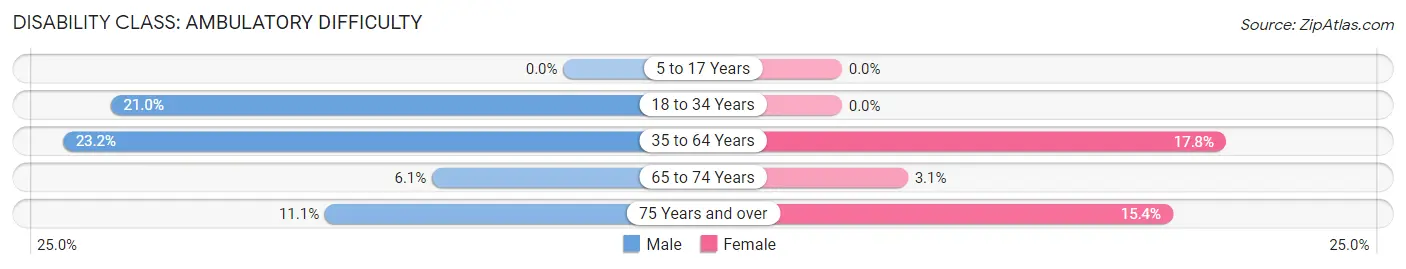
| Age Bracket | Male | Female |
| 5 to 17 Years | 0 (0.0%) | 0 (0.0%) |
| 18 to 34 Years | 121 (21.0%) | 0 (0.0%) |
| 35 to 64 Years | 384 (23.2%) | 250 (17.8%) |
| 65 to 74 Years | 49 (6.1%) | 26 (3.1%) |
| 75 Years and over | 112 (11.1%) | 141 (15.4%) |
Disability Class: Self-Care Difficulty
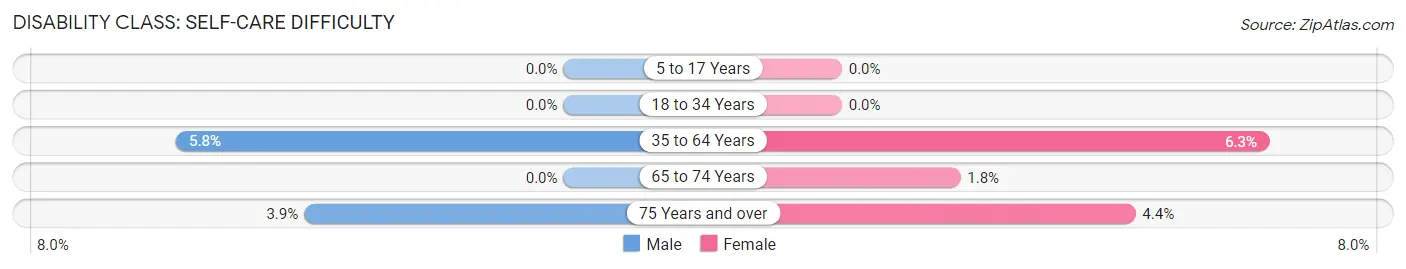
| Age Bracket | Male | Female |
| 5 to 17 Years | 0 (0.0%) | 0 (0.0%) |
| 18 to 34 Years | 0 (0.0%) | 0 (0.0%) |
| 35 to 64 Years | 95 (5.8%) | 89 (6.3%) |
| 65 to 74 Years | 0 (0.0%) | 15 (1.8%) |
| 75 Years and over | 39 (3.8%) | 40 (4.4%) |
Technology Access in Hernando
Computing Device Access in Hernando
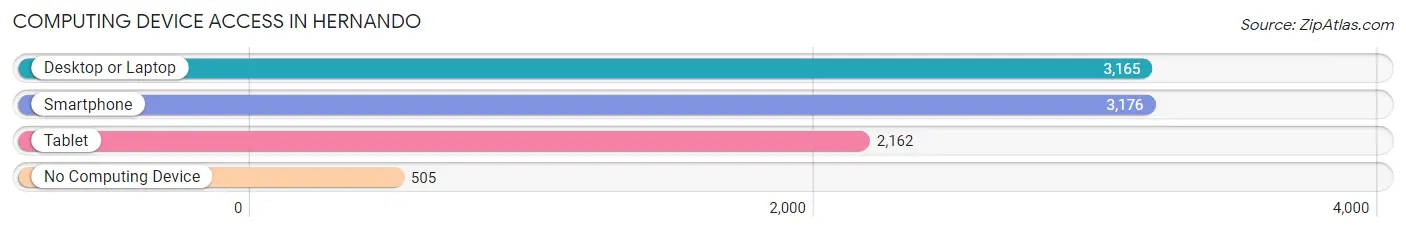
| Device Type | # Households | % Households |
| Desktop or Laptop | 3,165 | 75.7% |
| Smartphone | 3,176 | 75.9% |
| Tablet | 2,162 | 51.7% |
| No Computing Device | 505 | 12.1% |
| Total | 4,183 | 100.0% |
Internet Access in Hernando
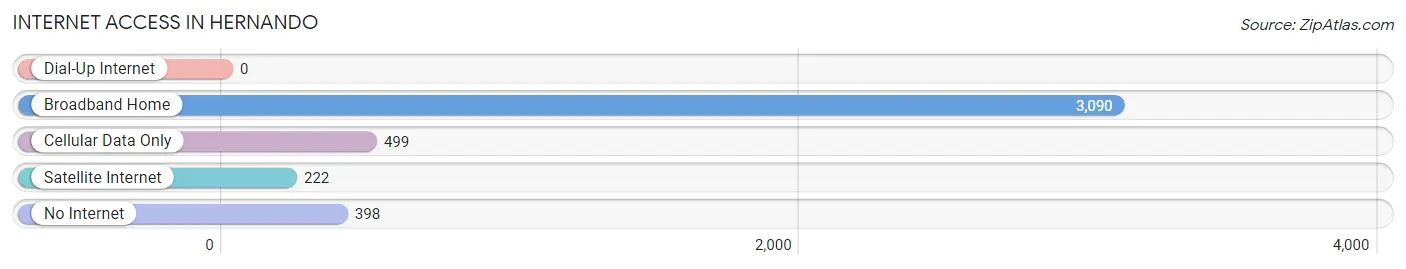
| Internet Type | # Households | % Households |
| Dial-Up Internet | 0 | 0.0% |
| Broadband Home | 3,090 | 73.9% |
| Cellular Data Only | 499 | 11.9% |
| Satellite Internet | 222 | 5.3% |
| No Internet | 398 | 9.5% |
| Total | 4,183 | 100.0% |
Hernando Summary
Hernando, Florida is a small town located in the central part of the state, just north of Tampa. It is part of the Tampa-St. Petersburg-Clearwater metropolitan area and is home to about 15,000 people. The town is known for its rural charm and its proximity to the Gulf of Mexico.
History
Hernando was first settled in 1842 by a group of settlers from Georgia. The town was named after Spanish explorer Hernando de Soto, who explored the area in 1539. The town was officially incorporated in 1887.
In the early 1900s, Hernando was a thriving agricultural community, with citrus groves, vegetable farms, and cattle ranches. The town was also home to a number of sawmills and turpentine stills.
In the 1950s, Hernando began to experience a population boom as people moved to the area from other parts of Florida. This growth was fueled by the construction of the Suncoast Parkway, which connected Hernando to Tampa and other cities in the region.
Geography
Hernando is located in the central part of Florida, just north of Tampa. It is part of the Tampa-St. Petersburg-Clearwater metropolitan area. The town is situated on the Gulf of Mexico, and is bordered by the Withlacoochee River to the east and the Pithlachascotee River to the west.
The town is located in a flat, low-lying area, with an average elevation of just 25 feet above sea level. The climate is humid subtropical, with hot, humid summers and mild winters.
Economy
Hernando’s economy is largely based on tourism and agriculture. The town is home to a number of tourist attractions, including the Weeki Wachee Springs State Park, which is home to a live mermaid show.
Agriculture is also an important part of the local economy. The town is home to a number of citrus groves, vegetable farms, and cattle ranches.
Demographics
As of the 2010 census, Hernando had a population of 15,072. The racial makeup of the town was 87.3% White, 8.2% African American, 0.7% Native American, 0.7% Asian, 0.1% Pacific Islander, and 2.9% from other races. Hispanic or Latino of any race were 6.3% of the population.
The median household income in Hernando was $41,945, and the median family income was $50,945. The per capita income was $21,945. About 11.3% of families and 14.2% of the population were below the poverty line.
Common Questions
What is Per Capita Income in Hernando?
Per Capita income in Hernando is $25,404.
What is the Median Family Income in Hernando?
Median Family Income in Hernando is $55,031.
What is the Median Household income in Hernando?
Median Household Income in Hernando is $41,019.
What is Income or Wage Gap in Hernando?
Income or Wage Gap in Hernando is 18.6%.
Women in Hernando earn 81.4 cents for every dollar earned by a man.
What is Family Income Deficit in Hernando?
Family Income Deficit in Hernando is $7,744.
Families that are below poverty line in Hernando earn $7,744 less on average than the poverty threshold level.
What is Inequality or Gini Index in Hernando?
Inequality or Gini Index in Hernando is 0.41.
What is the Total Population of Hernando?
Total Population of Hernando is 8,911.
What is the Total Male Population of Hernando?
Total Male Population of Hernando is 4,817.
What is the Total Female Population of Hernando?
Total Female Population of Hernando is 4,094.
What is the Ratio of Males per 100 Females in Hernando?
There are 117.66 Males per 100 Females in Hernando.
What is the Ratio of Females per 100 Males in Hernando?
There are 84.99 Females per 100 Males in Hernando.
What is the Median Population Age in Hernando?
Median Population Age in Hernando is 60.0 Years.
What is the Average Family Size in Hernando
Average Family Size in Hernando is 2.7 People.
What is the Average Household Size in Hernando
Average Household Size in Hernando is 2.1 People.
How Large is the Labor Force in Hernando?
There are 2,712 People in the Labor Forcein in Hernando.
What is the Percentage of People in the Labor Force in Hernando?
34.4% of People are in the Labor Force in Hernando.
What is the Unemployment Rate in Hernando?
Unemployment Rate in Hernando is 9.1%.