Warren, PA Map & Demographics
Warren Map
Warren Overview
$33,937
PER CAPITA INCOME
$69,583
AVG FAMILY INCOME
$49,609
AVG HOUSEHOLD INCOME
31.5%
WAGE / INCOME GAP [ % ]
68.5¢/ $1
WAGE / INCOME GAP [ $ ]
0.47
INEQUALITY / GINI INDEX
9,353
TOTAL POPULATION
4,137
MALE POPULATION
5,216
FEMALE POPULATION
79.31
MALES / 100 FEMALES
126.08
FEMALES / 100 MALES
43.8
MEDIAN AGE
2.8
AVG FAMILY SIZE
2.1
AVG HOUSEHOLD SIZE
4,671
LABOR FORCE [ PEOPLE ]
59.8%
PERCENT IN LABOR FORCE
3.2%
UNEMPLOYMENT RATE
Warren Zip Codes
Warren Area Codes
Income in Warren
Income Overview in Warren
Per Capita Income in Warren is $33,937, while median incomes of families and households are $69,583 and $49,609 respectively.
| Characteristic | Number | Measure |
| Per Capita Income | 9,353 | $33,937 |
| Median Family Income | 2,192 | $69,583 |
| Mean Family Income | 2,192 | $93,818 |
| Median Household Income | 4,303 | $49,609 |
| Mean Household Income | 4,303 | $71,491 |
| Income Deficit | 2,192 | $0 |
| Wage / Income Gap (%) | 9,353 | 31.52% |
| Wage / Income Gap ($) | 9,353 | 68.48¢ per $1 |
| Gini / Inequality Index | 9,353 | 0.47 |
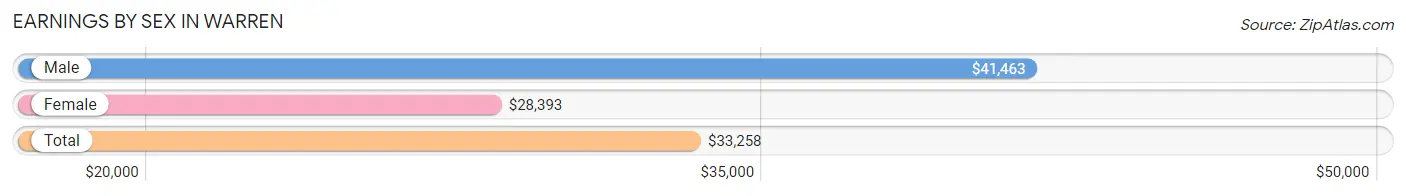
Earnings by Sex in Warren
Average Earnings in Warren are $33,258, $41,463 for men and $28,393 for women, a difference of 31.5%.
| Sex | Number | Average Earnings |
| Male | 2,323 (46.9%) | $41,463 |
| Female | 2,626 (53.1%) | $28,393 |
| Total | 4,949 (100.0%) | $33,258 |
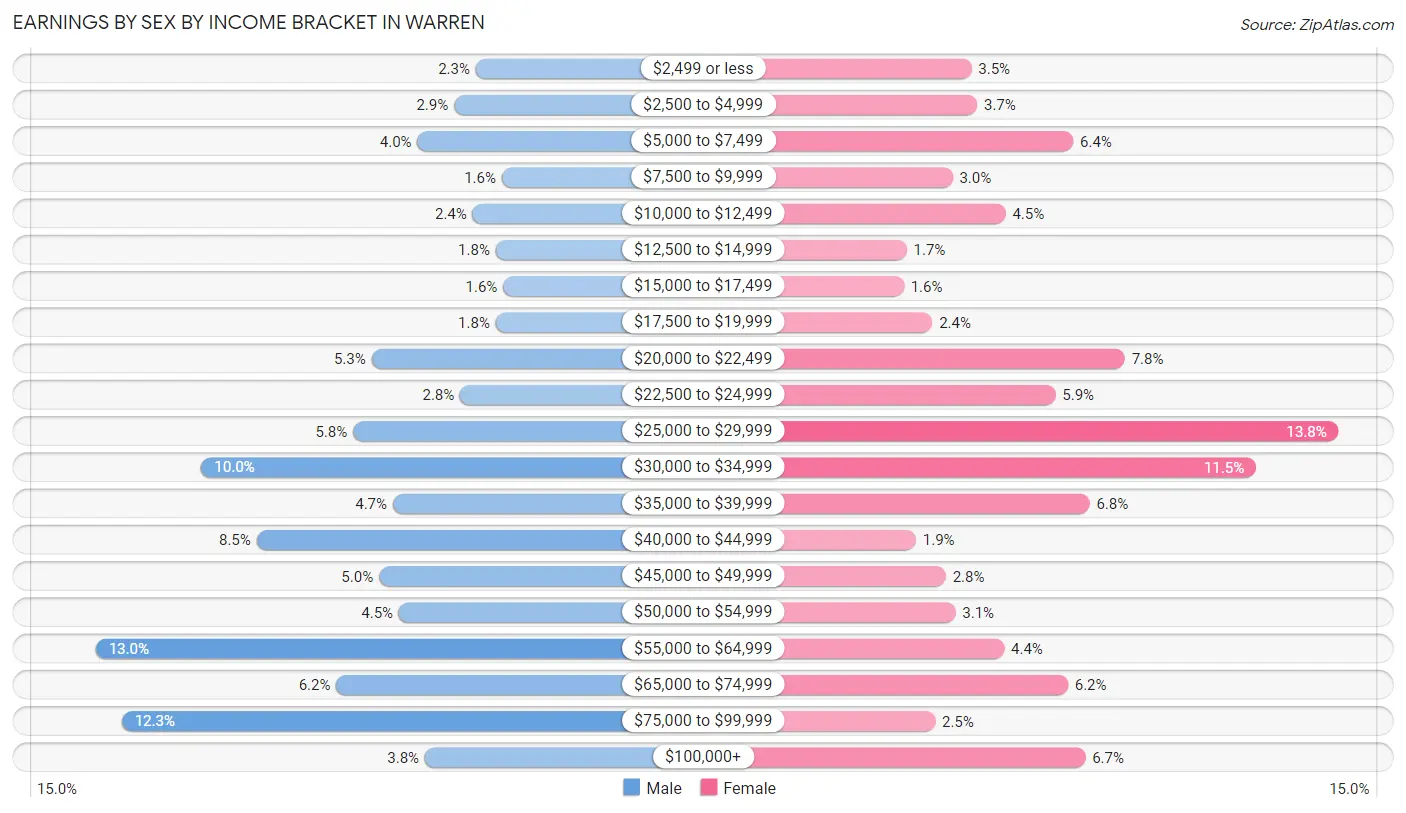
Earnings by Sex by Income Bracket in Warren
The most common earnings brackets in Warren are $55,000 to $64,999 for men (302 | 13.0%) and $25,000 to $29,999 for women (363 | 13.8%).
| Income | Male | Female |
| $2,499 or less | 54 (2.3%) | 92 (3.5%) |
| $2,500 to $4,999 | 68 (2.9%) | 96 (3.7%) |
| $5,000 to $7,499 | 92 (4.0%) | 167 (6.4%) |
| $7,500 to $9,999 | 37 (1.6%) | 78 (3.0%) |
| $10,000 to $12,499 | 56 (2.4%) | 117 (4.5%) |
| $12,500 to $14,999 | 41 (1.8%) | 44 (1.7%) |
| $15,000 to $17,499 | 36 (1.5%) | 42 (1.6%) |
| $17,500 to $19,999 | 41 (1.8%) | 63 (2.4%) |
| $20,000 to $22,499 | 122 (5.2%) | 205 (7.8%) |
| $22,500 to $24,999 | 64 (2.8%) | 154 (5.9%) |
| $25,000 to $29,999 | 134 (5.8%) | 363 (13.8%) |
| $30,000 to $34,999 | 233 (10.0%) | 302 (11.5%) |
| $35,000 to $39,999 | 108 (4.6%) | 179 (6.8%) |
| $40,000 to $44,999 | 197 (8.5%) | 51 (1.9%) |
| $45,000 to $49,999 | 117 (5.0%) | 73 (2.8%) |
| $50,000 to $54,999 | 104 (4.5%) | 80 (3.0%) |
| $55,000 to $64,999 | 302 (13.0%) | 116 (4.4%) |
| $65,000 to $74,999 | 145 (6.2%) | 163 (6.2%) |
| $75,000 to $99,999 | 285 (12.3%) | 65 (2.5%) |
| $100,000+ | 87 (3.7%) | 176 (6.7%) |
| Total | 2,323 (100.0%) | 2,626 (100.0%) |
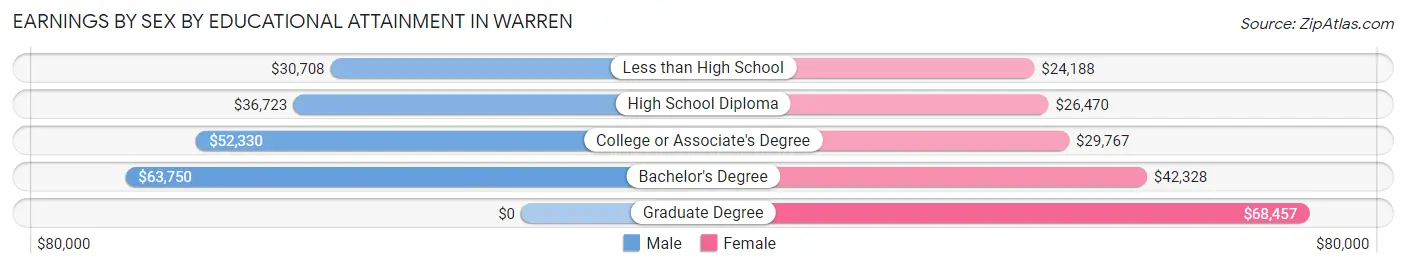
Earnings by Sex by Educational Attainment in Warren
Average earnings in Warren are $45,691 for men and $31,062 for women, a difference of 32.0%. Men with an educational attainment of bachelor's degree enjoy the highest average annual earnings of $63,750, while those with less than high school education earn the least with $30,708. Women with an educational attainment of graduate degree earn the most with the average annual earnings of $68,457, while those with less than high school education have the smallest earnings of $24,188.
| Educational Attainment | Male Income | Female Income |
| Less than High School | $30,708 | $24,188 |
| High School Diploma | $36,723 | $26,470 |
| College or Associate's Degree | $52,330 | $29,767 |
| Bachelor's Degree | $63,750 | $42,328 |
| Graduate Degree | - | - |
| Total | $45,691 | $31,062 |
Family Income in Warren
Family Income Brackets in Warren
According to the Warren family income data, there are 456 families falling into the $50,000 to $74,999 income range, which is the most common income bracket and makes up 20.8% of all families. Conversely, the less than $10,000 income bracket is the least frequent group with only 79 families (3.6%) belonging to this category.
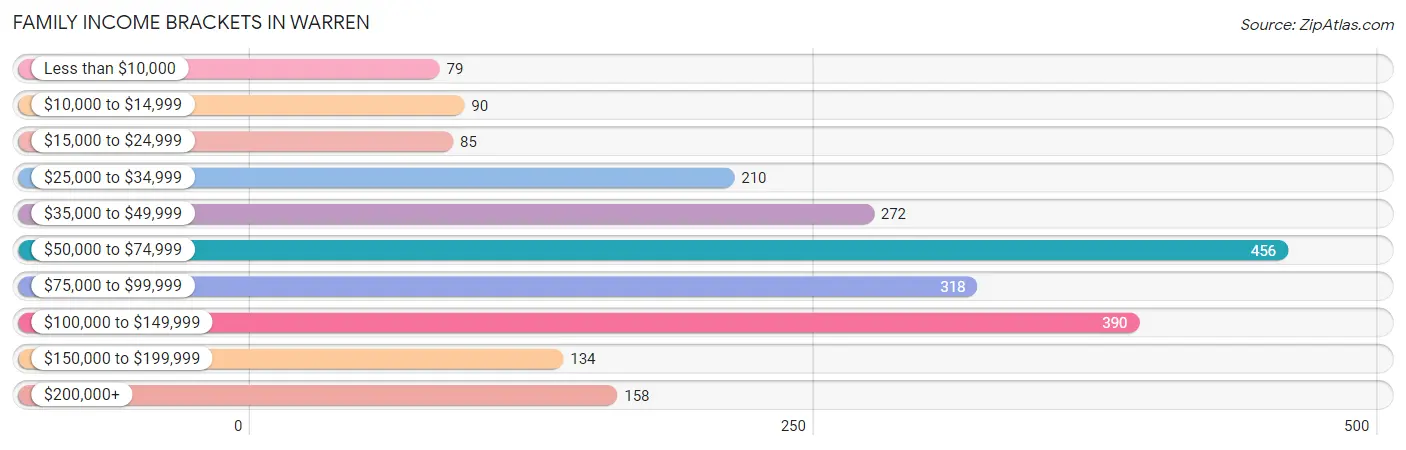
| Income Bracket | # Families | % Families |
| Less than $10,000 | 79 | 3.6% |
| $10,000 to $14,999 | 90 | 4.1% |
| $15,000 to $24,999 | 85 | 3.9% |
| $25,000 to $34,999 | 210 | 9.6% |
| $35,000 to $49,999 | 272 | 12.4% |
| $50,000 to $74,999 | 456 | 20.8% |
| $75,000 to $99,999 | 318 | 14.5% |
| $100,000 to $149,999 | 390 | 17.8% |
| $150,000 to $199,999 | 134 | 6.1% |
| $200,000+ | 158 | 7.2% |
Family Income by Famaliy Size in Warren
6-person families (97 | 4.4%) account for the highest median family income in Warren with $151,285 per family, while 2-person families (1,362 | 62.1%) have the highest median income of $32,610 per family member.
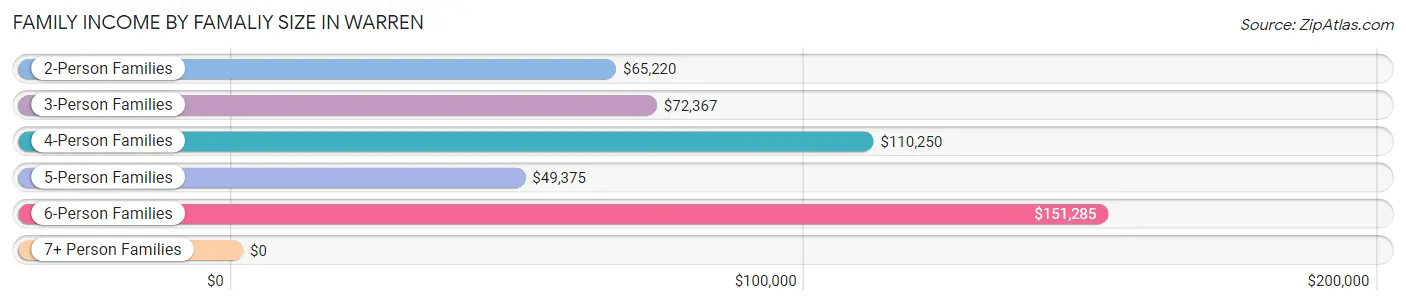
| Income Bracket | # Families | Median Income |
| 2-Person Families | 1,362 (62.1%) | $65,220 |
| 3-Person Families | 441 (20.1%) | $72,367 |
| 4-Person Families | 277 (12.6%) | $110,250 |
| 5-Person Families | 15 (0.7%) | $49,375 |
| 6-Person Families | 97 (4.4%) | $151,285 |
| 7+ Person Families | 0 (0.0%) | $0 |
| Total | 2,192 (100.0%) | $69,583 |
Family Income by Number of Earners in Warren
The median family income in Warren is $69,583, with families comprising 2 earners (807) having the highest median family income of $98,125, while families with no earners (539) have the lowest median family income of $48,401, accounting for 36.8% and 24.6% of families, respectively.
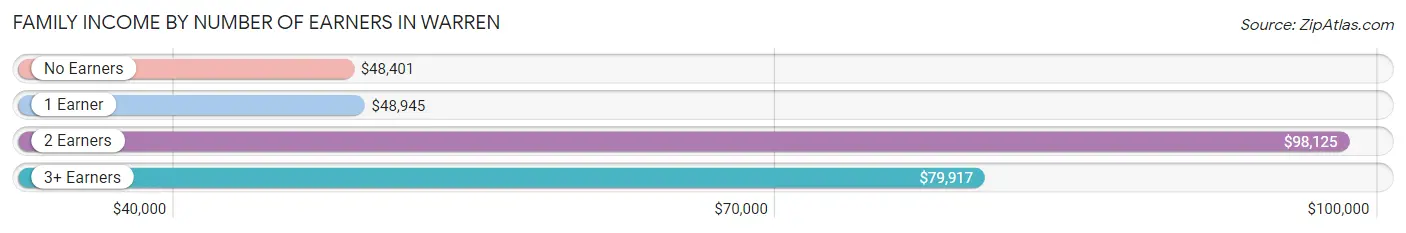
| Number of Earners | # Families | Median Income |
| No Earners | 539 (24.6%) | $48,401 |
| 1 Earner | 665 (30.3%) | $48,945 |
| 2 Earners | 807 (36.8%) | $98,125 |
| 3+ Earners | 181 (8.3%) | $79,917 |
| Total | 2,192 (100.0%) | $69,583 |
Household Income in Warren
Household Income Brackets in Warren
With 869 households falling in the category, the $50,000 to $74,999 income range is the most frequent in Warren, accounting for 20.2% of all households. In contrast, only 159 households (3.7%) fall into the $150,000 to $199,999 income bracket, making it the least populous group.
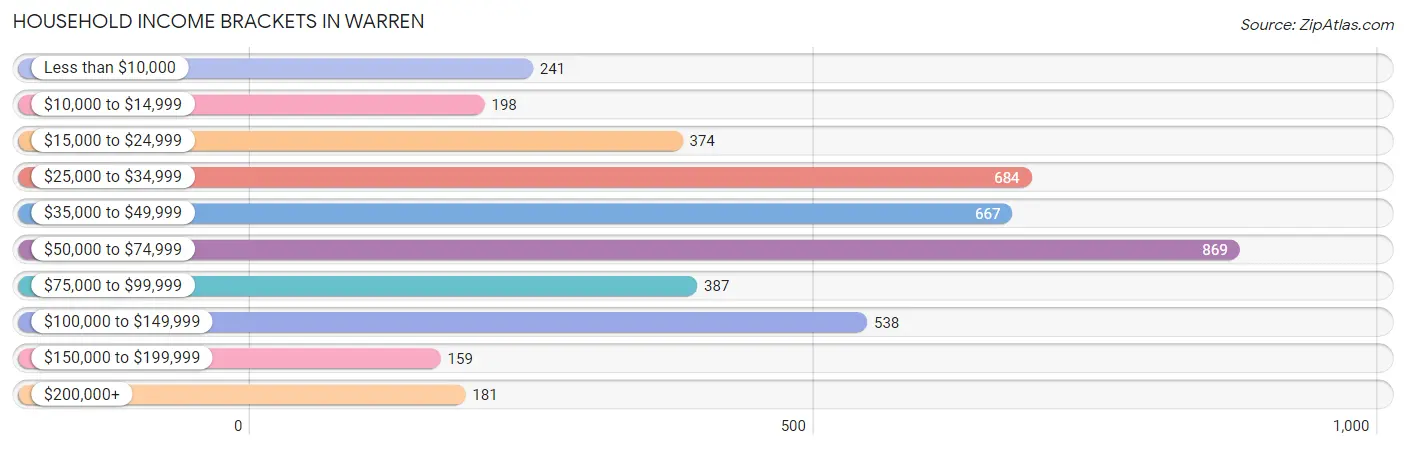
| Income Bracket | # Households | % Households |
| Less than $10,000 | 241 | 5.6% |
| $10,000 to $14,999 | 198 | 4.6% |
| $15,000 to $24,999 | 374 | 8.7% |
| $25,000 to $34,999 | 684 | 15.9% |
| $35,000 to $49,999 | 667 | 15.5% |
| $50,000 to $74,999 | 869 | 20.2% |
| $75,000 to $99,999 | 387 | 9.0% |
| $100,000 to $149,999 | 538 | 12.5% |
| $150,000 to $199,999 | 159 | 3.7% |
| $200,000+ | 181 | 4.2% |
Household Income by Householder Age in Warren
The median household income in Warren is $49,609, with the highest median household income of $71,818 found in the 25 to 44 years age bracket for the primary householder. A total of 1,110 households (25.8%) fall into this category. Meanwhile, the 65+ years age bracket for the primary householder has the lowest median household income of $37,557, with 1,250 households (29.0%) in this group.
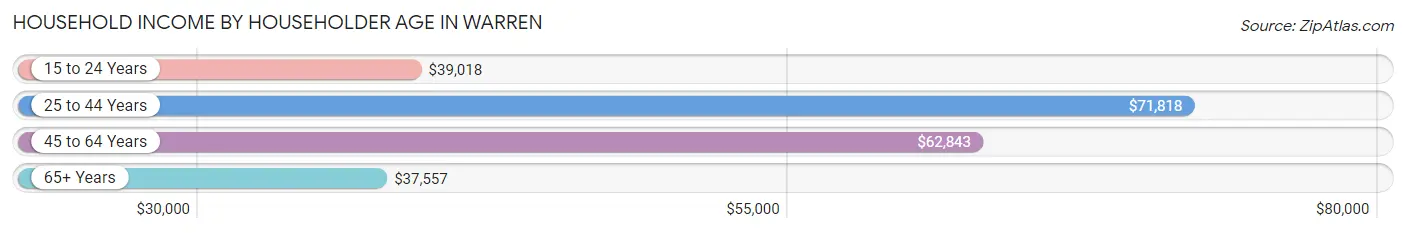
| Income Bracket | # Households | Median Income |
| 15 to 24 Years | 169 (3.9%) | $39,018 |
| 25 to 44 Years | 1,110 (25.8%) | $71,818 |
| 45 to 64 Years | 1,774 (41.2%) | $62,843 |
| 65+ Years | 1,250 (29.0%) | $37,557 |
| Total | 4,303 (100.0%) | $49,609 |
Poverty in Warren
Income Below Poverty by Sex and Age in Warren
With 9.1% poverty level for males and 15.3% for females among the residents of Warren, 16 and 17 year old males and under 5 year old females are the most vulnerable to poverty, with 65 males (31.7%) and 86 females (35.7%) in their respective age groups living below the poverty level.
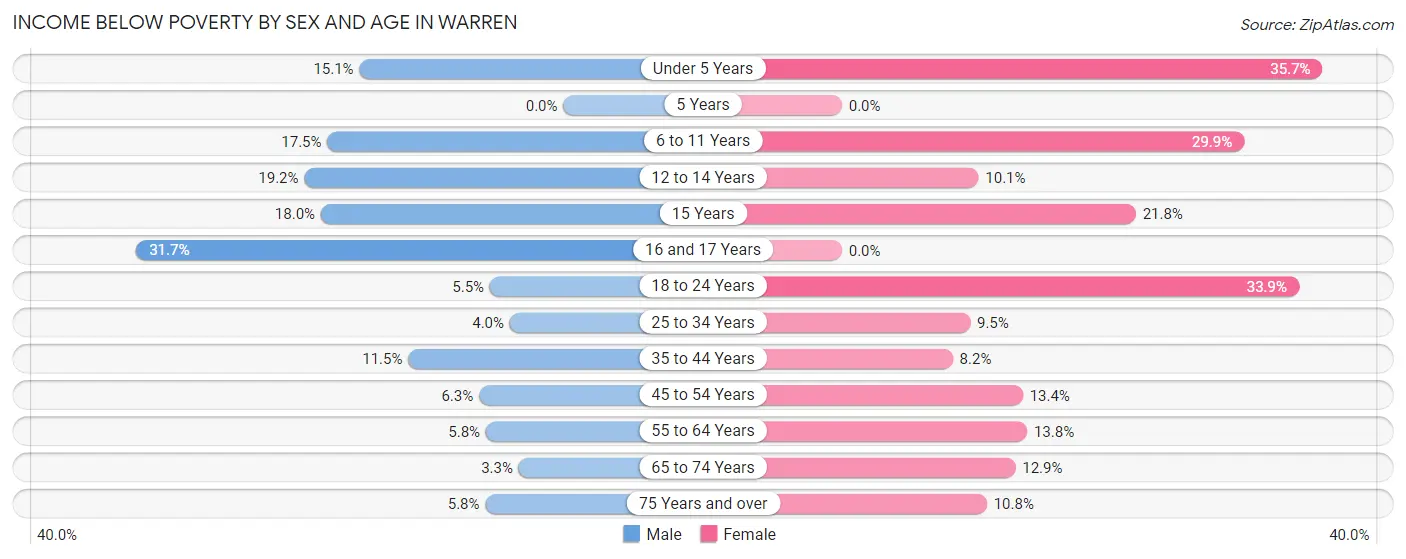
| Age Bracket | Male | Female |
| Under 5 Years | 33 (15.1%) | 86 (35.7%) |
| 5 Years | 0 (0.0%) | 0 (0.0%) |
| 6 to 11 Years | 41 (17.5%) | 66 (29.9%) |
| 12 to 14 Years | 20 (19.2%) | 30 (10.1%) |
| 15 Years | 9 (18.0%) | 24 (21.8%) |
| 16 and 17 Years | 65 (31.7%) | 0 (0.0%) |
| 18 to 24 Years | 14 (5.4%) | 152 (33.9%) |
| 25 to 34 Years | 19 (4.0%) | 58 (9.5%) |
| 35 to 44 Years | 61 (11.5%) | 47 (8.2%) |
| 45 to 54 Years | 31 (6.3%) | 92 (13.4%) |
| 55 to 64 Years | 35 (5.8%) | 95 (13.8%) |
| 65 to 74 Years | 14 (3.3%) | 72 (12.9%) |
| 75 Years and over | 23 (5.8%) | 55 (10.8%) |
| Total | 365 (9.1%) | 777 (15.3%) |
Income Above Poverty by Sex and Age in Warren
According to the poverty statistics in Warren, males aged 5 years and females aged 5 years are the age groups that are most secure financially, with 100.0% of males and 100.0% of females in these age groups living above the poverty line.
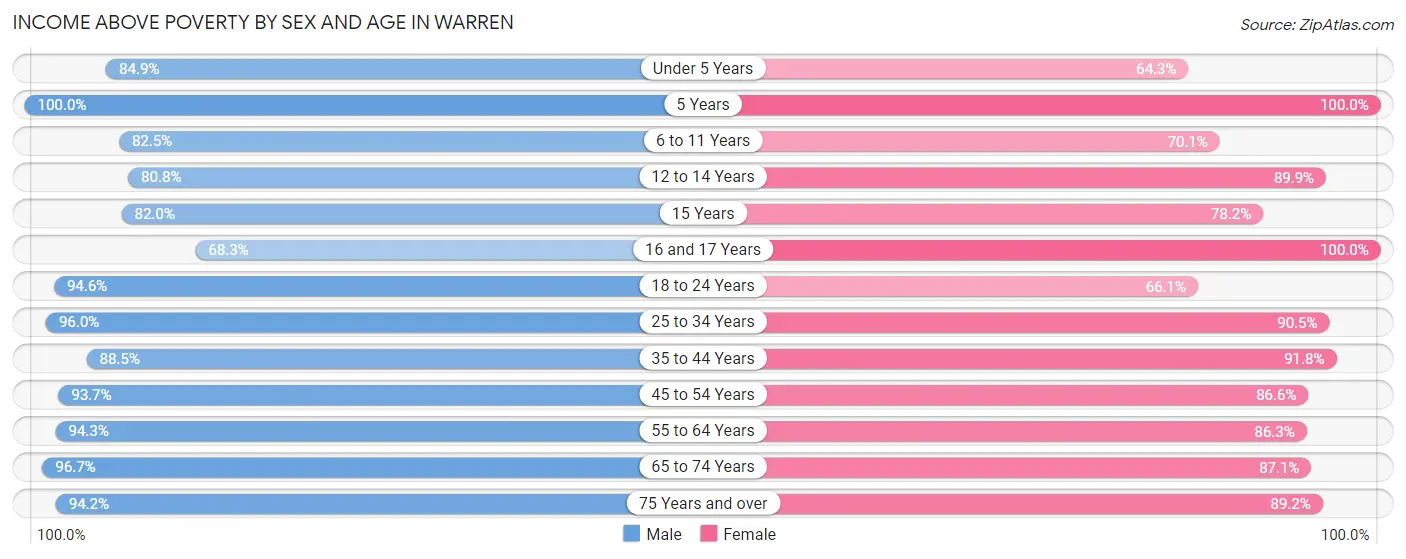
| Age Bracket | Male | Female |
| Under 5 Years | 185 (84.9%) | 155 (64.3%) |
| 5 Years | 18 (100.0%) | 20 (100.0%) |
| 6 to 11 Years | 193 (82.5%) | 155 (70.1%) |
| 12 to 14 Years | 84 (80.8%) | 266 (89.9%) |
| 15 Years | 41 (82.0%) | 86 (78.2%) |
| 16 and 17 Years | 140 (68.3%) | 120 (100.0%) |
| 18 to 24 Years | 243 (94.6%) | 296 (66.1%) |
| 25 to 34 Years | 459 (96.0%) | 551 (90.5%) |
| 35 to 44 Years | 469 (88.5%) | 524 (91.8%) |
| 45 to 54 Years | 464 (93.7%) | 593 (86.6%) |
| 55 to 64 Years | 574 (94.3%) | 596 (86.3%) |
| 65 to 74 Years | 409 (96.7%) | 487 (87.1%) |
| 75 Years and over | 374 (94.2%) | 456 (89.2%) |
| Total | 3,653 (90.9%) | 4,305 (84.7%) |
Income Below Poverty Among Married-Couple Families in Warren
The poverty statistics for married-couple families in Warren show that 0.2% or 3 of the total 1,536 families live below the poverty line. Families with no children have the highest poverty rate of 0.3%, comprising of 3 families. On the other hand, families with 1 or 2 children have the lowest poverty rate of 0.0%, which includes 0 families.
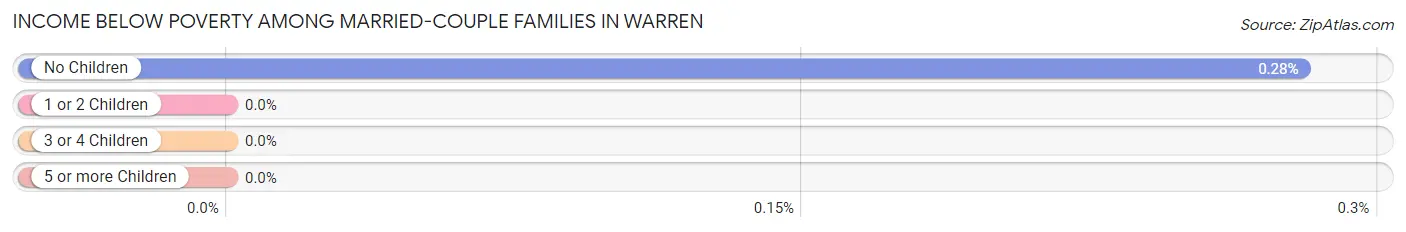
| Children | Above Poverty | Below Poverty |
| No Children | 1,066 (99.7%) | 3 (0.3%) |
| 1 or 2 Children | 431 (100.0%) | 0 (0.0%) |
| 3 or 4 Children | 36 (100.0%) | 0 (0.0%) |
| 5 or more Children | 0 (0.0%) | 0 (0.0%) |
| Total | 1,533 (99.8%) | 3 (0.2%) |
Income Below Poverty Among Single-Parent Households in Warren
According to the poverty data in Warren, 31.9% or 59 single-father households and 30.6% or 144 single-mother households are living below the poverty line. Among single-father households, those with 1 or 2 children have the highest poverty rate, with 46 households (33.6%) experiencing poverty. Likewise, among single-mother households, those with 3 or 4 children have the highest poverty rate, with 55 households (79.7%) falling below the poverty line.
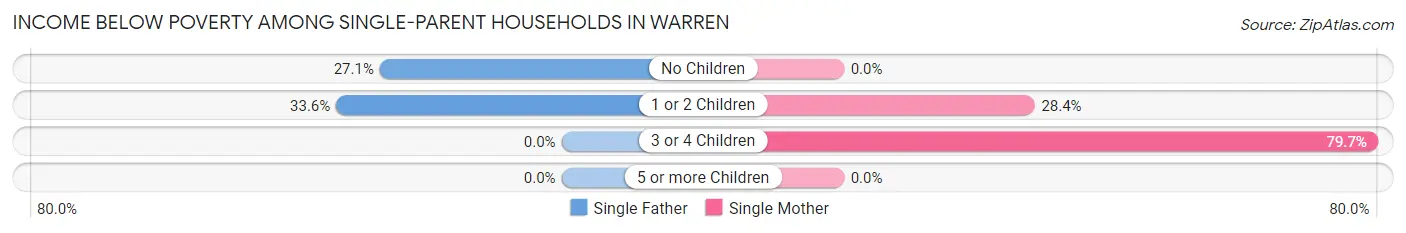
| Children | Single Father | Single Mother |
| No Children | 13 (27.1%) | 0 (0.0%) |
| 1 or 2 Children | 46 (33.6%) | 89 (28.4%) |
| 3 or 4 Children | 0 (0.0%) | 55 (79.7%) |
| 5 or more Children | 0 (0.0%) | 0 (0.0%) |
| Total | 59 (31.9%) | 144 (30.6%) |
Income Below Poverty Among Married-Couple vs Single-Parent Households in Warren
The poverty data for Warren shows that 3 of the married-couple family households (0.2%) and 203 of the single-parent households (30.9%) are living below the poverty level. Within the married-couple family households, those with no children have the highest poverty rate, with 3 households (0.3%) falling below the poverty line. Among the single-parent households, those with 3 or 4 children have the highest poverty rate, with 55 household (79.7%) living below poverty.
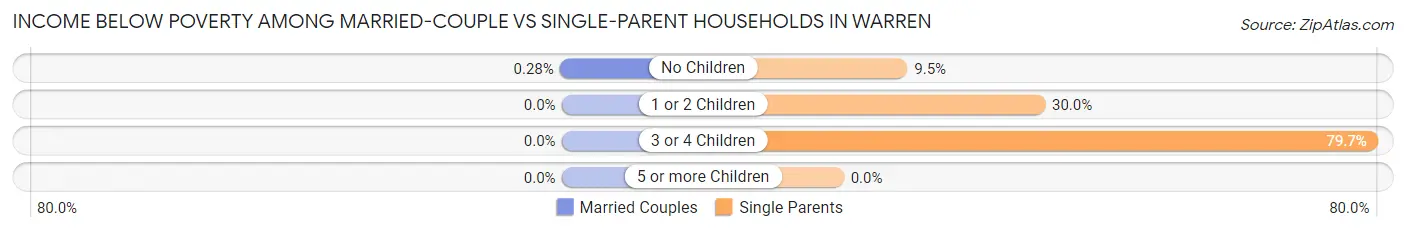
| Children | Married-Couple Families | Single-Parent Households |
| No Children | 3 (0.3%) | 13 (9.5%) |
| 1 or 2 Children | 0 (0.0%) | 135 (30.0%) |
| 3 or 4 Children | 0 (0.0%) | 55 (79.7%) |
| 5 or more Children | 0 (0.0%) | 0 (0.0%) |
| Total | 3 (0.2%) | 203 (30.9%) |
Race in Warren
The most populous races in Warren are White / Caucasian (8,915 | 95.3%), Black / African American (183 | 2.0%), and Two or more Races (124 | 1.3%).
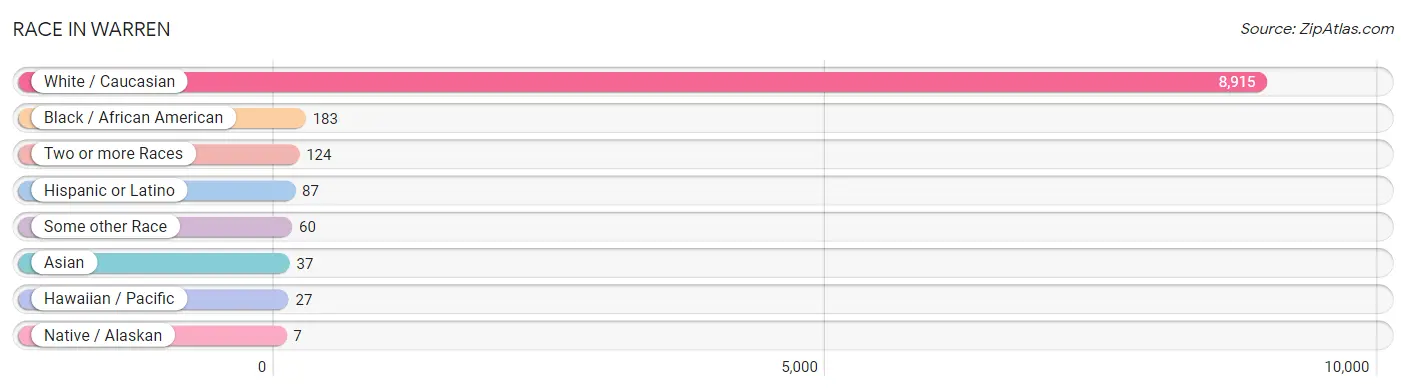
| Race | # Population | % Population |
| Asian | 37 | 0.4% |
| Black / African American | 183 | 2.0% |
| Hawaiian / Pacific | 27 | 0.3% |
| Hispanic or Latino | 87 | 0.9% |
| Native / Alaskan | 7 | 0.1% |
| White / Caucasian | 8,915 | 95.3% |
| Two or more Races | 124 | 1.3% |
| Some other Race | 60 | 0.6% |
| Total | 9,353 | 100.0% |
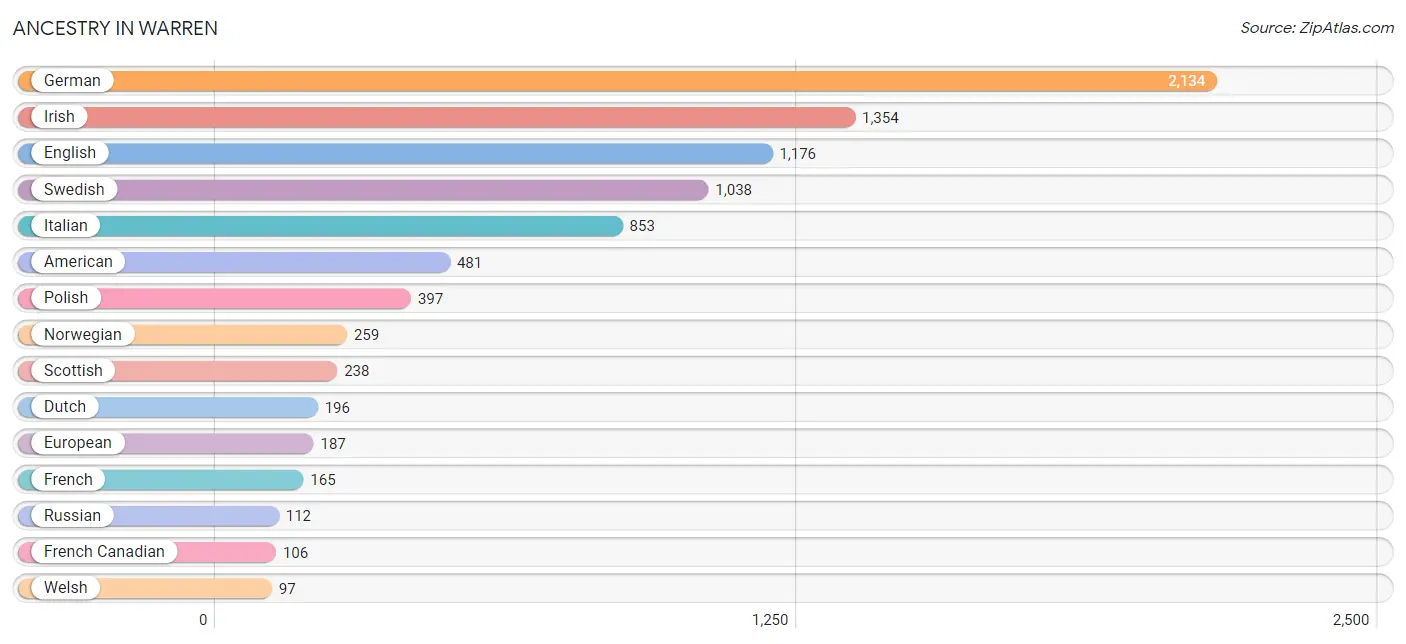
Ancestry in Warren
The most populous ancestries reported in Warren are German (2,134 | 22.8%), Irish (1,354 | 14.5%), English (1,176 | 12.6%), Swedish (1,038 | 11.1%), and Italian (853 | 9.1%), together accounting for 70.1% of all Warren residents.
| Ancestry | # Population | % Population |
| African | 8 | 0.1% |
| American | 481 | 5.1% |
| Arab | 17 | 0.2% |
| Austrian | 13 | 0.1% |
| Blackfeet | 10 | 0.1% |
| British | 22 | 0.2% |
| Canadian | 6 | 0.1% |
| Cherokee | 17 | 0.2% |
| Czechoslovakian | 9 | 0.1% |
| Danish | 89 | 0.9% |
| Dominican | 23 | 0.3% |
| Dutch | 196 | 2.1% |
| English | 1,176 | 12.6% |
| European | 187 | 2.0% |
| Finnish | 26 | 0.3% |
| French | 165 | 1.8% |
| French Canadian | 106 | 1.1% |
| German | 2,134 | 22.8% |
| Indian (Asian) | 1 | 0.0% |
| Irish | 1,354 | 14.5% |
| Italian | 853 | 9.1% |
| Korean | 17 | 0.2% |
| Lebanese | 17 | 0.2% |
| Malaysian | 10 | 0.1% |
| Mongolian | 9 | 0.1% |
| Native Hawaiian | 28 | 0.3% |
| Nigerian | 56 | 0.6% |
| Northern European | 31 | 0.3% |
| Norwegian | 259 | 2.8% |
| Polish | 397 | 4.2% |
| Puerto Rican | 64 | 0.7% |
| Romanian | 7 | 0.1% |
| Russian | 112 | 1.2% |
| Scandinavian | 70 | 0.7% |
| Scotch-Irish | 75 | 0.8% |
| Scottish | 238 | 2.5% |
| Serbian | 9 | 0.1% |
| Slovak | 54 | 0.6% |
| Slovene | 11 | 0.1% |
| Sri Lankan | 2 | 0.0% |
| Subsaharan African | 64 | 0.7% |
| Swedish | 1,038 | 11.1% |
| Swiss | 90 | 1.0% |
| Thai | 11 | 0.1% |
| Ukrainian | 5 | 0.1% |
| Welsh | 97 | 1.0% | View All 46 Rows |
Immigrants in Warren
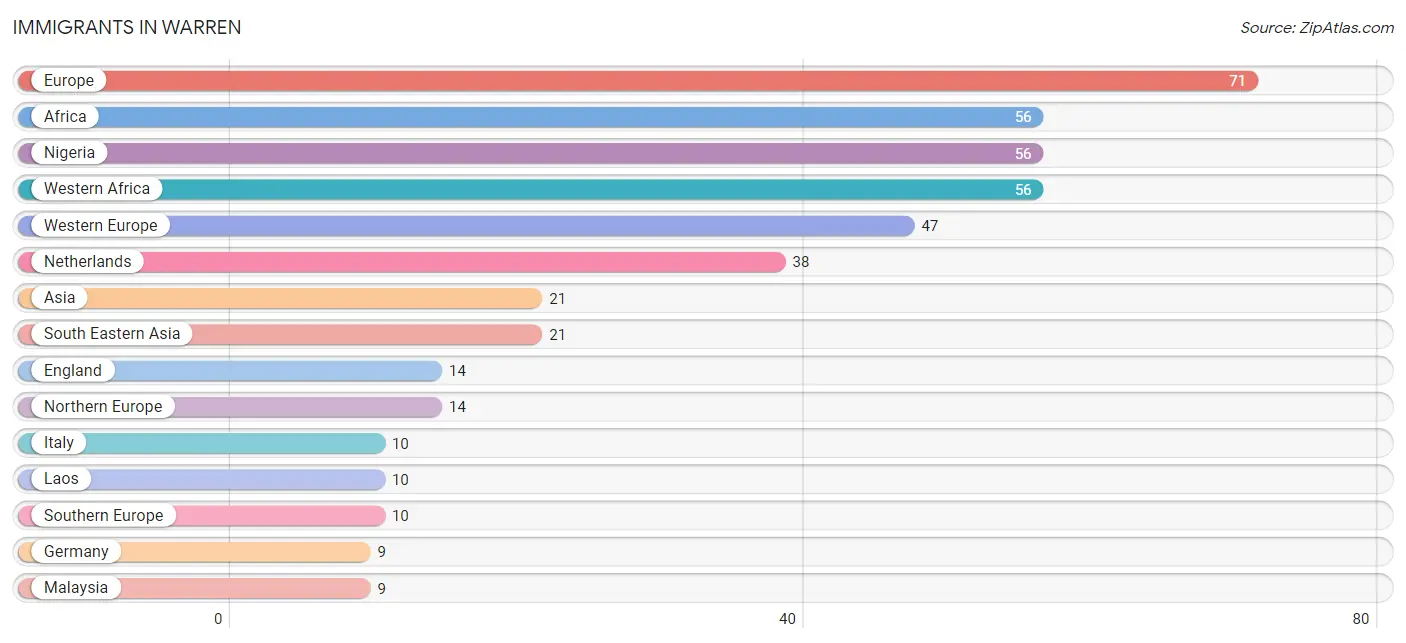
The most numerous immigrant groups reported in Warren came from Europe (71 | 0.8%), Africa (56 | 0.6%), Nigeria (56 | 0.6%), Western Africa (56 | 0.6%), and Western Europe (47 | 0.5%), together accounting for 3.1% of all Warren residents.
| Immigration Origin | # Population | % Population |
| Africa | 56 | 0.6% |
| Asia | 21 | 0.2% |
| England | 14 | 0.2% |
| Europe | 71 | 0.8% |
| Germany | 9 | 0.1% |
| Italy | 10 | 0.1% |
| Laos | 10 | 0.1% |
| Malaysia | 9 | 0.1% |
| Netherlands | 38 | 0.4% |
| Nigeria | 56 | 0.6% |
| Northern Europe | 14 | 0.2% |
| South Eastern Asia | 21 | 0.2% |
| Southern Europe | 10 | 0.1% |
| Vietnam | 2 | 0.0% |
| Western Africa | 56 | 0.6% |
| Western Europe | 47 | 0.5% | View All 16 Rows |
Sex and Age in Warren
Sex and Age in Warren
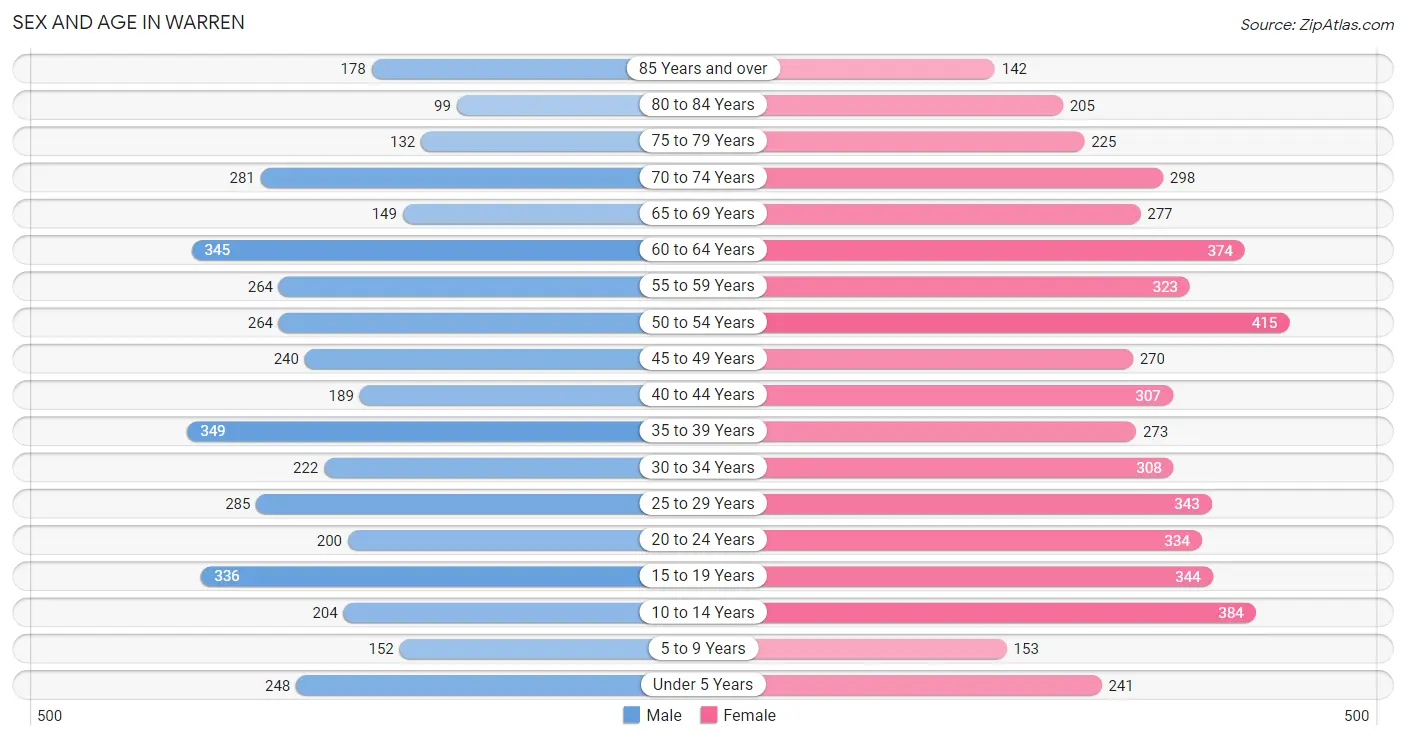
The most populous age groups in Warren are 35 to 39 Years (349 | 8.4%) for men and 50 to 54 Years (415 | 8.0%) for women.
| Age Bracket | Male | Female |
| Under 5 Years | 248 (6.0%) | 241 (4.6%) |
| 5 to 9 Years | 152 (3.7%) | 153 (2.9%) |
| 10 to 14 Years | 204 (4.9%) | 384 (7.4%) |
| 15 to 19 Years | 336 (8.1%) | 344 (6.6%) |
| 20 to 24 Years | 200 (4.8%) | 334 (6.4%) |
| 25 to 29 Years | 285 (6.9%) | 343 (6.6%) |
| 30 to 34 Years | 222 (5.4%) | 308 (5.9%) |
| 35 to 39 Years | 349 (8.4%) | 273 (5.2%) |
| 40 to 44 Years | 189 (4.6%) | 307 (5.9%) |
| 45 to 49 Years | 240 (5.8%) | 270 (5.2%) |
| 50 to 54 Years | 264 (6.4%) | 415 (8.0%) |
| 55 to 59 Years | 264 (6.4%) | 323 (6.2%) |
| 60 to 64 Years | 345 (8.3%) | 374 (7.2%) |
| 65 to 69 Years | 149 (3.6%) | 277 (5.3%) |
| 70 to 74 Years | 281 (6.8%) | 298 (5.7%) |
| 75 to 79 Years | 132 (3.2%) | 225 (4.3%) |
| 80 to 84 Years | 99 (2.4%) | 205 (3.9%) |
| 85 Years and over | 178 (4.3%) | 142 (2.7%) |
| Total | 4,137 (100.0%) | 5,216 (100.0%) |
Families and Households in Warren
Median Family Size in Warren
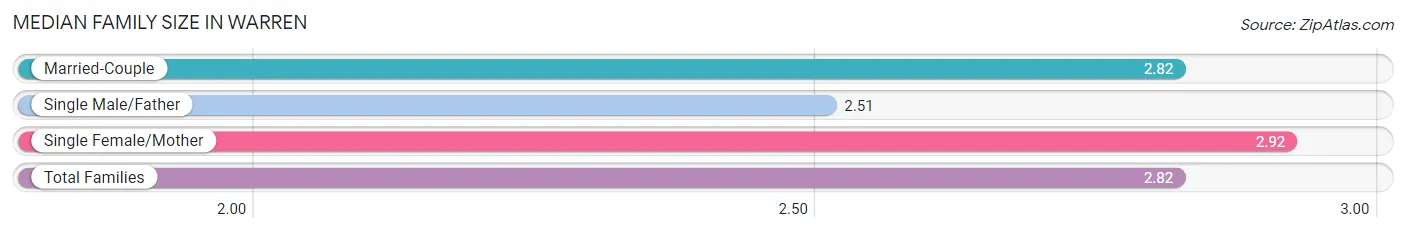
The median family size in Warren is 2.82 persons per family, with single female/mother families (471 | 21.5%) accounting for the largest median family size of 2.92 persons per family. On the other hand, single male/father families (185 | 8.4%) represent the smallest median family size with 2.51 persons per family.
| Family Type | # Families | Family Size |
| Married-Couple | 1,536 (70.1%) | 2.82 |
| Single Male/Father | 185 (8.4%) | 2.51 |
| Single Female/Mother | 471 (21.5%) | 2.92 |
| Total Families | 2,192 (100.0%) | 2.82 |
Median Household Size in Warren
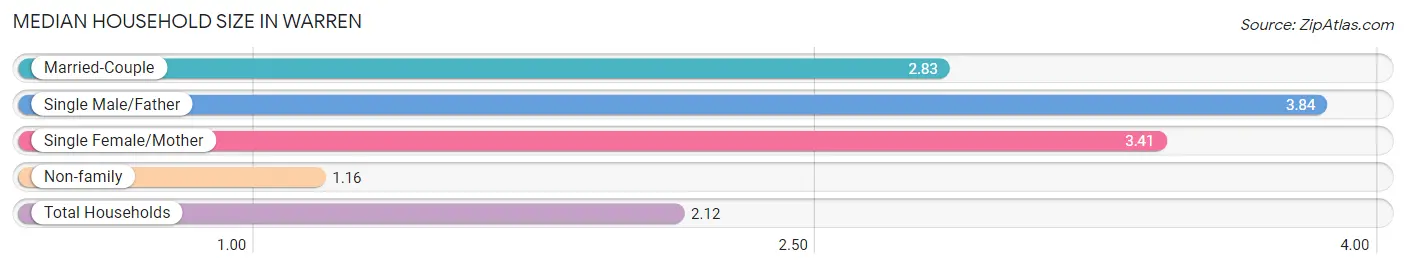
The median household size in Warren is 2.12 persons per household, with single male/father households (185 | 4.3%) accounting for the largest median household size of 3.84 persons per household. non-family households (2,111 | 49.1%) represent the smallest median household size with 1.16 persons per household.
| Household Type | # Households | Household Size |
| Married-Couple | 1,536 (35.7%) | 2.83 |
| Single Male/Father | 185 (4.3%) | 3.84 |
| Single Female/Mother | 471 (11.0%) | 3.41 |
| Non-family | 2,111 (49.1%) | 1.16 |
| Total Households | 4,303 (100.0%) | 2.12 |
Household Size by Marriage Status in Warren
Out of a total of 4,303 households in Warren, 2,192 (50.9%) are family households, while 2,111 (49.1%) are nonfamily households. The most numerous type of family households are 2-person households, comprising 1,221, and the most common type of nonfamily households are 1-person households, comprising 1,819.
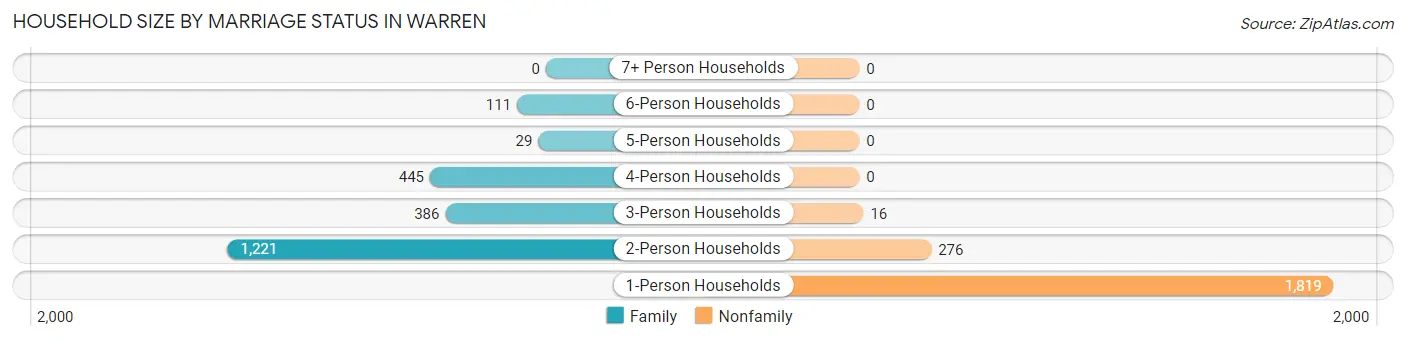
| Household Size | Family Households | Nonfamily Households |
| 1-Person Households | - | 1,819 (42.3%) |
| 2-Person Households | 1,221 (28.4%) | 276 (6.4%) |
| 3-Person Households | 386 (9.0%) | 16 (0.4%) |
| 4-Person Households | 445 (10.3%) | 0 (0.0%) |
| 5-Person Households | 29 (0.7%) | 0 (0.0%) |
| 6-Person Households | 111 (2.6%) | 0 (0.0%) |
| 7+ Person Households | 0 (0.0%) | 0 (0.0%) |
| Total | 2,192 (50.9%) | 2,111 (49.1%) |
Female Fertility in Warren
Fertility by Age in Warren
Average fertility rate in Warren is 24.0 births per 1,000 women. Women in the age bracket of 20 to 34 years have the highest fertility rate with 57.0 births per 1,000 women. Women in the age bracket of 20 to 34 years acount for 100.0% of all women with births.
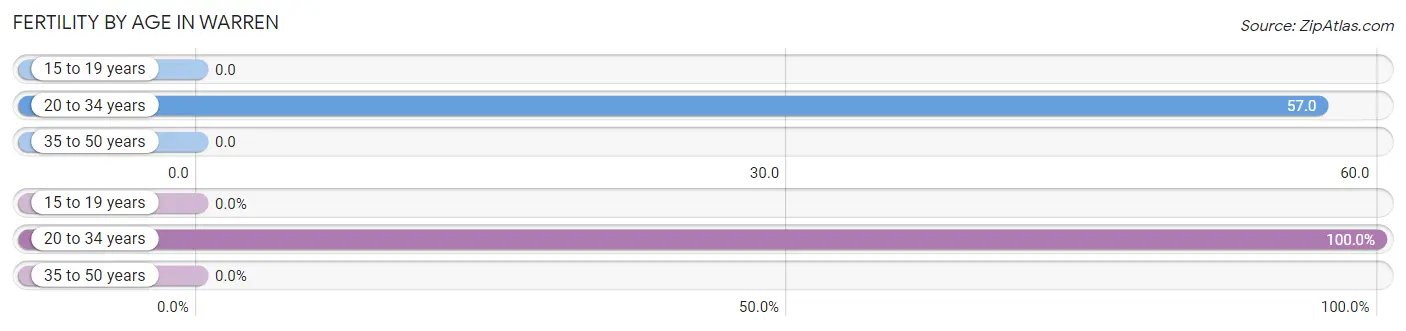
| Age Bracket | Women with Births | Births / 1,000 Women |
| 15 to 19 years | 0 (0.0%) | 0.0 |
| 20 to 34 years | 56 (100.0%) | 57.0 |
| 35 to 50 years | 0 (0.0%) | 0.0 |
| Total | 56 (100.0%) | 24.0 |
Fertility by Age by Marriage Status in Warren
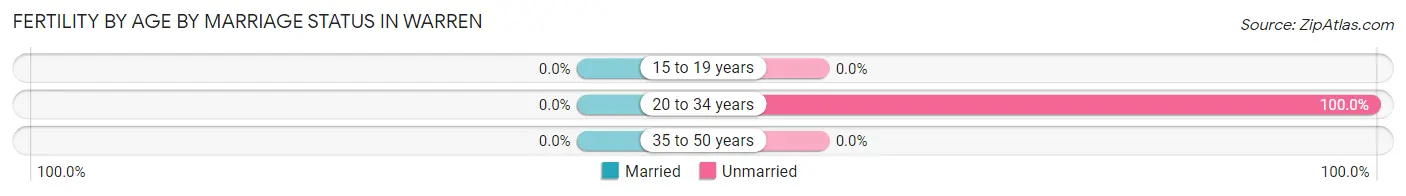
| Age Bracket | Married | Unmarried |
| 15 to 19 years | 0 (0.0%) | 0 (0.0%) |
| 20 to 34 years | 0 (0.0%) | 56 (100.0%) |
| 35 to 50 years | 0 (0.0%) | 0 (0.0%) |
| Total | 0 (0.0%) | 56 (100.0%) |
Fertility by Education in Warren
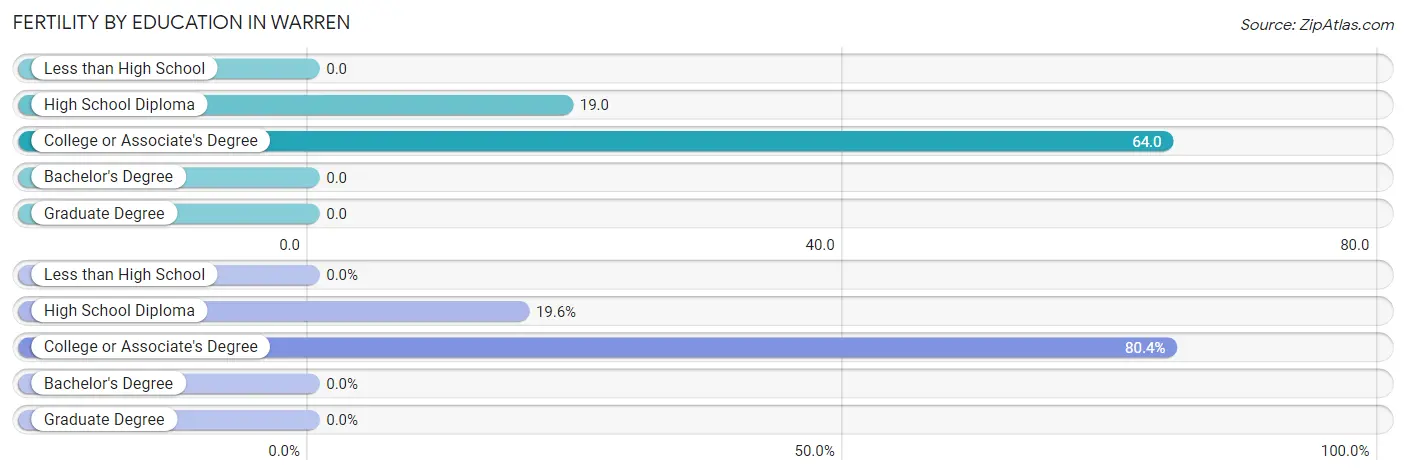
| Educational Attainment | Women with Births | Births / 1,000 Women |
| Less than High School | 0 (0.0%) | 0.0 |
| High School Diploma | 11 (19.6%) | 19.0 |
| College or Associate's Degree | 45 (80.4%) | 64.0 |
| Bachelor's Degree | 0 (0.0%) | 0.0 |
| Graduate Degree | 0 (0.0%) | 0.0 |
| Total | 56 (100.0%) | 24.0 |
Fertility by Education by Marriage Status in Warren
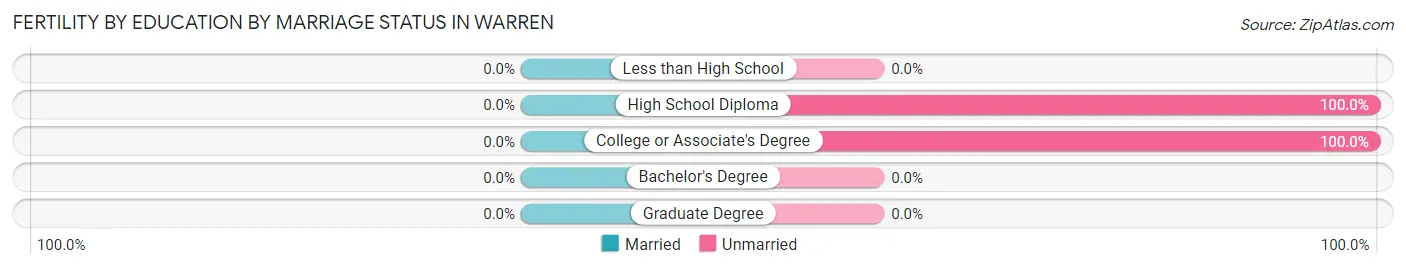
| Educational Attainment | Married | Unmarried |
| Less than High School | 0 (0.0%) | 0 (0.0%) |
| High School Diploma | 0 (0.0%) | 11 (100.0%) |
| College or Associate's Degree | 0 (0.0%) | 45 (100.0%) |
| Bachelor's Degree | 0 (0.0%) | 0 (0.0%) |
| Graduate Degree | 0 (0.0%) | 0 (0.0%) |
| Total | 0 (0.0%) | 56 (100.0%) |
Employment Characteristics in Warren
Employment by Class of Employer in Warren
Among the 4,416 employed individuals in Warren, private company employees (2,947 | 66.7%), not-for-profit organizations (505 | 11.4%), and federal government employees (218 | 4.9%) make up the most common classes of employment.
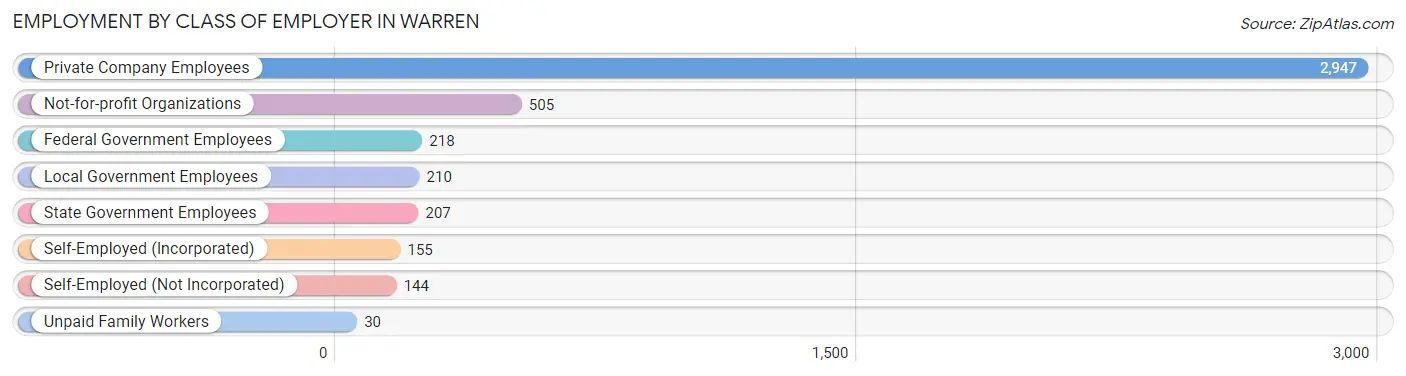
| Employer Class | # Employees | % Employees |
| Private Company Employees | 2,947 | 66.7% |
| Self-Employed (Incorporated) | 155 | 3.5% |
| Self-Employed (Not Incorporated) | 144 | 3.3% |
| Not-for-profit Organizations | 505 | 11.4% |
| Local Government Employees | 210 | 4.8% |
| State Government Employees | 207 | 4.7% |
| Federal Government Employees | 218 | 4.9% |
| Unpaid Family Workers | 30 | 0.7% |
| Total | 4,416 | 100.0% |
Employment Status by Age in Warren
According to the labor force statistics for Warren, out of the total population over 16 years of age (7,811), 59.8% or 4,671 individuals are in the labor force, with 3.2% or 149 of them unemployed. The age group with the highest labor force participation rate is 30 to 34 years, with 91.9% or 487 individuals in the labor force. Within the labor force, the 65 to 74 years age range has the highest percentage of unemployed individuals, with 8.0% or 13 of them being unemployed.
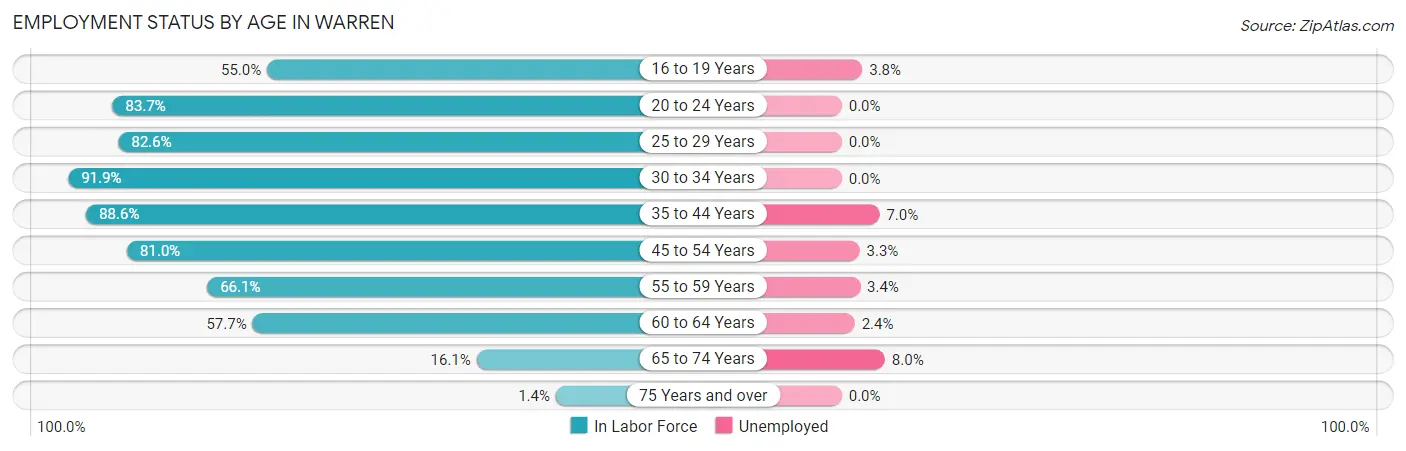
| Age Bracket | In Labor Force | Unemployed |
| 16 to 19 Years | 286 (55.0%) | 11 (3.8%) |
| 20 to 24 Years | 447 (83.7%) | 0 (0.0%) |
| 25 to 29 Years | 519 (82.6%) | 0 (0.0%) |
| 30 to 34 Years | 487 (91.9%) | 0 (0.0%) |
| 35 to 44 Years | 991 (88.6%) | 69 (7.0%) |
| 45 to 54 Years | 963 (81.0%) | 32 (3.3%) |
| 55 to 59 Years | 388 (66.1%) | 13 (3.4%) |
| 60 to 64 Years | 415 (57.7%) | 10 (2.4%) |
| 65 to 74 Years | 162 (16.1%) | 13 (8.0%) |
| 75 Years and over | 14 (1.4%) | 0 (0.0%) |
| Total | 4,671 (59.8%) | 149 (3.2%) |
Employment Status by Educational Attainment in Warren
According to labor force statistics for Warren, 78.9% of individuals (3,764) out of the total population between 25 and 64 years of age (4,771) are in the labor force, with 3.3% or 124 of them being unemployed. The group with the highest labor force participation rate are those with the educational attainment of bachelor's degree or higher, with 88.8% or 1,085 individuals in the labor force. Within the labor force, individuals with less than high school education have the highest percentage of unemployment, with 8.1% or 17 of them being unemployed.
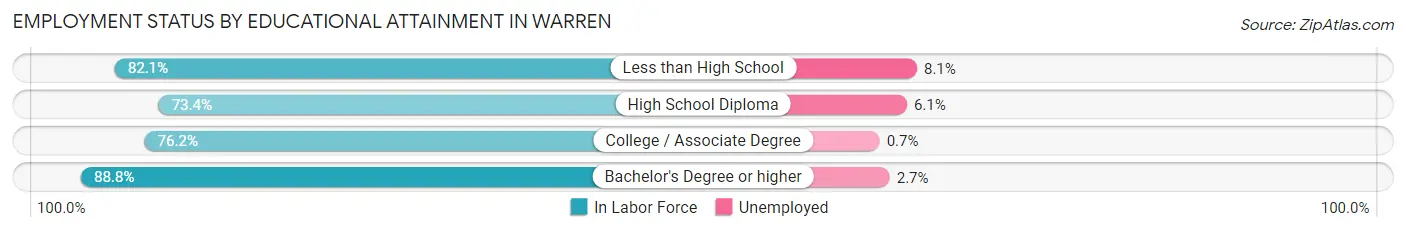
| Educational Attainment | In Labor Force | Unemployed |
| Less than High School | 211 (82.1%) | 21 (8.1%) |
| High School Diploma | 1,113 (73.4%) | 93 (6.1%) |
| College / Associate Degree | 1,353 (76.2%) | 12 (0.7%) |
| Bachelor's Degree or higher | 1,085 (88.8%) | 33 (2.7%) |
| Total | 3,764 (78.9%) | 157 (3.3%) |
Employment Occupations by Sex in Warren
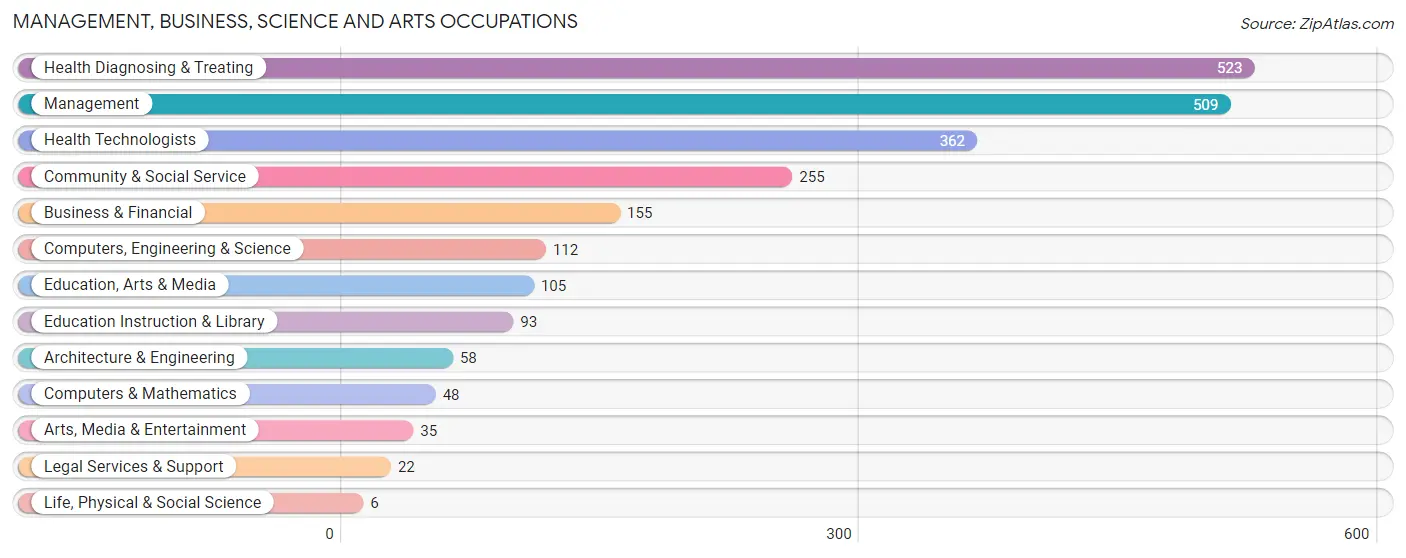
Management, Business, Science and Arts Occupations
The most common Management, Business, Science and Arts occupations in Warren are Health Diagnosing & Treating (523 | 11.6%), Management (509 | 11.3%), Health Technologists (362 | 8.0%), Community & Social Service (255 | 5.6%), and Business & Financial (155 | 3.4%).
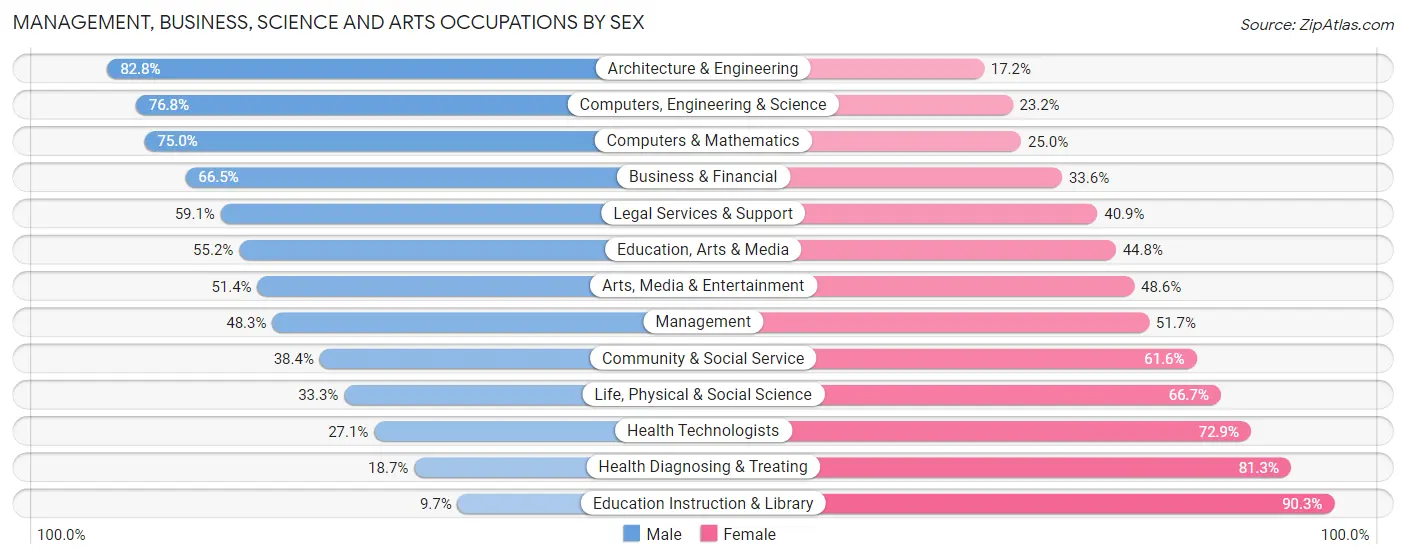
Management, Business, Science and Arts Occupations by Sex
Within the Management, Business, Science and Arts occupations in Warren, the most male-oriented occupations are Architecture & Engineering (82.8%), Computers, Engineering & Science (76.8%), and Computers & Mathematics (75.0%), while the most female-oriented occupations are Education Instruction & Library (90.3%), Health Diagnosing & Treating (81.3%), and Health Technologists (72.9%).
| Occupation | Male | Female |
| Management | 246 (48.3%) | 263 (51.7%) |
| Business & Financial | 103 (66.4%) | 52 (33.6%) |
| Computers, Engineering & Science | 86 (76.8%) | 26 (23.2%) |
| Computers & Mathematics | 36 (75.0%) | 12 (25.0%) |
| Architecture & Engineering | 48 (82.8%) | 10 (17.2%) |
| Life, Physical & Social Science | 2 (33.3%) | 4 (66.7%) |
| Community & Social Service | 98 (38.4%) | 157 (61.6%) |
| Education, Arts & Media | 58 (55.2%) | 47 (44.8%) |
| Legal Services & Support | 13 (59.1%) | 9 (40.9%) |
| Education Instruction & Library | 9 (9.7%) | 84 (90.3%) |
| Arts, Media & Entertainment | 18 (51.4%) | 17 (48.6%) |
| Health Diagnosing & Treating | 98 (18.7%) | 425 (81.3%) |
| Health Technologists | 98 (27.1%) | 264 (72.9%) |
| Total (Category) | 631 (40.6%) | 923 (59.4%) |
| Total (Overall) | 2,194 (48.5%) | 2,330 (51.5%) |
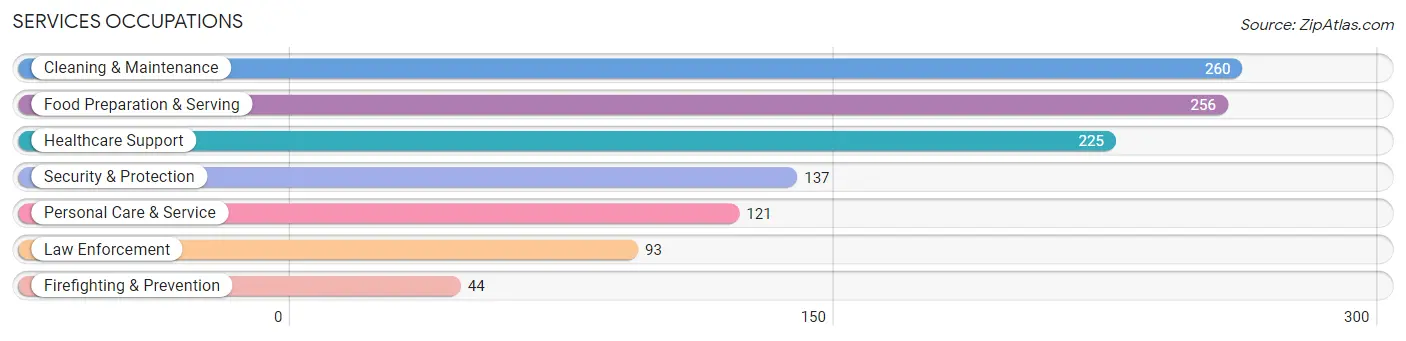
Services Occupations
The most common Services occupations in Warren are Cleaning & Maintenance (260 | 5.8%), Food Preparation & Serving (256 | 5.7%), Healthcare Support (225 | 5.0%), Security & Protection (137 | 3.0%), and Personal Care & Service (121 | 2.7%).
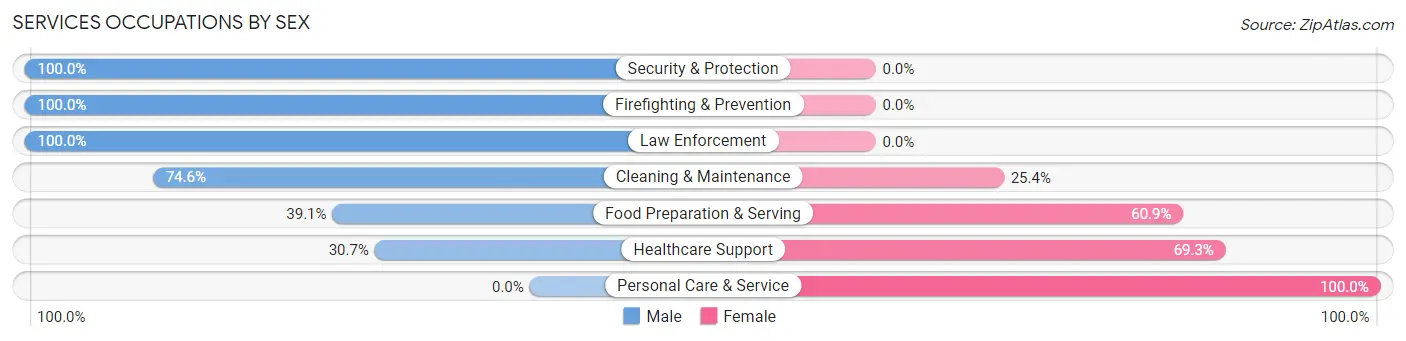
Services Occupations by Sex
Within the Services occupations in Warren, the most male-oriented occupations are Security & Protection (100.0%), Firefighting & Prevention (100.0%), and Law Enforcement (100.0%), while the most female-oriented occupations are Personal Care & Service (100.0%), Healthcare Support (69.3%), and Food Preparation & Serving (60.9%).
| Occupation | Male | Female |
| Healthcare Support | 69 (30.7%) | 156 (69.3%) |
| Security & Protection | 137 (100.0%) | 0 (0.0%) |
| Firefighting & Prevention | 44 (100.0%) | 0 (0.0%) |
| Law Enforcement | 93 (100.0%) | 0 (0.0%) |
| Food Preparation & Serving | 100 (39.1%) | 156 (60.9%) |
| Cleaning & Maintenance | 194 (74.6%) | 66 (25.4%) |
| Personal Care & Service | 0 (0.0%) | 121 (100.0%) |
| Total (Category) | 500 (50.0%) | 499 (49.9%) |
| Total (Overall) | 2,194 (48.5%) | 2,330 (51.5%) |
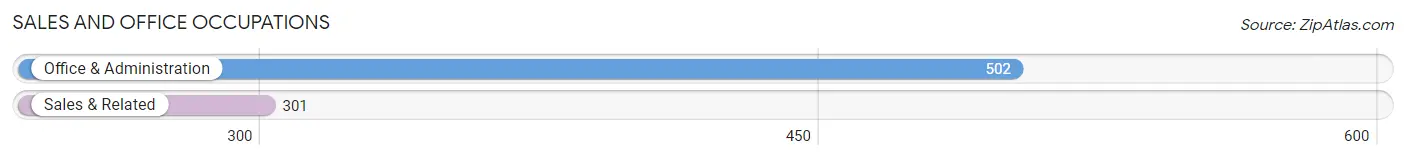
Sales and Office Occupations
The most common Sales and Office occupations in Warren are Office & Administration (502 | 11.1%), and Sales & Related (301 | 6.7%).
Sales and Office Occupations by Sex
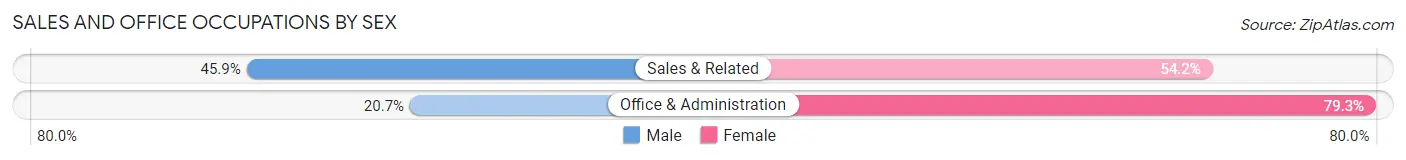
| Occupation | Male | Female |
| Sales & Related | 138 (45.9%) | 163 (54.1%) |
| Office & Administration | 104 (20.7%) | 398 (79.3%) |
| Total (Category) | 242 (30.1%) | 561 (69.9%) |
| Total (Overall) | 2,194 (48.5%) | 2,330 (51.5%) |
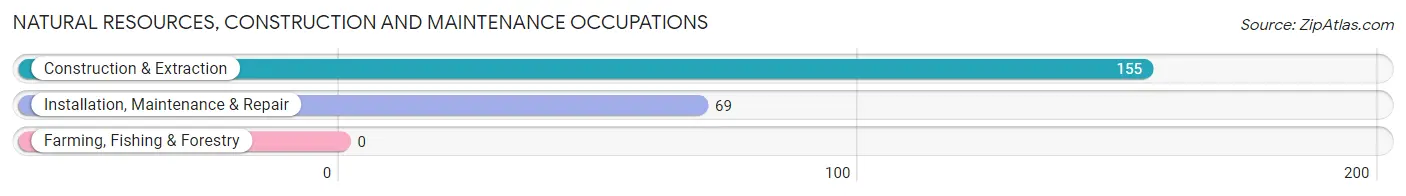
Natural Resources, Construction and Maintenance Occupations
The most common Natural Resources, Construction and Maintenance occupations in Warren are Construction & Extraction (155 | 3.4%), and Installation, Maintenance & Repair (69 | 1.5%).
Natural Resources, Construction and Maintenance Occupations by Sex
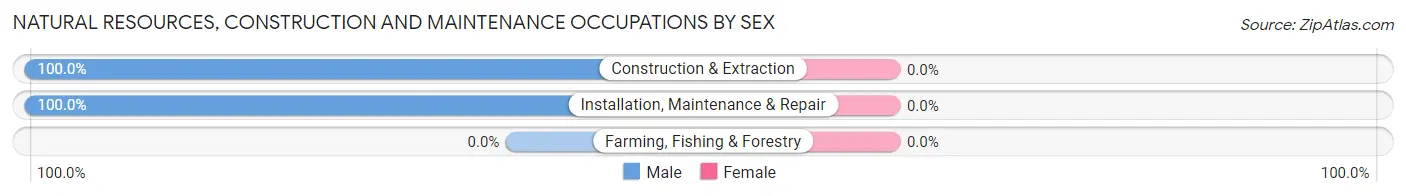
| Occupation | Male | Female |
| Farming, Fishing & Forestry | 0 (0.0%) | 0 (0.0%) |
| Construction & Extraction | 155 (100.0%) | 0 (0.0%) |
| Installation, Maintenance & Repair | 69 (100.0%) | 0 (0.0%) |
| Total (Category) | 224 (100.0%) | 0 (0.0%) |
| Total (Overall) | 2,194 (48.5%) | 2,330 (51.5%) |
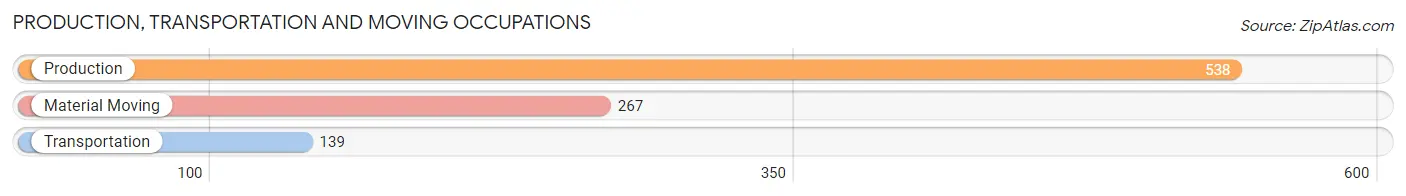
Production, Transportation and Moving Occupations
The most common Production, Transportation and Moving occupations in Warren are Production (538 | 11.9%), Material Moving (267 | 5.9%), and Transportation (139 | 3.1%).
Production, Transportation and Moving Occupations by Sex
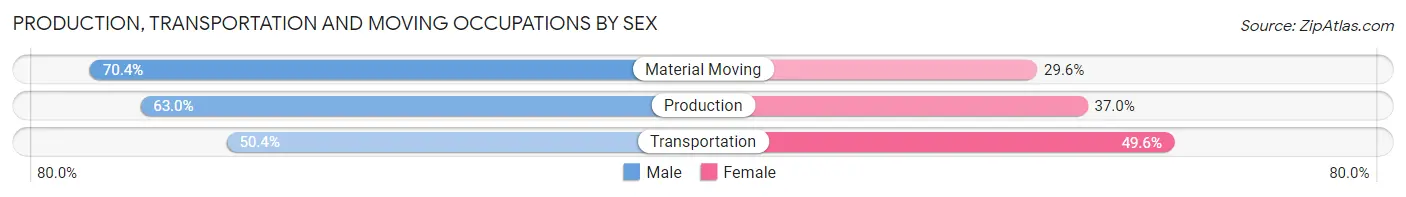
| Occupation | Male | Female |
| Production | 339 (63.0%) | 199 (37.0%) |
| Transportation | 70 (50.4%) | 69 (49.6%) |
| Material Moving | 188 (70.4%) | 79 (29.6%) |
| Total (Category) | 597 (63.2%) | 347 (36.8%) |
| Total (Overall) | 2,194 (48.5%) | 2,330 (51.5%) |
Employment Industries by Sex in Warren
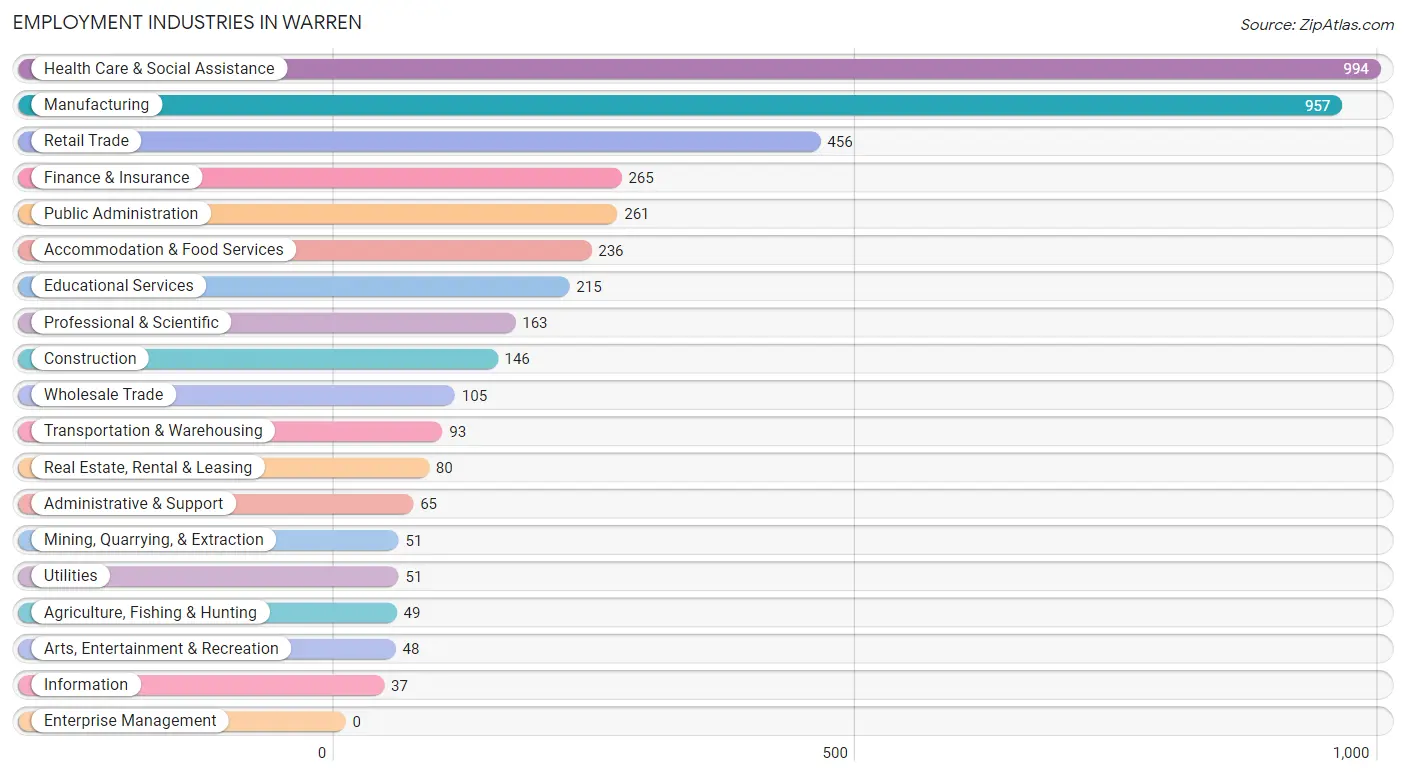
Employment Industries in Warren
The major employment industries in Warren include Health Care & Social Assistance (994 | 22.0%), Manufacturing (957 | 21.1%), Retail Trade (456 | 10.1%), Finance & Insurance (265 | 5.9%), and Public Administration (261 | 5.8%).
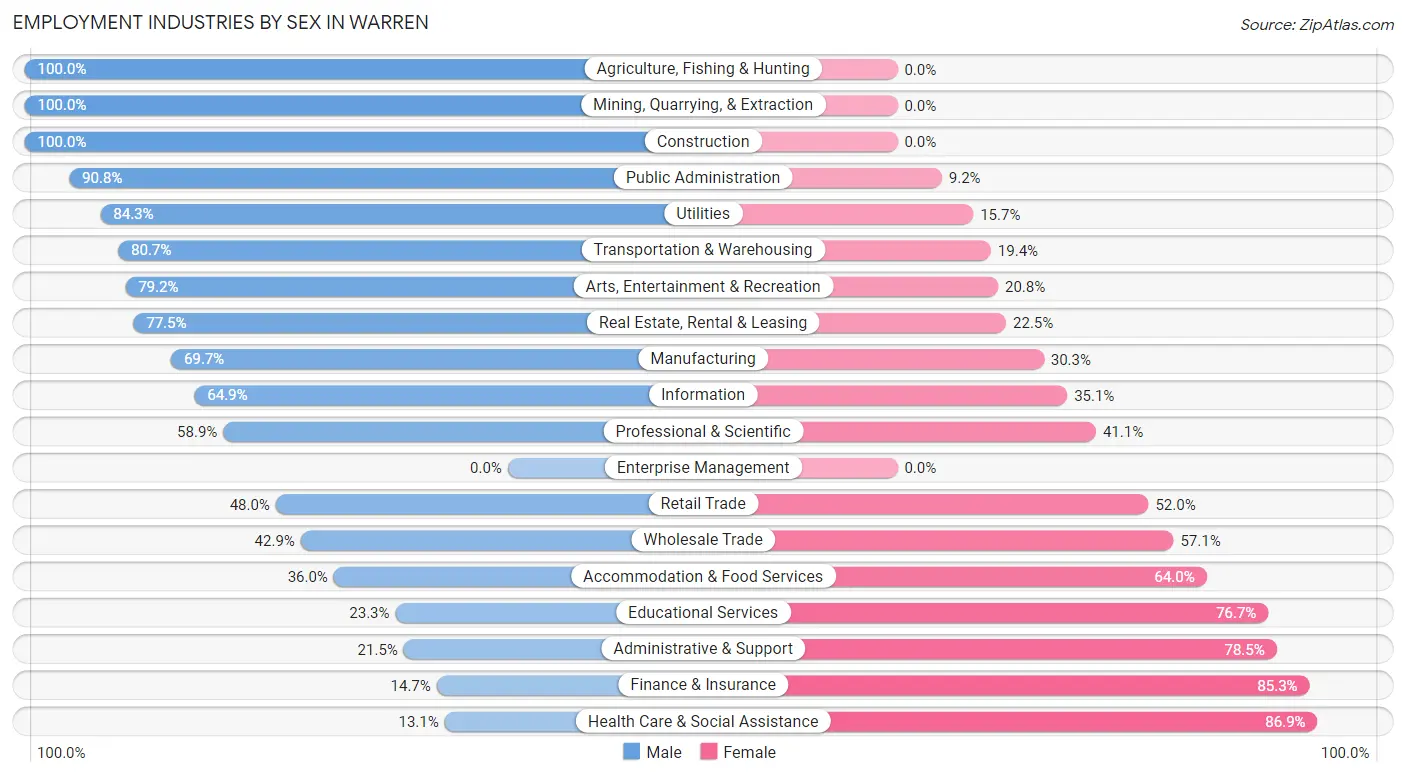
Employment Industries by Sex in Warren
The Warren industries that see more men than women are Agriculture, Fishing & Hunting (100.0%), Mining, Quarrying, & Extraction (100.0%), and Construction (100.0%), whereas the industries that tend to have a higher number of women are Health Care & Social Assistance (86.9%), Finance & Insurance (85.3%), and Administrative & Support (78.5%).
| Industry | Male | Female |
| Agriculture, Fishing & Hunting | 49 (100.0%) | 0 (0.0%) |
| Mining, Quarrying, & Extraction | 51 (100.0%) | 0 (0.0%) |
| Construction | 146 (100.0%) | 0 (0.0%) |
| Manufacturing | 667 (69.7%) | 290 (30.3%) |
| Wholesale Trade | 45 (42.9%) | 60 (57.1%) |
| Retail Trade | 219 (48.0%) | 237 (52.0%) |
| Transportation & Warehousing | 75 (80.6%) | 18 (19.4%) |
| Utilities | 43 (84.3%) | 8 (15.7%) |
| Information | 24 (64.9%) | 13 (35.1%) |
| Finance & Insurance | 39 (14.7%) | 226 (85.3%) |
| Real Estate, Rental & Leasing | 62 (77.5%) | 18 (22.5%) |
| Professional & Scientific | 96 (58.9%) | 67 (41.1%) |
| Enterprise Management | 0 (0.0%) | 0 (0.0%) |
| Administrative & Support | 14 (21.5%) | 51 (78.5%) |
| Educational Services | 50 (23.3%) | 165 (76.7%) |
| Health Care & Social Assistance | 130 (13.1%) | 864 (86.9%) |
| Arts, Entertainment & Recreation | 38 (79.2%) | 10 (20.8%) |
| Accommodation & Food Services | 85 (36.0%) | 151 (64.0%) |
| Public Administration | 237 (90.8%) | 24 (9.2%) |
| Total | 2,194 (48.5%) | 2,330 (51.5%) |
Education in Warren
School Enrollment in Warren
The most common levels of schooling among the 1,860 students in Warren are high school (611 | 32.9%), middle school (512 | 27.5%), and elementary school (313 | 16.8%).
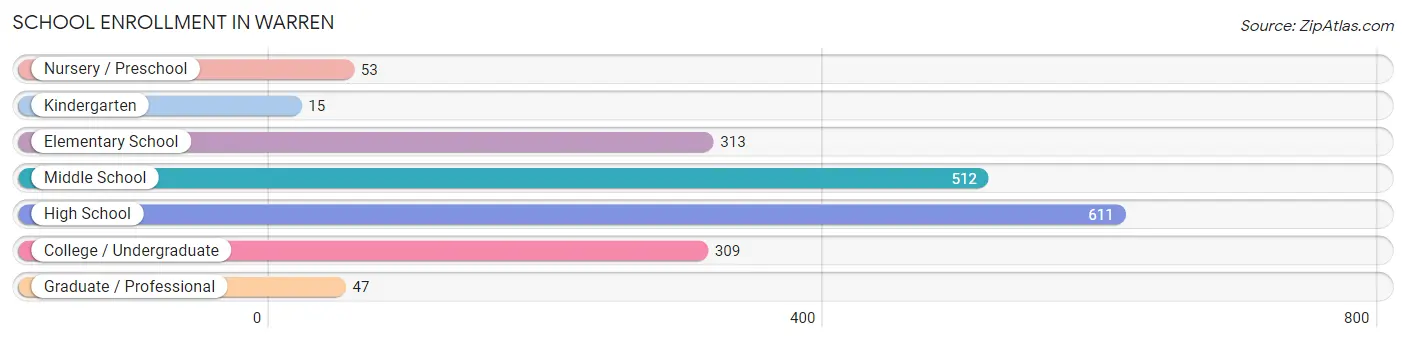
| School Level | # Students | % Students |
| Nursery / Preschool | 53 | 2.9% |
| Kindergarten | 15 | 0.8% |
| Elementary School | 313 | 16.8% |
| Middle School | 512 | 27.5% |
| High School | 611 | 32.9% |
| College / Undergraduate | 309 | 16.6% |
| Graduate / Professional | 47 | 2.5% |
| Total | 1,860 | 100.0% |
School Enrollment by Age by Funding Source in Warren
Out of a total of 1,860 students who are enrolled in schools in Warren, 307 (16.5%) attend a private institution, while the remaining 1,553 (83.5%) are enrolled in public schools. The age group of 3 to 4 year olds has the highest likelihood of being enrolled in private schools, with 15 (100.0% in the age bracket) enrolled. Conversely, the age group of 10 to 14 year olds has the lowest likelihood of being enrolled in a private school, with 547 (95.0% in the age bracket) attending a public institution.
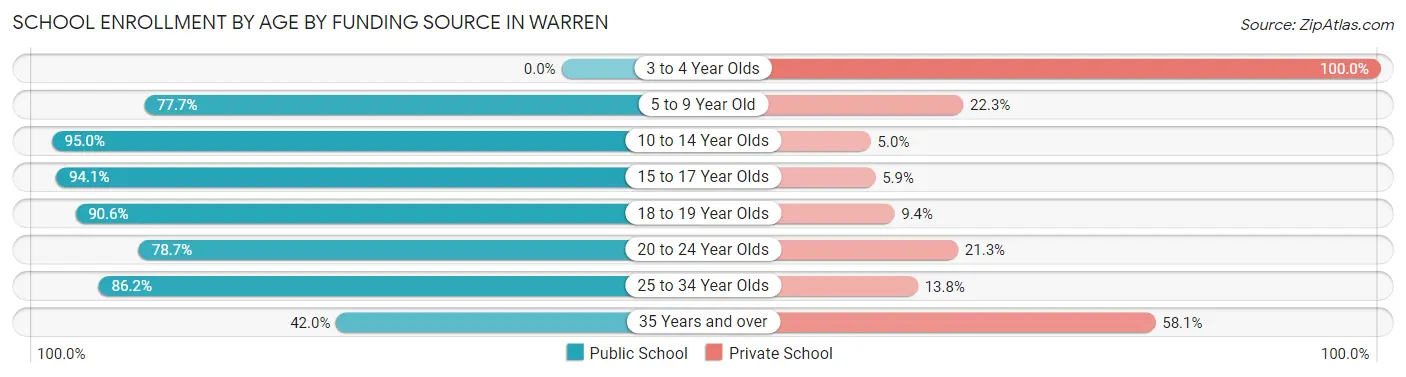
| Age Bracket | Public School | Private School |
| 3 to 4 Year Olds | 0 (0.0%) | 15 (100.0%) |
| 5 to 9 Year Old | 227 (77.7%) | 65 (22.3%) |
| 10 to 14 Year Olds | 547 (95.0%) | 29 (5.0%) |
| 15 to 17 Year Olds | 449 (94.1%) | 28 (5.9%) |
| 18 to 19 Year Olds | 144 (90.6%) | 15 (9.4%) |
| 20 to 24 Year Olds | 37 (78.7%) | 10 (21.3%) |
| 25 to 34 Year Olds | 50 (86.2%) | 8 (13.8%) |
| 35 Years and over | 99 (41.9%) | 137 (58.1%) |
| Total | 1,553 (83.5%) | 307 (16.5%) |
Educational Attainment by Field of Study in Warren
Education (340 | 18.4%), business (307 | 16.6%), science & technology (216 | 11.7%), arts & humanities (167 | 9.0%), and communications (117 | 6.3%) are the most common fields of study among 1,845 individuals in Warren who have obtained a bachelor's degree or higher.
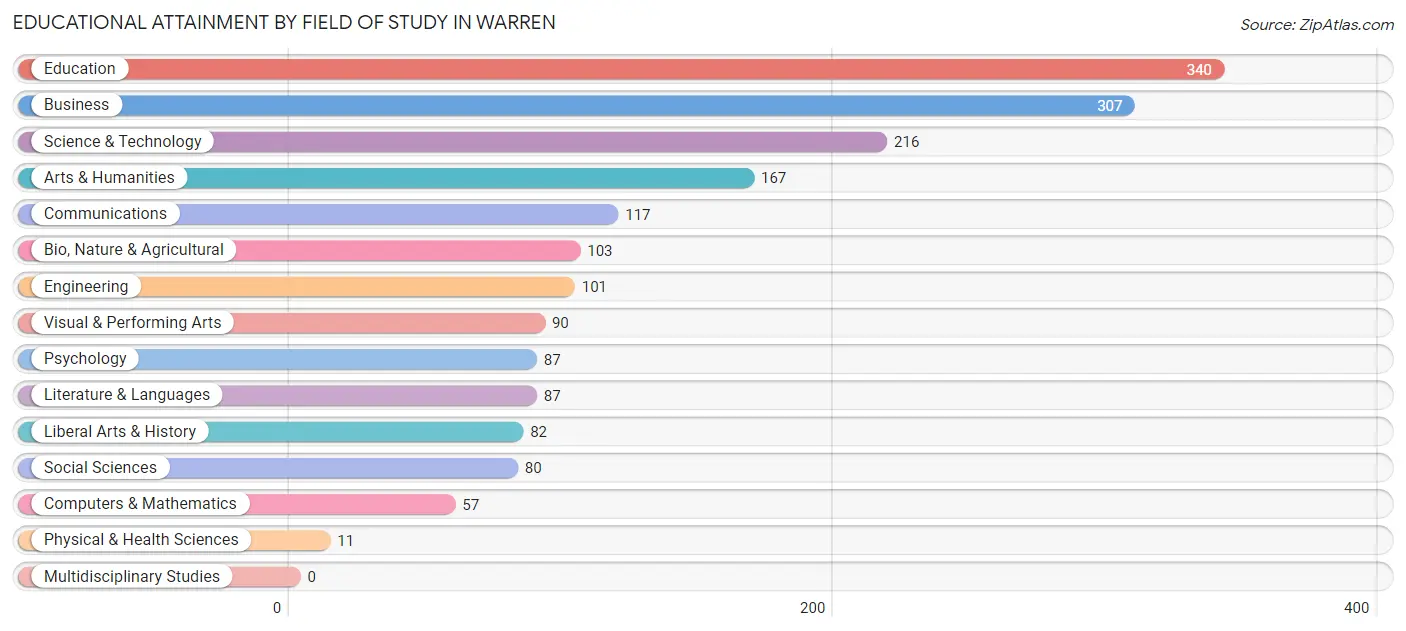
| Field of Study | # Graduates | % Graduates |
| Computers & Mathematics | 57 | 3.1% |
| Bio, Nature & Agricultural | 103 | 5.6% |
| Physical & Health Sciences | 11 | 0.6% |
| Psychology | 87 | 4.7% |
| Social Sciences | 80 | 4.3% |
| Engineering | 101 | 5.5% |
| Multidisciplinary Studies | 0 | 0.0% |
| Science & Technology | 216 | 11.7% |
| Business | 307 | 16.6% |
| Education | 340 | 18.4% |
| Literature & Languages | 87 | 4.7% |
| Liberal Arts & History | 82 | 4.4% |
| Visual & Performing Arts | 90 | 4.9% |
| Communications | 117 | 6.3% |
| Arts & Humanities | 167 | 9.0% |
| Total | 1,845 | 100.0% |
Transportation & Commute in Warren
Vehicle Availability by Sex in Warren
The most prevalent vehicle ownership categories in Warren are males with 2 vehicles (833, accounting for 38.3%) and females with 2 vehicles (722, making up 37.3%).
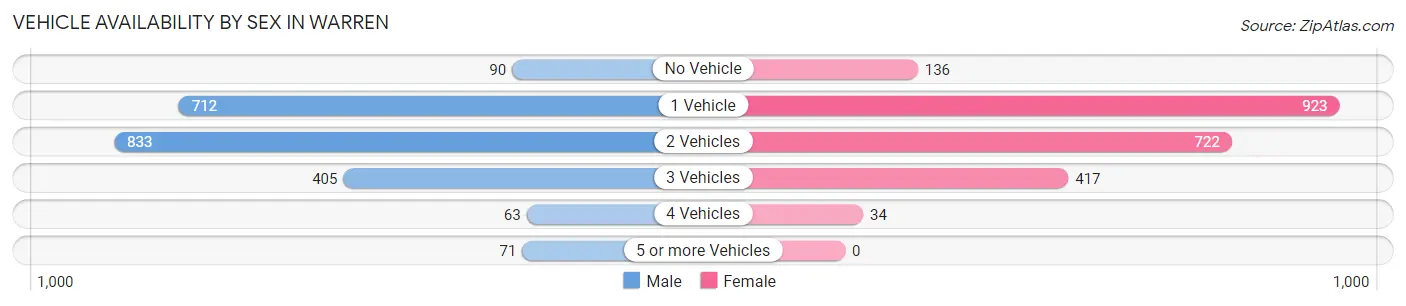
| Vehicles Available | Male | Female |
| No Vehicle | 90 (4.1%) | 136 (6.1%) |
| 1 Vehicle | 712 (32.8%) | 923 (41.3%) |
| 2 Vehicles | 833 (38.3%) | 722 (32.4%) |
| 3 Vehicles | 405 (18.6%) | 417 (18.7%) |
| 4 Vehicles | 63 (2.9%) | 34 (1.5%) |
| 5 or more Vehicles | 71 (3.3%) | 0 (0.0%) |
| Total | 2,174 (100.0%) | 2,232 (100.0%) |
Commute Time in Warren
The most frequently occuring commute durations in Warren are 5 to 9 minutes (1,425 commuters, 33.3%), 15 to 19 minutes (909 commuters, 21.2%), and 10 to 14 minutes (818 commuters, 19.1%).
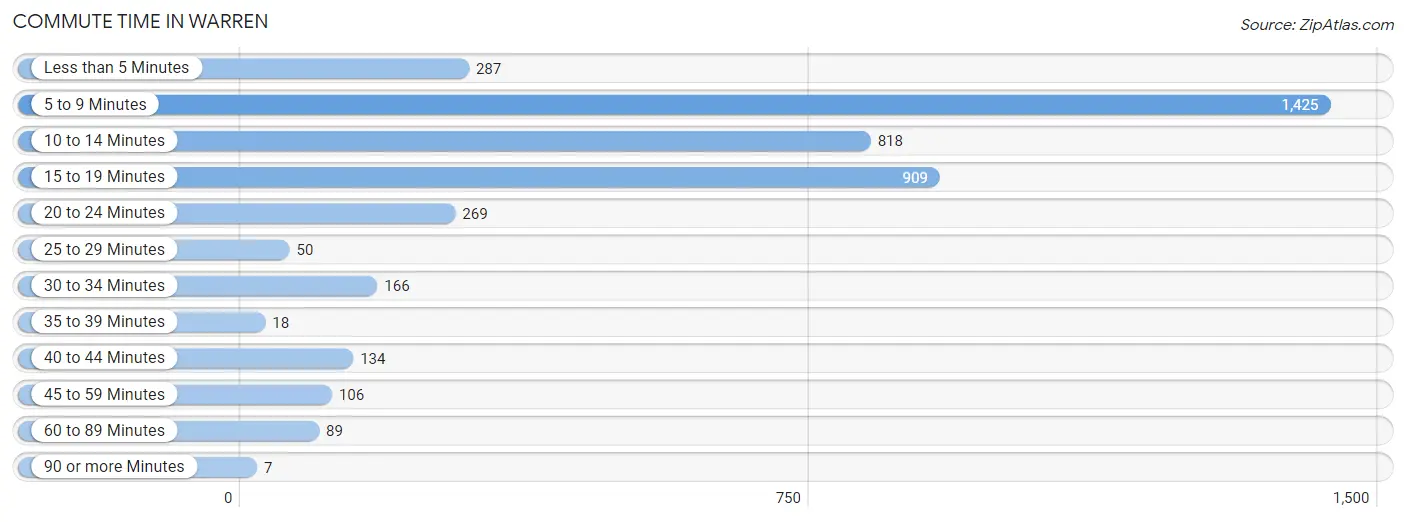
| Commute Time | # Commuters | % Commuters |
| Less than 5 Minutes | 287 | 6.7% |
| 5 to 9 Minutes | 1,425 | 33.3% |
| 10 to 14 Minutes | 818 | 19.1% |
| 15 to 19 Minutes | 909 | 21.2% |
| 20 to 24 Minutes | 269 | 6.3% |
| 25 to 29 Minutes | 50 | 1.2% |
| 30 to 34 Minutes | 166 | 3.9% |
| 35 to 39 Minutes | 18 | 0.4% |
| 40 to 44 Minutes | 134 | 3.1% |
| 45 to 59 Minutes | 106 | 2.5% |
| 60 to 89 Minutes | 89 | 2.1% |
| 90 or more Minutes | 7 | 0.2% |
Commute Time by Sex in Warren
The most common commute times in Warren are 5 to 9 minutes (657 commuters, 30.7%) for males and 5 to 9 minutes (768 commuters, 35.9%) for females.
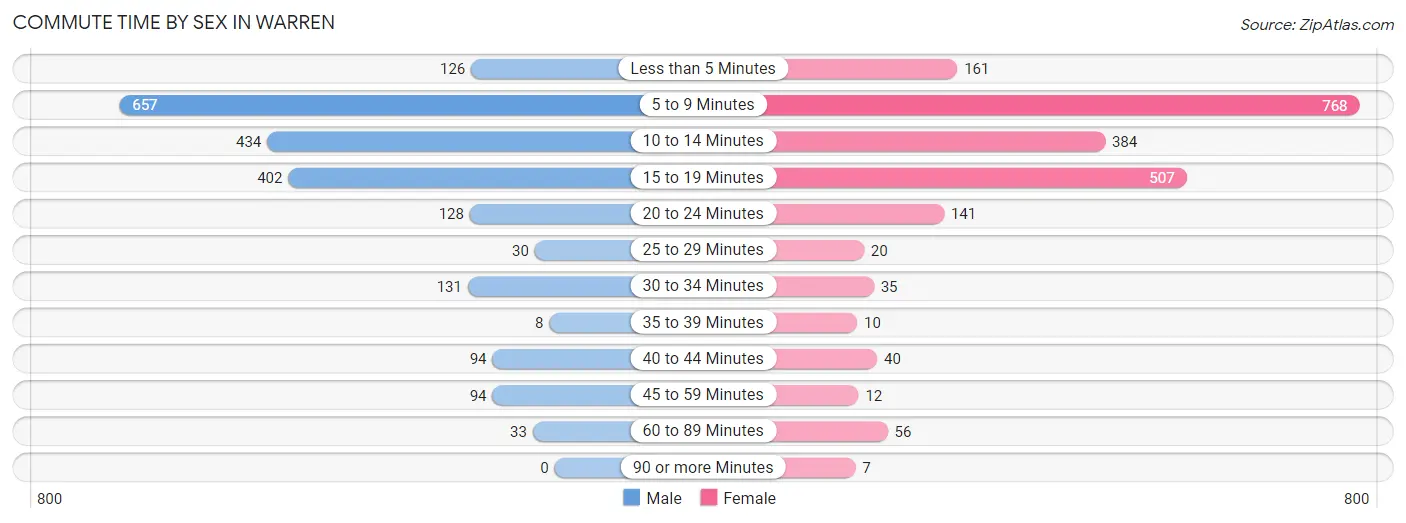
| Commute Time | Male | Female |
| Less than 5 Minutes | 126 (5.9%) | 161 (7.5%) |
| 5 to 9 Minutes | 657 (30.7%) | 768 (35.9%) |
| 10 to 14 Minutes | 434 (20.3%) | 384 (17.9%) |
| 15 to 19 Minutes | 402 (18.8%) | 507 (23.7%) |
| 20 to 24 Minutes | 128 (6.0%) | 141 (6.6%) |
| 25 to 29 Minutes | 30 (1.4%) | 20 (0.9%) |
| 30 to 34 Minutes | 131 (6.1%) | 35 (1.6%) |
| 35 to 39 Minutes | 8 (0.4%) | 10 (0.5%) |
| 40 to 44 Minutes | 94 (4.4%) | 40 (1.9%) |
| 45 to 59 Minutes | 94 (4.4%) | 12 (0.6%) |
| 60 to 89 Minutes | 33 (1.5%) | 56 (2.6%) |
| 90 or more Minutes | 0 (0.0%) | 7 (0.3%) |
Time of Departure to Work by Sex in Warren
The most frequent times of departure to work in Warren are 6:30 AM to 6:59 AM (449, 21.0%) for males and 12:00 PM to 3:59 PM (367, 17.1%) for females.
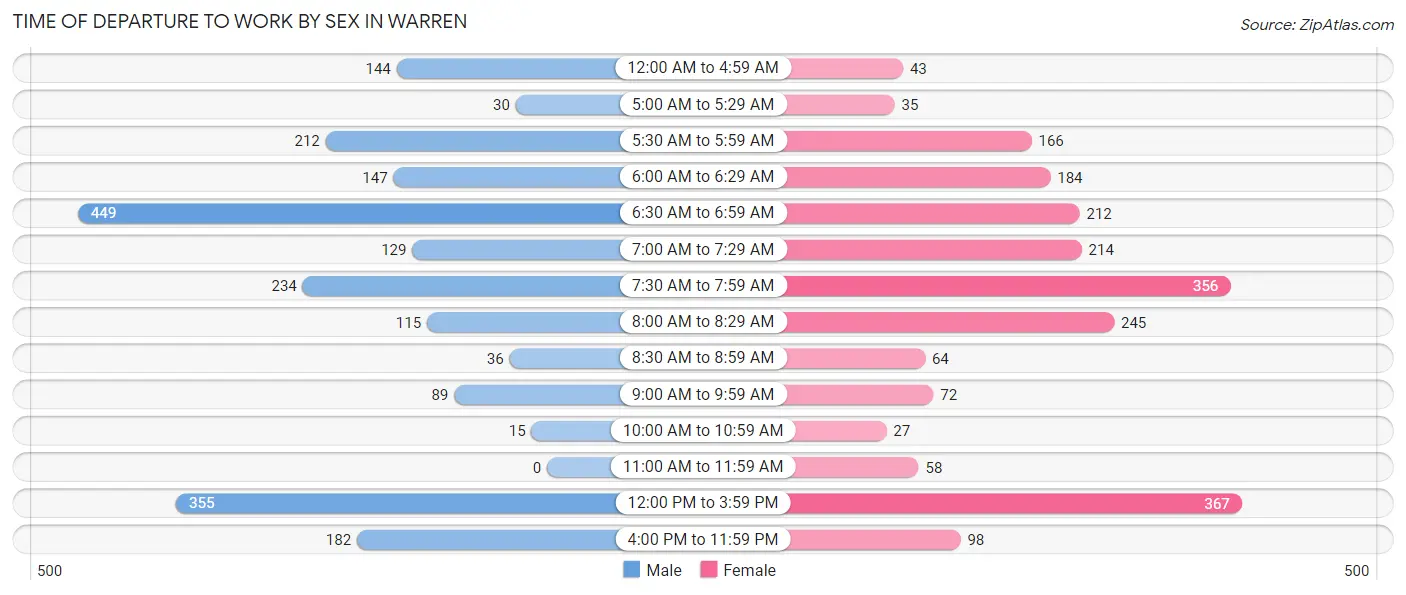
| Time of Departure | Male | Female |
| 12:00 AM to 4:59 AM | 144 (6.7%) | 43 (2.0%) |
| 5:00 AM to 5:29 AM | 30 (1.4%) | 35 (1.6%) |
| 5:30 AM to 5:59 AM | 212 (9.9%) | 166 (7.7%) |
| 6:00 AM to 6:29 AM | 147 (6.9%) | 184 (8.6%) |
| 6:30 AM to 6:59 AM | 449 (21.0%) | 212 (9.9%) |
| 7:00 AM to 7:29 AM | 129 (6.0%) | 214 (10.0%) |
| 7:30 AM to 7:59 AM | 234 (11.0%) | 356 (16.6%) |
| 8:00 AM to 8:29 AM | 115 (5.4%) | 245 (11.4%) |
| 8:30 AM to 8:59 AM | 36 (1.7%) | 64 (3.0%) |
| 9:00 AM to 9:59 AM | 89 (4.2%) | 72 (3.4%) |
| 10:00 AM to 10:59 AM | 15 (0.7%) | 27 (1.3%) |
| 11:00 AM to 11:59 AM | 0 (0.0%) | 58 (2.7%) |
| 12:00 PM to 3:59 PM | 355 (16.6%) | 367 (17.1%) |
| 4:00 PM to 11:59 PM | 182 (8.5%) | 98 (4.6%) |
| Total | 2,137 (100.0%) | 2,141 (100.0%) |
Housing Occupancy in Warren
Occupancy by Ownership in Warren
Of the total 4,303 dwellings in Warren, owner-occupied units account for 2,506 (58.2%), while renter-occupied units make up 1,797 (41.8%).
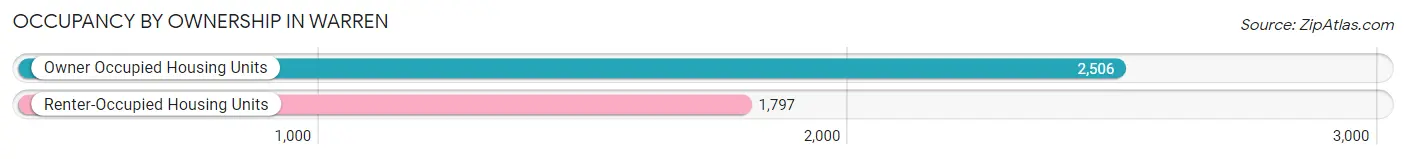
| Occupancy | # Housing Units | % Housing Units |
| Owner Occupied Housing Units | 2,506 | 58.2% |
| Renter-Occupied Housing Units | 1,797 | 41.8% |
| Total Occupied Housing Units | 4,303 | 100.0% |
Occupancy by Household Size in Warren
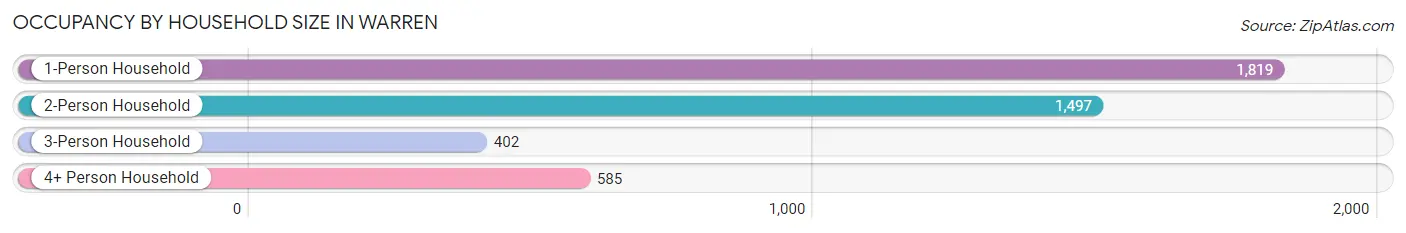
| Household Size | # Housing Units | % Housing Units |
| 1-Person Household | 1,819 | 42.3% |
| 2-Person Household | 1,497 | 34.8% |
| 3-Person Household | 402 | 9.3% |
| 4+ Person Household | 585 | 13.6% |
| Total Housing Units | 4,303 | 100.0% |
Occupancy by Ownership by Household Size in Warren
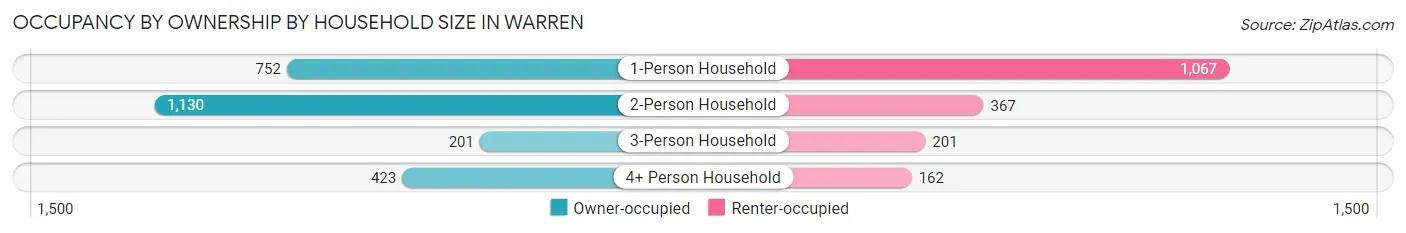
| Household Size | Owner-occupied | Renter-occupied |
| 1-Person Household | 752 (41.3%) | 1,067 (58.7%) |
| 2-Person Household | 1,130 (75.5%) | 367 (24.5%) |
| 3-Person Household | 201 (50.0%) | 201 (50.0%) |
| 4+ Person Household | 423 (72.3%) | 162 (27.7%) |
| Total Housing Units | 2,506 (58.2%) | 1,797 (41.8%) |
Occupancy by Educational Attainment in Warren
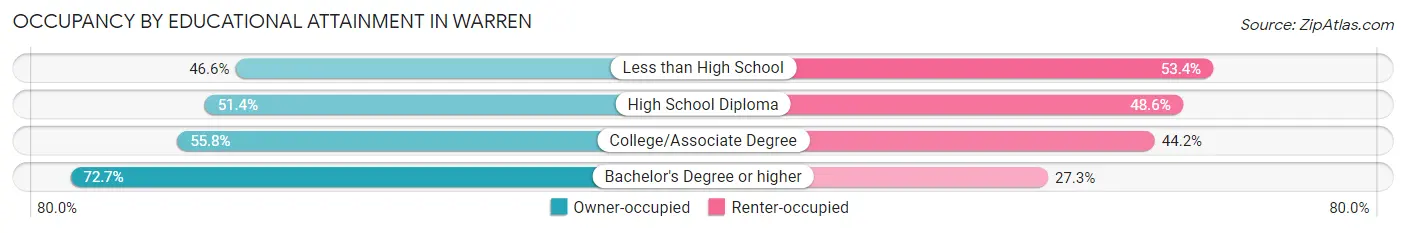
| Household Size | Owner-occupied | Renter-occupied |
| Less than High School | 82 (46.6%) | 94 (53.4%) |
| High School Diploma | 794 (51.4%) | 750 (48.6%) |
| College/Associate Degree | 819 (55.8%) | 649 (44.2%) |
| Bachelor's Degree or higher | 811 (72.7%) | 304 (27.3%) |
Occupancy by Age of Householder in Warren
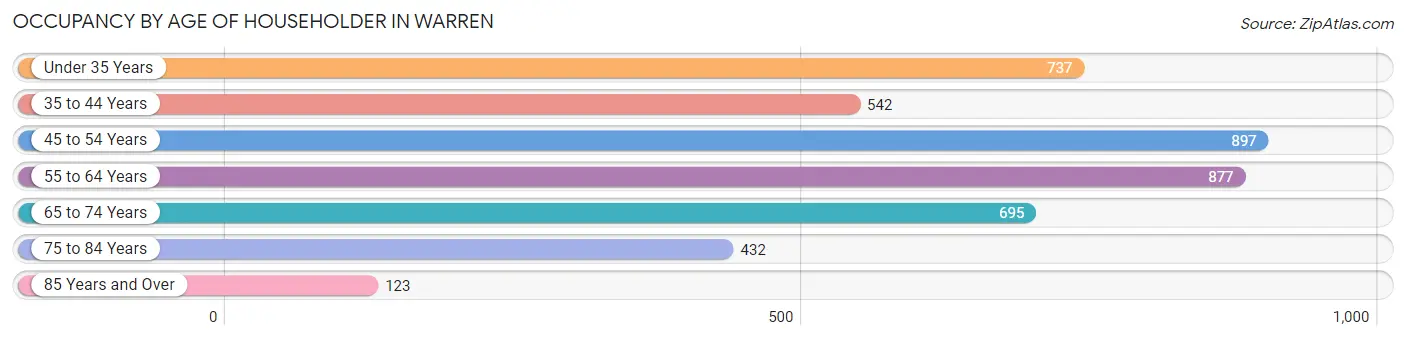
| Age Bracket | # Households | % Households |
| Under 35 Years | 737 | 17.1% |
| 35 to 44 Years | 542 | 12.6% |
| 45 to 54 Years | 897 | 20.8% |
| 55 to 64 Years | 877 | 20.4% |
| 65 to 74 Years | 695 | 16.2% |
| 75 to 84 Years | 432 | 10.0% |
| 85 Years and Over | 123 | 2.9% |
| Total | 4,303 | 100.0% |
Housing Finances in Warren
Median Income by Occupancy in Warren
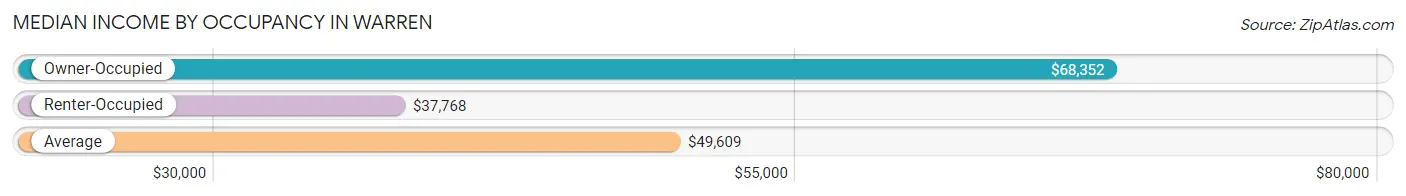
| Occupancy Type | # Households | Median Income |
| Owner-Occupied | 2,506 (58.2%) | $68,352 |
| Renter-Occupied | 1,797 (41.8%) | $37,768 |
| Average | 4,303 (100.0%) | $49,609 |
Occupancy by Householder Income Bracket in Warren
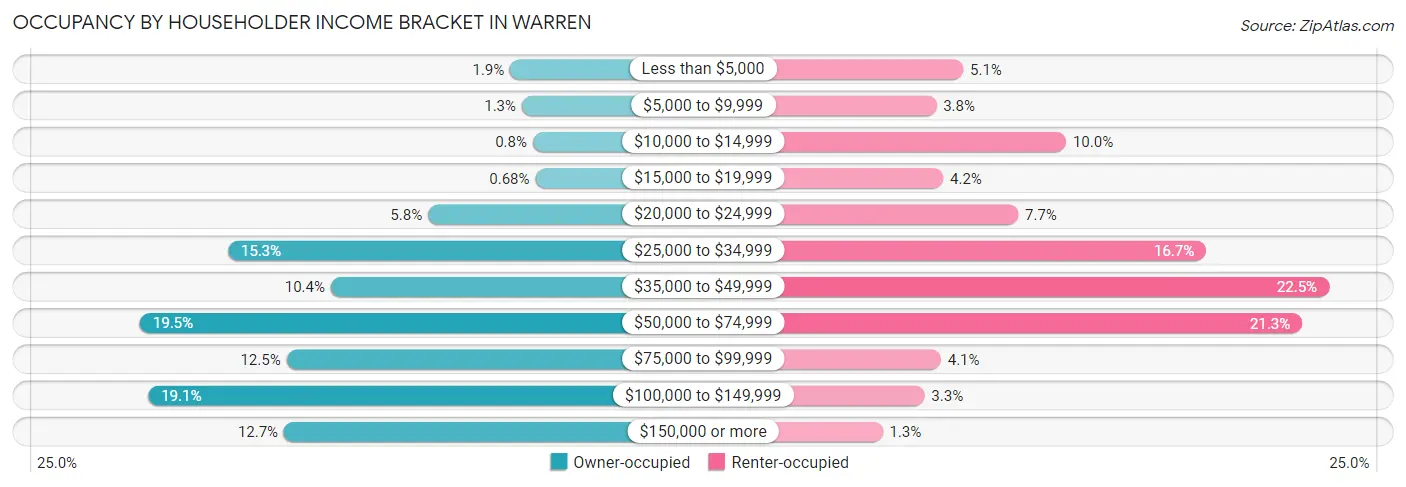
| Income Bracket | Owner-occupied | Renter-occupied |
| Less than $5,000 | 47 (1.9%) | 92 (5.1%) |
| $5,000 to $9,999 | 33 (1.3%) | 69 (3.8%) |
| $10,000 to $14,999 | 20 (0.8%) | 180 (10.0%) |
| $15,000 to $19,999 | 17 (0.7%) | 75 (4.2%) |
| $20,000 to $24,999 | 145 (5.8%) | 139 (7.7%) |
| $25,000 to $34,999 | 384 (15.3%) | 300 (16.7%) |
| $35,000 to $49,999 | 261 (10.4%) | 405 (22.5%) |
| $50,000 to $74,999 | 489 (19.5%) | 382 (21.3%) |
| $75,000 to $99,999 | 314 (12.5%) | 73 (4.1%) |
| $100,000 to $149,999 | 479 (19.1%) | 59 (3.3%) |
| $150,000 or more | 317 (12.7%) | 23 (1.3%) |
| Total | 2,506 (100.0%) | 1,797 (100.0%) |
Monthly Housing Cost Tiers in Warren
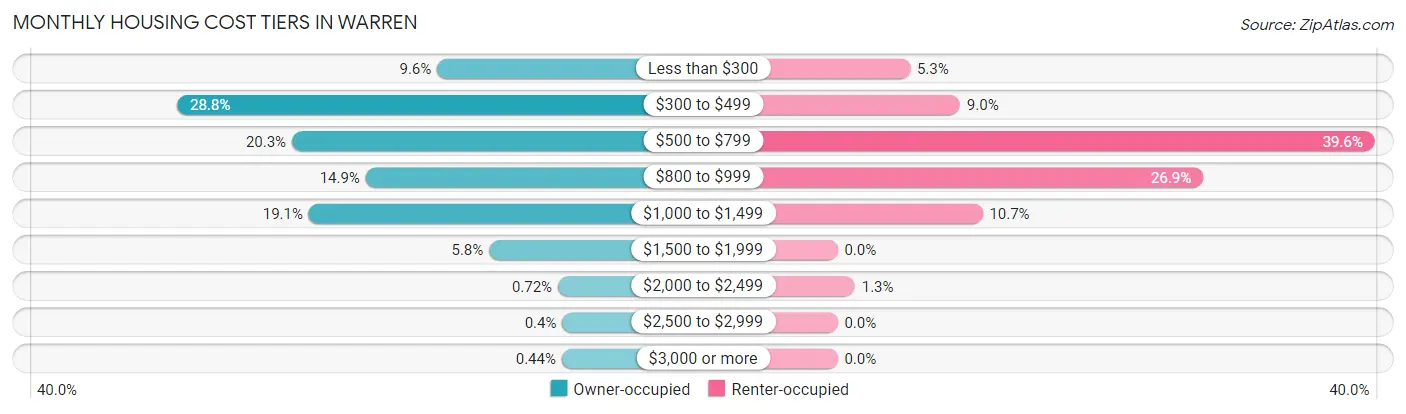
| Monthly Cost | Owner-occupied | Renter-occupied |
| Less than $300 | 241 (9.6%) | 96 (5.3%) |
| $300 to $499 | 721 (28.8%) | 162 (9.0%) |
| $500 to $799 | 509 (20.3%) | 711 (39.6%) |
| $800 to $999 | 373 (14.9%) | 484 (26.9%) |
| $1,000 to $1,499 | 478 (19.1%) | 192 (10.7%) |
| $1,500 to $1,999 | 145 (5.8%) | 0 (0.0%) |
| $2,000 to $2,499 | 18 (0.7%) | 23 (1.3%) |
| $2,500 to $2,999 | 10 (0.4%) | 0 (0.0%) |
| $3,000 or more | 11 (0.4%) | 0 (0.0%) |
| Total | 2,506 (100.0%) | 1,797 (100.0%) |
Physical Housing Characteristics in Warren
Housing Structures in Warren
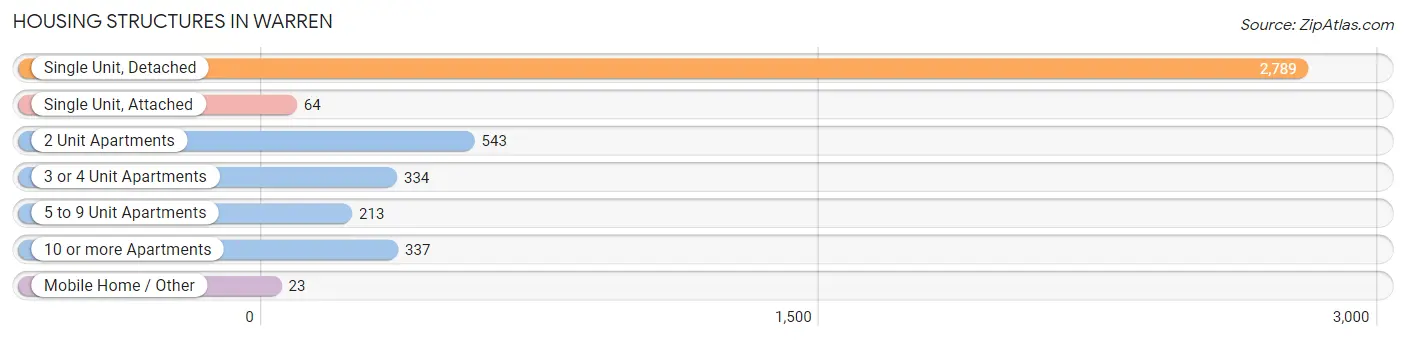
| Structure Type | # Housing Units | % Housing Units |
| Single Unit, Detached | 2,789 | 64.8% |
| Single Unit, Attached | 64 | 1.5% |
| 2 Unit Apartments | 543 | 12.6% |
| 3 or 4 Unit Apartments | 334 | 7.8% |
| 5 to 9 Unit Apartments | 213 | 5.0% |
| 10 or more Apartments | 337 | 7.8% |
| Mobile Home / Other | 23 | 0.5% |
| Total | 4,303 | 100.0% |
Housing Structures by Occupancy in Warren
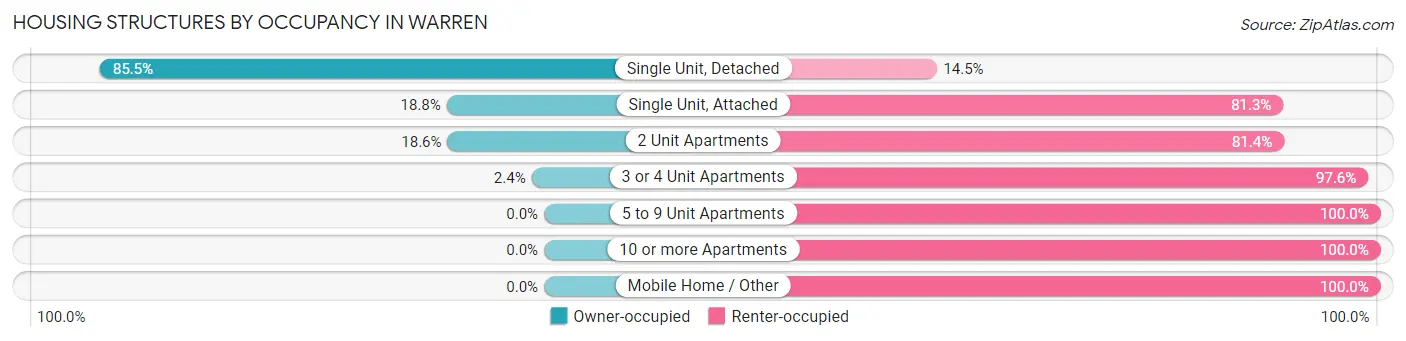
| Structure Type | Owner-occupied | Renter-occupied |
| Single Unit, Detached | 2,385 (85.5%) | 404 (14.5%) |
| Single Unit, Attached | 12 (18.8%) | 52 (81.2%) |
| 2 Unit Apartments | 101 (18.6%) | 442 (81.4%) |
| 3 or 4 Unit Apartments | 8 (2.4%) | 326 (97.6%) |
| 5 to 9 Unit Apartments | 0 (0.0%) | 213 (100.0%) |
| 10 or more Apartments | 0 (0.0%) | 337 (100.0%) |
| Mobile Home / Other | 0 (0.0%) | 23 (100.0%) |
| Total | 2,506 (58.2%) | 1,797 (41.8%) |
Housing Structures by Number of Rooms in Warren
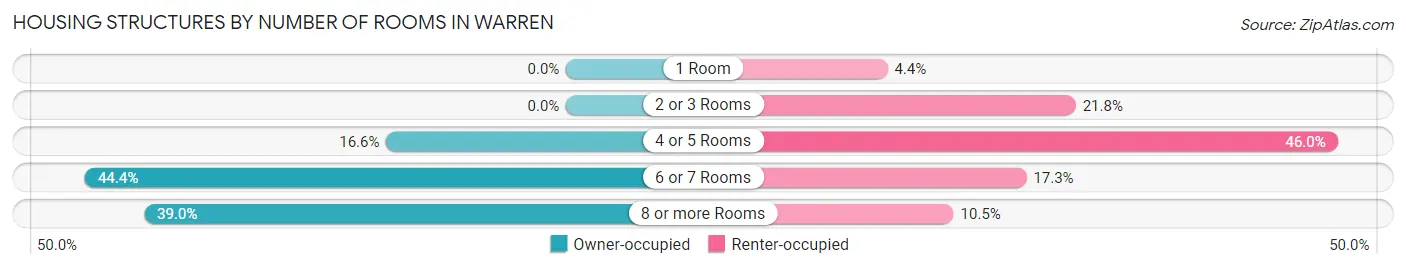
| Number of Rooms | Owner-occupied | Renter-occupied |
| 1 Room | 0 (0.0%) | 79 (4.4%) |
| 2 or 3 Rooms | 0 (0.0%) | 392 (21.8%) |
| 4 or 5 Rooms | 417 (16.6%) | 827 (46.0%) |
| 6 or 7 Rooms | 1,113 (44.4%) | 310 (17.2%) |
| 8 or more Rooms | 976 (39.0%) | 189 (10.5%) |
| Total | 2,506 (100.0%) | 1,797 (100.0%) |
Housing Structure by Heating Type in Warren
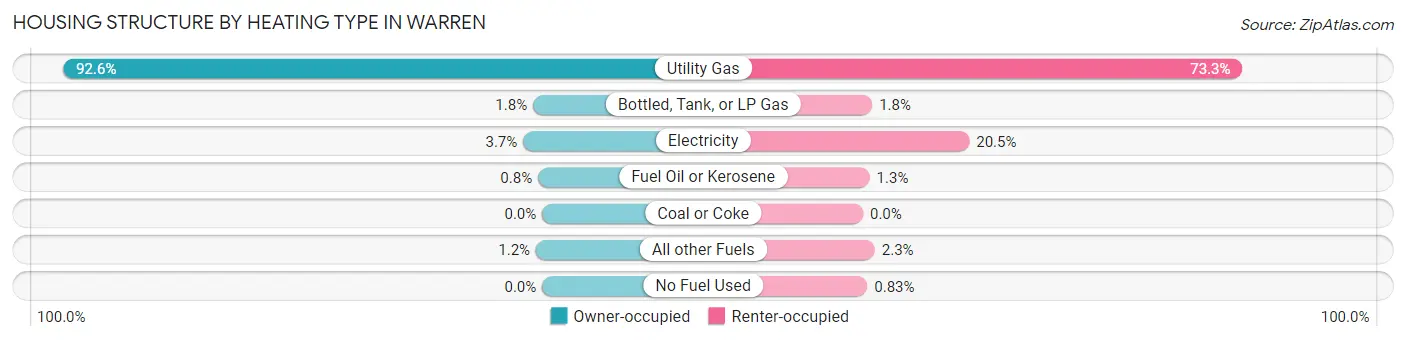
| Heating Type | Owner-occupied | Renter-occupied |
| Utility Gas | 2,320 (92.6%) | 1,317 (73.3%) |
| Bottled, Tank, or LP Gas | 44 (1.8%) | 32 (1.8%) |
| Electricity | 92 (3.7%) | 369 (20.5%) |
| Fuel Oil or Kerosene | 20 (0.8%) | 23 (1.3%) |
| Coal or Coke | 0 (0.0%) | 0 (0.0%) |
| All other Fuels | 30 (1.2%) | 41 (2.3%) |
| No Fuel Used | 0 (0.0%) | 15 (0.8%) |
| Total | 2,506 (100.0%) | 1,797 (100.0%) |
Household Vehicle Usage in Warren
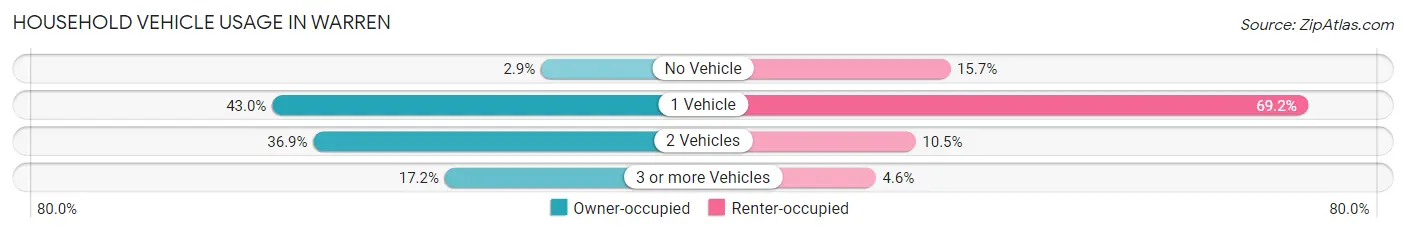
| Vehicles per Household | Owner-occupied | Renter-occupied |
| No Vehicle | 72 (2.9%) | 282 (15.7%) |
| 1 Vehicle | 1,078 (43.0%) | 1,244 (69.2%) |
| 2 Vehicles | 924 (36.9%) | 189 (10.5%) |
| 3 or more Vehicles | 432 (17.2%) | 82 (4.6%) |
| Total | 2,506 (100.0%) | 1,797 (100.0%) |
Real Estate & Mortgages in Warren
Real Estate and Mortgage Overview in Warren
| Characteristic | Without Mortgage | With Mortgage |
| Housing Units | 1,339 | 1,167 |
| Median Property Value | $85,900 | $117,000 |
| Median Household Income | $52,061 | $161 |
| Monthly Housing Costs | $443 | $0 |
| Real Estate Taxes | $1,454 | $8 |
Property Value by Mortgage Status in Warren
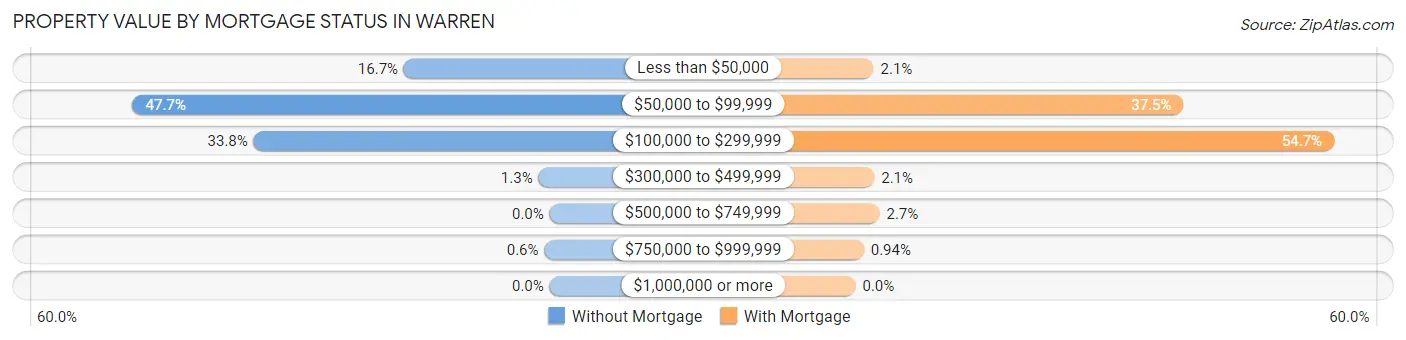
| Property Value | Without Mortgage | With Mortgage |
| Less than $50,000 | 223 (16.7%) | 24 (2.1%) |
| $50,000 to $99,999 | 638 (47.6%) | 437 (37.4%) |
| $100,000 to $299,999 | 453 (33.8%) | 638 (54.7%) |
| $300,000 to $499,999 | 17 (1.3%) | 25 (2.1%) |
| $500,000 to $749,999 | 0 (0.0%) | 32 (2.7%) |
| $750,000 to $999,999 | 8 (0.6%) | 11 (0.9%) |
| $1,000,000 or more | 0 (0.0%) | 0 (0.0%) |
| Total | 1,339 (100.0%) | 1,167 (100.0%) |
Household Income by Mortgage Status in Warren
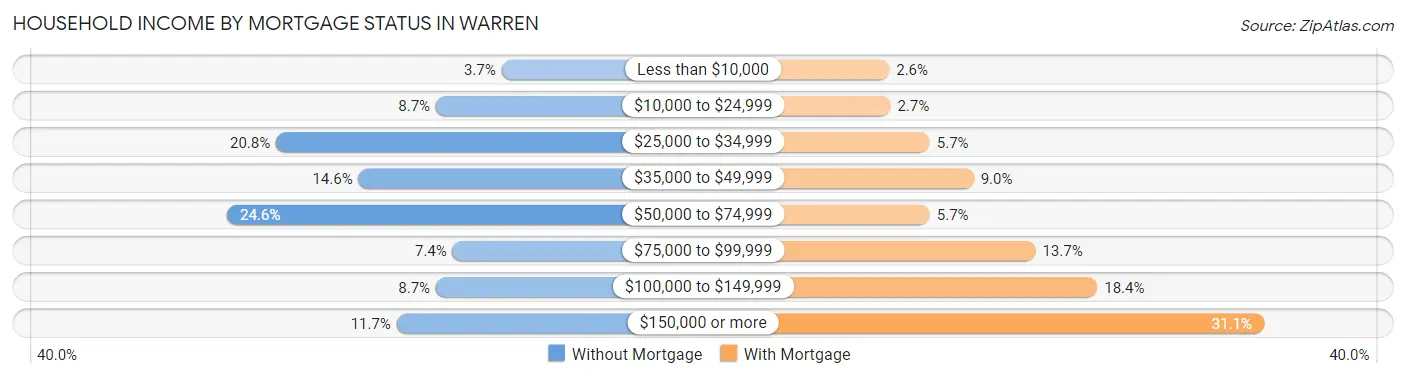
| Household Income | Without Mortgage | With Mortgage |
| Less than $10,000 | 49 (3.7%) | 30 (2.6%) |
| $10,000 to $24,999 | 116 (8.7%) | 31 (2.7%) |
| $25,000 to $34,999 | 279 (20.8%) | 66 (5.7%) |
| $35,000 to $49,999 | 195 (14.6%) | 105 (9.0%) |
| $50,000 to $74,999 | 329 (24.6%) | 66 (5.7%) |
| $75,000 to $99,999 | 99 (7.4%) | 160 (13.7%) |
| $100,000 to $149,999 | 116 (8.7%) | 215 (18.4%) |
| $150,000 or more | 156 (11.7%) | 363 (31.1%) |
| Total | 1,339 (100.0%) | 1,167 (100.0%) |
Property Value to Household Income Ratio in Warren
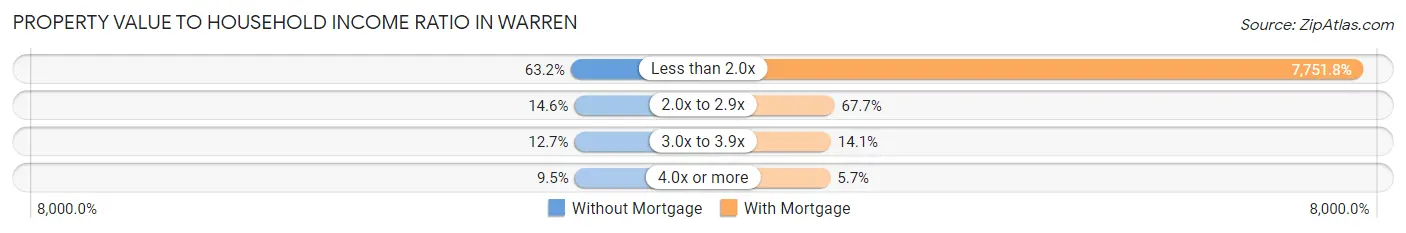
| Value-to-Income Ratio | Without Mortgage | With Mortgage |
| Less than 2.0x | 846 (63.2%) | 90,464 (7,751.8%) |
| 2.0x to 2.9x | 196 (14.6%) | 790 (67.7%) |
| 3.0x to 3.9x | 170 (12.7%) | 164 (14.1%) |
| 4.0x or more | 127 (9.5%) | 67 (5.7%) |
| Total | 1,339 (100.0%) | 1,167 (100.0%) |
Real Estate Taxes by Mortgage Status in Warren
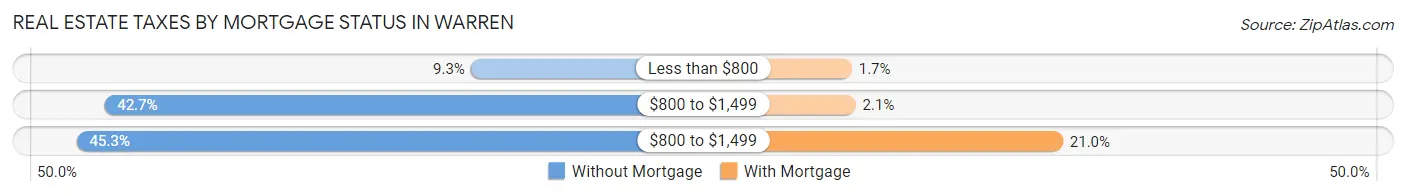
| Property Taxes | Without Mortgage | With Mortgage |
| Less than $800 | 124 (9.3%) | 20 (1.7%) |
| $800 to $1,499 | 572 (42.7%) | 24 (2.1%) |
| $800 to $1,499 | 606 (45.3%) | 245 (21.0%) |
| Total | 1,339 (100.0%) | 1,167 (100.0%) |
Health & Disability in Warren
Health Insurance Coverage by Age in Warren
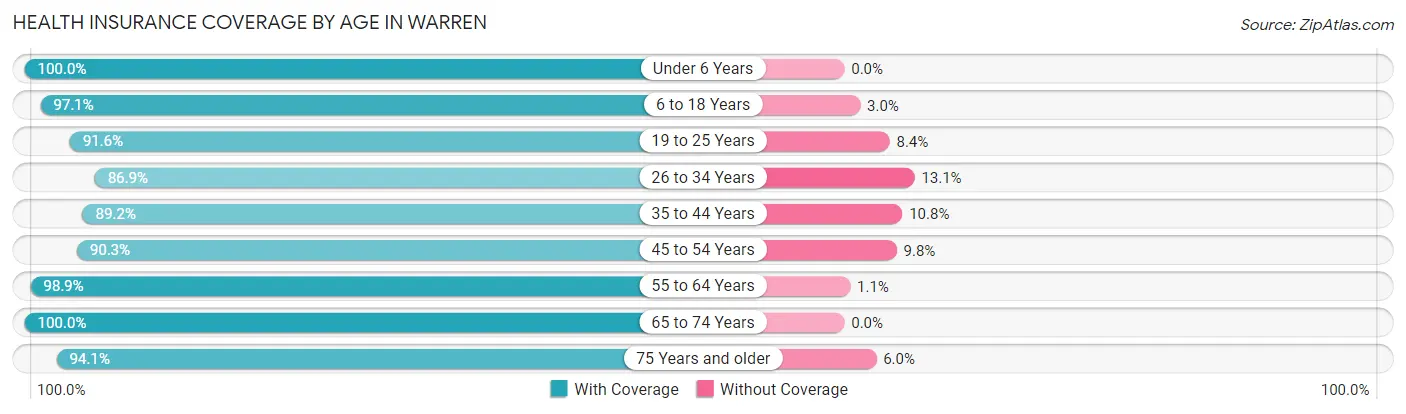
| Age Bracket | With Coverage | Without Coverage |
| Under 6 Years | 527 (100.0%) | 0 (0.0%) |
| 6 to 18 Years | 1,416 (97.1%) | 43 (2.9%) |
| 19 to 25 Years | 629 (91.6%) | 58 (8.4%) |
| 26 to 34 Years | 857 (86.9%) | 129 (13.1%) |
| 35 to 44 Years | 982 (89.2%) | 119 (10.8%) |
| 45 to 54 Years | 1,065 (90.2%) | 115 (9.8%) |
| 55 to 64 Years | 1,286 (98.9%) | 14 (1.1%) |
| 65 to 74 Years | 982 (100.0%) | 0 (0.0%) |
| 75 Years and older | 854 (94.1%) | 54 (5.9%) |
| Total | 8,598 (94.2%) | 532 (5.8%) |
Health Insurance Coverage by Citizenship Status in Warren
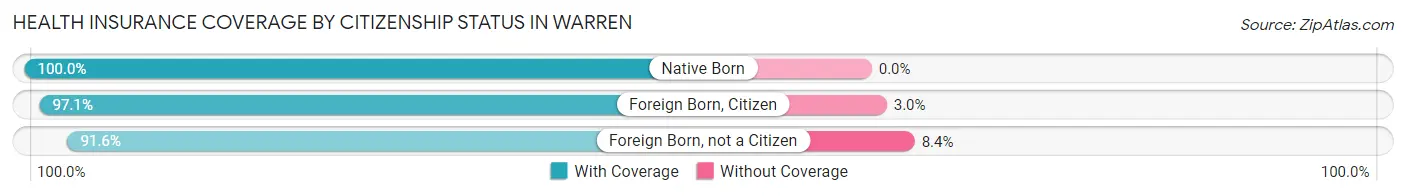
| Citizenship Status | With Coverage | Without Coverage |
| Native Born | 527 (100.0%) | 0 (0.0%) |
| Foreign Born, Citizen | 1,416 (97.1%) | 43 (2.9%) |
| Foreign Born, not a Citizen | 629 (91.6%) | 58 (8.4%) |
Health Insurance Coverage by Household Income in Warren
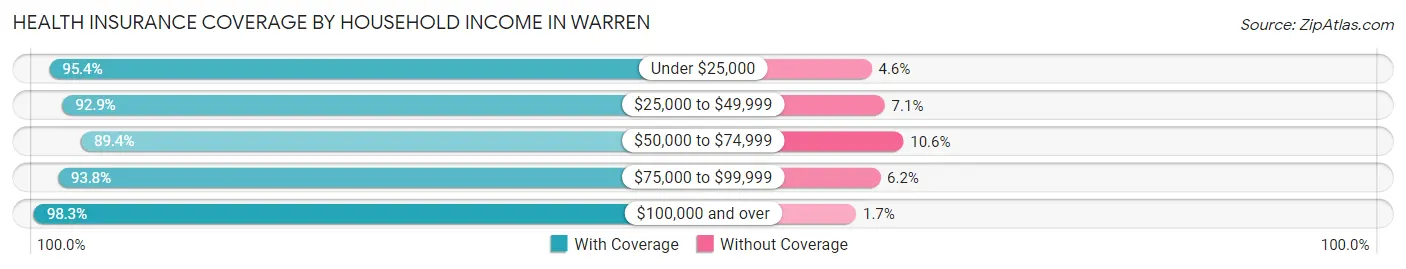
| Household Income | With Coverage | Without Coverage |
| Under $25,000 | 1,050 (95.4%) | 51 (4.6%) |
| $25,000 to $49,999 | 2,253 (92.9%) | 172 (7.1%) |
| $50,000 to $74,999 | 1,699 (89.4%) | 201 (10.6%) |
| $75,000 to $99,999 | 916 (93.8%) | 61 (6.2%) |
| $100,000 and over | 2,664 (98.3%) | 47 (1.7%) |
Public vs Private Health Insurance Coverage by Age in Warren
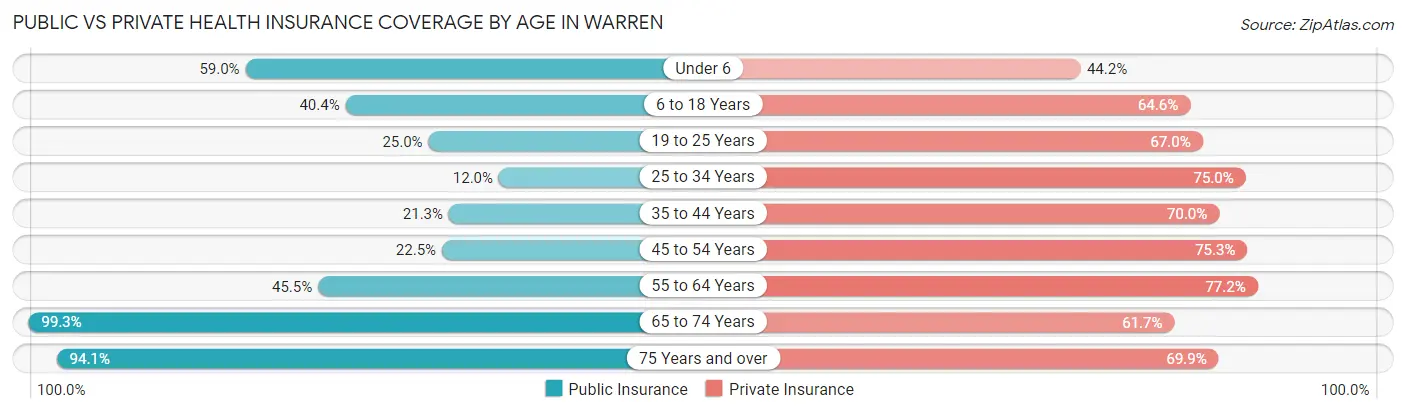
| Age Bracket | Public Insurance | Private Insurance |
| Under 6 | 311 (59.0%) | 233 (44.2%) |
| 6 to 18 Years | 590 (40.4%) | 943 (64.6%) |
| 19 to 25 Years | 172 (25.0%) | 460 (67.0%) |
| 25 to 34 Years | 118 (12.0%) | 739 (75.0%) |
| 35 to 44 Years | 234 (21.2%) | 771 (70.0%) |
| 45 to 54 Years | 266 (22.5%) | 888 (75.2%) |
| 55 to 64 Years | 592 (45.5%) | 1,003 (77.1%) |
| 65 to 74 Years | 975 (99.3%) | 606 (61.7%) |
| 75 Years and over | 854 (94.1%) | 635 (69.9%) |
| Total | 4,112 (45.0%) | 6,278 (68.8%) |
Disability Status by Sex by Age in Warren
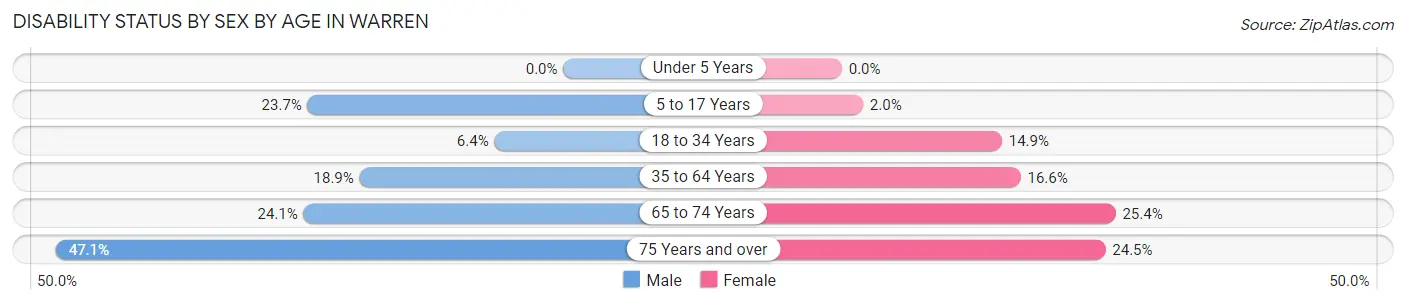
| Age Bracket | Male | Female |
| Under 5 Years | 0 (0.0%) | 0 (0.0%) |
| 5 to 17 Years | 145 (23.7%) | 15 (2.0%) |
| 18 to 34 Years | 47 (6.4%) | 157 (14.8%) |
| 35 to 64 Years | 309 (18.9%) | 323 (16.6%) |
| 65 to 74 Years | 102 (24.1%) | 142 (25.4%) |
| 75 Years and over | 187 (47.1%) | 125 (24.5%) |
Disability Class by Sex by Age in Warren
Disability Class: Hearing Difficulty
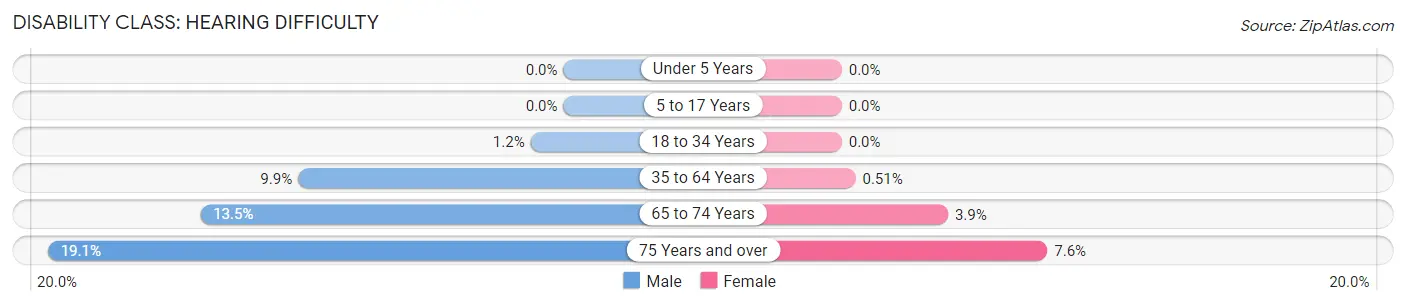
| Age Bracket | Male | Female |
| Under 5 Years | 0 (0.0%) | 0 (0.0%) |
| 5 to 17 Years | 0 (0.0%) | 0 (0.0%) |
| 18 to 34 Years | 9 (1.2%) | 0 (0.0%) |
| 35 to 64 Years | 161 (9.9%) | 10 (0.5%) |
| 65 to 74 Years | 57 (13.5%) | 22 (3.9%) |
| 75 Years and over | 76 (19.1%) | 39 (7.6%) |
Disability Class: Vision Difficulty
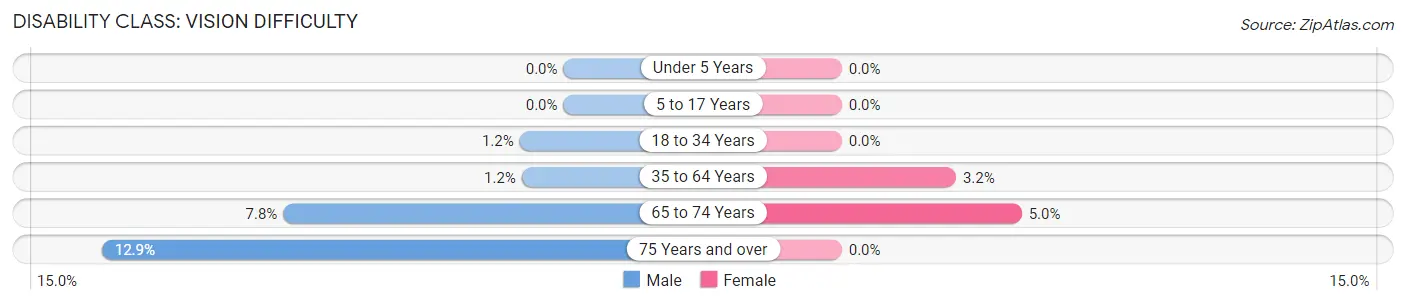
| Age Bracket | Male | Female |
| Under 5 Years | 0 (0.0%) | 0 (0.0%) |
| 5 to 17 Years | 0 (0.0%) | 0 (0.0%) |
| 18 to 34 Years | 9 (1.2%) | 0 (0.0%) |
| 35 to 64 Years | 19 (1.2%) | 62 (3.2%) |
| 65 to 74 Years | 33 (7.8%) | 28 (5.0%) |
| 75 Years and over | 51 (12.9%) | 0 (0.0%) |
Disability Class: Cognitive Difficulty
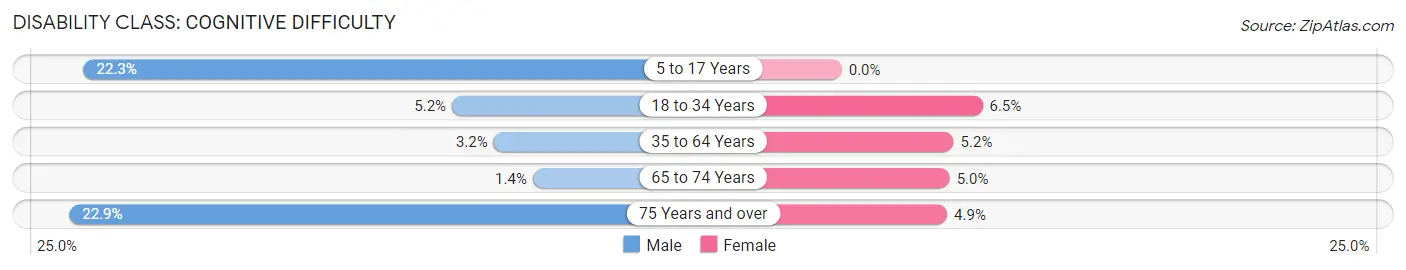
| Age Bracket | Male | Female |
| 5 to 17 Years | 136 (22.3%) | 0 (0.0%) |
| 18 to 34 Years | 38 (5.2%) | 69 (6.5%) |
| 35 to 64 Years | 53 (3.2%) | 101 (5.2%) |
| 65 to 74 Years | 6 (1.4%) | 28 (5.0%) |
| 75 Years and over | 91 (22.9%) | 25 (4.9%) |
Disability Class: Ambulatory Difficulty
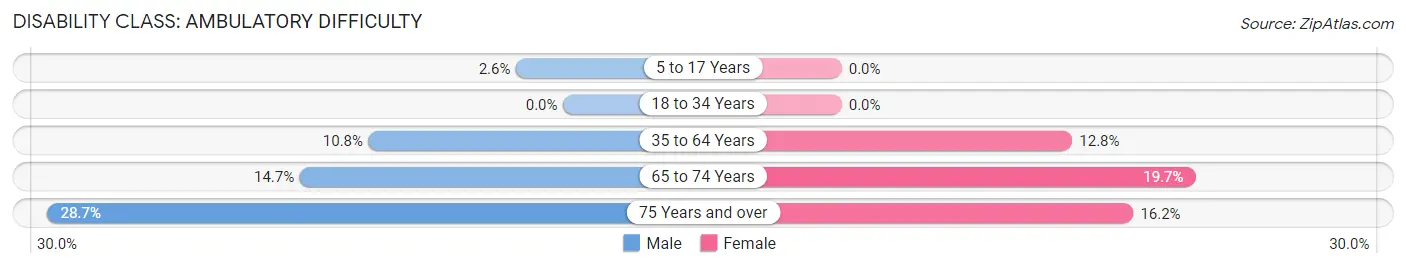
| Age Bracket | Male | Female |
| 5 to 17 Years | 16 (2.6%) | 0 (0.0%) |
| 18 to 34 Years | 0 (0.0%) | 0 (0.0%) |
| 35 to 64 Years | 177 (10.8%) | 250 (12.8%) |
| 65 to 74 Years | 62 (14.7%) | 110 (19.7%) |
| 75 Years and over | 114 (28.7%) | 83 (16.2%) |
Disability Class: Self-Care Difficulty
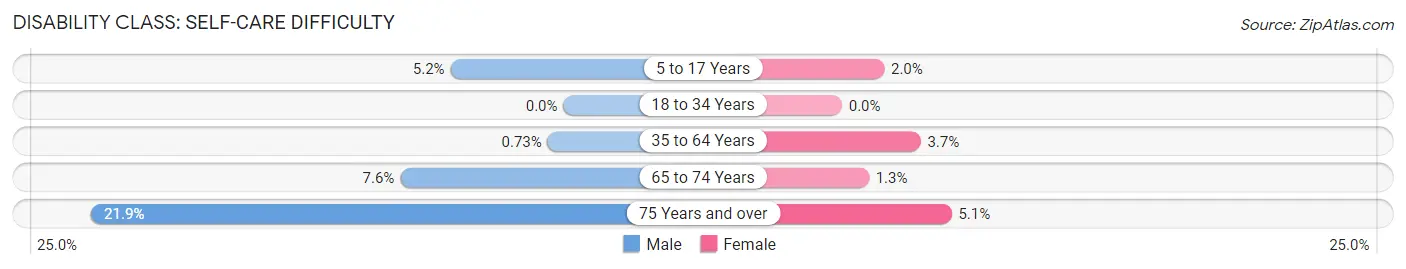
| Age Bracket | Male | Female |
| 5 to 17 Years | 32 (5.2%) | 15 (2.0%) |
| 18 to 34 Years | 0 (0.0%) | 0 (0.0%) |
| 35 to 64 Years | 12 (0.7%) | 71 (3.6%) |
| 65 to 74 Years | 32 (7.6%) | 7 (1.3%) |
| 75 Years and over | 87 (21.9%) | 26 (5.1%) |
Technology Access in Warren
Computing Device Access in Warren
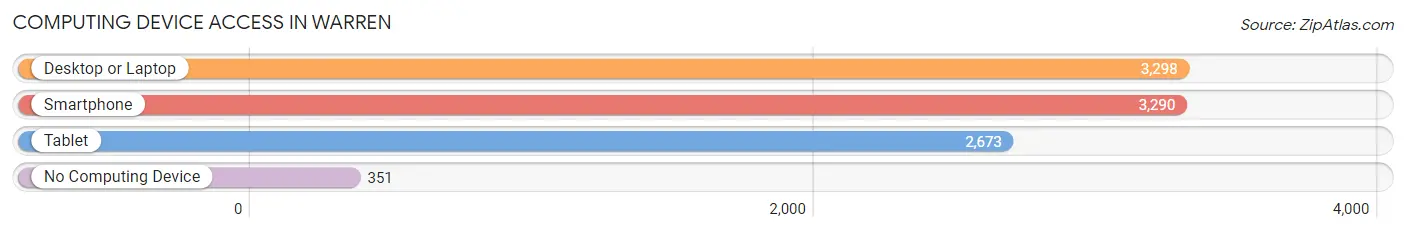
| Device Type | # Households | % Households |
| Desktop or Laptop | 3,298 | 76.6% |
| Smartphone | 3,290 | 76.5% |
| Tablet | 2,673 | 62.1% |
| No Computing Device | 351 | 8.2% |
| Total | 4,303 | 100.0% |
Internet Access in Warren
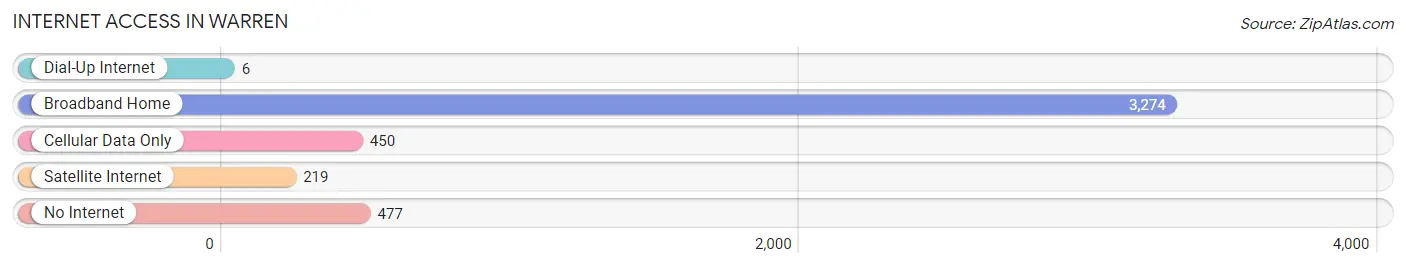
| Internet Type | # Households | % Households |
| Dial-Up Internet | 6 | 0.1% |
| Broadband Home | 3,274 | 76.1% |
| Cellular Data Only | 450 | 10.5% |
| Satellite Internet | 219 | 5.1% |
| No Internet | 477 | 11.1% |
| Total | 4,303 | 100.0% |
Warren Summary
Warren, Pennsylvania is a city located in Warren County in the northwestern part of the state. It is the county seat and the largest city in the county. The city is situated in the foothills of the Allegheny Mountains and is located along the Allegheny River. The city has a population of approximately 10,000 people and is the home of the Allegheny National Forest.
History
The area that is now Warren was first settled in 1795 by a group of settlers from Connecticut. The settlers named the area after General Joseph Warren, a hero of the American Revolution. The town was officially incorporated in 1806 and was named the county seat of Warren County in 1819.
In the early 19th century, the area was a major center for the lumber industry. The lumber industry was so important to the area that the city was nicknamed “Lumber City.” The lumber industry declined in the late 19th century, but the city continued to grow and develop.
In the early 20th century, the city was a major center for the oil and gas industry. The city was also home to several manufacturing companies, including the Warren Foundry and Machine Company, which produced locomotives and other machinery.
Geography
Warren is located in the northwestern part of Pennsylvania, in Warren County. The city is situated in the foothills of the Allegheny Mountains and is located along the Allegheny River. The city has a total area of 4.2 square miles, of which 4.1 square miles is land and 0.1 square miles is water.
The city has a humid continental climate, with cold, snowy winters and warm, humid summers. The average annual temperature is 46°F, and the average annual precipitation is 39 inches.
Economy
The economy of Warren is largely based on the oil and gas industry, as well as manufacturing and tourism. The city is home to several oil and gas companies, including Warren Energy, which is the largest employer in the city. The city is also home to several manufacturing companies, including the Warren Foundry and Machine Company, which produces locomotives and other machinery.
The city is also a popular tourist destination, with several attractions, including the Allegheny National Forest, the Allegheny River, and the Kinzua Dam. The city also hosts several festivals and events throughout the year, including the Warren County Fair and the Warren County Music Festival.
Demographics
As of the 2010 census, the population of Warren was 10,042. The racial makeup of the city was 95.3% White, 1.2% African American, 0.3% Native American, 0.7% Asian, 0.1% Pacific Islander, 0.7% from other races, and 1.7% from two or more races. Hispanic or Latino of any race were 2.2% of the population.
The median household income in Warren was $37,917, and the median family income was $45,938. The per capita income in Warren was $20,845. About 11.3% of the population was below the poverty line.
Common Questions
What is Per Capita Income in Warren?
Per Capita income in Warren is $33,937.
What is the Median Family Income in Warren?
Median Family Income in Warren is $69,583.
What is the Median Household income in Warren?
Median Household Income in Warren is $49,609.
What is Income or Wage Gap in Warren?
Income or Wage Gap in Warren is 31.5%.
Women in Warren earn 68.5 cents for every dollar earned by a man.
What is Inequality or Gini Index in Warren?
Inequality or Gini Index in Warren is 0.47.
What is the Total Population of Warren?
Total Population of Warren is 9,353.
What is the Total Male Population of Warren?
Total Male Population of Warren is 4,137.
What is the Total Female Population of Warren?
Total Female Population of Warren is 5,216.
What is the Ratio of Males per 100 Females in Warren?
There are 79.31 Males per 100 Females in Warren.
What is the Ratio of Females per 100 Males in Warren?
There are 126.08 Females per 100 Males in Warren.
What is the Median Population Age in Warren?
Median Population Age in Warren is 43.8 Years.
What is the Average Family Size in Warren
Average Family Size in Warren is 2.8 People.
What is the Average Household Size in Warren
Average Household Size in Warren is 2.1 People.
How Large is the Labor Force in Warren?
There are 4,671 People in the Labor Forcein in Warren.
What is the Percentage of People in the Labor Force in Warren?
59.8% of People are in the Labor Force in Warren.
What is the Unemployment Rate in Warren?
Unemployment Rate in Warren is 3.2%.