Muskegon Heights, MI Map & Demographics
Muskegon Heights Map
Muskegon Heights Overview
$15,816
PER CAPITA INCOME
$36,052
AVG FAMILY INCOME
$35,216
AVG HOUSEHOLD INCOME
16.6%
WAGE / INCOME GAP [ % ]
83.4¢/ $1
WAGE / INCOME GAP [ $ ]
$11,435
FAMILY INCOME DEFICIT
0.42
INEQUALITY / GINI INDEX
9,954
TOTAL POPULATION
4,630
MALE POPULATION
5,324
FEMALE POPULATION
86.96
MALES / 100 FEMALES
114.99
FEMALES / 100 MALES
30.7
MEDIAN AGE
3.5
AVG FAMILY SIZE
2.7
AVG HOUSEHOLD SIZE
4,169
LABOR FORCE [ PEOPLE ]
58.4%
PERCENT IN LABOR FORCE
20.5%
UNEMPLOYMENT RATE
Muskegon Heights Area Codes
Income in Muskegon Heights
Income Overview in Muskegon Heights
Per Capita Income in Muskegon Heights is $15,816, while median incomes of families and households are $36,052 and $35,216 respectively.
| Characteristic | Number | Measure |
| Per Capita Income | 9,954 | $15,816 |
| Median Family Income | 2,233 | $36,052 |
| Mean Family Income | 2,233 | $44,411 |
| Median Household Income | 3,611 | $35,216 |
| Mean Household Income | 3,611 | $42,986 |
| Income Deficit | 2,233 | $11,435 |
| Wage / Income Gap (%) | 9,954 | 16.55% |
| Wage / Income Gap ($) | 9,954 | 83.45¢ per $1 |
| Gini / Inequality Index | 9,954 | 0.42 |
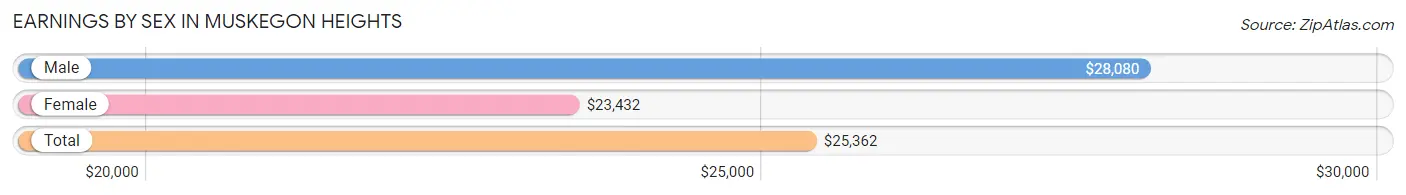
Earnings by Sex in Muskegon Heights
Average Earnings in Muskegon Heights are $25,362, $28,080 for men and $23,432 for women, a difference of 16.6%.
| Sex | Number | Average Earnings |
| Male | 1,568 (40.3%) | $28,080 |
| Female | 2,325 (59.7%) | $23,432 |
| Total | 3,893 (100.0%) | $25,362 |
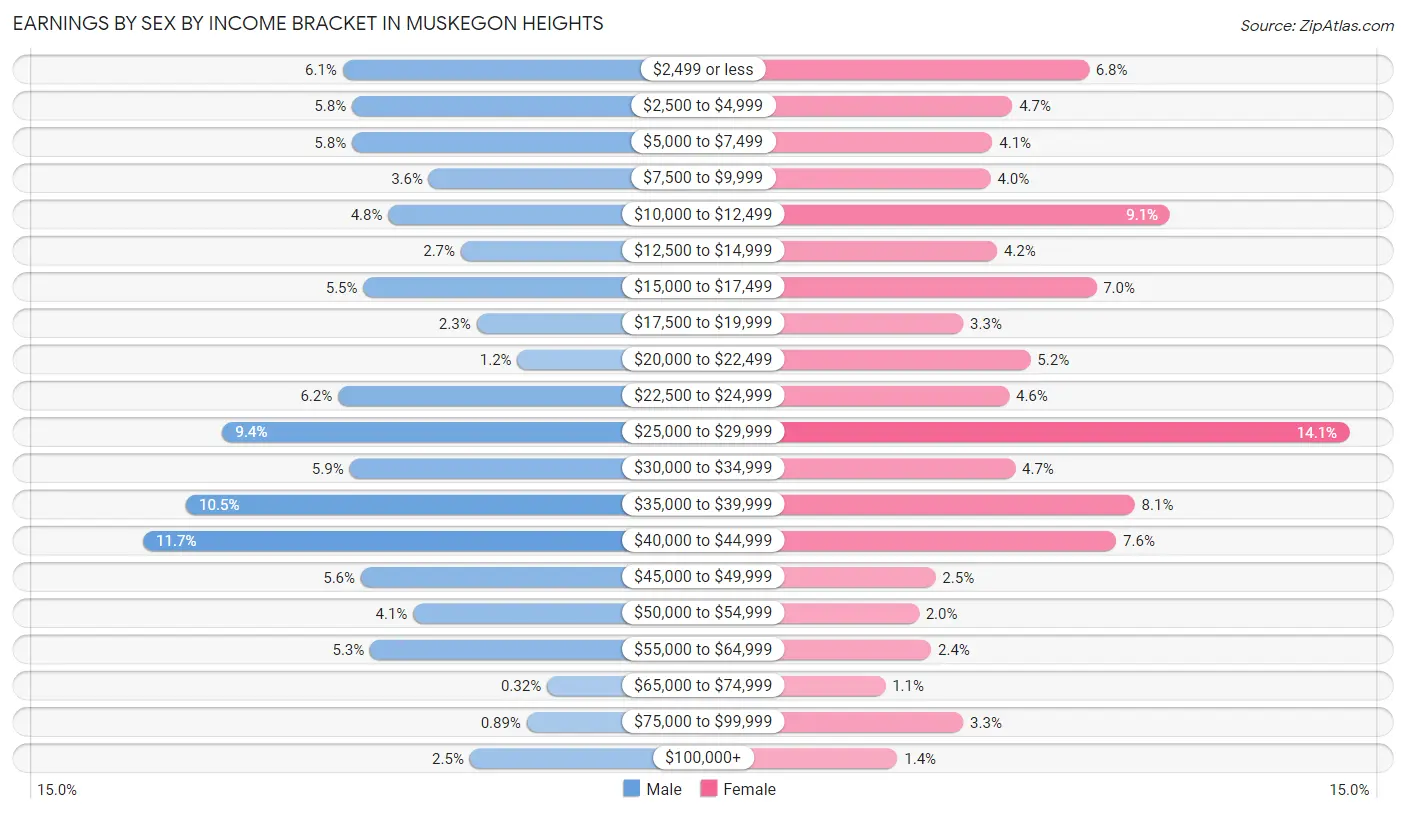
Earnings by Sex by Income Bracket in Muskegon Heights
The most common earnings brackets in Muskegon Heights are $40,000 to $44,999 for men (183 | 11.7%) and $25,000 to $29,999 for women (328 | 14.1%).
| Income | Male | Female |
| $2,499 or less | 95 (6.1%) | 158 (6.8%) |
| $2,500 to $4,999 | 91 (5.8%) | 108 (4.6%) |
| $5,000 to $7,499 | 91 (5.8%) | 95 (4.1%) |
| $7,500 to $9,999 | 57 (3.6%) | 94 (4.0%) |
| $10,000 to $12,499 | 75 (4.8%) | 211 (9.1%) |
| $12,500 to $14,999 | 43 (2.7%) | 98 (4.2%) |
| $15,000 to $17,499 | 86 (5.5%) | 163 (7.0%) |
| $17,500 to $19,999 | 36 (2.3%) | 76 (3.3%) |
| $20,000 to $22,499 | 18 (1.1%) | 120 (5.2%) |
| $22,500 to $24,999 | 97 (6.2%) | 106 (4.6%) |
| $25,000 to $29,999 | 148 (9.4%) | 328 (14.1%) |
| $30,000 to $34,999 | 92 (5.9%) | 110 (4.7%) |
| $35,000 to $39,999 | 164 (10.5%) | 188 (8.1%) |
| $40,000 to $44,999 | 183 (11.7%) | 176 (7.6%) |
| $45,000 to $49,999 | 87 (5.6%) | 58 (2.5%) |
| $50,000 to $54,999 | 64 (4.1%) | 47 (2.0%) |
| $55,000 to $64,999 | 83 (5.3%) | 55 (2.4%) |
| $65,000 to $74,999 | 5 (0.3%) | 25 (1.1%) |
| $75,000 to $99,999 | 14 (0.9%) | 76 (3.3%) |
| $100,000+ | 39 (2.5%) | 33 (1.4%) |
| Total | 1,568 (100.0%) | 2,325 (100.0%) |
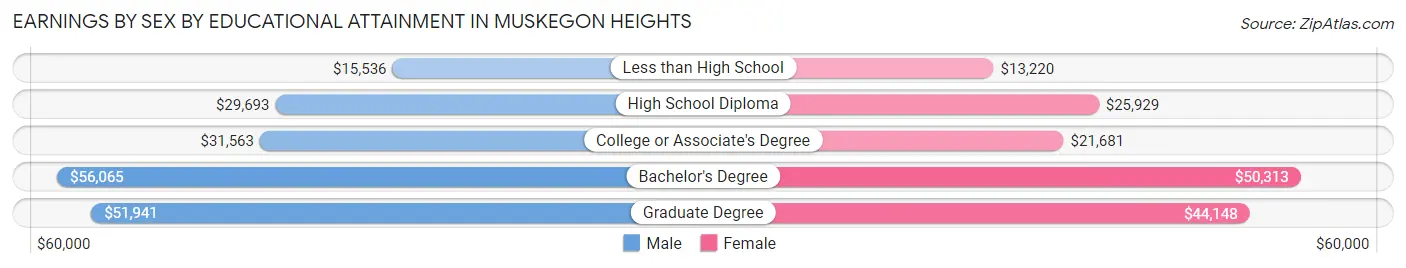
Earnings by Sex by Educational Attainment in Muskegon Heights
Average earnings in Muskegon Heights are $30,185 for men and $24,628 for women, a difference of 18.4%. Men with an educational attainment of bachelor's degree enjoy the highest average annual earnings of $56,065, while those with less than high school education earn the least with $15,536. Women with an educational attainment of bachelor's degree earn the most with the average annual earnings of $50,313, while those with less than high school education have the smallest earnings of $13,220.
| Educational Attainment | Male Income | Female Income |
| Less than High School | $15,536 | $13,220 |
| High School Diploma | $29,693 | $25,929 |
| College or Associate's Degree | $31,563 | $21,681 |
| Bachelor's Degree | $56,065 | $50,313 |
| Graduate Degree | $51,941 | $44,148 |
| Total | $30,185 | $24,628 |
Family Income in Muskegon Heights
Family Income Brackets in Muskegon Heights
According to the Muskegon Heights family income data, there are 505 families falling into the $35,000 to $49,999 income range, which is the most common income bracket and makes up 22.6% of all families.
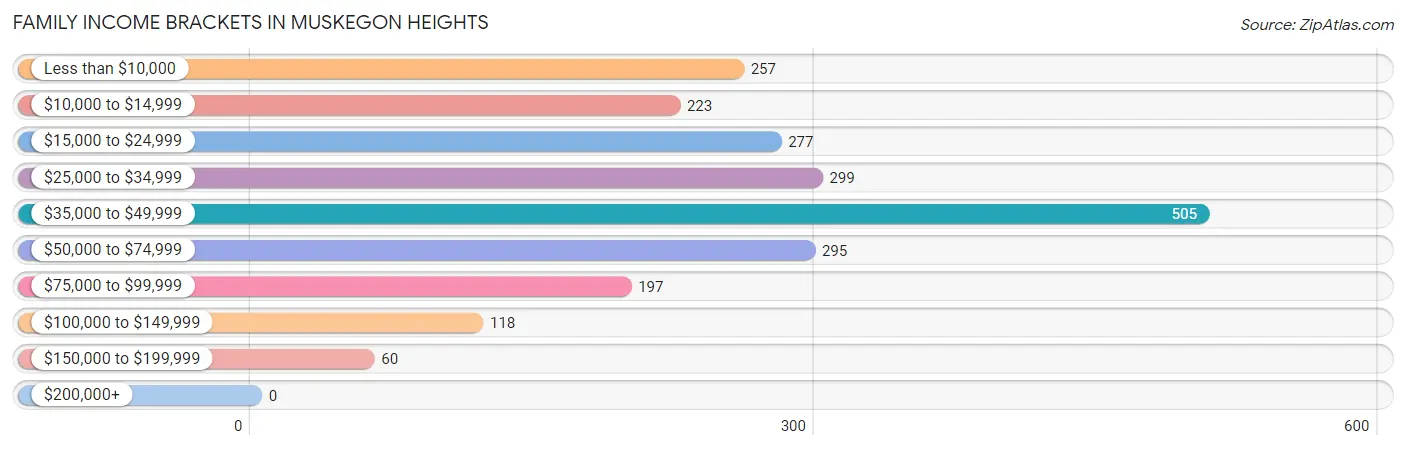
| Income Bracket | # Families | % Families |
| Less than $10,000 | 257 | 11.5% |
| $10,000 to $14,999 | 223 | 10.0% |
| $15,000 to $24,999 | 277 | 12.4% |
| $25,000 to $34,999 | 299 | 13.4% |
| $35,000 to $49,999 | 505 | 22.6% |
| $50,000 to $74,999 | 295 | 13.2% |
| $75,000 to $99,999 | 197 | 8.8% |
| $100,000 to $149,999 | 118 | 5.3% |
| $150,000 to $199,999 | 60 | 2.7% |
| $200,000+ | 0 | 0.0% |
Family Income by Famaliy Size in Muskegon Heights
7+ person families (55 | 2.5%) account for the highest median family income in Muskegon Heights with $81,094 per family, while 2-person families (909 | 40.7%) have the highest median income of $18,039 per family member.
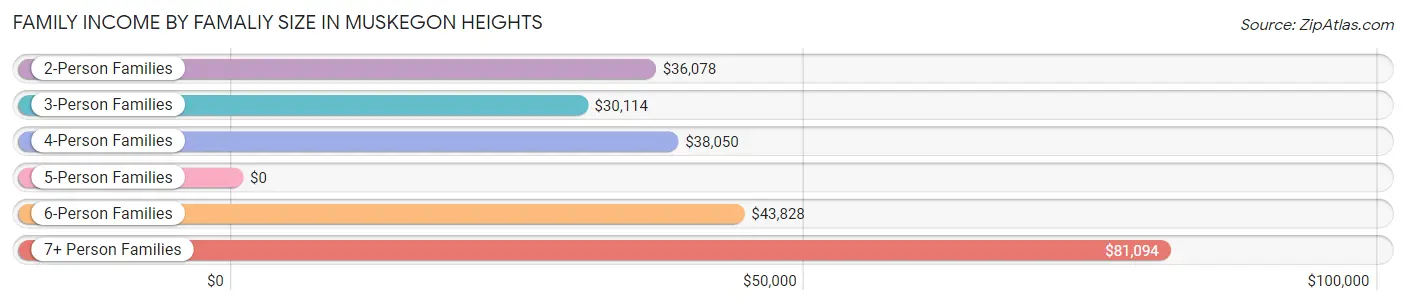
| Income Bracket | # Families | Median Income |
| 2-Person Families | 909 (40.7%) | $36,078 |
| 3-Person Families | 607 (27.2%) | $30,114 |
| 4-Person Families | 415 (18.6%) | $38,050 |
| 5-Person Families | 144 (6.5%) | $0 |
| 6-Person Families | 103 (4.6%) | $43,828 |
| 7+ Person Families | 55 (2.5%) | $81,094 |
| Total | 2,233 (100.0%) | $36,052 |
Family Income by Number of Earners in Muskegon Heights
The median family income in Muskegon Heights is $36,052, with families comprising 3+ earners (119) having the highest median family income of $103,125, while families with no earners (444) have the lowest median family income of $20,077, accounting for 5.3% and 19.9% of families, respectively.
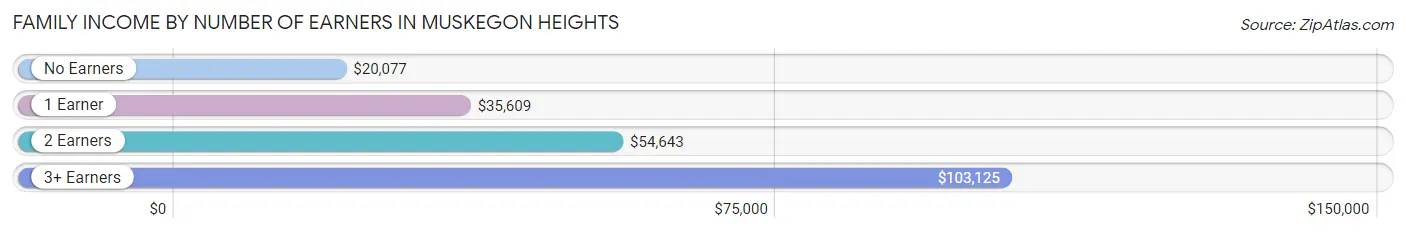
| Number of Earners | # Families | Median Income |
| No Earners | 444 (19.9%) | $20,077 |
| 1 Earner | 1,246 (55.8%) | $35,609 |
| 2 Earners | 424 (19.0%) | $54,643 |
| 3+ Earners | 119 (5.3%) | $103,125 |
| Total | 2,233 (100.0%) | $36,052 |
Household Income in Muskegon Heights
Household Income Brackets in Muskegon Heights
With 632 households falling in the category, the $50,000 to $74,999 income range is the most frequent in Muskegon Heights, accounting for 17.5% of all households.
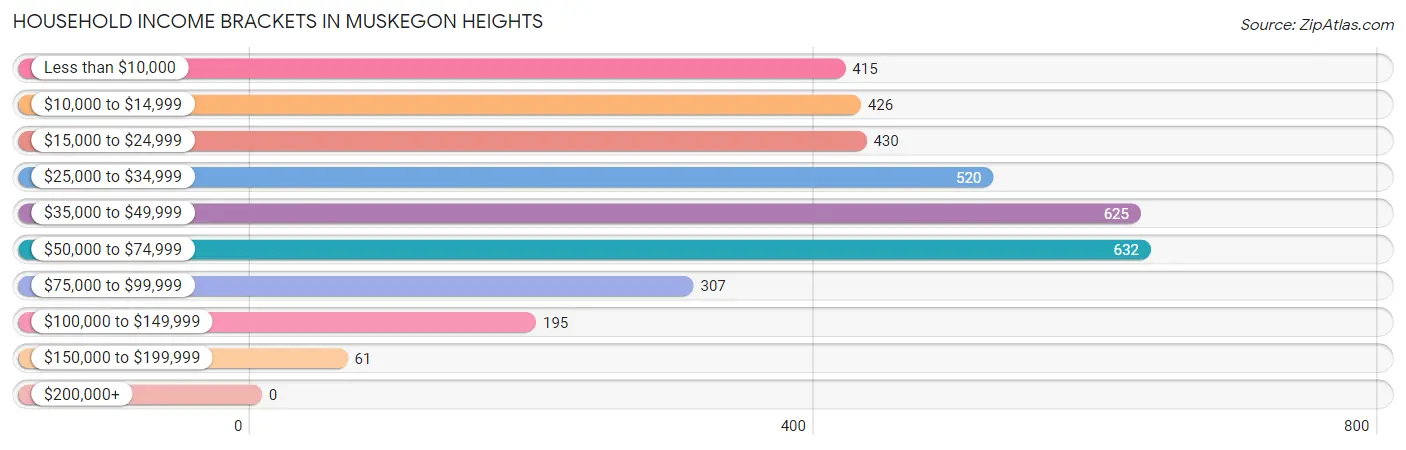
| Income Bracket | # Households | % Households |
| Less than $10,000 | 415 | 11.5% |
| $10,000 to $14,999 | 426 | 11.8% |
| $15,000 to $24,999 | 430 | 11.9% |
| $25,000 to $34,999 | 520 | 14.4% |
| $35,000 to $49,999 | 625 | 17.3% |
| $50,000 to $74,999 | 632 | 17.5% |
| $75,000 to $99,999 | 307 | 8.5% |
| $100,000 to $149,999 | 195 | 5.4% |
| $150,000 to $199,999 | 61 | 1.7% |
| $200,000+ | 0 | 0.0% |
Household Income by Householder Age in Muskegon Heights
The median household income in Muskegon Heights is $35,216, with the highest median household income of $36,667 found in the 45 to 64 years age bracket for the primary householder. A total of 1,084 households (30.0%) fall into this category. Meanwhile, the 15 to 24 years age bracket for the primary householder has the lowest median household income of $23,316, with 242 households (6.7%) in this group.
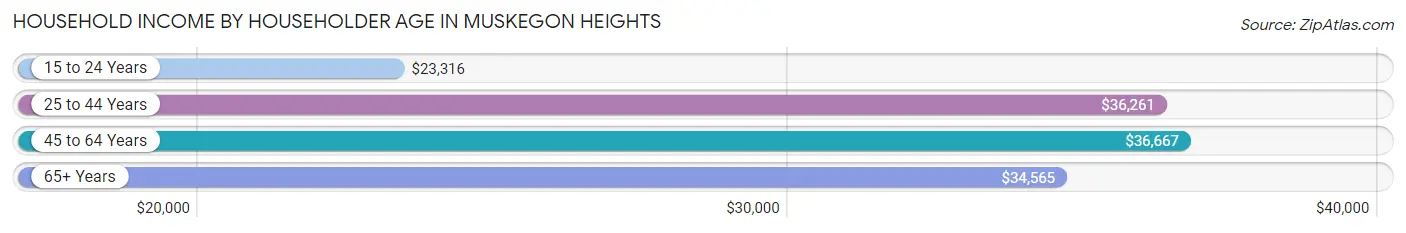
| Income Bracket | # Households | Median Income |
| 15 to 24 Years | 242 (6.7%) | $23,316 |
| 25 to 44 Years | 1,275 (35.3%) | $36,261 |
| 45 to 64 Years | 1,084 (30.0%) | $36,667 |
| 65+ Years | 1,010 (28.0%) | $34,565 |
| Total | 3,611 (100.0%) | $35,216 |
Poverty in Muskegon Heights
Income Below Poverty by Sex and Age in Muskegon Heights
With 35.7% poverty level for males and 37.1% for females among the residents of Muskegon Heights, 5 year old males and 5 year old females are the most vulnerable to poverty, with 71 males (68.9%) and 83 females (72.2%) in their respective age groups living below the poverty level.
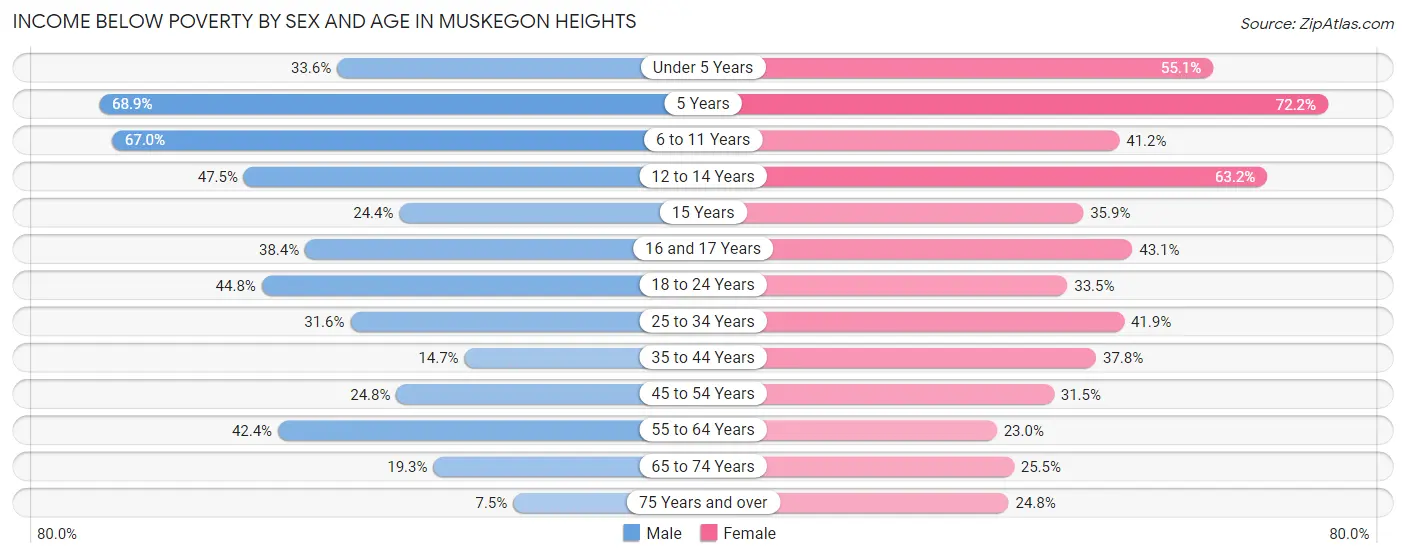
| Age Bracket | Male | Female |
| Under 5 Years | 167 (33.6%) | 172 (55.1%) |
| 5 Years | 71 (68.9%) | 83 (72.2%) |
| 6 to 11 Years | 415 (67.0%) | 197 (41.2%) |
| 12 to 14 Years | 93 (47.4%) | 132 (63.2%) |
| 15 Years | 19 (24.4%) | 38 (35.8%) |
| 16 and 17 Years | 28 (38.4%) | 44 (43.1%) |
| 18 to 24 Years | 224 (44.8%) | 212 (33.5%) |
| 25 to 34 Years | 187 (31.6%) | 349 (41.9%) |
| 35 to 44 Years | 73 (14.7%) | 245 (37.8%) |
| 45 to 54 Years | 121 (24.8%) | 170 (31.5%) |
| 55 to 64 Years | 139 (42.4%) | 110 (23.0%) |
| 65 to 74 Years | 73 (19.3%) | 131 (25.5%) |
| 75 Years and over | 15 (7.5%) | 79 (24.8%) |
| Total | 1,625 (35.7%) | 1,962 (37.1%) |
Income Above Poverty by Sex and Age in Muskegon Heights
According to the poverty statistics in Muskegon Heights, males aged 75 years and over and females aged 55 to 64 years are the age groups that are most secure financially, with 92.5% of males and 77.0% of females in these age groups living above the poverty line.
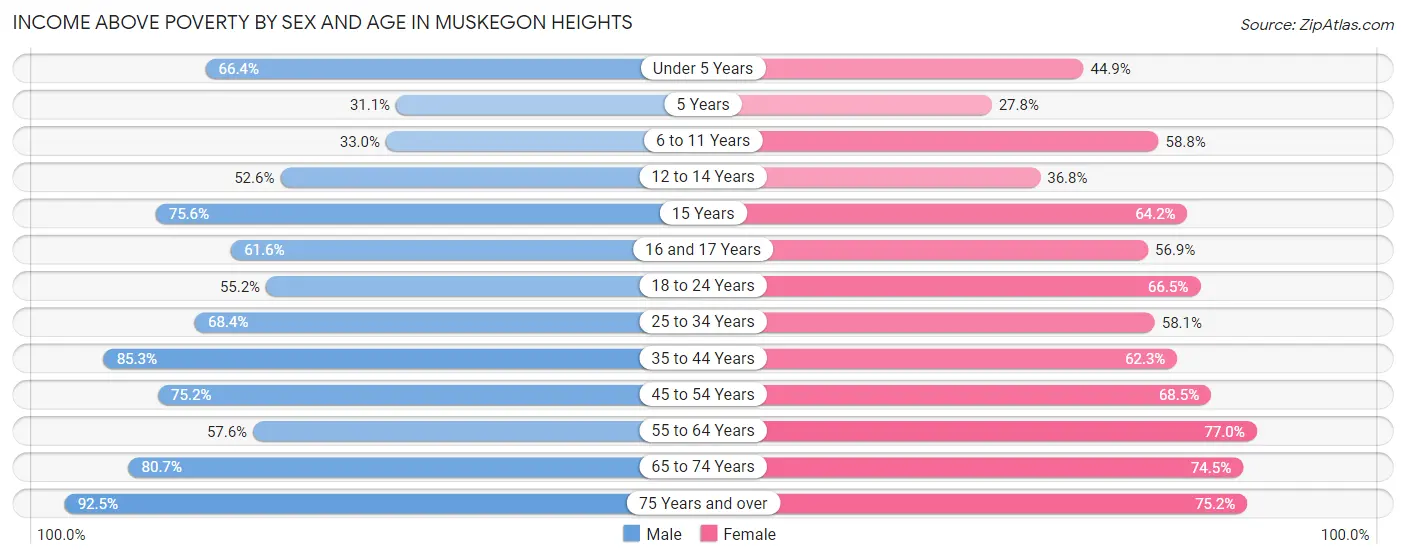
| Age Bracket | Male | Female |
| Under 5 Years | 330 (66.4%) | 140 (44.9%) |
| 5 Years | 32 (31.1%) | 32 (27.8%) |
| 6 to 11 Years | 204 (33.0%) | 281 (58.8%) |
| 12 to 14 Years | 103 (52.5%) | 77 (36.8%) |
| 15 Years | 59 (75.6%) | 68 (64.1%) |
| 16 and 17 Years | 45 (61.6%) | 58 (56.9%) |
| 18 to 24 Years | 276 (55.2%) | 421 (66.5%) |
| 25 to 34 Years | 404 (68.4%) | 484 (58.1%) |
| 35 to 44 Years | 424 (85.3%) | 404 (62.3%) |
| 45 to 54 Years | 367 (75.2%) | 370 (68.5%) |
| 55 to 64 Years | 189 (57.6%) | 368 (77.0%) |
| 65 to 74 Years | 305 (80.7%) | 382 (74.5%) |
| 75 Years and over | 186 (92.5%) | 240 (75.2%) |
| Total | 2,924 (64.3%) | 3,325 (62.9%) |
Income Below Poverty Among Married-Couple Families in Muskegon Heights
The poverty statistics for married-couple families in Muskegon Heights show that 21.8% or 119 of the total 545 families live below the poverty line. Families with 1 or 2 children have the highest poverty rate of 44.7%, comprising of 68 families. On the other hand, families with 3 or 4 children have the lowest poverty rate of 5.3%, which includes 4 families.
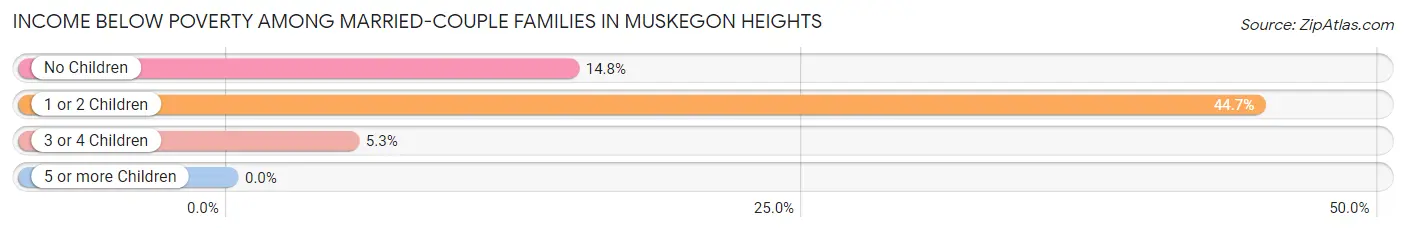
| Children | Above Poverty | Below Poverty |
| No Children | 270 (85.2%) | 47 (14.8%) |
| 1 or 2 Children | 84 (55.3%) | 68 (44.7%) |
| 3 or 4 Children | 72 (94.7%) | 4 (5.3%) |
| 5 or more Children | 0 (0.0%) | 0 (0.0%) |
| Total | 426 (78.2%) | 119 (21.8%) |
Income Below Poverty Among Single-Parent Households in Muskegon Heights
According to the poverty data in Muskegon Heights, 23.2% or 65 single-father households and 41.0% or 578 single-mother households are living below the poverty line. Among single-father households, those with 1 or 2 children have the highest poverty rate, with 30 households (23.6%) experiencing poverty. Likewise, among single-mother households, those with 5 or more children have the highest poverty rate, with 29 households (100.0%) falling below the poverty line.
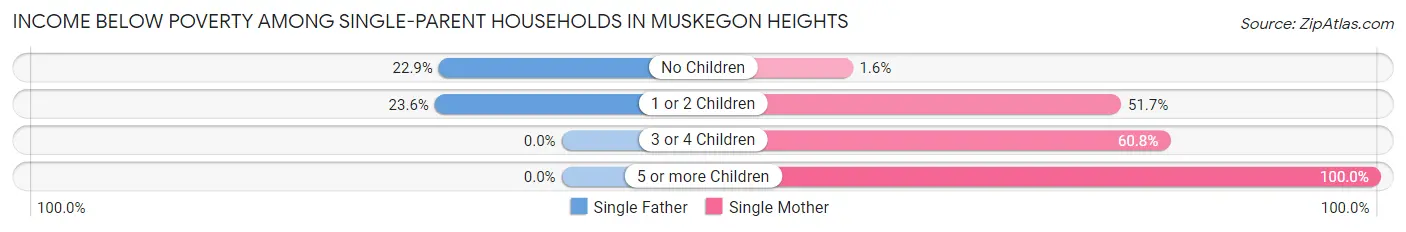
| Children | Single Father | Single Mother |
| No Children | 35 (22.9%) | 6 (1.6%) |
| 1 or 2 Children | 30 (23.6%) | 402 (51.7%) |
| 3 or 4 Children | 0 (0.0%) | 141 (60.8%) |
| 5 or more Children | 0 (0.0%) | 29 (100.0%) |
| Total | 65 (23.2%) | 578 (41.0%) |
Income Below Poverty Among Married-Couple vs Single-Parent Households in Muskegon Heights
The poverty data for Muskegon Heights shows that 119 of the married-couple family households (21.8%) and 643 of the single-parent households (38.1%) are living below the poverty level. Within the married-couple family households, those with 1 or 2 children have the highest poverty rate, with 68 households (44.7%) falling below the poverty line. Among the single-parent households, those with 5 or more children have the highest poverty rate, with 29 household (100.0%) living below poverty.
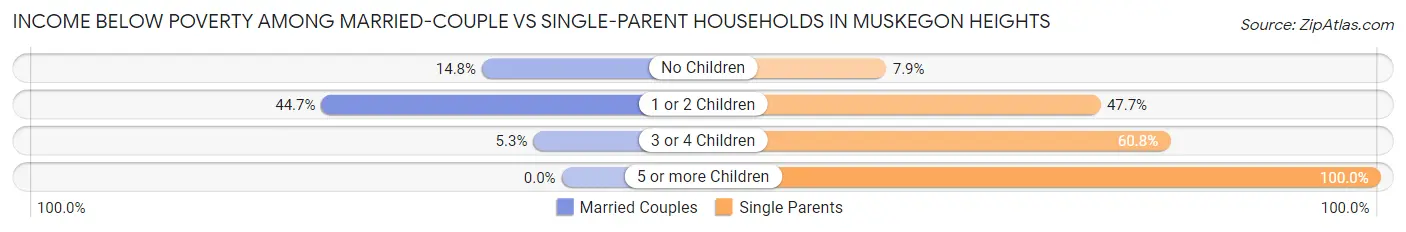
| Children | Married-Couple Families | Single-Parent Households |
| No Children | 47 (14.8%) | 41 (7.9%) |
| 1 or 2 Children | 68 (44.7%) | 432 (47.7%) |
| 3 or 4 Children | 4 (5.3%) | 141 (60.8%) |
| 5 or more Children | 0 (0.0%) | 29 (100.0%) |
| Total | 119 (21.8%) | 643 (38.1%) |
Race in Muskegon Heights
The most populous races in Muskegon Heights are Black / African American (7,602 | 76.4%), White / Caucasian (1,689 | 17.0%), and Two or more Races (442 | 4.4%).
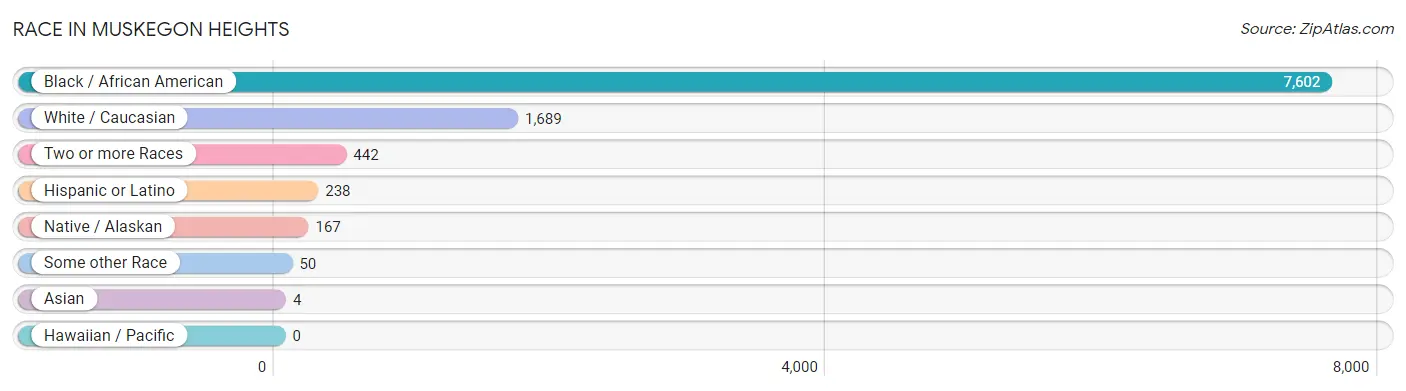
| Race | # Population | % Population |
| Asian | 4 | 0.0% |
| Black / African American | 7,602 | 76.4% |
| Hawaiian / Pacific | 0 | 0.0% |
| Hispanic or Latino | 238 | 2.4% |
| Native / Alaskan | 167 | 1.7% |
| White / Caucasian | 1,689 | 17.0% |
| Two or more Races | 442 | 4.4% |
| Some other Race | 50 | 0.5% |
| Total | 9,954 | 100.0% |
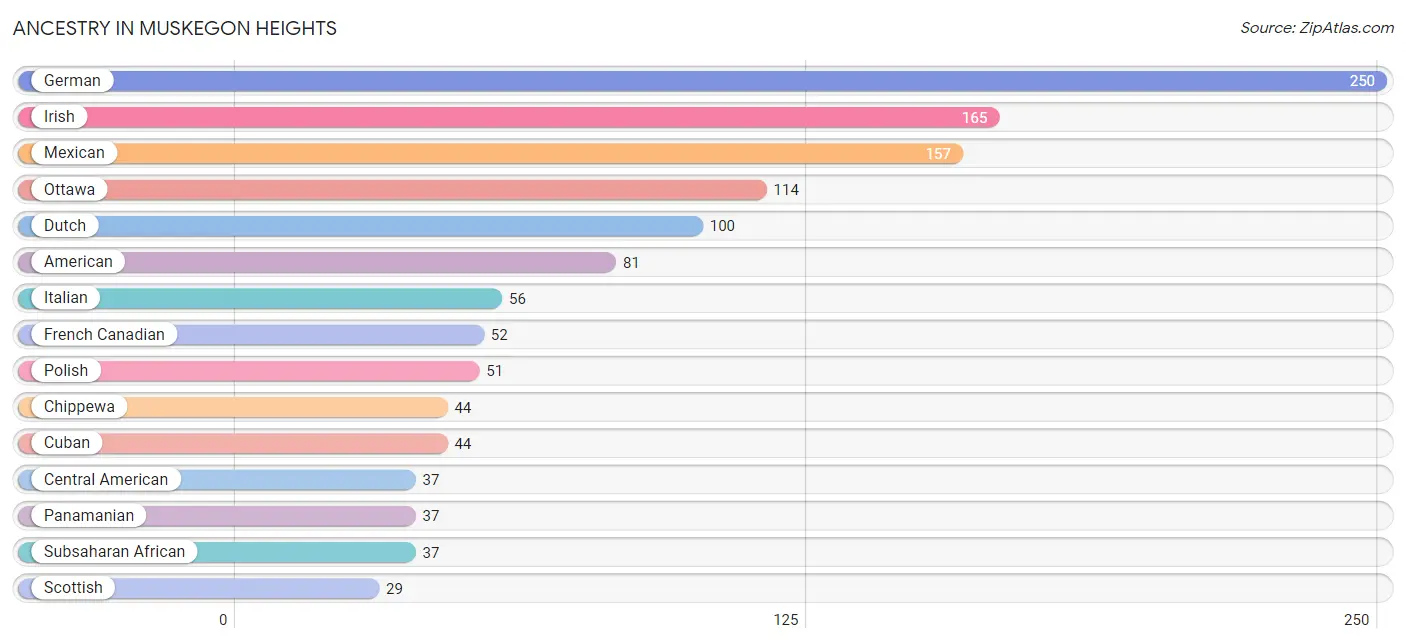
Ancestry in Muskegon Heights
The most populous ancestries reported in Muskegon Heights are German (250 | 2.5%), Irish (165 | 1.7%), Mexican (157 | 1.6%), Ottawa (114 | 1.1%), and Dutch (100 | 1.0%), together accounting for 7.9% of all Muskegon Heights residents.
| Ancestry | # Population | % Population |
| African | 19 | 0.2% |
| American | 81 | 0.8% |
| Arab | 16 | 0.2% |
| Burmese | 4 | 0.0% |
| Central American | 37 | 0.4% |
| Chippewa | 44 | 0.4% |
| Cuban | 44 | 0.4% |
| Czech | 6 | 0.1% |
| Dutch | 100 | 1.0% |
| Egyptian | 16 | 0.2% |
| English | 28 | 0.3% |
| European | 7 | 0.1% |
| Finnish | 25 | 0.3% |
| French | 4 | 0.0% |
| French Canadian | 52 | 0.5% |
| German | 250 | 2.5% |
| Greek | 7 | 0.1% |
| Hungarian | 1 | 0.0% |
| Irish | 165 | 1.7% |
| Italian | 56 | 0.6% |
| Jamaican | 6 | 0.1% |
| Mexican | 157 | 1.6% |
| Nigerian | 18 | 0.2% |
| Norwegian | 8 | 0.1% |
| Ottawa | 114 | 1.1% |
| Panamanian | 37 | 0.4% |
| Polish | 51 | 0.5% |
| Potawatomi | 9 | 0.1% |
| Russian | 6 | 0.1% |
| Scotch-Irish | 14 | 0.1% |
| Scottish | 29 | 0.3% |
| Serbian | 14 | 0.1% |
| Slavic | 4 | 0.0% |
| Subsaharan African | 37 | 0.4% |
| Swedish | 14 | 0.1% |
| Swiss | 17 | 0.2% | View All 36 Rows |
Immigrants in Muskegon Heights
The most numerous immigrant groups reported in Muskegon Heights came from Latin America (132 | 1.3%), Central America (101 | 1.0%), Mexico (101 | 1.0%), Caribbean (31 | 0.3%), and Cuba (31 | 0.3%), together accounting for 4.0% of all Muskegon Heights residents.
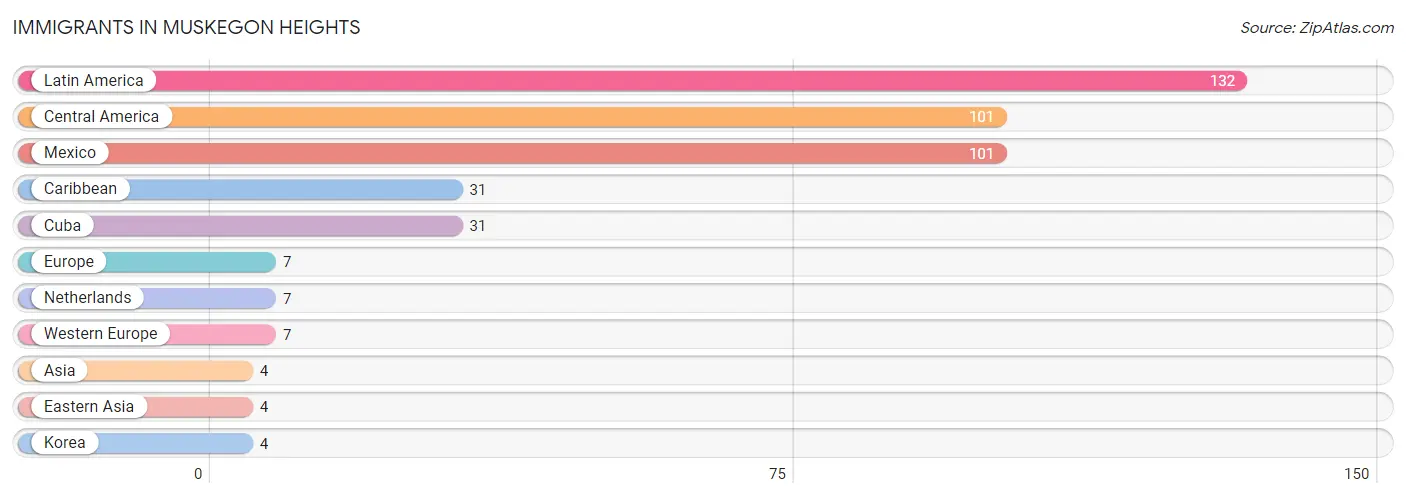
| Immigration Origin | # Population | % Population |
| Asia | 4 | 0.0% |
| Caribbean | 31 | 0.3% |
| Central America | 101 | 1.0% |
| Cuba | 31 | 0.3% |
| Eastern Asia | 4 | 0.0% |
| Europe | 7 | 0.1% |
| Korea | 4 | 0.0% |
| Latin America | 132 | 1.3% |
| Mexico | 101 | 1.0% |
| Netherlands | 7 | 0.1% |
| Western Europe | 7 | 0.1% | View All 11 Rows |
Sex and Age in Muskegon Heights
Sex and Age in Muskegon Heights
The most populous age groups in Muskegon Heights are 5 to 9 Years (594 | 12.8%) for men and 20 to 24 Years (448 | 8.4%) for women.
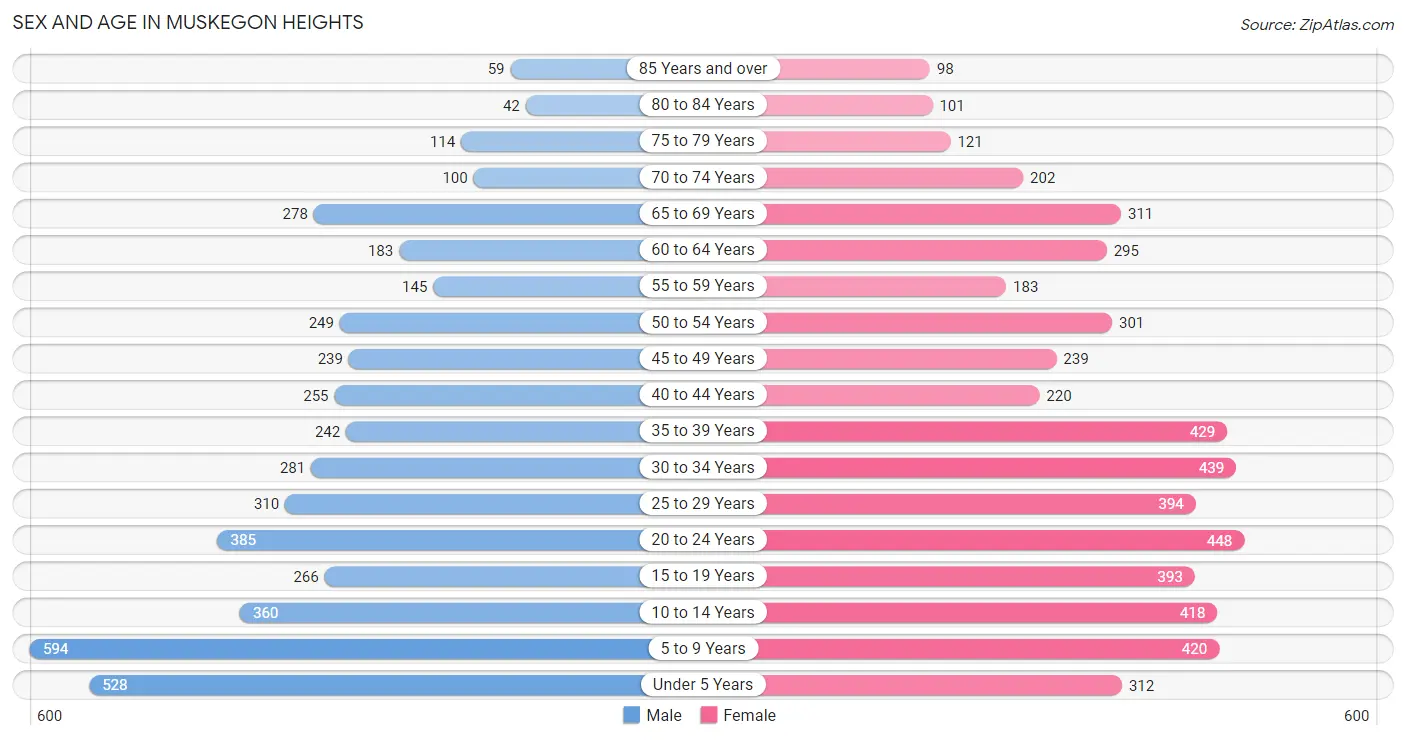
| Age Bracket | Male | Female |
| Under 5 Years | 528 (11.4%) | 312 (5.9%) |
| 5 to 9 Years | 594 (12.8%) | 420 (7.9%) |
| 10 to 14 Years | 360 (7.8%) | 418 (7.9%) |
| 15 to 19 Years | 266 (5.8%) | 393 (7.4%) |
| 20 to 24 Years | 385 (8.3%) | 448 (8.4%) |
| 25 to 29 Years | 310 (6.7%) | 394 (7.4%) |
| 30 to 34 Years | 281 (6.1%) | 439 (8.3%) |
| 35 to 39 Years | 242 (5.2%) | 429 (8.1%) |
| 40 to 44 Years | 255 (5.5%) | 220 (4.1%) |
| 45 to 49 Years | 239 (5.2%) | 239 (4.5%) |
| 50 to 54 Years | 249 (5.4%) | 301 (5.7%) |
| 55 to 59 Years | 145 (3.1%) | 183 (3.4%) |
| 60 to 64 Years | 183 (4.0%) | 295 (5.5%) |
| 65 to 69 Years | 278 (6.0%) | 311 (5.8%) |
| 70 to 74 Years | 100 (2.2%) | 202 (3.8%) |
| 75 to 79 Years | 114 (2.5%) | 121 (2.3%) |
| 80 to 84 Years | 42 (0.9%) | 101 (1.9%) |
| 85 Years and over | 59 (1.3%) | 98 (1.8%) |
| Total | 4,630 (100.0%) | 5,324 (100.0%) |
Families and Households in Muskegon Heights
Median Family Size in Muskegon Heights
The median family size in Muskegon Heights is 3.45 persons per family, with married-couple families (545 | 24.4%) accounting for the largest median family size of 3.62 persons per family. On the other hand, single male/father families (280 | 12.5%) represent the smallest median family size with 2.55 persons per family.
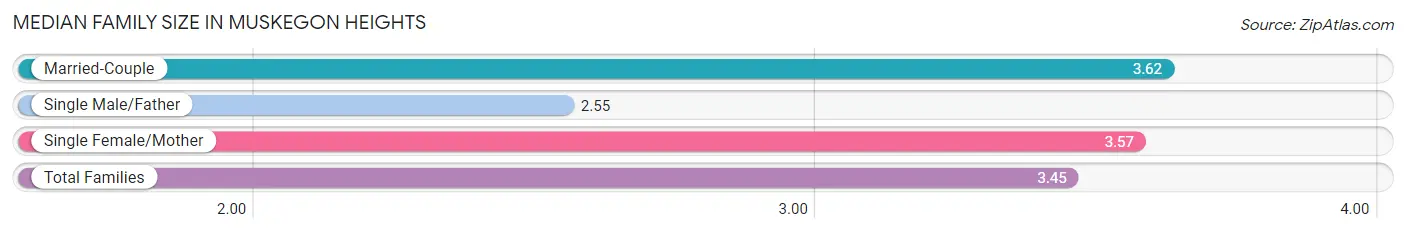
| Family Type | # Families | Family Size |
| Married-Couple | 545 (24.4%) | 3.62 |
| Single Male/Father | 280 (12.5%) | 2.55 |
| Single Female/Mother | 1,408 (63.0%) | 3.57 |
| Total Families | 2,233 (100.0%) | 3.45 |
Median Household Size in Muskegon Heights
The median household size in Muskegon Heights is 2.73 persons per household, with single female/mother households (1,408 | 39.0%) accounting for the largest median household size of 3.69 persons per household. non-family households (1,378 | 38.2%) represent the smallest median household size with 1.35 persons per household.
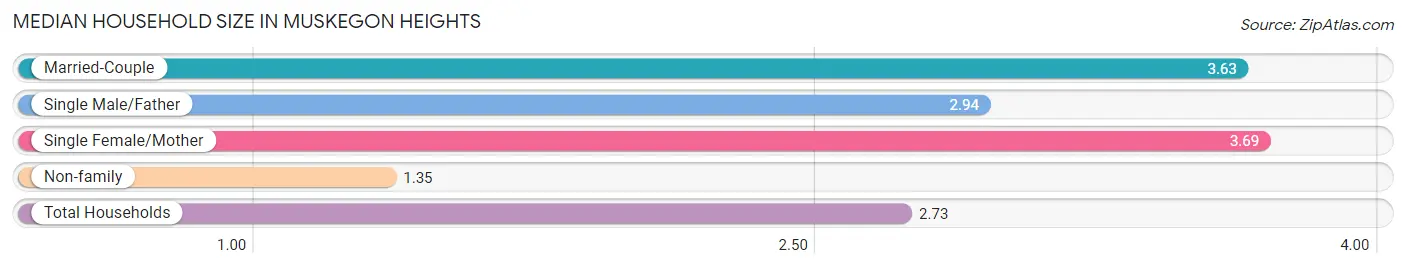
| Household Type | # Households | Household Size |
| Married-Couple | 545 (15.1%) | 3.63 |
| Single Male/Father | 280 (7.7%) | 2.94 |
| Single Female/Mother | 1,408 (39.0%) | 3.69 |
| Non-family | 1,378 (38.2%) | 1.35 |
| Total Households | 3,611 (100.0%) | 2.73 |
Household Size by Marriage Status in Muskegon Heights
Out of a total of 3,611 households in Muskegon Heights, 2,233 (61.8%) are family households, while 1,378 (38.2%) are nonfamily households. The most numerous type of family households are 2-person households, comprising 814, and the most common type of nonfamily households are 1-person households, comprising 1,101.
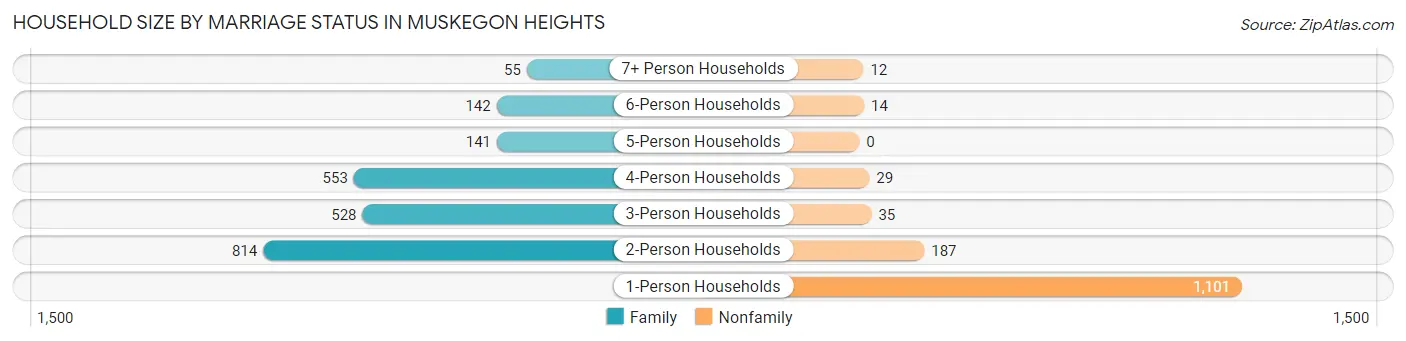
| Household Size | Family Households | Nonfamily Households |
| 1-Person Households | - | 1,101 (30.5%) |
| 2-Person Households | 814 (22.5%) | 187 (5.2%) |
| 3-Person Households | 528 (14.6%) | 35 (1.0%) |
| 4-Person Households | 553 (15.3%) | 29 (0.8%) |
| 5-Person Households | 141 (3.9%) | 0 (0.0%) |
| 6-Person Households | 142 (3.9%) | 14 (0.4%) |
| 7+ Person Households | 55 (1.5%) | 12 (0.3%) |
| Total | 2,233 (61.8%) | 1,378 (38.2%) |
Female Fertility in Muskegon Heights
Fertility by Age in Muskegon Heights
Average fertility rate in Muskegon Heights is 10.0 births per 1,000 women. Women in the age bracket of 35 to 50 years have the highest fertility rate with 18.0 births per 1,000 women. Women in the age bracket of 35 to 50 years acount for 66.7% of all women with births.
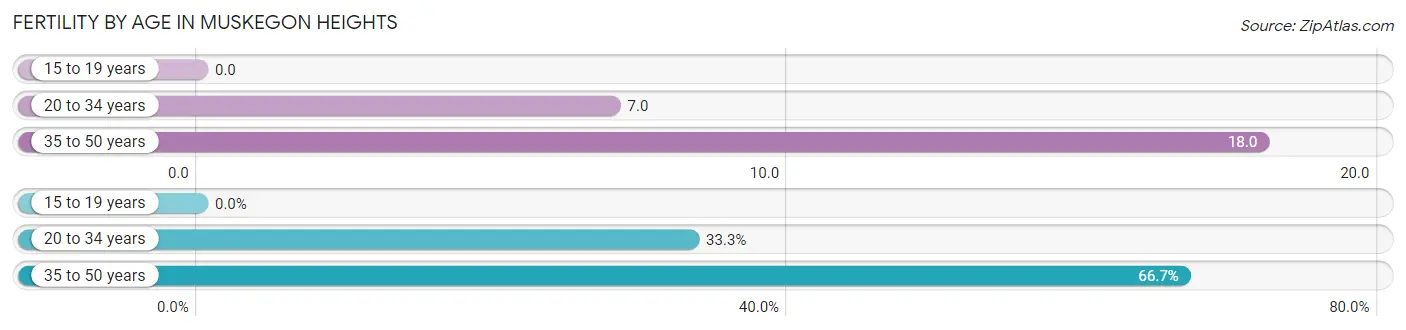
| Age Bracket | Women with Births | Births / 1,000 Women |
| 15 to 19 years | 0 (0.0%) | 0.0 |
| 20 to 34 years | 9 (33.3%) | 7.0 |
| 35 to 50 years | 18 (66.7%) | 18.0 |
| Total | 27 (100.0%) | 10.0 |
Fertility by Age by Marriage Status in Muskegon Heights
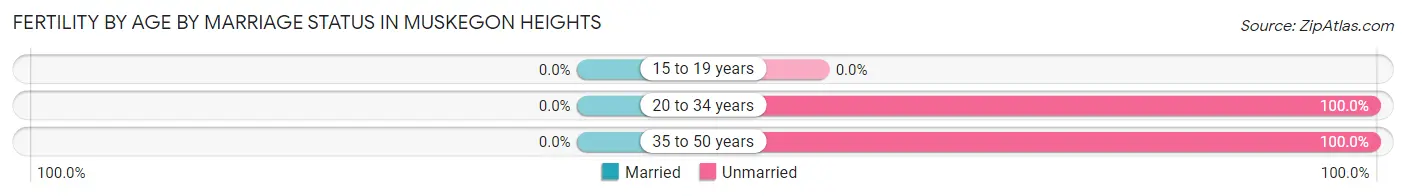
| Age Bracket | Married | Unmarried |
| 15 to 19 years | 0 (0.0%) | 0 (0.0%) |
| 20 to 34 years | 0 (0.0%) | 9 (100.0%) |
| 35 to 50 years | 0 (0.0%) | 18 (100.0%) |
| Total | 0 (0.0%) | 27 (100.0%) |
Fertility by Education in Muskegon Heights
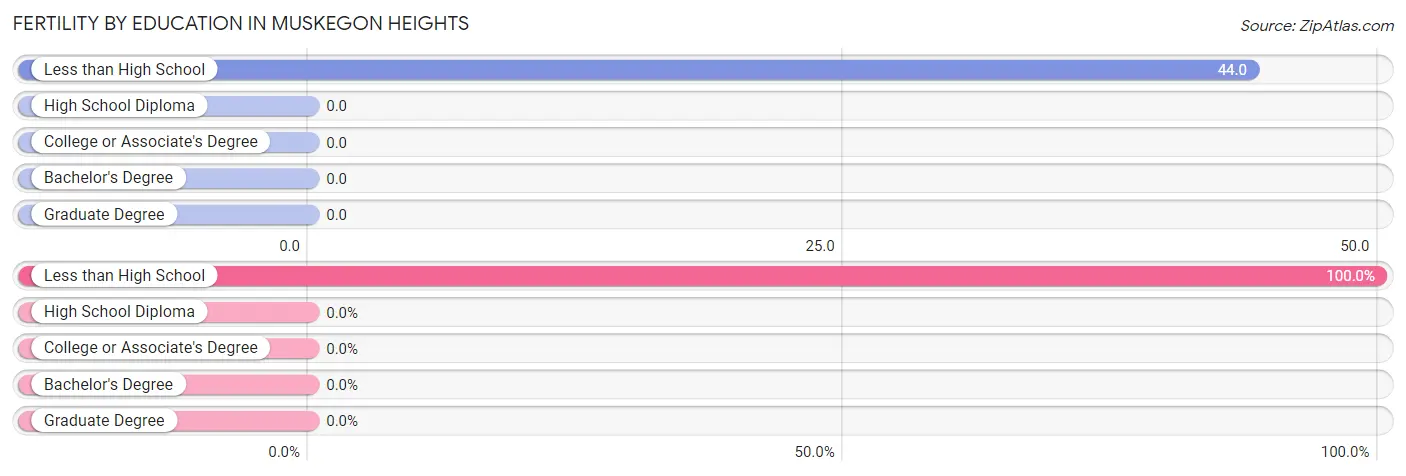
| Educational Attainment | Women with Births | Births / 1,000 Women |
| Less than High School | 27 (100.0%) | 44.0 |
| High School Diploma | 0 (0.0%) | 0.0 |
| College or Associate's Degree | 0 (0.0%) | 0.0 |
| Bachelor's Degree | 0 (0.0%) | 0.0 |
| Graduate Degree | 0 (0.0%) | 0.0 |
| Total | 27 (100.0%) | 10.0 |
Fertility by Education by Marriage Status in Muskegon Heights
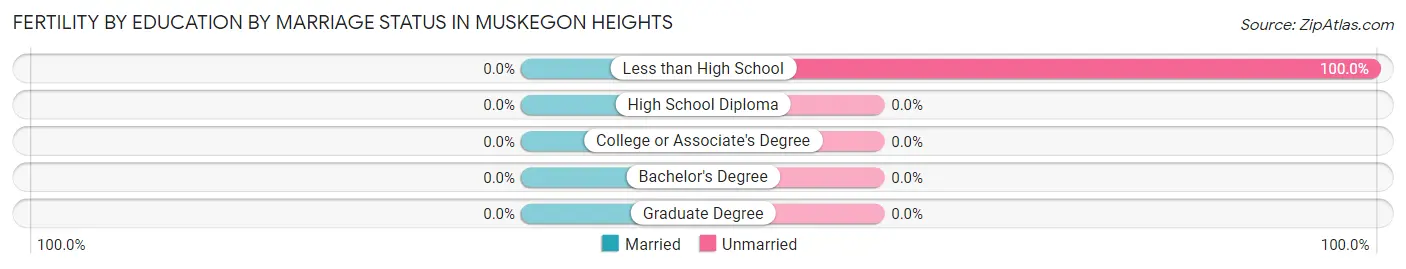
| Educational Attainment | Married | Unmarried |
| Less than High School | 0 (0.0%) | 27 (100.0%) |
| High School Diploma | 0 (0.0%) | 0 (0.0%) |
| College or Associate's Degree | 0 (0.0%) | 0 (0.0%) |
| Bachelor's Degree | 0 (0.0%) | 0 (0.0%) |
| Graduate Degree | 0 (0.0%) | 0 (0.0%) |
| Total | 0 (0.0%) | 27 (100.0%) |
Employment Characteristics in Muskegon Heights
Employment by Class of Employer in Muskegon Heights
Among the 3,182 employed individuals in Muskegon Heights, private company employees (2,515 | 79.0%), not-for-profit organizations (356 | 11.2%), and local government employees (163 | 5.1%) make up the most common classes of employment.
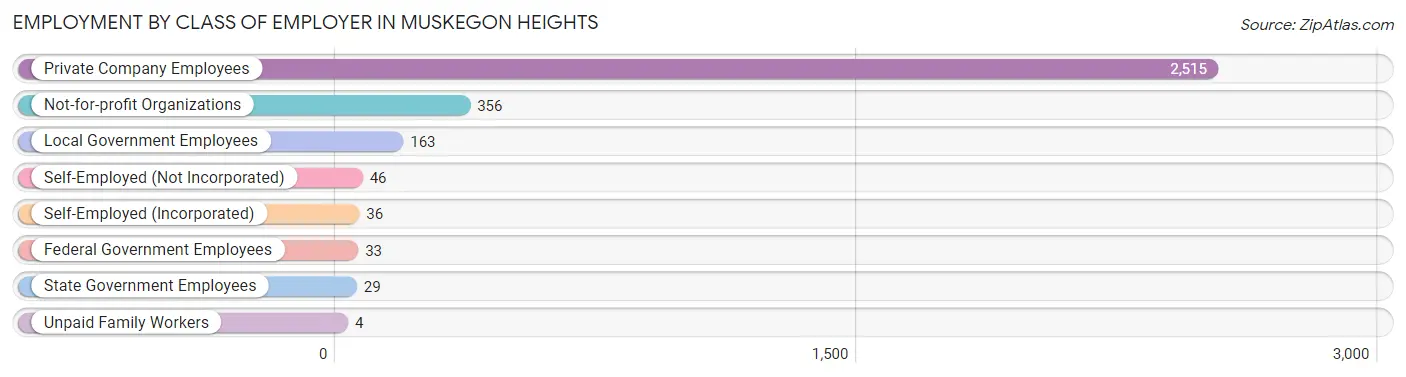
| Employer Class | # Employees | % Employees |
| Private Company Employees | 2,515 | 79.0% |
| Self-Employed (Incorporated) | 36 | 1.1% |
| Self-Employed (Not Incorporated) | 46 | 1.5% |
| Not-for-profit Organizations | 356 | 11.2% |
| Local Government Employees | 163 | 5.1% |
| State Government Employees | 29 | 0.9% |
| Federal Government Employees | 33 | 1.0% |
| Unpaid Family Workers | 4 | 0.1% |
| Total | 3,182 | 100.0% |
Employment Status by Age in Muskegon Heights
According to the labor force statistics for Muskegon Heights, out of the total population over 16 years of age (7,138), 58.4% or 4,169 individuals are in the labor force, with 20.5% or 855 of them unemployed. The age group with the highest labor force participation rate is 25 to 29 years, with 83.2% or 586 individuals in the labor force. Within the labor force, the 16 to 19 years age range has the highest percentage of unemployed individuals, with 65.4% or 121 of them being unemployed.
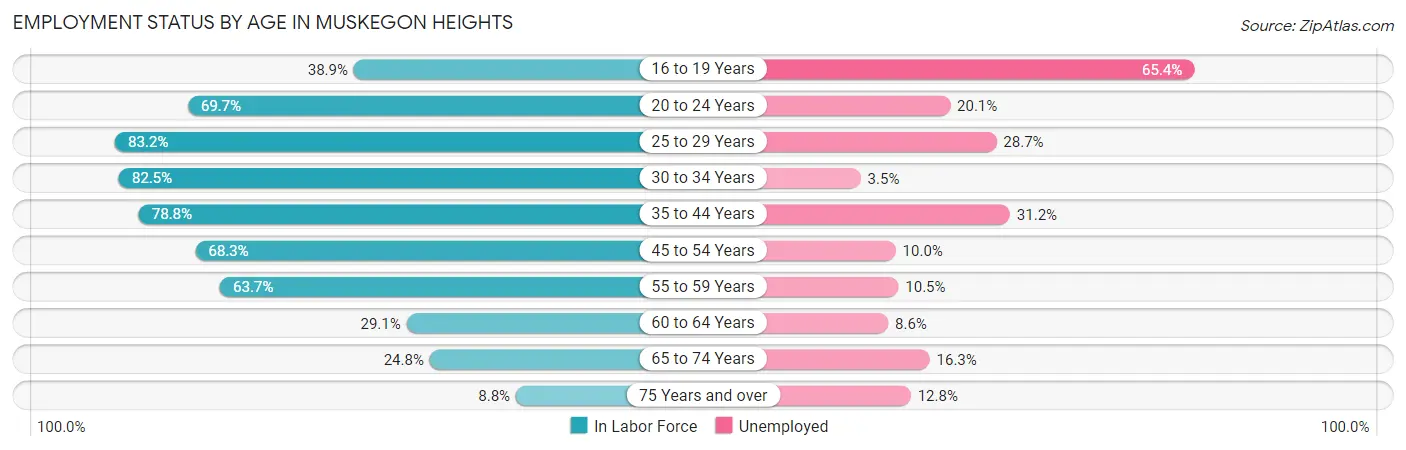
| Age Bracket | In Labor Force | Unemployed |
| 16 to 19 Years | 185 (38.9%) | 121 (65.4%) |
| 20 to 24 Years | 581 (69.7%) | 117 (20.1%) |
| 25 to 29 Years | 586 (83.2%) | 168 (28.7%) |
| 30 to 34 Years | 594 (82.5%) | 21 (3.5%) |
| 35 to 44 Years | 903 (78.8%) | 282 (31.2%) |
| 45 to 54 Years | 702 (68.3%) | 70 (10.0%) |
| 55 to 59 Years | 209 (63.7%) | 22 (10.5%) |
| 60 to 64 Years | 139 (29.1%) | 12 (8.6%) |
| 65 to 74 Years | 221 (24.8%) | 36 (16.3%) |
| 75 Years and over | 47 (8.8%) | 6 (12.8%) |
| Total | 4,169 (58.4%) | 855 (20.5%) |
Employment Status by Educational Attainment in Muskegon Heights
According to labor force statistics for Muskegon Heights, 71.1% of individuals (3,131) out of the total population between 25 and 64 years of age (4,404) are in the labor force, with 18.4% or 576 of them being unemployed. The group with the highest labor force participation rate are those with the educational attainment of bachelor's degree or higher, with 87.2% or 360 individuals in the labor force. Within the labor force, individuals with less than high school education have the highest percentage of unemployment, with 32.8% or 114 of them being unemployed.
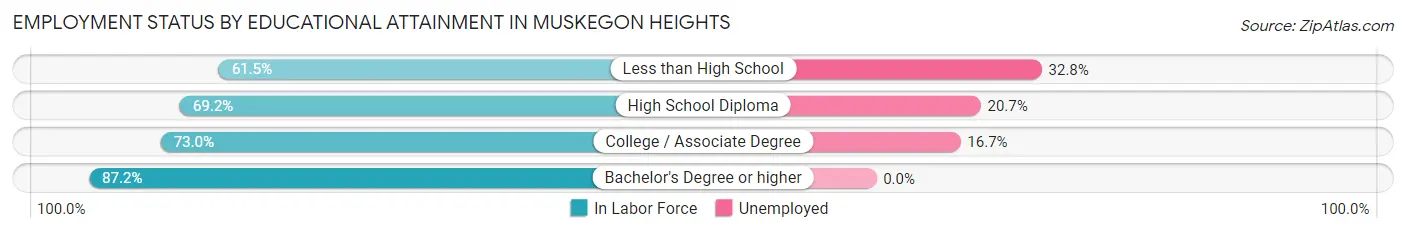
| Educational Attainment | In Labor Force | Unemployed |
| Less than High School | 348 (61.5%) | 186 (32.8%) |
| High School Diploma | 1,387 (69.2%) | 415 (20.7%) |
| College / Associate Degree | 1,037 (73.0%) | 237 (16.7%) |
| Bachelor's Degree or higher | 360 (87.2%) | 0 (0.0%) |
| Total | 3,131 (71.1%) | 810 (18.4%) |
Employment Occupations by Sex in Muskegon Heights
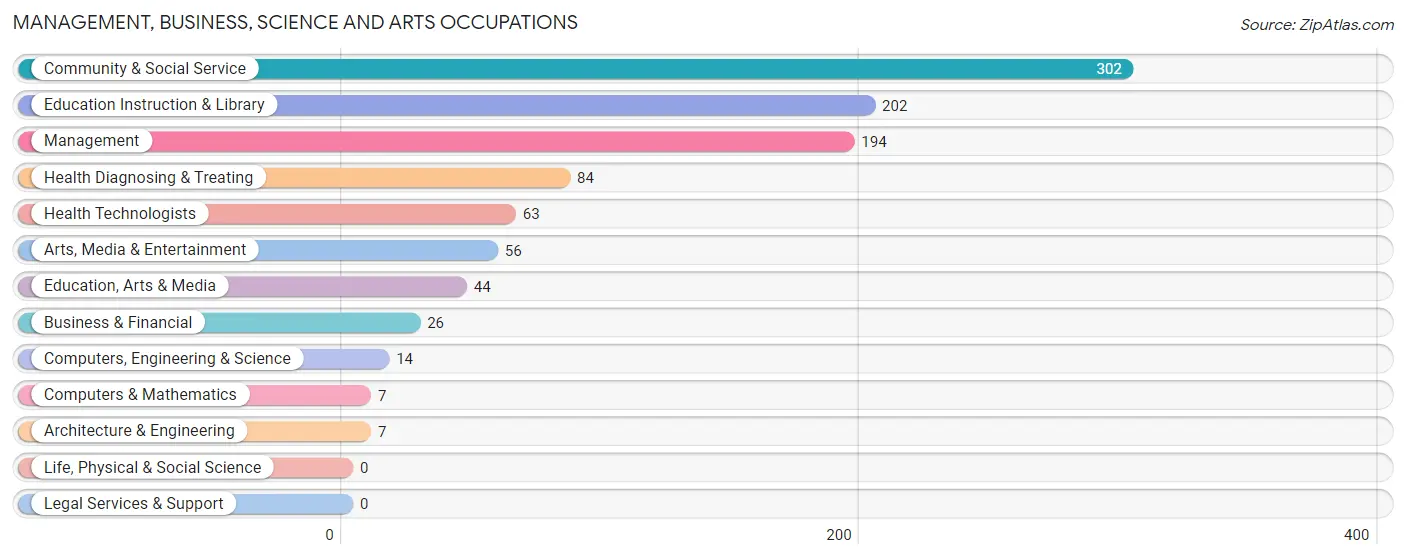
Management, Business, Science and Arts Occupations
The most common Management, Business, Science and Arts occupations in Muskegon Heights are Community & Social Service (302 | 9.1%), Education Instruction & Library (202 | 6.1%), Management (194 | 5.9%), Health Diagnosing & Treating (84 | 2.5%), and Health Technologists (63 | 1.9%).
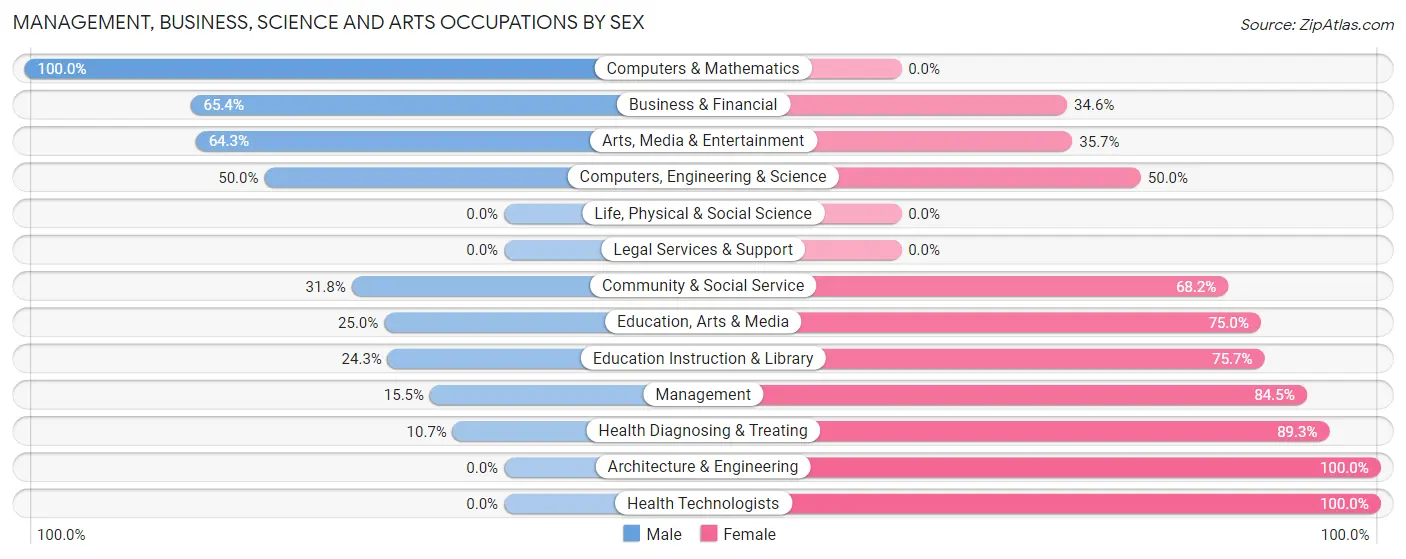
Management, Business, Science and Arts Occupations by Sex
Within the Management, Business, Science and Arts occupations in Muskegon Heights, the most male-oriented occupations are Computers & Mathematics (100.0%), Business & Financial (65.4%), and Arts, Media & Entertainment (64.3%), while the most female-oriented occupations are Architecture & Engineering (100.0%), Health Technologists (100.0%), and Health Diagnosing & Treating (89.3%).
| Occupation | Male | Female |
| Management | 30 (15.5%) | 164 (84.5%) |
| Business & Financial | 17 (65.4%) | 9 (34.6%) |
| Computers, Engineering & Science | 7 (50.0%) | 7 (50.0%) |
| Computers & Mathematics | 7 (100.0%) | 0 (0.0%) |
| Architecture & Engineering | 0 (0.0%) | 7 (100.0%) |
| Life, Physical & Social Science | 0 (0.0%) | 0 (0.0%) |
| Community & Social Service | 96 (31.8%) | 206 (68.2%) |
| Education, Arts & Media | 11 (25.0%) | 33 (75.0%) |
| Legal Services & Support | 0 (0.0%) | 0 (0.0%) |
| Education Instruction & Library | 49 (24.3%) | 153 (75.7%) |
| Arts, Media & Entertainment | 36 (64.3%) | 20 (35.7%) |
| Health Diagnosing & Treating | 9 (10.7%) | 75 (89.3%) |
| Health Technologists | 0 (0.0%) | 63 (100.0%) |
| Total (Category) | 159 (25.7%) | 461 (74.4%) |
| Total (Overall) | 1,338 (40.4%) | 1,974 (59.6%) |
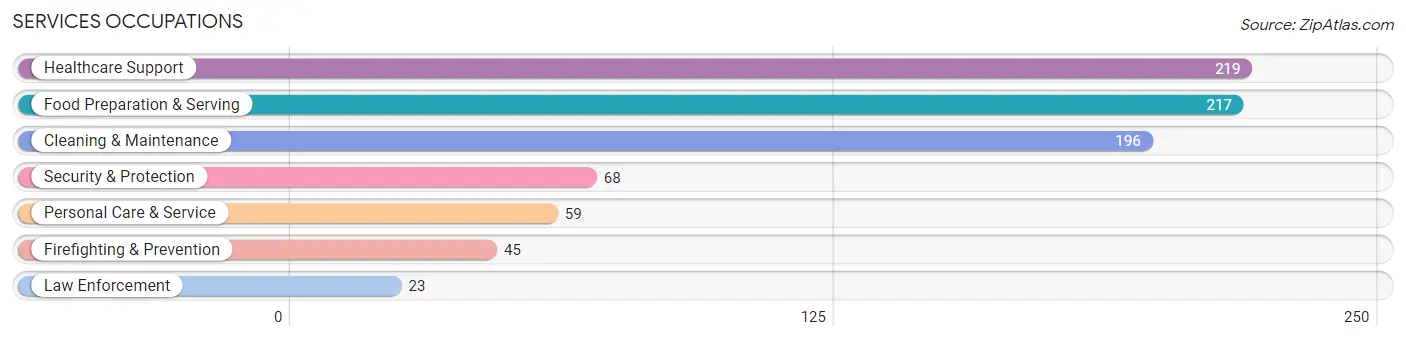
Services Occupations
The most common Services occupations in Muskegon Heights are Healthcare Support (219 | 6.6%), Food Preparation & Serving (217 | 6.6%), Cleaning & Maintenance (196 | 5.9%), Security & Protection (68 | 2.1%), and Personal Care & Service (59 | 1.8%).
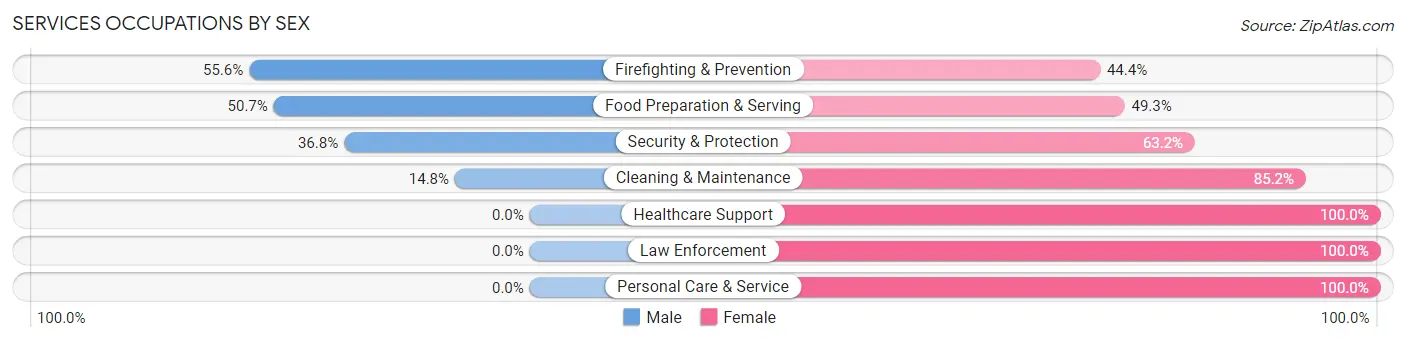
Services Occupations by Sex
Within the Services occupations in Muskegon Heights, the most male-oriented occupations are Firefighting & Prevention (55.6%), Food Preparation & Serving (50.7%), and Security & Protection (36.8%), while the most female-oriented occupations are Healthcare Support (100.0%), Law Enforcement (100.0%), and Personal Care & Service (100.0%).
| Occupation | Male | Female |
| Healthcare Support | 0 (0.0%) | 219 (100.0%) |
| Security & Protection | 25 (36.8%) | 43 (63.2%) |
| Firefighting & Prevention | 25 (55.6%) | 20 (44.4%) |
| Law Enforcement | 0 (0.0%) | 23 (100.0%) |
| Food Preparation & Serving | 110 (50.7%) | 107 (49.3%) |
| Cleaning & Maintenance | 29 (14.8%) | 167 (85.2%) |
| Personal Care & Service | 0 (0.0%) | 59 (100.0%) |
| Total (Category) | 164 (21.6%) | 595 (78.4%) |
| Total (Overall) | 1,338 (40.4%) | 1,974 (59.6%) |
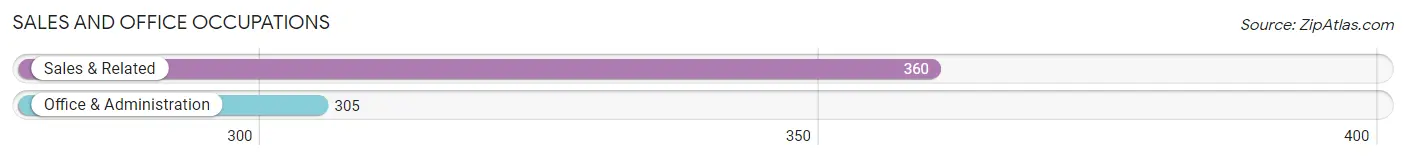
Sales and Office Occupations
The most common Sales and Office occupations in Muskegon Heights are Sales & Related (360 | 10.9%), and Office & Administration (305 | 9.2%).
Sales and Office Occupations by Sex
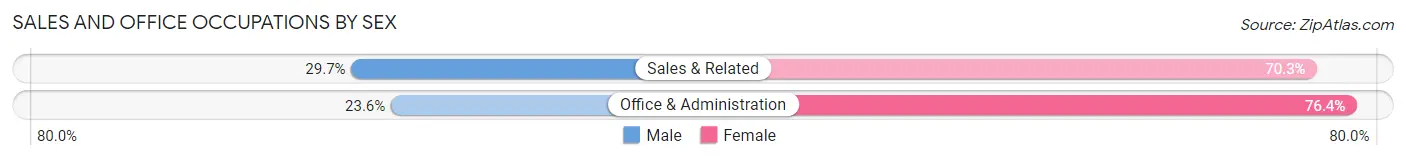
| Occupation | Male | Female |
| Sales & Related | 107 (29.7%) | 253 (70.3%) |
| Office & Administration | 72 (23.6%) | 233 (76.4%) |
| Total (Category) | 179 (26.9%) | 486 (73.1%) |
| Total (Overall) | 1,338 (40.4%) | 1,974 (59.6%) |
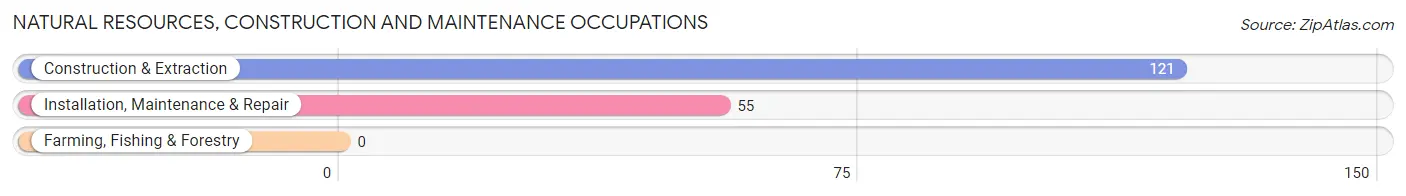
Natural Resources, Construction and Maintenance Occupations
The most common Natural Resources, Construction and Maintenance occupations in Muskegon Heights are Construction & Extraction (121 | 3.6%), and Installation, Maintenance & Repair (55 | 1.7%).
Natural Resources, Construction and Maintenance Occupations by Sex
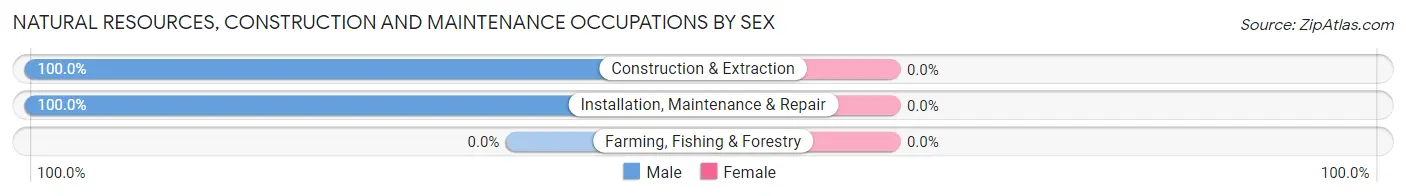
| Occupation | Male | Female |
| Farming, Fishing & Forestry | 0 (0.0%) | 0 (0.0%) |
| Construction & Extraction | 121 (100.0%) | 0 (0.0%) |
| Installation, Maintenance & Repair | 55 (100.0%) | 0 (0.0%) |
| Total (Category) | 176 (100.0%) | 0 (0.0%) |
| Total (Overall) | 1,338 (40.4%) | 1,974 (59.6%) |
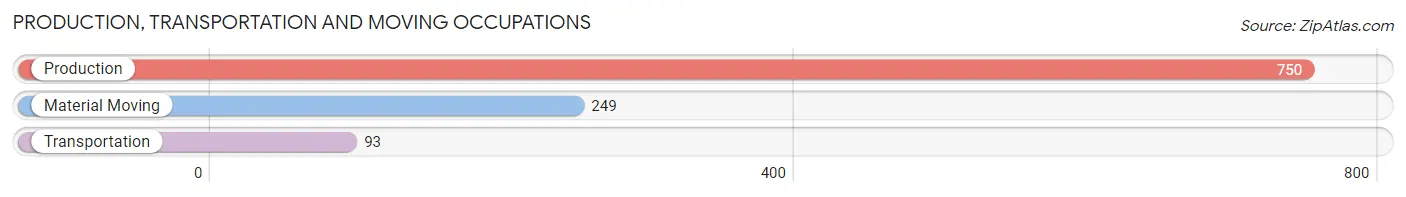
Production, Transportation and Moving Occupations
The most common Production, Transportation and Moving occupations in Muskegon Heights are Production (750 | 22.6%), Material Moving (249 | 7.5%), and Transportation (93 | 2.8%).
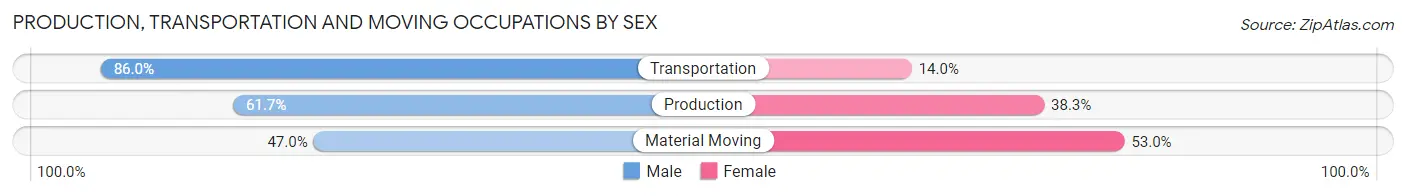
Production, Transportation and Moving Occupations by Sex
| Occupation | Male | Female |
| Production | 463 (61.7%) | 287 (38.3%) |
| Transportation | 80 (86.0%) | 13 (14.0%) |
| Material Moving | 117 (47.0%) | 132 (53.0%) |
| Total (Category) | 660 (60.4%) | 432 (39.6%) |
| Total (Overall) | 1,338 (40.4%) | 1,974 (59.6%) |
Employment Industries by Sex in Muskegon Heights
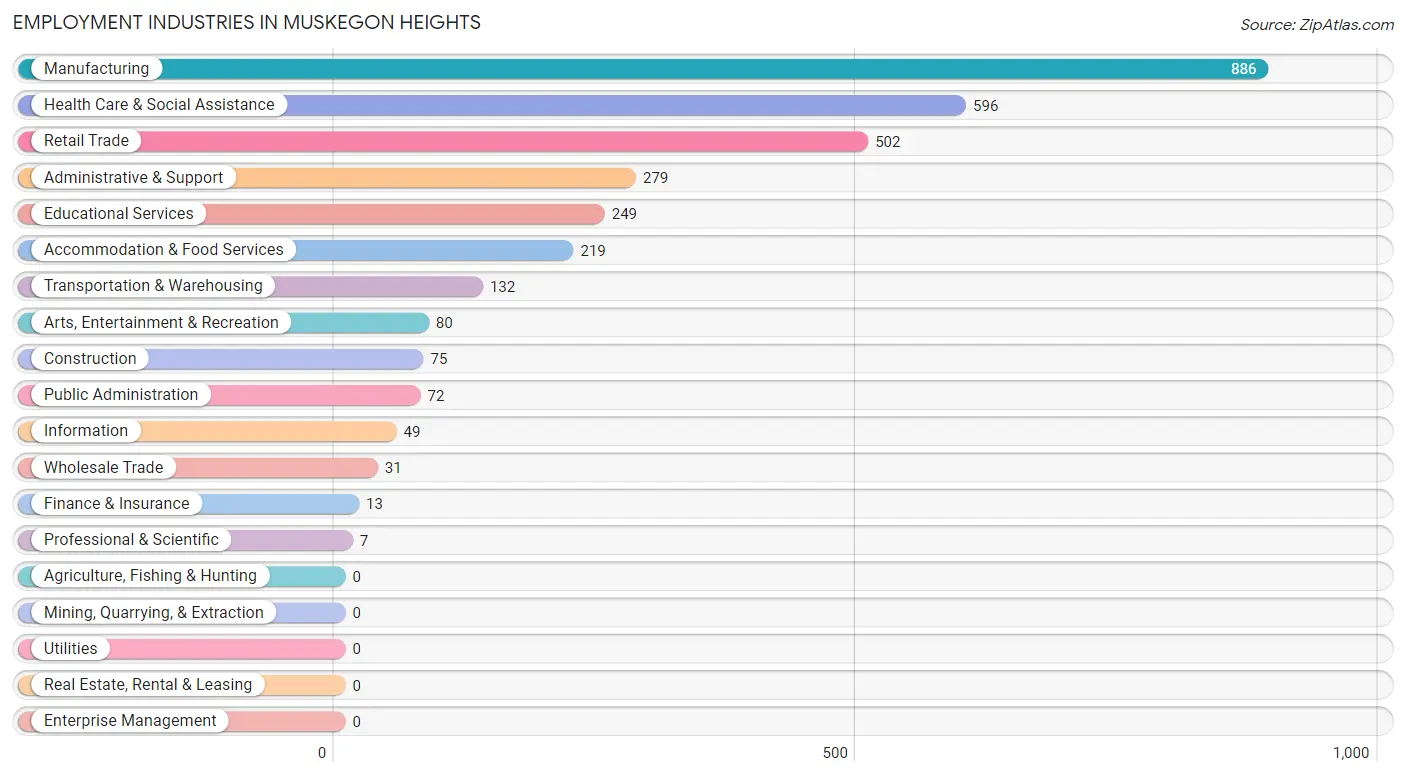
Employment Industries in Muskegon Heights
The major employment industries in Muskegon Heights include Manufacturing (886 | 26.8%), Health Care & Social Assistance (596 | 18.0%), Retail Trade (502 | 15.2%), Administrative & Support (279 | 8.4%), and Educational Services (249 | 7.5%).
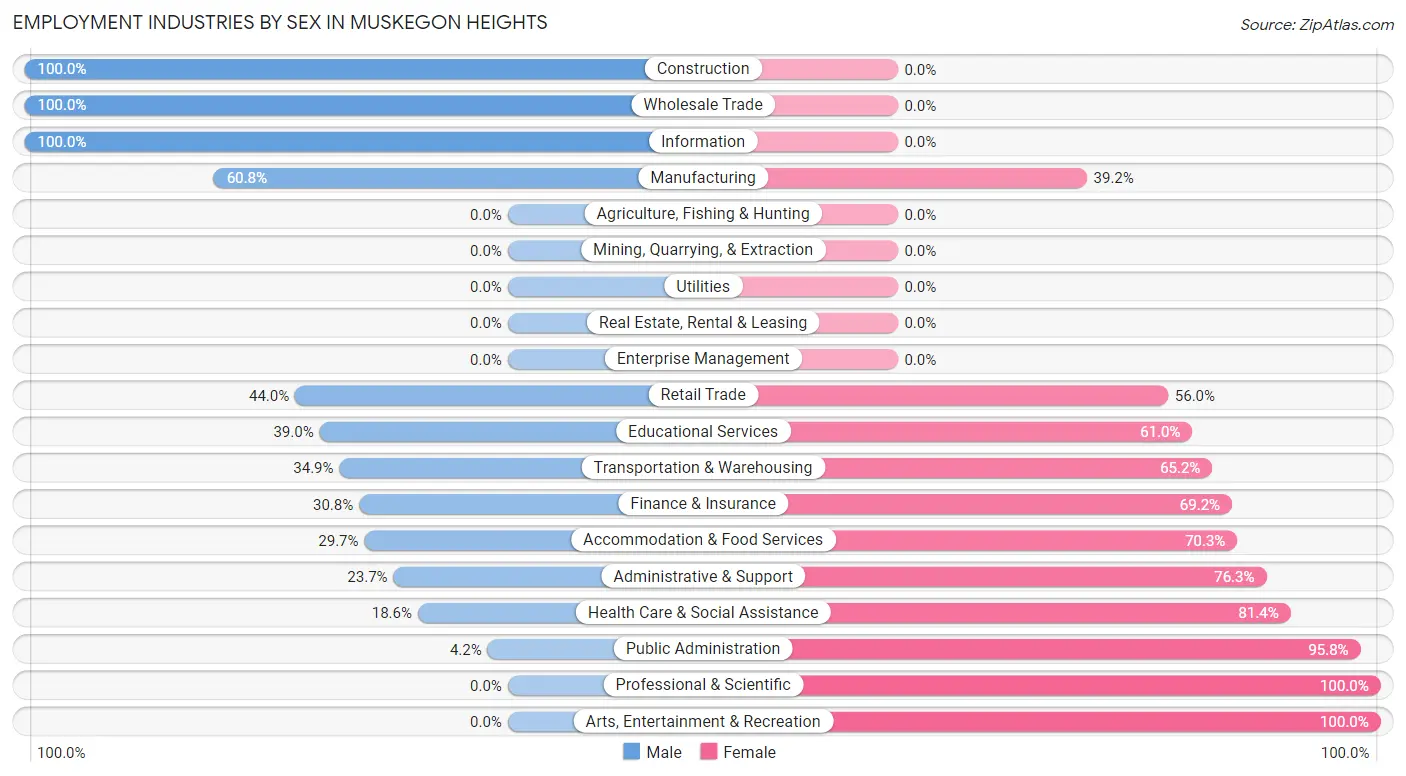
Employment Industries by Sex in Muskegon Heights
The Muskegon Heights industries that see more men than women are Construction (100.0%), Wholesale Trade (100.0%), and Information (100.0%), whereas the industries that tend to have a higher number of women are Professional & Scientific (100.0%), Arts, Entertainment & Recreation (100.0%), and Public Administration (95.8%).
| Industry | Male | Female |
| Agriculture, Fishing & Hunting | 0 (0.0%) | 0 (0.0%) |
| Mining, Quarrying, & Extraction | 0 (0.0%) | 0 (0.0%) |
| Construction | 75 (100.0%) | 0 (0.0%) |
| Manufacturing | 539 (60.8%) | 347 (39.2%) |
| Wholesale Trade | 31 (100.0%) | 0 (0.0%) |
| Retail Trade | 221 (44.0%) | 281 (56.0%) |
| Transportation & Warehousing | 46 (34.8%) | 86 (65.1%) |
| Utilities | 0 (0.0%) | 0 (0.0%) |
| Information | 49 (100.0%) | 0 (0.0%) |
| Finance & Insurance | 4 (30.8%) | 9 (69.2%) |
| Real Estate, Rental & Leasing | 0 (0.0%) | 0 (0.0%) |
| Professional & Scientific | 0 (0.0%) | 7 (100.0%) |
| Enterprise Management | 0 (0.0%) | 0 (0.0%) |
| Administrative & Support | 66 (23.7%) | 213 (76.3%) |
| Educational Services | 97 (39.0%) | 152 (61.0%) |
| Health Care & Social Assistance | 111 (18.6%) | 485 (81.4%) |
| Arts, Entertainment & Recreation | 0 (0.0%) | 80 (100.0%) |
| Accommodation & Food Services | 65 (29.7%) | 154 (70.3%) |
| Public Administration | 3 (4.2%) | 69 (95.8%) |
| Total | 1,338 (40.4%) | 1,974 (59.6%) |
Education in Muskegon Heights
School Enrollment in Muskegon Heights
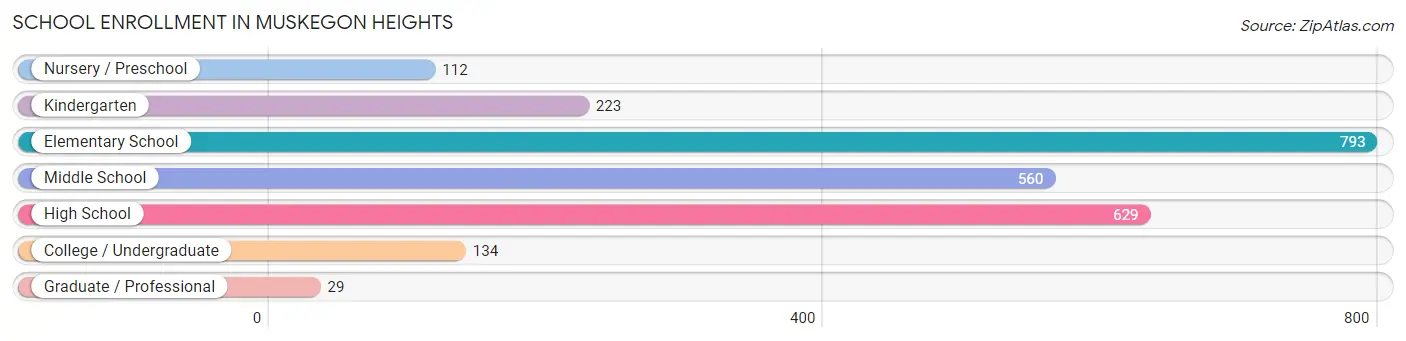
The most common levels of schooling among the 2,480 students in Muskegon Heights are elementary school (793 | 32.0%), high school (629 | 25.4%), and middle school (560 | 22.6%).
| School Level | # Students | % Students |
| Nursery / Preschool | 112 | 4.5% |
| Kindergarten | 223 | 9.0% |
| Elementary School | 793 | 32.0% |
| Middle School | 560 | 22.6% |
| High School | 629 | 25.4% |
| College / Undergraduate | 134 | 5.4% |
| Graduate / Professional | 29 | 1.2% |
| Total | 2,480 | 100.0% |
School Enrollment by Age by Funding Source in Muskegon Heights
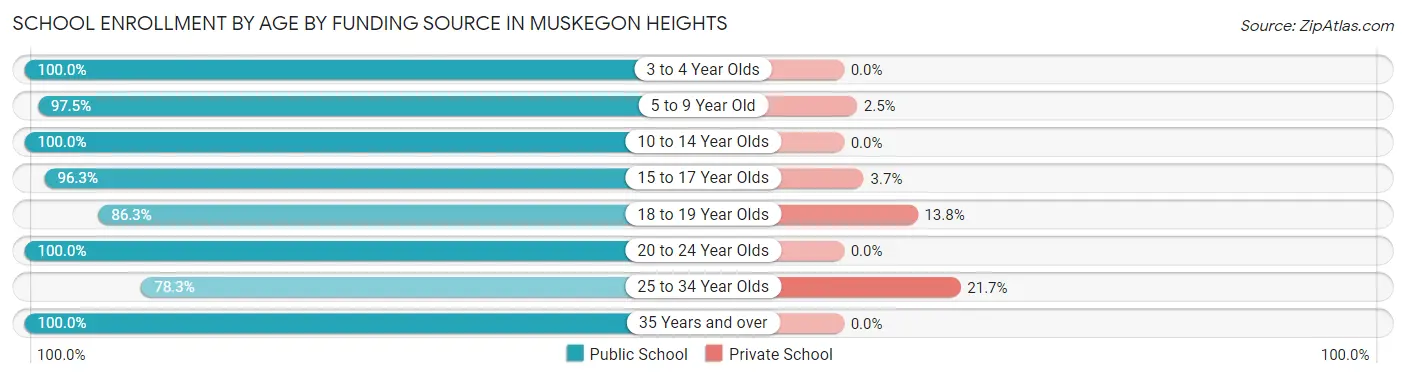
Out of a total of 2,480 students who are enrolled in schools in Muskegon Heights, 72 (2.9%) attend a private institution, while the remaining 2,408 (97.1%) are enrolled in public schools. The age group of 25 to 34 year olds has the highest likelihood of being enrolled in private schools, with 15 (21.7% in the age bracket) enrolled. Conversely, the age group of 3 to 4 year olds has the lowest likelihood of being enrolled in a private school, with 56 (100.0% in the age bracket) attending a public institution.
| Age Bracket | Public School | Private School |
| 3 to 4 Year Olds | 56 (100.0%) | 0 (0.0%) |
| 5 to 9 Year Old | 911 (97.5%) | 23 (2.5%) |
| 10 to 14 Year Olds | 778 (100.0%) | 0 (0.0%) |
| 15 to 17 Year Olds | 336 (96.3%) | 13 (3.7%) |
| 18 to 19 Year Olds | 138 (86.3%) | 22 (13.8%) |
| 20 to 24 Year Olds | 89 (100.0%) | 0 (0.0%) |
| 25 to 34 Year Olds | 54 (78.3%) | 15 (21.7%) |
| 35 Years and over | 45 (100.0%) | 0 (0.0%) |
| Total | 2,408 (97.1%) | 72 (2.9%) |
Educational Attainment by Field of Study in Muskegon Heights
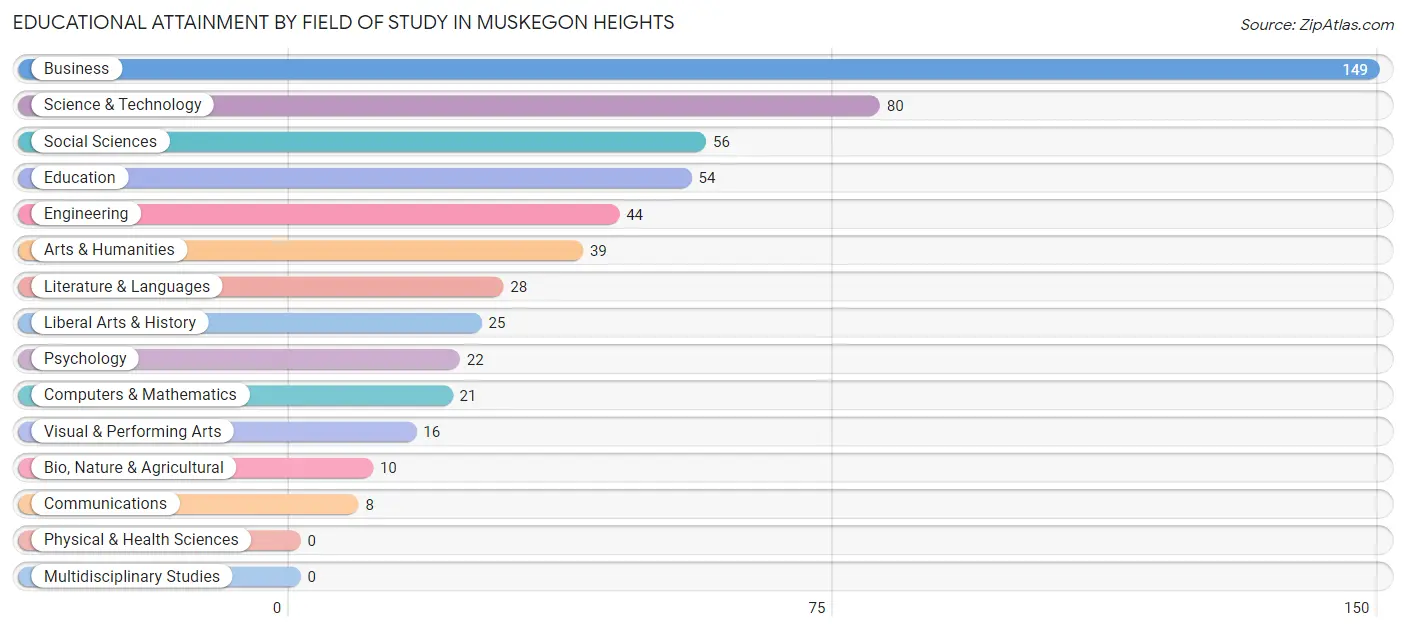
Business (149 | 27.0%), science & technology (80 | 14.5%), social sciences (56 | 10.1%), education (54 | 9.8%), and engineering (44 | 8.0%) are the most common fields of study among 552 individuals in Muskegon Heights who have obtained a bachelor's degree or higher.
| Field of Study | # Graduates | % Graduates |
| Computers & Mathematics | 21 | 3.8% |
| Bio, Nature & Agricultural | 10 | 1.8% |
| Physical & Health Sciences | 0 | 0.0% |
| Psychology | 22 | 4.0% |
| Social Sciences | 56 | 10.1% |
| Engineering | 44 | 8.0% |
| Multidisciplinary Studies | 0 | 0.0% |
| Science & Technology | 80 | 14.5% |
| Business | 149 | 27.0% |
| Education | 54 | 9.8% |
| Literature & Languages | 28 | 5.1% |
| Liberal Arts & History | 25 | 4.5% |
| Visual & Performing Arts | 16 | 2.9% |
| Communications | 8 | 1.5% |
| Arts & Humanities | 39 | 7.1% |
| Total | 552 | 100.0% |
Transportation & Commute in Muskegon Heights
Vehicle Availability by Sex in Muskegon Heights
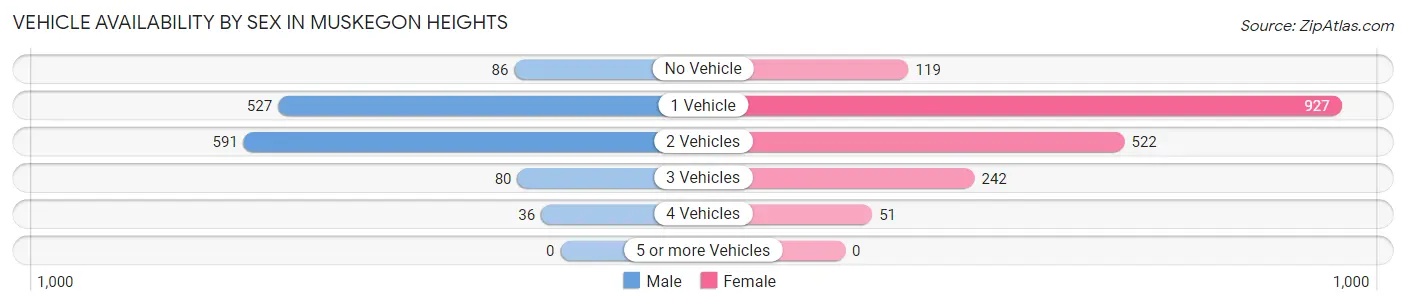
The most prevalent vehicle ownership categories in Muskegon Heights are males with 2 vehicles (591, accounting for 44.8%) and females with 2 vehicles (522, making up 31.8%).
| Vehicles Available | Male | Female |
| No Vehicle | 86 (6.5%) | 119 (6.4%) |
| 1 Vehicle | 527 (39.9%) | 927 (49.8%) |
| 2 Vehicles | 591 (44.8%) | 522 (28.1%) |
| 3 Vehicles | 80 (6.1%) | 242 (13.0%) |
| 4 Vehicles | 36 (2.7%) | 51 (2.7%) |
| 5 or more Vehicles | 0 (0.0%) | 0 (0.0%) |
| Total | 1,320 (100.0%) | 1,861 (100.0%) |
Commute Time in Muskegon Heights
The most frequently occuring commute durations in Muskegon Heights are 5 to 9 minutes (639 commuters, 20.2%), 15 to 19 minutes (591 commuters, 18.7%), and 10 to 14 minutes (526 commuters, 16.6%).

| Commute Time | # Commuters | % Commuters |
| Less than 5 Minutes | 144 | 4.5% |
| 5 to 9 Minutes | 639 | 20.2% |
| 10 to 14 Minutes | 526 | 16.6% |
| 15 to 19 Minutes | 591 | 18.7% |
| 20 to 24 Minutes | 380 | 12.0% |
| 25 to 29 Minutes | 195 | 6.2% |
| 30 to 34 Minutes | 196 | 6.2% |
| 35 to 39 Minutes | 7 | 0.2% |
| 40 to 44 Minutes | 54 | 1.7% |
| 45 to 59 Minutes | 238 | 7.5% |
| 60 to 89 Minutes | 196 | 6.2% |
| 90 or more Minutes | 0 | 0.0% |
Commute Time by Sex in Muskegon Heights
The most common commute times in Muskegon Heights are 5 to 9 minutes (298 commuters, 22.7%) for males and 15 to 19 minutes (425 commuters, 22.9%) for females.
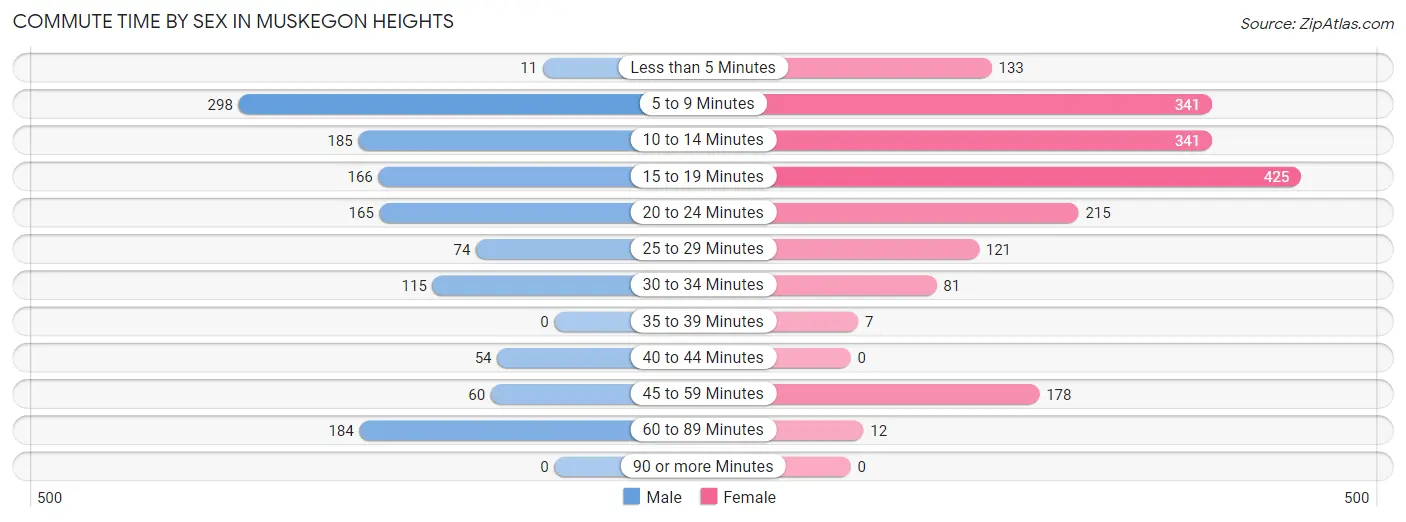
| Commute Time | Male | Female |
| Less than 5 Minutes | 11 (0.8%) | 133 (7.2%) |
| 5 to 9 Minutes | 298 (22.7%) | 341 (18.4%) |
| 10 to 14 Minutes | 185 (14.1%) | 341 (18.4%) |
| 15 to 19 Minutes | 166 (12.7%) | 425 (22.9%) |
| 20 to 24 Minutes | 165 (12.6%) | 215 (11.6%) |
| 25 to 29 Minutes | 74 (5.6%) | 121 (6.5%) |
| 30 to 34 Minutes | 115 (8.8%) | 81 (4.4%) |
| 35 to 39 Minutes | 0 (0.0%) | 7 (0.4%) |
| 40 to 44 Minutes | 54 (4.1%) | 0 (0.0%) |
| 45 to 59 Minutes | 60 (4.6%) | 178 (9.6%) |
| 60 to 89 Minutes | 184 (14.0%) | 12 (0.6%) |
| 90 or more Minutes | 0 (0.0%) | 0 (0.0%) |
Time of Departure to Work by Sex in Muskegon Heights
The most frequent times of departure to work in Muskegon Heights are 12:00 AM to 4:59 AM (235, 17.9%) for males and 7:30 AM to 7:59 AM (434, 23.4%) for females.
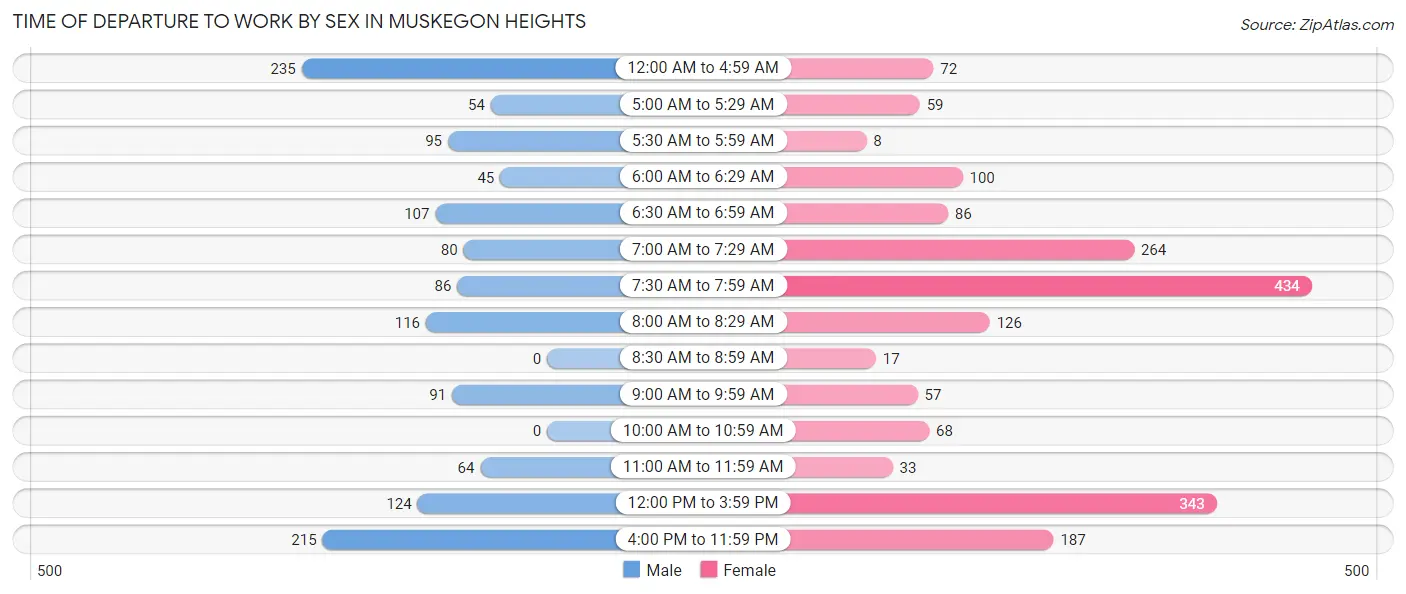
| Time of Departure | Male | Female |
| 12:00 AM to 4:59 AM | 235 (17.9%) | 72 (3.9%) |
| 5:00 AM to 5:29 AM | 54 (4.1%) | 59 (3.2%) |
| 5:30 AM to 5:59 AM | 95 (7.2%) | 8 (0.4%) |
| 6:00 AM to 6:29 AM | 45 (3.4%) | 100 (5.4%) |
| 6:30 AM to 6:59 AM | 107 (8.2%) | 86 (4.6%) |
| 7:00 AM to 7:29 AM | 80 (6.1%) | 264 (14.2%) |
| 7:30 AM to 7:59 AM | 86 (6.6%) | 434 (23.4%) |
| 8:00 AM to 8:29 AM | 116 (8.8%) | 126 (6.8%) |
| 8:30 AM to 8:59 AM | 0 (0.0%) | 17 (0.9%) |
| 9:00 AM to 9:59 AM | 91 (6.9%) | 57 (3.1%) |
| 10:00 AM to 10:59 AM | 0 (0.0%) | 68 (3.7%) |
| 11:00 AM to 11:59 AM | 64 (4.9%) | 33 (1.8%) |
| 12:00 PM to 3:59 PM | 124 (9.5%) | 343 (18.5%) |
| 4:00 PM to 11:59 PM | 215 (16.4%) | 187 (10.1%) |
| Total | 1,312 (100.0%) | 1,854 (100.0%) |
Housing Occupancy in Muskegon Heights
Occupancy by Ownership in Muskegon Heights
Of the total 3,611 dwellings in Muskegon Heights, owner-occupied units account for 1,703 (47.2%), while renter-occupied units make up 1,908 (52.8%).
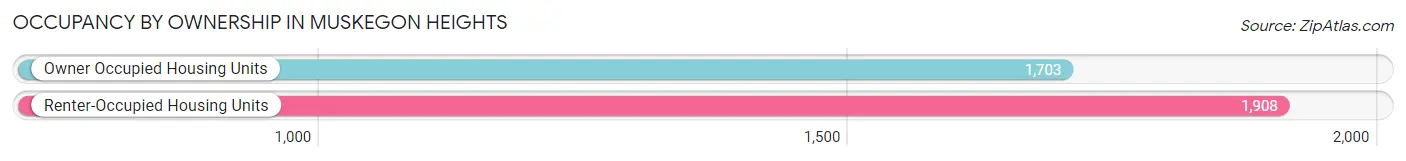
| Occupancy | # Housing Units | % Housing Units |
| Owner Occupied Housing Units | 1,703 | 47.2% |
| Renter-Occupied Housing Units | 1,908 | 52.8% |
| Total Occupied Housing Units | 3,611 | 100.0% |
Occupancy by Household Size in Muskegon Heights
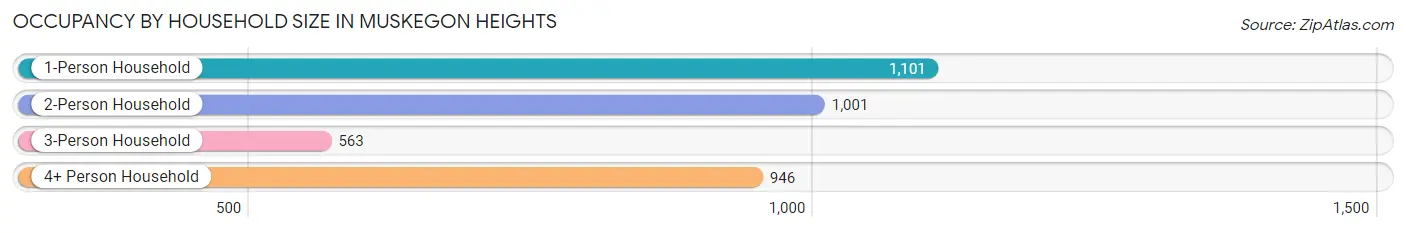
| Household Size | # Housing Units | % Housing Units |
| 1-Person Household | 1,101 | 30.5% |
| 2-Person Household | 1,001 | 27.7% |
| 3-Person Household | 563 | 15.6% |
| 4+ Person Household | 946 | 26.2% |
| Total Housing Units | 3,611 | 100.0% |
Occupancy by Ownership by Household Size in Muskegon Heights
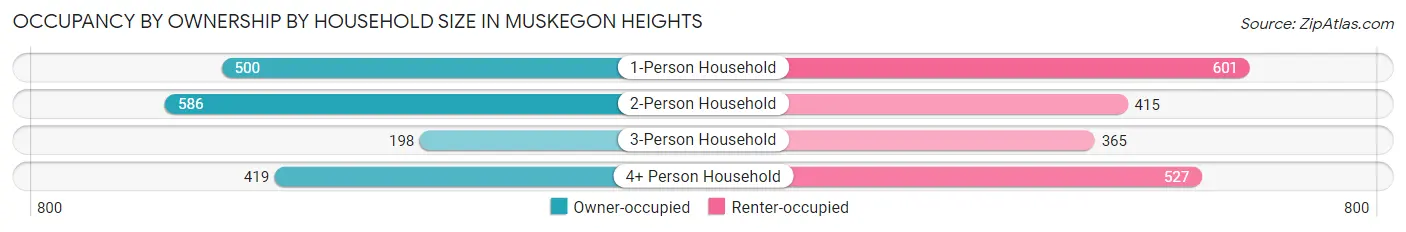
| Household Size | Owner-occupied | Renter-occupied |
| 1-Person Household | 500 (45.4%) | 601 (54.6%) |
| 2-Person Household | 586 (58.5%) | 415 (41.5%) |
| 3-Person Household | 198 (35.2%) | 365 (64.8%) |
| 4+ Person Household | 419 (44.3%) | 527 (55.7%) |
| Total Housing Units | 1,703 (47.2%) | 1,908 (52.8%) |
Occupancy by Educational Attainment in Muskegon Heights
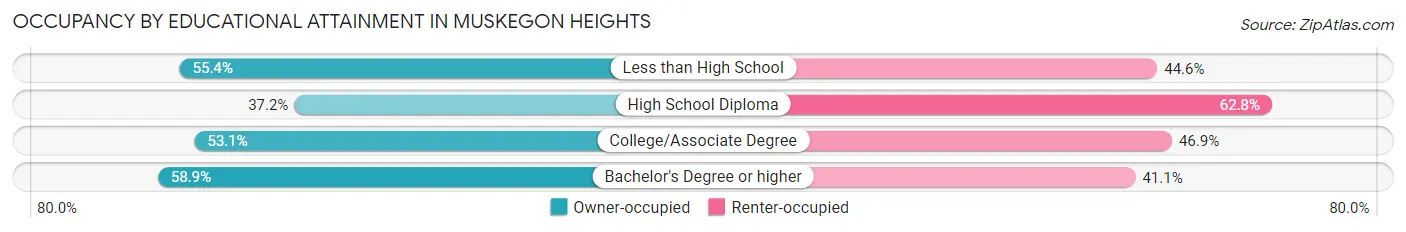
| Household Size | Owner-occupied | Renter-occupied |
| Less than High School | 251 (55.4%) | 202 (44.6%) |
| High School Diploma | 578 (37.2%) | 974 (62.8%) |
| College/Associate Degree | 655 (53.1%) | 579 (46.9%) |
| Bachelor's Degree or higher | 219 (58.9%) | 153 (41.1%) |
Occupancy by Age of Householder in Muskegon Heights
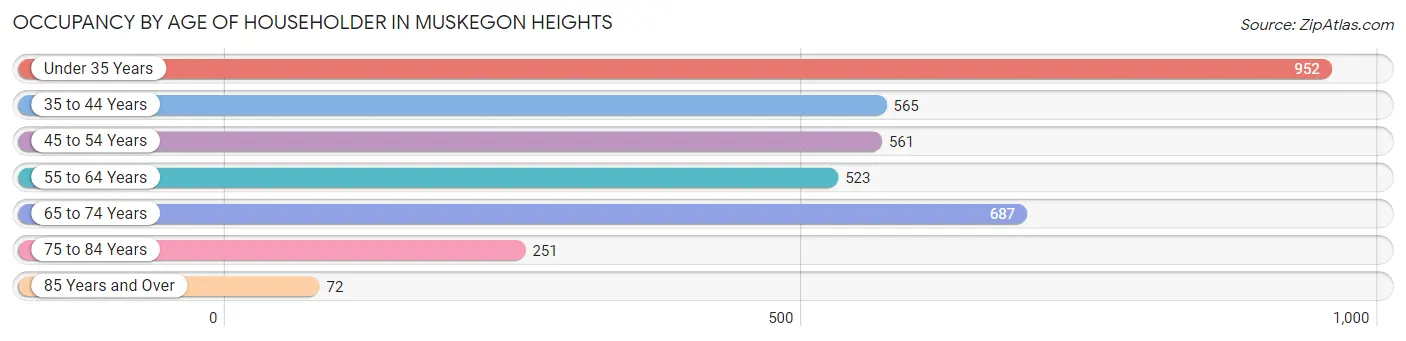
| Age Bracket | # Households | % Households |
| Under 35 Years | 952 | 26.4% |
| 35 to 44 Years | 565 | 15.7% |
| 45 to 54 Years | 561 | 15.5% |
| 55 to 64 Years | 523 | 14.5% |
| 65 to 74 Years | 687 | 19.0% |
| 75 to 84 Years | 251 | 7.0% |
| 85 Years and Over | 72 | 2.0% |
| Total | 3,611 | 100.0% |
Housing Finances in Muskegon Heights
Median Income by Occupancy in Muskegon Heights
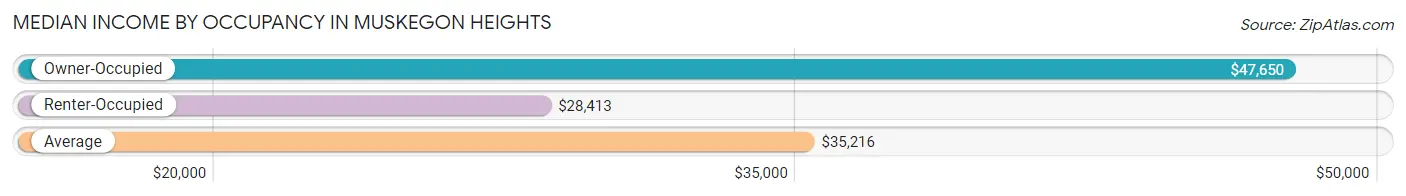
| Occupancy Type | # Households | Median Income |
| Owner-Occupied | 1,703 (47.2%) | $47,650 |
| Renter-Occupied | 1,908 (52.8%) | $28,413 |
| Average | 3,611 (100.0%) | $35,216 |
Occupancy by Householder Income Bracket in Muskegon Heights
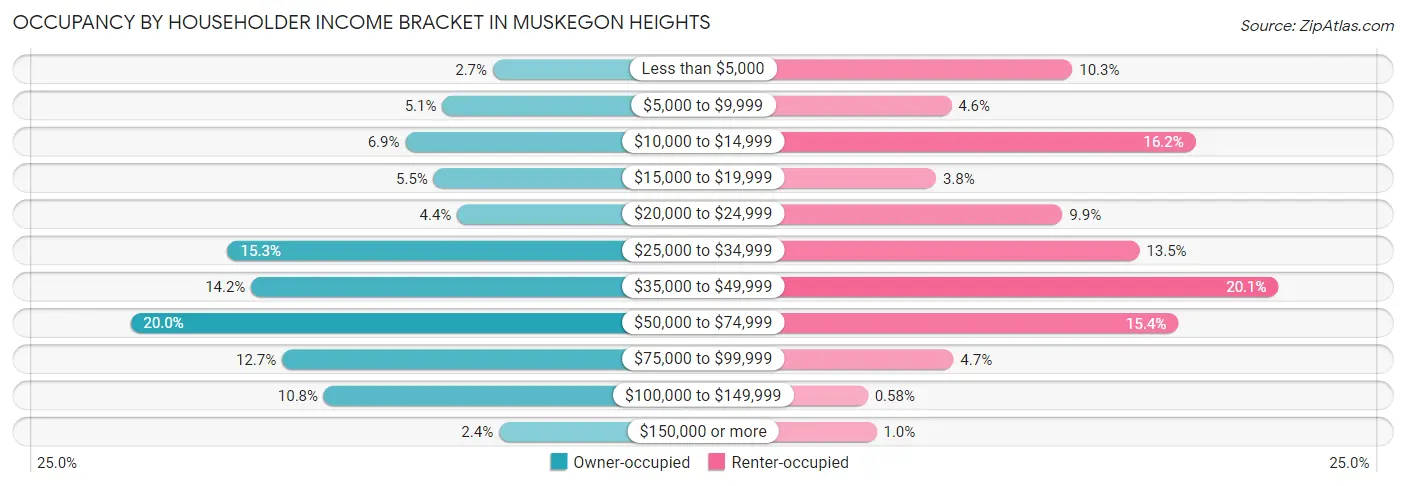
| Income Bracket | Owner-occupied | Renter-occupied |
| Less than $5,000 | 46 (2.7%) | 197 (10.3%) |
| $5,000 to $9,999 | 87 (5.1%) | 87 (4.6%) |
| $10,000 to $14,999 | 117 (6.9%) | 309 (16.2%) |
| $15,000 to $19,999 | 94 (5.5%) | 73 (3.8%) |
| $20,000 to $24,999 | 75 (4.4%) | 188 (9.9%) |
| $25,000 to $34,999 | 261 (15.3%) | 258 (13.5%) |
| $35,000 to $49,999 | 242 (14.2%) | 384 (20.1%) |
| $50,000 to $74,999 | 340 (20.0%) | 293 (15.4%) |
| $75,000 to $99,999 | 217 (12.7%) | 89 (4.7%) |
| $100,000 to $149,999 | 183 (10.7%) | 11 (0.6%) |
| $150,000 or more | 41 (2.4%) | 19 (1.0%) |
| Total | 1,703 (100.0%) | 1,908 (100.0%) |
Monthly Housing Cost Tiers in Muskegon Heights
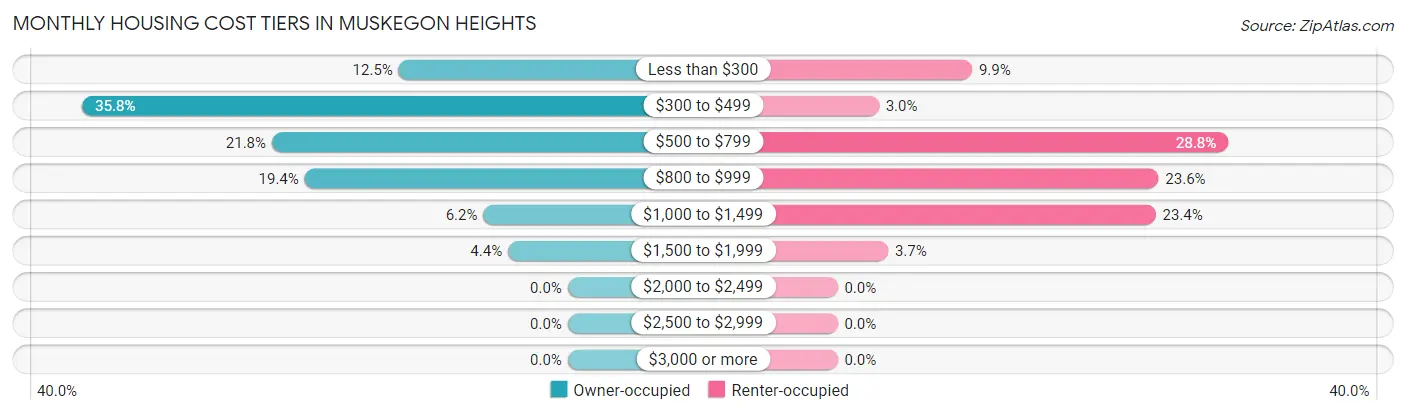
| Monthly Cost | Owner-occupied | Renter-occupied |
| Less than $300 | 212 (12.4%) | 189 (9.9%) |
| $300 to $499 | 609 (35.8%) | 58 (3.0%) |
| $500 to $799 | 371 (21.8%) | 549 (28.8%) |
| $800 to $999 | 330 (19.4%) | 451 (23.6%) |
| $1,000 to $1,499 | 106 (6.2%) | 447 (23.4%) |
| $1,500 to $1,999 | 75 (4.4%) | 71 (3.7%) |
| $2,000 to $2,499 | 0 (0.0%) | 0 (0.0%) |
| $2,500 to $2,999 | 0 (0.0%) | 0 (0.0%) |
| $3,000 or more | 0 (0.0%) | 0 (0.0%) |
| Total | 1,703 (100.0%) | 1,908 (100.0%) |
Physical Housing Characteristics in Muskegon Heights
Housing Structures in Muskegon Heights
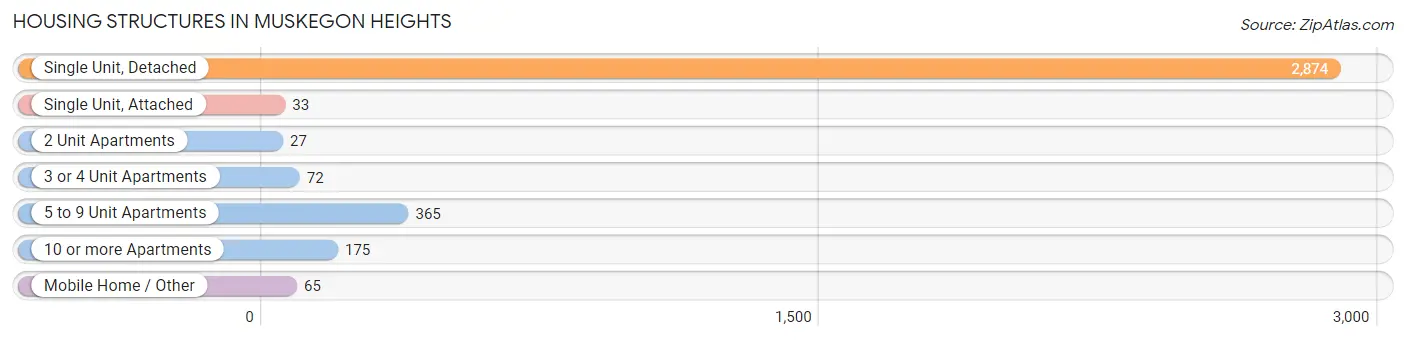
| Structure Type | # Housing Units | % Housing Units |
| Single Unit, Detached | 2,874 | 79.6% |
| Single Unit, Attached | 33 | 0.9% |
| 2 Unit Apartments | 27 | 0.7% |
| 3 or 4 Unit Apartments | 72 | 2.0% |
| 5 to 9 Unit Apartments | 365 | 10.1% |
| 10 or more Apartments | 175 | 4.9% |
| Mobile Home / Other | 65 | 1.8% |
| Total | 3,611 | 100.0% |
Housing Structures by Occupancy in Muskegon Heights
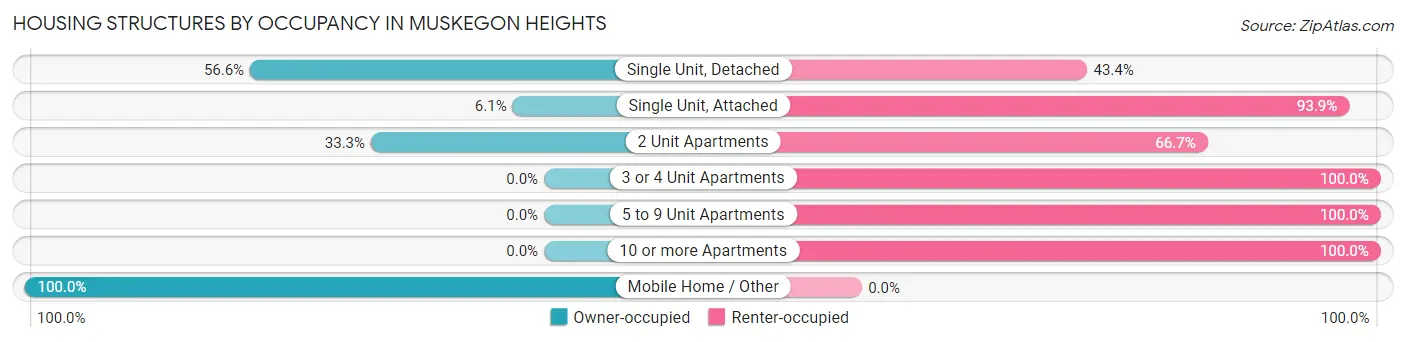
| Structure Type | Owner-occupied | Renter-occupied |
| Single Unit, Detached | 1,627 (56.6%) | 1,247 (43.4%) |
| Single Unit, Attached | 2 (6.1%) | 31 (93.9%) |
| 2 Unit Apartments | 9 (33.3%) | 18 (66.7%) |
| 3 or 4 Unit Apartments | 0 (0.0%) | 72 (100.0%) |
| 5 to 9 Unit Apartments | 0 (0.0%) | 365 (100.0%) |
| 10 or more Apartments | 0 (0.0%) | 175 (100.0%) |
| Mobile Home / Other | 65 (100.0%) | 0 (0.0%) |
| Total | 1,703 (47.2%) | 1,908 (52.8%) |
Housing Structures by Number of Rooms in Muskegon Heights
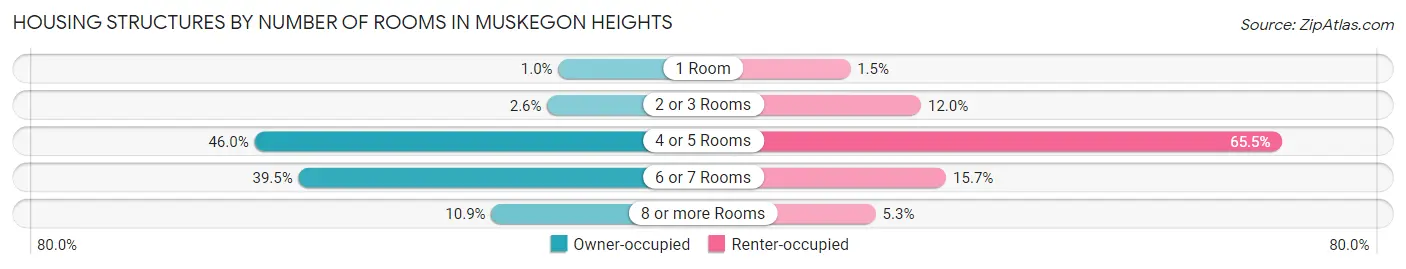
| Number of Rooms | Owner-occupied | Renter-occupied |
| 1 Room | 17 (1.0%) | 29 (1.5%) |
| 2 or 3 Rooms | 45 (2.6%) | 229 (12.0%) |
| 4 or 5 Rooms | 783 (46.0%) | 1,249 (65.5%) |
| 6 or 7 Rooms | 672 (39.5%) | 300 (15.7%) |
| 8 or more Rooms | 186 (10.9%) | 101 (5.3%) |
| Total | 1,703 (100.0%) | 1,908 (100.0%) |
Housing Structure by Heating Type in Muskegon Heights
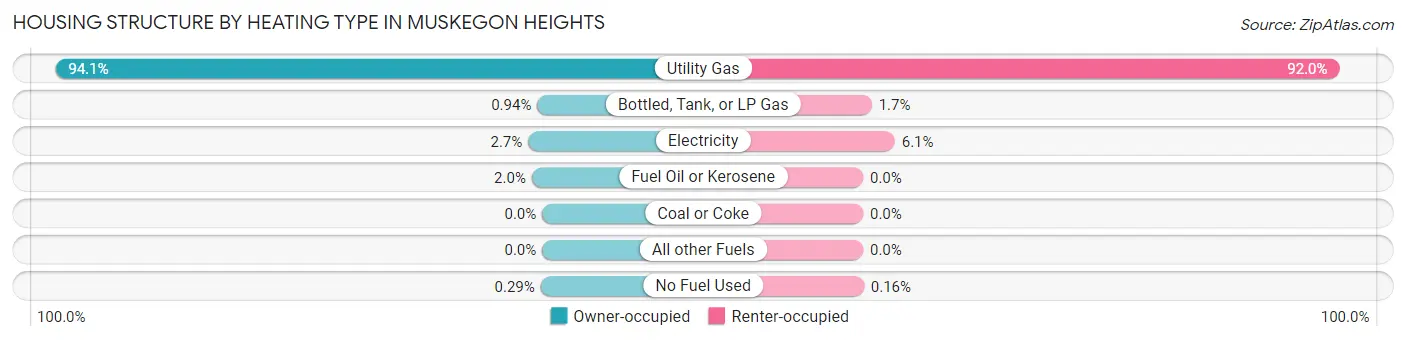
| Heating Type | Owner-occupied | Renter-occupied |
| Utility Gas | 1,602 (94.1%) | 1,756 (92.0%) |
| Bottled, Tank, or LP Gas | 16 (0.9%) | 32 (1.7%) |
| Electricity | 46 (2.7%) | 117 (6.1%) |
| Fuel Oil or Kerosene | 34 (2.0%) | 0 (0.0%) |
| Coal or Coke | 0 (0.0%) | 0 (0.0%) |
| All other Fuels | 0 (0.0%) | 0 (0.0%) |
| No Fuel Used | 5 (0.3%) | 3 (0.2%) |
| Total | 1,703 (100.0%) | 1,908 (100.0%) |
Household Vehicle Usage in Muskegon Heights
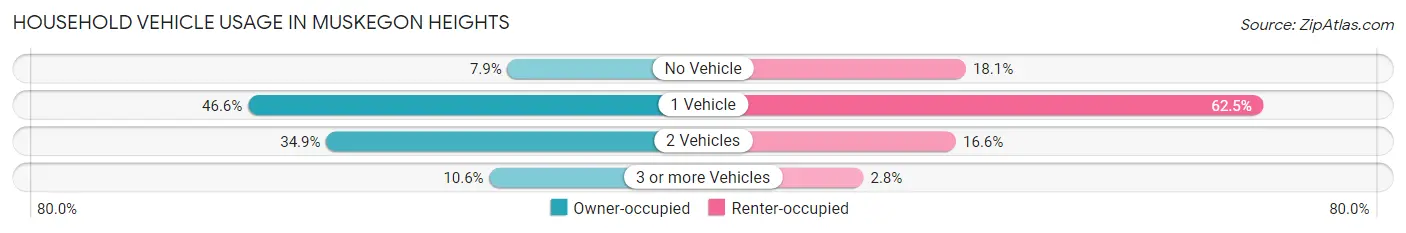
| Vehicles per Household | Owner-occupied | Renter-occupied |
| No Vehicle | 134 (7.9%) | 345 (18.1%) |
| 1 Vehicle | 794 (46.6%) | 1,193 (62.5%) |
| 2 Vehicles | 595 (34.9%) | 317 (16.6%) |
| 3 or more Vehicles | 180 (10.6%) | 53 (2.8%) |
| Total | 1,703 (100.0%) | 1,908 (100.0%) |
Real Estate & Mortgages in Muskegon Heights
Real Estate and Mortgage Overview in Muskegon Heights
| Characteristic | Without Mortgage | With Mortgage |
| Housing Units | 1,111 | 592 |
| Median Property Value | $49,200 | $63,200 |
| Median Household Income | $37,951 | $18 |
| Monthly Housing Costs | $426 | $0 |
| Real Estate Taxes | $1,055 | $20 |
Property Value by Mortgage Status in Muskegon Heights
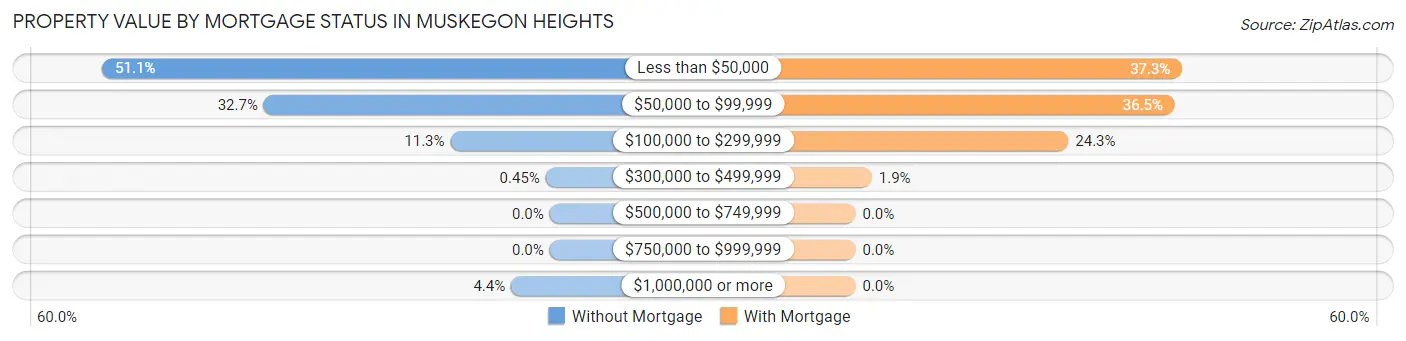
| Property Value | Without Mortgage | With Mortgage |
| Less than $50,000 | 568 (51.1%) | 221 (37.3%) |
| $50,000 to $99,999 | 363 (32.7%) | 216 (36.5%) |
| $100,000 to $299,999 | 126 (11.3%) | 144 (24.3%) |
| $300,000 to $499,999 | 5 (0.4%) | 11 (1.9%) |
| $500,000 to $749,999 | 0 (0.0%) | 0 (0.0%) |
| $750,000 to $999,999 | 0 (0.0%) | 0 (0.0%) |
| $1,000,000 or more | 49 (4.4%) | 0 (0.0%) |
| Total | 1,111 (100.0%) | 592 (100.0%) |
Household Income by Mortgage Status in Muskegon Heights
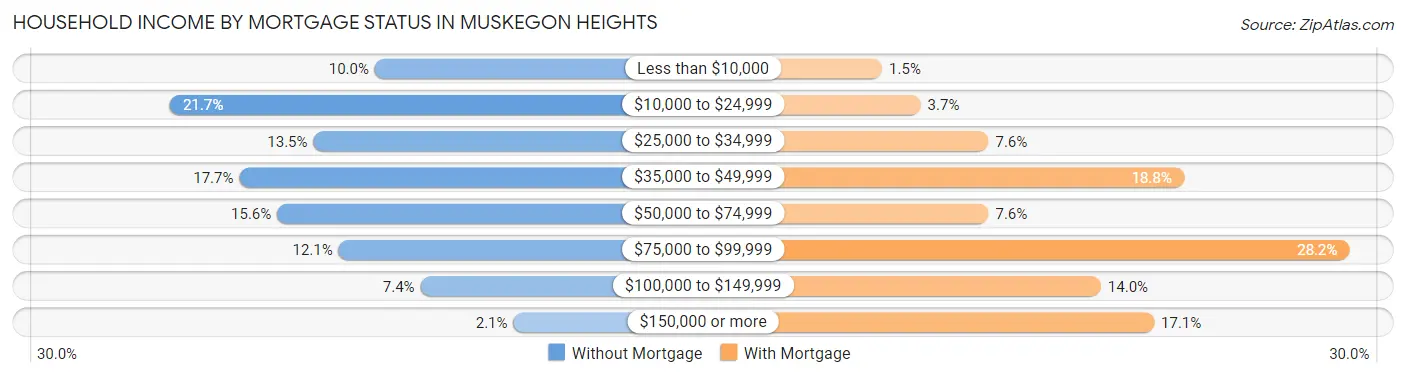
| Household Income | Without Mortgage | With Mortgage |
| Less than $10,000 | 111 (10.0%) | 9 (1.5%) |
| $10,000 to $24,999 | 241 (21.7%) | 22 (3.7%) |
| $25,000 to $34,999 | 150 (13.5%) | 45 (7.6%) |
| $35,000 to $49,999 | 197 (17.7%) | 111 (18.8%) |
| $50,000 to $74,999 | 173 (15.6%) | 45 (7.6%) |
| $75,000 to $99,999 | 134 (12.1%) | 167 (28.2%) |
| $100,000 to $149,999 | 82 (7.4%) | 83 (14.0%) |
| $150,000 or more | 23 (2.1%) | 101 (17.1%) |
| Total | 1,111 (100.0%) | 592 (100.0%) |
Property Value to Household Income Ratio in Muskegon Heights
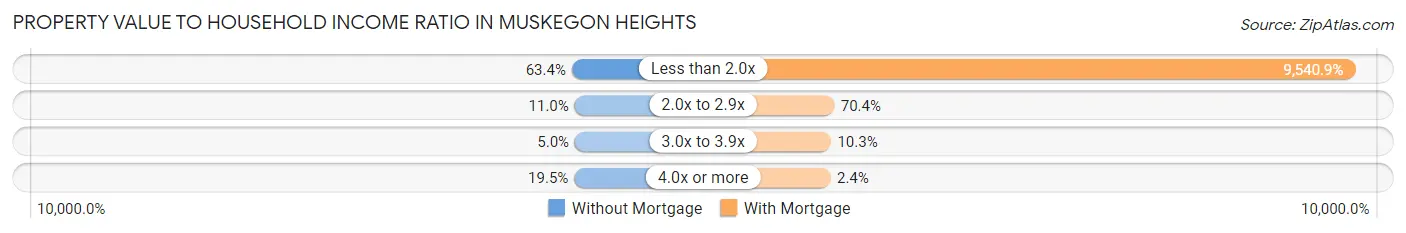
| Value-to-Income Ratio | Without Mortgage | With Mortgage |
| Less than 2.0x | 704 (63.4%) | 56,482 (9,540.9%) |
| 2.0x to 2.9x | 122 (11.0%) | 417 (70.4%) |
| 3.0x to 3.9x | 56 (5.0%) | 61 (10.3%) |
| 4.0x or more | 217 (19.5%) | 14 (2.4%) |
| Total | 1,111 (100.0%) | 592 (100.0%) |
Real Estate Taxes by Mortgage Status in Muskegon Heights
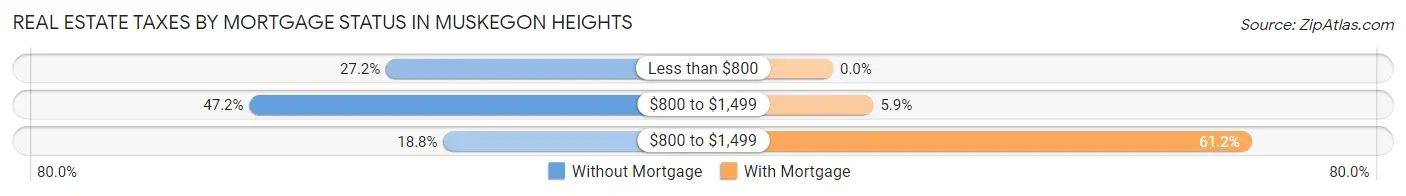
| Property Taxes | Without Mortgage | With Mortgage |
| Less than $800 | 302 (27.2%) | 0 (0.0%) |
| $800 to $1,499 | 524 (47.2%) | 35 (5.9%) |
| $800 to $1,499 | 209 (18.8%) | 362 (61.2%) |
| Total | 1,111 (100.0%) | 592 (100.0%) |
Health & Disability in Muskegon Heights
Health Insurance Coverage by Age in Muskegon Heights
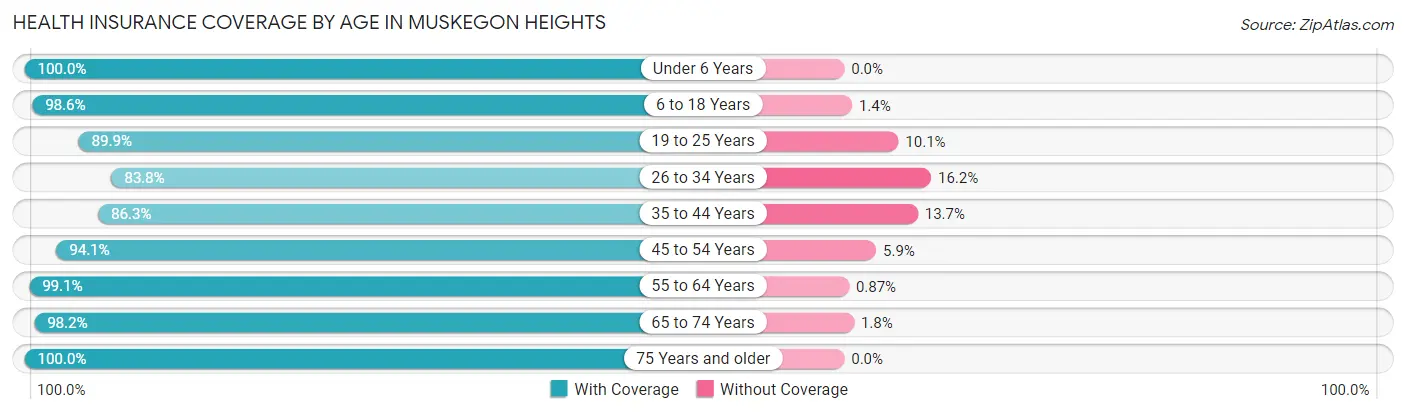
| Age Bracket | With Coverage | Without Coverage |
| Under 6 Years | 1,094 (100.0%) | 0 (0.0%) |
| 6 to 18 Years | 2,063 (98.6%) | 30 (1.4%) |
| 19 to 25 Years | 945 (89.9%) | 106 (10.1%) |
| 26 to 34 Years | 1,098 (83.8%) | 212 (16.2%) |
| 35 to 44 Years | 989 (86.3%) | 157 (13.7%) |
| 45 to 54 Years | 967 (94.1%) | 61 (5.9%) |
| 55 to 64 Years | 799 (99.1%) | 7 (0.9%) |
| 65 to 74 Years | 875 (98.2%) | 16 (1.8%) |
| 75 Years and older | 520 (100.0%) | 0 (0.0%) |
| Total | 9,350 (94.1%) | 589 (5.9%) |
Health Insurance Coverage by Citizenship Status in Muskegon Heights
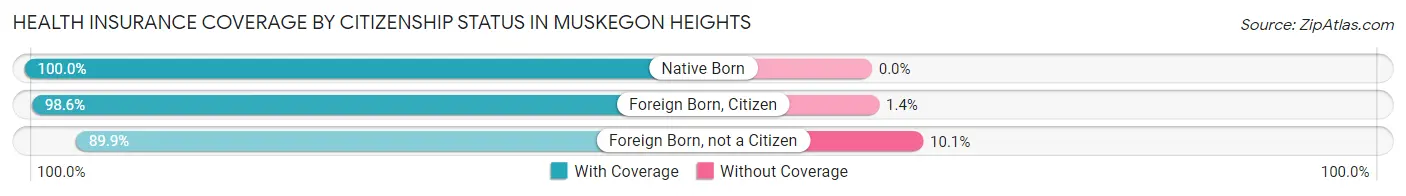
| Citizenship Status | With Coverage | Without Coverage |
| Native Born | 1,094 (100.0%) | 0 (0.0%) |
| Foreign Born, Citizen | 2,063 (98.6%) | 30 (1.4%) |
| Foreign Born, not a Citizen | 945 (89.9%) | 106 (10.1%) |
Health Insurance Coverage by Household Income in Muskegon Heights
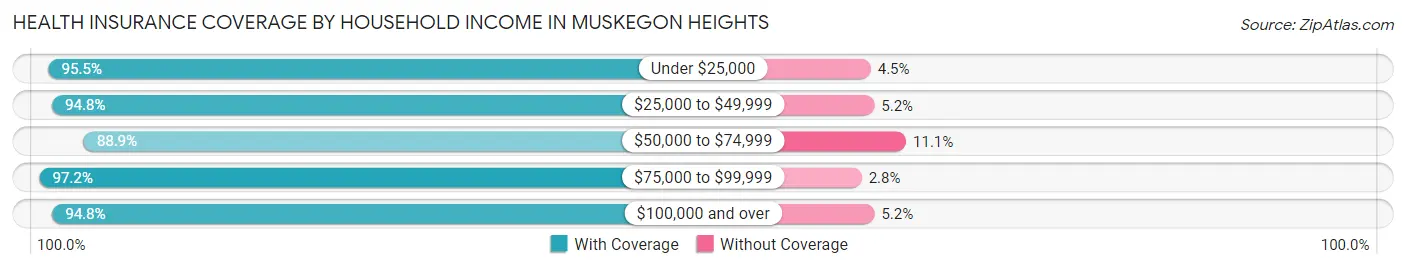
| Household Income | With Coverage | Without Coverage |
| Under $25,000 | 2,549 (95.5%) | 120 (4.5%) |
| $25,000 to $49,999 | 2,961 (94.8%) | 161 (5.2%) |
| $50,000 to $74,999 | 1,841 (88.9%) | 230 (11.1%) |
| $75,000 to $99,999 | 1,040 (97.2%) | 30 (2.8%) |
| $100,000 and over | 877 (94.8%) | 48 (5.2%) |
Public vs Private Health Insurance Coverage by Age in Muskegon Heights
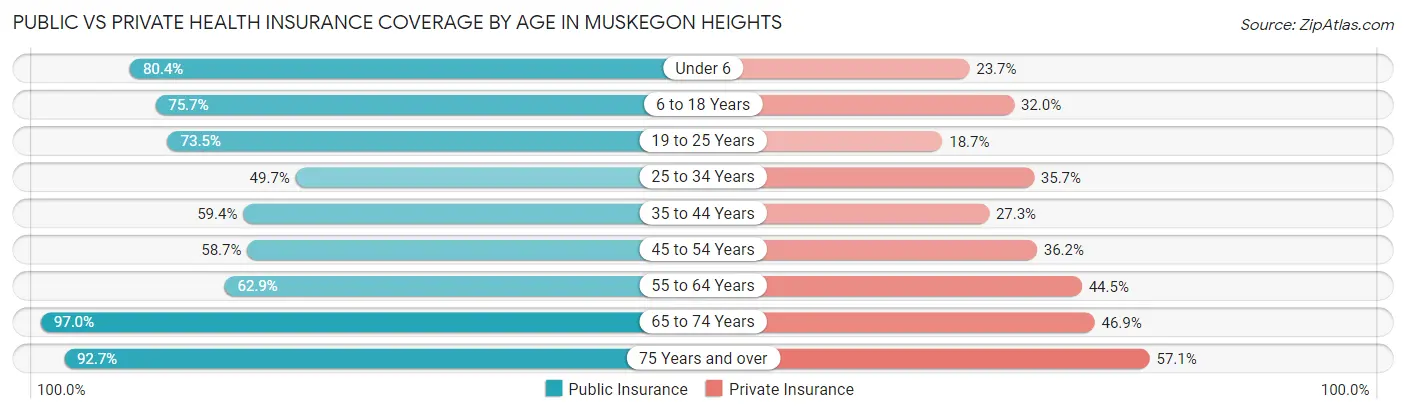
| Age Bracket | Public Insurance | Private Insurance |
| Under 6 | 880 (80.4%) | 259 (23.7%) |
| 6 to 18 Years | 1,585 (75.7%) | 669 (32.0%) |
| 19 to 25 Years | 772 (73.5%) | 196 (18.6%) |
| 25 to 34 Years | 651 (49.7%) | 467 (35.6%) |
| 35 to 44 Years | 681 (59.4%) | 313 (27.3%) |
| 45 to 54 Years | 603 (58.7%) | 372 (36.2%) |
| 55 to 64 Years | 507 (62.9%) | 359 (44.5%) |
| 65 to 74 Years | 864 (97.0%) | 418 (46.9%) |
| 75 Years and over | 482 (92.7%) | 297 (57.1%) |
| Total | 7,025 (70.7%) | 3,350 (33.7%) |
Disability Status by Sex by Age in Muskegon Heights
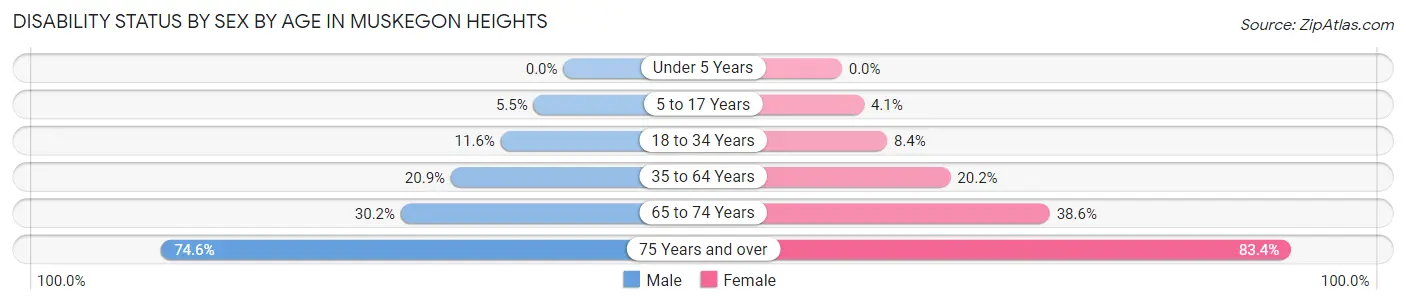
| Age Bracket | Male | Female |
| Under 5 Years | 0 (0.0%) | 0 (0.0%) |
| 5 to 17 Years | 61 (5.5%) | 43 (4.1%) |
| 18 to 34 Years | 127 (11.6%) | 123 (8.4%) |
| 35 to 64 Years | 274 (20.9%) | 336 (20.2%) |
| 65 to 74 Years | 114 (30.2%) | 198 (38.6%) |
| 75 Years and over | 150 (74.6%) | 266 (83.4%) |
Disability Class by Sex by Age in Muskegon Heights
Disability Class: Hearing Difficulty
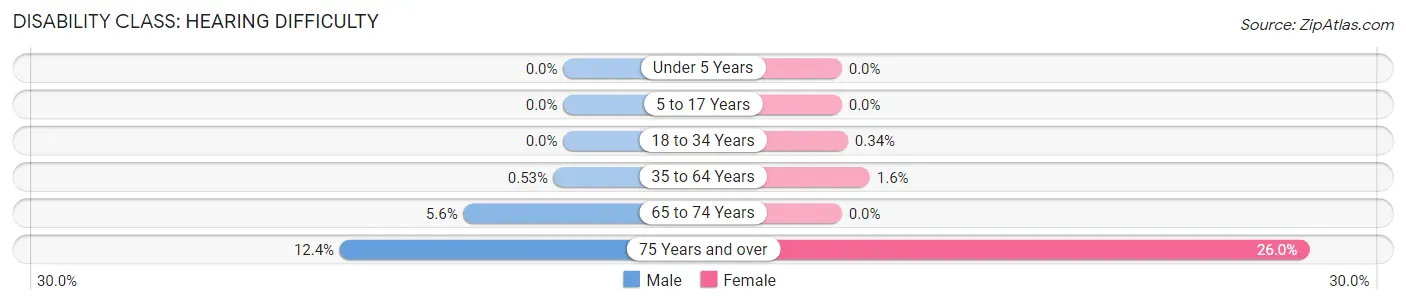
| Age Bracket | Male | Female |
| Under 5 Years | 0 (0.0%) | 0 (0.0%) |
| 5 to 17 Years | 0 (0.0%) | 0 (0.0%) |
| 18 to 34 Years | 0 (0.0%) | 5 (0.3%) |
| 35 to 64 Years | 7 (0.5%) | 26 (1.6%) |
| 65 to 74 Years | 21 (5.6%) | 0 (0.0%) |
| 75 Years and over | 25 (12.4%) | 83 (26.0%) |
Disability Class: Vision Difficulty
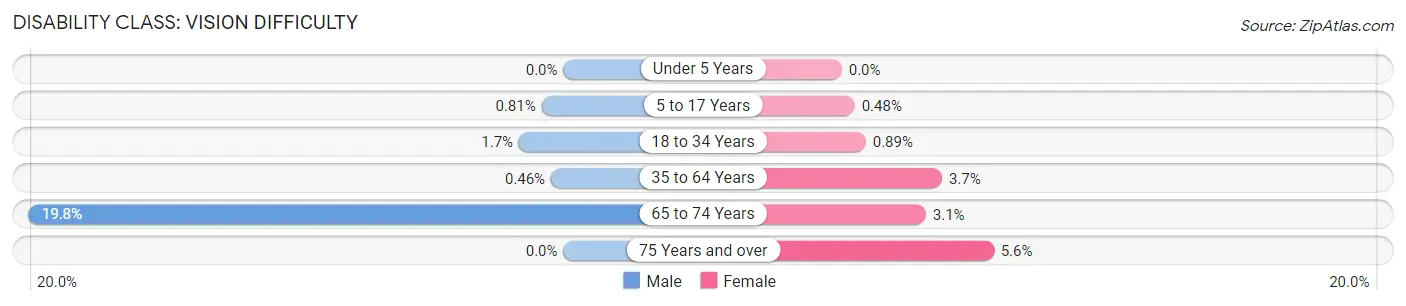
| Age Bracket | Male | Female |
| Under 5 Years | 0 (0.0%) | 0 (0.0%) |
| 5 to 17 Years | 9 (0.8%) | 5 (0.5%) |
| 18 to 34 Years | 18 (1.7%) | 13 (0.9%) |
| 35 to 64 Years | 6 (0.5%) | 62 (3.7%) |
| 65 to 74 Years | 75 (19.8%) | 16 (3.1%) |
| 75 Years and over | 0 (0.0%) | 18 (5.6%) |
Disability Class: Cognitive Difficulty
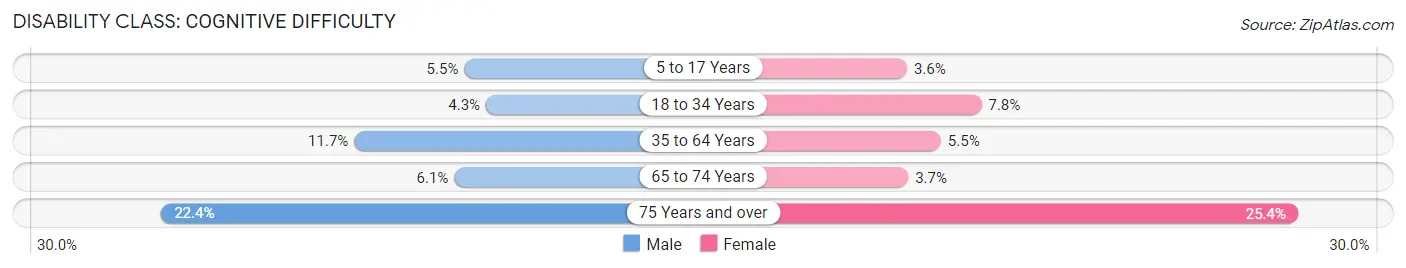
| Age Bracket | Male | Female |
| 5 to 17 Years | 61 (5.5%) | 38 (3.6%) |
| 18 to 34 Years | 47 (4.3%) | 114 (7.8%) |
| 35 to 64 Years | 153 (11.7%) | 92 (5.5%) |
| 65 to 74 Years | 23 (6.1%) | 19 (3.7%) |
| 75 Years and over | 45 (22.4%) | 81 (25.4%) |
Disability Class: Ambulatory Difficulty
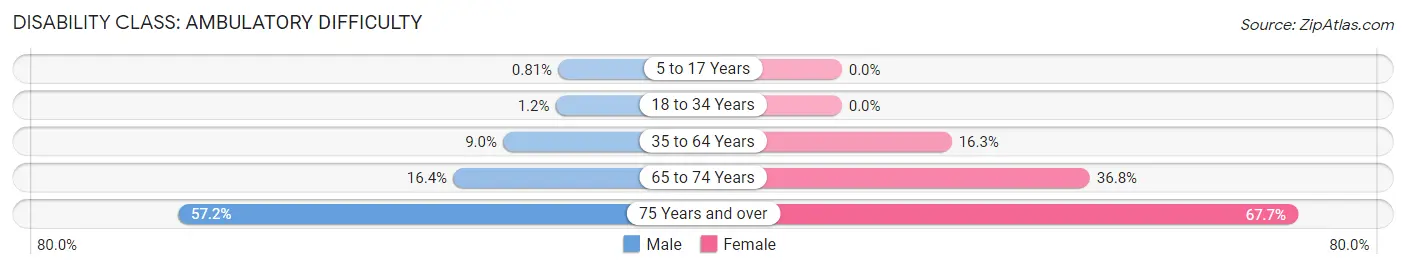
| Age Bracket | Male | Female |
| 5 to 17 Years | 9 (0.8%) | 0 (0.0%) |
| 18 to 34 Years | 13 (1.2%) | 0 (0.0%) |
| 35 to 64 Years | 118 (9.0%) | 272 (16.3%) |
| 65 to 74 Years | 62 (16.4%) | 189 (36.8%) |
| 75 Years and over | 115 (57.2%) | 216 (67.7%) |
Disability Class: Self-Care Difficulty
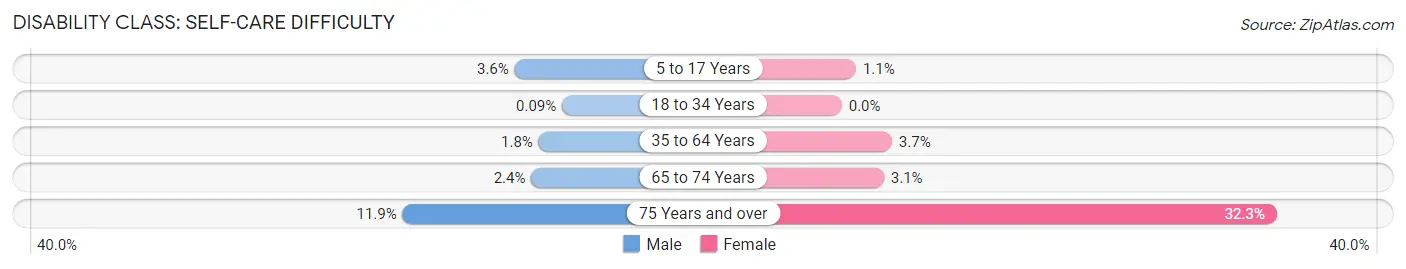
| Age Bracket | Male | Female |
| 5 to 17 Years | 40 (3.6%) | 11 (1.1%) |
| 18 to 34 Years | 1 (0.1%) | 0 (0.0%) |
| 35 to 64 Years | 24 (1.8%) | 62 (3.7%) |
| 65 to 74 Years | 9 (2.4%) | 16 (3.1%) |
| 75 Years and over | 24 (11.9%) | 103 (32.3%) |
Technology Access in Muskegon Heights
Computing Device Access in Muskegon Heights
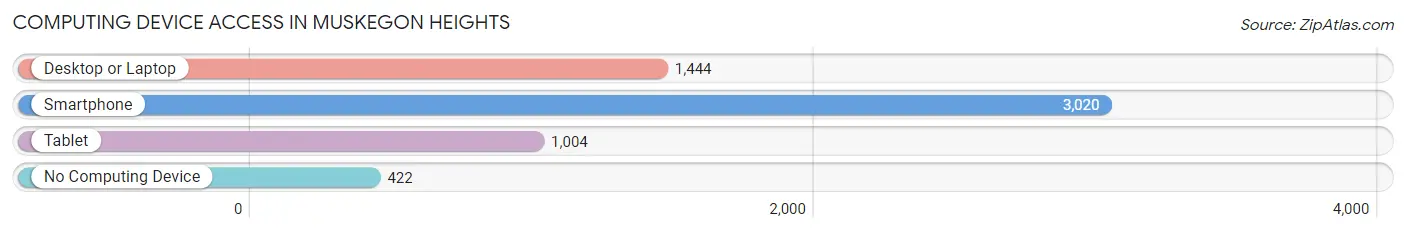
| Device Type | # Households | % Households |
| Desktop or Laptop | 1,444 | 40.0% |
| Smartphone | 3,020 | 83.6% |
| Tablet | 1,004 | 27.8% |
| No Computing Device | 422 | 11.7% |
| Total | 3,611 | 100.0% |
Internet Access in Muskegon Heights
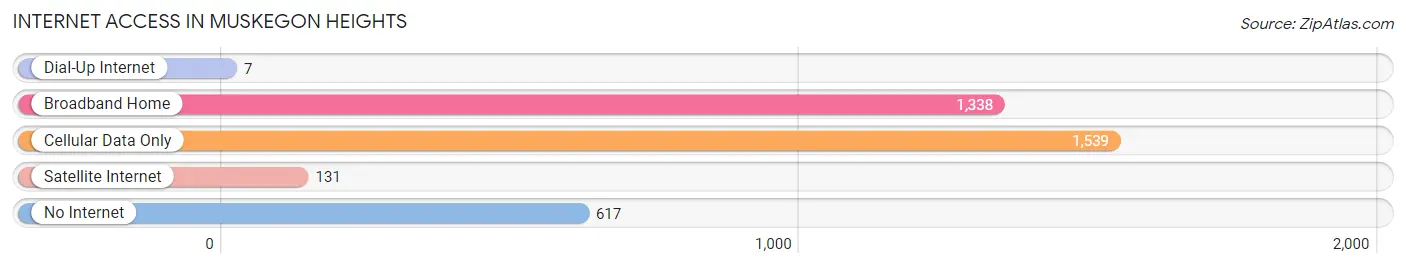
| Internet Type | # Households | % Households |
| Dial-Up Internet | 7 | 0.2% |
| Broadband Home | 1,338 | 37.0% |
| Cellular Data Only | 1,539 | 42.6% |
| Satellite Internet | 131 | 3.6% |
| No Internet | 617 | 17.1% |
| Total | 3,611 | 100.0% |
Muskegon Heights Summary
Muskegon Heights is a city located in Muskegon County, Michigan, United States. The population was 10,868 at the 2010 census. It is located along the eastern shore of Lake Michigan at the mouth of the Muskegon River. Muskegon Heights is part of the Muskegon Metropolitan Statistical Area.
History
Muskegon Heights was founded in 1891 by a group of investors led by Charles Hackley, a lumber baron from Muskegon. The city was incorporated in 1907. The city was originally a resort town, but it soon became a manufacturing center. The city was home to several factories, including the Muskegon Iron Works, which produced steel for the automotive industry.
In the 1950s, Muskegon Heights began to decline as the manufacturing industry moved away from the city. The city's population decreased from a peak of over 20,000 in 1950 to just over 10,000 in 2010.
Geography
Muskegon Heights is located at 43°14′N 86°17′W (43.2345, -86.2845). According to the United States Census Bureau, the city has a total area of 4.2 square miles (10.9 km2), of which 4.1 square miles (10.6 km2) is land and 0.1 square miles (0.3 km2) (2.37%) is water.
Economy
Muskegon Heights is home to several businesses, including manufacturing, retail, and service industries. The city is also home to several educational institutions, including Muskegon Community College and Baker College of Muskegon.
The city's largest employer is the Muskegon County Airport, which employs over 1,000 people. Other major employers include the Muskegon Public Schools, Mercy Health, and the Muskegon County government.
Demographics
As of the census of 2010, there were 10,868 people, 4,541 households, and 2,717 families residing in the city. The population density was 2,637.3 inhabitants per square mile (1,017.2/km2). There were 5,093 housing units at an average density of 1,241.3 per square mile (478.3/km2). The racial makeup of the city was 57.2% White, 36.2% African American, 0.4% Native American, 0.7% Asian, 0.1% Pacific Islander, 3.2% from other races, and 2.2% from two or more races. Hispanic or Latino of any race were 6.7% of the population.
There were 4,541 households, of which 33.2% had children under the age of 18 living with them, 28.2% were married couples living together, 25.2% had a female householder with no husband present, 8.2% had a male householder with no wife present, and 38.4% were non-families. 32.2% of all households were made up of individuals, and 11.2% had someone living alone who was 65 years of age or older. The average household size was 2.39 and the average family size was 3.00.
The median age in the city was 34.7 years. 25.7% of residents were under the age of 18; 10.2% were between the ages of 18 and 24; 25.2% were from 25 to 44; 25.2% were from 45 to 64; and 13.7% were 65 years of age or older. The gender makeup of the city was 48.2% male and 51.8% female.
Conclusion
Muskegon Heights is a city located in Muskegon County, Michigan, United States. The city was founded in 1891 and was originally a resort town, but it soon became a manufacturing center. The city has since declined as the manufacturing industry moved away from the city. The population of Muskegon Heights was 10,868 at the 2010 census. The city is home to several businesses, including manufacturing, retail, and service industries. The city's largest employer is the Muskegon County Airport, which employs over 1,000 people. The racial makeup of the city was 57.2% White, 36.2% African American, 0.4% Native American, 0.7% Asian, 0.1% Pacific Islander, 3.2% from other races, and 2.2% from two or more races. The median age in the city was 34.7 years. Muskegon Heights is part of the Muskegon Metropolitan Statistical Area.
Common Questions
What is Per Capita Income in Muskegon Heights?
Per Capita income in Muskegon Heights is $15,816.
What is the Median Family Income in Muskegon Heights?
Median Family Income in Muskegon Heights is $36,052.
What is the Median Household income in Muskegon Heights?
Median Household Income in Muskegon Heights is $35,216.
What is Income or Wage Gap in Muskegon Heights?
Income or Wage Gap in Muskegon Heights is 16.6%.
Women in Muskegon Heights earn 83.4 cents for every dollar earned by a man.
What is Family Income Deficit in Muskegon Heights?
Family Income Deficit in Muskegon Heights is $11,435.
Families that are below poverty line in Muskegon Heights earn $11,435 less on average than the poverty threshold level.
What is Inequality or Gini Index in Muskegon Heights?
Inequality or Gini Index in Muskegon Heights is 0.42.
What is the Total Population of Muskegon Heights?
Total Population of Muskegon Heights is 9,954.
What is the Total Male Population of Muskegon Heights?
Total Male Population of Muskegon Heights is 4,630.
What is the Total Female Population of Muskegon Heights?
Total Female Population of Muskegon Heights is 5,324.
What is the Ratio of Males per 100 Females in Muskegon Heights?
There are 86.96 Males per 100 Females in Muskegon Heights.
What is the Ratio of Females per 100 Males in Muskegon Heights?
There are 114.99 Females per 100 Males in Muskegon Heights.
What is the Median Population Age in Muskegon Heights?
Median Population Age in Muskegon Heights is 30.7 Years.
What is the Average Family Size in Muskegon Heights
Average Family Size in Muskegon Heights is 3.5 People.
What is the Average Household Size in Muskegon Heights
Average Household Size in Muskegon Heights is 2.7 People.
How Large is the Labor Force in Muskegon Heights?
There are 4,169 People in the Labor Forcein in Muskegon Heights.
What is the Percentage of People in the Labor Force in Muskegon Heights?
58.4% of People are in the Labor Force in Muskegon Heights.
What is the Unemployment Rate in Muskegon Heights?
Unemployment Rate in Muskegon Heights is 20.5%.