Arcata, CA Map & Demographics
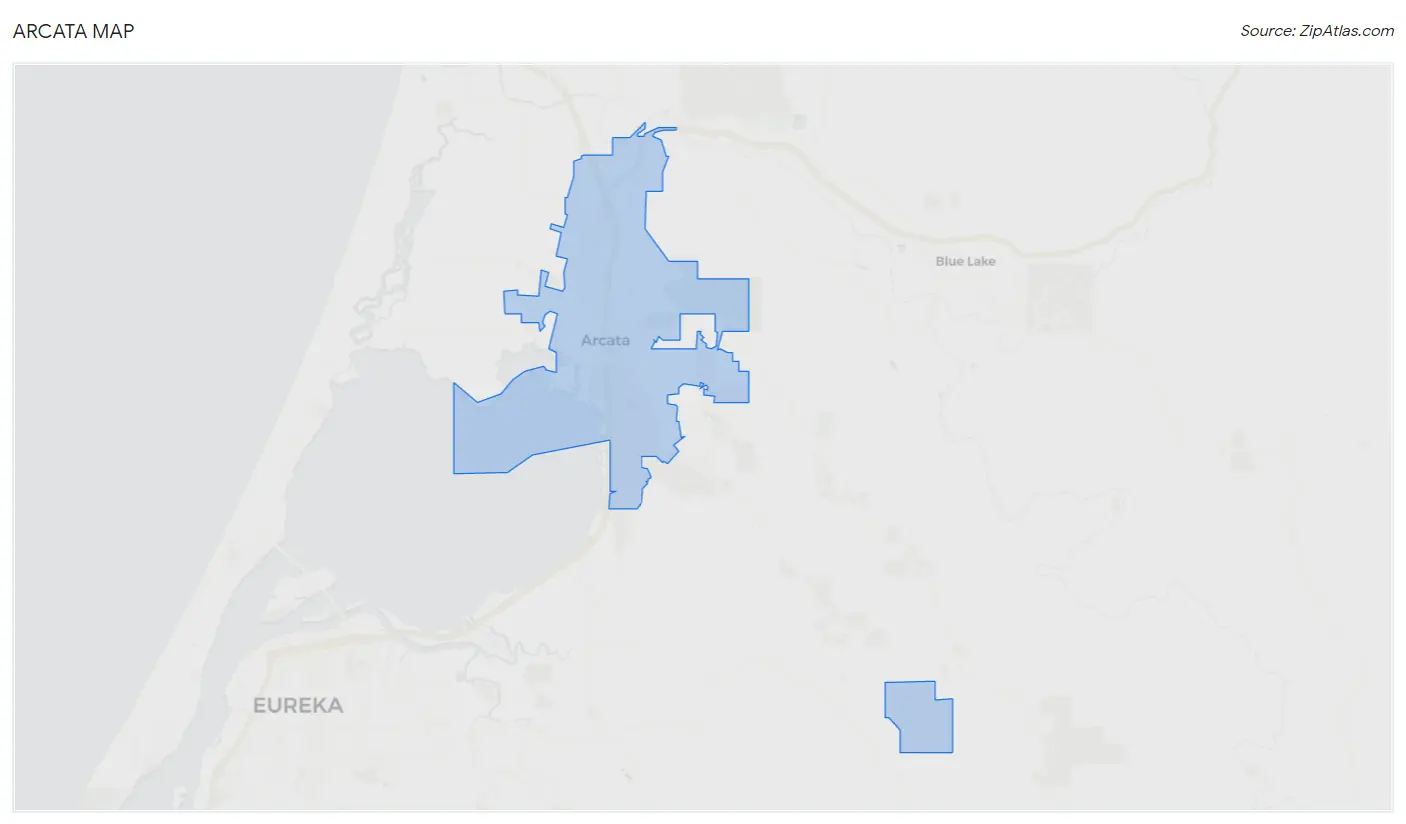
Arcata Map
Arcata Overview
$27,651
PER CAPITA INCOME
$82,793
AVG FAMILY INCOME
$43,444
AVG HOUSEHOLD INCOME
0.9%
WAGE / INCOME GAP [ % ]
99.1¢/ $1
WAGE / INCOME GAP [ $ ]
0.50
INEQUALITY / GINI INDEX
18,536
TOTAL POPULATION
9,359
MALE POPULATION
9,177
FEMALE POPULATION
101.98
MALES / 100 FEMALES
98.06
FEMALES / 100 MALES
27.2
MEDIAN AGE
3.0
AVG FAMILY SIZE
2.3
AVG HOUSEHOLD SIZE
11,073
LABOR FORCE [ PEOPLE ]
66.8%
PERCENT IN LABOR FORCE
13.9%
UNEMPLOYMENT RATE
Arcata Zip Codes
Arcata Area Codes
Income in Arcata
Income Overview in Arcata
Per Capita Income in Arcata is $27,651, while median incomes of families and households are $82,793 and $43,444 respectively.
| Characteristic | Number | Measure |
| Per Capita Income | 18,536 | $27,651 |
| Median Family Income | 2,782 | $82,793 |
| Mean Family Income | 2,782 | $96,176 |
| Median Household Income | 7,496 | $43,444 |
| Mean Household Income | 7,496 | $63,817 |
| Income Deficit | 2,782 | $0 |
| Wage / Income Gap (%) | 18,536 | 0.91% |
| Wage / Income Gap ($) | 18,536 | 99.09¢ per $1 |
| Gini / Inequality Index | 18,536 | 0.50 |
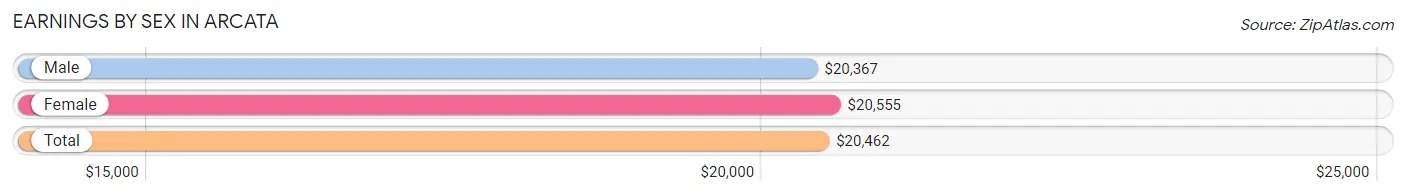
Earnings by Sex in Arcata
Average Earnings in Arcata are $20,462, $20,367 for men and $20,555 for women, a difference of 0.9%.
| Sex | Number | Average Earnings |
| Male | 6,601 (54.1%) | $20,367 |
| Female | 5,597 (45.9%) | $20,555 |
| Total | 12,198 (100.0%) | $20,462 |
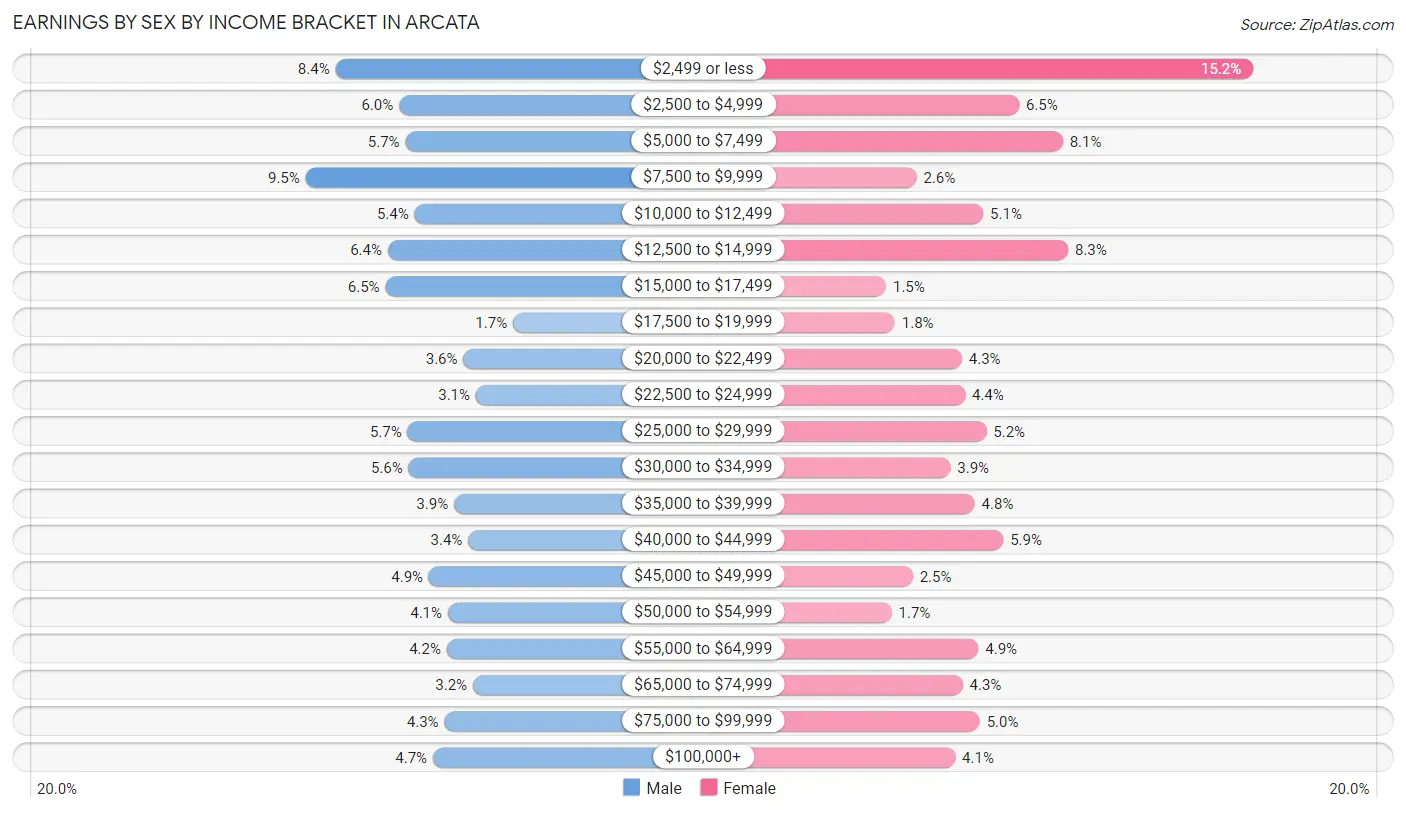
Earnings by Sex by Income Bracket in Arcata
The most common earnings brackets in Arcata are $7,500 to $9,999 for men (625 | 9.5%) and $2,499 or less for women (852 | 15.2%).
| Income | Male | Female |
| $2,499 or less | 551 (8.4%) | 852 (15.2%) |
| $2,500 to $4,999 | 394 (6.0%) | 361 (6.5%) |
| $5,000 to $7,499 | 378 (5.7%) | 453 (8.1%) |
| $7,500 to $9,999 | 625 (9.5%) | 146 (2.6%) |
| $10,000 to $12,499 | 356 (5.4%) | 286 (5.1%) |
| $12,500 to $14,999 | 422 (6.4%) | 464 (8.3%) |
| $15,000 to $17,499 | 428 (6.5%) | 82 (1.5%) |
| $17,500 to $19,999 | 112 (1.7%) | 101 (1.8%) |
| $20,000 to $22,499 | 235 (3.6%) | 241 (4.3%) |
| $22,500 to $24,999 | 204 (3.1%) | 248 (4.4%) |
| $25,000 to $29,999 | 373 (5.7%) | 293 (5.2%) |
| $30,000 to $34,999 | 370 (5.6%) | 217 (3.9%) |
| $35,000 to $39,999 | 258 (3.9%) | 268 (4.8%) |
| $40,000 to $44,999 | 223 (3.4%) | 328 (5.9%) |
| $45,000 to $49,999 | 320 (4.9%) | 138 (2.5%) |
| $50,000 to $54,999 | 273 (4.1%) | 94 (1.7%) |
| $55,000 to $64,999 | 276 (4.2%) | 276 (4.9%) |
| $65,000 to $74,999 | 211 (3.2%) | 243 (4.3%) |
| $75,000 to $99,999 | 282 (4.3%) | 279 (5.0%) |
| $100,000+ | 310 (4.7%) | 227 (4.1%) |
| Total | 6,601 (100.0%) | 5,597 (100.0%) |
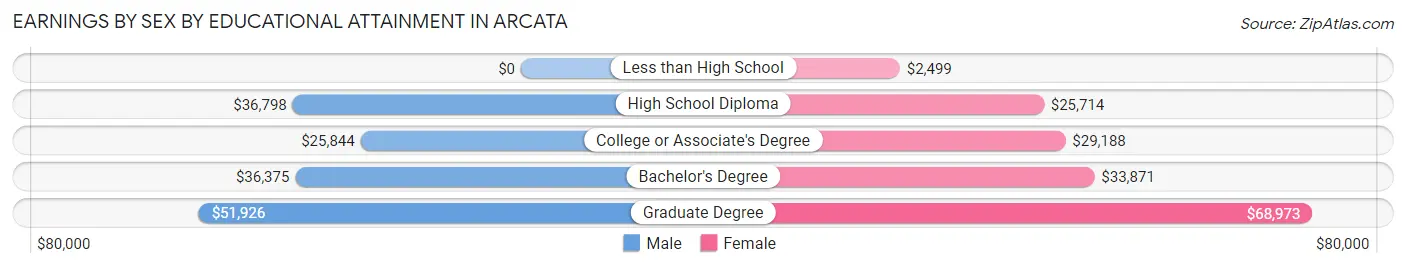
Earnings by Sex by Educational Attainment in Arcata
Average earnings in Arcata are $33,343 for men and $38,198 for women, a difference of 12.7%. Men with an educational attainment of graduate degree enjoy the highest average annual earnings of $51,926, while those with college or associate's degree education earn the least with $25,844. Women with an educational attainment of graduate degree earn the most with the average annual earnings of $68,973, while those with less than high school education have the smallest earnings of $2,499.
| Educational Attainment | Male Income | Female Income |
| Less than High School | - | - |
| High School Diploma | $36,798 | $25,714 |
| College or Associate's Degree | $25,844 | $29,188 |
| Bachelor's Degree | $36,375 | $33,871 |
| Graduate Degree | $51,926 | $68,973 |
| Total | $33,343 | $38,198 |
Family Income in Arcata
Family Income Brackets in Arcata
According to the Arcata family income data, there are 659 families falling into the $100,000 to $149,999 income range, which is the most common income bracket and makes up 23.7% of all families. Conversely, the $10,000 to $14,999 income bracket is the least frequent group with only 114 families (4.1%) belonging to this category.
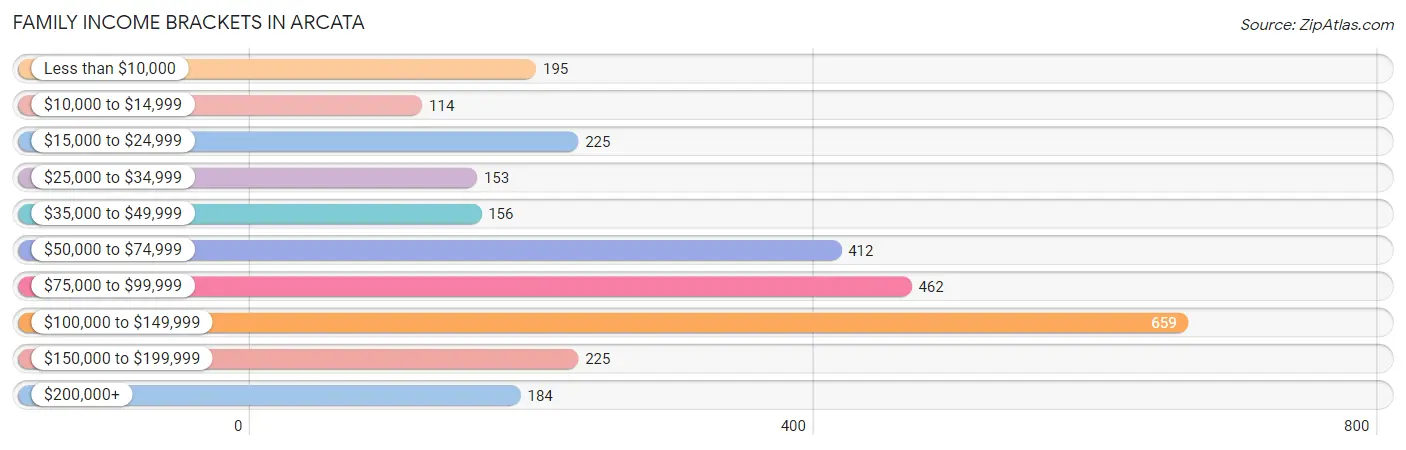
| Income Bracket | # Families | % Families |
| Less than $10,000 | 195 | 7.0% |
| $10,000 to $14,999 | 114 | 4.1% |
| $15,000 to $24,999 | 225 | 8.1% |
| $25,000 to $34,999 | 153 | 5.5% |
| $35,000 to $49,999 | 156 | 5.6% |
| $50,000 to $74,999 | 412 | 14.8% |
| $75,000 to $99,999 | 462 | 16.6% |
| $100,000 to $149,999 | 659 | 23.7% |
| $150,000 to $199,999 | 225 | 8.1% |
| $200,000+ | 184 | 6.6% |
Family Income by Famaliy Size in Arcata
5-person families (82 | 2.9%) account for the highest median family income in Arcata with $139,875 per family, while 2-person families (1,761 | 63.3%) have the highest median income of $37,604 per family member.
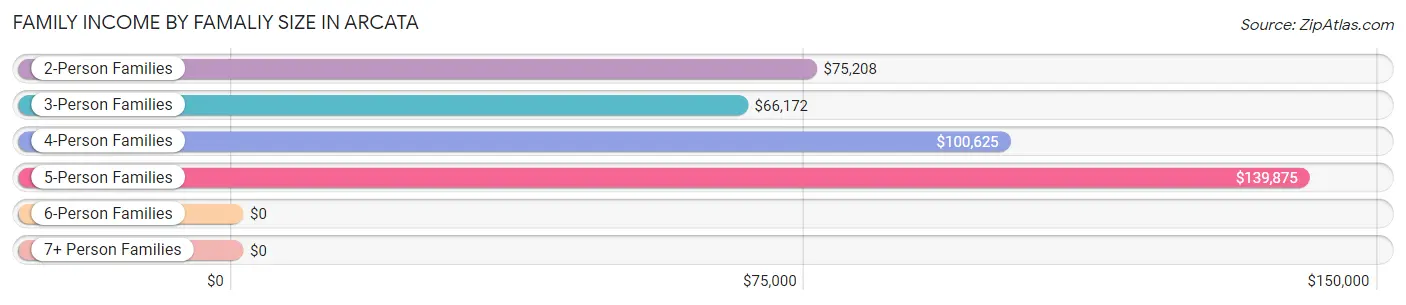
| Income Bracket | # Families | Median Income |
| 2-Person Families | 1,761 (63.3%) | $75,208 |
| 3-Person Families | 401 (14.4%) | $66,172 |
| 4-Person Families | 508 (18.3%) | $100,625 |
| 5-Person Families | 82 (2.9%) | $139,875 |
| 6-Person Families | 7 (0.3%) | $0 |
| 7+ Person Families | 23 (0.8%) | $0 |
| Total | 2,782 (100.0%) | $82,793 |
Family Income by Number of Earners in Arcata
The median family income in Arcata is $82,793, with families comprising 3+ earners (289) having the highest median family income of $143,237, while families with no earners (415) have the lowest median family income of $30,234, accounting for 10.4% and 14.9% of families, respectively.
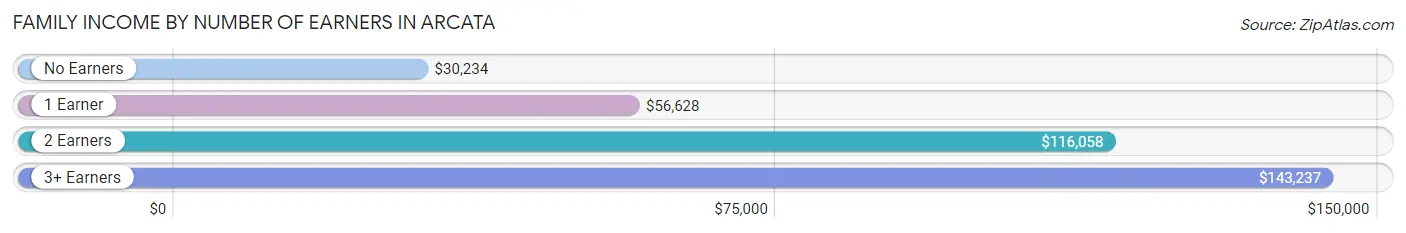
| Number of Earners | # Families | Median Income |
| No Earners | 415 (14.9%) | $30,234 |
| 1 Earner | 1,065 (38.3%) | $56,628 |
| 2 Earners | 1,013 (36.4%) | $116,058 |
| 3+ Earners | 289 (10.4%) | $143,237 |
| Total | 2,782 (100.0%) | $82,793 |
Household Income in Arcata
Household Income Brackets in Arcata
With 1,049 households falling in the category, the $50,000 to $74,999 income range is the most frequent in Arcata, accounting for 14.0% of all households. In contrast, only 240 households (3.2%) fall into the $200,000+ income bracket, making it the least populous group.
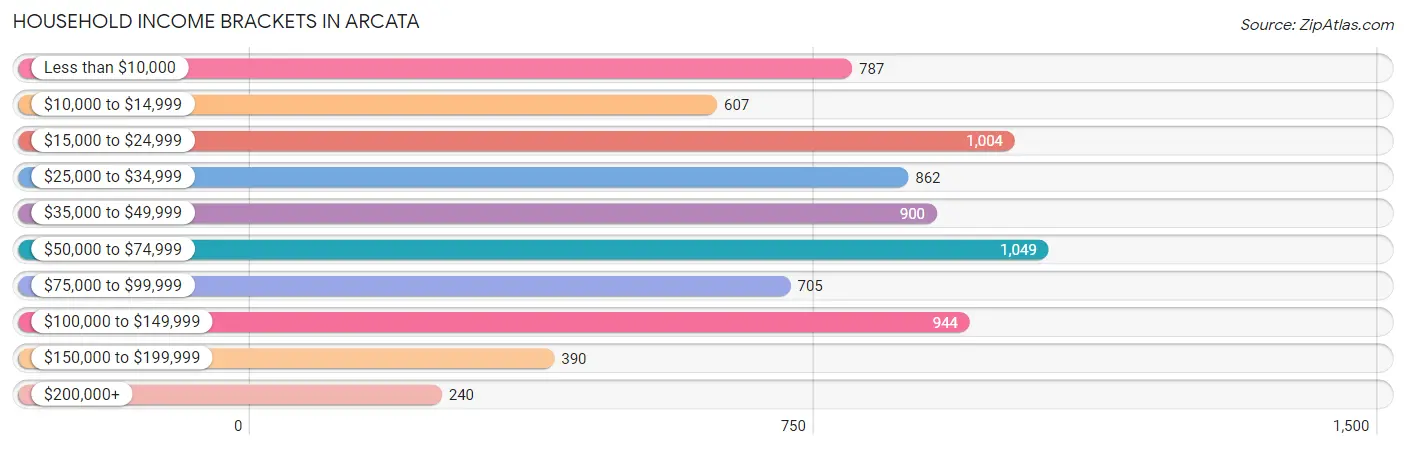
| Income Bracket | # Households | % Households |
| Less than $10,000 | 787 | 10.5% |
| $10,000 to $14,999 | 607 | 8.1% |
| $15,000 to $24,999 | 1,004 | 13.4% |
| $25,000 to $34,999 | 862 | 11.5% |
| $35,000 to $49,999 | 900 | 12.0% |
| $50,000 to $74,999 | 1,049 | 14.0% |
| $75,000 to $99,999 | 705 | 9.4% |
| $100,000 to $149,999 | 944 | 12.6% |
| $150,000 to $199,999 | 390 | 5.2% |
| $200,000+ | 240 | 3.2% |
Household Income by Householder Age in Arcata
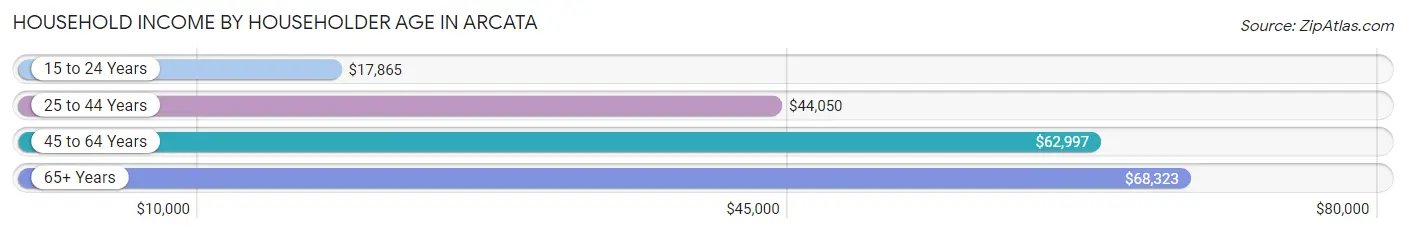
The median household income in Arcata is $43,444, with the highest median household income of $68,323 found in the 65+ years age bracket for the primary householder. A total of 1,533 households (20.4%) fall into this category. Meanwhile, the 15 to 24 years age bracket for the primary householder has the lowest median household income of $17,865, with 1,489 households (19.9%) in this group.
| Income Bracket | # Households | Median Income |
| 15 to 24 Years | 1,489 (19.9%) | $17,865 |
| 25 to 44 Years | 2,653 (35.4%) | $44,050 |
| 45 to 64 Years | 1,821 (24.3%) | $62,997 |
| 65+ Years | 1,533 (20.4%) | $68,323 |
| Total | 7,496 (100.0%) | $43,444 |
Poverty in Arcata
Income Below Poverty by Sex and Age in Arcata
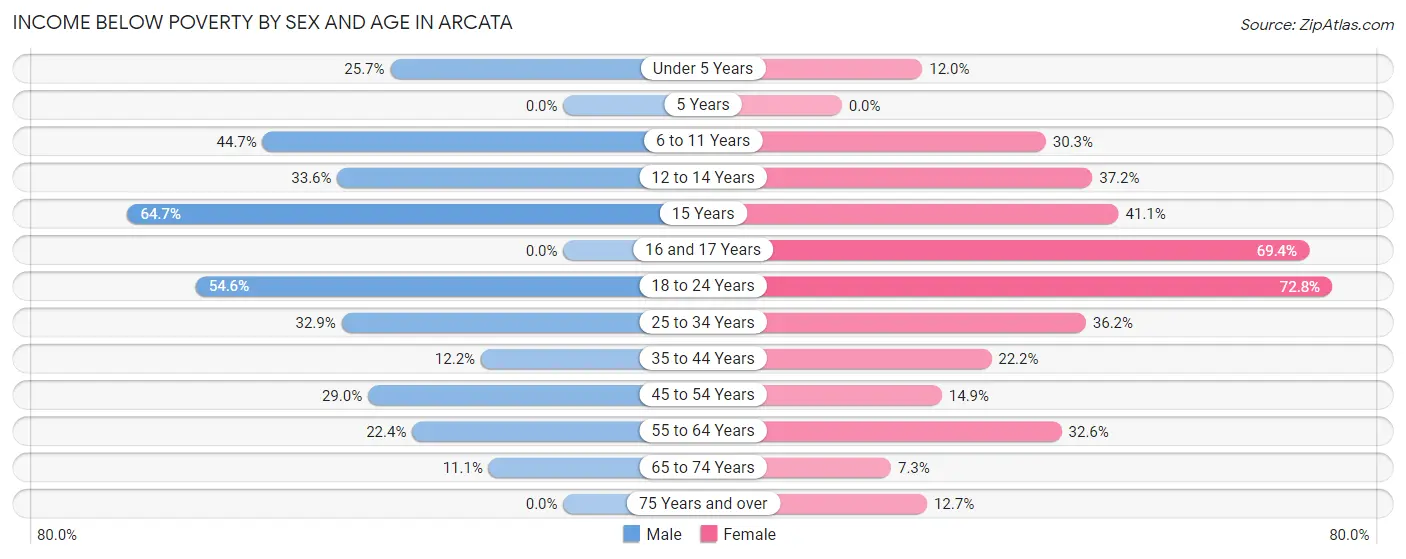
With 32.5% poverty level for males and 36.6% for females among the residents of Arcata, 15 year old males and 18 to 24 year old females are the most vulnerable to poverty, with 44 males (64.7%) and 1,371 females (72.8%) in their respective age groups living below the poverty level.
| Age Bracket | Male | Female |
| Under 5 Years | 37 (25.7%) | 33 (12.0%) |
| 5 Years | 0 (0.0%) | 0 (0.0%) |
| 6 to 11 Years | 113 (44.7%) | 173 (30.3%) |
| 12 to 14 Years | 50 (33.6%) | 125 (37.2%) |
| 15 Years | 44 (64.7%) | 30 (41.1%) |
| 16 and 17 Years | 0 (0.0%) | 129 (69.4%) |
| 18 to 24 Years | 1,405 (54.6%) | 1,371 (72.8%) |
| 25 to 34 Years | 613 (32.9%) | 519 (36.2%) |
| 35 to 44 Years | 133 (12.2%) | 210 (22.2%) |
| 45 to 54 Years | 172 (29.0%) | 99 (14.9%) |
| 55 to 64 Years | 173 (22.4%) | 221 (32.6%) |
| 65 to 74 Years | 85 (11.1%) | 56 (7.3%) |
| 75 Years and over | 0 (0.0%) | 52 (12.7%) |
| Total | 2,825 (32.5%) | 3,018 (36.6%) |
Income Above Poverty by Sex and Age in Arcata
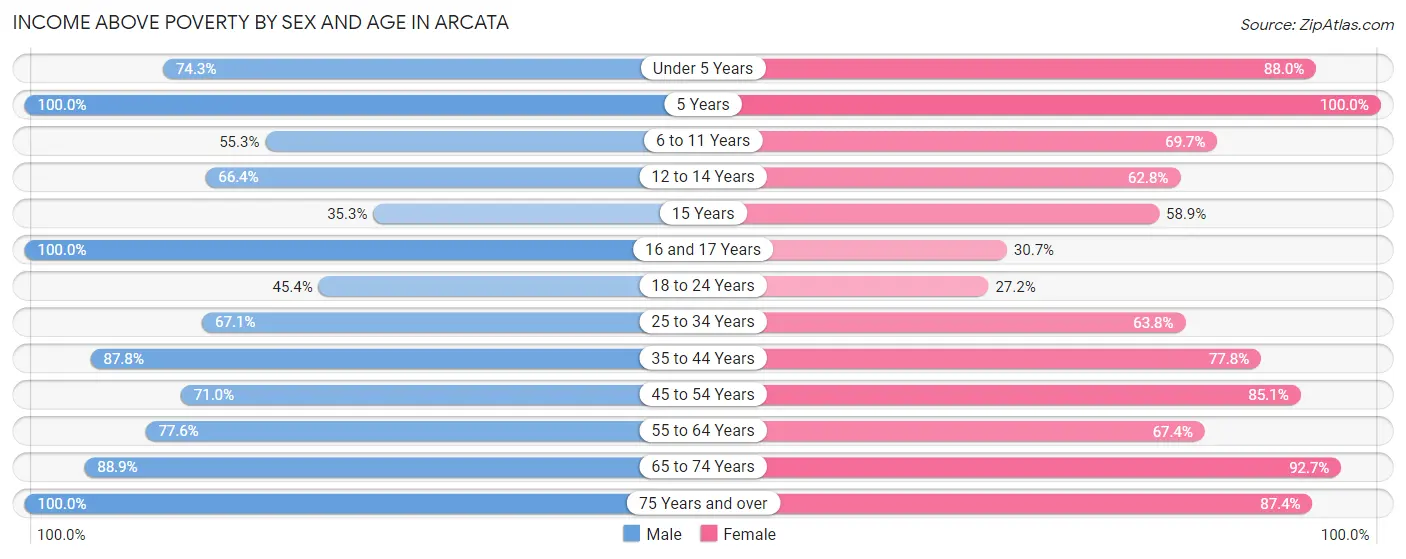
According to the poverty statistics in Arcata, males aged 5 years and females aged 5 years are the age groups that are most secure financially, with 100.0% of males and 100.0% of females in these age groups living above the poverty line.
| Age Bracket | Male | Female |
| Under 5 Years | 107 (74.3%) | 243 (88.0%) |
| 5 Years | 24 (100.0%) | 27 (100.0%) |
| 6 to 11 Years | 140 (55.3%) | 398 (69.7%) |
| 12 to 14 Years | 99 (66.4%) | 211 (62.8%) |
| 15 Years | 24 (35.3%) | 43 (58.9%) |
| 16 and 17 Years | 160 (100.0%) | 57 (30.6%) |
| 18 to 24 Years | 1,170 (45.4%) | 513 (27.2%) |
| 25 to 34 Years | 1,248 (67.1%) | 913 (63.8%) |
| 35 to 44 Years | 954 (87.8%) | 736 (77.8%) |
| 45 to 54 Years | 421 (71.0%) | 567 (85.1%) |
| 55 to 64 Years | 598 (77.6%) | 456 (67.4%) |
| 65 to 74 Years | 682 (88.9%) | 710 (92.7%) |
| 75 Years and over | 244 (100.0%) | 359 (87.4%) |
| Total | 5,871 (67.5%) | 5,233 (63.4%) |
Income Below Poverty Among Married-Couple Families in Arcata
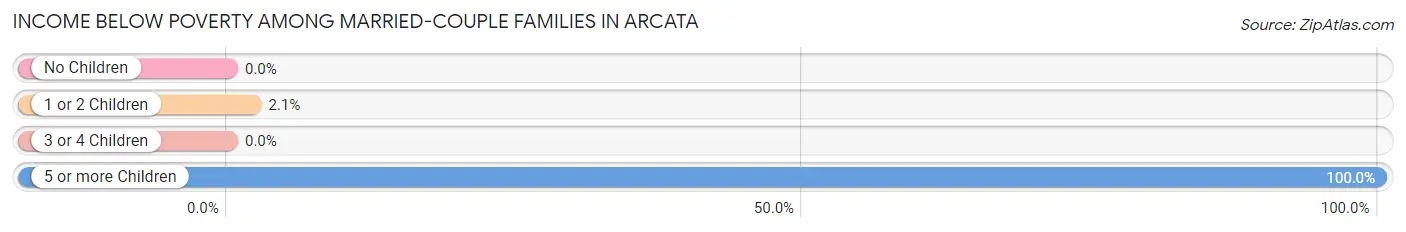
The poverty statistics for married-couple families in Arcata show that 2.1% or 32 of the total 1,559 families live below the poverty line. Families with 5 or more children have the highest poverty rate of 100.0%, comprising of 23 families. On the other hand, families with no children have the lowest poverty rate of 0.0%, which includes 0 families.
| Children | Above Poverty | Below Poverty |
| No Children | 1,033 (100.0%) | 0 (0.0%) |
| 1 or 2 Children | 431 (98.0%) | 9 (2.1%) |
| 3 or 4 Children | 63 (100.0%) | 0 (0.0%) |
| 5 or more Children | 0 (0.0%) | 23 (100.0%) |
| Total | 1,527 (98.0%) | 32 (2.1%) |
Income Below Poverty Among Single-Parent Households in Arcata
According to the poverty data in Arcata, 30.7% or 101 single-father households and 37.0% or 331 single-mother households are living below the poverty line. Among single-father households, those with 1 or 2 children have the highest poverty rate, with 73 households (34.1%) experiencing poverty. Likewise, among single-mother households, those with 1 or 2 children have the highest poverty rate, with 284 households (44.9%) falling below the poverty line.
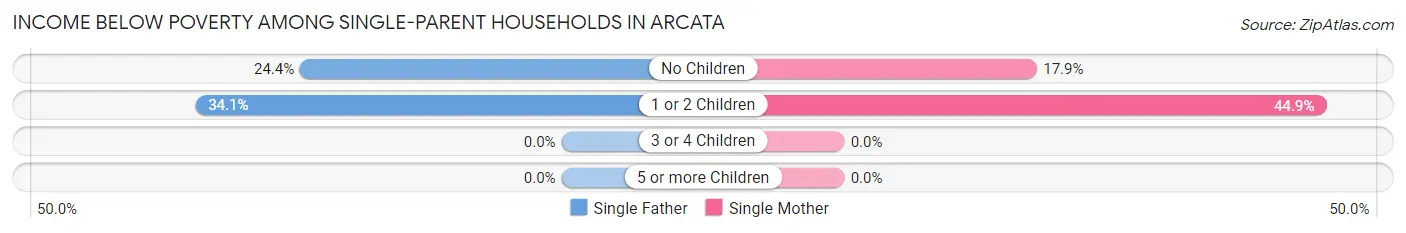
| Children | Single Father | Single Mother |
| No Children | 28 (24.3%) | 47 (17.9%) |
| 1 or 2 Children | 73 (34.1%) | 284 (44.9%) |
| 3 or 4 Children | 0 (0.0%) | 0 (0.0%) |
| 5 or more Children | 0 (0.0%) | 0 (0.0%) |
| Total | 101 (30.7%) | 331 (37.0%) |
Income Below Poverty Among Married-Couple vs Single-Parent Households in Arcata
The poverty data for Arcata shows that 32 of the married-couple family households (2.1%) and 432 of the single-parent households (35.3%) are living below the poverty level. Within the married-couple family households, those with 5 or more children have the highest poverty rate, with 23 households (100.0%) falling below the poverty line. Among the single-parent households, those with 1 or 2 children have the highest poverty rate, with 357 household (42.2%) living below poverty.
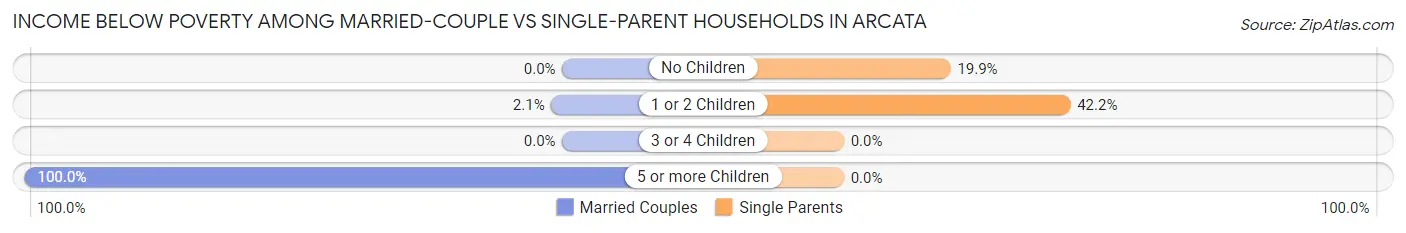
| Children | Married-Couple Families | Single-Parent Households |
| No Children | 0 (0.0%) | 75 (19.9%) |
| 1 or 2 Children | 9 (2.1%) | 357 (42.2%) |
| 3 or 4 Children | 0 (0.0%) | 0 (0.0%) |
| 5 or more Children | 23 (100.0%) | 0 (0.0%) |
| Total | 32 (2.1%) | 432 (35.3%) |
Race in Arcata
The most populous races in Arcata are White / Caucasian (13,230 | 71.4%), Hispanic or Latino (2,964 | 16.0%), and Two or more Races (2,085 | 11.3%).
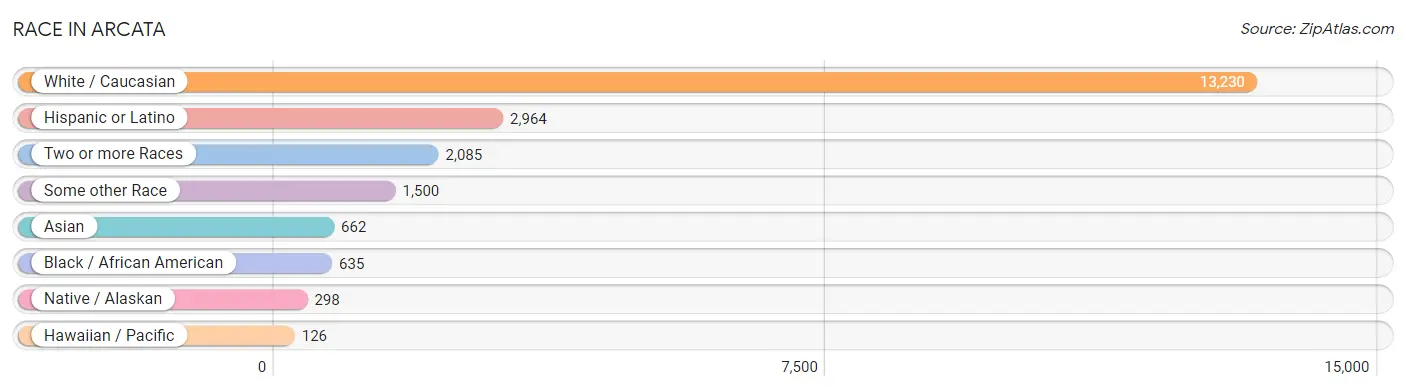
| Race | # Population | % Population |
| Asian | 662 | 3.6% |
| Black / African American | 635 | 3.4% |
| Hawaiian / Pacific | 126 | 0.7% |
| Hispanic or Latino | 2,964 | 16.0% |
| Native / Alaskan | 298 | 1.6% |
| White / Caucasian | 13,230 | 71.4% |
| Two or more Races | 2,085 | 11.3% |
| Some other Race | 1,500 | 8.1% |
| Total | 18,536 | 100.0% |
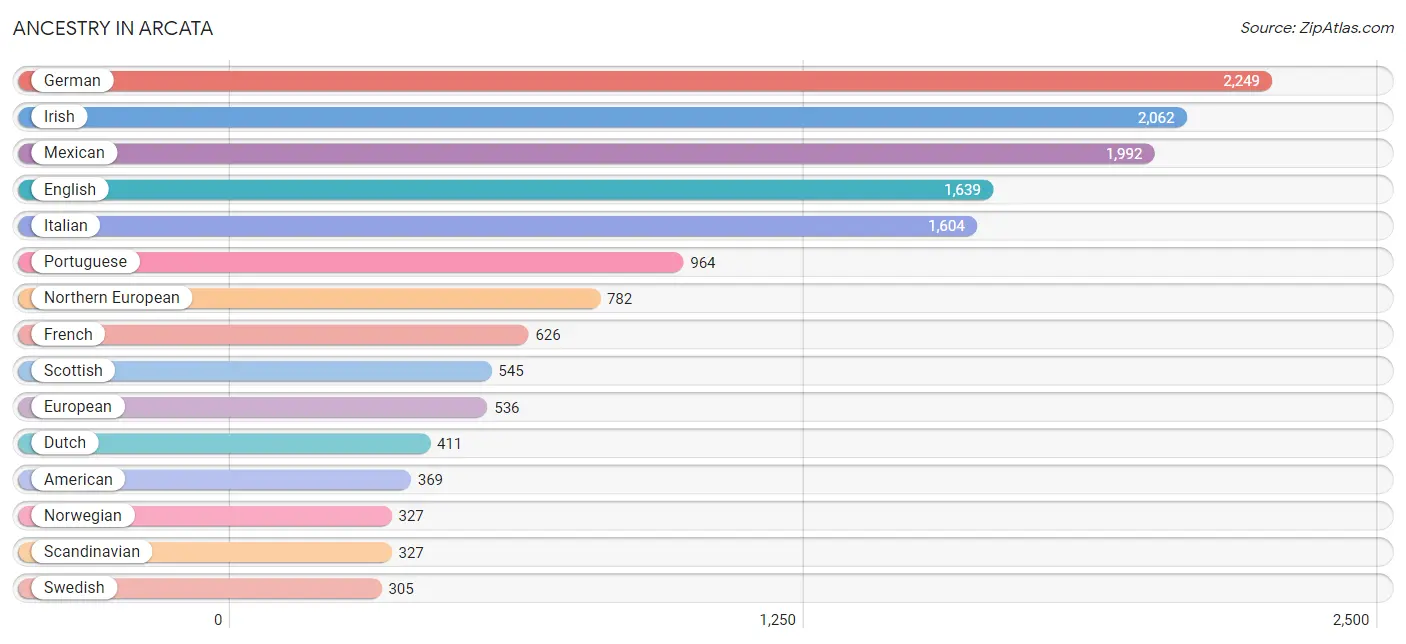
Ancestry in Arcata
The most populous ancestries reported in Arcata are German (2,249 | 12.1%), Irish (2,062 | 11.1%), Mexican (1,992 | 10.7%), English (1,639 | 8.8%), and Italian (1,604 | 8.6%), together accounting for 51.5% of all Arcata residents.
| Ancestry | # Population | % Population |
| American | 369 | 2.0% |
| Arab | 144 | 0.8% |
| Armenian | 37 | 0.2% |
| Austrian | 66 | 0.4% |
| Bangladeshi | 261 | 1.4% |
| Basque | 212 | 1.1% |
| Belgian | 31 | 0.2% |
| Bhutanese | 138 | 0.7% |
| Blackfeet | 5 | 0.0% |
| Bolivian | 39 | 0.2% |
| Brazilian | 58 | 0.3% |
| British | 141 | 0.8% |
| British West Indian | 3 | 0.0% |
| Burmese | 52 | 0.3% |
| Canadian | 12 | 0.1% |
| Celtic | 3 | 0.0% |
| Central American | 269 | 1.5% |
| Central American Indian | 46 | 0.3% |
| Cherokee | 92 | 0.5% |
| Chilean | 49 | 0.3% |
| Chippewa | 2 | 0.0% |
| Choctaw | 14 | 0.1% |
| Colombian | 33 | 0.2% |
| Creek | 15 | 0.1% |
| Croatian | 47 | 0.3% |
| Czech | 17 | 0.1% |
| Czechoslovakian | 33 | 0.2% |
| Danish | 183 | 1.0% |
| Dutch | 411 | 2.2% |
| Eastern European | 233 | 1.3% |
| Ecuadorian | 67 | 0.4% |
| Egyptian | 62 | 0.3% |
| English | 1,639 | 8.8% |
| European | 536 | 2.9% |
| Filipino | 4 | 0.0% |
| Finnish | 2 | 0.0% |
| French | 626 | 3.4% |
| French Canadian | 22 | 0.1% |
| German | 2,249 | 12.1% |
| Ghanaian | 34 | 0.2% |
| Guatemalan | 84 | 0.4% |
| Guyanese | 3 | 0.0% |
| Honduran | 5 | 0.0% |
| Hungarian | 31 | 0.2% |
| Indian (Asian) | 159 | 0.9% |
| Iranian | 15 | 0.1% |
| Iraqi | 20 | 0.1% |
| Irish | 2,062 | 11.1% |
| Italian | 1,604 | 8.6% |
| Jamaican | 18 | 0.1% |
| Japanese | 28 | 0.2% |
| Korean | 88 | 0.5% |
| Laotian | 55 | 0.3% |
| Lebanese | 30 | 0.2% |
| Malaysian | 6 | 0.0% |
| Maltese | 10 | 0.1% |
| Mexican | 1,992 | 10.7% |
| Mexican American Indian | 76 | 0.4% |
| Native Hawaiian | 34 | 0.2% |
| Navajo | 52 | 0.3% |
| New Zealander | 28 | 0.2% |
| Nicaraguan | 63 | 0.3% |
| Nigerian | 7 | 0.0% |
| Northern European | 782 | 4.2% |
| Norwegian | 327 | 1.8% |
| Pakistani | 3 | 0.0% |
| Palestinian | 19 | 0.1% |
| Peruvian | 26 | 0.1% |
| Polish | 258 | 1.4% |
| Portuguese | 964 | 5.2% |
| Potawatomi | 23 | 0.1% |
| Puerto Rican | 264 | 1.4% |
| Romanian | 7 | 0.0% |
| Russian | 257 | 1.4% |
| Salvadoran | 117 | 0.6% |
| Samoan | 2 | 0.0% |
| Scandinavian | 327 | 1.8% |
| Scotch-Irish | 270 | 1.5% |
| Scottish | 545 | 2.9% |
| Sioux | 31 | 0.2% |
| Slavic | 9 | 0.1% |
| Slovak | 11 | 0.1% |
| South American | 226 | 1.2% |
| Spaniard | 123 | 0.7% |
| Spanish American | 16 | 0.1% |
| Sri Lankan | 131 | 0.7% |
| Subsaharan African | 50 | 0.3% |
| Swedish | 305 | 1.7% |
| Swiss | 38 | 0.2% |
| Taiwanese | 51 | 0.3% |
| Thai | 26 | 0.1% |
| Tohono O'Odham | 12 | 0.1% |
| Tongan | 92 | 0.5% |
| Ukrainian | 82 | 0.4% |
| Venezuelan | 12 | 0.1% |
| Welsh | 158 | 0.9% |
| West Indian | 107 | 0.6% |
| Yaqui | 18 | 0.1% |
| Yugoslavian | 53 | 0.3% | View All 99 Rows |
Immigrants in Arcata
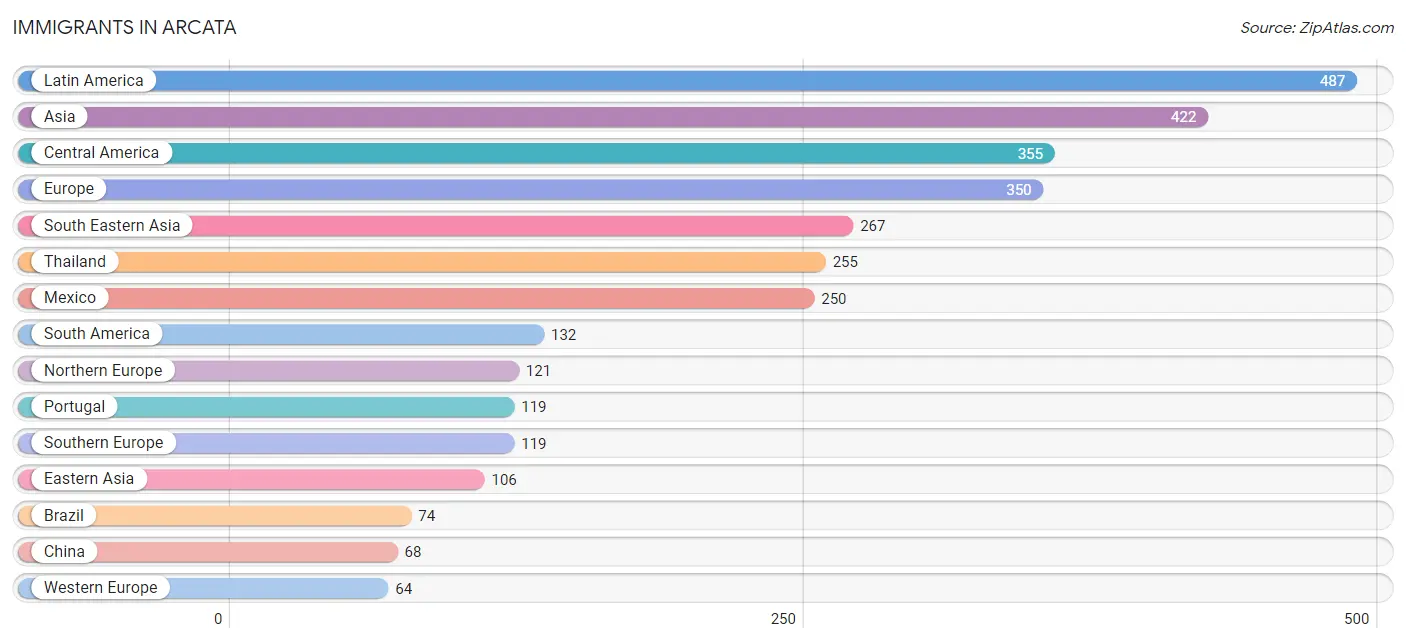
The most numerous immigrant groups reported in Arcata came from Latin America (487 | 2.6%), Asia (422 | 2.3%), Central America (355 | 1.9%), Europe (350 | 1.9%), and South Eastern Asia (267 | 1.4%), together accounting for 10.2% of all Arcata residents.
| Immigration Origin | # Population | % Population |
| Africa | 18 | 0.1% |
| Asia | 422 | 2.3% |
| Australia | 10 | 0.1% |
| Bolivia | 38 | 0.2% |
| Brazil | 74 | 0.4% |
| Canada | 8 | 0.0% |
| Central America | 355 | 1.9% |
| Chile | 20 | 0.1% |
| China | 68 | 0.4% |
| Denmark | 10 | 0.1% |
| Eastern Asia | 106 | 0.6% |
| Eastern Europe | 46 | 0.3% |
| El Salvador | 17 | 0.1% |
| England | 27 | 0.2% |
| Europe | 350 | 1.9% |
| Germany | 20 | 0.1% |
| Guatemala | 28 | 0.2% |
| Iran | 15 | 0.1% |
| Japan | 12 | 0.1% |
| Korea | 26 | 0.1% |
| Latin America | 487 | 2.6% |
| Mexico | 250 | 1.3% |
| Netherlands | 31 | 0.2% |
| Nicaragua | 60 | 0.3% |
| Northern Europe | 121 | 0.6% |
| Oceania | 24 | 0.1% |
| Portugal | 119 | 0.6% |
| Russia | 46 | 0.3% |
| South Africa | 9 | 0.1% |
| South America | 132 | 0.7% |
| South Central Asia | 49 | 0.3% |
| South Eastern Asia | 267 | 1.4% |
| Southern Europe | 119 | 0.6% |
| Sri Lanka | 34 | 0.2% |
| Switzerland | 13 | 0.1% |
| Thailand | 255 | 1.4% |
| Vietnam | 12 | 0.1% |
| Western Africa | 9 | 0.1% |
| Western Europe | 64 | 0.4% | View All 39 Rows |
Sex and Age in Arcata
Sex and Age in Arcata
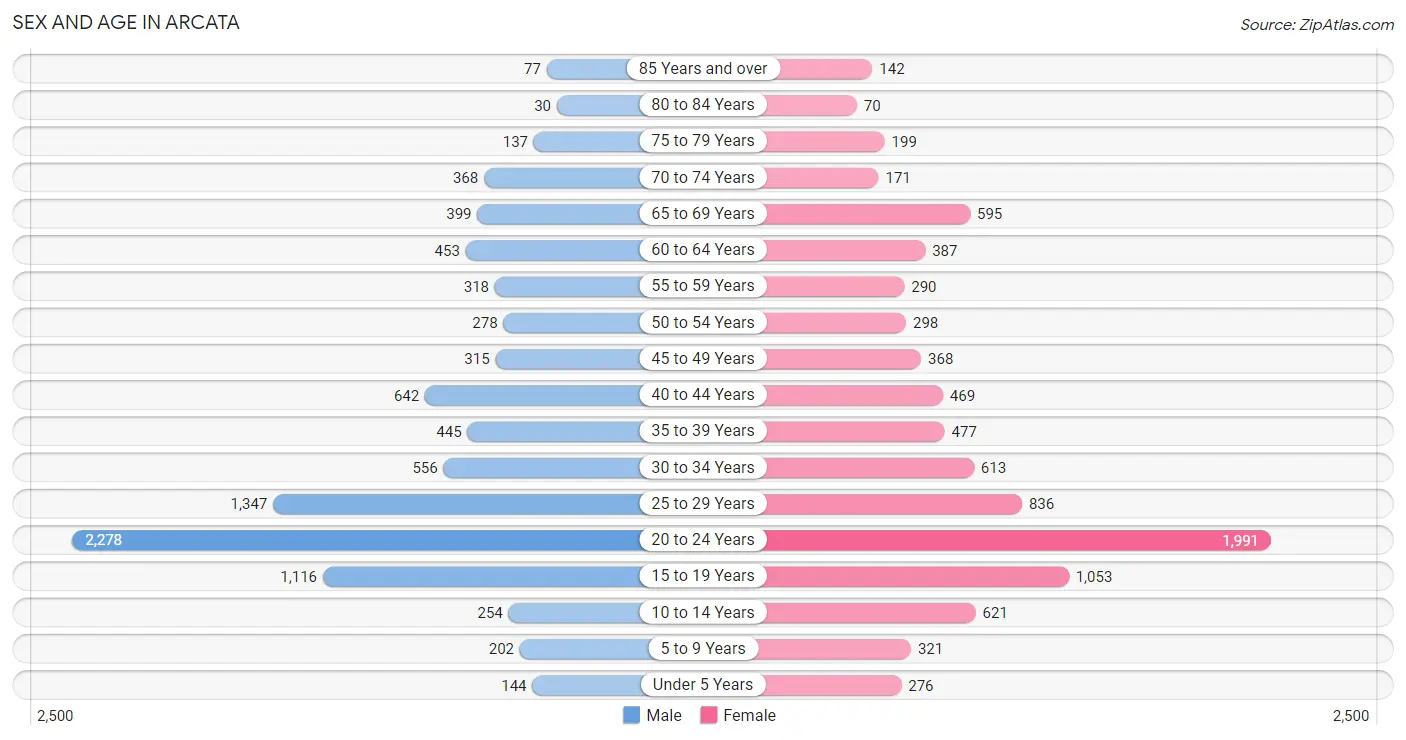
The most populous age groups in Arcata are 20 to 24 Years (2,278 | 24.3%) for men and 20 to 24 Years (1,991 | 21.7%) for women.
| Age Bracket | Male | Female |
| Under 5 Years | 144 (1.5%) | 276 (3.0%) |
| 5 to 9 Years | 202 (2.2%) | 321 (3.5%) |
| 10 to 14 Years | 254 (2.7%) | 621 (6.8%) |
| 15 to 19 Years | 1,116 (11.9%) | 1,053 (11.5%) |
| 20 to 24 Years | 2,278 (24.3%) | 1,991 (21.7%) |
| 25 to 29 Years | 1,347 (14.4%) | 836 (9.1%) |
| 30 to 34 Years | 556 (5.9%) | 613 (6.7%) |
| 35 to 39 Years | 445 (4.8%) | 477 (5.2%) |
| 40 to 44 Years | 642 (6.9%) | 469 (5.1%) |
| 45 to 49 Years | 315 (3.4%) | 368 (4.0%) |
| 50 to 54 Years | 278 (3.0%) | 298 (3.3%) |
| 55 to 59 Years | 318 (3.4%) | 290 (3.2%) |
| 60 to 64 Years | 453 (4.8%) | 387 (4.2%) |
| 65 to 69 Years | 399 (4.3%) | 595 (6.5%) |
| 70 to 74 Years | 368 (3.9%) | 171 (1.9%) |
| 75 to 79 Years | 137 (1.5%) | 199 (2.2%) |
| 80 to 84 Years | 30 (0.3%) | 70 (0.8%) |
| 85 Years and over | 77 (0.8%) | 142 (1.5%) |
| Total | 9,359 (100.0%) | 9,177 (100.0%) |
Families and Households in Arcata
Median Family Size in Arcata
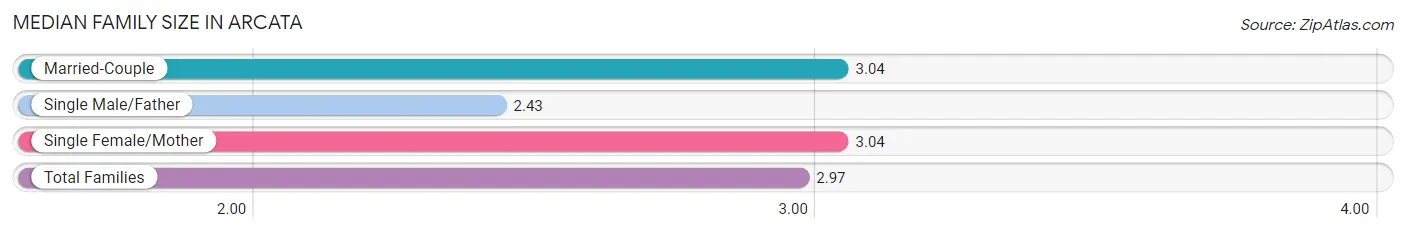
The median family size in Arcata is 2.97 persons per family, with married-couple families (1,559 | 56.0%) accounting for the largest median family size of 3.04 persons per family. On the other hand, single male/father families (329 | 11.8%) represent the smallest median family size with 2.43 persons per family.
| Family Type | # Families | Family Size |
| Married-Couple | 1,559 (56.0%) | 3.04 |
| Single Male/Father | 329 (11.8%) | 2.43 |
| Single Female/Mother | 894 (32.1%) | 3.04 |
| Total Families | 2,782 (100.0%) | 2.97 |
Median Household Size in Arcata
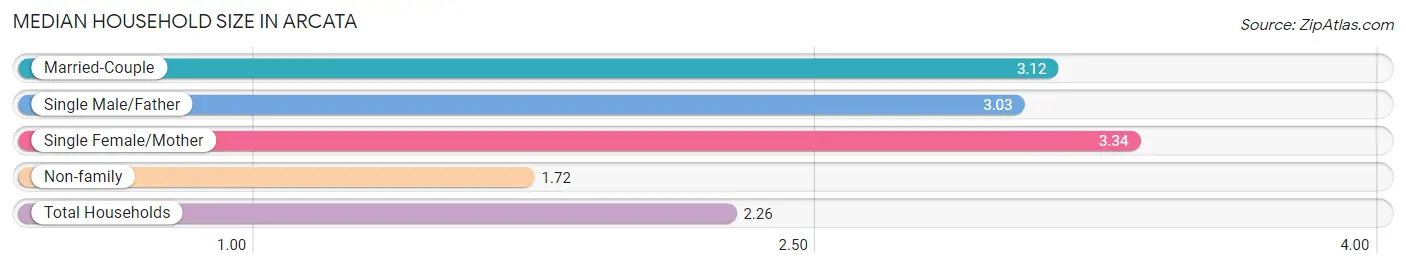
The median household size in Arcata is 2.26 persons per household, with single female/mother households (894 | 11.9%) accounting for the largest median household size of 3.34 persons per household. non-family households (4,714 | 62.9%) represent the smallest median household size with 1.72 persons per household.
| Household Type | # Households | Household Size |
| Married-Couple | 1,559 (20.8%) | 3.12 |
| Single Male/Father | 329 (4.4%) | 3.03 |
| Single Female/Mother | 894 (11.9%) | 3.34 |
| Non-family | 4,714 (62.9%) | 1.72 |
| Total Households | 7,496 (100.0%) | 2.26 |
Household Size by Marriage Status in Arcata
Out of a total of 7,496 households in Arcata, 2,782 (37.1%) are family households, while 4,714 (62.9%) are nonfamily households. The most numerous type of family households are 2-person households, comprising 1,435, and the most common type of nonfamily households are 1-person households, comprising 2,613.
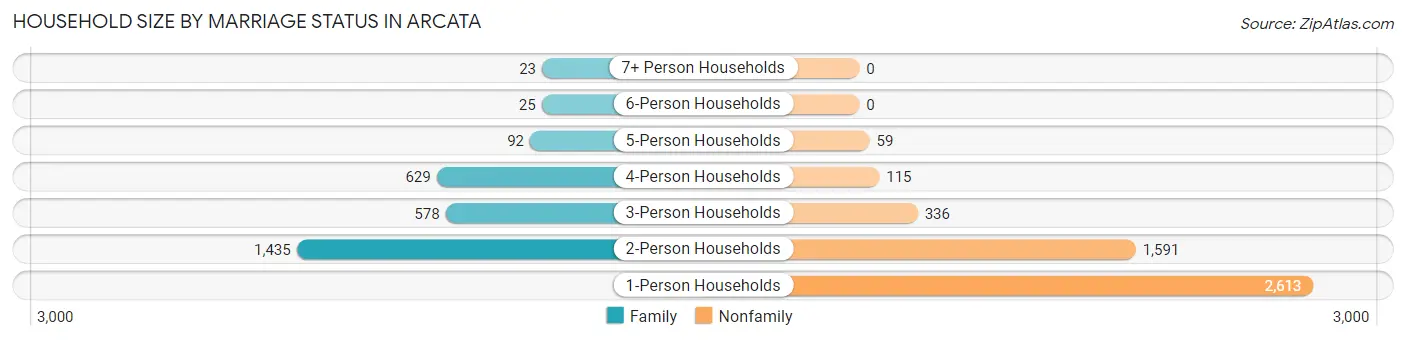
| Household Size | Family Households | Nonfamily Households |
| 1-Person Households | - | 2,613 (34.9%) |
| 2-Person Households | 1,435 (19.1%) | 1,591 (21.2%) |
| 3-Person Households | 578 (7.7%) | 336 (4.5%) |
| 4-Person Households | 629 (8.4%) | 115 (1.5%) |
| 5-Person Households | 92 (1.2%) | 59 (0.8%) |
| 6-Person Households | 25 (0.3%) | 0 (0.0%) |
| 7+ Person Households | 23 (0.3%) | 0 (0.0%) |
| Total | 2,782 (37.1%) | 4,714 (62.9%) |
Female Fertility in Arcata
Fertility by Age in Arcata
Average fertility rate in Arcata is 15.0 births per 1,000 women. Women in the age bracket of 35 to 50 years have the highest fertility rate with 23.0 births per 1,000 women. Women in the age bracket of 20 to 34 years acount for 62.5% of all women with births.
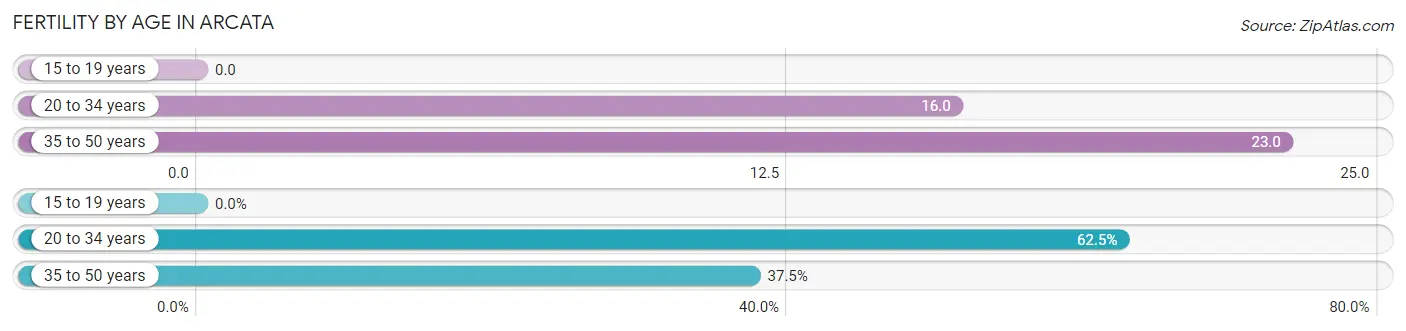
| Age Bracket | Women with Births | Births / 1,000 Women |
| 15 to 19 years | 0 (0.0%) | 0.0 |
| 20 to 34 years | 55 (62.5%) | 16.0 |
| 35 to 50 years | 33 (37.5%) | 23.0 |
| Total | 88 (100.0%) | 15.0 |
Fertility by Age by Marriage Status in Arcata
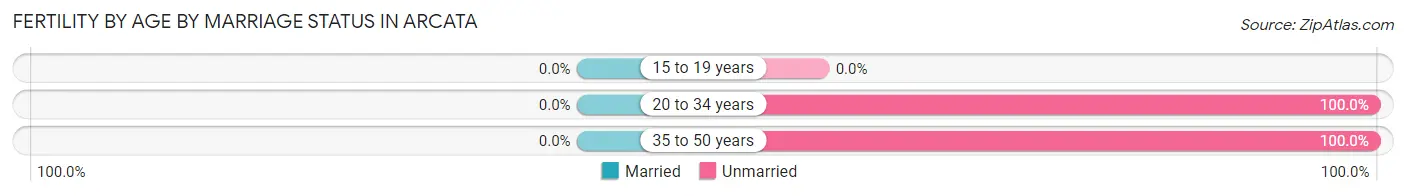
| Age Bracket | Married | Unmarried |
| 15 to 19 years | 0 (0.0%) | 0 (0.0%) |
| 20 to 34 years | 0 (0.0%) | 55 (100.0%) |
| 35 to 50 years | 0 (0.0%) | 33 (100.0%) |
| Total | 0 (0.0%) | 88 (100.0%) |
Fertility by Education in Arcata
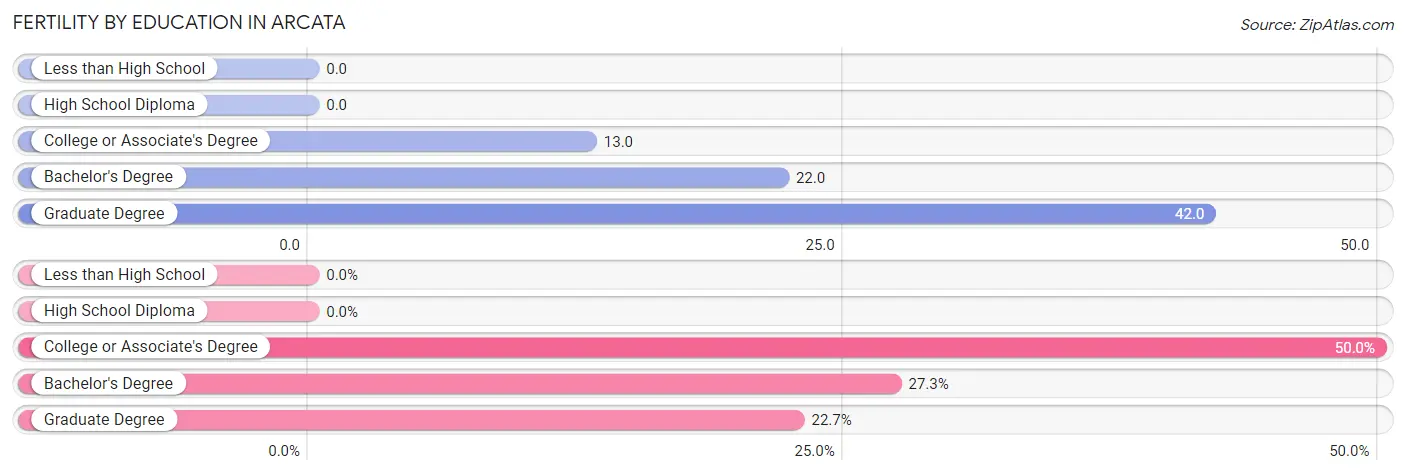
| Educational Attainment | Women with Births | Births / 1,000 Women |
| Less than High School | 0 (0.0%) | 0.0 |
| High School Diploma | 0 (0.0%) | 0.0 |
| College or Associate's Degree | 44 (50.0%) | 13.0 |
| Bachelor's Degree | 24 (27.3%) | 22.0 |
| Graduate Degree | 20 (22.7%) | 42.0 |
| Total | 88 (100.0%) | 15.0 |
Fertility by Education by Marriage Status in Arcata
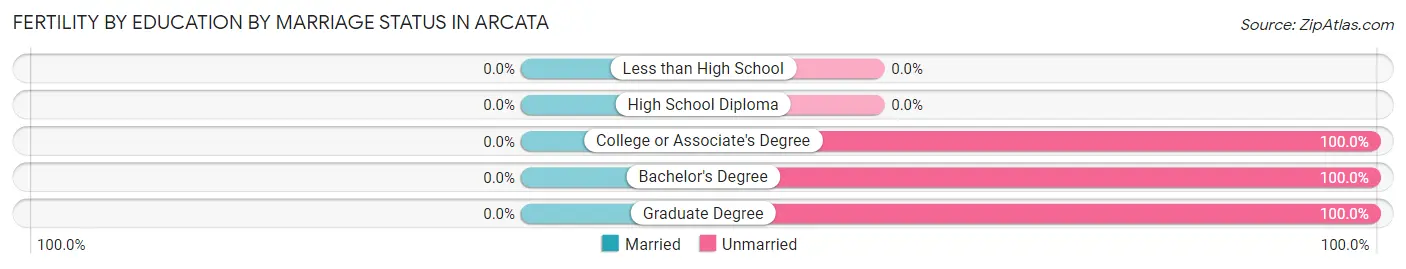
| Educational Attainment | Married | Unmarried |
| Less than High School | 0 (0.0%) | 0 (0.0%) |
| High School Diploma | 0 (0.0%) | 0 (0.0%) |
| College or Associate's Degree | 0 (0.0%) | 44 (100.0%) |
| Bachelor's Degree | 0 (0.0%) | 24 (100.0%) |
| Graduate Degree | 0 (0.0%) | 20 (100.0%) |
| Total | 0 (0.0%) | 88 (100.0%) |
Employment Characteristics in Arcata
Employment by Class of Employer in Arcata
Among the 9,073 employed individuals in Arcata, private company employees (5,161 | 56.9%), state government employees (1,214 | 13.4%), and self-employed (not incorporated) (908 | 10.0%) make up the most common classes of employment.
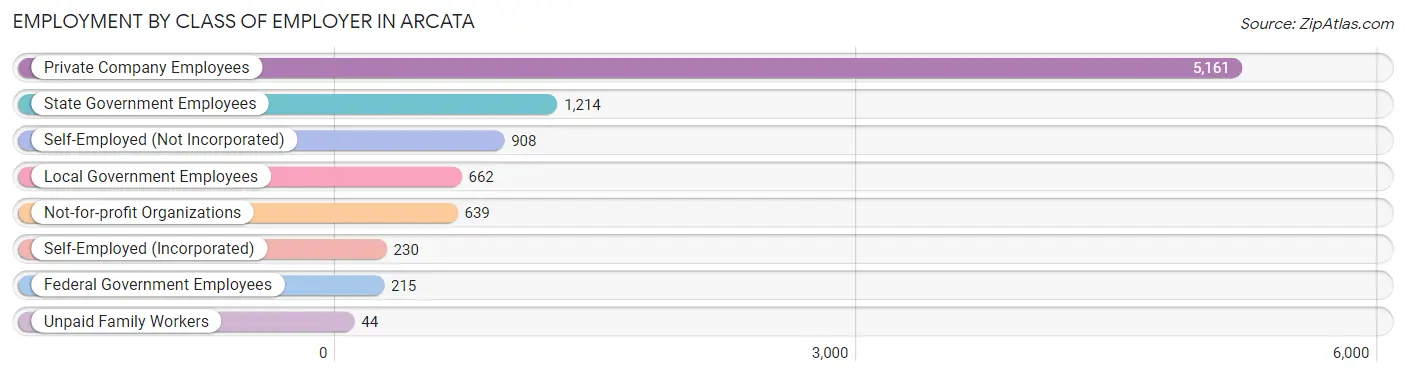
| Employer Class | # Employees | % Employees |
| Private Company Employees | 5,161 | 56.9% |
| Self-Employed (Incorporated) | 230 | 2.5% |
| Self-Employed (Not Incorporated) | 908 | 10.0% |
| Not-for-profit Organizations | 639 | 7.0% |
| Local Government Employees | 662 | 7.3% |
| State Government Employees | 1,214 | 13.4% |
| Federal Government Employees | 215 | 2.4% |
| Unpaid Family Workers | 44 | 0.5% |
| Total | 9,073 | 100.0% |
Employment Status by Age in Arcata
According to the labor force statistics for Arcata, out of the total population over 16 years of age (16,577), 66.8% or 11,073 individuals are in the labor force, with 13.9% or 1,539 of them unemployed. The age group with the highest labor force participation rate is 30 to 34 years, with 84.3% or 985 individuals in the labor force. Within the labor force, the 35 to 44 years age range has the highest percentage of unemployed individuals, with 26.2% or 440 of them being unemployed.
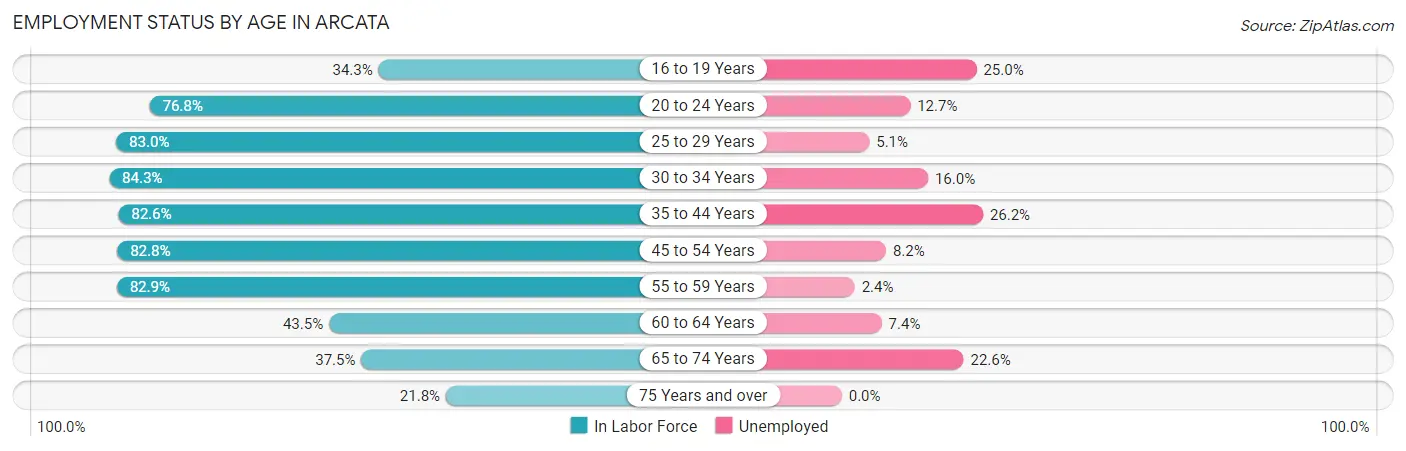
| Age Bracket | In Labor Force | Unemployed |
| 16 to 19 Years | 696 (34.3%) | 174 (25.0%) |
| 20 to 24 Years | 3,279 (76.8%) | 416 (12.7%) |
| 25 to 29 Years | 1,812 (83.0%) | 92 (5.1%) |
| 30 to 34 Years | 985 (84.3%) | 158 (16.0%) |
| 35 to 44 Years | 1,679 (82.6%) | 440 (26.2%) |
| 45 to 54 Years | 1,042 (82.8%) | 85 (8.2%) |
| 55 to 59 Years | 504 (82.9%) | 12 (2.4%) |
| 60 to 64 Years | 365 (43.5%) | 27 (7.4%) |
| 65 to 74 Years | 575 (37.5%) | 130 (22.6%) |
| 75 Years and over | 143 (21.8%) | 0 (0.0%) |
| Total | 11,073 (66.8%) | 1,539 (13.9%) |
Employment Status by Educational Attainment in Arcata
According to labor force statistics for Arcata, 78.9% of individuals (6,385) out of the total population between 25 and 64 years of age (8,092) are in the labor force, with 12.8% or 817 of them being unemployed. The group with the highest labor force participation rate are those with the educational attainment of bachelor's degree or higher, with 88.1% or 2,987 individuals in the labor force. Within the labor force, individuals with college / associate degree education have the highest percentage of unemployment, with 25.5% or 593 of them being unemployed.
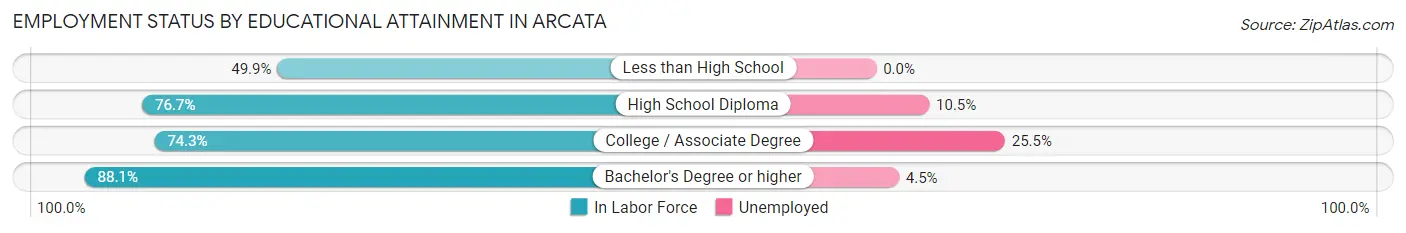
| Educational Attainment | In Labor Force | Unemployed |
| Less than High School | 247 (49.9%) | 0 (0.0%) |
| High School Diploma | 827 (76.7%) | 113 (10.5%) |
| College / Associate Degree | 2,324 (74.3%) | 798 (25.5%) |
| Bachelor's Degree or higher | 2,987 (88.1%) | 153 (4.5%) |
| Total | 6,385 (78.9%) | 1,036 (12.8%) |
Employment Occupations by Sex in Arcata
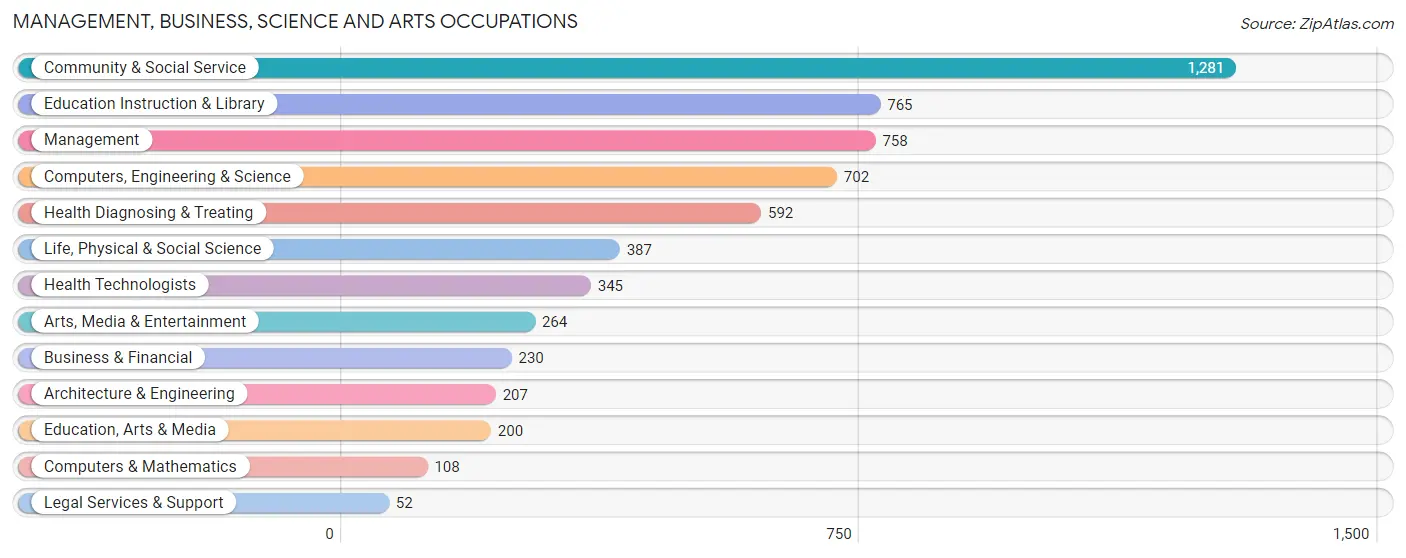
Management, Business, Science and Arts Occupations
The most common Management, Business, Science and Arts occupations in Arcata are Community & Social Service (1,281 | 13.4%), Education Instruction & Library (765 | 8.0%), Management (758 | 7.9%), Computers, Engineering & Science (702 | 7.4%), and Health Diagnosing & Treating (592 | 6.2%).
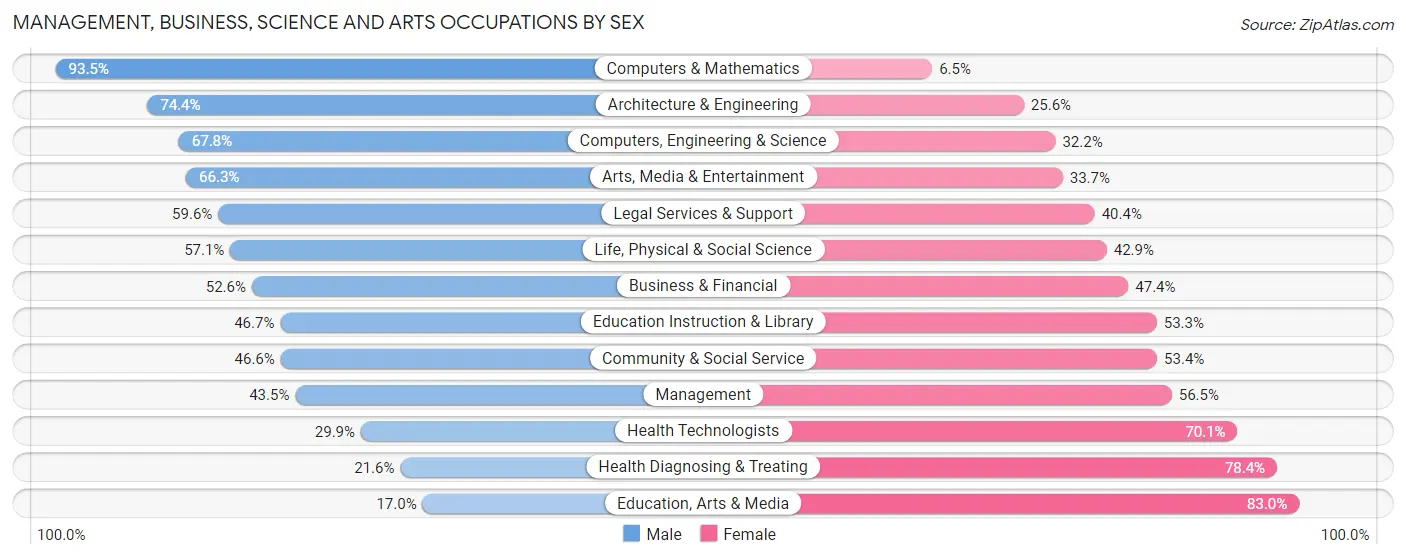
Management, Business, Science and Arts Occupations by Sex
Within the Management, Business, Science and Arts occupations in Arcata, the most male-oriented occupations are Computers & Mathematics (93.5%), Architecture & Engineering (74.4%), and Computers, Engineering & Science (67.8%), while the most female-oriented occupations are Education, Arts & Media (83.0%), Health Diagnosing & Treating (78.4%), and Health Technologists (70.1%).
| Occupation | Male | Female |
| Management | 330 (43.5%) | 428 (56.5%) |
| Business & Financial | 121 (52.6%) | 109 (47.4%) |
| Computers, Engineering & Science | 476 (67.8%) | 226 (32.2%) |
| Computers & Mathematics | 101 (93.5%) | 7 (6.5%) |
| Architecture & Engineering | 154 (74.4%) | 53 (25.6%) |
| Life, Physical & Social Science | 221 (57.1%) | 166 (42.9%) |
| Community & Social Service | 597 (46.6%) | 684 (53.4%) |
| Education, Arts & Media | 34 (17.0%) | 166 (83.0%) |
| Legal Services & Support | 31 (59.6%) | 21 (40.4%) |
| Education Instruction & Library | 357 (46.7%) | 408 (53.3%) |
| Arts, Media & Entertainment | 175 (66.3%) | 89 (33.7%) |
| Health Diagnosing & Treating | 128 (21.6%) | 464 (78.4%) |
| Health Technologists | 103 (29.9%) | 242 (70.1%) |
| Total (Category) | 1,652 (46.4%) | 1,911 (53.6%) |
| Total (Overall) | 5,169 (54.2%) | 4,375 (45.8%) |
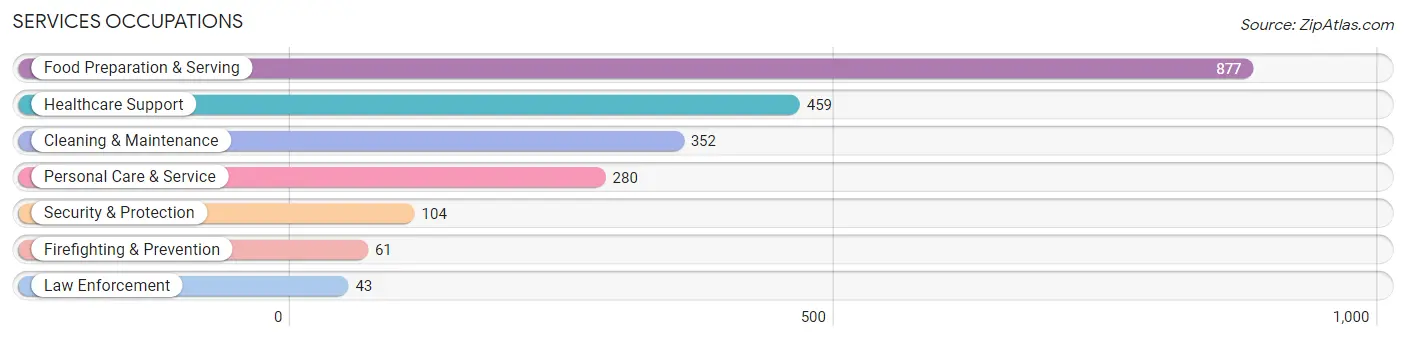
Services Occupations
The most common Services occupations in Arcata are Food Preparation & Serving (877 | 9.2%), Healthcare Support (459 | 4.8%), Cleaning & Maintenance (352 | 3.7%), Personal Care & Service (280 | 2.9%), and Security & Protection (104 | 1.1%).
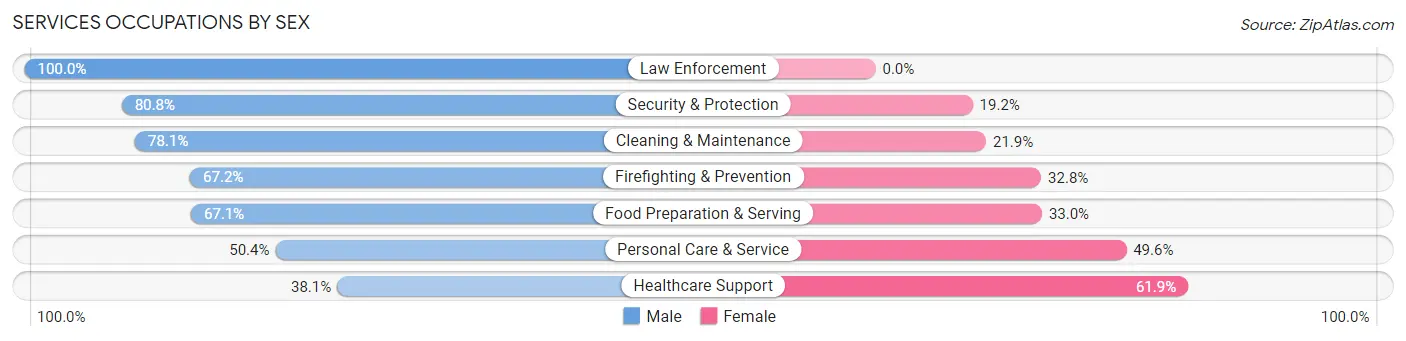
Services Occupations by Sex
Within the Services occupations in Arcata, the most male-oriented occupations are Law Enforcement (100.0%), Security & Protection (80.8%), and Cleaning & Maintenance (78.1%), while the most female-oriented occupations are Healthcare Support (61.9%), Personal Care & Service (49.6%), and Food Preparation & Serving (33.0%).
| Occupation | Male | Female |
| Healthcare Support | 175 (38.1%) | 284 (61.9%) |
| Security & Protection | 84 (80.8%) | 20 (19.2%) |
| Firefighting & Prevention | 41 (67.2%) | 20 (32.8%) |
| Law Enforcement | 43 (100.0%) | 0 (0.0%) |
| Food Preparation & Serving | 588 (67.0%) | 289 (33.0%) |
| Cleaning & Maintenance | 275 (78.1%) | 77 (21.9%) |
| Personal Care & Service | 141 (50.4%) | 139 (49.6%) |
| Total (Category) | 1,263 (61.0%) | 809 (39.0%) |
| Total (Overall) | 5,169 (54.2%) | 4,375 (45.8%) |
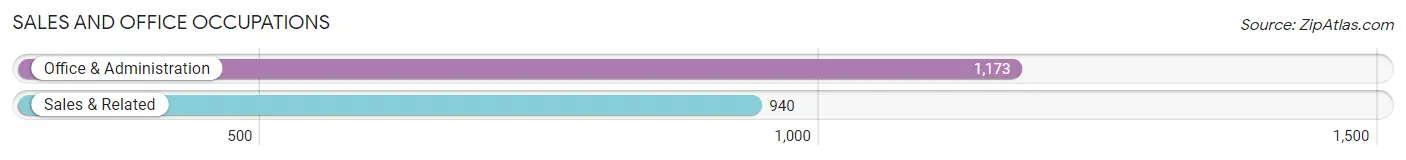
Sales and Office Occupations
The most common Sales and Office occupations in Arcata are Office & Administration (1,173 | 12.3%), and Sales & Related (940 | 9.9%).
Sales and Office Occupations by Sex
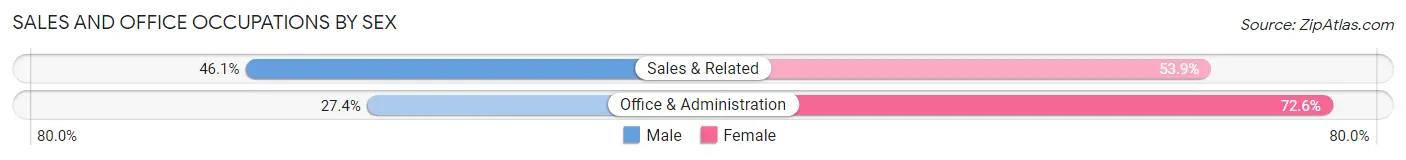
| Occupation | Male | Female |
| Sales & Related | 433 (46.1%) | 507 (53.9%) |
| Office & Administration | 321 (27.4%) | 852 (72.6%) |
| Total (Category) | 754 (35.7%) | 1,359 (64.3%) |
| Total (Overall) | 5,169 (54.2%) | 4,375 (45.8%) |
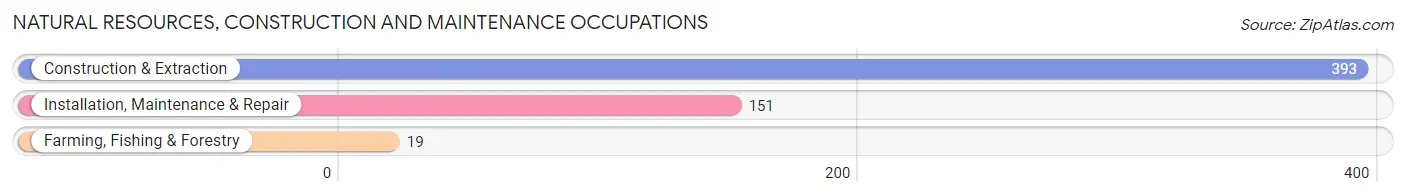
Natural Resources, Construction and Maintenance Occupations
The most common Natural Resources, Construction and Maintenance occupations in Arcata are Construction & Extraction (393 | 4.1%), Installation, Maintenance & Repair (151 | 1.6%), and Farming, Fishing & Forestry (19 | 0.2%).
Natural Resources, Construction and Maintenance Occupations by Sex
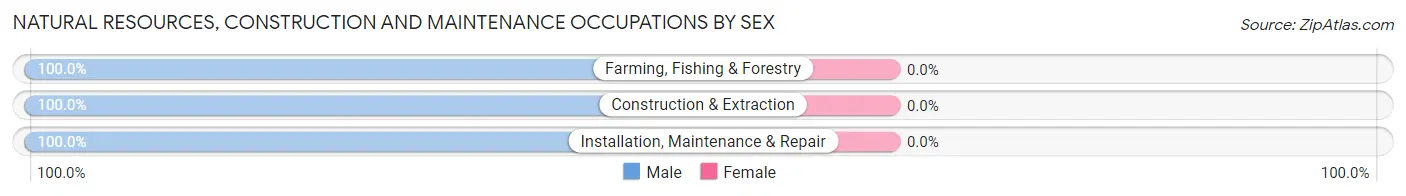
| Occupation | Male | Female |
| Farming, Fishing & Forestry | 19 (100.0%) | 0 (0.0%) |
| Construction & Extraction | 393 (100.0%) | 0 (0.0%) |
| Installation, Maintenance & Repair | 151 (100.0%) | 0 (0.0%) |
| Total (Category) | 563 (100.0%) | 0 (0.0%) |
| Total (Overall) | 5,169 (54.2%) | 4,375 (45.8%) |
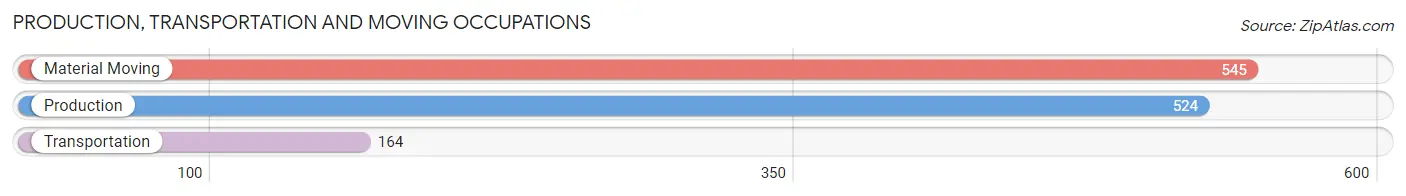
Production, Transportation and Moving Occupations
The most common Production, Transportation and Moving occupations in Arcata are Material Moving (545 | 5.7%), Production (524 | 5.5%), and Transportation (164 | 1.7%).
Production, Transportation and Moving Occupations by Sex
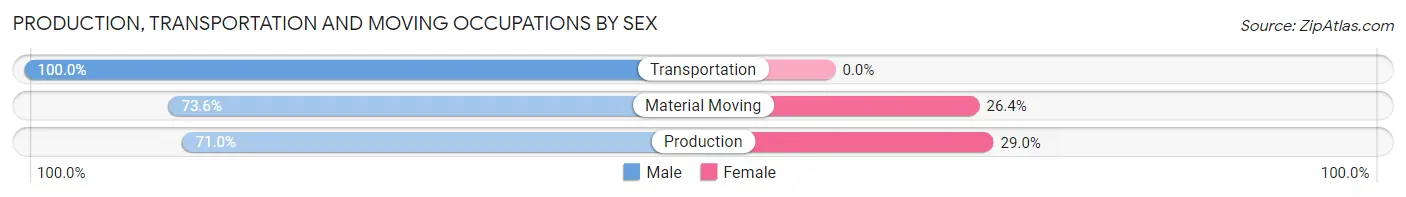
| Occupation | Male | Female |
| Production | 372 (71.0%) | 152 (29.0%) |
| Transportation | 164 (100.0%) | 0 (0.0%) |
| Material Moving | 401 (73.6%) | 144 (26.4%) |
| Total (Category) | 937 (76.0%) | 296 (24.0%) |
| Total (Overall) | 5,169 (54.2%) | 4,375 (45.8%) |
Employment Industries by Sex in Arcata
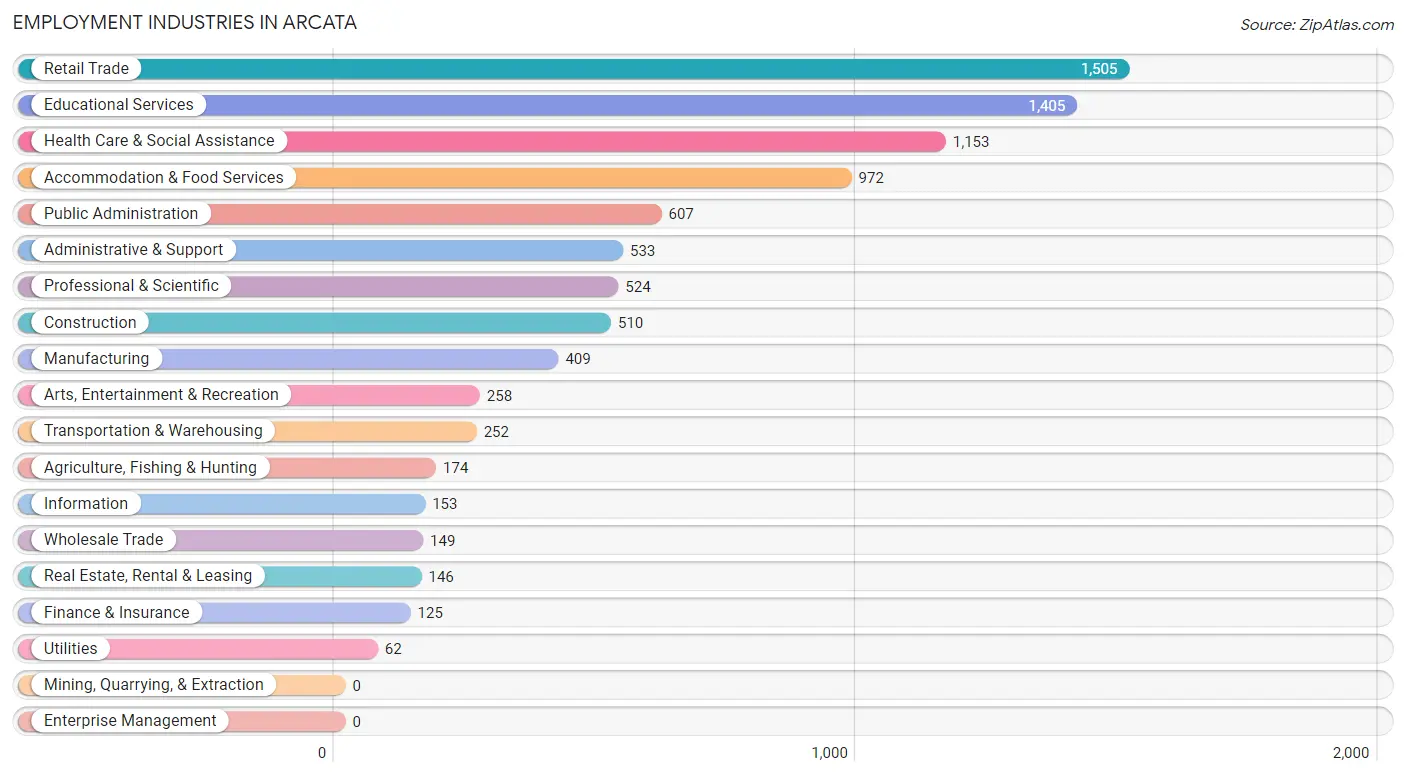
Employment Industries in Arcata
The major employment industries in Arcata include Retail Trade (1,505 | 15.8%), Educational Services (1,405 | 14.7%), Health Care & Social Assistance (1,153 | 12.1%), Accommodation & Food Services (972 | 10.2%), and Public Administration (607 | 6.4%).
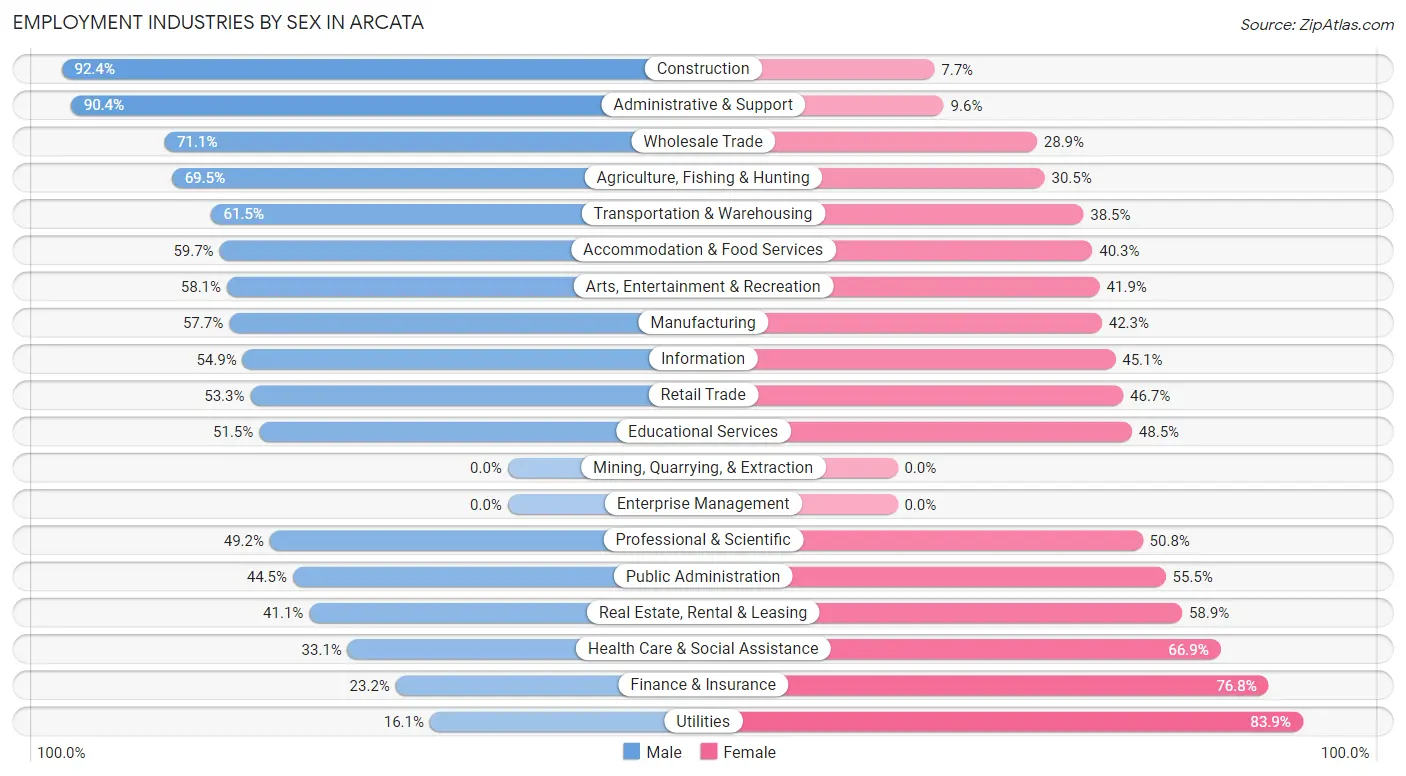
Employment Industries by Sex in Arcata
The Arcata industries that see more men than women are Construction (92.3%), Administrative & Support (90.4%), and Wholesale Trade (71.1%), whereas the industries that tend to have a higher number of women are Utilities (83.9%), Finance & Insurance (76.8%), and Health Care & Social Assistance (66.9%).
| Industry | Male | Female |
| Agriculture, Fishing & Hunting | 121 (69.5%) | 53 (30.5%) |
| Mining, Quarrying, & Extraction | 0 (0.0%) | 0 (0.0%) |
| Construction | 471 (92.3%) | 39 (7.6%) |
| Manufacturing | 236 (57.7%) | 173 (42.3%) |
| Wholesale Trade | 106 (71.1%) | 43 (28.9%) |
| Retail Trade | 802 (53.3%) | 703 (46.7%) |
| Transportation & Warehousing | 155 (61.5%) | 97 (38.5%) |
| Utilities | 10 (16.1%) | 52 (83.9%) |
| Information | 84 (54.9%) | 69 (45.1%) |
| Finance & Insurance | 29 (23.2%) | 96 (76.8%) |
| Real Estate, Rental & Leasing | 60 (41.1%) | 86 (58.9%) |
| Professional & Scientific | 258 (49.2%) | 266 (50.8%) |
| Enterprise Management | 0 (0.0%) | 0 (0.0%) |
| Administrative & Support | 482 (90.4%) | 51 (9.6%) |
| Educational Services | 723 (51.5%) | 682 (48.5%) |
| Health Care & Social Assistance | 382 (33.1%) | 771 (66.9%) |
| Arts, Entertainment & Recreation | 150 (58.1%) | 108 (41.9%) |
| Accommodation & Food Services | 580 (59.7%) | 392 (40.3%) |
| Public Administration | 270 (44.5%) | 337 (55.5%) |
| Total | 5,169 (54.2%) | 4,375 (45.8%) |
Education in Arcata
School Enrollment in Arcata
The most common levels of schooling among the 7,863 students in Arcata are college / undergraduate (5,496 | 69.9%), middle school (708 | 9.0%), and high school (663 | 8.4%).
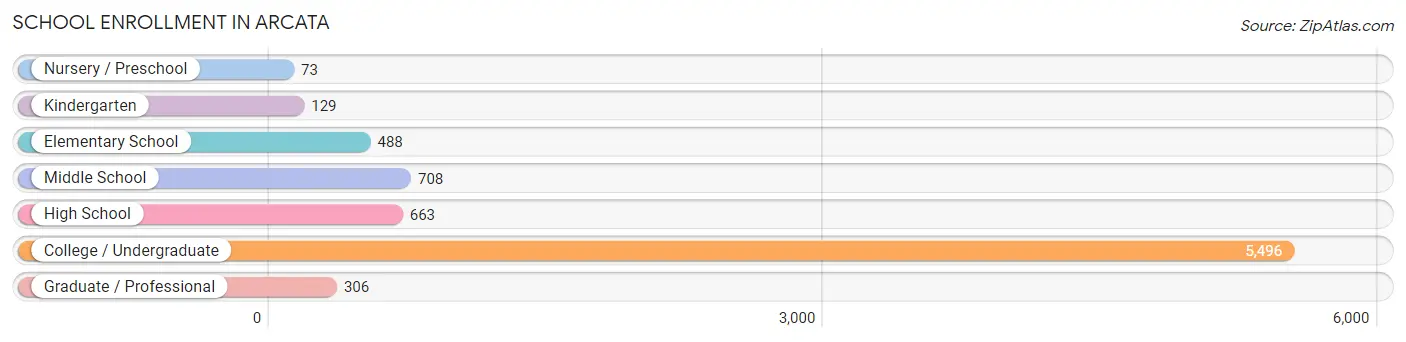
| School Level | # Students | % Students |
| Nursery / Preschool | 73 | 0.9% |
| Kindergarten | 129 | 1.6% |
| Elementary School | 488 | 6.2% |
| Middle School | 708 | 9.0% |
| High School | 663 | 8.4% |
| College / Undergraduate | 5,496 | 69.9% |
| Graduate / Professional | 306 | 3.9% |
| Total | 7,863 | 100.0% |
School Enrollment by Age by Funding Source in Arcata
Out of a total of 7,863 students who are enrolled in schools in Arcata, 220 (2.8%) attend a private institution, while the remaining 7,643 (97.2%) are enrolled in public schools. The age group of 3 to 4 year olds has the highest likelihood of being enrolled in private schools, with 48 (41.4% in the age bracket) enrolled. Conversely, the age group of 15 to 17 year olds has the lowest likelihood of being enrolled in a private school, with 497 (100.0% in the age bracket) attending a public institution.
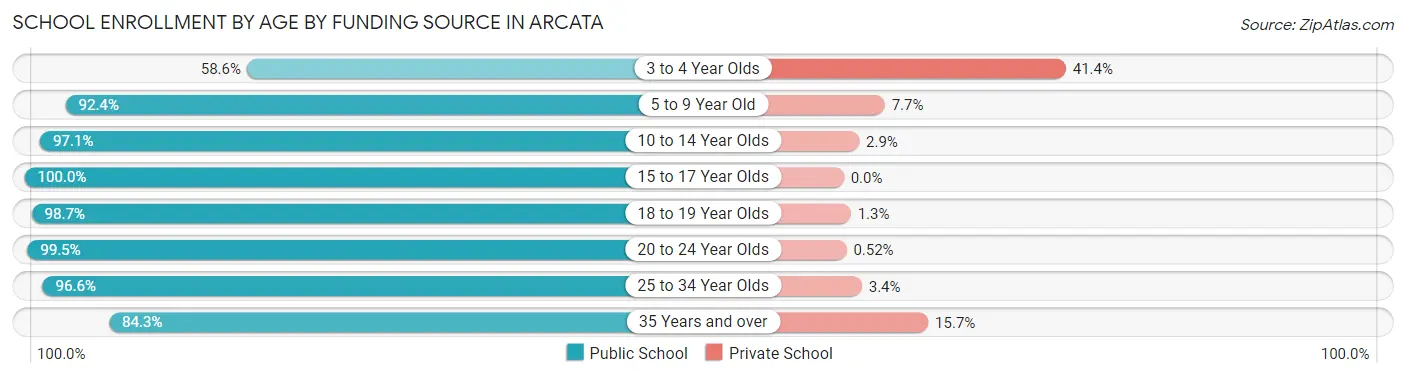
| Age Bracket | Public School | Private School |
| 3 to 4 Year Olds | 68 (58.6%) | 48 (41.4%) |
| 5 to 9 Year Old | 471 (92.3%) | 39 (7.6%) |
| 10 to 14 Year Olds | 811 (97.1%) | 24 (2.9%) |
| 15 to 17 Year Olds | 497 (100.0%) | 0 (0.0%) |
| 18 to 19 Year Olds | 1,345 (98.7%) | 18 (1.3%) |
| 20 to 24 Year Olds | 3,222 (99.5%) | 17 (0.5%) |
| 25 to 34 Year Olds | 1,032 (96.6%) | 36 (3.4%) |
| 35 Years and over | 198 (84.3%) | 37 (15.7%) |
| Total | 7,643 (97.2%) | 220 (2.8%) |
Educational Attainment by Field of Study in Arcata
Bio, nature & agricultural (887 | 18.0%), social sciences (532 | 10.8%), visual & performing arts (516 | 10.5%), liberal arts & history (389 | 7.9%), and engineering (381 | 7.7%) are the most common fields of study among 4,914 individuals in Arcata who have obtained a bachelor's degree or higher.
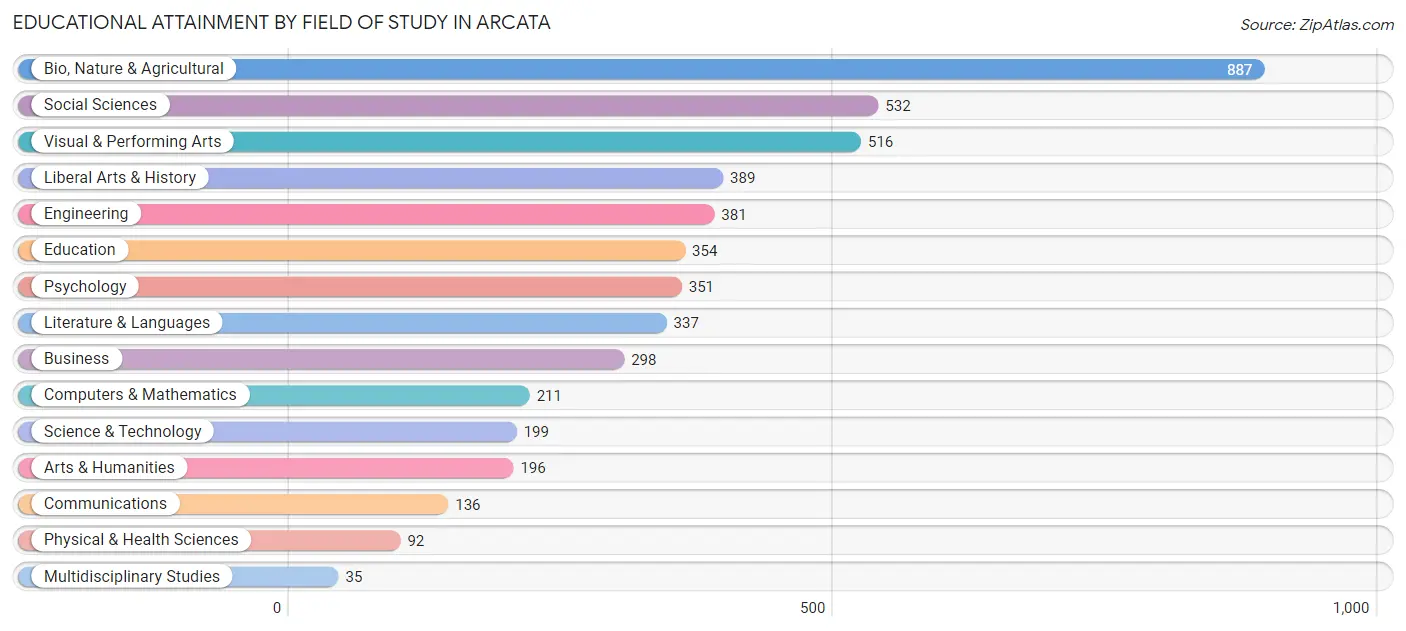
| Field of Study | # Graduates | % Graduates |
| Computers & Mathematics | 211 | 4.3% |
| Bio, Nature & Agricultural | 887 | 18.0% |
| Physical & Health Sciences | 92 | 1.9% |
| Psychology | 351 | 7.1% |
| Social Sciences | 532 | 10.8% |
| Engineering | 381 | 7.7% |
| Multidisciplinary Studies | 35 | 0.7% |
| Science & Technology | 199 | 4.1% |
| Business | 298 | 6.1% |
| Education | 354 | 7.2% |
| Literature & Languages | 337 | 6.9% |
| Liberal Arts & History | 389 | 7.9% |
| Visual & Performing Arts | 516 | 10.5% |
| Communications | 136 | 2.8% |
| Arts & Humanities | 196 | 4.0% |
| Total | 4,914 | 100.0% |
Transportation & Commute in Arcata
Vehicle Availability by Sex in Arcata
The most prevalent vehicle ownership categories in Arcata are males with 2 vehicles (1,841, accounting for 38.7%) and females with 2 vehicles (1,481, making up 47.0%).
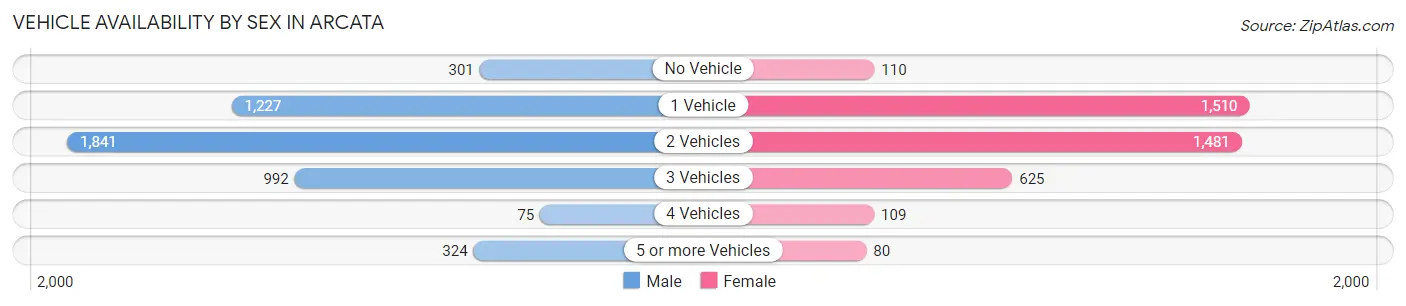
| Vehicles Available | Male | Female |
| No Vehicle | 301 (6.3%) | 110 (2.8%) |
| 1 Vehicle | 1,227 (25.8%) | 1,510 (38.6%) |
| 2 Vehicles | 1,841 (38.7%) | 1,481 (37.8%) |
| 3 Vehicles | 992 (20.8%) | 625 (16.0%) |
| 4 Vehicles | 75 (1.6%) | 109 (2.8%) |
| 5 or more Vehicles | 324 (6.8%) | 80 (2.0%) |
| Total | 4,760 (100.0%) | 3,915 (100.0%) |
Commute Time in Arcata
The most frequently occuring commute durations in Arcata are 15 to 19 minutes (1,787 commuters, 22.8%), 5 to 9 minutes (1,774 commuters, 22.6%), and 10 to 14 minutes (1,533 commuters, 19.5%).
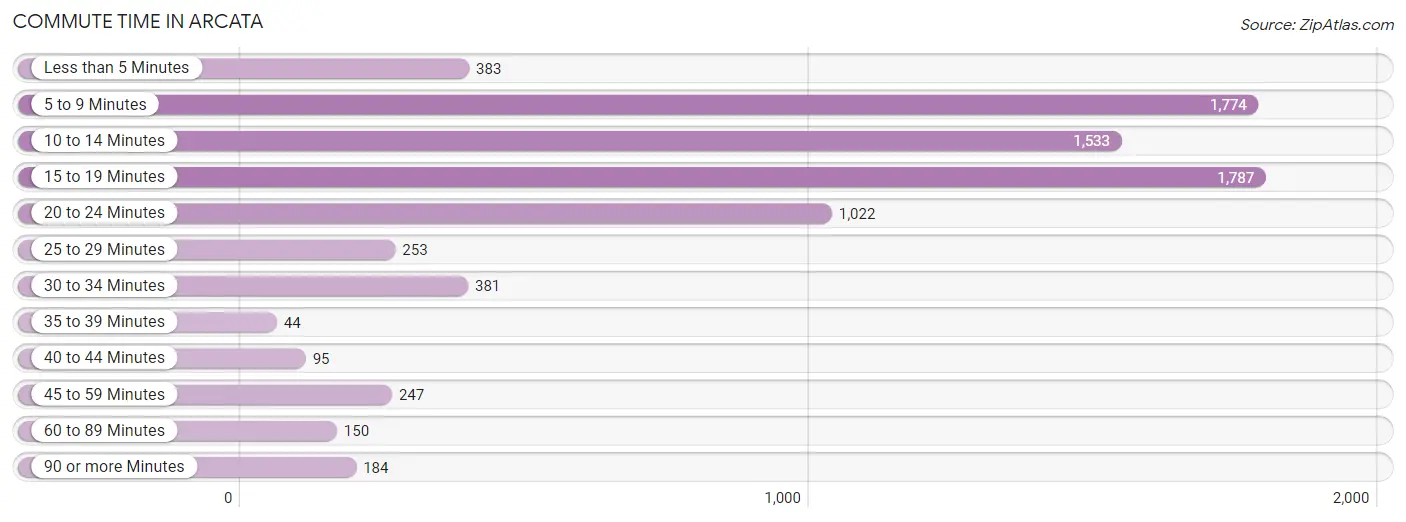
| Commute Time | # Commuters | % Commuters |
| Less than 5 Minutes | 383 | 4.9% |
| 5 to 9 Minutes | 1,774 | 22.6% |
| 10 to 14 Minutes | 1,533 | 19.5% |
| 15 to 19 Minutes | 1,787 | 22.8% |
| 20 to 24 Minutes | 1,022 | 13.0% |
| 25 to 29 Minutes | 253 | 3.2% |
| 30 to 34 Minutes | 381 | 4.9% |
| 35 to 39 Minutes | 44 | 0.6% |
| 40 to 44 Minutes | 95 | 1.2% |
| 45 to 59 Minutes | 247 | 3.2% |
| 60 to 89 Minutes | 150 | 1.9% |
| 90 or more Minutes | 184 | 2.3% |
Commute Time by Sex in Arcata
The most common commute times in Arcata are 10 to 14 minutes (1,172 commuters, 27.7%) for males and 5 to 9 minutes (1,044 commuters, 28.8%) for females.
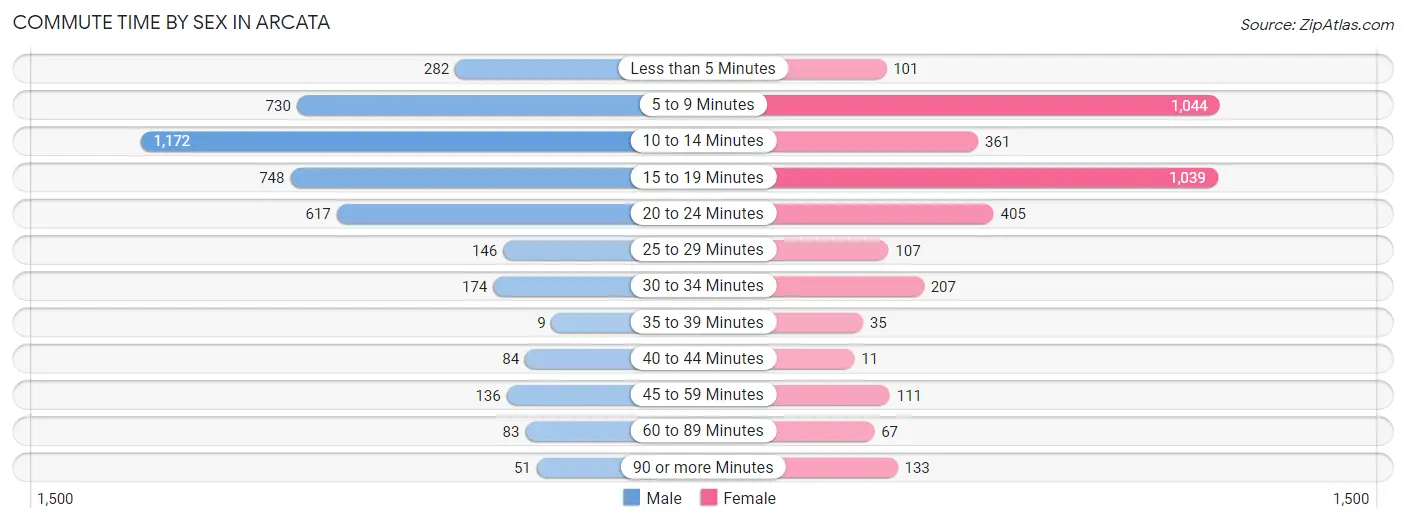
| Commute Time | Male | Female |
| Less than 5 Minutes | 282 (6.7%) | 101 (2.8%) |
| 5 to 9 Minutes | 730 (17.2%) | 1,044 (28.8%) |
| 10 to 14 Minutes | 1,172 (27.7%) | 361 (10.0%) |
| 15 to 19 Minutes | 748 (17.7%) | 1,039 (28.7%) |
| 20 to 24 Minutes | 617 (14.6%) | 405 (11.2%) |
| 25 to 29 Minutes | 146 (3.5%) | 107 (2.9%) |
| 30 to 34 Minutes | 174 (4.1%) | 207 (5.7%) |
| 35 to 39 Minutes | 9 (0.2%) | 35 (1.0%) |
| 40 to 44 Minutes | 84 (2.0%) | 11 (0.3%) |
| 45 to 59 Minutes | 136 (3.2%) | 111 (3.1%) |
| 60 to 89 Minutes | 83 (2.0%) | 67 (1.8%) |
| 90 or more Minutes | 51 (1.2%) | 133 (3.7%) |
Time of Departure to Work by Sex in Arcata
The most frequent times of departure to work in Arcata are 9:00 AM to 9:59 AM (707, 16.7%) for males and 7:30 AM to 7:59 AM (683, 18.9%) for females.
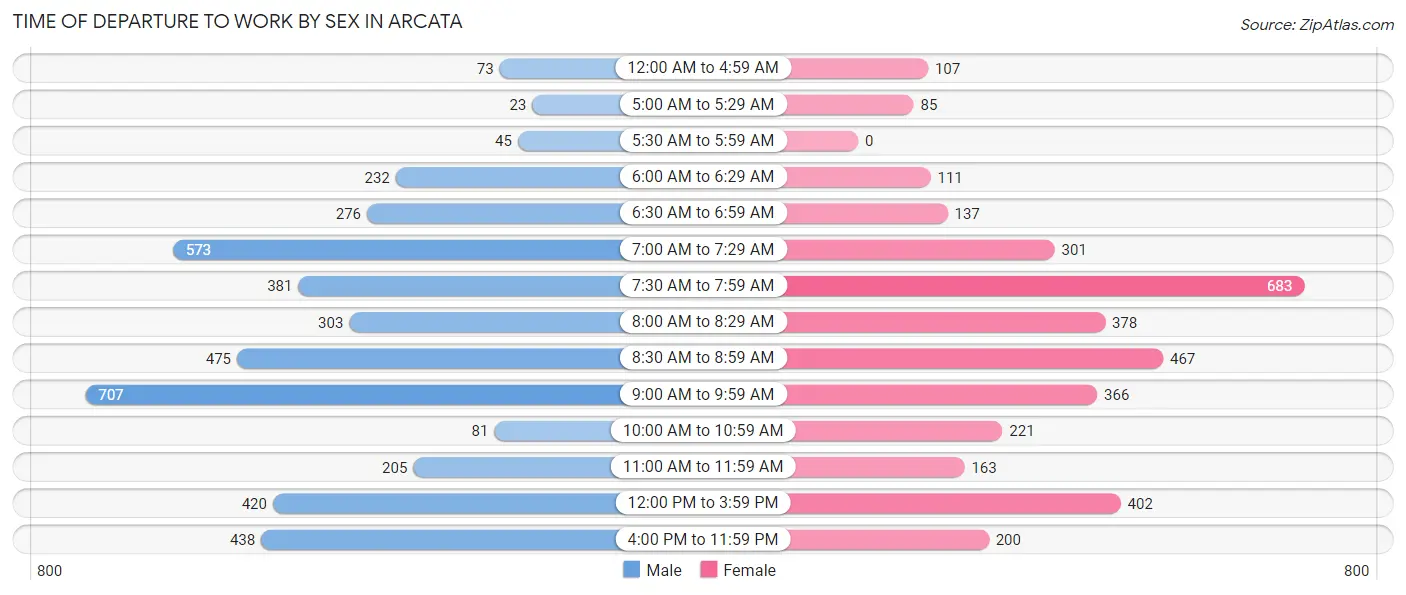
| Time of Departure | Male | Female |
| 12:00 AM to 4:59 AM | 73 (1.7%) | 107 (2.9%) |
| 5:00 AM to 5:29 AM | 23 (0.5%) | 85 (2.4%) |
| 5:30 AM to 5:59 AM | 45 (1.1%) | 0 (0.0%) |
| 6:00 AM to 6:29 AM | 232 (5.5%) | 111 (3.1%) |
| 6:30 AM to 6:59 AM | 276 (6.5%) | 137 (3.8%) |
| 7:00 AM to 7:29 AM | 573 (13.5%) | 301 (8.3%) |
| 7:30 AM to 7:59 AM | 381 (9.0%) | 683 (18.9%) |
| 8:00 AM to 8:29 AM | 303 (7.2%) | 378 (10.4%) |
| 8:30 AM to 8:59 AM | 475 (11.2%) | 467 (12.9%) |
| 9:00 AM to 9:59 AM | 707 (16.7%) | 366 (10.1%) |
| 10:00 AM to 10:59 AM | 81 (1.9%) | 221 (6.1%) |
| 11:00 AM to 11:59 AM | 205 (4.8%) | 163 (4.5%) |
| 12:00 PM to 3:59 PM | 420 (9.9%) | 402 (11.1%) |
| 4:00 PM to 11:59 PM | 438 (10.3%) | 200 (5.5%) |
| Total | 4,232 (100.0%) | 3,621 (100.0%) |
Housing Occupancy in Arcata
Occupancy by Ownership in Arcata
Of the total 7,496 dwellings in Arcata, owner-occupied units account for 2,489 (33.2%), while renter-occupied units make up 5,007 (66.8%).
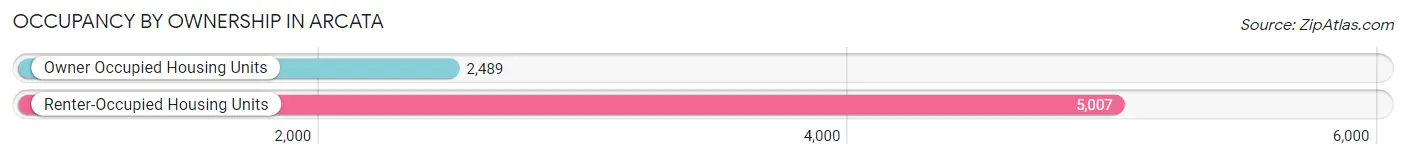
| Occupancy | # Housing Units | % Housing Units |
| Owner Occupied Housing Units | 2,489 | 33.2% |
| Renter-Occupied Housing Units | 5,007 | 66.8% |
| Total Occupied Housing Units | 7,496 | 100.0% |
Occupancy by Household Size in Arcata
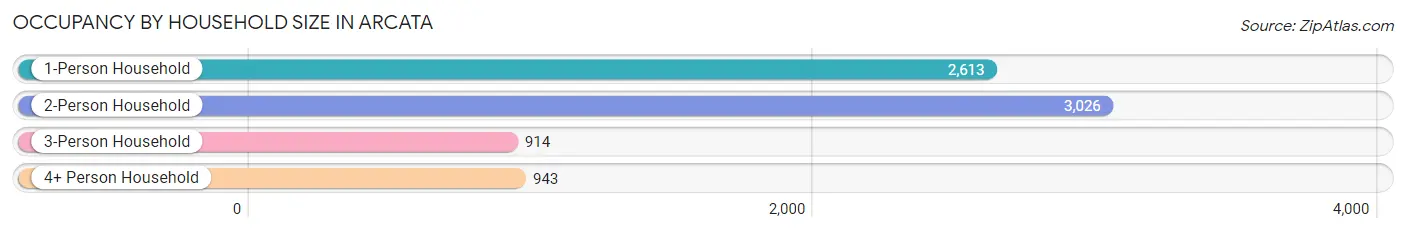
| Household Size | # Housing Units | % Housing Units |
| 1-Person Household | 2,613 | 34.9% |
| 2-Person Household | 3,026 | 40.4% |
| 3-Person Household | 914 | 12.2% |
| 4+ Person Household | 943 | 12.6% |
| Total Housing Units | 7,496 | 100.0% |
Occupancy by Ownership by Household Size in Arcata
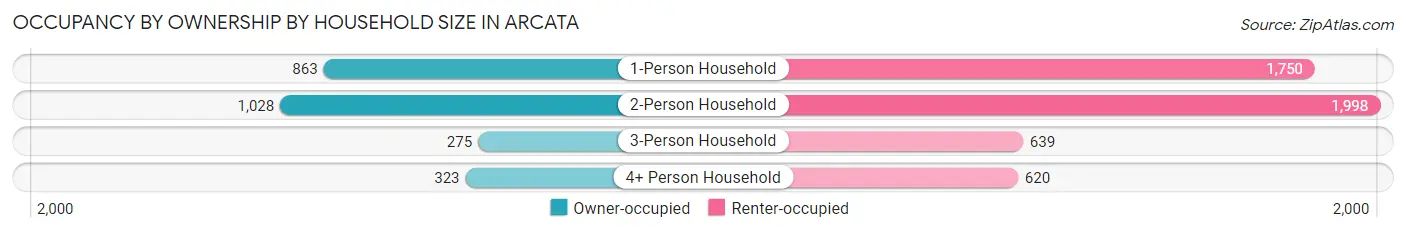
| Household Size | Owner-occupied | Renter-occupied |
| 1-Person Household | 863 (33.0%) | 1,750 (67.0%) |
| 2-Person Household | 1,028 (34.0%) | 1,998 (66.0%) |
| 3-Person Household | 275 (30.1%) | 639 (69.9%) |
| 4+ Person Household | 323 (34.3%) | 620 (65.7%) |
| Total Housing Units | 2,489 (33.2%) | 5,007 (66.8%) |
Occupancy by Educational Attainment in Arcata
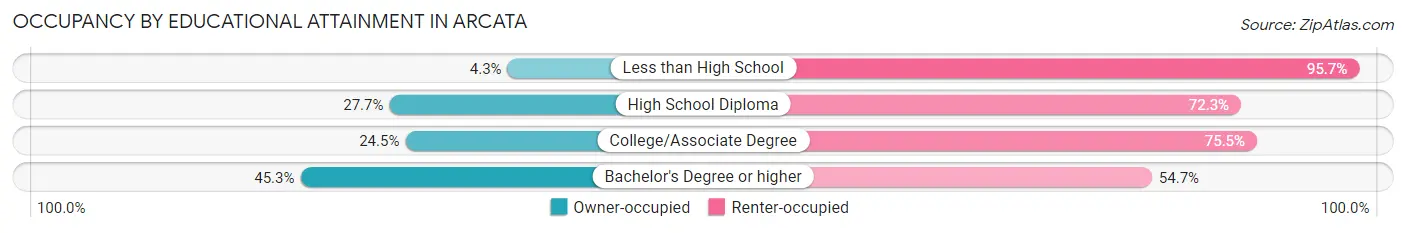
| Household Size | Owner-occupied | Renter-occupied |
| Less than High School | 12 (4.3%) | 269 (95.7%) |
| High School Diploma | 206 (27.7%) | 538 (72.3%) |
| College/Associate Degree | 781 (24.5%) | 2,403 (75.5%) |
| Bachelor's Degree or higher | 1,490 (45.3%) | 1,797 (54.7%) |
Occupancy by Age of Householder in Arcata
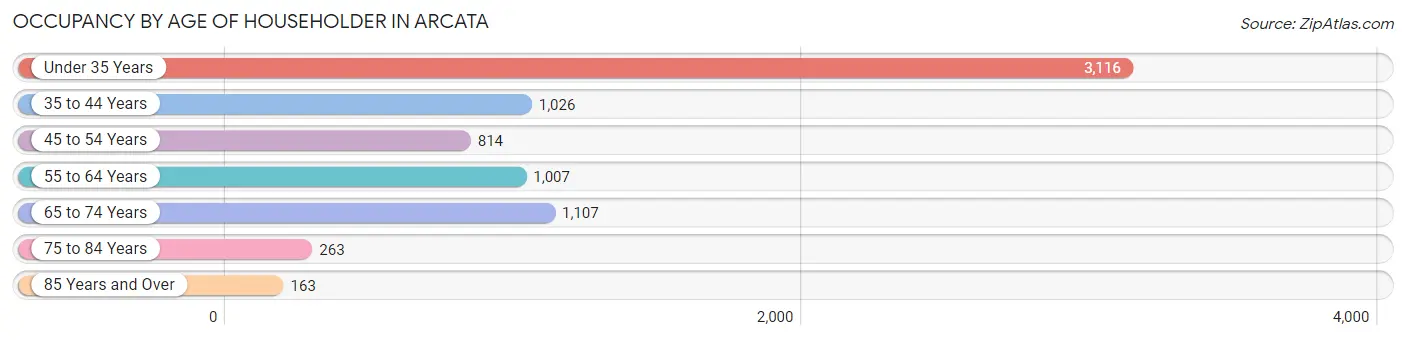
| Age Bracket | # Households | % Households |
| Under 35 Years | 3,116 | 41.6% |
| 35 to 44 Years | 1,026 | 13.7% |
| 45 to 54 Years | 814 | 10.9% |
| 55 to 64 Years | 1,007 | 13.4% |
| 65 to 74 Years | 1,107 | 14.8% |
| 75 to 84 Years | 263 | 3.5% |
| 85 Years and Over | 163 | 2.2% |
| Total | 7,496 | 100.0% |
Housing Finances in Arcata
Median Income by Occupancy in Arcata
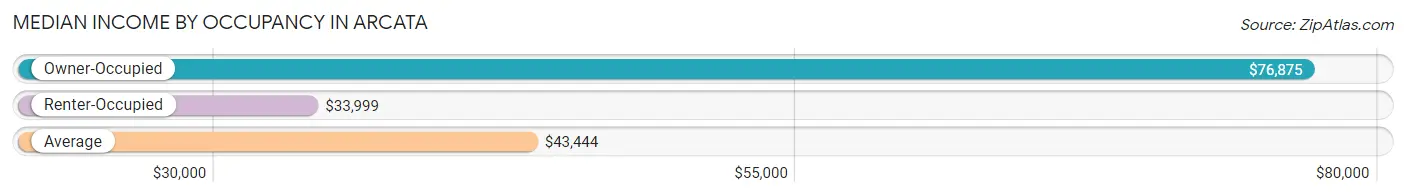
| Occupancy Type | # Households | Median Income |
| Owner-Occupied | 2,489 (33.2%) | $76,875 |
| Renter-Occupied | 5,007 (66.8%) | $33,999 |
| Average | 7,496 (100.0%) | $43,444 |
Occupancy by Householder Income Bracket in Arcata
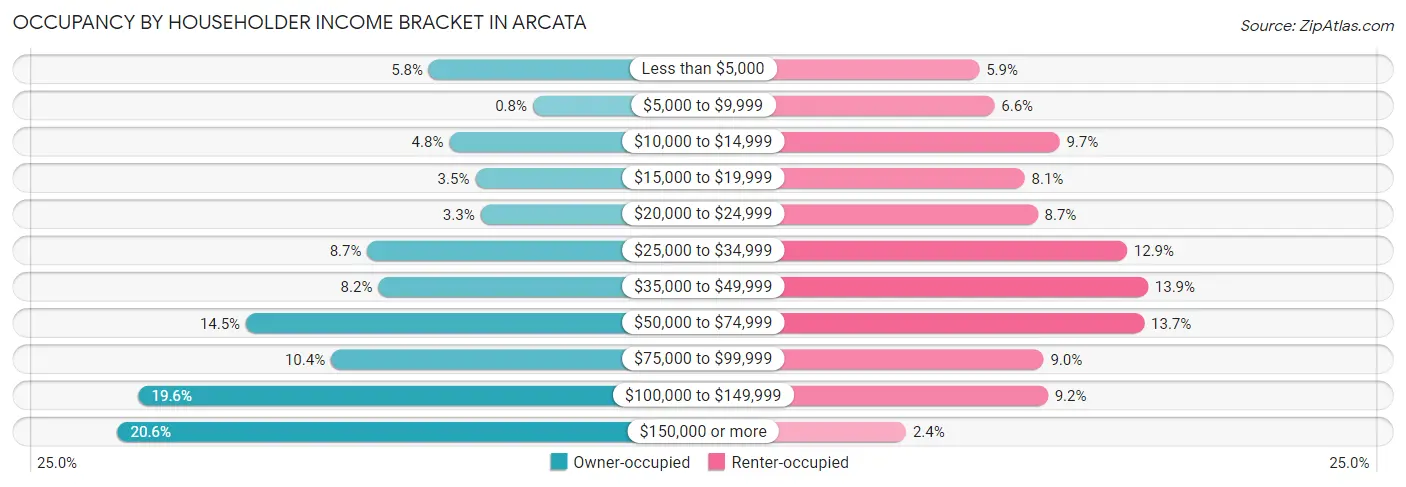
| Income Bracket | Owner-occupied | Renter-occupied |
| Less than $5,000 | 143 (5.8%) | 295 (5.9%) |
| $5,000 to $9,999 | 20 (0.8%) | 331 (6.6%) |
| $10,000 to $14,999 | 119 (4.8%) | 486 (9.7%) |
| $15,000 to $19,999 | 88 (3.5%) | 403 (8.1%) |
| $20,000 to $24,999 | 82 (3.3%) | 434 (8.7%) |
| $25,000 to $34,999 | 216 (8.7%) | 647 (12.9%) |
| $35,000 to $49,999 | 203 (8.2%) | 697 (13.9%) |
| $50,000 to $74,999 | 360 (14.5%) | 688 (13.7%) |
| $75,000 to $99,999 | 259 (10.4%) | 448 (8.9%) |
| $100,000 to $149,999 | 487 (19.6%) | 458 (9.1%) |
| $150,000 or more | 512 (20.6%) | 120 (2.4%) |
| Total | 2,489 (100.0%) | 5,007 (100.0%) |
Monthly Housing Cost Tiers in Arcata
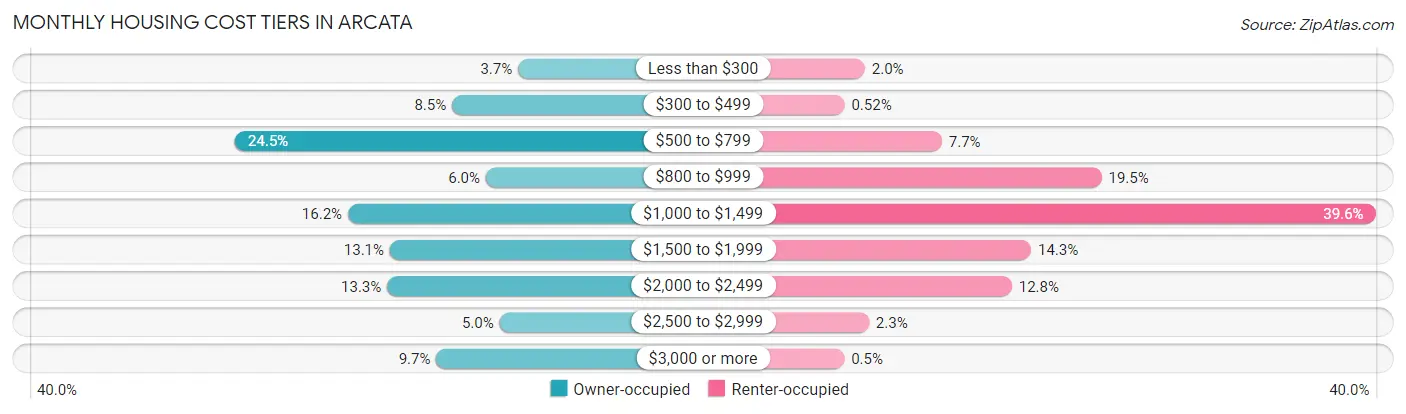
| Monthly Cost | Owner-occupied | Renter-occupied |
| Less than $300 | 91 (3.7%) | 101 (2.0%) |
| $300 to $499 | 212 (8.5%) | 26 (0.5%) |
| $500 to $799 | 610 (24.5%) | 385 (7.7%) |
| $800 to $999 | 150 (6.0%) | 974 (19.5%) |
| $1,000 to $1,499 | 403 (16.2%) | 1,984 (39.6%) |
| $1,500 to $1,999 | 326 (13.1%) | 714 (14.3%) |
| $2,000 to $2,499 | 331 (13.3%) | 643 (12.8%) |
| $2,500 to $2,999 | 125 (5.0%) | 116 (2.3%) |
| $3,000 or more | 241 (9.7%) | 25 (0.5%) |
| Total | 2,489 (100.0%) | 5,007 (100.0%) |
Physical Housing Characteristics in Arcata
Housing Structures in Arcata
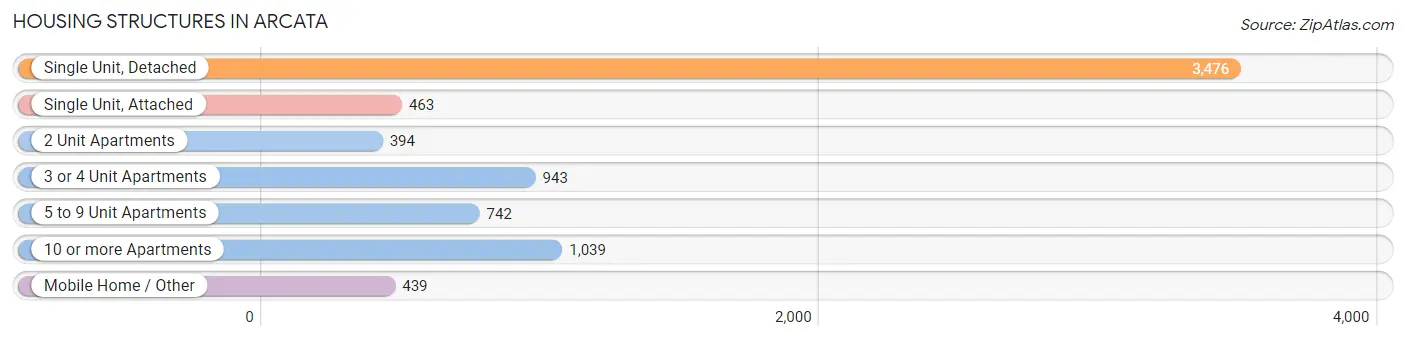
| Structure Type | # Housing Units | % Housing Units |
| Single Unit, Detached | 3,476 | 46.4% |
| Single Unit, Attached | 463 | 6.2% |
| 2 Unit Apartments | 394 | 5.3% |
| 3 or 4 Unit Apartments | 943 | 12.6% |
| 5 to 9 Unit Apartments | 742 | 9.9% |
| 10 or more Apartments | 1,039 | 13.9% |
| Mobile Home / Other | 439 | 5.9% |
| Total | 7,496 | 100.0% |
Housing Structures by Occupancy in Arcata
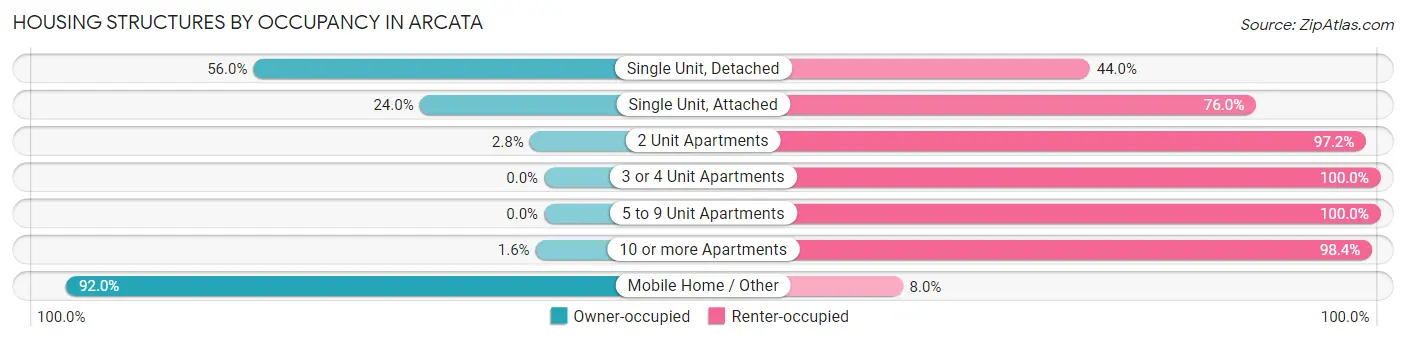
| Structure Type | Owner-occupied | Renter-occupied |
| Single Unit, Detached | 1,946 (56.0%) | 1,530 (44.0%) |
| Single Unit, Attached | 111 (24.0%) | 352 (76.0%) |
| 2 Unit Apartments | 11 (2.8%) | 383 (97.2%) |
| 3 or 4 Unit Apartments | 0 (0.0%) | 943 (100.0%) |
| 5 to 9 Unit Apartments | 0 (0.0%) | 742 (100.0%) |
| 10 or more Apartments | 17 (1.6%) | 1,022 (98.4%) |
| Mobile Home / Other | 404 (92.0%) | 35 (8.0%) |
| Total | 2,489 (33.2%) | 5,007 (66.8%) |
Housing Structures by Number of Rooms in Arcata
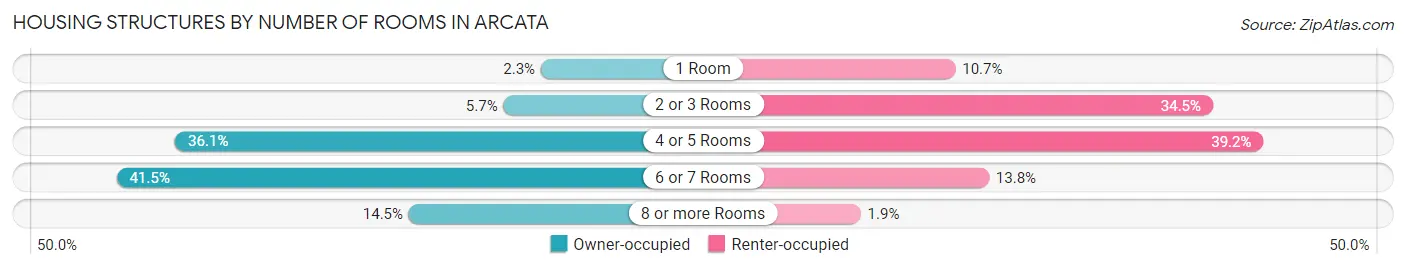
| Number of Rooms | Owner-occupied | Renter-occupied |
| 1 Room | 56 (2.2%) | 534 (10.7%) |
| 2 or 3 Rooms | 142 (5.7%) | 1,727 (34.5%) |
| 4 or 5 Rooms | 898 (36.1%) | 1,960 (39.2%) |
| 6 or 7 Rooms | 1,033 (41.5%) | 690 (13.8%) |
| 8 or more Rooms | 360 (14.5%) | 96 (1.9%) |
| Total | 2,489 (100.0%) | 5,007 (100.0%) |
Housing Structure by Heating Type in Arcata
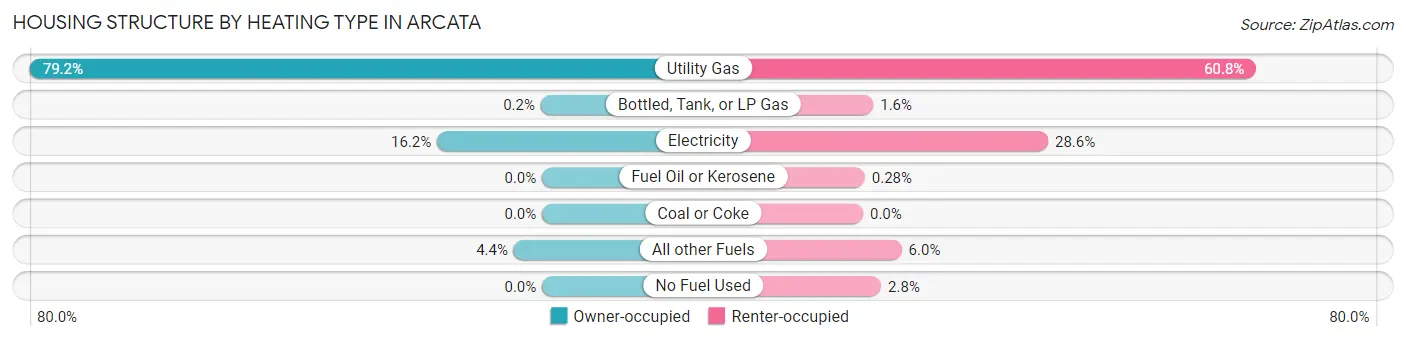
| Heating Type | Owner-occupied | Renter-occupied |
| Utility Gas | 1,971 (79.2%) | 3,043 (60.8%) |
| Bottled, Tank, or LP Gas | 5 (0.2%) | 79 (1.6%) |
| Electricity | 404 (16.2%) | 1,432 (28.6%) |
| Fuel Oil or Kerosene | 0 (0.0%) | 14 (0.3%) |
| Coal or Coke | 0 (0.0%) | 0 (0.0%) |
| All other Fuels | 109 (4.4%) | 299 (6.0%) |
| No Fuel Used | 0 (0.0%) | 140 (2.8%) |
| Total | 2,489 (100.0%) | 5,007 (100.0%) |
Household Vehicle Usage in Arcata
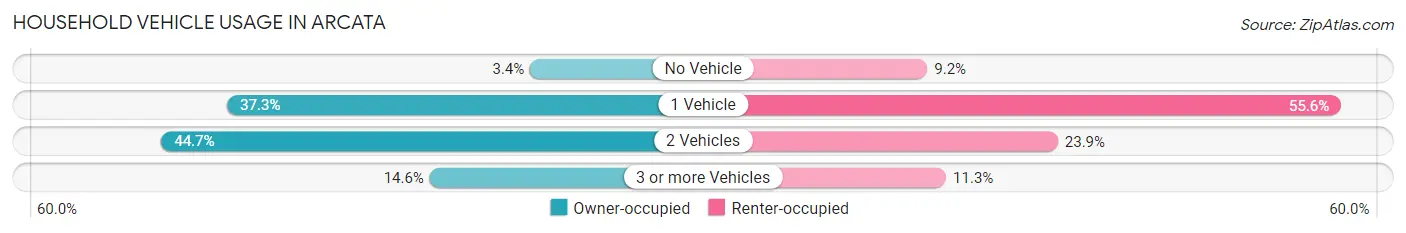
| Vehicles per Household | Owner-occupied | Renter-occupied |
| No Vehicle | 84 (3.4%) | 462 (9.2%) |
| 1 Vehicle | 929 (37.3%) | 2,783 (55.6%) |
| 2 Vehicles | 1,112 (44.7%) | 1,194 (23.8%) |
| 3 or more Vehicles | 364 (14.6%) | 568 (11.3%) |
| Total | 2,489 (100.0%) | 5,007 (100.0%) |
Real Estate & Mortgages in Arcata
Real Estate and Mortgage Overview in Arcata
| Characteristic | Without Mortgage | With Mortgage |
| Housing Units | 1,090 | 1,399 |
| Median Property Value | $316,300 | $456,600 |
| Median Household Income | $48,393 | $416 |
| Monthly Housing Costs | $626 | $210 |
| Real Estate Taxes | $2,105 | $10 |
Property Value by Mortgage Status in Arcata
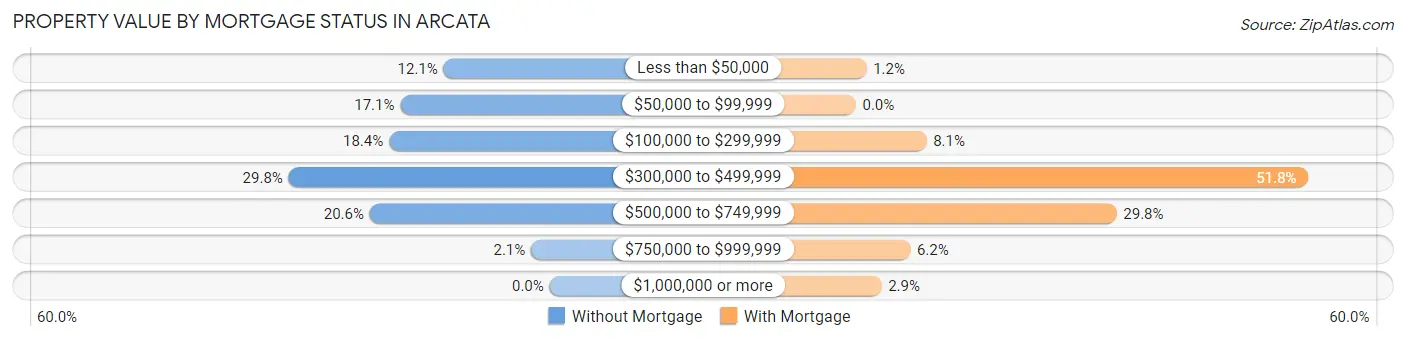
| Property Value | Without Mortgage | With Mortgage |
| Less than $50,000 | 132 (12.1%) | 17 (1.2%) |
| $50,000 to $99,999 | 186 (17.1%) | 0 (0.0%) |
| $100,000 to $299,999 | 200 (18.3%) | 113 (8.1%) |
| $300,000 to $499,999 | 325 (29.8%) | 724 (51.7%) |
| $500,000 to $749,999 | 224 (20.5%) | 417 (29.8%) |
| $750,000 to $999,999 | 23 (2.1%) | 87 (6.2%) |
| $1,000,000 or more | 0 (0.0%) | 41 (2.9%) |
| Total | 1,090 (100.0%) | 1,399 (100.0%) |
Household Income by Mortgage Status in Arcata
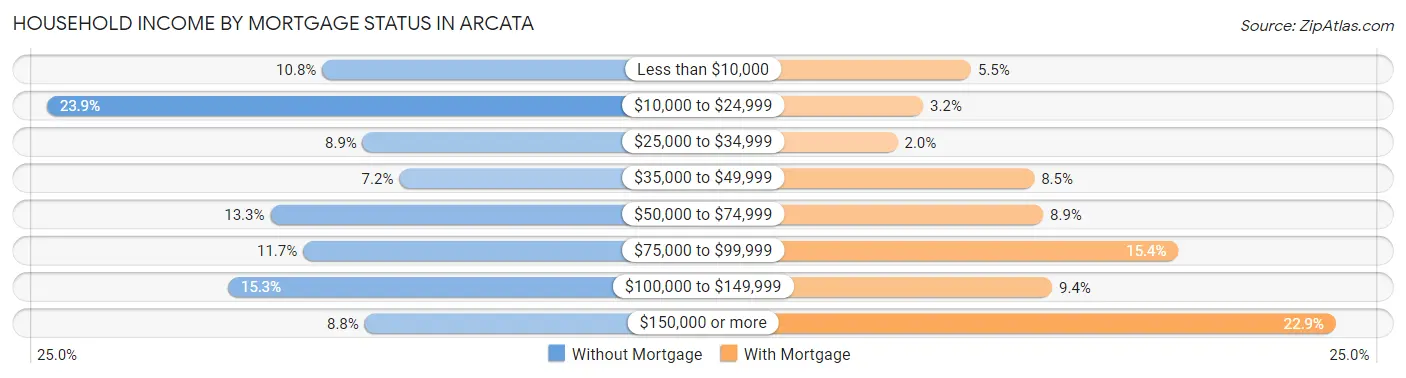
| Household Income | Without Mortgage | With Mortgage |
| Less than $10,000 | 118 (10.8%) | 77 (5.5%) |
| $10,000 to $24,999 | 261 (23.9%) | 45 (3.2%) |
| $25,000 to $34,999 | 97 (8.9%) | 28 (2.0%) |
| $35,000 to $49,999 | 78 (7.2%) | 119 (8.5%) |
| $50,000 to $74,999 | 145 (13.3%) | 125 (8.9%) |
| $75,000 to $99,999 | 128 (11.7%) | 215 (15.4%) |
| $100,000 to $149,999 | 167 (15.3%) | 131 (9.4%) |
| $150,000 or more | 96 (8.8%) | 320 (22.9%) |
| Total | 1,090 (100.0%) | 1,399 (100.0%) |
Property Value to Household Income Ratio in Arcata
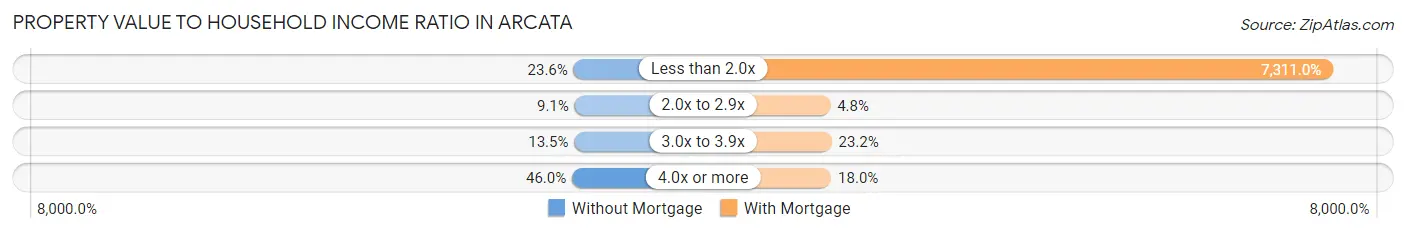
| Value-to-Income Ratio | Without Mortgage | With Mortgage |
| Less than 2.0x | 257 (23.6%) | 102,281 (7,311.0%) |
| 2.0x to 2.9x | 99 (9.1%) | 67 (4.8%) |
| 3.0x to 3.9x | 147 (13.5%) | 324 (23.2%) |
| 4.0x or more | 501 (46.0%) | 252 (18.0%) |
| Total | 1,090 (100.0%) | 1,399 (100.0%) |
Real Estate Taxes by Mortgage Status in Arcata
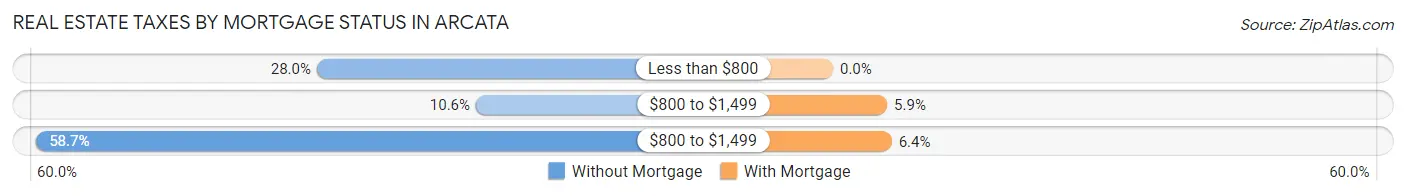
| Property Taxes | Without Mortgage | With Mortgage |
| Less than $800 | 305 (28.0%) | 0 (0.0%) |
| $800 to $1,499 | 115 (10.5%) | 83 (5.9%) |
| $800 to $1,499 | 640 (58.7%) | 90 (6.4%) |
| Total | 1,090 (100.0%) | 1,399 (100.0%) |
Health & Disability in Arcata
Health Insurance Coverage by Age in Arcata
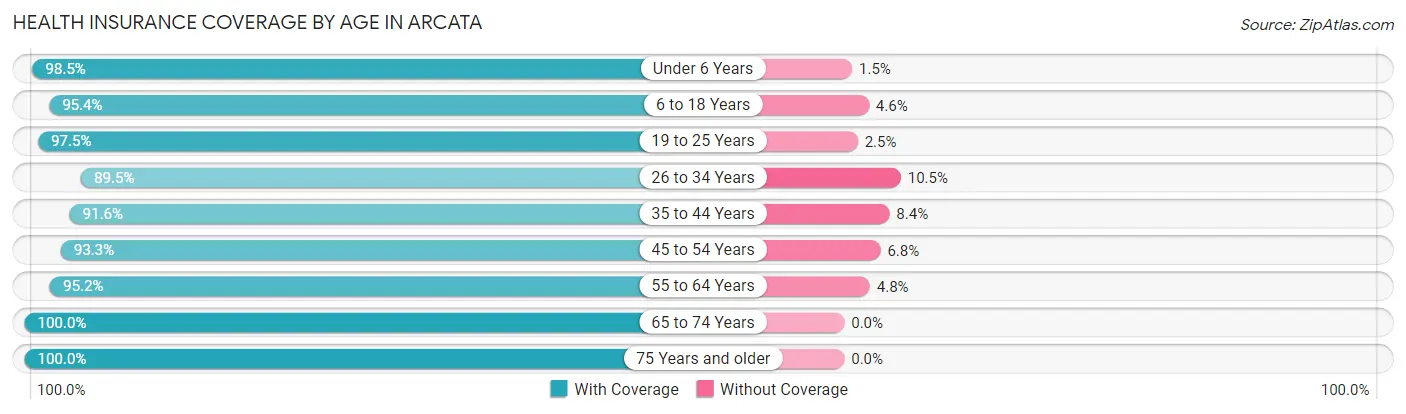
| Age Bracket | With Coverage | Without Coverage |
| Under 6 Years | 472 (98.5%) | 7 (1.5%) |
| 6 to 18 Years | 2,703 (95.4%) | 130 (4.6%) |
| 19 to 25 Years | 5,345 (97.5%) | 137 (2.5%) |
| 26 to 34 Years | 2,515 (89.5%) | 296 (10.5%) |
| 35 to 44 Years | 1,862 (91.6%) | 171 (8.4%) |
| 45 to 54 Years | 1,174 (93.2%) | 85 (6.8%) |
| 55 to 64 Years | 1,379 (95.2%) | 69 (4.8%) |
| 65 to 74 Years | 1,533 (100.0%) | 0 (0.0%) |
| 75 Years and older | 655 (100.0%) | 0 (0.0%) |
| Total | 17,638 (95.2%) | 895 (4.8%) |
Health Insurance Coverage by Citizenship Status in Arcata
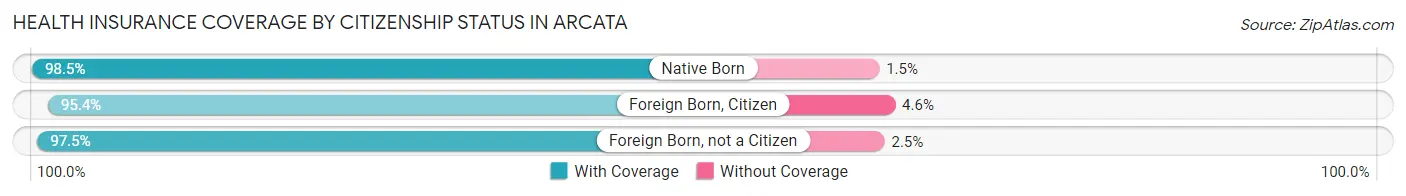
| Citizenship Status | With Coverage | Without Coverage |
| Native Born | 472 (98.5%) | 7 (1.5%) |
| Foreign Born, Citizen | 2,703 (95.4%) | 130 (4.6%) |
| Foreign Born, not a Citizen | 5,345 (97.5%) | 137 (2.5%) |
Health Insurance Coverage by Household Income in Arcata
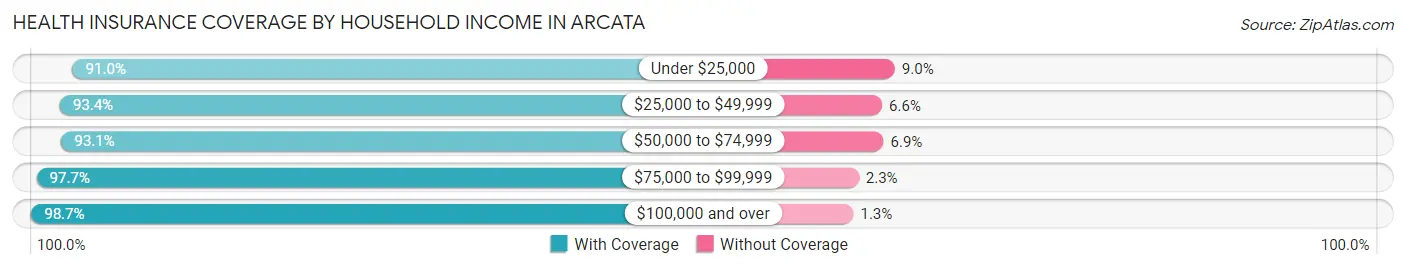
| Household Income | With Coverage | Without Coverage |
| Under $25,000 | 4,203 (91.0%) | 416 (9.0%) |
| $25,000 to $49,999 | 3,021 (93.4%) | 214 (6.6%) |
| $50,000 to $74,999 | 2,063 (93.1%) | 153 (6.9%) |
| $75,000 to $99,999 | 2,159 (97.7%) | 50 (2.3%) |
| $100,000 and over | 4,606 (98.7%) | 59 (1.3%) |
Public vs Private Health Insurance Coverage by Age in Arcata
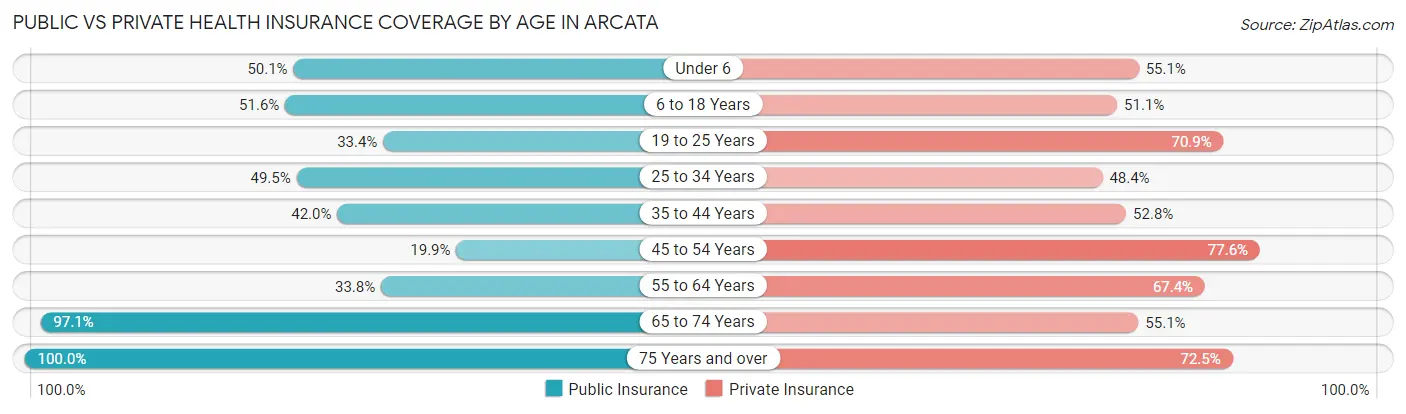
| Age Bracket | Public Insurance | Private Insurance |
| Under 6 | 240 (50.1%) | 264 (55.1%) |
| 6 to 18 Years | 1,463 (51.6%) | 1,448 (51.1%) |
| 19 to 25 Years | 1,833 (33.4%) | 3,884 (70.9%) |
| 25 to 34 Years | 1,392 (49.5%) | 1,360 (48.4%) |
| 35 to 44 Years | 853 (42.0%) | 1,073 (52.8%) |
| 45 to 54 Years | 250 (19.9%) | 977 (77.6%) |
| 55 to 64 Years | 490 (33.8%) | 976 (67.4%) |
| 65 to 74 Years | 1,488 (97.1%) | 844 (55.1%) |
| 75 Years and over | 655 (100.0%) | 475 (72.5%) |
| Total | 8,664 (46.8%) | 11,301 (61.0%) |
Disability Status by Sex by Age in Arcata
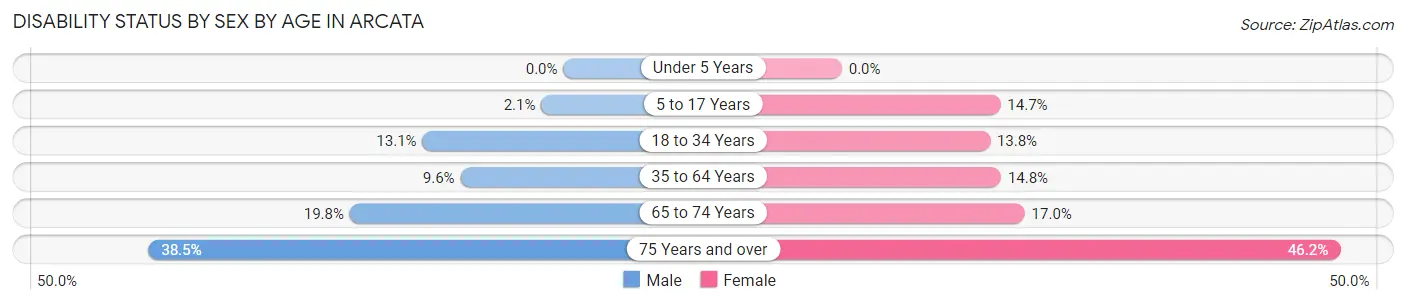
| Age Bracket | Male | Female |
| Under 5 Years | 0 (0.0%) | 0 (0.0%) |
| 5 to 17 Years | 14 (2.1%) | 178 (14.7%) |
| 18 to 34 Years | 663 (13.1%) | 581 (13.8%) |
| 35 to 64 Years | 234 (9.6%) | 338 (14.8%) |
| 65 to 74 Years | 152 (19.8%) | 130 (17.0%) |
| 75 Years and over | 94 (38.5%) | 190 (46.2%) |
Disability Class by Sex by Age in Arcata
Disability Class: Hearing Difficulty
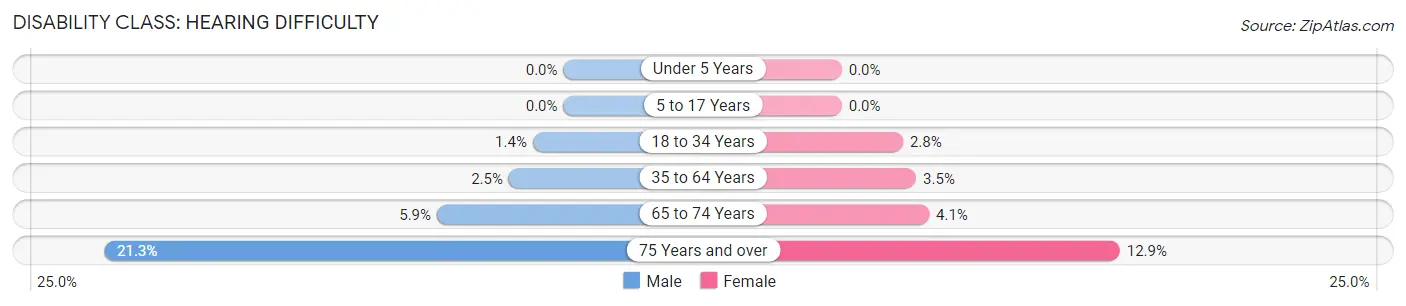
| Age Bracket | Male | Female |
| Under 5 Years | 0 (0.0%) | 0 (0.0%) |
| 5 to 17 Years | 0 (0.0%) | 0 (0.0%) |
| 18 to 34 Years | 72 (1.4%) | 120 (2.8%) |
| 35 to 64 Years | 62 (2.5%) | 79 (3.5%) |
| 65 to 74 Years | 45 (5.9%) | 31 (4.1%) |
| 75 Years and over | 52 (21.3%) | 53 (12.9%) |
Disability Class: Vision Difficulty
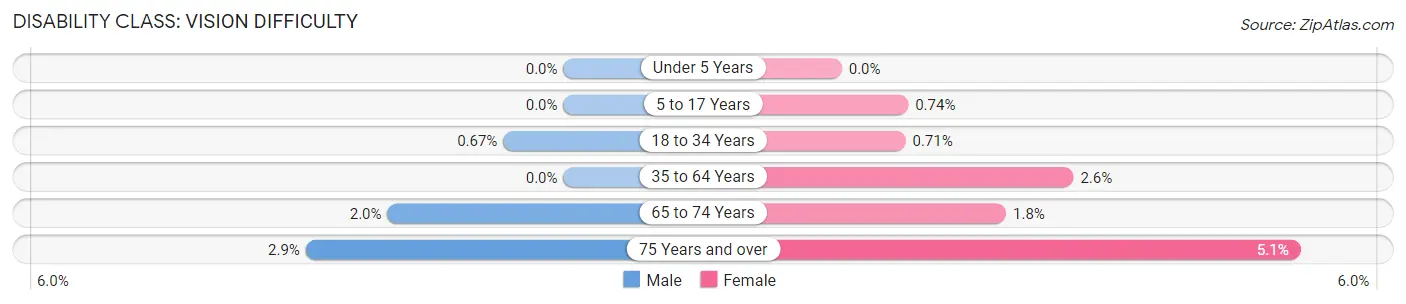
| Age Bracket | Male | Female |
| Under 5 Years | 0 (0.0%) | 0 (0.0%) |
| 5 to 17 Years | 0 (0.0%) | 9 (0.7%) |
| 18 to 34 Years | 34 (0.7%) | 30 (0.7%) |
| 35 to 64 Years | 0 (0.0%) | 59 (2.6%) |
| 65 to 74 Years | 15 (2.0%) | 14 (1.8%) |
| 75 Years and over | 7 (2.9%) | 21 (5.1%) |
Disability Class: Cognitive Difficulty
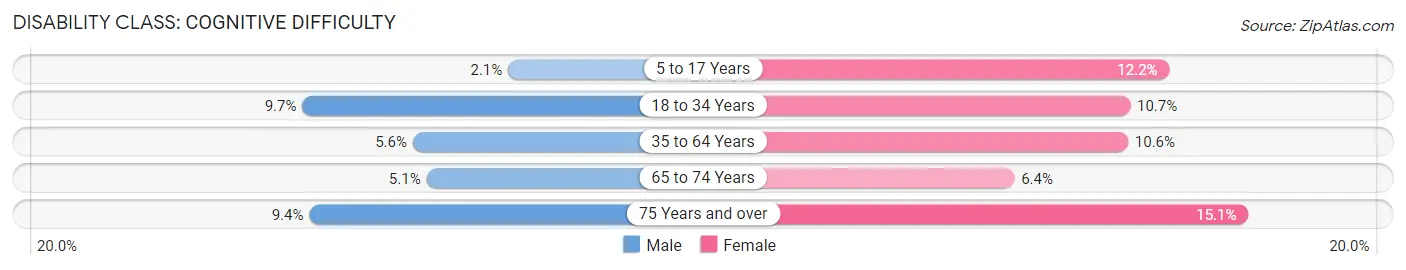
| Age Bracket | Male | Female |
| 5 to 17 Years | 14 (2.1%) | 147 (12.2%) |
| 18 to 34 Years | 491 (9.7%) | 452 (10.7%) |
| 35 to 64 Years | 137 (5.6%) | 243 (10.6%) |
| 65 to 74 Years | 39 (5.1%) | 49 (6.4%) |
| 75 Years and over | 23 (9.4%) | 62 (15.1%) |
Disability Class: Ambulatory Difficulty
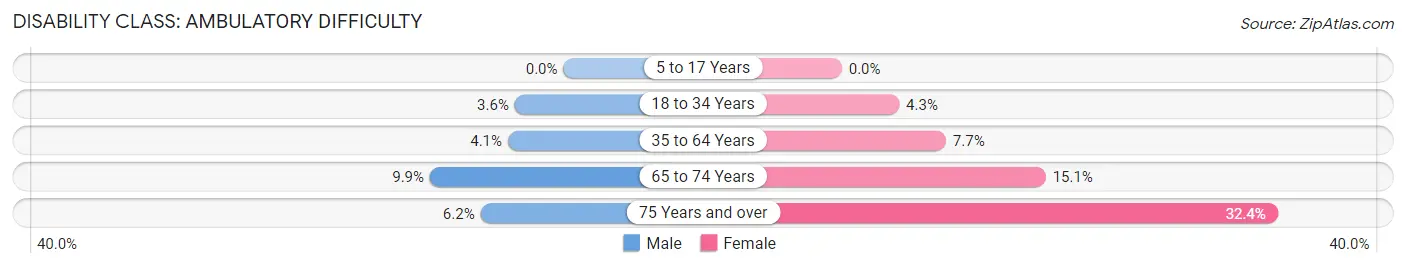
| Age Bracket | Male | Female |
| 5 to 17 Years | 0 (0.0%) | 0 (0.0%) |
| 18 to 34 Years | 183 (3.6%) | 180 (4.3%) |
| 35 to 64 Years | 101 (4.1%) | 177 (7.7%) |
| 65 to 74 Years | 76 (9.9%) | 116 (15.1%) |
| 75 Years and over | 15 (6.1%) | 133 (32.4%) |
Disability Class: Self-Care Difficulty
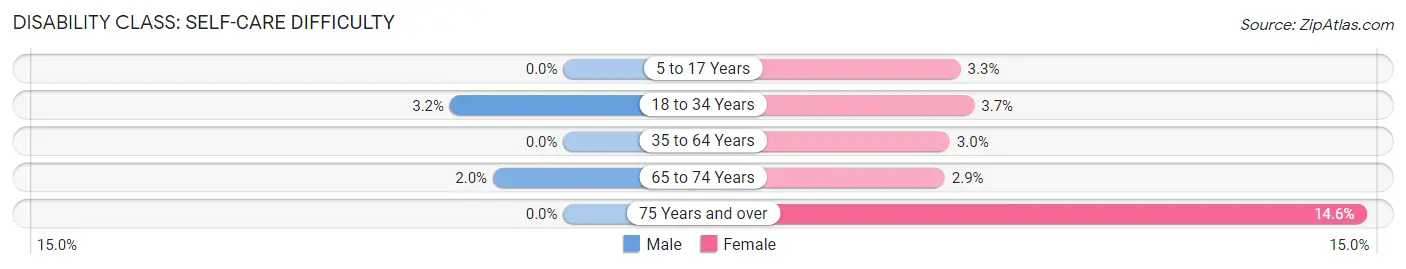
| Age Bracket | Male | Female |
| 5 to 17 Years | 0 (0.0%) | 40 (3.3%) |
| 18 to 34 Years | 160 (3.2%) | 156 (3.7%) |
| 35 to 64 Years | 0 (0.0%) | 69 (3.0%) |
| 65 to 74 Years | 15 (2.0%) | 22 (2.9%) |
| 75 Years and over | 0 (0.0%) | 60 (14.6%) |
Technology Access in Arcata
Computing Device Access in Arcata
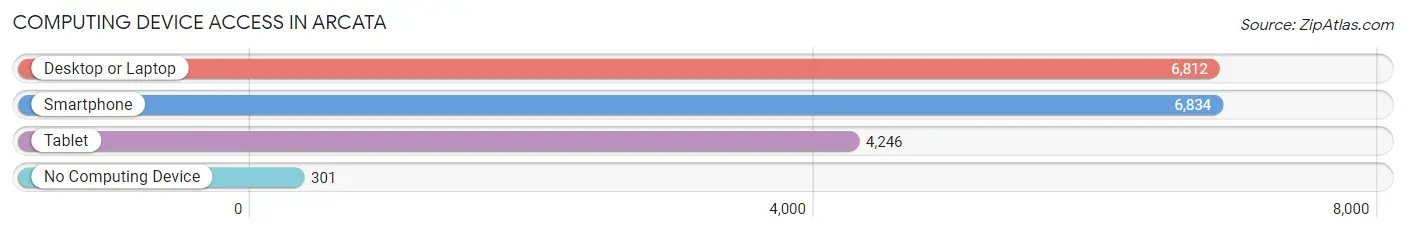
| Device Type | # Households | % Households |
| Desktop or Laptop | 6,812 | 90.9% |
| Smartphone | 6,834 | 91.2% |
| Tablet | 4,246 | 56.6% |
| No Computing Device | 301 | 4.0% |
| Total | 7,496 | 100.0% |
Internet Access in Arcata
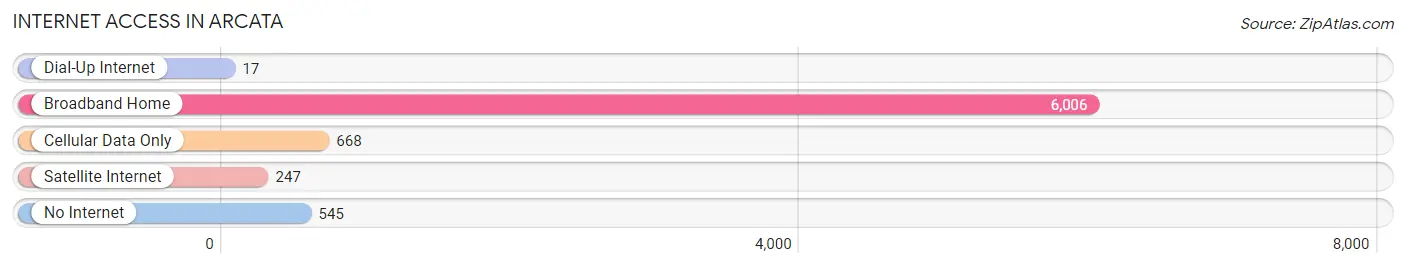
| Internet Type | # Households | % Households |
| Dial-Up Internet | 17 | 0.2% |
| Broadband Home | 6,006 | 80.1% |
| Cellular Data Only | 668 | 8.9% |
| Satellite Internet | 247 | 3.3% |
| No Internet | 545 | 7.3% |
| Total | 7,496 | 100.0% |
Arcata Summary
History
The city of Arcata, California is located in Humboldt County, on the northern coast of California. It is situated on the western edge of the Humboldt Bay, and is the largest city in the county. The city was founded in 1850 by Union Army Captain Jacoby, who named it Union Town. The city was later renamed Arcata, after the nearby Arcata Bay.
Arcata has a long and rich history, beginning with the Wiyot people, who were the original inhabitants of the area. The Wiyot people lived in the area for thousands of years before the arrival of European settlers. The first Europeans to settle in the area were Spanish missionaries, who established a mission in the area in 1806.
In the mid-1800s, the area was settled by farmers and ranchers, who established the town of Union Town. The town was renamed Arcata in 1857, and the city was officially incorporated in 1858.
In the late 1800s, Arcata became a center for the lumber industry, and the city grew rapidly. The city was also home to a number of other industries, including fishing, canning, and shipping.
In the early 1900s, Arcata became a popular tourist destination, and the city's population grew rapidly. The city was also home to a number of educational institutions, including Humboldt State University, which was founded in 1913.
In the late 1900s, Arcata became a center for the environmental movement, and the city was home to a number of environmental organizations, including the Arcata Marsh and Wildlife Sanctuary. The city is also home to a number of other organizations, including the Arcata Community Forest, which is dedicated to preserving the city's forests.
Geography
Arcata is located in Humboldt County, on the northern coast of California. The city is situated on the western edge of the Humboldt Bay, and is the largest city in the county. The city is bordered by the cities of Eureka, McKinleyville, and Blue Lake.
The city has a total area of 8.3 square miles, of which 8.2 square miles is land and 0.1 square miles is water. The city is located at an elevation of 33 feet above sea level.
The climate in Arcata is mild and temperate, with warm summers and cool winters. The average annual temperature is 54 degrees Fahrenheit, and the average annual precipitation is 44 inches.
Economy
Arcata has a diverse economy, with a number of industries contributing to the city's economic growth. The city is home to a number of businesses, including retail stores, restaurants, and hotels. The city is also home to a number of educational institutions, including Humboldt State University.
The city is also home to a number of manufacturing companies, including the Arcata-based Humboldt Bay Brewing Company. The city is also home to a number of technology companies, including the Arcata-based software company, Arcata Systems.
The city is also home to a number of government agencies, including the Humboldt County Sheriff's Office and the Arcata Police Department. The city is also home to a number of non-profit organizations, including the Arcata Marsh and Wildlife Sanctuary.
Demographics
As of the 2010 census, the population of Arcata was 17,231. The population is composed of a diverse mix of ethnicities, including White (63.2%), Hispanic or Latino (17.2%), Asian (7.2%), African American (4.2%), and Native American (2.2%).
The median household income in Arcata is $41,945, and the median family income is $50,945. The city has a poverty rate of 17.2%, and the unemployment rate is 6.2%.
The city is home to a number of educational institutions, including Humboldt State University. The city is also home to a number of cultural attractions, including the Arcata Marsh and Wildlife Sanctuary. The city is also home to a number of parks, including the Arcata Community Forest.
Common Questions
What is Per Capita Income in Arcata?
Per Capita income in Arcata is $27,651.
What is the Median Family Income in Arcata?
Median Family Income in Arcata is $82,793.
What is the Median Household income in Arcata?
Median Household Income in Arcata is $43,444.
What is Income or Wage Gap in Arcata?
Income or Wage Gap in Arcata is 0.9%.
Women in Arcata earn 99.1 cents for every dollar earned by a man.
What is Inequality or Gini Index in Arcata?
Inequality or Gini Index in Arcata is 0.50.
What is the Total Population of Arcata?
Total Population of Arcata is 18,536.
What is the Total Male Population of Arcata?
Total Male Population of Arcata is 9,359.
What is the Total Female Population of Arcata?
Total Female Population of Arcata is 9,177.
What is the Ratio of Males per 100 Females in Arcata?
There are 101.98 Males per 100 Females in Arcata.
What is the Ratio of Females per 100 Males in Arcata?
There are 98.06 Females per 100 Males in Arcata.
What is the Median Population Age in Arcata?
Median Population Age in Arcata is 27.2 Years.
What is the Average Family Size in Arcata
Average Family Size in Arcata is 3.0 People.
What is the Average Household Size in Arcata
Average Household Size in Arcata is 2.3 People.
How Large is the Labor Force in Arcata?
There are 11,073 People in the Labor Forcein in Arcata.
What is the Percentage of People in the Labor Force in Arcata?
66.8% of People are in the Labor Force in Arcata.
What is the Unemployment Rate in Arcata?
Unemployment Rate in Arcata is 13.9%.