Dorado, PR Map & Demographics
Dorado Map
Dorado Overview
$27,131
PER CAPITA INCOME
$52,989
AVG FAMILY INCOME
$40,660
AVG HOUSEHOLD INCOME
10.0%
WAGE / INCOME GAP [ % ]
90.0¢/ $1
WAGE / INCOME GAP [ $ ]
$13,494
FAMILY INCOME DEFICIT
0.60
INEQUALITY / GINI INDEX
13,208
TOTAL POPULATION
6,002
MALE POPULATION
7,206
FEMALE POPULATION
83.29
MALES / 100 FEMALES
120.06
FEMALES / 100 MALES
43.8
MEDIAN AGE
3.8
AVG FAMILY SIZE
3.0
AVG HOUSEHOLD SIZE
5,304
LABOR FORCE [ PEOPLE ]
47.7%
PERCENT IN LABOR FORCE
10.9%
UNEMPLOYMENT RATE
Dorado Zip Codes
Dorado Area Codes
Income in Dorado
Income Overview in Dorado
Per Capita Income in Dorado is $27,131, while median incomes of families and households are $52,989 and $40,660 respectively.
| Characteristic | Number | Measure |
| Per Capita Income | 13,208 | $27,131 |
| Median Family Income | 2,982 | $52,989 |
| Mean Family Income | 2,982 | $85,874 |
| Median Household Income | 4,434 | $40,660 |
| Mean Household Income | 4,434 | $72,298 |
| Income Deficit | 2,982 | $13,494 |
| Wage / Income Gap (%) | 13,208 | 9.96% |
| Wage / Income Gap ($) | 13,208 | 90.04¢ per $1 |
| Gini / Inequality Index | 13,208 | 0.60 |
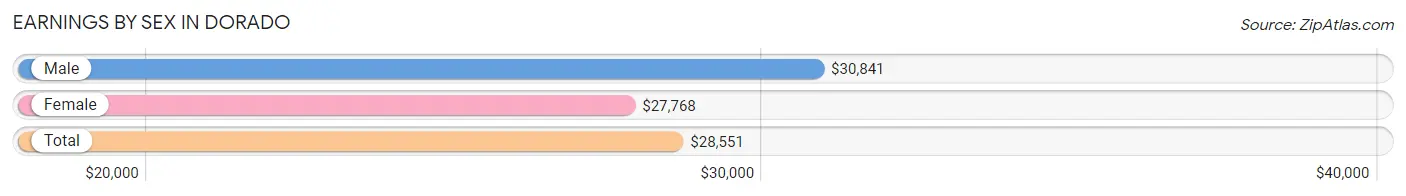
Earnings by Sex in Dorado
Average Earnings in Dorado are $28,551, $30,841 for men and $27,768 for women, a difference of 10.0%.
| Sex | Number | Average Earnings |
| Male | 2,311 (46.6%) | $30,841 |
| Female | 2,646 (53.4%) | $27,768 |
| Total | 4,957 (100.0%) | $28,551 |
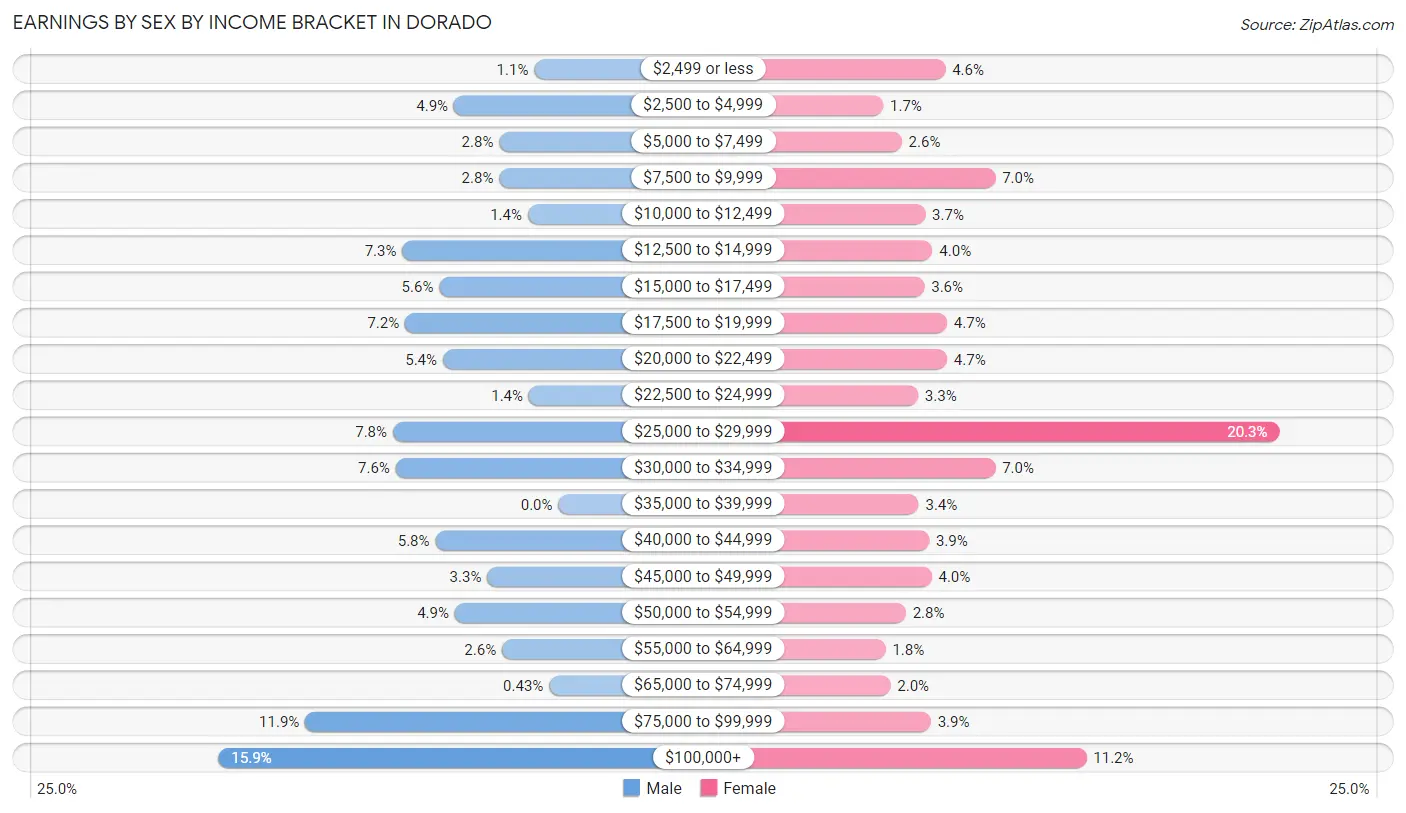
Earnings by Sex by Income Bracket in Dorado
The most common earnings brackets in Dorado are $100,000+ for men (368 | 15.9%) and $25,000 to $29,999 for women (536 | 20.3%).
| Income | Male | Female |
| $2,499 or less | 26 (1.1%) | 122 (4.6%) |
| $2,500 to $4,999 | 113 (4.9%) | 45 (1.7%) |
| $5,000 to $7,499 | 64 (2.8%) | 68 (2.6%) |
| $7,500 to $9,999 | 64 (2.8%) | 184 (7.0%) |
| $10,000 to $12,499 | 33 (1.4%) | 97 (3.7%) |
| $12,500 to $14,999 | 169 (7.3%) | 106 (4.0%) |
| $15,000 to $17,499 | 129 (5.6%) | 96 (3.6%) |
| $17,500 to $19,999 | 166 (7.2%) | 124 (4.7%) |
| $20,000 to $22,499 | 125 (5.4%) | 124 (4.7%) |
| $22,500 to $24,999 | 32 (1.4%) | 88 (3.3%) |
| $25,000 to $29,999 | 179 (7.7%) | 536 (20.3%) |
| $30,000 to $34,999 | 176 (7.6%) | 184 (7.0%) |
| $35,000 to $39,999 | 0 (0.0%) | 89 (3.4%) |
| $40,000 to $44,999 | 133 (5.8%) | 102 (3.8%) |
| $45,000 to $49,999 | 77 (3.3%) | 105 (4.0%) |
| $50,000 to $54,999 | 112 (4.9%) | 73 (2.8%) |
| $55,000 to $64,999 | 61 (2.6%) | 48 (1.8%) |
| $65,000 to $74,999 | 10 (0.4%) | 54 (2.0%) |
| $75,000 to $99,999 | 274 (11.9%) | 104 (3.9%) |
| $100,000+ | 368 (15.9%) | 297 (11.2%) |
| Total | 2,311 (100.0%) | 2,646 (100.0%) |
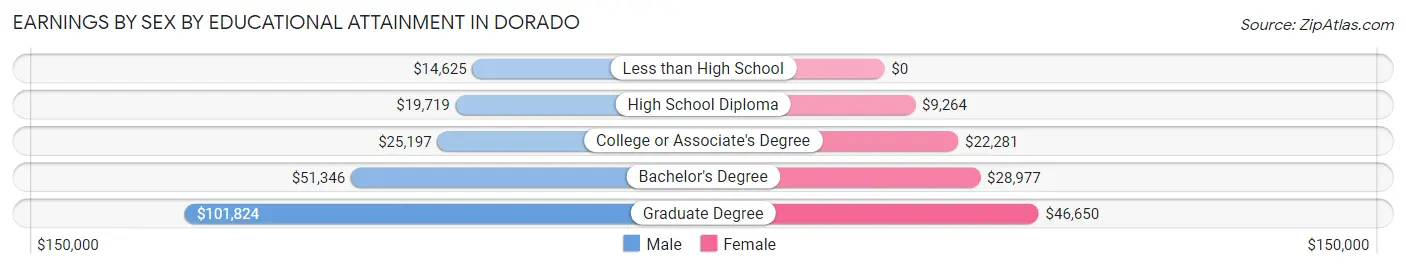
Earnings by Sex by Educational Attainment in Dorado
Average earnings in Dorado are $40,688 for men and $28,282 for women, a difference of 30.5%. Men with an educational attainment of graduate degree enjoy the highest average annual earnings of $101,824, while those with less than high school education earn the least with $14,625. Women with an educational attainment of graduate degree earn the most with the average annual earnings of $46,650, while those with high school diploma education have the smallest earnings of $9,264.
| Educational Attainment | Male Income | Female Income |
| Less than High School | $14,625 | $0 |
| High School Diploma | $19,719 | $9,264 |
| College or Associate's Degree | $25,197 | $22,281 |
| Bachelor's Degree | $51,346 | $28,977 |
| Graduate Degree | $101,824 | $46,650 |
| Total | $40,688 | $28,282 |
Family Income in Dorado
Family Income Brackets in Dorado
According to the Dorado family income data, there are 543 families falling into the $50,000 to $74,999 income range, which is the most common income bracket and makes up 18.2% of all families. Conversely, the $10,000 to $14,999 income bracket is the least frequent group with only 45 families (1.5%) belonging to this category.
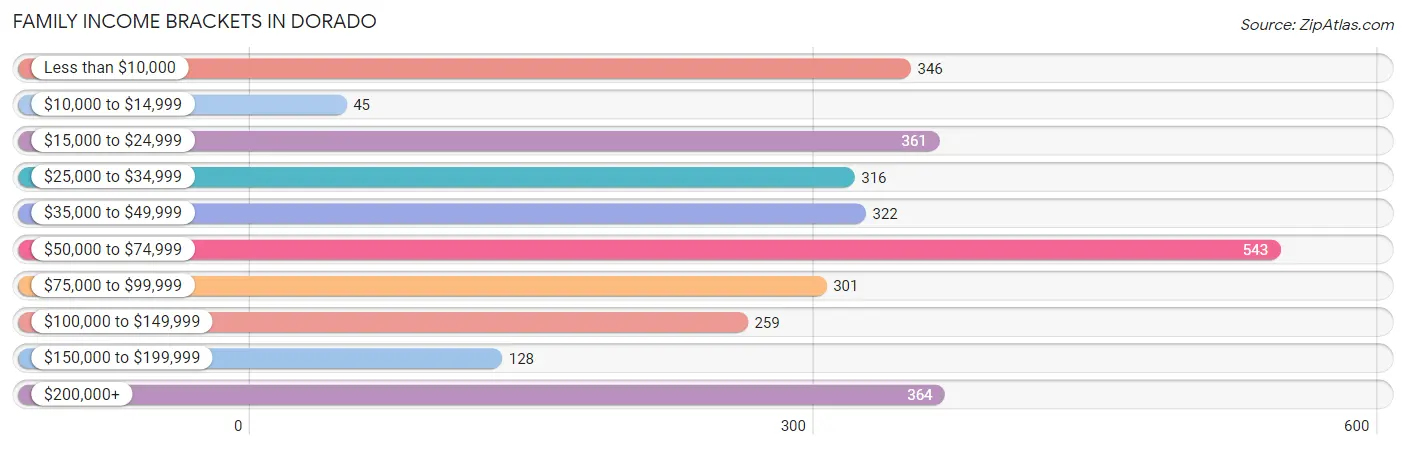
| Income Bracket | # Families | % Families |
| Less than $10,000 | 346 | 11.6% |
| $10,000 to $14,999 | 45 | 1.5% |
| $15,000 to $24,999 | 361 | 12.1% |
| $25,000 to $34,999 | 316 | 10.6% |
| $35,000 to $49,999 | 322 | 10.8% |
| $50,000 to $74,999 | 543 | 18.2% |
| $75,000 to $99,999 | 301 | 10.1% |
| $100,000 to $149,999 | 259 | 8.7% |
| $150,000 to $199,999 | 128 | 4.3% |
| $200,000+ | 364 | 12.2% |
Family Income by Famaliy Size in Dorado
4-person families (517 | 17.3%) account for the highest median family income in Dorado with $112,939 per family, while 4-person families (517 | 17.3%) have the highest median income of $28,235 per family member.
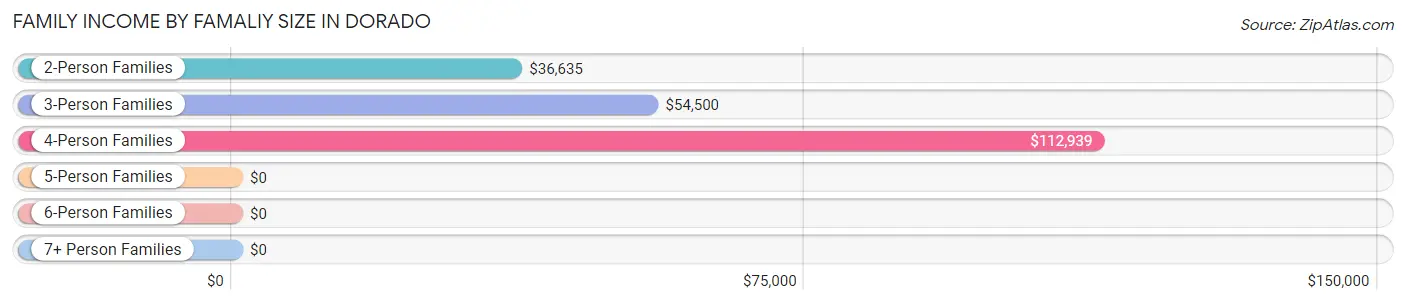
| Income Bracket | # Families | Median Income |
| 2-Person Families | 1,531 (51.3%) | $36,635 |
| 3-Person Families | 690 (23.1%) | $54,500 |
| 4-Person Families | 517 (17.3%) | $112,939 |
| 5-Person Families | 172 (5.8%) | $0 |
| 6-Person Families | 54 (1.8%) | $0 |
| 7+ Person Families | 18 (0.6%) | $0 |
| Total | 2,982 (100.0%) | $52,989 |
Family Income by Number of Earners in Dorado
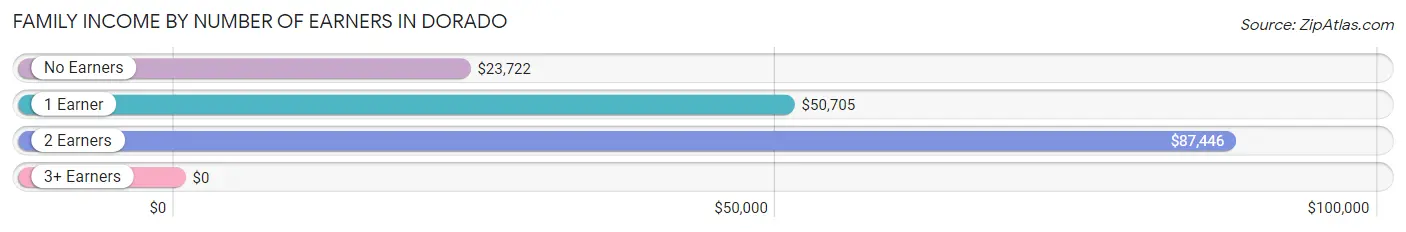
| Number of Earners | # Families | Median Income |
| No Earners | 1,004 (33.7%) | $23,722 |
| 1 Earner | 1,028 (34.5%) | $50,705 |
| 2 Earners | 832 (27.9%) | $87,446 |
| 3+ Earners | 118 (4.0%) | $0 |
| Total | 2,982 (100.0%) | $52,989 |
Household Income in Dorado
Household Income Brackets in Dorado
With 816 households falling in the category, the less than $10,000 income range is the most frequent in Dorado, accounting for 18.4% of all households. In contrast, only 204 households (4.6%) fall into the $150,000 to $199,999 income bracket, making it the least populous group.
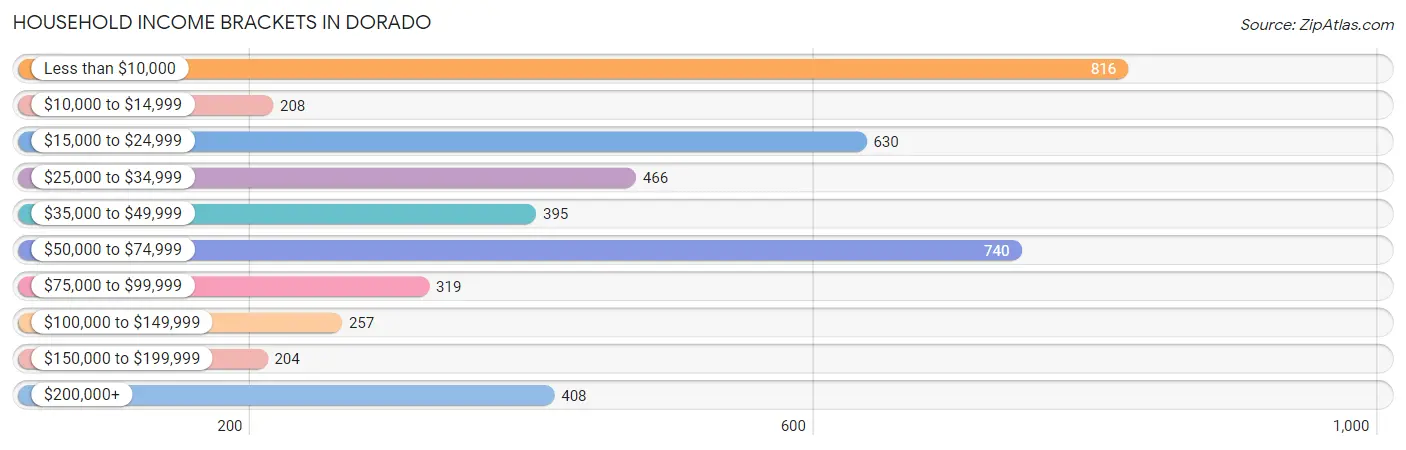
| Income Bracket | # Households | % Households |
| Less than $10,000 | 816 | 18.4% |
| $10,000 to $14,999 | 208 | 4.7% |
| $15,000 to $24,999 | 630 | 14.2% |
| $25,000 to $34,999 | 466 | 10.5% |
| $35,000 to $49,999 | 395 | 8.9% |
| $50,000 to $74,999 | 740 | 16.7% |
| $75,000 to $99,999 | 319 | 7.2% |
| $100,000 to $149,999 | 257 | 5.8% |
| $150,000 to $199,999 | 204 | 4.6% |
| $200,000+ | 408 | 9.2% |
Household Income by Householder Age in Dorado
The median household income in Dorado is $40,660, with the highest median household income of $58,000 found in the 45 to 64 years age bracket for the primary householder. A total of 1,676 households (37.8%) fall into this category. Meanwhile, the 15 to 24 years age bracket for the primary householder has the lowest median household income of $0, with 45 households (1.0%) in this group.
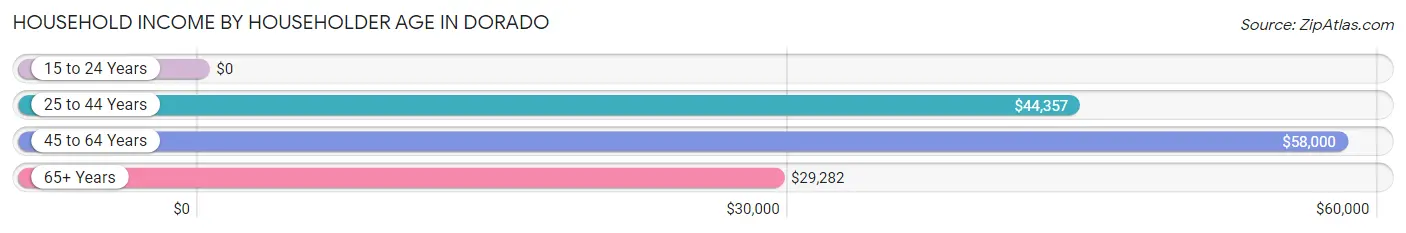
| Income Bracket | # Households | Median Income |
| 15 to 24 Years | 45 (1.0%) | $0 |
| 25 to 44 Years | 924 (20.8%) | $44,357 |
| 45 to 64 Years | 1,676 (37.8%) | $58,000 |
| 65+ Years | 1,789 (40.4%) | $29,282 |
| Total | 4,434 (100.0%) | $40,660 |
Poverty in Dorado
Income Below Poverty by Sex and Age in Dorado
With 21.3% poverty level for males and 20.6% for females among the residents of Dorado, 16 and 17 year old males and 16 and 17 year old females are the most vulnerable to poverty, with 132 males (45.4%) and 37 females (41.1%) in their respective age groups living below the poverty level.
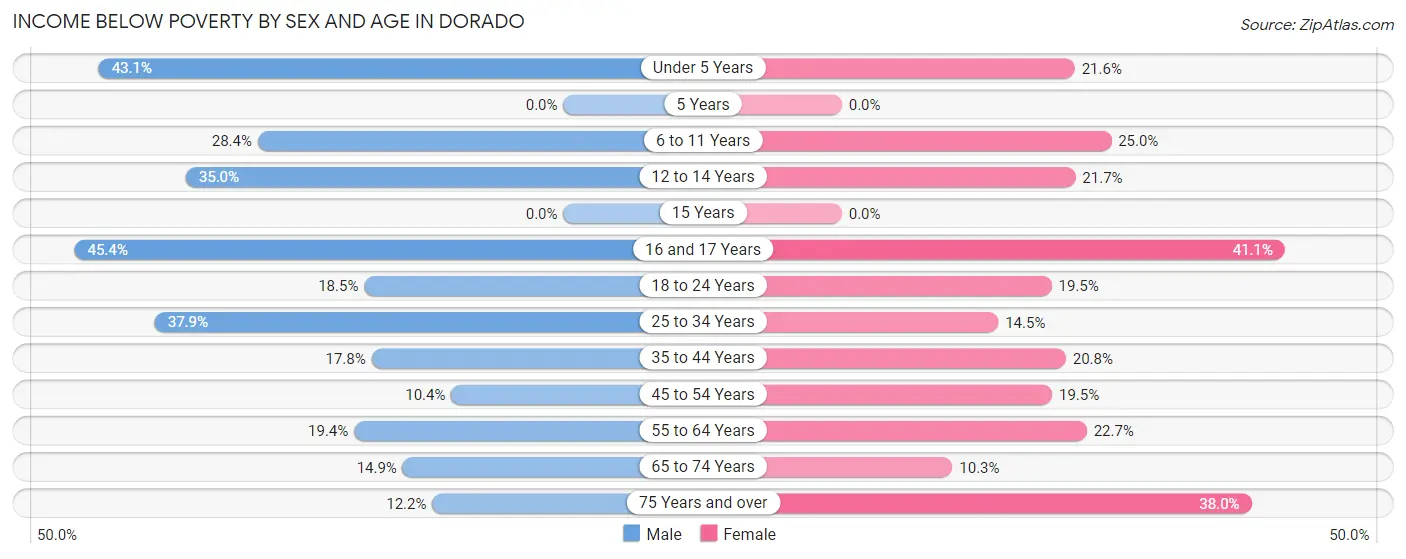
| Age Bracket | Male | Female |
| Under 5 Years | 94 (43.1%) | 32 (21.6%) |
| 5 Years | 0 (0.0%) | 0 (0.0%) |
| 6 to 11 Years | 135 (28.4%) | 81 (25.0%) |
| 12 to 14 Years | 55 (35.0%) | 116 (21.7%) |
| 15 Years | 0 (0.0%) | 0 (0.0%) |
| 16 and 17 Years | 132 (45.4%) | 37 (41.1%) |
| 18 to 24 Years | 139 (18.5%) | 103 (19.5%) |
| 25 to 34 Years | 221 (37.9%) | 117 (14.5%) |
| 35 to 44 Years | 120 (17.8%) | 217 (20.8%) |
| 45 to 54 Years | 76 (10.4%) | 207 (19.5%) |
| 55 to 64 Years | 133 (19.4%) | 215 (22.7%) |
| 65 to 74 Years | 103 (14.9%) | 96 (10.3%) |
| 75 Years and over | 71 (12.2%) | 260 (38.0%) |
| Total | 1,279 (21.3%) | 1,481 (20.6%) |
Income Above Poverty by Sex and Age in Dorado
According to the poverty statistics in Dorado, males aged 5 years and females aged 5 years are the age groups that are most secure financially, with 100.0% of males and 100.0% of females in these age groups living above the poverty line.
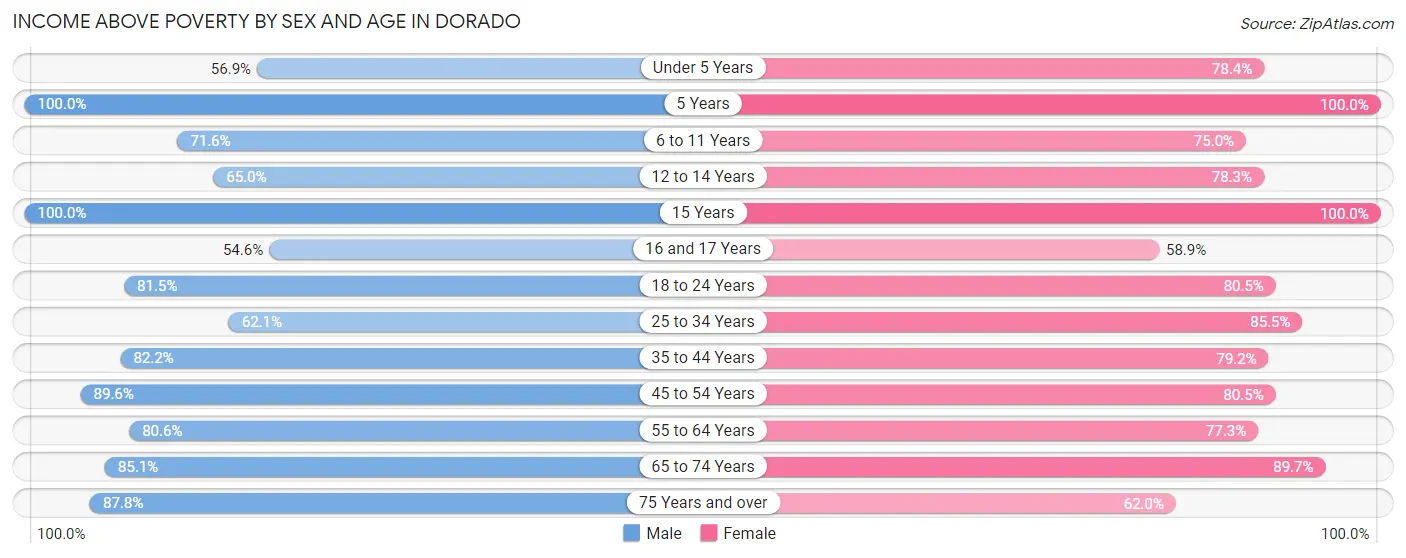
| Age Bracket | Male | Female |
| Under 5 Years | 124 (56.9%) | 116 (78.4%) |
| 5 Years | 86 (100.0%) | 47 (100.0%) |
| 6 to 11 Years | 341 (71.6%) | 243 (75.0%) |
| 12 to 14 Years | 102 (65.0%) | 419 (78.3%) |
| 15 Years | 64 (100.0%) | 28 (100.0%) |
| 16 and 17 Years | 159 (54.6%) | 53 (58.9%) |
| 18 to 24 Years | 613 (81.5%) | 426 (80.5%) |
| 25 to 34 Years | 362 (62.1%) | 689 (85.5%) |
| 35 to 44 Years | 554 (82.2%) | 827 (79.2%) |
| 45 to 54 Years | 655 (89.6%) | 854 (80.5%) |
| 55 to 64 Years | 552 (80.6%) | 731 (77.3%) |
| 65 to 74 Years | 588 (85.1%) | 840 (89.7%) |
| 75 Years and over | 513 (87.8%) | 424 (62.0%) |
| Total | 4,713 (78.6%) | 5,697 (79.4%) |
Income Below Poverty Among Married-Couple Families in Dorado
The poverty statistics for married-couple families in Dorado show that 4.9% or 88 of the total 1,780 families live below the poverty line. Families with no children have the highest poverty rate of 5.9%, comprising of 80 families. On the other hand, families with 3 or 4 children have the lowest poverty rate of 0.0%, which includes 0 families.
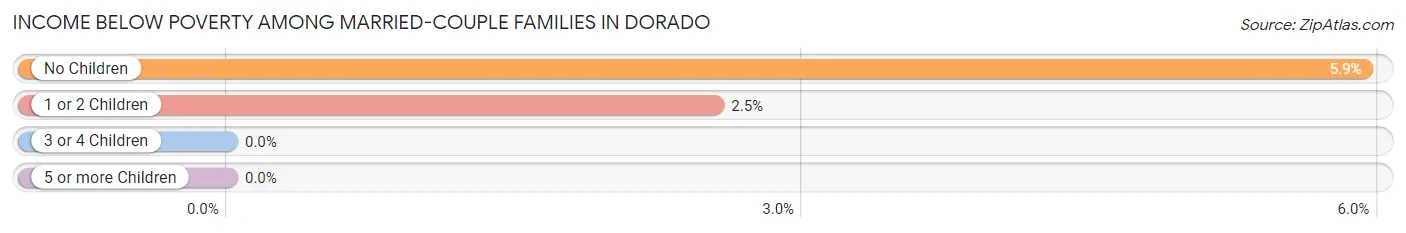
| Children | Above Poverty | Below Poverty |
| No Children | 1,268 (94.1%) | 80 (5.9%) |
| 1 or 2 Children | 307 (97.5%) | 8 (2.5%) |
| 3 or 4 Children | 117 (100.0%) | 0 (0.0%) |
| 5 or more Children | 0 (0.0%) | 0 (0.0%) |
| Total | 1,692 (95.1%) | 88 (4.9%) |
Income Below Poverty Among Single-Parent Households in Dorado
According to the poverty data in Dorado, 20.6% or 48 single-father households and 40.3% or 390 single-mother households are living below the poverty line. Among single-father households, those with 1 or 2 children have the highest poverty rate, with 18 households (23.4%) experiencing poverty. Likewise, among single-mother households, those with 5 or more children have the highest poverty rate, with 25 households (100.0%) falling below the poverty line.
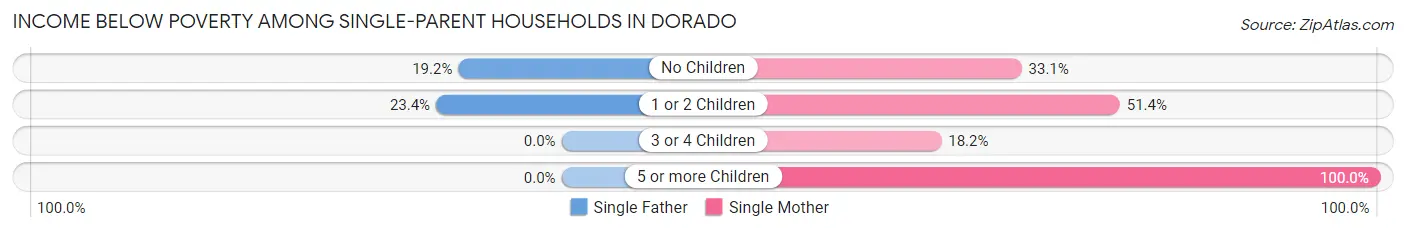
| Children | Single Father | Single Mother |
| No Children | 30 (19.2%) | 172 (33.1%) |
| 1 or 2 Children | 18 (23.4%) | 179 (51.4%) |
| 3 or 4 Children | 0 (0.0%) | 14 (18.2%) |
| 5 or more Children | 0 (0.0%) | 25 (100.0%) |
| Total | 48 (20.6%) | 390 (40.3%) |
Income Below Poverty Among Married-Couple vs Single-Parent Households in Dorado
The poverty data for Dorado shows that 88 of the married-couple family households (4.9%) and 438 of the single-parent households (36.4%) are living below the poverty level. Within the married-couple family households, those with no children have the highest poverty rate, with 80 households (5.9%) falling below the poverty line. Among the single-parent households, those with 5 or more children have the highest poverty rate, with 25 household (100.0%) living below poverty.
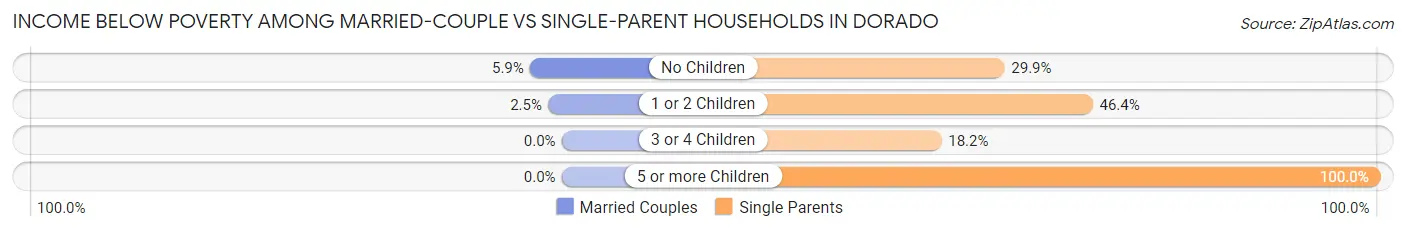
| Children | Married-Couple Families | Single-Parent Households |
| No Children | 80 (5.9%) | 202 (29.9%) |
| 1 or 2 Children | 8 (2.5%) | 197 (46.4%) |
| 3 or 4 Children | 0 (0.0%) | 14 (18.2%) |
| 5 or more Children | 0 (0.0%) | 25 (100.0%) |
| Total | 88 (4.9%) | 438 (36.4%) |
Race in Dorado
The most populous races in Dorado are Hispanic or Latino (12,602 | 95.4%), White / Caucasian (6,207 | 47.0%), and Two or more Races (4,701 | 35.6%).
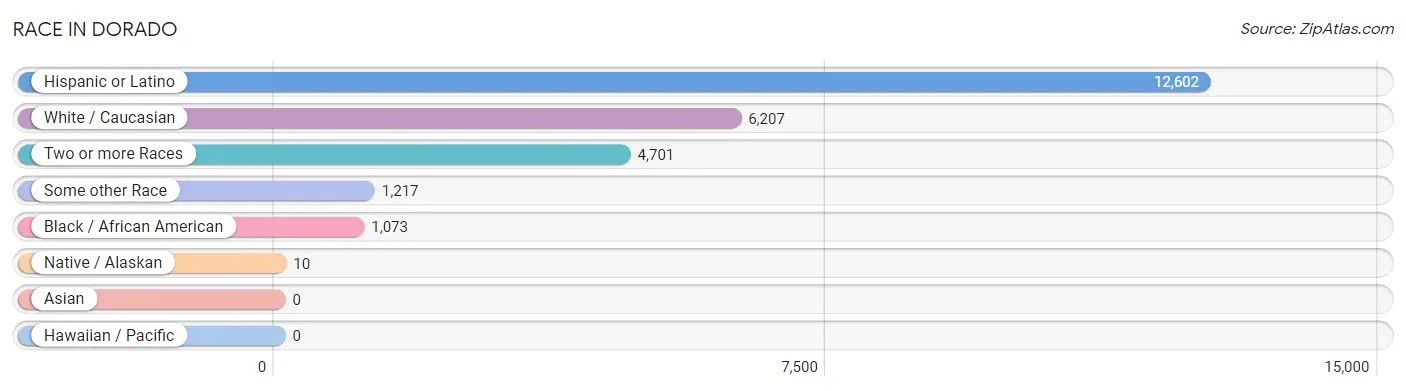
| Race | # Population | % Population |
| Asian | 0 | 0.0% |
| Black / African American | 1,073 | 8.1% |
| Hawaiian / Pacific | 0 | 0.0% |
| Hispanic or Latino | 12,602 | 95.4% |
| Native / Alaskan | 10 | 0.1% |
| White / Caucasian | 6,207 | 47.0% |
| Two or more Races | 4,701 | 35.6% |
| Some other Race | 1,217 | 9.2% |
| Total | 13,208 | 100.0% |
Ancestry in Dorado
The most populous ancestries reported in Dorado are Puerto Rican (12,345 | 93.5%), American (277 | 2.1%), Spaniard (150 | 1.1%), Italian (94 | 0.7%), and English (69 | 0.5%), together accounting for 97.9% of all Dorado residents.
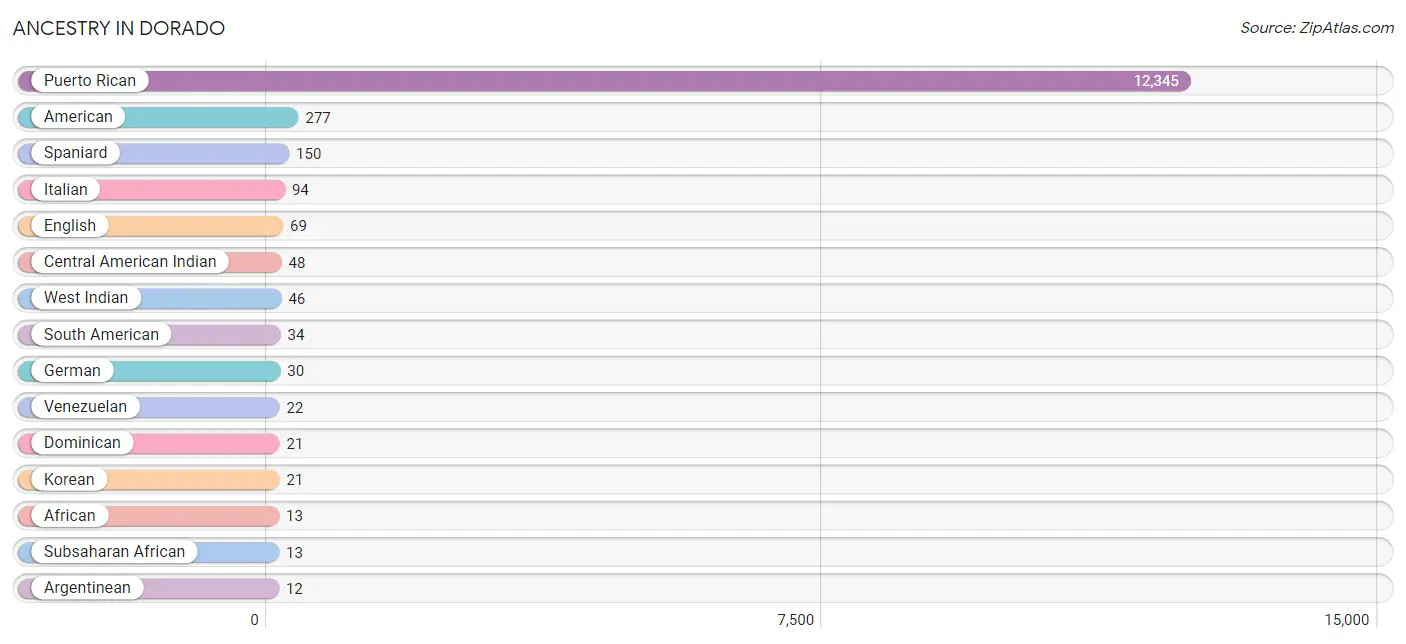
| Ancestry | # Population | % Population |
| African | 13 | 0.1% |
| American | 277 | 2.1% |
| Argentinean | 12 | 0.1% |
| Basque | 12 | 0.1% |
| British | 12 | 0.1% |
| Burmese | 10 | 0.1% |
| Central American Indian | 48 | 0.4% |
| Cuban | 9 | 0.1% |
| Dominican | 21 | 0.2% |
| English | 69 | 0.5% |
| French | 8 | 0.1% |
| German | 30 | 0.2% |
| Irish | 10 | 0.1% |
| Italian | 94 | 0.7% |
| Korean | 21 | 0.2% |
| Mexican | 10 | 0.1% |
| Mexican American Indian | 10 | 0.1% |
| Puerto Rican | 12,345 | 93.5% |
| Scotch-Irish | 9 | 0.1% |
| South American | 34 | 0.3% |
| Spaniard | 150 | 1.1% |
| Subsaharan African | 13 | 0.1% |
| Swedish | 9 | 0.1% |
| Venezuelan | 22 | 0.2% |
| West Indian | 46 | 0.4% | View All 25 Rows |
Immigrants in Dorado

| Immigration Origin | # Population | % Population | View All 0 Rows |
Sex and Age in Dorado
Sex and Age in Dorado
The most populous age groups in Dorado are 20 to 24 Years (582 | 9.7%) for men and 40 to 44 Years (749 | 10.4%) for women.
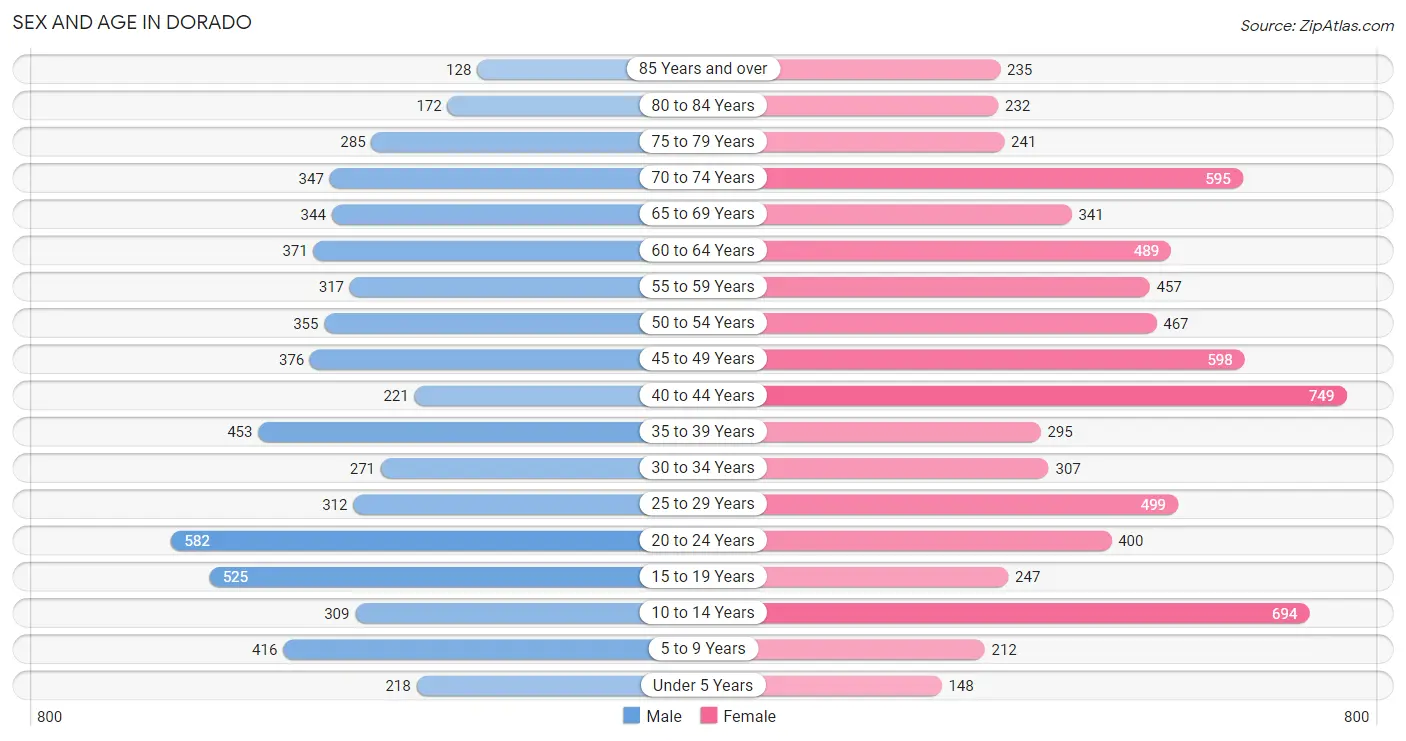
| Age Bracket | Male | Female |
| Under 5 Years | 218 (3.6%) | 148 (2.1%) |
| 5 to 9 Years | 416 (6.9%) | 212 (2.9%) |
| 10 to 14 Years | 309 (5.1%) | 694 (9.6%) |
| 15 to 19 Years | 525 (8.7%) | 247 (3.4%) |
| 20 to 24 Years | 582 (9.7%) | 400 (5.6%) |
| 25 to 29 Years | 312 (5.2%) | 499 (6.9%) |
| 30 to 34 Years | 271 (4.5%) | 307 (4.3%) |
| 35 to 39 Years | 453 (7.5%) | 295 (4.1%) |
| 40 to 44 Years | 221 (3.7%) | 749 (10.4%) |
| 45 to 49 Years | 376 (6.3%) | 598 (8.3%) |
| 50 to 54 Years | 355 (5.9%) | 467 (6.5%) |
| 55 to 59 Years | 317 (5.3%) | 457 (6.3%) |
| 60 to 64 Years | 371 (6.2%) | 489 (6.8%) |
| 65 to 69 Years | 344 (5.7%) | 341 (4.7%) |
| 70 to 74 Years | 347 (5.8%) | 595 (8.3%) |
| 75 to 79 Years | 285 (4.8%) | 241 (3.3%) |
| 80 to 84 Years | 172 (2.9%) | 232 (3.2%) |
| 85 Years and over | 128 (2.1%) | 235 (3.3%) |
| Total | 6,002 (100.0%) | 7,206 (100.0%) |
Families and Households in Dorado
Median Family Size in Dorado
The median family size in Dorado is 3.78 persons per family, with single male/father families (233 | 7.8%) accounting for the largest median family size of 4.23 persons per family. On the other hand, married-couple families (1,780 | 59.7%) represent the smallest median family size with 3.57 persons per family.
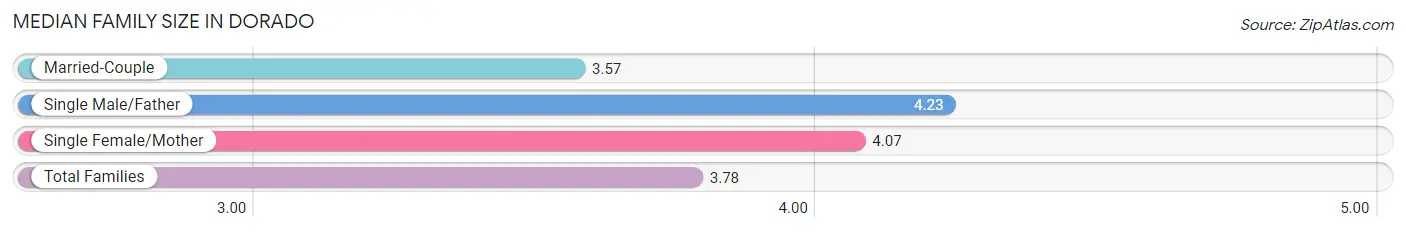
| Family Type | # Families | Family Size |
| Married-Couple | 1,780 (59.7%) | 3.57 |
| Single Male/Father | 233 (7.8%) | 4.23 |
| Single Female/Mother | 969 (32.5%) | 4.07 |
| Total Families | 2,982 (100.0%) | 3.78 |
Median Household Size in Dorado
The median household size in Dorado is 2.97 persons per household, with single male/father households (233 | 5.2%) accounting for the largest median household size of 4.56 persons per household. non-family households (1,452 | 32.8%) represent the smallest median household size with 1.15 persons per household.
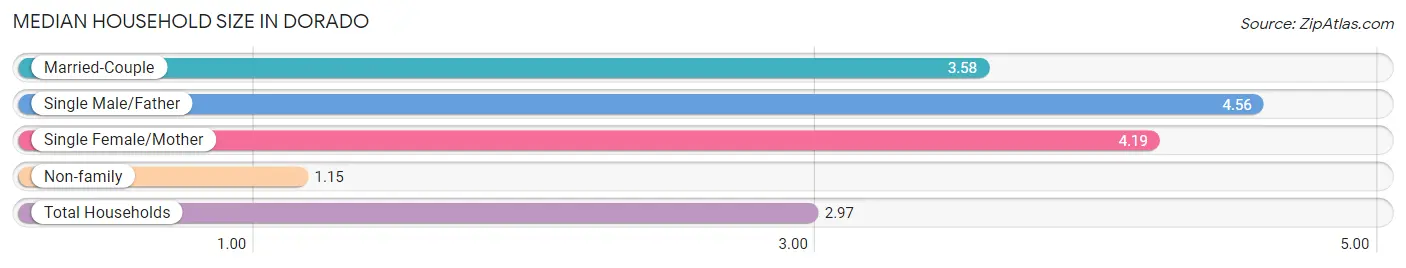
| Household Type | # Households | Household Size |
| Married-Couple | 1,780 (40.1%) | 3.58 |
| Single Male/Father | 233 (5.2%) | 4.56 |
| Single Female/Mother | 969 (21.8%) | 4.19 |
| Non-family | 1,452 (32.8%) | 1.15 |
| Total Households | 4,434 (100.0%) | 2.97 |
Household Size by Marriage Status in Dorado
Out of a total of 4,434 households in Dorado, 2,982 (67.2%) are family households, while 1,452 (32.8%) are nonfamily households. The most numerous type of family households are 2-person households, comprising 1,453, and the most common type of nonfamily households are 1-person households, comprising 1,277.
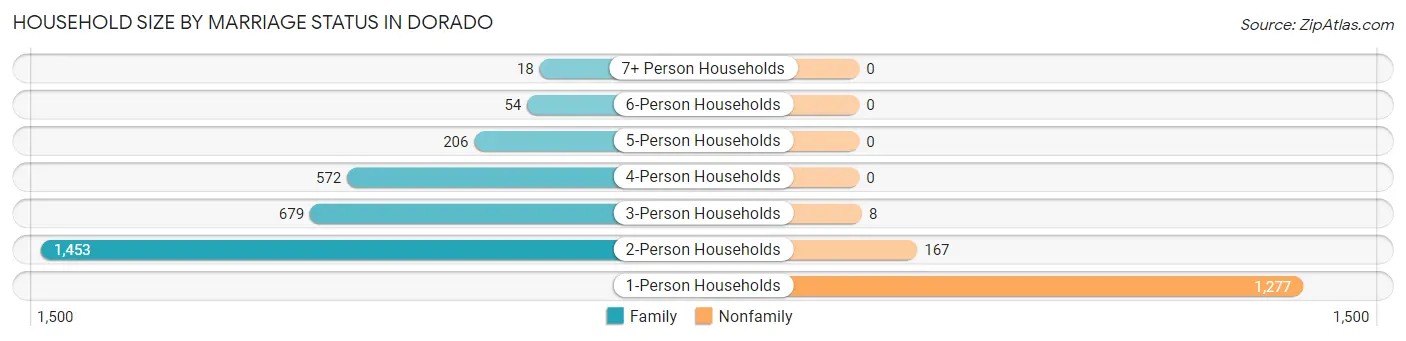
| Household Size | Family Households | Nonfamily Households |
| 1-Person Households | - | 1,277 (28.8%) |
| 2-Person Households | 1,453 (32.8%) | 167 (3.8%) |
| 3-Person Households | 679 (15.3%) | 8 (0.2%) |
| 4-Person Households | 572 (12.9%) | 0 (0.0%) |
| 5-Person Households | 206 (4.6%) | 0 (0.0%) |
| 6-Person Households | 54 (1.2%) | 0 (0.0%) |
| 7+ Person Households | 18 (0.4%) | 0 (0.0%) |
| Total | 2,982 (67.2%) | 1,452 (32.8%) |
Female Fertility in Dorado
Fertility by Age in Dorado
Average fertility rate in Dorado is 19.0 births per 1,000 women. Women in the age bracket of 35 to 50 years have the highest fertility rate with 36.0 births per 1,000 women. Women in the age bracket of 35 to 50 years acount for 100.0% of all women with births.
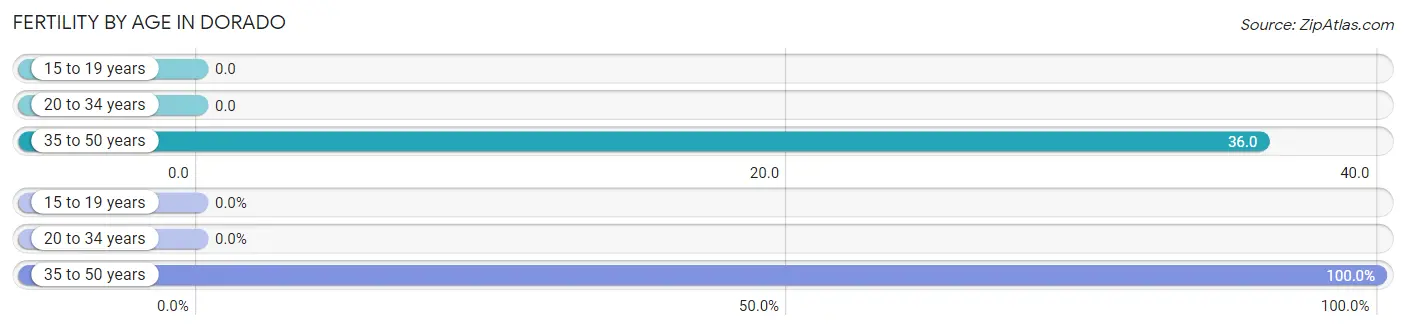
| Age Bracket | Women with Births | Births / 1,000 Women |
| 15 to 19 years | 0 (0.0%) | 0.0 |
| 20 to 34 years | 0 (0.0%) | 0.0 |
| 35 to 50 years | 62 (100.0%) | 36.0 |
| Total | 62 (100.0%) | 19.0 |
Fertility by Age by Marriage Status in Dorado
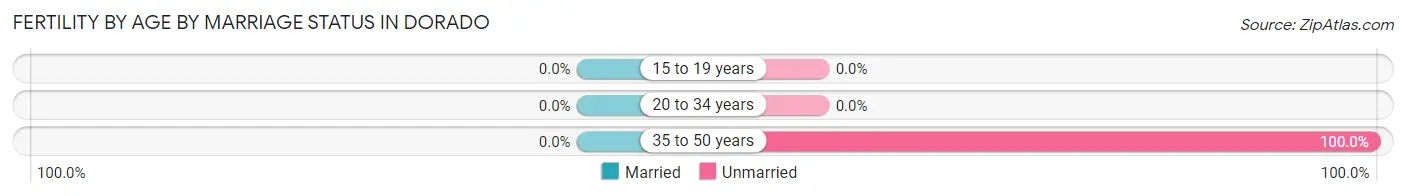
| Age Bracket | Married | Unmarried |
| 15 to 19 years | 0 (0.0%) | 0 (0.0%) |
| 20 to 34 years | 0 (0.0%) | 0 (0.0%) |
| 35 to 50 years | 0 (0.0%) | 62 (100.0%) |
| Total | 0 (0.0%) | 62 (100.0%) |
Fertility by Education in Dorado
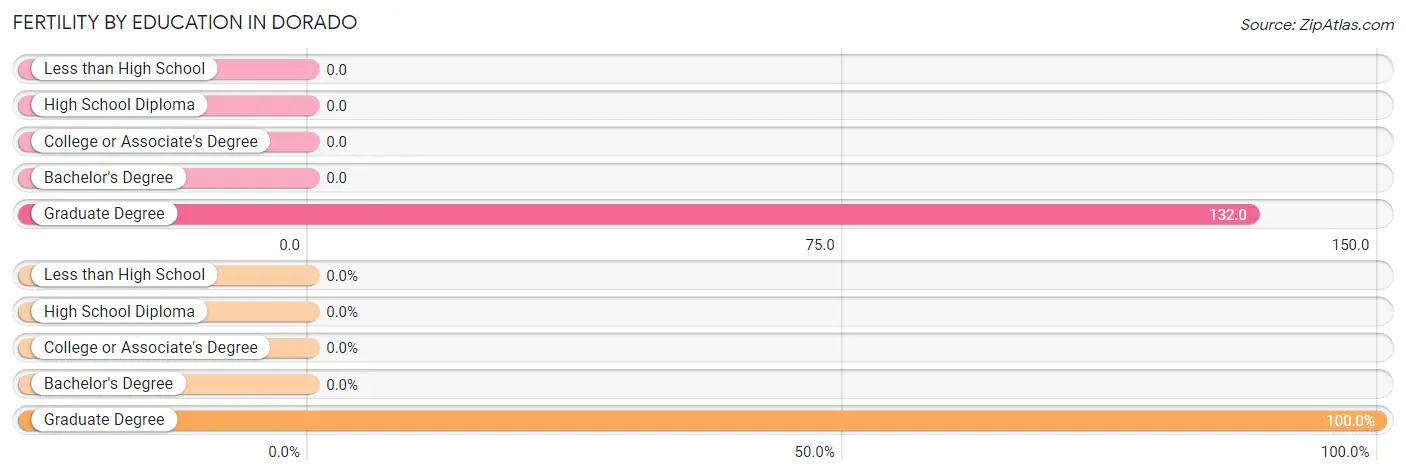
| Educational Attainment | Women with Births | Births / 1,000 Women |
| Less than High School | 0 (0.0%) | 0.0 |
| High School Diploma | 0 (0.0%) | 0.0 |
| College or Associate's Degree | 0 (0.0%) | 0.0 |
| Bachelor's Degree | 0 (0.0%) | 0.0 |
| Graduate Degree | 62 (100.0%) | 132.0 |
| Total | 62 (100.0%) | 19.0 |
Fertility by Education by Marriage Status in Dorado
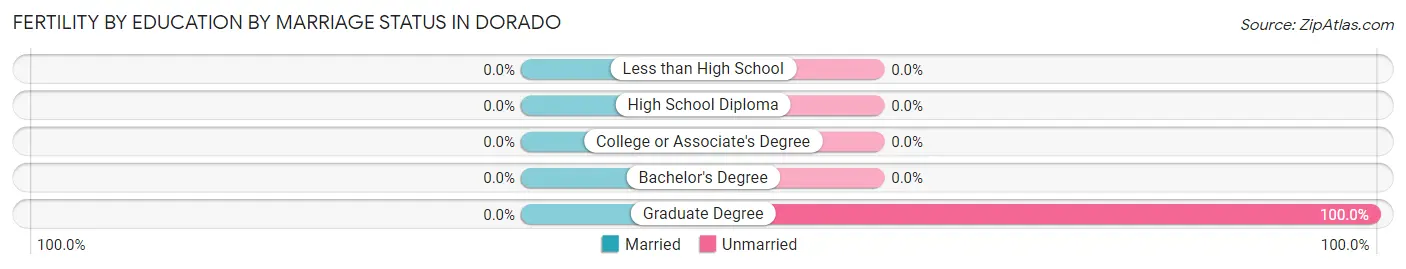
| Educational Attainment | Married | Unmarried |
| Less than High School | 0 (0.0%) | 0 (0.0%) |
| High School Diploma | 0 (0.0%) | 0 (0.0%) |
| College or Associate's Degree | 0 (0.0%) | 0 (0.0%) |
| Bachelor's Degree | 0 (0.0%) | 0 (0.0%) |
| Graduate Degree | 0 (0.0%) | 62 (100.0%) |
| Total | 0 (0.0%) | 62 (100.0%) |
Employment Characteristics in Dorado
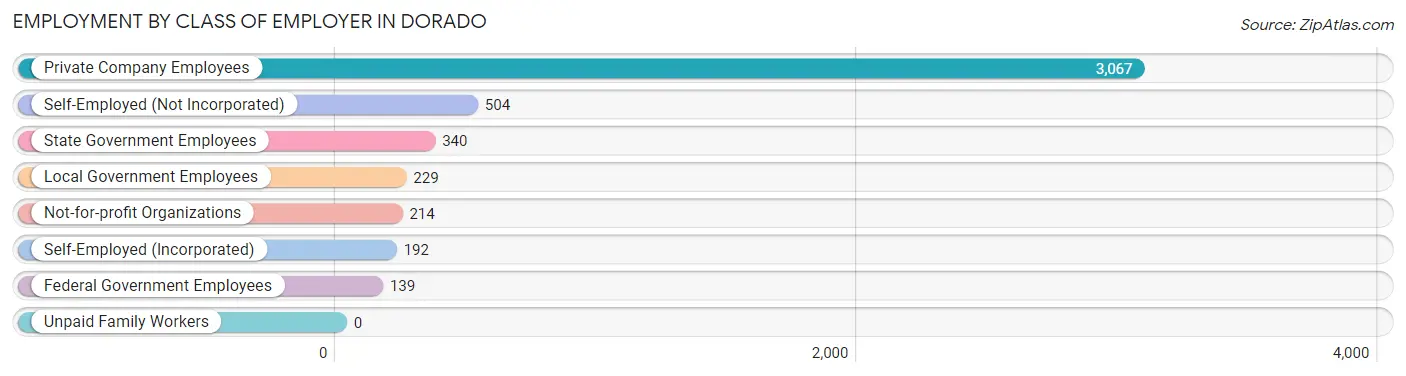
Employment by Class of Employer in Dorado
Among the 4,685 employed individuals in Dorado, private company employees (3,067 | 65.5%), self-employed (not incorporated) (504 | 10.8%), and state government employees (340 | 7.3%) make up the most common classes of employment.
| Employer Class | # Employees | % Employees |
| Private Company Employees | 3,067 | 65.5% |
| Self-Employed (Incorporated) | 192 | 4.1% |
| Self-Employed (Not Incorporated) | 504 | 10.8% |
| Not-for-profit Organizations | 214 | 4.6% |
| Local Government Employees | 229 | 4.9% |
| State Government Employees | 340 | 7.3% |
| Federal Government Employees | 139 | 3.0% |
| Unpaid Family Workers | 0 | 0.0% |
| Total | 4,685 | 100.0% |
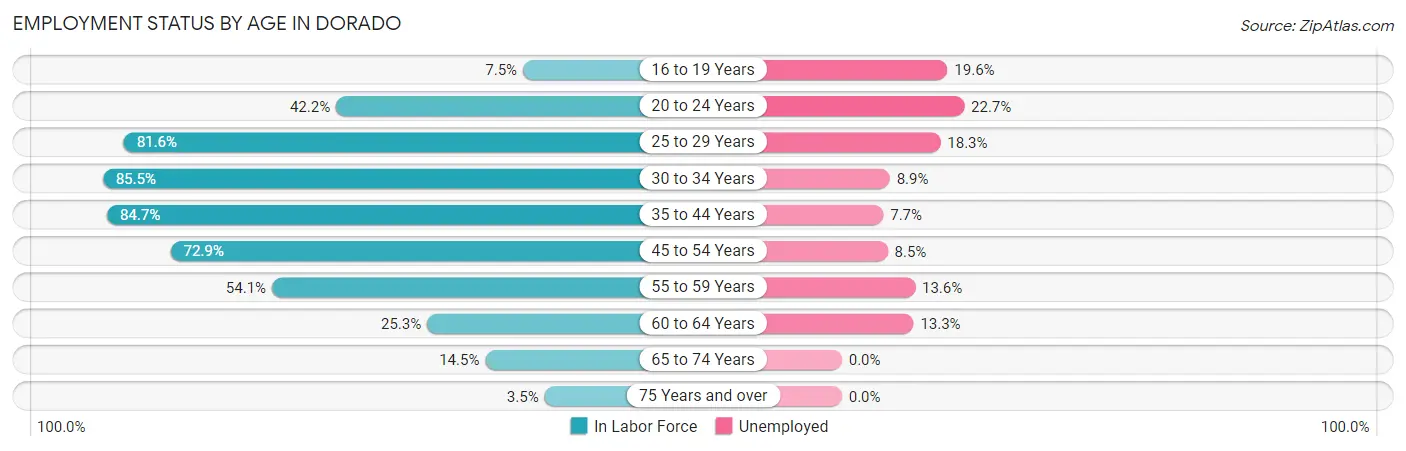
Employment Status by Age in Dorado
According to the labor force statistics for Dorado, out of the total population over 16 years of age (11,119), 47.7% or 5,304 individuals are in the labor force, with 10.9% or 578 of them unemployed. The age group with the highest labor force participation rate is 30 to 34 years, with 85.5% or 494 individuals in the labor force. Within the labor force, the 20 to 24 years age range has the highest percentage of unemployed individuals, with 22.7% or 94 of them being unemployed.
| Age Bracket | In Labor Force | Unemployed |
| 16 to 19 Years | 51 (7.5%) | 10 (19.6%) |
| 20 to 24 Years | 414 (42.2%) | 94 (22.7%) |
| 25 to 29 Years | 662 (81.6%) | 121 (18.3%) |
| 30 to 34 Years | 494 (85.5%) | 44 (8.9%) |
| 35 to 44 Years | 1,455 (84.7%) | 112 (7.7%) |
| 45 to 54 Years | 1,309 (72.9%) | 111 (8.5%) |
| 55 to 59 Years | 419 (54.1%) | 57 (13.6%) |
| 60 to 64 Years | 218 (25.3%) | 29 (13.3%) |
| 65 to 74 Years | 236 (14.5%) | 0 (0.0%) |
| 75 Years and over | 45 (3.5%) | 0 (0.0%) |
| Total | 5,304 (47.7%) | 578 (10.9%) |
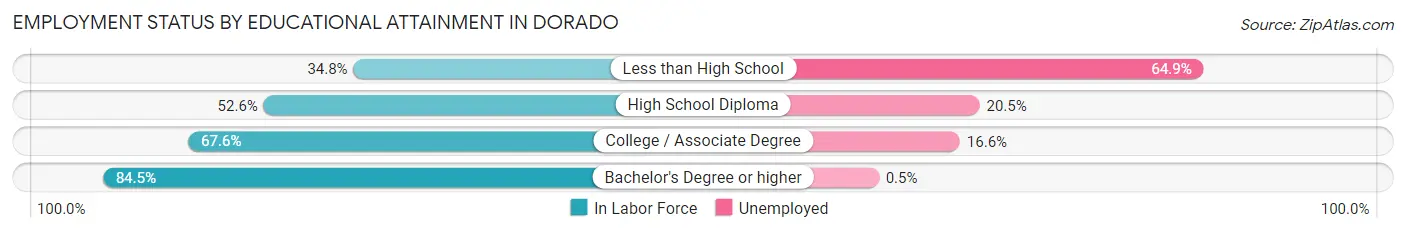
Employment Status by Educational Attainment in Dorado
According to labor force statistics for Dorado, 69.7% of individuals (4,556) out of the total population between 25 and 64 years of age (6,537) are in the labor force, with 10.4% or 474 of them being unemployed. The group with the highest labor force participation rate are those with the educational attainment of bachelor's degree or higher, with 84.5% or 2,404 individuals in the labor force. Within the labor force, individuals with less than high school education have the highest percentage of unemployment, with 64.9% or 100 of them being unemployed.
| Educational Attainment | In Labor Force | Unemployed |
| Less than High School | 154 (34.8%) | 288 (64.9%) |
| High School Diploma | 679 (52.6%) | 264 (20.5%) |
| College / Associate Degree | 1,324 (67.6%) | 325 (16.6%) |
| Bachelor's Degree or higher | 2,404 (84.5%) | 14 (0.5%) |
| Total | 4,556 (69.7%) | 680 (10.4%) |
Employment Occupations by Sex in Dorado
Management, Business, Science and Arts Occupations
The most common Management, Business, Science and Arts occupations in Dorado are Management (662 | 14.2%), Community & Social Service (538 | 11.5%), Computers, Engineering & Science (370 | 7.9%), Education Instruction & Library (325 | 7.0%), and Health Diagnosing & Treating (311 | 6.7%).
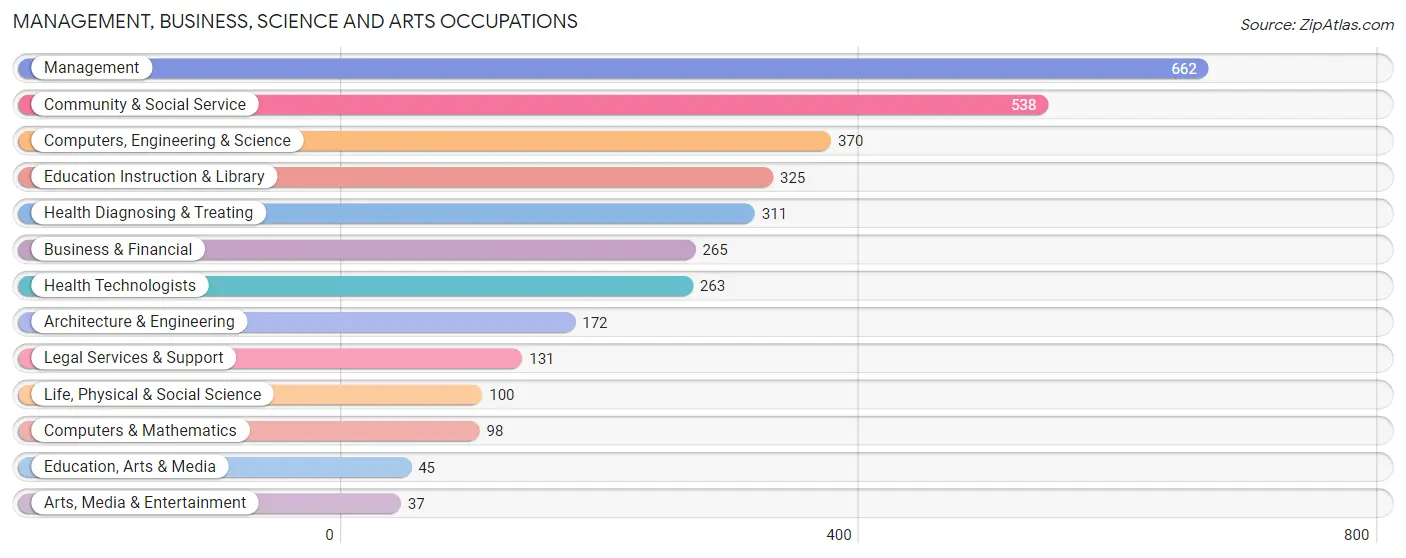
Management, Business, Science and Arts Occupations by Sex
Within the Management, Business, Science and Arts occupations in Dorado, the most male-oriented occupations are Architecture & Engineering (75.0%), Computers & Mathematics (72.5%), and Computers, Engineering & Science (67.6%), while the most female-oriented occupations are Education, Arts & Media (88.9%), Health Diagnosing & Treating (71.7%), and Education Instruction & Library (70.8%).
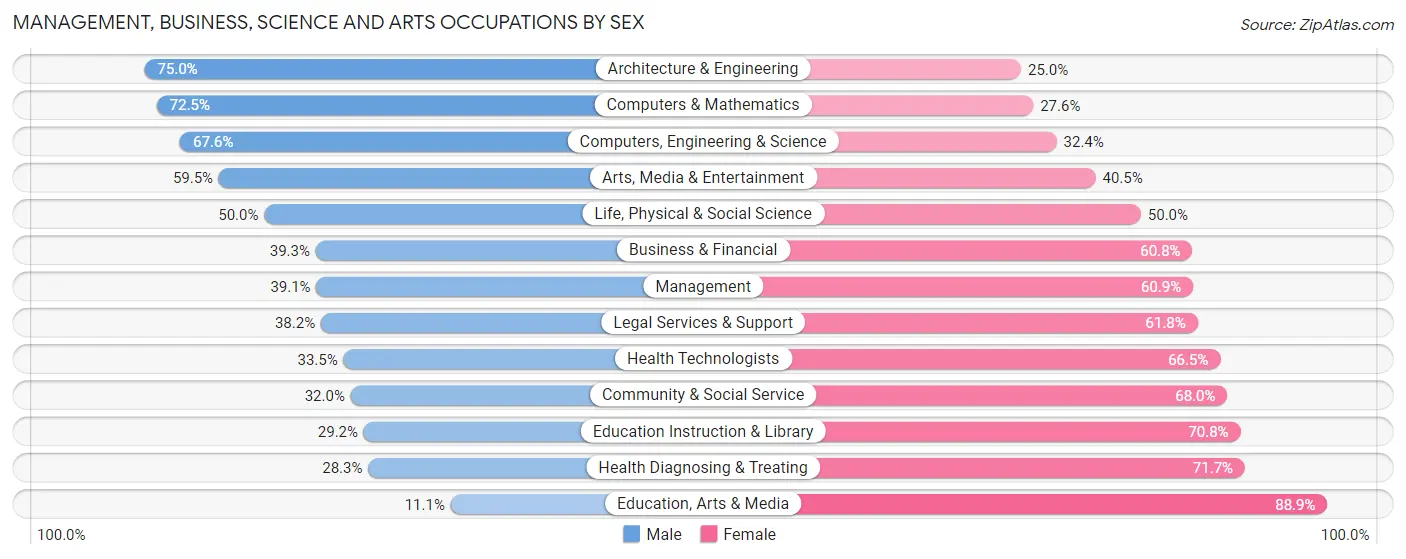
| Occupation | Male | Female |
| Management | 259 (39.1%) | 403 (60.9%) |
| Business & Financial | 104 (39.3%) | 161 (60.8%) |
| Computers, Engineering & Science | 250 (67.6%) | 120 (32.4%) |
| Computers & Mathematics | 71 (72.5%) | 27 (27.6%) |
| Architecture & Engineering | 129 (75.0%) | 43 (25.0%) |
| Life, Physical & Social Science | 50 (50.0%) | 50 (50.0%) |
| Community & Social Service | 172 (32.0%) | 366 (68.0%) |
| Education, Arts & Media | 5 (11.1%) | 40 (88.9%) |
| Legal Services & Support | 50 (38.2%) | 81 (61.8%) |
| Education Instruction & Library | 95 (29.2%) | 230 (70.8%) |
| Arts, Media & Entertainment | 22 (59.5%) | 15 (40.5%) |
| Health Diagnosing & Treating | 88 (28.3%) | 223 (71.7%) |
| Health Technologists | 88 (33.5%) | 175 (66.5%) |
| Total (Category) | 873 (40.7%) | 1,273 (59.3%) |
| Total (Overall) | 2,138 (45.8%) | 2,535 (54.2%) |
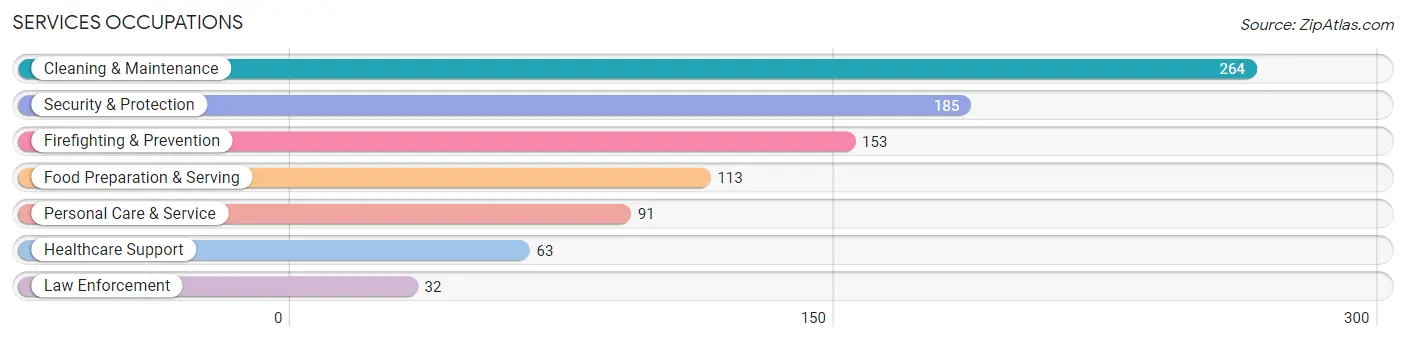
Services Occupations
The most common Services occupations in Dorado are Cleaning & Maintenance (264 | 5.7%), Security & Protection (185 | 4.0%), Firefighting & Prevention (153 | 3.3%), Food Preparation & Serving (113 | 2.4%), and Personal Care & Service (91 | 1.9%).
Services Occupations by Sex
Within the Services occupations in Dorado, the most male-oriented occupations are Law Enforcement (100.0%), Cleaning & Maintenance (84.1%), and Security & Protection (77.8%), while the most female-oriented occupations are Healthcare Support (100.0%), Personal Care & Service (90.1%), and Food Preparation & Serving (33.6%).
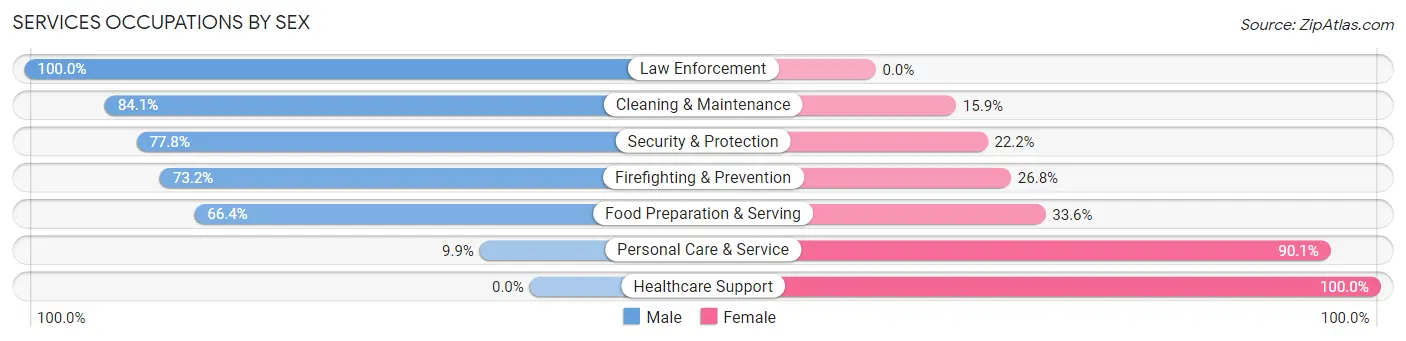
| Occupation | Male | Female |
| Healthcare Support | 0 (0.0%) | 63 (100.0%) |
| Security & Protection | 144 (77.8%) | 41 (22.2%) |
| Firefighting & Prevention | 112 (73.2%) | 41 (26.8%) |
| Law Enforcement | 32 (100.0%) | 0 (0.0%) |
| Food Preparation & Serving | 75 (66.4%) | 38 (33.6%) |
| Cleaning & Maintenance | 222 (84.1%) | 42 (15.9%) |
| Personal Care & Service | 9 (9.9%) | 82 (90.1%) |
| Total (Category) | 450 (62.8%) | 266 (37.1%) |
| Total (Overall) | 2,138 (45.8%) | 2,535 (54.2%) |
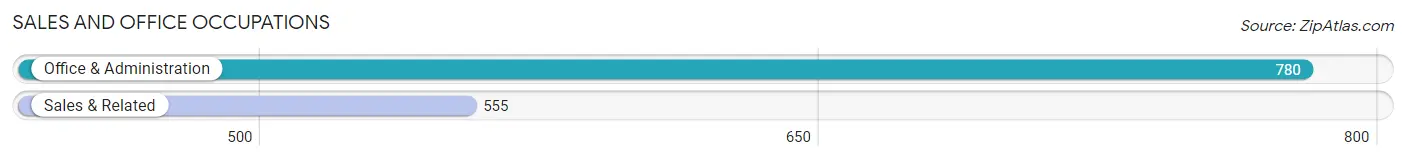
Sales and Office Occupations
The most common Sales and Office occupations in Dorado are Office & Administration (780 | 16.7%), and Sales & Related (555 | 11.9%).
Sales and Office Occupations by Sex
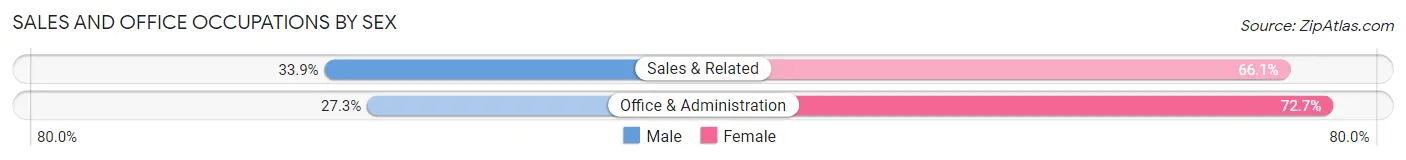
| Occupation | Male | Female |
| Sales & Related | 188 (33.9%) | 367 (66.1%) |
| Office & Administration | 213 (27.3%) | 567 (72.7%) |
| Total (Category) | 401 (30.0%) | 934 (70.0%) |
| Total (Overall) | 2,138 (45.8%) | 2,535 (54.2%) |
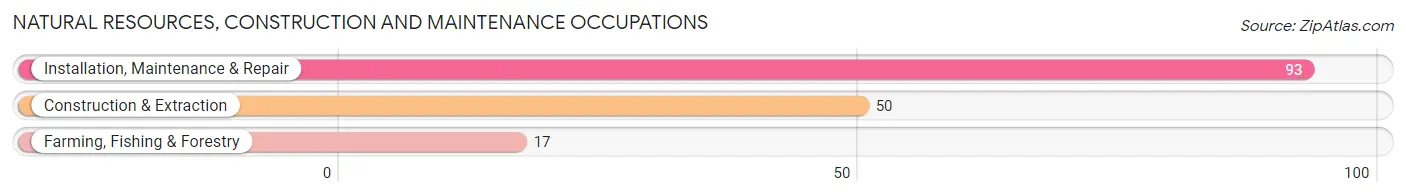
Natural Resources, Construction and Maintenance Occupations
The most common Natural Resources, Construction and Maintenance occupations in Dorado are Installation, Maintenance & Repair (93 | 2.0%), Construction & Extraction (50 | 1.1%), and Farming, Fishing & Forestry (17 | 0.4%).
Natural Resources, Construction and Maintenance Occupations by Sex
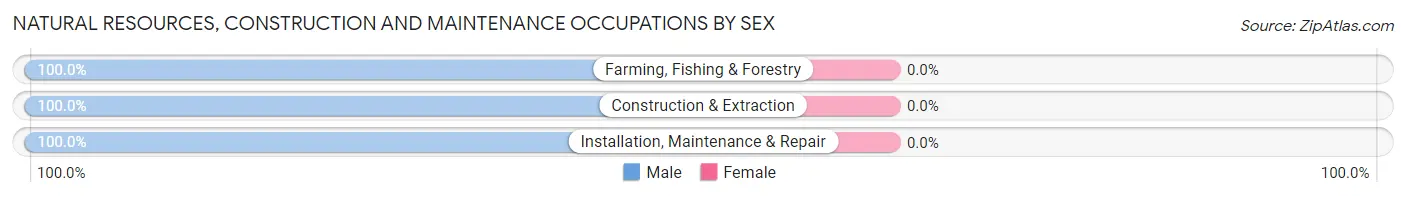
| Occupation | Male | Female |
| Farming, Fishing & Forestry | 17 (100.0%) | 0 (0.0%) |
| Construction & Extraction | 50 (100.0%) | 0 (0.0%) |
| Installation, Maintenance & Repair | 93 (100.0%) | 0 (0.0%) |
| Total (Category) | 160 (100.0%) | 0 (0.0%) |
| Total (Overall) | 2,138 (45.8%) | 2,535 (54.2%) |
Production, Transportation and Moving Occupations
The most common Production, Transportation and Moving occupations in Dorado are Production (259 | 5.5%), Material Moving (39 | 0.8%), and Transportation (18 | 0.4%).
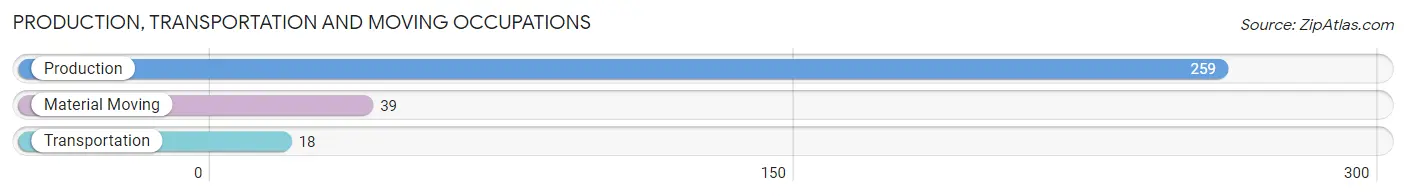
Production, Transportation and Moving Occupations by Sex
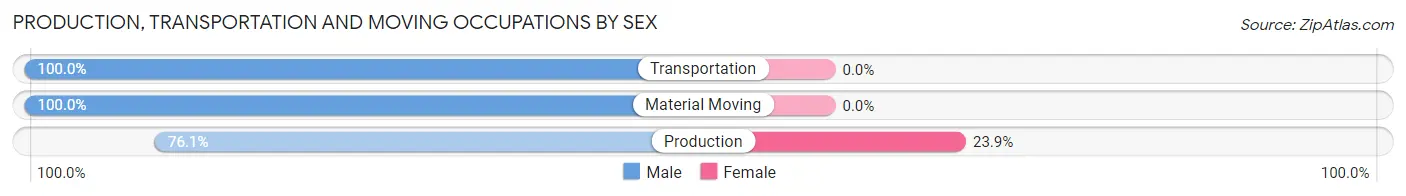
| Occupation | Male | Female |
| Production | 197 (76.1%) | 62 (23.9%) |
| Transportation | 18 (100.0%) | 0 (0.0%) |
| Material Moving | 39 (100.0%) | 0 (0.0%) |
| Total (Category) | 254 (80.4%) | 62 (19.6%) |
| Total (Overall) | 2,138 (45.8%) | 2,535 (54.2%) |
Employment Industries by Sex in Dorado
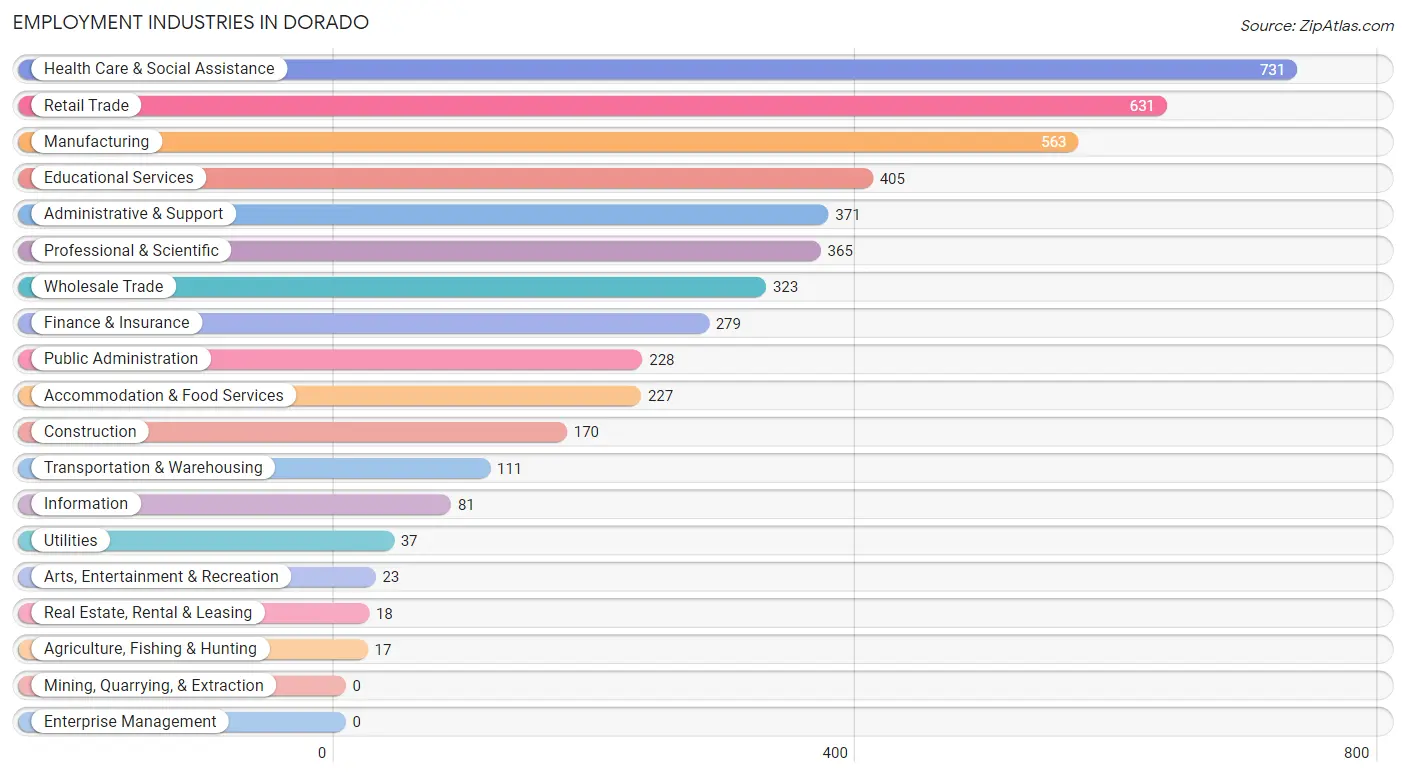
Employment Industries in Dorado
The major employment industries in Dorado include Health Care & Social Assistance (731 | 15.6%), Retail Trade (631 | 13.5%), Manufacturing (563 | 12.0%), Educational Services (405 | 8.7%), and Administrative & Support (371 | 7.9%).
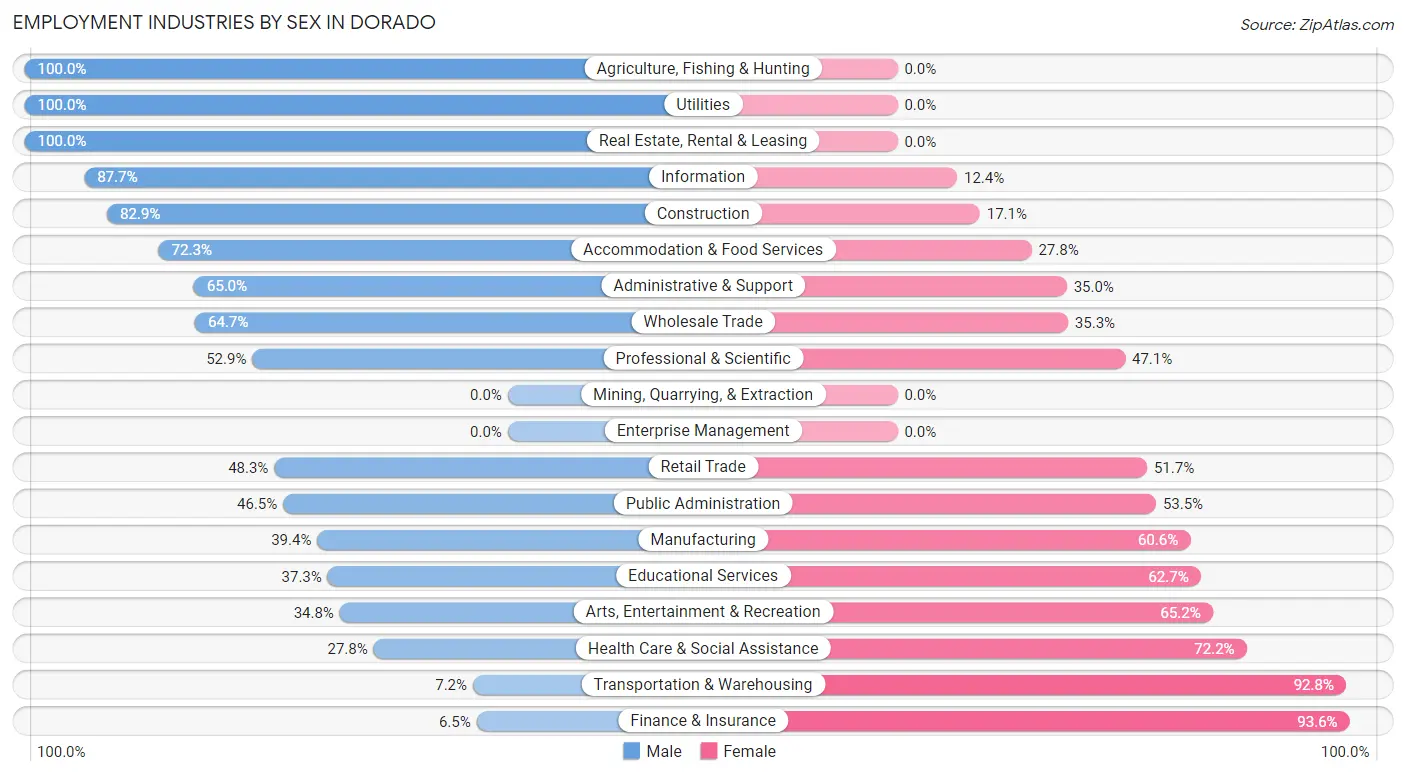
Employment Industries by Sex in Dorado
The Dorado industries that see more men than women are Agriculture, Fishing & Hunting (100.0%), Utilities (100.0%), and Real Estate, Rental & Leasing (100.0%), whereas the industries that tend to have a higher number of women are Finance & Insurance (93.5%), Transportation & Warehousing (92.8%), and Health Care & Social Assistance (72.2%).
| Industry | Male | Female |
| Agriculture, Fishing & Hunting | 17 (100.0%) | 0 (0.0%) |
| Mining, Quarrying, & Extraction | 0 (0.0%) | 0 (0.0%) |
| Construction | 141 (82.9%) | 29 (17.1%) |
| Manufacturing | 222 (39.4%) | 341 (60.6%) |
| Wholesale Trade | 209 (64.7%) | 114 (35.3%) |
| Retail Trade | 305 (48.3%) | 326 (51.7%) |
| Transportation & Warehousing | 8 (7.2%) | 103 (92.8%) |
| Utilities | 37 (100.0%) | 0 (0.0%) |
| Information | 71 (87.6%) | 10 (12.3%) |
| Finance & Insurance | 18 (6.5%) | 261 (93.5%) |
| Real Estate, Rental & Leasing | 18 (100.0%) | 0 (0.0%) |
| Professional & Scientific | 193 (52.9%) | 172 (47.1%) |
| Enterprise Management | 0 (0.0%) | 0 (0.0%) |
| Administrative & Support | 241 (65.0%) | 130 (35.0%) |
| Educational Services | 151 (37.3%) | 254 (62.7%) |
| Health Care & Social Assistance | 203 (27.8%) | 528 (72.2%) |
| Arts, Entertainment & Recreation | 8 (34.8%) | 15 (65.2%) |
| Accommodation & Food Services | 164 (72.3%) | 63 (27.8%) |
| Public Administration | 106 (46.5%) | 122 (53.5%) |
| Total | 2,138 (45.8%) | 2,535 (54.2%) |
Education in Dorado
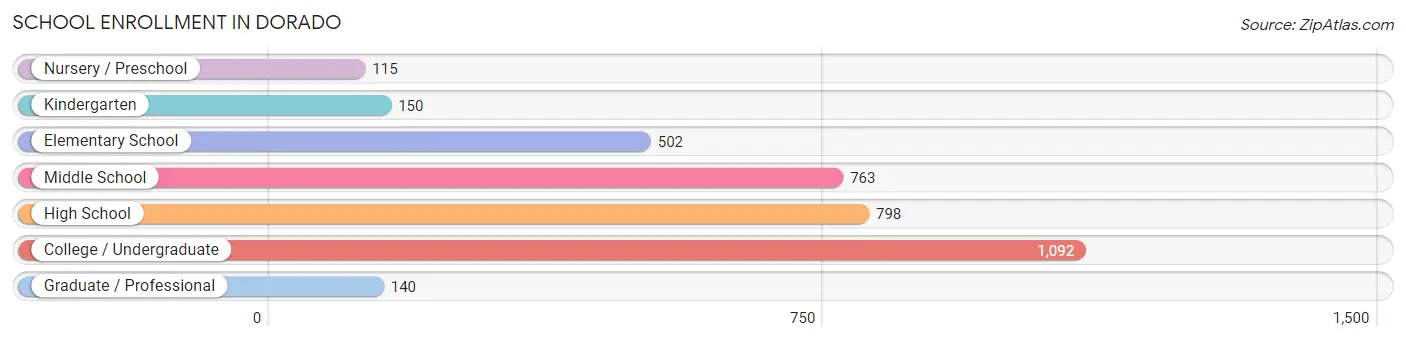
School Enrollment in Dorado
The most common levels of schooling among the 3,560 students in Dorado are college / undergraduate (1,092 | 30.7%), high school (798 | 22.4%), and middle school (763 | 21.4%).
| School Level | # Students | % Students |
| Nursery / Preschool | 115 | 3.2% |
| Kindergarten | 150 | 4.2% |
| Elementary School | 502 | 14.1% |
| Middle School | 763 | 21.4% |
| High School | 798 | 22.4% |
| College / Undergraduate | 1,092 | 30.7% |
| Graduate / Professional | 140 | 3.9% |
| Total | 3,560 | 100.0% |
School Enrollment by Age by Funding Source in Dorado
Out of a total of 3,560 students who are enrolled in schools in Dorado, 2,157 (60.6%) attend a private institution, while the remaining 1,403 (39.4%) are enrolled in public schools. The age group of 35 years and over has the highest likelihood of being enrolled in private schools, with 171 (88.6% in the age bracket) enrolled. Conversely, the age group of 20 to 24 year olds has the lowest likelihood of being enrolled in a private school, with 396 (63.3% in the age bracket) attending a public institution.
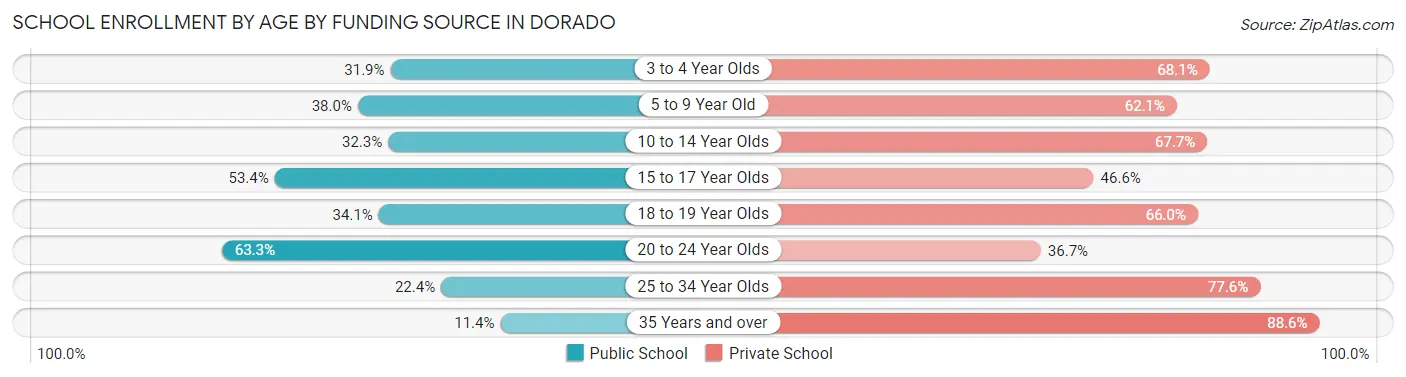
| Age Bracket | Public School | Private School |
| 3 to 4 Year Olds | 58 (31.9%) | 124 (68.1%) |
| 5 to 9 Year Old | 222 (38.0%) | 363 (62.1%) |
| 10 to 14 Year Olds | 324 (32.3%) | 679 (67.7%) |
| 15 to 17 Year Olds | 233 (53.4%) | 203 (46.6%) |
| 18 to 19 Year Olds | 79 (34.1%) | 153 (65.9%) |
| 20 to 24 Year Olds | 396 (63.3%) | 230 (36.7%) |
| 25 to 34 Year Olds | 68 (22.4%) | 235 (77.6%) |
| 35 Years and over | 22 (11.4%) | 171 (88.6%) |
| Total | 1,403 (39.4%) | 2,157 (60.6%) |
Educational Attainment by Field of Study in Dorado
Business (1,127 | 28.4%), education (618 | 15.6%), science & technology (480 | 12.1%), engineering (322 | 8.1%), and social sciences (254 | 6.4%) are the most common fields of study among 3,967 individuals in Dorado who have obtained a bachelor's degree or higher.
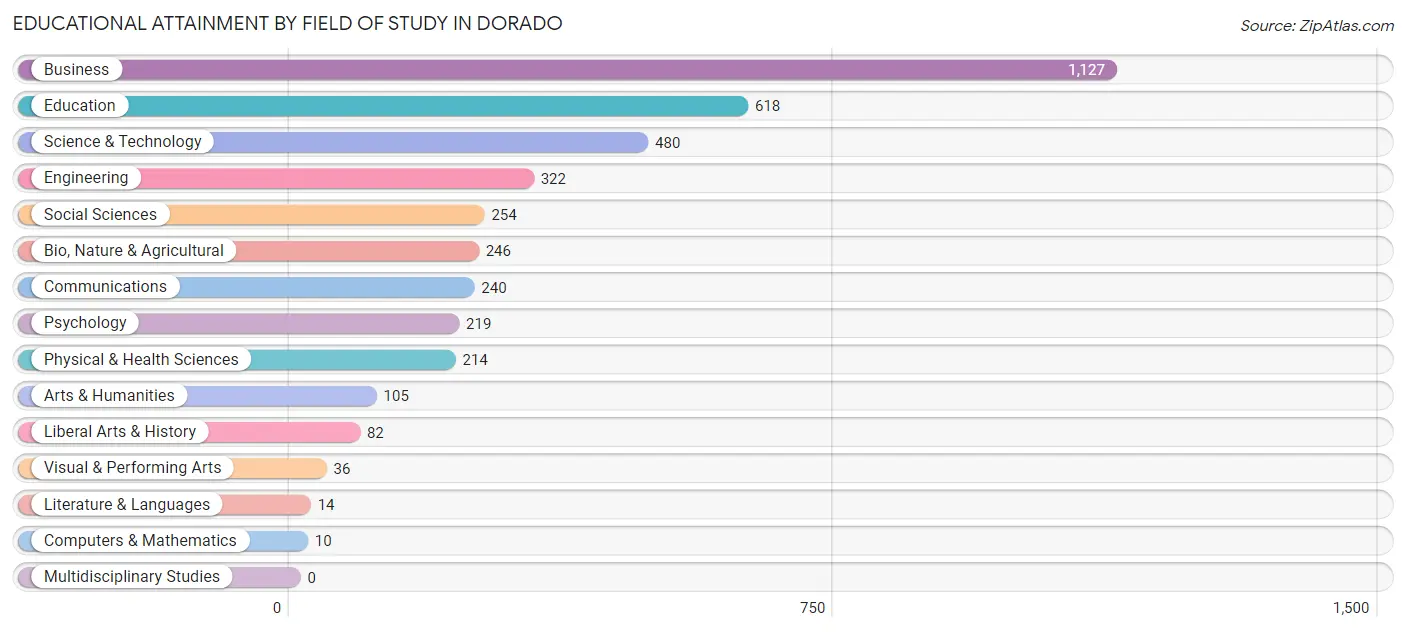
| Field of Study | # Graduates | % Graduates |
| Computers & Mathematics | 10 | 0.3% |
| Bio, Nature & Agricultural | 246 | 6.2% |
| Physical & Health Sciences | 214 | 5.4% |
| Psychology | 219 | 5.5% |
| Social Sciences | 254 | 6.4% |
| Engineering | 322 | 8.1% |
| Multidisciplinary Studies | 0 | 0.0% |
| Science & Technology | 480 | 12.1% |
| Business | 1,127 | 28.4% |
| Education | 618 | 15.6% |
| Literature & Languages | 14 | 0.4% |
| Liberal Arts & History | 82 | 2.1% |
| Visual & Performing Arts | 36 | 0.9% |
| Communications | 240 | 6.0% |
| Arts & Humanities | 105 | 2.6% |
| Total | 3,967 | 100.0% |
Transportation & Commute in Dorado
Vehicle Availability by Sex in Dorado
The most prevalent vehicle ownership categories in Dorado are males with 2 vehicles (955, accounting for 43.7%) and females with 2 vehicles (1,077, making up 38.2%).
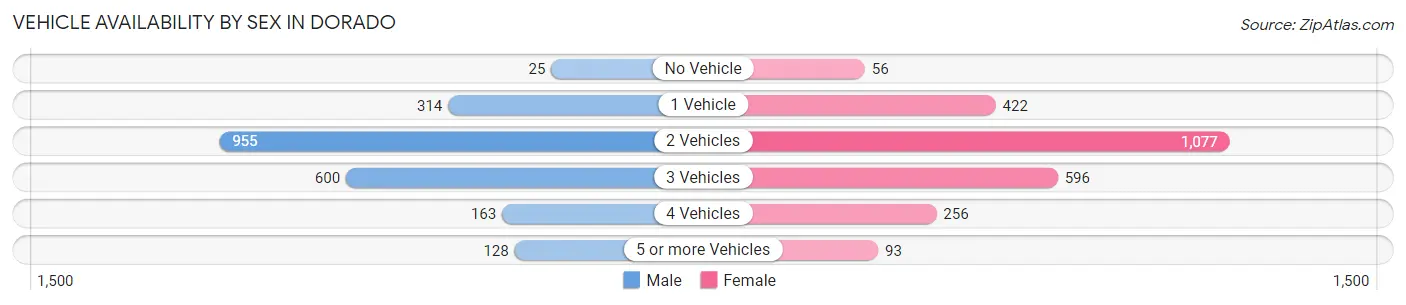
| Vehicles Available | Male | Female |
| No Vehicle | 25 (1.1%) | 56 (2.2%) |
| 1 Vehicle | 314 (14.4%) | 422 (16.9%) |
| 2 Vehicles | 955 (43.7%) | 1,077 (43.1%) |
| 3 Vehicles | 600 (27.5%) | 596 (23.8%) |
| 4 Vehicles | 163 (7.5%) | 256 (10.2%) |
| 5 or more Vehicles | 128 (5.9%) | 93 (3.7%) |
| Total | 2,185 (100.0%) | 2,500 (100.0%) |
Commute Time in Dorado
The most frequently occuring commute durations in Dorado are 30 to 34 minutes (1,116 commuters, 25.8%), 45 to 59 minutes (648 commuters, 15.0%), and 10 to 14 minutes (521 commuters, 12.0%).
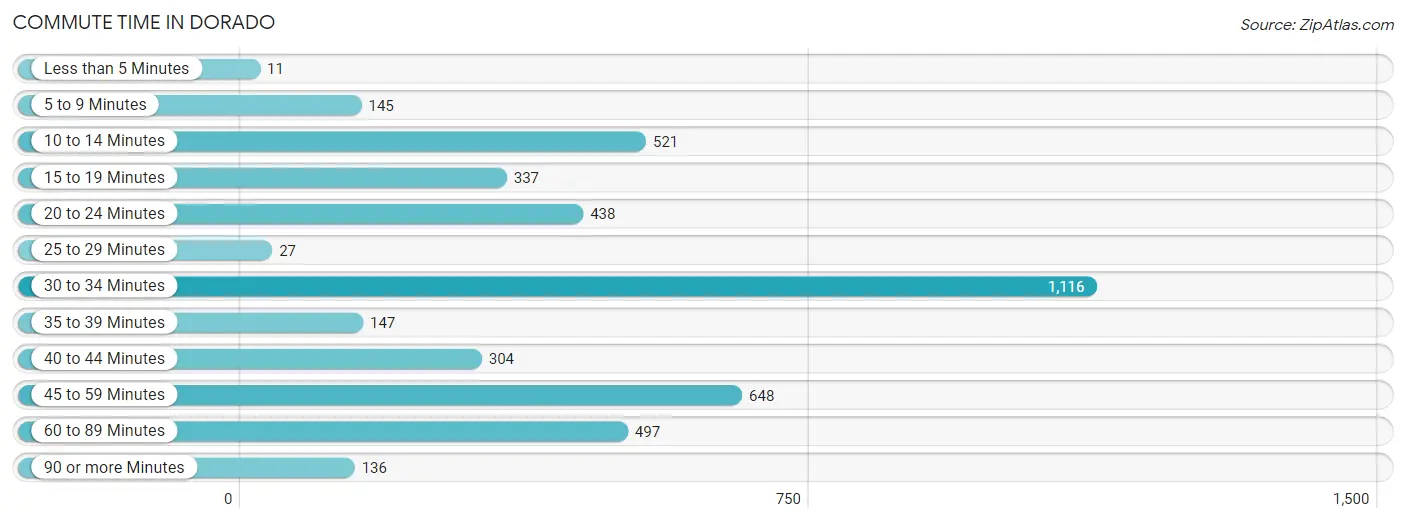
| Commute Time | # Commuters | % Commuters |
| Less than 5 Minutes | 11 | 0.3% |
| 5 to 9 Minutes | 145 | 3.4% |
| 10 to 14 Minutes | 521 | 12.0% |
| 15 to 19 Minutes | 337 | 7.8% |
| 20 to 24 Minutes | 438 | 10.1% |
| 25 to 29 Minutes | 27 | 0.6% |
| 30 to 34 Minutes | 1,116 | 25.8% |
| 35 to 39 Minutes | 147 | 3.4% |
| 40 to 44 Minutes | 304 | 7.0% |
| 45 to 59 Minutes | 648 | 15.0% |
| 60 to 89 Minutes | 497 | 11.5% |
| 90 or more Minutes | 136 | 3.1% |
Commute Time by Sex in Dorado
The most common commute times in Dorado are 30 to 34 minutes (565 commuters, 28.0%) for males and 30 to 34 minutes (551 commuters, 23.9%) for females.
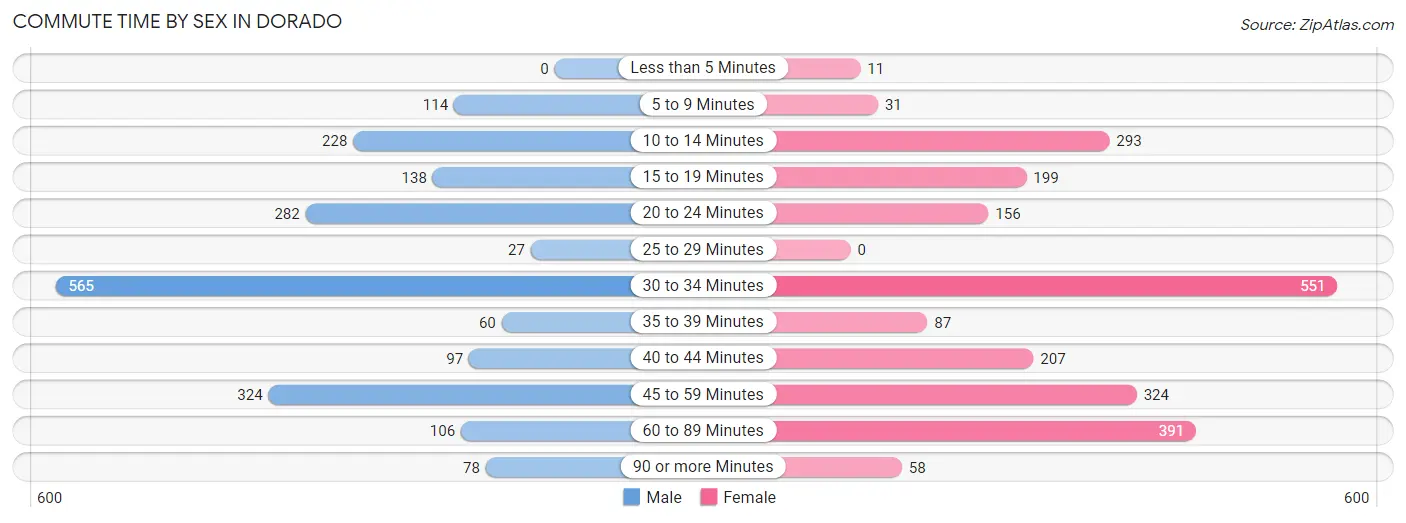
| Commute Time | Male | Female |
| Less than 5 Minutes | 0 (0.0%) | 11 (0.5%) |
| 5 to 9 Minutes | 114 (5.7%) | 31 (1.3%) |
| 10 to 14 Minutes | 228 (11.3%) | 293 (12.7%) |
| 15 to 19 Minutes | 138 (6.8%) | 199 (8.6%) |
| 20 to 24 Minutes | 282 (14.0%) | 156 (6.8%) |
| 25 to 29 Minutes | 27 (1.3%) | 0 (0.0%) |
| 30 to 34 Minutes | 565 (28.0%) | 551 (23.9%) |
| 35 to 39 Minutes | 60 (3.0%) | 87 (3.8%) |
| 40 to 44 Minutes | 97 (4.8%) | 207 (9.0%) |
| 45 to 59 Minutes | 324 (16.1%) | 324 (14.0%) |
| 60 to 89 Minutes | 106 (5.2%) | 391 (16.9%) |
| 90 or more Minutes | 78 (3.9%) | 58 (2.5%) |
Time of Departure to Work by Sex in Dorado
The most frequent times of departure to work in Dorado are 6:30 AM to 6:59 AM (274, 13.6%) for males and 7:00 AM to 7:29 AM (454, 19.7%) for females.
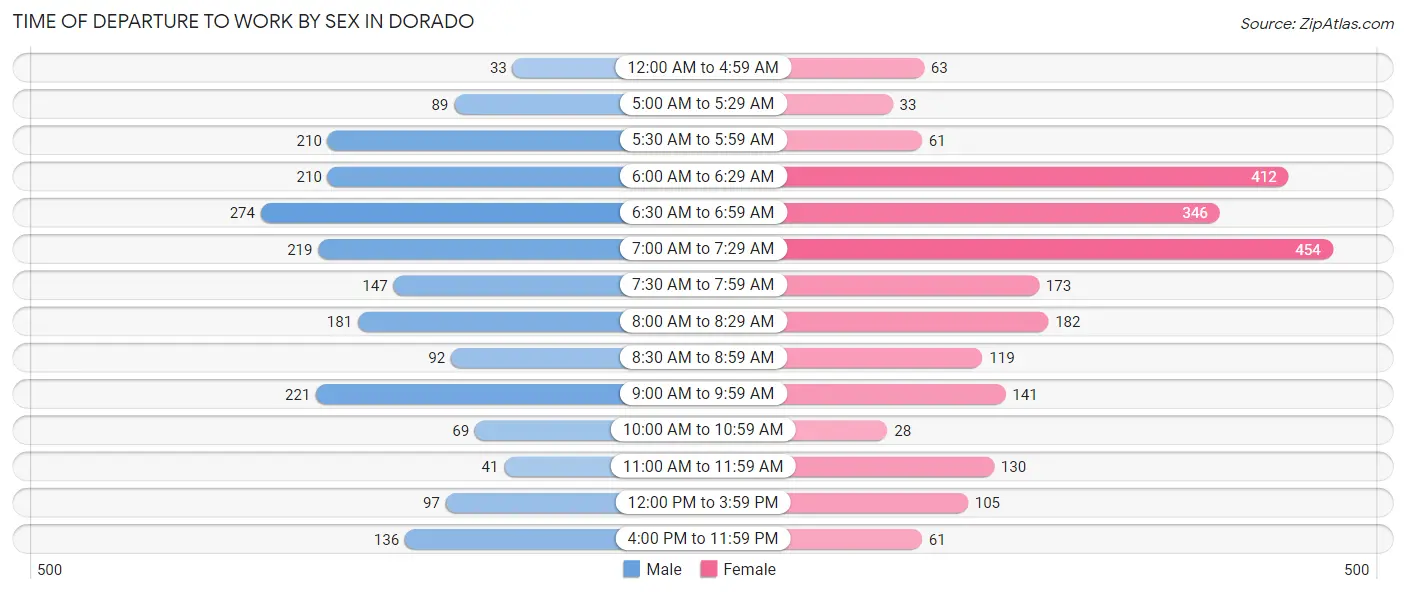
| Time of Departure | Male | Female |
| 12:00 AM to 4:59 AM | 33 (1.6%) | 63 (2.7%) |
| 5:00 AM to 5:29 AM | 89 (4.4%) | 33 (1.4%) |
| 5:30 AM to 5:59 AM | 210 (10.4%) | 61 (2.6%) |
| 6:00 AM to 6:29 AM | 210 (10.4%) | 412 (17.8%) |
| 6:30 AM to 6:59 AM | 274 (13.6%) | 346 (15.0%) |
| 7:00 AM to 7:29 AM | 219 (10.8%) | 454 (19.7%) |
| 7:30 AM to 7:59 AM | 147 (7.3%) | 173 (7.5%) |
| 8:00 AM to 8:29 AM | 181 (9.0%) | 182 (7.9%) |
| 8:30 AM to 8:59 AM | 92 (4.6%) | 119 (5.2%) |
| 9:00 AM to 9:59 AM | 221 (11.0%) | 141 (6.1%) |
| 10:00 AM to 10:59 AM | 69 (3.4%) | 28 (1.2%) |
| 11:00 AM to 11:59 AM | 41 (2.0%) | 130 (5.6%) |
| 12:00 PM to 3:59 PM | 97 (4.8%) | 105 (4.5%) |
| 4:00 PM to 11:59 PM | 136 (6.7%) | 61 (2.6%) |
| Total | 2,019 (100.0%) | 2,308 (100.0%) |
Housing Occupancy in Dorado
Occupancy by Ownership in Dorado
Of the total 4,434 dwellings in Dorado, owner-occupied units account for 3,302 (74.5%), while renter-occupied units make up 1,132 (25.5%).
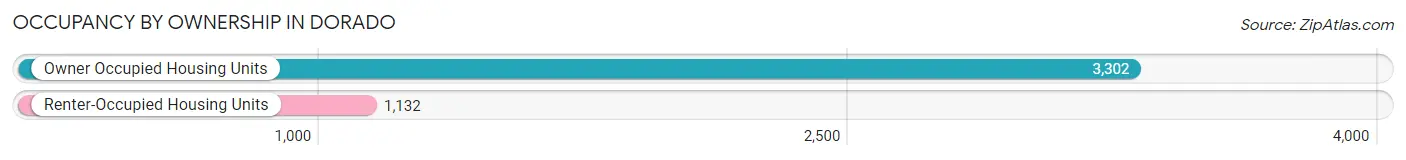
| Occupancy | # Housing Units | % Housing Units |
| Owner Occupied Housing Units | 3,302 | 74.5% |
| Renter-Occupied Housing Units | 1,132 | 25.5% |
| Total Occupied Housing Units | 4,434 | 100.0% |
Occupancy by Household Size in Dorado
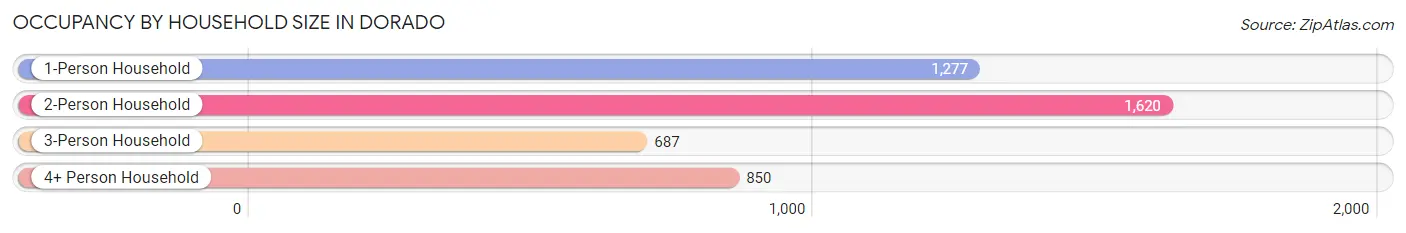
| Household Size | # Housing Units | % Housing Units |
| 1-Person Household | 1,277 | 28.8% |
| 2-Person Household | 1,620 | 36.5% |
| 3-Person Household | 687 | 15.5% |
| 4+ Person Household | 850 | 19.2% |
| Total Housing Units | 4,434 | 100.0% |
Occupancy by Ownership by Household Size in Dorado
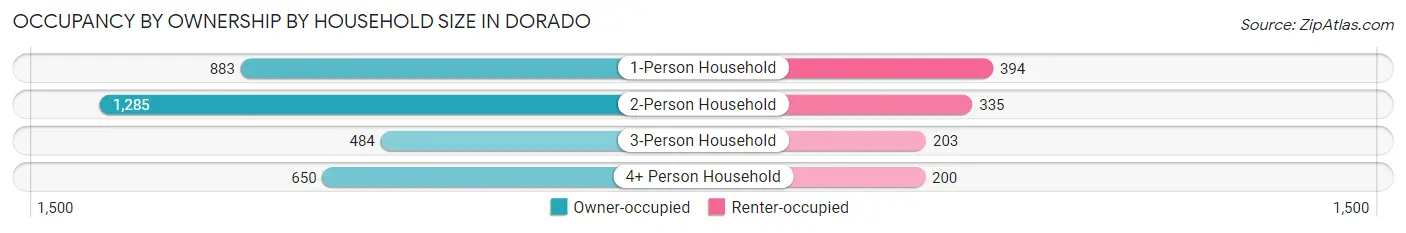
| Household Size | Owner-occupied | Renter-occupied |
| 1-Person Household | 883 (69.2%) | 394 (30.8%) |
| 2-Person Household | 1,285 (79.3%) | 335 (20.7%) |
| 3-Person Household | 484 (70.5%) | 203 (29.5%) |
| 4+ Person Household | 650 (76.5%) | 200 (23.5%) |
| Total Housing Units | 3,302 (74.5%) | 1,132 (25.5%) |
Occupancy by Educational Attainment in Dorado
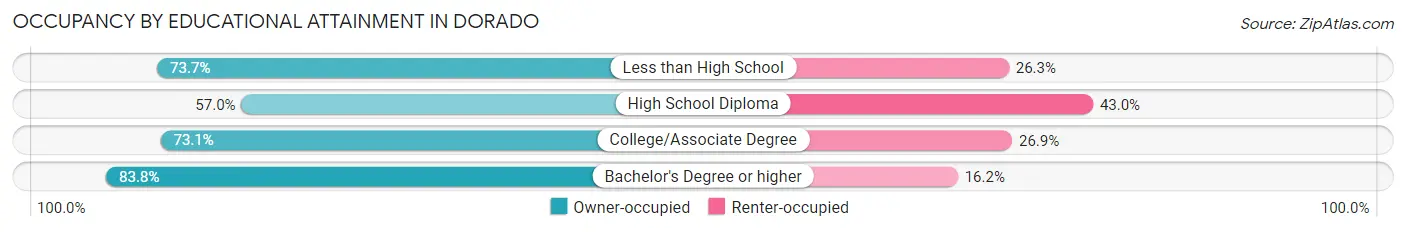
| Household Size | Owner-occupied | Renter-occupied |
| Less than High School | 485 (73.7%) | 173 (26.3%) |
| High School Diploma | 532 (57.0%) | 401 (43.0%) |
| College/Associate Degree | 667 (73.1%) | 246 (26.9%) |
| Bachelor's Degree or higher | 1,618 (83.8%) | 312 (16.2%) |
Occupancy by Age of Householder in Dorado
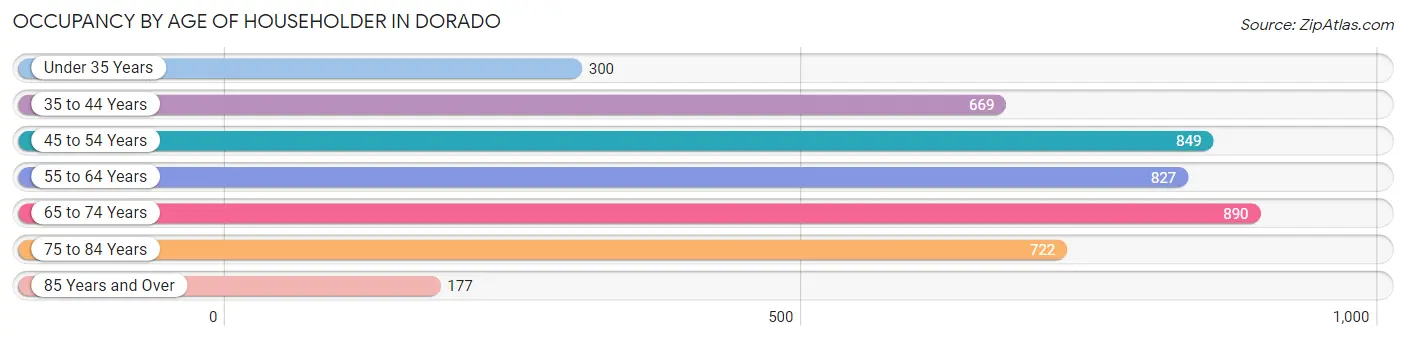
| Age Bracket | # Households | % Households |
| Under 35 Years | 300 | 6.8% |
| 35 to 44 Years | 669 | 15.1% |
| 45 to 54 Years | 849 | 19.2% |
| 55 to 64 Years | 827 | 18.6% |
| 65 to 74 Years | 890 | 20.1% |
| 75 to 84 Years | 722 | 16.3% |
| 85 Years and Over | 177 | 4.0% |
| Total | 4,434 | 100.0% |
Housing Finances in Dorado
Median Income by Occupancy in Dorado
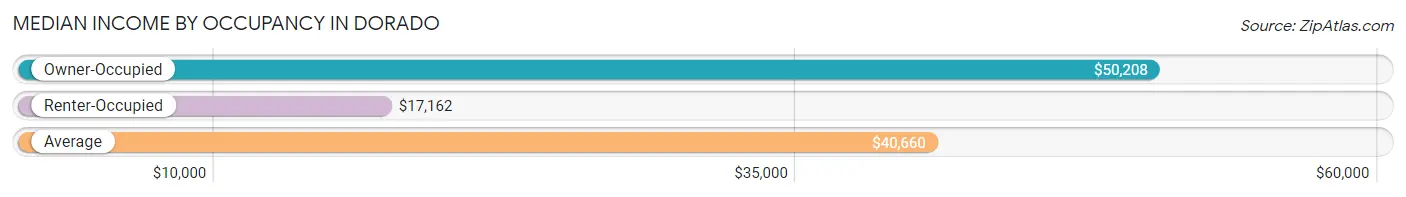
| Occupancy Type | # Households | Median Income |
| Owner-Occupied | 3,302 (74.5%) | $50,208 |
| Renter-Occupied | 1,132 (25.5%) | $17,162 |
| Average | 4,434 (100.0%) | $40,660 |
Occupancy by Householder Income Bracket in Dorado
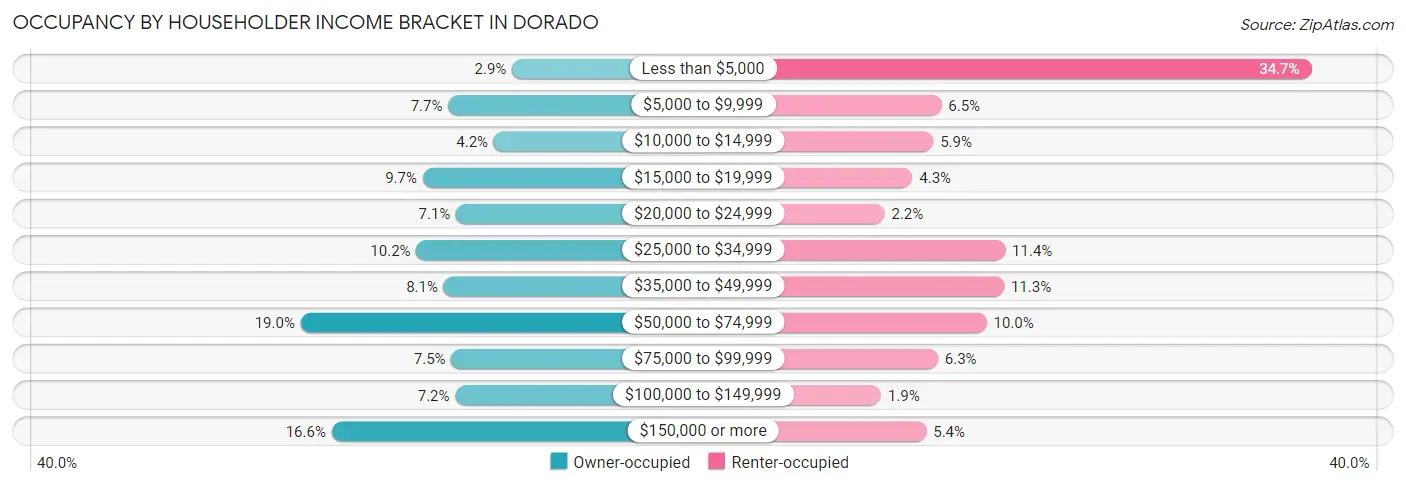
| Income Bracket | Owner-occupied | Renter-occupied |
| Less than $5,000 | 94 (2.9%) | 393 (34.7%) |
| $5,000 to $9,999 | 255 (7.7%) | 74 (6.5%) |
| $10,000 to $14,999 | 140 (4.2%) | 67 (5.9%) |
| $15,000 to $19,999 | 319 (9.7%) | 49 (4.3%) |
| $20,000 to $24,999 | 235 (7.1%) | 25 (2.2%) |
| $25,000 to $34,999 | 335 (10.2%) | 129 (11.4%) |
| $35,000 to $49,999 | 266 (8.1%) | 128 (11.3%) |
| $50,000 to $74,999 | 626 (19.0%) | 113 (10.0%) |
| $75,000 to $99,999 | 247 (7.5%) | 71 (6.3%) |
| $100,000 to $149,999 | 237 (7.2%) | 22 (1.9%) |
| $150,000 or more | 548 (16.6%) | 61 (5.4%) |
| Total | 3,302 (100.0%) | 1,132 (100.0%) |
Monthly Housing Cost Tiers in Dorado
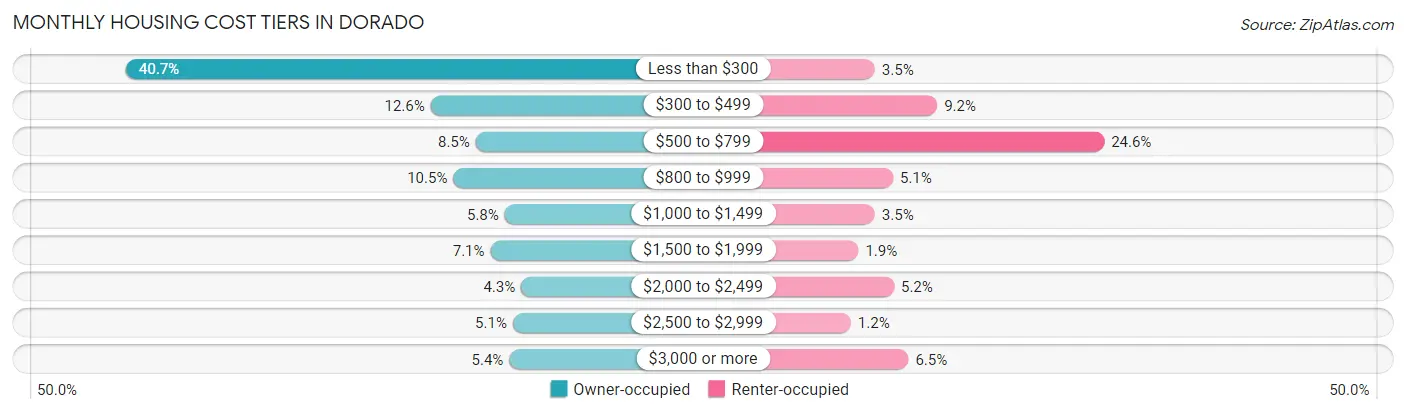
| Monthly Cost | Owner-occupied | Renter-occupied |
| Less than $300 | 1,343 (40.7%) | 39 (3.5%) |
| $300 to $499 | 417 (12.6%) | 104 (9.2%) |
| $500 to $799 | 280 (8.5%) | 278 (24.6%) |
| $800 to $999 | 348 (10.5%) | 58 (5.1%) |
| $1,000 to $1,499 | 192 (5.8%) | 39 (3.5%) |
| $1,500 to $1,999 | 235 (7.1%) | 22 (1.9%) |
| $2,000 to $2,499 | 142 (4.3%) | 59 (5.2%) |
| $2,500 to $2,999 | 167 (5.1%) | 14 (1.2%) |
| $3,000 or more | 178 (5.4%) | 74 (6.5%) |
| Total | 3,302 (100.0%) | 1,132 (100.0%) |
Physical Housing Characteristics in Dorado
Housing Structures in Dorado
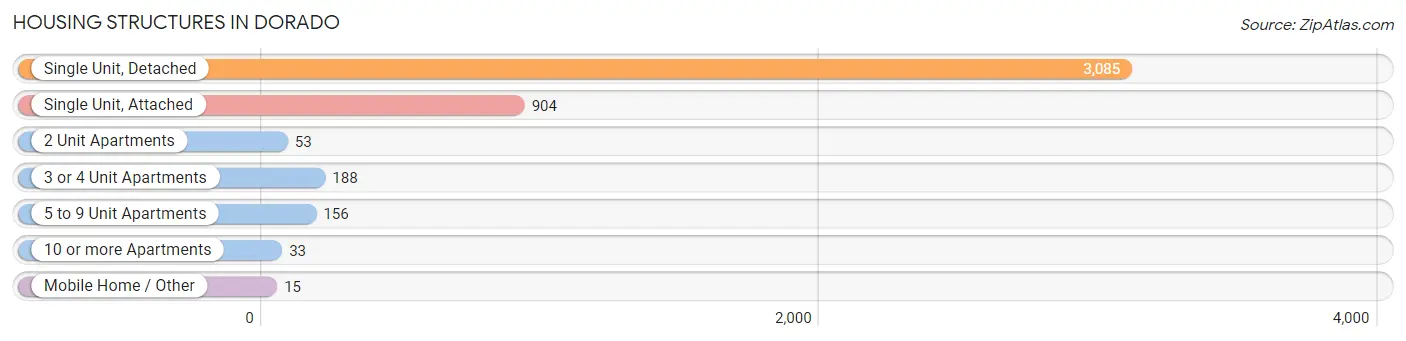
| Structure Type | # Housing Units | % Housing Units |
| Single Unit, Detached | 3,085 | 69.6% |
| Single Unit, Attached | 904 | 20.4% |
| 2 Unit Apartments | 53 | 1.2% |
| 3 or 4 Unit Apartments | 188 | 4.2% |
| 5 to 9 Unit Apartments | 156 | 3.5% |
| 10 or more Apartments | 33 | 0.7% |
| Mobile Home / Other | 15 | 0.3% |
| Total | 4,434 | 100.0% |
Housing Structures by Occupancy in Dorado
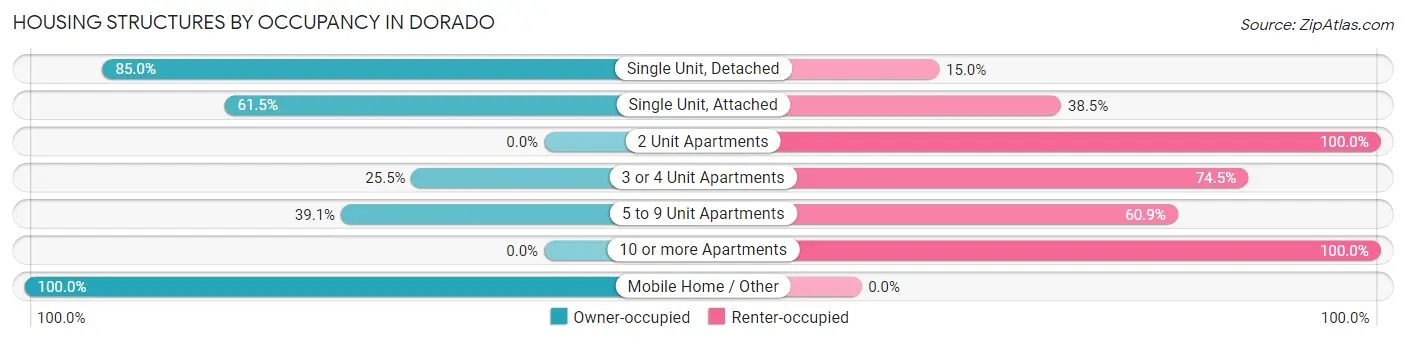
| Structure Type | Owner-occupied | Renter-occupied |
| Single Unit, Detached | 2,622 (85.0%) | 463 (15.0%) |
| Single Unit, Attached | 556 (61.5%) | 348 (38.5%) |
| 2 Unit Apartments | 0 (0.0%) | 53 (100.0%) |
| 3 or 4 Unit Apartments | 48 (25.5%) | 140 (74.5%) |
| 5 to 9 Unit Apartments | 61 (39.1%) | 95 (60.9%) |
| 10 or more Apartments | 0 (0.0%) | 33 (100.0%) |
| Mobile Home / Other | 15 (100.0%) | 0 (0.0%) |
| Total | 3,302 (74.5%) | 1,132 (25.5%) |
Housing Structures by Number of Rooms in Dorado
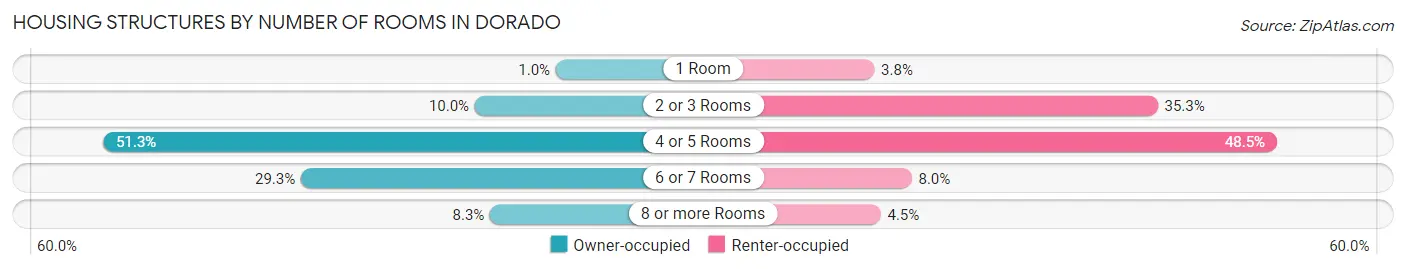
| Number of Rooms | Owner-occupied | Renter-occupied |
| 1 Room | 34 (1.0%) | 43 (3.8%) |
| 2 or 3 Rooms | 331 (10.0%) | 399 (35.2%) |
| 4 or 5 Rooms | 1,694 (51.3%) | 549 (48.5%) |
| 6 or 7 Rooms | 968 (29.3%) | 90 (8.0%) |
| 8 or more Rooms | 275 (8.3%) | 51 (4.5%) |
| Total | 3,302 (100.0%) | 1,132 (100.0%) |
Housing Structure by Heating Type in Dorado
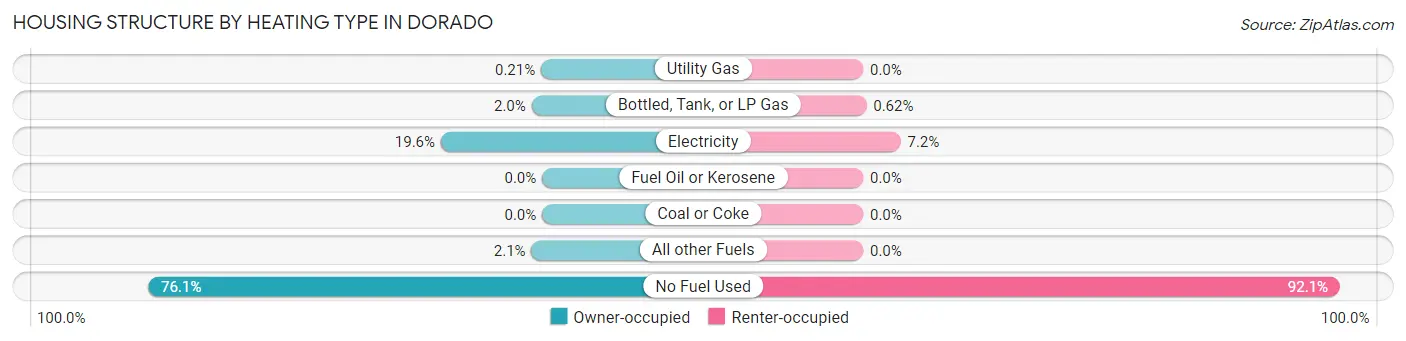
| Heating Type | Owner-occupied | Renter-occupied |
| Utility Gas | 7 (0.2%) | 0 (0.0%) |
| Bottled, Tank, or LP Gas | 67 (2.0%) | 7 (0.6%) |
| Electricity | 646 (19.6%) | 82 (7.2%) |
| Fuel Oil or Kerosene | 0 (0.0%) | 0 (0.0%) |
| Coal or Coke | 0 (0.0%) | 0 (0.0%) |
| All other Fuels | 68 (2.1%) | 0 (0.0%) |
| No Fuel Used | 2,514 (76.1%) | 1,043 (92.1%) |
| Total | 3,302 (100.0%) | 1,132 (100.0%) |
Household Vehicle Usage in Dorado
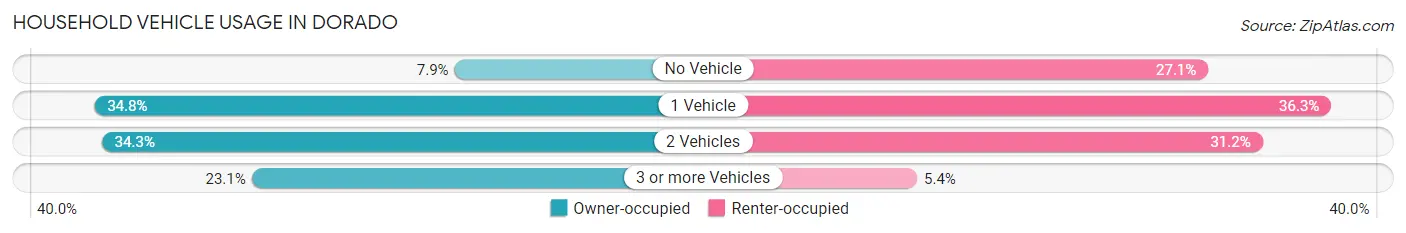
| Vehicles per Household | Owner-occupied | Renter-occupied |
| No Vehicle | 261 (7.9%) | 307 (27.1%) |
| 1 Vehicle | 1,149 (34.8%) | 411 (36.3%) |
| 2 Vehicles | 1,131 (34.3%) | 353 (31.2%) |
| 3 or more Vehicles | 761 (23.1%) | 61 (5.4%) |
| Total | 3,302 (100.0%) | 1,132 (100.0%) |
Real Estate & Mortgages in Dorado
Real Estate and Mortgage Overview in Dorado
| Characteristic | Without Mortgage | With Mortgage |
| Housing Units | 2,035 | 1,267 |
| Median Property Value | $140,200 | $239,000 |
| Median Household Income | $32,137 | $344 |
| Monthly Housing Costs | $225 | $169 |
| Real Estate Taxes | $682 | $783 |
Property Value by Mortgage Status in Dorado
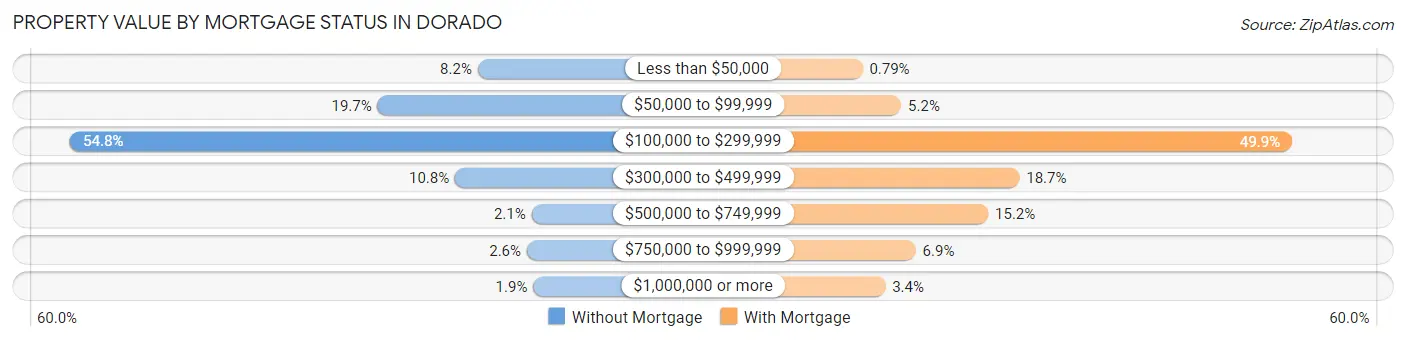
| Property Value | Without Mortgage | With Mortgage |
| Less than $50,000 | 167 (8.2%) | 10 (0.8%) |
| $50,000 to $99,999 | 400 (19.7%) | 66 (5.2%) |
| $100,000 to $299,999 | 1,115 (54.8%) | 632 (49.9%) |
| $300,000 to $499,999 | 220 (10.8%) | 237 (18.7%) |
| $500,000 to $749,999 | 42 (2.1%) | 192 (15.1%) |
| $750,000 to $999,999 | 53 (2.6%) | 87 (6.9%) |
| $1,000,000 or more | 38 (1.9%) | 43 (3.4%) |
| Total | 2,035 (100.0%) | 1,267 (100.0%) |
Household Income by Mortgage Status in Dorado
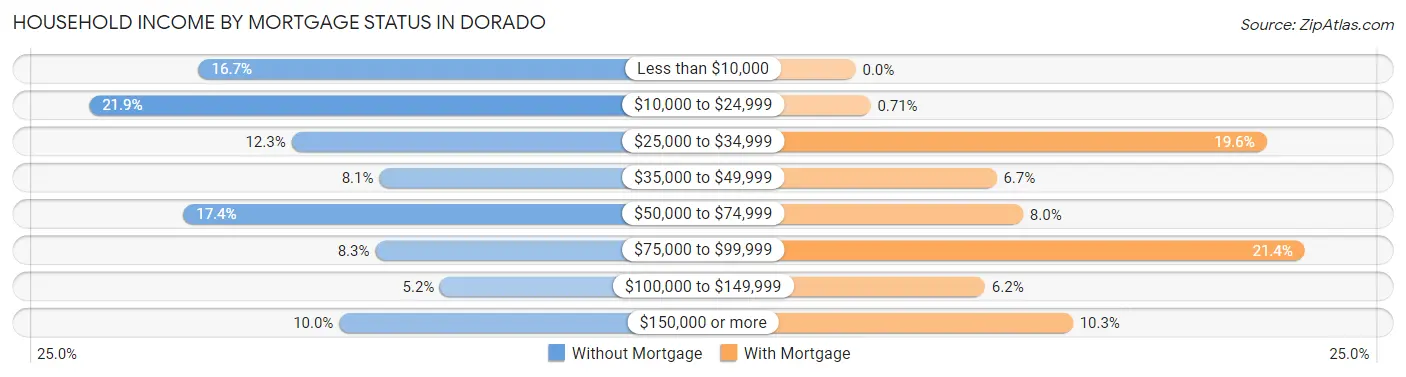
| Household Income | Without Mortgage | With Mortgage |
| Less than $10,000 | 340 (16.7%) | 0 (0.0%) |
| $10,000 to $24,999 | 446 (21.9%) | 9 (0.7%) |
| $25,000 to $34,999 | 250 (12.3%) | 248 (19.6%) |
| $35,000 to $49,999 | 165 (8.1%) | 85 (6.7%) |
| $50,000 to $74,999 | 355 (17.4%) | 101 (8.0%) |
| $75,000 to $99,999 | 169 (8.3%) | 271 (21.4%) |
| $100,000 to $149,999 | 106 (5.2%) | 78 (6.2%) |
| $150,000 or more | 204 (10.0%) | 131 (10.3%) |
| Total | 2,035 (100.0%) | 1,267 (100.0%) |
Property Value to Household Income Ratio in Dorado
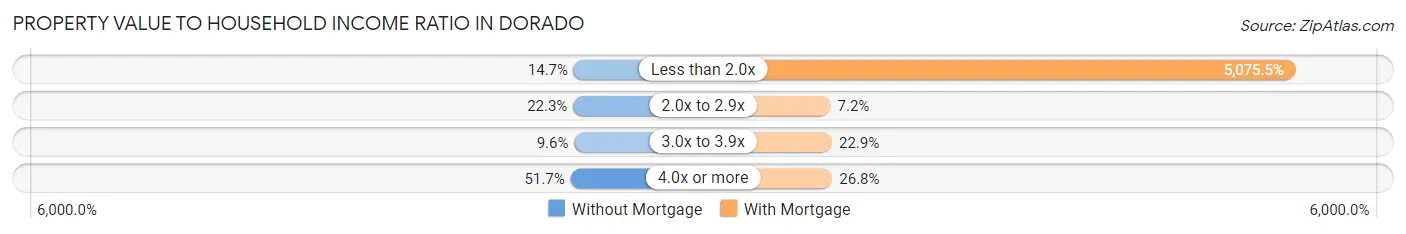
| Value-to-Income Ratio | Without Mortgage | With Mortgage |
| Less than 2.0x | 299 (14.7%) | 64,306 (5,075.5%) |
| 2.0x to 2.9x | 453 (22.3%) | 91 (7.2%) |
| 3.0x to 3.9x | 196 (9.6%) | 290 (22.9%) |
| 4.0x or more | 1,051 (51.6%) | 339 (26.8%) |
| Total | 2,035 (100.0%) | 1,267 (100.0%) |
Real Estate Taxes by Mortgage Status in Dorado
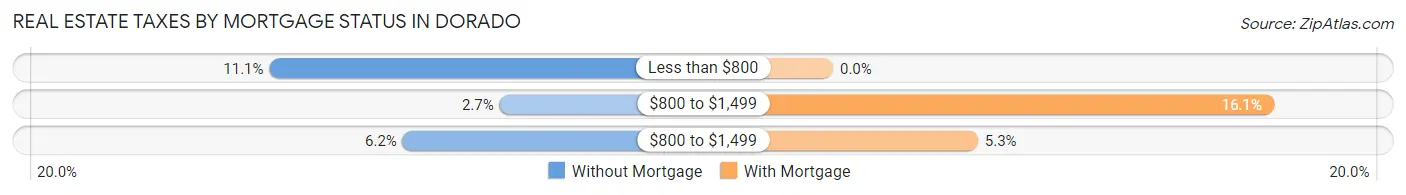
| Property Taxes | Without Mortgage | With Mortgage |
| Less than $800 | 225 (11.1%) | 0 (0.0%) |
| $800 to $1,499 | 54 (2.6%) | 204 (16.1%) |
| $800 to $1,499 | 126 (6.2%) | 67 (5.3%) |
| Total | 2,035 (100.0%) | 1,267 (100.0%) |
Health & Disability in Dorado
Health Insurance Coverage by Age in Dorado
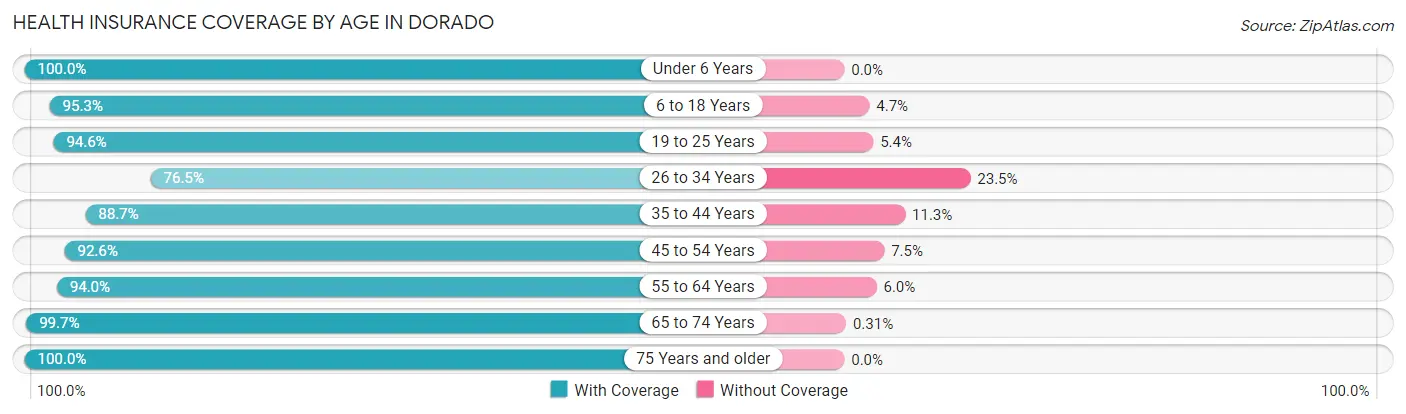
| Age Bracket | With Coverage | Without Coverage |
| Under 6 Years | 499 (100.0%) | 0 (0.0%) |
| 6 to 18 Years | 2,041 (95.3%) | 100 (4.7%) |
| 19 to 25 Years | 1,229 (94.6%) | 70 (5.4%) |
| 26 to 34 Years | 914 (76.5%) | 281 (23.5%) |
| 35 to 44 Years | 1,501 (88.7%) | 192 (11.3%) |
| 45 to 54 Years | 1,627 (92.5%) | 131 (7.4%) |
| 55 to 64 Years | 1,533 (94.0%) | 98 (6.0%) |
| 65 to 74 Years | 1,622 (99.7%) | 5 (0.3%) |
| 75 Years and older | 1,268 (100.0%) | 0 (0.0%) |
| Total | 12,234 (93.3%) | 877 (6.7%) |
Health Insurance Coverage by Citizenship Status in Dorado
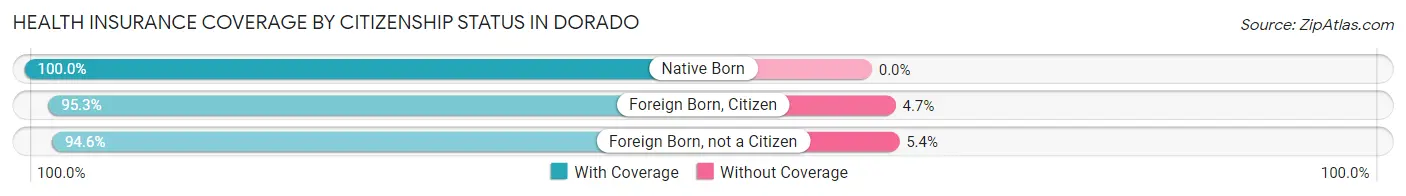
| Citizenship Status | With Coverage | Without Coverage |
| Native Born | 499 (100.0%) | 0 (0.0%) |
| Foreign Born, Citizen | 2,041 (95.3%) | 100 (4.7%) |
| Foreign Born, not a Citizen | 1,229 (94.6%) | 70 (5.4%) |
Health Insurance Coverage by Household Income in Dorado
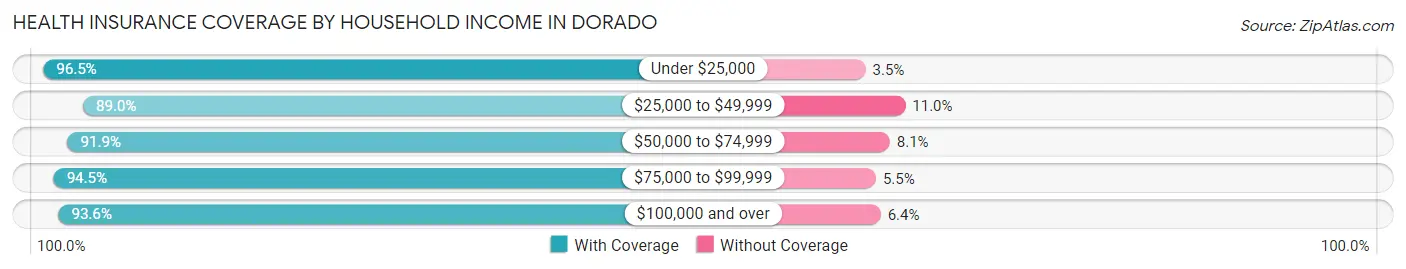
| Household Income | With Coverage | Without Coverage |
| Under $25,000 | 3,389 (96.5%) | 124 (3.5%) |
| $25,000 to $49,999 | 2,077 (89.0%) | 256 (11.0%) |
| $50,000 to $74,999 | 2,506 (91.9%) | 220 (8.1%) |
| $75,000 to $99,999 | 1,228 (94.5%) | 71 (5.5%) |
| $100,000 and over | 3,031 (93.6%) | 206 (6.4%) |
Public vs Private Health Insurance Coverage by Age in Dorado
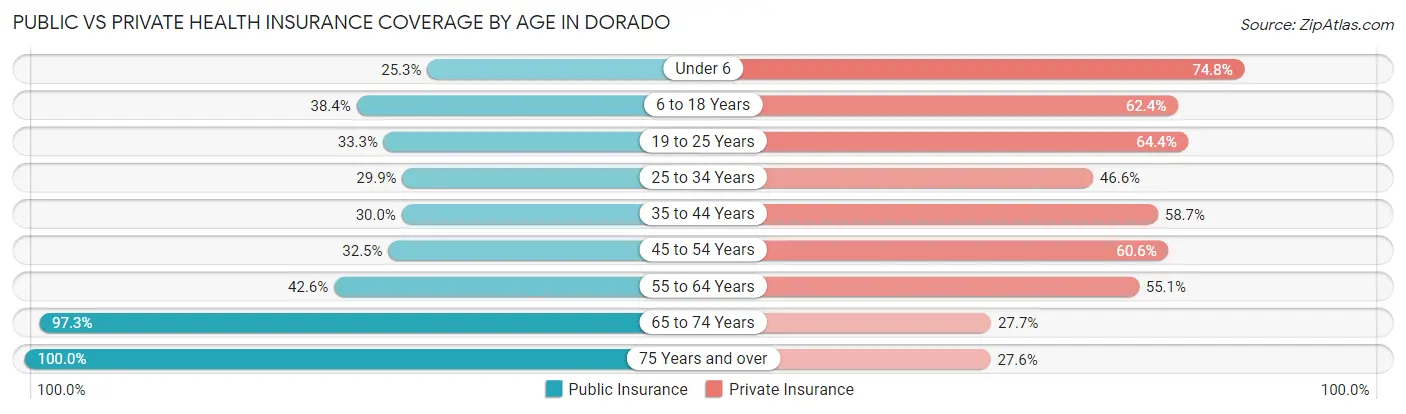
| Age Bracket | Public Insurance | Private Insurance |
| Under 6 | 126 (25.3%) | 373 (74.8%) |
| 6 to 18 Years | 822 (38.4%) | 1,336 (62.4%) |
| 19 to 25 Years | 433 (33.3%) | 836 (64.4%) |
| 25 to 34 Years | 357 (29.9%) | 557 (46.6%) |
| 35 to 44 Years | 508 (30.0%) | 993 (58.7%) |
| 45 to 54 Years | 571 (32.5%) | 1,066 (60.6%) |
| 55 to 64 Years | 694 (42.5%) | 899 (55.1%) |
| 65 to 74 Years | 1,583 (97.3%) | 451 (27.7%) |
| 75 Years and over | 1,268 (100.0%) | 350 (27.6%) |
| Total | 6,362 (48.5%) | 6,861 (52.3%) |
Disability Status by Sex by Age in Dorado
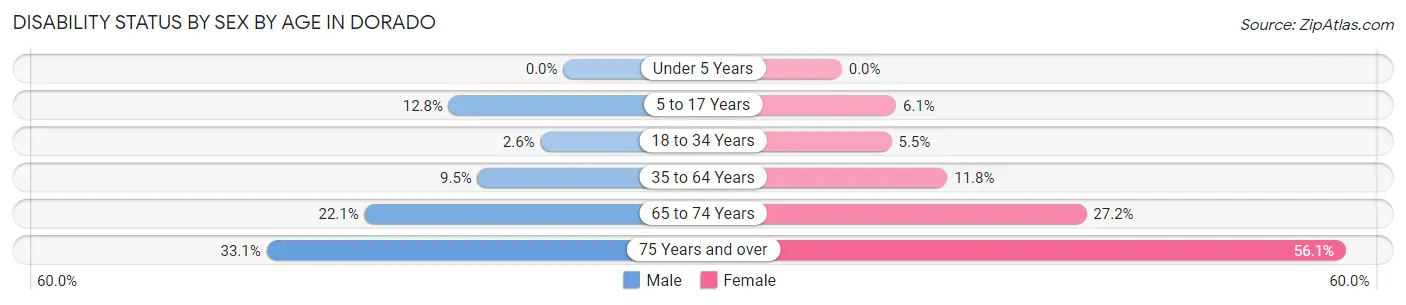
| Age Bracket | Male | Female |
| Under 5 Years | 0 (0.0%) | 0 (0.0%) |
| 5 to 17 Years | 137 (12.8%) | 62 (6.0%) |
| 18 to 34 Years | 34 (2.5%) | 74 (5.5%) |
| 35 to 64 Years | 195 (9.5%) | 357 (11.7%) |
| 65 to 74 Years | 153 (22.1%) | 255 (27.2%) |
| 75 Years and over | 193 (33.1%) | 384 (56.1%) |
Disability Class by Sex by Age in Dorado
Disability Class: Hearing Difficulty
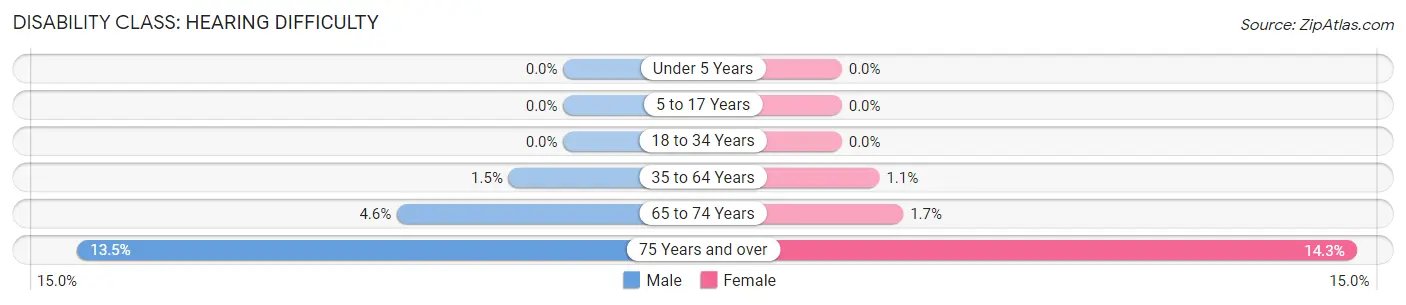
| Age Bracket | Male | Female |
| Under 5 Years | 0 (0.0%) | 0 (0.0%) |
| 5 to 17 Years | 0 (0.0%) | 0 (0.0%) |
| 18 to 34 Years | 0 (0.0%) | 0 (0.0%) |
| 35 to 64 Years | 31 (1.5%) | 32 (1.1%) |
| 65 to 74 Years | 32 (4.6%) | 16 (1.7%) |
| 75 Years and over | 79 (13.5%) | 98 (14.3%) |
Disability Class: Vision Difficulty
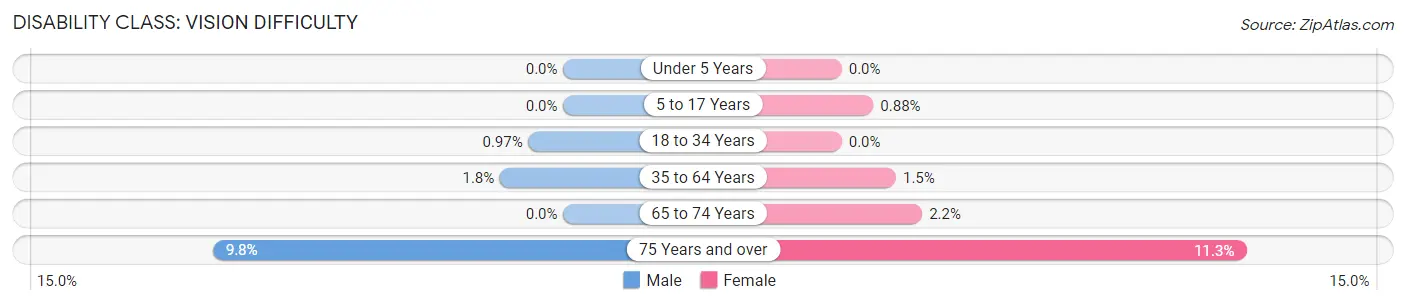
| Age Bracket | Male | Female |
| Under 5 Years | 0 (0.0%) | 0 (0.0%) |
| 5 to 17 Years | 0 (0.0%) | 9 (0.9%) |
| 18 to 34 Years | 13 (1.0%) | 0 (0.0%) |
| 35 to 64 Years | 36 (1.8%) | 46 (1.5%) |
| 65 to 74 Years | 0 (0.0%) | 21 (2.2%) |
| 75 Years and over | 57 (9.8%) | 77 (11.3%) |
Disability Class: Cognitive Difficulty
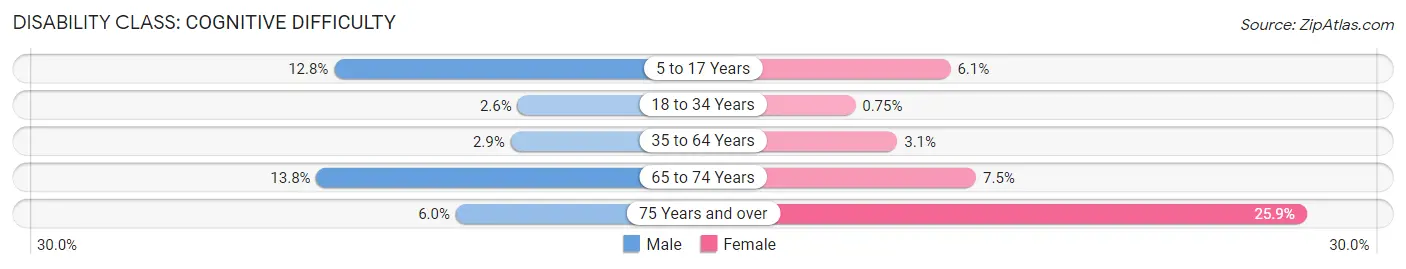
| Age Bracket | Male | Female |
| 5 to 17 Years | 137 (12.8%) | 62 (6.0%) |
| 18 to 34 Years | 34 (2.5%) | 10 (0.7%) |
| 35 to 64 Years | 60 (2.9%) | 94 (3.1%) |
| 65 to 74 Years | 95 (13.8%) | 70 (7.5%) |
| 75 Years and over | 35 (6.0%) | 177 (25.9%) |
Disability Class: Ambulatory Difficulty
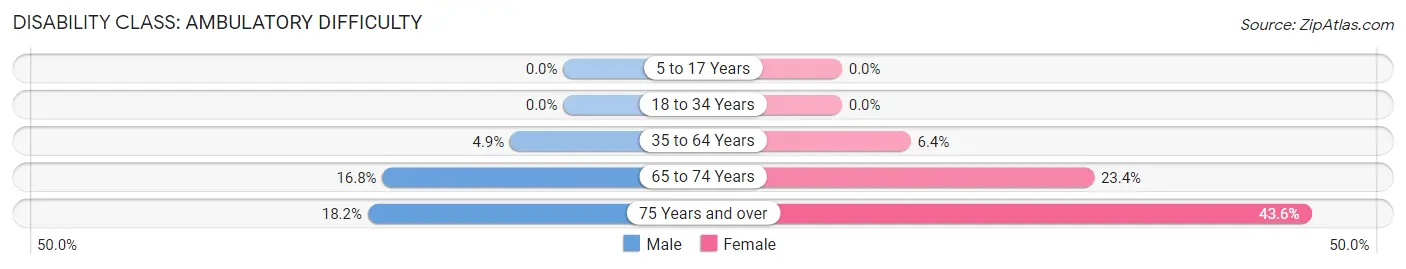
| Age Bracket | Male | Female |
| 5 to 17 Years | 0 (0.0%) | 0 (0.0%) |
| 18 to 34 Years | 0 (0.0%) | 0 (0.0%) |
| 35 to 64 Years | 101 (4.9%) | 194 (6.4%) |
| 65 to 74 Years | 116 (16.8%) | 219 (23.4%) |
| 75 Years and over | 106 (18.1%) | 298 (43.6%) |
Disability Class: Self-Care Difficulty
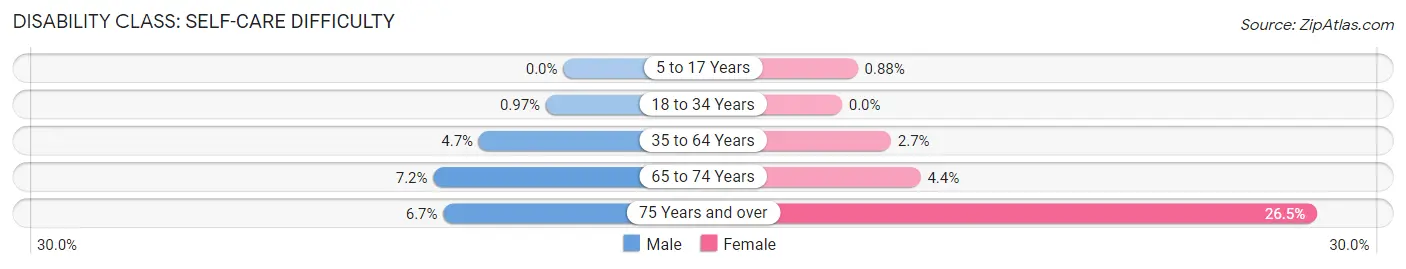
| Age Bracket | Male | Female |
| 5 to 17 Years | 0 (0.0%) | 9 (0.9%) |
| 18 to 34 Years | 13 (1.0%) | 0 (0.0%) |
| 35 to 64 Years | 96 (4.7%) | 83 (2.7%) |
| 65 to 74 Years | 50 (7.2%) | 41 (4.4%) |
| 75 Years and over | 39 (6.7%) | 181 (26.5%) |
Technology Access in Dorado
Computing Device Access in Dorado
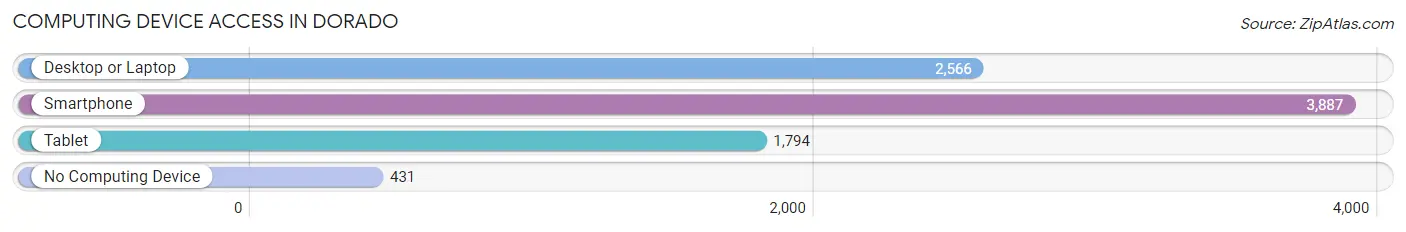
| Device Type | # Households | % Households |
| Desktop or Laptop | 2,566 | 57.9% |
| Smartphone | 3,887 | 87.7% |
| Tablet | 1,794 | 40.5% |
| No Computing Device | 431 | 9.7% |
| Total | 4,434 | 100.0% |
Internet Access in Dorado
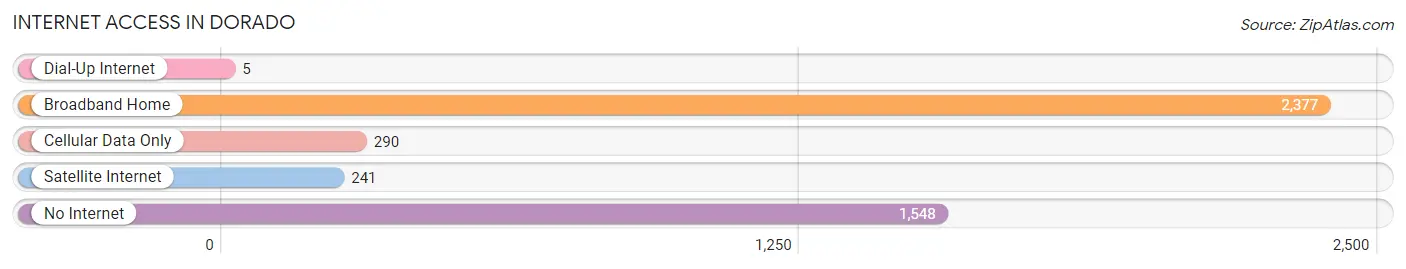
| Internet Type | # Households | % Households |
| Dial-Up Internet | 5 | 0.1% |
| Broadband Home | 2,377 | 53.6% |
| Cellular Data Only | 290 | 6.5% |
| Satellite Internet | 241 | 5.4% |
| No Internet | 1,548 | 34.9% |
| Total | 4,434 | 100.0% |
Dorado Summary
Dorado, Puerto Rico is a municipality located in the northern coast of the island of Puerto Rico. It is part of the San Juan-Caguas-Guaynabo Metropolitan Statistical Area. The town is known for its beautiful beaches, lush vegetation, and its proximity to the capital city of San Juan.
History
The area of Dorado was originally inhabited by the Taíno Indians, who called the area “Yucayo”. The first European settlers arrived in the area in the early 16th century, and the town was officially founded in 1776. The town was named after the Dorado River, which runs through the area.
In the 19th century, Dorado was a small fishing village. In the early 20th century, the town began to grow as a tourist destination, and it was incorporated as a municipality in 1959.
Geography
Dorado is located in the northern coast of Puerto Rico, about 20 miles west of San Juan. The town covers an area of 11.2 square miles, and it is bordered by the municipalities of Toa Alta, Toa Baja, Vega Alta, Vega Baja, and San Juan.
The terrain of Dorado is mostly flat, with some hills in the northern part of the town. The town is located on the coast of the Atlantic Ocean, and it is home to several beaches, including Dorado Beach, Balneario de Dorado, and Playa Grande.
Economy
The economy of Dorado is largely based on tourism. The town is home to several resorts and hotels, as well as restaurants and other tourist attractions. The town is also home to several industrial parks, which are home to a variety of businesses, including pharmaceutical companies, electronics manufacturers, and food processing plants.
Demographics
As of the 2010 census, Dorado had a population of 33,845. The population is mostly of Puerto Rican descent, with a small percentage of other ethnicities, including African, European, and Asian. The median household income in Dorado is $25,845, and the median age is 38.
The town is served by several public schools, as well as a private school. The town is also home to several churches, including the Iglesia de San Antonio de Padua, the Iglesia de Nuestra Señora de la Candelaria, and the Iglesia de San José.
Conclusion
Dorado, Puerto Rico is a municipality located in the northern coast of the island of Puerto Rico. It is known for its beautiful beaches, lush vegetation, and its proximity to the capital city of San Juan. The economy of Dorado is largely based on tourism, and the town is home to several resorts and hotels, as well as industrial parks. The population of Dorado is mostly of Puerto Rican descent, with a small percentage of other ethnicities. The town is served by several public schools, as well as a private school, and it is home to several churches.
Common Questions
What is Per Capita Income in Dorado?
Per Capita income in Dorado is $27,131.
What is the Median Family Income in Dorado?
Median Family Income in Dorado is $52,989.
What is the Median Household income in Dorado?
Median Household Income in Dorado is $40,660.
What is Income or Wage Gap in Dorado?
Income or Wage Gap in Dorado is 10.0%.
Women in Dorado earn 90.0 cents for every dollar earned by a man.
What is Family Income Deficit in Dorado?
Family Income Deficit in Dorado is $13,494.
Families that are below poverty line in Dorado earn $13,494 less on average than the poverty threshold level.
What is Inequality or Gini Index in Dorado?
Inequality or Gini Index in Dorado is 0.60.
What is the Total Population of Dorado?
Total Population of Dorado is 13,208.
What is the Total Male Population of Dorado?
Total Male Population of Dorado is 6,002.
What is the Total Female Population of Dorado?
Total Female Population of Dorado is 7,206.
What is the Ratio of Males per 100 Females in Dorado?
There are 83.29 Males per 100 Females in Dorado.
What is the Ratio of Females per 100 Males in Dorado?
There are 120.06 Females per 100 Males in Dorado.
What is the Median Population Age in Dorado?
Median Population Age in Dorado is 43.8 Years.
What is the Average Family Size in Dorado
Average Family Size in Dorado is 3.8 People.
What is the Average Household Size in Dorado
Average Household Size in Dorado is 3.0 People.
How Large is the Labor Force in Dorado?
There are 5,304 People in the Labor Forcein in Dorado.
What is the Percentage of People in the Labor Force in Dorado?
47.7% of People are in the Labor Force in Dorado.
What is the Unemployment Rate in Dorado?
Unemployment Rate in Dorado is 10.9%.