Lake Geneva, WI Map & Demographics
Lake Geneva Map
Lake Geneva Overview
$42,817
PER CAPITA INCOME
$77,065
AVG FAMILY INCOME
$62,883
AVG HOUSEHOLD INCOME
24.5%
WAGE / INCOME GAP [ % ]
75.5¢/ $1
WAGE / INCOME GAP [ $ ]
$8,550
FAMILY INCOME DEFICIT
0.46
INEQUALITY / GINI INDEX
8,335
TOTAL POPULATION
3,903
MALE POPULATION
4,432
FEMALE POPULATION
88.06
MALES / 100 FEMALES
113.55
FEMALES / 100 MALES
45.0
MEDIAN AGE
2.7
AVG FAMILY SIZE
2.0
AVG HOUSEHOLD SIZE
4,570
LABOR FORCE [ PEOPLE ]
64.2%
PERCENT IN LABOR FORCE
3.7%
UNEMPLOYMENT RATE
Lake Geneva Zip Codes
Lake Geneva Area Codes
Income in Lake Geneva
Income Overview in Lake Geneva
Per Capita Income in Lake Geneva is $42,817, while median incomes of families and households are $77,065 and $62,883 respectively.
| Characteristic | Number | Measure |
| Per Capita Income | 8,335 | $42,817 |
| Median Family Income | 2,189 | $77,065 |
| Mean Family Income | 2,189 | $109,088 |
| Median Household Income | 4,073 | $62,883 |
| Mean Household Income | 4,073 | $87,976 |
| Income Deficit | 2,189 | $8,550 |
| Wage / Income Gap (%) | 8,335 | 24.50% |
| Wage / Income Gap ($) | 8,335 | 75.50¢ per $1 |
| Gini / Inequality Index | 8,335 | 0.46 |
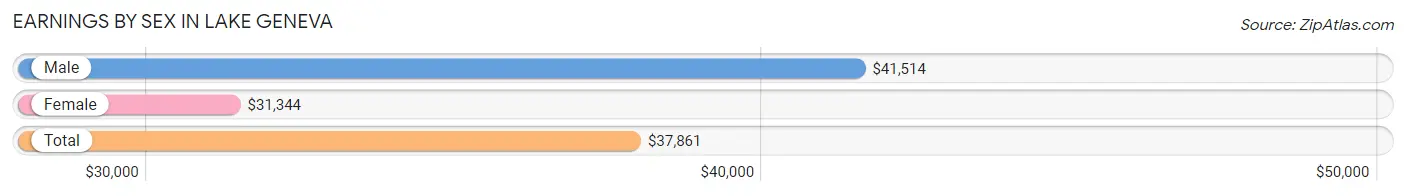
Earnings by Sex in Lake Geneva
Average Earnings in Lake Geneva are $37,861, $41,514 for men and $31,344 for women, a difference of 24.5%.
| Sex | Number | Average Earnings |
| Male | 2,570 (51.8%) | $41,514 |
| Female | 2,392 (48.2%) | $31,344 |
| Total | 4,962 (100.0%) | $37,861 |
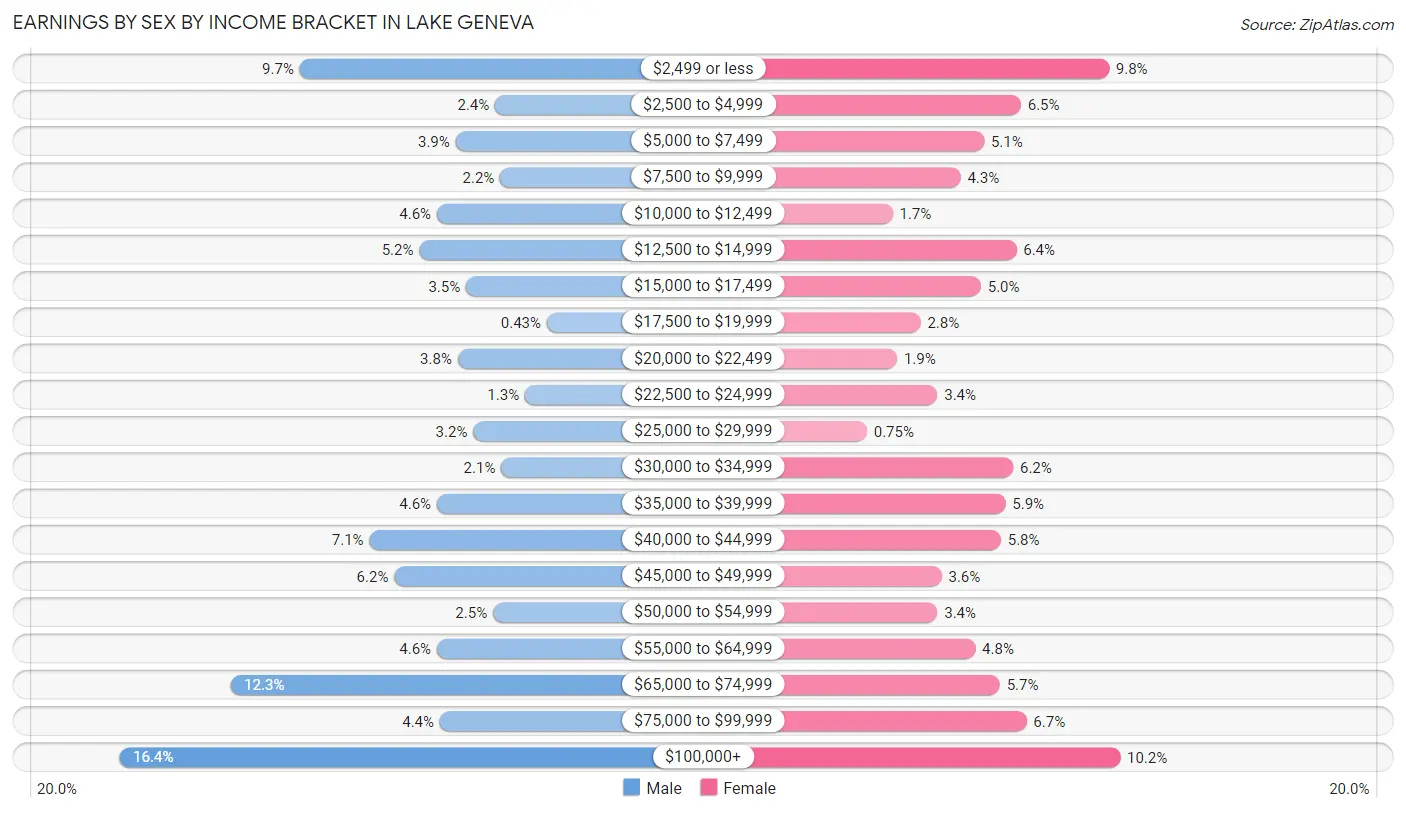
Earnings by Sex by Income Bracket in Lake Geneva
The most common earnings brackets in Lake Geneva are $100,000+ for men (422 | 16.4%) and $100,000+ for women (245 | 10.2%).
| Income | Male | Female |
| $2,499 or less | 249 (9.7%) | 235 (9.8%) |
| $2,500 to $4,999 | 61 (2.4%) | 156 (6.5%) |
| $5,000 to $7,499 | 99 (3.8%) | 123 (5.1%) |
| $7,500 to $9,999 | 56 (2.2%) | 102 (4.3%) |
| $10,000 to $12,499 | 117 (4.5%) | 41 (1.7%) |
| $12,500 to $14,999 | 134 (5.2%) | 152 (6.4%) |
| $15,000 to $17,499 | 89 (3.5%) | 120 (5.0%) |
| $17,500 to $19,999 | 11 (0.4%) | 66 (2.8%) |
| $20,000 to $22,499 | 97 (3.8%) | 45 (1.9%) |
| $22,500 to $24,999 | 32 (1.3%) | 81 (3.4%) |
| $25,000 to $29,999 | 82 (3.2%) | 18 (0.7%) |
| $30,000 to $34,999 | 55 (2.1%) | 149 (6.2%) |
| $35,000 to $39,999 | 117 (4.5%) | 142 (5.9%) |
| $40,000 to $44,999 | 182 (7.1%) | 138 (5.8%) |
| $45,000 to $49,999 | 158 (6.1%) | 85 (3.5%) |
| $50,000 to $54,999 | 63 (2.5%) | 81 (3.4%) |
| $55,000 to $64,999 | 117 (4.5%) | 115 (4.8%) |
| $65,000 to $74,999 | 315 (12.3%) | 137 (5.7%) |
| $75,000 to $99,999 | 114 (4.4%) | 161 (6.7%) |
| $100,000+ | 422 (16.4%) | 245 (10.2%) |
| Total | 2,570 (100.0%) | 2,392 (100.0%) |
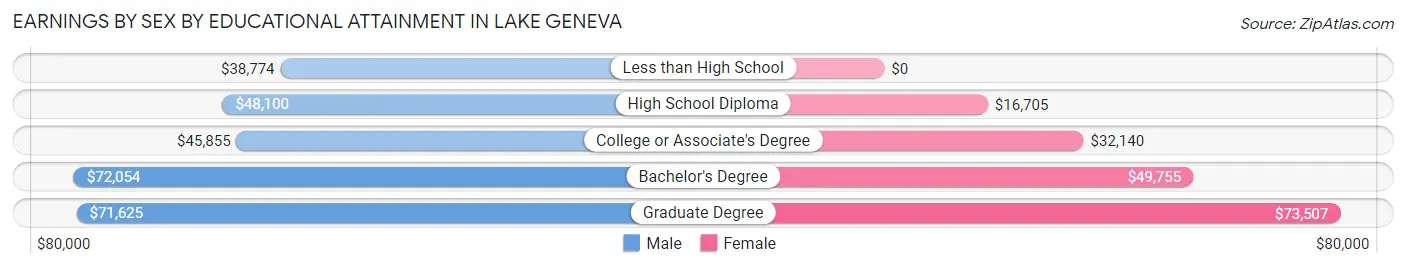
Earnings by Sex by Educational Attainment in Lake Geneva
Average earnings in Lake Geneva are $51,369 for men and $39,917 for women, a difference of 22.3%. Men with an educational attainment of bachelor's degree enjoy the highest average annual earnings of $72,054, while those with less than high school education earn the least with $38,774. Women with an educational attainment of graduate degree earn the most with the average annual earnings of $73,507, while those with high school diploma education have the smallest earnings of $16,705.
| Educational Attainment | Male Income | Female Income |
| Less than High School | $38,774 | $0 |
| High School Diploma | $48,100 | $16,705 |
| College or Associate's Degree | $45,855 | $32,140 |
| Bachelor's Degree | $72,054 | $49,755 |
| Graduate Degree | $71,625 | $73,507 |
| Total | $51,369 | $39,917 |
Family Income in Lake Geneva
Family Income Brackets in Lake Geneva
According to the Lake Geneva family income data, there are 394 families falling into the $100,000 to $149,999 income range, which is the most common income bracket and makes up 18.0% of all families. Conversely, the $10,000 to $14,999 income bracket is the least frequent group with only 13 families (0.6%) belonging to this category.
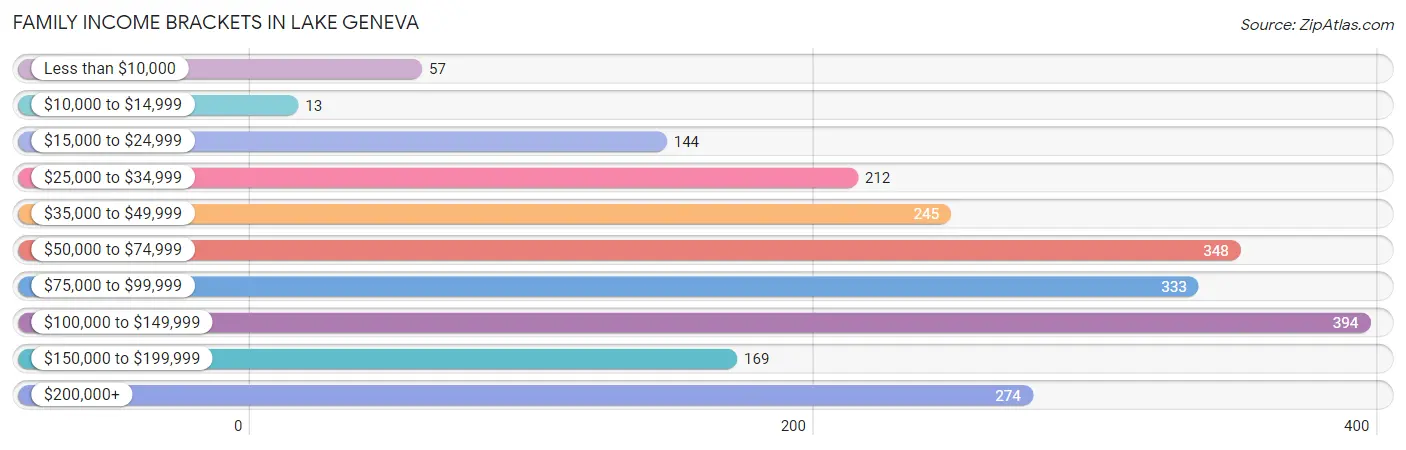
| Income Bracket | # Families | % Families |
| Less than $10,000 | 57 | 2.6% |
| $10,000 to $14,999 | 13 | 0.6% |
| $15,000 to $24,999 | 144 | 6.6% |
| $25,000 to $34,999 | 212 | 9.7% |
| $35,000 to $49,999 | 245 | 11.2% |
| $50,000 to $74,999 | 348 | 15.9% |
| $75,000 to $99,999 | 333 | 15.2% |
| $100,000 to $149,999 | 394 | 18.0% |
| $150,000 to $199,999 | 169 | 7.7% |
| $200,000+ | 274 | 12.5% |
Family Income by Famaliy Size in Lake Geneva
7+ person families (61 | 2.8%) account for the highest median family income in Lake Geneva with $104,440 per family, while 2-person families (1,342 | 61.3%) have the highest median income of $43,928 per family member.
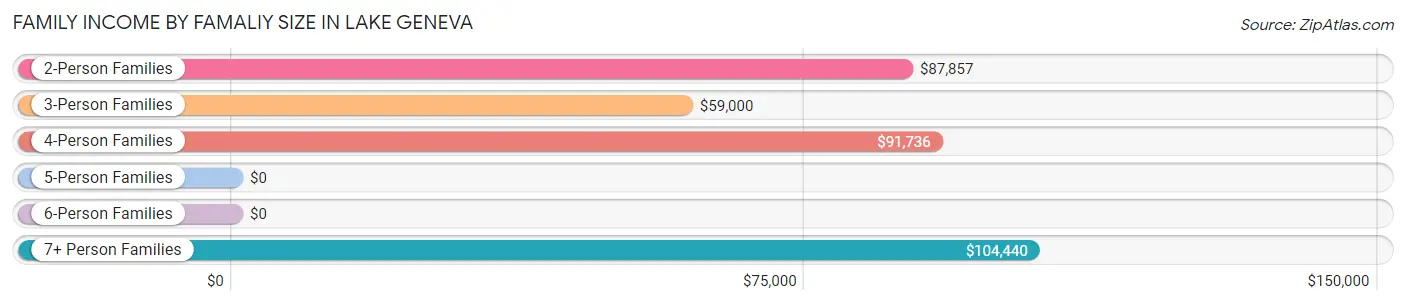
| Income Bracket | # Families | Median Income |
| 2-Person Families | 1,342 (61.3%) | $87,857 |
| 3-Person Families | 368 (16.8%) | $59,000 |
| 4-Person Families | 255 (11.7%) | $91,736 |
| 5-Person Families | 163 (7.4%) | $0 |
| 6-Person Families | 0 (0.0%) | $0 |
| 7+ Person Families | 61 (2.8%) | $104,440 |
| Total | 2,189 (100.0%) | $77,065 |
Family Income by Number of Earners in Lake Geneva
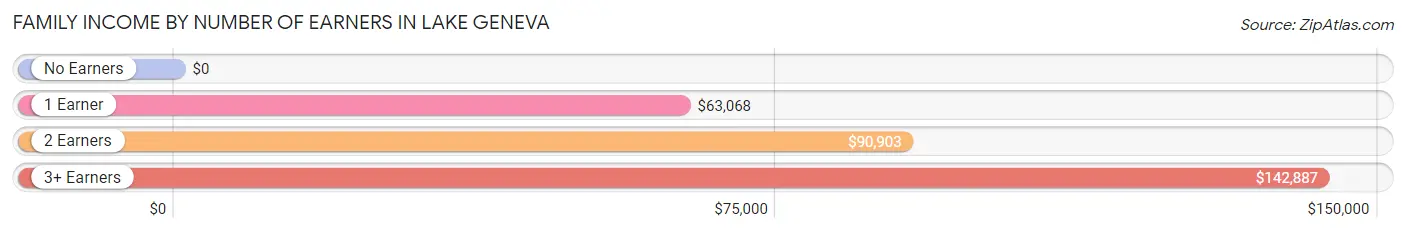
| Number of Earners | # Families | Median Income |
| No Earners | 235 (10.7%) | $0 |
| 1 Earner | 676 (30.9%) | $63,068 |
| 2 Earners | 1,005 (45.9%) | $90,903 |
| 3+ Earners | 273 (12.5%) | $142,887 |
| Total | 2,189 (100.0%) | $77,065 |
Household Income in Lake Geneva
Household Income Brackets in Lake Geneva
With 778 households falling in the category, the $50,000 to $74,999 income range is the most frequent in Lake Geneva, accounting for 19.1% of all households. In contrast, only 77 households (1.9%) fall into the $10,000 to $14,999 income bracket, making it the least populous group.
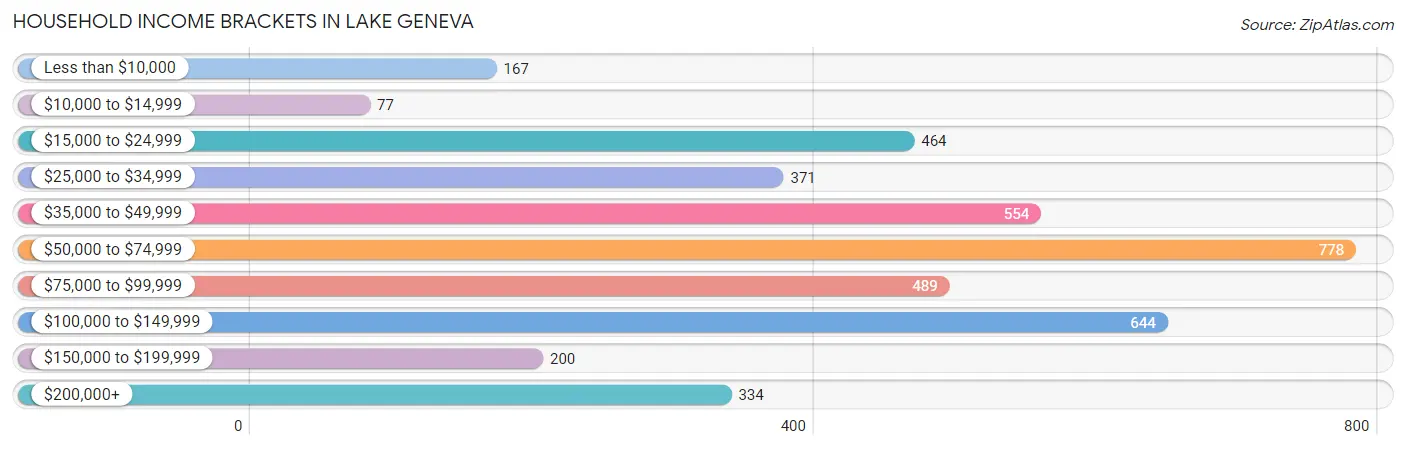
| Income Bracket | # Households | % Households |
| Less than $10,000 | 167 | 4.1% |
| $10,000 to $14,999 | 77 | 1.9% |
| $15,000 to $24,999 | 464 | 11.4% |
| $25,000 to $34,999 | 371 | 9.1% |
| $35,000 to $49,999 | 554 | 13.6% |
| $50,000 to $74,999 | 778 | 19.1% |
| $75,000 to $99,999 | 489 | 12.0% |
| $100,000 to $149,999 | 644 | 15.8% |
| $150,000 to $199,999 | 200 | 4.9% |
| $200,000+ | 334 | 8.2% |
Household Income by Householder Age in Lake Geneva
The median household income in Lake Geneva is $62,883, with the highest median household income of $75,229 found in the 25 to 44 years age bracket for the primary householder. A total of 975 households (23.9%) fall into this category. Meanwhile, the 15 to 24 years age bracket for the primary householder has the lowest median household income of $28,080, with 230 households (5.7%) in this group.
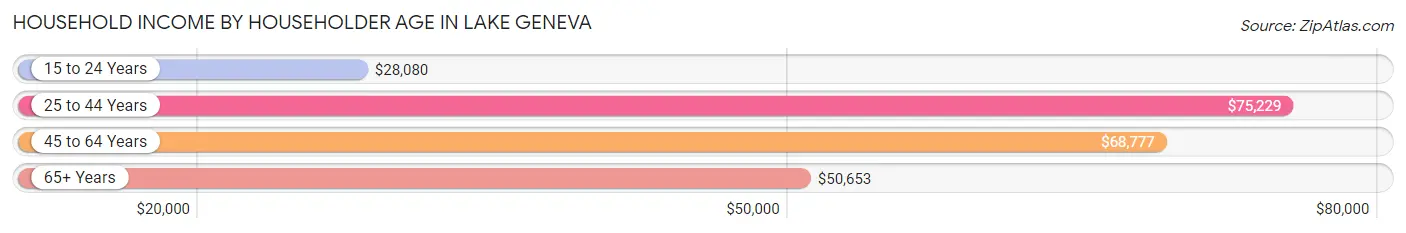
| Income Bracket | # Households | Median Income |
| 15 to 24 Years | 230 (5.7%) | $28,080 |
| 25 to 44 Years | 975 (23.9%) | $75,229 |
| 45 to 64 Years | 1,501 (36.8%) | $68,777 |
| 65+ Years | 1,367 (33.6%) | $50,653 |
| Total | 4,073 (100.0%) | $62,883 |
Poverty in Lake Geneva
Income Below Poverty by Sex and Age in Lake Geneva
With 7.8% poverty level for males and 15.3% for females among the residents of Lake Geneva, 6 to 11 year old males and 18 to 24 year old females are the most vulnerable to poverty, with 48 males (17.7%) and 187 females (47.7%) in their respective age groups living below the poverty level.
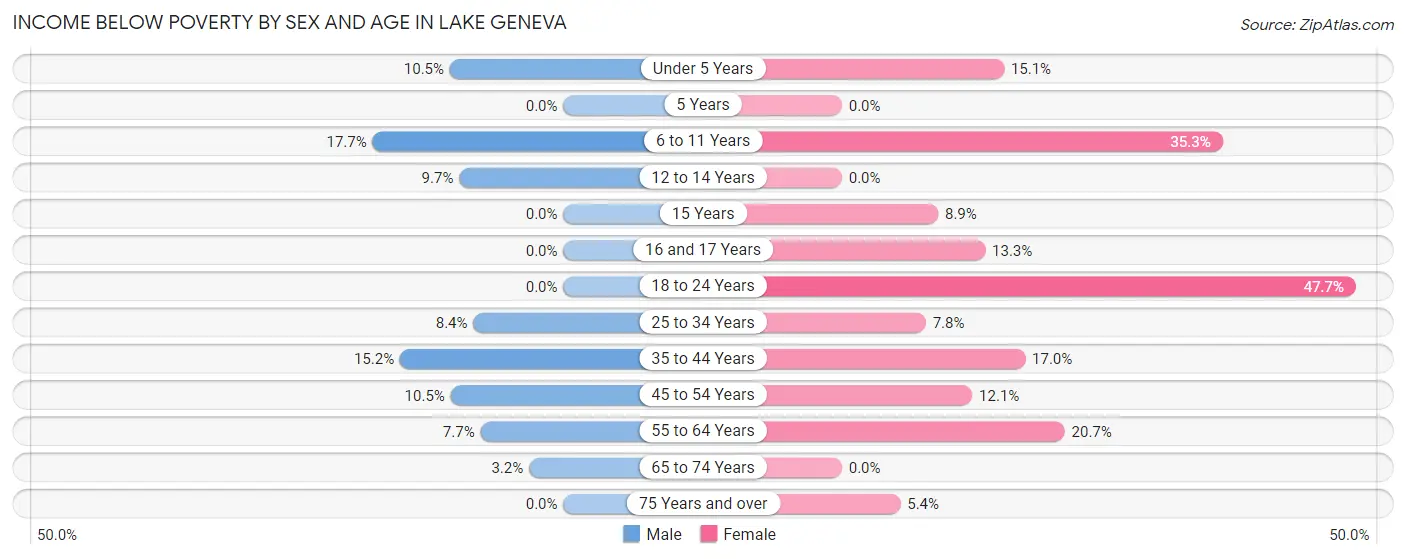
| Age Bracket | Male | Female |
| Under 5 Years | 8 (10.5%) | 14 (15.0%) |
| 5 Years | 0 (0.0%) | 0 (0.0%) |
| 6 to 11 Years | 48 (17.7%) | 106 (35.3%) |
| 12 to 14 Years | 17 (9.7%) | 0 (0.0%) |
| 15 Years | 0 (0.0%) | 5 (8.9%) |
| 16 and 17 Years | 0 (0.0%) | 31 (13.3%) |
| 18 to 24 Years | 0 (0.0%) | 187 (47.7%) |
| 25 to 34 Years | 33 (8.4%) | 30 (7.8%) |
| 35 to 44 Years | 74 (15.2%) | 75 (17.0%) |
| 45 to 54 Years | 64 (10.5%) | 65 (12.1%) |
| 55 to 64 Years | 46 (7.7%) | 128 (20.7%) |
| 65 to 74 Years | 13 (3.2%) | 0 (0.0%) |
| 75 Years and over | 0 (0.0%) | 30 (5.4%) |
| Total | 303 (7.8%) | 671 (15.3%) |
Income Above Poverty by Sex and Age in Lake Geneva
According to the poverty statistics in Lake Geneva, males aged 5 years and females aged 5 years are the age groups that are most secure financially, with 100.0% of males and 100.0% of females in these age groups living above the poverty line.
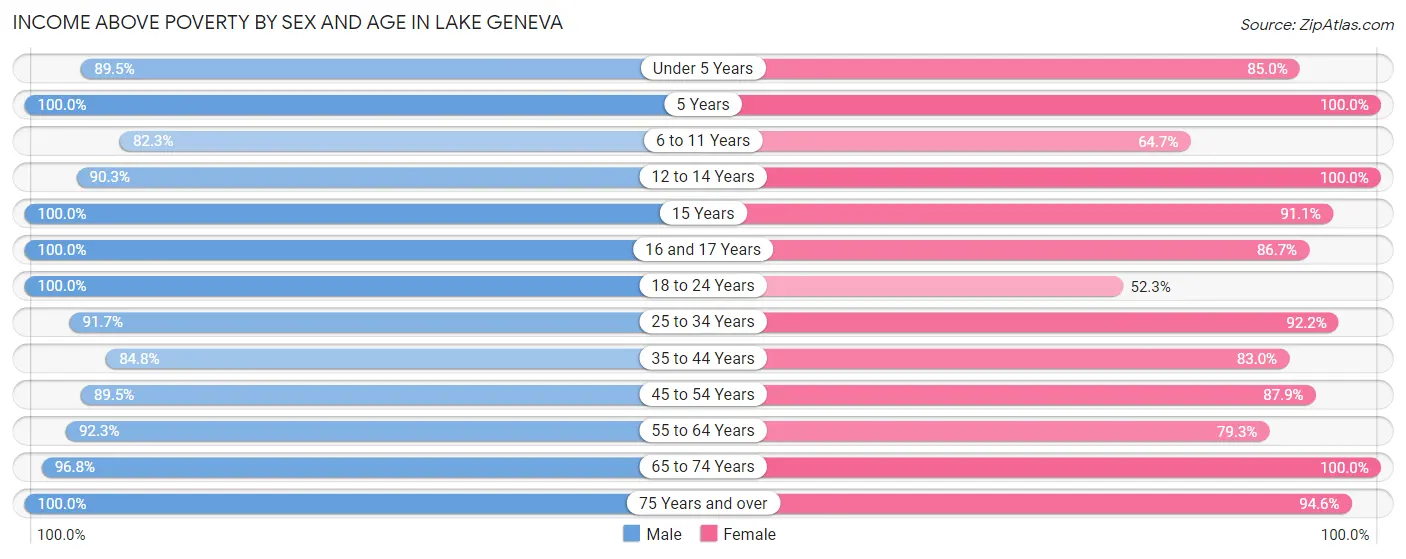
| Age Bracket | Male | Female |
| Under 5 Years | 68 (89.5%) | 79 (85.0%) |
| 5 Years | 61 (100.0%) | 23 (100.0%) |
| 6 to 11 Years | 223 (82.3%) | 194 (64.7%) |
| 12 to 14 Years | 159 (90.3%) | 118 (100.0%) |
| 15 Years | 42 (100.0%) | 51 (91.1%) |
| 16 and 17 Years | 107 (100.0%) | 202 (86.7%) |
| 18 to 24 Years | 494 (100.0%) | 205 (52.3%) |
| 25 to 34 Years | 362 (91.6%) | 355 (92.2%) |
| 35 to 44 Years | 414 (84.8%) | 366 (83.0%) |
| 45 to 54 Years | 548 (89.5%) | 472 (87.9%) |
| 55 to 64 Years | 552 (92.3%) | 491 (79.3%) |
| 65 to 74 Years | 396 (96.8%) | 630 (100.0%) |
| 75 Years and over | 162 (100.0%) | 522 (94.6%) |
| Total | 3,588 (92.2%) | 3,708 (84.7%) |
Income Below Poverty Among Married-Couple Families in Lake Geneva
The poverty statistics for married-couple families in Lake Geneva show that 6.7% or 103 of the total 1,541 families live below the poverty line. Families with 1 or 2 children have the highest poverty rate of 23.7%, comprising of 69 families. On the other hand, families with 5 or more children have the lowest poverty rate of 0.0%, which includes 0 families.
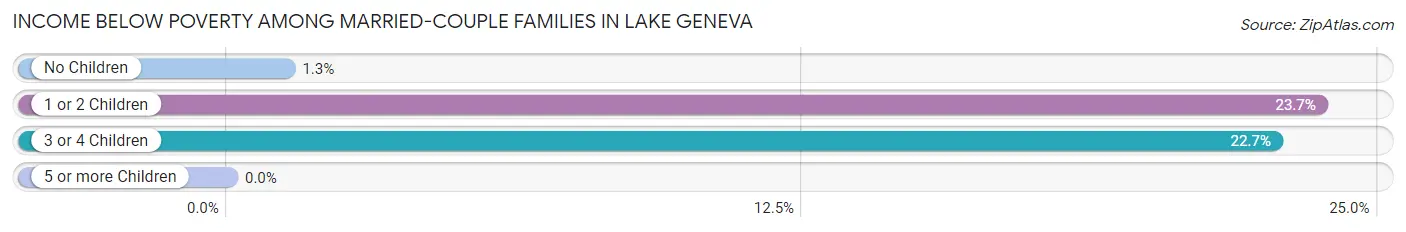
| Children | Above Poverty | Below Poverty |
| No Children | 1,107 (98.8%) | 14 (1.3%) |
| 1 or 2 Children | 222 (76.3%) | 69 (23.7%) |
| 3 or 4 Children | 68 (77.3%) | 20 (22.7%) |
| 5 or more Children | 41 (100.0%) | 0 (0.0%) |
| Total | 1,438 (93.3%) | 103 (6.7%) |
Income Below Poverty Among Single-Parent Households in Lake Geneva
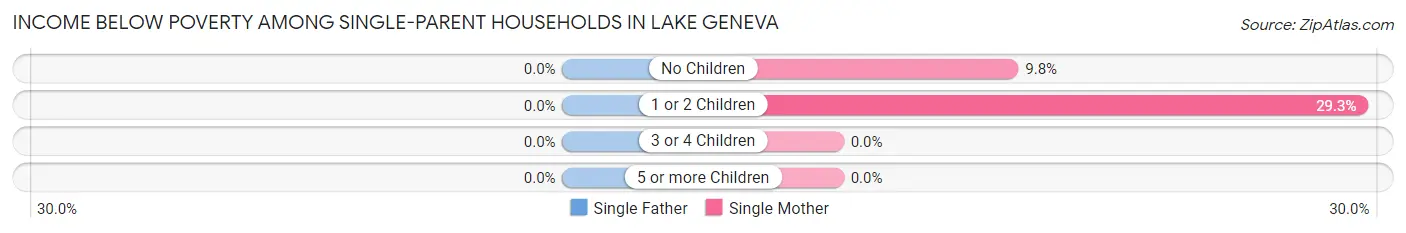
| Children | Single Father | Single Mother |
| No Children | 0 (0.0%) | 20 (9.8%) |
| 1 or 2 Children | 0 (0.0%) | 68 (29.3%) |
| 3 or 4 Children | 0 (0.0%) | 0 (0.0%) |
| 5 or more Children | 0 (0.0%) | 0 (0.0%) |
| Total | 0 (0.0%) | 88 (17.4%) |
Income Below Poverty Among Married-Couple vs Single-Parent Households in Lake Geneva
The poverty data for Lake Geneva shows that 103 of the married-couple family households (6.7%) and 88 of the single-parent households (13.6%) are living below the poverty level. Within the married-couple family households, those with 1 or 2 children have the highest poverty rate, with 69 households (23.7%) falling below the poverty line. Among the single-parent households, those with 1 or 2 children have the highest poverty rate, with 68 household (26.6%) living below poverty.
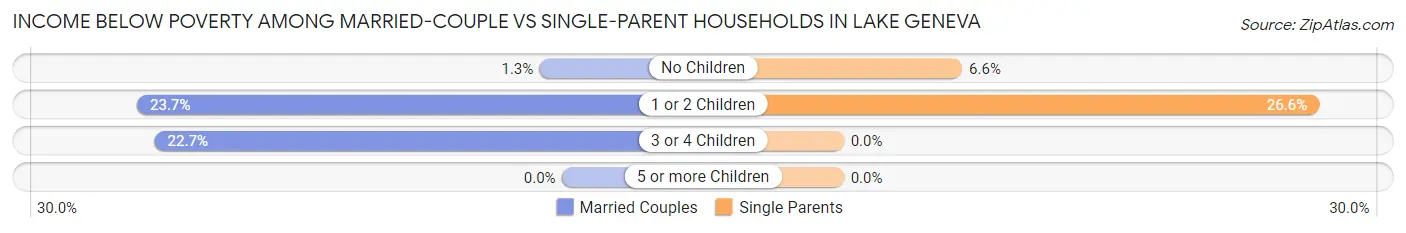
| Children | Married-Couple Families | Single-Parent Households |
| No Children | 14 (1.3%) | 20 (6.6%) |
| 1 or 2 Children | 69 (23.7%) | 68 (26.6%) |
| 3 or 4 Children | 20 (22.7%) | 0 (0.0%) |
| 5 or more Children | 0 (0.0%) | 0 (0.0%) |
| Total | 103 (6.7%) | 88 (13.6%) |
Race in Lake Geneva
The most populous races in Lake Geneva are White / Caucasian (7,511 | 90.1%), Hispanic or Latino (982 | 11.8%), and Some other Race (420 | 5.0%).
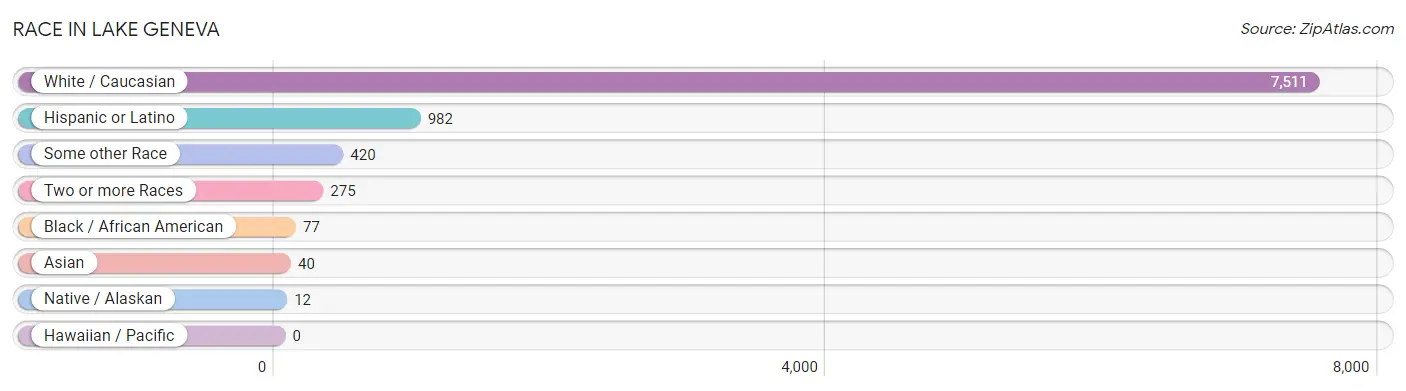
| Race | # Population | % Population |
| Asian | 40 | 0.5% |
| Black / African American | 77 | 0.9% |
| Hawaiian / Pacific | 0 | 0.0% |
| Hispanic or Latino | 982 | 11.8% |
| Native / Alaskan | 12 | 0.1% |
| White / Caucasian | 7,511 | 90.1% |
| Two or more Races | 275 | 3.3% |
| Some other Race | 420 | 5.0% |
| Total | 8,335 | 100.0% |
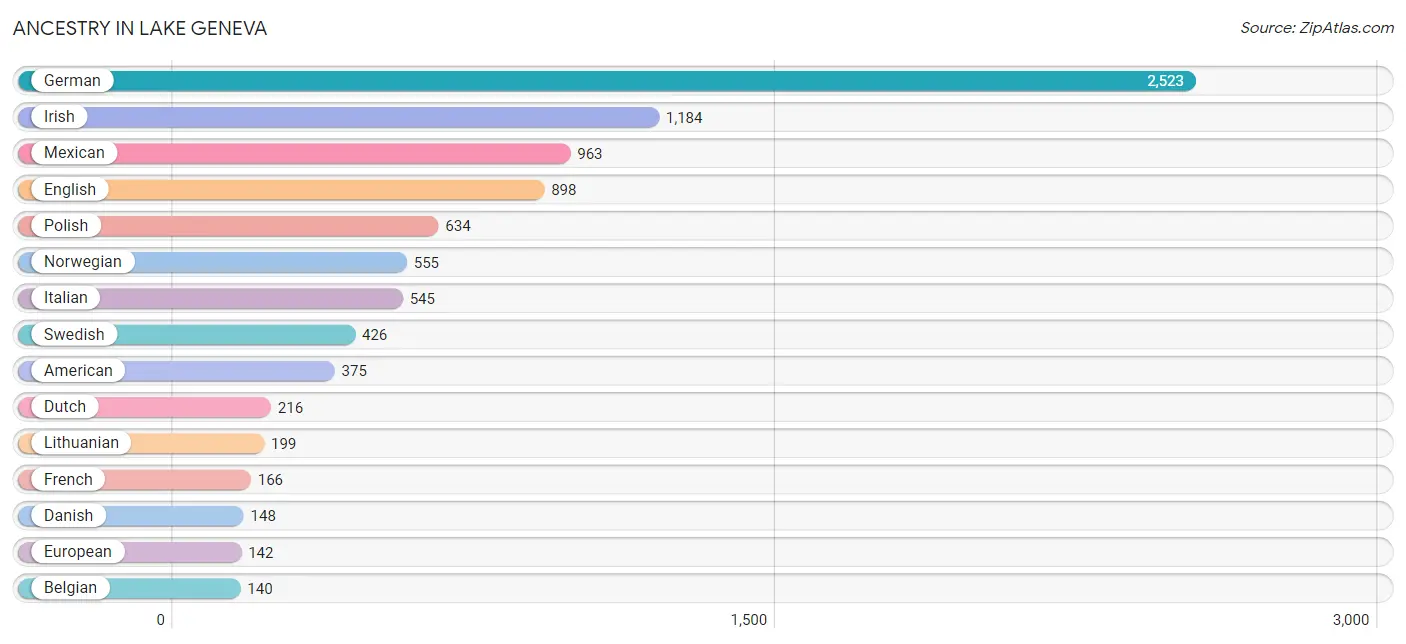
Ancestry in Lake Geneva
The most populous ancestries reported in Lake Geneva are German (2,523 | 30.3%), Irish (1,184 | 14.2%), Mexican (963 | 11.6%), English (898 | 10.8%), and Polish (634 | 7.6%), together accounting for 74.4% of all Lake Geneva residents.
| Ancestry | # Population | % Population |
| American | 375 | 4.5% |
| Arab | 16 | 0.2% |
| Armenian | 60 | 0.7% |
| Austrian | 5 | 0.1% |
| Bangladeshi | 40 | 0.5% |
| Belgian | 140 | 1.7% |
| British | 79 | 0.9% |
| Canadian | 17 | 0.2% |
| Cherokee | 19 | 0.2% |
| Croatian | 46 | 0.5% |
| Czech | 49 | 0.6% |
| Danish | 148 | 1.8% |
| Dutch | 216 | 2.6% |
| Eastern European | 16 | 0.2% |
| English | 898 | 10.8% |
| European | 142 | 1.7% |
| Finnish | 30 | 0.4% |
| French | 166 | 2.0% |
| French Canadian | 12 | 0.1% |
| German | 2,523 | 30.3% |
| Greek | 22 | 0.3% |
| Hungarian | 59 | 0.7% |
| Irish | 1,184 | 14.2% |
| Italian | 545 | 6.5% |
| Korean | 36 | 0.4% |
| Latvian | 16 | 0.2% |
| Lithuanian | 199 | 2.4% |
| Luxembourger | 13 | 0.2% |
| Mexican | 963 | 11.6% |
| Moroccan | 16 | 0.2% |
| Native Hawaiian | 33 | 0.4% |
| Norwegian | 555 | 6.7% |
| Pennsylvania German | 17 | 0.2% |
| Polish | 634 | 7.6% |
| Portuguese | 39 | 0.5% |
| Russian | 37 | 0.4% |
| Scotch-Irish | 51 | 0.6% |
| Scottish | 135 | 1.6% |
| Serbian | 35 | 0.4% |
| Slovak | 69 | 0.8% |
| Slovene | 10 | 0.1% |
| Spanish | 19 | 0.2% |
| Swedish | 426 | 5.1% |
| Swiss | 40 | 0.5% |
| Ukrainian | 7 | 0.1% | View All 45 Rows |
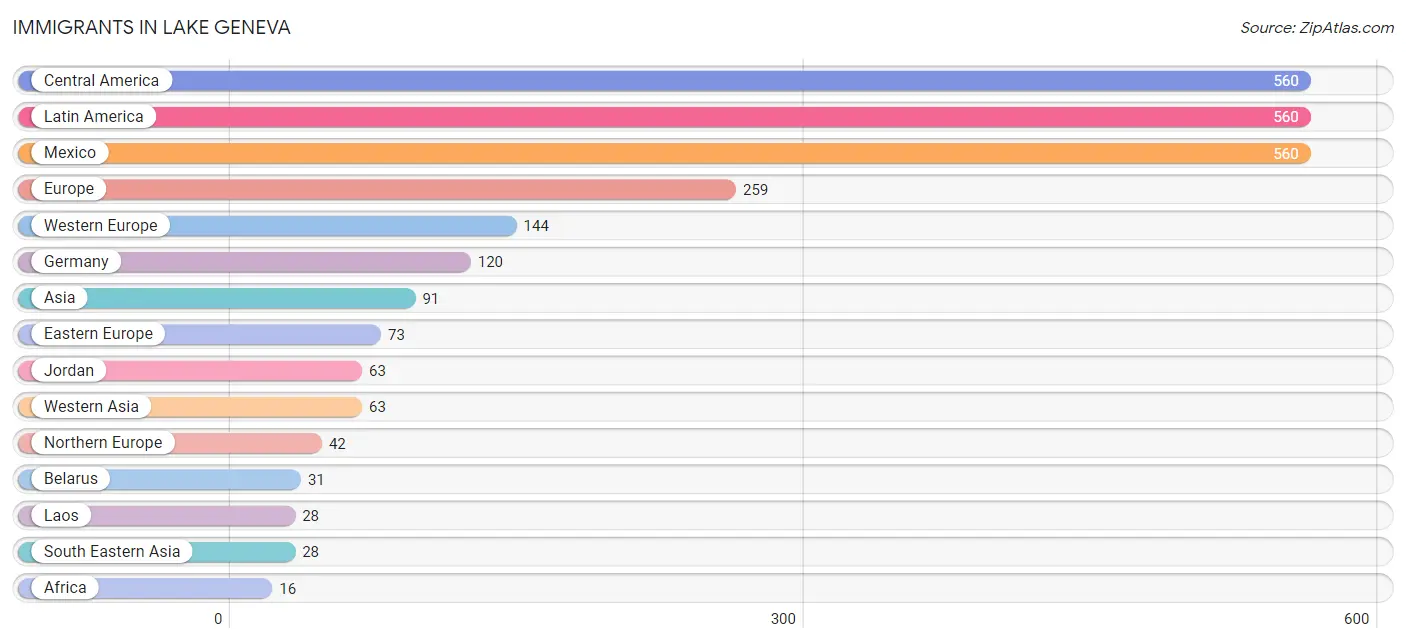
Immigrants in Lake Geneva
The most numerous immigrant groups reported in Lake Geneva came from Central America (560 | 6.7%), Latin America (560 | 6.7%), Mexico (560 | 6.7%), Europe (259 | 3.1%), and Western Europe (144 | 1.7%), together accounting for 25.0% of all Lake Geneva residents.
| Immigration Origin | # Population | % Population |
| Africa | 16 | 0.2% |
| Asia | 91 | 1.1% |
| Austria | 13 | 0.2% |
| Belarus | 31 | 0.4% |
| Canada | 9 | 0.1% |
| Central America | 560 | 6.7% |
| Croatia | 13 | 0.2% |
| Eastern Europe | 73 | 0.9% |
| England | 10 | 0.1% |
| Europe | 259 | 3.1% |
| France | 11 | 0.1% |
| Germany | 120 | 1.4% |
| Hungary | 8 | 0.1% |
| Jordan | 63 | 0.8% |
| Laos | 28 | 0.3% |
| Latin America | 560 | 6.7% |
| Mexico | 560 | 6.7% |
| Morocco | 16 | 0.2% |
| Northern Africa | 16 | 0.2% |
| Northern Europe | 42 | 0.5% |
| Romania | 11 | 0.1% |
| Serbia | 10 | 0.1% |
| South Eastern Asia | 28 | 0.3% |
| Western Asia | 63 | 0.8% |
| Western Europe | 144 | 1.7% | View All 25 Rows |
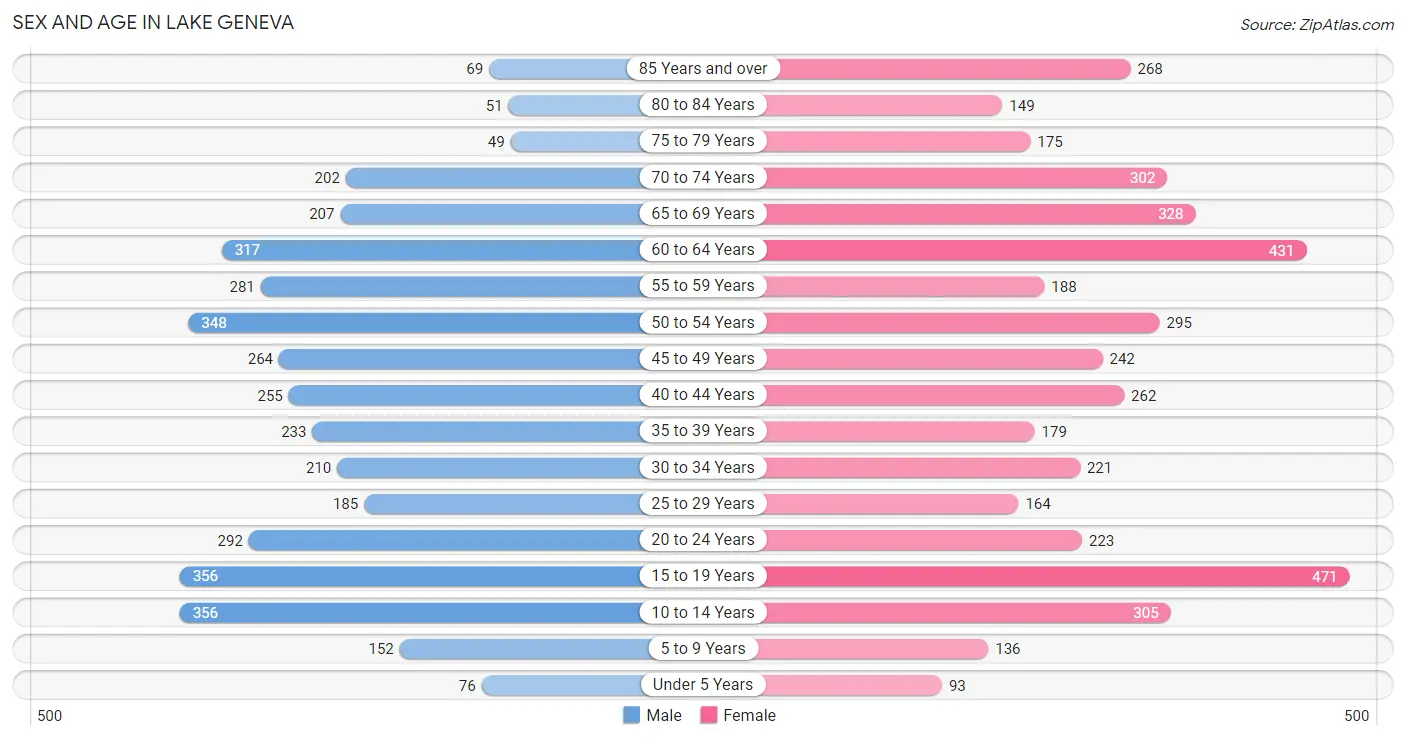
Sex and Age in Lake Geneva
Sex and Age in Lake Geneva
The most populous age groups in Lake Geneva are 10 to 14 Years (356 | 9.1%) for men and 15 to 19 Years (471 | 10.6%) for women.
| Age Bracket | Male | Female |
| Under 5 Years | 76 (1.9%) | 93 (2.1%) |
| 5 to 9 Years | 152 (3.9%) | 136 (3.1%) |
| 10 to 14 Years | 356 (9.1%) | 305 (6.9%) |
| 15 to 19 Years | 356 (9.1%) | 471 (10.6%) |
| 20 to 24 Years | 292 (7.5%) | 223 (5.0%) |
| 25 to 29 Years | 185 (4.7%) | 164 (3.7%) |
| 30 to 34 Years | 210 (5.4%) | 221 (5.0%) |
| 35 to 39 Years | 233 (6.0%) | 179 (4.0%) |
| 40 to 44 Years | 255 (6.5%) | 262 (5.9%) |
| 45 to 49 Years | 264 (6.8%) | 242 (5.5%) |
| 50 to 54 Years | 348 (8.9%) | 295 (6.7%) |
| 55 to 59 Years | 281 (7.2%) | 188 (4.2%) |
| 60 to 64 Years | 317 (8.1%) | 431 (9.7%) |
| 65 to 69 Years | 207 (5.3%) | 328 (7.4%) |
| 70 to 74 Years | 202 (5.2%) | 302 (6.8%) |
| 75 to 79 Years | 49 (1.3%) | 175 (4.0%) |
| 80 to 84 Years | 51 (1.3%) | 149 (3.4%) |
| 85 Years and over | 69 (1.8%) | 268 (6.0%) |
| Total | 3,903 (100.0%) | 4,432 (100.0%) |
Families and Households in Lake Geneva
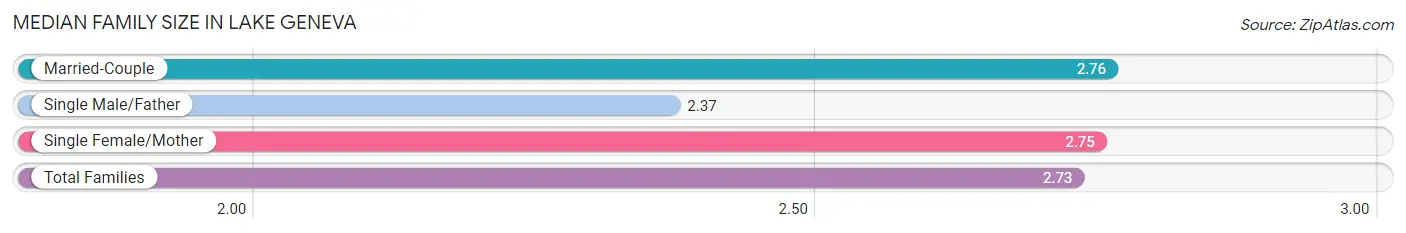
Median Family Size in Lake Geneva
The median family size in Lake Geneva is 2.73 persons per family, with married-couple families (1,541 | 70.4%) accounting for the largest median family size of 2.76 persons per family. On the other hand, single male/father families (143 | 6.5%) represent the smallest median family size with 2.37 persons per family.
| Family Type | # Families | Family Size |
| Married-Couple | 1,541 (70.4%) | 2.76 |
| Single Male/Father | 143 (6.5%) | 2.37 |
| Single Female/Mother | 505 (23.1%) | 2.75 |
| Total Families | 2,189 (100.0%) | 2.73 |
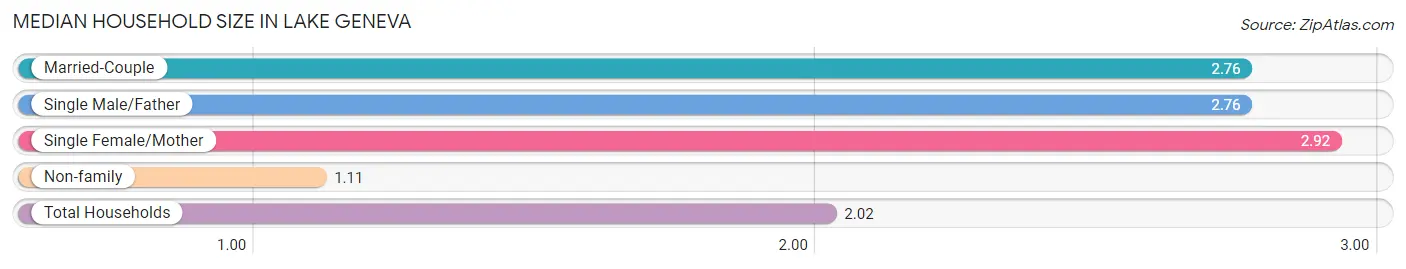
Median Household Size in Lake Geneva
The median household size in Lake Geneva is 2.02 persons per household, with single female/mother households (505 | 12.4%) accounting for the largest median household size of 2.92 persons per household. non-family households (1,884 | 46.3%) represent the smallest median household size with 1.11 persons per household.
| Household Type | # Households | Household Size |
| Married-Couple | 1,541 (37.8%) | 2.76 |
| Single Male/Father | 143 (3.5%) | 2.76 |
| Single Female/Mother | 505 (12.4%) | 2.92 |
| Non-family | 1,884 (46.3%) | 1.11 |
| Total Households | 4,073 (100.0%) | 2.02 |
Household Size by Marriage Status in Lake Geneva
Out of a total of 4,073 households in Lake Geneva, 2,189 (53.7%) are family households, while 1,884 (46.3%) are nonfamily households. The most numerous type of family households are 2-person households, comprising 1,277, and the most common type of nonfamily households are 1-person households, comprising 1,710.
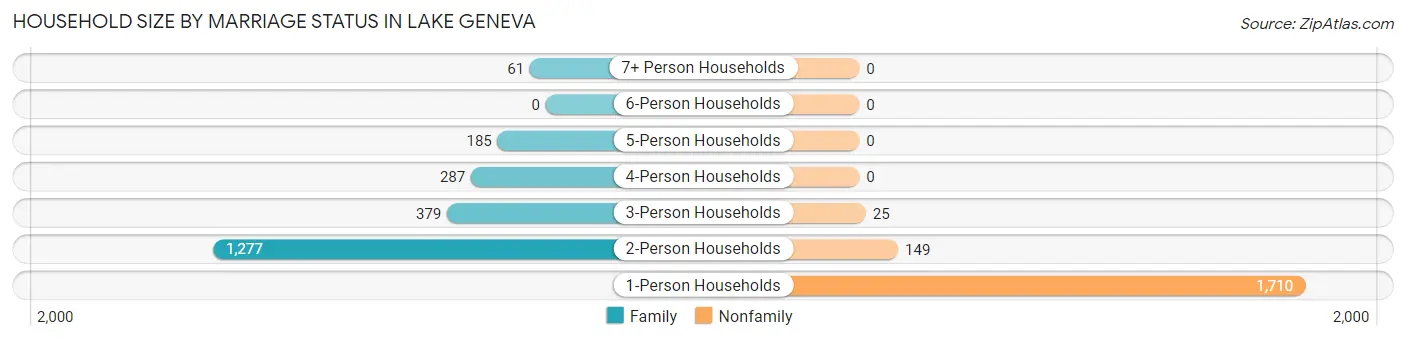
| Household Size | Family Households | Nonfamily Households |
| 1-Person Households | - | 1,710 (42.0%) |
| 2-Person Households | 1,277 (31.4%) | 149 (3.7%) |
| 3-Person Households | 379 (9.3%) | 25 (0.6%) |
| 4-Person Households | 287 (7.0%) | 0 (0.0%) |
| 5-Person Households | 185 (4.5%) | 0 (0.0%) |
| 6-Person Households | 0 (0.0%) | 0 (0.0%) |
| 7+ Person Households | 61 (1.5%) | 0 (0.0%) |
| Total | 2,189 (53.7%) | 1,884 (46.3%) |
Female Fertility in Lake Geneva
Fertility by Age in Lake Geneva
Average fertility rate in Lake Geneva is 8.0 births per 1,000 women. Women in the age bracket of 20 to 34 years have the highest fertility rate with 23.0 births per 1,000 women. Women in the age bracket of 20 to 34 years acount for 100.0% of all women with births.
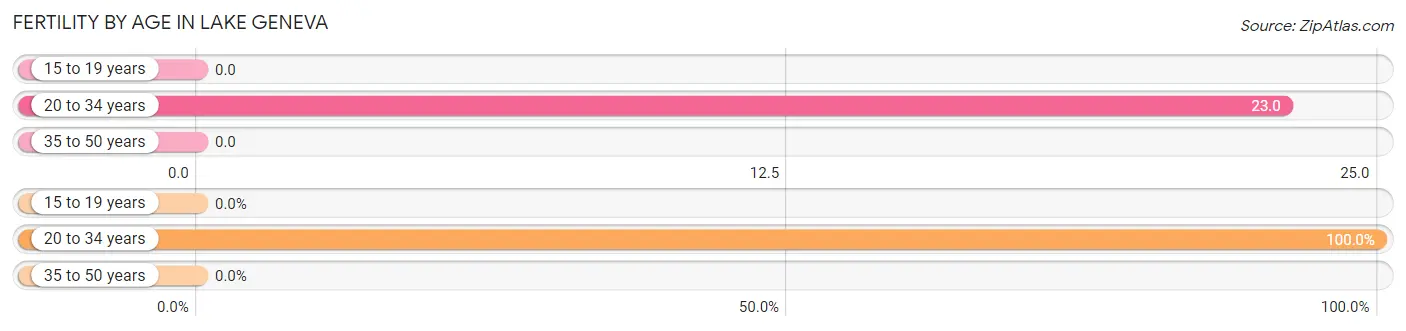
| Age Bracket | Women with Births | Births / 1,000 Women |
| 15 to 19 years | 0 (0.0%) | 0.0 |
| 20 to 34 years | 14 (100.0%) | 23.0 |
| 35 to 50 years | 0 (0.0%) | 0.0 |
| Total | 14 (100.0%) | 8.0 |
Fertility by Age by Marriage Status in Lake Geneva
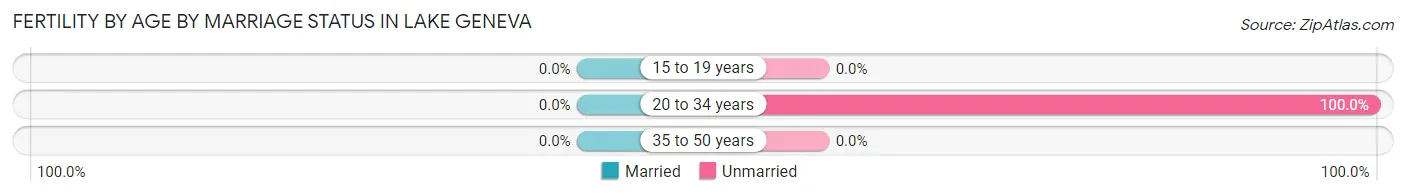
| Age Bracket | Married | Unmarried |
| 15 to 19 years | 0 (0.0%) | 0 (0.0%) |
| 20 to 34 years | 0 (0.0%) | 14 (100.0%) |
| 35 to 50 years | 0 (0.0%) | 0 (0.0%) |
| Total | 0 (0.0%) | 14 (100.0%) |
Fertility by Education in Lake Geneva
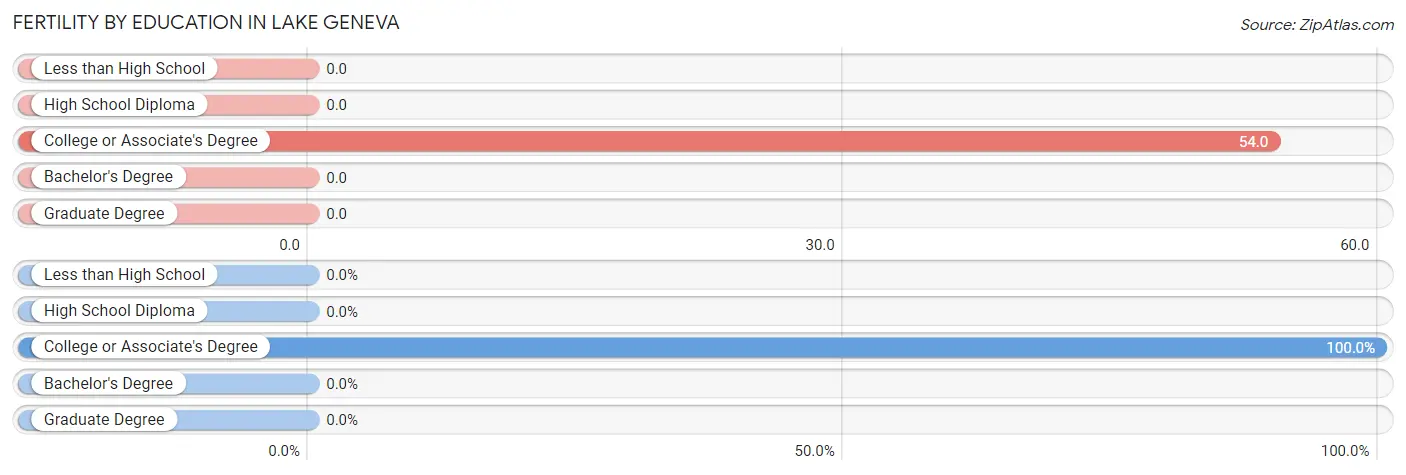
| Educational Attainment | Women with Births | Births / 1,000 Women |
| Less than High School | 0 (0.0%) | 0.0 |
| High School Diploma | 0 (0.0%) | 0.0 |
| College or Associate's Degree | 14 (100.0%) | 54.0 |
| Bachelor's Degree | 0 (0.0%) | 0.0 |
| Graduate Degree | 0 (0.0%) | 0.0 |
| Total | 14 (100.0%) | 8.0 |
Fertility by Education by Marriage Status in Lake Geneva
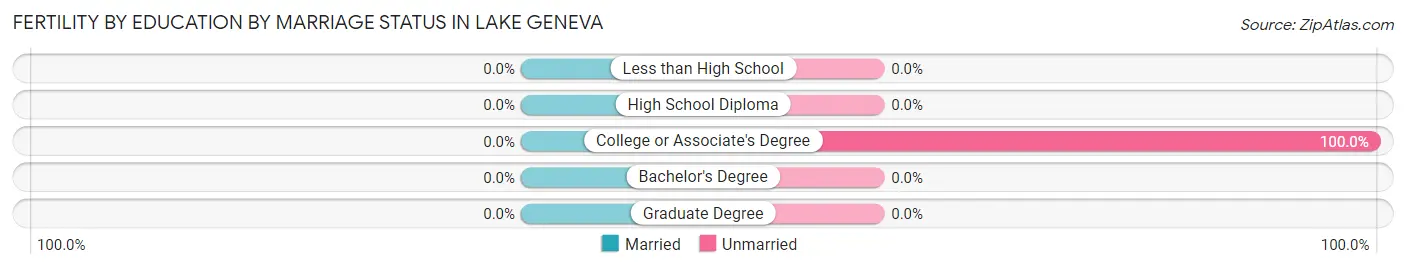
| Educational Attainment | Married | Unmarried |
| Less than High School | 0 (0.0%) | 0 (0.0%) |
| High School Diploma | 0 (0.0%) | 0 (0.0%) |
| College or Associate's Degree | 0 (0.0%) | 14 (100.0%) |
| Bachelor's Degree | 0 (0.0%) | 0 (0.0%) |
| Graduate Degree | 0 (0.0%) | 0 (0.0%) |
| Total | 0 (0.0%) | 14 (100.0%) |
Employment Characteristics in Lake Geneva
Employment by Class of Employer in Lake Geneva
Among the 4,372 employed individuals in Lake Geneva, private company employees (3,191 | 73.0%), not-for-profit organizations (482 | 11.0%), and local government employees (338 | 7.7%) make up the most common classes of employment.
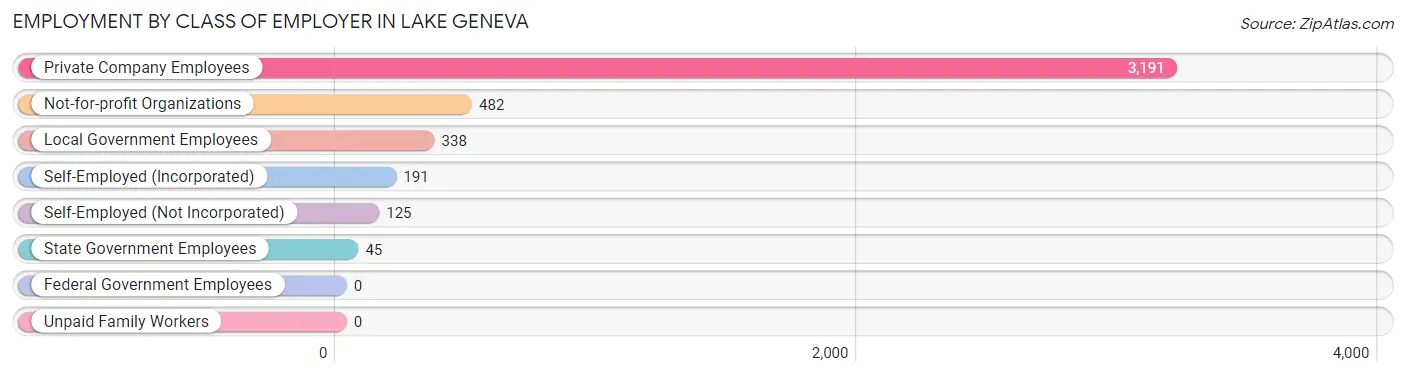
| Employer Class | # Employees | % Employees |
| Private Company Employees | 3,191 | 73.0% |
| Self-Employed (Incorporated) | 191 | 4.4% |
| Self-Employed (Not Incorporated) | 125 | 2.9% |
| Not-for-profit Organizations | 482 | 11.0% |
| Local Government Employees | 338 | 7.7% |
| State Government Employees | 45 | 1.0% |
| Federal Government Employees | 0 | 0.0% |
| Unpaid Family Workers | 0 | 0.0% |
| Total | 4,372 | 100.0% |
Employment Status by Age in Lake Geneva
According to the labor force statistics for Lake Geneva, out of the total population over 16 years of age (7,119), 64.2% or 4,570 individuals are in the labor force, with 3.7% or 169 of them unemployed. The age group with the highest labor force participation rate is 30 to 34 years, with 96.1% or 414 individuals in the labor force. Within the labor force, the 35 to 44 years age range has the highest percentage of unemployed individuals, with 9.5% or 84 of them being unemployed.
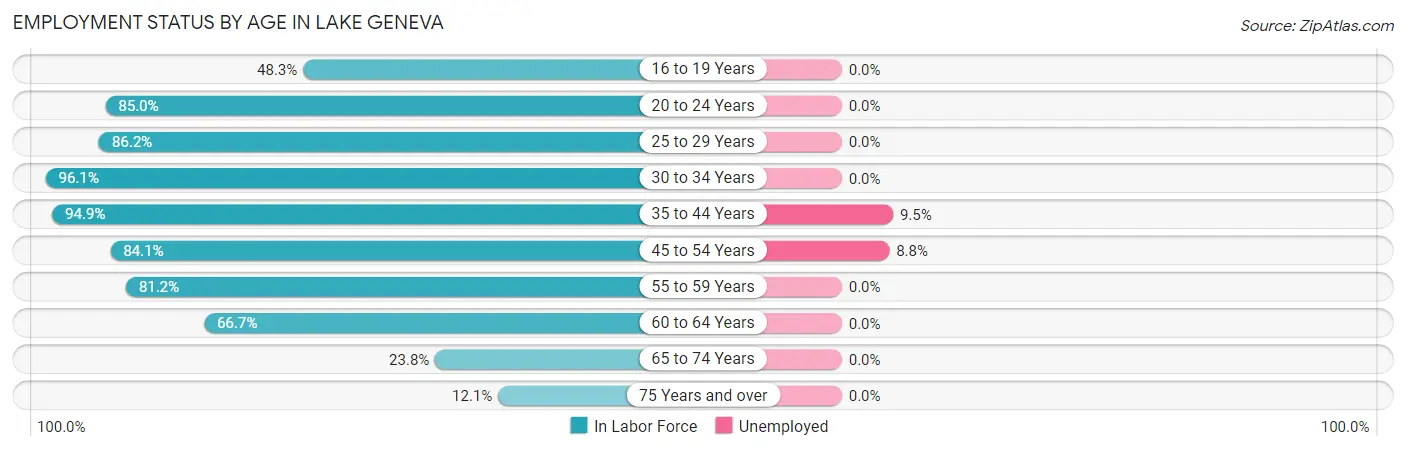
| Age Bracket | In Labor Force | Unemployed |
| 16 to 19 Years | 352 (48.3%) | 0 (0.0%) |
| 20 to 24 Years | 438 (85.0%) | 0 (0.0%) |
| 25 to 29 Years | 301 (86.2%) | 0 (0.0%) |
| 30 to 34 Years | 414 (96.1%) | 0 (0.0%) |
| 35 to 44 Years | 882 (94.9%) | 84 (9.5%) |
| 45 to 54 Years | 966 (84.1%) | 85 (8.8%) |
| 55 to 59 Years | 381 (81.2%) | 0 (0.0%) |
| 60 to 64 Years | 499 (66.7%) | 0 (0.0%) |
| 65 to 74 Years | 247 (23.8%) | 0 (0.0%) |
| 75 Years and over | 92 (12.1%) | 0 (0.0%) |
| Total | 4,570 (64.2%) | 169 (3.7%) |
Employment Status by Educational Attainment in Lake Geneva
According to labor force statistics for Lake Geneva, 84.5% of individuals (3,443) out of the total population between 25 and 64 years of age (4,075) are in the labor force, with 4.9% or 169 of them being unemployed. The group with the highest labor force participation rate are those with the educational attainment of bachelor's degree or higher, with 92.9% or 1,574 individuals in the labor force. Within the labor force, individuals with less than high school education have the highest percentage of unemployment, with 9.7% or 29 of them being unemployed.
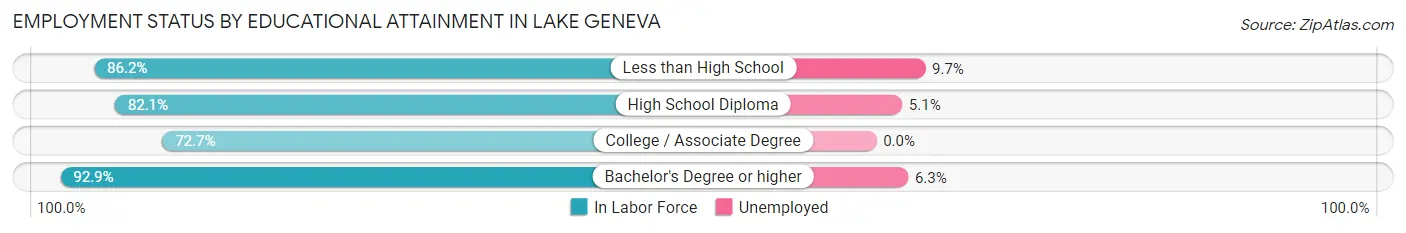
| Educational Attainment | In Labor Force | Unemployed |
| Less than High School | 300 (86.2%) | 34 (9.7%) |
| High School Diploma | 803 (82.1%) | 50 (5.1%) |
| College / Associate Degree | 767 (72.7%) | 0 (0.0%) |
| Bachelor's Degree or higher | 1,574 (92.9%) | 107 (6.3%) |
| Total | 3,443 (84.5%) | 200 (4.9%) |
Employment Occupations by Sex in Lake Geneva
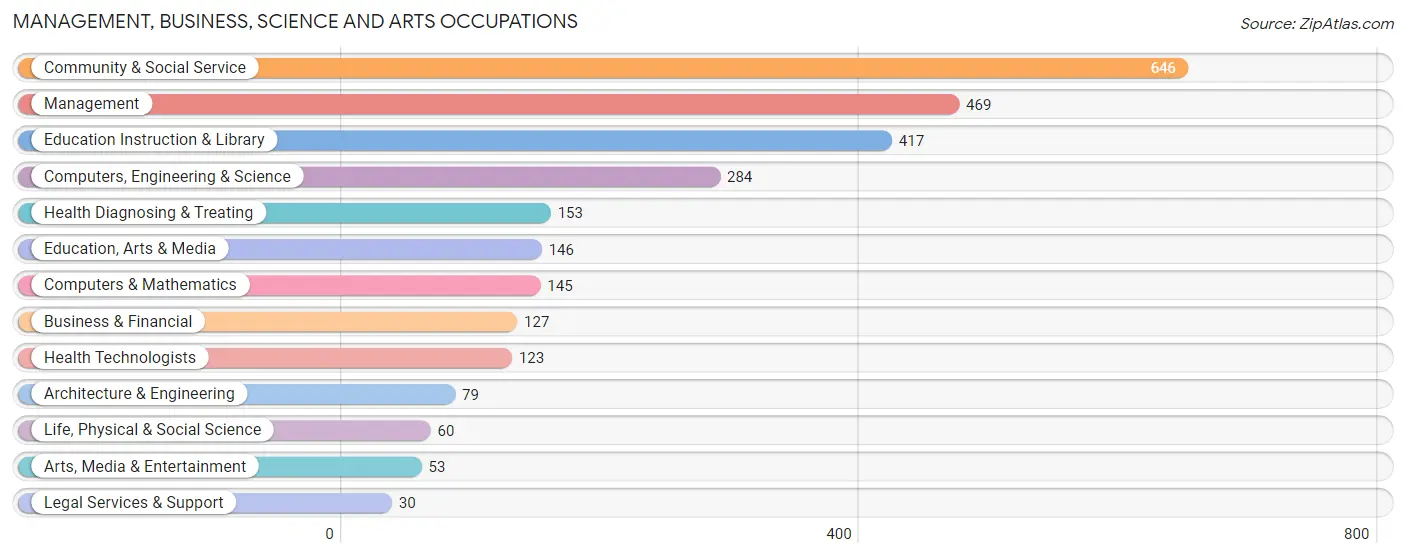
Management, Business, Science and Arts Occupations
The most common Management, Business, Science and Arts occupations in Lake Geneva are Community & Social Service (646 | 14.7%), Management (469 | 10.6%), Education Instruction & Library (417 | 9.5%), Computers, Engineering & Science (284 | 6.5%), and Health Diagnosing & Treating (153 | 3.5%).
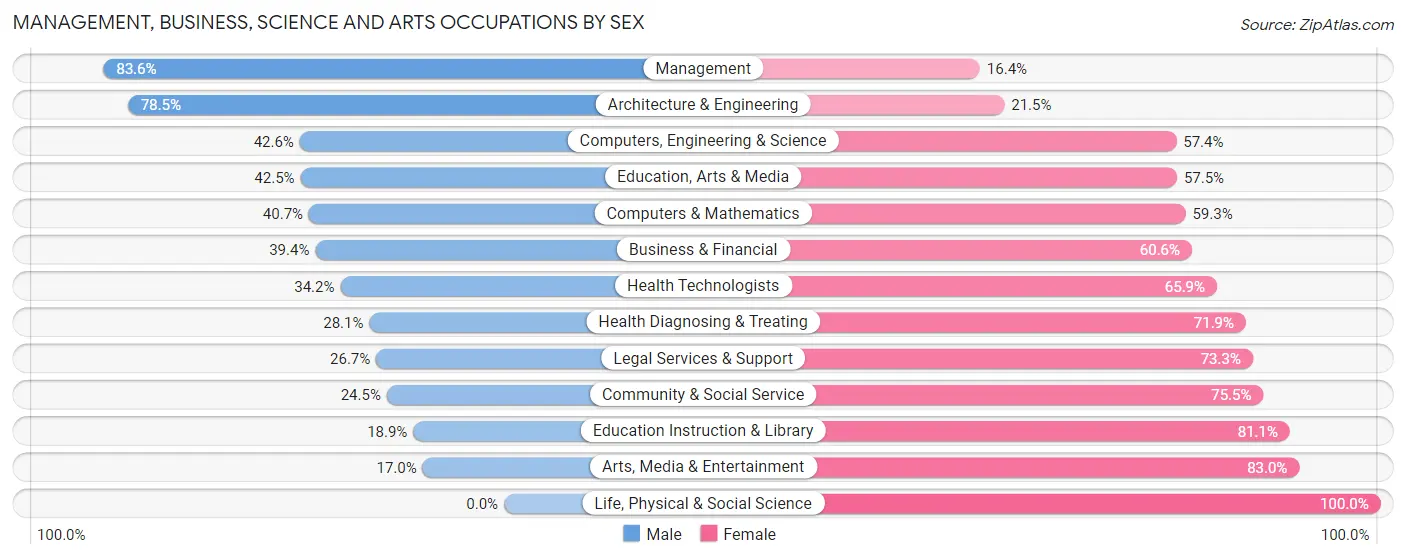
Management, Business, Science and Arts Occupations by Sex
Within the Management, Business, Science and Arts occupations in Lake Geneva, the most male-oriented occupations are Management (83.6%), Architecture & Engineering (78.5%), and Computers, Engineering & Science (42.6%), while the most female-oriented occupations are Life, Physical & Social Science (100.0%), Arts, Media & Entertainment (83.0%), and Education Instruction & Library (81.1%).
| Occupation | Male | Female |
| Management | 392 (83.6%) | 77 (16.4%) |
| Business & Financial | 50 (39.4%) | 77 (60.6%) |
| Computers, Engineering & Science | 121 (42.6%) | 163 (57.4%) |
| Computers & Mathematics | 59 (40.7%) | 86 (59.3%) |
| Architecture & Engineering | 62 (78.5%) | 17 (21.5%) |
| Life, Physical & Social Science | 0 (0.0%) | 60 (100.0%) |
| Community & Social Service | 158 (24.5%) | 488 (75.5%) |
| Education, Arts & Media | 62 (42.5%) | 84 (57.5%) |
| Legal Services & Support | 8 (26.7%) | 22 (73.3%) |
| Education Instruction & Library | 79 (18.9%) | 338 (81.1%) |
| Arts, Media & Entertainment | 9 (17.0%) | 44 (83.0%) |
| Health Diagnosing & Treating | 43 (28.1%) | 110 (71.9%) |
| Health Technologists | 42 (34.2%) | 81 (65.8%) |
| Total (Category) | 764 (45.5%) | 915 (54.5%) |
| Total (Overall) | 2,355 (53.5%) | 2,048 (46.5%) |
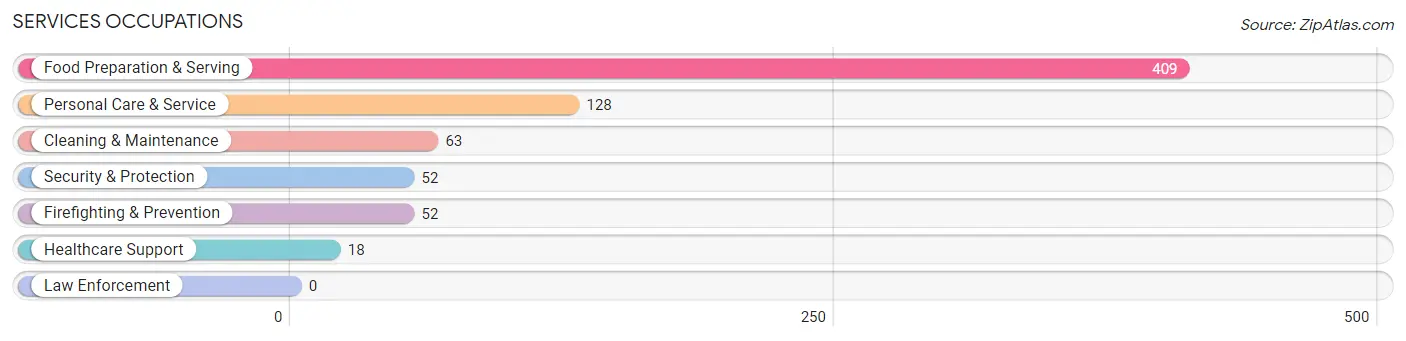
Services Occupations
The most common Services occupations in Lake Geneva are Food Preparation & Serving (409 | 9.3%), Personal Care & Service (128 | 2.9%), Cleaning & Maintenance (63 | 1.4%), Security & Protection (52 | 1.2%), and Firefighting & Prevention (52 | 1.2%).
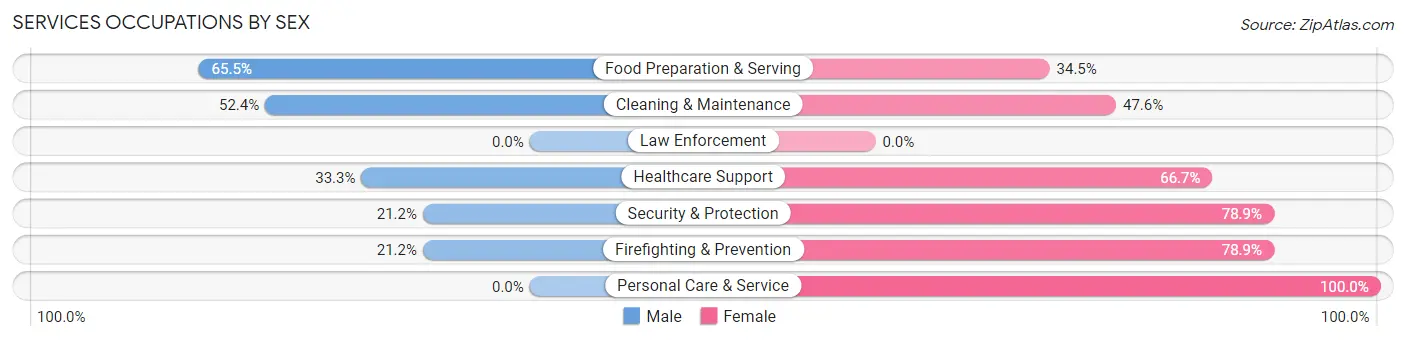
Services Occupations by Sex
Within the Services occupations in Lake Geneva, the most male-oriented occupations are Food Preparation & Serving (65.5%), Cleaning & Maintenance (52.4%), and Healthcare Support (33.3%), while the most female-oriented occupations are Personal Care & Service (100.0%), Security & Protection (78.8%), and Firefighting & Prevention (78.8%).
| Occupation | Male | Female |
| Healthcare Support | 6 (33.3%) | 12 (66.7%) |
| Security & Protection | 11 (21.1%) | 41 (78.8%) |
| Firefighting & Prevention | 11 (21.1%) | 41 (78.8%) |
| Law Enforcement | 0 (0.0%) | 0 (0.0%) |
| Food Preparation & Serving | 268 (65.5%) | 141 (34.5%) |
| Cleaning & Maintenance | 33 (52.4%) | 30 (47.6%) |
| Personal Care & Service | 0 (0.0%) | 128 (100.0%) |
| Total (Category) | 318 (47.5%) | 352 (52.5%) |
| Total (Overall) | 2,355 (53.5%) | 2,048 (46.5%) |
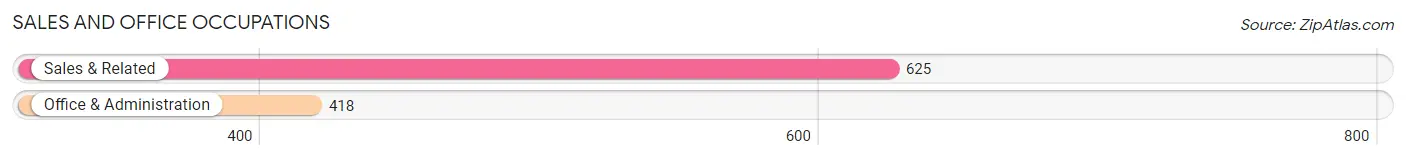
Sales and Office Occupations
The most common Sales and Office occupations in Lake Geneva are Sales & Related (625 | 14.2%), and Office & Administration (418 | 9.5%).
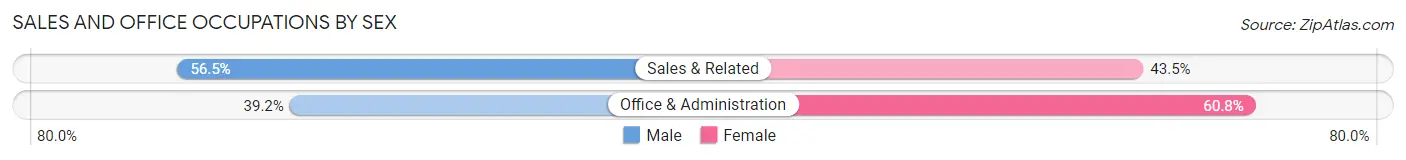
Sales and Office Occupations by Sex
| Occupation | Male | Female |
| Sales & Related | 353 (56.5%) | 272 (43.5%) |
| Office & Administration | 164 (39.2%) | 254 (60.8%) |
| Total (Category) | 517 (49.6%) | 526 (50.4%) |
| Total (Overall) | 2,355 (53.5%) | 2,048 (46.5%) |
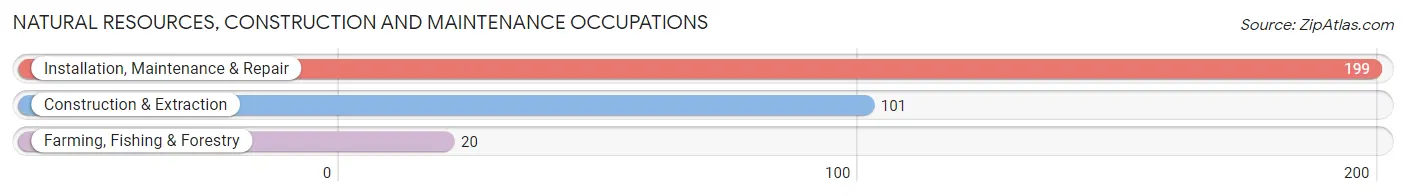
Natural Resources, Construction and Maintenance Occupations
The most common Natural Resources, Construction and Maintenance occupations in Lake Geneva are Installation, Maintenance & Repair (199 | 4.5%), Construction & Extraction (101 | 2.3%), and Farming, Fishing & Forestry (20 | 0.4%).
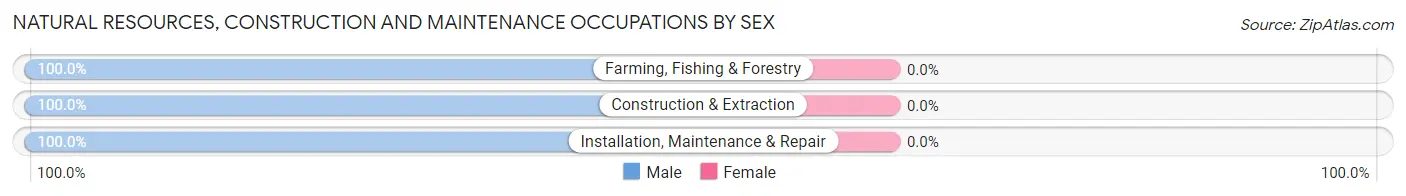
Natural Resources, Construction and Maintenance Occupations by Sex
| Occupation | Male | Female |
| Farming, Fishing & Forestry | 20 (100.0%) | 0 (0.0%) |
| Construction & Extraction | 101 (100.0%) | 0 (0.0%) |
| Installation, Maintenance & Repair | 199 (100.0%) | 0 (0.0%) |
| Total (Category) | 320 (100.0%) | 0 (0.0%) |
| Total (Overall) | 2,355 (53.5%) | 2,048 (46.5%) |
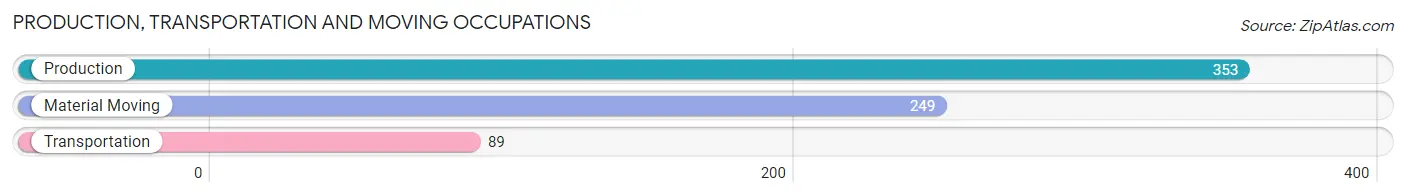
Production, Transportation and Moving Occupations
The most common Production, Transportation and Moving occupations in Lake Geneva are Production (353 | 8.0%), Material Moving (249 | 5.7%), and Transportation (89 | 2.0%).
Production, Transportation and Moving Occupations by Sex
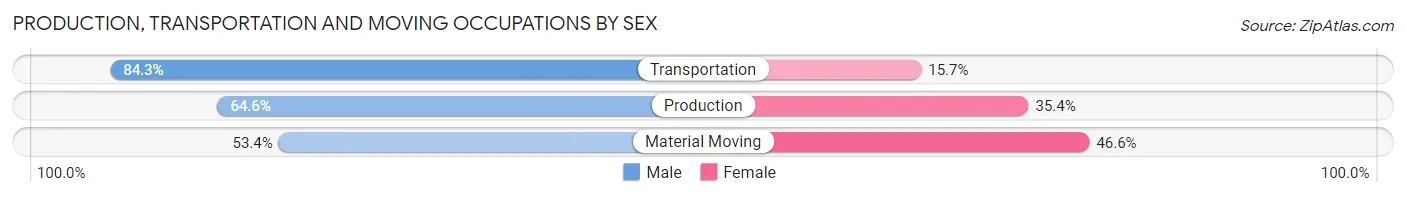
| Occupation | Male | Female |
| Production | 228 (64.6%) | 125 (35.4%) |
| Transportation | 75 (84.3%) | 14 (15.7%) |
| Material Moving | 133 (53.4%) | 116 (46.6%) |
| Total (Category) | 436 (63.1%) | 255 (36.9%) |
| Total (Overall) | 2,355 (53.5%) | 2,048 (46.5%) |
Employment Industries by Sex in Lake Geneva
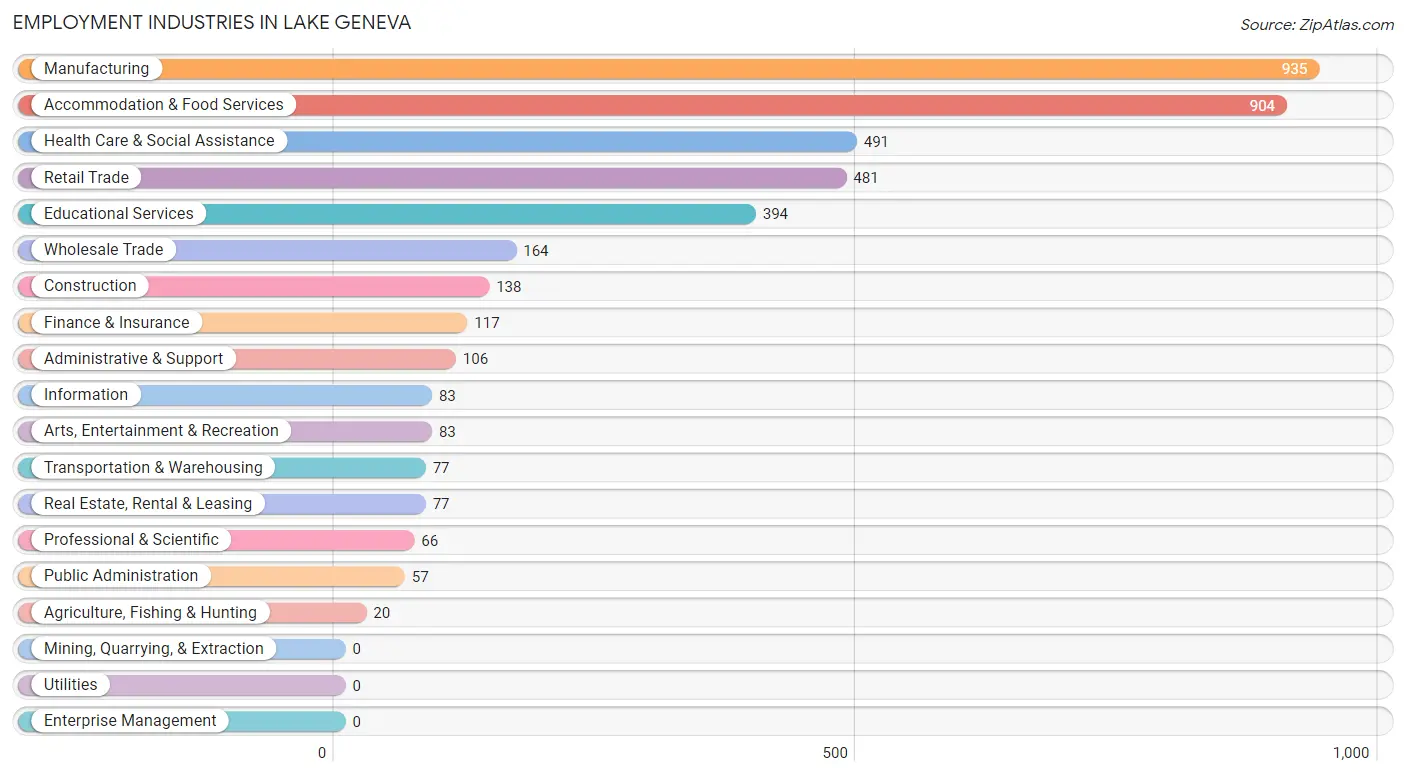
Employment Industries in Lake Geneva
The major employment industries in Lake Geneva include Manufacturing (935 | 21.2%), Accommodation & Food Services (904 | 20.5%), Health Care & Social Assistance (491 | 11.2%), Retail Trade (481 | 10.9%), and Educational Services (394 | 8.9%).
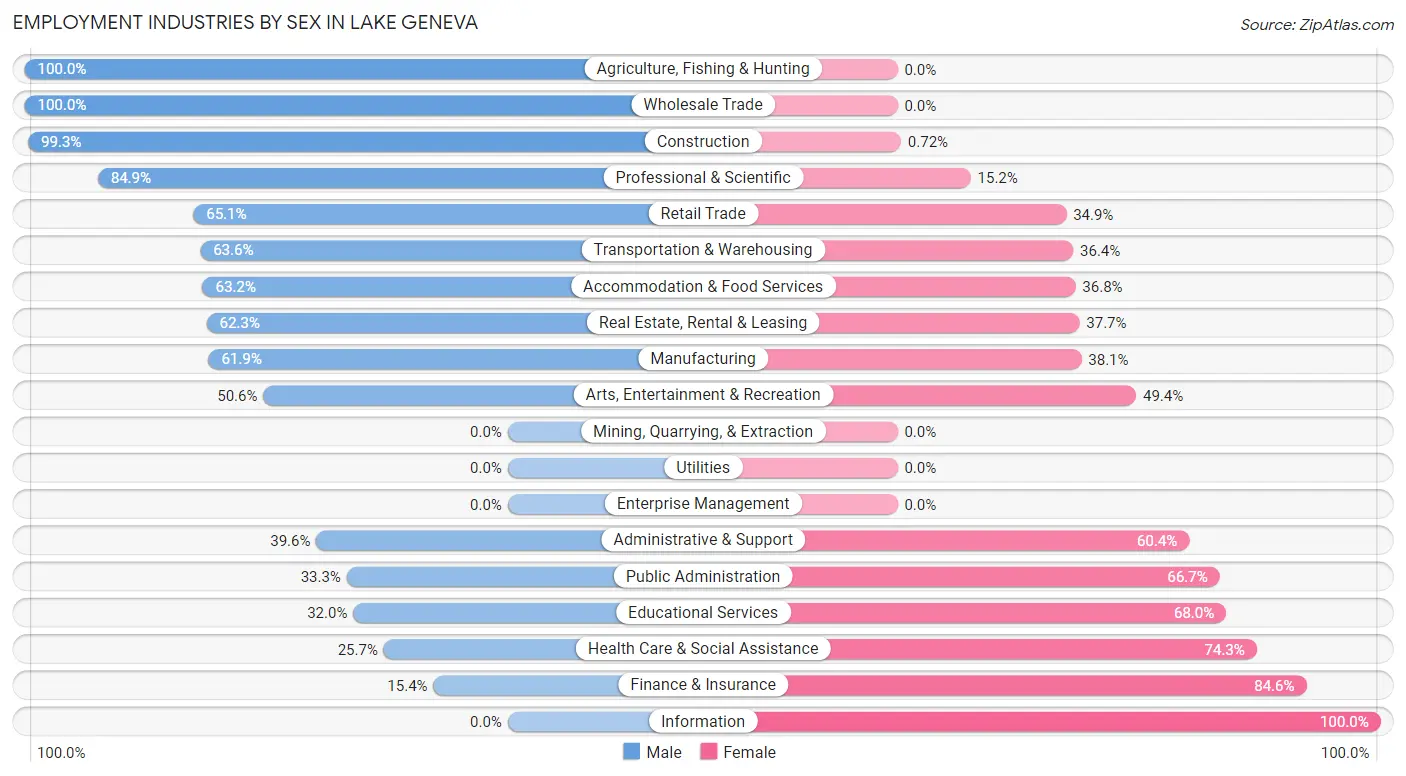
Employment Industries by Sex in Lake Geneva
The Lake Geneva industries that see more men than women are Agriculture, Fishing & Hunting (100.0%), Wholesale Trade (100.0%), and Construction (99.3%), whereas the industries that tend to have a higher number of women are Information (100.0%), Finance & Insurance (84.6%), and Health Care & Social Assistance (74.3%).
| Industry | Male | Female |
| Agriculture, Fishing & Hunting | 20 (100.0%) | 0 (0.0%) |
| Mining, Quarrying, & Extraction | 0 (0.0%) | 0 (0.0%) |
| Construction | 137 (99.3%) | 1 (0.7%) |
| Manufacturing | 579 (61.9%) | 356 (38.1%) |
| Wholesale Trade | 164 (100.0%) | 0 (0.0%) |
| Retail Trade | 313 (65.1%) | 168 (34.9%) |
| Transportation & Warehousing | 49 (63.6%) | 28 (36.4%) |
| Utilities | 0 (0.0%) | 0 (0.0%) |
| Information | 0 (0.0%) | 83 (100.0%) |
| Finance & Insurance | 18 (15.4%) | 99 (84.6%) |
| Real Estate, Rental & Leasing | 48 (62.3%) | 29 (37.7%) |
| Professional & Scientific | 56 (84.9%) | 10 (15.1%) |
| Enterprise Management | 0 (0.0%) | 0 (0.0%) |
| Administrative & Support | 42 (39.6%) | 64 (60.4%) |
| Educational Services | 126 (32.0%) | 268 (68.0%) |
| Health Care & Social Assistance | 126 (25.7%) | 365 (74.3%) |
| Arts, Entertainment & Recreation | 42 (50.6%) | 41 (49.4%) |
| Accommodation & Food Services | 571 (63.2%) | 333 (36.8%) |
| Public Administration | 19 (33.3%) | 38 (66.7%) |
| Total | 2,355 (53.5%) | 2,048 (46.5%) |
Education in Lake Geneva
School Enrollment in Lake Geneva
The most common levels of schooling among the 1,902 students in Lake Geneva are high school (664 | 34.9%), middle school (560 | 29.4%), and college / undergraduate (300 | 15.8%).
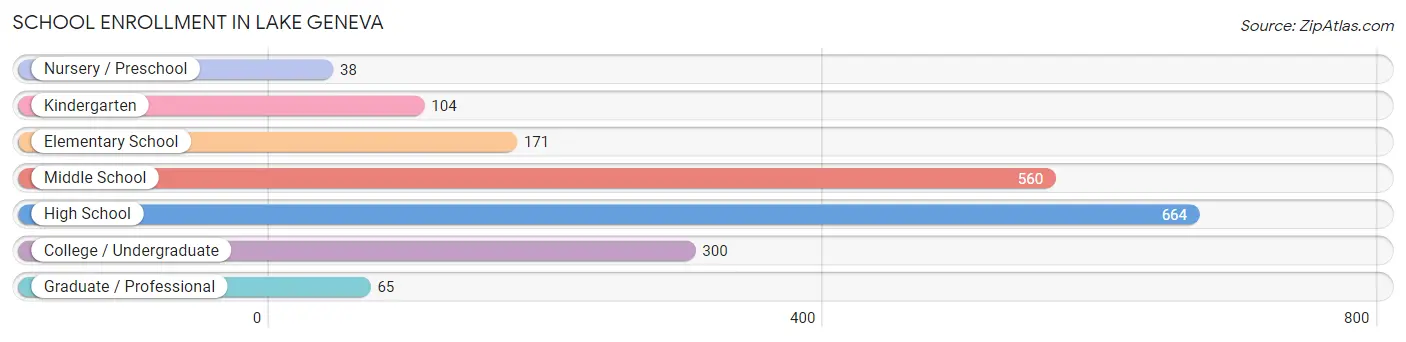
| School Level | # Students | % Students |
| Nursery / Preschool | 38 | 2.0% |
| Kindergarten | 104 | 5.5% |
| Elementary School | 171 | 9.0% |
| Middle School | 560 | 29.4% |
| High School | 664 | 34.9% |
| College / Undergraduate | 300 | 15.8% |
| Graduate / Professional | 65 | 3.4% |
| Total | 1,902 | 100.0% |
School Enrollment by Age by Funding Source in Lake Geneva
Out of a total of 1,902 students who are enrolled in schools in Lake Geneva, 164 (8.6%) attend a private institution, while the remaining 1,738 (91.4%) are enrolled in public schools. The age group of 35 years and over has the highest likelihood of being enrolled in private schools, with 81 (100.0% in the age bracket) enrolled. Conversely, the age group of 5 to 9 year old has the lowest likelihood of being enrolled in a private school, with 265 (100.0% in the age bracket) attending a public institution.
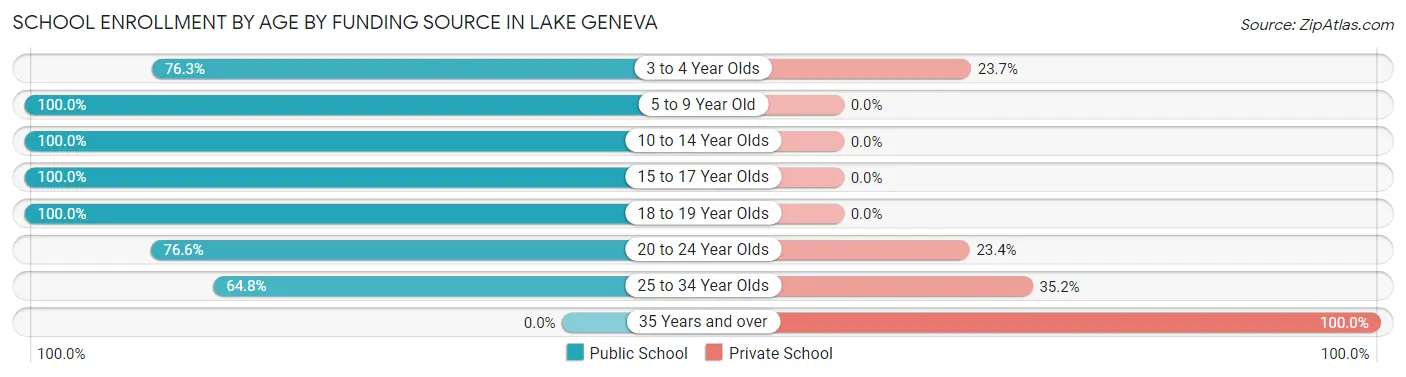
| Age Bracket | Public School | Private School |
| 3 to 4 Year Olds | 29 (76.3%) | 9 (23.7%) |
| 5 to 9 Year Old | 265 (100.0%) | 0 (0.0%) |
| 10 to 14 Year Olds | 661 (100.0%) | 0 (0.0%) |
| 15 to 17 Year Olds | 438 (100.0%) | 0 (0.0%) |
| 18 to 19 Year Olds | 153 (100.0%) | 0 (0.0%) |
| 20 to 24 Year Olds | 134 (76.6%) | 41 (23.4%) |
| 25 to 34 Year Olds | 59 (64.8%) | 32 (35.2%) |
| 35 Years and over | 0 (0.0%) | 81 (100.0%) |
| Total | 1,738 (91.4%) | 164 (8.6%) |
Educational Attainment by Field of Study in Lake Geneva
Business (491 | 18.1%), education (477 | 17.6%), science & technology (270 | 10.0%), social sciences (258 | 9.5%), and psychology (155 | 5.7%) are the most common fields of study among 2,712 individuals in Lake Geneva who have obtained a bachelor's degree or higher.
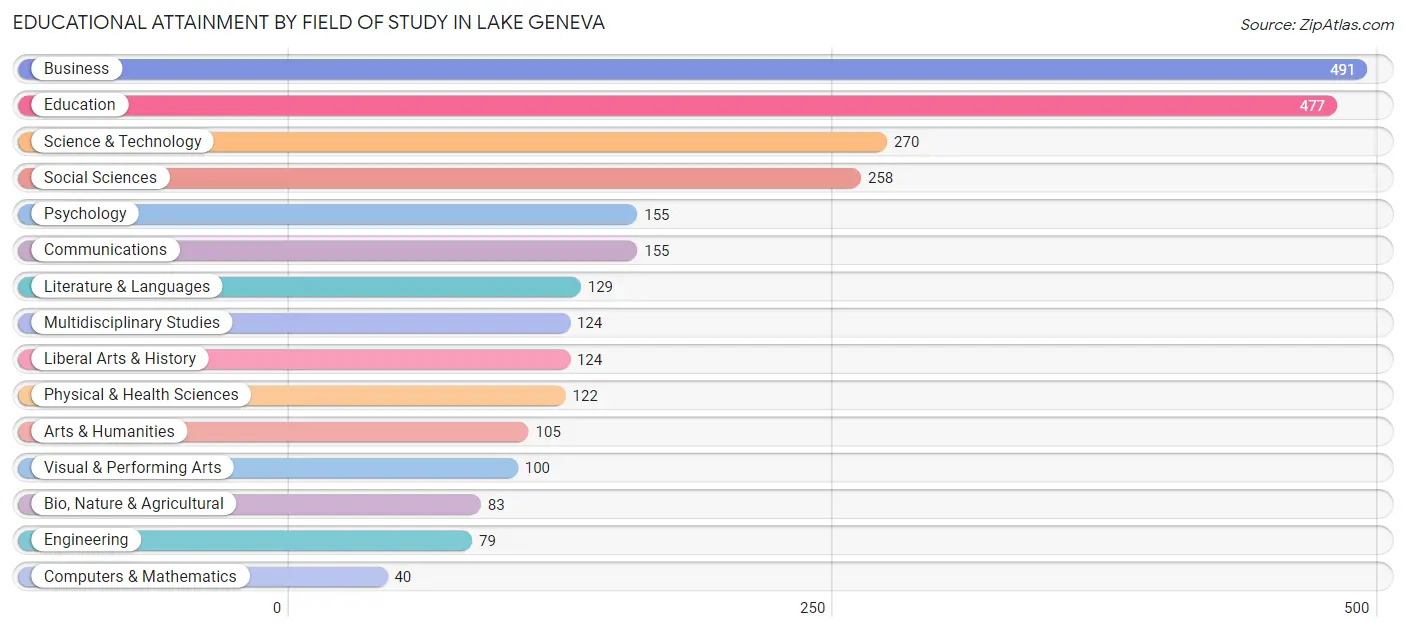
| Field of Study | # Graduates | % Graduates |
| Computers & Mathematics | 40 | 1.5% |
| Bio, Nature & Agricultural | 83 | 3.1% |
| Physical & Health Sciences | 122 | 4.5% |
| Psychology | 155 | 5.7% |
| Social Sciences | 258 | 9.5% |
| Engineering | 79 | 2.9% |
| Multidisciplinary Studies | 124 | 4.6% |
| Science & Technology | 270 | 10.0% |
| Business | 491 | 18.1% |
| Education | 477 | 17.6% |
| Literature & Languages | 129 | 4.8% |
| Liberal Arts & History | 124 | 4.6% |
| Visual & Performing Arts | 100 | 3.7% |
| Communications | 155 | 5.7% |
| Arts & Humanities | 105 | 3.9% |
| Total | 2,712 | 100.0% |
Transportation & Commute in Lake Geneva
Vehicle Availability by Sex in Lake Geneva
The most prevalent vehicle ownership categories in Lake Geneva are males with 2 vehicles (1,237, accounting for 53.6%) and females with 2 vehicles (933, making up 60.9%).
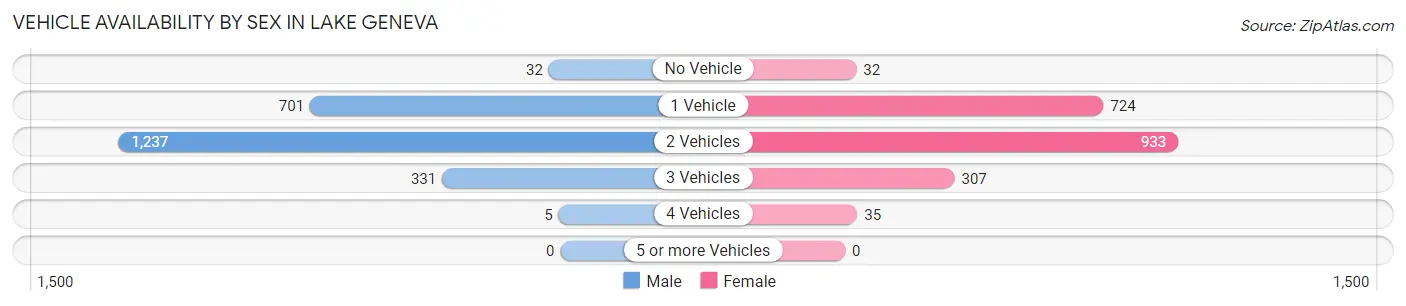
| Vehicles Available | Male | Female |
| No Vehicle | 32 (1.4%) | 32 (1.6%) |
| 1 Vehicle | 701 (30.4%) | 724 (35.6%) |
| 2 Vehicles | 1,237 (53.6%) | 933 (45.9%) |
| 3 Vehicles | 331 (14.3%) | 307 (15.1%) |
| 4 Vehicles | 5 (0.2%) | 35 (1.7%) |
| 5 or more Vehicles | 0 (0.0%) | 0 (0.0%) |
| Total | 2,306 (100.0%) | 2,031 (100.0%) |
Commute Time in Lake Geneva
The most frequently occuring commute durations in Lake Geneva are 5 to 9 minutes (846 commuters, 21.5%), 10 to 14 minutes (685 commuters, 17.4%), and 20 to 24 minutes (463 commuters, 11.8%).
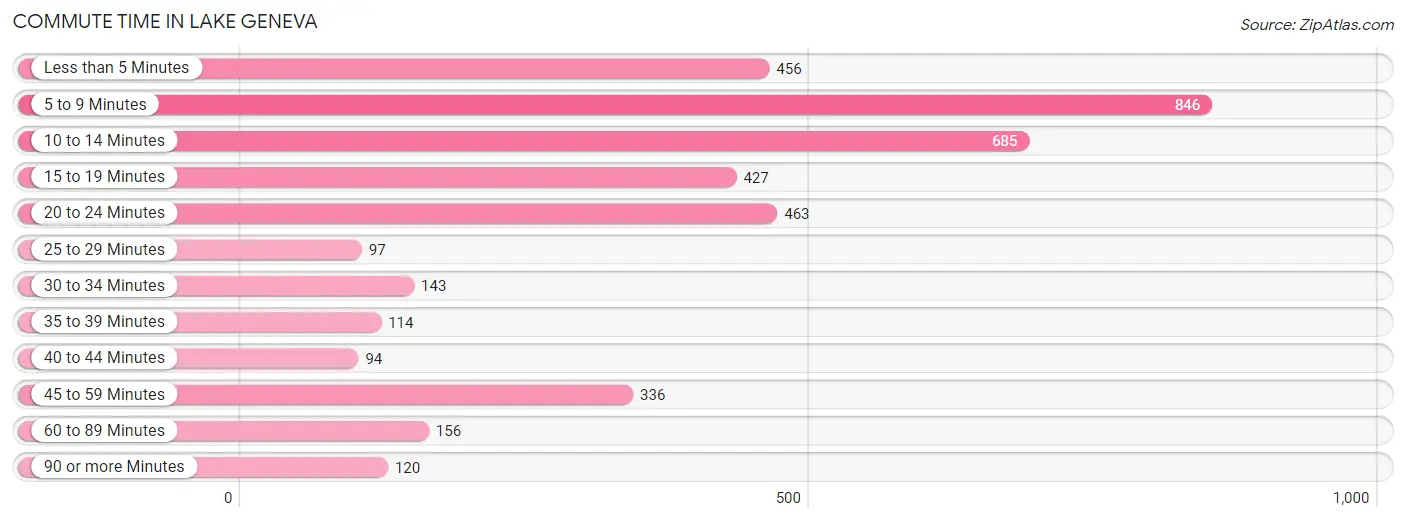
| Commute Time | # Commuters | % Commuters |
| Less than 5 Minutes | 456 | 11.6% |
| 5 to 9 Minutes | 846 | 21.5% |
| 10 to 14 Minutes | 685 | 17.4% |
| 15 to 19 Minutes | 427 | 10.8% |
| 20 to 24 Minutes | 463 | 11.8% |
| 25 to 29 Minutes | 97 | 2.5% |
| 30 to 34 Minutes | 143 | 3.6% |
| 35 to 39 Minutes | 114 | 2.9% |
| 40 to 44 Minutes | 94 | 2.4% |
| 45 to 59 Minutes | 336 | 8.5% |
| 60 to 89 Minutes | 156 | 4.0% |
| 90 or more Minutes | 120 | 3.0% |
Commute Time by Sex in Lake Geneva
The most common commute times in Lake Geneva are 5 to 9 minutes (616 commuters, 28.6%) for males and 10 to 14 minutes (371 commuters, 20.8%) for females.
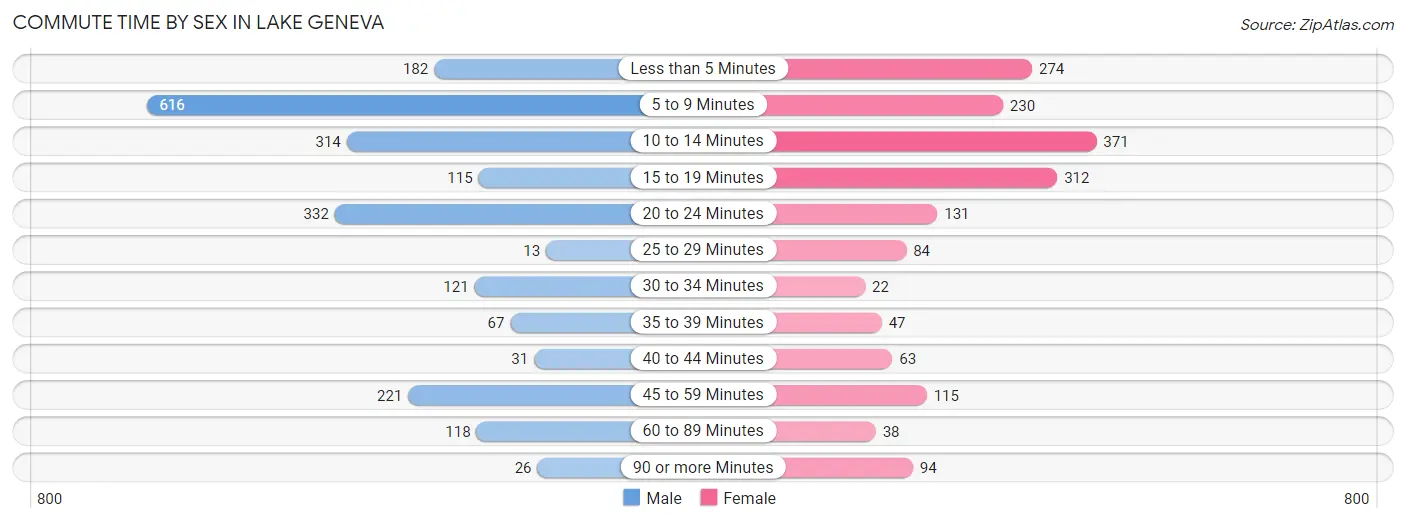
| Commute Time | Male | Female |
| Less than 5 Minutes | 182 (8.4%) | 274 (15.4%) |
| 5 to 9 Minutes | 616 (28.6%) | 230 (12.9%) |
| 10 to 14 Minutes | 314 (14.6%) | 371 (20.8%) |
| 15 to 19 Minutes | 115 (5.3%) | 312 (17.5%) |
| 20 to 24 Minutes | 332 (15.4%) | 131 (7.4%) |
| 25 to 29 Minutes | 13 (0.6%) | 84 (4.7%) |
| 30 to 34 Minutes | 121 (5.6%) | 22 (1.2%) |
| 35 to 39 Minutes | 67 (3.1%) | 47 (2.6%) |
| 40 to 44 Minutes | 31 (1.4%) | 63 (3.5%) |
| 45 to 59 Minutes | 221 (10.2%) | 115 (6.5%) |
| 60 to 89 Minutes | 118 (5.5%) | 38 (2.1%) |
| 90 or more Minutes | 26 (1.2%) | 94 (5.3%) |
Time of Departure to Work by Sex in Lake Geneva
The most frequent times of departure to work in Lake Geneva are 6:30 AM to 6:59 AM (245, 11.4%) for males and 7:30 AM to 7:59 AM (290, 16.3%) for females.
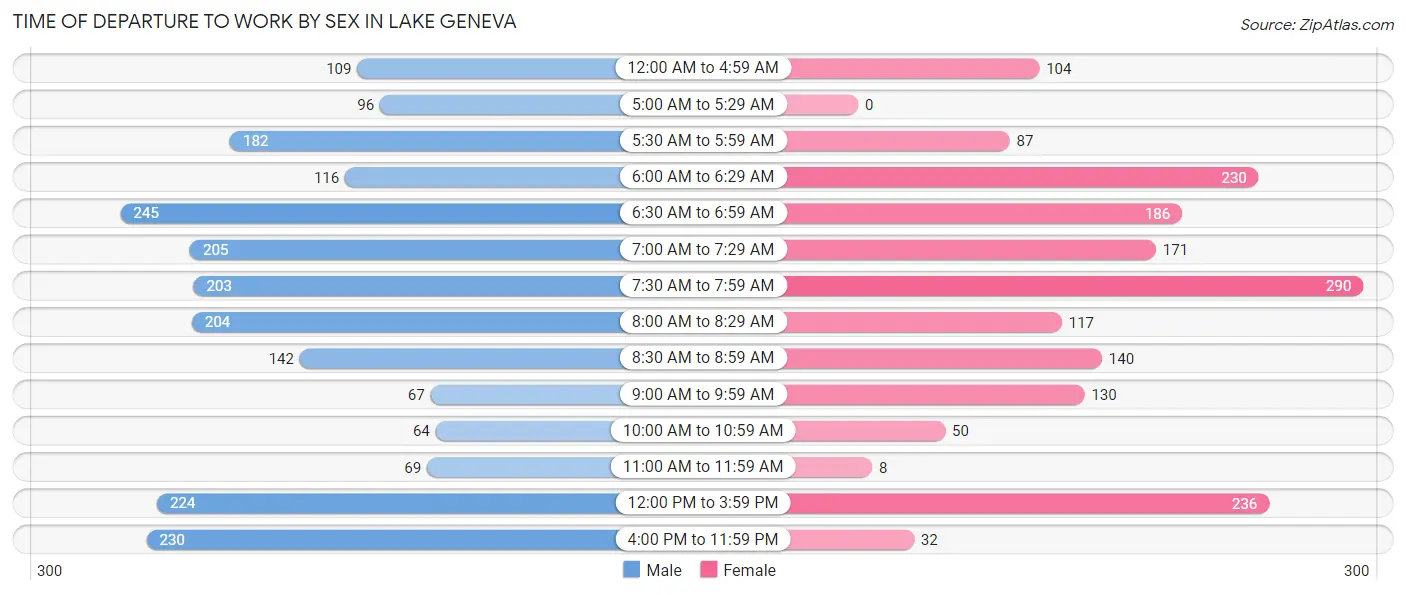
| Time of Departure | Male | Female |
| 12:00 AM to 4:59 AM | 109 (5.1%) | 104 (5.8%) |
| 5:00 AM to 5:29 AM | 96 (4.4%) | 0 (0.0%) |
| 5:30 AM to 5:59 AM | 182 (8.4%) | 87 (4.9%) |
| 6:00 AM to 6:29 AM | 116 (5.4%) | 230 (12.9%) |
| 6:30 AM to 6:59 AM | 245 (11.4%) | 186 (10.4%) |
| 7:00 AM to 7:29 AM | 205 (9.5%) | 171 (9.6%) |
| 7:30 AM to 7:59 AM | 203 (9.4%) | 290 (16.3%) |
| 8:00 AM to 8:29 AM | 204 (9.5%) | 117 (6.6%) |
| 8:30 AM to 8:59 AM | 142 (6.6%) | 140 (7.9%) |
| 9:00 AM to 9:59 AM | 67 (3.1%) | 130 (7.3%) |
| 10:00 AM to 10:59 AM | 64 (3.0%) | 50 (2.8%) |
| 11:00 AM to 11:59 AM | 69 (3.2%) | 8 (0.4%) |
| 12:00 PM to 3:59 PM | 224 (10.4%) | 236 (13.3%) |
| 4:00 PM to 11:59 PM | 230 (10.7%) | 32 (1.8%) |
| Total | 2,156 (100.0%) | 1,781 (100.0%) |
Housing Occupancy in Lake Geneva
Occupancy by Ownership in Lake Geneva
Of the total 4,073 dwellings in Lake Geneva, owner-occupied units account for 2,112 (51.8%), while renter-occupied units make up 1,961 (48.1%).
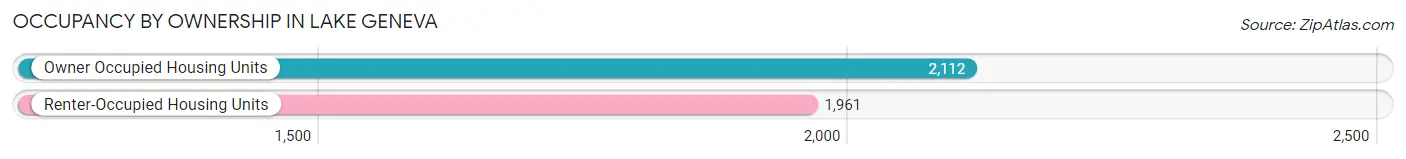
| Occupancy | # Housing Units | % Housing Units |
| Owner Occupied Housing Units | 2,112 | 51.8% |
| Renter-Occupied Housing Units | 1,961 | 48.1% |
| Total Occupied Housing Units | 4,073 | 100.0% |
Occupancy by Household Size in Lake Geneva
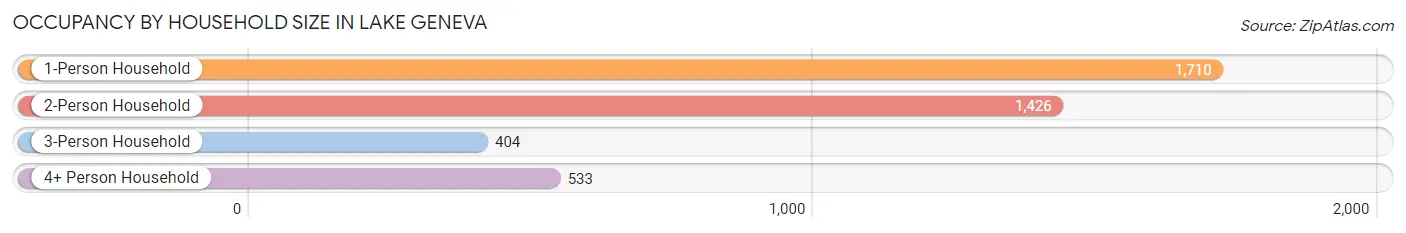
| Household Size | # Housing Units | % Housing Units |
| 1-Person Household | 1,710 | 42.0% |
| 2-Person Household | 1,426 | 35.0% |
| 3-Person Household | 404 | 9.9% |
| 4+ Person Household | 533 | 13.1% |
| Total Housing Units | 4,073 | 100.0% |
Occupancy by Ownership by Household Size in Lake Geneva
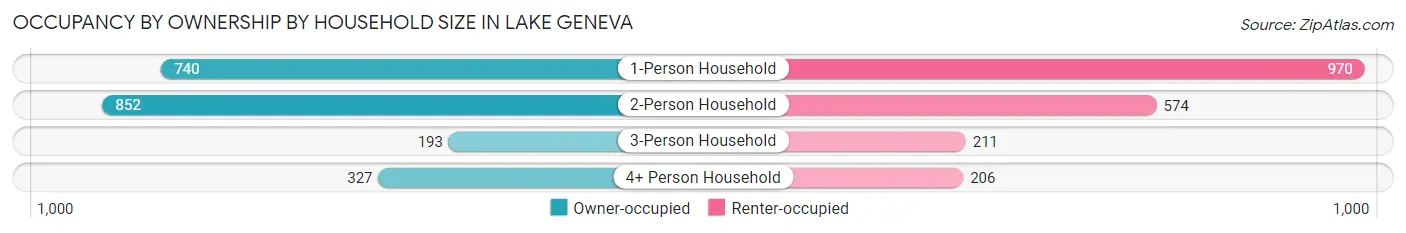
| Household Size | Owner-occupied | Renter-occupied |
| 1-Person Household | 740 (43.3%) | 970 (56.7%) |
| 2-Person Household | 852 (59.8%) | 574 (40.3%) |
| 3-Person Household | 193 (47.8%) | 211 (52.2%) |
| 4+ Person Household | 327 (61.4%) | 206 (38.7%) |
| Total Housing Units | 2,112 (51.8%) | 1,961 (48.1%) |
Occupancy by Educational Attainment in Lake Geneva
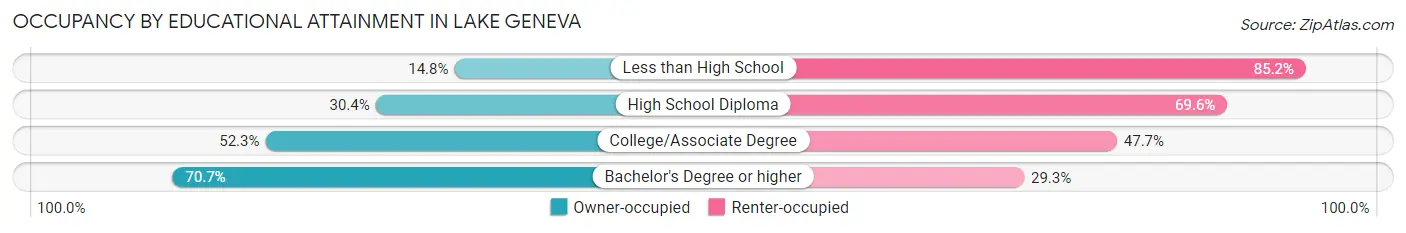
| Household Size | Owner-occupied | Renter-occupied |
| Less than High School | 44 (14.8%) | 253 (85.2%) |
| High School Diploma | 296 (30.4%) | 677 (69.6%) |
| College/Associate Degree | 595 (52.3%) | 543 (47.7%) |
| Bachelor's Degree or higher | 1,177 (70.7%) | 488 (29.3%) |
Occupancy by Age of Householder in Lake Geneva
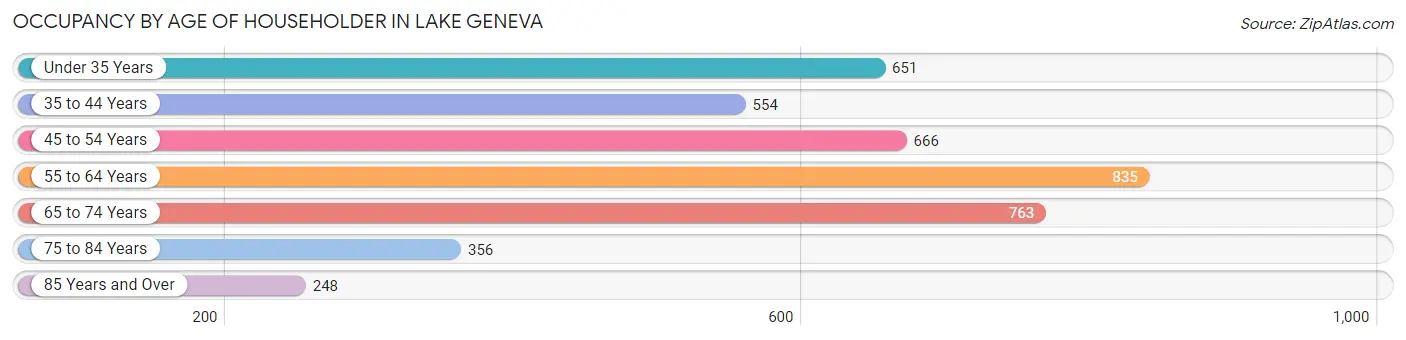
| Age Bracket | # Households | % Households |
| Under 35 Years | 651 | 16.0% |
| 35 to 44 Years | 554 | 13.6% |
| 45 to 54 Years | 666 | 16.4% |
| 55 to 64 Years | 835 | 20.5% |
| 65 to 74 Years | 763 | 18.7% |
| 75 to 84 Years | 356 | 8.7% |
| 85 Years and Over | 248 | 6.1% |
| Total | 4,073 | 100.0% |
Housing Finances in Lake Geneva
Median Income by Occupancy in Lake Geneva
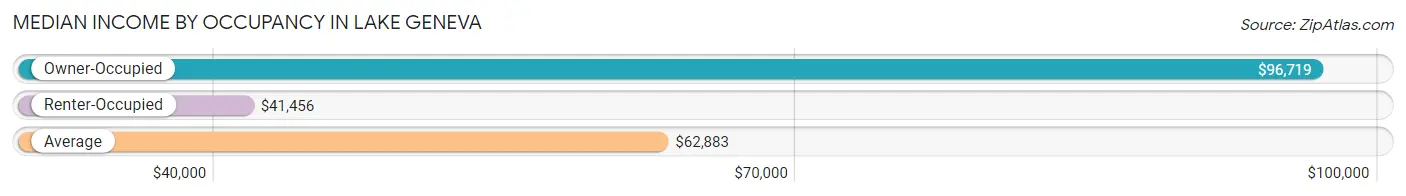
| Occupancy Type | # Households | Median Income |
| Owner-Occupied | 2,112 (51.8%) | $96,719 |
| Renter-Occupied | 1,961 (48.1%) | $41,456 |
| Average | 4,073 (100.0%) | $62,883 |
Occupancy by Householder Income Bracket in Lake Geneva
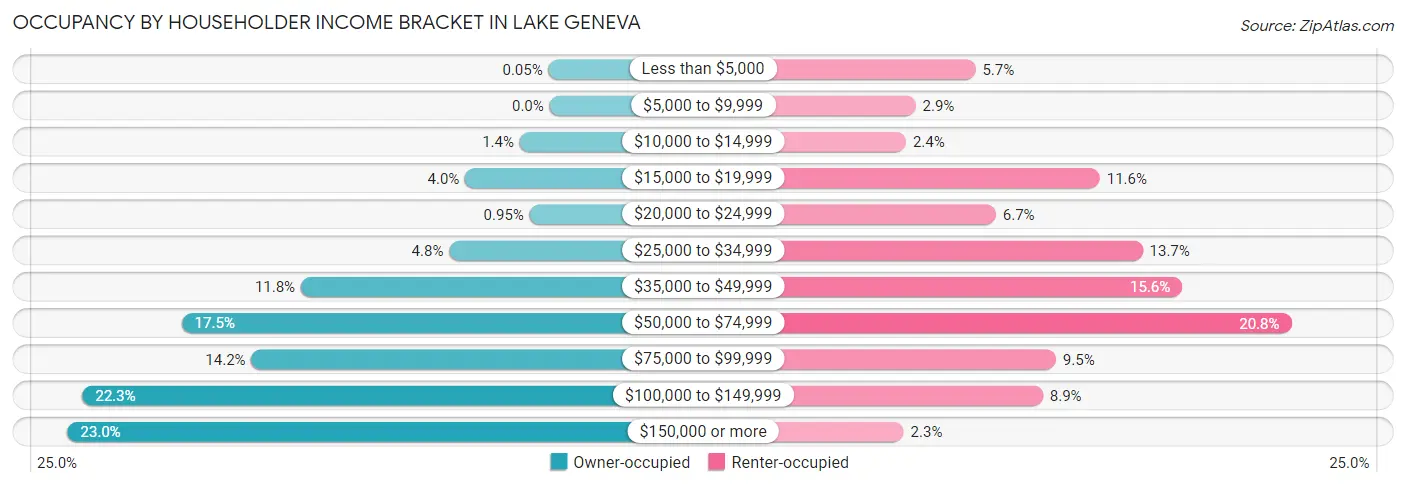
| Income Bracket | Owner-occupied | Renter-occupied |
| Less than $5,000 | 1 (0.1%) | 112 (5.7%) |
| $5,000 to $9,999 | 0 (0.0%) | 56 (2.9%) |
| $10,000 to $14,999 | 30 (1.4%) | 47 (2.4%) |
| $15,000 to $19,999 | 85 (4.0%) | 228 (11.6%) |
| $20,000 to $24,999 | 20 (0.9%) | 131 (6.7%) |
| $25,000 to $34,999 | 101 (4.8%) | 268 (13.7%) |
| $35,000 to $49,999 | 250 (11.8%) | 305 (15.5%) |
| $50,000 to $74,999 | 370 (17.5%) | 407 (20.7%) |
| $75,000 to $99,999 | 300 (14.2%) | 187 (9.5%) |
| $100,000 to $149,999 | 470 (22.3%) | 175 (8.9%) |
| $150,000 or more | 485 (23.0%) | 45 (2.3%) |
| Total | 2,112 (100.0%) | 1,961 (100.0%) |
Monthly Housing Cost Tiers in Lake Geneva
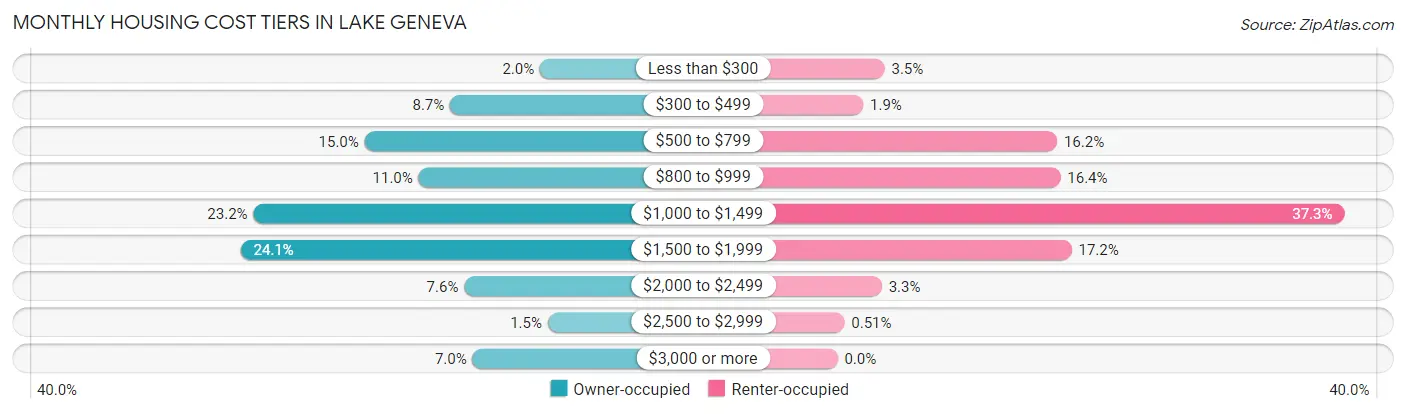
| Monthly Cost | Owner-occupied | Renter-occupied |
| Less than $300 | 43 (2.0%) | 68 (3.5%) |
| $300 to $499 | 183 (8.7%) | 37 (1.9%) |
| $500 to $799 | 316 (15.0%) | 317 (16.2%) |
| $800 to $999 | 232 (11.0%) | 322 (16.4%) |
| $1,000 to $1,499 | 489 (23.2%) | 732 (37.3%) |
| $1,500 to $1,999 | 509 (24.1%) | 338 (17.2%) |
| $2,000 to $2,499 | 161 (7.6%) | 64 (3.3%) |
| $2,500 to $2,999 | 31 (1.5%) | 10 (0.5%) |
| $3,000 or more | 148 (7.0%) | 0 (0.0%) |
| Total | 2,112 (100.0%) | 1,961 (100.0%) |
Physical Housing Characteristics in Lake Geneva
Housing Structures in Lake Geneva
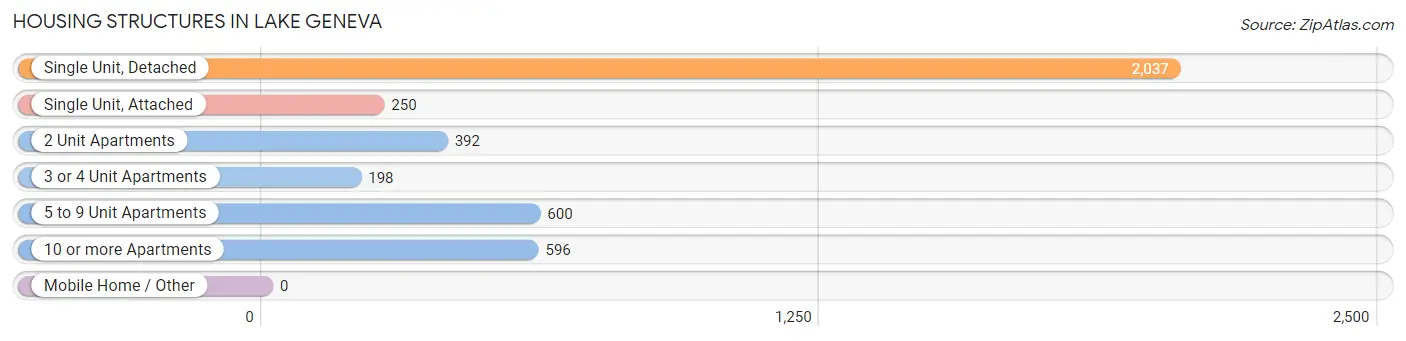
| Structure Type | # Housing Units | % Housing Units |
| Single Unit, Detached | 2,037 | 50.0% |
| Single Unit, Attached | 250 | 6.1% |
| 2 Unit Apartments | 392 | 9.6% |
| 3 or 4 Unit Apartments | 198 | 4.9% |
| 5 to 9 Unit Apartments | 600 | 14.7% |
| 10 or more Apartments | 596 | 14.6% |
| Mobile Home / Other | 0 | 0.0% |
| Total | 4,073 | 100.0% |
Housing Structures by Occupancy in Lake Geneva
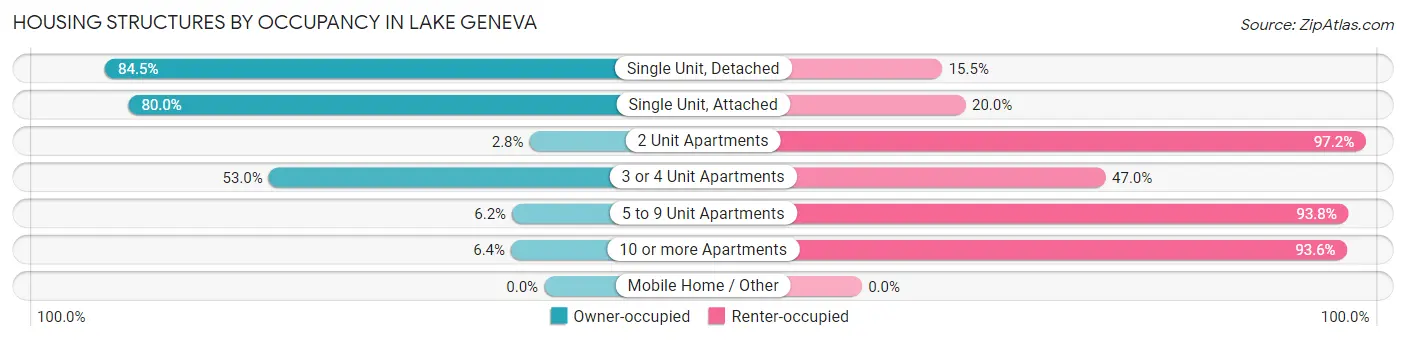
| Structure Type | Owner-occupied | Renter-occupied |
| Single Unit, Detached | 1,721 (84.5%) | 316 (15.5%) |
| Single Unit, Attached | 200 (80.0%) | 50 (20.0%) |
| 2 Unit Apartments | 11 (2.8%) | 381 (97.2%) |
| 3 or 4 Unit Apartments | 105 (53.0%) | 93 (47.0%) |
| 5 to 9 Unit Apartments | 37 (6.2%) | 563 (93.8%) |
| 10 or more Apartments | 38 (6.4%) | 558 (93.6%) |
| Mobile Home / Other | 0 (0.0%) | 0 (0.0%) |
| Total | 2,112 (51.8%) | 1,961 (48.1%) |
Housing Structures by Number of Rooms in Lake Geneva
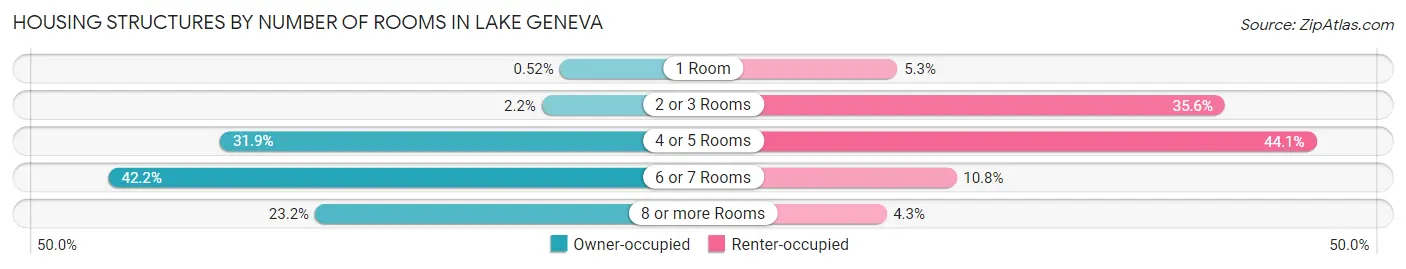
| Number of Rooms | Owner-occupied | Renter-occupied |
| 1 Room | 11 (0.5%) | 104 (5.3%) |
| 2 or 3 Rooms | 46 (2.2%) | 698 (35.6%) |
| 4 or 5 Rooms | 674 (31.9%) | 864 (44.1%) |
| 6 or 7 Rooms | 892 (42.2%) | 211 (10.8%) |
| 8 or more Rooms | 489 (23.2%) | 84 (4.3%) |
| Total | 2,112 (100.0%) | 1,961 (100.0%) |
Housing Structure by Heating Type in Lake Geneva
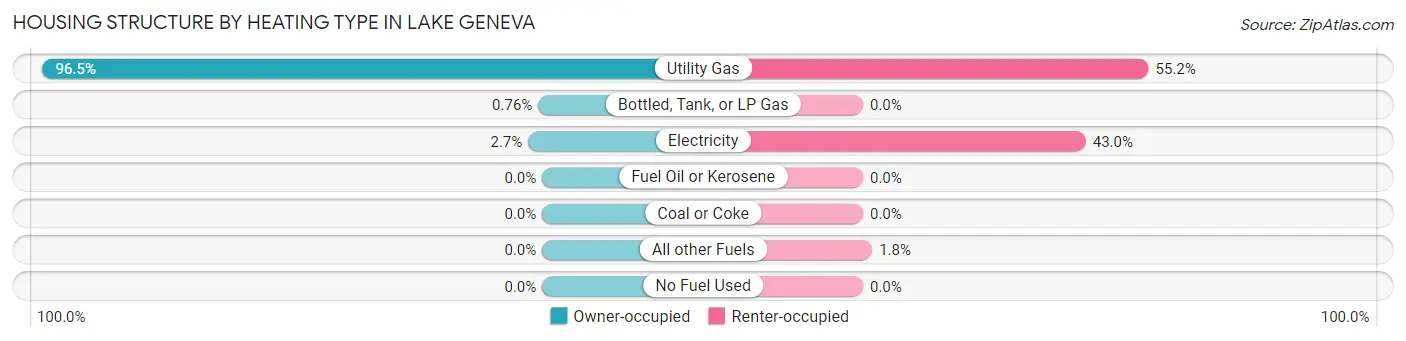
| Heating Type | Owner-occupied | Renter-occupied |
| Utility Gas | 2,039 (96.5%) | 1,082 (55.2%) |
| Bottled, Tank, or LP Gas | 16 (0.8%) | 0 (0.0%) |
| Electricity | 57 (2.7%) | 844 (43.0%) |
| Fuel Oil or Kerosene | 0 (0.0%) | 0 (0.0%) |
| Coal or Coke | 0 (0.0%) | 0 (0.0%) |
| All other Fuels | 0 (0.0%) | 35 (1.8%) |
| No Fuel Used | 0 (0.0%) | 0 (0.0%) |
| Total | 2,112 (100.0%) | 1,961 (100.0%) |
Household Vehicle Usage in Lake Geneva
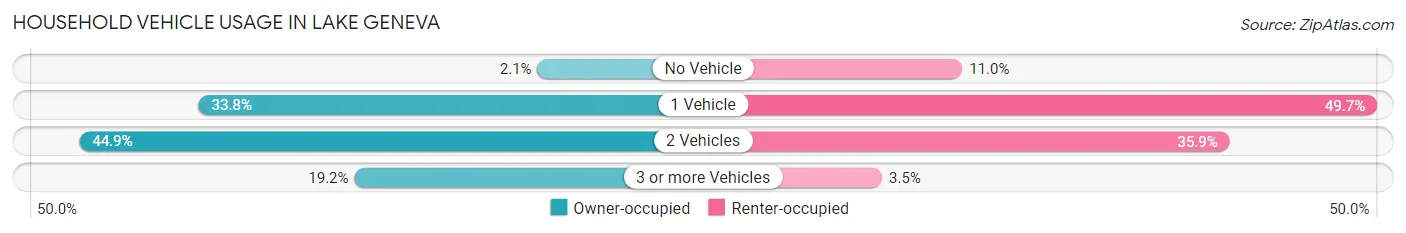
| Vehicles per Household | Owner-occupied | Renter-occupied |
| No Vehicle | 45 (2.1%) | 215 (11.0%) |
| 1 Vehicle | 713 (33.8%) | 974 (49.7%) |
| 2 Vehicles | 948 (44.9%) | 704 (35.9%) |
| 3 or more Vehicles | 406 (19.2%) | 68 (3.5%) |
| Total | 2,112 (100.0%) | 1,961 (100.0%) |
Real Estate & Mortgages in Lake Geneva
Real Estate and Mortgage Overview in Lake Geneva
| Characteristic | Without Mortgage | With Mortgage |
| Housing Units | 742 | 1,370 |
| Median Property Value | $276,100 | $300,600 |
| Median Household Income | $96,223 | $314 |
| Monthly Housing Costs | $600 | $137 |
| Real Estate Taxes | $3,918 | $0 |
Property Value by Mortgage Status in Lake Geneva
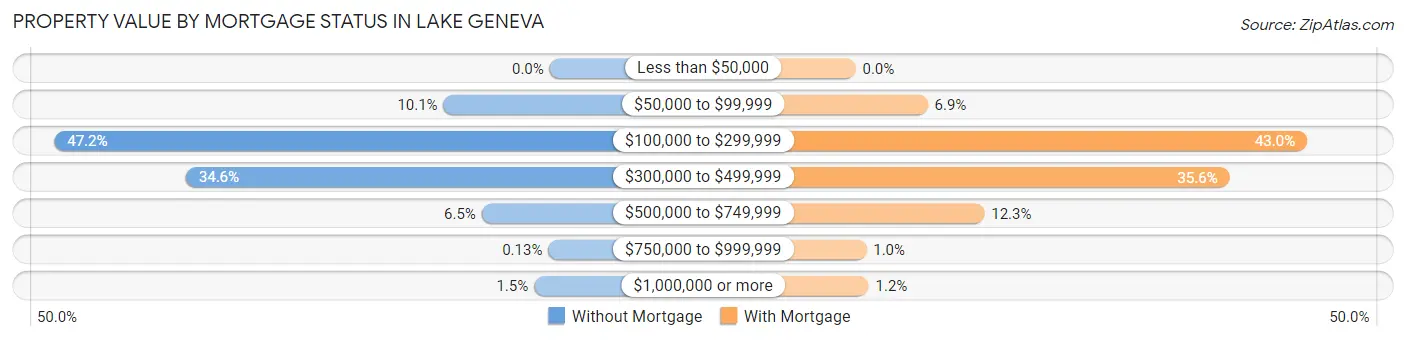
| Property Value | Without Mortgage | With Mortgage |
| Less than $50,000 | 0 (0.0%) | 0 (0.0%) |
| $50,000 to $99,999 | 75 (10.1%) | 94 (6.9%) |
| $100,000 to $299,999 | 350 (47.2%) | 589 (43.0%) |
| $300,000 to $499,999 | 257 (34.6%) | 488 (35.6%) |
| $500,000 to $749,999 | 48 (6.5%) | 168 (12.3%) |
| $750,000 to $999,999 | 1 (0.1%) | 14 (1.0%) |
| $1,000,000 or more | 11 (1.5%) | 17 (1.2%) |
| Total | 742 (100.0%) | 1,370 (100.0%) |
Household Income by Mortgage Status in Lake Geneva
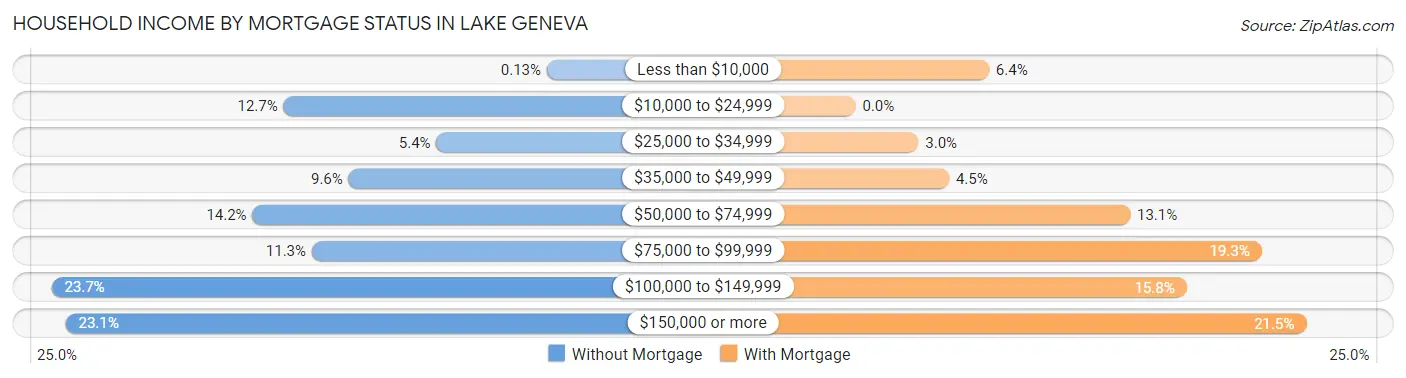
| Household Income | Without Mortgage | With Mortgage |
| Less than $10,000 | 1 (0.1%) | 87 (6.4%) |
| $10,000 to $24,999 | 94 (12.7%) | 0 (0.0%) |
| $25,000 to $34,999 | 40 (5.4%) | 41 (3.0%) |
| $35,000 to $49,999 | 71 (9.6%) | 61 (4.4%) |
| $50,000 to $74,999 | 105 (14.1%) | 179 (13.1%) |
| $75,000 to $99,999 | 84 (11.3%) | 265 (19.3%) |
| $100,000 to $149,999 | 176 (23.7%) | 216 (15.8%) |
| $150,000 or more | 171 (23.1%) | 294 (21.5%) |
| Total | 742 (100.0%) | 1,370 (100.0%) |
Property Value to Household Income Ratio in Lake Geneva
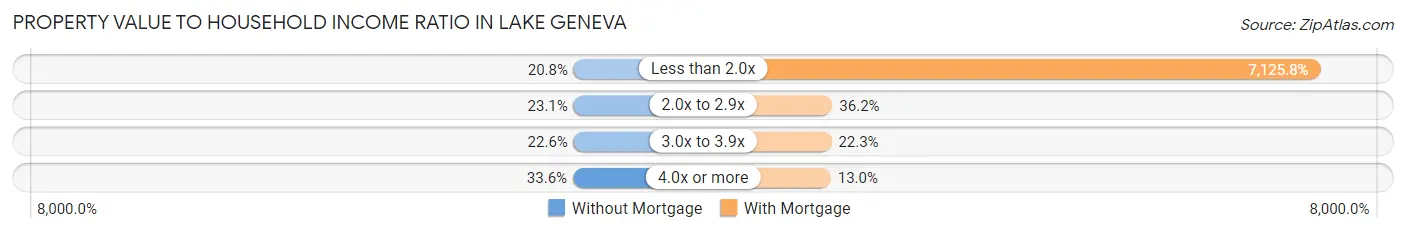
| Value-to-Income Ratio | Without Mortgage | With Mortgage |
| Less than 2.0x | 154 (20.7%) | 97,623 (7,125.8%) |
| 2.0x to 2.9x | 171 (23.1%) | 496 (36.2%) |
| 3.0x to 3.9x | 168 (22.6%) | 306 (22.3%) |
| 4.0x or more | 249 (33.6%) | 178 (13.0%) |
| Total | 742 (100.0%) | 1,370 (100.0%) |
Real Estate Taxes by Mortgage Status in Lake Geneva
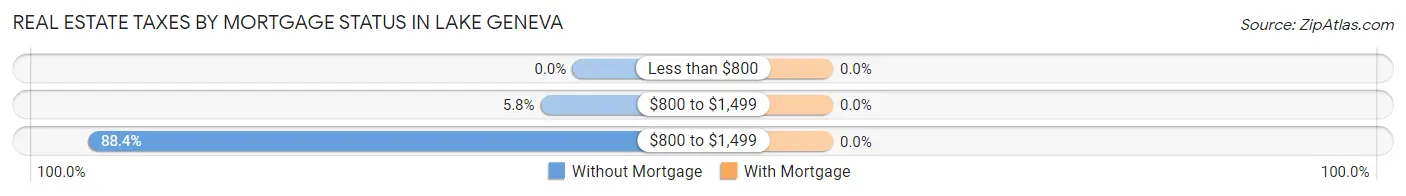
| Property Taxes | Without Mortgage | With Mortgage |
| Less than $800 | 0 (0.0%) | 0 (0.0%) |
| $800 to $1,499 | 43 (5.8%) | 0 (0.0%) |
| $800 to $1,499 | 656 (88.4%) | 0 (0.0%) |
| Total | 742 (100.0%) | 1,370 (100.0%) |
Health & Disability in Lake Geneva
Health Insurance Coverage by Age in Lake Geneva
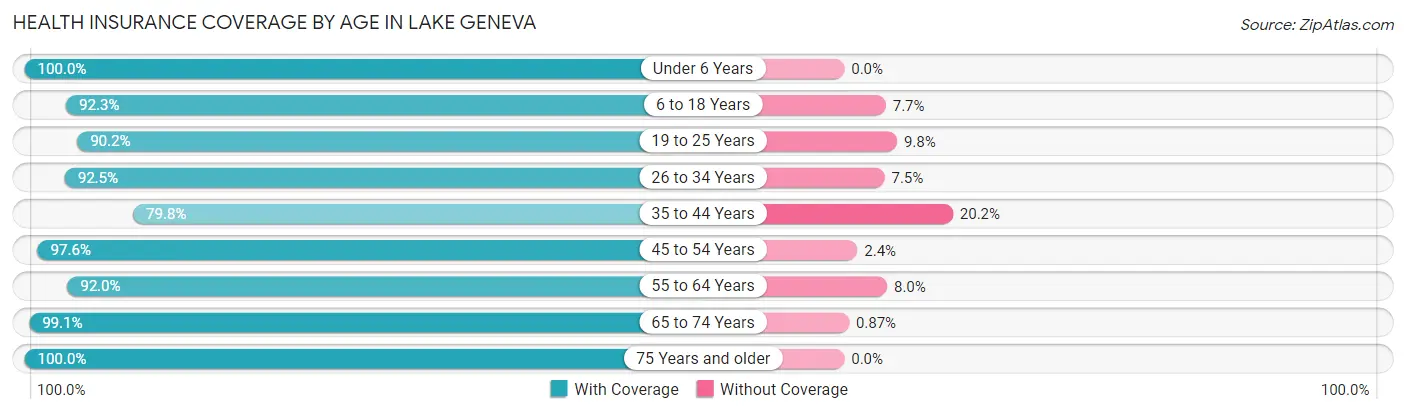
| Age Bracket | With Coverage | Without Coverage |
| Under 6 Years | 253 (100.0%) | 0 (0.0%) |
| 6 to 18 Years | 1,359 (92.3%) | 114 (7.7%) |
| 19 to 25 Years | 716 (90.2%) | 78 (9.8%) |
| 26 to 34 Years | 666 (92.5%) | 54 (7.5%) |
| 35 to 44 Years | 741 (79.8%) | 188 (20.2%) |
| 45 to 54 Years | 1,121 (97.6%) | 28 (2.4%) |
| 55 to 64 Years | 1,120 (92.0%) | 97 (8.0%) |
| 65 to 74 Years | 1,030 (99.1%) | 9 (0.9%) |
| 75 Years and older | 714 (100.0%) | 0 (0.0%) |
| Total | 7,720 (93.1%) | 568 (6.9%) |
Health Insurance Coverage by Citizenship Status in Lake Geneva
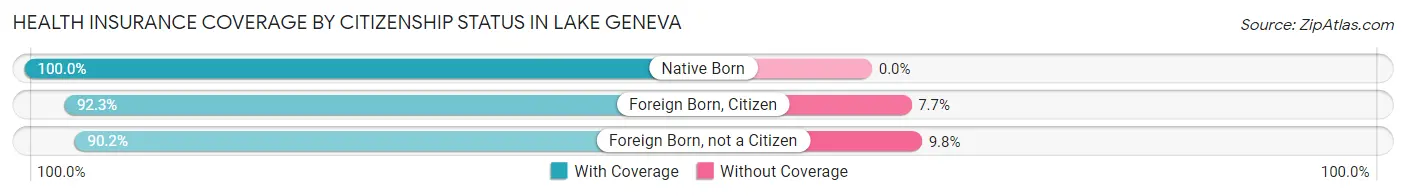
| Citizenship Status | With Coverage | Without Coverage |
| Native Born | 253 (100.0%) | 0 (0.0%) |
| Foreign Born, Citizen | 1,359 (92.3%) | 114 (7.7%) |
| Foreign Born, not a Citizen | 716 (90.2%) | 78 (9.8%) |
Health Insurance Coverage by Household Income in Lake Geneva
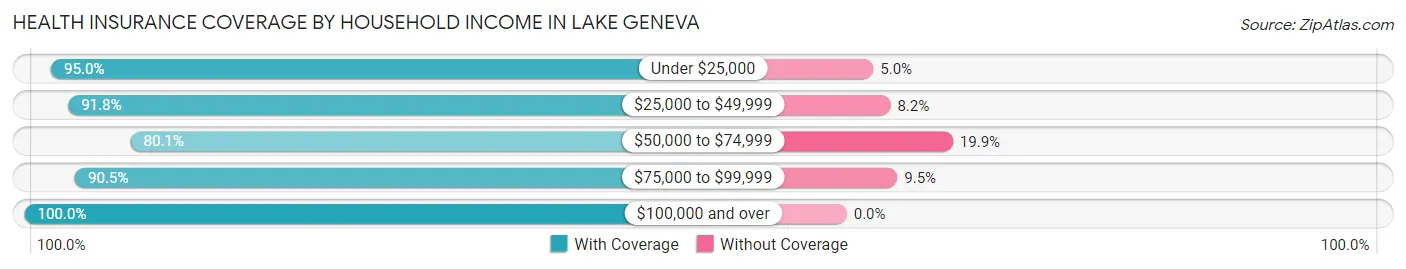
| Household Income | With Coverage | Without Coverage |
| Under $25,000 | 1,164 (95.0%) | 61 (5.0%) |
| $25,000 to $49,999 | 1,381 (91.8%) | 123 (8.2%) |
| $50,000 to $74,999 | 1,040 (80.1%) | 258 (19.9%) |
| $75,000 to $99,999 | 1,099 (90.5%) | 115 (9.5%) |
| $100,000 and over | 2,979 (100.0%) | 0 (0.0%) |
Public vs Private Health Insurance Coverage by Age in Lake Geneva
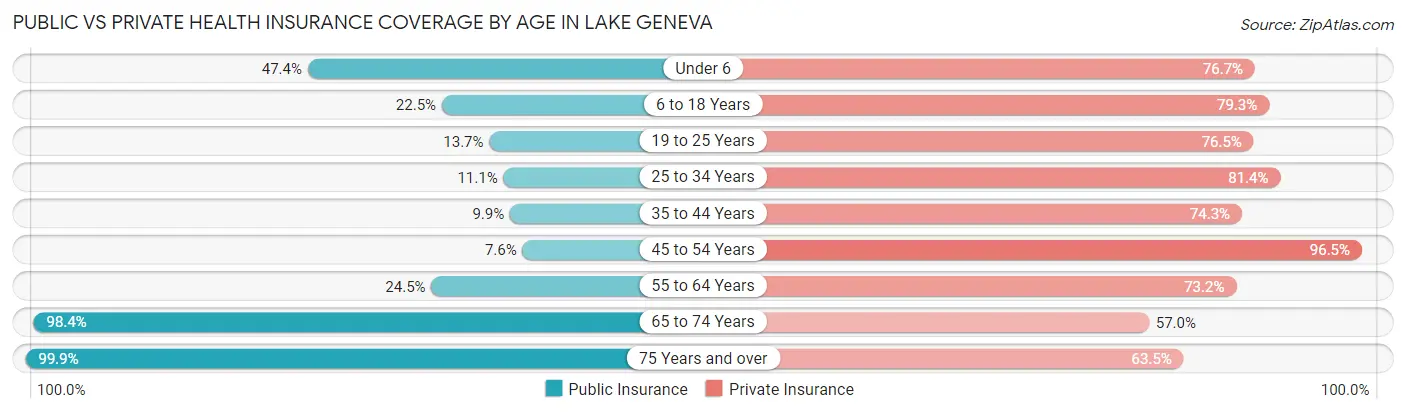
| Age Bracket | Public Insurance | Private Insurance |
| Under 6 | 120 (47.4%) | 194 (76.7%) |
| 6 to 18 Years | 332 (22.5%) | 1,168 (79.3%) |
| 19 to 25 Years | 109 (13.7%) | 607 (76.4%) |
| 25 to 34 Years | 80 (11.1%) | 586 (81.4%) |
| 35 to 44 Years | 92 (9.9%) | 690 (74.3%) |
| 45 to 54 Years | 87 (7.6%) | 1,109 (96.5%) |
| 55 to 64 Years | 298 (24.5%) | 891 (73.2%) |
| 65 to 74 Years | 1,022 (98.4%) | 592 (57.0%) |
| 75 Years and over | 713 (99.9%) | 453 (63.4%) |
| Total | 2,853 (34.4%) | 6,290 (75.9%) |
Disability Status by Sex by Age in Lake Geneva
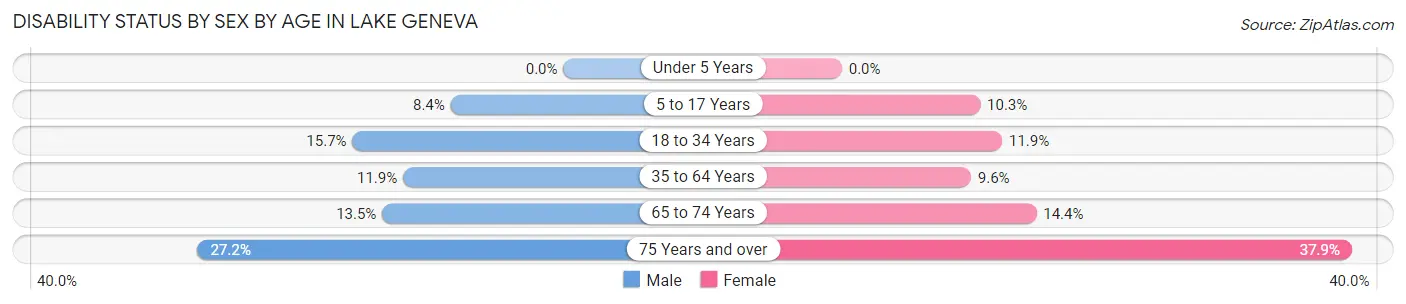
| Age Bracket | Male | Female |
| Under 5 Years | 0 (0.0%) | 0 (0.0%) |
| 5 to 17 Years | 55 (8.4%) | 75 (10.3%) |
| 18 to 34 Years | 140 (15.7%) | 94 (11.9%) |
| 35 to 64 Years | 202 (11.9%) | 153 (9.6%) |
| 65 to 74 Years | 55 (13.5%) | 91 (14.4%) |
| 75 Years and over | 44 (27.2%) | 209 (37.9%) |
Disability Class by Sex by Age in Lake Geneva
Disability Class: Hearing Difficulty
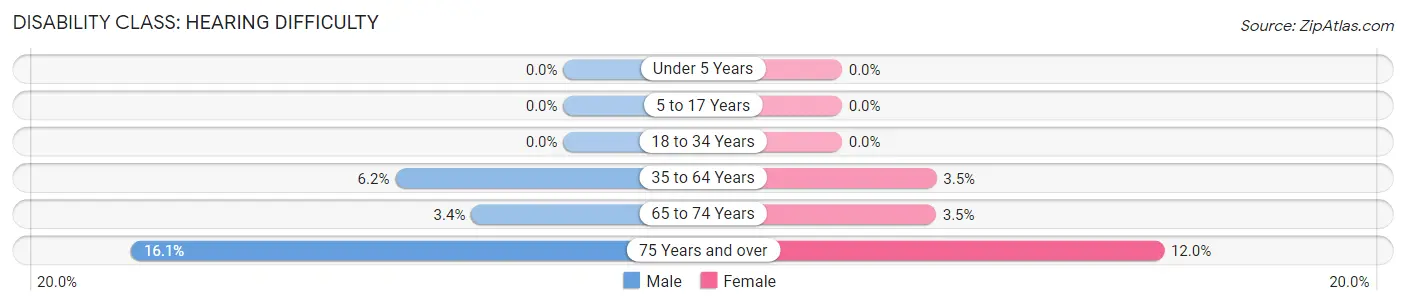
| Age Bracket | Male | Female |
| Under 5 Years | 0 (0.0%) | 0 (0.0%) |
| 5 to 17 Years | 0 (0.0%) | 0 (0.0%) |
| 18 to 34 Years | 0 (0.0%) | 0 (0.0%) |
| 35 to 64 Years | 106 (6.2%) | 56 (3.5%) |
| 65 to 74 Years | 14 (3.4%) | 22 (3.5%) |
| 75 Years and over | 26 (16.1%) | 66 (12.0%) |
Disability Class: Vision Difficulty
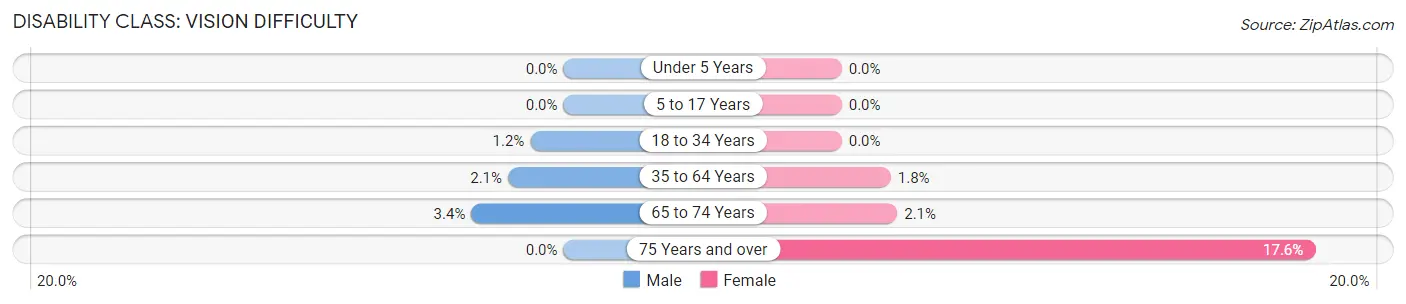
| Age Bracket | Male | Female |
| Under 5 Years | 0 (0.0%) | 0 (0.0%) |
| 5 to 17 Years | 0 (0.0%) | 0 (0.0%) |
| 18 to 34 Years | 11 (1.2%) | 0 (0.0%) |
| 35 to 64 Years | 35 (2.1%) | 29 (1.8%) |
| 65 to 74 Years | 14 (3.4%) | 13 (2.1%) |
| 75 Years and over | 0 (0.0%) | 97 (17.6%) |
Disability Class: Cognitive Difficulty
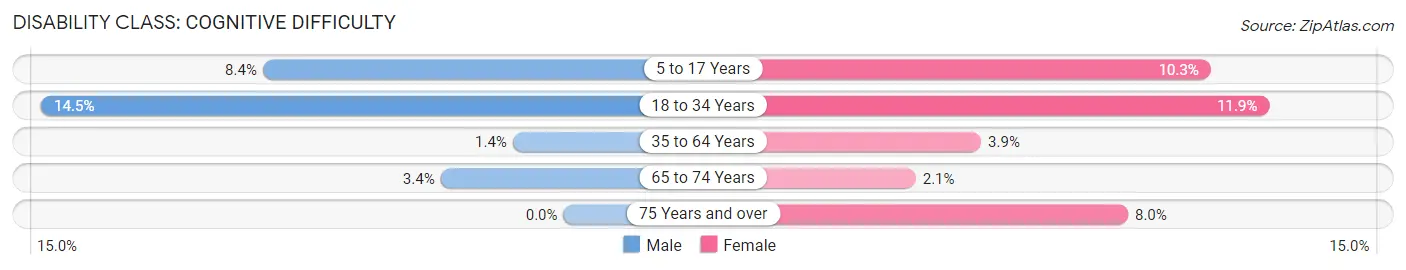
| Age Bracket | Male | Female |
| 5 to 17 Years | 55 (8.4%) | 75 (10.3%) |
| 18 to 34 Years | 130 (14.5%) | 94 (11.9%) |
| 35 to 64 Years | 24 (1.4%) | 62 (3.9%) |
| 65 to 74 Years | 14 (3.4%) | 13 (2.1%) |
| 75 Years and over | 0 (0.0%) | 44 (8.0%) |
Disability Class: Ambulatory Difficulty
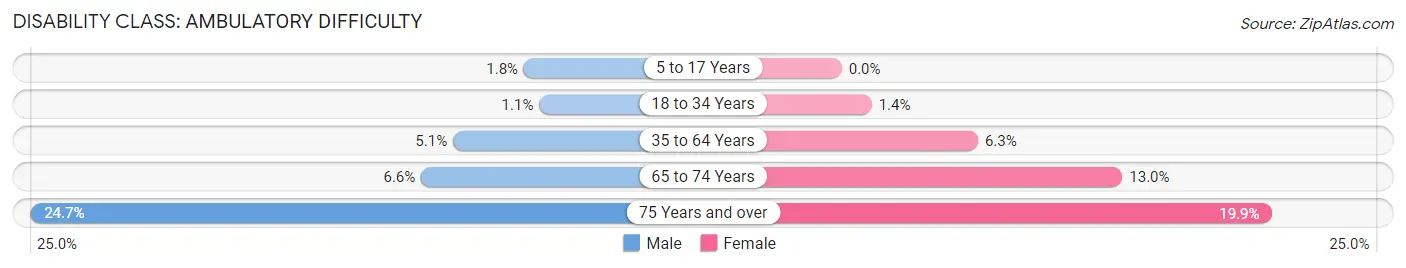
| Age Bracket | Male | Female |
| 5 to 17 Years | 12 (1.8%) | 0 (0.0%) |
| 18 to 34 Years | 10 (1.1%) | 11 (1.4%) |
| 35 to 64 Years | 87 (5.1%) | 101 (6.3%) |
| 65 to 74 Years | 27 (6.6%) | 82 (13.0%) |
| 75 Years and over | 40 (24.7%) | 110 (19.9%) |
Disability Class: Self-Care Difficulty
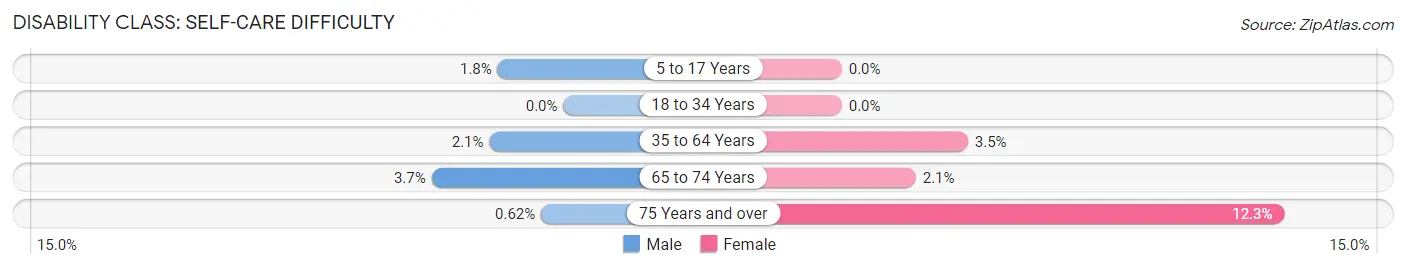
| Age Bracket | Male | Female |
| 5 to 17 Years | 12 (1.8%) | 0 (0.0%) |
| 18 to 34 Years | 0 (0.0%) | 0 (0.0%) |
| 35 to 64 Years | 35 (2.1%) | 56 (3.5%) |
| 65 to 74 Years | 15 (3.7%) | 13 (2.1%) |
| 75 Years and over | 1 (0.6%) | 68 (12.3%) |
Technology Access in Lake Geneva
Computing Device Access in Lake Geneva
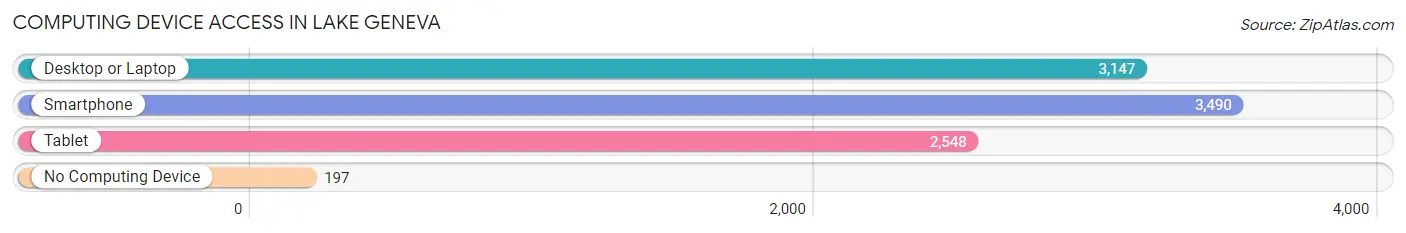
| Device Type | # Households | % Households |
| Desktop or Laptop | 3,147 | 77.3% |
| Smartphone | 3,490 | 85.7% |
| Tablet | 2,548 | 62.6% |
| No Computing Device | 197 | 4.8% |
| Total | 4,073 | 100.0% |
Internet Access in Lake Geneva
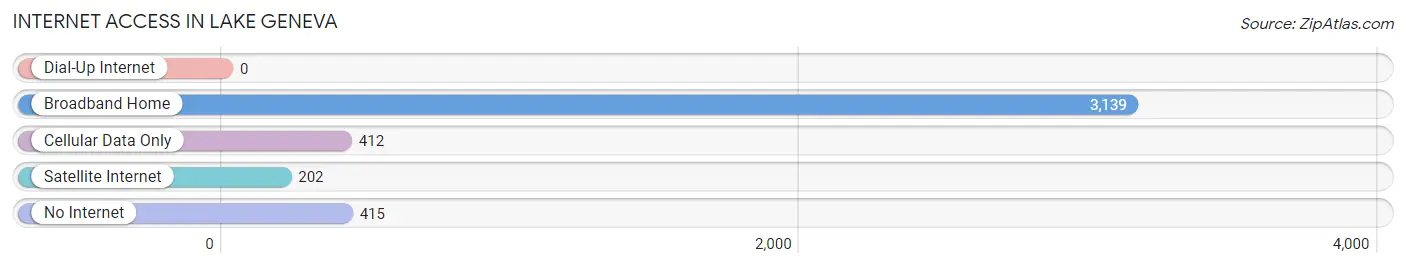
| Internet Type | # Households | % Households |
| Dial-Up Internet | 0 | 0.0% |
| Broadband Home | 3,139 | 77.1% |
| Cellular Data Only | 412 | 10.1% |
| Satellite Internet | 202 | 5.0% |
| No Internet | 415 | 10.2% |
| Total | 4,073 | 100.0% |
Lake Geneva Summary
Lake Geneva is a city located in southeastern Wisconsin, in the United States. It is situated on the shores of Geneva Lake, a natural lake that is the second largest in Wisconsin. The city is located in Walworth County, and is part of the Milwaukee-Racine-Waukesha Metropolitan Statistical Area. As of the 2010 census, the city had a population of 7,651.
History
The area around Lake Geneva was first inhabited by Native Americans, who used the lake for fishing and hunting. The first Europeans to settle in the area were French fur traders, who arrived in the early 19th century. The first permanent settlement was established in 1836, when a group of settlers from New York arrived and established a village on the lake's shore. The village was named Geneva after the lake, and the name was later changed to Lake Geneva.
The city was officially incorporated in 1882, and the following year, the first railroad line was built, connecting Lake Geneva to Chicago. This allowed the city to become a popular tourist destination, and it soon became known as the "Newport of the West." The city's economy was largely based on tourism, and it was home to several grand hotels, including the Geneva Lake Hotel and the Grand Geneva Resort.
Geography
Lake Geneva is located at 42°35'N 88°26'W (42.5833, -88.4333). It is situated on the shores of Geneva Lake, a natural lake that is the second largest in Wisconsin. The city is located in Walworth County, and is part of the Milwaukee-Racine-Waukesha Metropolitan Statistical Area.
The city has a total area of 5.2 square miles, of which 4.9 square miles is land and 0.3 square miles is water. The city is located in a hilly region, and the highest point in the city is located at an elevation of 890 feet.
Economy
The economy of Lake Geneva is largely based on tourism. The city is home to several resorts and hotels, including the Grand Geneva Resort and the Geneva Lake Hotel. The city also has a number of restaurants, shops, and other attractions that cater to tourists.
In addition to tourism, the city is also home to a number of manufacturing and industrial businesses. The largest employers in the city include the Grand Geneva Resort, the Geneva Lake Hotel, and the Lake Geneva School District.
Demographics
As of the 2010 census, the city had a population of 7,651. The racial makeup of the city was 94.2% White, 1.2% African American, 0.3% Native American, 1.2% Asian, 0.1% Pacific Islander, 1.2% from other races, and 1.9% from two or more races. Hispanic or Latino of any race were 3.2% of the population.
The median income for a household in the city was $50,945, and the median income for a family was $62,917. The per capita income for the city was $30,945. About 5.2% of families and 8.2% of the population were below the poverty line, including 10.2% of those under age 18 and 5.2% of those age 65 or over.
Common Questions
What is Per Capita Income in Lake Geneva?
Per Capita income in Lake Geneva is $42,817.
What is the Median Family Income in Lake Geneva?
Median Family Income in Lake Geneva is $77,065.
What is the Median Household income in Lake Geneva?
Median Household Income in Lake Geneva is $62,883.
What is Income or Wage Gap in Lake Geneva?
Income or Wage Gap in Lake Geneva is 24.5%.
Women in Lake Geneva earn 75.5 cents for every dollar earned by a man.
What is Family Income Deficit in Lake Geneva?
Family Income Deficit in Lake Geneva is $8,550.
Families that are below poverty line in Lake Geneva earn $8,550 less on average than the poverty threshold level.
What is Inequality or Gini Index in Lake Geneva?
Inequality or Gini Index in Lake Geneva is 0.46.
What is the Total Population of Lake Geneva?
Total Population of Lake Geneva is 8,335.
What is the Total Male Population of Lake Geneva?
Total Male Population of Lake Geneva is 3,903.
What is the Total Female Population of Lake Geneva?
Total Female Population of Lake Geneva is 4,432.
What is the Ratio of Males per 100 Females in Lake Geneva?
There are 88.06 Males per 100 Females in Lake Geneva.
What is the Ratio of Females per 100 Males in Lake Geneva?
There are 113.55 Females per 100 Males in Lake Geneva.
What is the Median Population Age in Lake Geneva?
Median Population Age in Lake Geneva is 45.0 Years.
What is the Average Family Size in Lake Geneva
Average Family Size in Lake Geneva is 2.7 People.
What is the Average Household Size in Lake Geneva
Average Household Size in Lake Geneva is 2.0 People.
How Large is the Labor Force in Lake Geneva?
There are 4,570 People in the Labor Forcein in Lake Geneva.
What is the Percentage of People in the Labor Force in Lake Geneva?
64.2% of People are in the Labor Force in Lake Geneva.
What is the Unemployment Rate in Lake Geneva?
Unemployment Rate in Lake Geneva is 3.7%.