Live Oak, FL Map & Demographics
Live Oak Map
Live Oak Overview
$22,136
PER CAPITA INCOME
$49,942
AVG FAMILY INCOME
$43,664
AVG HOUSEHOLD INCOME
26.9%
WAGE / INCOME GAP [ % ]
73.1¢/ $1
WAGE / INCOME GAP [ $ ]
0.45
INEQUALITY / GINI INDEX
6,811
TOTAL POPULATION
3,360
MALE POPULATION
3,451
FEMALE POPULATION
97.36
MALES / 100 FEMALES
102.71
FEMALES / 100 MALES
37.5
MEDIAN AGE
3.5
AVG FAMILY SIZE
2.7
AVG HOUSEHOLD SIZE
3,330
LABOR FORCE [ PEOPLE ]
63.1%
PERCENT IN LABOR FORCE
13.6%
UNEMPLOYMENT RATE
Live Oak Area Codes
Income in Live Oak
Income Overview in Live Oak
Per Capita Income in Live Oak is $22,136, while median incomes of families and households are $49,942 and $43,664 respectively.
| Characteristic | Number | Measure |
| Per Capita Income | 6,811 | $22,136 |
| Median Family Income | 1,365 | $49,942 |
| Mean Family Income | 1,365 | $61,611 |
| Median Household Income | 2,365 | $43,664 |
| Mean Household Income | 2,365 | $54,734 |
| Income Deficit | 1,365 | $0 |
| Wage / Income Gap (%) | 6,811 | 26.90% |
| Wage / Income Gap ($) | 6,811 | 73.10¢ per $1 |
| Gini / Inequality Index | 6,811 | 0.45 |
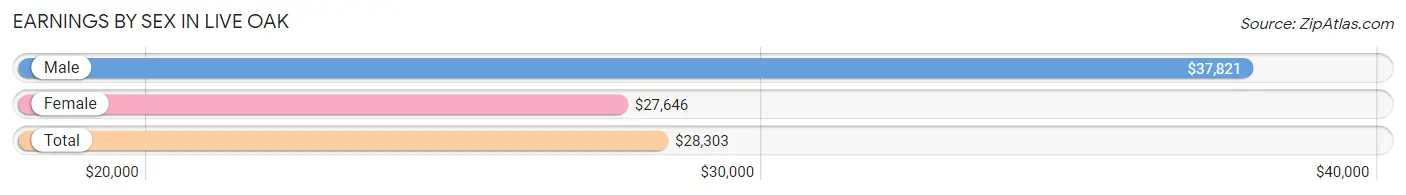
Earnings by Sex in Live Oak
Average Earnings in Live Oak are $28,303, $37,821 for men and $27,646 for women, a difference of 26.9%.
| Sex | Number | Average Earnings |
| Male | 1,689 (51.1%) | $37,821 |
| Female | 1,618 (48.9%) | $27,646 |
| Total | 3,307 (100.0%) | $28,303 |
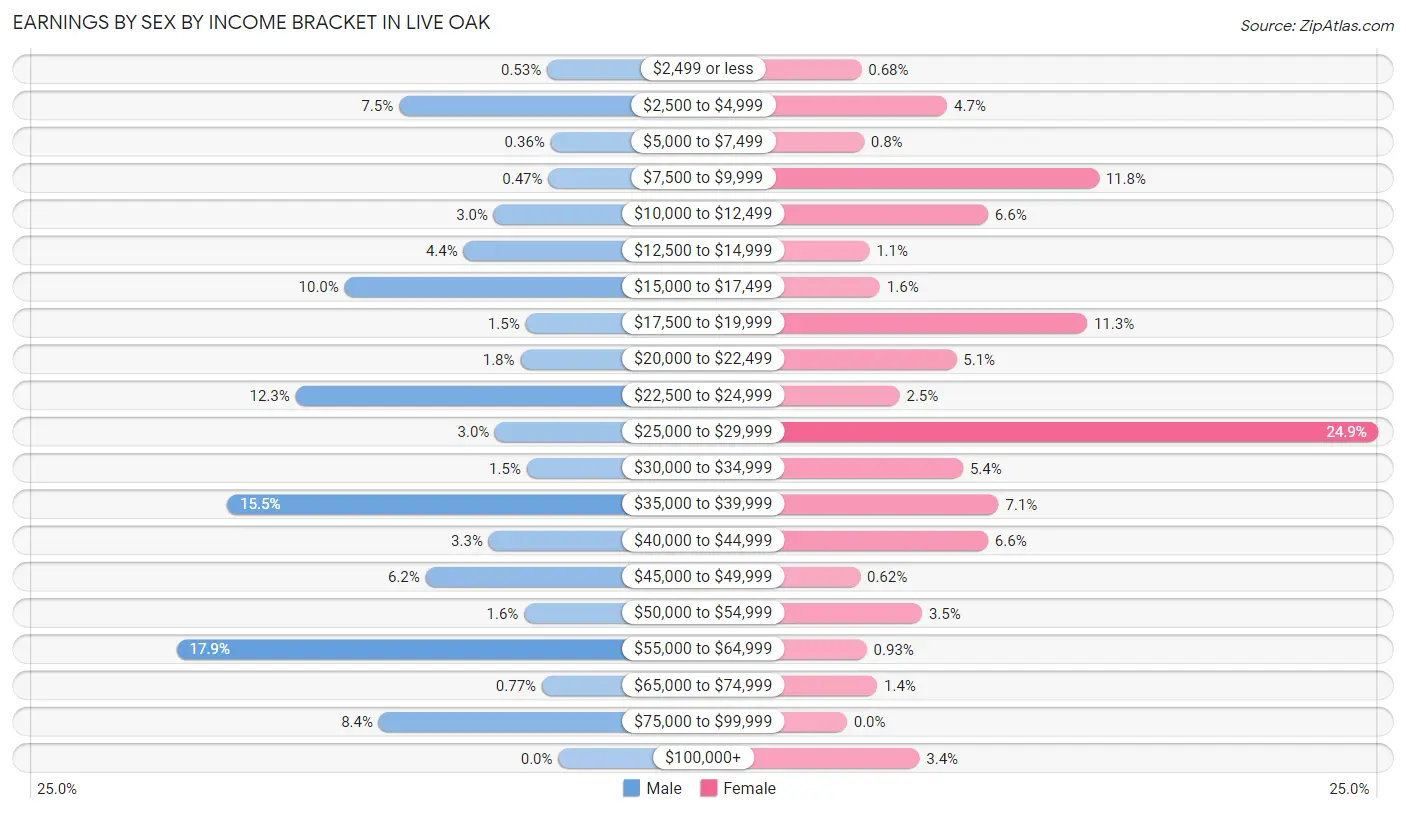
Earnings by Sex by Income Bracket in Live Oak
The most common earnings brackets in Live Oak are $55,000 to $64,999 for men (302 | 17.9%) and $25,000 to $29,999 for women (403 | 24.9%).
| Income | Male | Female |
| $2,499 or less | 9 (0.5%) | 11 (0.7%) |
| $2,500 to $4,999 | 126 (7.5%) | 76 (4.7%) |
| $5,000 to $7,499 | 6 (0.4%) | 13 (0.8%) |
| $7,500 to $9,999 | 8 (0.5%) | 191 (11.8%) |
| $10,000 to $12,499 | 51 (3.0%) | 107 (6.6%) |
| $12,500 to $14,999 | 75 (4.4%) | 17 (1.1%) |
| $15,000 to $17,499 | 169 (10.0%) | 25 (1.5%) |
| $17,500 to $19,999 | 26 (1.5%) | 182 (11.3%) |
| $20,000 to $22,499 | 30 (1.8%) | 83 (5.1%) |
| $22,500 to $24,999 | 208 (12.3%) | 40 (2.5%) |
| $25,000 to $29,999 | 50 (3.0%) | 403 (24.9%) |
| $30,000 to $34,999 | 25 (1.5%) | 88 (5.4%) |
| $35,000 to $39,999 | 262 (15.5%) | 115 (7.1%) |
| $40,000 to $44,999 | 55 (3.3%) | 107 (6.6%) |
| $45,000 to $49,999 | 105 (6.2%) | 10 (0.6%) |
| $50,000 to $54,999 | 27 (1.6%) | 57 (3.5%) |
| $55,000 to $64,999 | 302 (17.9%) | 15 (0.9%) |
| $65,000 to $74,999 | 13 (0.8%) | 23 (1.4%) |
| $75,000 to $99,999 | 142 (8.4%) | 0 (0.0%) |
| $100,000+ | 0 (0.0%) | 55 (3.4%) |
| Total | 1,689 (100.0%) | 1,618 (100.0%) |
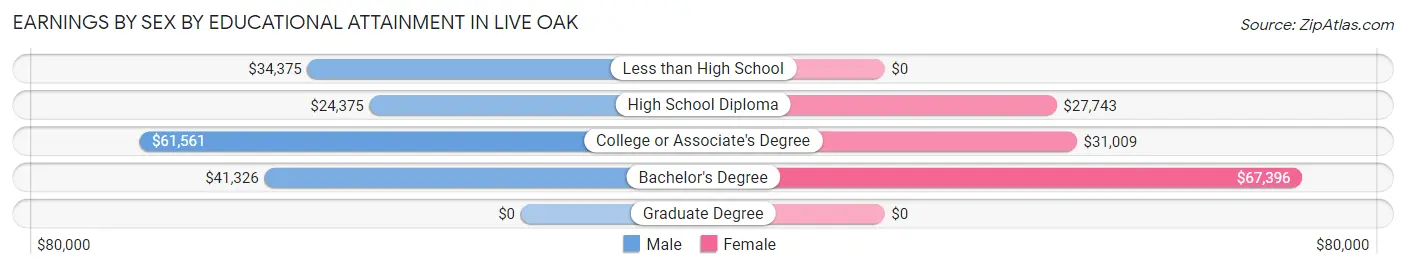
Earnings by Sex by Educational Attainment in Live Oak
Average earnings in Live Oak are $38,924 for men and $28,382 for women, a difference of 27.1%. Men with an educational attainment of college or associate's degree enjoy the highest average annual earnings of $61,561, while those with high school diploma education earn the least with $24,375. Women with an educational attainment of bachelor's degree earn the most with the average annual earnings of $67,396, while those with high school diploma education have the smallest earnings of $27,743.
| Educational Attainment | Male Income | Female Income |
| Less than High School | $34,375 | $0 |
| High School Diploma | $24,375 | $27,743 |
| College or Associate's Degree | $61,561 | $31,009 |
| Bachelor's Degree | $41,326 | $67,396 |
| Graduate Degree | - | - |
| Total | $38,924 | $28,382 |
Family Income in Live Oak
Family Income Brackets in Live Oak
According to the Live Oak family income data, there are 382 families falling into the $50,000 to $74,999 income range, which is the most common income bracket and makes up 28.0% of all families.
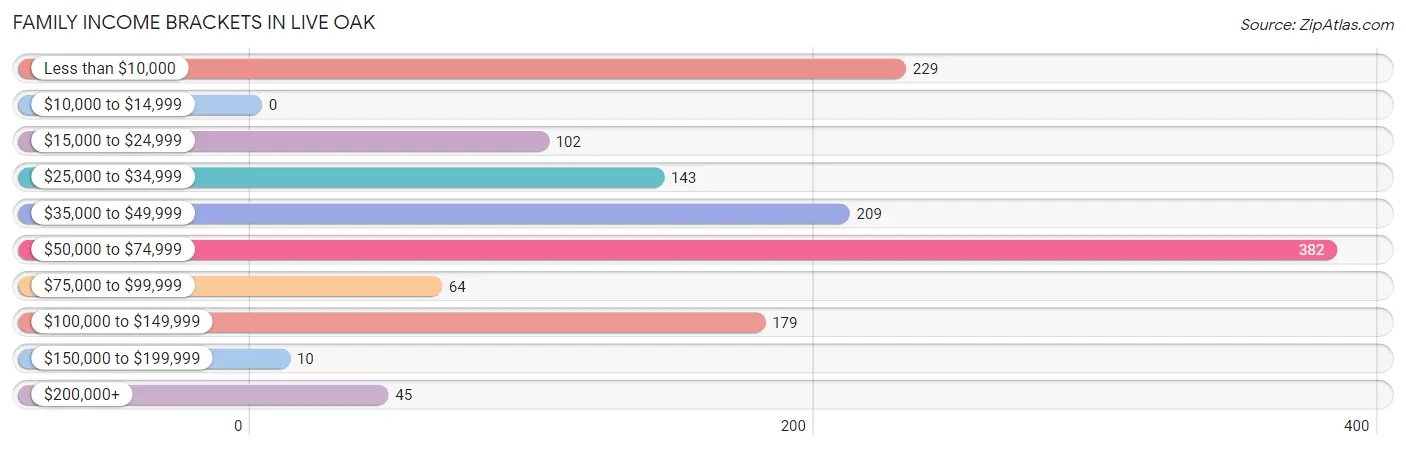
| Income Bracket | # Families | % Families |
| Less than $10,000 | 229 | 16.8% |
| $10,000 to $14,999 | 0 | 0.0% |
| $15,000 to $24,999 | 102 | 7.5% |
| $25,000 to $34,999 | 143 | 10.5% |
| $35,000 to $49,999 | 209 | 15.3% |
| $50,000 to $74,999 | 382 | 28.0% |
| $75,000 to $99,999 | 64 | 4.7% |
| $100,000 to $149,999 | 179 | 13.1% |
| $150,000 to $199,999 | 10 | 0.7% |
| $200,000+ | 45 | 3.3% |
Family Income by Famaliy Size in Live Oak
2-person families (775 | 56.8%) account for the highest median family income in Live Oak with $47,975 per family, while 2-person families (775 | 56.8%) have the highest median income of $23,988 per family member.
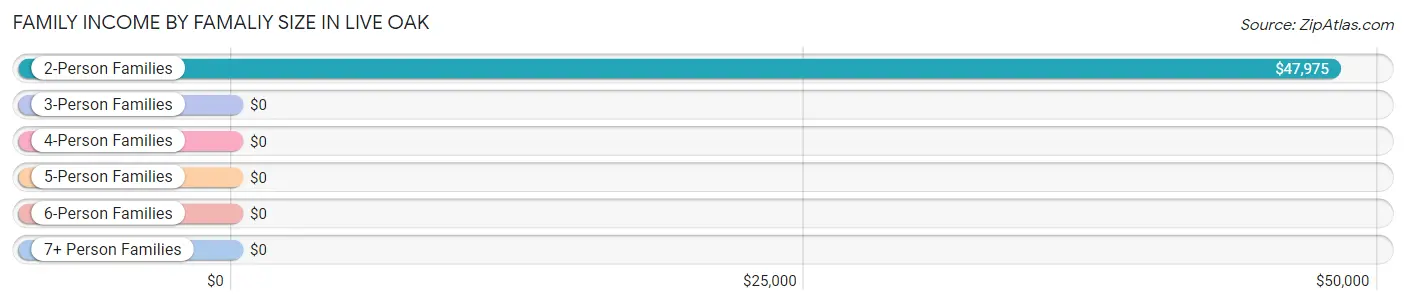
| Income Bracket | # Families | Median Income |
| 2-Person Families | 775 (56.8%) | $47,975 |
| 3-Person Families | 263 (19.3%) | $0 |
| 4-Person Families | 264 (19.3%) | $0 |
| 5-Person Families | 63 (4.6%) | $0 |
| 6-Person Families | 0 (0.0%) | $0 |
| 7+ Person Families | 0 (0.0%) | $0 |
| Total | 1,365 (100.0%) | $49,942 |
Family Income by Number of Earners in Live Oak
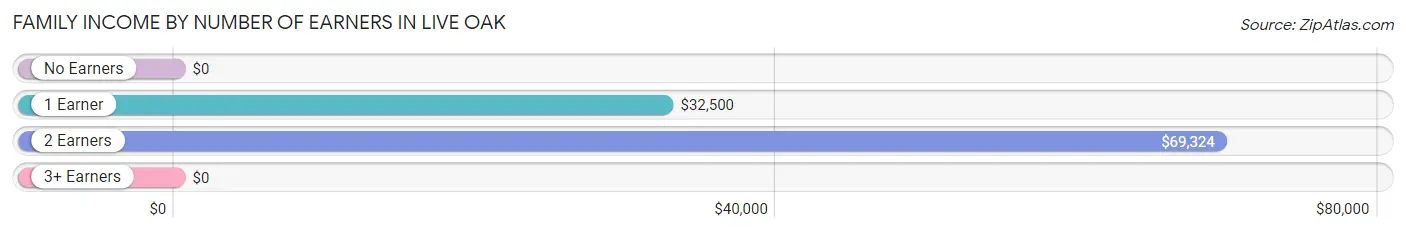
| Number of Earners | # Families | Median Income |
| No Earners | 418 (30.6%) | $0 |
| 1 Earner | 308 (22.6%) | $32,500 |
| 2 Earners | 590 (43.2%) | $69,324 |
| 3+ Earners | 49 (3.6%) | $0 |
| Total | 1,365 (100.0%) | $49,942 |
Household Income in Live Oak
Household Income Brackets in Live Oak
With 492 households falling in the category, the $50,000 to $74,999 income range is the most frequent in Live Oak, accounting for 20.8% of all households. In contrast, only 9 households (0.4%) fall into the $150,000 to $199,999 income bracket, making it the least populous group.
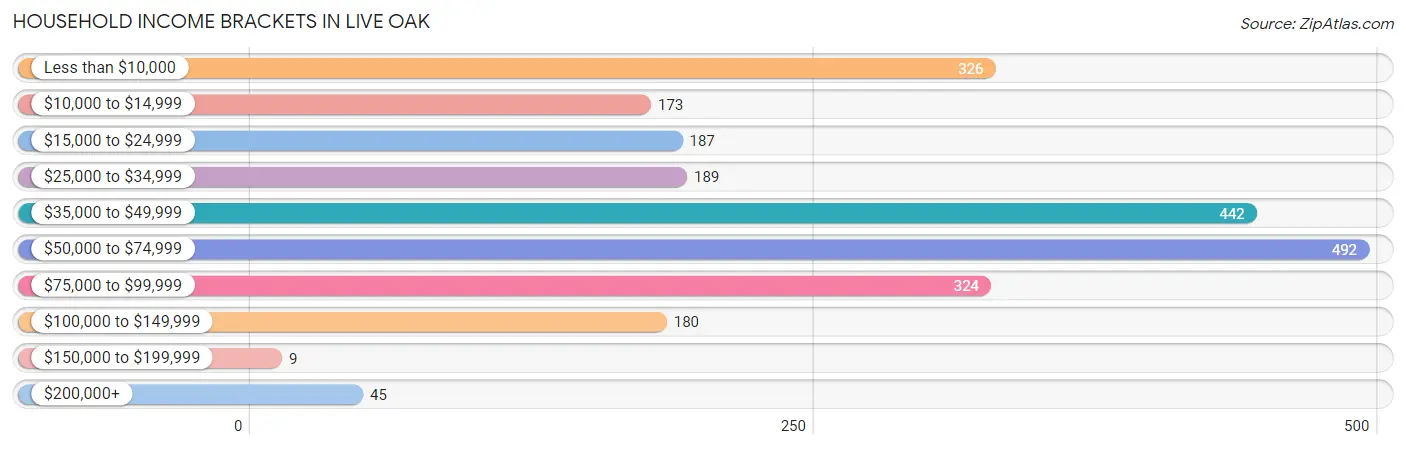
| Income Bracket | # Households | % Households |
| Less than $10,000 | 326 | 13.8% |
| $10,000 to $14,999 | 173 | 7.3% |
| $15,000 to $24,999 | 187 | 7.9% |
| $25,000 to $34,999 | 189 | 8.0% |
| $35,000 to $49,999 | 442 | 18.7% |
| $50,000 to $74,999 | 492 | 20.8% |
| $75,000 to $99,999 | 324 | 13.7% |
| $100,000 to $149,999 | 180 | 7.6% |
| $150,000 to $199,999 | 9 | 0.4% |
| $200,000+ | 45 | 1.9% |
Household Income by Householder Age in Live Oak
The median household income in Live Oak is $43,664, with the highest median household income of $57,470 found in the 25 to 44 years age bracket for the primary householder. A total of 901 households (38.1%) fall into this category. Meanwhile, the 15 to 24 years age bracket for the primary householder has the lowest median household income of $0, with 208 households (8.8%) in this group.
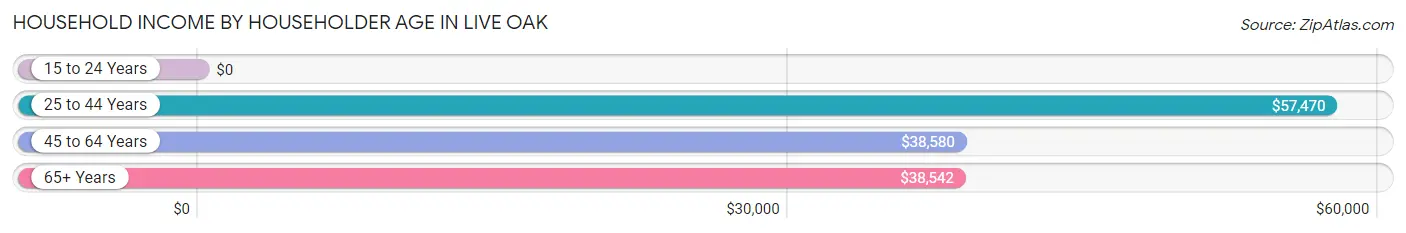
| Income Bracket | # Households | Median Income |
| 15 to 24 Years | 208 (8.8%) | $0 |
| 25 to 44 Years | 901 (38.1%) | $57,470 |
| 45 to 64 Years | 616 (26.1%) | $38,580 |
| 65+ Years | 640 (27.1%) | $38,542 |
| Total | 2,365 (100.0%) | $43,664 |
Poverty in Live Oak
Income Below Poverty by Sex and Age in Live Oak
With 14.3% poverty level for males and 23.9% for females among the residents of Live Oak, 5 year old males and 18 to 24 year old females are the most vulnerable to poverty, with 12 males (100.0%) and 166 females (62.9%) in their respective age groups living below the poverty level.
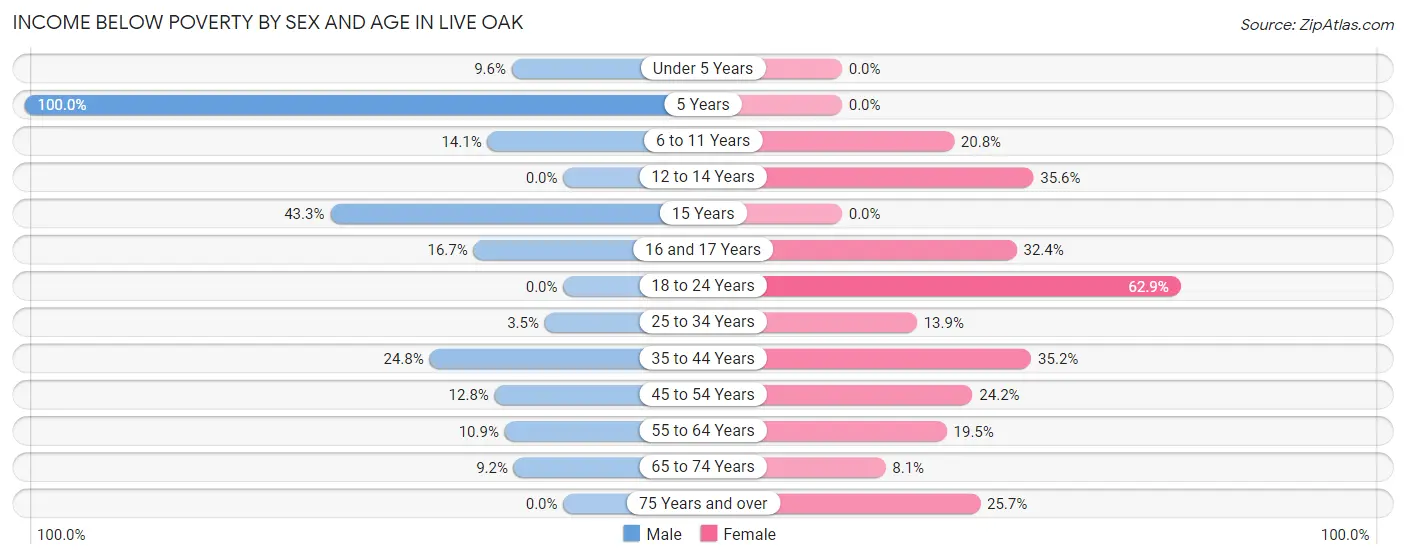
| Age Bracket | Male | Female |
| Under 5 Years | 37 (9.6%) | 0 (0.0%) |
| 5 Years | 12 (100.0%) | 0 (0.0%) |
| 6 to 11 Years | 29 (14.1%) | 108 (20.8%) |
| 12 to 14 Years | 0 (0.0%) | 16 (35.6%) |
| 15 Years | 45 (43.3%) | 0 (0.0%) |
| 16 and 17 Years | 5 (16.7%) | 24 (32.4%) |
| 18 to 24 Years | 0 (0.0%) | 166 (62.9%) |
| 25 to 34 Years | 3 (3.5%) | 42 (13.9%) |
| 35 to 44 Years | 231 (24.8%) | 219 (35.1%) |
| 45 to 54 Years | 19 (12.8%) | 40 (24.2%) |
| 55 to 64 Years | 31 (10.9%) | 101 (19.5%) |
| 65 to 74 Years | 24 (9.2%) | 36 (8.1%) |
| 75 Years and over | 0 (0.0%) | 29 (25.7%) |
| Total | 436 (14.3%) | 781 (23.9%) |
Income Above Poverty by Sex and Age in Live Oak
According to the poverty statistics in Live Oak, males aged 12 to 14 years and females aged under 5 years are the age groups that are most secure financially, with 100.0% of males and 100.0% of females in these age groups living above the poverty line.
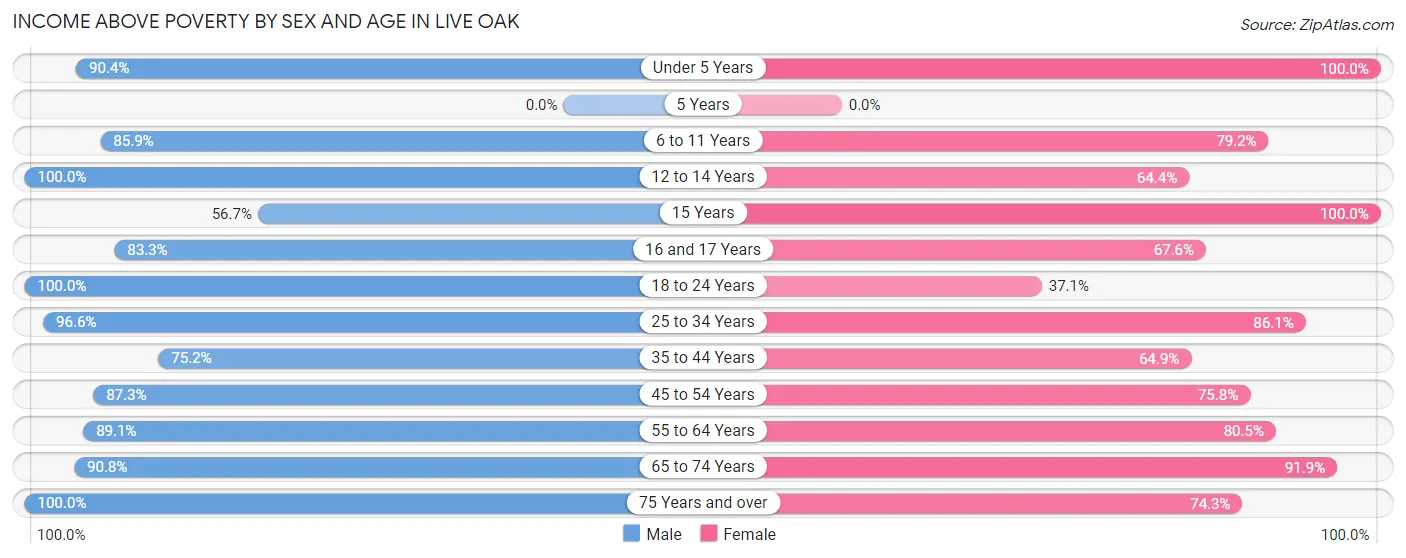
| Age Bracket | Male | Female |
| Under 5 Years | 350 (90.4%) | 177 (100.0%) |
| 5 Years | 0 (0.0%) | 0 (0.0%) |
| 6 to 11 Years | 177 (85.9%) | 411 (79.2%) |
| 12 to 14 Years | 41 (100.0%) | 29 (64.4%) |
| 15 Years | 59 (56.7%) | 17 (100.0%) |
| 16 and 17 Years | 25 (83.3%) | 50 (67.6%) |
| 18 to 24 Years | 410 (100.0%) | 98 (37.1%) |
| 25 to 34 Years | 84 (96.6%) | 260 (86.1%) |
| 35 to 44 Years | 699 (75.2%) | 404 (64.8%) |
| 45 to 54 Years | 130 (87.3%) | 125 (75.8%) |
| 55 to 64 Years | 254 (89.1%) | 418 (80.5%) |
| 65 to 74 Years | 237 (90.8%) | 409 (91.9%) |
| 75 Years and over | 149 (100.0%) | 84 (74.3%) |
| Total | 2,615 (85.7%) | 2,482 (76.1%) |
Income Below Poverty Among Married-Couple Families in Live Oak
The poverty statistics for married-couple families in Live Oak show that 3.2% or 29 of the total 898 families live below the poverty line. Families with 1 or 2 children have the highest poverty rate of 5.4%, comprising of 14 families. On the other hand, families with 3 or 4 children have the lowest poverty rate of 0.0%, which includes 0 families.
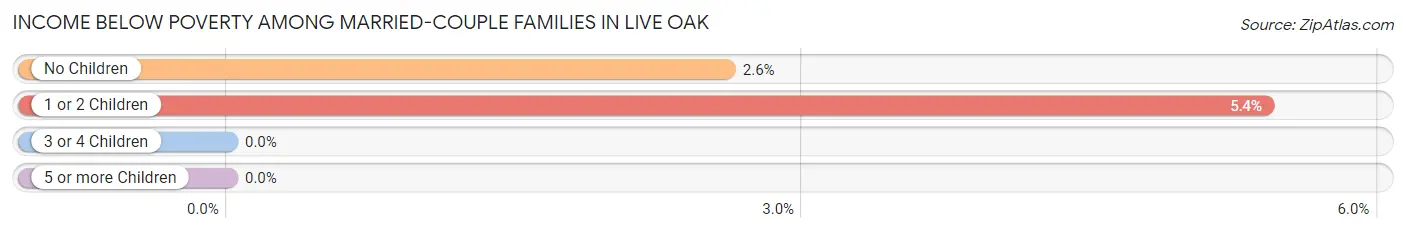
| Children | Above Poverty | Below Poverty |
| No Children | 561 (97.4%) | 15 (2.6%) |
| 1 or 2 Children | 245 (94.6%) | 14 (5.4%) |
| 3 or 4 Children | 63 (100.0%) | 0 (0.0%) |
| 5 or more Children | 0 (0.0%) | 0 (0.0%) |
| Total | 869 (96.8%) | 29 (3.2%) |
Income Below Poverty Among Single-Parent Households in Live Oak
According to the poverty data in Live Oak, 12.6% or 12 single-father households and 62.1% or 231 single-mother households are living below the poverty line. Among single-father households, those with no children have the highest poverty rate, with 12 households (12.6%) experiencing poverty. Likewise, among single-mother households, those with 3 or 4 children have the highest poverty rate, with 42 households (100.0%) falling below the poverty line.
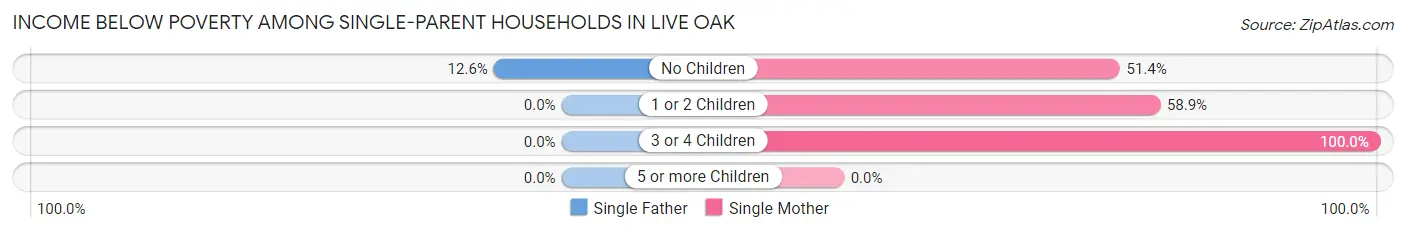
| Children | Single Father | Single Mother |
| No Children | 12 (12.6%) | 37 (51.4%) |
| 1 or 2 Children | 0 (0.0%) | 152 (58.9%) |
| 3 or 4 Children | 0 (0.0%) | 42 (100.0%) |
| 5 or more Children | 0 (0.0%) | 0 (0.0%) |
| Total | 12 (12.6%) | 231 (62.1%) |
Income Below Poverty Among Married-Couple vs Single-Parent Households in Live Oak
The poverty data for Live Oak shows that 29 of the married-couple family households (3.2%) and 243 of the single-parent households (52.0%) are living below the poverty level. Within the married-couple family households, those with 1 or 2 children have the highest poverty rate, with 14 households (5.4%) falling below the poverty line. Among the single-parent households, those with 3 or 4 children have the highest poverty rate, with 42 household (100.0%) living below poverty.
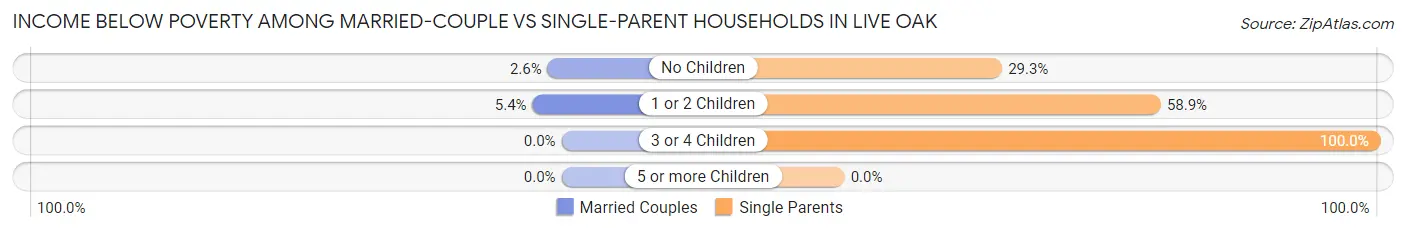
| Children | Married-Couple Families | Single-Parent Households |
| No Children | 15 (2.6%) | 49 (29.3%) |
| 1 or 2 Children | 14 (5.4%) | 152 (58.9%) |
| 3 or 4 Children | 0 (0.0%) | 42 (100.0%) |
| 5 or more Children | 0 (0.0%) | 0 (0.0%) |
| Total | 29 (3.2%) | 243 (52.0%) |
Race in Live Oak
The most populous races in Live Oak are White / Caucasian (3,150 | 46.3%), Black / African American (2,655 | 39.0%), and Two or more Races (813 | 11.9%).
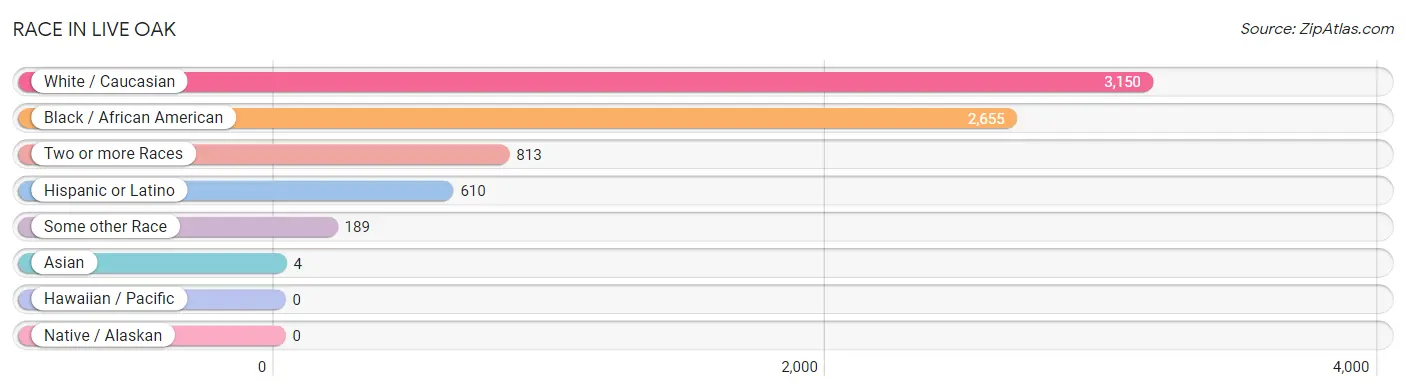
| Race | # Population | % Population |
| Asian | 4 | 0.1% |
| Black / African American | 2,655 | 39.0% |
| Hawaiian / Pacific | 0 | 0.0% |
| Hispanic or Latino | 610 | 9.0% |
| Native / Alaskan | 0 | 0.0% |
| White / Caucasian | 3,150 | 46.3% |
| Two or more Races | 813 | 11.9% |
| Some other Race | 189 | 2.8% |
| Total | 6,811 | 100.0% |
Ancestry in Live Oak
The most populous ancestries reported in Live Oak are Italian (561 | 8.2%), American (449 | 6.6%), German (321 | 4.7%), Irish (228 | 3.4%), and Mexican (216 | 3.2%), together accounting for 26.1% of all Live Oak residents.
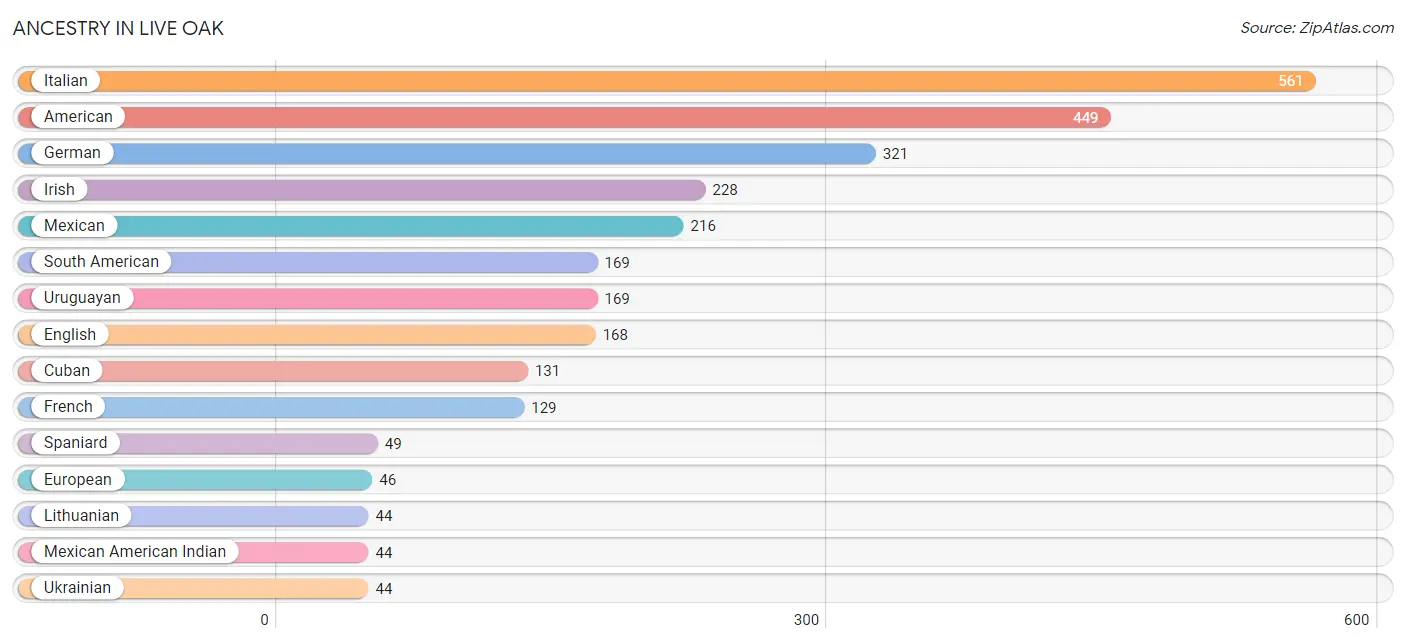
| Ancestry | # Population | % Population |
| African | 4 | 0.1% |
| American | 449 | 6.6% |
| Central American | 14 | 0.2% |
| Central American Indian | 5 | 0.1% |
| Cherokee | 6 | 0.1% |
| Costa Rican | 14 | 0.2% |
| Cuban | 131 | 1.9% |
| Dutch | 10 | 0.2% |
| English | 168 | 2.5% |
| European | 46 | 0.7% |
| French | 129 | 1.9% |
| German | 321 | 4.7% |
| Greek | 20 | 0.3% |
| Irish | 228 | 3.4% |
| Italian | 561 | 8.2% |
| Korean | 4 | 0.1% |
| Lithuanian | 44 | 0.6% |
| Mexican | 216 | 3.2% |
| Mexican American Indian | 44 | 0.6% |
| Polish | 10 | 0.2% |
| Portuguese | 10 | 0.2% |
| Puerto Rican | 31 | 0.5% |
| Scotch-Irish | 32 | 0.5% |
| South American | 169 | 2.5% |
| Spaniard | 49 | 0.7% |
| Subsaharan African | 4 | 0.1% |
| Swiss | 8 | 0.1% |
| Ukrainian | 44 | 0.6% |
| Uruguayan | 169 | 2.5% | View All 29 Rows |
Immigrants in Live Oak
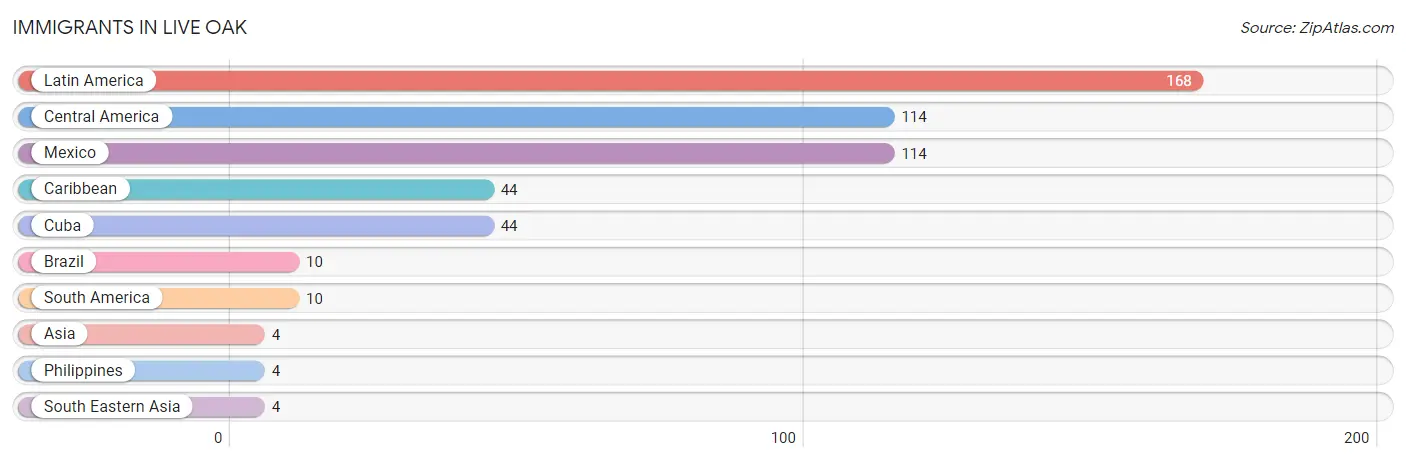
The most numerous immigrant groups reported in Live Oak came from Latin America (168 | 2.5%), Central America (114 | 1.7%), Mexico (114 | 1.7%), Caribbean (44 | 0.6%), and Cuba (44 | 0.6%), together accounting for 7.1% of all Live Oak residents.
| Immigration Origin | # Population | % Population |
| Asia | 4 | 0.1% |
| Brazil | 10 | 0.2% |
| Caribbean | 44 | 0.6% |
| Central America | 114 | 1.7% |
| Cuba | 44 | 0.6% |
| Latin America | 168 | 2.5% |
| Mexico | 114 | 1.7% |
| Philippines | 4 | 0.1% |
| South America | 10 | 0.2% |
| South Eastern Asia | 4 | 0.1% | View All 10 Rows |
Sex and Age in Live Oak
Sex and Age in Live Oak
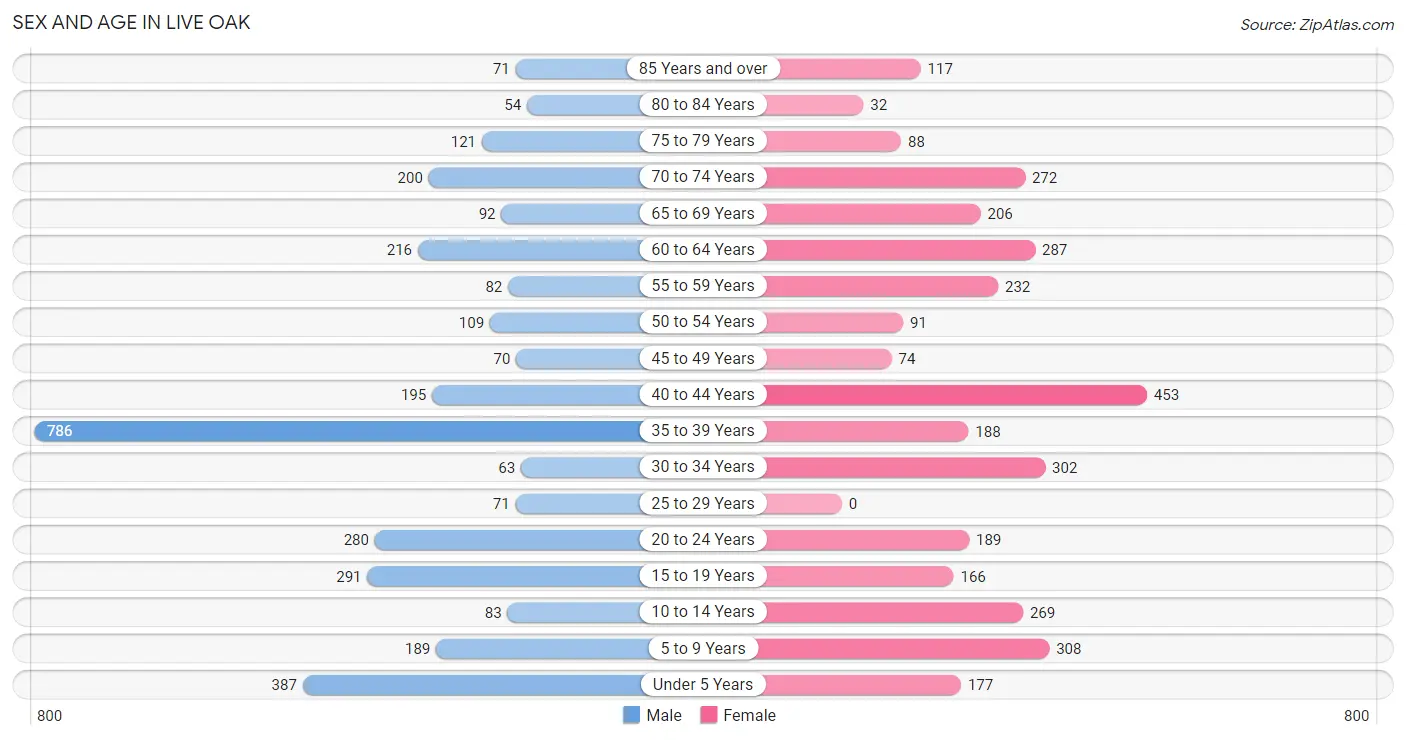
The most populous age groups in Live Oak are 35 to 39 Years (786 | 23.4%) for men and 40 to 44 Years (453 | 13.1%) for women.
| Age Bracket | Male | Female |
| Under 5 Years | 387 (11.5%) | 177 (5.1%) |
| 5 to 9 Years | 189 (5.6%) | 308 (8.9%) |
| 10 to 14 Years | 83 (2.5%) | 269 (7.8%) |
| 15 to 19 Years | 291 (8.7%) | 166 (4.8%) |
| 20 to 24 Years | 280 (8.3%) | 189 (5.5%) |
| 25 to 29 Years | 71 (2.1%) | 0 (0.0%) |
| 30 to 34 Years | 63 (1.9%) | 302 (8.7%) |
| 35 to 39 Years | 786 (23.4%) | 188 (5.4%) |
| 40 to 44 Years | 195 (5.8%) | 453 (13.1%) |
| 45 to 49 Years | 70 (2.1%) | 74 (2.1%) |
| 50 to 54 Years | 109 (3.2%) | 91 (2.6%) |
| 55 to 59 Years | 82 (2.4%) | 232 (6.7%) |
| 60 to 64 Years | 216 (6.4%) | 287 (8.3%) |
| 65 to 69 Years | 92 (2.7%) | 206 (6.0%) |
| 70 to 74 Years | 200 (5.9%) | 272 (7.9%) |
| 75 to 79 Years | 121 (3.6%) | 88 (2.5%) |
| 80 to 84 Years | 54 (1.6%) | 32 (0.9%) |
| 85 Years and over | 71 (2.1%) | 117 (3.4%) |
| Total | 3,360 (100.0%) | 3,451 (100.0%) |
Families and Households in Live Oak
Median Family Size in Live Oak
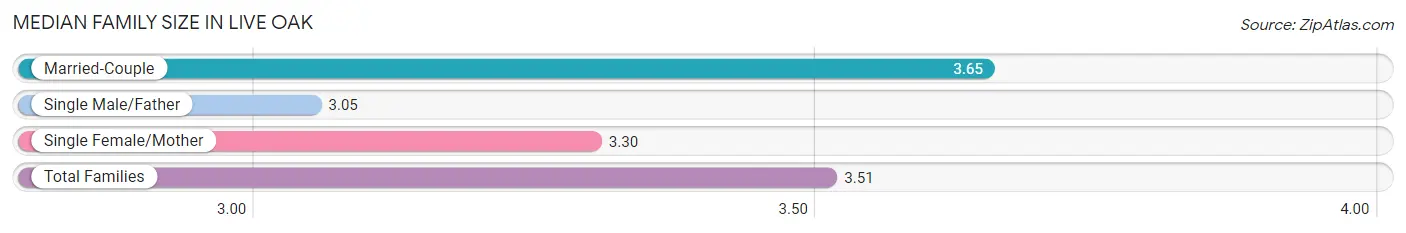
The median family size in Live Oak is 3.51 persons per family, with married-couple families (898 | 65.8%) accounting for the largest median family size of 3.65 persons per family. On the other hand, single male/father families (95 | 7.0%) represent the smallest median family size with 3.05 persons per family.
| Family Type | # Families | Family Size |
| Married-Couple | 898 (65.8%) | 3.65 |
| Single Male/Father | 95 (7.0%) | 3.05 |
| Single Female/Mother | 372 (27.3%) | 3.30 |
| Total Families | 1,365 (100.0%) | 3.51 |
Median Household Size in Live Oak
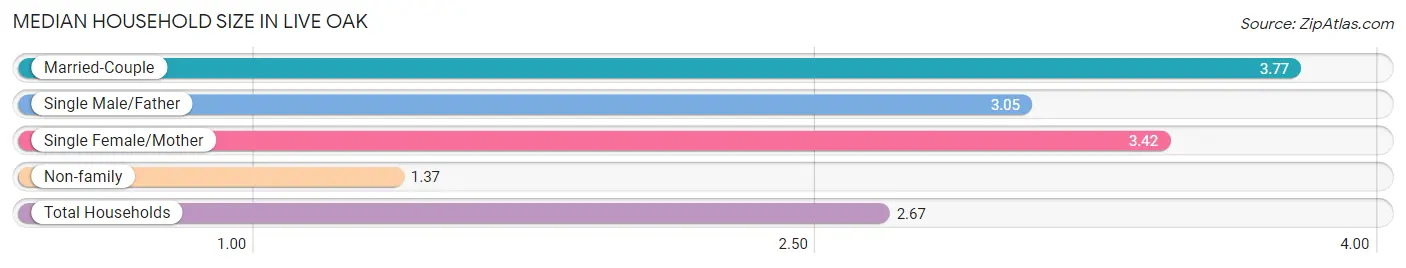
The median household size in Live Oak is 2.67 persons per household, with married-couple households (898 | 38.0%) accounting for the largest median household size of 3.77 persons per household. non-family households (1,000 | 42.3%) represent the smallest median household size with 1.37 persons per household.
| Household Type | # Households | Household Size |
| Married-Couple | 898 (38.0%) | 3.77 |
| Single Male/Father | 95 (4.0%) | 3.05 |
| Single Female/Mother | 372 (15.7%) | 3.42 |
| Non-family | 1,000 (42.3%) | 1.37 |
| Total Households | 2,365 (100.0%) | 2.67 |
Household Size by Marriage Status in Live Oak
Out of a total of 2,365 households in Live Oak, 1,365 (57.7%) are family households, while 1,000 (42.3%) are nonfamily households. The most numerous type of family households are 2-person households, comprising 761, and the most common type of nonfamily households are 1-person households, comprising 729.
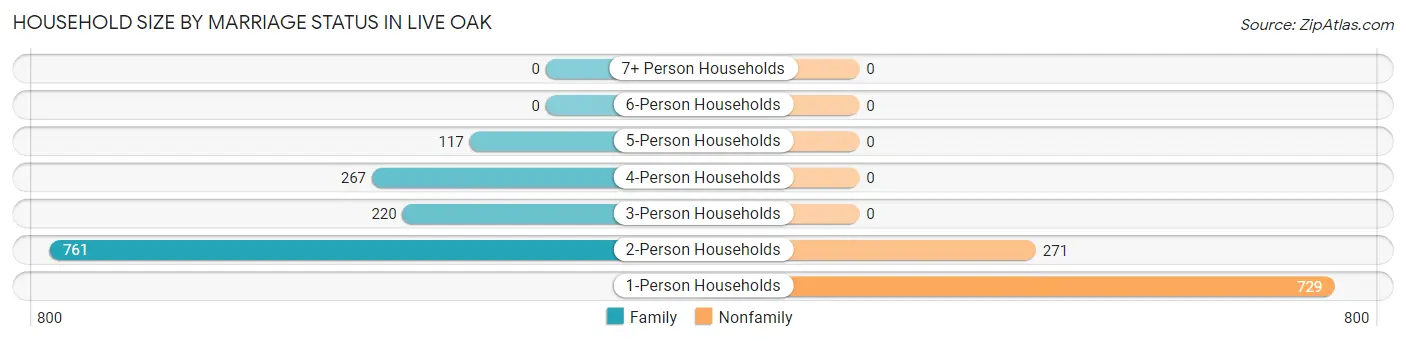
| Household Size | Family Households | Nonfamily Households |
| 1-Person Households | - | 729 (30.8%) |
| 2-Person Households | 761 (32.2%) | 271 (11.5%) |
| 3-Person Households | 220 (9.3%) | 0 (0.0%) |
| 4-Person Households | 267 (11.3%) | 0 (0.0%) |
| 5-Person Households | 117 (5.0%) | 0 (0.0%) |
| 6-Person Households | 0 (0.0%) | 0 (0.0%) |
| 7+ Person Households | 0 (0.0%) | 0 (0.0%) |
| Total | 1,365 (57.7%) | 1,000 (42.3%) |
Female Fertility in Live Oak
Fertility by Age in Live Oak
Average fertility rate in Live Oak is 260.0 births per 1,000 women. Women in the age bracket of 35 to 50 years have the highest fertility rate with 419.0 births per 1,000 women. Women in the age bracket of 35 to 50 years acount for 85.8% of all women with births.
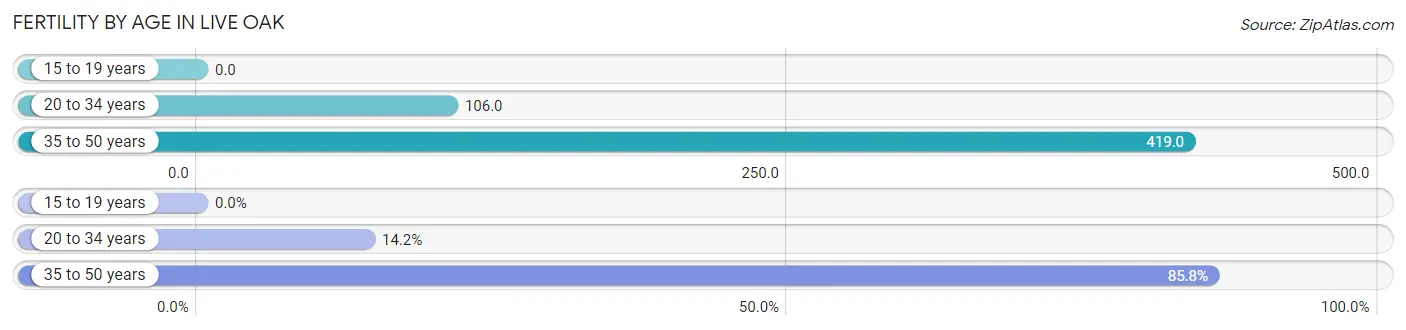
| Age Bracket | Women with Births | Births / 1,000 Women |
| 15 to 19 years | 0 (0.0%) | 0.0 |
| 20 to 34 years | 52 (14.2%) | 106.0 |
| 35 to 50 years | 315 (85.8%) | 419.0 |
| Total | 367 (100.0%) | 260.0 |
Fertility by Age by Marriage Status in Live Oak
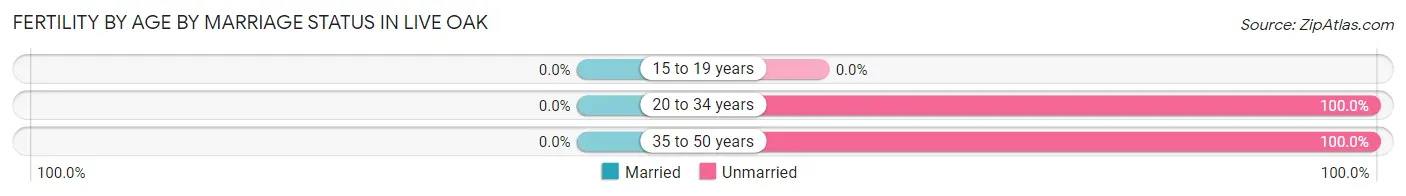
| Age Bracket | Married | Unmarried |
| 15 to 19 years | 0 (0.0%) | 0 (0.0%) |
| 20 to 34 years | 0 (0.0%) | 52 (100.0%) |
| 35 to 50 years | 0 (0.0%) | 315 (100.0%) |
| Total | 0 (0.0%) | 367 (100.0%) |
Fertility by Education in Live Oak
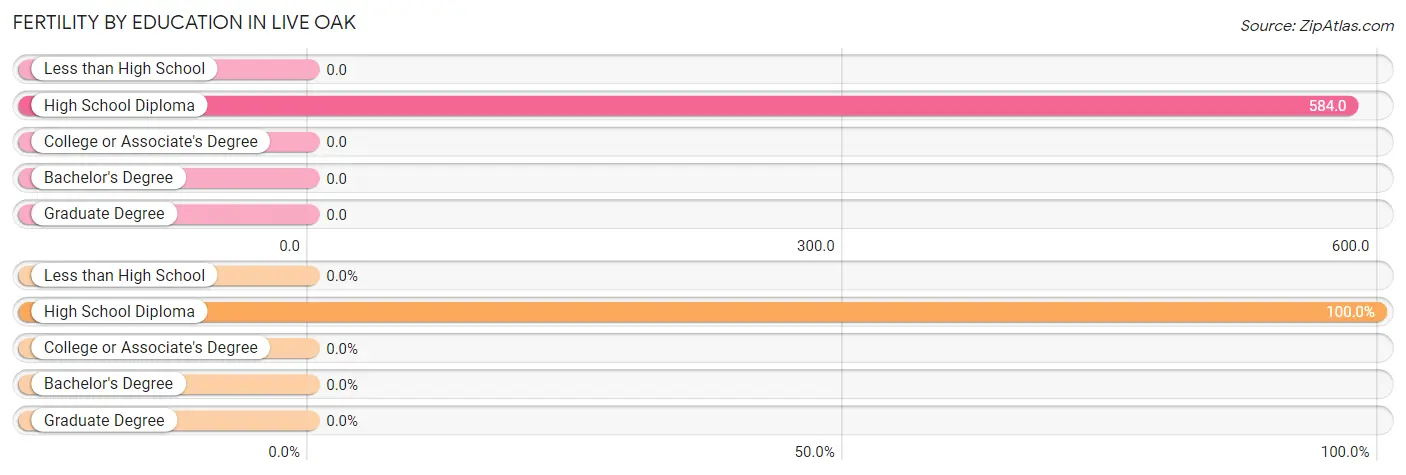
| Educational Attainment | Women with Births | Births / 1,000 Women |
| Less than High School | 0 (0.0%) | 0.0 |
| High School Diploma | 367 (100.0%) | 584.0 |
| College or Associate's Degree | 0 (0.0%) | 0.0 |
| Bachelor's Degree | 0 (0.0%) | 0.0 |
| Graduate Degree | 0 (0.0%) | 0.0 |
| Total | 367 (100.0%) | 260.0 |
Fertility by Education by Marriage Status in Live Oak
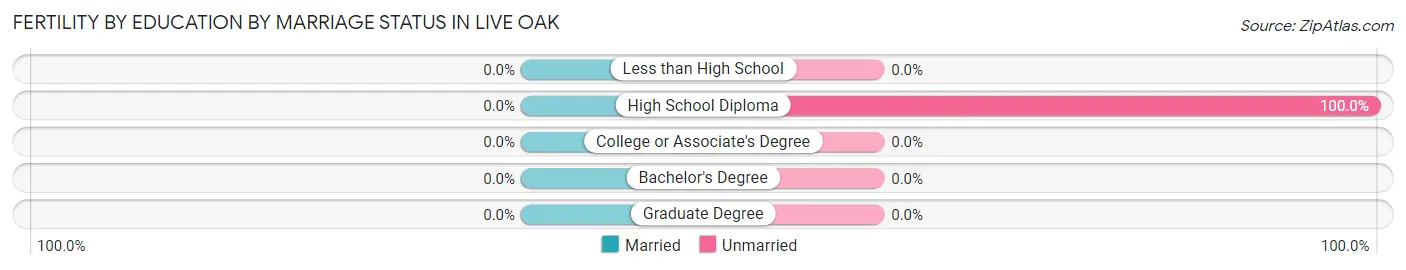
| Educational Attainment | Married | Unmarried |
| Less than High School | 0 (0.0%) | 0 (0.0%) |
| High School Diploma | 0 (0.0%) | 367 (100.0%) |
| College or Associate's Degree | 0 (0.0%) | 0 (0.0%) |
| Bachelor's Degree | 0 (0.0%) | 0 (0.0%) |
| Graduate Degree | 0 (0.0%) | 0 (0.0%) |
| Total | 0 (0.0%) | 367 (100.0%) |
Employment Characteristics in Live Oak
Employment by Class of Employer in Live Oak
Among the 2,815 employed individuals in Live Oak, private company employees (2,049 | 72.8%), self-employed (incorporated) (333 | 11.8%), and state government employees (147 | 5.2%) make up the most common classes of employment.
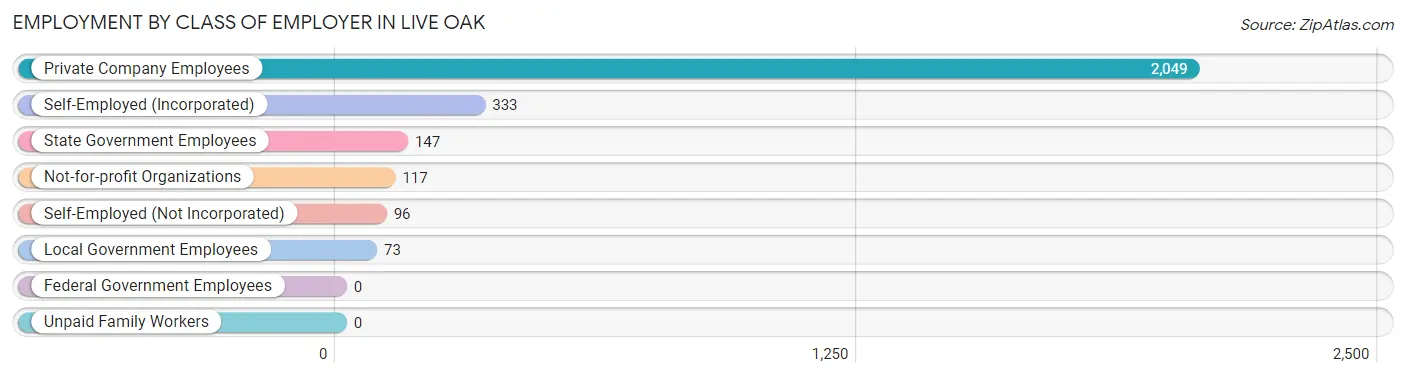
| Employer Class | # Employees | % Employees |
| Private Company Employees | 2,049 | 72.8% |
| Self-Employed (Incorporated) | 333 | 11.8% |
| Self-Employed (Not Incorporated) | 96 | 3.4% |
| Not-for-profit Organizations | 117 | 4.2% |
| Local Government Employees | 73 | 2.6% |
| State Government Employees | 147 | 5.2% |
| Federal Government Employees | 0 | 0.0% |
| Unpaid Family Workers | 0 | 0.0% |
| Total | 2,815 | 100.0% |
Employment Status by Age in Live Oak
According to the labor force statistics for Live Oak, out of the total population over 16 years of age (5,277), 63.1% or 3,330 individuals are in the labor force, with 13.6% or 453 of them unemployed. The age group with the highest labor force participation rate is 20 to 24 years, with 83.2% or 390 individuals in the labor force. Within the labor force, the 16 to 19 years age range has the highest percentage of unemployed individuals, with 46.6% or 118 of them being unemployed.
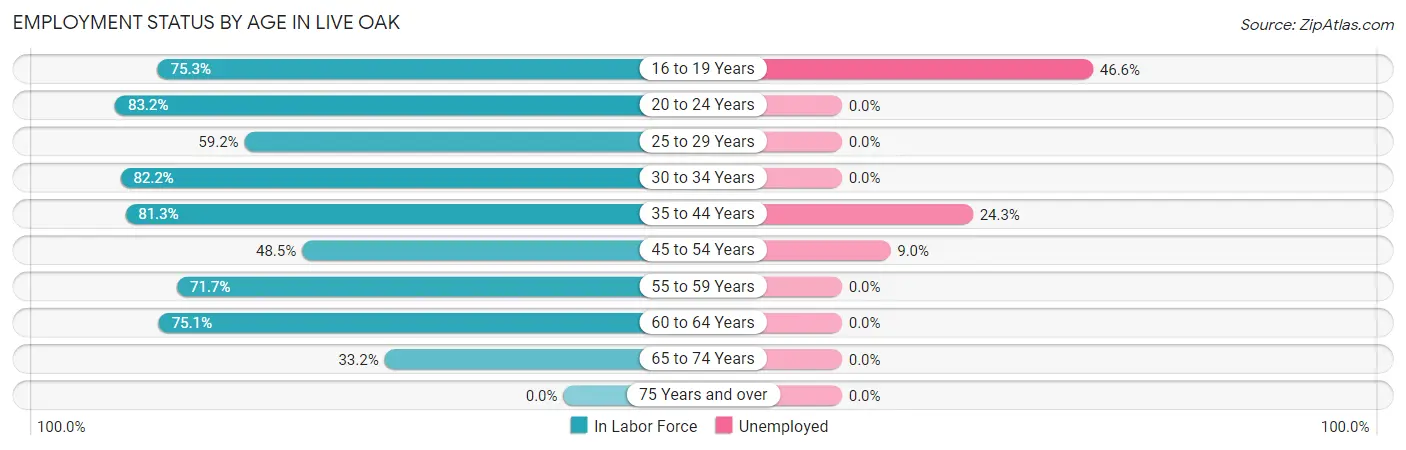
| Age Bracket | In Labor Force | Unemployed |
| 16 to 19 Years | 253 (75.3%) | 118 (46.6%) |
| 20 to 24 Years | 390 (83.2%) | 0 (0.0%) |
| 25 to 29 Years | 42 (59.2%) | 0 (0.0%) |
| 30 to 34 Years | 300 (82.2%) | 0 (0.0%) |
| 35 to 44 Years | 1,319 (81.3%) | 321 (24.3%) |
| 45 to 54 Years | 167 (48.5%) | 15 (9.0%) |
| 55 to 59 Years | 225 (71.7%) | 0 (0.0%) |
| 60 to 64 Years | 378 (75.1%) | 0 (0.0%) |
| 65 to 74 Years | 256 (33.2%) | 0 (0.0%) |
| 75 Years and over | 0 (0.0%) | 0 (0.0%) |
| Total | 3,330 (63.1%) | 453 (13.6%) |
Employment Status by Educational Attainment in Live Oak
According to labor force statistics for Live Oak, 75.5% of individuals (2,430) out of the total population between 25 and 64 years of age (3,219) are in the labor force, with 13.8% or 335 of them being unemployed. The group with the highest labor force participation rate are those with the educational attainment of college / associate degree, with 87.2% or 1,134 individuals in the labor force. Within the labor force, individuals with high school diploma education have the highest percentage of unemployment, with 25.8% or 239 of them being unemployed.
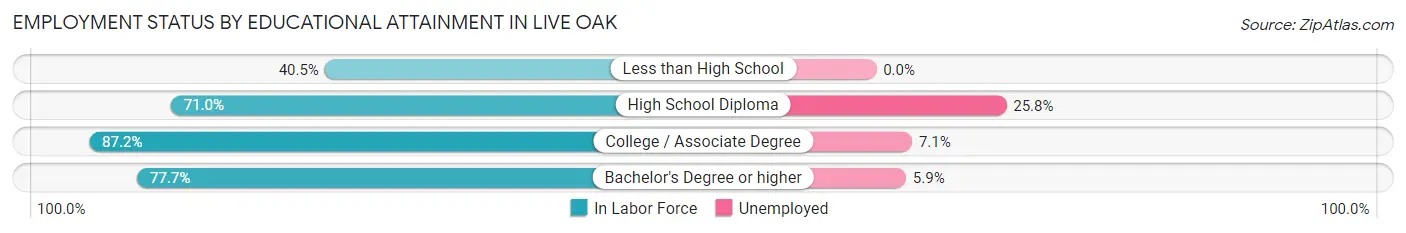
| Educational Attainment | In Labor Force | Unemployed |
| Less than High School | 115 (40.5%) | 0 (0.0%) |
| High School Diploma | 928 (71.0%) | 337 (25.8%) |
| College / Associate Degree | 1,134 (87.2%) | 92 (7.1%) |
| Bachelor's Degree or higher | 255 (77.7%) | 19 (5.9%) |
| Total | 2,430 (75.5%) | 444 (13.8%) |
Employment Occupations by Sex in Live Oak
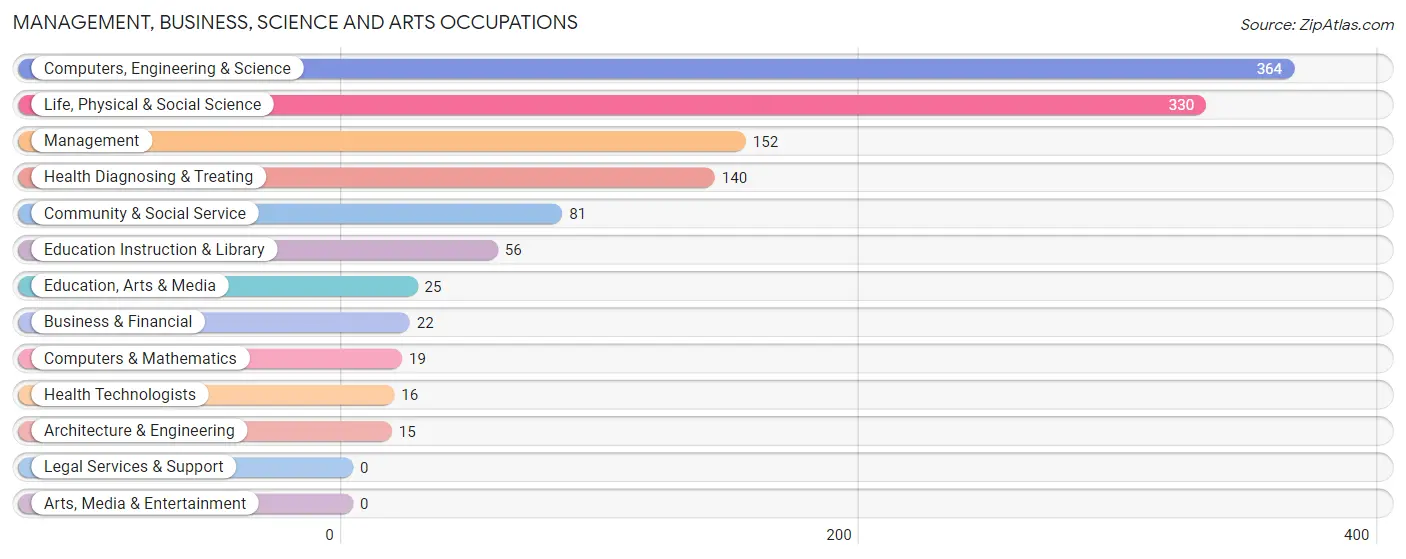
Management, Business, Science and Arts Occupations
The most common Management, Business, Science and Arts occupations in Live Oak are Computers, Engineering & Science (364 | 12.7%), Life, Physical & Social Science (330 | 11.5%), Management (152 | 5.3%), Health Diagnosing & Treating (140 | 4.9%), and Community & Social Service (81 | 2.8%).
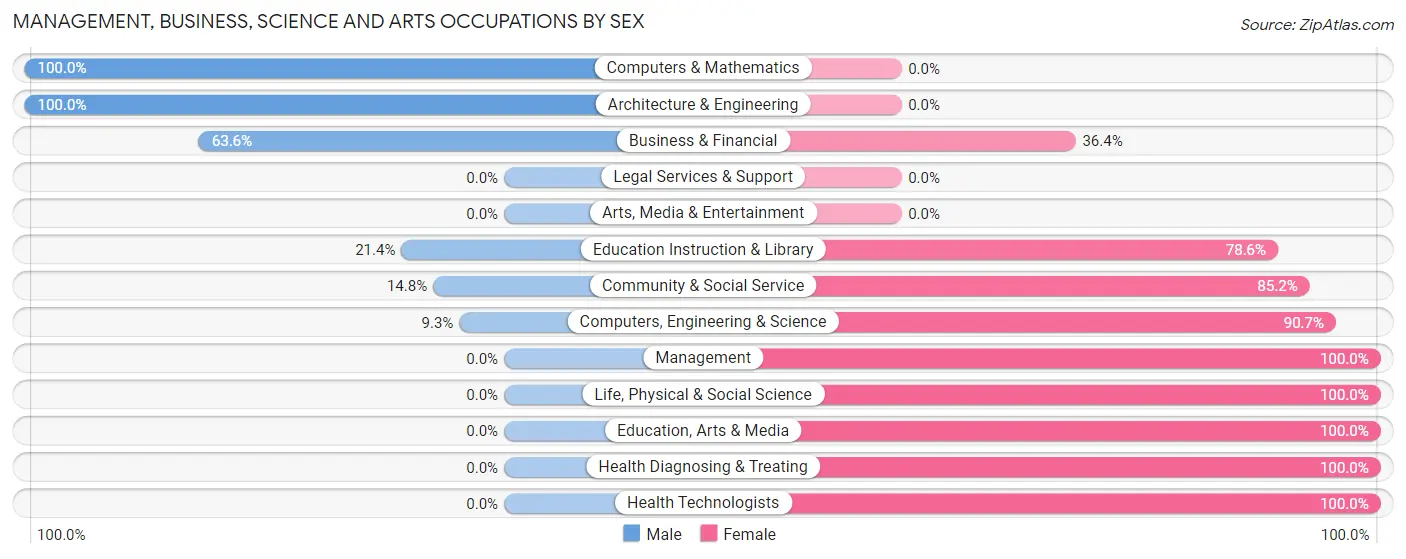
Management, Business, Science and Arts Occupations by Sex
Within the Management, Business, Science and Arts occupations in Live Oak, the most male-oriented occupations are Computers & Mathematics (100.0%), Architecture & Engineering (100.0%), and Business & Financial (63.6%), while the most female-oriented occupations are Management (100.0%), Life, Physical & Social Science (100.0%), and Education, Arts & Media (100.0%).
| Occupation | Male | Female |
| Management | 0 (0.0%) | 152 (100.0%) |
| Business & Financial | 14 (63.6%) | 8 (36.4%) |
| Computers, Engineering & Science | 34 (9.3%) | 330 (90.7%) |
| Computers & Mathematics | 19 (100.0%) | 0 (0.0%) |
| Architecture & Engineering | 15 (100.0%) | 0 (0.0%) |
| Life, Physical & Social Science | 0 (0.0%) | 330 (100.0%) |
| Community & Social Service | 12 (14.8%) | 69 (85.2%) |
| Education, Arts & Media | 0 (0.0%) | 25 (100.0%) |
| Legal Services & Support | 0 (0.0%) | 0 (0.0%) |
| Education Instruction & Library | 12 (21.4%) | 44 (78.6%) |
| Arts, Media & Entertainment | 0 (0.0%) | 0 (0.0%) |
| Health Diagnosing & Treating | 0 (0.0%) | 140 (100.0%) |
| Health Technologists | 0 (0.0%) | 16 (100.0%) |
| Total (Category) | 60 (7.9%) | 699 (92.1%) |
| Total (Overall) | 1,357 (47.2%) | 1,520 (52.8%) |
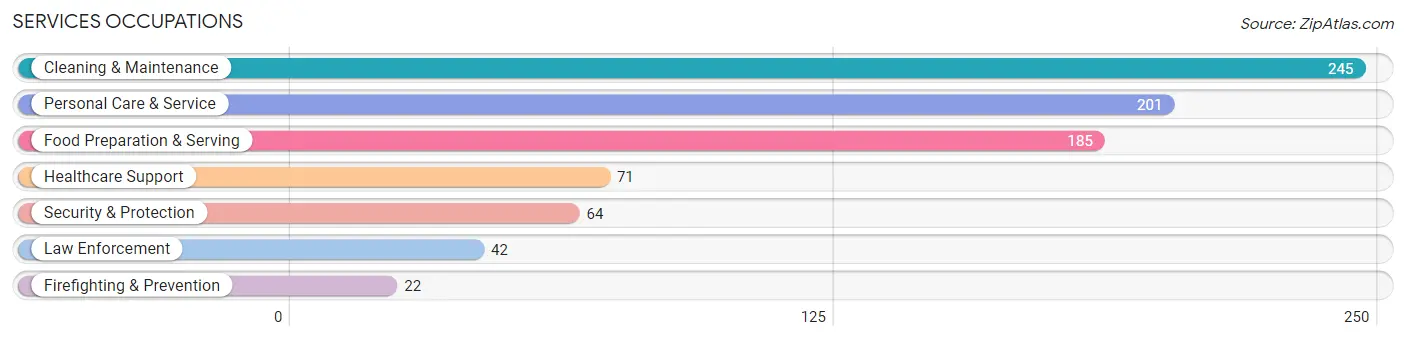
Services Occupations
The most common Services occupations in Live Oak are Cleaning & Maintenance (245 | 8.5%), Personal Care & Service (201 | 7.0%), Food Preparation & Serving (185 | 6.4%), Healthcare Support (71 | 2.5%), and Security & Protection (64 | 2.2%).
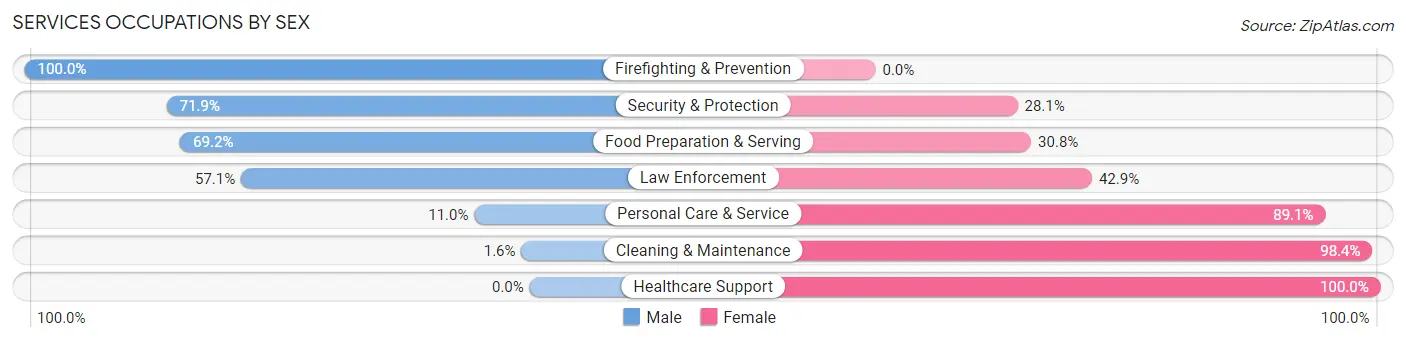
Services Occupations by Sex
Within the Services occupations in Live Oak, the most male-oriented occupations are Firefighting & Prevention (100.0%), Security & Protection (71.9%), and Food Preparation & Serving (69.2%), while the most female-oriented occupations are Healthcare Support (100.0%), Cleaning & Maintenance (98.4%), and Personal Care & Service (89.0%).
| Occupation | Male | Female |
| Healthcare Support | 0 (0.0%) | 71 (100.0%) |
| Security & Protection | 46 (71.9%) | 18 (28.1%) |
| Firefighting & Prevention | 22 (100.0%) | 0 (0.0%) |
| Law Enforcement | 24 (57.1%) | 18 (42.9%) |
| Food Preparation & Serving | 128 (69.2%) | 57 (30.8%) |
| Cleaning & Maintenance | 4 (1.6%) | 241 (98.4%) |
| Personal Care & Service | 22 (11.0%) | 179 (89.0%) |
| Total (Category) | 200 (26.1%) | 566 (73.9%) |
| Total (Overall) | 1,357 (47.2%) | 1,520 (52.8%) |
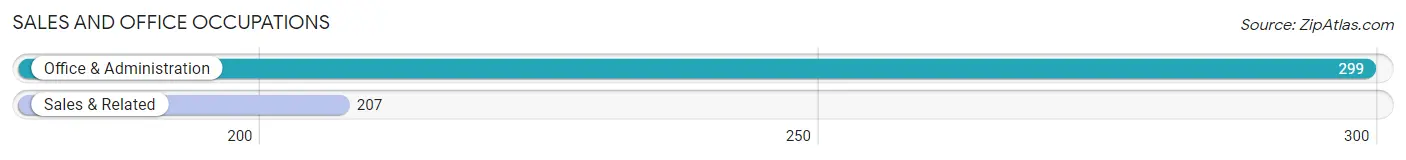
Sales and Office Occupations
The most common Sales and Office occupations in Live Oak are Office & Administration (299 | 10.4%), and Sales & Related (207 | 7.2%).
Sales and Office Occupations by Sex
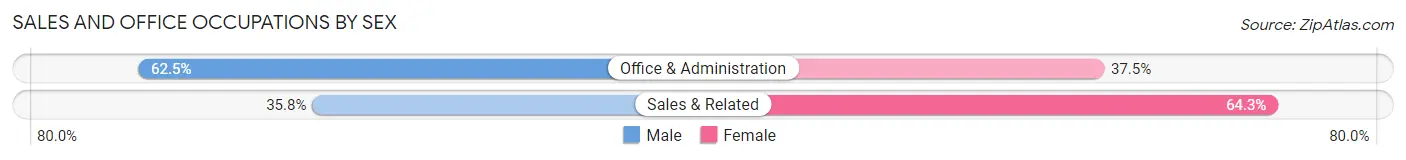
| Occupation | Male | Female |
| Sales & Related | 74 (35.7%) | 133 (64.2%) |
| Office & Administration | 187 (62.5%) | 112 (37.5%) |
| Total (Category) | 261 (51.6%) | 245 (48.4%) |
| Total (Overall) | 1,357 (47.2%) | 1,520 (52.8%) |
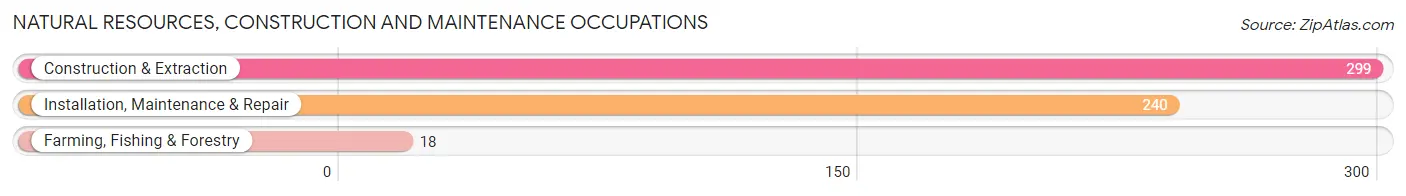
Natural Resources, Construction and Maintenance Occupations
The most common Natural Resources, Construction and Maintenance occupations in Live Oak are Construction & Extraction (299 | 10.4%), Installation, Maintenance & Repair (240 | 8.3%), and Farming, Fishing & Forestry (18 | 0.6%).
Natural Resources, Construction and Maintenance Occupations by Sex
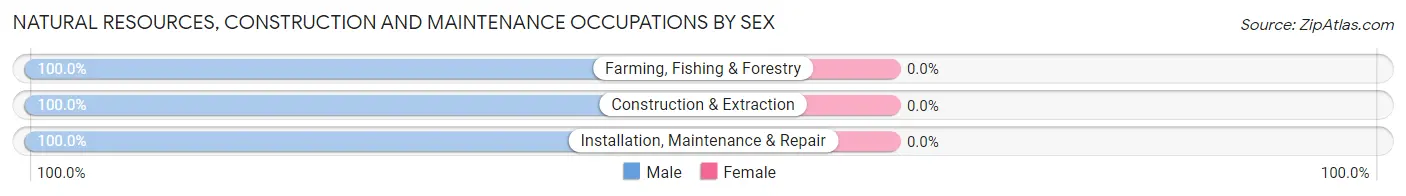
| Occupation | Male | Female |
| Farming, Fishing & Forestry | 18 (100.0%) | 0 (0.0%) |
| Construction & Extraction | 299 (100.0%) | 0 (0.0%) |
| Installation, Maintenance & Repair | 240 (100.0%) | 0 (0.0%) |
| Total (Category) | 557 (100.0%) | 0 (0.0%) |
| Total (Overall) | 1,357 (47.2%) | 1,520 (52.8%) |
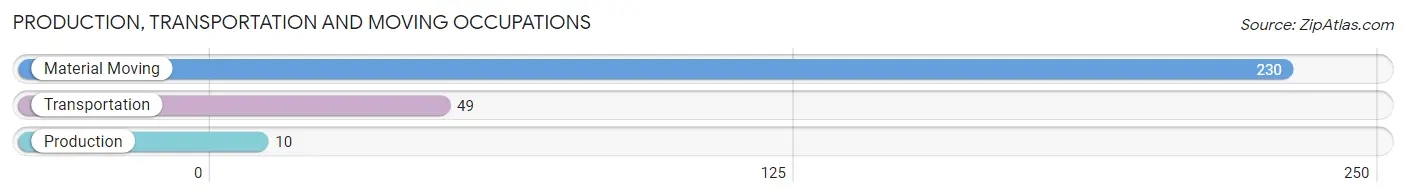
Production, Transportation and Moving Occupations
The most common Production, Transportation and Moving occupations in Live Oak are Material Moving (230 | 8.0%), Transportation (49 | 1.7%), and Production (10 | 0.4%).
Production, Transportation and Moving Occupations by Sex
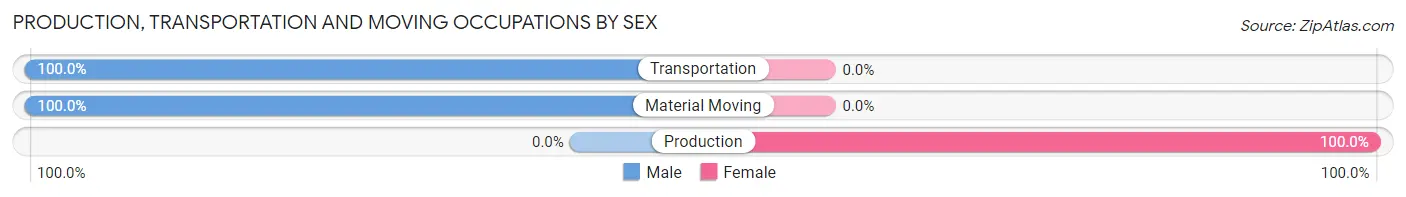
| Occupation | Male | Female |
| Production | 0 (0.0%) | 10 (100.0%) |
| Transportation | 49 (100.0%) | 0 (0.0%) |
| Material Moving | 230 (100.0%) | 0 (0.0%) |
| Total (Category) | 279 (96.5%) | 10 (3.5%) |
| Total (Overall) | 1,357 (47.2%) | 1,520 (52.8%) |
Employment Industries by Sex in Live Oak
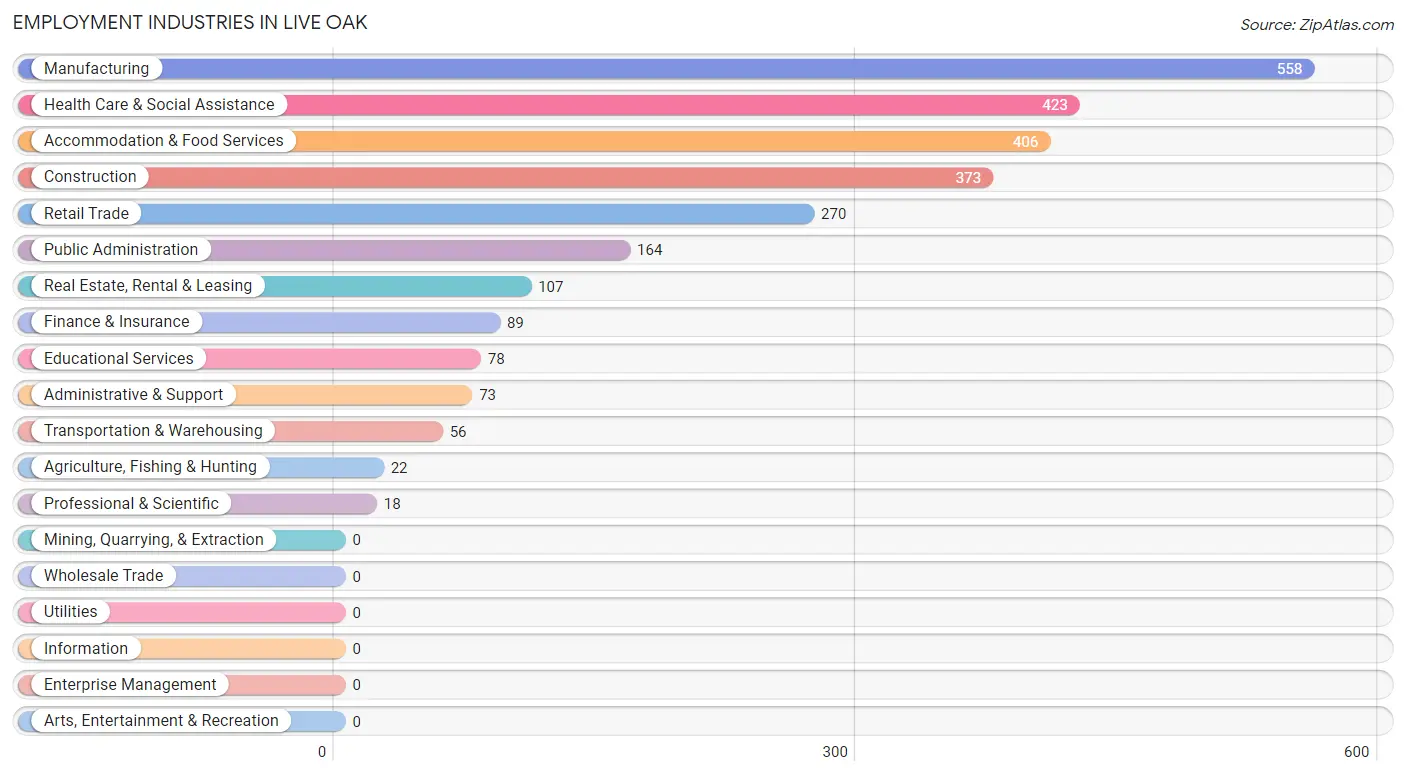
Employment Industries in Live Oak
The major employment industries in Live Oak include Manufacturing (558 | 19.4%), Health Care & Social Assistance (423 | 14.7%), Accommodation & Food Services (406 | 14.1%), Construction (373 | 13.0%), and Retail Trade (270 | 9.4%).
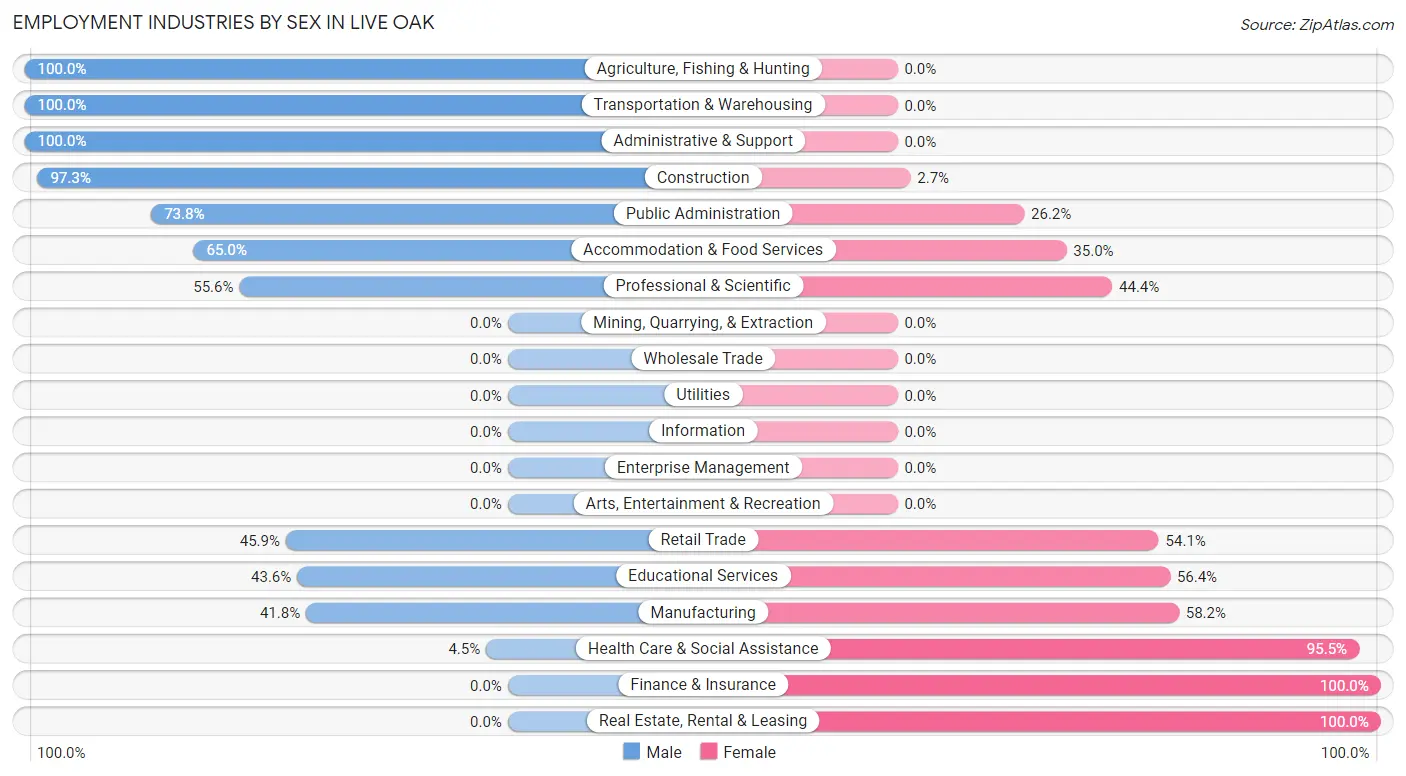
Employment Industries by Sex in Live Oak
The Live Oak industries that see more men than women are Agriculture, Fishing & Hunting (100.0%), Transportation & Warehousing (100.0%), and Administrative & Support (100.0%), whereas the industries that tend to have a higher number of women are Finance & Insurance (100.0%), Real Estate, Rental & Leasing (100.0%), and Health Care & Social Assistance (95.5%).
| Industry | Male | Female |
| Agriculture, Fishing & Hunting | 22 (100.0%) | 0 (0.0%) |
| Mining, Quarrying, & Extraction | 0 (0.0%) | 0 (0.0%) |
| Construction | 363 (97.3%) | 10 (2.7%) |
| Manufacturing | 233 (41.8%) | 325 (58.2%) |
| Wholesale Trade | 0 (0.0%) | 0 (0.0%) |
| Retail Trade | 124 (45.9%) | 146 (54.1%) |
| Transportation & Warehousing | 56 (100.0%) | 0 (0.0%) |
| Utilities | 0 (0.0%) | 0 (0.0%) |
| Information | 0 (0.0%) | 0 (0.0%) |
| Finance & Insurance | 0 (0.0%) | 89 (100.0%) |
| Real Estate, Rental & Leasing | 0 (0.0%) | 107 (100.0%) |
| Professional & Scientific | 10 (55.6%) | 8 (44.4%) |
| Enterprise Management | 0 (0.0%) | 0 (0.0%) |
| Administrative & Support | 73 (100.0%) | 0 (0.0%) |
| Educational Services | 34 (43.6%) | 44 (56.4%) |
| Health Care & Social Assistance | 19 (4.5%) | 404 (95.5%) |
| Arts, Entertainment & Recreation | 0 (0.0%) | 0 (0.0%) |
| Accommodation & Food Services | 264 (65.0%) | 142 (35.0%) |
| Public Administration | 121 (73.8%) | 43 (26.2%) |
| Total | 1,357 (47.2%) | 1,520 (52.8%) |
Education in Live Oak
School Enrollment in Live Oak
The most common levels of schooling among the 1,678 students in Live Oak are elementary school (427 | 25.5%), nursery / preschool (392 | 23.4%), and high school (309 | 18.4%).
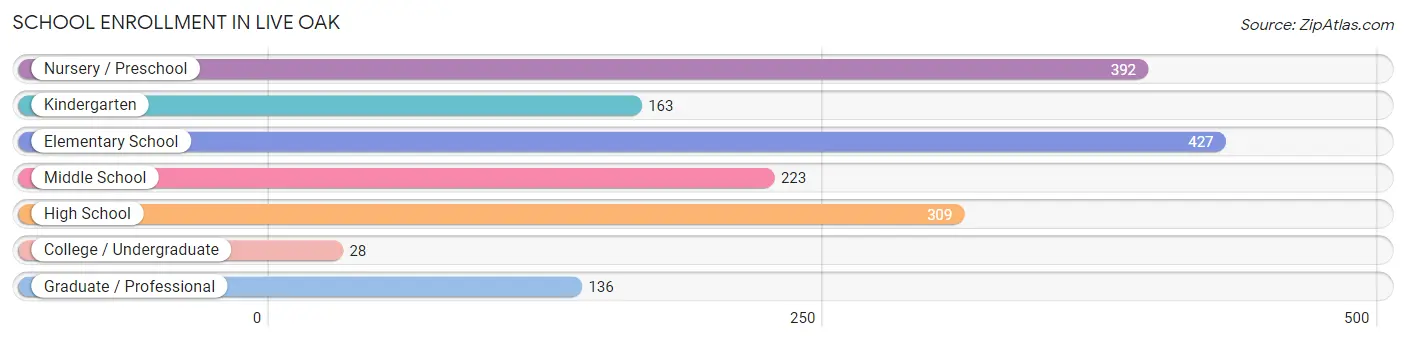
| School Level | # Students | % Students |
| Nursery / Preschool | 392 | 23.4% |
| Kindergarten | 163 | 9.7% |
| Elementary School | 427 | 25.5% |
| Middle School | 223 | 13.3% |
| High School | 309 | 18.4% |
| College / Undergraduate | 28 | 1.7% |
| Graduate / Professional | 136 | 8.1% |
| Total | 1,678 | 100.0% |
School Enrollment by Age by Funding Source in Live Oak
Out of a total of 1,678 students who are enrolled in schools in Live Oak, 312 (18.6%) attend a private institution, while the remaining 1,366 (81.4%) are enrolled in public schools. The age group of 10 to 14 year olds has the highest likelihood of being enrolled in private schools, with 237 (72.3% in the age bracket) enrolled. Conversely, the age group of 5 to 9 year old has the lowest likelihood of being enrolled in a private school, with 497 (100.0% in the age bracket) attending a public institution.
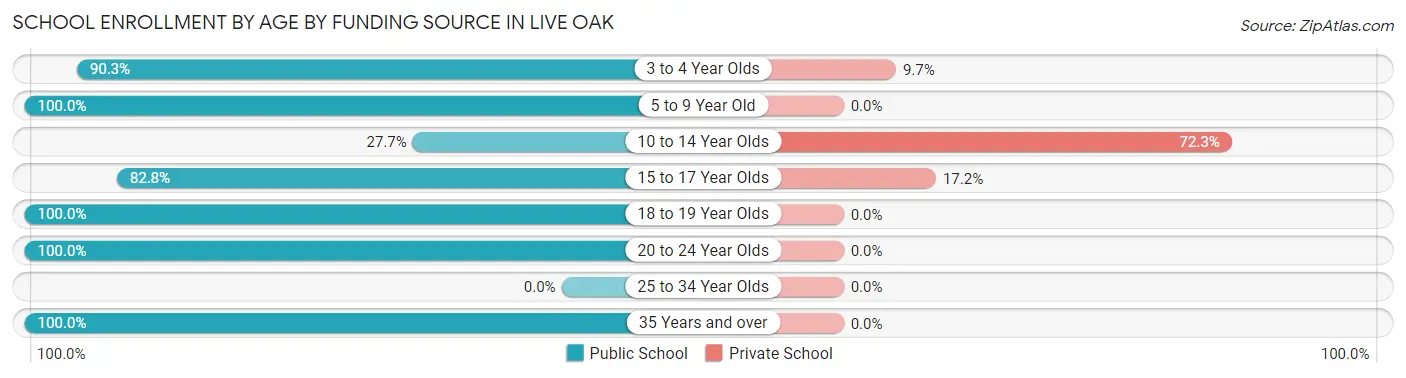
| Age Bracket | Public School | Private School |
| 3 to 4 Year Olds | 343 (90.3%) | 37 (9.7%) |
| 5 to 9 Year Old | 497 (100.0%) | 0 (0.0%) |
| 10 to 14 Year Olds | 91 (27.7%) | 237 (72.3%) |
| 15 to 17 Year Olds | 183 (82.8%) | 38 (17.2%) |
| 18 to 19 Year Olds | 97 (100.0%) | 0 (0.0%) |
| 20 to 24 Year Olds | 148 (100.0%) | 0 (0.0%) |
| 25 to 34 Year Olds | 0 (0.0%) | 0 (0.0%) |
| 35 Years and over | 7 (100.0%) | 0 (0.0%) |
| Total | 1,366 (81.4%) | 312 (18.6%) |
Educational Attainment by Field of Study in Live Oak
Education (178 | 27.5%), business (132 | 20.4%), arts & humanities (65 | 10.1%), literature & languages (44 | 6.8%), and computers & mathematics (35 | 5.4%) are the most common fields of study among 647 individuals in Live Oak who have obtained a bachelor's degree or higher.
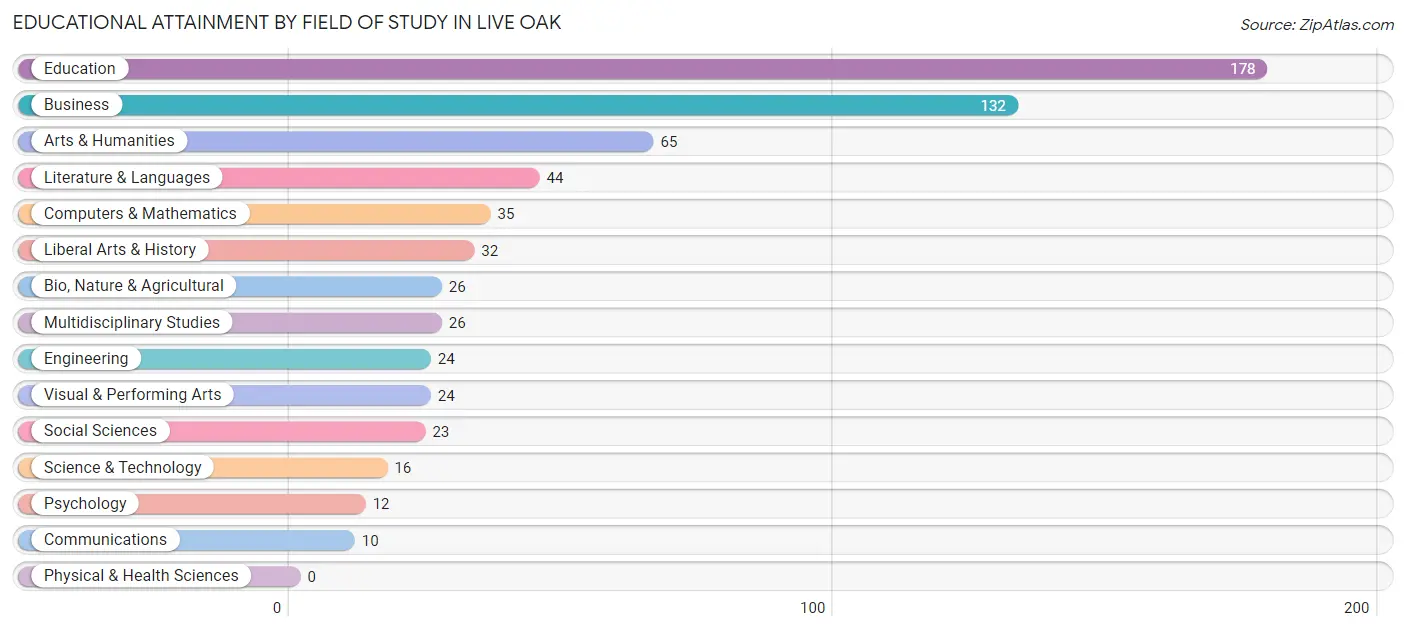
| Field of Study | # Graduates | % Graduates |
| Computers & Mathematics | 35 | 5.4% |
| Bio, Nature & Agricultural | 26 | 4.0% |
| Physical & Health Sciences | 0 | 0.0% |
| Psychology | 12 | 1.8% |
| Social Sciences | 23 | 3.5% |
| Engineering | 24 | 3.7% |
| Multidisciplinary Studies | 26 | 4.0% |
| Science & Technology | 16 | 2.5% |
| Business | 132 | 20.4% |
| Education | 178 | 27.5% |
| Literature & Languages | 44 | 6.8% |
| Liberal Arts & History | 32 | 5.0% |
| Visual & Performing Arts | 24 | 3.7% |
| Communications | 10 | 1.5% |
| Arts & Humanities | 65 | 10.1% |
| Total | 647 | 100.0% |
Transportation & Commute in Live Oak
Vehicle Availability by Sex in Live Oak
The most prevalent vehicle ownership categories in Live Oak are males with 3 vehicles (674, accounting for 49.7%) and females with 3 vehicles (714, making up 46.2%).
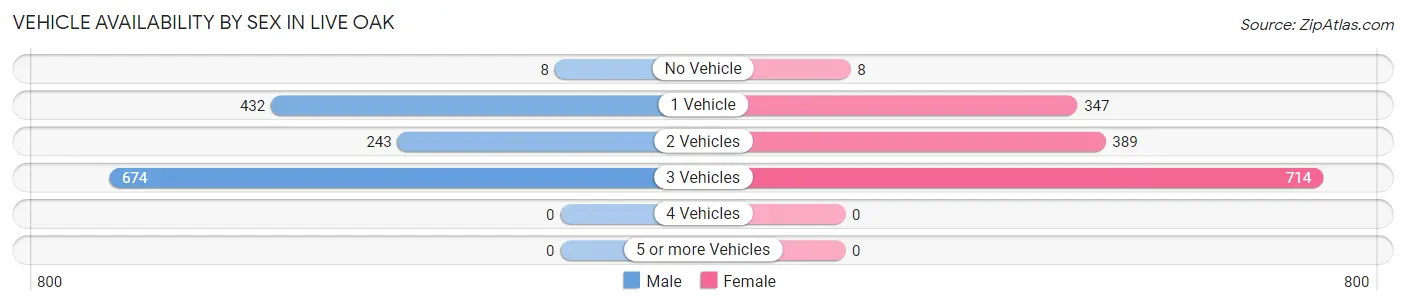
| Vehicles Available | Male | Female |
| No Vehicle | 8 (0.6%) | 8 (0.5%) |
| 1 Vehicle | 432 (31.8%) | 347 (23.8%) |
| 2 Vehicles | 243 (17.9%) | 389 (26.7%) |
| 3 Vehicles | 674 (49.7%) | 714 (49.0%) |
| 4 Vehicles | 0 (0.0%) | 0 (0.0%) |
| 5 or more Vehicles | 0 (0.0%) | 0 (0.0%) |
| Total | 1,357 (100.0%) | 1,458 (100.0%) |
Commute Time in Live Oak
The most frequently occuring commute durations in Live Oak are 15 to 19 minutes (631 commuters, 24.0%), 5 to 9 minutes (558 commuters, 21.3%), and 10 to 14 minutes (423 commuters, 16.1%).
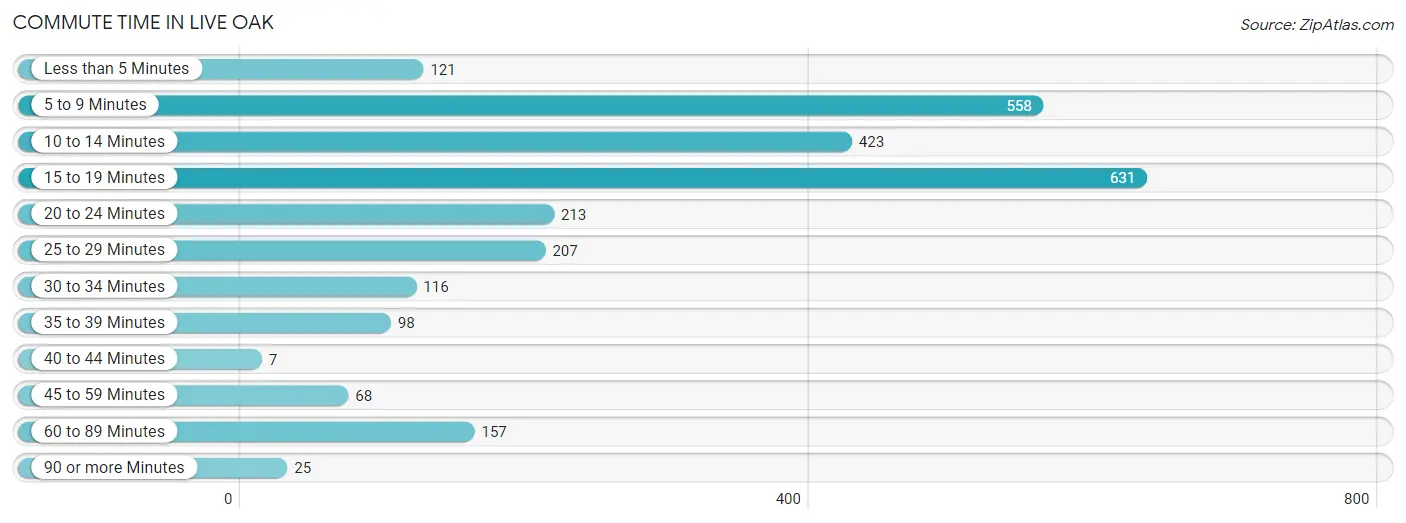
| Commute Time | # Commuters | % Commuters |
| Less than 5 Minutes | 121 | 4.6% |
| 5 to 9 Minutes | 558 | 21.3% |
| 10 to 14 Minutes | 423 | 16.1% |
| 15 to 19 Minutes | 631 | 24.0% |
| 20 to 24 Minutes | 213 | 8.1% |
| 25 to 29 Minutes | 207 | 7.9% |
| 30 to 34 Minutes | 116 | 4.4% |
| 35 to 39 Minutes | 98 | 3.7% |
| 40 to 44 Minutes | 7 | 0.3% |
| 45 to 59 Minutes | 68 | 2.6% |
| 60 to 89 Minutes | 157 | 6.0% |
| 90 or more Minutes | 25 | 0.9% |
Commute Time by Sex in Live Oak
The most common commute times in Live Oak are 15 to 19 minutes (276 commuters, 22.1%) for males and 5 to 9 minutes (412 commuters, 29.9%) for females.
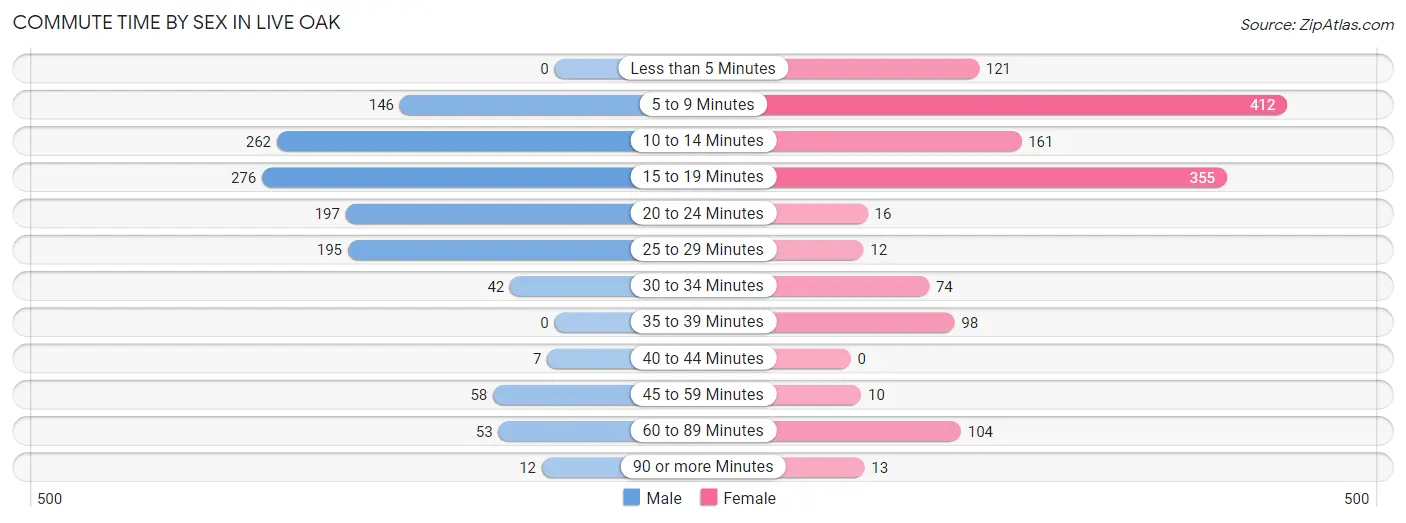
| Commute Time | Male | Female |
| Less than 5 Minutes | 0 (0.0%) | 121 (8.8%) |
| 5 to 9 Minutes | 146 (11.7%) | 412 (29.9%) |
| 10 to 14 Minutes | 262 (21.0%) | 161 (11.7%) |
| 15 to 19 Minutes | 276 (22.1%) | 355 (25.8%) |
| 20 to 24 Minutes | 197 (15.8%) | 16 (1.2%) |
| 25 to 29 Minutes | 195 (15.6%) | 12 (0.9%) |
| 30 to 34 Minutes | 42 (3.4%) | 74 (5.4%) |
| 35 to 39 Minutes | 0 (0.0%) | 98 (7.1%) |
| 40 to 44 Minutes | 7 (0.6%) | 0 (0.0%) |
| 45 to 59 Minutes | 58 (4.6%) | 10 (0.7%) |
| 60 to 89 Minutes | 53 (4.3%) | 104 (7.6%) |
| 90 or more Minutes | 12 (1.0%) | 13 (0.9%) |
Time of Departure to Work by Sex in Live Oak
The most frequent times of departure to work in Live Oak are 12:00 PM to 3:59 PM (309, 24.8%) for males and 9:00 AM to 9:59 AM (324, 23.5%) for females.
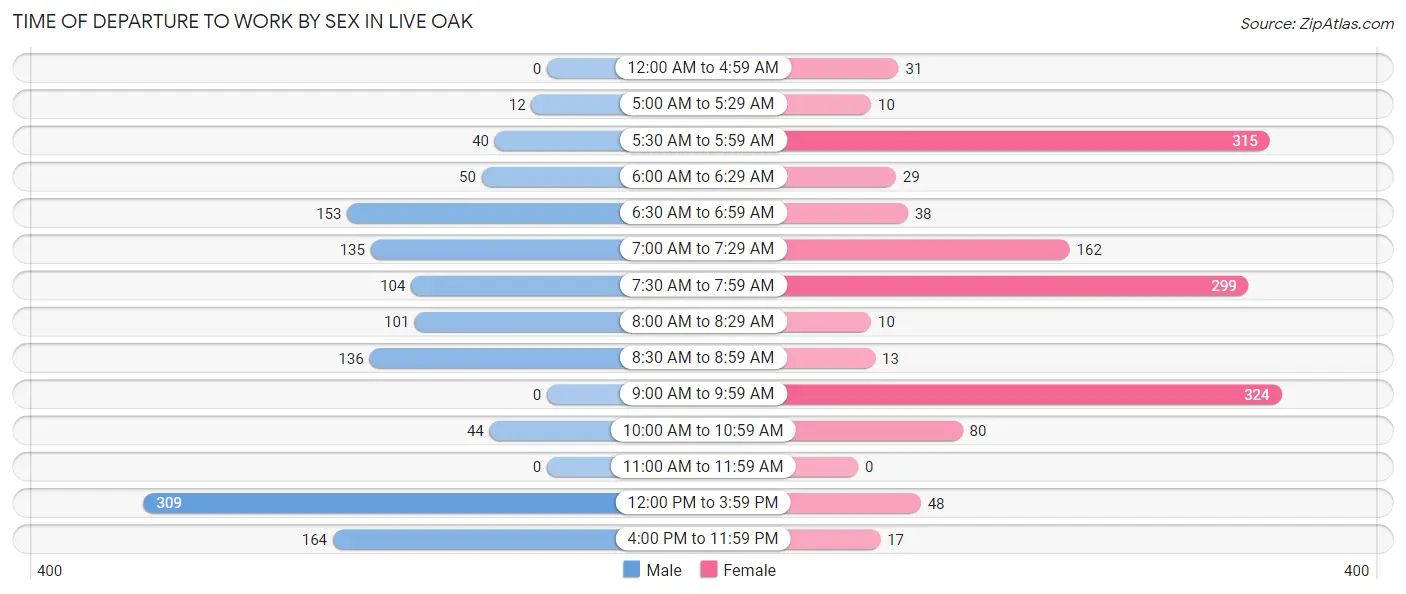
| Time of Departure | Male | Female |
| 12:00 AM to 4:59 AM | 0 (0.0%) | 31 (2.2%) |
| 5:00 AM to 5:29 AM | 12 (1.0%) | 10 (0.7%) |
| 5:30 AM to 5:59 AM | 40 (3.2%) | 315 (22.9%) |
| 6:00 AM to 6:29 AM | 50 (4.0%) | 29 (2.1%) |
| 6:30 AM to 6:59 AM | 153 (12.3%) | 38 (2.8%) |
| 7:00 AM to 7:29 AM | 135 (10.8%) | 162 (11.8%) |
| 7:30 AM to 7:59 AM | 104 (8.3%) | 299 (21.7%) |
| 8:00 AM to 8:29 AM | 101 (8.1%) | 10 (0.7%) |
| 8:30 AM to 8:59 AM | 136 (10.9%) | 13 (0.9%) |
| 9:00 AM to 9:59 AM | 0 (0.0%) | 324 (23.5%) |
| 10:00 AM to 10:59 AM | 44 (3.5%) | 80 (5.8%) |
| 11:00 AM to 11:59 AM | 0 (0.0%) | 0 (0.0%) |
| 12:00 PM to 3:59 PM | 309 (24.8%) | 48 (3.5%) |
| 4:00 PM to 11:59 PM | 164 (13.1%) | 17 (1.2%) |
| Total | 1,248 (100.0%) | 1,376 (100.0%) |
Housing Occupancy in Live Oak
Occupancy by Ownership in Live Oak
Of the total 2,365 dwellings in Live Oak, owner-occupied units account for 1,177 (49.8%), while renter-occupied units make up 1,188 (50.2%).
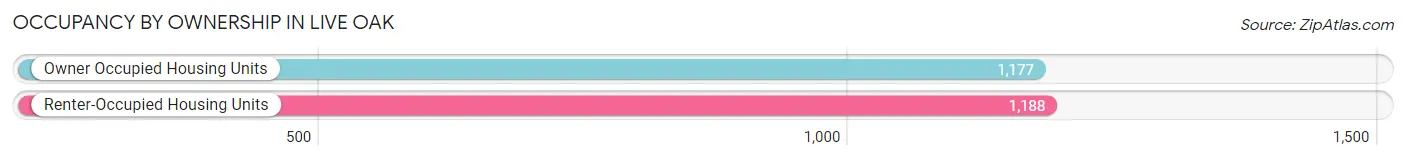
| Occupancy | # Housing Units | % Housing Units |
| Owner Occupied Housing Units | 1,177 | 49.8% |
| Renter-Occupied Housing Units | 1,188 | 50.2% |
| Total Occupied Housing Units | 2,365 | 100.0% |
Occupancy by Household Size in Live Oak
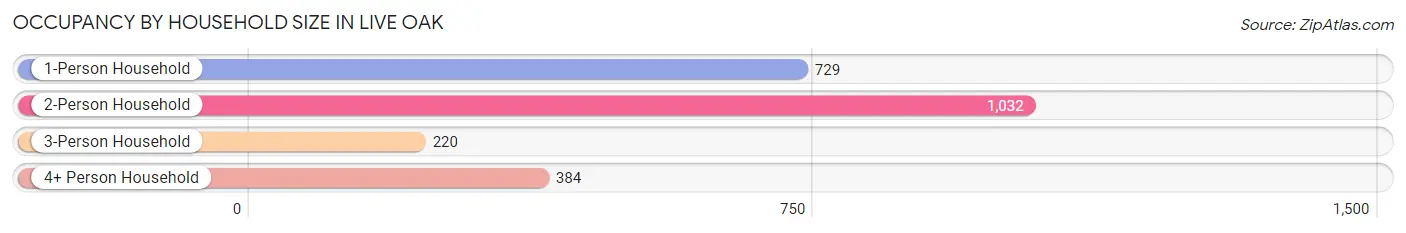
| Household Size | # Housing Units | % Housing Units |
| 1-Person Household | 729 | 30.8% |
| 2-Person Household | 1,032 | 43.6% |
| 3-Person Household | 220 | 9.3% |
| 4+ Person Household | 384 | 16.2% |
| Total Housing Units | 2,365 | 100.0% |
Occupancy by Ownership by Household Size in Live Oak
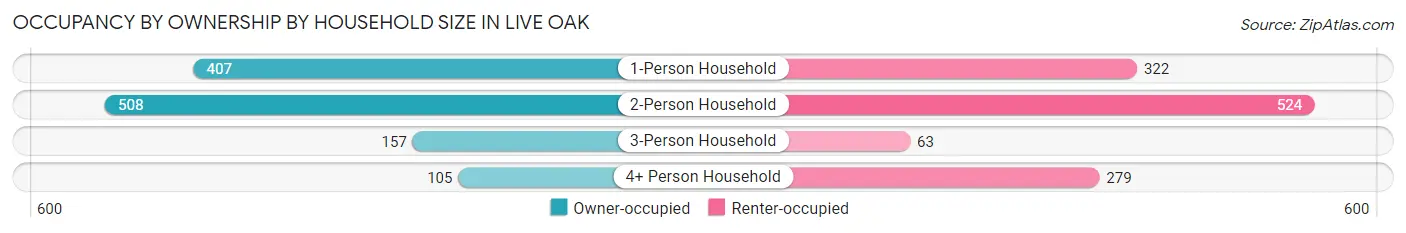
| Household Size | Owner-occupied | Renter-occupied |
| 1-Person Household | 407 (55.8%) | 322 (44.2%) |
| 2-Person Household | 508 (49.2%) | 524 (50.8%) |
| 3-Person Household | 157 (71.4%) | 63 (28.6%) |
| 4+ Person Household | 105 (27.3%) | 279 (72.7%) |
| Total Housing Units | 1,177 (49.8%) | 1,188 (50.2%) |
Occupancy by Educational Attainment in Live Oak
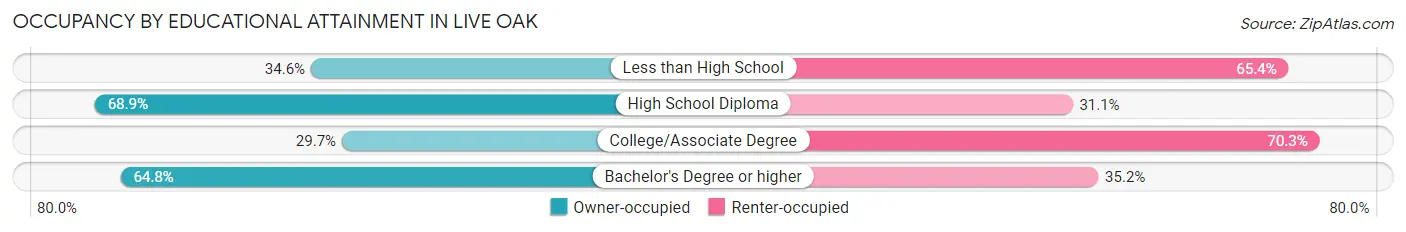
| Household Size | Owner-occupied | Renter-occupied |
| Less than High School | 92 (34.6%) | 174 (65.4%) |
| High School Diploma | 593 (68.9%) | 268 (31.1%) |
| College/Associate Degree | 262 (29.7%) | 621 (70.3%) |
| Bachelor's Degree or higher | 230 (64.8%) | 125 (35.2%) |
Occupancy by Age of Householder in Live Oak
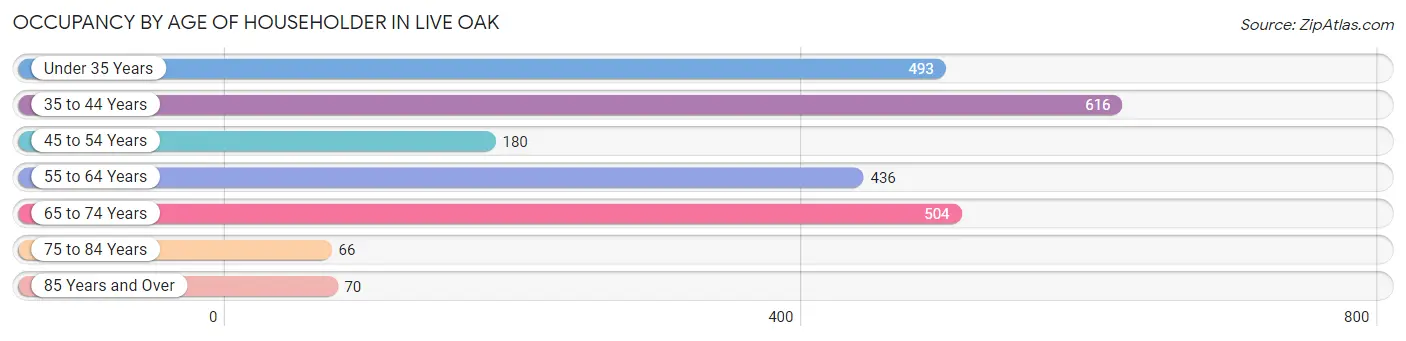
| Age Bracket | # Households | % Households |
| Under 35 Years | 493 | 20.8% |
| 35 to 44 Years | 616 | 26.1% |
| 45 to 54 Years | 180 | 7.6% |
| 55 to 64 Years | 436 | 18.4% |
| 65 to 74 Years | 504 | 21.3% |
| 75 to 84 Years | 66 | 2.8% |
| 85 Years and Over | 70 | 3.0% |
| Total | 2,365 | 100.0% |
Housing Finances in Live Oak
Median Income by Occupancy in Live Oak
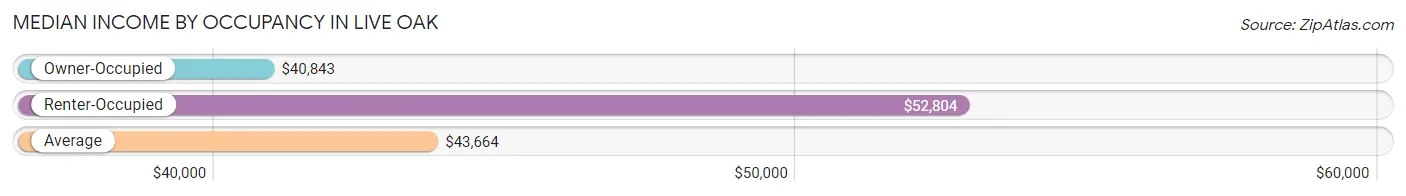
| Occupancy Type | # Households | Median Income |
| Owner-Occupied | 1,177 (49.8%) | $40,843 |
| Renter-Occupied | 1,188 (50.2%) | $52,804 |
| Average | 2,365 (100.0%) | $43,664 |
Occupancy by Householder Income Bracket in Live Oak
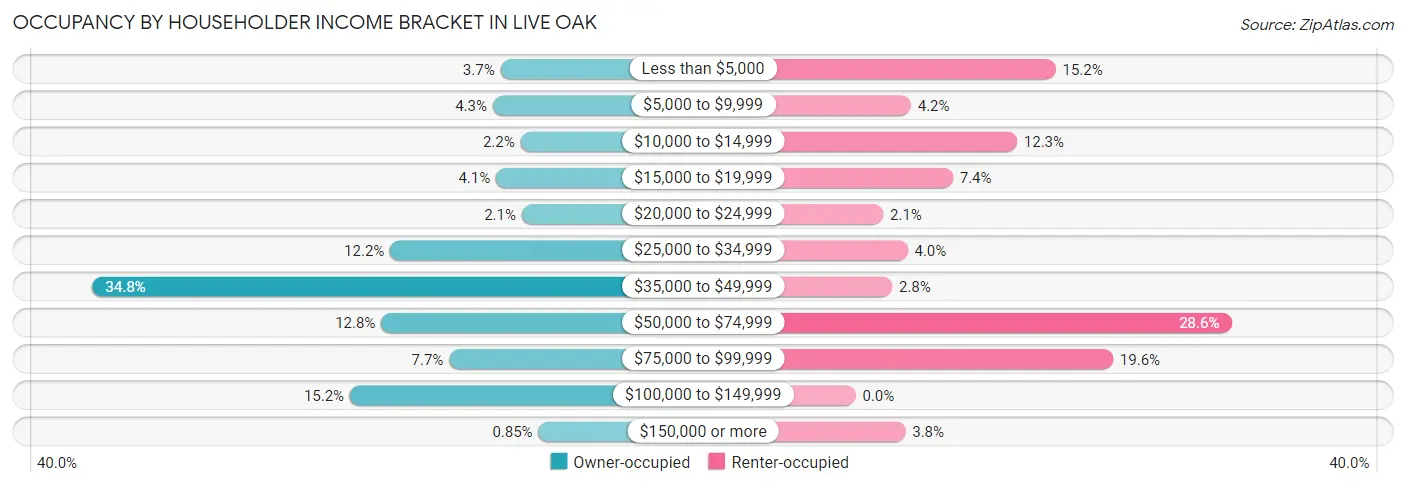
| Income Bracket | Owner-occupied | Renter-occupied |
| Less than $5,000 | 44 (3.7%) | 181 (15.2%) |
| $5,000 to $9,999 | 51 (4.3%) | 50 (4.2%) |
| $10,000 to $14,999 | 26 (2.2%) | 146 (12.3%) |
| $15,000 to $19,999 | 48 (4.1%) | 88 (7.4%) |
| $20,000 to $24,999 | 25 (2.1%) | 25 (2.1%) |
| $25,000 to $34,999 | 143 (12.1%) | 47 (4.0%) |
| $35,000 to $49,999 | 410 (34.8%) | 33 (2.8%) |
| $50,000 to $74,999 | 151 (12.8%) | 340 (28.6%) |
| $75,000 to $99,999 | 90 (7.6%) | 233 (19.6%) |
| $100,000 to $149,999 | 179 (15.2%) | 0 (0.0%) |
| $150,000 or more | 10 (0.9%) | 45 (3.8%) |
| Total | 1,177 (100.0%) | 1,188 (100.0%) |
Monthly Housing Cost Tiers in Live Oak
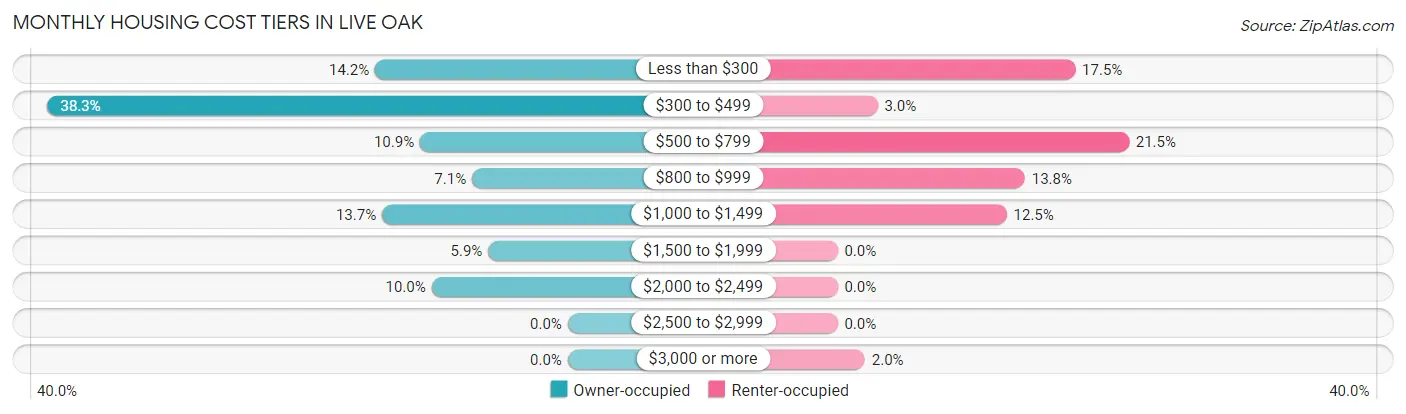
| Monthly Cost | Owner-occupied | Renter-occupied |
| Less than $300 | 167 (14.2%) | 208 (17.5%) |
| $300 to $499 | 451 (38.3%) | 35 (2.9%) |
| $500 to $799 | 128 (10.9%) | 255 (21.5%) |
| $800 to $999 | 83 (7.0%) | 164 (13.8%) |
| $1,000 to $1,499 | 161 (13.7%) | 148 (12.5%) |
| $1,500 to $1,999 | 69 (5.9%) | 0 (0.0%) |
| $2,000 to $2,499 | 118 (10.0%) | 0 (0.0%) |
| $2,500 to $2,999 | 0 (0.0%) | 0 (0.0%) |
| $3,000 or more | 0 (0.0%) | 24 (2.0%) |
| Total | 1,177 (100.0%) | 1,188 (100.0%) |
Physical Housing Characteristics in Live Oak
Housing Structures in Live Oak
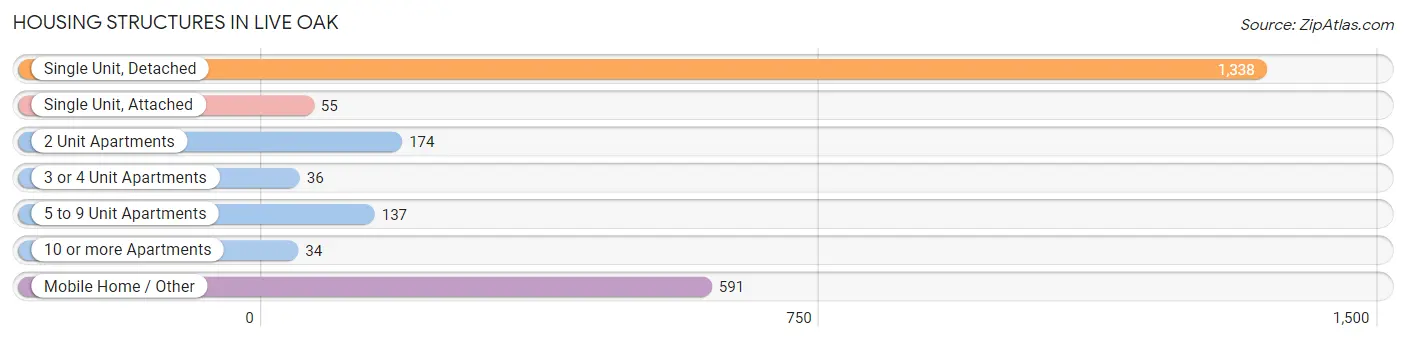
| Structure Type | # Housing Units | % Housing Units |
| Single Unit, Detached | 1,338 | 56.6% |
| Single Unit, Attached | 55 | 2.3% |
| 2 Unit Apartments | 174 | 7.4% |
| 3 or 4 Unit Apartments | 36 | 1.5% |
| 5 to 9 Unit Apartments | 137 | 5.8% |
| 10 or more Apartments | 34 | 1.4% |
| Mobile Home / Other | 591 | 25.0% |
| Total | 2,365 | 100.0% |
Housing Structures by Occupancy in Live Oak
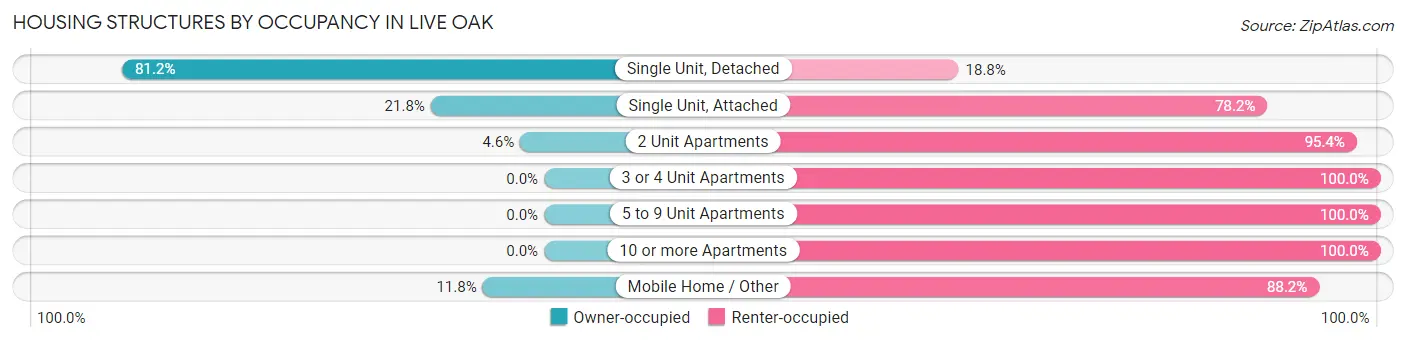
| Structure Type | Owner-occupied | Renter-occupied |
| Single Unit, Detached | 1,087 (81.2%) | 251 (18.8%) |
| Single Unit, Attached | 12 (21.8%) | 43 (78.2%) |
| 2 Unit Apartments | 8 (4.6%) | 166 (95.4%) |
| 3 or 4 Unit Apartments | 0 (0.0%) | 36 (100.0%) |
| 5 to 9 Unit Apartments | 0 (0.0%) | 137 (100.0%) |
| 10 or more Apartments | 0 (0.0%) | 34 (100.0%) |
| Mobile Home / Other | 70 (11.8%) | 521 (88.2%) |
| Total | 1,177 (49.8%) | 1,188 (50.2%) |
Housing Structures by Number of Rooms in Live Oak
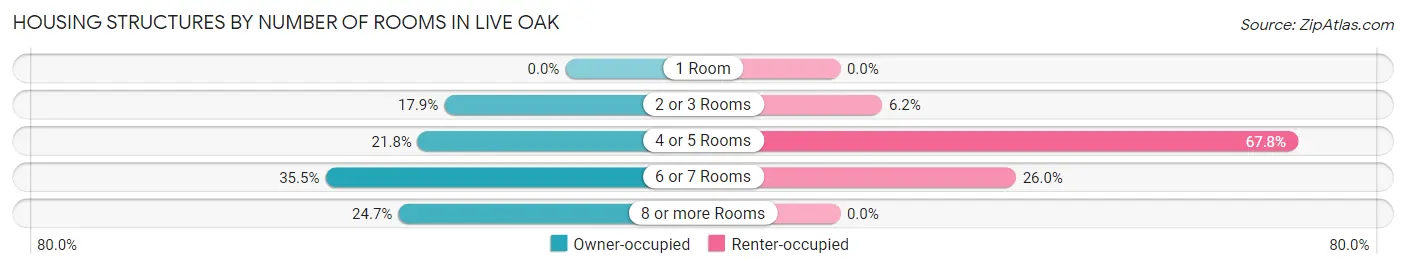
| Number of Rooms | Owner-occupied | Renter-occupied |
| 1 Room | 0 (0.0%) | 0 (0.0%) |
| 2 or 3 Rooms | 211 (17.9%) | 74 (6.2%) |
| 4 or 5 Rooms | 257 (21.8%) | 805 (67.8%) |
| 6 or 7 Rooms | 418 (35.5%) | 309 (26.0%) |
| 8 or more Rooms | 291 (24.7%) | 0 (0.0%) |
| Total | 1,177 (100.0%) | 1,188 (100.0%) |
Housing Structure by Heating Type in Live Oak
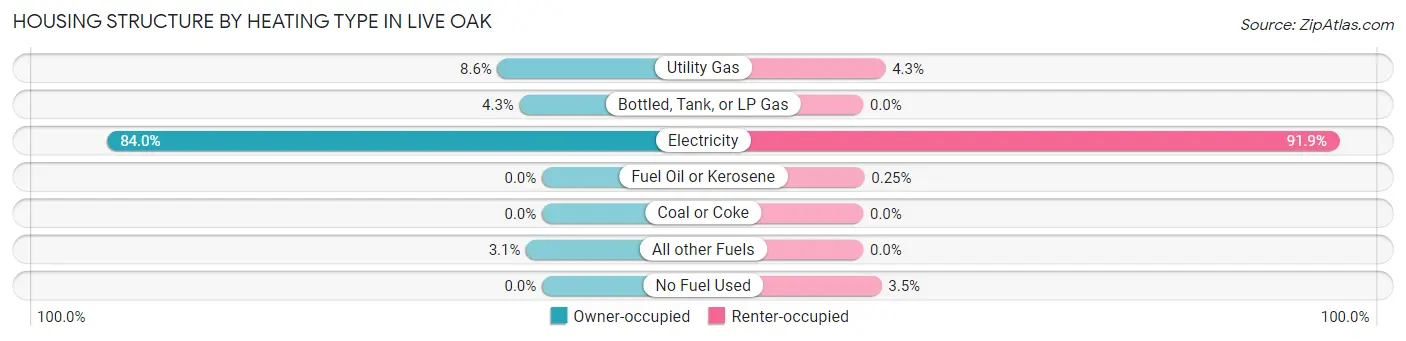
| Heating Type | Owner-occupied | Renter-occupied |
| Utility Gas | 101 (8.6%) | 51 (4.3%) |
| Bottled, Tank, or LP Gas | 51 (4.3%) | 0 (0.0%) |
| Electricity | 989 (84.0%) | 1,092 (91.9%) |
| Fuel Oil or Kerosene | 0 (0.0%) | 3 (0.3%) |
| Coal or Coke | 0 (0.0%) | 0 (0.0%) |
| All other Fuels | 36 (3.1%) | 0 (0.0%) |
| No Fuel Used | 0 (0.0%) | 42 (3.5%) |
| Total | 1,177 (100.0%) | 1,188 (100.0%) |
Household Vehicle Usage in Live Oak
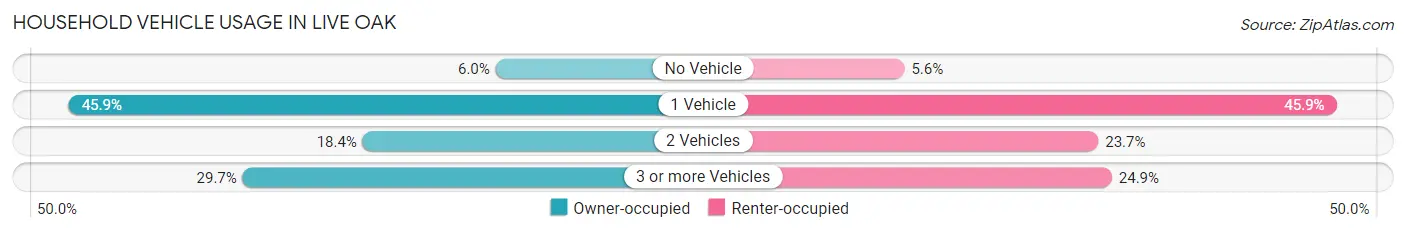
| Vehicles per Household | Owner-occupied | Renter-occupied |
| No Vehicle | 71 (6.0%) | 66 (5.6%) |
| 1 Vehicle | 540 (45.9%) | 545 (45.9%) |
| 2 Vehicles | 217 (18.4%) | 281 (23.6%) |
| 3 or more Vehicles | 349 (29.6%) | 296 (24.9%) |
| Total | 1,177 (100.0%) | 1,188 (100.0%) |
Real Estate & Mortgages in Live Oak
Real Estate and Mortgage Overview in Live Oak
| Characteristic | Without Mortgage | With Mortgage |
| Housing Units | 697 | 480 |
| Median Property Value | $105,600 | $183,000 |
| Median Household Income | $38,550 | $0 |
| Monthly Housing Costs | $404 | $0 |
| Real Estate Taxes | $1,121 | $58 |
Property Value by Mortgage Status in Live Oak
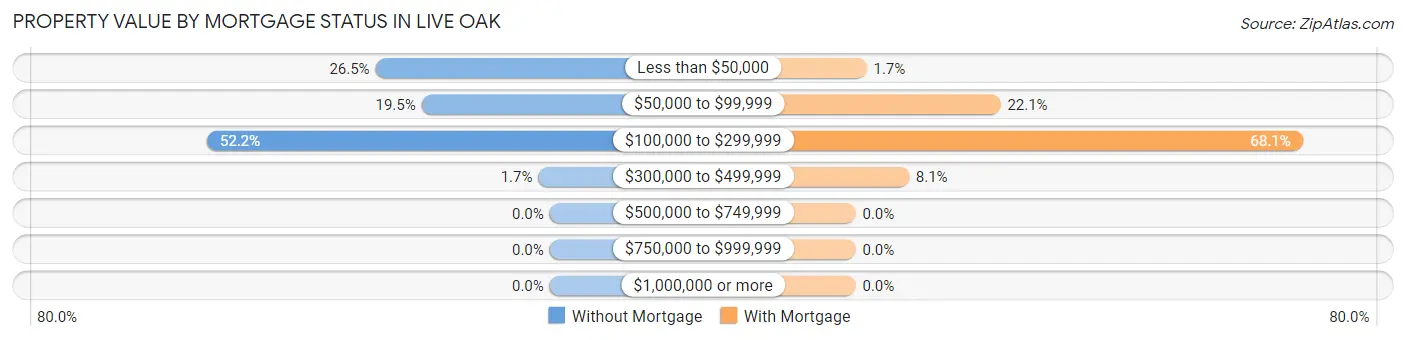
| Property Value | Without Mortgage | With Mortgage |
| Less than $50,000 | 185 (26.5%) | 8 (1.7%) |
| $50,000 to $99,999 | 136 (19.5%) | 106 (22.1%) |
| $100,000 to $299,999 | 364 (52.2%) | 327 (68.1%) |
| $300,000 to $499,999 | 12 (1.7%) | 39 (8.1%) |
| $500,000 to $749,999 | 0 (0.0%) | 0 (0.0%) |
| $750,000 to $999,999 | 0 (0.0%) | 0 (0.0%) |
| $1,000,000 or more | 0 (0.0%) | 0 (0.0%) |
| Total | 697 (100.0%) | 480 (100.0%) |
Household Income by Mortgage Status in Live Oak
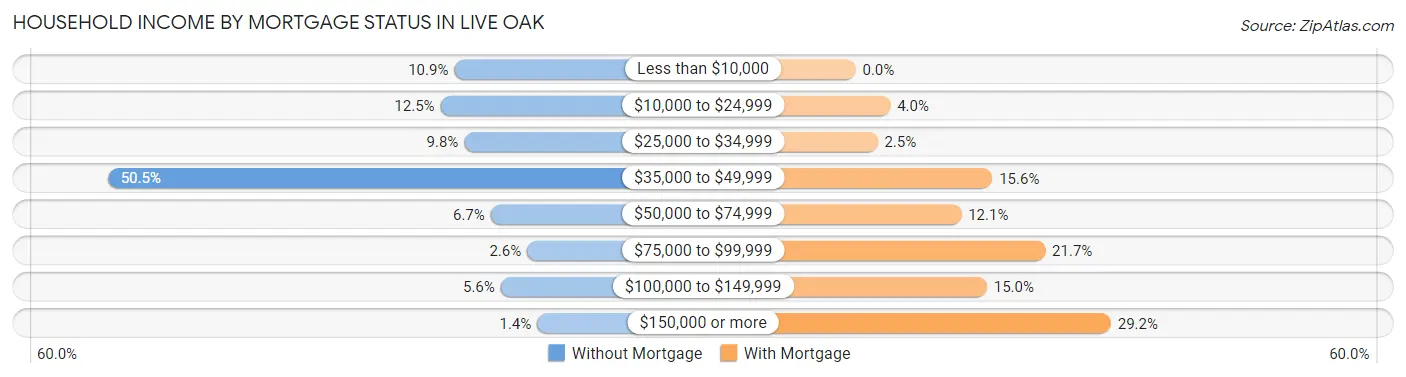
| Household Income | Without Mortgage | With Mortgage |
| Less than $10,000 | 76 (10.9%) | 0 (0.0%) |
| $10,000 to $24,999 | 87 (12.5%) | 19 (4.0%) |
| $25,000 to $34,999 | 68 (9.8%) | 12 (2.5%) |
| $35,000 to $49,999 | 352 (50.5%) | 75 (15.6%) |
| $50,000 to $74,999 | 47 (6.7%) | 58 (12.1%) |
| $75,000 to $99,999 | 18 (2.6%) | 104 (21.7%) |
| $100,000 to $149,999 | 39 (5.6%) | 72 (15.0%) |
| $150,000 or more | 10 (1.4%) | 140 (29.2%) |
| Total | 697 (100.0%) | 480 (100.0%) |
Property Value to Household Income Ratio in Live Oak
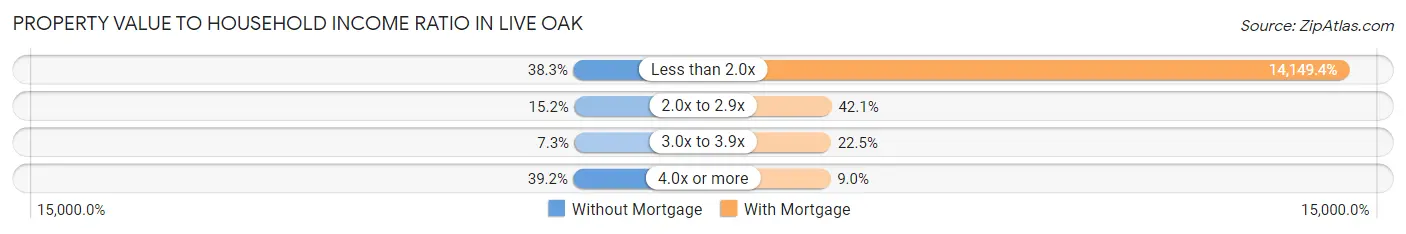
| Value-to-Income Ratio | Without Mortgage | With Mortgage |
| Less than 2.0x | 267 (38.3%) | 67,917 (14,149.4%) |
| 2.0x to 2.9x | 106 (15.2%) | 202 (42.1%) |
| 3.0x to 3.9x | 51 (7.3%) | 108 (22.5%) |
| 4.0x or more | 273 (39.2%) | 43 (9.0%) |
| Total | 697 (100.0%) | 480 (100.0%) |
Real Estate Taxes by Mortgage Status in Live Oak
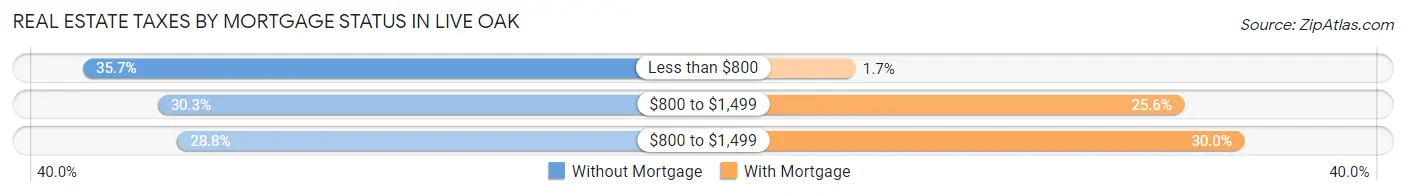
| Property Taxes | Without Mortgage | With Mortgage |
| Less than $800 | 249 (35.7%) | 8 (1.7%) |
| $800 to $1,499 | 211 (30.3%) | 123 (25.6%) |
| $800 to $1,499 | 201 (28.8%) | 144 (30.0%) |
| Total | 697 (100.0%) | 480 (100.0%) |
Health & Disability in Live Oak
Health Insurance Coverage by Age in Live Oak
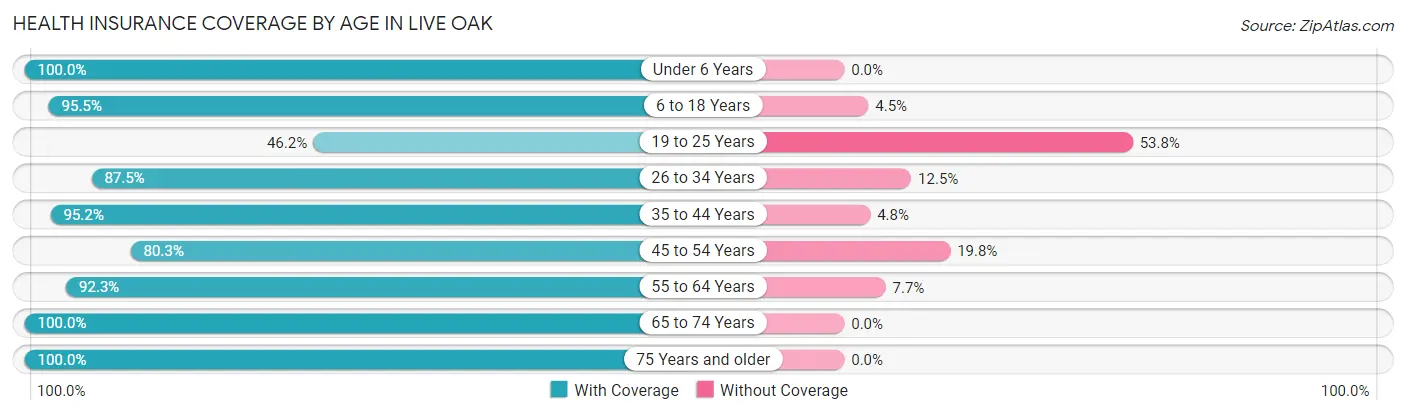
| Age Bracket | With Coverage | Without Coverage |
| Under 6 Years | 576 (100.0%) | 0 (0.0%) |
| 6 to 18 Years | 1,131 (95.5%) | 53 (4.5%) |
| 19 to 25 Years | 257 (46.2%) | 299 (53.8%) |
| 26 to 34 Years | 337 (87.5%) | 48 (12.5%) |
| 35 to 44 Years | 1,478 (95.2%) | 75 (4.8%) |
| 45 to 54 Years | 252 (80.2%) | 62 (19.8%) |
| 55 to 64 Years | 742 (92.3%) | 62 (7.7%) |
| 65 to 74 Years | 706 (100.0%) | 0 (0.0%) |
| 75 Years and older | 262 (100.0%) | 0 (0.0%) |
| Total | 5,741 (90.5%) | 599 (9.5%) |
Health Insurance Coverage by Citizenship Status in Live Oak
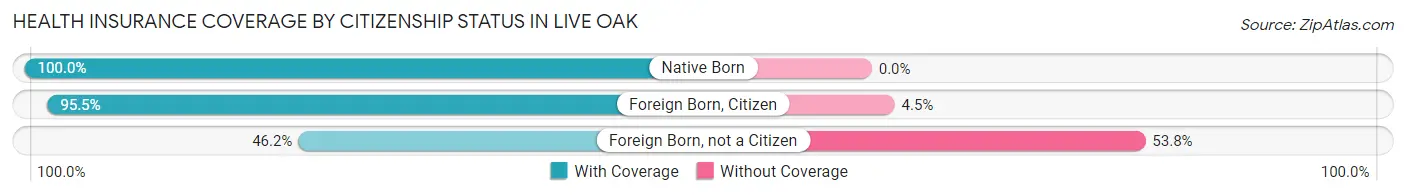
| Citizenship Status | With Coverage | Without Coverage |
| Native Born | 576 (100.0%) | 0 (0.0%) |
| Foreign Born, Citizen | 1,131 (95.5%) | 53 (4.5%) |
| Foreign Born, not a Citizen | 257 (46.2%) | 299 (53.8%) |
Health Insurance Coverage by Household Income in Live Oak
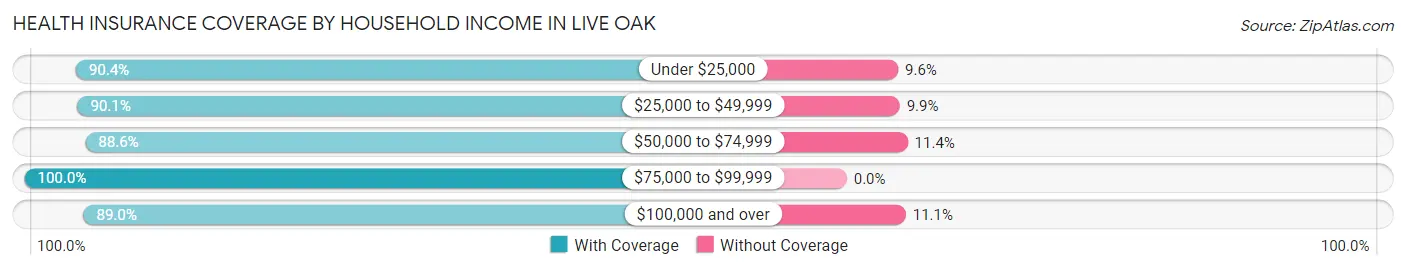
| Household Income | With Coverage | Without Coverage |
| Under $25,000 | 1,165 (90.4%) | 124 (9.6%) |
| $25,000 to $49,999 | 1,117 (90.1%) | 123 (9.9%) |
| $50,000 to $74,999 | 1,710 (88.6%) | 220 (11.4%) |
| $75,000 to $99,999 | 688 (100.0%) | 0 (0.0%) |
| $100,000 and over | 1,038 (88.9%) | 129 (11.1%) |
Public vs Private Health Insurance Coverage by Age in Live Oak
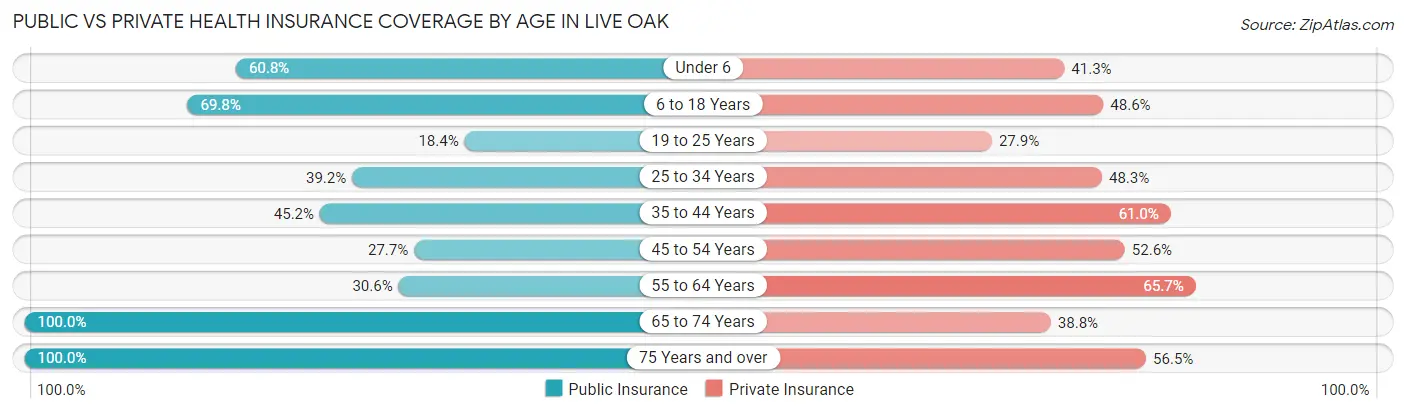
| Age Bracket | Public Insurance | Private Insurance |
| Under 6 | 350 (60.8%) | 238 (41.3%) |
| 6 to 18 Years | 826 (69.8%) | 575 (48.6%) |
| 19 to 25 Years | 102 (18.3%) | 155 (27.9%) |
| 25 to 34 Years | 151 (39.2%) | 186 (48.3%) |
| 35 to 44 Years | 702 (45.2%) | 948 (61.0%) |
| 45 to 54 Years | 87 (27.7%) | 165 (52.5%) |
| 55 to 64 Years | 246 (30.6%) | 528 (65.7%) |
| 65 to 74 Years | 706 (100.0%) | 274 (38.8%) |
| 75 Years and over | 262 (100.0%) | 148 (56.5%) |
| Total | 3,432 (54.1%) | 3,217 (50.7%) |
Disability Status by Sex by Age in Live Oak
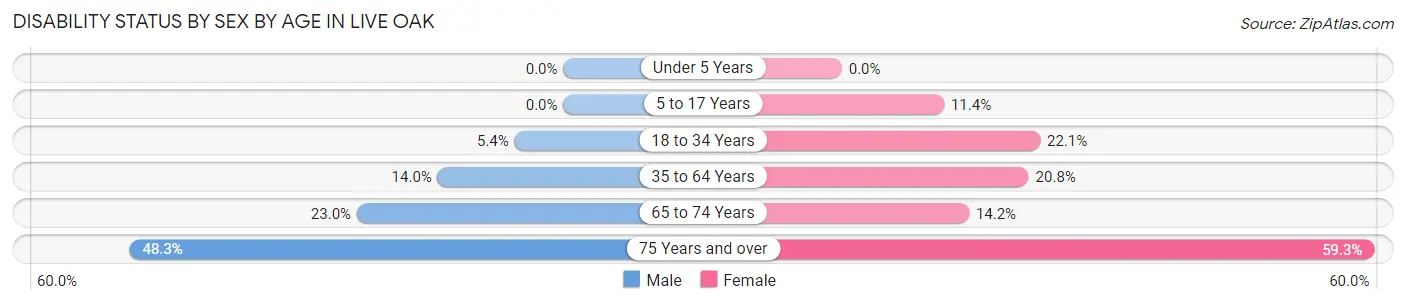
| Age Bracket | Male | Female |
| Under 5 Years | 0 (0.0%) | 0 (0.0%) |
| 5 to 17 Years | 0 (0.0%) | 76 (11.4%) |
| 18 to 34 Years | 27 (5.4%) | 125 (22.1%) |
| 35 to 64 Years | 191 (14.0%) | 272 (20.8%) |
| 65 to 74 Years | 60 (23.0%) | 63 (14.2%) |
| 75 Years and over | 72 (48.3%) | 67 (59.3%) |
Disability Class by Sex by Age in Live Oak
Disability Class: Hearing Difficulty
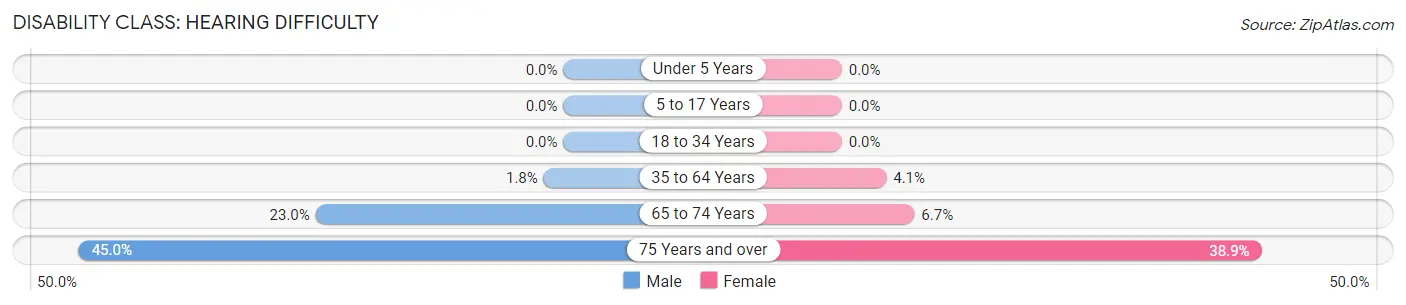
| Age Bracket | Male | Female |
| Under 5 Years | 0 (0.0%) | 0 (0.0%) |
| 5 to 17 Years | 0 (0.0%) | 0 (0.0%) |
| 18 to 34 Years | 0 (0.0%) | 0 (0.0%) |
| 35 to 64 Years | 25 (1.8%) | 54 (4.1%) |
| 65 to 74 Years | 60 (23.0%) | 30 (6.7%) |
| 75 Years and over | 67 (45.0%) | 44 (38.9%) |
Disability Class: Vision Difficulty
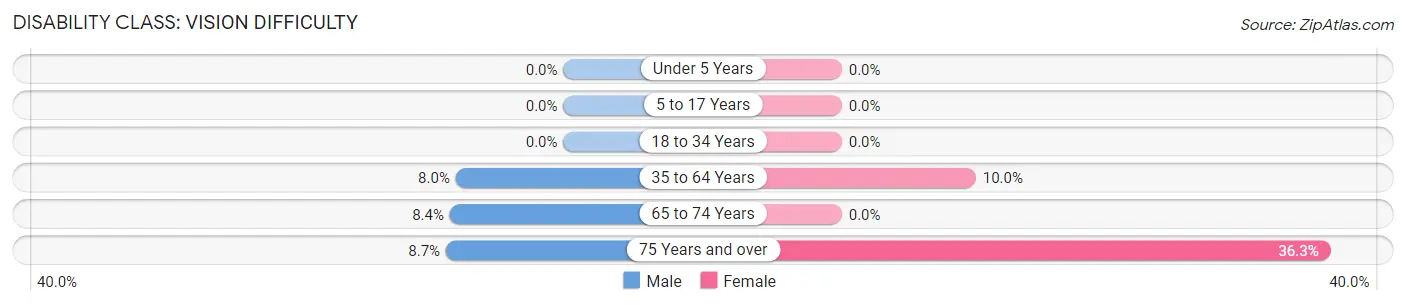
| Age Bracket | Male | Female |
| Under 5 Years | 0 (0.0%) | 0 (0.0%) |
| 5 to 17 Years | 0 (0.0%) | 0 (0.0%) |
| 18 to 34 Years | 0 (0.0%) | 0 (0.0%) |
| 35 to 64 Years | 109 (8.0%) | 130 (10.0%) |
| 65 to 74 Years | 22 (8.4%) | 0 (0.0%) |
| 75 Years and over | 13 (8.7%) | 41 (36.3%) |
Disability Class: Cognitive Difficulty
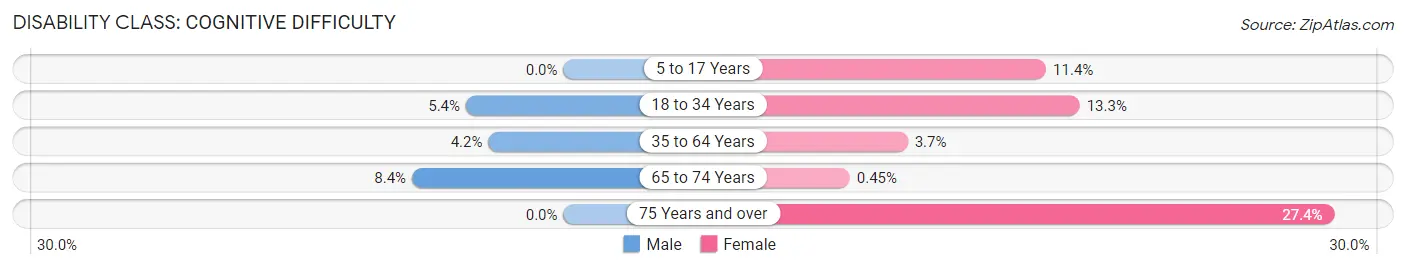
| Age Bracket | Male | Female |
| 5 to 17 Years | 0 (0.0%) | 76 (11.4%) |
| 18 to 34 Years | 27 (5.4%) | 75 (13.3%) |
| 35 to 64 Years | 57 (4.2%) | 48 (3.7%) |
| 65 to 74 Years | 22 (8.4%) | 2 (0.4%) |
| 75 Years and over | 0 (0.0%) | 31 (27.4%) |
Disability Class: Ambulatory Difficulty
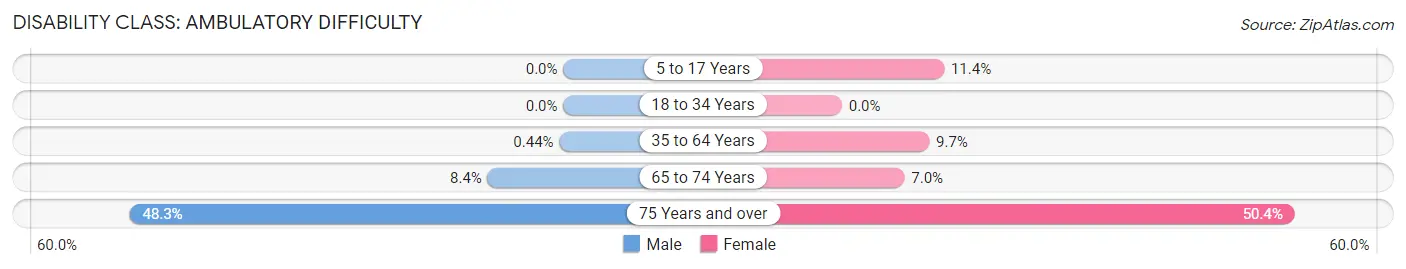
| Age Bracket | Male | Female |
| 5 to 17 Years | 0 (0.0%) | 76 (11.4%) |
| 18 to 34 Years | 0 (0.0%) | 0 (0.0%) |
| 35 to 64 Years | 6 (0.4%) | 127 (9.7%) |
| 65 to 74 Years | 22 (8.4%) | 31 (7.0%) |
| 75 Years and over | 72 (48.3%) | 57 (50.4%) |
Disability Class: Self-Care Difficulty
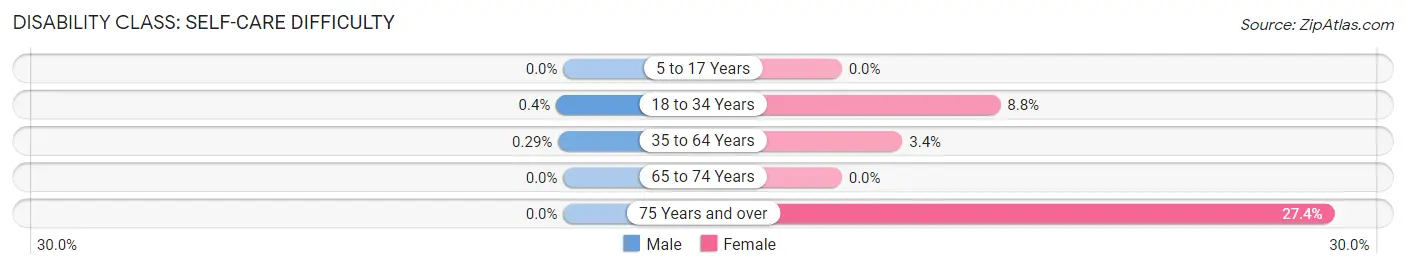
| Age Bracket | Male | Female |
| 5 to 17 Years | 0 (0.0%) | 0 (0.0%) |
| 18 to 34 Years | 2 (0.4%) | 50 (8.8%) |
| 35 to 64 Years | 4 (0.3%) | 44 (3.4%) |
| 65 to 74 Years | 0 (0.0%) | 0 (0.0%) |
| 75 Years and over | 0 (0.0%) | 31 (27.4%) |
Technology Access in Live Oak
Computing Device Access in Live Oak
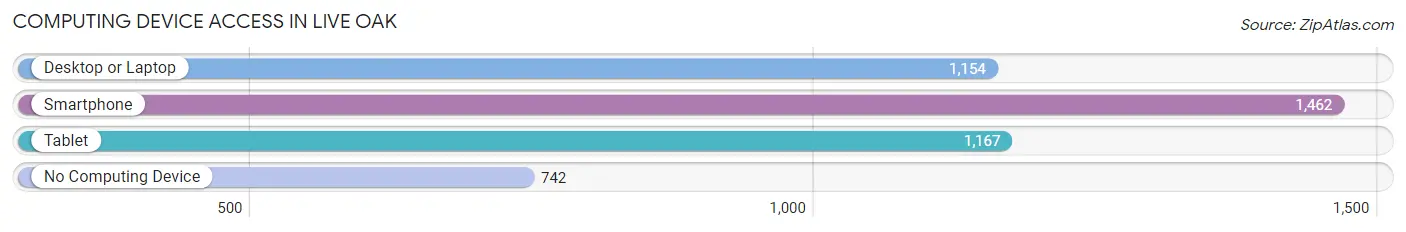
| Device Type | # Households | % Households |
| Desktop or Laptop | 1,154 | 48.8% |
| Smartphone | 1,462 | 61.8% |
| Tablet | 1,167 | 49.3% |
| No Computing Device | 742 | 31.4% |
| Total | 2,365 | 100.0% |
Internet Access in Live Oak
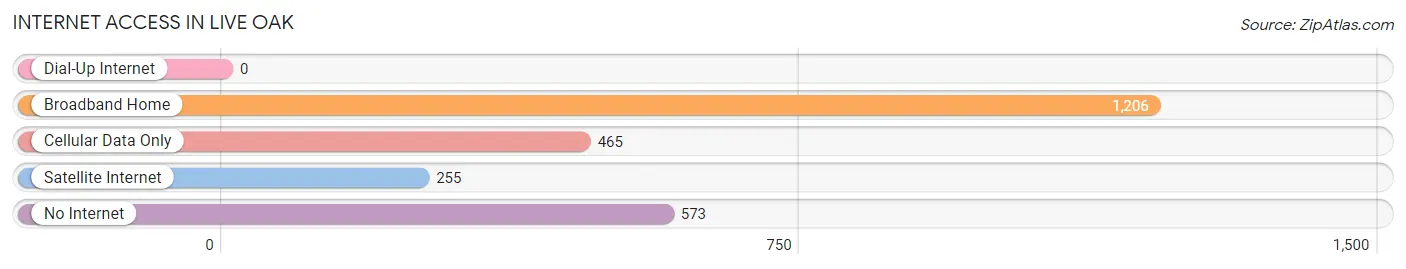
| Internet Type | # Households | % Households |
| Dial-Up Internet | 0 | 0.0% |
| Broadband Home | 1,206 | 51.0% |
| Cellular Data Only | 465 | 19.7% |
| Satellite Internet | 255 | 10.8% |
| No Internet | 573 | 24.2% |
| Total | 2,365 | 100.0% |
Live Oak Summary
History
The city of Live Oak, Florida is located in Suwannee County, in the northern part of the state. It is situated on the banks of the Suwannee River, and is the county seat of Suwannee County. The city was founded in 1884 by the Live Oak Land Company, and was named after the nearby Live Oak trees. The city was incorporated in 1885, and has since grown to become a thriving community.
Live Oak has a rich history that dates back to the early 1800s. The area was originally inhabited by the Seminole and Creek Indians, who used the area for hunting and fishing. In 1821, the United States acquired the area from Spain, and the area was opened up to settlement. The first settlers in the area were the families of William and John McAlpin, who arrived in 1836. The McAlpin family established a trading post and a ferry service across the Suwannee River.
In 1884, the Live Oak Land Company was formed, and the city of Live Oak was established. The city was named after the nearby Live Oak trees, and the city was incorporated in 1885. The city quickly grew, and by the early 1900s, it had become a thriving community. The city was home to several businesses, including a sawmill, a cotton gin, and a turpentine still.
In the early 1900s, the city was also home to several educational institutions, including the Live Oak Academy, the Live Oak Institute, and the Live Oak Normal and Industrial Institute. These schools provided educational opportunities for African Americans in the area.
In the 1950s, the city experienced a period of growth and development. The city was home to several industries, including a paper mill, a lumber mill, and a fertilizer plant. The city also became a popular tourist destination, and several hotels and motels were built in the area.
Geography
Live Oak is located in Suwannee County, in the northern part of the state of Florida. It is situated on the banks of the Suwannee River, and is the county seat of Suwannee County. The city is located at the intersection of Interstate 10 and US Highway 129. The city is located approximately 60 miles west of Jacksonville, and approximately 70 miles east of Tallahassee.
The city has a total area of 8.2 square miles, of which 8.1 square miles is land and 0.1 square miles is water. The city is located in a humid subtropical climate zone, and has hot, humid summers and mild winters. The average temperature in the summer is around 90 degrees Fahrenheit, and the average temperature in the winter is around 60 degrees Fahrenheit.
Economy
Live Oak has a diverse economy that is driven by several industries. The city is home to several manufacturing companies, including a paper mill, a lumber mill, and a fertilizer plant. The city is also home to several retail stores, restaurants, and other businesses.
The city is also home to several educational institutions, including the Live Oak Academy, the Live Oak Institute, and the Live Oak Normal and Industrial Institute. These schools provide educational opportunities for students in the area.
The city is also home to several healthcare facilities, including a hospital, a nursing home, and several medical clinics. The city is also home to several parks and recreational facilities, including a golf course, a swimming pool, and several parks.
Demographics
As of the 2010 census, the city of Live Oak had a population of 6,974. The population was spread out, with 24.3% under the age of 18, 8.3% from 18 to 24, 25.2% from 25 to 44, 24.3% from 45 to 64, and 17.9% who were 65 years of age or older. The median age was 38.7 years.
The racial makeup of the city was 73.2% White, 21.2% African American, 0.3% Native American, 0.7% Asian, 0.1% Pacific Islander, 2.7% from other races, and 1.8% from two or more races. Hispanic or Latino of any race were 5.2% of the population.
The median income for a household in the city was $30,938, and the median income for a family was $37,917. The per capita income for the city was $17,845. About 17.2% of families and 20.3% of the population were below the poverty line, including 28.2% of those under age 18 and 14.2% of those age 65 or over.
Common Questions
What is Per Capita Income in Live Oak?
Per Capita income in Live Oak is $22,136.
What is the Median Family Income in Live Oak?
Median Family Income in Live Oak is $49,942.
What is the Median Household income in Live Oak?
Median Household Income in Live Oak is $43,664.
What is Income or Wage Gap in Live Oak?
Income or Wage Gap in Live Oak is 26.9%.
Women in Live Oak earn 73.1 cents for every dollar earned by a man.
What is Inequality or Gini Index in Live Oak?
Inequality or Gini Index in Live Oak is 0.45.
What is the Total Population of Live Oak?
Total Population of Live Oak is 6,811.
What is the Total Male Population of Live Oak?
Total Male Population of Live Oak is 3,360.
What is the Total Female Population of Live Oak?
Total Female Population of Live Oak is 3,451.
What is the Ratio of Males per 100 Females in Live Oak?
There are 97.36 Males per 100 Females in Live Oak.
What is the Ratio of Females per 100 Males in Live Oak?
There are 102.71 Females per 100 Males in Live Oak.
What is the Median Population Age in Live Oak?
Median Population Age in Live Oak is 37.5 Years.
What is the Average Family Size in Live Oak
Average Family Size in Live Oak is 3.5 People.
What is the Average Household Size in Live Oak
Average Household Size in Live Oak is 2.7 People.
How Large is the Labor Force in Live Oak?
There are 3,330 People in the Labor Forcein in Live Oak.
What is the Percentage of People in the Labor Force in Live Oak?
63.1% of People are in the Labor Force in Live Oak.
What is the Unemployment Rate in Live Oak?
Unemployment Rate in Live Oak is 13.6%.