Mexia, TX Map & Demographics
Mexia Map
Mexia Overview
$17,786
PER CAPITA INCOME
$47,150
AVG FAMILY INCOME
$33,239
AVG HOUSEHOLD INCOME
17.8%
WAGE / INCOME GAP [ % ]
82.2¢/ $1
WAGE / INCOME GAP [ $ ]
0.46
INEQUALITY / GINI INDEX
6,907
TOTAL POPULATION
3,267
MALE POPULATION
3,640
FEMALE POPULATION
89.75
MALES / 100 FEMALES
111.42
FEMALES / 100 MALES
36.8
MEDIAN AGE
3.6
AVG FAMILY SIZE
2.7
AVG HOUSEHOLD SIZE
2,641
LABOR FORCE [ PEOPLE ]
49.0%
PERCENT IN LABOR FORCE
3.8%
UNEMPLOYMENT RATE
Mexia Zip Codes
Mexia Area Codes
Income in Mexia
Income Overview in Mexia
Per Capita Income in Mexia is $17,786, while median incomes of families and households are $47,150 and $33,239 respectively.
| Characteristic | Number | Measure |
| Per Capita Income | 6,907 | $17,786 |
| Median Family Income | 1,457 | $47,150 |
| Mean Family Income | 1,457 | $56,226 |
| Median Household Income | 2,379 | $33,239 |
| Mean Household Income | 2,379 | $47,990 |
| Income Deficit | 1,457 | $0 |
| Wage / Income Gap (%) | 6,907 | 17.82% |
| Wage / Income Gap ($) | 6,907 | 82.18¢ per $1 |
| Gini / Inequality Index | 6,907 | 0.46 |
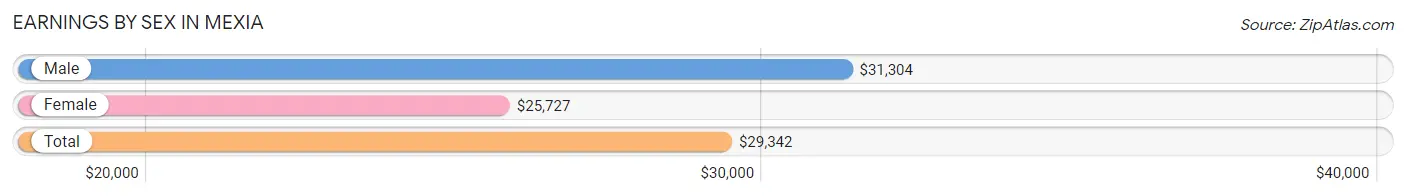
Earnings by Sex in Mexia
Average Earnings in Mexia are $29,342, $31,304 for men and $25,727 for women, a difference of 17.8%.
| Sex | Number | Average Earnings |
| Male | 1,374 (51.7%) | $31,304 |
| Female | 1,284 (48.3%) | $25,727 |
| Total | 2,658 (100.0%) | $29,342 |
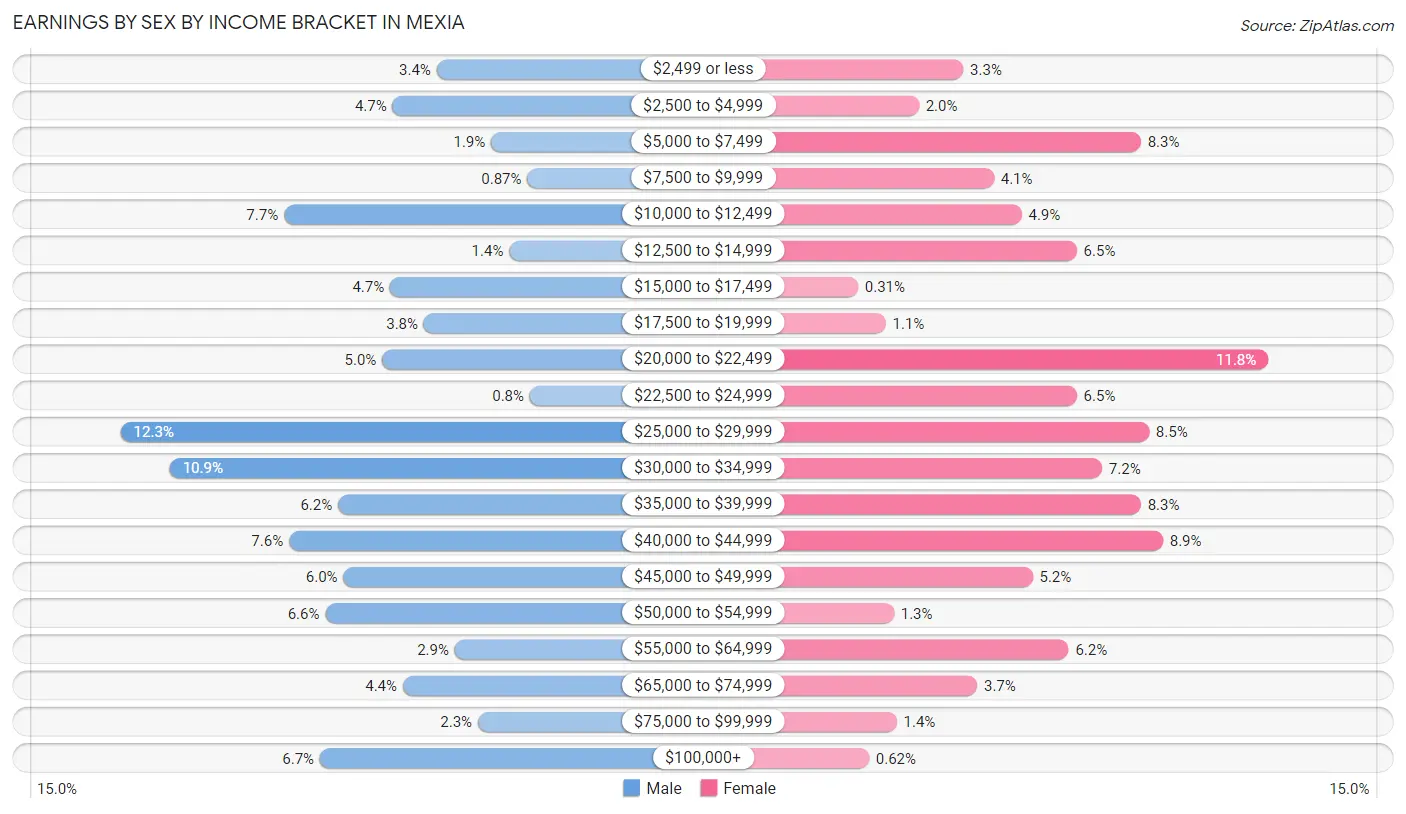
Earnings by Sex by Income Bracket in Mexia
The most common earnings brackets in Mexia are $25,000 to $29,999 for men (169 | 12.3%) and $20,000 to $22,499 for women (152 | 11.8%).
| Income | Male | Female |
| $2,499 or less | 47 (3.4%) | 42 (3.3%) |
| $2,500 to $4,999 | 64 (4.7%) | 26 (2.0%) |
| $5,000 to $7,499 | 26 (1.9%) | 106 (8.3%) |
| $7,500 to $9,999 | 12 (0.9%) | 53 (4.1%) |
| $10,000 to $12,499 | 106 (7.7%) | 63 (4.9%) |
| $12,500 to $14,999 | 19 (1.4%) | 83 (6.5%) |
| $15,000 to $17,499 | 65 (4.7%) | 4 (0.3%) |
| $17,500 to $19,999 | 52 (3.8%) | 14 (1.1%) |
| $20,000 to $22,499 | 68 (5.0%) | 152 (11.8%) |
| $22,500 to $24,999 | 11 (0.8%) | 83 (6.5%) |
| $25,000 to $29,999 | 169 (12.3%) | 109 (8.5%) |
| $30,000 to $34,999 | 150 (10.9%) | 92 (7.2%) |
| $35,000 to $39,999 | 85 (6.2%) | 106 (8.3%) |
| $40,000 to $44,999 | 104 (7.6%) | 114 (8.9%) |
| $45,000 to $49,999 | 83 (6.0%) | 67 (5.2%) |
| $50,000 to $54,999 | 90 (6.6%) | 17 (1.3%) |
| $55,000 to $64,999 | 40 (2.9%) | 80 (6.2%) |
| $65,000 to $74,999 | 60 (4.4%) | 47 (3.7%) |
| $75,000 to $99,999 | 31 (2.3%) | 18 (1.4%) |
| $100,000+ | 92 (6.7%) | 8 (0.6%) |
| Total | 1,374 (100.0%) | 1,284 (100.0%) |
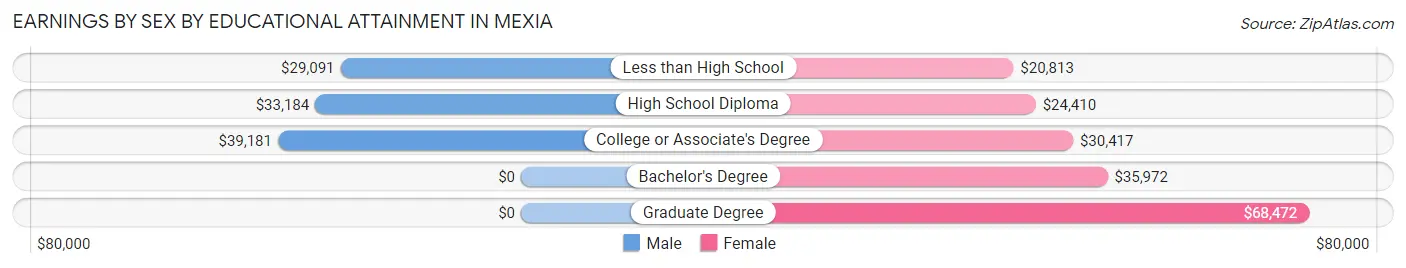
Earnings by Sex by Educational Attainment in Mexia
Average earnings in Mexia are $32,586 for men and $28,356 for women, a difference of 13.0%. Men with an educational attainment of college or associate's degree enjoy the highest average annual earnings of $39,181, while those with less than high school education earn the least with $29,091. Women with an educational attainment of graduate degree earn the most with the average annual earnings of $68,472, while those with less than high school education have the smallest earnings of $20,813.
| Educational Attainment | Male Income | Female Income |
| Less than High School | $29,091 | $20,813 |
| High School Diploma | $33,184 | $24,410 |
| College or Associate's Degree | $39,181 | $30,417 |
| Bachelor's Degree | - | - |
| Graduate Degree | - | - |
| Total | $32,586 | $28,356 |
Family Income in Mexia
Family Income Brackets in Mexia
According to the Mexia family income data, there are 369 families falling into the $50,000 to $74,999 income range, which is the most common income bracket and makes up 25.3% of all families. Conversely, the $200,000+ income bracket is the least frequent group with only 20 families (1.4%) belonging to this category.
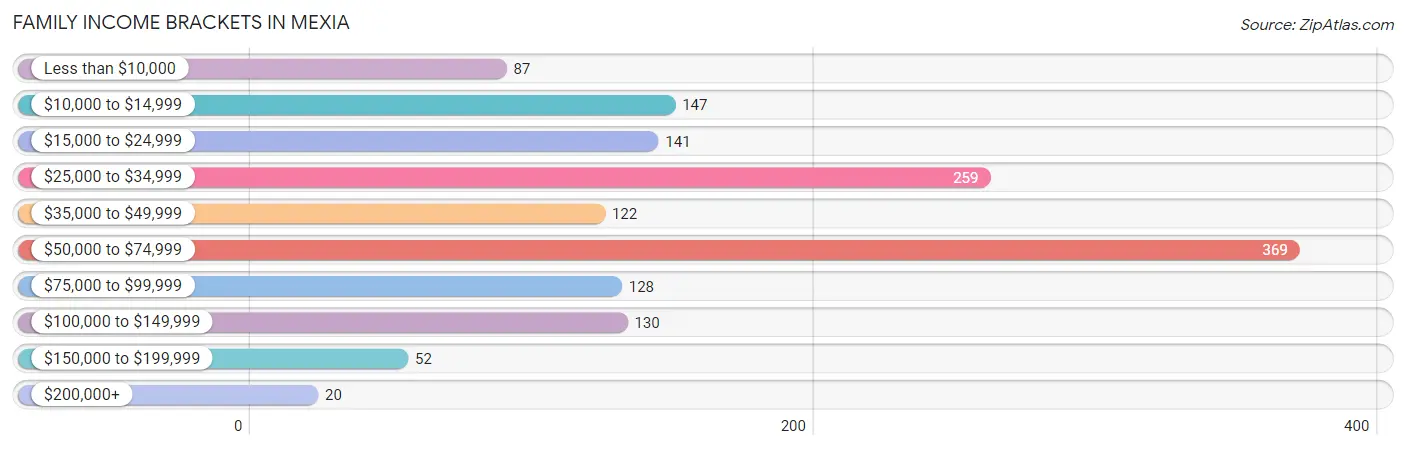
| Income Bracket | # Families | % Families |
| Less than $10,000 | 87 | 6.0% |
| $10,000 to $14,999 | 147 | 10.1% |
| $15,000 to $24,999 | 141 | 9.7% |
| $25,000 to $34,999 | 259 | 17.8% |
| $35,000 to $49,999 | 122 | 8.4% |
| $50,000 to $74,999 | 369 | 25.3% |
| $75,000 to $99,999 | 128 | 8.8% |
| $100,000 to $149,999 | 130 | 8.9% |
| $150,000 to $199,999 | 52 | 3.6% |
| $200,000+ | 20 | 1.4% |
Family Income by Famaliy Size in Mexia
6-person families (55 | 3.8%) account for the highest median family income in Mexia with $67,011 per family, while 2-person families (536 | 36.8%) have the highest median income of $20,416 per family member.
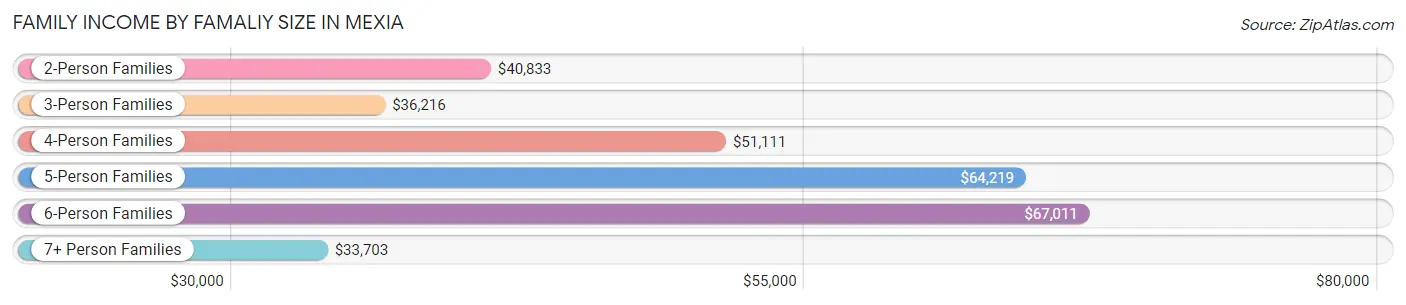
| Income Bracket | # Families | Median Income |
| 2-Person Families | 536 (36.8%) | $40,833 |
| 3-Person Families | 466 (32.0%) | $36,216 |
| 4-Person Families | 134 (9.2%) | $51,111 |
| 5-Person Families | 179 (12.3%) | $64,219 |
| 6-Person Families | 55 (3.8%) | $67,011 |
| 7+ Person Families | 87 (6.0%) | $33,703 |
| Total | 1,457 (100.0%) | $47,150 |
Family Income by Number of Earners in Mexia
The median family income in Mexia is $47,150, with families comprising 3+ earners (152) having the highest median family income of $102,602, while families with no earners (252) have the lowest median family income of $15,667, accounting for 10.4% and 17.3% of families, respectively.
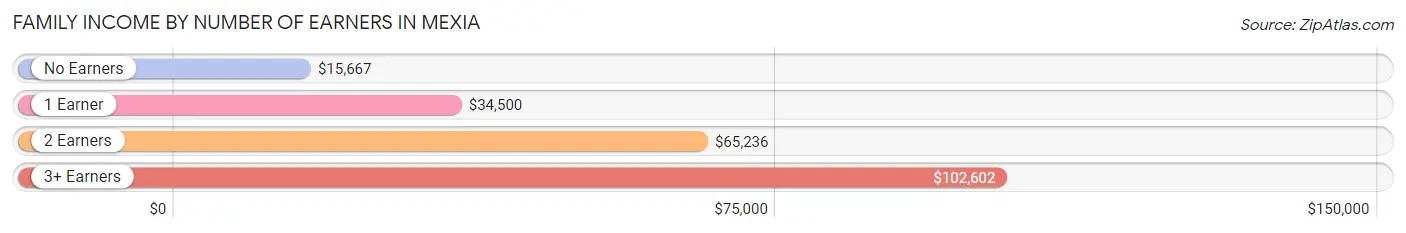
| Number of Earners | # Families | Median Income |
| No Earners | 252 (17.3%) | $15,667 |
| 1 Earner | 710 (48.7%) | $34,500 |
| 2 Earners | 343 (23.5%) | $65,236 |
| 3+ Earners | 152 (10.4%) | $102,602 |
| Total | 1,457 (100.0%) | $47,150 |
Household Income in Mexia
Household Income Brackets in Mexia
With 471 households falling in the category, the $50,000 to $74,999 income range is the most frequent in Mexia, accounting for 19.8% of all households. In contrast, only 19 households (0.8%) fall into the $200,000+ income bracket, making it the least populous group.
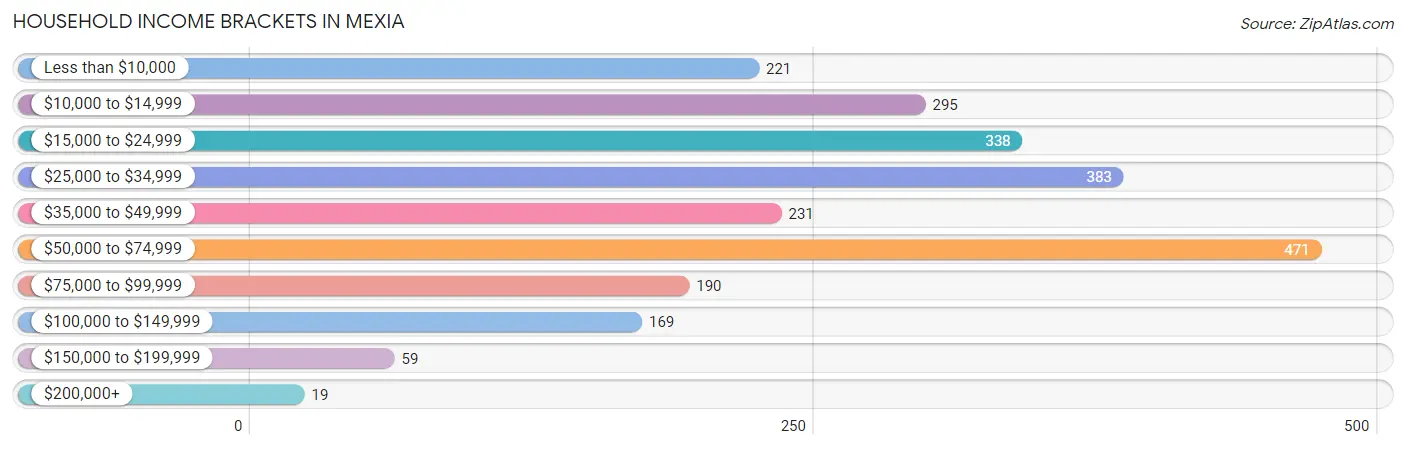
| Income Bracket | # Households | % Households |
| Less than $10,000 | 221 | 9.3% |
| $10,000 to $14,999 | 295 | 12.4% |
| $15,000 to $24,999 | 338 | 14.2% |
| $25,000 to $34,999 | 383 | 16.1% |
| $35,000 to $49,999 | 231 | 9.7% |
| $50,000 to $74,999 | 471 | 19.8% |
| $75,000 to $99,999 | 190 | 8.0% |
| $100,000 to $149,999 | 169 | 7.1% |
| $150,000 to $199,999 | 59 | 2.5% |
| $200,000+ | 19 | 0.8% |
Household Income by Householder Age in Mexia
The median household income in Mexia is $33,239, with the highest median household income of $40,670 found in the 25 to 44 years age bracket for the primary householder. A total of 791 households (33.3%) fall into this category. Meanwhile, the 15 to 24 years age bracket for the primary householder has the lowest median household income of $27,316, with 63 households (2.6%) in this group.
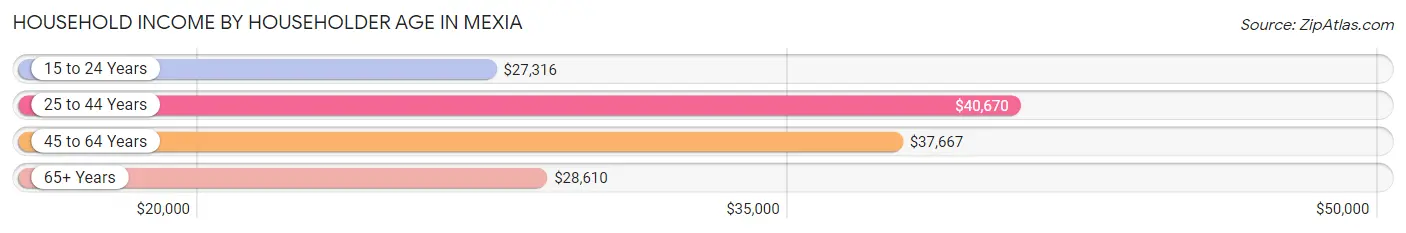
| Income Bracket | # Households | Median Income |
| 15 to 24 Years | 63 (2.6%) | $27,316 |
| 25 to 44 Years | 791 (33.3%) | $40,670 |
| 45 to 64 Years | 896 (37.7%) | $37,667 |
| 65+ Years | 629 (26.4%) | $28,610 |
| Total | 2,379 (100.0%) | $33,239 |
Poverty in Mexia
Income Below Poverty by Sex and Age in Mexia
With 34.6% poverty level for males and 38.4% for females among the residents of Mexia, 6 to 11 year old males and 5 year old females are the most vulnerable to poverty, with 131 males (63.3%) and 57 females (72.2%) in their respective age groups living below the poverty level.
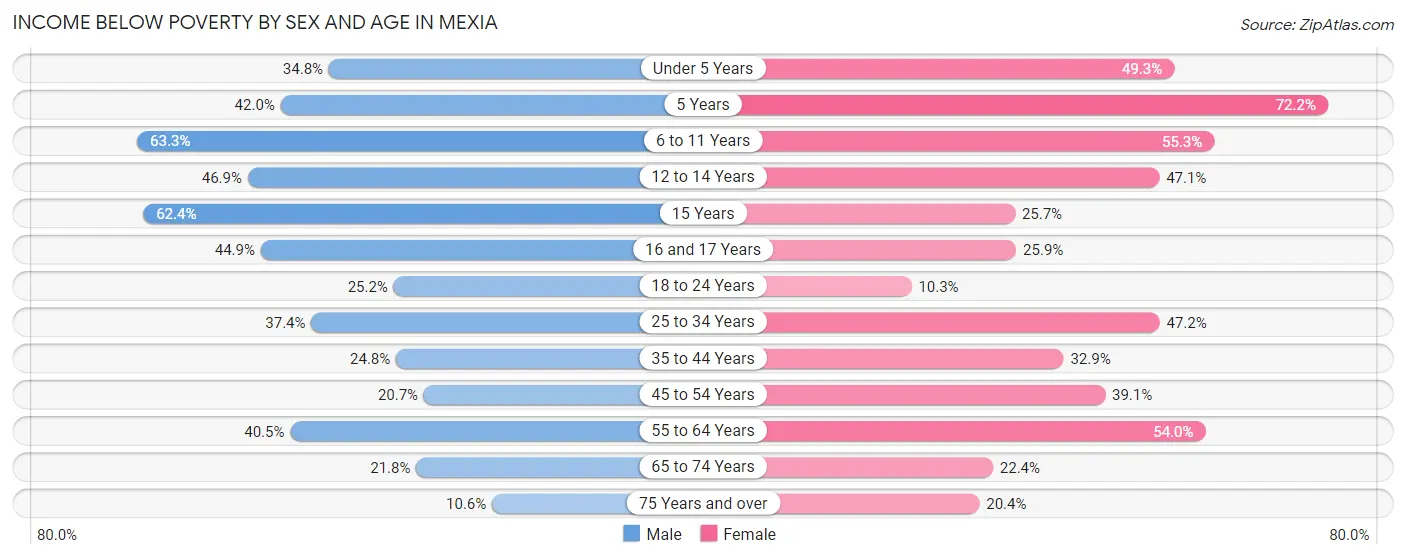
| Age Bracket | Male | Female |
| Under 5 Years | 55 (34.8%) | 150 (49.3%) |
| 5 Years | 34 (42.0%) | 57 (72.2%) |
| 6 to 11 Years | 131 (63.3%) | 152 (55.3%) |
| 12 to 14 Years | 82 (46.9%) | 41 (47.1%) |
| 15 Years | 63 (62.4%) | 9 (25.7%) |
| 16 and 17 Years | 31 (44.9%) | 29 (25.9%) |
| 18 to 24 Years | 66 (25.2%) | 33 (10.3%) |
| 25 to 34 Years | 226 (37.4%) | 167 (47.2%) |
| 35 to 44 Years | 73 (24.8%) | 161 (32.9%) |
| 45 to 54 Years | 77 (20.7%) | 181 (39.1%) |
| 55 to 64 Years | 165 (40.5%) | 244 (54.0%) |
| 65 to 74 Years | 57 (21.8%) | 59 (22.4%) |
| 75 Years and over | 11 (10.6%) | 49 (20.4%) |
| Total | 1,071 (34.6%) | 1,332 (38.4%) |
Income Above Poverty by Sex and Age in Mexia
According to the poverty statistics in Mexia, males aged 75 years and over and females aged 18 to 24 years are the age groups that are most secure financially, with 89.4% of males and 89.7% of females in these age groups living above the poverty line.
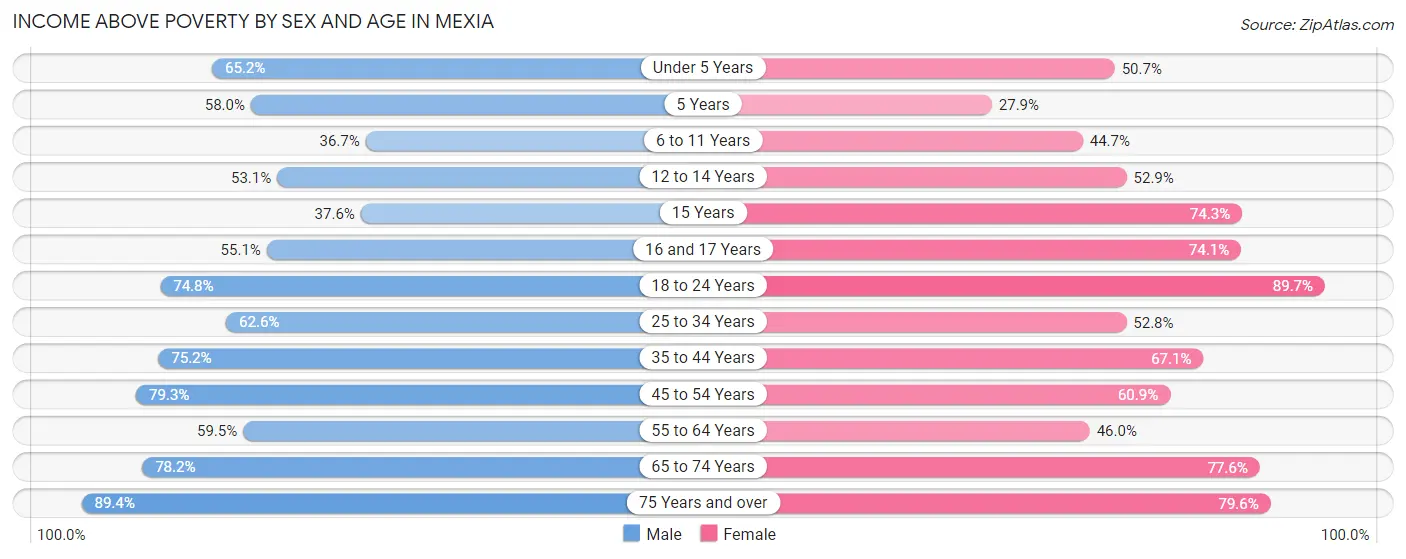
| Age Bracket | Male | Female |
| Under 5 Years | 103 (65.2%) | 154 (50.7%) |
| 5 Years | 47 (58.0%) | 22 (27.9%) |
| 6 to 11 Years | 76 (36.7%) | 123 (44.7%) |
| 12 to 14 Years | 93 (53.1%) | 46 (52.9%) |
| 15 Years | 38 (37.6%) | 26 (74.3%) |
| 16 and 17 Years | 38 (55.1%) | 83 (74.1%) |
| 18 to 24 Years | 196 (74.8%) | 286 (89.7%) |
| 25 to 34 Years | 378 (62.6%) | 187 (52.8%) |
| 35 to 44 Years | 221 (75.2%) | 328 (67.1%) |
| 45 to 54 Years | 295 (79.3%) | 282 (60.9%) |
| 55 to 64 Years | 242 (59.5%) | 208 (46.0%) |
| 65 to 74 Years | 204 (78.2%) | 204 (77.6%) |
| 75 Years and over | 93 (89.4%) | 191 (79.6%) |
| Total | 2,024 (65.4%) | 2,140 (61.6%) |
Income Below Poverty Among Married-Couple Families in Mexia
The poverty statistics for married-couple families in Mexia show that 20.6% or 157 of the total 762 families live below the poverty line. Families with 5 or more children have the highest poverty rate of 100.0%, comprising of 53 families. On the other hand, families with 1 or 2 children have the lowest poverty rate of 10.4%, which includes 13 families.
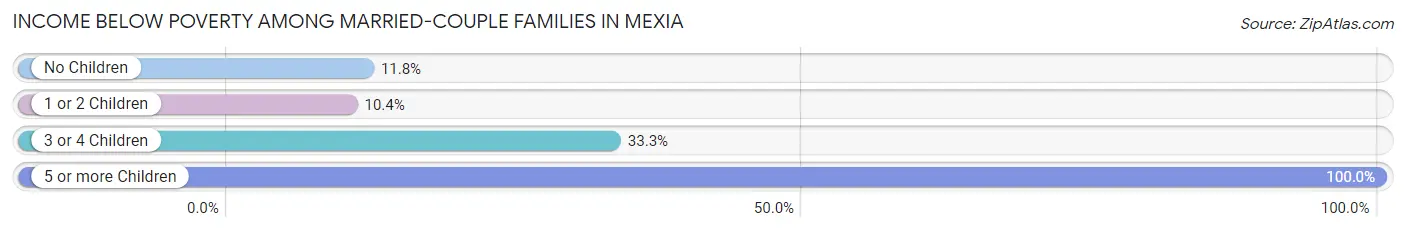
| Children | Above Poverty | Below Poverty |
| No Children | 425 (88.2%) | 57 (11.8%) |
| 1 or 2 Children | 112 (89.6%) | 13 (10.4%) |
| 3 or 4 Children | 68 (66.7%) | 34 (33.3%) |
| 5 or more Children | 0 (0.0%) | 53 (100.0%) |
| Total | 605 (79.4%) | 157 (20.6%) |
Income Below Poverty Among Single-Parent Households in Mexia
According to the poverty data in Mexia, 11.8% or 22 single-father households and 56.0% or 285 single-mother households are living below the poverty line. Among single-father households, those with 1 or 2 children have the highest poverty rate, with 19 households (12.7%) experiencing poverty. Likewise, among single-mother households, those with 3 or 4 children have the highest poverty rate, with 20 households (80.0%) falling below the poverty line.
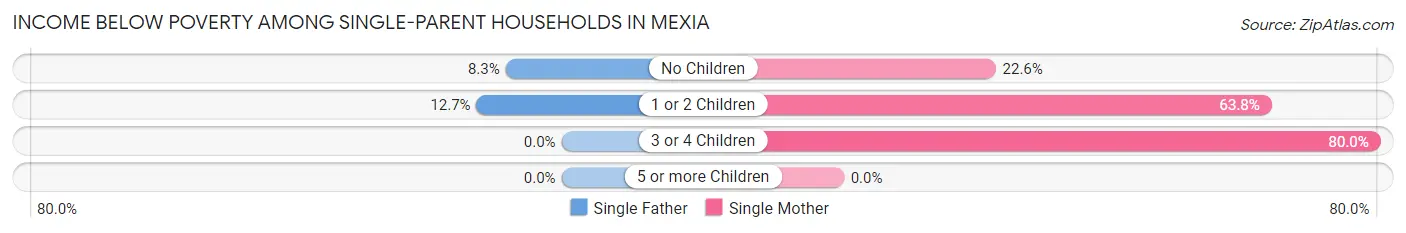
| Children | Single Father | Single Mother |
| No Children | 3 (8.3%) | 24 (22.6%) |
| 1 or 2 Children | 19 (12.7%) | 241 (63.8%) |
| 3 or 4 Children | 0 (0.0%) | 20 (80.0%) |
| 5 or more Children | 0 (0.0%) | 0 (0.0%) |
| Total | 22 (11.8%) | 285 (56.0%) |
Income Below Poverty Among Married-Couple vs Single-Parent Households in Mexia
The poverty data for Mexia shows that 157 of the married-couple family households (20.6%) and 307 of the single-parent households (44.2%) are living below the poverty level. Within the married-couple family households, those with 5 or more children have the highest poverty rate, with 53 households (100.0%) falling below the poverty line. Among the single-parent households, those with 3 or 4 children have the highest poverty rate, with 20 household (80.0%) living below poverty.
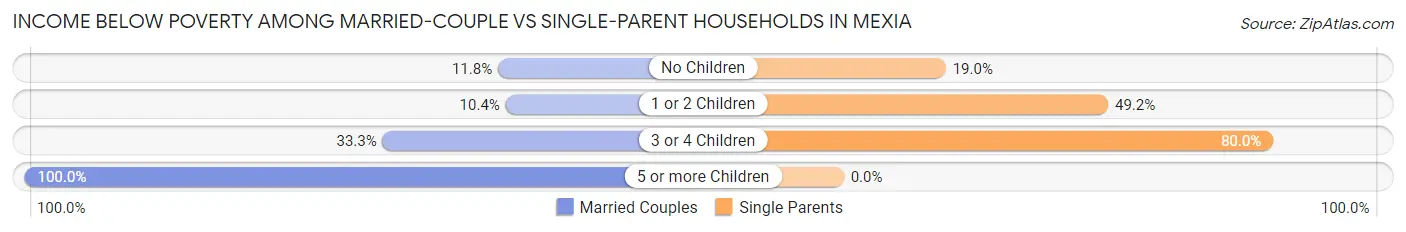
| Children | Married-Couple Families | Single-Parent Households |
| No Children | 57 (11.8%) | 27 (19.0%) |
| 1 or 2 Children | 13 (10.4%) | 260 (49.2%) |
| 3 or 4 Children | 34 (33.3%) | 20 (80.0%) |
| 5 or more Children | 53 (100.0%) | 0 (0.0%) |
| Total | 157 (20.6%) | 307 (44.2%) |
Race in Mexia
The most populous races in Mexia are White / Caucasian (3,065 | 44.4%), Hispanic or Latino (2,401 | 34.8%), and Black / African American (2,139 | 31.0%).
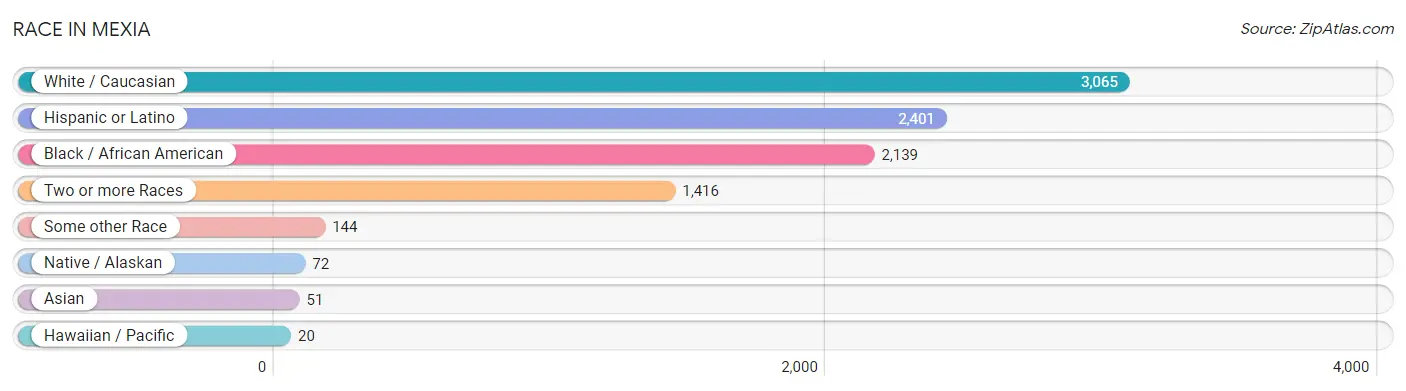
| Race | # Population | % Population |
| Asian | 51 | 0.7% |
| Black / African American | 2,139 | 31.0% |
| Hawaiian / Pacific | 20 | 0.3% |
| Hispanic or Latino | 2,401 | 34.8% |
| Native / Alaskan | 72 | 1.0% |
| White / Caucasian | 3,065 | 44.4% |
| Two or more Races | 1,416 | 20.5% |
| Some other Race | 144 | 2.1% |
| Total | 6,907 | 100.0% |
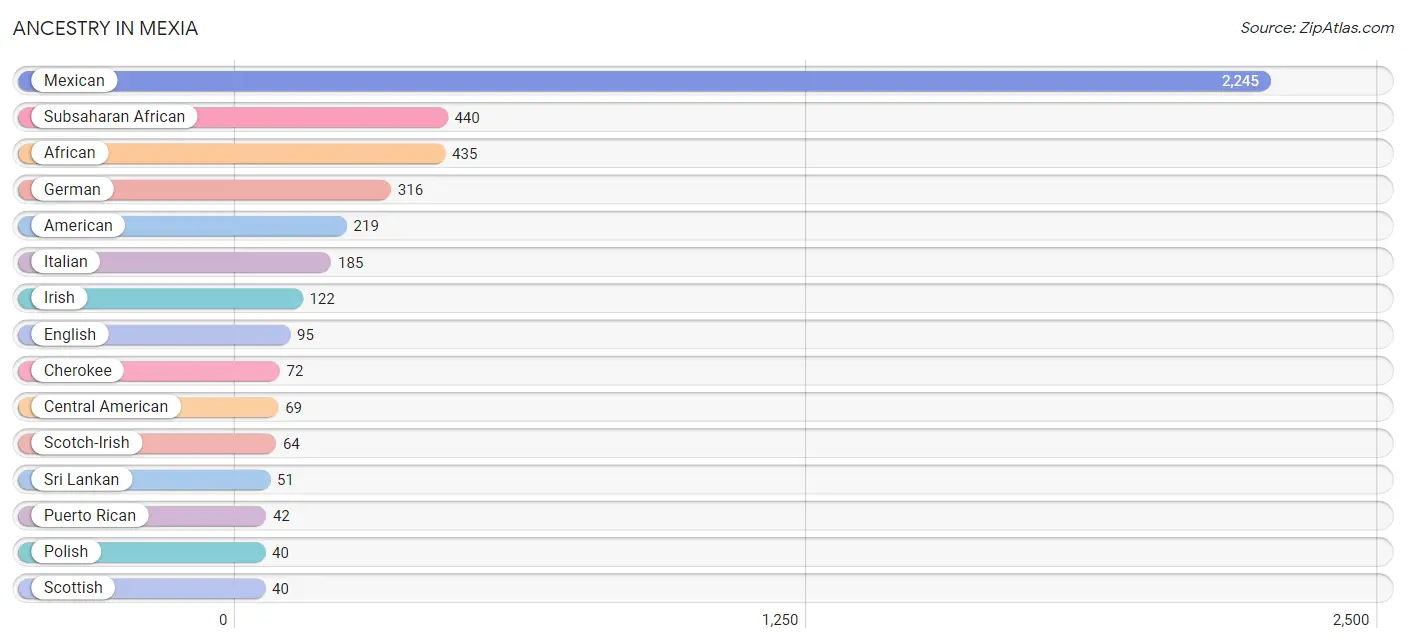
Ancestry in Mexia
The most populous ancestries reported in Mexia are Mexican (2,245 | 32.5%), Subsaharan African (440 | 6.4%), African (435 | 6.3%), German (316 | 4.6%), and American (219 | 3.2%), together accounting for 52.9% of all Mexia residents.
| Ancestry | # Population | % Population |
| African | 435 | 6.3% |
| Alaska Native | 17 | 0.3% |
| American | 219 | 3.2% |
| Blackfeet | 4 | 0.1% |
| British | 16 | 0.2% |
| Central American | 69 | 1.0% |
| Cherokee | 72 | 1.0% |
| Colombian | 12 | 0.2% |
| Comanche | 9 | 0.1% |
| Czech | 28 | 0.4% |
| Czechoslovakian | 4 | 0.1% |
| Dutch | 12 | 0.2% |
| Eastern European | 28 | 0.4% |
| English | 95 | 1.4% |
| European | 6 | 0.1% |
| French | 35 | 0.5% |
| German | 316 | 4.6% |
| Greek | 8 | 0.1% |
| Guamanian / Chamorro | 20 | 0.3% |
| Guatemalan | 39 | 0.6% |
| Irish | 122 | 1.8% |
| Italian | 185 | 2.7% |
| Mexican | 2,245 | 32.5% |
| Native Hawaiian | 9 | 0.1% |
| Nigerian | 5 | 0.1% |
| Panamanian | 17 | 0.3% |
| Polish | 40 | 0.6% |
| Puerto Rican | 42 | 0.6% |
| Salvadoran | 13 | 0.2% |
| Scandinavian | 18 | 0.3% |
| Scotch-Irish | 64 | 0.9% |
| Scottish | 40 | 0.6% |
| South American | 39 | 0.6% |
| Sri Lankan | 51 | 0.7% |
| Subsaharan African | 440 | 6.4% |
| Swedish | 18 | 0.3% |
| Venezuelan | 27 | 0.4% |
| West Indian | 24 | 0.4% | View All 38 Rows |
Immigrants in Mexia
The most numerous immigrant groups reported in Mexia came from Latin America (997 | 14.4%), Central America (958 | 13.9%), Mexico (897 | 13.0%), Asia (51 | 0.7%), and South Eastern Asia (51 | 0.7%), together accounting for 42.8% of all Mexia residents.
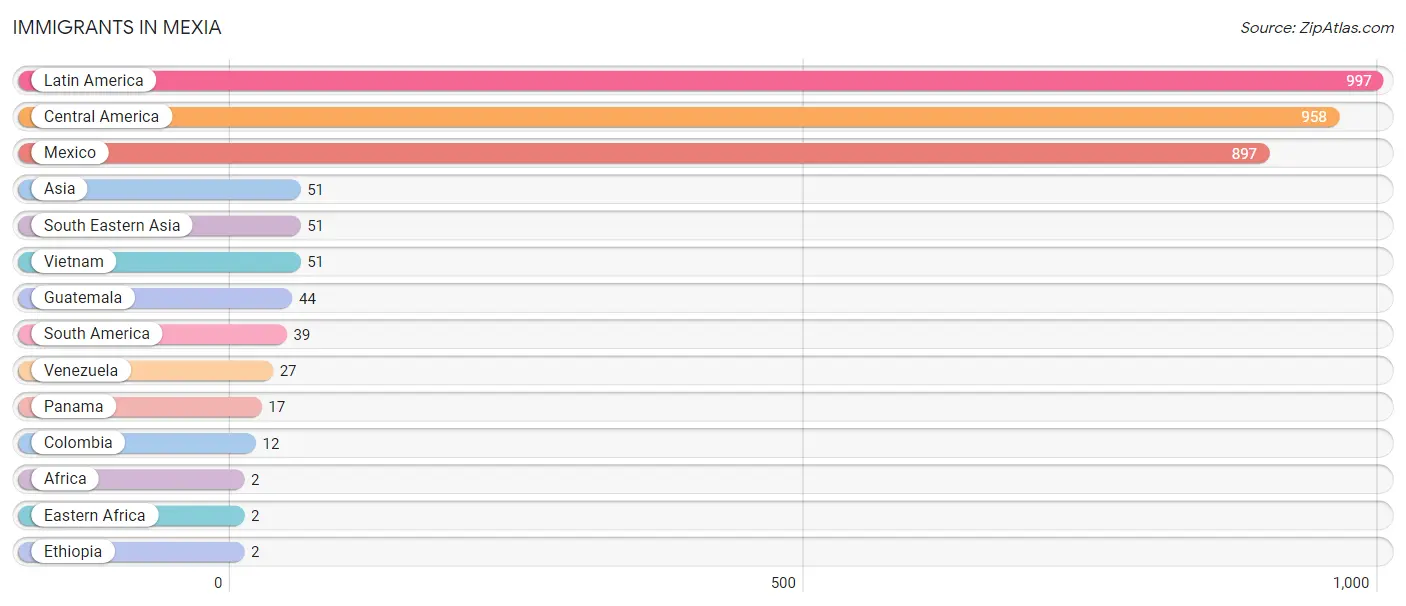
| Immigration Origin | # Population | % Population |
| Africa | 2 | 0.0% |
| Asia | 51 | 0.7% |
| Central America | 958 | 13.9% |
| Colombia | 12 | 0.2% |
| Eastern Africa | 2 | 0.0% |
| Ethiopia | 2 | 0.0% |
| Guatemala | 44 | 0.6% |
| Latin America | 997 | 14.4% |
| Mexico | 897 | 13.0% |
| Panama | 17 | 0.3% |
| South America | 39 | 0.6% |
| South Eastern Asia | 51 | 0.7% |
| Venezuela | 27 | 0.4% |
| Vietnam | 51 | 0.7% | View All 14 Rows |
Sex and Age in Mexia
Sex and Age in Mexia
The most populous age groups in Mexia are 25 to 29 Years (352 | 10.8%) for men and 15 to 19 Years (307 | 8.4%) for women.
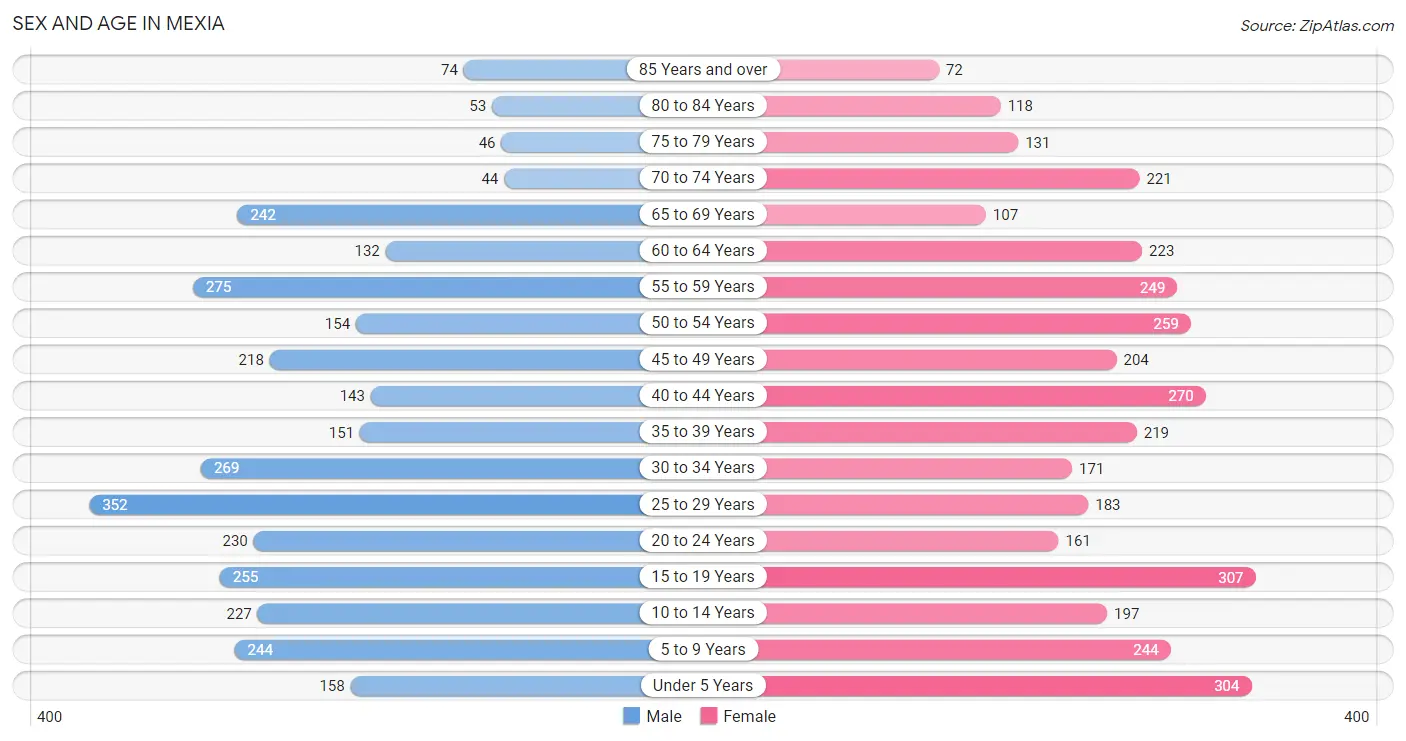
| Age Bracket | Male | Female |
| Under 5 Years | 158 (4.8%) | 304 (8.4%) |
| 5 to 9 Years | 244 (7.5%) | 244 (6.7%) |
| 10 to 14 Years | 227 (7.0%) | 197 (5.4%) |
| 15 to 19 Years | 255 (7.8%) | 307 (8.4%) |
| 20 to 24 Years | 230 (7.0%) | 161 (4.4%) |
| 25 to 29 Years | 352 (10.8%) | 183 (5.0%) |
| 30 to 34 Years | 269 (8.2%) | 171 (4.7%) |
| 35 to 39 Years | 151 (4.6%) | 219 (6.0%) |
| 40 to 44 Years | 143 (4.4%) | 270 (7.4%) |
| 45 to 49 Years | 218 (6.7%) | 204 (5.6%) |
| 50 to 54 Years | 154 (4.7%) | 259 (7.1%) |
| 55 to 59 Years | 275 (8.4%) | 249 (6.8%) |
| 60 to 64 Years | 132 (4.0%) | 223 (6.1%) |
| 65 to 69 Years | 242 (7.4%) | 107 (2.9%) |
| 70 to 74 Years | 44 (1.3%) | 221 (6.1%) |
| 75 to 79 Years | 46 (1.4%) | 131 (3.6%) |
| 80 to 84 Years | 53 (1.6%) | 118 (3.2%) |
| 85 Years and over | 74 (2.3%) | 72 (2.0%) |
| Total | 3,267 (100.0%) | 3,640 (100.0%) |
Families and Households in Mexia
Median Family Size in Mexia
The median family size in Mexia is 3.57 persons per family, with married-couple families (762 | 52.3%) accounting for the largest median family size of 3.63 persons per family. On the other hand, single male/father families (186 | 12.8%) represent the smallest median family size with 3.37 persons per family.
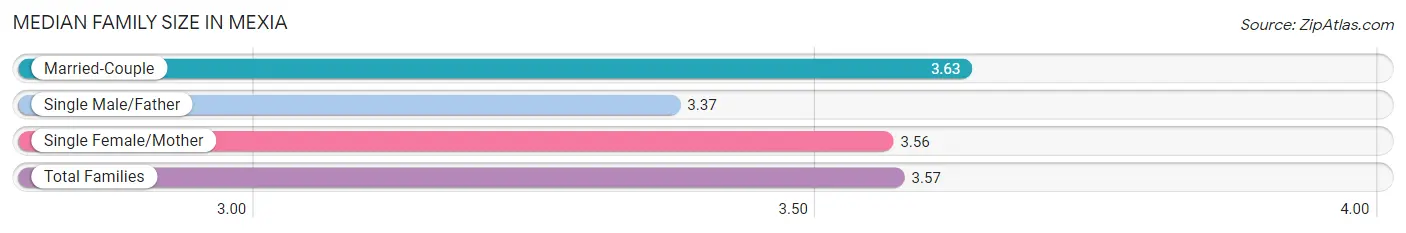
| Family Type | # Families | Family Size |
| Married-Couple | 762 (52.3%) | 3.63 |
| Single Male/Father | 186 (12.8%) | 3.37 |
| Single Female/Mother | 509 (34.9%) | 3.56 |
| Total Families | 1,457 (100.0%) | 3.57 |
Median Household Size in Mexia
The median household size in Mexia is 2.69 persons per household, with single male/father households (186 | 7.8%) accounting for the largest median household size of 3.82 persons per household. non-family households (922 | 38.8%) represent the smallest median household size with 1.18 persons per household.
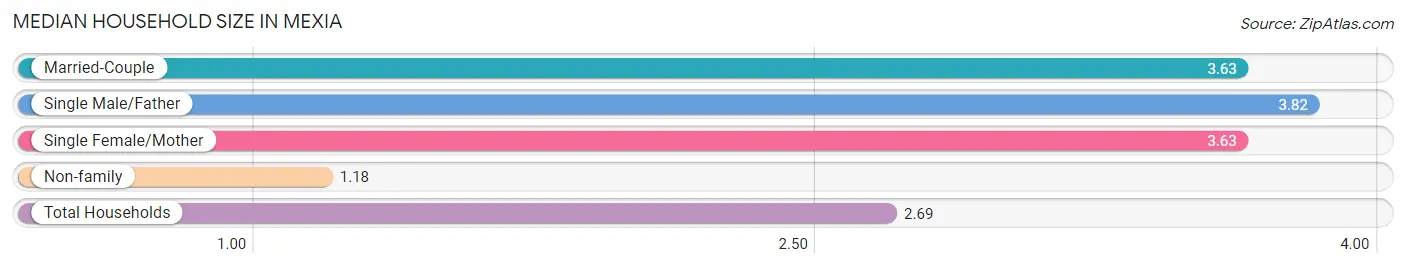
| Household Type | # Households | Household Size |
| Married-Couple | 762 (32.0%) | 3.63 |
| Single Male/Father | 186 (7.8%) | 3.82 |
| Single Female/Mother | 509 (21.4%) | 3.63 |
| Non-family | 922 (38.8%) | 1.18 |
| Total Households | 2,379 (100.0%) | 2.69 |
Household Size by Marriage Status in Mexia
Out of a total of 2,379 households in Mexia, 1,457 (61.2%) are family households, while 922 (38.8%) are nonfamily households. The most numerous type of family households are 2-person households, comprising 491, and the most common type of nonfamily households are 1-person households, comprising 840.
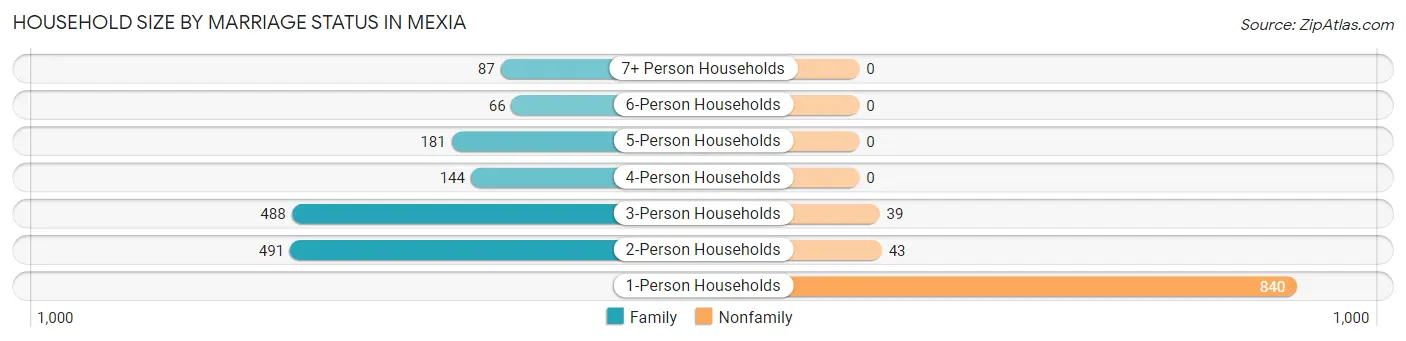
| Household Size | Family Households | Nonfamily Households |
| 1-Person Households | - | 840 (35.3%) |
| 2-Person Households | 491 (20.6%) | 43 (1.8%) |
| 3-Person Households | 488 (20.5%) | 39 (1.6%) |
| 4-Person Households | 144 (6.0%) | 0 (0.0%) |
| 5-Person Households | 181 (7.6%) | 0 (0.0%) |
| 6-Person Households | 66 (2.8%) | 0 (0.0%) |
| 7+ Person Households | 87 (3.7%) | 0 (0.0%) |
| Total | 1,457 (61.2%) | 922 (38.8%) |
Female Fertility in Mexia
Fertility by Age in Mexia
Average fertility rate in Mexia is 36.0 births per 1,000 women. Women in the age bracket of 15 to 19 years have the highest fertility rate with 107.0 births per 1,000 women. Women in the age bracket of 15 to 19 years acount for 58.9% of all women with births.
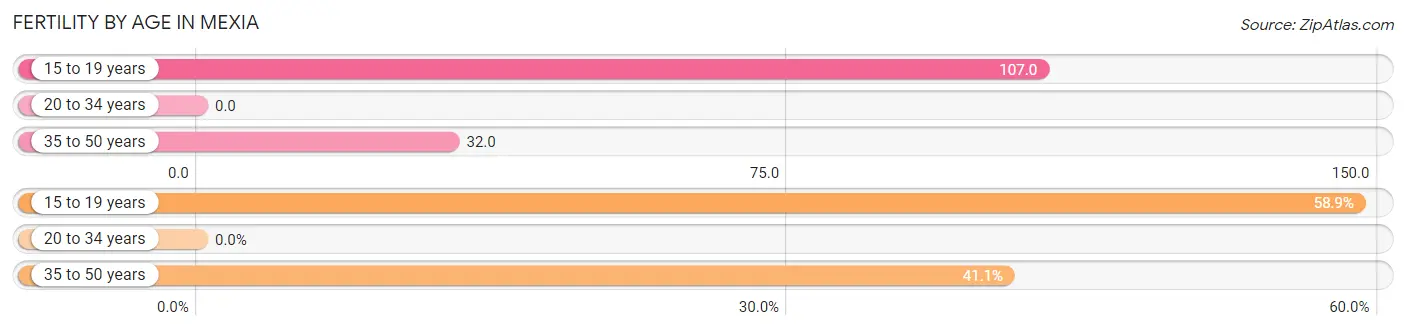
| Age Bracket | Women with Births | Births / 1,000 Women |
| 15 to 19 years | 33 (58.9%) | 107.0 |
| 20 to 34 years | 0 (0.0%) | 0.0 |
| 35 to 50 years | 23 (41.1%) | 32.0 |
| Total | 56 (100.0%) | 36.0 |
Fertility by Age by Marriage Status in Mexia
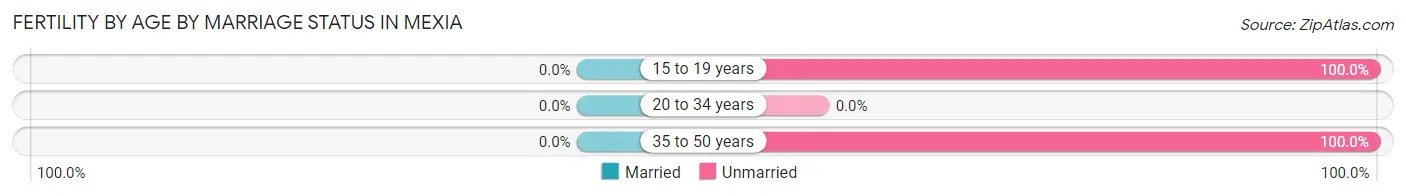
| Age Bracket | Married | Unmarried |
| 15 to 19 years | 0 (0.0%) | 33 (100.0%) |
| 20 to 34 years | 0 (0.0%) | 0 (0.0%) |
| 35 to 50 years | 0 (0.0%) | 23 (100.0%) |
| Total | 0 (0.0%) | 56 (100.0%) |
Fertility by Education in Mexia
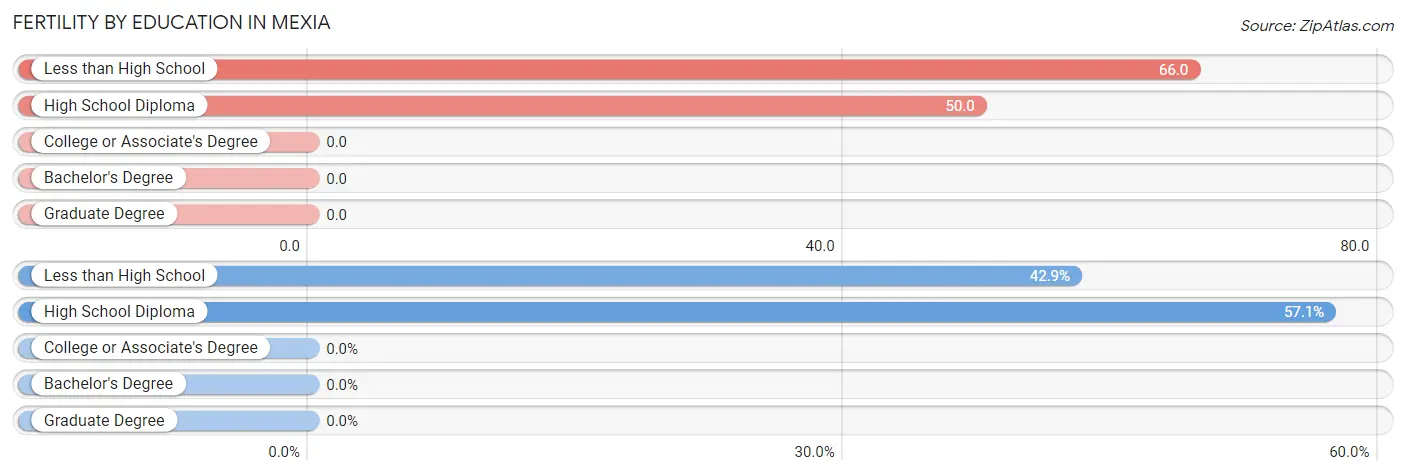
| Educational Attainment | Women with Births | Births / 1,000 Women |
| Less than High School | 24 (42.9%) | 66.0 |
| High School Diploma | 32 (57.1%) | 50.0 |
| College or Associate's Degree | 0 (0.0%) | 0.0 |
| Bachelor's Degree | 0 (0.0%) | 0.0 |
| Graduate Degree | 0 (0.0%) | 0.0 |
| Total | 56 (100.0%) | 36.0 |
Fertility by Education by Marriage Status in Mexia
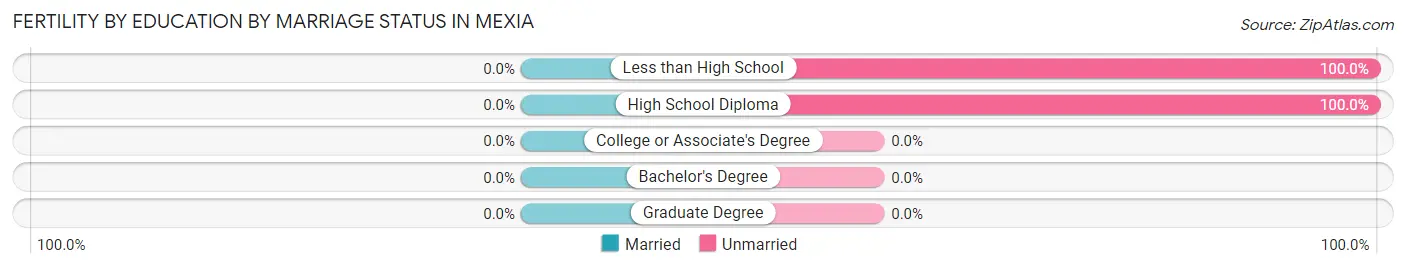
| Educational Attainment | Married | Unmarried |
| Less than High School | 0 (0.0%) | 24 (100.0%) |
| High School Diploma | 0 (0.0%) | 32 (100.0%) |
| College or Associate's Degree | 0 (0.0%) | 0 (0.0%) |
| Bachelor's Degree | 0 (0.0%) | 0 (0.0%) |
| Graduate Degree | 0 (0.0%) | 0 (0.0%) |
| Total | 0 (0.0%) | 56 (100.0%) |
Employment Characteristics in Mexia
Employment by Class of Employer in Mexia
Among the 2,537 employed individuals in Mexia, private company employees (1,445 | 57.0%), state government employees (422 | 16.6%), and self-employed (not incorporated) (242 | 9.5%) make up the most common classes of employment.
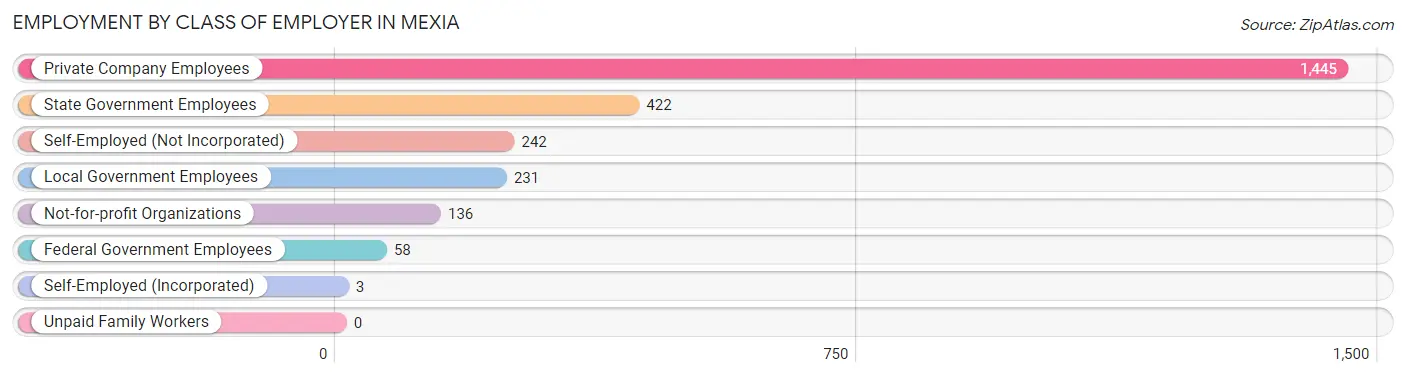
| Employer Class | # Employees | % Employees |
| Private Company Employees | 1,445 | 57.0% |
| Self-Employed (Incorporated) | 3 | 0.1% |
| Self-Employed (Not Incorporated) | 242 | 9.5% |
| Not-for-profit Organizations | 136 | 5.4% |
| Local Government Employees | 231 | 9.1% |
| State Government Employees | 422 | 16.6% |
| Federal Government Employees | 58 | 2.3% |
| Unpaid Family Workers | 0 | 0.0% |
| Total | 2,537 | 100.0% |
Employment Status by Age in Mexia
According to the labor force statistics for Mexia, out of the total population over 16 years of age (5,389), 49.0% or 2,641 individuals are in the labor force, with 3.8% or 100 of them unemployed. The age group with the highest labor force participation rate is 30 to 34 years, with 89.5% or 394 individuals in the labor force. Within the labor force, the 20 to 24 years age range has the highest percentage of unemployed individuals, with 33.0% or 37 of them being unemployed.
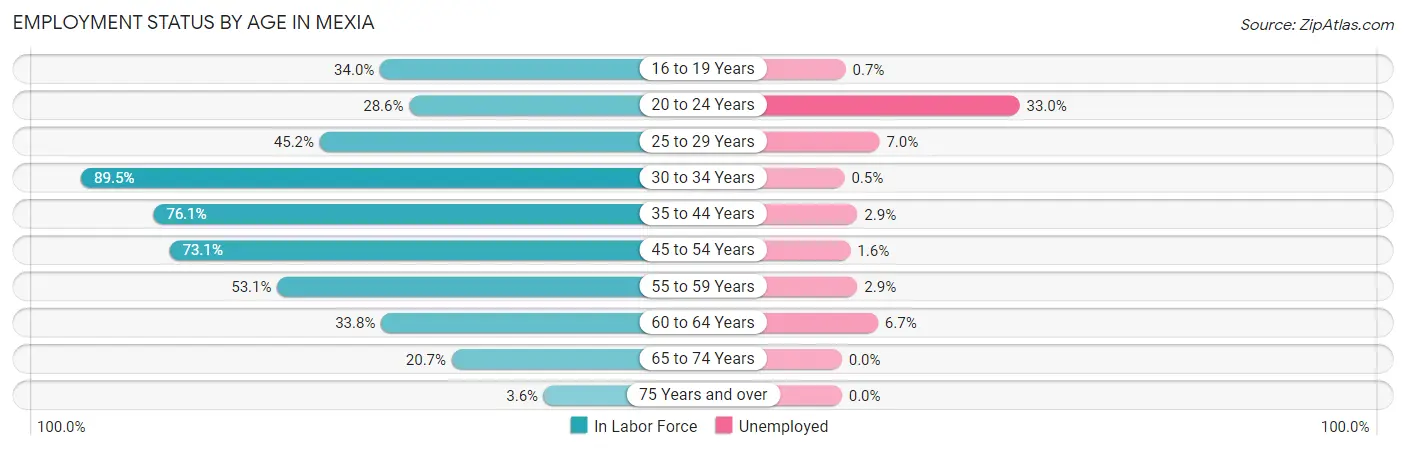
| Age Bracket | In Labor Force | Unemployed |
| 16 to 19 Years | 142 (34.0%) | 1 (0.7%) |
| 20 to 24 Years | 112 (28.6%) | 37 (33.0%) |
| 25 to 29 Years | 242 (45.2%) | 17 (7.0%) |
| 30 to 34 Years | 394 (89.5%) | 2 (0.5%) |
| 35 to 44 Years | 596 (76.1%) | 17 (2.9%) |
| 45 to 54 Years | 610 (73.1%) | 10 (1.6%) |
| 55 to 59 Years | 278 (53.1%) | 8 (2.9%) |
| 60 to 64 Years | 120 (33.8%) | 8 (6.7%) |
| 65 to 74 Years | 127 (20.7%) | 0 (0.0%) |
| 75 Years and over | 18 (3.6%) | 0 (0.0%) |
| Total | 2,641 (49.0%) | 100 (3.8%) |
Employment Status by Educational Attainment in Mexia
According to labor force statistics for Mexia, 64.5% of individuals (2,239) out of the total population between 25 and 64 years of age (3,472) are in the labor force, with 2.8% or 63 of them being unemployed. The group with the highest labor force participation rate are those with the educational attainment of bachelor's degree or higher, with 88.7% or 266 individuals in the labor force. Within the labor force, individuals with bachelor's degree or higher education have the highest percentage of unemployment, with 6.4% or 17 of them being unemployed.
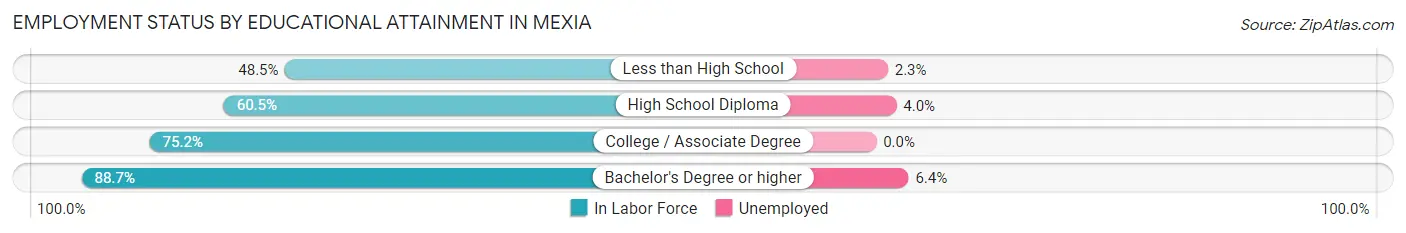
| Educational Attainment | In Labor Force | Unemployed |
| Less than High School | 343 (48.5%) | 16 (2.3%) |
| High School Diploma | 915 (60.5%) | 61 (4.0%) |
| College / Associate Degree | 716 (75.2%) | 0 (0.0%) |
| Bachelor's Degree or higher | 266 (88.7%) | 19 (6.4%) |
| Total | 2,239 (64.5%) | 97 (2.8%) |
Employment Occupations by Sex in Mexia
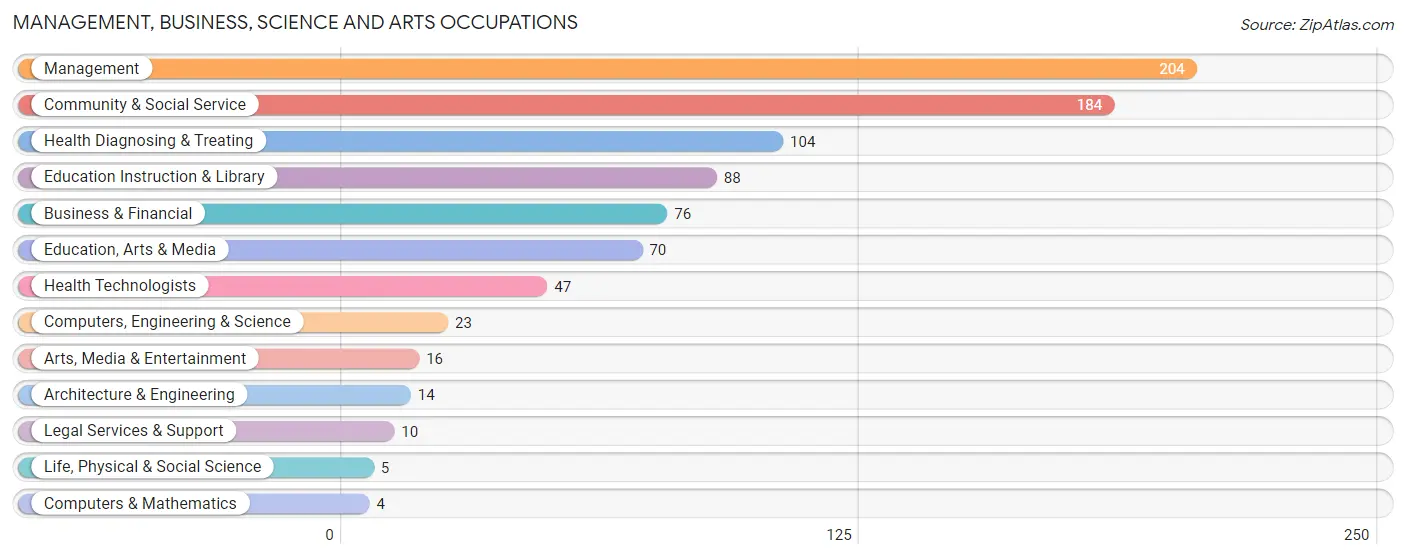
Management, Business, Science and Arts Occupations
The most common Management, Business, Science and Arts occupations in Mexia are Management (204 | 8.0%), Community & Social Service (184 | 7.2%), Health Diagnosing & Treating (104 | 4.1%), Education Instruction & Library (88 | 3.5%), and Business & Financial (76 | 3.0%).
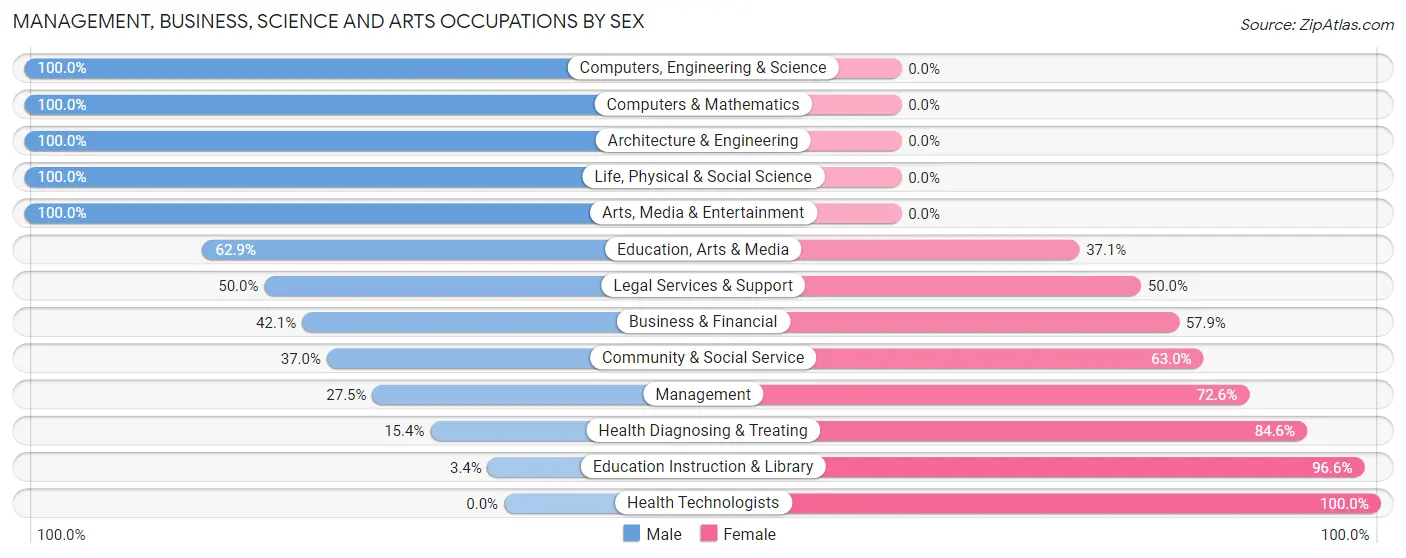
Management, Business, Science and Arts Occupations by Sex
Within the Management, Business, Science and Arts occupations in Mexia, the most male-oriented occupations are Computers, Engineering & Science (100.0%), Computers & Mathematics (100.0%), and Architecture & Engineering (100.0%), while the most female-oriented occupations are Health Technologists (100.0%), Education Instruction & Library (96.6%), and Health Diagnosing & Treating (84.6%).
| Occupation | Male | Female |
| Management | 56 (27.5%) | 148 (72.6%) |
| Business & Financial | 32 (42.1%) | 44 (57.9%) |
| Computers, Engineering & Science | 23 (100.0%) | 0 (0.0%) |
| Computers & Mathematics | 4 (100.0%) | 0 (0.0%) |
| Architecture & Engineering | 14 (100.0%) | 0 (0.0%) |
| Life, Physical & Social Science | 5 (100.0%) | 0 (0.0%) |
| Community & Social Service | 68 (37.0%) | 116 (63.0%) |
| Education, Arts & Media | 44 (62.9%) | 26 (37.1%) |
| Legal Services & Support | 5 (50.0%) | 5 (50.0%) |
| Education Instruction & Library | 3 (3.4%) | 85 (96.6%) |
| Arts, Media & Entertainment | 16 (100.0%) | 0 (0.0%) |
| Health Diagnosing & Treating | 16 (15.4%) | 88 (84.6%) |
| Health Technologists | 0 (0.0%) | 47 (100.0%) |
| Total (Category) | 195 (33.0%) | 396 (67.0%) |
| Total (Overall) | 1,312 (51.7%) | 1,227 (48.3%) |
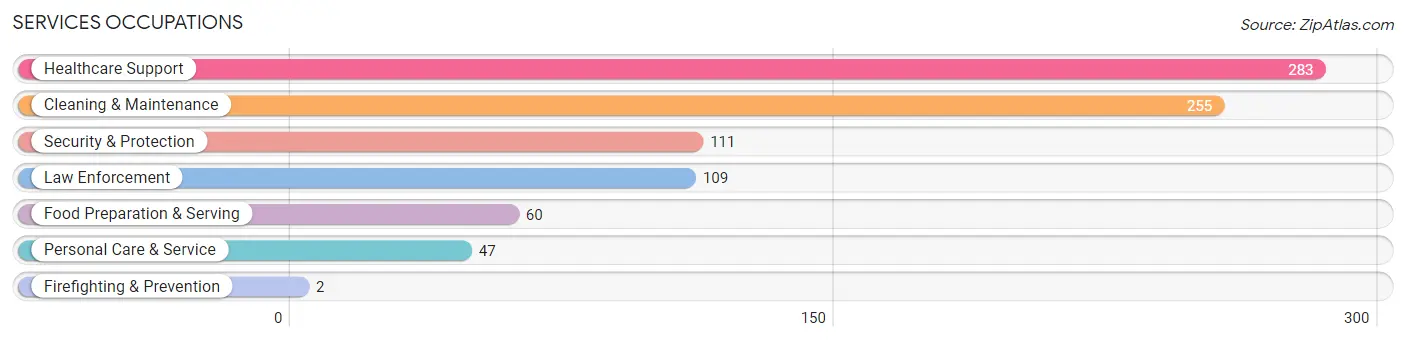
Services Occupations
The most common Services occupations in Mexia are Healthcare Support (283 | 11.2%), Cleaning & Maintenance (255 | 10.0%), Security & Protection (111 | 4.4%), Law Enforcement (109 | 4.3%), and Food Preparation & Serving (60 | 2.4%).
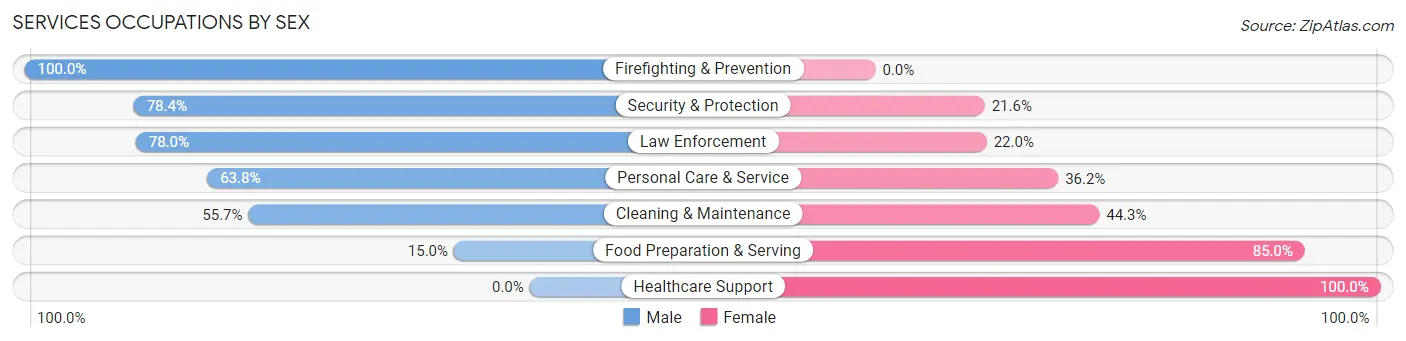
Services Occupations by Sex
Within the Services occupations in Mexia, the most male-oriented occupations are Firefighting & Prevention (100.0%), Security & Protection (78.4%), and Law Enforcement (78.0%), while the most female-oriented occupations are Healthcare Support (100.0%), Food Preparation & Serving (85.0%), and Cleaning & Maintenance (44.3%).
| Occupation | Male | Female |
| Healthcare Support | 0 (0.0%) | 283 (100.0%) |
| Security & Protection | 87 (78.4%) | 24 (21.6%) |
| Firefighting & Prevention | 2 (100.0%) | 0 (0.0%) |
| Law Enforcement | 85 (78.0%) | 24 (22.0%) |
| Food Preparation & Serving | 9 (15.0%) | 51 (85.0%) |
| Cleaning & Maintenance | 142 (55.7%) | 113 (44.3%) |
| Personal Care & Service | 30 (63.8%) | 17 (36.2%) |
| Total (Category) | 268 (35.4%) | 488 (64.5%) |
| Total (Overall) | 1,312 (51.7%) | 1,227 (48.3%) |
Sales and Office Occupations
The most common Sales and Office occupations in Mexia are Office & Administration (185 | 7.3%), and Sales & Related (149 | 5.9%).
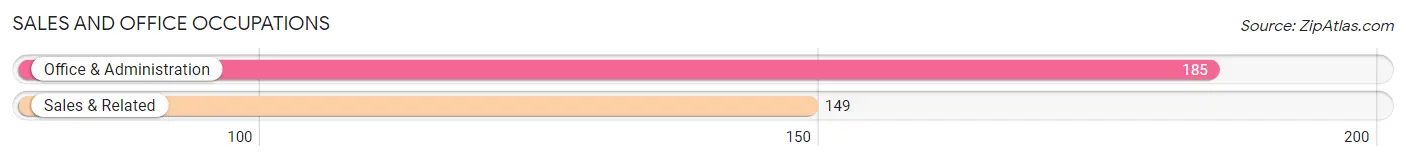
Sales and Office Occupations by Sex
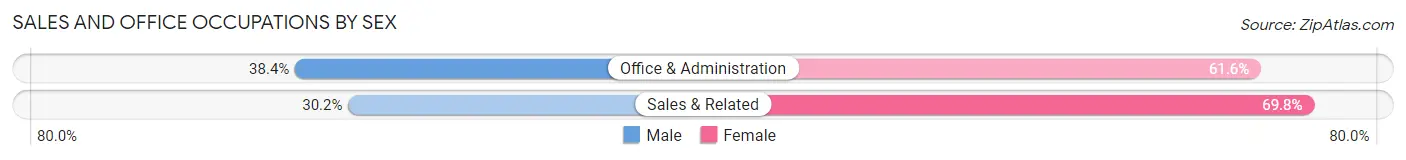
| Occupation | Male | Female |
| Sales & Related | 45 (30.2%) | 104 (69.8%) |
| Office & Administration | 71 (38.4%) | 114 (61.6%) |
| Total (Category) | 116 (34.7%) | 218 (65.3%) |
| Total (Overall) | 1,312 (51.7%) | 1,227 (48.3%) |
Natural Resources, Construction and Maintenance Occupations
The most common Natural Resources, Construction and Maintenance occupations in Mexia are Construction & Extraction (237 | 9.3%), and Installation, Maintenance & Repair (184 | 7.2%).
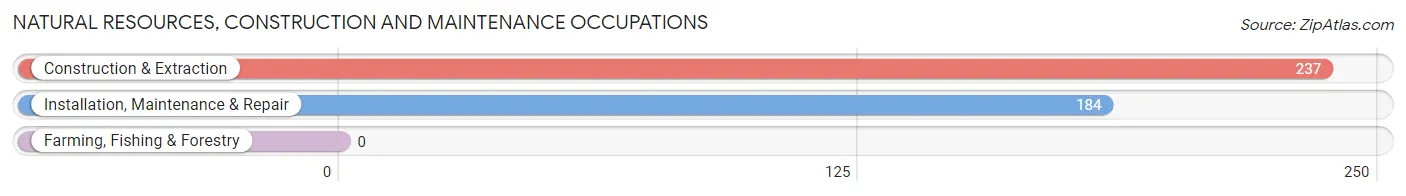
Natural Resources, Construction and Maintenance Occupations by Sex
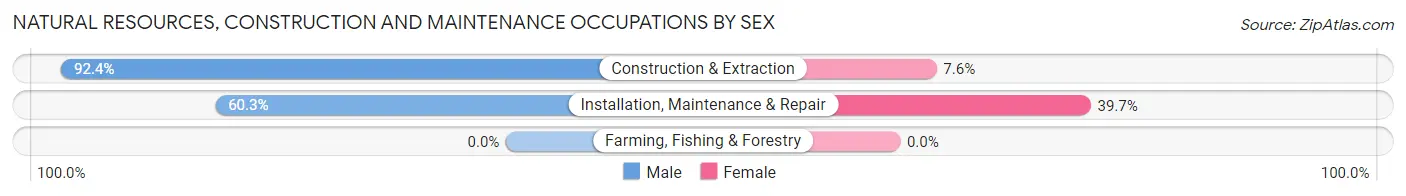
| Occupation | Male | Female |
| Farming, Fishing & Forestry | 0 (0.0%) | 0 (0.0%) |
| Construction & Extraction | 219 (92.4%) | 18 (7.6%) |
| Installation, Maintenance & Repair | 111 (60.3%) | 73 (39.7%) |
| Total (Category) | 330 (78.4%) | 91 (21.6%) |
| Total (Overall) | 1,312 (51.7%) | 1,227 (48.3%) |
Production, Transportation and Moving Occupations
The most common Production, Transportation and Moving occupations in Mexia are Production (257 | 10.1%), Transportation (101 | 4.0%), and Material Moving (79 | 3.1%).
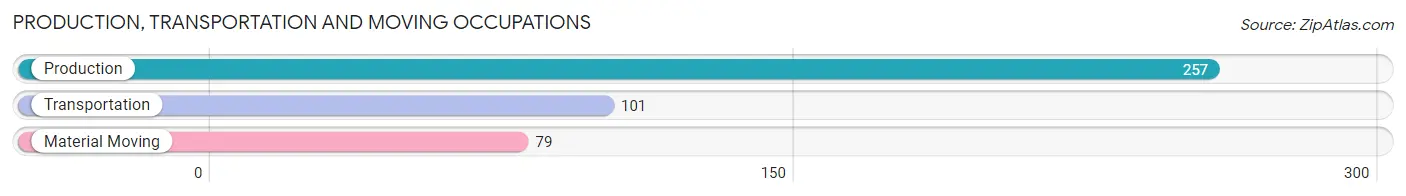
Production, Transportation and Moving Occupations by Sex
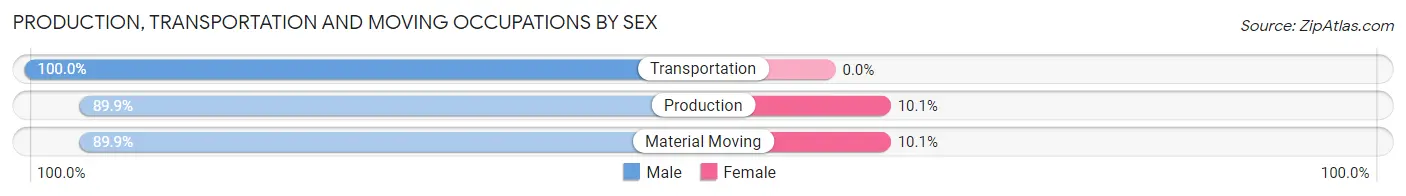
| Occupation | Male | Female |
| Production | 231 (89.9%) | 26 (10.1%) |
| Transportation | 101 (100.0%) | 0 (0.0%) |
| Material Moving | 71 (89.9%) | 8 (10.1%) |
| Total (Category) | 403 (92.2%) | 34 (7.8%) |
| Total (Overall) | 1,312 (51.7%) | 1,227 (48.3%) |
Employment Industries by Sex in Mexia
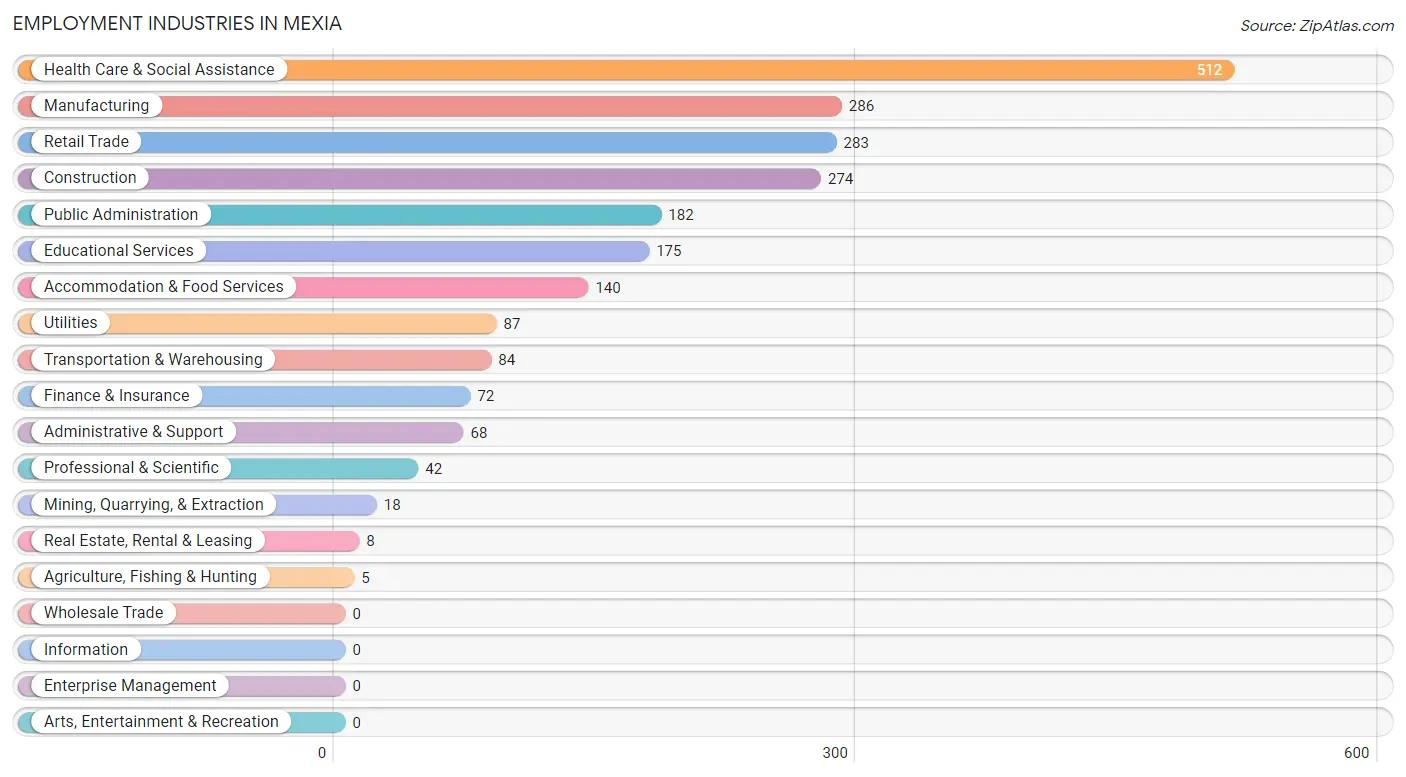
Employment Industries in Mexia
The major employment industries in Mexia include Health Care & Social Assistance (512 | 20.2%), Manufacturing (286 | 11.3%), Retail Trade (283 | 11.2%), Construction (274 | 10.8%), and Public Administration (182 | 7.2%).
Employment Industries by Sex in Mexia
The Mexia industries that see more men than women are Mining, Quarrying, & Extraction (100.0%), Utilities (100.0%), and Administrative & Support (95.6%), whereas the industries that tend to have a higher number of women are Agriculture, Fishing & Hunting (100.0%), Professional & Scientific (100.0%), and Real Estate, Rental & Leasing (87.5%).
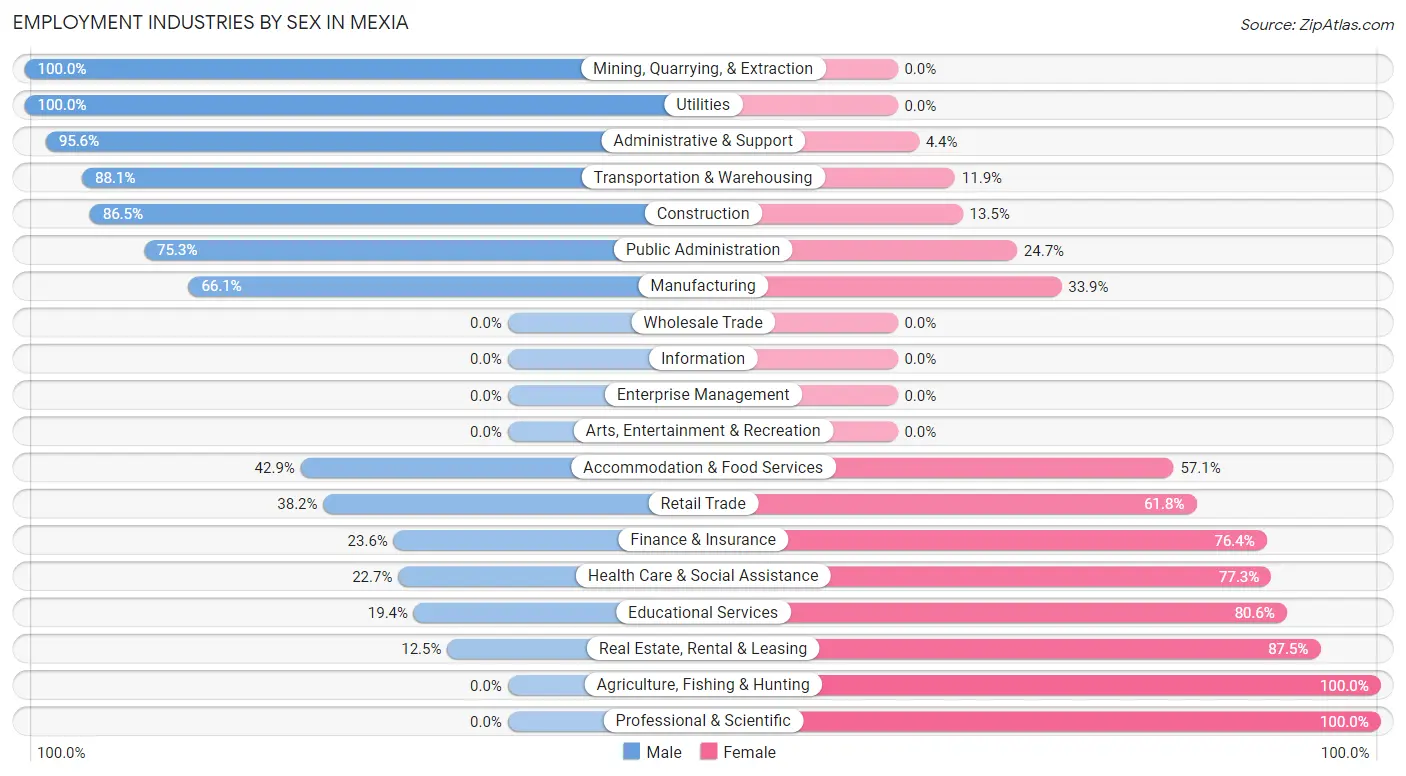
| Industry | Male | Female |
| Agriculture, Fishing & Hunting | 0 (0.0%) | 5 (100.0%) |
| Mining, Quarrying, & Extraction | 18 (100.0%) | 0 (0.0%) |
| Construction | 237 (86.5%) | 37 (13.5%) |
| Manufacturing | 189 (66.1%) | 97 (33.9%) |
| Wholesale Trade | 0 (0.0%) | 0 (0.0%) |
| Retail Trade | 108 (38.2%) | 175 (61.8%) |
| Transportation & Warehousing | 74 (88.1%) | 10 (11.9%) |
| Utilities | 87 (100.0%) | 0 (0.0%) |
| Information | 0 (0.0%) | 0 (0.0%) |
| Finance & Insurance | 17 (23.6%) | 55 (76.4%) |
| Real Estate, Rental & Leasing | 1 (12.5%) | 7 (87.5%) |
| Professional & Scientific | 0 (0.0%) | 42 (100.0%) |
| Enterprise Management | 0 (0.0%) | 0 (0.0%) |
| Administrative & Support | 65 (95.6%) | 3 (4.4%) |
| Educational Services | 34 (19.4%) | 141 (80.6%) |
| Health Care & Social Assistance | 116 (22.7%) | 396 (77.3%) |
| Arts, Entertainment & Recreation | 0 (0.0%) | 0 (0.0%) |
| Accommodation & Food Services | 60 (42.9%) | 80 (57.1%) |
| Public Administration | 137 (75.3%) | 45 (24.7%) |
| Total | 1,312 (51.7%) | 1,227 (48.3%) |
Education in Mexia
School Enrollment in Mexia
The most common levels of schooling among the 1,549 students in Mexia are high school (428 | 27.6%), middle school (362 | 23.4%), and elementary school (327 | 21.1%).
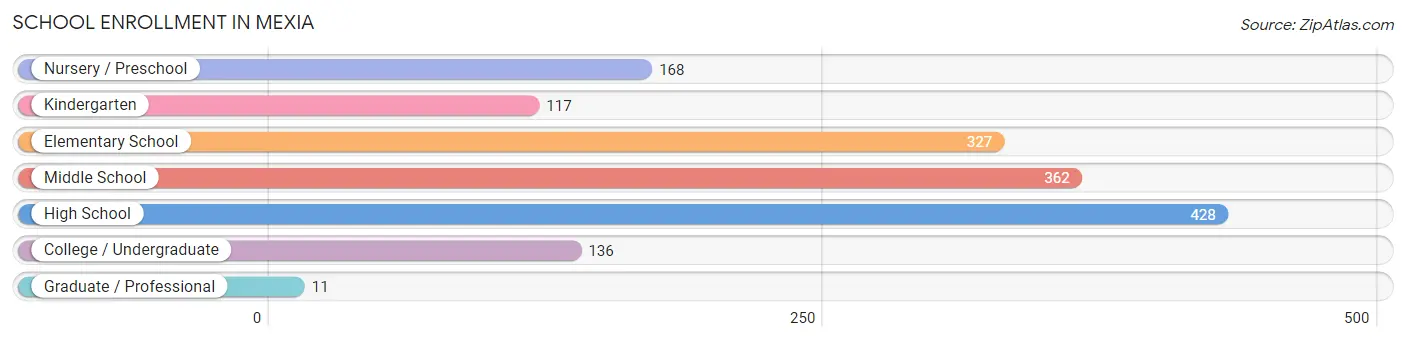
| School Level | # Students | % Students |
| Nursery / Preschool | 168 | 10.8% |
| Kindergarten | 117 | 7.5% |
| Elementary School | 327 | 21.1% |
| Middle School | 362 | 23.4% |
| High School | 428 | 27.6% |
| College / Undergraduate | 136 | 8.8% |
| Graduate / Professional | 11 | 0.7% |
| Total | 1,549 | 100.0% |
School Enrollment by Age by Funding Source in Mexia
Out of a total of 1,549 students who are enrolled in schools in Mexia, 57 (3.7%) attend a private institution, while the remaining 1,492 (96.3%) are enrolled in public schools. The age group of 5 to 9 year old has the highest likelihood of being enrolled in private schools, with 33 (7.9% in the age bracket) enrolled. Conversely, the age group of 3 to 4 year olds has the lowest likelihood of being enrolled in a private school, with 149 (100.0% in the age bracket) attending a public institution.
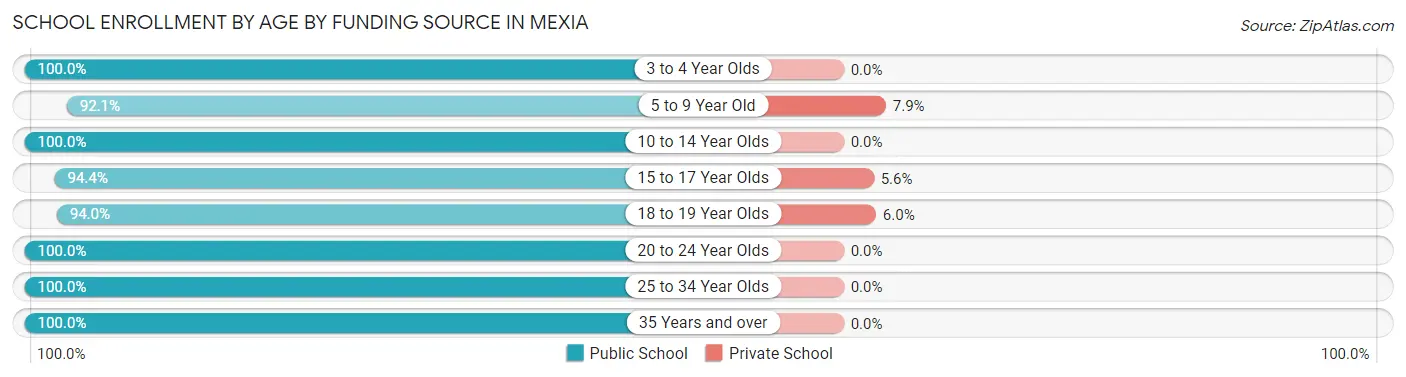
| Age Bracket | Public School | Private School |
| 3 to 4 Year Olds | 149 (100.0%) | 0 (0.0%) |
| 5 to 9 Year Old | 387 (92.1%) | 33 (7.9%) |
| 10 to 14 Year Olds | 424 (100.0%) | 0 (0.0%) |
| 15 to 17 Year Olds | 321 (94.4%) | 19 (5.6%) |
| 18 to 19 Year Olds | 94 (94.0%) | 6 (6.0%) |
| 20 to 24 Year Olds | 49 (100.0%) | 0 (0.0%) |
| 25 to 34 Year Olds | 42 (100.0%) | 0 (0.0%) |
| 35 Years and over | 25 (100.0%) | 0 (0.0%) |
| Total | 1,492 (96.3%) | 57 (3.7%) |
Educational Attainment by Field of Study in Mexia
Education (116 | 24.6%), business (80 | 17.0%), arts & humanities (71 | 15.1%), science & technology (61 | 13.0%), and psychology (32 | 6.8%) are the most common fields of study among 471 individuals in Mexia who have obtained a bachelor's degree or higher.
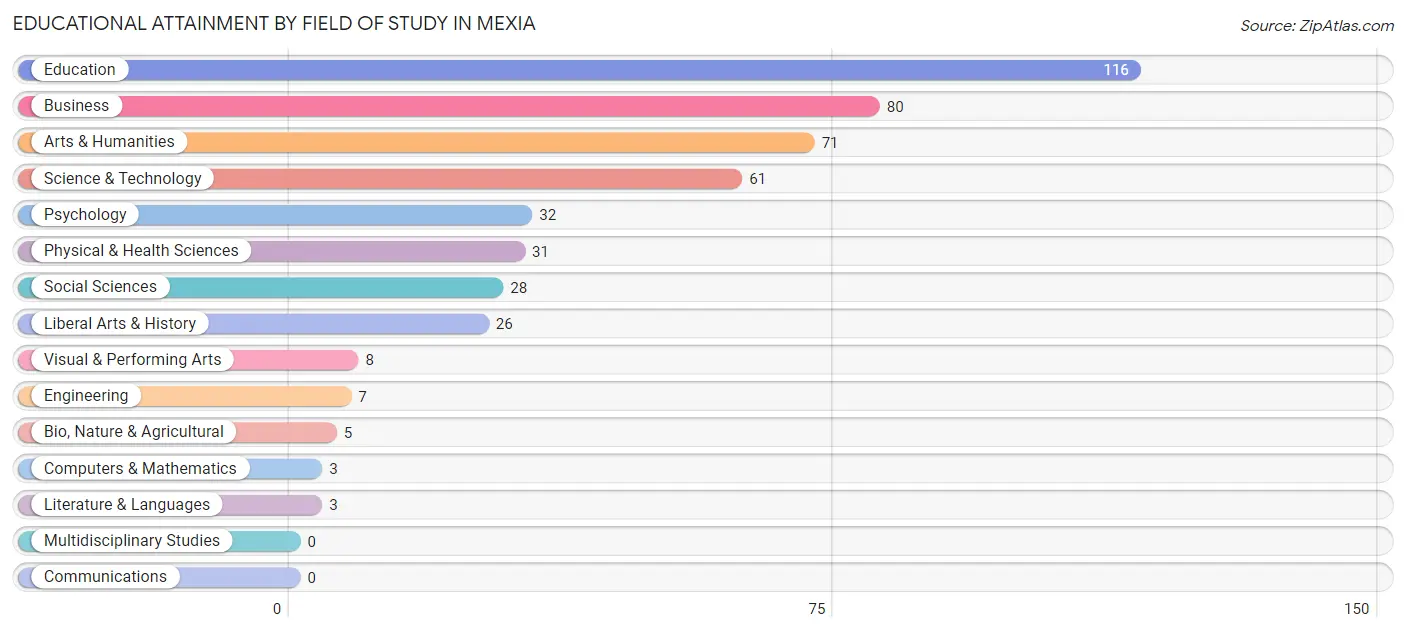
| Field of Study | # Graduates | % Graduates |
| Computers & Mathematics | 3 | 0.6% |
| Bio, Nature & Agricultural | 5 | 1.1% |
| Physical & Health Sciences | 31 | 6.6% |
| Psychology | 32 | 6.8% |
| Social Sciences | 28 | 5.9% |
| Engineering | 7 | 1.5% |
| Multidisciplinary Studies | 0 | 0.0% |
| Science & Technology | 61 | 13.0% |
| Business | 80 | 17.0% |
| Education | 116 | 24.6% |
| Literature & Languages | 3 | 0.6% |
| Liberal Arts & History | 26 | 5.5% |
| Visual & Performing Arts | 8 | 1.7% |
| Communications | 0 | 0.0% |
| Arts & Humanities | 71 | 15.1% |
| Total | 471 | 100.0% |
Transportation & Commute in Mexia
Vehicle Availability by Sex in Mexia
The most prevalent vehicle ownership categories in Mexia are males with 2 vehicles (431, accounting for 33.8%) and females with 2 vehicles (347, making up 35.1%).
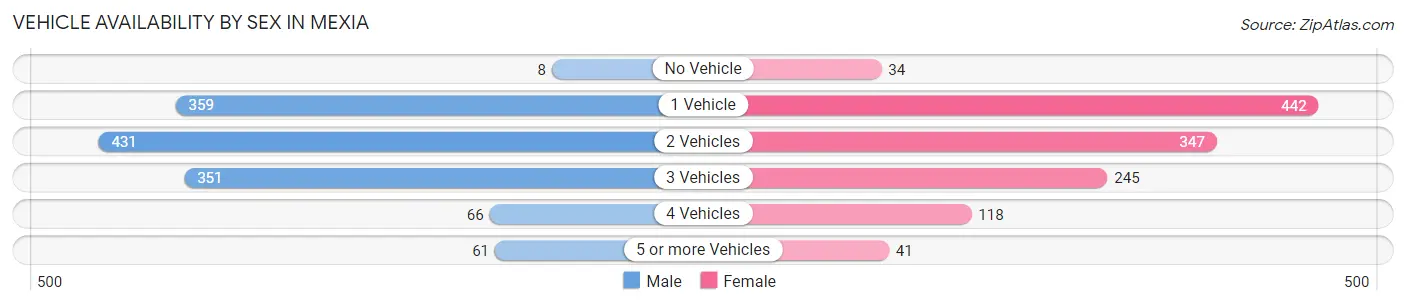
| Vehicles Available | Male | Female |
| No Vehicle | 8 (0.6%) | 34 (2.8%) |
| 1 Vehicle | 359 (28.1%) | 442 (36.0%) |
| 2 Vehicles | 431 (33.8%) | 347 (28.3%) |
| 3 Vehicles | 351 (27.5%) | 245 (20.0%) |
| 4 Vehicles | 66 (5.2%) | 118 (9.6%) |
| 5 or more Vehicles | 61 (4.8%) | 41 (3.3%) |
| Total | 1,276 (100.0%) | 1,227 (100.0%) |
Commute Time in Mexia
The most frequently occuring commute durations in Mexia are 10 to 14 minutes (516 commuters, 21.5%), 15 to 19 minutes (484 commuters, 20.2%), and 5 to 9 minutes (472 commuters, 19.7%).
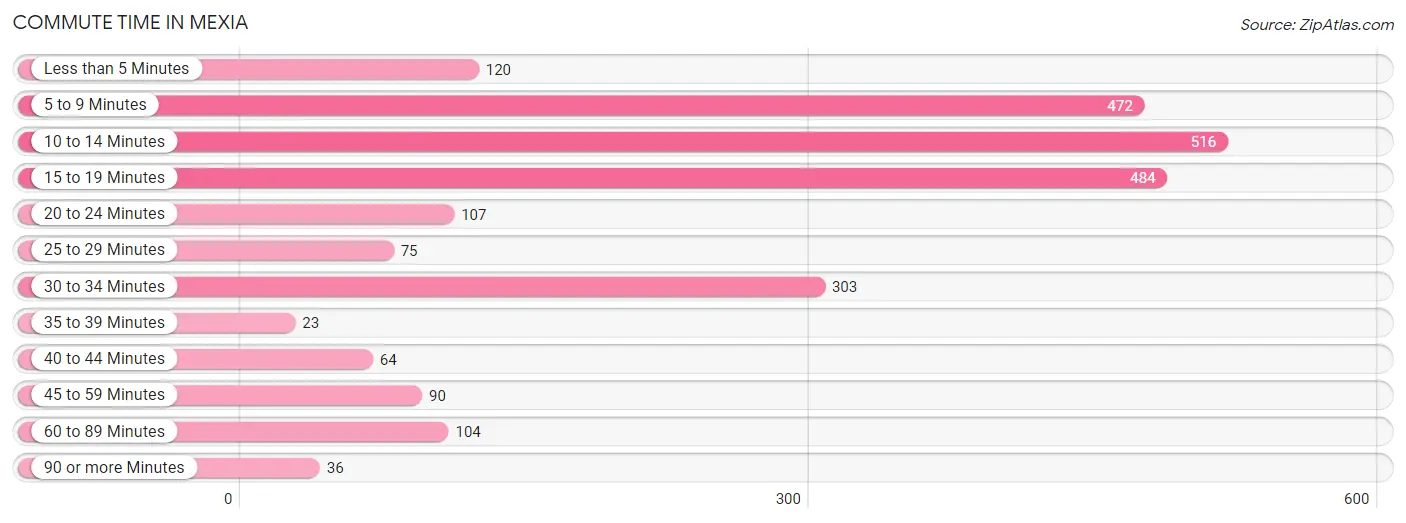
| Commute Time | # Commuters | % Commuters |
| Less than 5 Minutes | 120 | 5.0% |
| 5 to 9 Minutes | 472 | 19.7% |
| 10 to 14 Minutes | 516 | 21.5% |
| 15 to 19 Minutes | 484 | 20.2% |
| 20 to 24 Minutes | 107 | 4.5% |
| 25 to 29 Minutes | 75 | 3.1% |
| 30 to 34 Minutes | 303 | 12.7% |
| 35 to 39 Minutes | 23 | 1.0% |
| 40 to 44 Minutes | 64 | 2.7% |
| 45 to 59 Minutes | 90 | 3.8% |
| 60 to 89 Minutes | 104 | 4.3% |
| 90 or more Minutes | 36 | 1.5% |
Commute Time by Sex in Mexia
The most common commute times in Mexia are 15 to 19 minutes (253 commuters, 20.2%) for males and 10 to 14 minutes (312 commuters, 27.3%) for females.
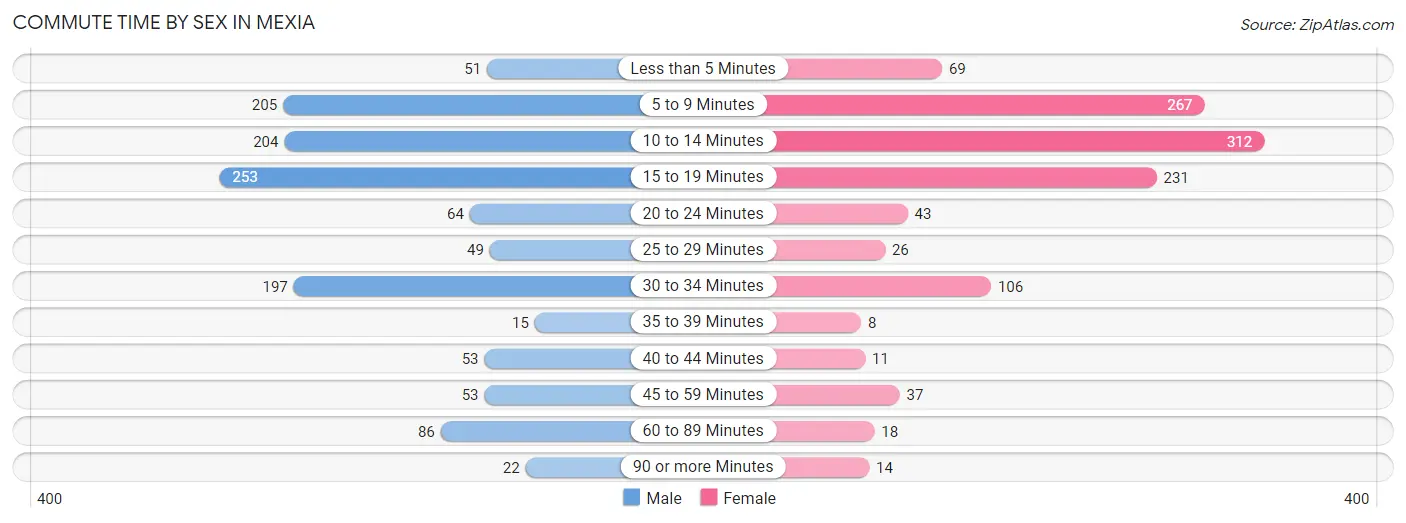
| Commute Time | Male | Female |
| Less than 5 Minutes | 51 (4.1%) | 69 (6.0%) |
| 5 to 9 Minutes | 205 (16.4%) | 267 (23.4%) |
| 10 to 14 Minutes | 204 (16.3%) | 312 (27.3%) |
| 15 to 19 Minutes | 253 (20.2%) | 231 (20.2%) |
| 20 to 24 Minutes | 64 (5.1%) | 43 (3.8%) |
| 25 to 29 Minutes | 49 (3.9%) | 26 (2.3%) |
| 30 to 34 Minutes | 197 (15.7%) | 106 (9.3%) |
| 35 to 39 Minutes | 15 (1.2%) | 8 (0.7%) |
| 40 to 44 Minutes | 53 (4.2%) | 11 (1.0%) |
| 45 to 59 Minutes | 53 (4.2%) | 37 (3.2%) |
| 60 to 89 Minutes | 86 (6.9%) | 18 (1.6%) |
| 90 or more Minutes | 22 (1.8%) | 14 (1.2%) |
Time of Departure to Work by Sex in Mexia
The most frequent times of departure to work in Mexia are 6:30 AM to 6:59 AM (213, 17.0%) for males and 7:30 AM to 7:59 AM (241, 21.1%) for females.
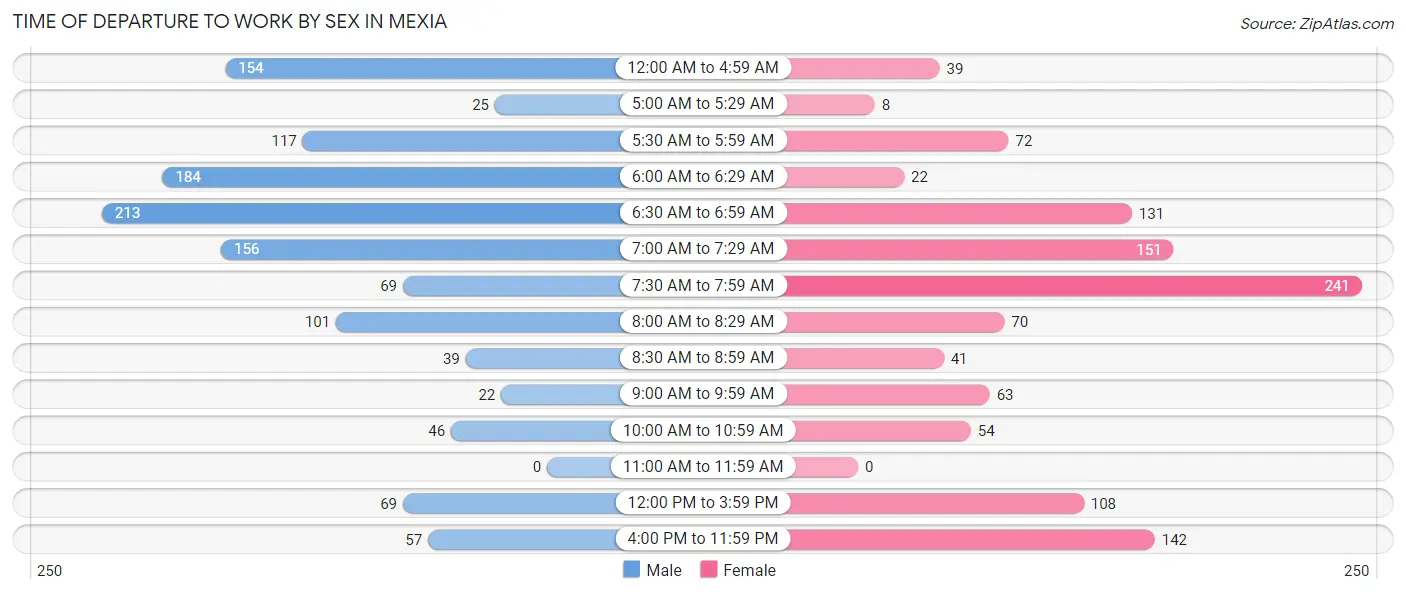
| Time of Departure | Male | Female |
| 12:00 AM to 4:59 AM | 154 (12.3%) | 39 (3.4%) |
| 5:00 AM to 5:29 AM | 25 (2.0%) | 8 (0.7%) |
| 5:30 AM to 5:59 AM | 117 (9.3%) | 72 (6.3%) |
| 6:00 AM to 6:29 AM | 184 (14.7%) | 22 (1.9%) |
| 6:30 AM to 6:59 AM | 213 (17.0%) | 131 (11.5%) |
| 7:00 AM to 7:29 AM | 156 (12.5%) | 151 (13.2%) |
| 7:30 AM to 7:59 AM | 69 (5.5%) | 241 (21.1%) |
| 8:00 AM to 8:29 AM | 101 (8.1%) | 70 (6.1%) |
| 8:30 AM to 8:59 AM | 39 (3.1%) | 41 (3.6%) |
| 9:00 AM to 9:59 AM | 22 (1.8%) | 63 (5.5%) |
| 10:00 AM to 10:59 AM | 46 (3.7%) | 54 (4.7%) |
| 11:00 AM to 11:59 AM | 0 (0.0%) | 0 (0.0%) |
| 12:00 PM to 3:59 PM | 69 (5.5%) | 108 (9.5%) |
| 4:00 PM to 11:59 PM | 57 (4.5%) | 142 (12.4%) |
| Total | 1,252 (100.0%) | 1,142 (100.0%) |
Housing Occupancy in Mexia
Occupancy by Ownership in Mexia
Of the total 2,379 dwellings in Mexia, owner-occupied units account for 1,379 (58.0%), while renter-occupied units make up 1,000 (42.0%).
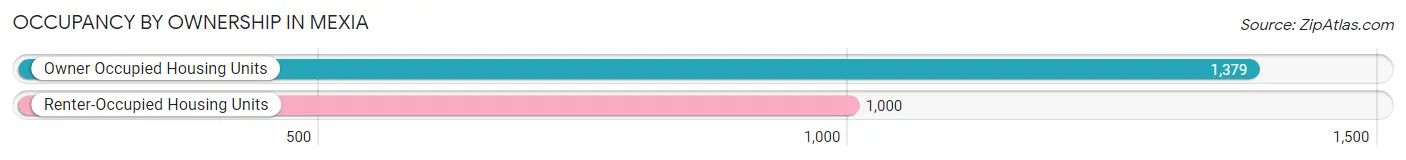
| Occupancy | # Housing Units | % Housing Units |
| Owner Occupied Housing Units | 1,379 | 58.0% |
| Renter-Occupied Housing Units | 1,000 | 42.0% |
| Total Occupied Housing Units | 2,379 | 100.0% |
Occupancy by Household Size in Mexia
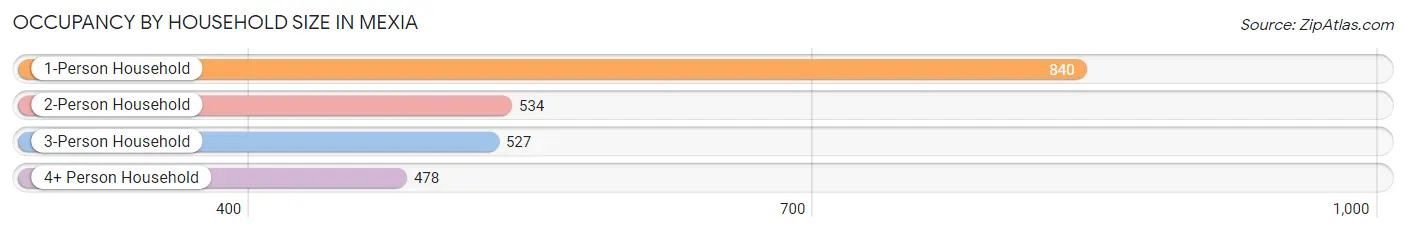
| Household Size | # Housing Units | % Housing Units |
| 1-Person Household | 840 | 35.3% |
| 2-Person Household | 534 | 22.5% |
| 3-Person Household | 527 | 22.2% |
| 4+ Person Household | 478 | 20.1% |
| Total Housing Units | 2,379 | 100.0% |
Occupancy by Ownership by Household Size in Mexia
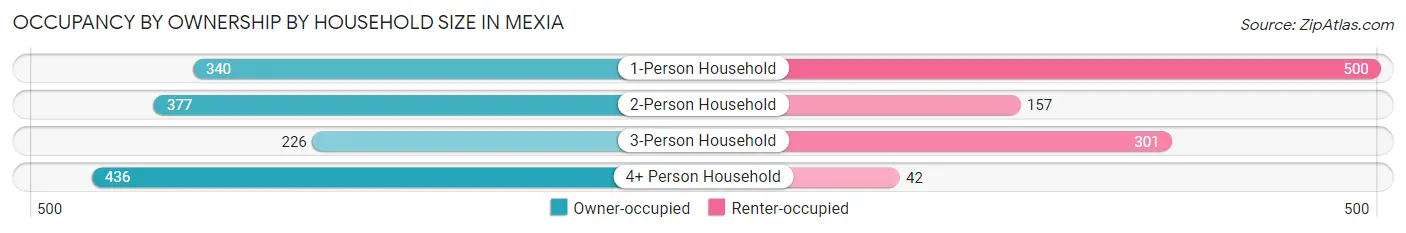
| Household Size | Owner-occupied | Renter-occupied |
| 1-Person Household | 340 (40.5%) | 500 (59.5%) |
| 2-Person Household | 377 (70.6%) | 157 (29.4%) |
| 3-Person Household | 226 (42.9%) | 301 (57.1%) |
| 4+ Person Household | 436 (91.2%) | 42 (8.8%) |
| Total Housing Units | 1,379 (58.0%) | 1,000 (42.0%) |
Occupancy by Educational Attainment in Mexia
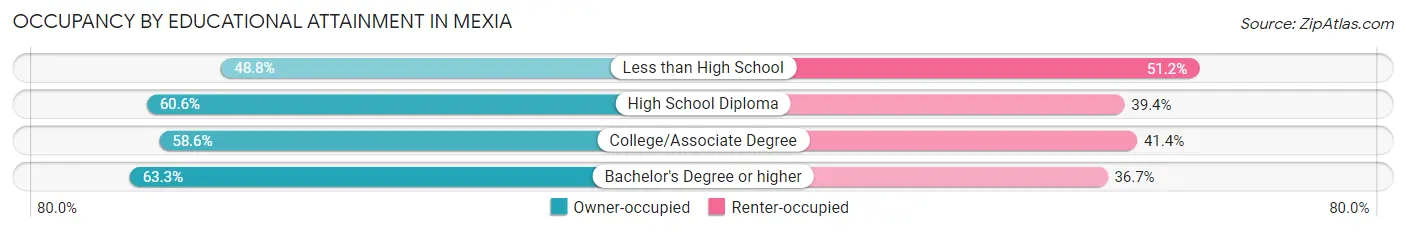
| Household Size | Owner-occupied | Renter-occupied |
| Less than High School | 223 (48.8%) | 234 (51.2%) |
| High School Diploma | 556 (60.6%) | 361 (39.4%) |
| College/Associate Degree | 455 (58.6%) | 321 (41.4%) |
| Bachelor's Degree or higher | 145 (63.3%) | 84 (36.7%) |
Occupancy by Age of Householder in Mexia
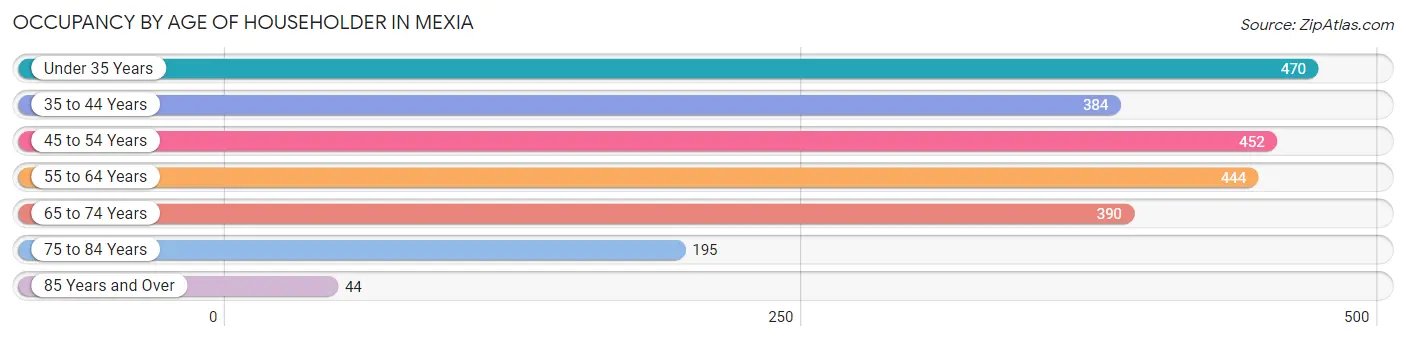
| Age Bracket | # Households | % Households |
| Under 35 Years | 470 | 19.8% |
| 35 to 44 Years | 384 | 16.1% |
| 45 to 54 Years | 452 | 19.0% |
| 55 to 64 Years | 444 | 18.7% |
| 65 to 74 Years | 390 | 16.4% |
| 75 to 84 Years | 195 | 8.2% |
| 85 Years and Over | 44 | 1.8% |
| Total | 2,379 | 100.0% |
Housing Finances in Mexia
Median Income by Occupancy in Mexia
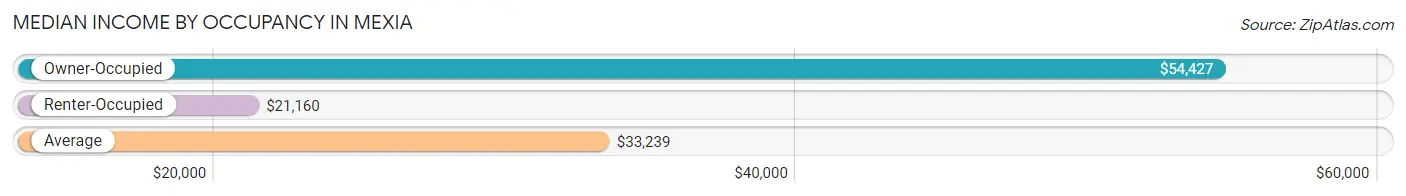
| Occupancy Type | # Households | Median Income |
| Owner-Occupied | 1,379 (58.0%) | $54,427 |
| Renter-Occupied | 1,000 (42.0%) | $21,160 |
| Average | 2,379 (100.0%) | $33,239 |
Occupancy by Householder Income Bracket in Mexia
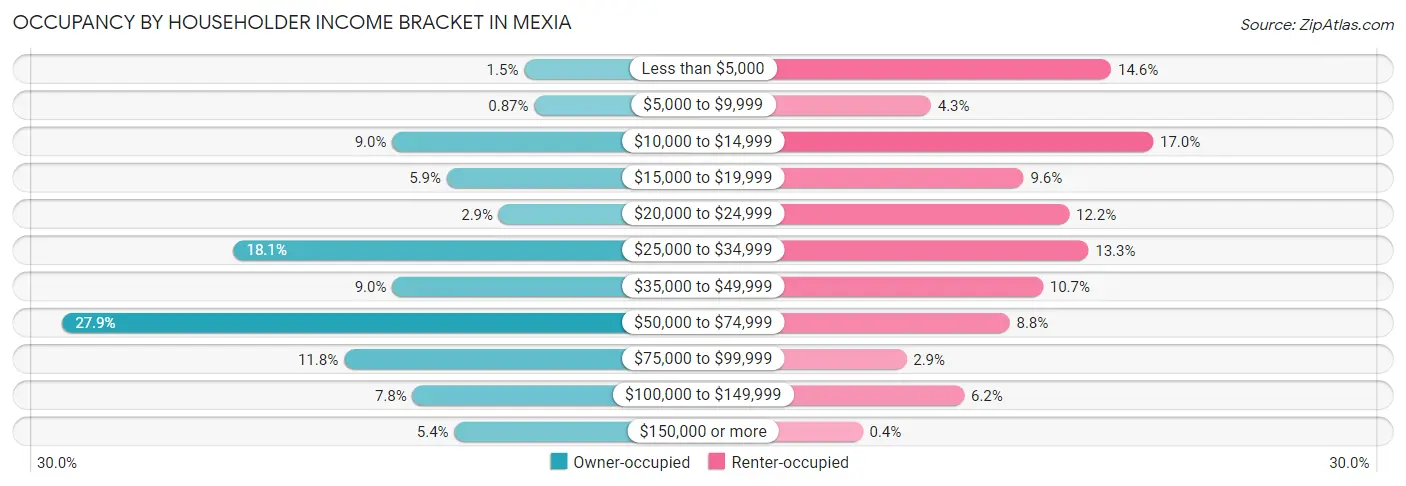
| Income Bracket | Owner-occupied | Renter-occupied |
| Less than $5,000 | 20 (1.5%) | 146 (14.6%) |
| $5,000 to $9,999 | 12 (0.9%) | 43 (4.3%) |
| $10,000 to $14,999 | 124 (9.0%) | 170 (17.0%) |
| $15,000 to $19,999 | 81 (5.9%) | 96 (9.6%) |
| $20,000 to $24,999 | 40 (2.9%) | 122 (12.2%) |
| $25,000 to $34,999 | 249 (18.1%) | 133 (13.3%) |
| $35,000 to $49,999 | 124 (9.0%) | 107 (10.7%) |
| $50,000 to $74,999 | 384 (27.9%) | 88 (8.8%) |
| $75,000 to $99,999 | 162 (11.7%) | 29 (2.9%) |
| $100,000 to $149,999 | 108 (7.8%) | 62 (6.2%) |
| $150,000 or more | 75 (5.4%) | 4 (0.4%) |
| Total | 1,379 (100.0%) | 1,000 (100.0%) |
Monthly Housing Cost Tiers in Mexia
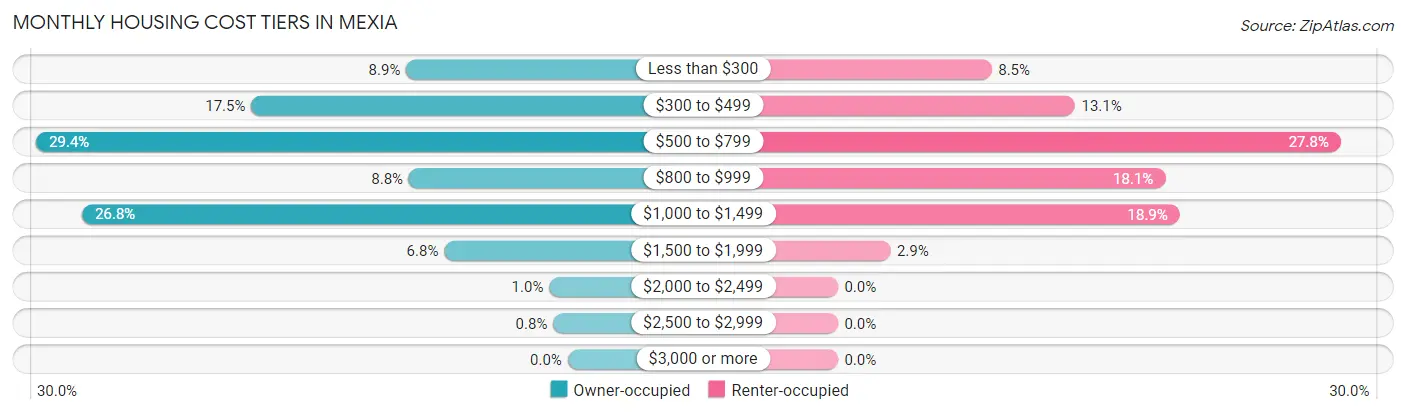
| Monthly Cost | Owner-occupied | Renter-occupied |
| Less than $300 | 123 (8.9%) | 85 (8.5%) |
| $300 to $499 | 241 (17.5%) | 131 (13.1%) |
| $500 to $799 | 405 (29.4%) | 278 (27.8%) |
| $800 to $999 | 121 (8.8%) | 181 (18.1%) |
| $1,000 to $1,499 | 370 (26.8%) | 189 (18.9%) |
| $1,500 to $1,999 | 94 (6.8%) | 29 (2.9%) |
| $2,000 to $2,499 | 14 (1.0%) | 0 (0.0%) |
| $2,500 to $2,999 | 11 (0.8%) | 0 (0.0%) |
| $3,000 or more | 0 (0.0%) | 0 (0.0%) |
| Total | 1,379 (100.0%) | 1,000 (100.0%) |
Physical Housing Characteristics in Mexia
Housing Structures in Mexia
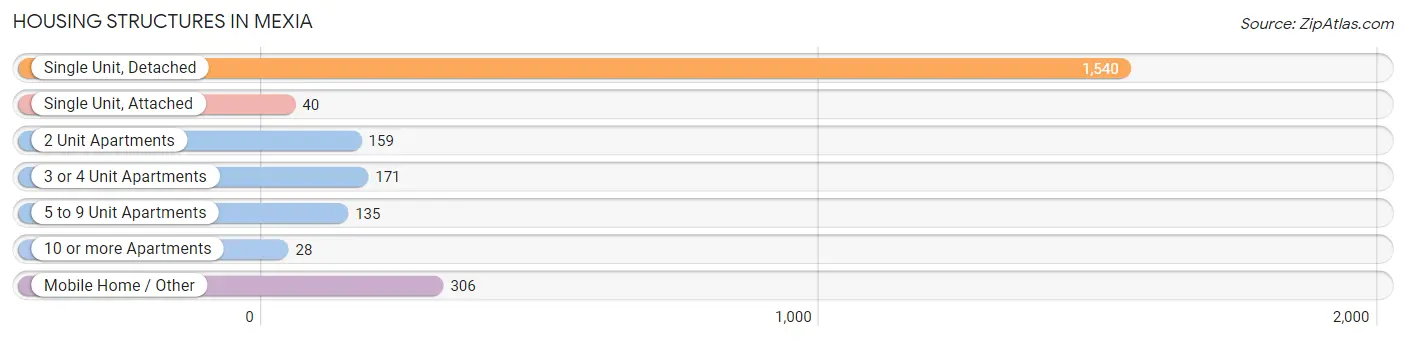
| Structure Type | # Housing Units | % Housing Units |
| Single Unit, Detached | 1,540 | 64.7% |
| Single Unit, Attached | 40 | 1.7% |
| 2 Unit Apartments | 159 | 6.7% |
| 3 or 4 Unit Apartments | 171 | 7.2% |
| 5 to 9 Unit Apartments | 135 | 5.7% |
| 10 or more Apartments | 28 | 1.2% |
| Mobile Home / Other | 306 | 12.9% |
| Total | 2,379 | 100.0% |
Housing Structures by Occupancy in Mexia
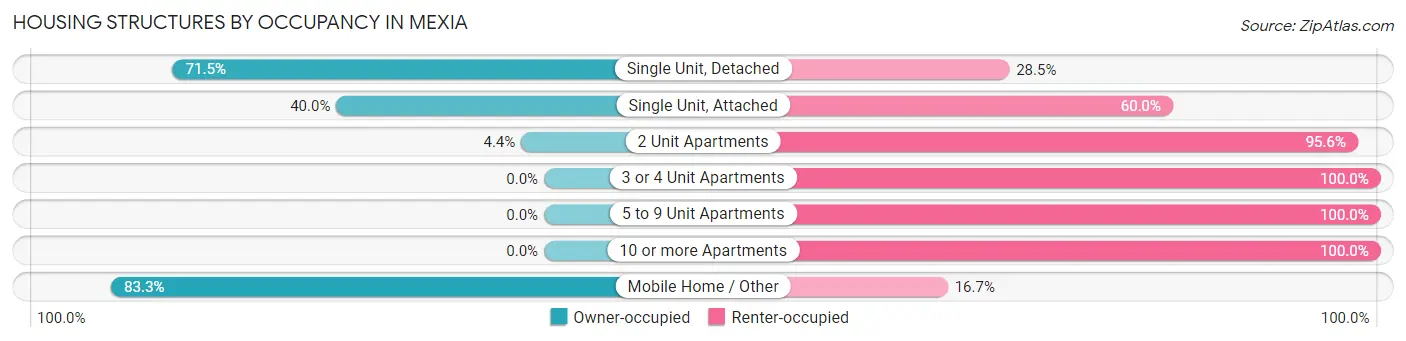
| Structure Type | Owner-occupied | Renter-occupied |
| Single Unit, Detached | 1,101 (71.5%) | 439 (28.5%) |
| Single Unit, Attached | 16 (40.0%) | 24 (60.0%) |
| 2 Unit Apartments | 7 (4.4%) | 152 (95.6%) |
| 3 or 4 Unit Apartments | 0 (0.0%) | 171 (100.0%) |
| 5 to 9 Unit Apartments | 0 (0.0%) | 135 (100.0%) |
| 10 or more Apartments | 0 (0.0%) | 28 (100.0%) |
| Mobile Home / Other | 255 (83.3%) | 51 (16.7%) |
| Total | 1,379 (58.0%) | 1,000 (42.0%) |
Housing Structures by Number of Rooms in Mexia
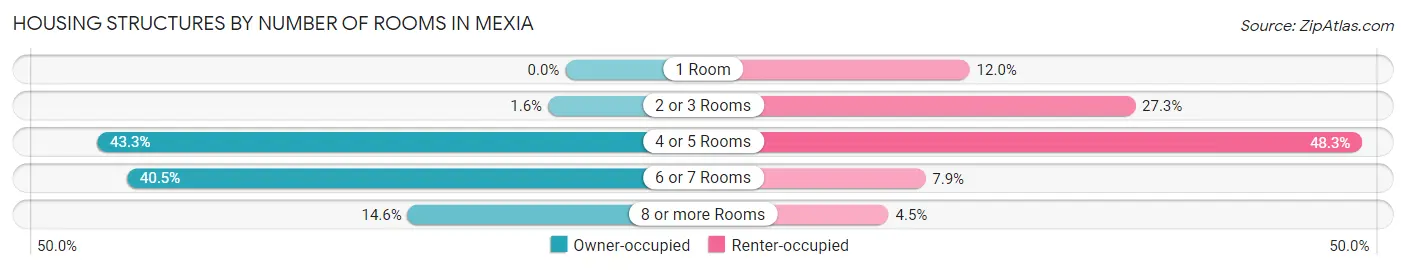
| Number of Rooms | Owner-occupied | Renter-occupied |
| 1 Room | 0 (0.0%) | 120 (12.0%) |
| 2 or 3 Rooms | 22 (1.6%) | 273 (27.3%) |
| 4 or 5 Rooms | 597 (43.3%) | 483 (48.3%) |
| 6 or 7 Rooms | 559 (40.5%) | 79 (7.9%) |
| 8 or more Rooms | 201 (14.6%) | 45 (4.5%) |
| Total | 1,379 (100.0%) | 1,000 (100.0%) |
Housing Structure by Heating Type in Mexia
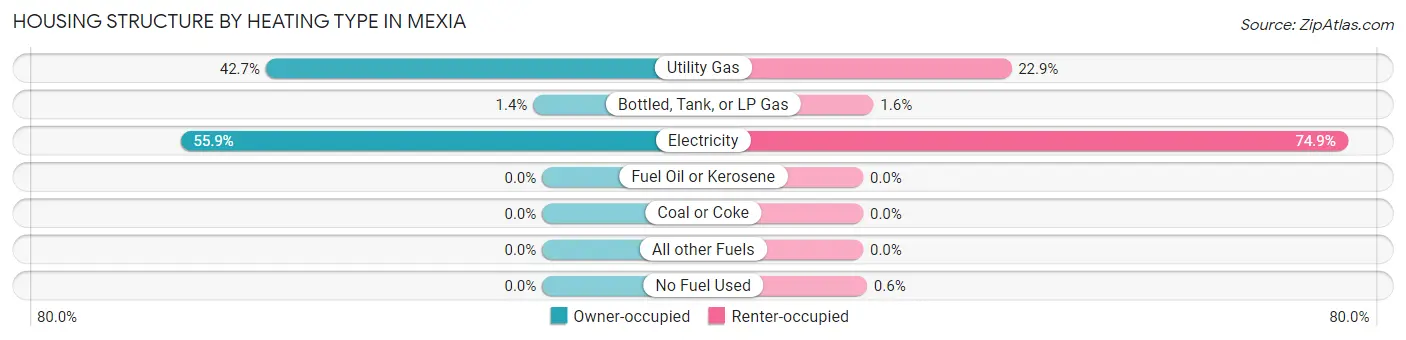
| Heating Type | Owner-occupied | Renter-occupied |
| Utility Gas | 589 (42.7%) | 229 (22.9%) |
| Bottled, Tank, or LP Gas | 19 (1.4%) | 16 (1.6%) |
| Electricity | 771 (55.9%) | 749 (74.9%) |
| Fuel Oil or Kerosene | 0 (0.0%) | 0 (0.0%) |
| Coal or Coke | 0 (0.0%) | 0 (0.0%) |
| All other Fuels | 0 (0.0%) | 0 (0.0%) |
| No Fuel Used | 0 (0.0%) | 6 (0.6%) |
| Total | 1,379 (100.0%) | 1,000 (100.0%) |
Household Vehicle Usage in Mexia
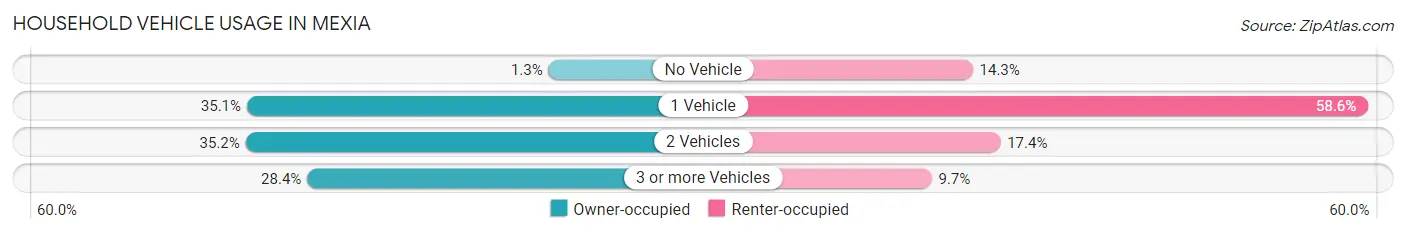
| Vehicles per Household | Owner-occupied | Renter-occupied |
| No Vehicle | 18 (1.3%) | 143 (14.3%) |
| 1 Vehicle | 484 (35.1%) | 586 (58.6%) |
| 2 Vehicles | 486 (35.2%) | 174 (17.4%) |
| 3 or more Vehicles | 391 (28.3%) | 97 (9.7%) |
| Total | 1,379 (100.0%) | 1,000 (100.0%) |
Real Estate & Mortgages in Mexia
Real Estate and Mortgage Overview in Mexia
| Characteristic | Without Mortgage | With Mortgage |
| Housing Units | 825 | 554 |
| Median Property Value | $83,700 | $87,100 |
| Median Household Income | $51,012 | $19 |
| Monthly Housing Costs | $551 | $0 |
| Real Estate Taxes | $1,496 | $39 |
Property Value by Mortgage Status in Mexia
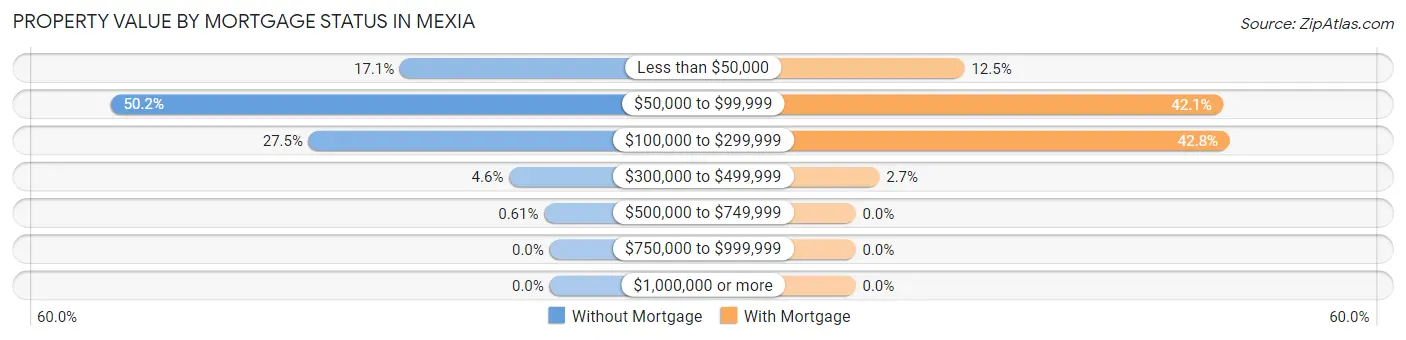
| Property Value | Without Mortgage | With Mortgage |
| Less than $50,000 | 141 (17.1%) | 69 (12.4%) |
| $50,000 to $99,999 | 414 (50.2%) | 233 (42.1%) |
| $100,000 to $299,999 | 227 (27.5%) | 237 (42.8%) |
| $300,000 to $499,999 | 38 (4.6%) | 15 (2.7%) |
| $500,000 to $749,999 | 5 (0.6%) | 0 (0.0%) |
| $750,000 to $999,999 | 0 (0.0%) | 0 (0.0%) |
| $1,000,000 or more | 0 (0.0%) | 0 (0.0%) |
| Total | 825 (100.0%) | 554 (100.0%) |
Household Income by Mortgage Status in Mexia
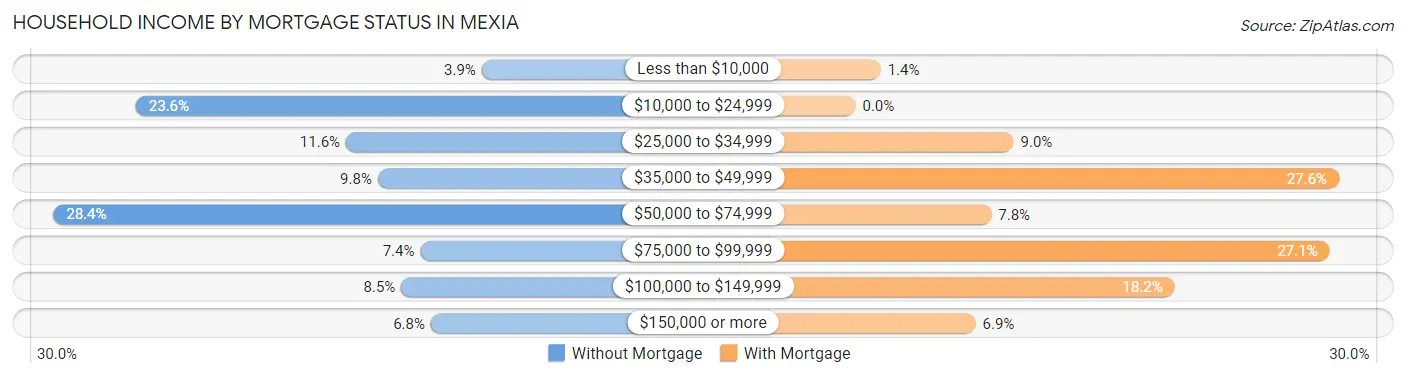
| Household Income | Without Mortgage | With Mortgage |
| Less than $10,000 | 32 (3.9%) | 8 (1.4%) |
| $10,000 to $24,999 | 195 (23.6%) | 0 (0.0%) |
| $25,000 to $34,999 | 96 (11.6%) | 50 (9.0%) |
| $35,000 to $49,999 | 81 (9.8%) | 153 (27.6%) |
| $50,000 to $74,999 | 234 (28.4%) | 43 (7.8%) |
| $75,000 to $99,999 | 61 (7.4%) | 150 (27.1%) |
| $100,000 to $149,999 | 70 (8.5%) | 101 (18.2%) |
| $150,000 or more | 56 (6.8%) | 38 (6.9%) |
| Total | 825 (100.0%) | 554 (100.0%) |
Property Value to Household Income Ratio in Mexia
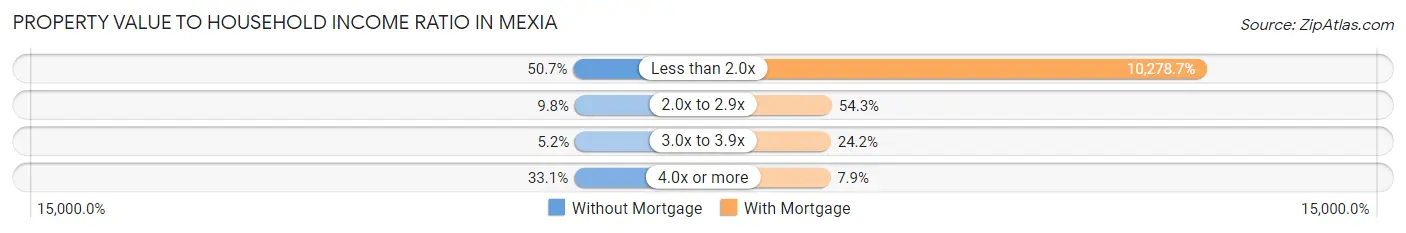
| Value-to-Income Ratio | Without Mortgage | With Mortgage |
| Less than 2.0x | 418 (50.7%) | 56,944 (10,278.7%) |
| 2.0x to 2.9x | 81 (9.8%) | 301 (54.3%) |
| 3.0x to 3.9x | 43 (5.2%) | 134 (24.2%) |
| 4.0x or more | 273 (33.1%) | 44 (7.9%) |
| Total | 825 (100.0%) | 554 (100.0%) |
Real Estate Taxes by Mortgage Status in Mexia
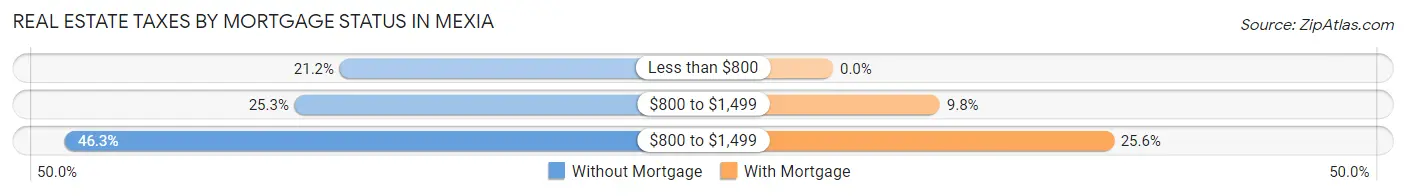
| Property Taxes | Without Mortgage | With Mortgage |
| Less than $800 | 175 (21.2%) | 0 (0.0%) |
| $800 to $1,499 | 209 (25.3%) | 54 (9.8%) |
| $800 to $1,499 | 382 (46.3%) | 142 (25.6%) |
| Total | 825 (100.0%) | 554 (100.0%) |
Health & Disability in Mexia
Health Insurance Coverage by Age in Mexia
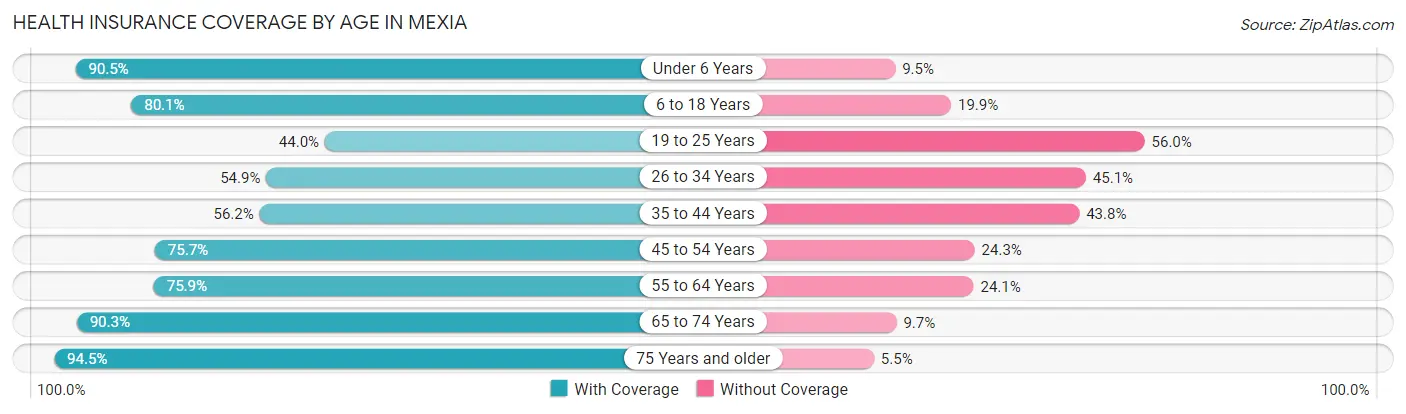
| Age Bracket | With Coverage | Without Coverage |
| Under 6 Years | 563 (90.5%) | 59 (9.5%) |
| 6 to 18 Years | 925 (80.1%) | 230 (19.9%) |
| 19 to 25 Years | 297 (44.0%) | 378 (56.0%) |
| 26 to 34 Years | 423 (54.9%) | 347 (45.1%) |
| 35 to 44 Years | 440 (56.2%) | 343 (43.8%) |
| 45 to 54 Years | 632 (75.7%) | 203 (24.3%) |
| 55 to 64 Years | 652 (75.9%) | 207 (24.1%) |
| 65 to 74 Years | 473 (90.3%) | 51 (9.7%) |
| 75 Years and older | 325 (94.5%) | 19 (5.5%) |
| Total | 4,730 (72.0%) | 1,837 (28.0%) |
Health Insurance Coverage by Citizenship Status in Mexia
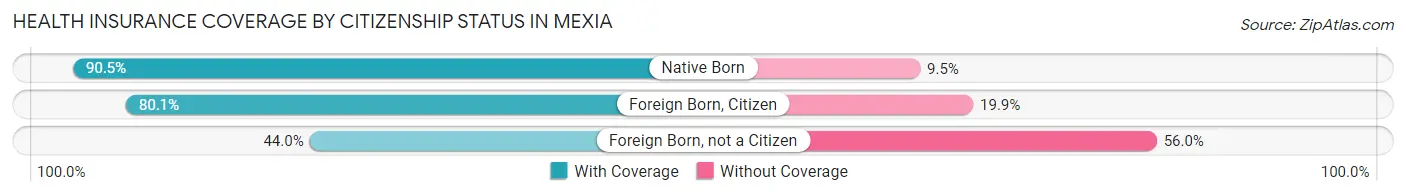
| Citizenship Status | With Coverage | Without Coverage |
| Native Born | 563 (90.5%) | 59 (9.5%) |
| Foreign Born, Citizen | 925 (80.1%) | 230 (19.9%) |
| Foreign Born, not a Citizen | 297 (44.0%) | 378 (56.0%) |
Health Insurance Coverage by Household Income in Mexia
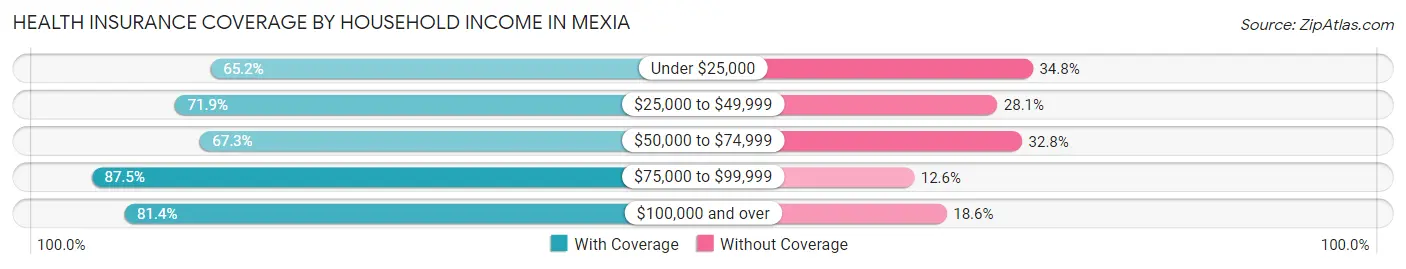
| Household Income | With Coverage | Without Coverage |
| Under $25,000 | 1,256 (65.2%) | 670 (34.8%) |
| $25,000 to $49,999 | 1,058 (71.9%) | 414 (28.1%) |
| $50,000 to $74,999 | 930 (67.2%) | 453 (32.8%) |
| $75,000 to $99,999 | 627 (87.5%) | 90 (12.6%) |
| $100,000 and over | 742 (81.4%) | 170 (18.6%) |
Public vs Private Health Insurance Coverage by Age in Mexia
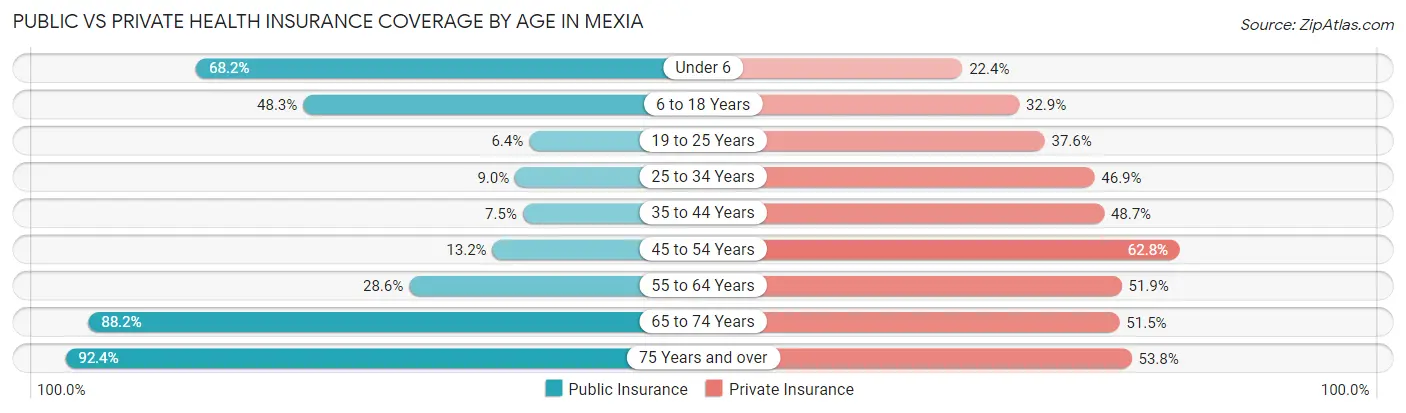
| Age Bracket | Public Insurance | Private Insurance |
| Under 6 | 424 (68.2%) | 139 (22.4%) |
| 6 to 18 Years | 558 (48.3%) | 380 (32.9%) |
| 19 to 25 Years | 43 (6.4%) | 254 (37.6%) |
| 25 to 34 Years | 69 (9.0%) | 361 (46.9%) |
| 35 to 44 Years | 59 (7.5%) | 381 (48.7%) |
| 45 to 54 Years | 110 (13.2%) | 524 (62.7%) |
| 55 to 64 Years | 246 (28.6%) | 446 (51.9%) |
| 65 to 74 Years | 462 (88.2%) | 270 (51.5%) |
| 75 Years and over | 318 (92.4%) | 185 (53.8%) |
| Total | 2,289 (34.9%) | 2,940 (44.8%) |
Disability Status by Sex by Age in Mexia
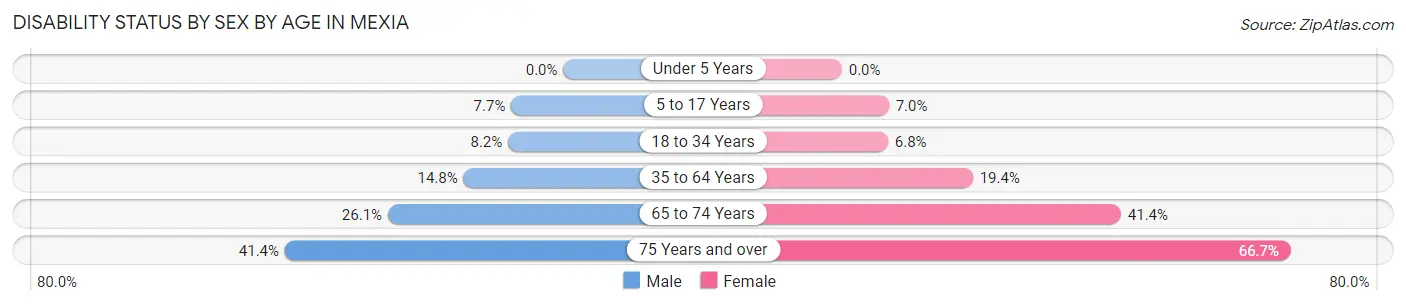
| Age Bracket | Male | Female |
| Under 5 Years | 0 (0.0%) | 0 (0.0%) |
| 5 to 17 Years | 49 (7.7%) | 41 (7.0%) |
| 18 to 34 Years | 71 (8.2%) | 46 (6.8%) |
| 35 to 64 Years | 159 (14.8%) | 273 (19.4%) |
| 65 to 74 Years | 68 (26.1%) | 109 (41.4%) |
| 75 Years and over | 43 (41.3%) | 160 (66.7%) |
Disability Class by Sex by Age in Mexia
Disability Class: Hearing Difficulty
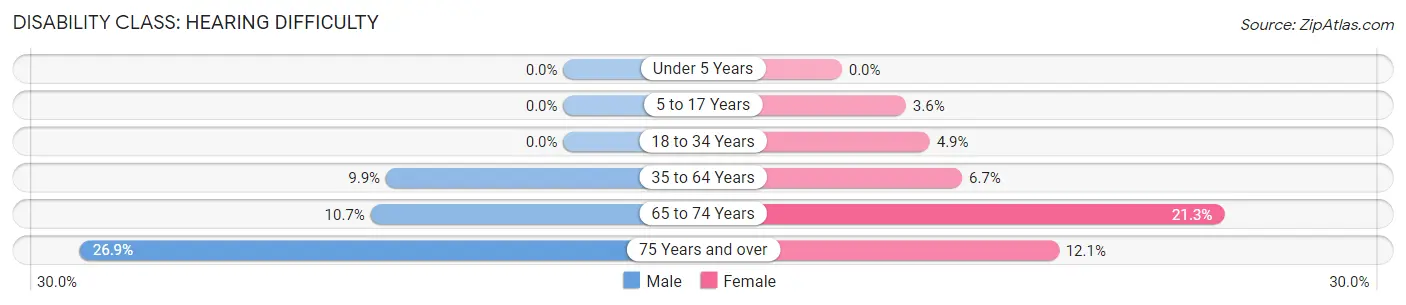
| Age Bracket | Male | Female |
| Under 5 Years | 0 (0.0%) | 0 (0.0%) |
| 5 to 17 Years | 0 (0.0%) | 21 (3.6%) |
| 18 to 34 Years | 0 (0.0%) | 33 (4.9%) |
| 35 to 64 Years | 106 (9.9%) | 94 (6.7%) |
| 65 to 74 Years | 28 (10.7%) | 56 (21.3%) |
| 75 Years and over | 28 (26.9%) | 29 (12.1%) |
Disability Class: Vision Difficulty
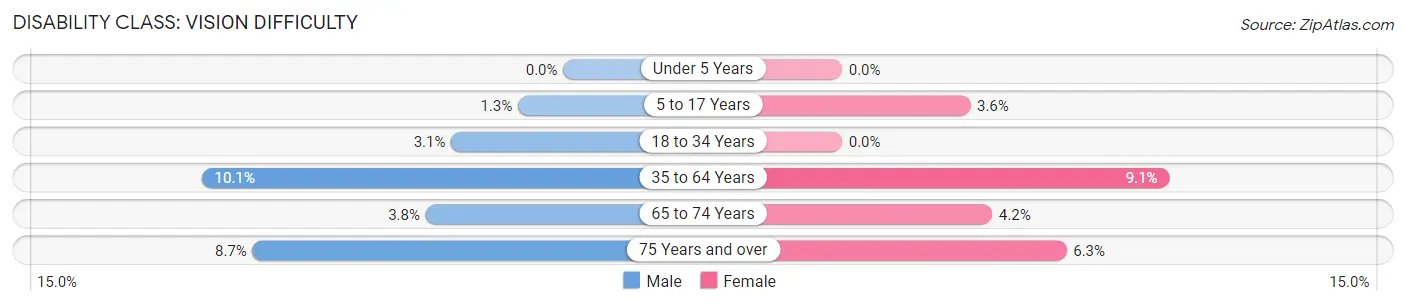
| Age Bracket | Male | Female |
| Under 5 Years | 0 (0.0%) | 0 (0.0%) |
| 5 to 17 Years | 8 (1.3%) | 21 (3.6%) |
| 18 to 34 Years | 27 (3.1%) | 0 (0.0%) |
| 35 to 64 Years | 108 (10.1%) | 128 (9.1%) |
| 65 to 74 Years | 10 (3.8%) | 11 (4.2%) |
| 75 Years and over | 9 (8.6%) | 15 (6.2%) |
Disability Class: Cognitive Difficulty
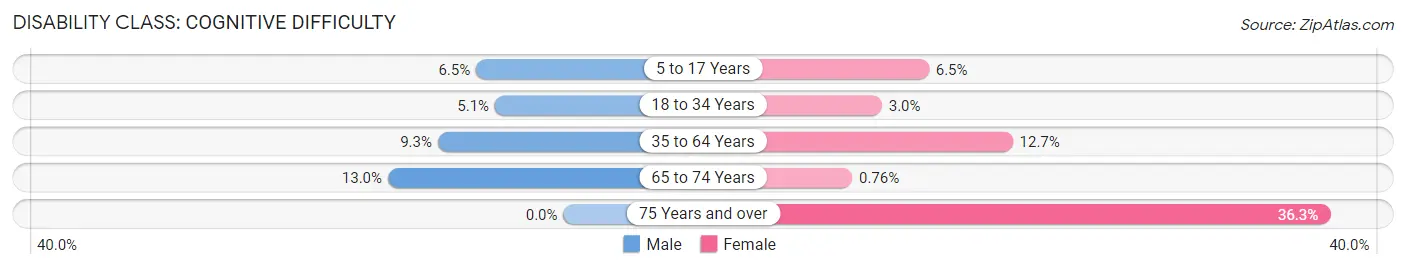
| Age Bracket | Male | Female |
| 5 to 17 Years | 41 (6.5%) | 38 (6.5%) |
| 18 to 34 Years | 44 (5.1%) | 20 (3.0%) |
| 35 to 64 Years | 100 (9.3%) | 178 (12.7%) |
| 65 to 74 Years | 34 (13.0%) | 2 (0.8%) |
| 75 Years and over | 0 (0.0%) | 87 (36.2%) |
Disability Class: Ambulatory Difficulty
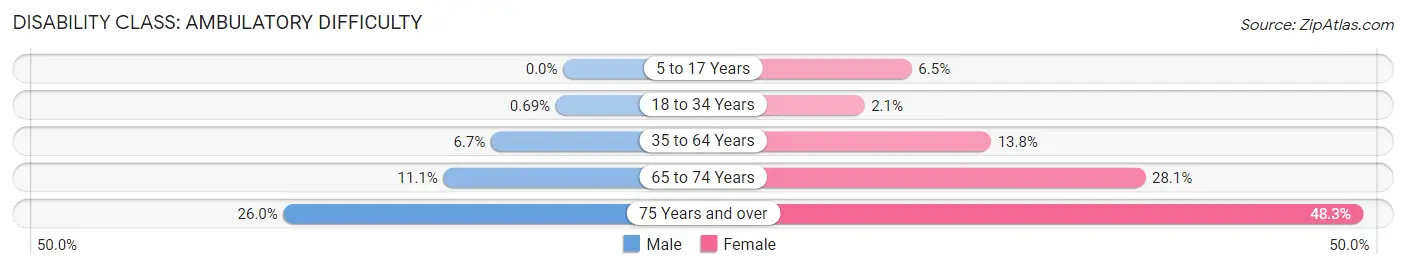
| Age Bracket | Male | Female |
| 5 to 17 Years | 0 (0.0%) | 38 (6.5%) |
| 18 to 34 Years | 6 (0.7%) | 14 (2.1%) |
| 35 to 64 Years | 72 (6.7%) | 194 (13.8%) |
| 65 to 74 Years | 29 (11.1%) | 74 (28.1%) |
| 75 Years and over | 27 (26.0%) | 116 (48.3%) |
Disability Class: Self-Care Difficulty
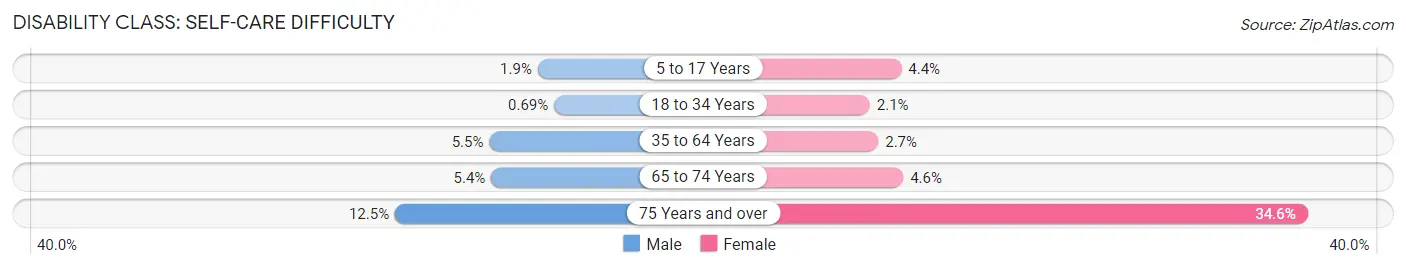
| Age Bracket | Male | Female |
| 5 to 17 Years | 12 (1.9%) | 26 (4.4%) |
| 18 to 34 Years | 6 (0.7%) | 14 (2.1%) |
| 35 to 64 Years | 59 (5.5%) | 38 (2.7%) |
| 65 to 74 Years | 14 (5.4%) | 12 (4.6%) |
| 75 Years and over | 13 (12.5%) | 83 (34.6%) |
Technology Access in Mexia
Computing Device Access in Mexia
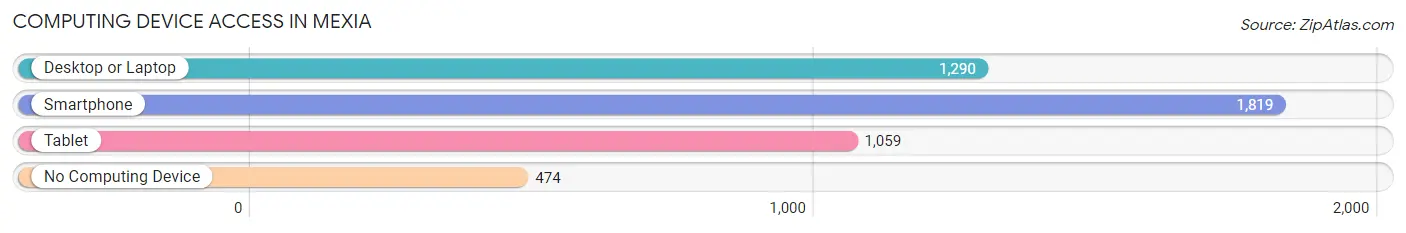
| Device Type | # Households | % Households |
| Desktop or Laptop | 1,290 | 54.2% |
| Smartphone | 1,819 | 76.5% |
| Tablet | 1,059 | 44.5% |
| No Computing Device | 474 | 19.9% |
| Total | 2,379 | 100.0% |
Internet Access in Mexia
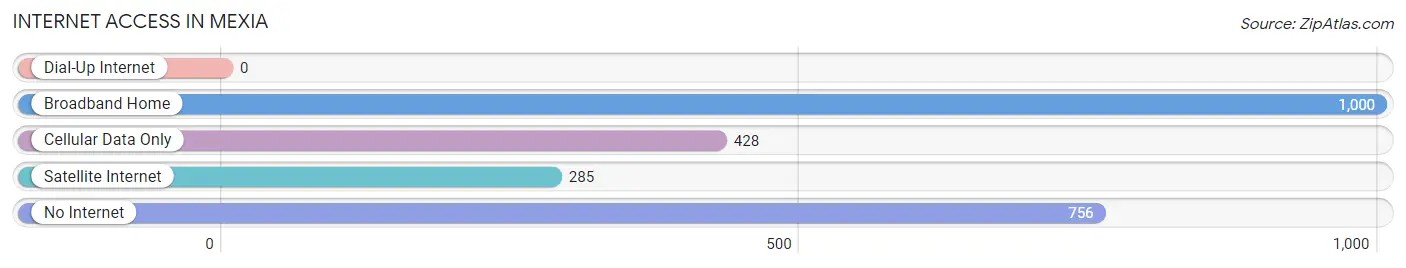
| Internet Type | # Households | % Households |
| Dial-Up Internet | 0 | 0.0% |
| Broadband Home | 1,000 | 42.0% |
| Cellular Data Only | 428 | 18.0% |
| Satellite Internet | 285 | 12.0% |
| No Internet | 756 | 31.8% |
| Total | 2,379 | 100.0% |
Mexia Summary
Mexia, Texas is a small city located in Limestone County, Texas, United States. It is situated approximately halfway between Dallas and Houston, and is part of the Waco Metropolitan Statistical Area. The city has a population of approximately 8,000 people, and is the county seat of Limestone County.
History
Mexia was founded in 1871 by a group of settlers from Mexico, who named the town after their homeland. The town was originally known as “Mexican Town”, but the name was changed to Mexia in 1873. The town was incorporated in 1875, and the first mayor was elected in 1876.
In the late 19th century, Mexia was a thriving agricultural center, with cotton, corn, and wheat being the main crops. The town also had a thriving lumber industry, and was home to several sawmills.
In the early 20th century, Mexia was a major oil-producing center, and the town was home to several oil refineries. The oil industry brought a great deal of wealth to the town, and many of the town’s buildings were constructed during this period.
Geography
Mexia is located in Limestone County, Texas, approximately halfway between Dallas and Houston. The city is situated at the intersection of U.S. Highway 84 and State Highway 14. The city is located in the Central Plains region of Texas, and is surrounded by rolling hills and prairies.
The climate in Mexia is generally mild, with hot summers and mild winters. The average annual temperature is around 68°F (20°C). The average annual precipitation is around 37 inches (94 cm).
Economy
The economy of Mexia is largely based on agriculture and oil production. The town is home to several large farms, and the main crops grown in the area are cotton, corn, and wheat. The town is also home to several oil refineries, and the oil industry is a major contributor to the local economy.
In addition to agriculture and oil production, Mexia is home to several manufacturing companies, including a plastics factory and a furniture factory. The town is also home to several retail stores, restaurants, and other businesses.
Demographics
As of the 2010 census, the population of Mexia was 8,059. The racial makeup of the city was 75.3% White, 17.2% Hispanic or Latino, 8.2% African American, 0.7% Native American, 0.3% Asian, and 0.2% Pacific Islander.
The median household income in Mexia was $31,945, and the median family income was $37,917. The per capita income was $17,845. The poverty rate was 22.3%.
Conclusion
Mexia, Texas is a small city located in Limestone County, Texas, United States. It is situated approximately halfway between Dallas and Houston, and is part of the Waco Metropolitan Statistical Area. The city has a population of approximately 8,000 people, and is the county seat of Limestone County. The economy of Mexia is largely based on agriculture and oil production, and the town is home to several large farms, oil refineries, and manufacturing companies. The racial makeup of the city is 75.3% White, 17.2% Hispanic or Latino, 8.2% African American, 0.7% Native American, 0.3% Asian, and 0.2% Pacific Islander. The median household income in Mexia was $31,945, and the poverty rate was 22.3%.
Common Questions
What is Per Capita Income in Mexia?
Per Capita income in Mexia is $17,786.
What is the Median Family Income in Mexia?
Median Family Income in Mexia is $47,150.
What is the Median Household income in Mexia?
Median Household Income in Mexia is $33,239.
What is Income or Wage Gap in Mexia?
Income or Wage Gap in Mexia is 17.8%.
Women in Mexia earn 82.2 cents for every dollar earned by a man.
What is Inequality or Gini Index in Mexia?
Inequality or Gini Index in Mexia is 0.46.
What is the Total Population of Mexia?
Total Population of Mexia is 6,907.
What is the Total Male Population of Mexia?
Total Male Population of Mexia is 3,267.
What is the Total Female Population of Mexia?
Total Female Population of Mexia is 3,640.
What is the Ratio of Males per 100 Females in Mexia?
There are 89.75 Males per 100 Females in Mexia.
What is the Ratio of Females per 100 Males in Mexia?
There are 111.42 Females per 100 Males in Mexia.
What is the Median Population Age in Mexia?
Median Population Age in Mexia is 36.8 Years.
What is the Average Family Size in Mexia
Average Family Size in Mexia is 3.6 People.
What is the Average Household Size in Mexia
Average Household Size in Mexia is 2.7 People.
How Large is the Labor Force in Mexia?
There are 2,641 People in the Labor Forcein in Mexia.
What is the Percentage of People in the Labor Force in Mexia?
49.0% of People are in the Labor Force in Mexia.
What is the Unemployment Rate in Mexia?
Unemployment Rate in Mexia is 3.8%.