Sierra Madre, CA Map & Demographics
Sierra Madre Map
Sierra Madre Overview
$80,210
PER CAPITA INCOME
$175,230
AVG FAMILY INCOME
$128,056
AVG HOUSEHOLD INCOME
39.3%
WAGE / INCOME GAP [ % ]
60.7¢/ $1
WAGE / INCOME GAP [ $ ]
0.49
INEQUALITY / GINI INDEX
11,151
TOTAL POPULATION
5,280
MALE POPULATION
5,871
FEMALE POPULATION
89.93
MALES / 100 FEMALES
111.19
FEMALES / 100 MALES
46.6
MEDIAN AGE
3.0
AVG FAMILY SIZE
2.2
AVG HOUSEHOLD SIZE
6,347
LABOR FORCE [ PEOPLE ]
68.2%
PERCENT IN LABOR FORCE
3.2%
UNEMPLOYMENT RATE
Sierra Madre Zip Codes
Sierra Madre Area Codes
Income in Sierra Madre
Income Overview in Sierra Madre
Per Capita Income in Sierra Madre is $80,210, while median incomes of families and households are $175,230 and $128,056 respectively.
| Characteristic | Number | Measure |
| Per Capita Income | 11,151 | $80,210 |
| Median Family Income | 2,885 | $175,230 |
| Mean Family Income | 2,885 | $235,963 |
| Median Household Income | 5,018 | $128,056 |
| Mean Household Income | 5,018 | $176,474 |
| Income Deficit | 2,885 | $0 |
| Wage / Income Gap (%) | 11,151 | 39.31% |
| Wage / Income Gap ($) | 11,151 | 60.69¢ per $1 |
| Gini / Inequality Index | 11,151 | 0.49 |
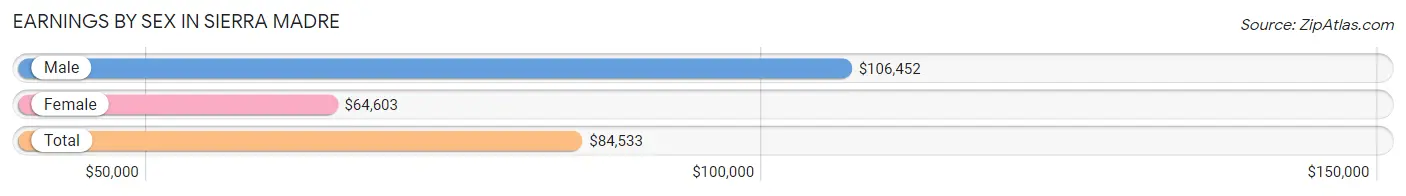
Earnings by Sex in Sierra Madre
Average Earnings in Sierra Madre are $84,533, $106,452 for men and $64,603 for women, a difference of 39.3%.
| Sex | Number | Average Earnings |
| Male | 3,433 (53.2%) | $106,452 |
| Female | 3,016 (46.8%) | $64,603 |
| Total | 6,449 (100.0%) | $84,533 |
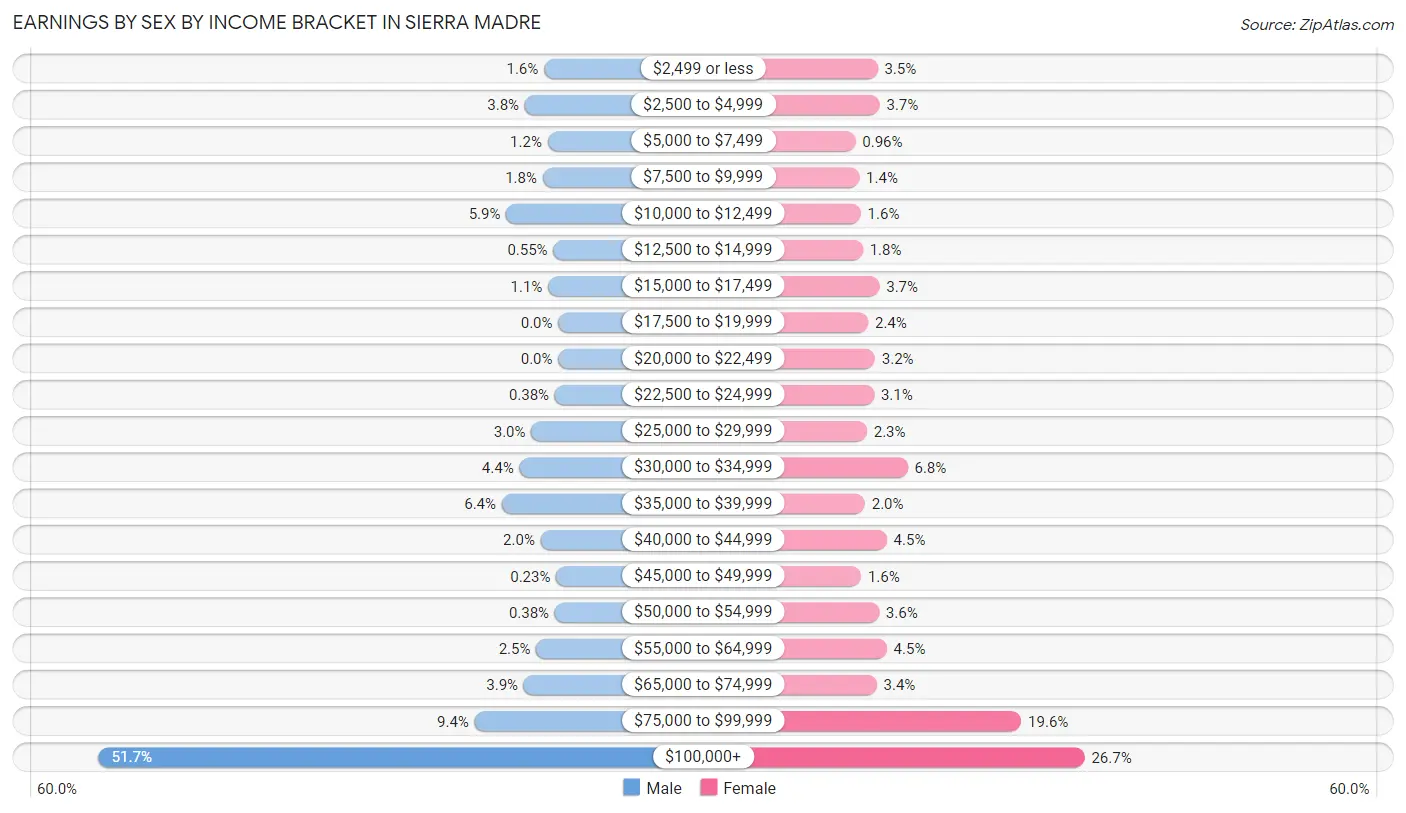
Earnings by Sex by Income Bracket in Sierra Madre
The most common earnings brackets in Sierra Madre are $100,000+ for men (1,774 | 51.7%) and $100,000+ for women (806 | 26.7%).
| Income | Male | Female |
| $2,499 or less | 55 (1.6%) | 104 (3.5%) |
| $2,500 to $4,999 | 129 (3.8%) | 111 (3.7%) |
| $5,000 to $7,499 | 41 (1.2%) | 29 (1.0%) |
| $7,500 to $9,999 | 60 (1.8%) | 42 (1.4%) |
| $10,000 to $12,499 | 201 (5.9%) | 47 (1.6%) |
| $12,500 to $14,999 | 19 (0.5%) | 54 (1.8%) |
| $15,000 to $17,499 | 39 (1.1%) | 110 (3.6%) |
| $17,500 to $19,999 | 0 (0.0%) | 72 (2.4%) |
| $20,000 to $22,499 | 0 (0.0%) | 95 (3.2%) |
| $22,500 to $24,999 | 13 (0.4%) | 92 (3.0%) |
| $25,000 to $29,999 | 104 (3.0%) | 68 (2.2%) |
| $30,000 to $34,999 | 150 (4.4%) | 206 (6.8%) |
| $35,000 to $39,999 | 218 (6.4%) | 61 (2.0%) |
| $40,000 to $44,999 | 68 (2.0%) | 135 (4.5%) |
| $45,000 to $49,999 | 8 (0.2%) | 48 (1.6%) |
| $50,000 to $54,999 | 13 (0.4%) | 109 (3.6%) |
| $55,000 to $64,999 | 85 (2.5%) | 135 (4.5%) |
| $65,000 to $74,999 | 133 (3.9%) | 101 (3.4%) |
| $75,000 to $99,999 | 323 (9.4%) | 591 (19.6%) |
| $100,000+ | 1,774 (51.7%) | 806 (26.7%) |
| Total | 3,433 (100.0%) | 3,016 (100.0%) |
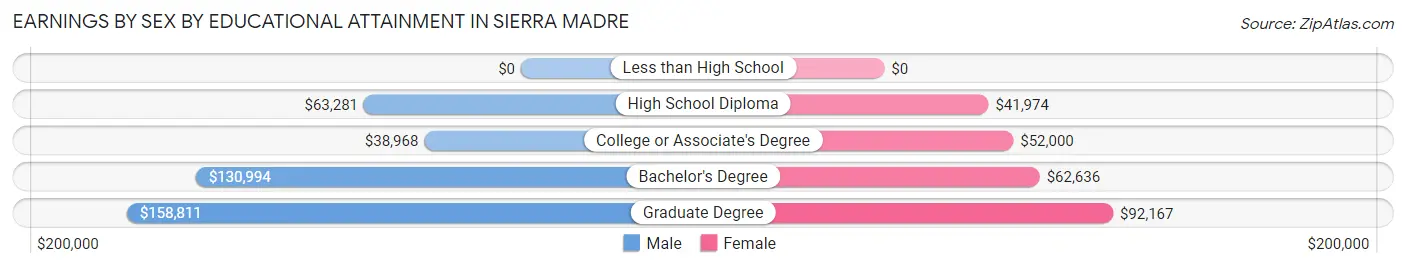
Earnings by Sex by Educational Attainment in Sierra Madre
Average earnings in Sierra Madre are $112,386 for men and $69,214 for women, a difference of 38.4%. Men with an educational attainment of graduate degree enjoy the highest average annual earnings of $158,811, while those with college or associate's degree education earn the least with $38,968. Women with an educational attainment of graduate degree earn the most with the average annual earnings of $92,167, while those with high school diploma education have the smallest earnings of $41,974.
| Educational Attainment | Male Income | Female Income |
| Less than High School | - | - |
| High School Diploma | $63,281 | $41,974 |
| College or Associate's Degree | $38,968 | $52,000 |
| Bachelor's Degree | $130,994 | $62,636 |
| Graduate Degree | $158,811 | $92,167 |
| Total | $112,386 | $69,214 |
Family Income in Sierra Madre
Family Income Brackets in Sierra Madre
According to the Sierra Madre family income data, there are 1,177 families falling into the $200,000+ income range, which is the most common income bracket and makes up 40.8% of all families.
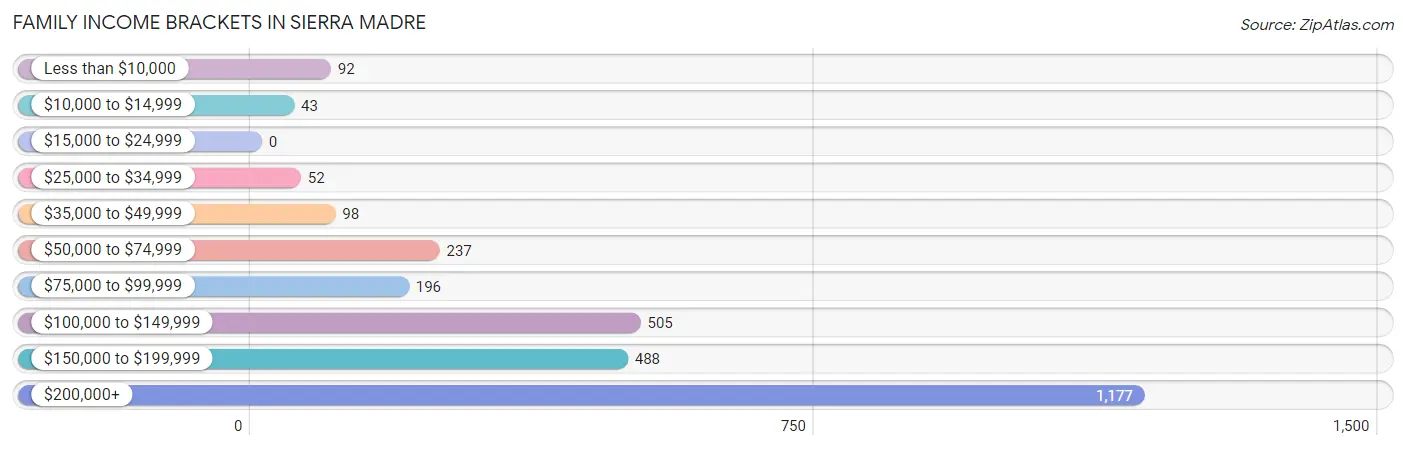
| Income Bracket | # Families | % Families |
| Less than $10,000 | 92 | 3.2% |
| $10,000 to $14,999 | 43 | 1.5% |
| $15,000 to $24,999 | 0 | 0.0% |
| $25,000 to $34,999 | 52 | 1.8% |
| $35,000 to $49,999 | 98 | 3.4% |
| $50,000 to $74,999 | 237 | 8.2% |
| $75,000 to $99,999 | 196 | 6.8% |
| $100,000 to $149,999 | 505 | 17.5% |
| $150,000 to $199,999 | 488 | 16.9% |
| $200,000+ | 1,177 | 40.8% |
Family Income by Famaliy Size in Sierra Madre
5-person families (122 | 4.2%) account for the highest median family income in Sierra Madre with $236,481 per family, while 2-person families (1,501 | 52.0%) have the highest median income of $76,493 per family member.
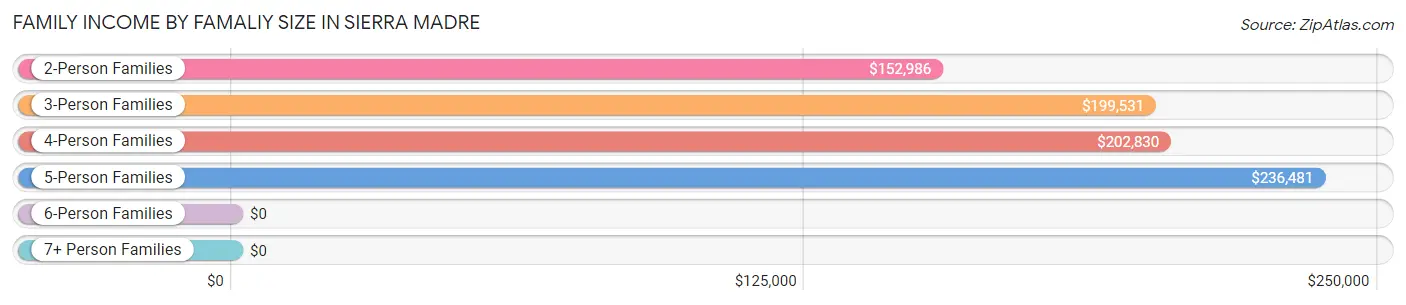
| Income Bracket | # Families | Median Income |
| 2-Person Families | 1,501 (52.0%) | $152,986 |
| 3-Person Families | 675 (23.4%) | $199,531 |
| 4-Person Families | 551 (19.1%) | $202,830 |
| 5-Person Families | 122 (4.2%) | $236,481 |
| 6-Person Families | 24 (0.8%) | $0 |
| 7+ Person Families | 12 (0.4%) | $0 |
| Total | 2,885 (100.0%) | $175,230 |
Family Income by Number of Earners in Sierra Madre
The median family income in Sierra Madre is $175,230, with families comprising 2 earners (1,324) having the highest median family income of $237,315, while families with no earners (369) have the lowest median family income of $51,533, accounting for 45.9% and 12.8% of families, respectively.
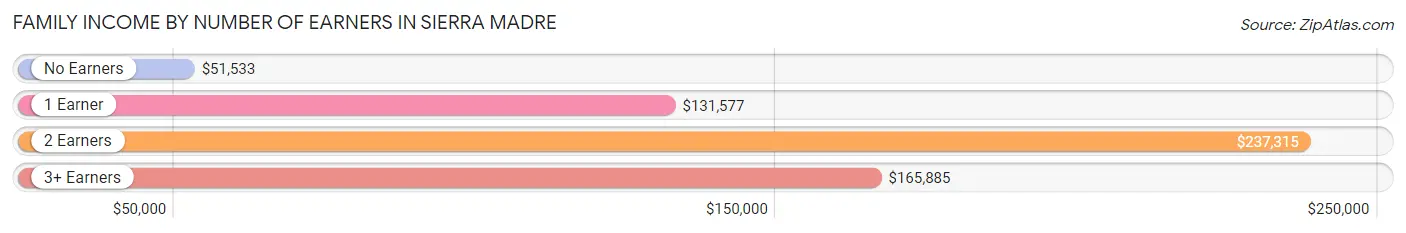
| Number of Earners | # Families | Median Income |
| No Earners | 369 (12.8%) | $51,533 |
| 1 Earner | 949 (32.9%) | $131,577 |
| 2 Earners | 1,324 (45.9%) | $237,315 |
| 3+ Earners | 243 (8.4%) | $165,885 |
| Total | 2,885 (100.0%) | $175,230 |
Household Income in Sierra Madre
Household Income Brackets in Sierra Madre
With 1,400 households falling in the category, the $200,000+ income range is the most frequent in Sierra Madre, accounting for 27.9% of all households. In contrast, only 125 households (2.5%) fall into the $10,000 to $14,999 income bracket, making it the least populous group.
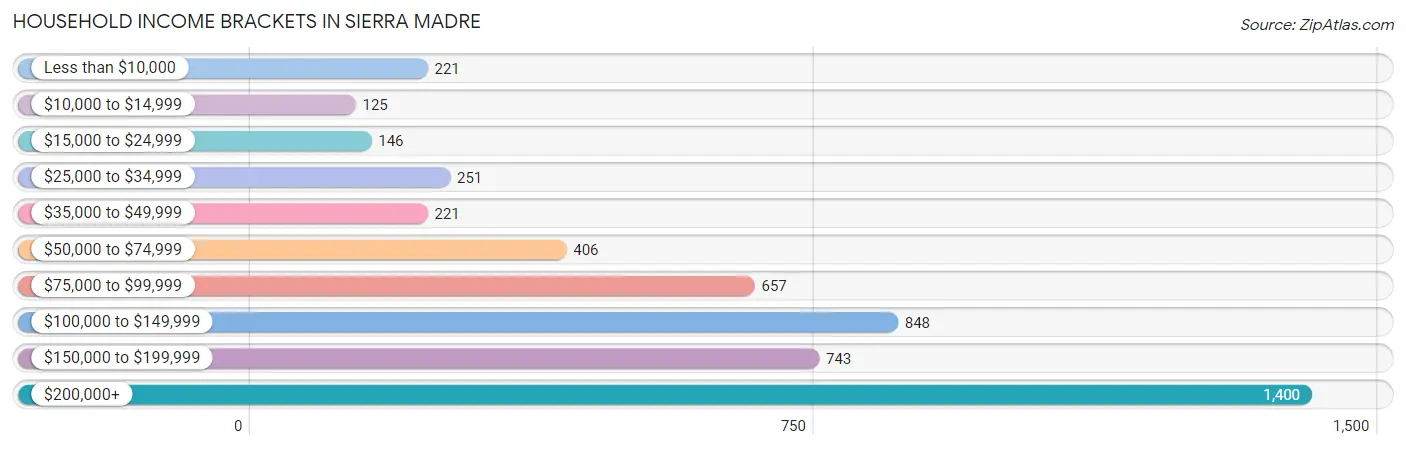
| Income Bracket | # Households | % Households |
| Less than $10,000 | 221 | 4.4% |
| $10,000 to $14,999 | 125 | 2.5% |
| $15,000 to $24,999 | 146 | 2.9% |
| $25,000 to $34,999 | 251 | 5.0% |
| $35,000 to $49,999 | 221 | 4.4% |
| $50,000 to $74,999 | 406 | 8.1% |
| $75,000 to $99,999 | 657 | 13.1% |
| $100,000 to $149,999 | 848 | 16.9% |
| $150,000 to $199,999 | 743 | 14.8% |
| $200,000+ | 1,400 | 27.9% |
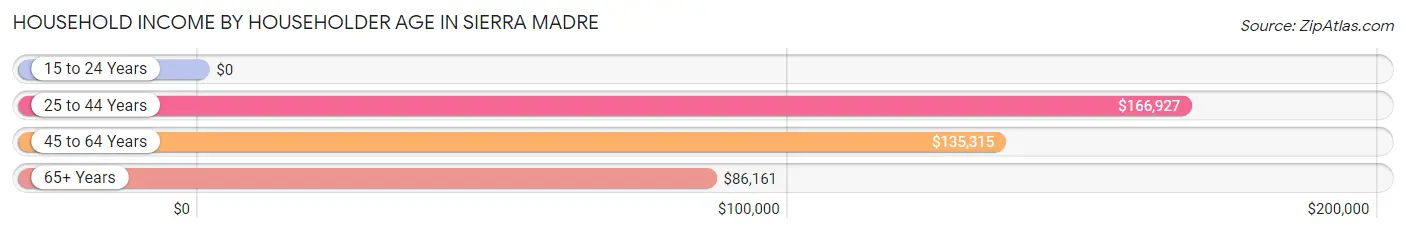
Household Income by Householder Age in Sierra Madre
The median household income in Sierra Madre is $128,056, with the highest median household income of $166,927 found in the 25 to 44 years age bracket for the primary householder. A total of 1,221 households (24.3%) fall into this category.
| Income Bracket | # Households | Median Income |
| 15 to 24 Years | 0 (0.0%) | $0 |
| 25 to 44 Years | 1,221 (24.3%) | $166,927 |
| 45 to 64 Years | 2,305 (45.9%) | $135,315 |
| 65+ Years | 1,492 (29.7%) | $86,161 |
| Total | 5,018 (100.0%) | $128,056 |
Poverty in Sierra Madre
Income Below Poverty by Sex and Age in Sierra Madre
With 7.2% poverty level for males and 5.2% for females among the residents of Sierra Madre, 15 year old males and 15 year old females are the most vulnerable to poverty, with 24 males (38.7%) and 14 females (31.8%) in their respective age groups living below the poverty level.
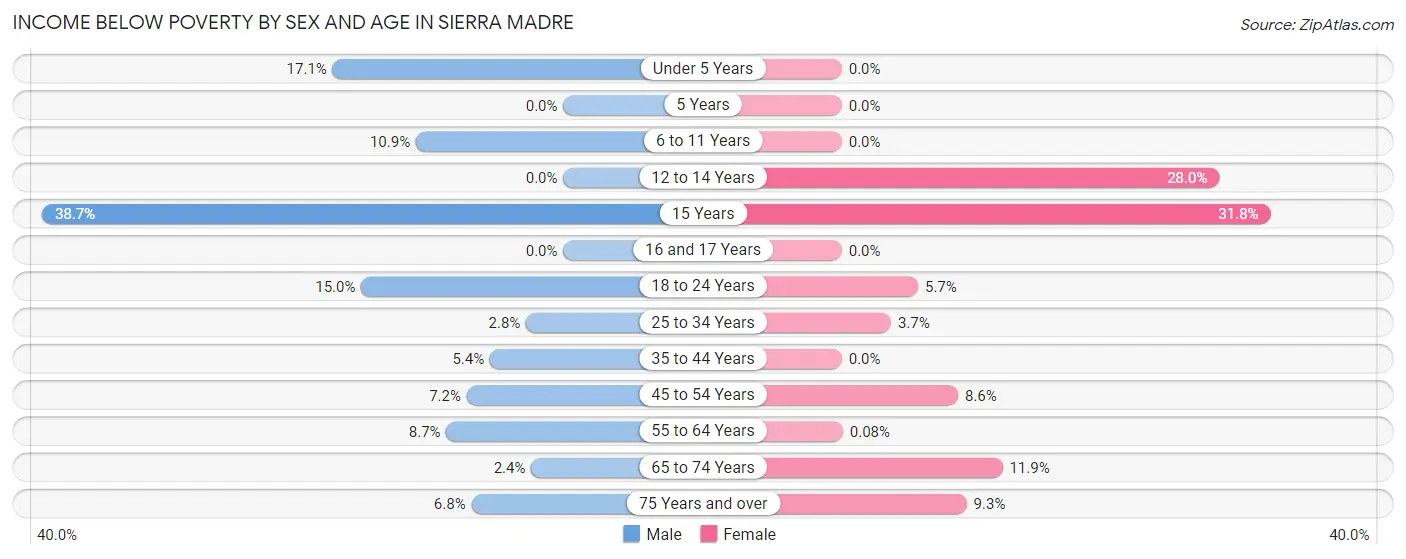
| Age Bracket | Male | Female |
| Under 5 Years | 55 (17.1%) | 0 (0.0%) |
| 5 Years | 0 (0.0%) | 0 (0.0%) |
| 6 to 11 Years | 35 (10.9%) | 0 (0.0%) |
| 12 to 14 Years | 0 (0.0%) | 51 (28.0%) |
| 15 Years | 24 (38.7%) | 14 (31.8%) |
| 16 and 17 Years | 0 (0.0%) | 0 (0.0%) |
| 18 to 24 Years | 33 (15.0%) | 9 (5.7%) |
| 25 to 34 Years | 21 (2.8%) | 19 (3.6%) |
| 35 to 44 Years | 41 (5.4%) | 0 (0.0%) |
| 45 to 54 Years | 48 (7.2%) | 67 (8.6%) |
| 55 to 64 Years | 78 (8.7%) | 1 (0.1%) |
| 65 to 74 Years | 12 (2.4%) | 84 (11.9%) |
| 75 Years and over | 30 (6.8%) | 62 (9.3%) |
| Total | 377 (7.2%) | 307 (5.2%) |
Income Above Poverty by Sex and Age in Sierra Madre
According to the poverty statistics in Sierra Madre, males aged 5 years and females aged under 5 years are the age groups that are most secure financially, with 100.0% of males and 100.0% of females in these age groups living above the poverty line.
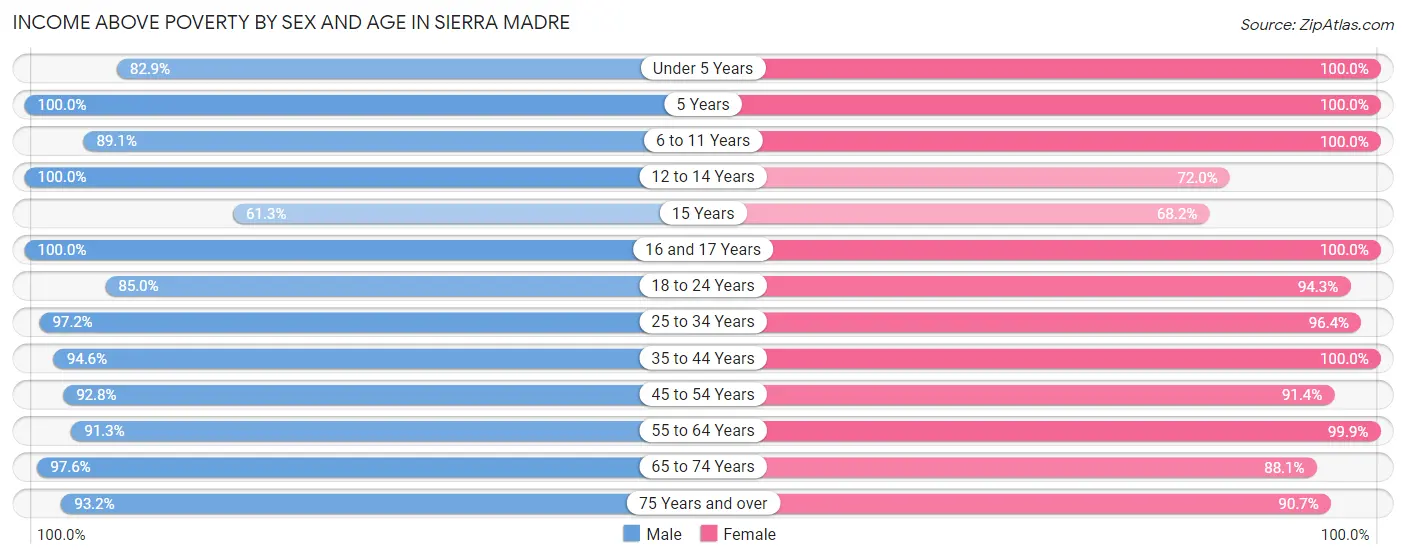
| Age Bracket | Male | Female |
| Under 5 Years | 266 (82.9%) | 209 (100.0%) |
| 5 Years | 33 (100.0%) | 96 (100.0%) |
| 6 to 11 Years | 285 (89.1%) | 396 (100.0%) |
| 12 to 14 Years | 169 (100.0%) | 131 (72.0%) |
| 15 Years | 38 (61.3%) | 30 (68.2%) |
| 16 and 17 Years | 115 (100.0%) | 73 (100.0%) |
| 18 to 24 Years | 187 (85.0%) | 150 (94.3%) |
| 25 to 34 Years | 740 (97.2%) | 501 (96.4%) |
| 35 to 44 Years | 712 (94.6%) | 796 (100.0%) |
| 45 to 54 Years | 621 (92.8%) | 709 (91.4%) |
| 55 to 64 Years | 821 (91.3%) | 1,232 (99.9%) |
| 65 to 74 Years | 493 (97.6%) | 620 (88.1%) |
| 75 Years and over | 410 (93.2%) | 607 (90.7%) |
| Total | 4,890 (92.8%) | 5,550 (94.8%) |
Income Below Poverty Among Married-Couple Families in Sierra Madre
The poverty statistics for married-couple families in Sierra Madre show that 2.1% or 47 of the total 2,237 families live below the poverty line. Families with 1 or 2 children have the highest poverty rate of 4.1%, comprising of 34 families. On the other hand, families with 3 or 4 children have the lowest poverty rate of 0.0%, which includes 0 families.
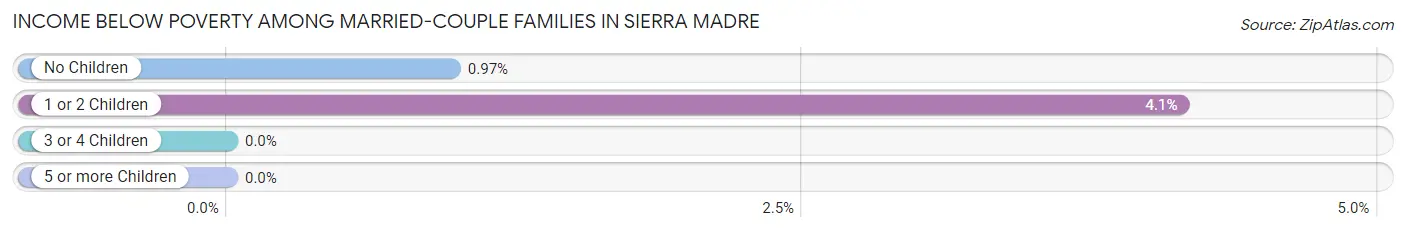
| Children | Above Poverty | Below Poverty |
| No Children | 1,333 (99.0%) | 13 (1.0%) |
| 1 or 2 Children | 787 (95.9%) | 34 (4.1%) |
| 3 or 4 Children | 70 (100.0%) | 0 (0.0%) |
| 5 or more Children | 0 (0.0%) | 0 (0.0%) |
| Total | 2,190 (97.9%) | 47 (2.1%) |
Income Below Poverty Among Single-Parent Households in Sierra Madre
According to the poverty data in Sierra Madre, 60.5% or 49 single-father households and 6.7% or 38 single-mother households are living below the poverty line. Among single-father households, those with 1 or 2 children have the highest poverty rate, with 35 households (79.5%) experiencing poverty. Likewise, among single-mother households, those with 1 or 2 children have the highest poverty rate, with 38 households (20.8%) falling below the poverty line.
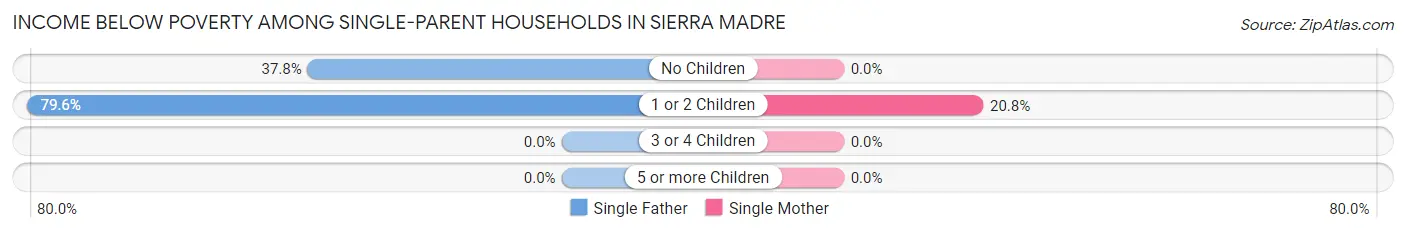
| Children | Single Father | Single Mother |
| No Children | 14 (37.8%) | 0 (0.0%) |
| 1 or 2 Children | 35 (79.5%) | 38 (20.8%) |
| 3 or 4 Children | 0 (0.0%) | 0 (0.0%) |
| 5 or more Children | 0 (0.0%) | 0 (0.0%) |
| Total | 49 (60.5%) | 38 (6.7%) |
Income Below Poverty Among Married-Couple vs Single-Parent Households in Sierra Madre
The poverty data for Sierra Madre shows that 47 of the married-couple family households (2.1%) and 87 of the single-parent households (13.4%) are living below the poverty level. Within the married-couple family households, those with 1 or 2 children have the highest poverty rate, with 34 households (4.1%) falling below the poverty line. Among the single-parent households, those with 1 or 2 children have the highest poverty rate, with 73 household (32.2%) living below poverty.
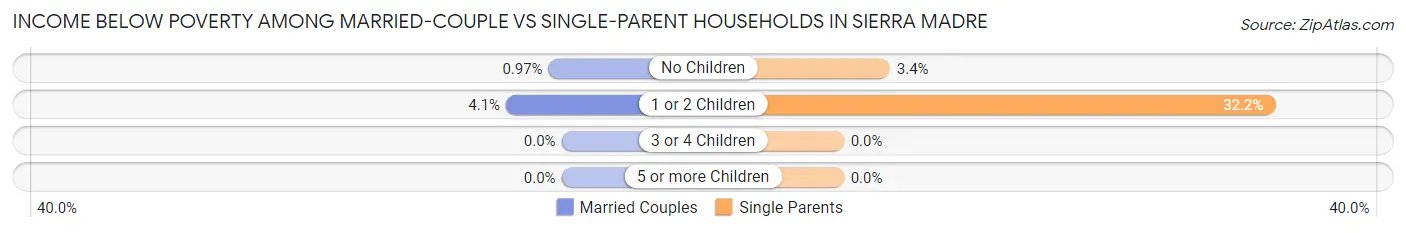
| Children | Married-Couple Families | Single-Parent Households |
| No Children | 13 (1.0%) | 14 (3.4%) |
| 1 or 2 Children | 34 (4.1%) | 73 (32.2%) |
| 3 or 4 Children | 0 (0.0%) | 0 (0.0%) |
| 5 or more Children | 0 (0.0%) | 0 (0.0%) |
| Total | 47 (2.1%) | 87 (13.4%) |
Race in Sierra Madre
The most populous races in Sierra Madre are White / Caucasian (7,500 | 67.3%), Asian (2,049 | 18.4%), and Hispanic or Latino (1,683 | 15.1%).
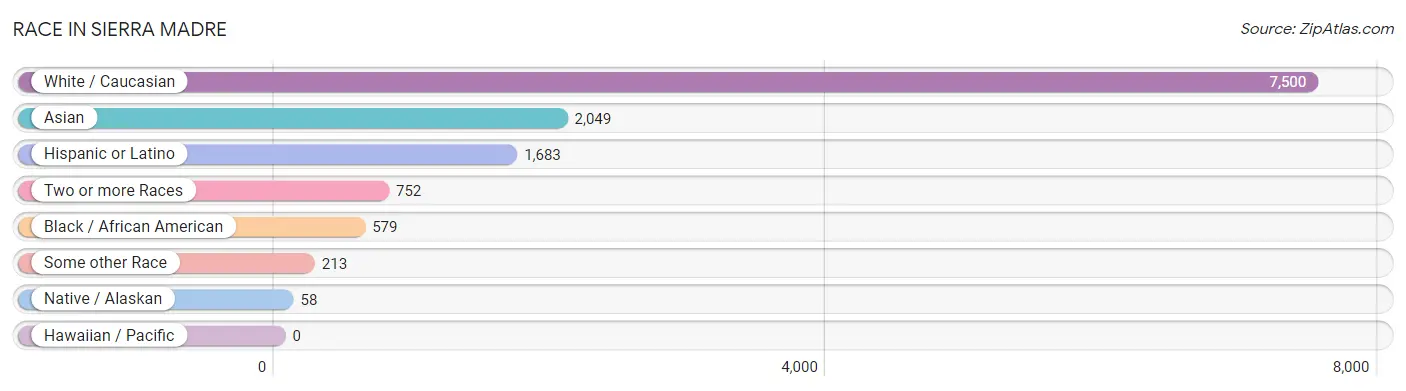
| Race | # Population | % Population |
| Asian | 2,049 | 18.4% |
| Black / African American | 579 | 5.2% |
| Hawaiian / Pacific | 0 | 0.0% |
| Hispanic or Latino | 1,683 | 15.1% |
| Native / Alaskan | 58 | 0.5% |
| White / Caucasian | 7,500 | 67.3% |
| Two or more Races | 752 | 6.7% |
| Some other Race | 213 | 1.9% |
| Total | 11,151 | 100.0% |
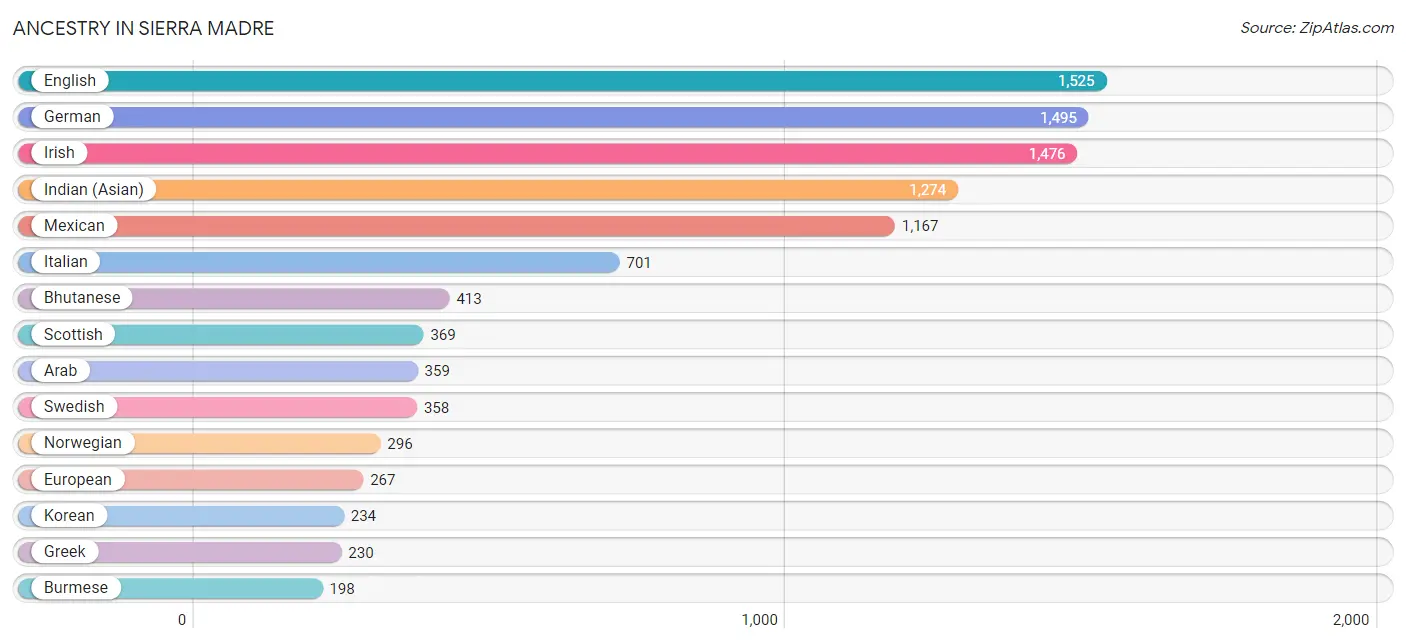
Ancestry in Sierra Madre
The most populous ancestries reported in Sierra Madre are English (1,525 | 13.7%), German (1,495 | 13.4%), Irish (1,476 | 13.2%), Indian (Asian) (1,274 | 11.4%), and Mexican (1,167 | 10.5%), together accounting for 62.2% of all Sierra Madre residents.
| Ancestry | # Population | % Population |
| American | 191 | 1.7% |
| Arab | 359 | 3.2% |
| Armenian | 190 | 1.7% |
| Austrian | 27 | 0.2% |
| Belizean | 35 | 0.3% |
| Bhutanese | 413 | 3.7% |
| British | 103 | 0.9% |
| Bulgarian | 21 | 0.2% |
| Burmese | 198 | 1.8% |
| Cajun | 23 | 0.2% |
| Canadian | 78 | 0.7% |
| Central American | 65 | 0.6% |
| Central American Indian | 10 | 0.1% |
| Cherokee | 40 | 0.4% |
| Chilean | 58 | 0.5% |
| Chippewa | 19 | 0.2% |
| Colombian | 39 | 0.4% |
| Costa Rican | 12 | 0.1% |
| Croatian | 54 | 0.5% |
| Czech | 8 | 0.1% |
| Danish | 10 | 0.1% |
| Dutch | 46 | 0.4% |
| Eastern European | 34 | 0.3% |
| Ecuadorian | 35 | 0.3% |
| Egyptian | 141 | 1.3% |
| English | 1,525 | 13.7% |
| European | 267 | 2.4% |
| Filipino | 197 | 1.8% |
| Finnish | 39 | 0.4% |
| French | 67 | 0.6% |
| French Canadian | 40 | 0.4% |
| German | 1,495 | 13.4% |
| Greek | 230 | 2.1% |
| Guatemalan | 14 | 0.1% |
| Hungarian | 53 | 0.5% |
| Indian (Asian) | 1,274 | 11.4% |
| Iranian | 7 | 0.1% |
| Iraqi | 136 | 1.2% |
| Irish | 1,476 | 13.2% |
| Italian | 701 | 6.3% |
| Korean | 234 | 2.1% |
| Lebanese | 24 | 0.2% |
| Lithuanian | 27 | 0.2% |
| Mexican | 1,167 | 10.5% |
| Northern European | 42 | 0.4% |
| Norwegian | 296 | 2.6% |
| Pakistani | 21 | 0.2% |
| Palestinian | 187 | 1.7% |
| Paraguayan | 10 | 0.1% |
| Polish | 141 | 1.3% |
| Portuguese | 165 | 1.5% |
| Pueblo | 19 | 0.2% |
| Puerto Rican | 179 | 1.6% |
| Romanian | 67 | 0.6% |
| Russian | 94 | 0.8% |
| Salvadoran | 39 | 0.4% |
| Scandinavian | 36 | 0.3% |
| Scotch-Irish | 88 | 0.8% |
| Scottish | 369 | 3.3% |
| Slovak | 9 | 0.1% |
| South American | 142 | 1.3% |
| Spaniard | 62 | 0.6% |
| Spanish | 35 | 0.3% |
| Sri Lankan | 32 | 0.3% |
| Swedish | 358 | 3.2% |
| Swiss | 73 | 0.6% |
| Thai | 99 | 0.9% |
| Ukrainian | 7 | 0.1% |
| Welsh | 75 | 0.7% |
| Yugoslavian | 54 | 0.5% | View All 70 Rows |
Immigrants in Sierra Madre
The most numerous immigrant groups reported in Sierra Madre came from Asia (1,448 | 13.0%), Eastern Asia (1,029 | 9.2%), China (912 | 8.2%), Taiwan (314 | 2.8%), and Western Asia (214 | 1.9%), together accounting for 35.1% of all Sierra Madre residents.
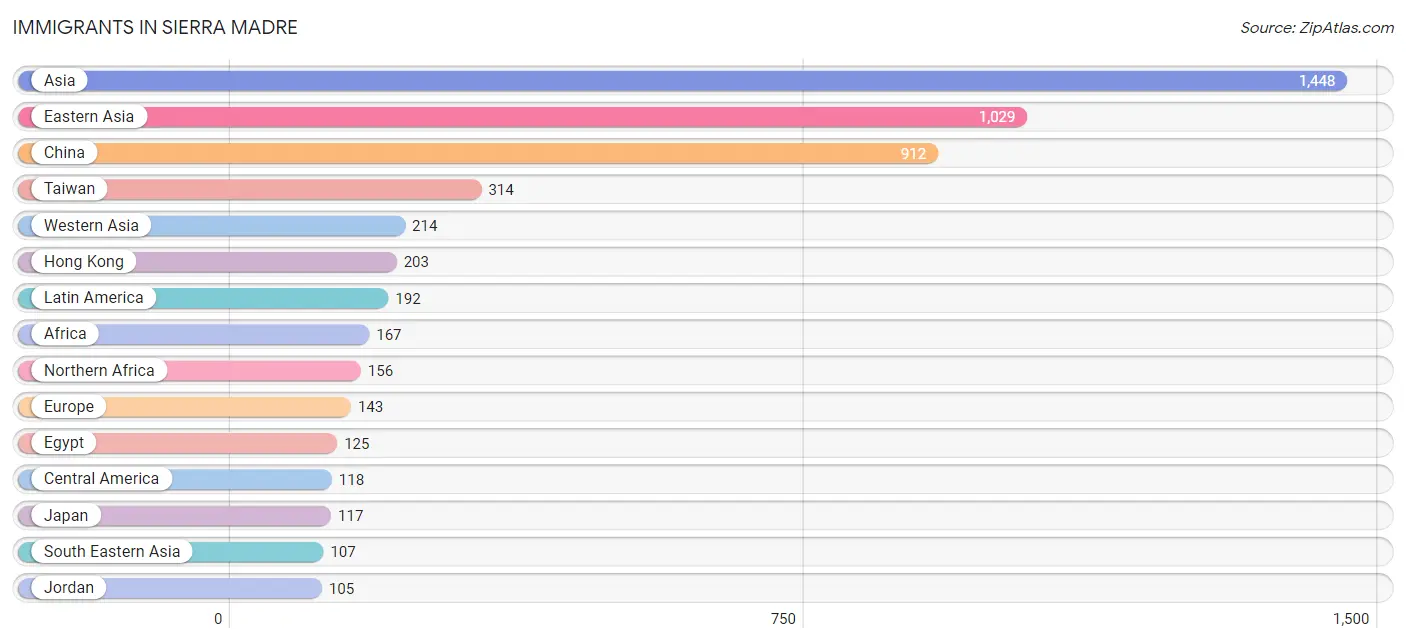
| Immigration Origin | # Population | % Population |
| Africa | 167 | 1.5% |
| Asia | 1,448 | 13.0% |
| Belize | 35 | 0.3% |
| Brazil | 18 | 0.2% |
| Canada | 94 | 0.8% |
| Caribbean | 11 | 0.1% |
| Central America | 118 | 1.1% |
| China | 912 | 8.2% |
| Cuba | 11 | 0.1% |
| Eastern Asia | 1,029 | 9.2% |
| Eastern Europe | 93 | 0.8% |
| Ecuador | 35 | 0.3% |
| Egypt | 125 | 1.1% |
| El Salvador | 29 | 0.3% |
| Europe | 143 | 1.3% |
| Germany | 18 | 0.2% |
| Greece | 11 | 0.1% |
| Guatemala | 14 | 0.1% |
| Hong Kong | 203 | 1.8% |
| Hungary | 16 | 0.1% |
| India | 68 | 0.6% |
| Iran | 30 | 0.3% |
| Israel | 39 | 0.4% |
| Japan | 117 | 1.1% |
| Jordan | 105 | 0.9% |
| Latin America | 192 | 1.7% |
| Lebanon | 36 | 0.3% |
| Mexico | 40 | 0.4% |
| Northern Africa | 156 | 1.4% |
| Northern Europe | 21 | 0.2% |
| Oceania | 10 | 0.1% |
| Philippines | 77 | 0.7% |
| Romania | 58 | 0.5% |
| Russia | 19 | 0.2% |
| Saudi Arabia | 34 | 0.3% |
| Singapore | 10 | 0.1% |
| South Africa | 11 | 0.1% |
| South America | 63 | 0.6% |
| South Central Asia | 98 | 0.9% |
| South Eastern Asia | 107 | 1.0% |
| Southern Europe | 11 | 0.1% |
| Sweden | 14 | 0.1% |
| Taiwan | 314 | 2.8% |
| Thailand | 8 | 0.1% |
| Vietnam | 12 | 0.1% |
| Western Asia | 214 | 1.9% |
| Western Europe | 18 | 0.2% | View All 47 Rows |
Sex and Age in Sierra Madre
Sex and Age in Sierra Madre
The most populous age groups in Sierra Madre are 60 to 64 Years (491 | 9.3%) for men and 55 to 59 Years (818 | 13.9%) for women.
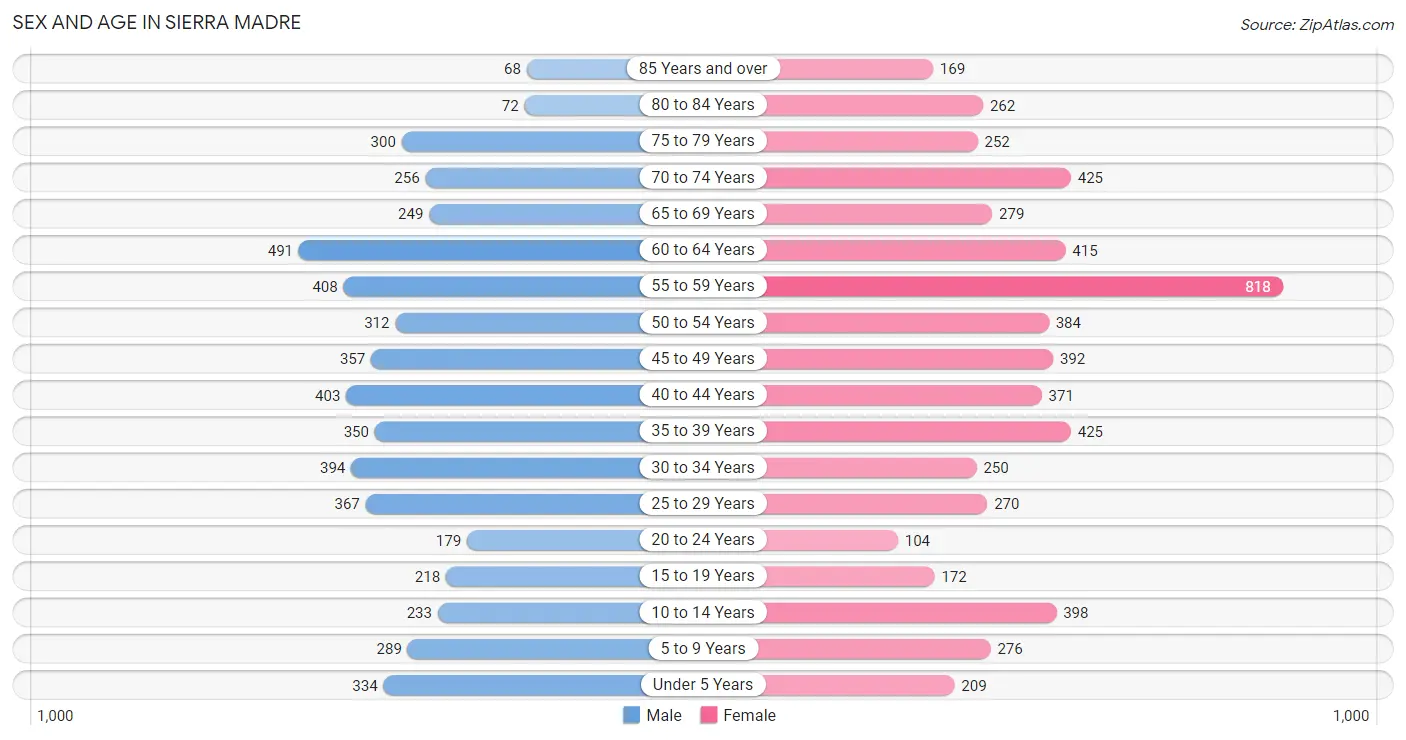
| Age Bracket | Male | Female |
| Under 5 Years | 334 (6.3%) | 209 (3.6%) |
| 5 to 9 Years | 289 (5.5%) | 276 (4.7%) |
| 10 to 14 Years | 233 (4.4%) | 398 (6.8%) |
| 15 to 19 Years | 218 (4.1%) | 172 (2.9%) |
| 20 to 24 Years | 179 (3.4%) | 104 (1.8%) |
| 25 to 29 Years | 367 (7.0%) | 270 (4.6%) |
| 30 to 34 Years | 394 (7.5%) | 250 (4.3%) |
| 35 to 39 Years | 350 (6.6%) | 425 (7.2%) |
| 40 to 44 Years | 403 (7.6%) | 371 (6.3%) |
| 45 to 49 Years | 357 (6.8%) | 392 (6.7%) |
| 50 to 54 Years | 312 (5.9%) | 384 (6.5%) |
| 55 to 59 Years | 408 (7.7%) | 818 (13.9%) |
| 60 to 64 Years | 491 (9.3%) | 415 (7.1%) |
| 65 to 69 Years | 249 (4.7%) | 279 (4.8%) |
| 70 to 74 Years | 256 (4.9%) | 425 (7.2%) |
| 75 to 79 Years | 300 (5.7%) | 252 (4.3%) |
| 80 to 84 Years | 72 (1.4%) | 262 (4.5%) |
| 85 Years and over | 68 (1.3%) | 169 (2.9%) |
| Total | 5,280 (100.0%) | 5,871 (100.0%) |
Families and Households in Sierra Madre
Median Family Size in Sierra Madre
The median family size in Sierra Madre is 2.97 persons per family, with single male/father families (81 | 2.8%) accounting for the largest median family size of 3.46 persons per family. On the other hand, single female/mother families (567 | 19.7%) represent the smallest median family size with 2.91 persons per family.
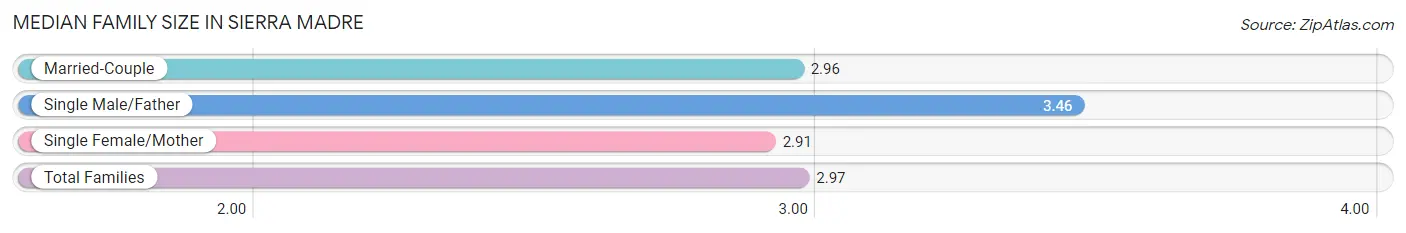
| Family Type | # Families | Family Size |
| Married-Couple | 2,237 (77.5%) | 2.96 |
| Single Male/Father | 81 (2.8%) | 3.46 |
| Single Female/Mother | 567 (19.7%) | 2.91 |
| Total Families | 2,885 (100.0%) | 2.97 |
Median Household Size in Sierra Madre
The median household size in Sierra Madre is 2.22 persons per household, with single male/father households (81 | 1.6%) accounting for the largest median household size of 3.46 persons per household. non-family households (2,133 | 42.5%) represent the smallest median household size with 1.15 persons per household.
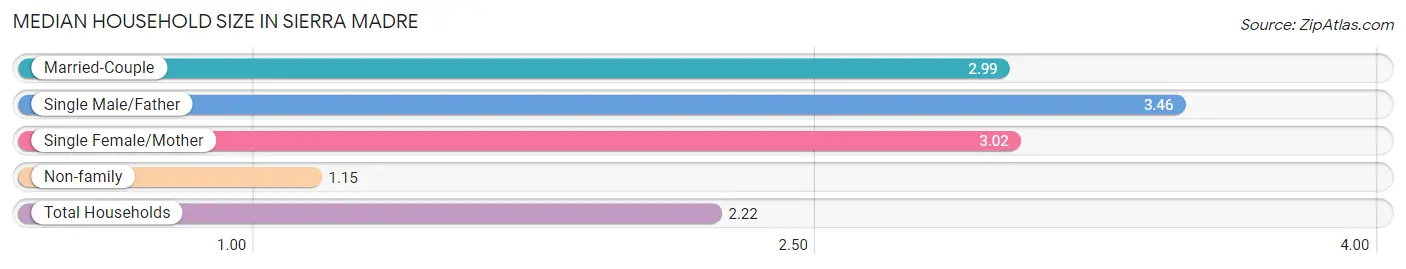
| Household Type | # Households | Household Size |
| Married-Couple | 2,237 (44.6%) | 2.99 |
| Single Male/Father | 81 (1.6%) | 3.46 |
| Single Female/Mother | 567 (11.3%) | 3.02 |
| Non-family | 2,133 (42.5%) | 1.15 |
| Total Households | 5,018 (100.0%) | 2.22 |
Household Size by Marriage Status in Sierra Madre
Out of a total of 5,018 households in Sierra Madre, 2,885 (57.5%) are family households, while 2,133 (42.5%) are nonfamily households. The most numerous type of family households are 2-person households, comprising 1,429, and the most common type of nonfamily households are 1-person households, comprising 1,840.
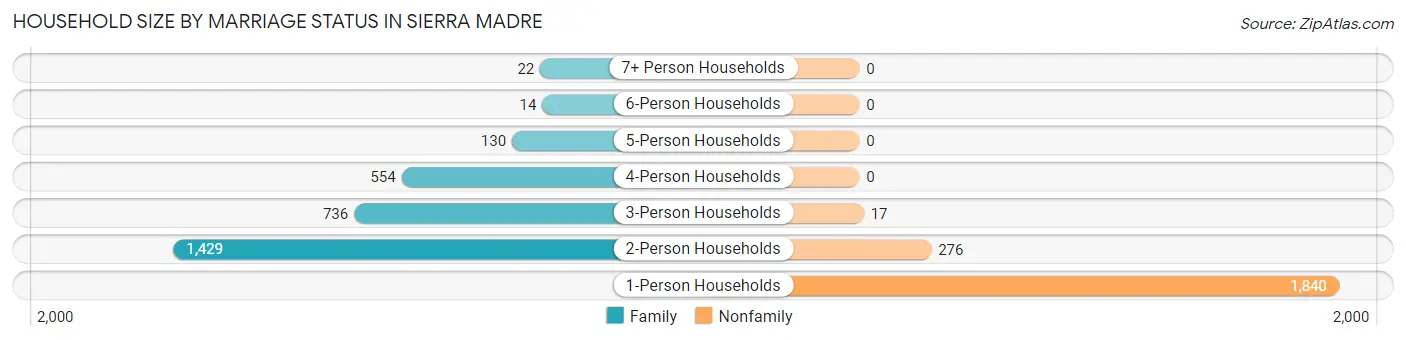
| Household Size | Family Households | Nonfamily Households |
| 1-Person Households | - | 1,840 (36.7%) |
| 2-Person Households | 1,429 (28.5%) | 276 (5.5%) |
| 3-Person Households | 736 (14.7%) | 17 (0.3%) |
| 4-Person Households | 554 (11.0%) | 0 (0.0%) |
| 5-Person Households | 130 (2.6%) | 0 (0.0%) |
| 6-Person Households | 14 (0.3%) | 0 (0.0%) |
| 7+ Person Households | 22 (0.4%) | 0 (0.0%) |
| Total | 2,885 (57.5%) | 2,133 (42.5%) |
Female Fertility in Sierra Madre
Fertility by Age in Sierra Madre
Average fertility rate in Sierra Madre is 5.0 births per 1,000 women. Women in the age bracket of 35 to 50 years have the highest fertility rate with 9.0 births per 1,000 women. Women in the age bracket of 35 to 50 years acount for 100.0% of all women with births.
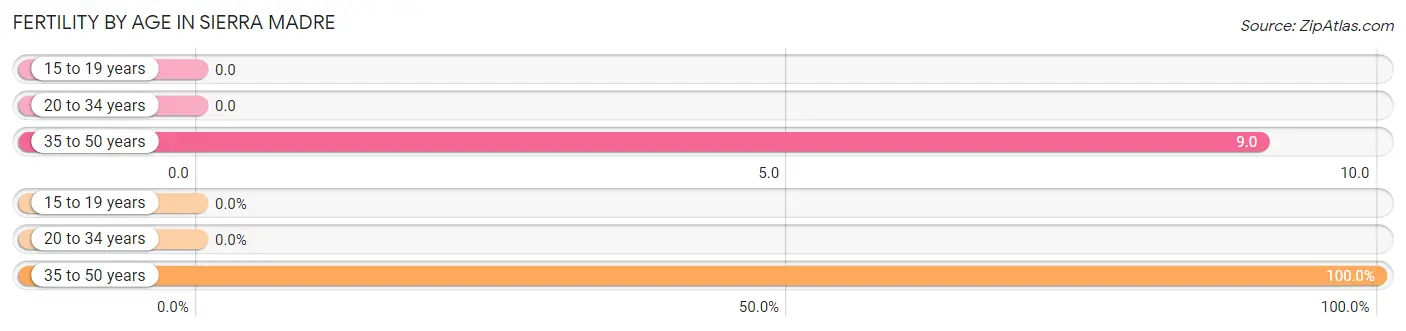
| Age Bracket | Women with Births | Births / 1,000 Women |
| 15 to 19 years | 0 (0.0%) | 0.0 |
| 20 to 34 years | 0 (0.0%) | 0.0 |
| 35 to 50 years | 11 (100.0%) | 9.0 |
| Total | 11 (100.0%) | 5.0 |
Fertility by Age by Marriage Status in Sierra Madre
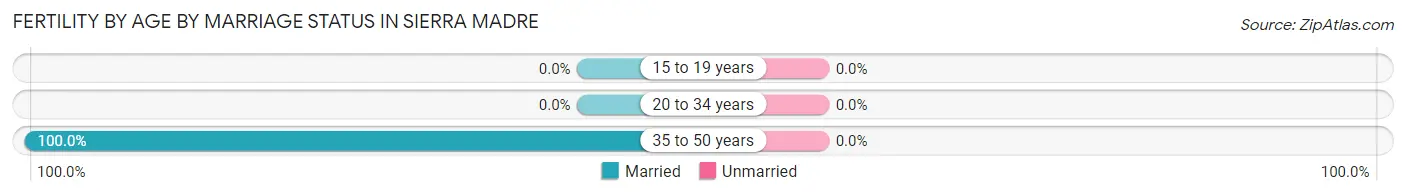
| Age Bracket | Married | Unmarried |
| 15 to 19 years | 0 (0.0%) | 0 (0.0%) |
| 20 to 34 years | 0 (0.0%) | 0 (0.0%) |
| 35 to 50 years | 11 (100.0%) | 0 (0.0%) |
| Total | 11 (100.0%) | 0 (0.0%) |
Fertility by Education in Sierra Madre
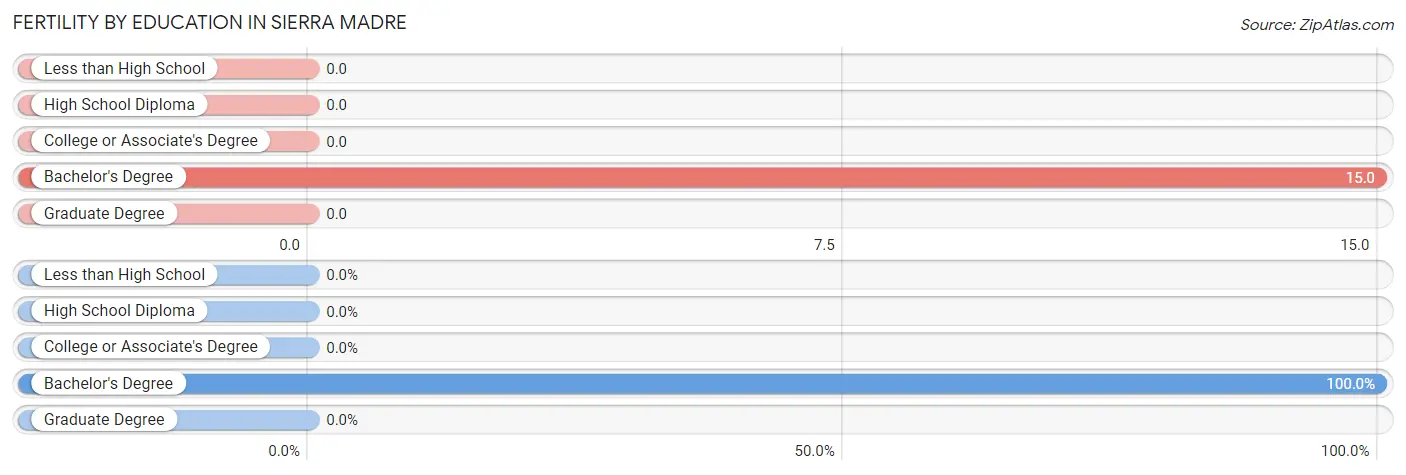
| Educational Attainment | Women with Births | Births / 1,000 Women |
| Less than High School | 0 (0.0%) | 0.0 |
| High School Diploma | 0 (0.0%) | 0.0 |
| College or Associate's Degree | 0 (0.0%) | 0.0 |
| Bachelor's Degree | 11 (100.0%) | 15.0 |
| Graduate Degree | 0 (0.0%) | 0.0 |
| Total | 11 (100.0%) | 5.0 |
Fertility by Education by Marriage Status in Sierra Madre
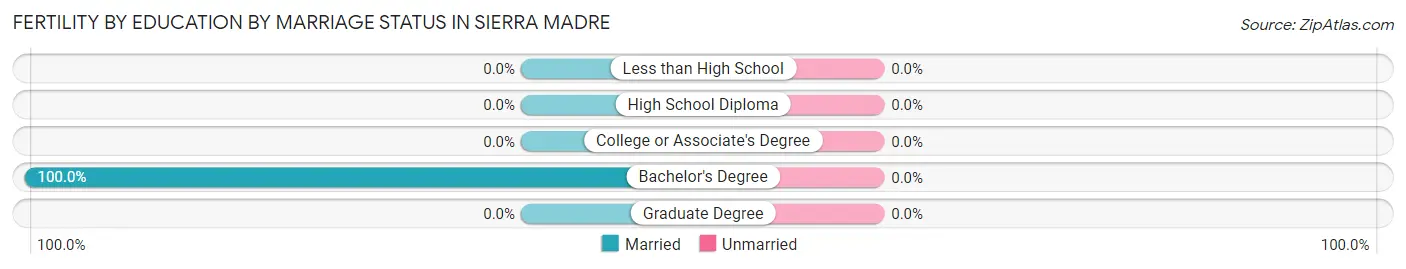
| Educational Attainment | Married | Unmarried |
| Less than High School | 0 (0.0%) | 0 (0.0%) |
| High School Diploma | 0 (0.0%) | 0 (0.0%) |
| College or Associate's Degree | 0 (0.0%) | 0 (0.0%) |
| Bachelor's Degree | 11 (100.0%) | 0 (0.0%) |
| Graduate Degree | 0 (0.0%) | 0 (0.0%) |
| Total | 11 (100.0%) | 0 (0.0%) |
Employment Characteristics in Sierra Madre
Employment by Class of Employer in Sierra Madre
Among the 5,995 employed individuals in Sierra Madre, private company employees (3,073 | 51.3%), not-for-profit organizations (1,094 | 18.2%), and self-employed (not incorporated) (526 | 8.8%) make up the most common classes of employment.
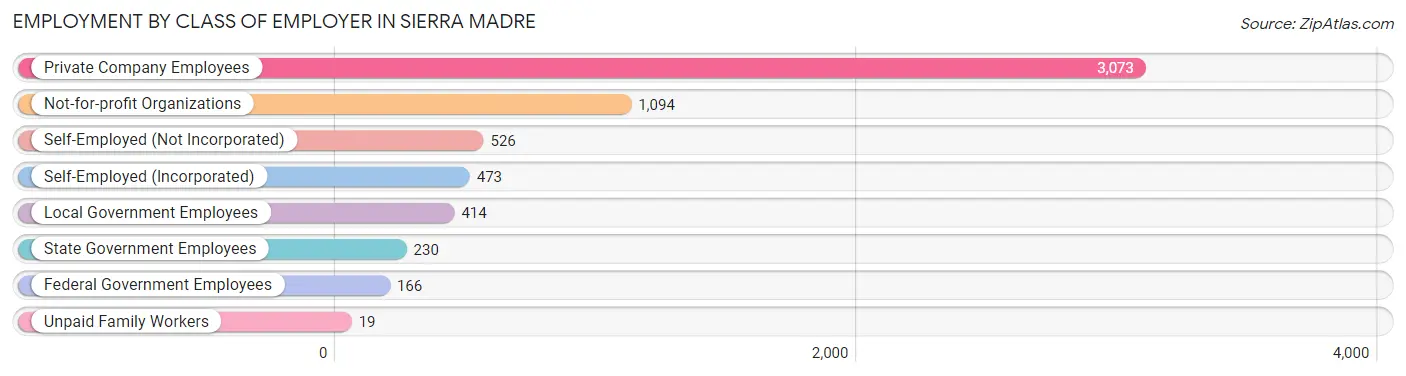
| Employer Class | # Employees | % Employees |
| Private Company Employees | 3,073 | 51.3% |
| Self-Employed (Incorporated) | 473 | 7.9% |
| Self-Employed (Not Incorporated) | 526 | 8.8% |
| Not-for-profit Organizations | 1,094 | 18.2% |
| Local Government Employees | 414 | 6.9% |
| State Government Employees | 230 | 3.8% |
| Federal Government Employees | 166 | 2.8% |
| Unpaid Family Workers | 19 | 0.3% |
| Total | 5,995 | 100.0% |
Employment Status by Age in Sierra Madre
According to the labor force statistics for Sierra Madre, out of the total population over 16 years of age (9,306), 68.2% or 6,347 individuals are in the labor force, with 3.2% or 203 of them unemployed. The age group with the highest labor force participation rate is 55 to 59 years, with 92.4% or 1,133 individuals in the labor force. Within the labor force, the 20 to 24 years age range has the highest percentage of unemployed individuals, with 13.4% or 25 of them being unemployed.
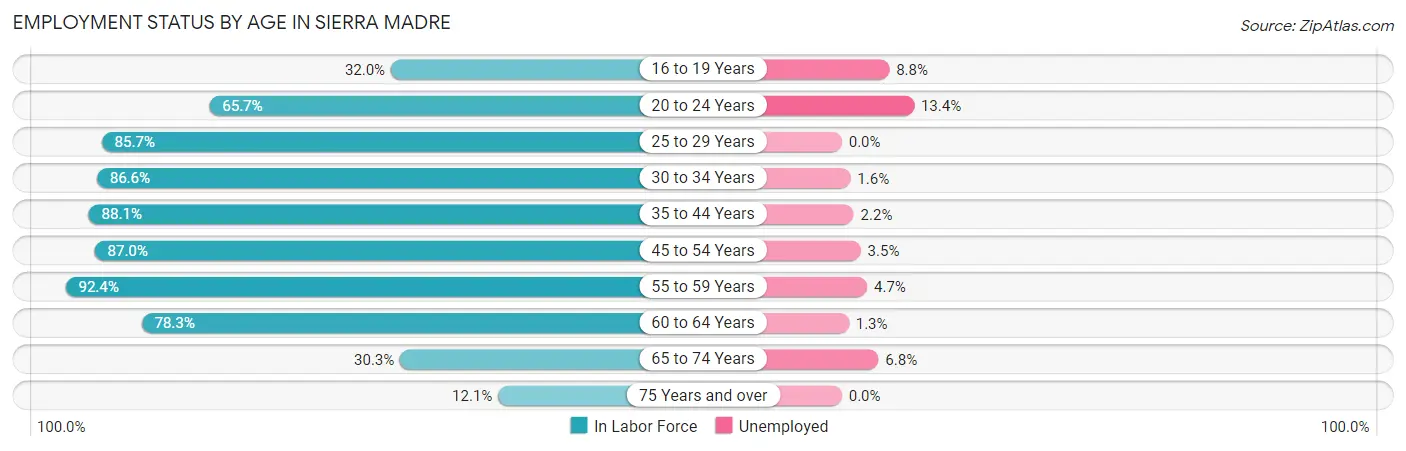
| Age Bracket | In Labor Force | Unemployed |
| 16 to 19 Years | 91 (32.0%) | 8 (8.8%) |
| 20 to 24 Years | 186 (65.7%) | 25 (13.4%) |
| 25 to 29 Years | 546 (85.7%) | 0 (0.0%) |
| 30 to 34 Years | 558 (86.6%) | 9 (1.6%) |
| 35 to 44 Years | 1,365 (88.1%) | 30 (2.2%) |
| 45 to 54 Years | 1,257 (87.0%) | 44 (3.5%) |
| 55 to 59 Years | 1,133 (92.4%) | 53 (4.7%) |
| 60 to 64 Years | 709 (78.3%) | 9 (1.3%) |
| 65 to 74 Years | 366 (30.3%) | 25 (6.8%) |
| 75 Years and over | 136 (12.1%) | 0 (0.0%) |
| Total | 6,347 (68.2%) | 203 (3.2%) |
Employment Status by Educational Attainment in Sierra Madre
According to labor force statistics for Sierra Madre, 86.9% of individuals (5,568) out of the total population between 25 and 64 years of age (6,407) are in the labor force, with 2.6% or 145 of them being unemployed. The group with the highest labor force participation rate are those with the educational attainment of bachelor's degree or higher, with 90.1% or 4,069 individuals in the labor force. Within the labor force, individuals with college / associate degree education have the highest percentage of unemployment, with 2.9% or 32 of them being unemployed.
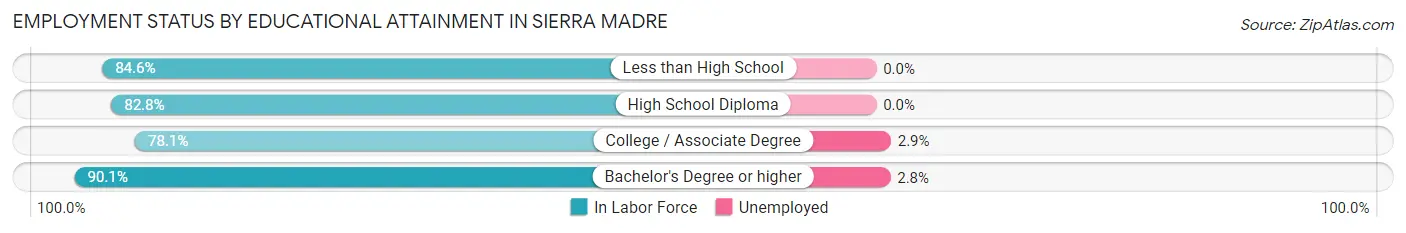
| Educational Attainment | In Labor Force | Unemployed |
| Less than High School | 55 (84.6%) | 0 (0.0%) |
| High School Diploma | 327 (82.8%) | 0 (0.0%) |
| College / Associate Degree | 1,118 (78.1%) | 41 (2.9%) |
| Bachelor's Degree or higher | 4,069 (90.1%) | 126 (2.8%) |
| Total | 5,568 (86.9%) | 167 (2.6%) |
Employment Occupations by Sex in Sierra Madre
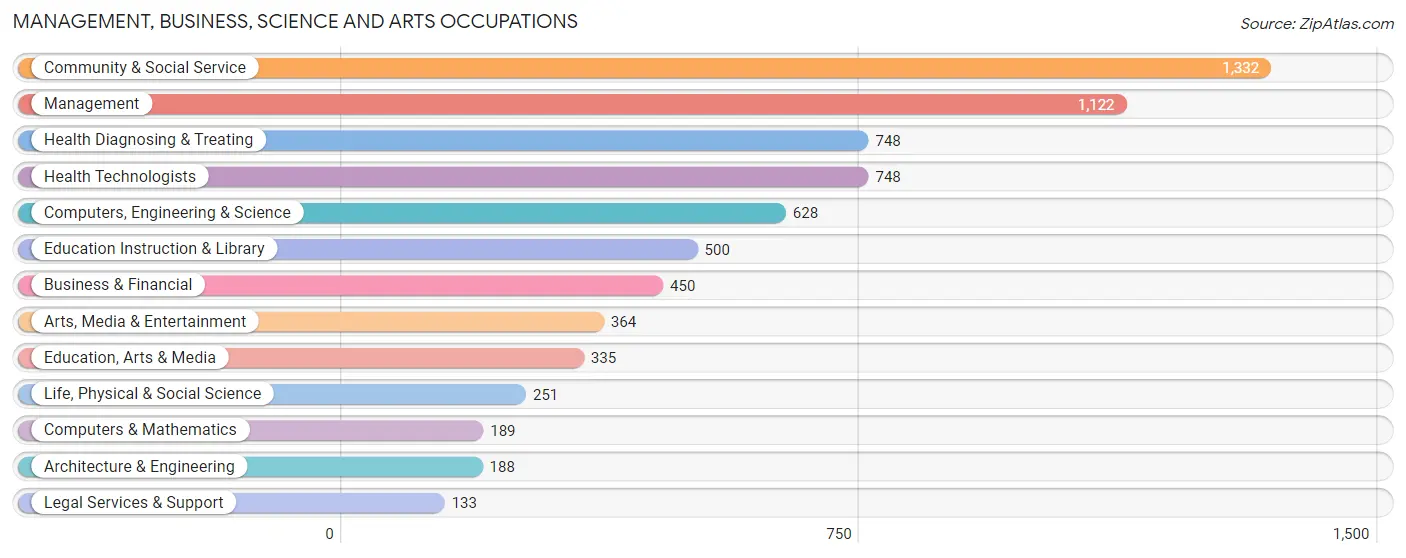
Management, Business, Science and Arts Occupations
The most common Management, Business, Science and Arts occupations in Sierra Madre are Community & Social Service (1,332 | 21.7%), Management (1,122 | 18.3%), Health Diagnosing & Treating (748 | 12.2%), Health Technologists (748 | 12.2%), and Computers, Engineering & Science (628 | 10.2%).
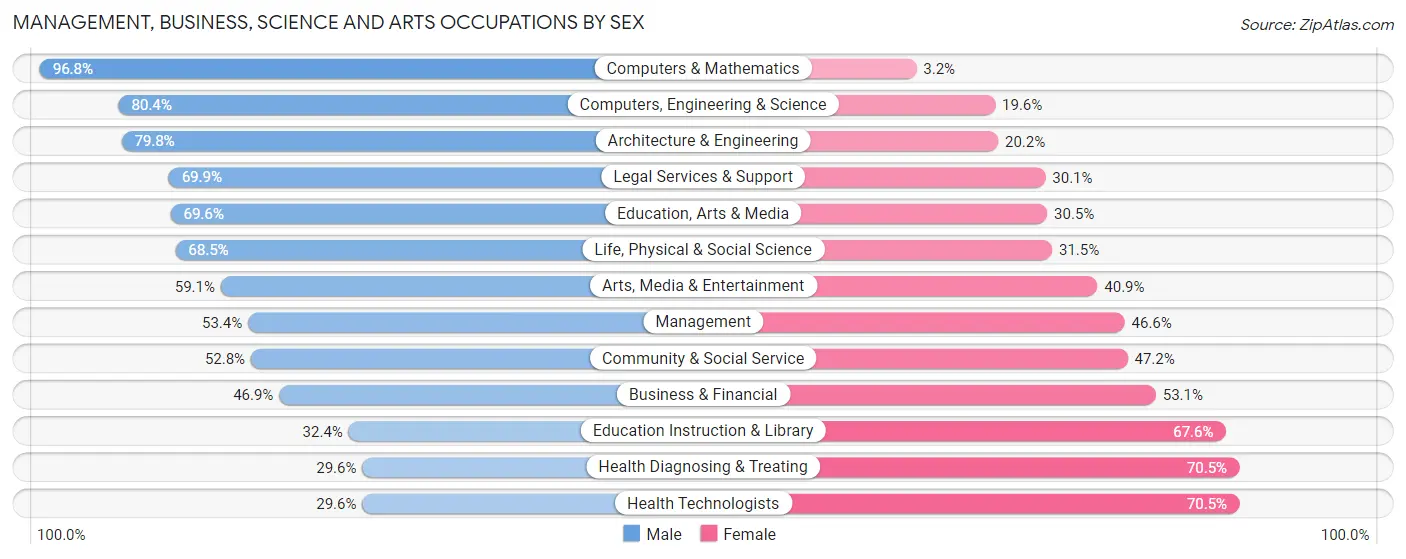
Management, Business, Science and Arts Occupations by Sex
Within the Management, Business, Science and Arts occupations in Sierra Madre, the most male-oriented occupations are Computers & Mathematics (96.8%), Computers, Engineering & Science (80.4%), and Architecture & Engineering (79.8%), while the most female-oriented occupations are Health Diagnosing & Treating (70.5%), Health Technologists (70.5%), and Education Instruction & Library (67.6%).
| Occupation | Male | Female |
| Management | 599 (53.4%) | 523 (46.6%) |
| Business & Financial | 211 (46.9%) | 239 (53.1%) |
| Computers, Engineering & Science | 505 (80.4%) | 123 (19.6%) |
| Computers & Mathematics | 183 (96.8%) | 6 (3.2%) |
| Architecture & Engineering | 150 (79.8%) | 38 (20.2%) |
| Life, Physical & Social Science | 172 (68.5%) | 79 (31.5%) |
| Community & Social Service | 703 (52.8%) | 629 (47.2%) |
| Education, Arts & Media | 233 (69.6%) | 102 (30.4%) |
| Legal Services & Support | 93 (69.9%) | 40 (30.1%) |
| Education Instruction & Library | 162 (32.4%) | 338 (67.6%) |
| Arts, Media & Entertainment | 215 (59.1%) | 149 (40.9%) |
| Health Diagnosing & Treating | 221 (29.5%) | 527 (70.5%) |
| Health Technologists | 221 (29.5%) | 527 (70.5%) |
| Total (Category) | 2,239 (52.3%) | 2,041 (47.7%) |
| Total (Overall) | 3,270 (53.2%) | 2,873 (46.8%) |
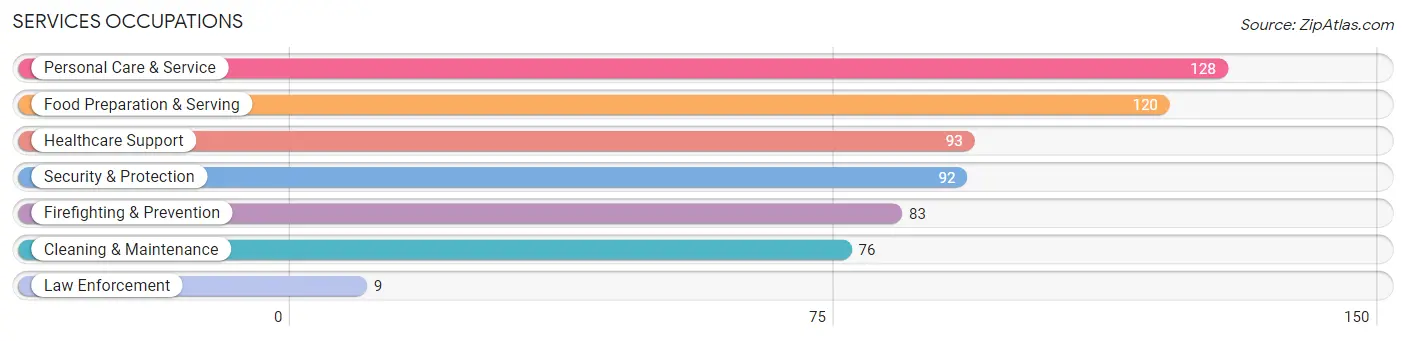
Services Occupations
The most common Services occupations in Sierra Madre are Personal Care & Service (128 | 2.1%), Food Preparation & Serving (120 | 1.9%), Healthcare Support (93 | 1.5%), Security & Protection (92 | 1.5%), and Firefighting & Prevention (83 | 1.3%).
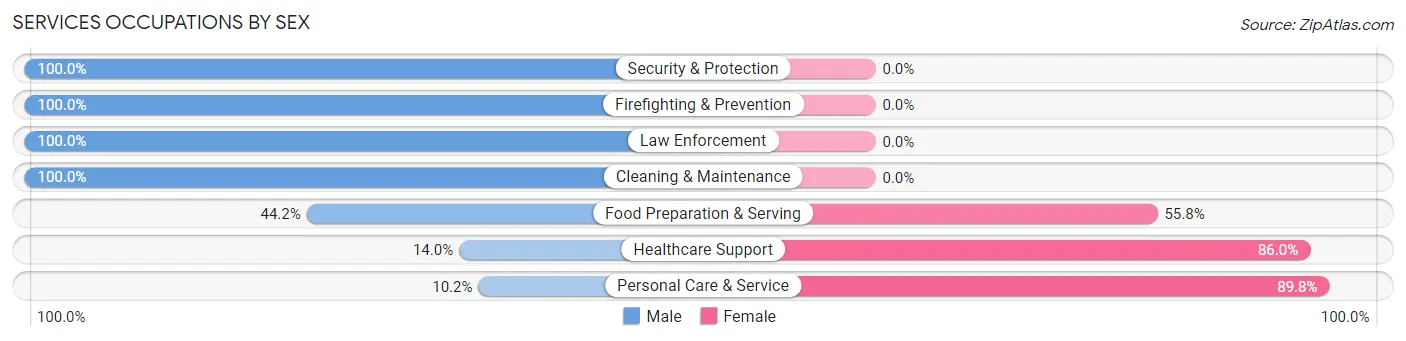
Services Occupations by Sex
Within the Services occupations in Sierra Madre, the most male-oriented occupations are Security & Protection (100.0%), Firefighting & Prevention (100.0%), and Law Enforcement (100.0%), while the most female-oriented occupations are Personal Care & Service (89.8%), Healthcare Support (86.0%), and Food Preparation & Serving (55.8%).
| Occupation | Male | Female |
| Healthcare Support | 13 (14.0%) | 80 (86.0%) |
| Security & Protection | 92 (100.0%) | 0 (0.0%) |
| Firefighting & Prevention | 83 (100.0%) | 0 (0.0%) |
| Law Enforcement | 9 (100.0%) | 0 (0.0%) |
| Food Preparation & Serving | 53 (44.2%) | 67 (55.8%) |
| Cleaning & Maintenance | 76 (100.0%) | 0 (0.0%) |
| Personal Care & Service | 13 (10.2%) | 115 (89.8%) |
| Total (Category) | 247 (48.5%) | 262 (51.5%) |
| Total (Overall) | 3,270 (53.2%) | 2,873 (46.8%) |
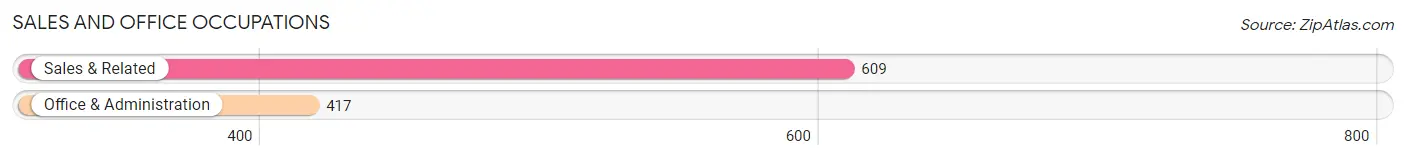
Sales and Office Occupations
The most common Sales and Office occupations in Sierra Madre are Sales & Related (609 | 9.9%), and Office & Administration (417 | 6.8%).
Sales and Office Occupations by Sex
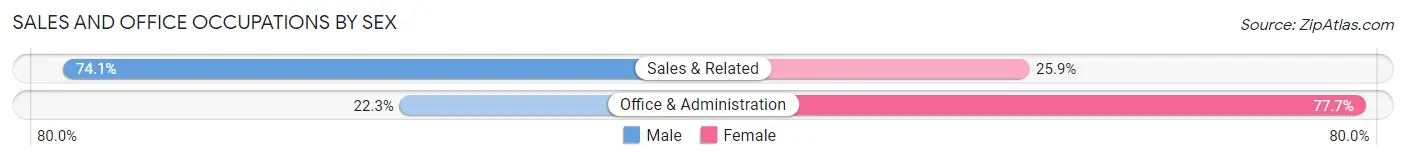
| Occupation | Male | Female |
| Sales & Related | 451 (74.1%) | 158 (25.9%) |
| Office & Administration | 93 (22.3%) | 324 (77.7%) |
| Total (Category) | 544 (53.0%) | 482 (47.0%) |
| Total (Overall) | 3,270 (53.2%) | 2,873 (46.8%) |
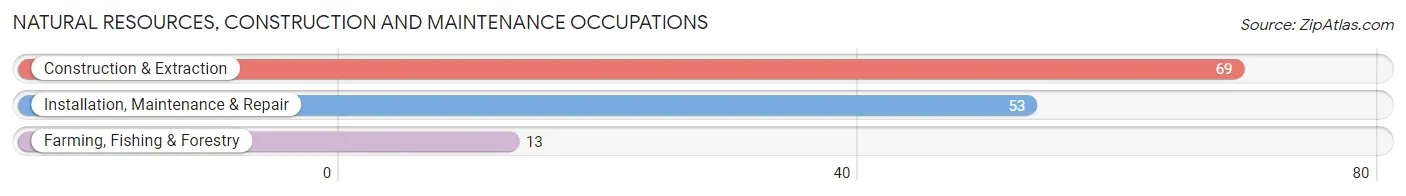
Natural Resources, Construction and Maintenance Occupations
The most common Natural Resources, Construction and Maintenance occupations in Sierra Madre are Construction & Extraction (69 | 1.1%), Installation, Maintenance & Repair (53 | 0.9%), and Farming, Fishing & Forestry (13 | 0.2%).
Natural Resources, Construction and Maintenance Occupations by Sex
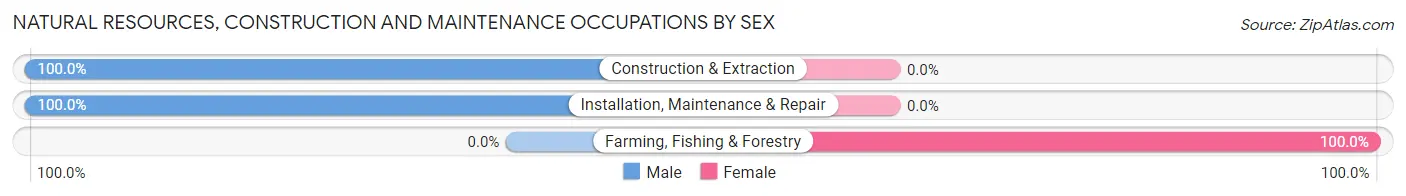
| Occupation | Male | Female |
| Farming, Fishing & Forestry | 0 (0.0%) | 13 (100.0%) |
| Construction & Extraction | 69 (100.0%) | 0 (0.0%) |
| Installation, Maintenance & Repair | 53 (100.0%) | 0 (0.0%) |
| Total (Category) | 122 (90.4%) | 13 (9.6%) |
| Total (Overall) | 3,270 (53.2%) | 2,873 (46.8%) |
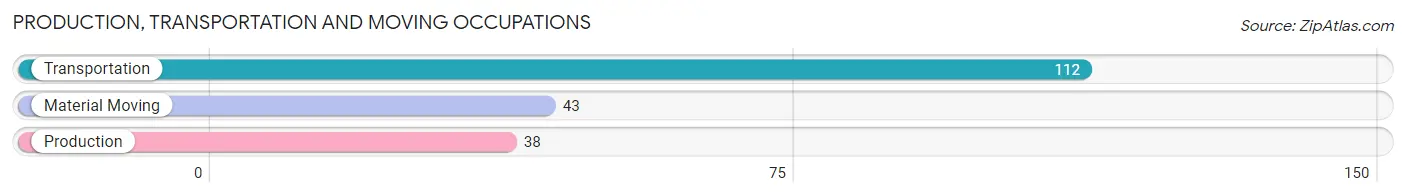
Production, Transportation and Moving Occupations
The most common Production, Transportation and Moving occupations in Sierra Madre are Transportation (112 | 1.8%), Material Moving (43 | 0.7%), and Production (38 | 0.6%).
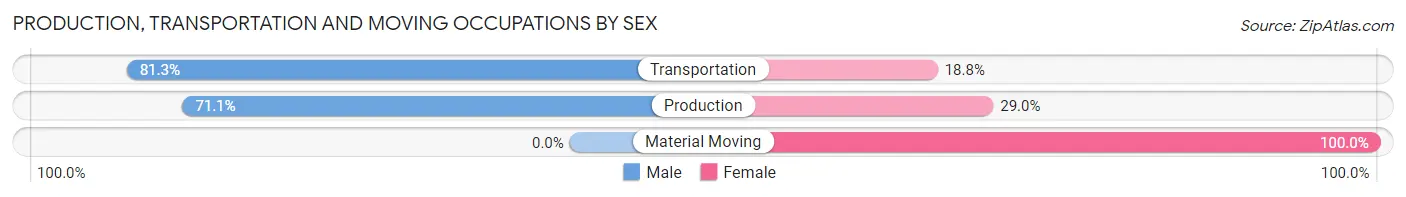
Production, Transportation and Moving Occupations by Sex
| Occupation | Male | Female |
| Production | 27 (71.1%) | 11 (28.9%) |
| Transportation | 91 (81.2%) | 21 (18.8%) |
| Material Moving | 0 (0.0%) | 43 (100.0%) |
| Total (Category) | 118 (61.1%) | 75 (38.9%) |
| Total (Overall) | 3,270 (53.2%) | 2,873 (46.8%) |
Employment Industries by Sex in Sierra Madre
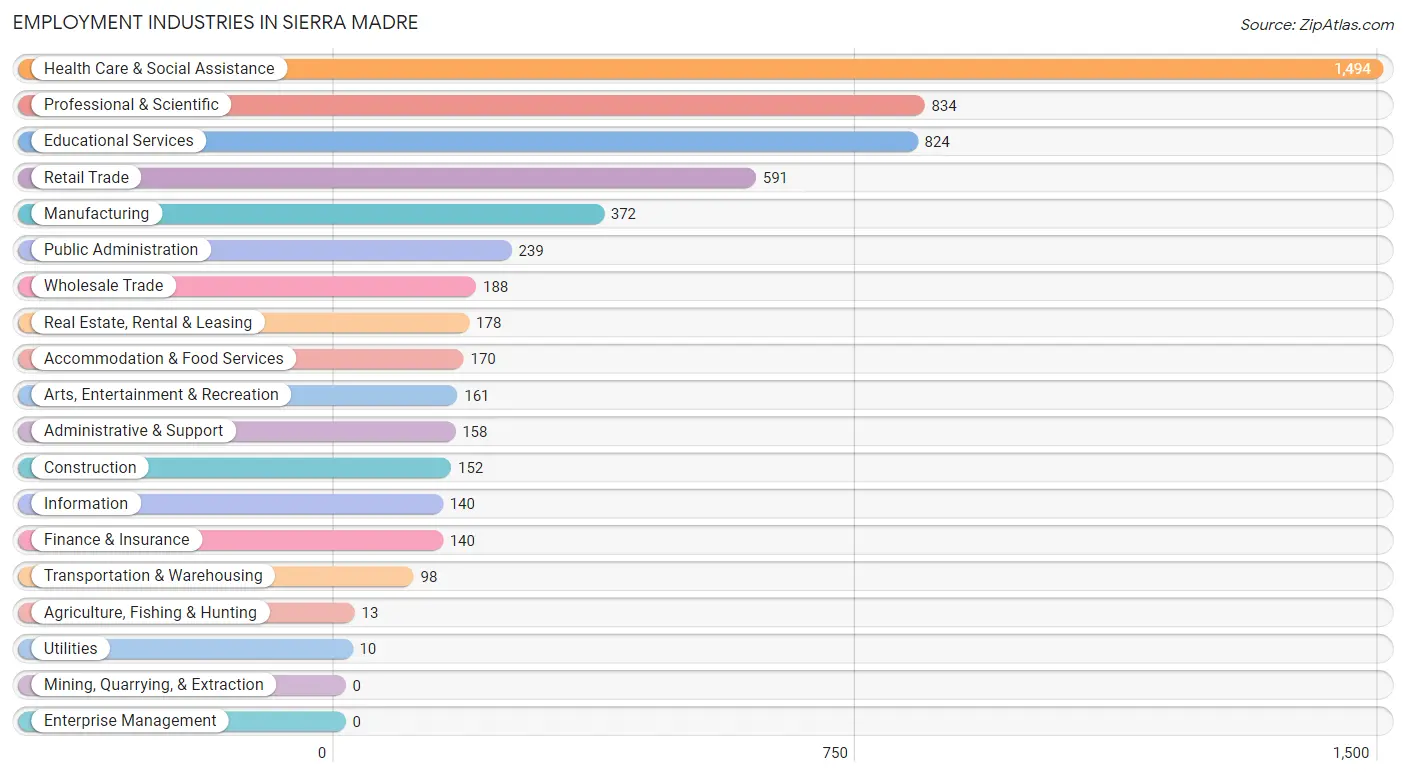
Employment Industries in Sierra Madre
The major employment industries in Sierra Madre include Health Care & Social Assistance (1,494 | 24.3%), Professional & Scientific (834 | 13.6%), Educational Services (824 | 13.4%), Retail Trade (591 | 9.6%), and Manufacturing (372 | 6.1%).
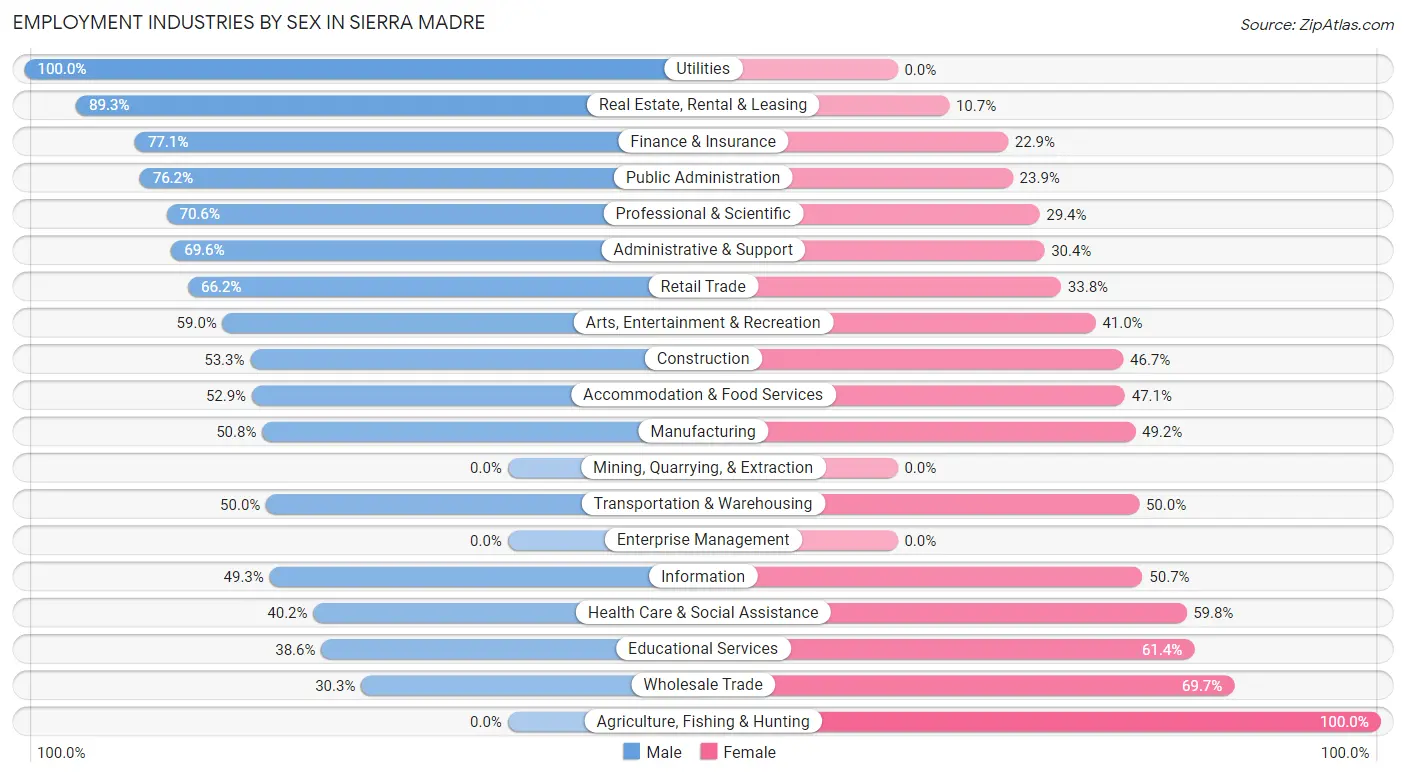
Employment Industries by Sex in Sierra Madre
The Sierra Madre industries that see more men than women are Utilities (100.0%), Real Estate, Rental & Leasing (89.3%), and Finance & Insurance (77.1%), whereas the industries that tend to have a higher number of women are Agriculture, Fishing & Hunting (100.0%), Wholesale Trade (69.7%), and Educational Services (61.4%).
| Industry | Male | Female |
| Agriculture, Fishing & Hunting | 0 (0.0%) | 13 (100.0%) |
| Mining, Quarrying, & Extraction | 0 (0.0%) | 0 (0.0%) |
| Construction | 81 (53.3%) | 71 (46.7%) |
| Manufacturing | 189 (50.8%) | 183 (49.2%) |
| Wholesale Trade | 57 (30.3%) | 131 (69.7%) |
| Retail Trade | 391 (66.2%) | 200 (33.8%) |
| Transportation & Warehousing | 49 (50.0%) | 49 (50.0%) |
| Utilities | 10 (100.0%) | 0 (0.0%) |
| Information | 69 (49.3%) | 71 (50.7%) |
| Finance & Insurance | 108 (77.1%) | 32 (22.9%) |
| Real Estate, Rental & Leasing | 159 (89.3%) | 19 (10.7%) |
| Professional & Scientific | 589 (70.6%) | 245 (29.4%) |
| Enterprise Management | 0 (0.0%) | 0 (0.0%) |
| Administrative & Support | 110 (69.6%) | 48 (30.4%) |
| Educational Services | 318 (38.6%) | 506 (61.4%) |
| Health Care & Social Assistance | 601 (40.2%) | 893 (59.8%) |
| Arts, Entertainment & Recreation | 95 (59.0%) | 66 (41.0%) |
| Accommodation & Food Services | 90 (52.9%) | 80 (47.1%) |
| Public Administration | 182 (76.1%) | 57 (23.8%) |
| Total | 3,270 (53.2%) | 2,873 (46.8%) |
Education in Sierra Madre
School Enrollment in Sierra Madre
The most common levels of schooling among the 2,513 students in Sierra Madre are middle school (513 | 20.4%), high school (404 | 16.1%), and elementary school (383 | 15.2%).
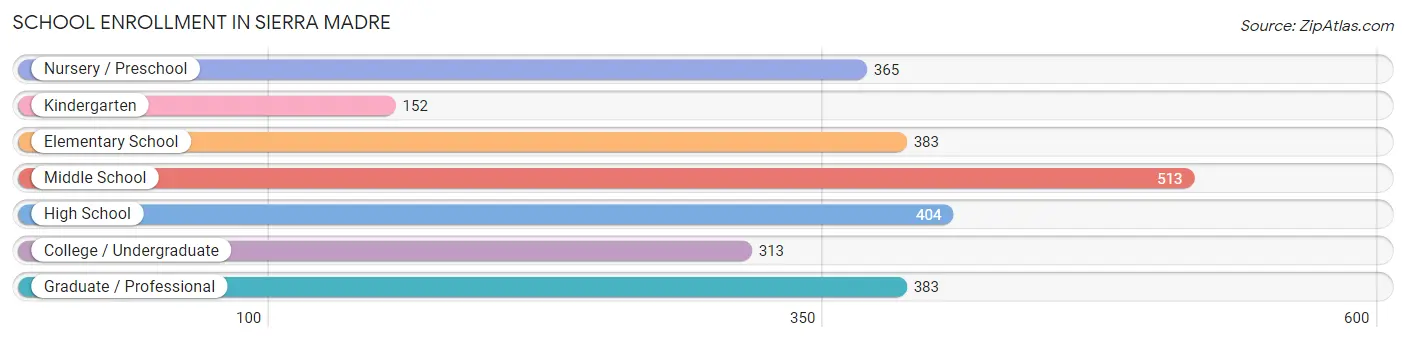
| School Level | # Students | % Students |
| Nursery / Preschool | 365 | 14.5% |
| Kindergarten | 152 | 6.0% |
| Elementary School | 383 | 15.2% |
| Middle School | 513 | 20.4% |
| High School | 404 | 16.1% |
| College / Undergraduate | 313 | 12.5% |
| Graduate / Professional | 383 | 15.2% |
| Total | 2,513 | 100.0% |
School Enrollment by Age by Funding Source in Sierra Madre
Out of a total of 2,513 students who are enrolled in schools in Sierra Madre, 1,174 (46.7%) attend a private institution, while the remaining 1,339 (53.3%) are enrolled in public schools. The age group of 3 to 4 year olds has the highest likelihood of being enrolled in private schools, with 308 (96.0% in the age bracket) enrolled. Conversely, the age group of 20 to 24 year olds has the lowest likelihood of being enrolled in a private school, with 138 (72.3% in the age bracket) attending a public institution.
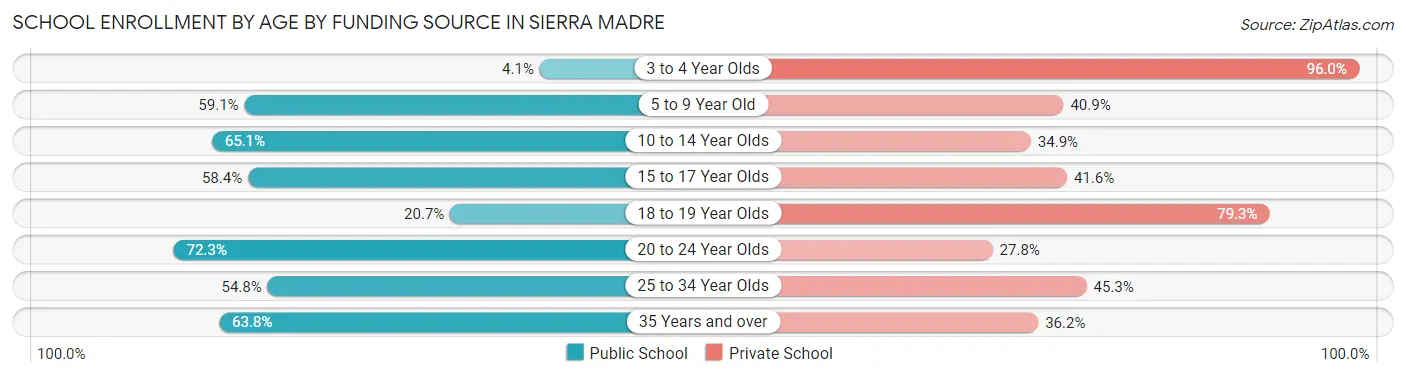
| Age Bracket | Public School | Private School |
| 3 to 4 Year Olds | 13 (4.1%) | 308 (96.0%) |
| 5 to 9 Year Old | 326 (59.1%) | 226 (40.9%) |
| 10 to 14 Year Olds | 411 (65.1%) | 220 (34.9%) |
| 15 to 17 Year Olds | 167 (58.4%) | 119 (41.6%) |
| 18 to 19 Year Olds | 17 (20.7%) | 65 (79.3%) |
| 20 to 24 Year Olds | 138 (72.3%) | 53 (27.8%) |
| 25 to 34 Year Olds | 121 (54.7%) | 100 (45.3%) |
| 35 Years and over | 146 (63.8%) | 83 (36.2%) |
| Total | 1,339 (53.3%) | 1,174 (46.7%) |
Educational Attainment by Field of Study in Sierra Madre
Business (885 | 14.9%), science & technology (706 | 11.9%), social sciences (648 | 10.9%), engineering (566 | 9.5%), and visual & performing arts (554 | 9.3%) are the most common fields of study among 5,950 individuals in Sierra Madre who have obtained a bachelor's degree or higher.
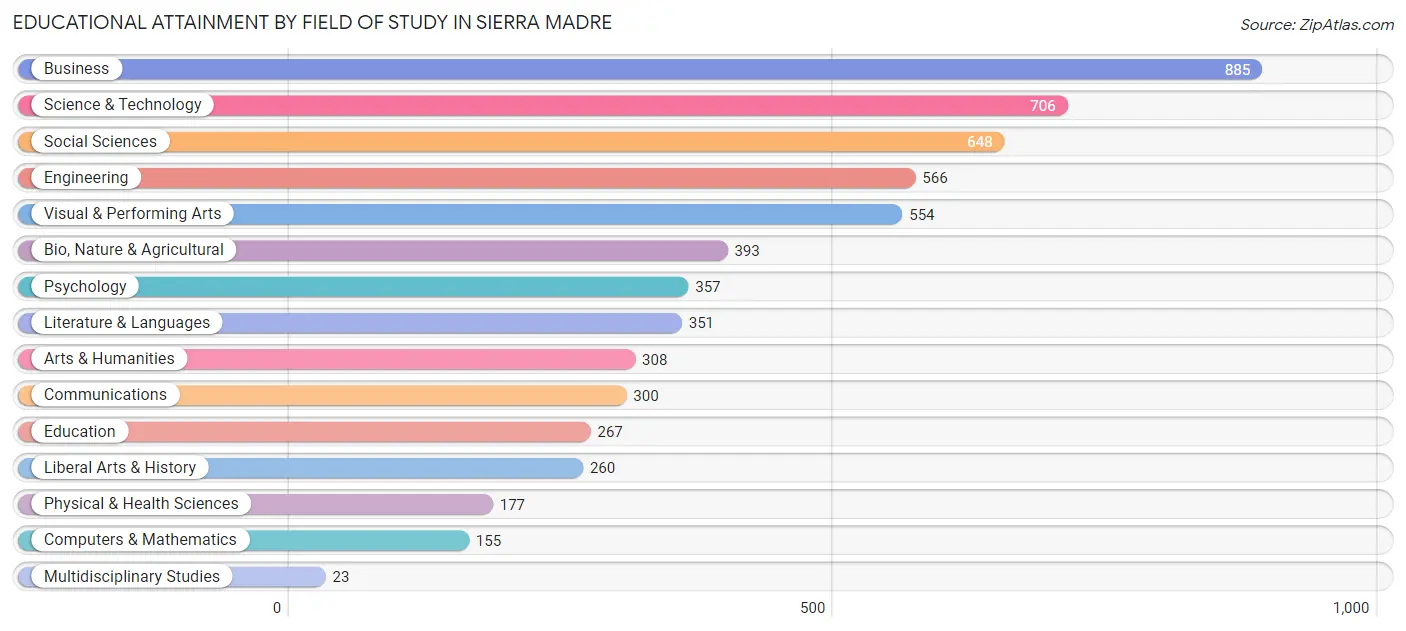
| Field of Study | # Graduates | % Graduates |
| Computers & Mathematics | 155 | 2.6% |
| Bio, Nature & Agricultural | 393 | 6.6% |
| Physical & Health Sciences | 177 | 3.0% |
| Psychology | 357 | 6.0% |
| Social Sciences | 648 | 10.9% |
| Engineering | 566 | 9.5% |
| Multidisciplinary Studies | 23 | 0.4% |
| Science & Technology | 706 | 11.9% |
| Business | 885 | 14.9% |
| Education | 267 | 4.5% |
| Literature & Languages | 351 | 5.9% |
| Liberal Arts & History | 260 | 4.4% |
| Visual & Performing Arts | 554 | 9.3% |
| Communications | 300 | 5.0% |
| Arts & Humanities | 308 | 5.2% |
| Total | 5,950 | 100.0% |
Transportation & Commute in Sierra Madre
Vehicle Availability by Sex in Sierra Madre
The most prevalent vehicle ownership categories in Sierra Madre are males with 2 vehicles (1,956, accounting for 60.4%) and females with 2 vehicles (1,319, making up 71.0%).
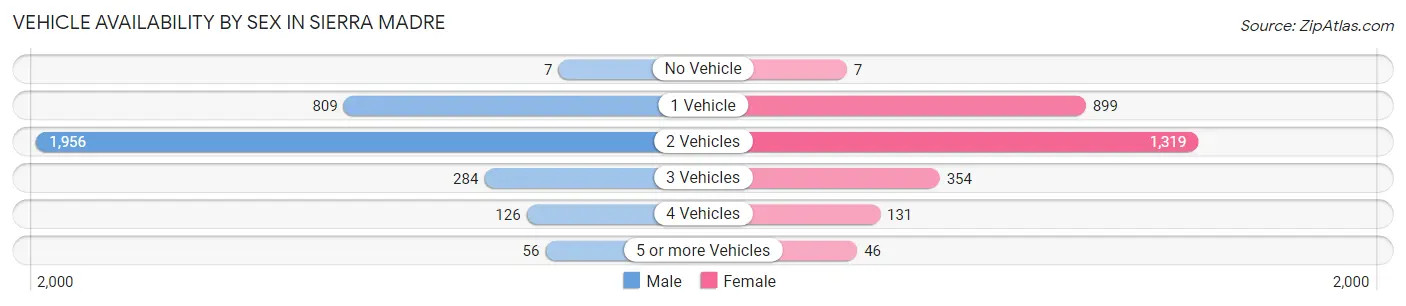
| Vehicles Available | Male | Female |
| No Vehicle | 7 (0.2%) | 7 (0.3%) |
| 1 Vehicle | 809 (25.0%) | 899 (32.6%) |
| 2 Vehicles | 1,956 (60.4%) | 1,319 (47.9%) |
| 3 Vehicles | 284 (8.8%) | 354 (12.8%) |
| 4 Vehicles | 126 (3.9%) | 131 (4.8%) |
| 5 or more Vehicles | 56 (1.7%) | 46 (1.7%) |
| Total | 3,238 (100.0%) | 2,756 (100.0%) |
Commute Time in Sierra Madre
The most frequently occuring commute durations in Sierra Madre are 15 to 19 minutes (844 commuters, 18.1%), 10 to 14 minutes (576 commuters, 12.3%), and 20 to 24 minutes (548 commuters, 11.7%).
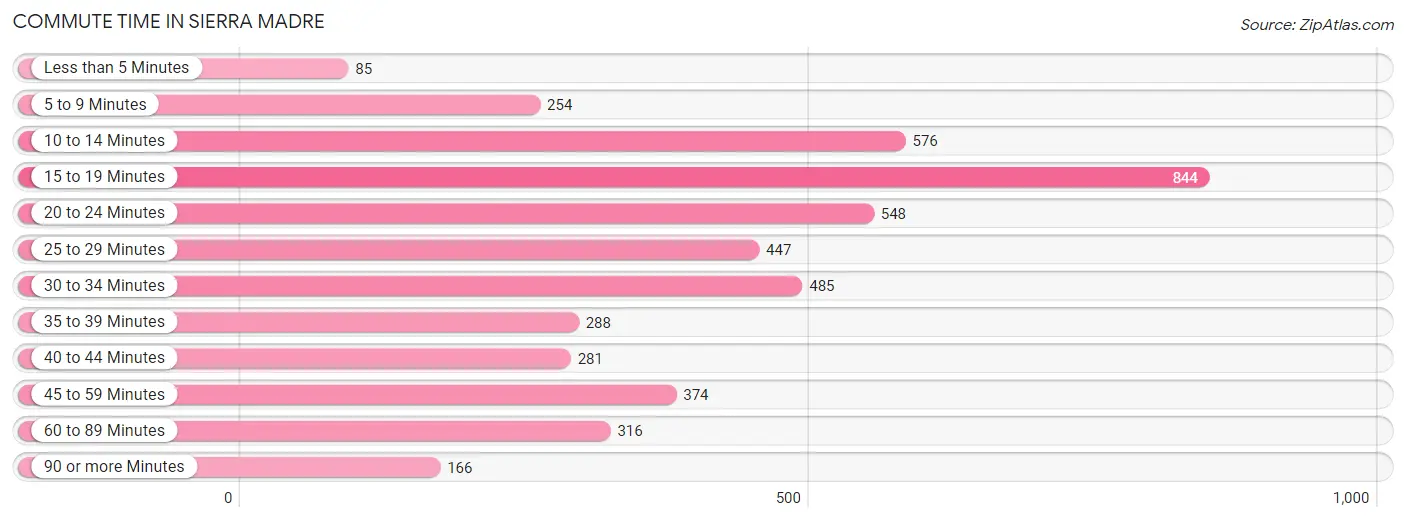
| Commute Time | # Commuters | % Commuters |
| Less than 5 Minutes | 85 | 1.8% |
| 5 to 9 Minutes | 254 | 5.4% |
| 10 to 14 Minutes | 576 | 12.3% |
| 15 to 19 Minutes | 844 | 18.1% |
| 20 to 24 Minutes | 548 | 11.7% |
| 25 to 29 Minutes | 447 | 9.6% |
| 30 to 34 Minutes | 485 | 10.4% |
| 35 to 39 Minutes | 288 | 6.2% |
| 40 to 44 Minutes | 281 | 6.0% |
| 45 to 59 Minutes | 374 | 8.0% |
| 60 to 89 Minutes | 316 | 6.8% |
| 90 or more Minutes | 166 | 3.6% |
Commute Time by Sex in Sierra Madre
The most common commute times in Sierra Madre are 15 to 19 minutes (528 commuters, 21.4%) for males and 25 to 29 minutes (334 commuters, 15.2%) for females.
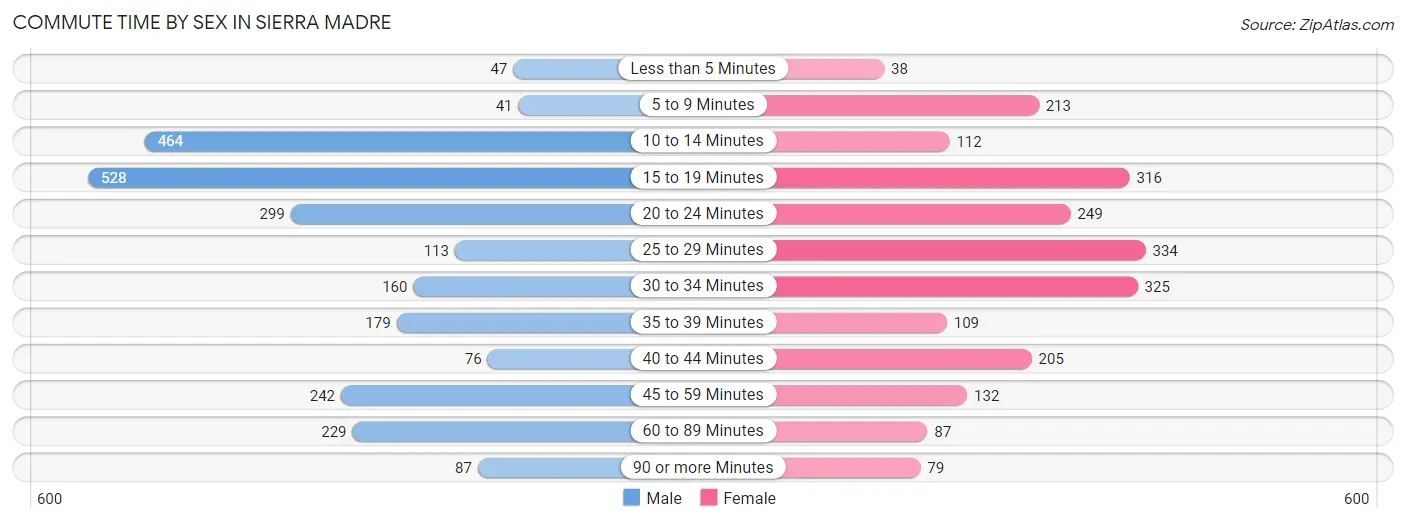
| Commute Time | Male | Female |
| Less than 5 Minutes | 47 (1.9%) | 38 (1.7%) |
| 5 to 9 Minutes | 41 (1.7%) | 213 (9.7%) |
| 10 to 14 Minutes | 464 (18.8%) | 112 (5.1%) |
| 15 to 19 Minutes | 528 (21.4%) | 316 (14.4%) |
| 20 to 24 Minutes | 299 (12.1%) | 249 (11.3%) |
| 25 to 29 Minutes | 113 (4.6%) | 334 (15.2%) |
| 30 to 34 Minutes | 160 (6.5%) | 325 (14.8%) |
| 35 to 39 Minutes | 179 (7.3%) | 109 (5.0%) |
| 40 to 44 Minutes | 76 (3.1%) | 205 (9.3%) |
| 45 to 59 Minutes | 242 (9.8%) | 132 (6.0%) |
| 60 to 89 Minutes | 229 (9.3%) | 87 (4.0%) |
| 90 or more Minutes | 87 (3.5%) | 79 (3.6%) |
Time of Departure to Work by Sex in Sierra Madre
The most frequent times of departure to work in Sierra Madre are 9:00 AM to 9:59 AM (475, 19.3%) for males and 9:00 AM to 9:59 AM (451, 20.5%) for females.
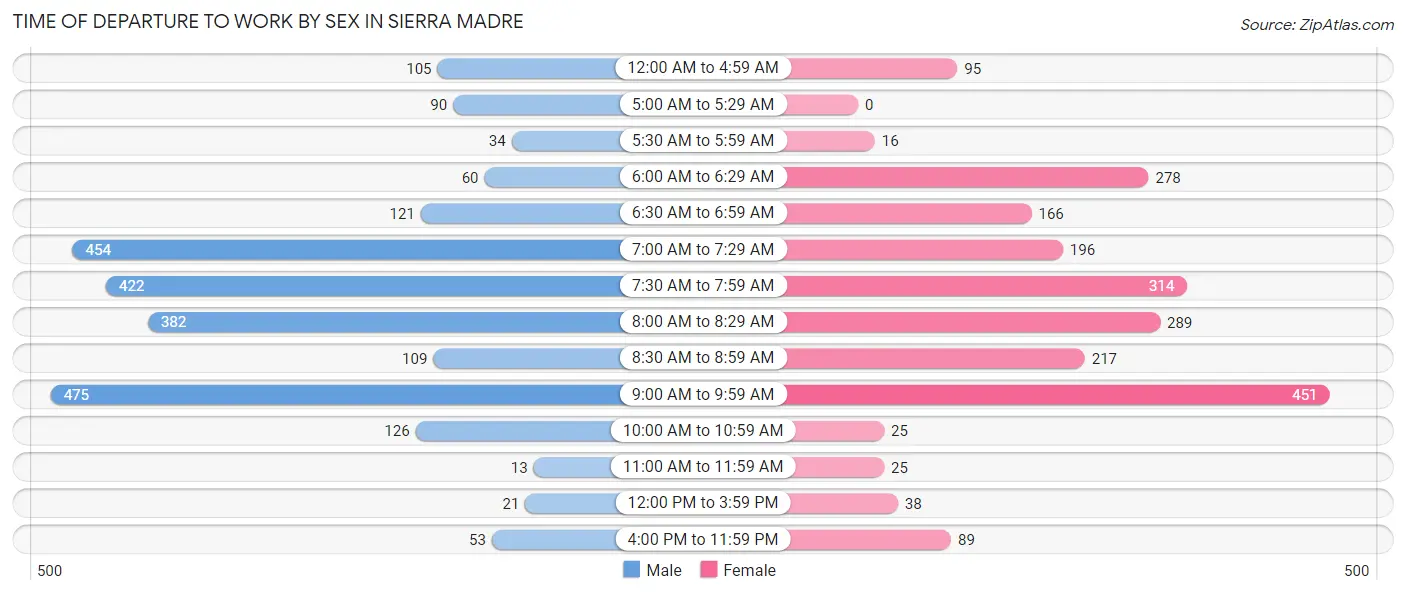
| Time of Departure | Male | Female |
| 12:00 AM to 4:59 AM | 105 (4.3%) | 95 (4.3%) |
| 5:00 AM to 5:29 AM | 90 (3.6%) | 0 (0.0%) |
| 5:30 AM to 5:59 AM | 34 (1.4%) | 16 (0.7%) |
| 6:00 AM to 6:29 AM | 60 (2.4%) | 278 (12.6%) |
| 6:30 AM to 6:59 AM | 121 (4.9%) | 166 (7.5%) |
| 7:00 AM to 7:29 AM | 454 (18.4%) | 196 (8.9%) |
| 7:30 AM to 7:59 AM | 422 (17.1%) | 314 (14.3%) |
| 8:00 AM to 8:29 AM | 382 (15.5%) | 289 (13.1%) |
| 8:30 AM to 8:59 AM | 109 (4.4%) | 217 (9.9%) |
| 9:00 AM to 9:59 AM | 475 (19.3%) | 451 (20.5%) |
| 10:00 AM to 10:59 AM | 126 (5.1%) | 25 (1.1%) |
| 11:00 AM to 11:59 AM | 13 (0.5%) | 25 (1.1%) |
| 12:00 PM to 3:59 PM | 21 (0.9%) | 38 (1.7%) |
| 4:00 PM to 11:59 PM | 53 (2.1%) | 89 (4.1%) |
| Total | 2,465 (100.0%) | 2,199 (100.0%) |
Housing Occupancy in Sierra Madre
Occupancy by Ownership in Sierra Madre
Of the total 5,018 dwellings in Sierra Madre, owner-occupied units account for 2,822 (56.2%), while renter-occupied units make up 2,196 (43.8%).
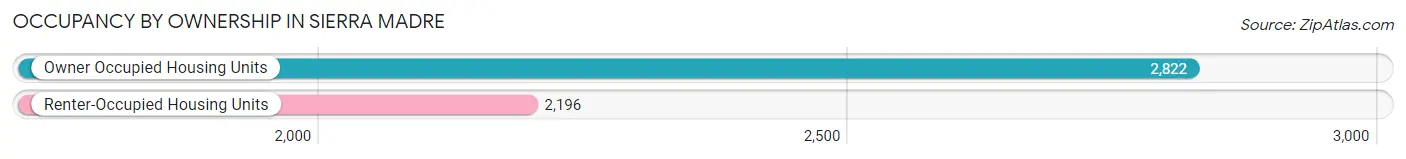
| Occupancy | # Housing Units | % Housing Units |
| Owner Occupied Housing Units | 2,822 | 56.2% |
| Renter-Occupied Housing Units | 2,196 | 43.8% |
| Total Occupied Housing Units | 5,018 | 100.0% |
Occupancy by Household Size in Sierra Madre
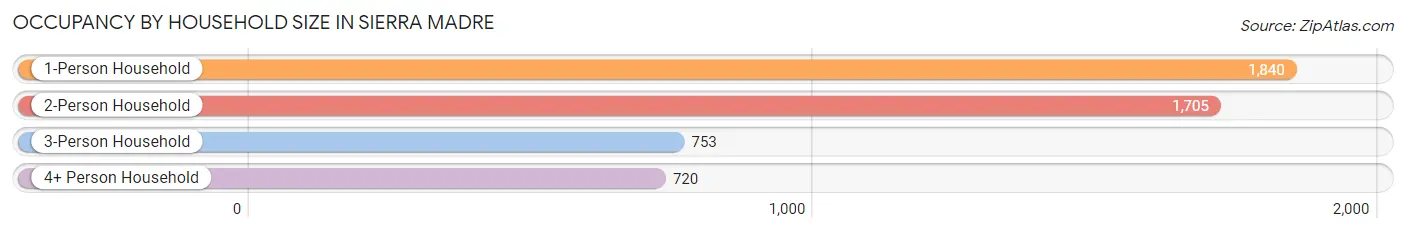
| Household Size | # Housing Units | % Housing Units |
| 1-Person Household | 1,840 | 36.7% |
| 2-Person Household | 1,705 | 34.0% |
| 3-Person Household | 753 | 15.0% |
| 4+ Person Household | 720 | 14.3% |
| Total Housing Units | 5,018 | 100.0% |
Occupancy by Ownership by Household Size in Sierra Madre
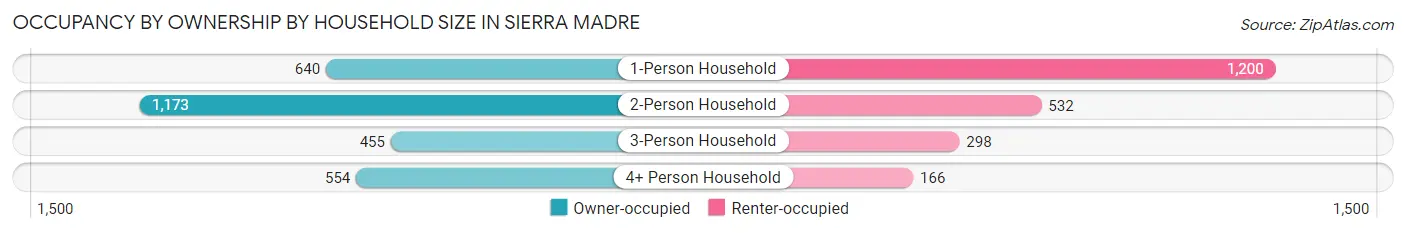
| Household Size | Owner-occupied | Renter-occupied |
| 1-Person Household | 640 (34.8%) | 1,200 (65.2%) |
| 2-Person Household | 1,173 (68.8%) | 532 (31.2%) |
| 3-Person Household | 455 (60.4%) | 298 (39.6%) |
| 4+ Person Household | 554 (76.9%) | 166 (23.1%) |
| Total Housing Units | 2,822 (56.2%) | 2,196 (43.8%) |
Occupancy by Educational Attainment in Sierra Madre
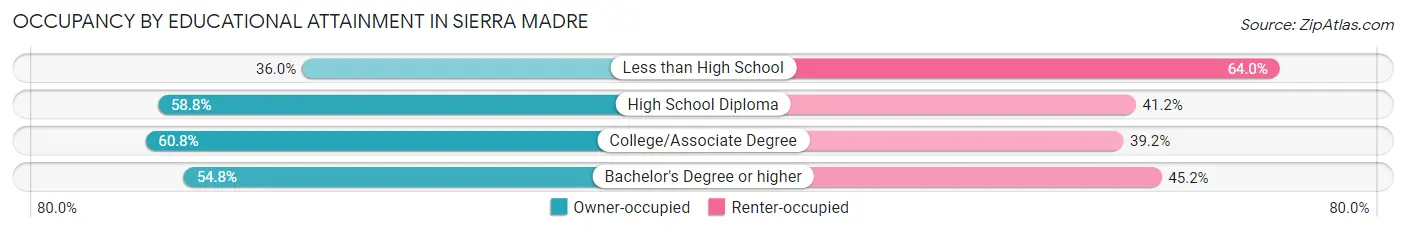
| Household Size | Owner-occupied | Renter-occupied |
| Less than High School | 9 (36.0%) | 16 (64.0%) |
| High School Diploma | 173 (58.8%) | 121 (41.2%) |
| College/Associate Degree | 668 (60.8%) | 430 (39.2%) |
| Bachelor's Degree or higher | 1,972 (54.8%) | 1,629 (45.2%) |
Occupancy by Age of Householder in Sierra Madre
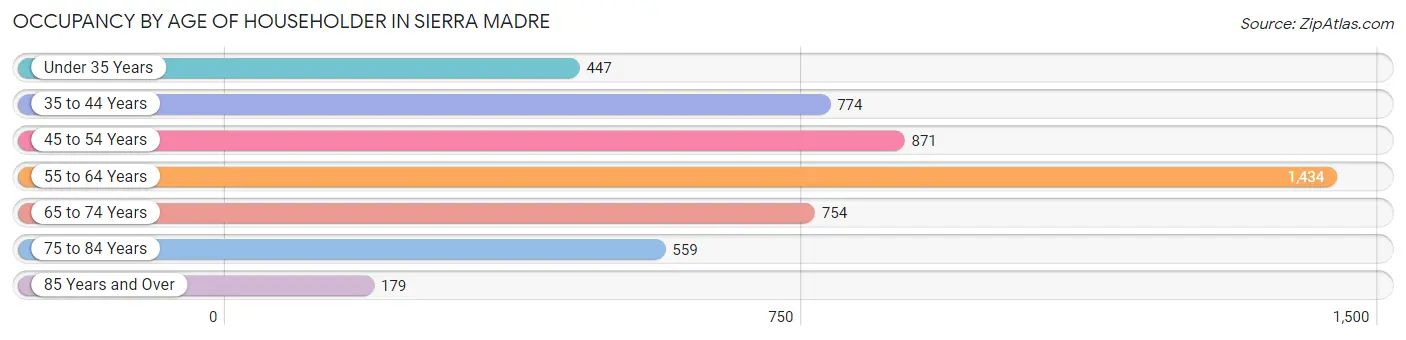
| Age Bracket | # Households | % Households |
| Under 35 Years | 447 | 8.9% |
| 35 to 44 Years | 774 | 15.4% |
| 45 to 54 Years | 871 | 17.4% |
| 55 to 64 Years | 1,434 | 28.6% |
| 65 to 74 Years | 754 | 15.0% |
| 75 to 84 Years | 559 | 11.1% |
| 85 Years and Over | 179 | 3.6% |
| Total | 5,018 | 100.0% |
Housing Finances in Sierra Madre
Median Income by Occupancy in Sierra Madre
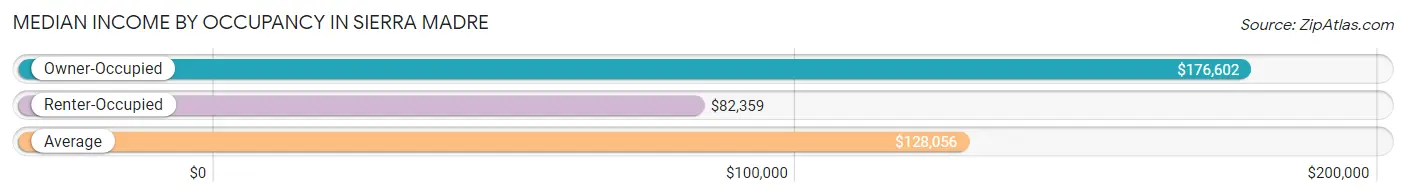
| Occupancy Type | # Households | Median Income |
| Owner-Occupied | 2,822 (56.2%) | $176,602 |
| Renter-Occupied | 2,196 (43.8%) | $82,359 |
| Average | 5,018 (100.0%) | $128,056 |
Occupancy by Householder Income Bracket in Sierra Madre
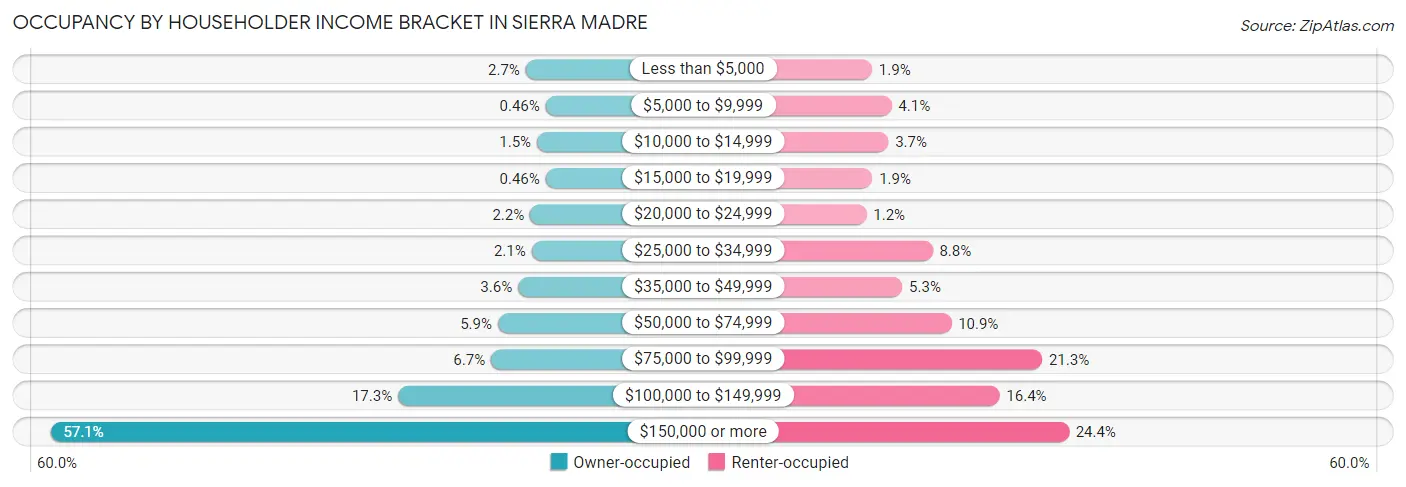
| Income Bracket | Owner-occupied | Renter-occupied |
| Less than $5,000 | 77 (2.7%) | 41 (1.9%) |
| $5,000 to $9,999 | 13 (0.5%) | 90 (4.1%) |
| $10,000 to $14,999 | 41 (1.5%) | 82 (3.7%) |
| $15,000 to $19,999 | 13 (0.5%) | 42 (1.9%) |
| $20,000 to $24,999 | 63 (2.2%) | 27 (1.2%) |
| $25,000 to $34,999 | 58 (2.1%) | 193 (8.8%) |
| $35,000 to $49,999 | 102 (3.6%) | 117 (5.3%) |
| $50,000 to $74,999 | 167 (5.9%) | 240 (10.9%) |
| $75,000 to $99,999 | 189 (6.7%) | 468 (21.3%) |
| $100,000 to $149,999 | 489 (17.3%) | 361 (16.4%) |
| $150,000 or more | 1,610 (57.1%) | 535 (24.4%) |
| Total | 2,822 (100.0%) | 2,196 (100.0%) |
Monthly Housing Cost Tiers in Sierra Madre

| Monthly Cost | Owner-occupied | Renter-occupied |
| Less than $300 | 26 (0.9%) | 0 (0.0%) |
| $300 to $499 | 117 (4.2%) | 0 (0.0%) |
| $500 to $799 | 248 (8.8%) | 0 (0.0%) |
| $800 to $999 | 111 (3.9%) | 40 (1.8%) |
| $1,000 to $1,499 | 219 (7.8%) | 360 (16.4%) |
| $1,500 to $1,999 | 254 (9.0%) | 588 (26.8%) |
| $2,000 to $2,499 | 186 (6.6%) | 702 (32.0%) |
| $2,500 to $2,999 | 219 (7.8%) | 165 (7.5%) |
| $3,000 or more | 1,442 (51.1%) | 108 (4.9%) |
| Total | 2,822 (100.0%) | 2,196 (100.0%) |
Physical Housing Characteristics in Sierra Madre
Housing Structures in Sierra Madre
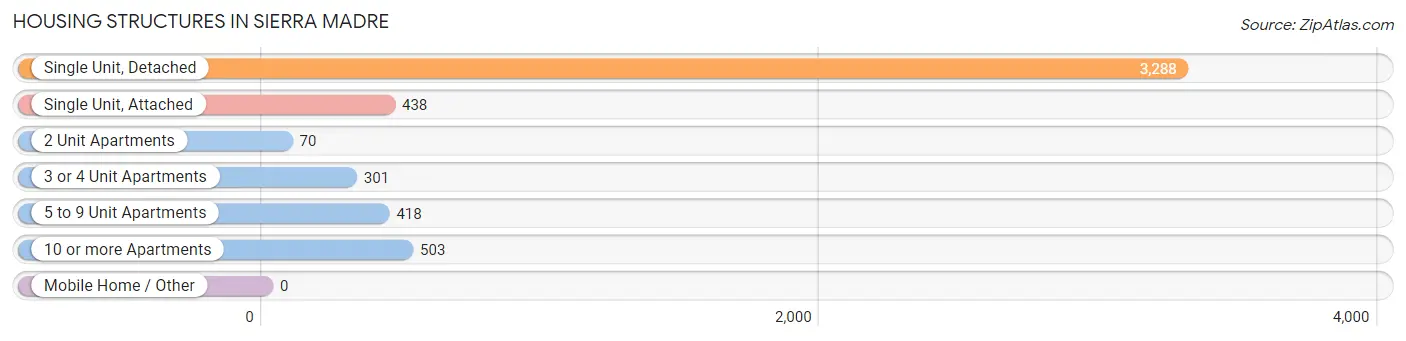
| Structure Type | # Housing Units | % Housing Units |
| Single Unit, Detached | 3,288 | 65.5% |
| Single Unit, Attached | 438 | 8.7% |
| 2 Unit Apartments | 70 | 1.4% |
| 3 or 4 Unit Apartments | 301 | 6.0% |
| 5 to 9 Unit Apartments | 418 | 8.3% |
| 10 or more Apartments | 503 | 10.0% |
| Mobile Home / Other | 0 | 0.0% |
| Total | 5,018 | 100.0% |
Housing Structures by Occupancy in Sierra Madre
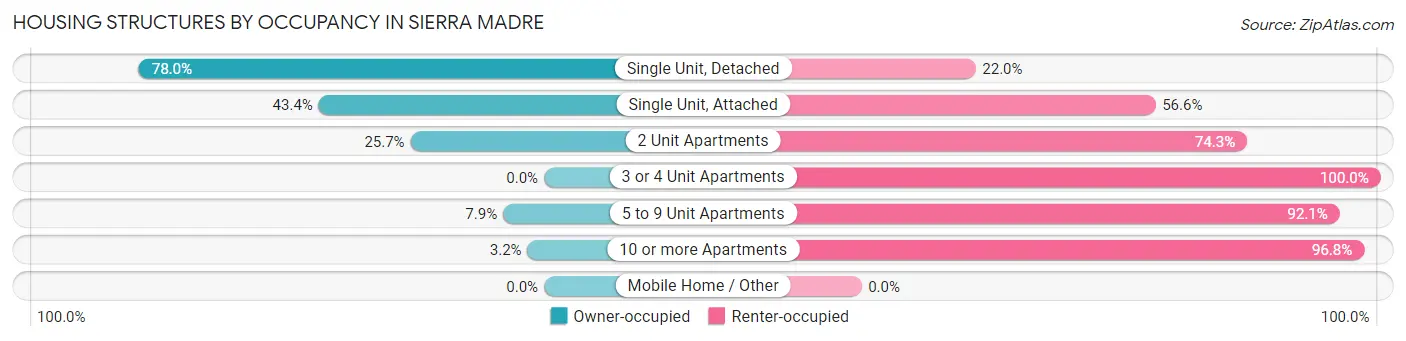
| Structure Type | Owner-occupied | Renter-occupied |
| Single Unit, Detached | 2,565 (78.0%) | 723 (22.0%) |
| Single Unit, Attached | 190 (43.4%) | 248 (56.6%) |
| 2 Unit Apartments | 18 (25.7%) | 52 (74.3%) |
| 3 or 4 Unit Apartments | 0 (0.0%) | 301 (100.0%) |
| 5 to 9 Unit Apartments | 33 (7.9%) | 385 (92.1%) |
| 10 or more Apartments | 16 (3.2%) | 487 (96.8%) |
| Mobile Home / Other | 0 (0.0%) | 0 (0.0%) |
| Total | 2,822 (56.2%) | 2,196 (43.8%) |
Housing Structures by Number of Rooms in Sierra Madre
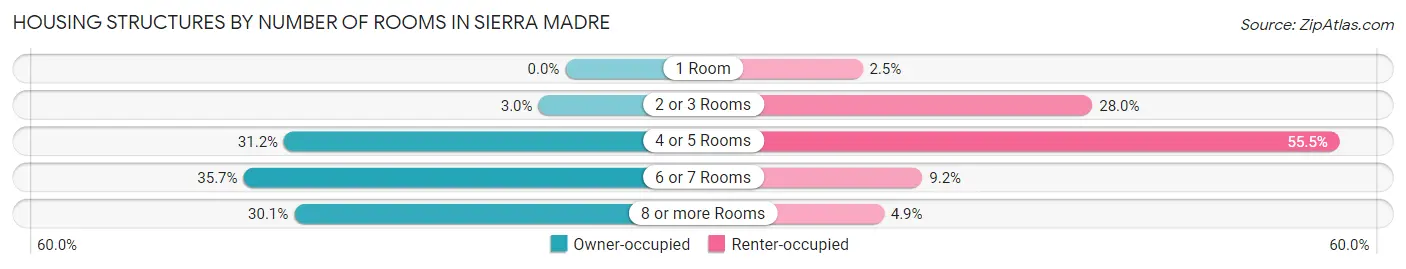
| Number of Rooms | Owner-occupied | Renter-occupied |
| 1 Room | 0 (0.0%) | 55 (2.5%) |
| 2 or 3 Rooms | 84 (3.0%) | 615 (28.0%) |
| 4 or 5 Rooms | 881 (31.2%) | 1,218 (55.5%) |
| 6 or 7 Rooms | 1,008 (35.7%) | 201 (9.1%) |
| 8 or more Rooms | 849 (30.1%) | 107 (4.9%) |
| Total | 2,822 (100.0%) | 2,196 (100.0%) |
Housing Structure by Heating Type in Sierra Madre
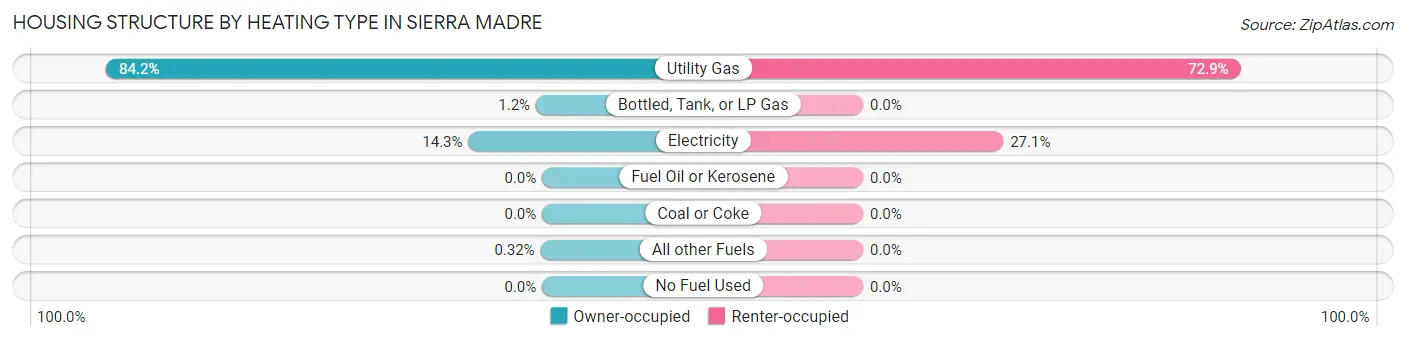
| Heating Type | Owner-occupied | Renter-occupied |
| Utility Gas | 2,377 (84.2%) | 1,601 (72.9%) |
| Bottled, Tank, or LP Gas | 34 (1.2%) | 0 (0.0%) |
| Electricity | 402 (14.2%) | 595 (27.1%) |
| Fuel Oil or Kerosene | 0 (0.0%) | 0 (0.0%) |
| Coal or Coke | 0 (0.0%) | 0 (0.0%) |
| All other Fuels | 9 (0.3%) | 0 (0.0%) |
| No Fuel Used | 0 (0.0%) | 0 (0.0%) |
| Total | 2,822 (100.0%) | 2,196 (100.0%) |
Household Vehicle Usage in Sierra Madre
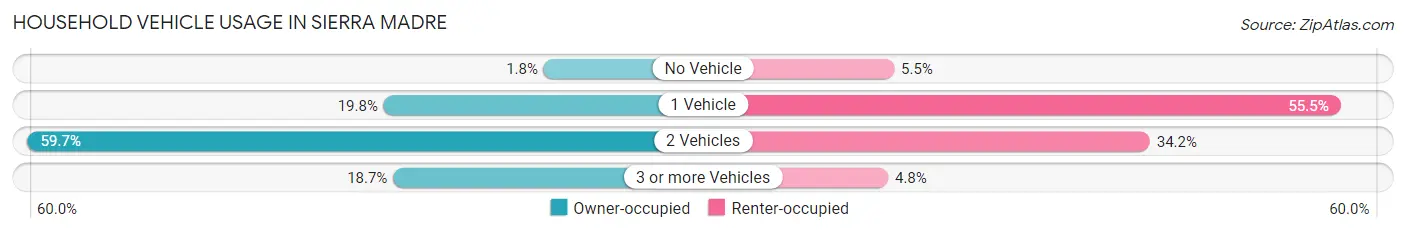
| Vehicles per Household | Owner-occupied | Renter-occupied |
| No Vehicle | 52 (1.8%) | 121 (5.5%) |
| 1 Vehicle | 558 (19.8%) | 1,219 (55.5%) |
| 2 Vehicles | 1,684 (59.7%) | 750 (34.2%) |
| 3 or more Vehicles | 528 (18.7%) | 106 (4.8%) |
| Total | 2,822 (100.0%) | 2,196 (100.0%) |
Real Estate & Mortgages in Sierra Madre
Real Estate and Mortgage Overview in Sierra Madre
| Characteristic | Without Mortgage | With Mortgage |
| Housing Units | 986 | 1,836 |
| Median Property Value | $1,029,400 | $1,187,100 |
| Median Household Income | $93,214 | $1,366 |
| Monthly Housing Costs | $990 | $1,433 |
| Real Estate Taxes | $6,364 | $0 |
Property Value by Mortgage Status in Sierra Madre
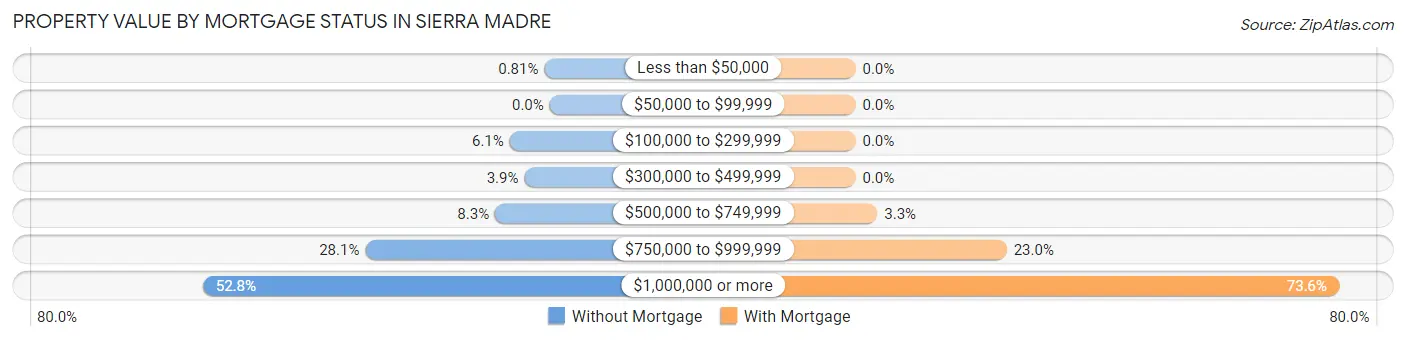
| Property Value | Without Mortgage | With Mortgage |
| Less than $50,000 | 8 (0.8%) | 0 (0.0%) |
| $50,000 to $99,999 | 0 (0.0%) | 0 (0.0%) |
| $100,000 to $299,999 | 60 (6.1%) | 0 (0.0%) |
| $300,000 to $499,999 | 38 (3.8%) | 0 (0.0%) |
| $500,000 to $749,999 | 82 (8.3%) | 61 (3.3%) |
| $750,000 to $999,999 | 277 (28.1%) | 423 (23.0%) |
| $1,000,000 or more | 521 (52.8%) | 1,352 (73.6%) |
| Total | 986 (100.0%) | 1,836 (100.0%) |
Household Income by Mortgage Status in Sierra Madre
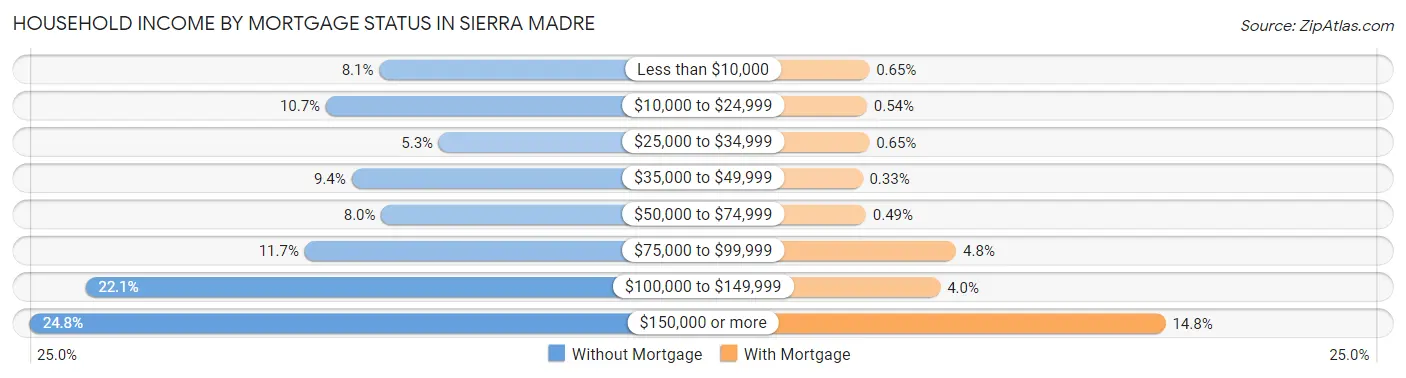
| Household Income | Without Mortgage | With Mortgage |
| Less than $10,000 | 80 (8.1%) | 12 (0.6%) |
| $10,000 to $24,999 | 105 (10.6%) | 10 (0.5%) |
| $25,000 to $34,999 | 52 (5.3%) | 12 (0.6%) |
| $35,000 to $49,999 | 93 (9.4%) | 6 (0.3%) |
| $50,000 to $74,999 | 79 (8.0%) | 9 (0.5%) |
| $75,000 to $99,999 | 115 (11.7%) | 88 (4.8%) |
| $100,000 to $149,999 | 218 (22.1%) | 74 (4.0%) |
| $150,000 or more | 244 (24.7%) | 271 (14.8%) |
| Total | 986 (100.0%) | 1,836 (100.0%) |
Property Value to Household Income Ratio in Sierra Madre
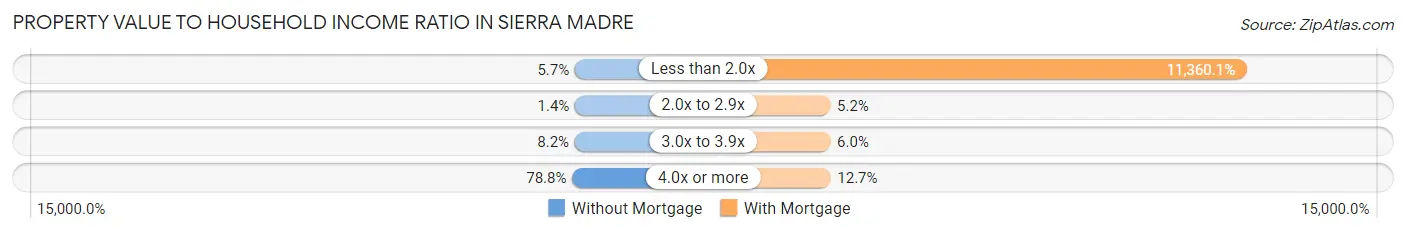
| Value-to-Income Ratio | Without Mortgage | With Mortgage |
| Less than 2.0x | 56 (5.7%) | 208,571 (11,360.1%) |
| 2.0x to 2.9x | 14 (1.4%) | 95 (5.2%) |
| 3.0x to 3.9x | 81 (8.2%) | 110 (6.0%) |
| 4.0x or more | 777 (78.8%) | 233 (12.7%) |
| Total | 986 (100.0%) | 1,836 (100.0%) |
Real Estate Taxes by Mortgage Status in Sierra Madre
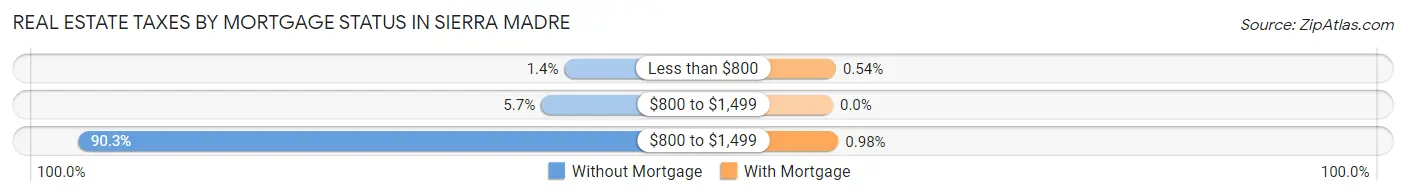
| Property Taxes | Without Mortgage | With Mortgage |
| Less than $800 | 14 (1.4%) | 10 (0.5%) |
| $800 to $1,499 | 56 (5.7%) | 0 (0.0%) |
| $800 to $1,499 | 890 (90.3%) | 18 (1.0%) |
| Total | 986 (100.0%) | 1,836 (100.0%) |
Health & Disability in Sierra Madre
Health Insurance Coverage by Age in Sierra Madre
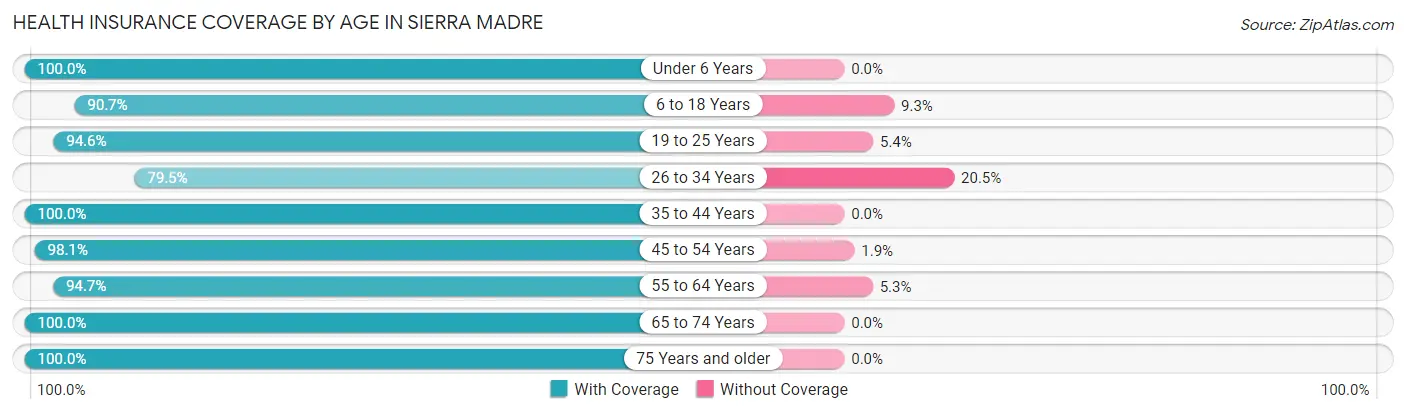
| Age Bracket | With Coverage | Without Coverage |
| Under 6 Years | 672 (100.0%) | 0 (0.0%) |
| 6 to 18 Years | 1,259 (90.7%) | 129 (9.3%) |
| 19 to 25 Years | 441 (94.6%) | 25 (5.4%) |
| 26 to 34 Years | 928 (79.5%) | 239 (20.5%) |
| 35 to 44 Years | 1,549 (100.0%) | 0 (0.0%) |
| 45 to 54 Years | 1,418 (98.1%) | 27 (1.9%) |
| 55 to 64 Years | 2,019 (94.7%) | 113 (5.3%) |
| 65 to 74 Years | 1,209 (100.0%) | 0 (0.0%) |
| 75 Years and older | 1,109 (100.0%) | 0 (0.0%) |
| Total | 10,604 (95.2%) | 533 (4.8%) |
Health Insurance Coverage by Citizenship Status in Sierra Madre
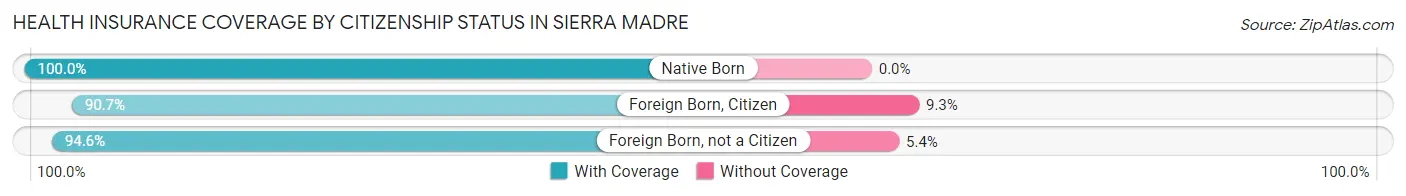
| Citizenship Status | With Coverage | Without Coverage |
| Native Born | 672 (100.0%) | 0 (0.0%) |
| Foreign Born, Citizen | 1,259 (90.7%) | 129 (9.3%) |
| Foreign Born, not a Citizen | 441 (94.6%) | 25 (5.4%) |
Health Insurance Coverage by Household Income in Sierra Madre
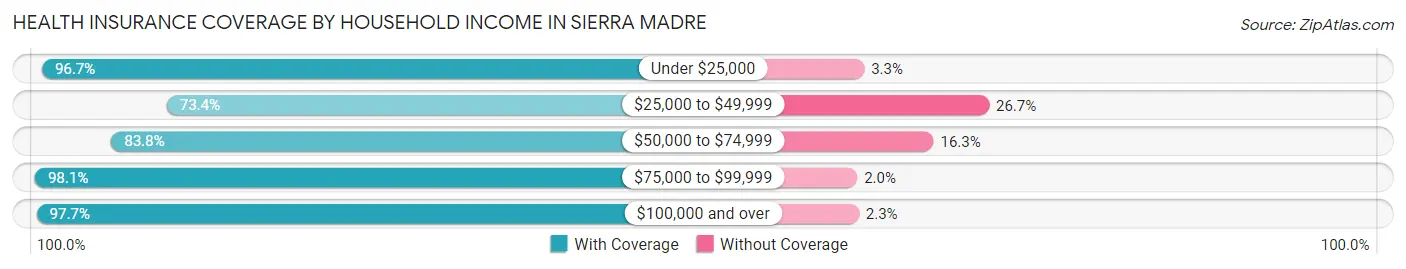
| Household Income | With Coverage | Without Coverage |
| Under $25,000 | 713 (96.7%) | 24 (3.3%) |
| $25,000 to $49,999 | 501 (73.4%) | 182 (26.7%) |
| $50,000 to $74,999 | 665 (83.8%) | 129 (16.3%) |
| $75,000 to $99,999 | 1,054 (98.1%) | 21 (1.9%) |
| $100,000 and over | 7,651 (97.7%) | 177 (2.3%) |
Public vs Private Health Insurance Coverage by Age in Sierra Madre
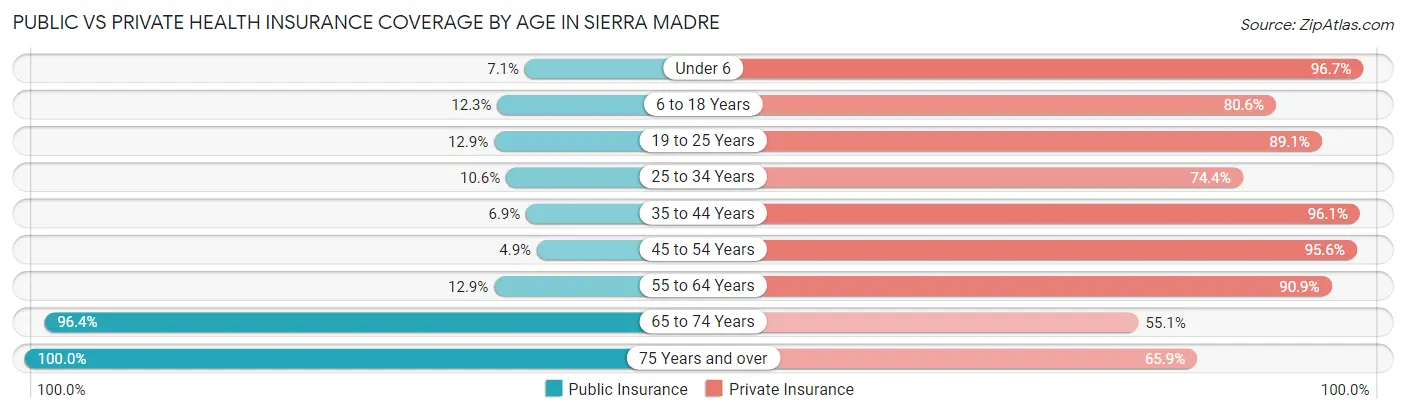
| Age Bracket | Public Insurance | Private Insurance |
| Under 6 | 48 (7.1%) | 650 (96.7%) |
| 6 to 18 Years | 170 (12.2%) | 1,118 (80.5%) |
| 19 to 25 Years | 60 (12.9%) | 415 (89.1%) |
| 25 to 34 Years | 124 (10.6%) | 868 (74.4%) |
| 35 to 44 Years | 107 (6.9%) | 1,489 (96.1%) |
| 45 to 54 Years | 71 (4.9%) | 1,381 (95.6%) |
| 55 to 64 Years | 274 (12.9%) | 1,937 (90.8%) |
| 65 to 74 Years | 1,165 (96.4%) | 666 (55.1%) |
| 75 Years and over | 1,109 (100.0%) | 731 (65.9%) |
| Total | 3,128 (28.1%) | 9,255 (83.1%) |
Disability Status by Sex by Age in Sierra Madre
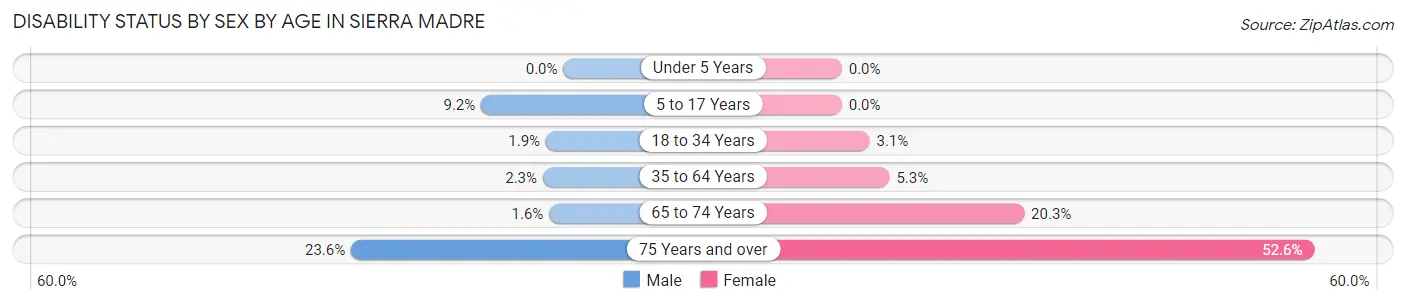
| Age Bracket | Male | Female |
| Under 5 Years | 0 (0.0%) | 0 (0.0%) |
| 5 to 17 Years | 64 (9.2%) | 0 (0.0%) |
| 18 to 34 Years | 19 (1.9%) | 21 (3.1%) |
| 35 to 64 Years | 53 (2.3%) | 149 (5.3%) |
| 65 to 74 Years | 8 (1.6%) | 143 (20.3%) |
| 75 Years and over | 104 (23.6%) | 352 (52.6%) |
Disability Class by Sex by Age in Sierra Madre
Disability Class: Hearing Difficulty
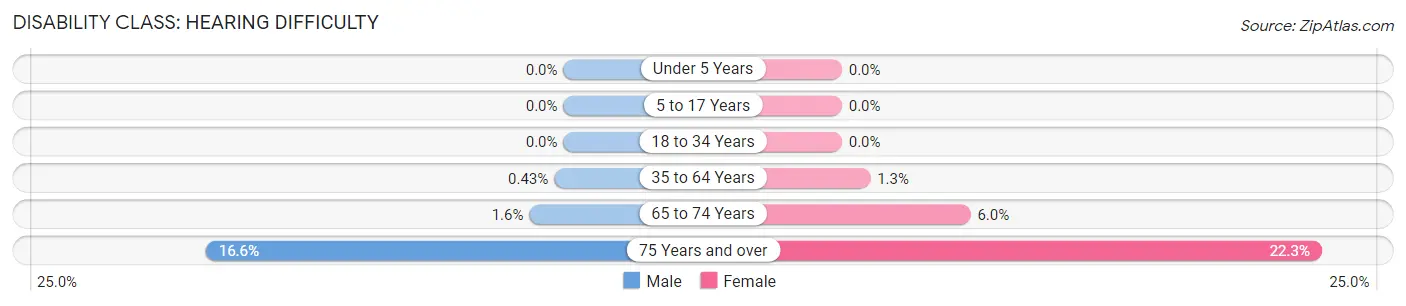
| Age Bracket | Male | Female |
| Under 5 Years | 0 (0.0%) | 0 (0.0%) |
| 5 to 17 Years | 0 (0.0%) | 0 (0.0%) |
| 18 to 34 Years | 0 (0.0%) | 0 (0.0%) |
| 35 to 64 Years | 10 (0.4%) | 37 (1.3%) |
| 65 to 74 Years | 8 (1.6%) | 42 (6.0%) |
| 75 Years and over | 73 (16.6%) | 149 (22.3%) |
Disability Class: Vision Difficulty
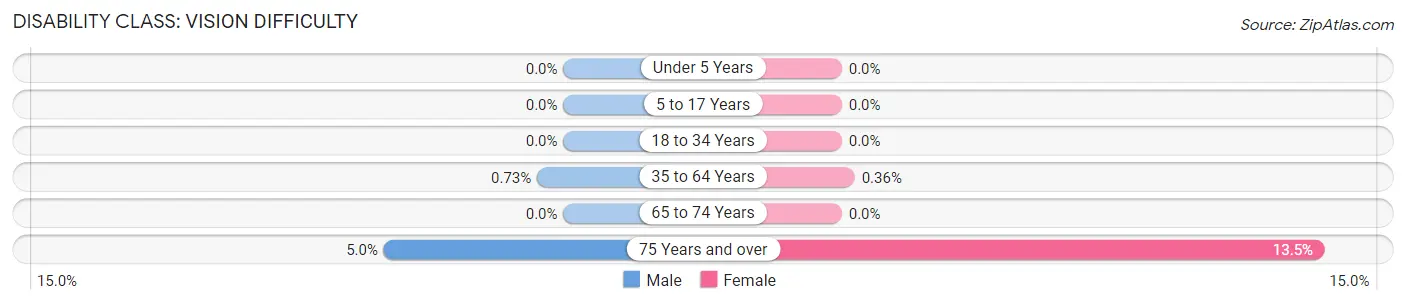
| Age Bracket | Male | Female |
| Under 5 Years | 0 (0.0%) | 0 (0.0%) |
| 5 to 17 Years | 0 (0.0%) | 0 (0.0%) |
| 18 to 34 Years | 0 (0.0%) | 0 (0.0%) |
| 35 to 64 Years | 17 (0.7%) | 10 (0.4%) |
| 65 to 74 Years | 0 (0.0%) | 0 (0.0%) |
| 75 Years and over | 22 (5.0%) | 90 (13.5%) |
Disability Class: Cognitive Difficulty
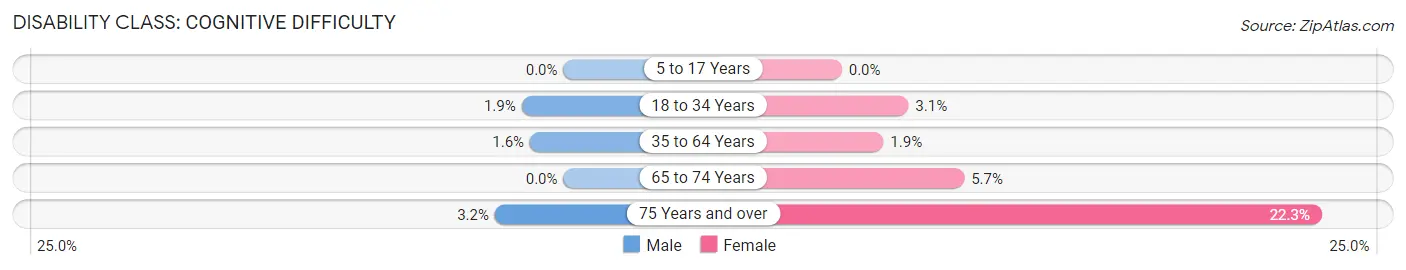
| Age Bracket | Male | Female |
| 5 to 17 Years | 0 (0.0%) | 0 (0.0%) |
| 18 to 34 Years | 19 (1.9%) | 21 (3.1%) |
| 35 to 64 Years | 36 (1.5%) | 54 (1.9%) |
| 65 to 74 Years | 0 (0.0%) | 40 (5.7%) |
| 75 Years and over | 14 (3.2%) | 149 (22.3%) |
Disability Class: Ambulatory Difficulty
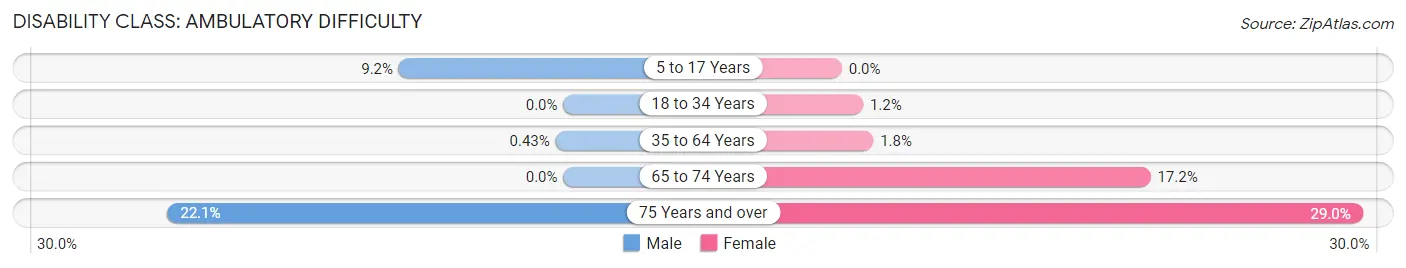
| Age Bracket | Male | Female |
| 5 to 17 Years | 64 (9.2%) | 0 (0.0%) |
| 18 to 34 Years | 0 (0.0%) | 8 (1.2%) |
| 35 to 64 Years | 10 (0.4%) | 49 (1.8%) |
| 65 to 74 Years | 0 (0.0%) | 121 (17.2%) |
| 75 Years and over | 97 (22.1%) | 194 (29.0%) |
Disability Class: Self-Care Difficulty
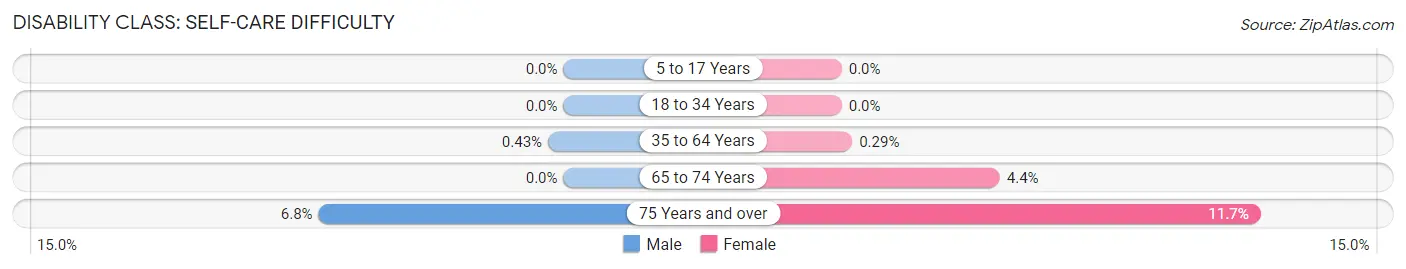
| Age Bracket | Male | Female |
| 5 to 17 Years | 0 (0.0%) | 0 (0.0%) |
| 18 to 34 Years | 0 (0.0%) | 0 (0.0%) |
| 35 to 64 Years | 10 (0.4%) | 8 (0.3%) |
| 65 to 74 Years | 0 (0.0%) | 31 (4.4%) |
| 75 Years and over | 30 (6.8%) | 78 (11.7%) |
Technology Access in Sierra Madre
Computing Device Access in Sierra Madre
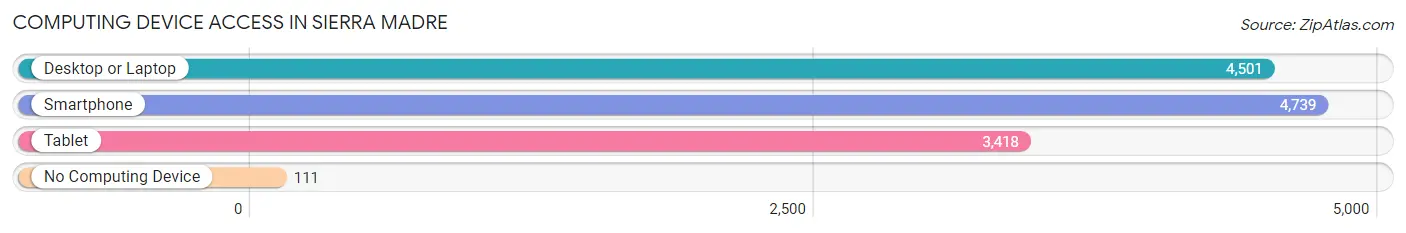
| Device Type | # Households | % Households |
| Desktop or Laptop | 4,501 | 89.7% |
| Smartphone | 4,739 | 94.4% |
| Tablet | 3,418 | 68.1% |
| No Computing Device | 111 | 2.2% |
| Total | 5,018 | 100.0% |
Internet Access in Sierra Madre
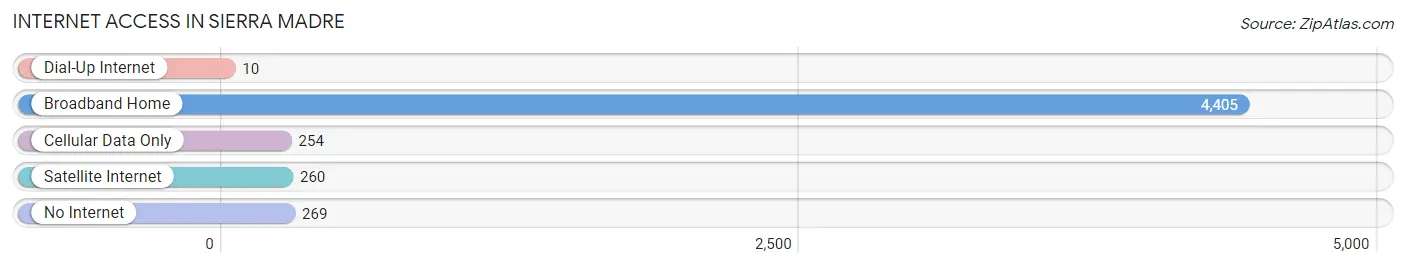
| Internet Type | # Households | % Households |
| Dial-Up Internet | 10 | 0.2% |
| Broadband Home | 4,405 | 87.8% |
| Cellular Data Only | 254 | 5.1% |
| Satellite Internet | 260 | 5.2% |
| No Internet | 269 | 5.4% |
| Total | 5,018 | 100.0% |
Sierra Madre Summary
Sierra Madre is a small city located in Los Angeles County, California. It is situated in the foothills of the San Gabriel Mountains, about 11 miles northeast of downtown Los Angeles. The city has a population of approximately 10,917 people, according to the 2010 United States Census.
History
Sierra Madre was founded in 1881 by a group of settlers from the Midwest. The city was named after the Sierra Madre mountain range in Mexico. The settlers were attracted to the area due to its mild climate and abundant natural resources. The city was incorporated in 1907 and has since grown to become a popular residential community.
Geography
Sierra Madre is located in the foothills of the San Gabriel Mountains, about 11 miles northeast of downtown Los Angeles. The city has a total area of 4.2 square miles, all of which is land. The city is bordered by Pasadena to the north, Arcadia to the east, and Monrovia to the south. The city is located at an elevation of 1,400 feet above sea level.
Climate
Sierra Madre has a Mediterranean climate, with hot, dry summers and mild, wet winters. The average high temperature in the summer is around 85°F, while the average low temperature in the winter is around 45°F. The city receives an average of 15 inches of rain per year.
Economy
Sierra Madre is a primarily residential community, with a small commercial district located in the downtown area. The city is home to a variety of small businesses, including restaurants, retail stores, and professional services. The city also has a thriving arts and culture scene, with several galleries and performance venues.
Demographics
As of the 2010 United States Census, Sierra Madre had a population of 10,917 people. The racial makeup of the city was 79.2% White, 0.7% African American, 0.3% Native American, 11.2% Asian, 0.1% Pacific Islander, 5.2% from other races, and 3.3% from two or more races. The median household income was $87,813, and the median family income was $103,945.
Conclusion
Sierra Madre is a small city located in Los Angeles County, California. It is situated in the foothills of the San Gabriel Mountains, about 11 miles northeast of downtown Los Angeles. The city has a population of approximately 10,917 people, according to the 2010 United States Census. Sierra Madre has a Mediterranean climate, with hot, dry summers and mild, wet winters. The city is a primarily residential community, with a small commercial district located in the downtown area. The racial makeup of the city was 79.2% White, 0.7% African American, 0.3% Native American, 11.2% Asian, 0.1% Pacific Islander, 5.2% from other races, and 3.3% from two or more races. The median household income was $87,813, and the median family income was $103,945. Sierra Madre is a popular residential community, with a thriving arts and culture scene.
Common Questions
What is Per Capita Income in Sierra Madre?
Per Capita income in Sierra Madre is $80,210.
What is the Median Family Income in Sierra Madre?
Median Family Income in Sierra Madre is $175,230.
What is the Median Household income in Sierra Madre?
Median Household Income in Sierra Madre is $128,056.
What is Income or Wage Gap in Sierra Madre?
Income or Wage Gap in Sierra Madre is 39.3%.
Women in Sierra Madre earn 60.7 cents for every dollar earned by a man.
What is Inequality or Gini Index in Sierra Madre?
Inequality or Gini Index in Sierra Madre is 0.49.
What is the Total Population of Sierra Madre?
Total Population of Sierra Madre is 11,151.
What is the Total Male Population of Sierra Madre?
Total Male Population of Sierra Madre is 5,280.
What is the Total Female Population of Sierra Madre?
Total Female Population of Sierra Madre is 5,871.
What is the Ratio of Males per 100 Females in Sierra Madre?
There are 89.93 Males per 100 Females in Sierra Madre.
What is the Ratio of Females per 100 Males in Sierra Madre?
There are 111.19 Females per 100 Males in Sierra Madre.
What is the Median Population Age in Sierra Madre?
Median Population Age in Sierra Madre is 46.6 Years.
What is the Average Family Size in Sierra Madre
Average Family Size in Sierra Madre is 3.0 People.
What is the Average Household Size in Sierra Madre
Average Household Size in Sierra Madre is 2.2 People.
How Large is the Labor Force in Sierra Madre?
There are 6,347 People in the Labor Forcein in Sierra Madre.
What is the Percentage of People in the Labor Force in Sierra Madre?
68.2% of People are in the Labor Force in Sierra Madre.
What is the Unemployment Rate in Sierra Madre?
Unemployment Rate in Sierra Madre is 3.2%.