Prairie Du Chien, WI Map & Demographics
Prairie Du Chien Map
Prairie Du Chien Overview
$28,255
PER CAPITA INCOME
$71,042
AVG FAMILY INCOME
$52,400
AVG HOUSEHOLD INCOME
17.5%
WAGE / INCOME GAP [ % ]
82.5¢/ $1
WAGE / INCOME GAP [ $ ]
0.39
INEQUALITY / GINI INDEX
5,502
TOTAL POPULATION
2,951
MALE POPULATION
2,551
FEMALE POPULATION
115.68
MALES / 100 FEMALES
86.45
FEMALES / 100 MALES
45.7
MEDIAN AGE
2.9
AVG FAMILY SIZE
2.2
AVG HOUSEHOLD SIZE
2,440
LABOR FORCE [ PEOPLE ]
53.0%
PERCENT IN LABOR FORCE
1.6%
UNEMPLOYMENT RATE
Prairie Du Chien Zip Codes
Prairie Du Chien Area Codes
Income in Prairie Du Chien
Income Overview in Prairie Du Chien
Per Capita Income in Prairie Du Chien is $28,255, while median incomes of families and households are $71,042 and $52,400 respectively.
| Characteristic | Number | Measure |
| Per Capita Income | 5,502 | $28,255 |
| Median Family Income | 1,273 | $71,042 |
| Mean Family Income | 1,273 | $78,536 |
| Median Household Income | 2,162 | $52,400 |
| Mean Household Income | 2,162 | $66,219 |
| Income Deficit | 1,273 | $0 |
| Wage / Income Gap (%) | 5,502 | 17.52% |
| Wage / Income Gap ($) | 5,502 | 82.48¢ per $1 |
| Gini / Inequality Index | 5,502 | 0.39 |
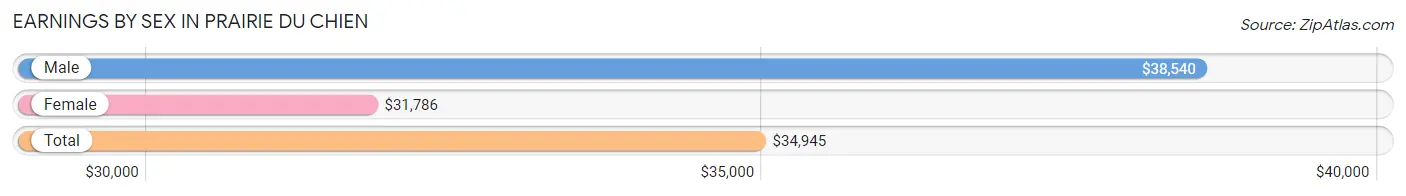
Earnings by Sex in Prairie Du Chien
Average Earnings in Prairie Du Chien are $34,945, $38,540 for men and $31,786 for women, a difference of 17.5%.
| Sex | Number | Average Earnings |
| Male | 1,443 (54.1%) | $38,540 |
| Female | 1,226 (45.9%) | $31,786 |
| Total | 2,669 (100.0%) | $34,945 |
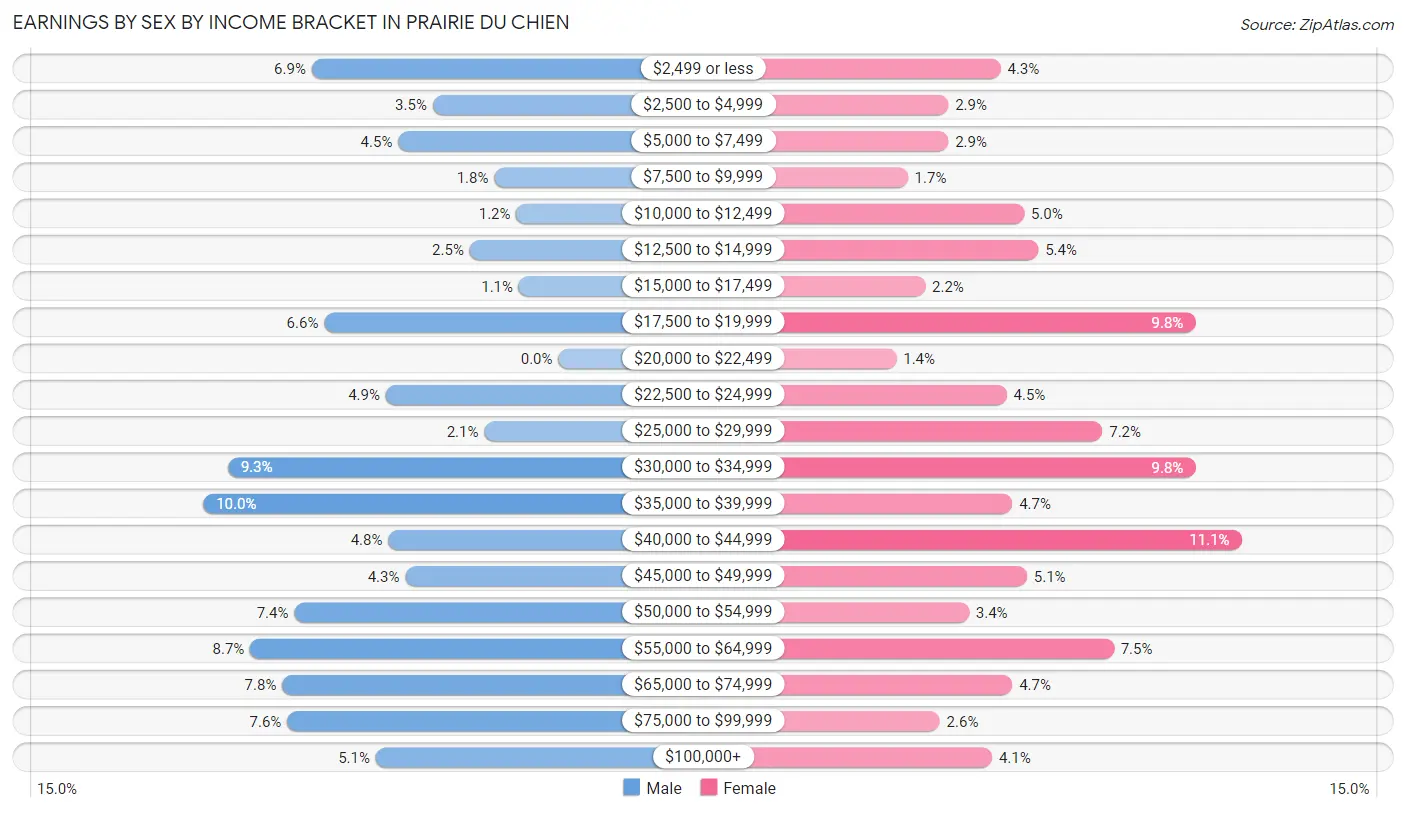
Earnings by Sex by Income Bracket in Prairie Du Chien
The most common earnings brackets in Prairie Du Chien are $35,000 to $39,999 for men (144 | 10.0%) and $40,000 to $44,999 for women (136 | 11.1%).
| Income | Male | Female |
| $2,499 or less | 100 (6.9%) | 53 (4.3%) |
| $2,500 to $4,999 | 51 (3.5%) | 35 (2.9%) |
| $5,000 to $7,499 | 65 (4.5%) | 35 (2.9%) |
| $7,500 to $9,999 | 26 (1.8%) | 21 (1.7%) |
| $10,000 to $12,499 | 17 (1.2%) | 61 (5.0%) |
| $12,500 to $14,999 | 36 (2.5%) | 66 (5.4%) |
| $15,000 to $17,499 | 16 (1.1%) | 27 (2.2%) |
| $17,500 to $19,999 | 95 (6.6%) | 120 (9.8%) |
| $20,000 to $22,499 | 0 (0.0%) | 17 (1.4%) |
| $22,500 to $24,999 | 70 (4.9%) | 55 (4.5%) |
| $25,000 to $29,999 | 30 (2.1%) | 88 (7.2%) |
| $30,000 to $34,999 | 134 (9.3%) | 120 (9.8%) |
| $35,000 to $39,999 | 144 (10.0%) | 57 (4.6%) |
| $40,000 to $44,999 | 69 (4.8%) | 136 (11.1%) |
| $45,000 to $49,999 | 62 (4.3%) | 62 (5.1%) |
| $50,000 to $54,999 | 107 (7.4%) | 42 (3.4%) |
| $55,000 to $64,999 | 125 (8.7%) | 92 (7.5%) |
| $65,000 to $74,999 | 112 (7.8%) | 57 (4.6%) |
| $75,000 to $99,999 | 110 (7.6%) | 32 (2.6%) |
| $100,000+ | 74 (5.1%) | 50 (4.1%) |
| Total | 1,443 (100.0%) | 1,226 (100.0%) |
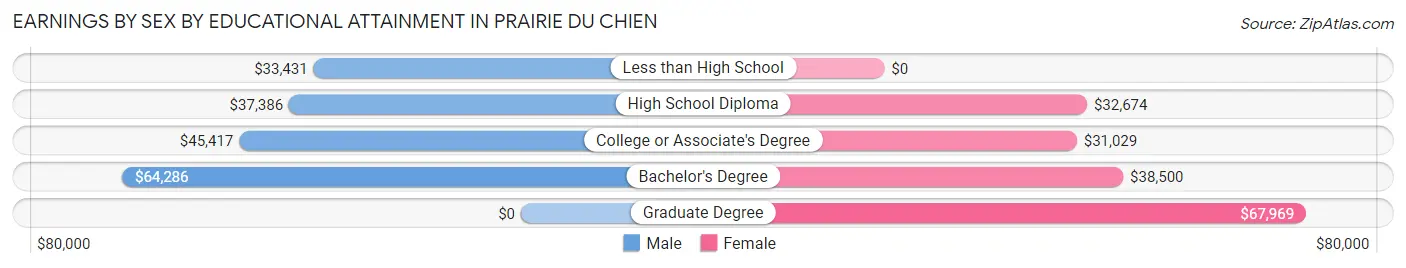
Earnings by Sex by Educational Attainment in Prairie Du Chien
Average earnings in Prairie Du Chien are $41,830 for men and $33,944 for women, a difference of 18.9%. Men with an educational attainment of bachelor's degree enjoy the highest average annual earnings of $64,286, while those with less than high school education earn the least with $33,431. Women with an educational attainment of graduate degree earn the most with the average annual earnings of $67,969, while those with college or associate's degree education have the smallest earnings of $31,029.
| Educational Attainment | Male Income | Female Income |
| Less than High School | $33,431 | $0 |
| High School Diploma | $37,386 | $32,674 |
| College or Associate's Degree | $45,417 | $31,029 |
| Bachelor's Degree | $64,286 | $38,500 |
| Graduate Degree | - | - |
| Total | $41,830 | $33,944 |
Family Income in Prairie Du Chien
Family Income Brackets in Prairie Du Chien
According to the Prairie Du Chien family income data, there are 271 families falling into the $75,000 to $99,999 income range, which is the most common income bracket and makes up 21.3% of all families. Conversely, the less than $10,000 income bracket is the least frequent group with only 14 families (1.1%) belonging to this category.
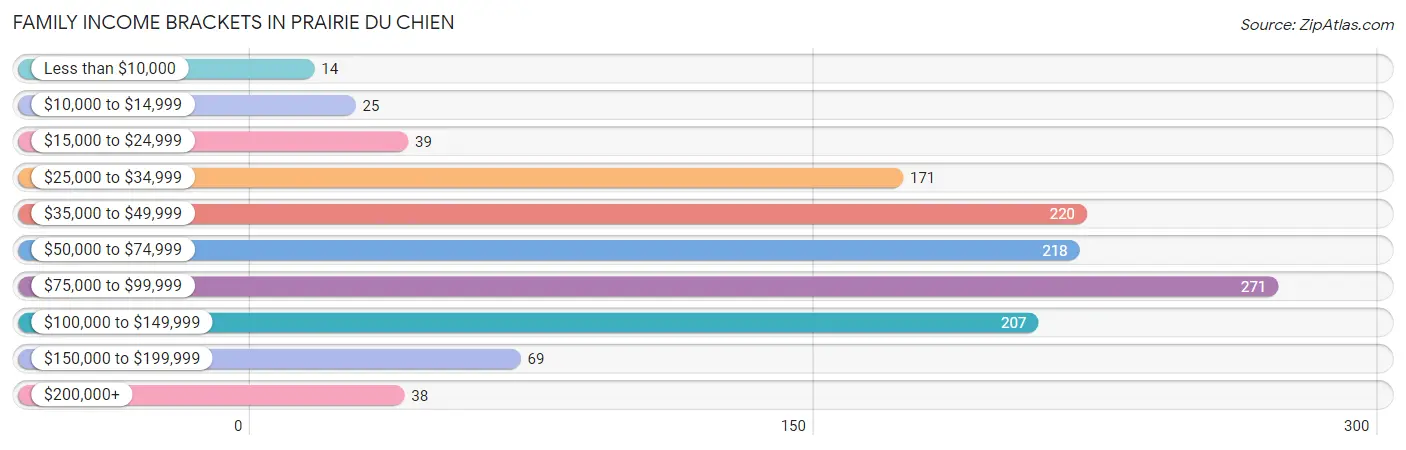
| Income Bracket | # Families | % Families |
| Less than $10,000 | 14 | 1.1% |
| $10,000 to $14,999 | 25 | 2.0% |
| $15,000 to $24,999 | 39 | 3.1% |
| $25,000 to $34,999 | 171 | 13.4% |
| $35,000 to $49,999 | 220 | 17.3% |
| $50,000 to $74,999 | 218 | 17.1% |
| $75,000 to $99,999 | 271 | 21.3% |
| $100,000 to $149,999 | 207 | 16.3% |
| $150,000 to $199,999 | 69 | 5.4% |
| $200,000+ | 38 | 3.0% |
Family Income by Famaliy Size in Prairie Du Chien
5-person families (34 | 2.7%) account for the highest median family income in Prairie Du Chien with $118,500 per family, while 2-person families (805 | 63.2%) have the highest median income of $31,188 per family member.
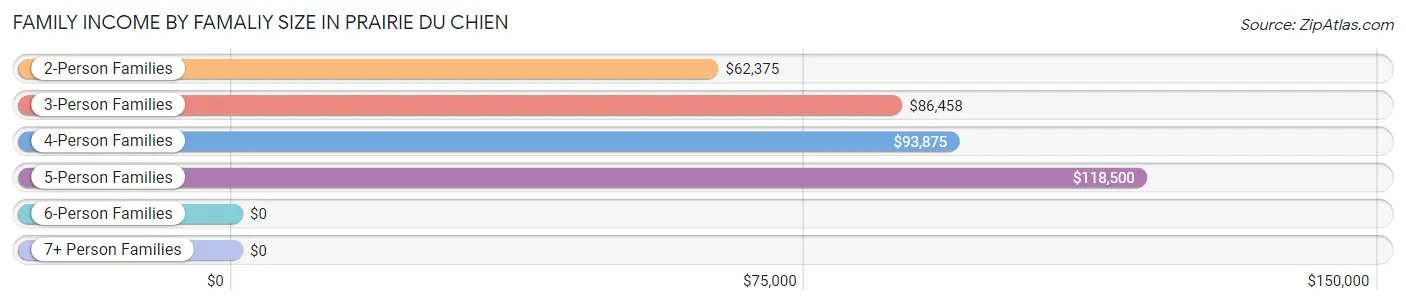
| Income Bracket | # Families | Median Income |
| 2-Person Families | 805 (63.2%) | $62,375 |
| 3-Person Families | 195 (15.3%) | $86,458 |
| 4-Person Families | 176 (13.8%) | $93,875 |
| 5-Person Families | 34 (2.7%) | $118,500 |
| 6-Person Families | 57 (4.5%) | $0 |
| 7+ Person Families | 6 (0.5%) | $0 |
| Total | 1,273 (100.0%) | $71,042 |
Family Income by Number of Earners in Prairie Du Chien
The median family income in Prairie Du Chien is $71,042, with families comprising 3+ earners (108) having the highest median family income of $106,029, while families with no earners (301) have the lowest median family income of $42,625, accounting for 8.5% and 23.6% of families, respectively.
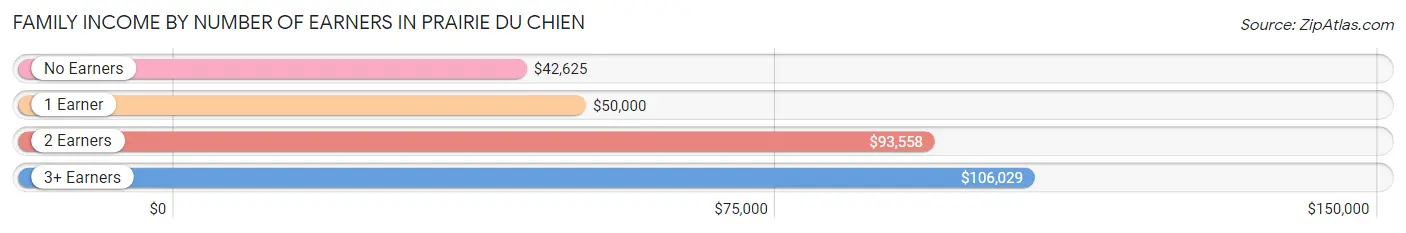
| Number of Earners | # Families | Median Income |
| No Earners | 301 (23.6%) | $42,625 |
| 1 Earner | 432 (33.9%) | $50,000 |
| 2 Earners | 432 (33.9%) | $93,558 |
| 3+ Earners | 108 (8.5%) | $106,029 |
| Total | 1,273 (100.0%) | $71,042 |
Household Income in Prairie Du Chien
Household Income Brackets in Prairie Du Chien
With 417 households falling in the category, the $50,000 to $74,999 income range is the most frequent in Prairie Du Chien, accounting for 19.3% of all households. In contrast, only 54 households (2.5%) fall into the $200,000+ income bracket, making it the least populous group.
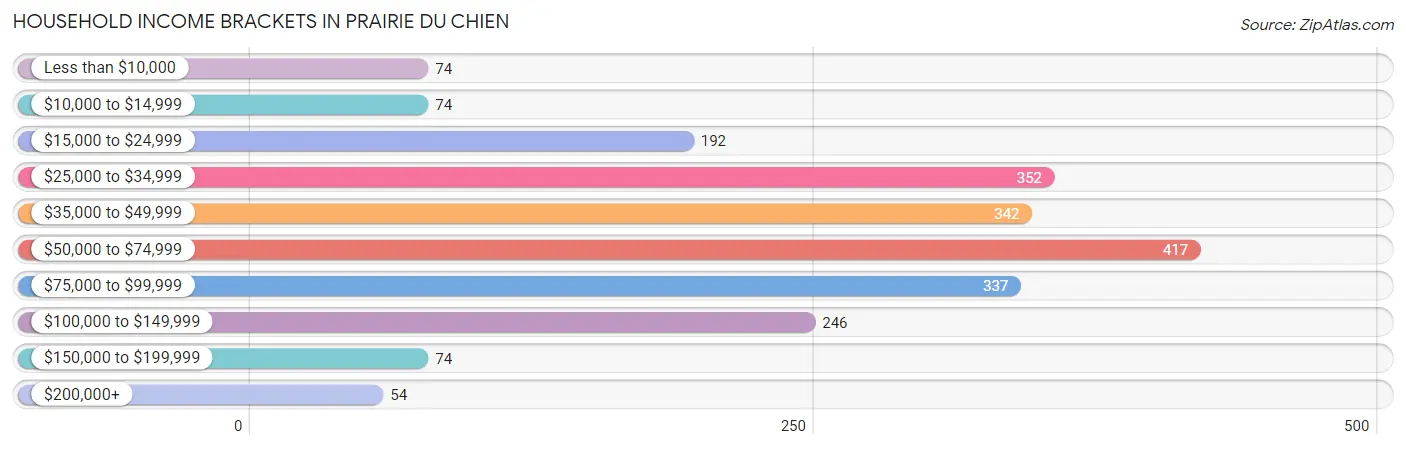
| Income Bracket | # Households | % Households |
| Less than $10,000 | 74 | 3.4% |
| $10,000 to $14,999 | 74 | 3.4% |
| $15,000 to $24,999 | 192 | 8.9% |
| $25,000 to $34,999 | 352 | 16.3% |
| $35,000 to $49,999 | 342 | 15.8% |
| $50,000 to $74,999 | 417 | 19.3% |
| $75,000 to $99,999 | 337 | 15.6% |
| $100,000 to $149,999 | 246 | 11.4% |
| $150,000 to $199,999 | 74 | 3.4% |
| $200,000+ | 54 | 2.5% |
Household Income by Householder Age in Prairie Du Chien
The median household income in Prairie Du Chien is $52,400, with the highest median household income of $63,229 found in the 25 to 44 years age bracket for the primary householder. A total of 641 households (29.6%) fall into this category. Meanwhile, the 65+ years age bracket for the primary householder has the lowest median household income of $42,583, with 777 households (35.9%) in this group.
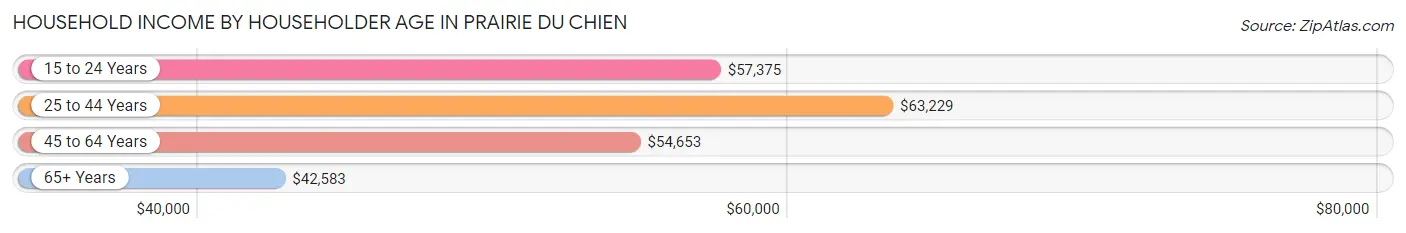
| Income Bracket | # Households | Median Income |
| 15 to 24 Years | 39 (1.8%) | $57,375 |
| 25 to 44 Years | 641 (29.6%) | $63,229 |
| 45 to 64 Years | 705 (32.6%) | $54,653 |
| 65+ Years | 777 (35.9%) | $42,583 |
| Total | 2,162 (100.0%) | $52,400 |
Poverty in Prairie Du Chien
Income Below Poverty by Sex and Age in Prairie Du Chien
With 14.0% poverty level for males and 11.8% for females among the residents of Prairie Du Chien, 5 year old males and under 5 year old females are the most vulnerable to poverty, with 28 males (70.0%) and 37 females (23.4%) in their respective age groups living below the poverty level.
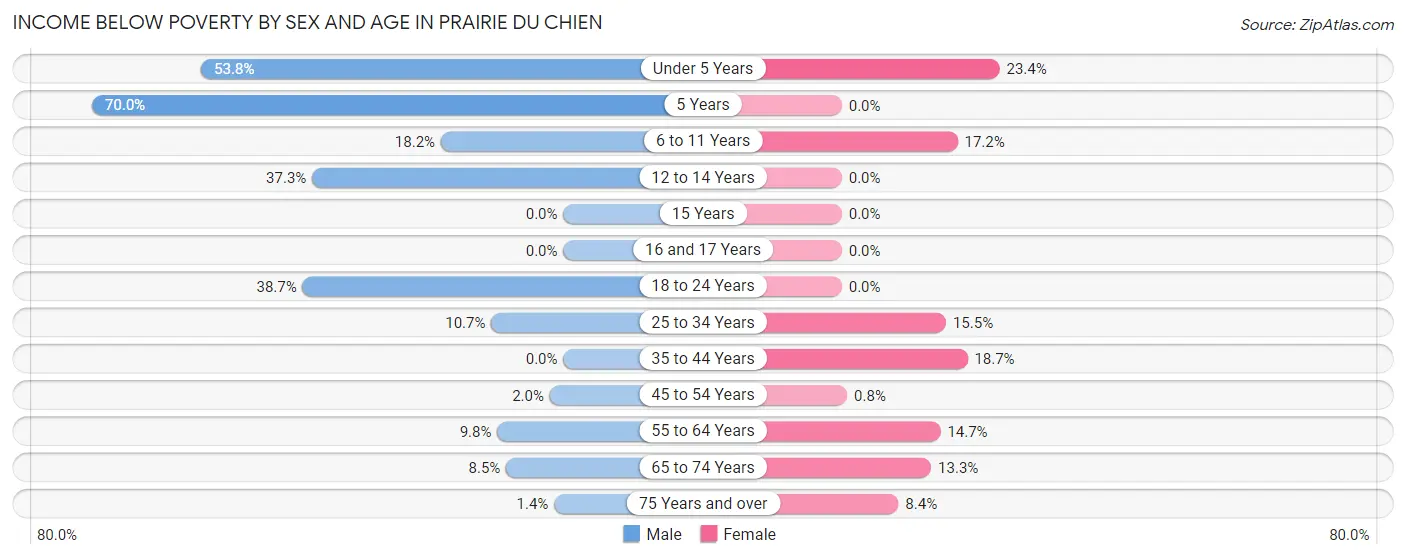
| Age Bracket | Male | Female |
| Under 5 Years | 71 (53.8%) | 37 (23.4%) |
| 5 Years | 28 (70.0%) | 0 (0.0%) |
| 6 to 11 Years | 28 (18.2%) | 22 (17.2%) |
| 12 to 14 Years | 47 (37.3%) | 0 (0.0%) |
| 15 Years | 0 (0.0%) | 0 (0.0%) |
| 16 and 17 Years | 0 (0.0%) | 0 (0.0%) |
| 18 to 24 Years | 55 (38.7%) | 0 (0.0%) |
| 25 to 34 Years | 29 (10.7%) | 43 (15.5%) |
| 35 to 44 Years | 0 (0.0%) | 50 (18.7%) |
| 45 to 54 Years | 5 (2.0%) | 2 (0.8%) |
| 55 to 64 Years | 41 (9.8%) | 63 (14.6%) |
| 65 to 74 Years | 23 (8.5%) | 45 (13.3%) |
| 75 Years and over | 3 (1.4%) | 29 (8.4%) |
| Total | 330 (14.0%) | 291 (11.8%) |
Income Above Poverty by Sex and Age in Prairie Du Chien
According to the poverty statistics in Prairie Du Chien, males aged 15 years and females aged 5 years are the age groups that are most secure financially, with 100.0% of males and 100.0% of females in these age groups living above the poverty line.
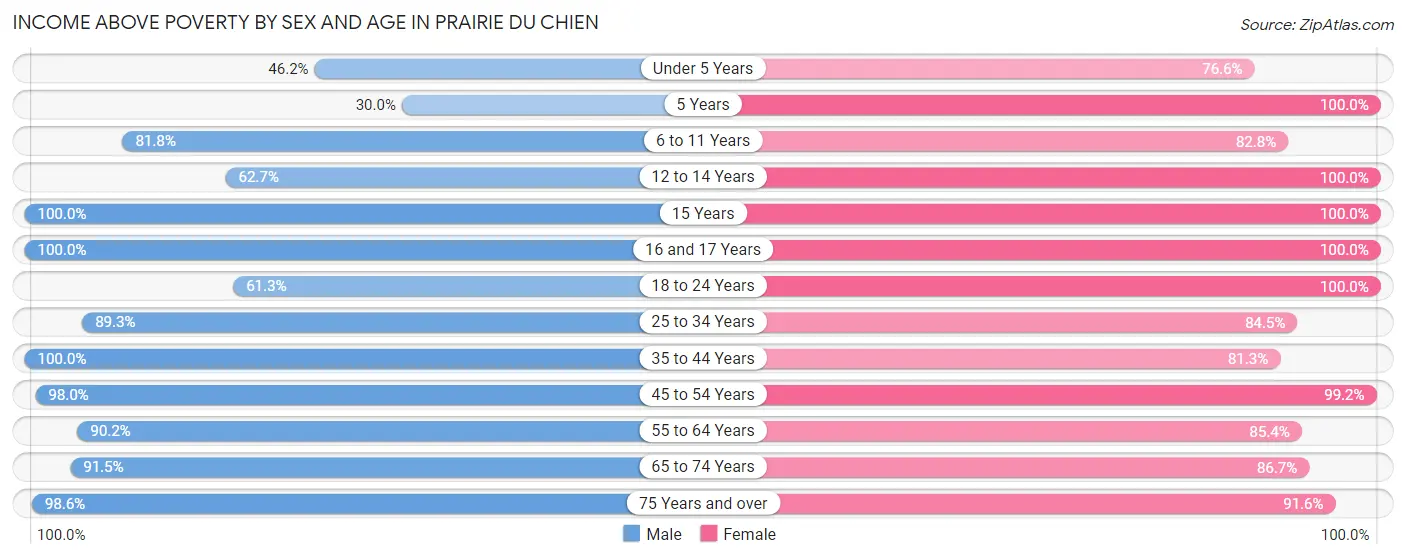
| Age Bracket | Male | Female |
| Under 5 Years | 61 (46.2%) | 121 (76.6%) |
| 5 Years | 12 (30.0%) | 6 (100.0%) |
| 6 to 11 Years | 126 (81.8%) | 106 (82.8%) |
| 12 to 14 Years | 79 (62.7%) | 85 (100.0%) |
| 15 Years | 29 (100.0%) | 5 (100.0%) |
| 16 and 17 Years | 43 (100.0%) | 36 (100.0%) |
| 18 to 24 Years | 87 (61.3%) | 128 (100.0%) |
| 25 to 34 Years | 242 (89.3%) | 235 (84.5%) |
| 35 to 44 Years | 266 (100.0%) | 218 (81.3%) |
| 45 to 54 Years | 244 (98.0%) | 249 (99.2%) |
| 55 to 64 Years | 377 (90.2%) | 367 (85.4%) |
| 65 to 74 Years | 248 (91.5%) | 294 (86.7%) |
| 75 Years and over | 218 (98.6%) | 316 (91.6%) |
| Total | 2,032 (86.0%) | 2,166 (88.2%) |
Income Below Poverty Among Married-Couple Families in Prairie Du Chien
The poverty statistics for married-couple families in Prairie Du Chien show that 4.6% or 43 of the total 939 families live below the poverty line. Families with 3 or 4 children have the highest poverty rate of 31.9%, comprising of 29 families. On the other hand, families with 1 or 2 children have the lowest poverty rate of 0.0%, which includes 0 families.
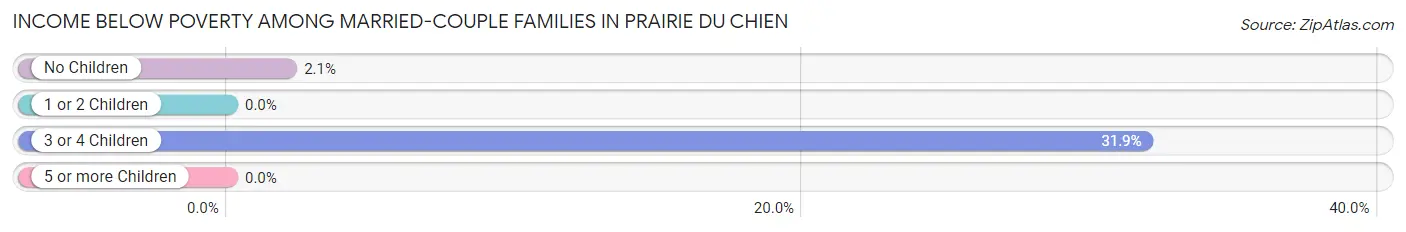
| Children | Above Poverty | Below Poverty |
| No Children | 667 (97.9%) | 14 (2.1%) |
| 1 or 2 Children | 161 (100.0%) | 0 (0.0%) |
| 3 or 4 Children | 62 (68.1%) | 29 (31.9%) |
| 5 or more Children | 6 (100.0%) | 0 (0.0%) |
| Total | 896 (95.4%) | 43 (4.6%) |
Income Below Poverty Among Single-Parent Households in Prairie Du Chien
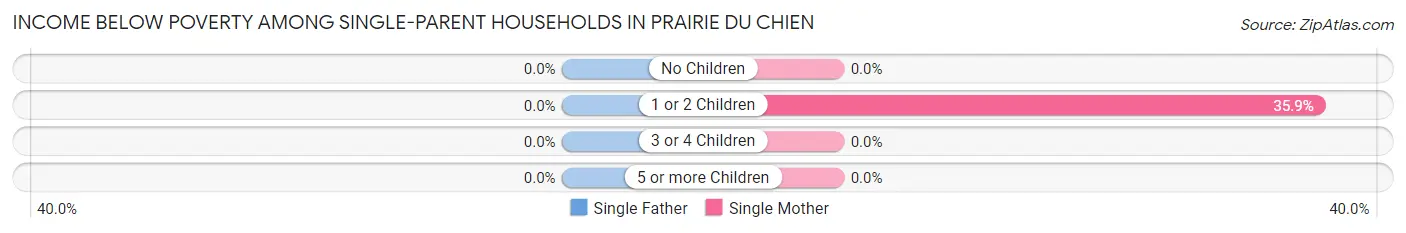
| Children | Single Father | Single Mother |
| No Children | 0 (0.0%) | 0 (0.0%) |
| 1 or 2 Children | 0 (0.0%) | 42 (35.9%) |
| 3 or 4 Children | 0 (0.0%) | 0 (0.0%) |
| 5 or more Children | 0 (0.0%) | 0 (0.0%) |
| Total | 0 (0.0%) | 42 (18.1%) |
Income Below Poverty Among Married-Couple vs Single-Parent Households in Prairie Du Chien
The poverty data for Prairie Du Chien shows that 43 of the married-couple family households (4.6%) and 42 of the single-parent households (12.6%) are living below the poverty level. Within the married-couple family households, those with 3 or 4 children have the highest poverty rate, with 29 households (31.9%) falling below the poverty line. Among the single-parent households, those with 1 or 2 children have the highest poverty rate, with 42 household (21.6%) living below poverty.
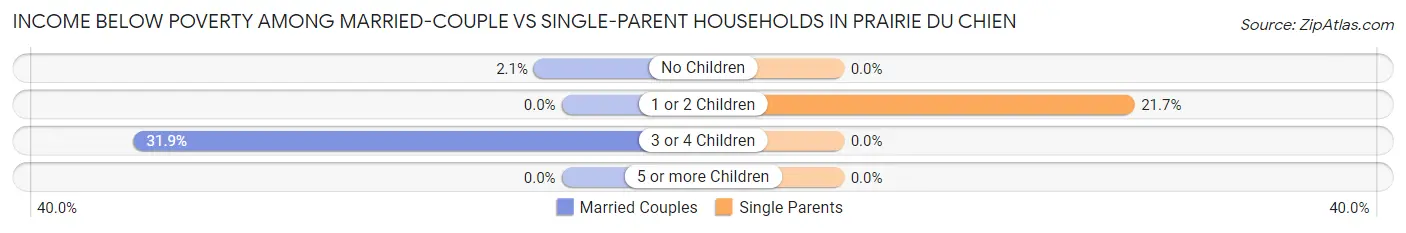
| Children | Married-Couple Families | Single-Parent Households |
| No Children | 14 (2.1%) | 0 (0.0%) |
| 1 or 2 Children | 0 (0.0%) | 42 (21.6%) |
| 3 or 4 Children | 29 (31.9%) | 0 (0.0%) |
| 5 or more Children | 0 (0.0%) | 0 (0.0%) |
| Total | 43 (4.6%) | 42 (12.6%) |
Race in Prairie Du Chien
The most populous races in Prairie Du Chien are White / Caucasian (4,981 | 90.5%), Two or more Races (289 | 5.2%), and Black / African American (182 | 3.3%).
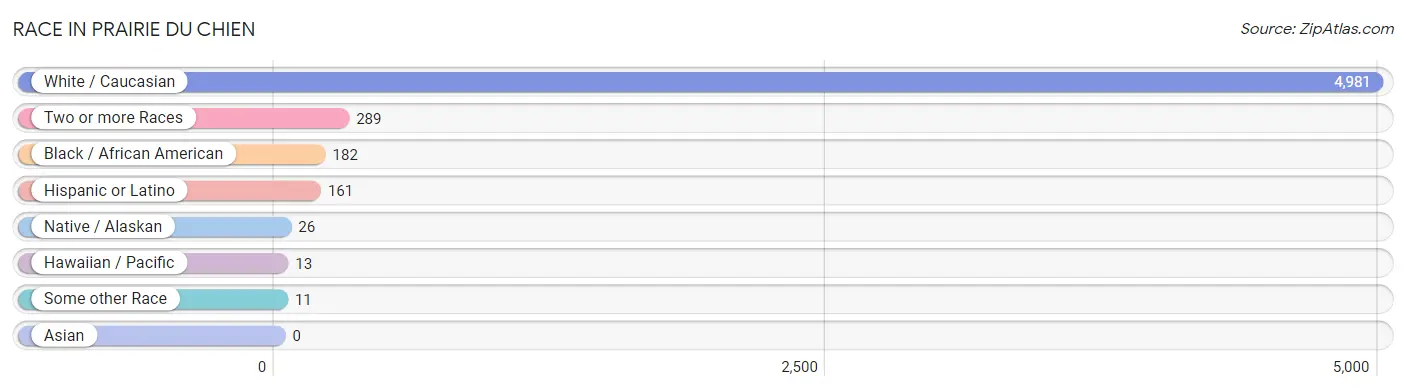
| Race | # Population | % Population |
| Asian | 0 | 0.0% |
| Black / African American | 182 | 3.3% |
| Hawaiian / Pacific | 13 | 0.2% |
| Hispanic or Latino | 161 | 2.9% |
| Native / Alaskan | 26 | 0.5% |
| White / Caucasian | 4,981 | 90.5% |
| Two or more Races | 289 | 5.2% |
| Some other Race | 11 | 0.2% |
| Total | 5,502 | 100.0% |
Ancestry in Prairie Du Chien
The most populous ancestries reported in Prairie Du Chien are German (1,945 | 35.3%), Irish (820 | 14.9%), Norwegian (432 | 7.9%), English (304 | 5.5%), and French (192 | 3.5%), together accounting for 67.1% of all Prairie Du Chien residents.
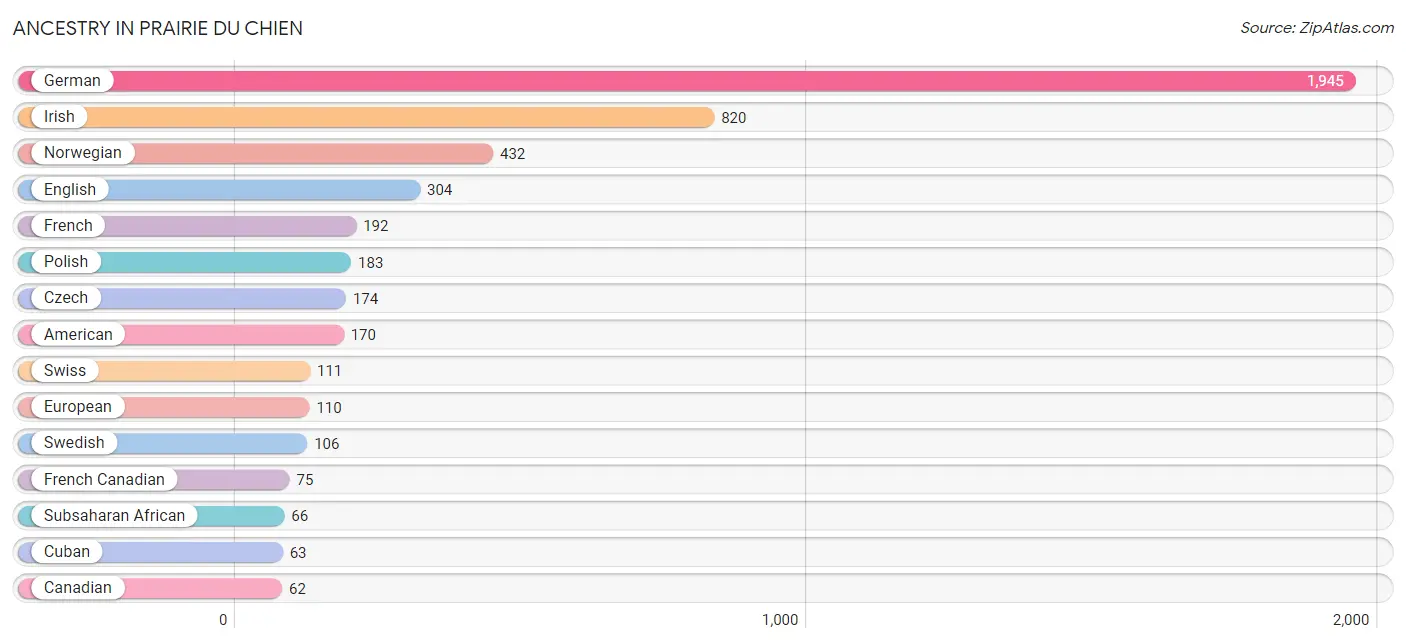
| Ancestry | # Population | % Population |
| African | 47 | 0.9% |
| Albanian | 10 | 0.2% |
| American | 170 | 3.1% |
| Austrian | 4 | 0.1% |
| Belgian | 8 | 0.2% |
| Blackfeet | 10 | 0.2% |
| Burmese | 10 | 0.2% |
| Canadian | 62 | 1.1% |
| Central American | 3 | 0.1% |
| Cherokee | 24 | 0.4% |
| Chippewa | 56 | 1.0% |
| Cree | 8 | 0.2% |
| Cuban | 63 | 1.1% |
| Czech | 174 | 3.2% |
| Czechoslovakian | 13 | 0.2% |
| Danish | 2 | 0.0% |
| Dutch | 38 | 0.7% |
| English | 304 | 5.5% |
| European | 110 | 2.0% |
| French | 192 | 3.5% |
| French American Indian | 7 | 0.1% |
| French Canadian | 75 | 1.4% |
| German | 1,945 | 35.3% |
| Greek | 16 | 0.3% |
| Hungarian | 20 | 0.4% |
| Irish | 820 | 14.9% |
| Italian | 46 | 0.8% |
| Menominee | 7 | 0.1% |
| Mexican | 52 | 0.9% |
| Mexican American Indian | 4 | 0.1% |
| Navajo | 53 | 1.0% |
| Nigerian | 19 | 0.4% |
| Northern European | 38 | 0.7% |
| Norwegian | 432 | 7.9% |
| Polish | 183 | 3.3% |
| Puerto Rican | 33 | 0.6% |
| Russian | 10 | 0.2% |
| Salvadoran | 3 | 0.1% |
| Scandinavian | 24 | 0.4% |
| Scotch-Irish | 55 | 1.0% |
| Scottish | 33 | 0.6% |
| Subsaharan African | 66 | 1.2% |
| Swedish | 106 | 1.9% |
| Swiss | 111 | 2.0% |
| Ukrainian | 4 | 0.1% |
| Welsh | 18 | 0.3% | View All 46 Rows |
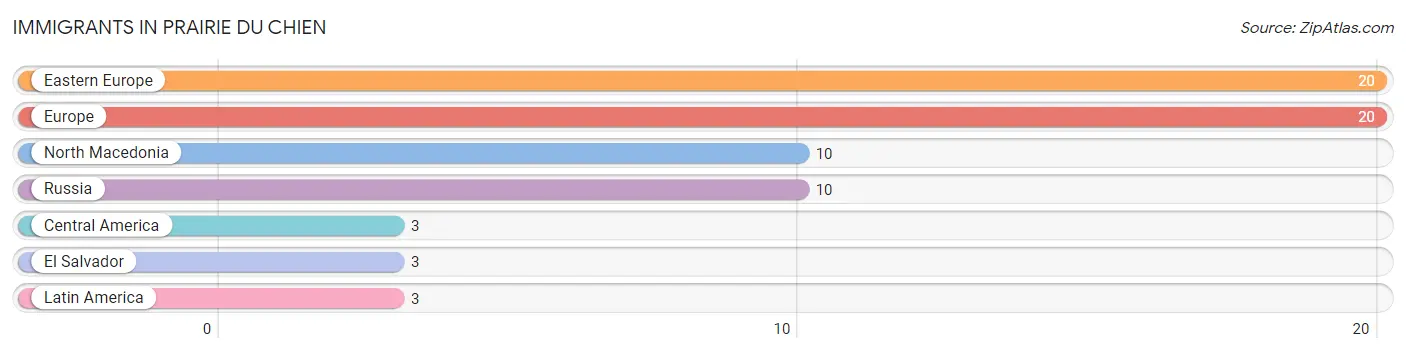
Immigrants in Prairie Du Chien
The most numerous immigrant groups reported in Prairie Du Chien came from Eastern Europe (20 | 0.4%), Europe (20 | 0.4%), North Macedonia (10 | 0.2%), Russia (10 | 0.2%), and Central America (3 | 0.1%), together accounting for 1.1% of all Prairie Du Chien residents.
| Immigration Origin | # Population | % Population |
| Central America | 3 | 0.1% |
| Eastern Europe | 20 | 0.4% |
| El Salvador | 3 | 0.1% |
| Europe | 20 | 0.4% |
| Latin America | 3 | 0.1% |
| North Macedonia | 10 | 0.2% |
| Russia | 10 | 0.2% | View All 7 Rows |
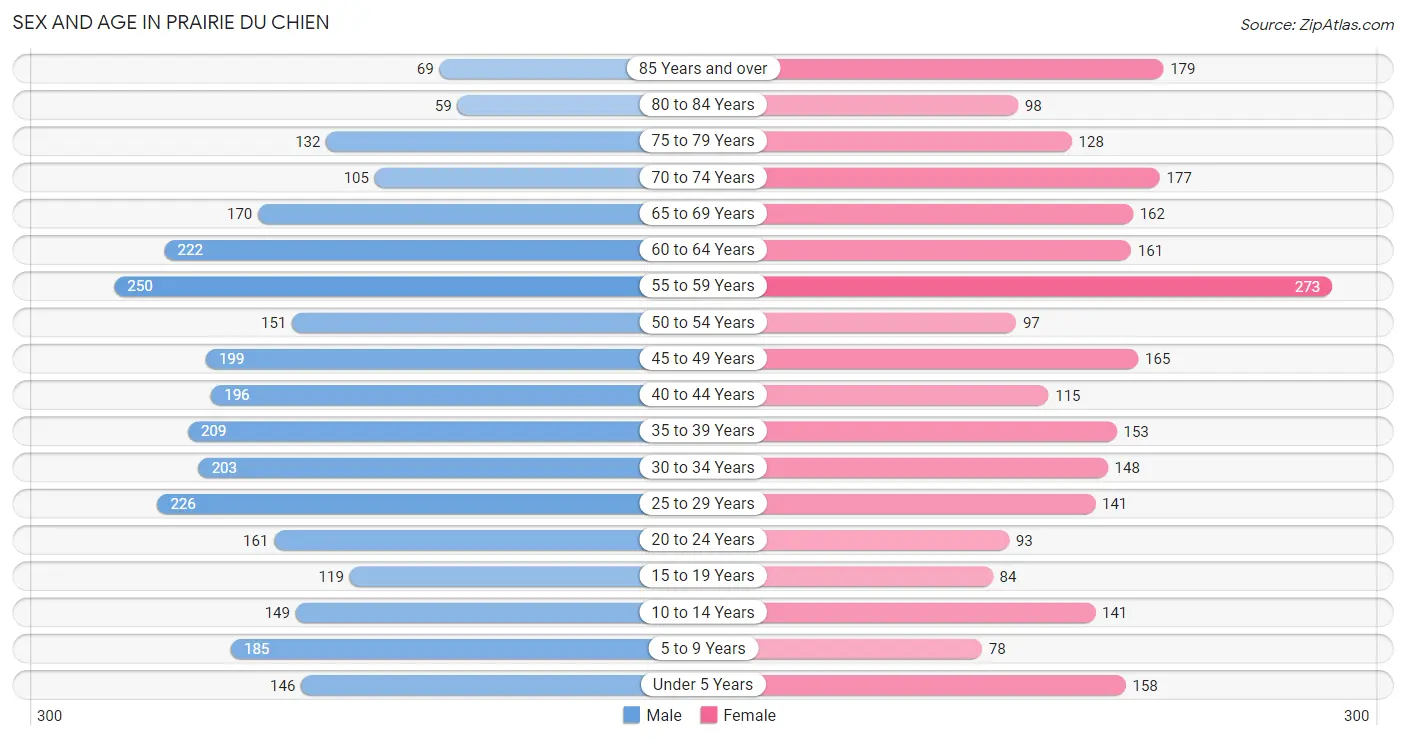
Sex and Age in Prairie Du Chien
Sex and Age in Prairie Du Chien
The most populous age groups in Prairie Du Chien are 55 to 59 Years (250 | 8.5%) for men and 55 to 59 Years (273 | 10.7%) for women.
| Age Bracket | Male | Female |
| Under 5 Years | 146 (5.0%) | 158 (6.2%) |
| 5 to 9 Years | 185 (6.3%) | 78 (3.1%) |
| 10 to 14 Years | 149 (5.1%) | 141 (5.5%) |
| 15 to 19 Years | 119 (4.0%) | 84 (3.3%) |
| 20 to 24 Years | 161 (5.5%) | 93 (3.6%) |
| 25 to 29 Years | 226 (7.7%) | 141 (5.5%) |
| 30 to 34 Years | 203 (6.9%) | 148 (5.8%) |
| 35 to 39 Years | 209 (7.1%) | 153 (6.0%) |
| 40 to 44 Years | 196 (6.6%) | 115 (4.5%) |
| 45 to 49 Years | 199 (6.7%) | 165 (6.5%) |
| 50 to 54 Years | 151 (5.1%) | 97 (3.8%) |
| 55 to 59 Years | 250 (8.5%) | 273 (10.7%) |
| 60 to 64 Years | 222 (7.5%) | 161 (6.3%) |
| 65 to 69 Years | 170 (5.8%) | 162 (6.4%) |
| 70 to 74 Years | 105 (3.6%) | 177 (6.9%) |
| 75 to 79 Years | 132 (4.5%) | 128 (5.0%) |
| 80 to 84 Years | 59 (2.0%) | 98 (3.8%) |
| 85 Years and over | 69 (2.3%) | 179 (7.0%) |
| Total | 2,951 (100.0%) | 2,551 (100.0%) |
Families and Households in Prairie Du Chien
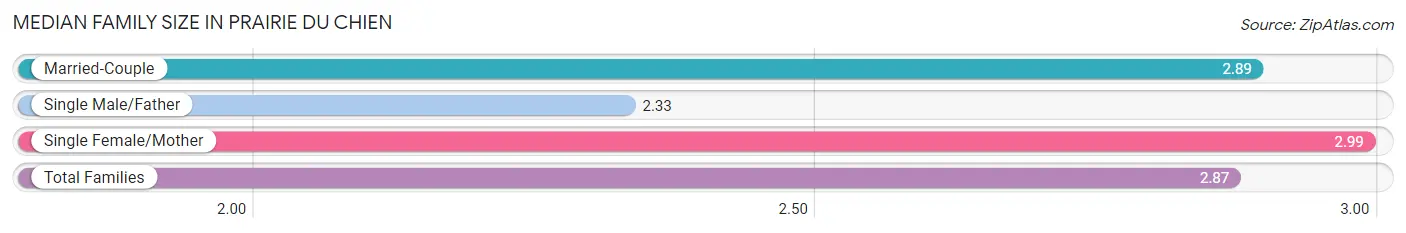
Median Family Size in Prairie Du Chien
The median family size in Prairie Du Chien is 2.87 persons per family, with single female/mother families (232 | 18.2%) accounting for the largest median family size of 2.99 persons per family. On the other hand, single male/father families (102 | 8.0%) represent the smallest median family size with 2.33 persons per family.
| Family Type | # Families | Family Size |
| Married-Couple | 939 (73.8%) | 2.89 |
| Single Male/Father | 102 (8.0%) | 2.33 |
| Single Female/Mother | 232 (18.2%) | 2.99 |
| Total Families | 1,273 (100.0%) | 2.87 |
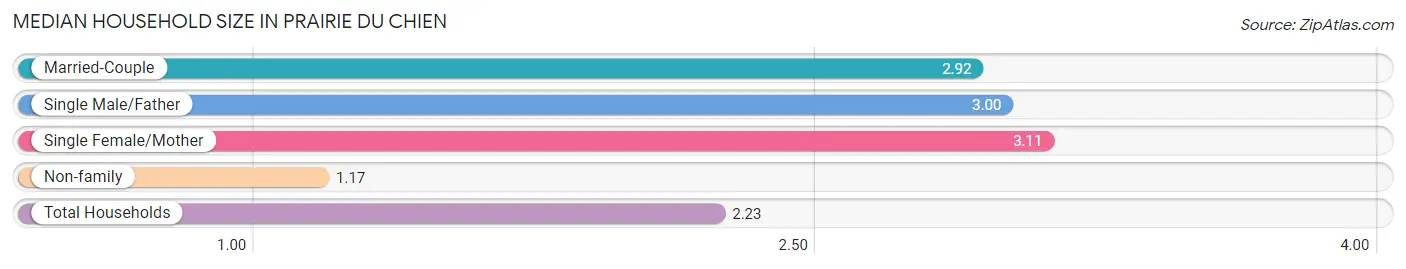
Median Household Size in Prairie Du Chien
The median household size in Prairie Du Chien is 2.23 persons per household, with single female/mother households (232 | 10.7%) accounting for the largest median household size of 3.11 persons per household. non-family households (889 | 41.1%) represent the smallest median household size with 1.17 persons per household.
| Household Type | # Households | Household Size |
| Married-Couple | 939 (43.4%) | 2.92 |
| Single Male/Father | 102 (4.7%) | 3.00 |
| Single Female/Mother | 232 (10.7%) | 3.11 |
| Non-family | 889 (41.1%) | 1.17 |
| Total Households | 2,162 (100.0%) | 2.23 |
Household Size by Marriage Status in Prairie Du Chien
Out of a total of 2,162 households in Prairie Du Chien, 1,273 (58.9%) are family households, while 889 (41.1%) are nonfamily households. The most numerous type of family households are 2-person households, comprising 776, and the most common type of nonfamily households are 1-person households, comprising 748.
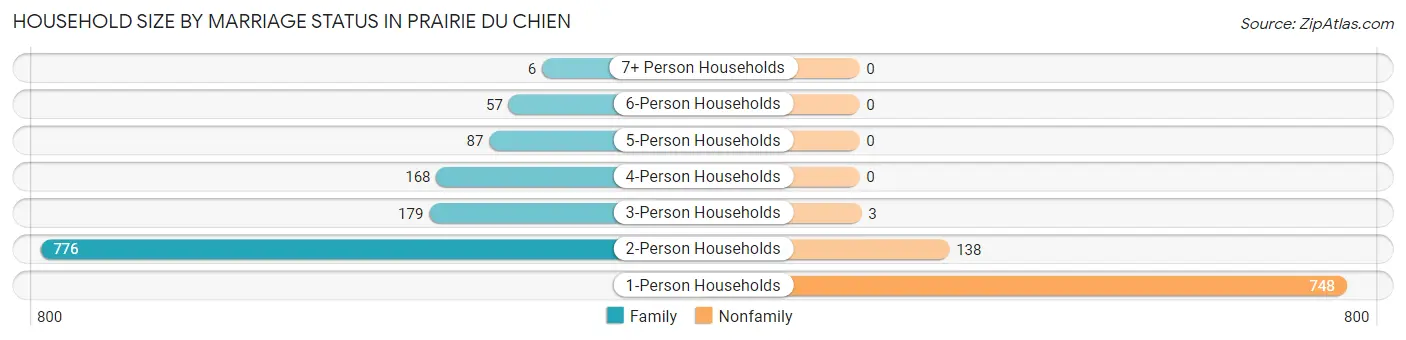
| Household Size | Family Households | Nonfamily Households |
| 1-Person Households | - | 748 (34.6%) |
| 2-Person Households | 776 (35.9%) | 138 (6.4%) |
| 3-Person Households | 179 (8.3%) | 3 (0.1%) |
| 4-Person Households | 168 (7.8%) | 0 (0.0%) |
| 5-Person Households | 87 (4.0%) | 0 (0.0%) |
| 6-Person Households | 57 (2.6%) | 0 (0.0%) |
| 7+ Person Households | 6 (0.3%) | 0 (0.0%) |
| Total | 1,273 (58.9%) | 889 (41.1%) |
Female Fertility in Prairie Du Chien
Fertility by Age in Prairie Du Chien
Average fertility rate in Prairie Du Chien is 1.0 births per 1,000 women. Women in the age bracket of 20 to 34 years have the highest fertility rate with 3.0 births per 1,000 women. Women in the age bracket of 20 to 34 years acount for 100.0% of all women with births.
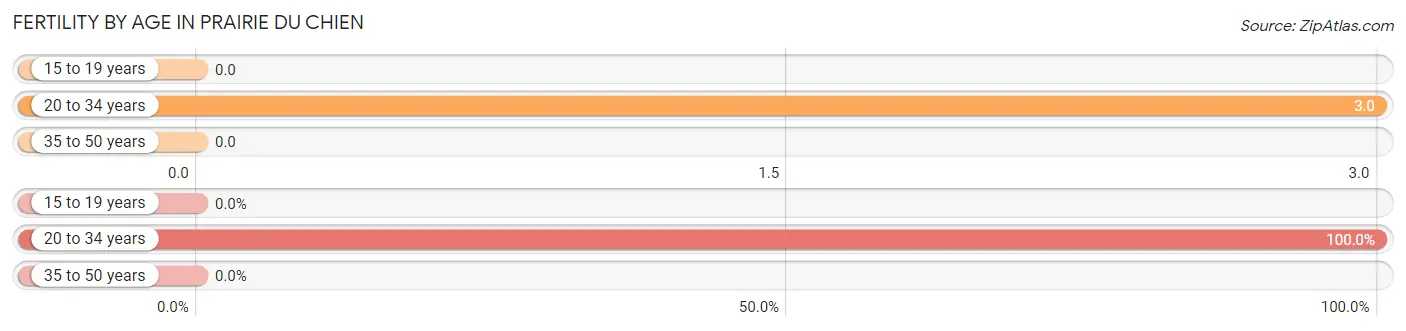
| Age Bracket | Women with Births | Births / 1,000 Women |
| 15 to 19 years | 0 (0.0%) | 0.0 |
| 20 to 34 years | 1 (100.0%) | 3.0 |
| 35 to 50 years | 0 (0.0%) | 0.0 |
| Total | 1 (100.0%) | 1.0 |
Fertility by Age by Marriage Status in Prairie Du Chien
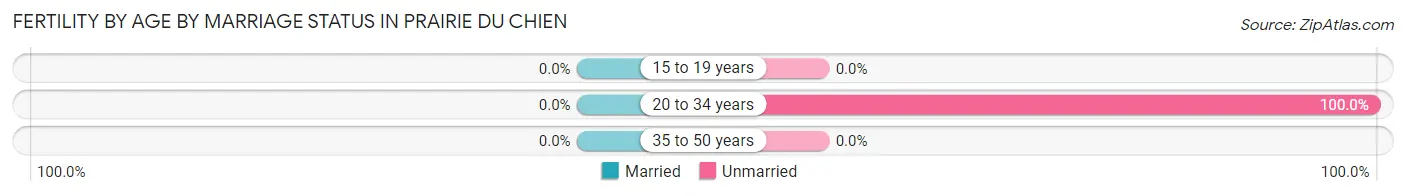
| Age Bracket | Married | Unmarried |
| 15 to 19 years | 0 (0.0%) | 0 (0.0%) |
| 20 to 34 years | 0 (0.0%) | 1 (100.0%) |
| 35 to 50 years | 0 (0.0%) | 0 (0.0%) |
| Total | 0 (0.0%) | 1 (100.0%) |
Fertility by Education in Prairie Du Chien
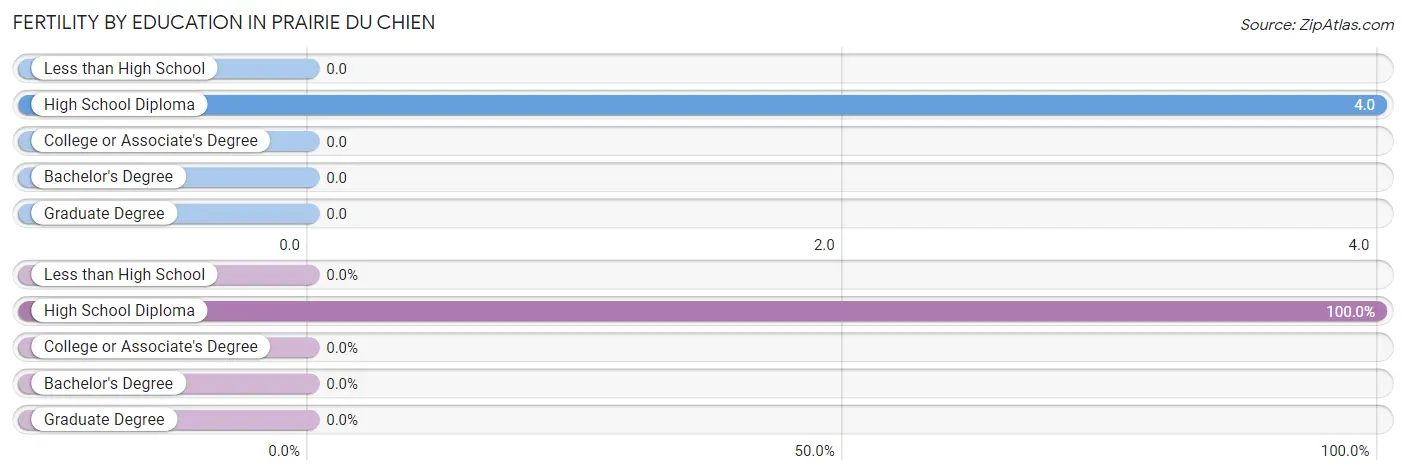
| Educational Attainment | Women with Births | Births / 1,000 Women |
| Less than High School | 0 (0.0%) | 0.0 |
| High School Diploma | 1 (100.0%) | 4.0 |
| College or Associate's Degree | 0 (0.0%) | 0.0 |
| Bachelor's Degree | 0 (0.0%) | 0.0 |
| Graduate Degree | 0 (0.0%) | 0.0 |
| Total | 1 (100.0%) | 1.0 |
Fertility by Education by Marriage Status in Prairie Du Chien
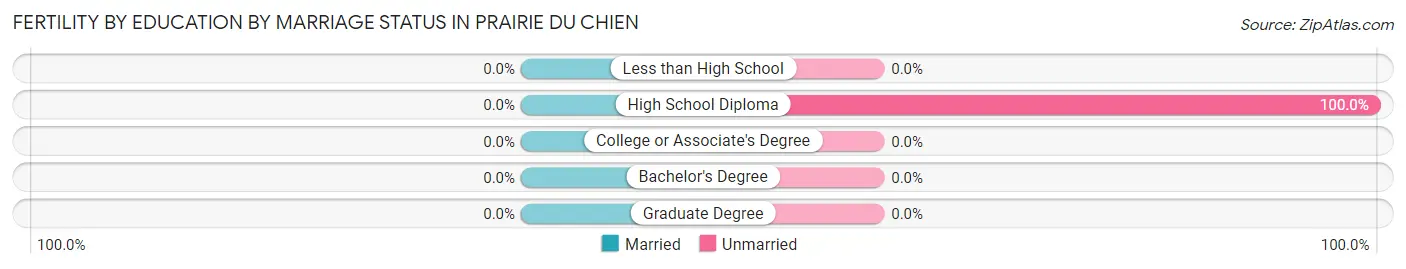
| Educational Attainment | Married | Unmarried |
| Less than High School | 0 (0.0%) | 0 (0.0%) |
| High School Diploma | 0 (0.0%) | 1 (100.0%) |
| College or Associate's Degree | 0 (0.0%) | 0 (0.0%) |
| Bachelor's Degree | 0 (0.0%) | 0 (0.0%) |
| Graduate Degree | 0 (0.0%) | 0 (0.0%) |
| Total | 0 (0.0%) | 1 (100.0%) |
Employment Characteristics in Prairie Du Chien
Employment by Class of Employer in Prairie Du Chien
Among the 2,389 employed individuals in Prairie Du Chien, private company employees (1,767 | 74.0%), not-for-profit organizations (176 | 7.4%), and local government employees (153 | 6.4%) make up the most common classes of employment.
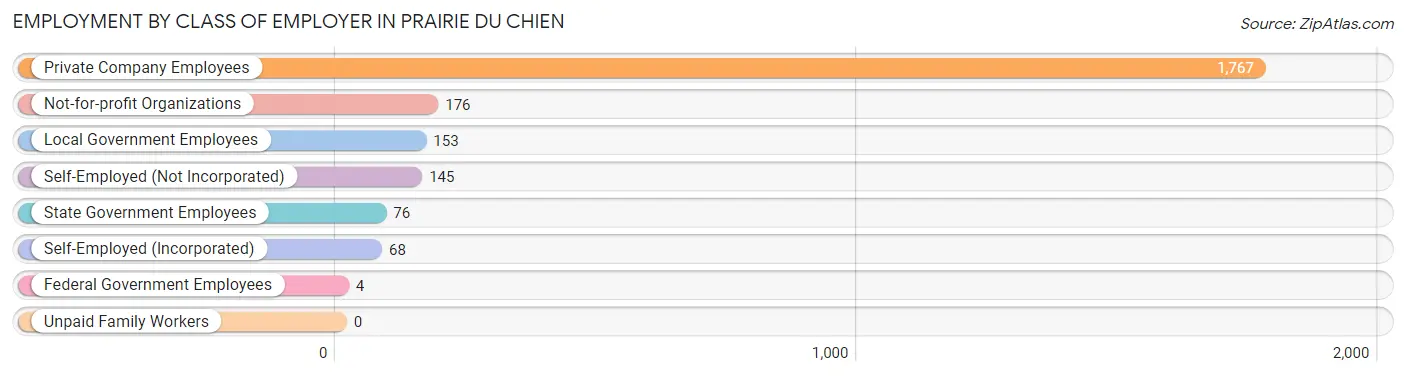
| Employer Class | # Employees | % Employees |
| Private Company Employees | 1,767 | 74.0% |
| Self-Employed (Incorporated) | 68 | 2.9% |
| Self-Employed (Not Incorporated) | 145 | 6.1% |
| Not-for-profit Organizations | 176 | 7.4% |
| Local Government Employees | 153 | 6.4% |
| State Government Employees | 76 | 3.2% |
| Federal Government Employees | 4 | 0.2% |
| Unpaid Family Workers | 0 | 0.0% |
| Total | 2,389 | 100.0% |
Employment Status by Age in Prairie Du Chien
According to the labor force statistics for Prairie Du Chien, out of the total population over 16 years of age (4,604), 53.0% or 2,440 individuals are in the labor force, with 1.6% or 39 of them unemployed. The age group with the highest labor force participation rate is 45 to 54 years, with 76.1% or 466 individuals in the labor force. Within the labor force, the 65 to 74 years age range has the highest percentage of unemployed individuals, with 5.2% or 6 of them being unemployed.
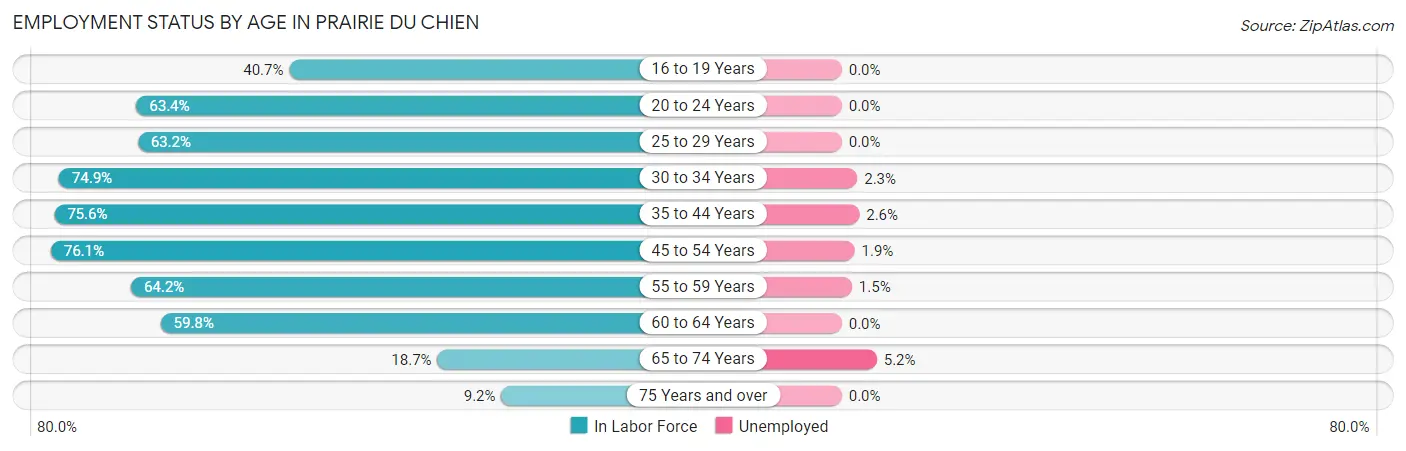
| Age Bracket | In Labor Force | Unemployed |
| 16 to 19 Years | 66 (40.7%) | 0 (0.0%) |
| 20 to 24 Years | 161 (63.4%) | 0 (0.0%) |
| 25 to 29 Years | 232 (63.2%) | 0 (0.0%) |
| 30 to 34 Years | 263 (74.9%) | 6 (2.3%) |
| 35 to 44 Years | 509 (75.6%) | 13 (2.6%) |
| 45 to 54 Years | 466 (76.1%) | 9 (1.9%) |
| 55 to 59 Years | 336 (64.2%) | 5 (1.5%) |
| 60 to 64 Years | 229 (59.8%) | 0 (0.0%) |
| 65 to 74 Years | 115 (18.7%) | 6 (5.2%) |
| 75 Years and over | 61 (9.2%) | 0 (0.0%) |
| Total | 2,440 (53.0%) | 39 (1.6%) |
Employment Status by Educational Attainment in Prairie Du Chien
According to labor force statistics for Prairie Du Chien, 70.0% of individuals (2,036) out of the total population between 25 and 64 years of age (2,909) are in the labor force, with 1.6% or 33 of them being unemployed. The group with the highest labor force participation rate are those with the educational attainment of bachelor's degree or higher, with 88.2% or 435 individuals in the labor force. Within the labor force, individuals with less than high school education have the highest percentage of unemployment, with 17.5% or 22 of them being unemployed.
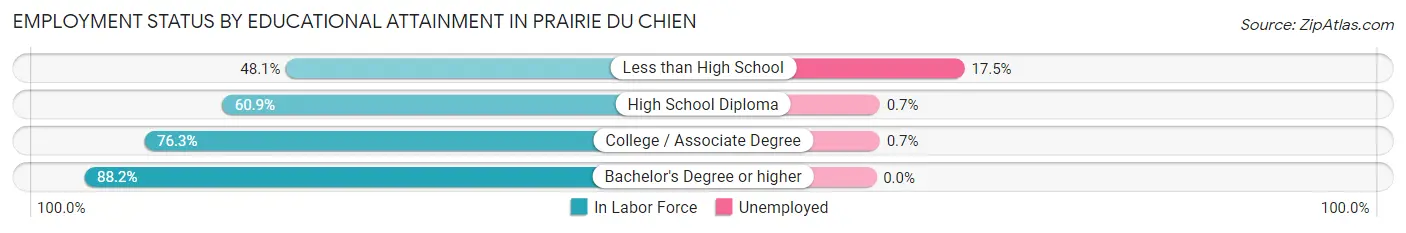
| Educational Attainment | In Labor Force | Unemployed |
| Less than High School | 126 (48.1%) | 46 (17.5%) |
| High School Diploma | 668 (60.9%) | 8 (0.7%) |
| College / Associate Degree | 806 (76.3%) | 7 (0.7%) |
| Bachelor's Degree or higher | 435 (88.2%) | 0 (0.0%) |
| Total | 2,036 (70.0%) | 47 (1.6%) |
Employment Occupations by Sex in Prairie Du Chien
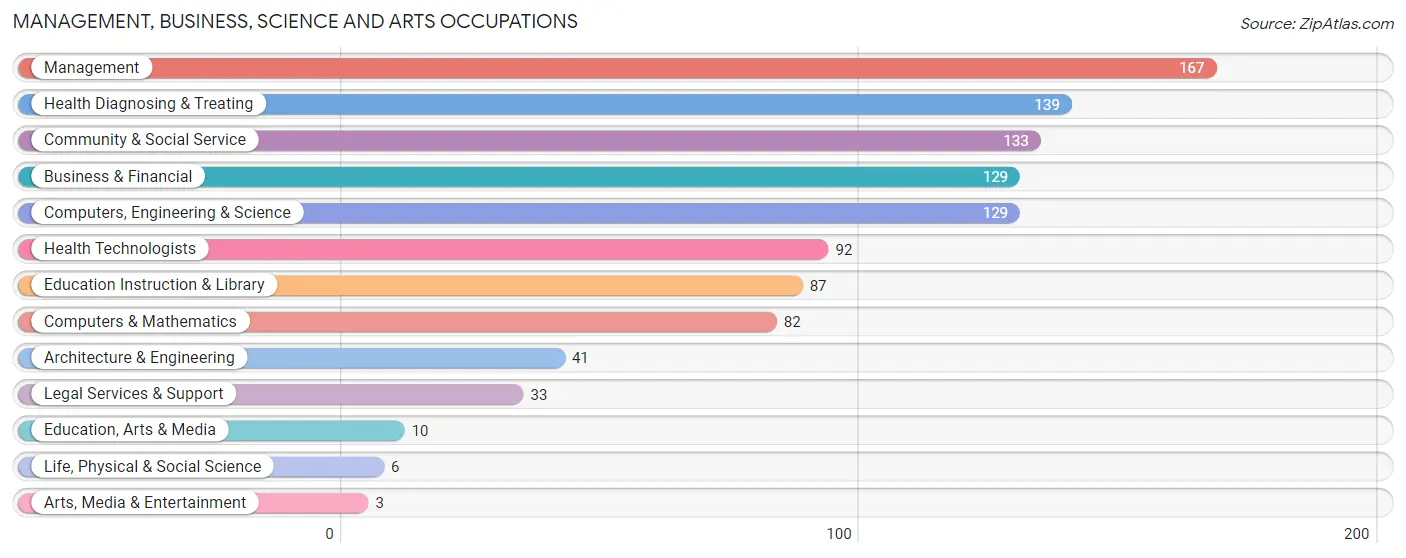
Management, Business, Science and Arts Occupations
The most common Management, Business, Science and Arts occupations in Prairie Du Chien are Management (167 | 7.0%), Health Diagnosing & Treating (139 | 5.8%), Community & Social Service (133 | 5.5%), Business & Financial (129 | 5.4%), and Computers, Engineering & Science (129 | 5.4%).
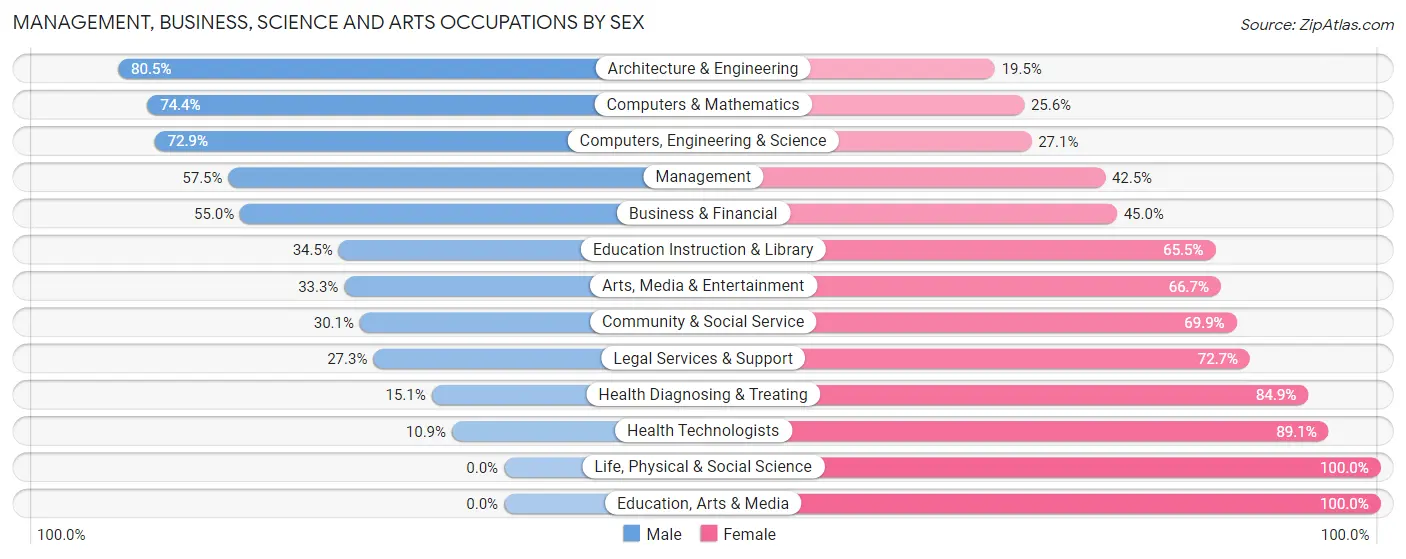
Management, Business, Science and Arts Occupations by Sex
Within the Management, Business, Science and Arts occupations in Prairie Du Chien, the most male-oriented occupations are Architecture & Engineering (80.5%), Computers & Mathematics (74.4%), and Computers, Engineering & Science (72.9%), while the most female-oriented occupations are Life, Physical & Social Science (100.0%), Education, Arts & Media (100.0%), and Health Technologists (89.1%).
| Occupation | Male | Female |
| Management | 96 (57.5%) | 71 (42.5%) |
| Business & Financial | 71 (55.0%) | 58 (45.0%) |
| Computers, Engineering & Science | 94 (72.9%) | 35 (27.1%) |
| Computers & Mathematics | 61 (74.4%) | 21 (25.6%) |
| Architecture & Engineering | 33 (80.5%) | 8 (19.5%) |
| Life, Physical & Social Science | 0 (0.0%) | 6 (100.0%) |
| Community & Social Service | 40 (30.1%) | 93 (69.9%) |
| Education, Arts & Media | 0 (0.0%) | 10 (100.0%) |
| Legal Services & Support | 9 (27.3%) | 24 (72.7%) |
| Education Instruction & Library | 30 (34.5%) | 57 (65.5%) |
| Arts, Media & Entertainment | 1 (33.3%) | 2 (66.7%) |
| Health Diagnosing & Treating | 21 (15.1%) | 118 (84.9%) |
| Health Technologists | 10 (10.9%) | 82 (89.1%) |
| Total (Category) | 322 (46.2%) | 375 (53.8%) |
| Total (Overall) | 1,251 (52.1%) | 1,148 (47.8%) |
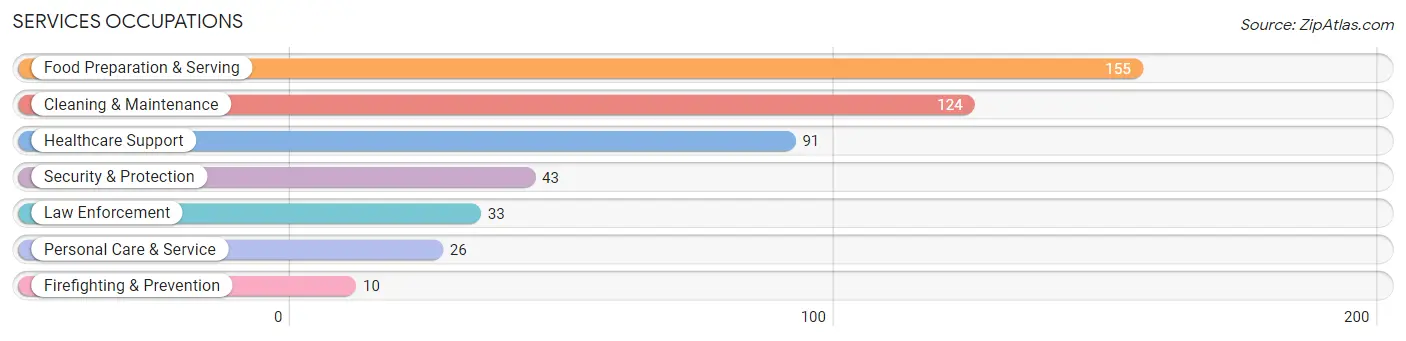
Services Occupations
The most common Services occupations in Prairie Du Chien are Food Preparation & Serving (155 | 6.5%), Cleaning & Maintenance (124 | 5.2%), Healthcare Support (91 | 3.8%), Security & Protection (43 | 1.8%), and Law Enforcement (33 | 1.4%).
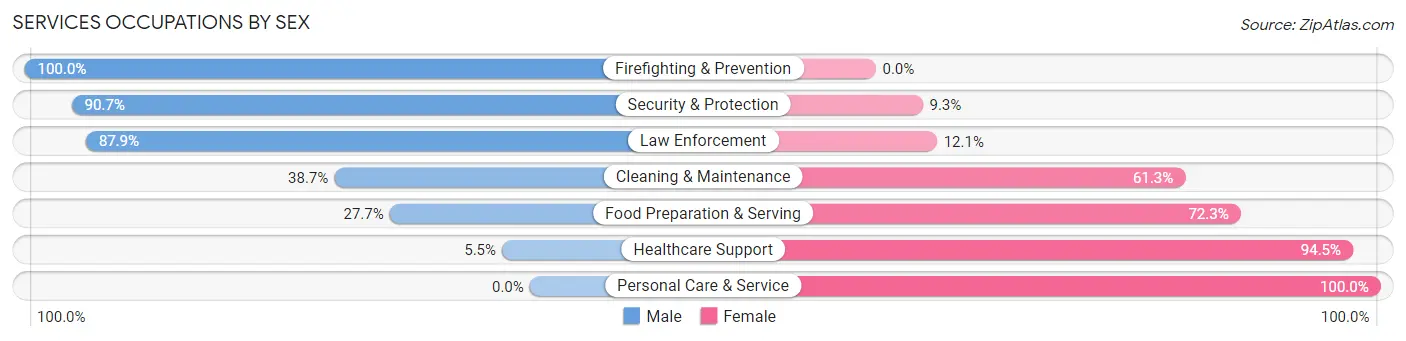
Services Occupations by Sex
Within the Services occupations in Prairie Du Chien, the most male-oriented occupations are Firefighting & Prevention (100.0%), Security & Protection (90.7%), and Law Enforcement (87.9%), while the most female-oriented occupations are Personal Care & Service (100.0%), Healthcare Support (94.5%), and Food Preparation & Serving (72.3%).
| Occupation | Male | Female |
| Healthcare Support | 5 (5.5%) | 86 (94.5%) |
| Security & Protection | 39 (90.7%) | 4 (9.3%) |
| Firefighting & Prevention | 10 (100.0%) | 0 (0.0%) |
| Law Enforcement | 29 (87.9%) | 4 (12.1%) |
| Food Preparation & Serving | 43 (27.7%) | 112 (72.3%) |
| Cleaning & Maintenance | 48 (38.7%) | 76 (61.3%) |
| Personal Care & Service | 0 (0.0%) | 26 (100.0%) |
| Total (Category) | 135 (30.7%) | 304 (69.3%) |
| Total (Overall) | 1,251 (52.1%) | 1,148 (47.8%) |
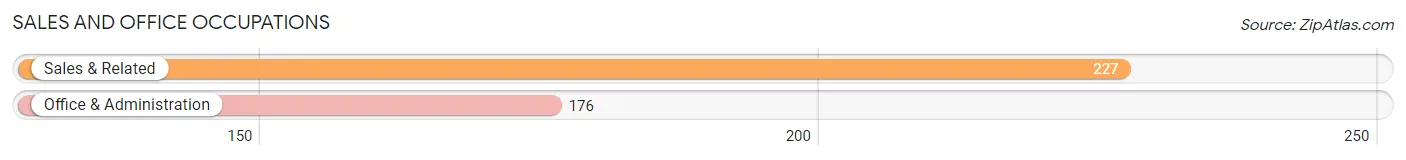
Sales and Office Occupations
The most common Sales and Office occupations in Prairie Du Chien are Sales & Related (227 | 9.5%), and Office & Administration (176 | 7.3%).
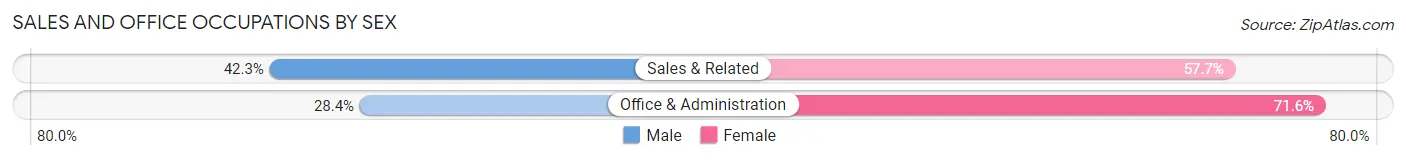
Sales and Office Occupations by Sex
| Occupation | Male | Female |
| Sales & Related | 96 (42.3%) | 131 (57.7%) |
| Office & Administration | 50 (28.4%) | 126 (71.6%) |
| Total (Category) | 146 (36.2%) | 257 (63.8%) |
| Total (Overall) | 1,251 (52.1%) | 1,148 (47.8%) |
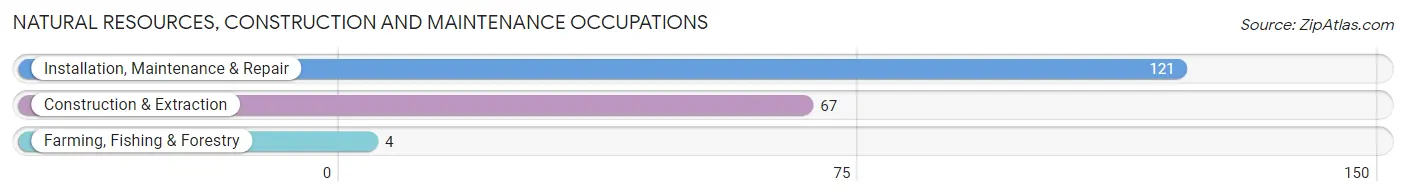
Natural Resources, Construction and Maintenance Occupations
The most common Natural Resources, Construction and Maintenance occupations in Prairie Du Chien are Installation, Maintenance & Repair (121 | 5.0%), Construction & Extraction (67 | 2.8%), and Farming, Fishing & Forestry (4 | 0.2%).
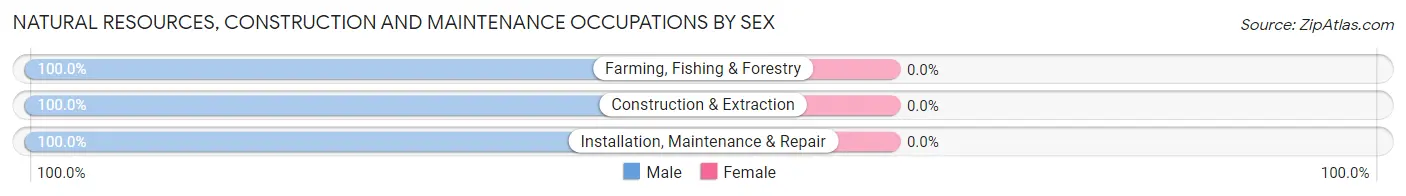
Natural Resources, Construction and Maintenance Occupations by Sex
| Occupation | Male | Female |
| Farming, Fishing & Forestry | 4 (100.0%) | 0 (0.0%) |
| Construction & Extraction | 67 (100.0%) | 0 (0.0%) |
| Installation, Maintenance & Repair | 121 (100.0%) | 0 (0.0%) |
| Total (Category) | 192 (100.0%) | 0 (0.0%) |
| Total (Overall) | 1,251 (52.1%) | 1,148 (47.8%) |
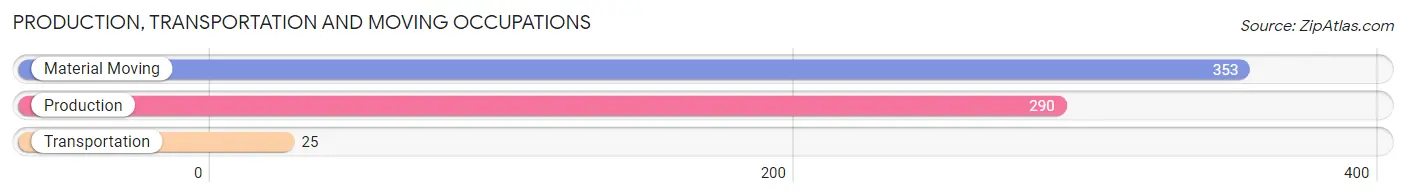
Production, Transportation and Moving Occupations
The most common Production, Transportation and Moving occupations in Prairie Du Chien are Material Moving (353 | 14.7%), Production (290 | 12.1%), and Transportation (25 | 1.0%).
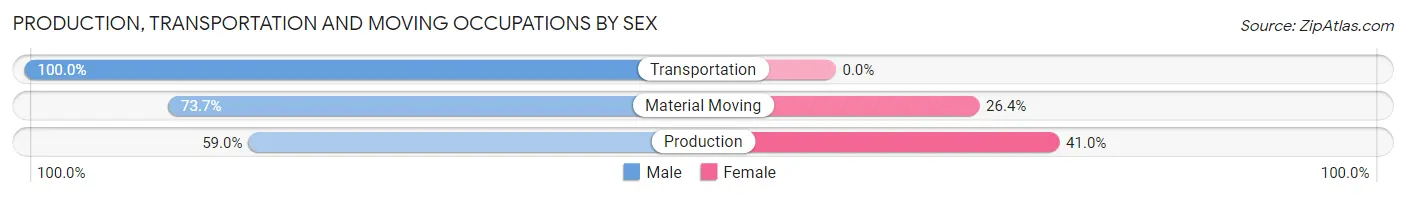
Production, Transportation and Moving Occupations by Sex
| Occupation | Male | Female |
| Production | 171 (59.0%) | 119 (41.0%) |
| Transportation | 25 (100.0%) | 0 (0.0%) |
| Material Moving | 260 (73.7%) | 93 (26.4%) |
| Total (Category) | 456 (68.3%) | 212 (31.7%) |
| Total (Overall) | 1,251 (52.1%) | 1,148 (47.8%) |
Employment Industries by Sex in Prairie Du Chien
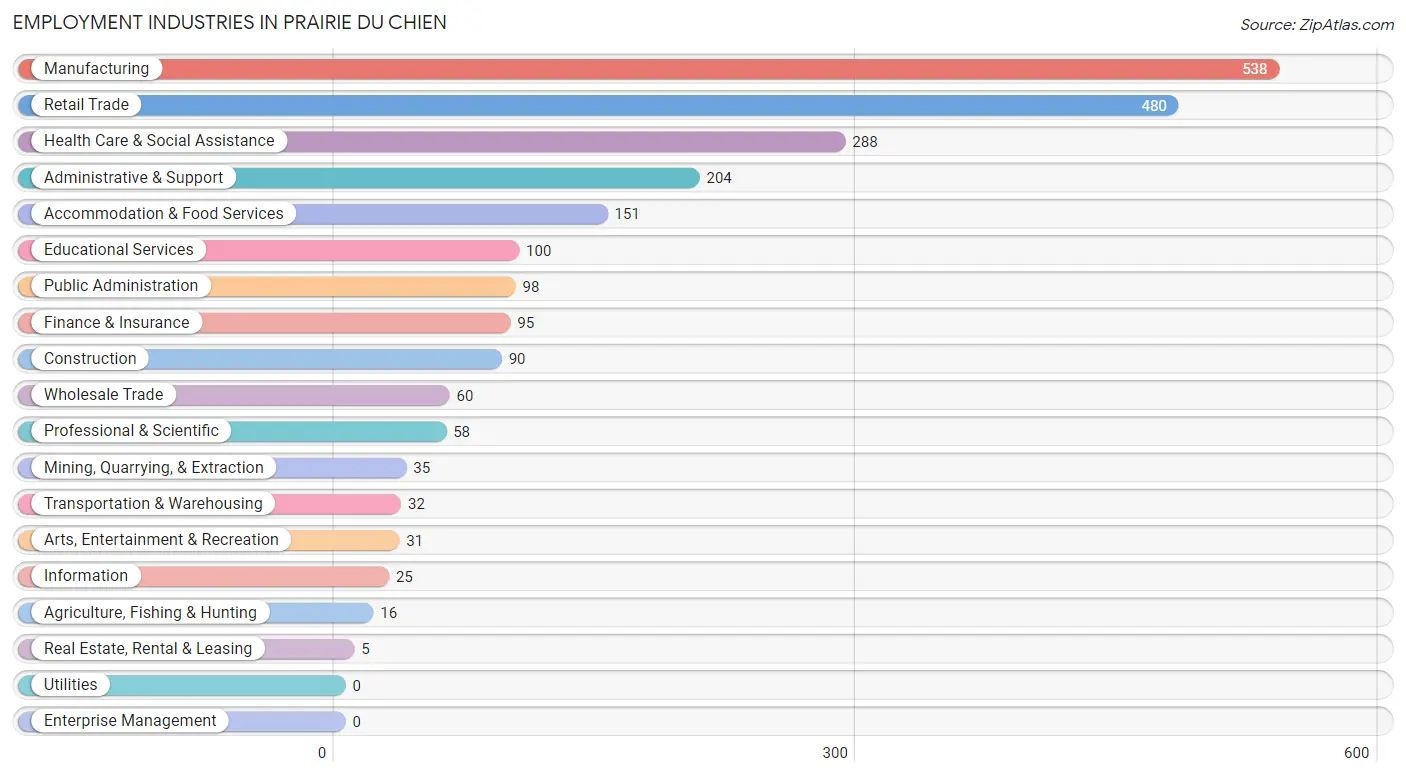
Employment Industries in Prairie Du Chien
The major employment industries in Prairie Du Chien include Manufacturing (538 | 22.4%), Retail Trade (480 | 20.0%), Health Care & Social Assistance (288 | 12.0%), Administrative & Support (204 | 8.5%), and Accommodation & Food Services (151 | 6.3%).
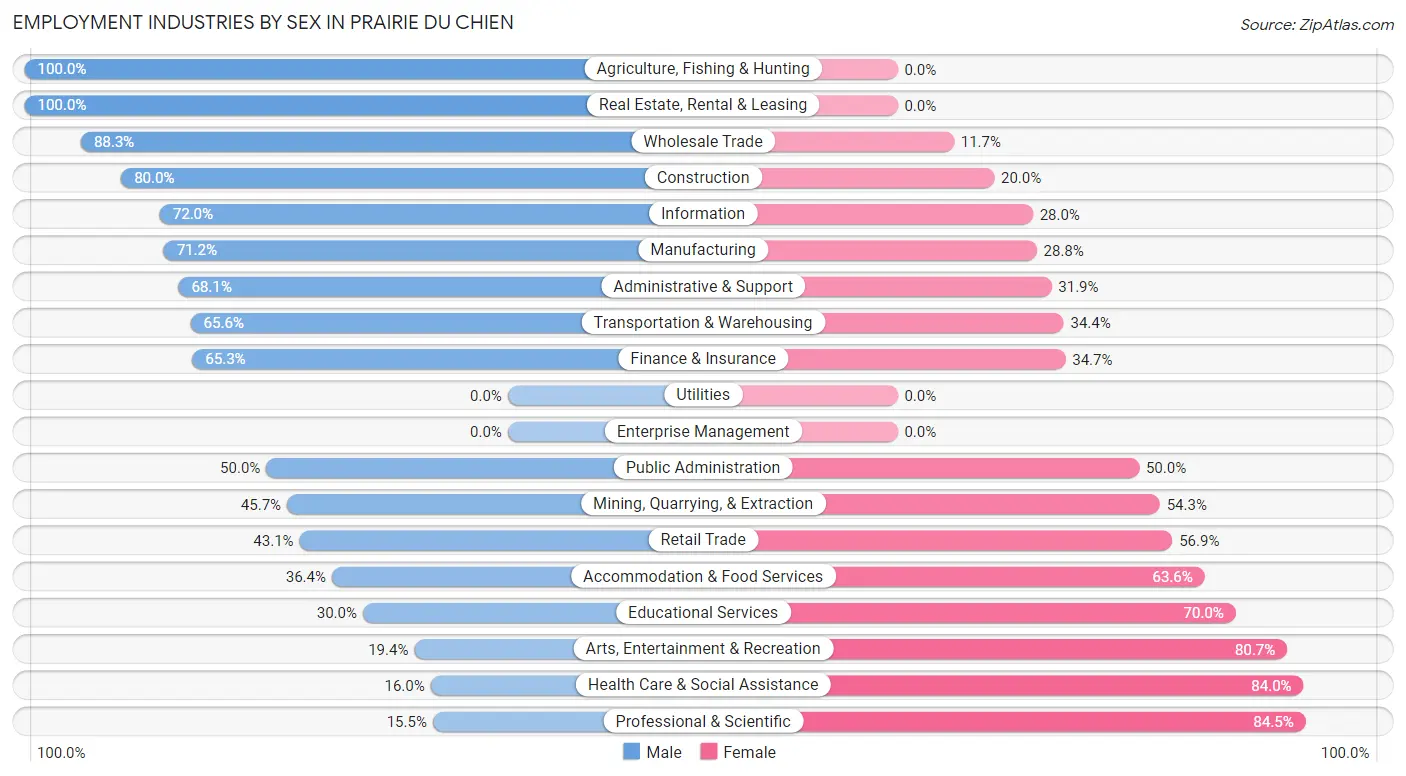
Employment Industries by Sex in Prairie Du Chien
The Prairie Du Chien industries that see more men than women are Agriculture, Fishing & Hunting (100.0%), Real Estate, Rental & Leasing (100.0%), and Wholesale Trade (88.3%), whereas the industries that tend to have a higher number of women are Professional & Scientific (84.5%), Health Care & Social Assistance (84.0%), and Arts, Entertainment & Recreation (80.6%).
| Industry | Male | Female |
| Agriculture, Fishing & Hunting | 16 (100.0%) | 0 (0.0%) |
| Mining, Quarrying, & Extraction | 16 (45.7%) | 19 (54.3%) |
| Construction | 72 (80.0%) | 18 (20.0%) |
| Manufacturing | 383 (71.2%) | 155 (28.8%) |
| Wholesale Trade | 53 (88.3%) | 7 (11.7%) |
| Retail Trade | 207 (43.1%) | 273 (56.9%) |
| Transportation & Warehousing | 21 (65.6%) | 11 (34.4%) |
| Utilities | 0 (0.0%) | 0 (0.0%) |
| Information | 18 (72.0%) | 7 (28.0%) |
| Finance & Insurance | 62 (65.3%) | 33 (34.7%) |
| Real Estate, Rental & Leasing | 5 (100.0%) | 0 (0.0%) |
| Professional & Scientific | 9 (15.5%) | 49 (84.5%) |
| Enterprise Management | 0 (0.0%) | 0 (0.0%) |
| Administrative & Support | 139 (68.1%) | 65 (31.9%) |
| Educational Services | 30 (30.0%) | 70 (70.0%) |
| Health Care & Social Assistance | 46 (16.0%) | 242 (84.0%) |
| Arts, Entertainment & Recreation | 6 (19.4%) | 25 (80.6%) |
| Accommodation & Food Services | 55 (36.4%) | 96 (63.6%) |
| Public Administration | 49 (50.0%) | 49 (50.0%) |
| Total | 1,251 (52.1%) | 1,148 (47.8%) |
Education in Prairie Du Chien
School Enrollment in Prairie Du Chien
The most common levels of schooling among the 949 students in Prairie Du Chien are middle school (245 | 25.8%), college / undergraduate (206 | 21.7%), and high school (205 | 21.6%).
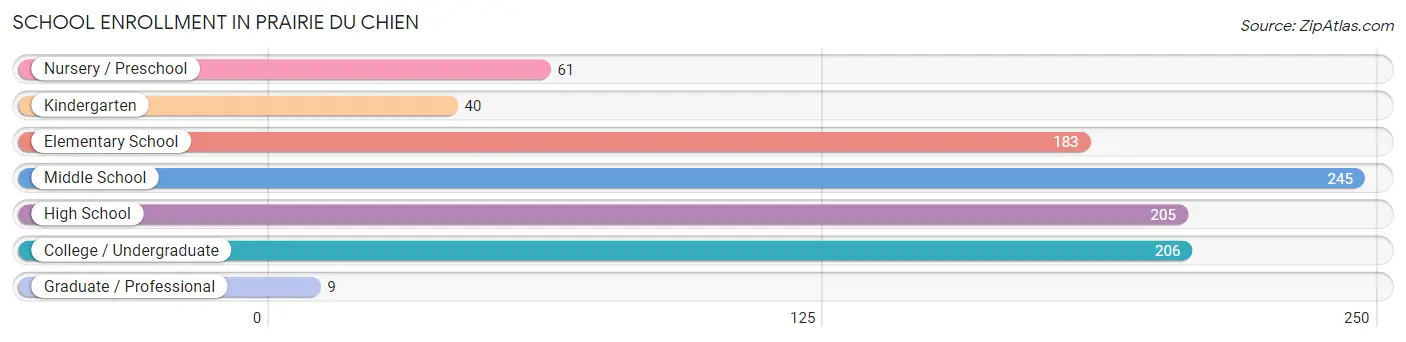
| School Level | # Students | % Students |
| Nursery / Preschool | 61 | 6.4% |
| Kindergarten | 40 | 4.2% |
| Elementary School | 183 | 19.3% |
| Middle School | 245 | 25.8% |
| High School | 205 | 21.6% |
| College / Undergraduate | 206 | 21.7% |
| Graduate / Professional | 9 | 0.9% |
| Total | 949 | 100.0% |
School Enrollment by Age by Funding Source in Prairie Du Chien
Out of a total of 949 students who are enrolled in schools in Prairie Du Chien, 80 (8.4%) attend a private institution, while the remaining 869 (91.6%) are enrolled in public schools. The age group of 20 to 24 year olds has the highest likelihood of being enrolled in private schools, with 15 (26.3% in the age bracket) enrolled. Conversely, the age group of 18 to 19 year olds has the lowest likelihood of being enrolled in a private school, with 59 (100.0% in the age bracket) attending a public institution.
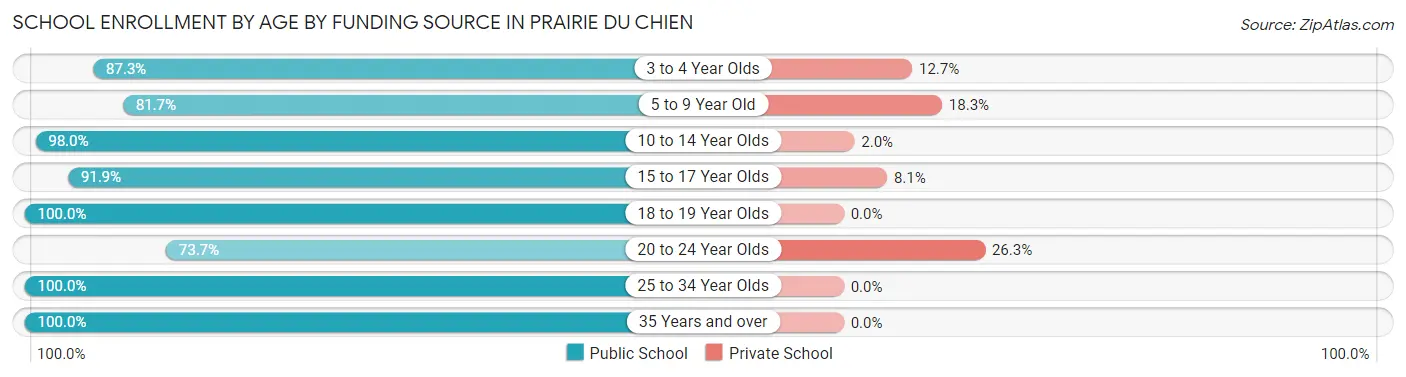
| Age Bracket | Public School | Private School |
| 3 to 4 Year Olds | 48 (87.3%) | 7 (12.7%) |
| 5 to 9 Year Old | 192 (81.7%) | 43 (18.3%) |
| 10 to 14 Year Olds | 246 (98.0%) | 5 (2.0%) |
| 15 to 17 Year Olds | 114 (91.9%) | 10 (8.1%) |
| 18 to 19 Year Olds | 59 (100.0%) | 0 (0.0%) |
| 20 to 24 Year Olds | 42 (73.7%) | 15 (26.3%) |
| 25 to 34 Year Olds | 56 (100.0%) | 0 (0.0%) |
| 35 Years and over | 112 (100.0%) | 0 (0.0%) |
| Total | 869 (91.6%) | 80 (8.4%) |
Educational Attainment by Field of Study in Prairie Du Chien
Education (155 | 21.0%), business (111 | 15.1%), science & technology (107 | 14.5%), arts & humanities (91 | 12.3%), and psychology (83 | 11.3%) are the most common fields of study among 737 individuals in Prairie Du Chien who have obtained a bachelor's degree or higher.
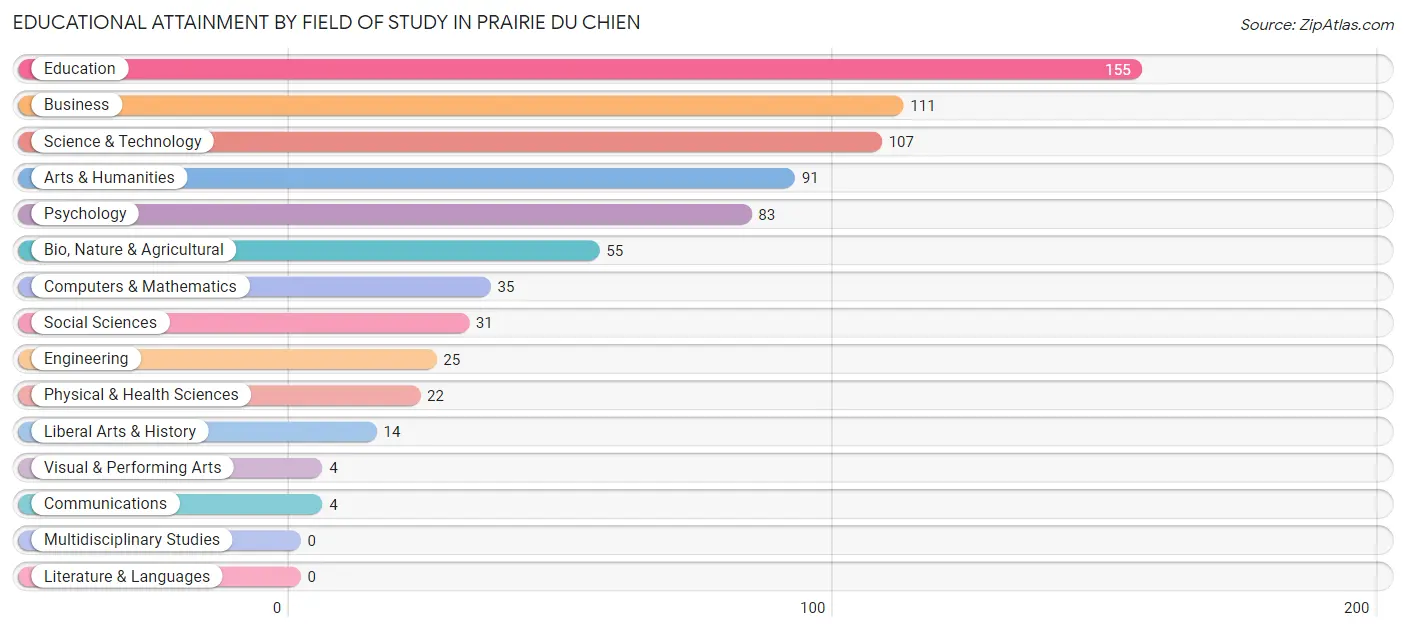
| Field of Study | # Graduates | % Graduates |
| Computers & Mathematics | 35 | 4.8% |
| Bio, Nature & Agricultural | 55 | 7.5% |
| Physical & Health Sciences | 22 | 3.0% |
| Psychology | 83 | 11.3% |
| Social Sciences | 31 | 4.2% |
| Engineering | 25 | 3.4% |
| Multidisciplinary Studies | 0 | 0.0% |
| Science & Technology | 107 | 14.5% |
| Business | 111 | 15.1% |
| Education | 155 | 21.0% |
| Literature & Languages | 0 | 0.0% |
| Liberal Arts & History | 14 | 1.9% |
| Visual & Performing Arts | 4 | 0.5% |
| Communications | 4 | 0.5% |
| Arts & Humanities | 91 | 12.3% |
| Total | 737 | 100.0% |
Transportation & Commute in Prairie Du Chien
Vehicle Availability by Sex in Prairie Du Chien
The most prevalent vehicle ownership categories in Prairie Du Chien are males with 2 vehicles (556, accounting for 44.7%) and females with 2 vehicles (540, making up 48.6%).
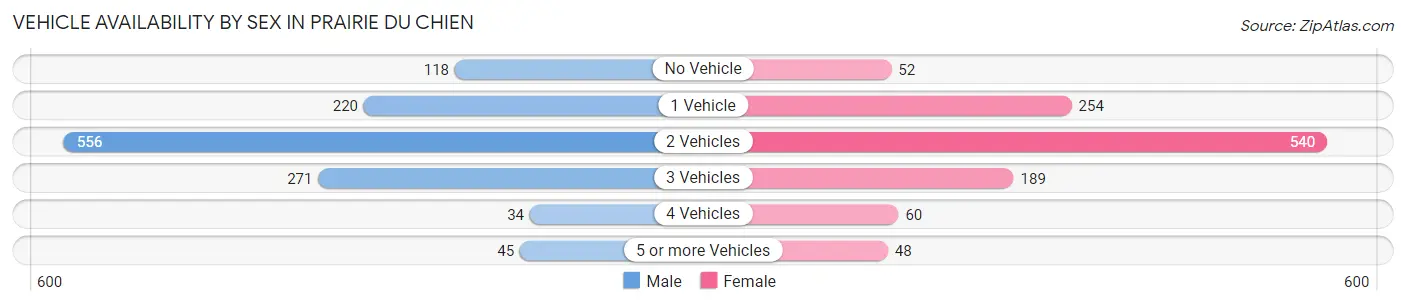
| Vehicles Available | Male | Female |
| No Vehicle | 118 (9.5%) | 52 (4.5%) |
| 1 Vehicle | 220 (17.7%) | 254 (22.2%) |
| 2 Vehicles | 556 (44.7%) | 540 (47.2%) |
| 3 Vehicles | 271 (21.8%) | 189 (16.5%) |
| 4 Vehicles | 34 (2.7%) | 60 (5.2%) |
| 5 or more Vehicles | 45 (3.6%) | 48 (4.2%) |
| Total | 1,244 (100.0%) | 1,143 (100.0%) |
Commute Time in Prairie Du Chien
The most frequently occuring commute durations in Prairie Du Chien are 5 to 9 minutes (871 commuters, 37.6%), 10 to 14 minutes (437 commuters, 18.9%), and less than 5 minutes (426 commuters, 18.4%).
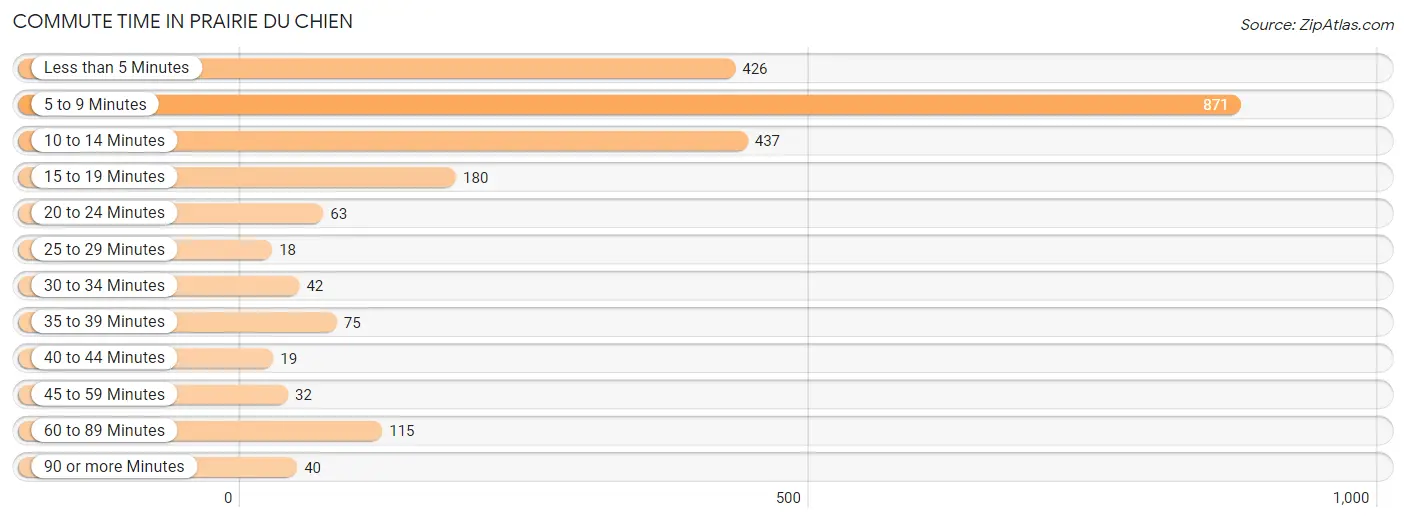
| Commute Time | # Commuters | % Commuters |
| Less than 5 Minutes | 426 | 18.4% |
| 5 to 9 Minutes | 871 | 37.6% |
| 10 to 14 Minutes | 437 | 18.9% |
| 15 to 19 Minutes | 180 | 7.8% |
| 20 to 24 Minutes | 63 | 2.7% |
| 25 to 29 Minutes | 18 | 0.8% |
| 30 to 34 Minutes | 42 | 1.8% |
| 35 to 39 Minutes | 75 | 3.2% |
| 40 to 44 Minutes | 19 | 0.8% |
| 45 to 59 Minutes | 32 | 1.4% |
| 60 to 89 Minutes | 115 | 5.0% |
| 90 or more Minutes | 40 | 1.7% |
Commute Time by Sex in Prairie Du Chien
The most common commute times in Prairie Du Chien are 5 to 9 minutes (455 commuters, 38.2%) for males and 5 to 9 minutes (416 commuters, 36.9%) for females.
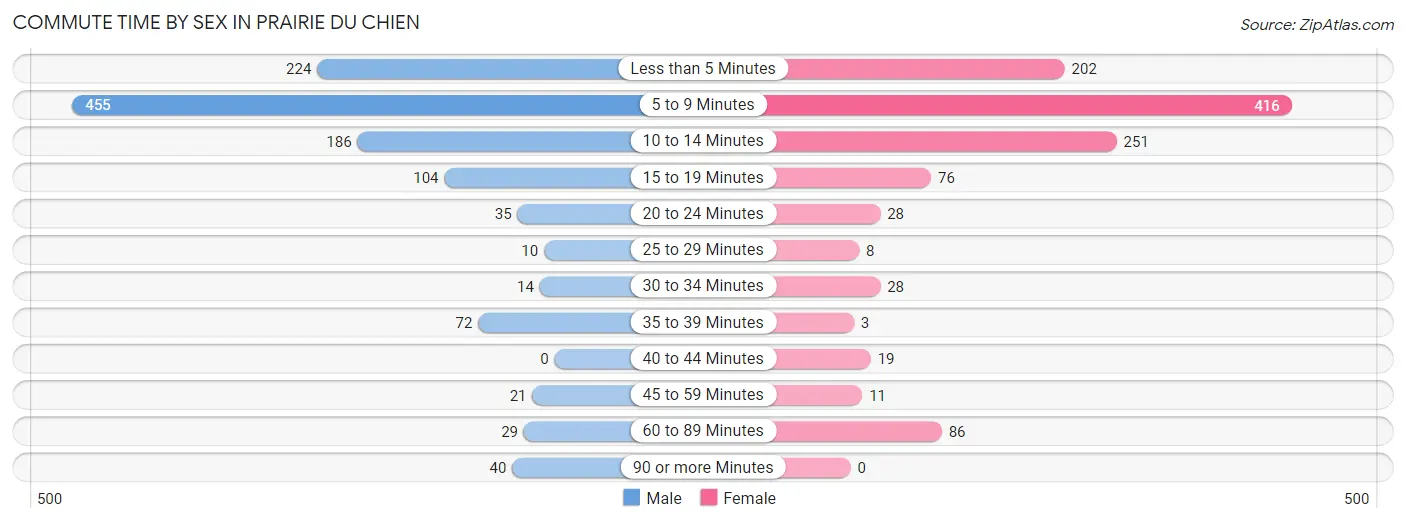
| Commute Time | Male | Female |
| Less than 5 Minutes | 224 (18.8%) | 202 (17.9%) |
| 5 to 9 Minutes | 455 (38.2%) | 416 (36.9%) |
| 10 to 14 Minutes | 186 (15.6%) | 251 (22.3%) |
| 15 to 19 Minutes | 104 (8.7%) | 76 (6.7%) |
| 20 to 24 Minutes | 35 (2.9%) | 28 (2.5%) |
| 25 to 29 Minutes | 10 (0.8%) | 8 (0.7%) |
| 30 to 34 Minutes | 14 (1.2%) | 28 (2.5%) |
| 35 to 39 Minutes | 72 (6.0%) | 3 (0.3%) |
| 40 to 44 Minutes | 0 (0.0%) | 19 (1.7%) |
| 45 to 59 Minutes | 21 (1.8%) | 11 (1.0%) |
| 60 to 89 Minutes | 29 (2.4%) | 86 (7.6%) |
| 90 or more Minutes | 40 (3.4%) | 0 (0.0%) |
Time of Departure to Work by Sex in Prairie Du Chien
The most frequent times of departure to work in Prairie Du Chien are 5:30 AM to 5:59 AM (205, 17.2%) for males and 7:30 AM to 7:59 AM (238, 21.1%) for females.
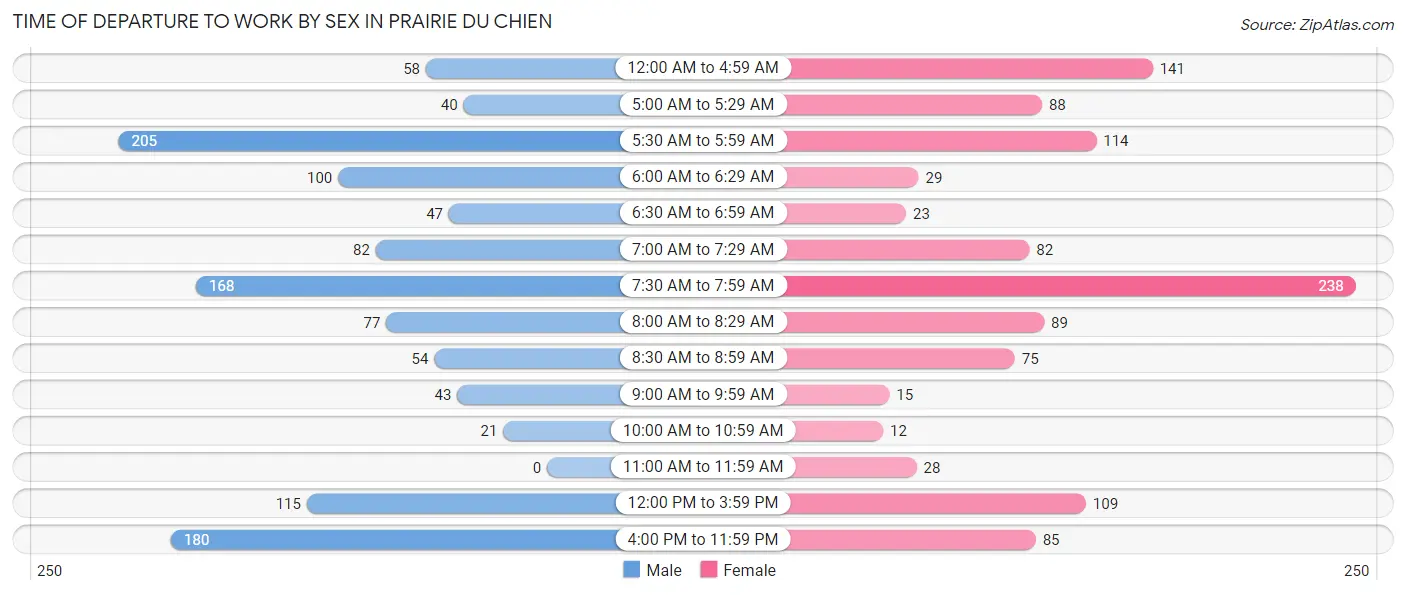
| Time of Departure | Male | Female |
| 12:00 AM to 4:59 AM | 58 (4.9%) | 141 (12.5%) |
| 5:00 AM to 5:29 AM | 40 (3.4%) | 88 (7.8%) |
| 5:30 AM to 5:59 AM | 205 (17.2%) | 114 (10.1%) |
| 6:00 AM to 6:29 AM | 100 (8.4%) | 29 (2.6%) |
| 6:30 AM to 6:59 AM | 47 (4.0%) | 23 (2.0%) |
| 7:00 AM to 7:29 AM | 82 (6.9%) | 82 (7.3%) |
| 7:30 AM to 7:59 AM | 168 (14.1%) | 238 (21.1%) |
| 8:00 AM to 8:29 AM | 77 (6.5%) | 89 (7.9%) |
| 8:30 AM to 8:59 AM | 54 (4.5%) | 75 (6.7%) |
| 9:00 AM to 9:59 AM | 43 (3.6%) | 15 (1.3%) |
| 10:00 AM to 10:59 AM | 21 (1.8%) | 12 (1.1%) |
| 11:00 AM to 11:59 AM | 0 (0.0%) | 28 (2.5%) |
| 12:00 PM to 3:59 PM | 115 (9.7%) | 109 (9.7%) |
| 4:00 PM to 11:59 PM | 180 (15.1%) | 85 (7.5%) |
| Total | 1,190 (100.0%) | 1,128 (100.0%) |
Housing Occupancy in Prairie Du Chien
Occupancy by Ownership in Prairie Du Chien
Of the total 2,162 dwellings in Prairie Du Chien, owner-occupied units account for 1,349 (62.4%), while renter-occupied units make up 813 (37.6%).
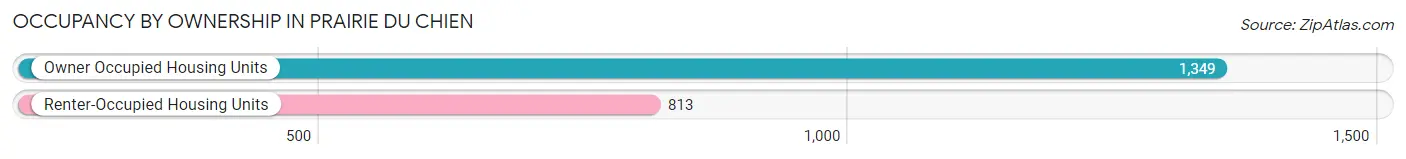
| Occupancy | # Housing Units | % Housing Units |
| Owner Occupied Housing Units | 1,349 | 62.4% |
| Renter-Occupied Housing Units | 813 | 37.6% |
| Total Occupied Housing Units | 2,162 | 100.0% |
Occupancy by Household Size in Prairie Du Chien
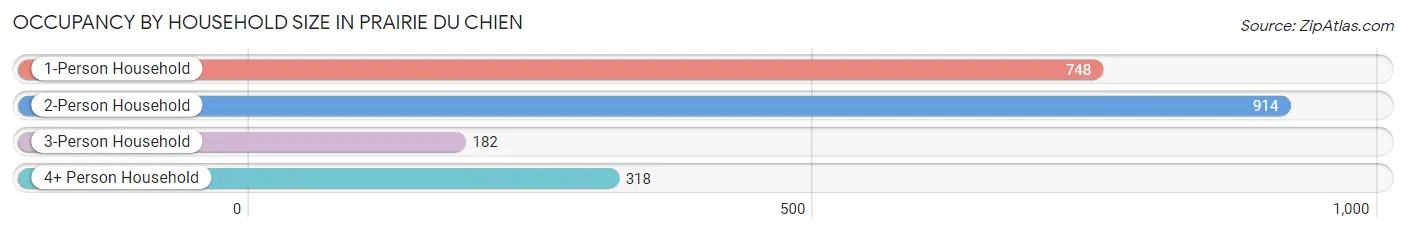
| Household Size | # Housing Units | % Housing Units |
| 1-Person Household | 748 | 34.6% |
| 2-Person Household | 914 | 42.3% |
| 3-Person Household | 182 | 8.4% |
| 4+ Person Household | 318 | 14.7% |
| Total Housing Units | 2,162 | 100.0% |
Occupancy by Ownership by Household Size in Prairie Du Chien
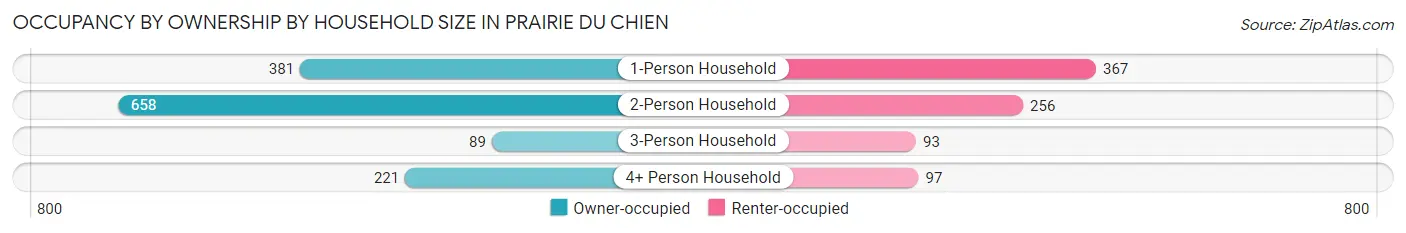
| Household Size | Owner-occupied | Renter-occupied |
| 1-Person Household | 381 (50.9%) | 367 (49.1%) |
| 2-Person Household | 658 (72.0%) | 256 (28.0%) |
| 3-Person Household | 89 (48.9%) | 93 (51.1%) |
| 4+ Person Household | 221 (69.5%) | 97 (30.5%) |
| Total Housing Units | 1,349 (62.4%) | 813 (37.6%) |
Occupancy by Educational Attainment in Prairie Du Chien
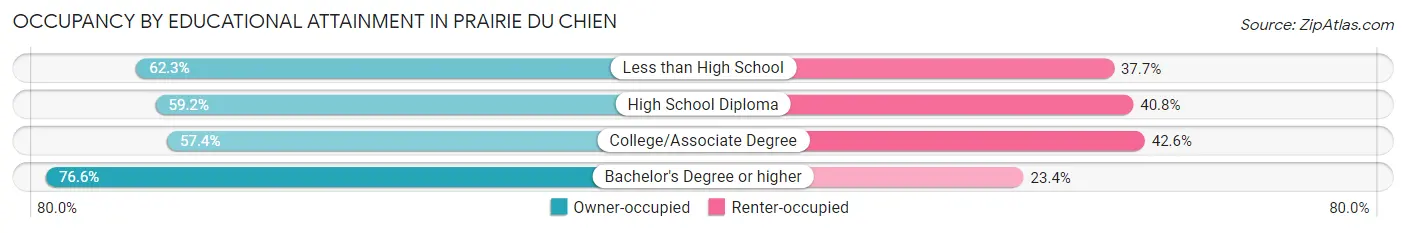
| Household Size | Owner-occupied | Renter-occupied |
| Less than High School | 71 (62.3%) | 43 (37.7%) |
| High School Diploma | 530 (59.2%) | 365 (40.8%) |
| College/Associate Degree | 404 (57.4%) | 300 (42.6%) |
| Bachelor's Degree or higher | 344 (76.6%) | 105 (23.4%) |
Occupancy by Age of Householder in Prairie Du Chien
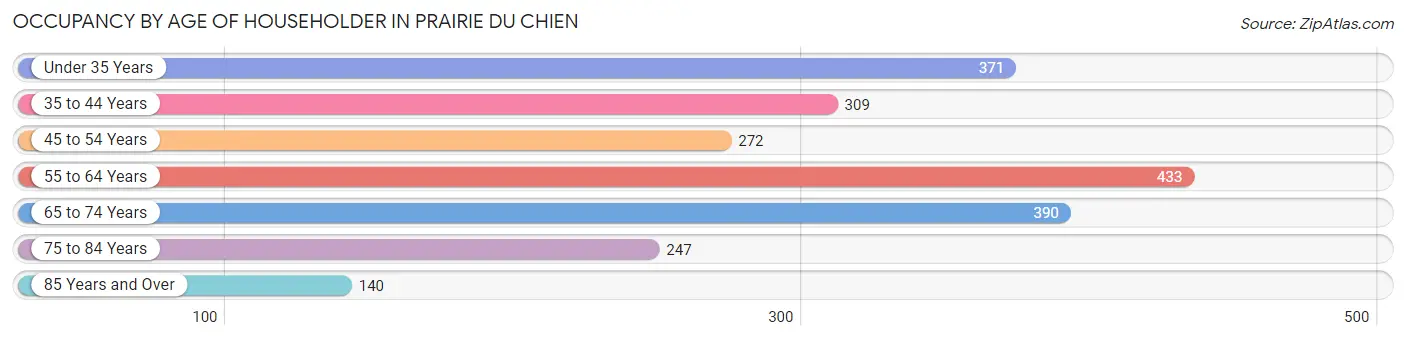
| Age Bracket | # Households | % Households |
| Under 35 Years | 371 | 17.2% |
| 35 to 44 Years | 309 | 14.3% |
| 45 to 54 Years | 272 | 12.6% |
| 55 to 64 Years | 433 | 20.0% |
| 65 to 74 Years | 390 | 18.0% |
| 75 to 84 Years | 247 | 11.4% |
| 85 Years and Over | 140 | 6.5% |
| Total | 2,162 | 100.0% |
Housing Finances in Prairie Du Chien
Median Income by Occupancy in Prairie Du Chien
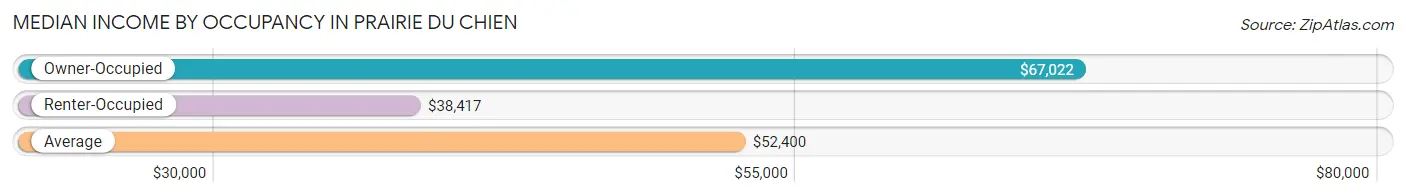
| Occupancy Type | # Households | Median Income |
| Owner-Occupied | 1,349 (62.4%) | $67,022 |
| Renter-Occupied | 813 (37.6%) | $38,417 |
| Average | 2,162 (100.0%) | $52,400 |
Occupancy by Householder Income Bracket in Prairie Du Chien
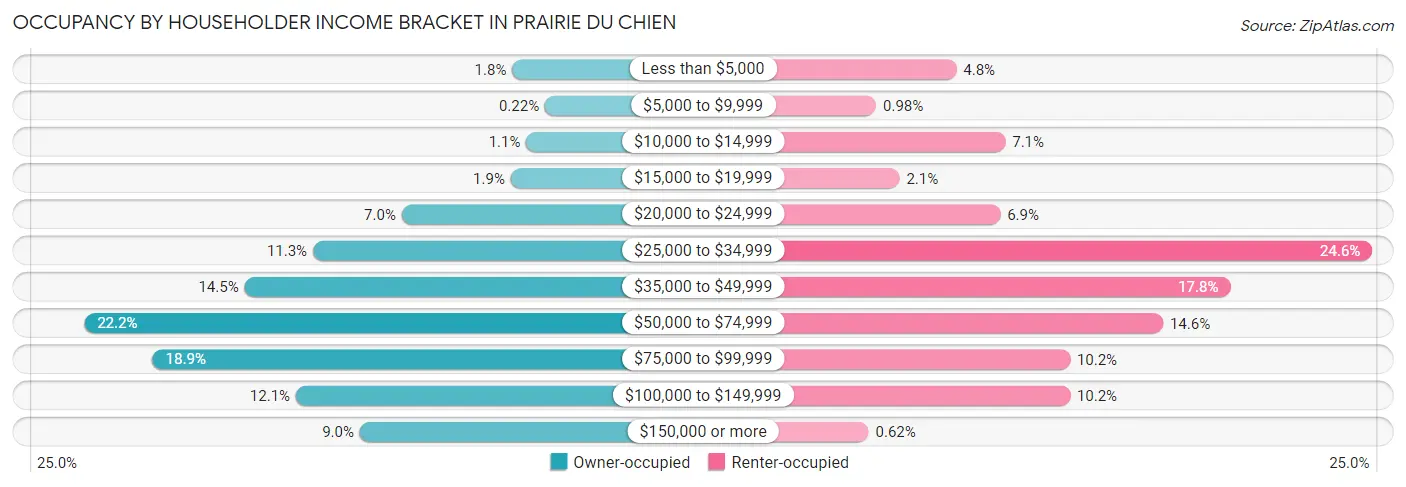
| Income Bracket | Owner-occupied | Renter-occupied |
| Less than $5,000 | 24 (1.8%) | 39 (4.8%) |
| $5,000 to $9,999 | 3 (0.2%) | 8 (1.0%) |
| $10,000 to $14,999 | 15 (1.1%) | 58 (7.1%) |
| $15,000 to $19,999 | 25 (1.8%) | 17 (2.1%) |
| $20,000 to $24,999 | 95 (7.0%) | 56 (6.9%) |
| $25,000 to $34,999 | 152 (11.3%) | 200 (24.6%) |
| $35,000 to $49,999 | 196 (14.5%) | 145 (17.8%) |
| $50,000 to $74,999 | 299 (22.2%) | 119 (14.6%) |
| $75,000 to $99,999 | 255 (18.9%) | 83 (10.2%) |
| $100,000 to $149,999 | 163 (12.1%) | 83 (10.2%) |
| $150,000 or more | 122 (9.0%) | 5 (0.6%) |
| Total | 1,349 (100.0%) | 813 (100.0%) |
Monthly Housing Cost Tiers in Prairie Du Chien
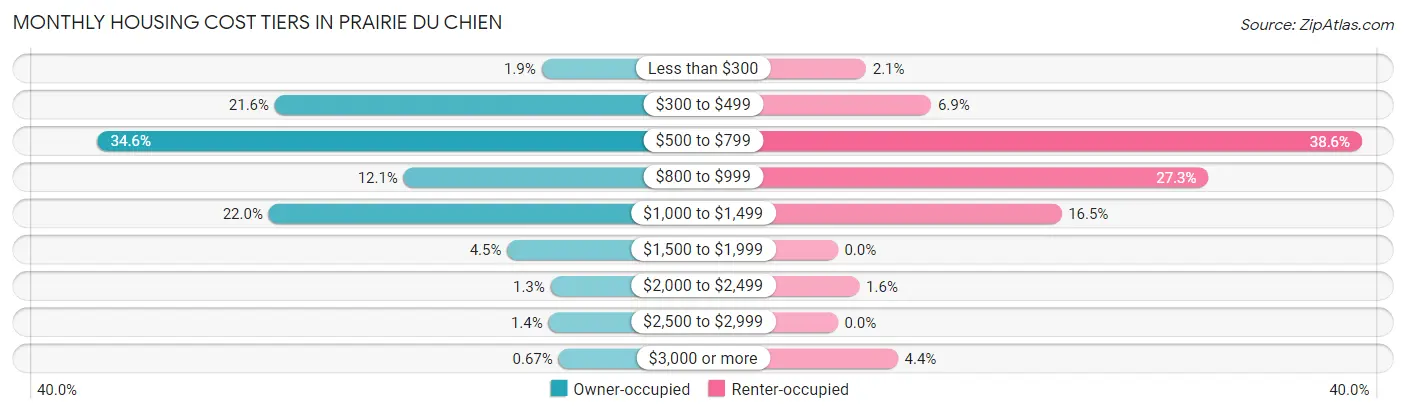
| Monthly Cost | Owner-occupied | Renter-occupied |
| Less than $300 | 26 (1.9%) | 17 (2.1%) |
| $300 to $499 | 291 (21.6%) | 56 (6.9%) |
| $500 to $799 | 467 (34.6%) | 314 (38.6%) |
| $800 to $999 | 163 (12.1%) | 222 (27.3%) |
| $1,000 to $1,499 | 297 (22.0%) | 134 (16.5%) |
| $1,500 to $1,999 | 60 (4.4%) | 0 (0.0%) |
| $2,000 to $2,499 | 17 (1.3%) | 13 (1.6%) |
| $2,500 to $2,999 | 19 (1.4%) | 0 (0.0%) |
| $3,000 or more | 9 (0.7%) | 36 (4.4%) |
| Total | 1,349 (100.0%) | 813 (100.0%) |
Physical Housing Characteristics in Prairie Du Chien
Housing Structures in Prairie Du Chien
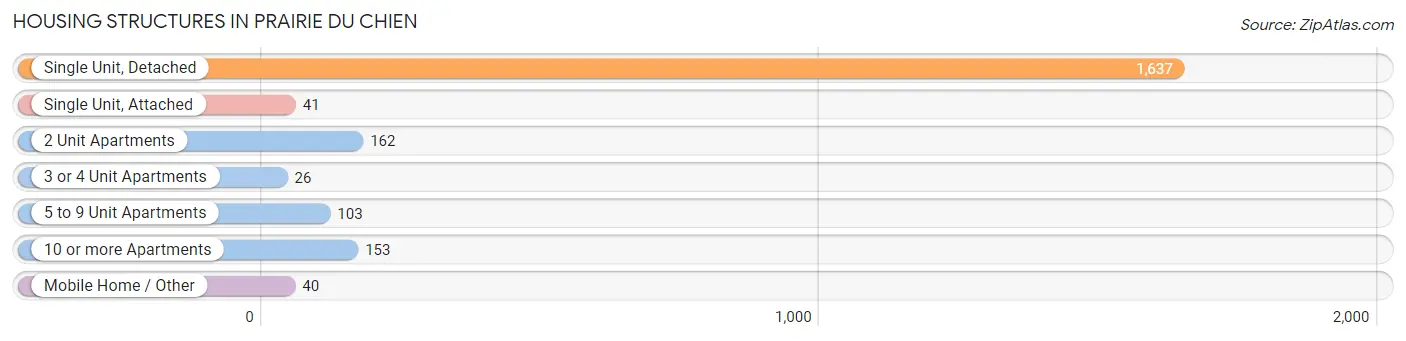
| Structure Type | # Housing Units | % Housing Units |
| Single Unit, Detached | 1,637 | 75.7% |
| Single Unit, Attached | 41 | 1.9% |
| 2 Unit Apartments | 162 | 7.5% |
| 3 or 4 Unit Apartments | 26 | 1.2% |
| 5 to 9 Unit Apartments | 103 | 4.8% |
| 10 or more Apartments | 153 | 7.1% |
| Mobile Home / Other | 40 | 1.8% |
| Total | 2,162 | 100.0% |
Housing Structures by Occupancy in Prairie Du Chien
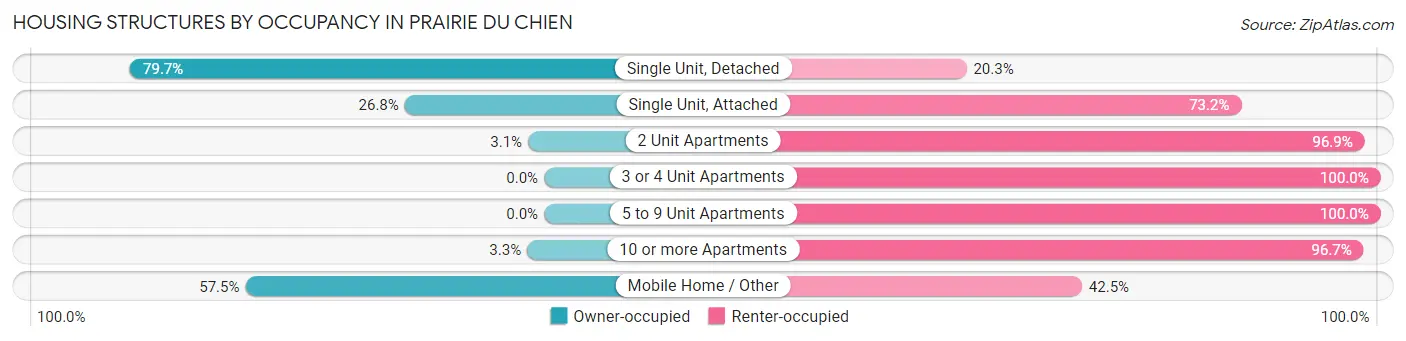
| Structure Type | Owner-occupied | Renter-occupied |
| Single Unit, Detached | 1,305 (79.7%) | 332 (20.3%) |
| Single Unit, Attached | 11 (26.8%) | 30 (73.2%) |
| 2 Unit Apartments | 5 (3.1%) | 157 (96.9%) |
| 3 or 4 Unit Apartments | 0 (0.0%) | 26 (100.0%) |
| 5 to 9 Unit Apartments | 0 (0.0%) | 103 (100.0%) |
| 10 or more Apartments | 5 (3.3%) | 148 (96.7%) |
| Mobile Home / Other | 23 (57.5%) | 17 (42.5%) |
| Total | 1,349 (62.4%) | 813 (37.6%) |
Housing Structures by Number of Rooms in Prairie Du Chien
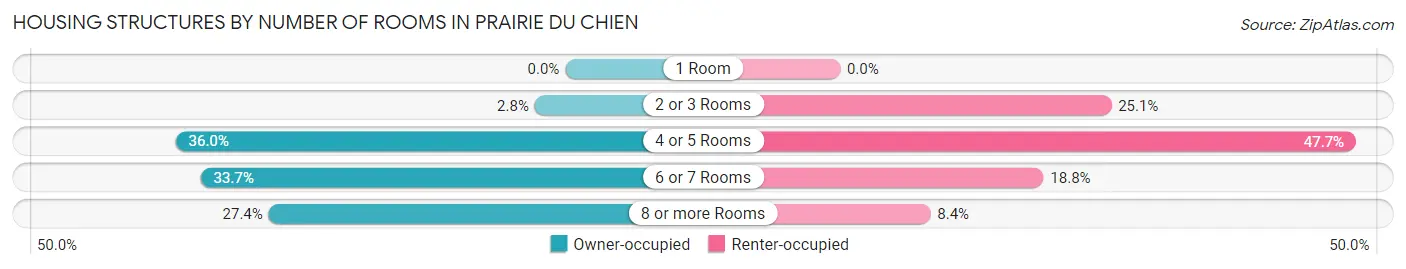
| Number of Rooms | Owner-occupied | Renter-occupied |
| 1 Room | 0 (0.0%) | 0 (0.0%) |
| 2 or 3 Rooms | 38 (2.8%) | 204 (25.1%) |
| 4 or 5 Rooms | 486 (36.0%) | 388 (47.7%) |
| 6 or 7 Rooms | 455 (33.7%) | 153 (18.8%) |
| 8 or more Rooms | 370 (27.4%) | 68 (8.4%) |
| Total | 1,349 (100.0%) | 813 (100.0%) |
Housing Structure by Heating Type in Prairie Du Chien
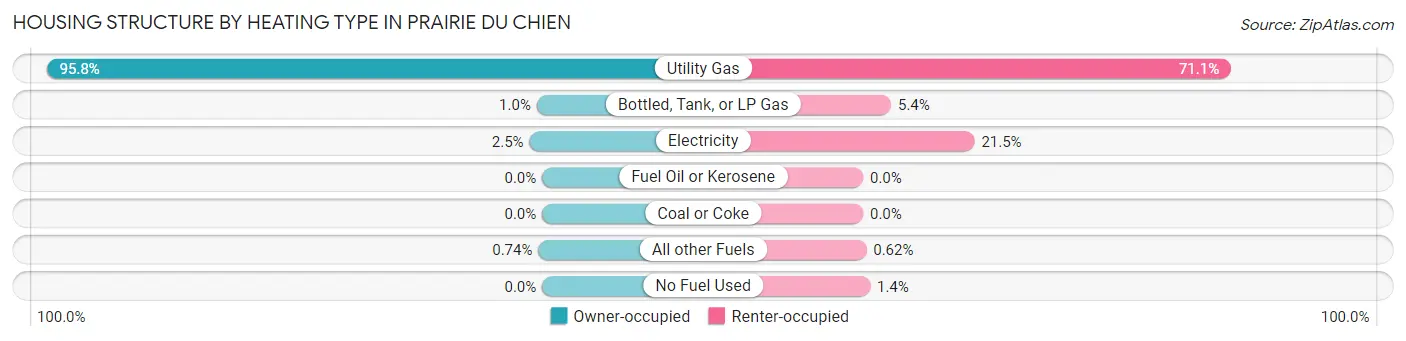
| Heating Type | Owner-occupied | Renter-occupied |
| Utility Gas | 1,292 (95.8%) | 578 (71.1%) |
| Bottled, Tank, or LP Gas | 14 (1.0%) | 44 (5.4%) |
| Electricity | 33 (2.5%) | 175 (21.5%) |
| Fuel Oil or Kerosene | 0 (0.0%) | 0 (0.0%) |
| Coal or Coke | 0 (0.0%) | 0 (0.0%) |
| All other Fuels | 10 (0.7%) | 5 (0.6%) |
| No Fuel Used | 0 (0.0%) | 11 (1.3%) |
| Total | 1,349 (100.0%) | 813 (100.0%) |
Household Vehicle Usage in Prairie Du Chien
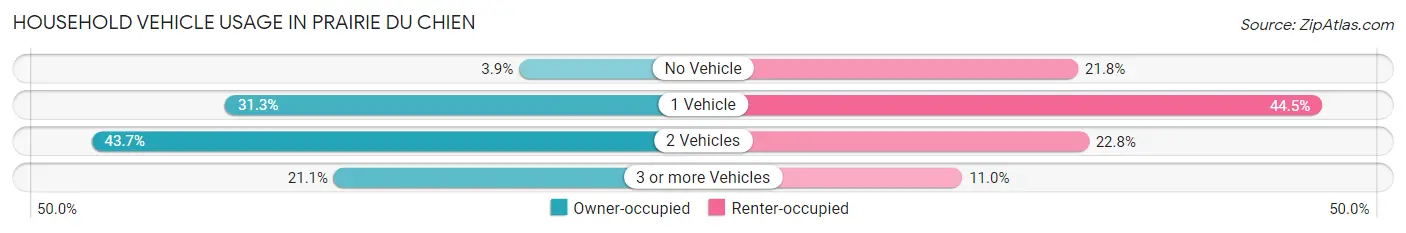
| Vehicles per Household | Owner-occupied | Renter-occupied |
| No Vehicle | 52 (3.8%) | 177 (21.8%) |
| 1 Vehicle | 422 (31.3%) | 362 (44.5%) |
| 2 Vehicles | 590 (43.7%) | 185 (22.8%) |
| 3 or more Vehicles | 285 (21.1%) | 89 (11.0%) |
| Total | 1,349 (100.0%) | 813 (100.0%) |
Real Estate & Mortgages in Prairie Du Chien
Real Estate and Mortgage Overview in Prairie Du Chien
| Characteristic | Without Mortgage | With Mortgage |
| Housing Units | 683 | 666 |
| Median Property Value | $148,700 | $131,500 |
| Median Household Income | $65,469 | $64 |
| Monthly Housing Costs | $525 | $0 |
| Real Estate Taxes | $3,252 | $0 |
Property Value by Mortgage Status in Prairie Du Chien
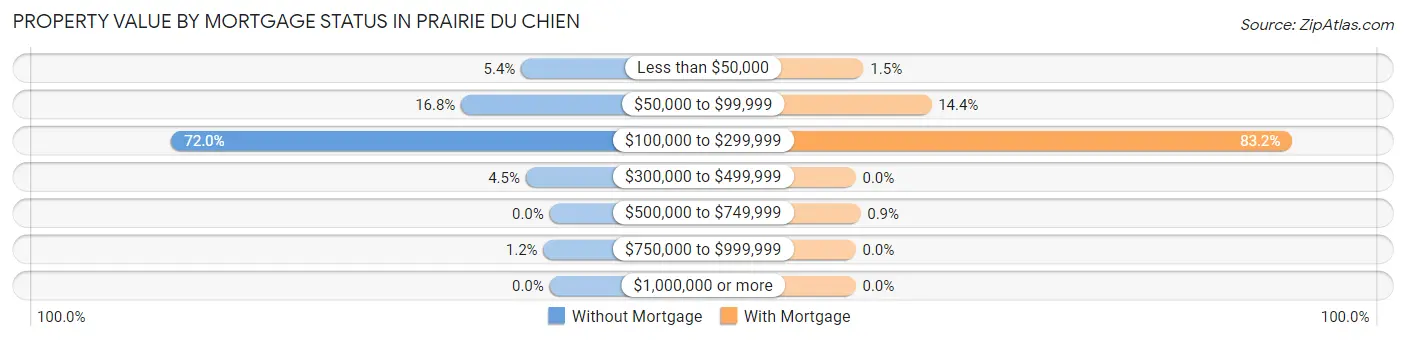
| Property Value | Without Mortgage | With Mortgage |
| Less than $50,000 | 37 (5.4%) | 10 (1.5%) |
| $50,000 to $99,999 | 115 (16.8%) | 96 (14.4%) |
| $100,000 to $299,999 | 492 (72.0%) | 554 (83.2%) |
| $300,000 to $499,999 | 31 (4.5%) | 0 (0.0%) |
| $500,000 to $749,999 | 0 (0.0%) | 6 (0.9%) |
| $750,000 to $999,999 | 8 (1.2%) | 0 (0.0%) |
| $1,000,000 or more | 0 (0.0%) | 0 (0.0%) |
| Total | 683 (100.0%) | 666 (100.0%) |
Household Income by Mortgage Status in Prairie Du Chien
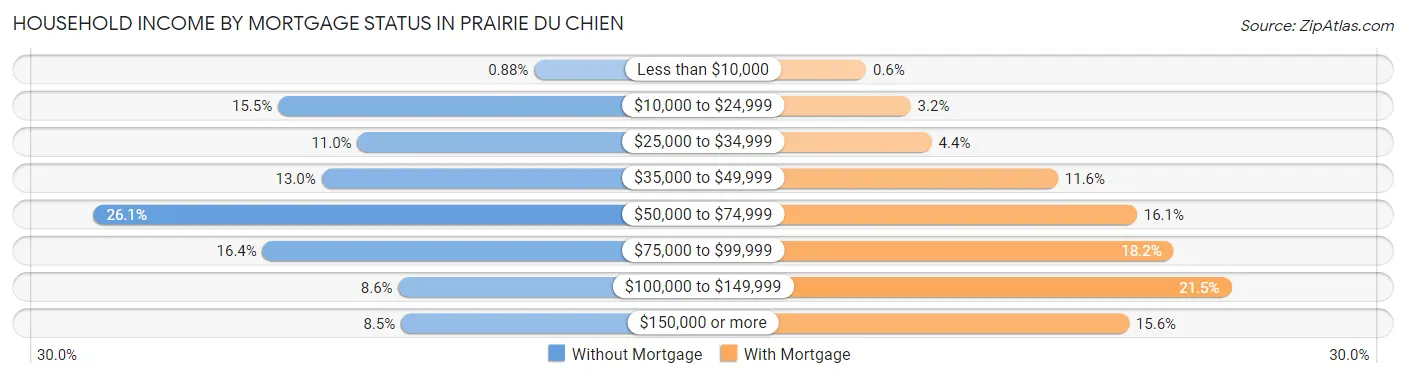
| Household Income | Without Mortgage | With Mortgage |
| Less than $10,000 | 6 (0.9%) | 4 (0.6%) |
| $10,000 to $24,999 | 106 (15.5%) | 21 (3.2%) |
| $25,000 to $34,999 | 75 (11.0%) | 29 (4.3%) |
| $35,000 to $49,999 | 89 (13.0%) | 77 (11.6%) |
| $50,000 to $74,999 | 178 (26.1%) | 107 (16.1%) |
| $75,000 to $99,999 | 112 (16.4%) | 121 (18.2%) |
| $100,000 to $149,999 | 59 (8.6%) | 143 (21.5%) |
| $150,000 or more | 58 (8.5%) | 104 (15.6%) |
| Total | 683 (100.0%) | 666 (100.0%) |
Property Value to Household Income Ratio in Prairie Du Chien
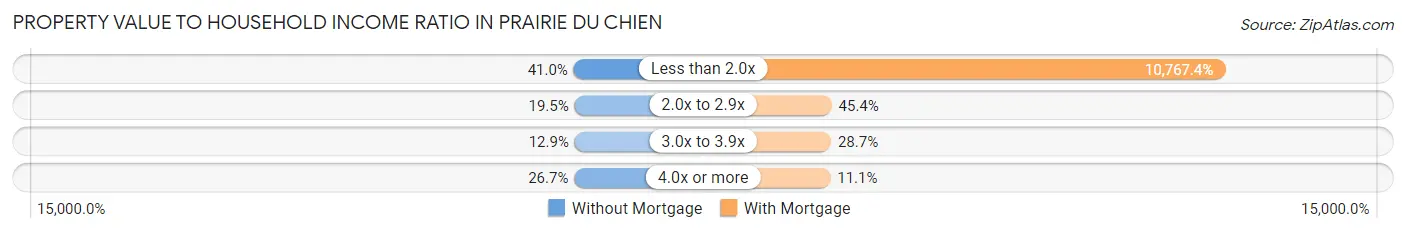
| Value-to-Income Ratio | Without Mortgage | With Mortgage |
| Less than 2.0x | 280 (41.0%) | 71,711 (10,767.4%) |
| 2.0x to 2.9x | 133 (19.5%) | 302 (45.4%) |
| 3.0x to 3.9x | 88 (12.9%) | 191 (28.7%) |
| 4.0x or more | 182 (26.7%) | 74 (11.1%) |
| Total | 683 (100.0%) | 666 (100.0%) |
Real Estate Taxes by Mortgage Status in Prairie Du Chien
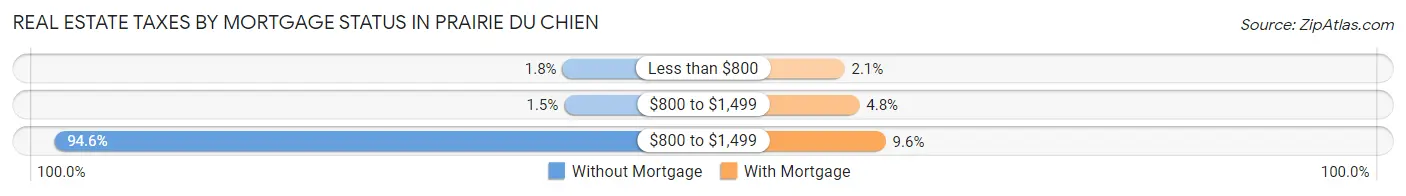
| Property Taxes | Without Mortgage | With Mortgage |
| Less than $800 | 12 (1.8%) | 14 (2.1%) |
| $800 to $1,499 | 10 (1.5%) | 32 (4.8%) |
| $800 to $1,499 | 646 (94.6%) | 64 (9.6%) |
| Total | 683 (100.0%) | 666 (100.0%) |
Health & Disability in Prairie Du Chien
Health Insurance Coverage by Age in Prairie Du Chien
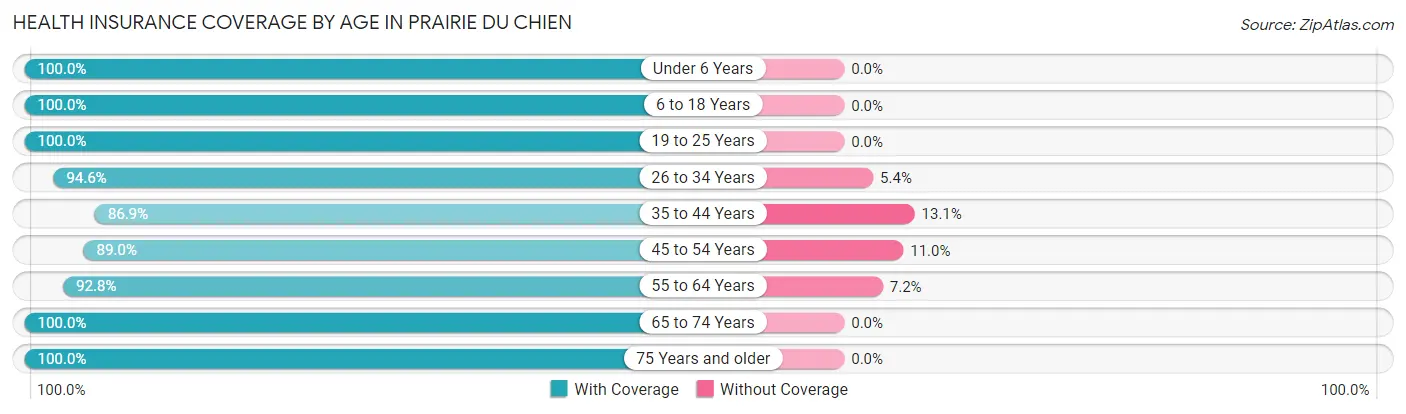
| Age Bracket | With Coverage | Without Coverage |
| Under 6 Years | 350 (100.0%) | 0 (0.0%) |
| 6 to 18 Years | 677 (100.0%) | 0 (0.0%) |
| 19 to 25 Years | 242 (100.0%) | 0 (0.0%) |
| 26 to 34 Years | 492 (94.6%) | 28 (5.4%) |
| 35 to 44 Years | 464 (86.9%) | 70 (13.1%) |
| 45 to 54 Years | 445 (89.0%) | 55 (11.0%) |
| 55 to 64 Years | 787 (92.8%) | 61 (7.2%) |
| 65 to 74 Years | 610 (100.0%) | 0 (0.0%) |
| 75 Years and older | 566 (100.0%) | 0 (0.0%) |
| Total | 4,633 (95.6%) | 214 (4.4%) |
Health Insurance Coverage by Citizenship Status in Prairie Du Chien
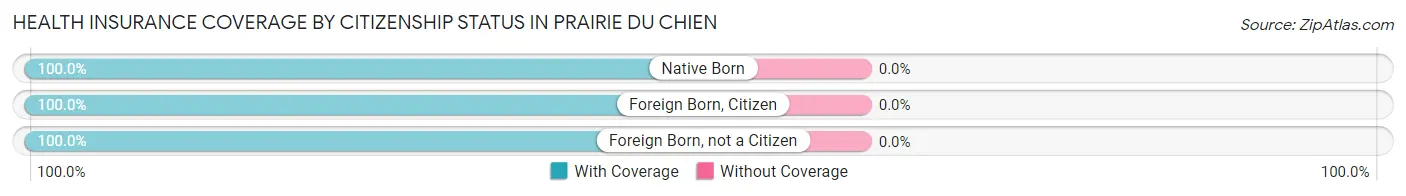
| Citizenship Status | With Coverage | Without Coverage |
| Native Born | 350 (100.0%) | 0 (0.0%) |
| Foreign Born, Citizen | 677 (100.0%) | 0 (0.0%) |
| Foreign Born, not a Citizen | 242 (100.0%) | 0 (0.0%) |
Health Insurance Coverage by Household Income in Prairie Du Chien
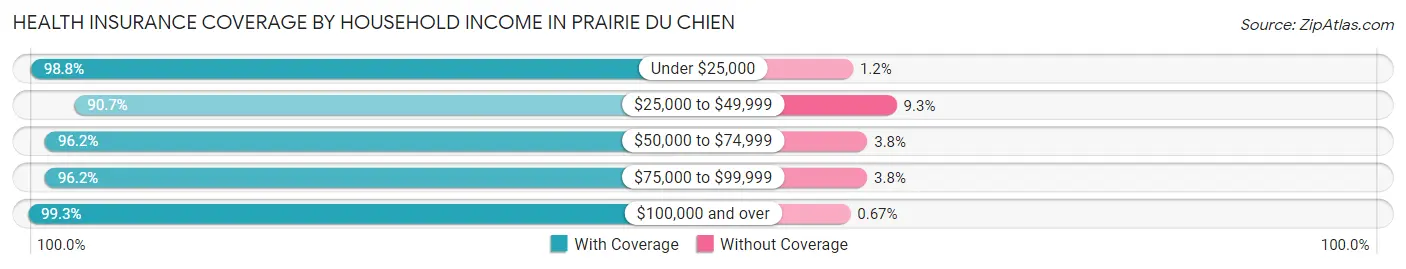
| Household Income | With Coverage | Without Coverage |
| Under $25,000 | 425 (98.8%) | 5 (1.2%) |
| $25,000 to $49,999 | 1,300 (90.7%) | 134 (9.3%) |
| $50,000 to $74,999 | 776 (96.2%) | 31 (3.8%) |
| $75,000 to $99,999 | 909 (96.2%) | 36 (3.8%) |
| $100,000 and over | 1,187 (99.3%) | 8 (0.7%) |
Public vs Private Health Insurance Coverage by Age in Prairie Du Chien
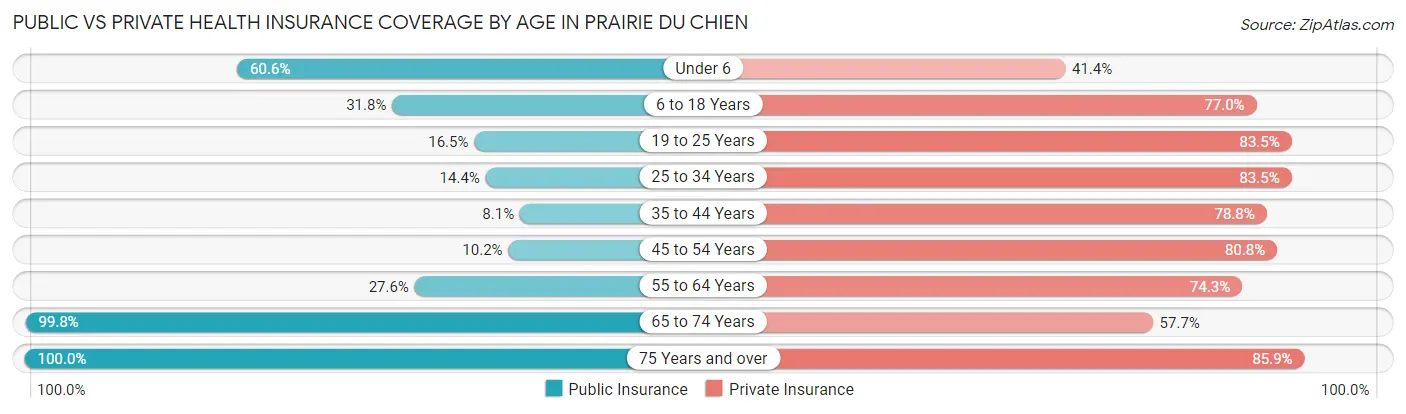
| Age Bracket | Public Insurance | Private Insurance |
| Under 6 | 212 (60.6%) | 145 (41.4%) |
| 6 to 18 Years | 215 (31.8%) | 521 (77.0%) |
| 19 to 25 Years | 40 (16.5%) | 202 (83.5%) |
| 25 to 34 Years | 75 (14.4%) | 434 (83.5%) |
| 35 to 44 Years | 43 (8.1%) | 421 (78.8%) |
| 45 to 54 Years | 51 (10.2%) | 404 (80.8%) |
| 55 to 64 Years | 234 (27.6%) | 630 (74.3%) |
| 65 to 74 Years | 609 (99.8%) | 352 (57.7%) |
| 75 Years and over | 566 (100.0%) | 486 (85.9%) |
| Total | 2,045 (42.2%) | 3,595 (74.2%) |
Disability Status by Sex by Age in Prairie Du Chien
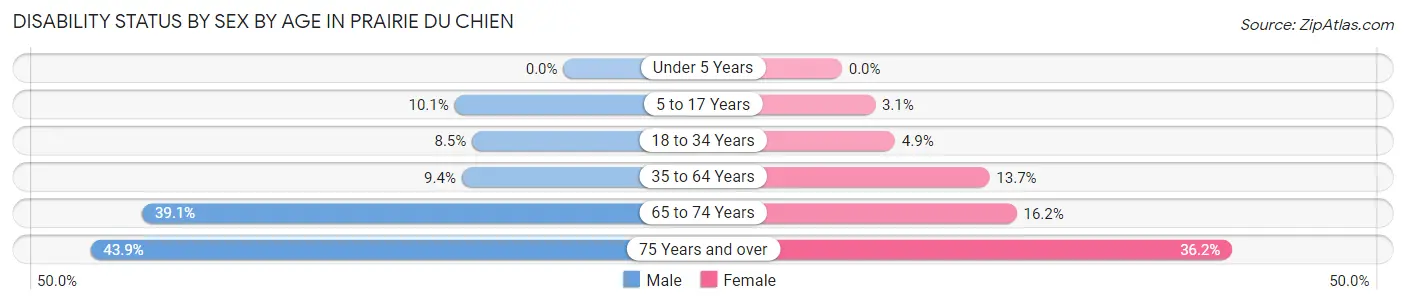
| Age Bracket | Male | Female |
| Under 5 Years | 0 (0.0%) | 0 (0.0%) |
| 5 to 17 Years | 41 (10.1%) | 8 (3.1%) |
| 18 to 34 Years | 35 (8.5%) | 20 (4.9%) |
| 35 to 64 Years | 88 (9.4%) | 130 (13.7%) |
| 65 to 74 Years | 106 (39.1%) | 55 (16.2%) |
| 75 Years and over | 97 (43.9%) | 125 (36.2%) |
Disability Class by Sex by Age in Prairie Du Chien
Disability Class: Hearing Difficulty
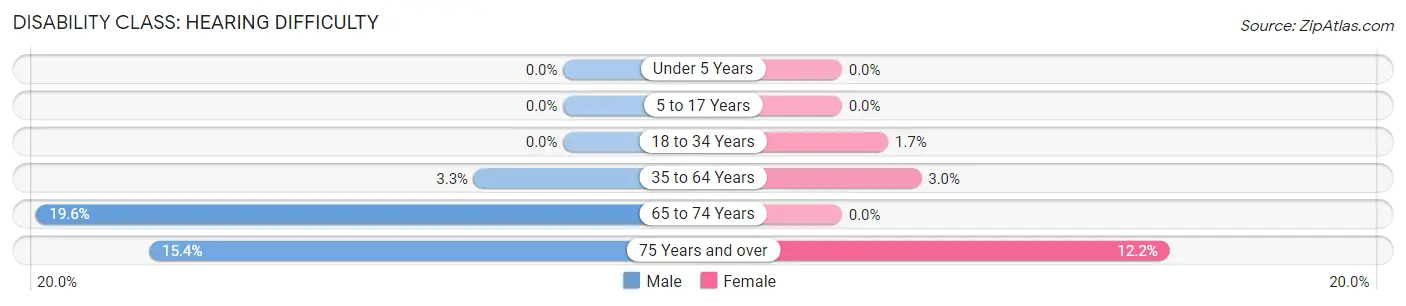
| Age Bracket | Male | Female |
| Under 5 Years | 0 (0.0%) | 0 (0.0%) |
| 5 to 17 Years | 0 (0.0%) | 0 (0.0%) |
| 18 to 34 Years | 0 (0.0%) | 7 (1.7%) |
| 35 to 64 Years | 31 (3.3%) | 28 (2.9%) |
| 65 to 74 Years | 53 (19.6%) | 0 (0.0%) |
| 75 Years and over | 34 (15.4%) | 42 (12.2%) |
Disability Class: Vision Difficulty
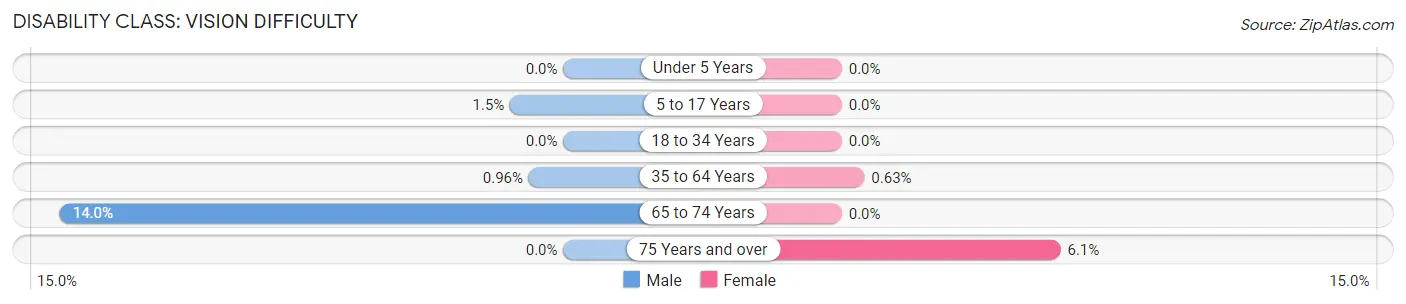
| Age Bracket | Male | Female |
| Under 5 Years | 0 (0.0%) | 0 (0.0%) |
| 5 to 17 Years | 6 (1.5%) | 0 (0.0%) |
| 18 to 34 Years | 0 (0.0%) | 0 (0.0%) |
| 35 to 64 Years | 9 (1.0%) | 6 (0.6%) |
| 65 to 74 Years | 38 (14.0%) | 0 (0.0%) |
| 75 Years and over | 0 (0.0%) | 21 (6.1%) |
Disability Class: Cognitive Difficulty
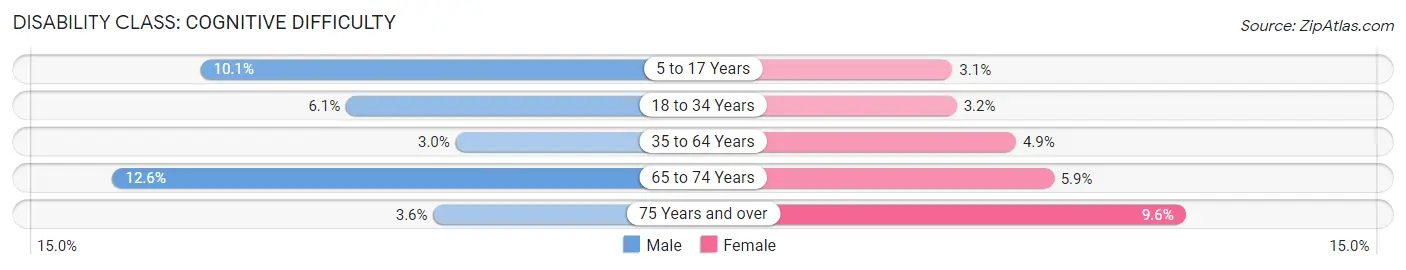
| Age Bracket | Male | Female |
| 5 to 17 Years | 41 (10.1%) | 8 (3.1%) |
| 18 to 34 Years | 25 (6.0%) | 13 (3.2%) |
| 35 to 64 Years | 28 (3.0%) | 46 (4.9%) |
| 65 to 74 Years | 34 (12.6%) | 20 (5.9%) |
| 75 Years and over | 8 (3.6%) | 33 (9.6%) |
Disability Class: Ambulatory Difficulty
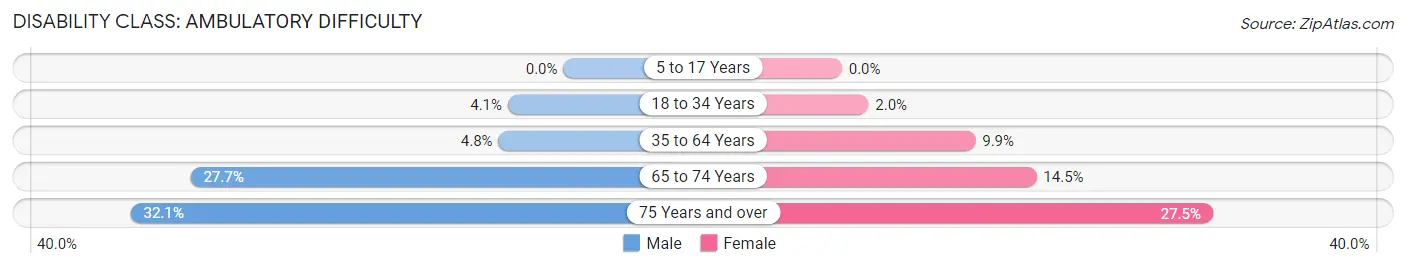
| Age Bracket | Male | Female |
| 5 to 17 Years | 0 (0.0%) | 0 (0.0%) |
| 18 to 34 Years | 17 (4.1%) | 8 (2.0%) |
| 35 to 64 Years | 45 (4.8%) | 94 (9.9%) |
| 65 to 74 Years | 75 (27.7%) | 49 (14.4%) |
| 75 Years and over | 71 (32.1%) | 95 (27.5%) |
Disability Class: Self-Care Difficulty
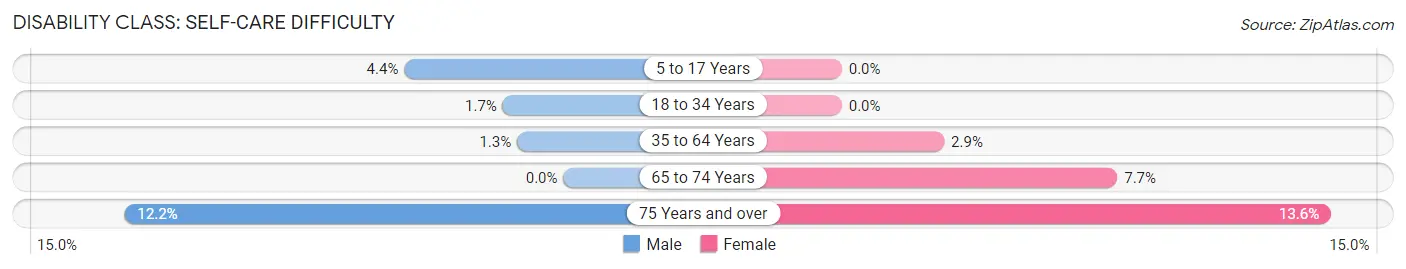
| Age Bracket | Male | Female |
| 5 to 17 Years | 18 (4.4%) | 0 (0.0%) |
| 18 to 34 Years | 7 (1.7%) | 0 (0.0%) |
| 35 to 64 Years | 12 (1.3%) | 27 (2.9%) |
| 65 to 74 Years | 0 (0.0%) | 26 (7.7%) |
| 75 Years and over | 27 (12.2%) | 47 (13.6%) |
Technology Access in Prairie Du Chien
Computing Device Access in Prairie Du Chien
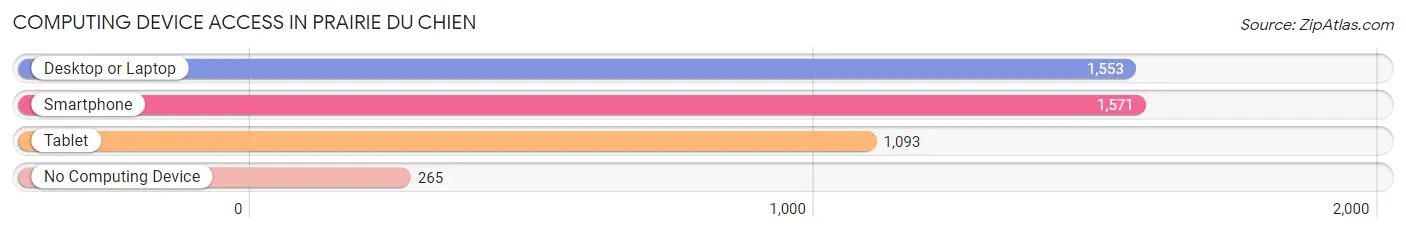
| Device Type | # Households | % Households |
| Desktop or Laptop | 1,553 | 71.8% |
| Smartphone | 1,571 | 72.7% |
| Tablet | 1,093 | 50.6% |
| No Computing Device | 265 | 12.3% |
| Total | 2,162 | 100.0% |
Internet Access in Prairie Du Chien
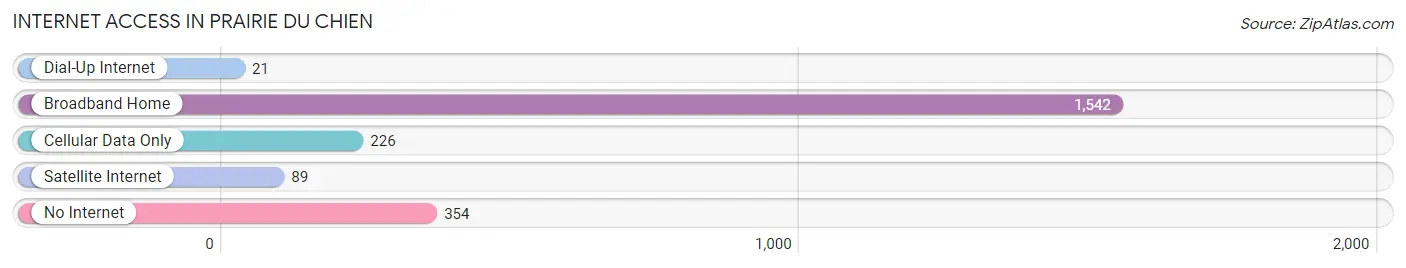
| Internet Type | # Households | % Households |
| Dial-Up Internet | 21 | 1.0% |
| Broadband Home | 1,542 | 71.3% |
| Cellular Data Only | 226 | 10.4% |
| Satellite Internet | 89 | 4.1% |
| No Internet | 354 | 16.4% |
| Total | 2,162 | 100.0% |
Prairie Du Chien Summary
Prairie du Chien is a city located in Crawford County, Wisconsin, United States. The population was 5,911 at the 2010 census. It is the county seat of Crawford County. The city is located mostly on the east side of the Wisconsin River, directly opposite the city of Marquette, Iowa.
History
Prairie du Chien was first settled by French fur traders in the late 17th century. The city was named after the prairie du Chien, a French phrase meaning "dog prairie," which was named by early French explorers and traders in the area. The city was officially incorporated in 1856.
During the War of 1812, Prairie du Chien was the site of the Battle of Prairie du Chien, a battle between the United States and the British-allied Sauk and Fox tribes. The battle was fought on July 20, 1814, and resulted in a victory for the United States.
In the 19th century, Prairie du Chien was a major trading center for the Upper Mississippi River region. The city was also a major port for steamboats, and was home to several steamboat companies.
Geography
Prairie du Chien is located at 43°3′N 91°10′W (43.05, -91.17). According to the United States Census Bureau, the city has a total area of 5.90 square miles (15.27 km2), of which, 5.87 square miles (15.19 km2) is land and 0.03 square miles (0.08 km2) is water.
Economy
Prairie du Chien is the economic center of Crawford County. The city is home to several manufacturing companies, including a paper mill, a cheese factory, and a canning factory. The city is also home to several retail stores, restaurants, and other businesses.
The city is also home to several tourist attractions, including the Prairie du Chien Historical Museum, the Villa Louis Historic Site, and the Wyalusing State Park.
Demographics
As of the census of 2010, there were 5,911 people, 2,541 households, and 1,541 families residing in the city. The population density was 1,007.2 people per square mile (389.2/km2). There were 2,741 housing units at an average density of 466.2 per square mile (180.2/km2). The racial makeup of the city was 95.2% White, 0.7% African American, 0.6% Native American, 0.5% Asian, 0.1% Pacific Islander, 1.7% from other races, and 1.2% from two or more races. Hispanic or Latino of any race were 3.3% of the population.
There were 2,541 households, out of which 28.2% had children under the age of 18 living with them, 44.2% were married couples living together, 11.7% had a female householder with no husband present, and 39.3% were non-families. 33.2% of all households were made up of individuals, and 15.2% had someone living alone who was 65 years of age or older. The average household size was 2.30 and the average family size was 2.93.
In the city, the population was spread out, with 24.2% under the age of 18, 8.2% from 18 to 24, 25.7% from 25 to 44, 22.7% from 45 to 64, and 19.2% who were 65 years of age or older. The median age was 39 years. For every 100 females, there were 91.2 males. For every 100 females age 18 and over, there were 87.2 males.
The median income for a household in the city was $35,938, and the median income for a family was $45,938. Males had a median income of $31,938 versus $22,938 for females. The per capita income for the city was $18,938. About 8.2% of families and 11.7% of the population were below the poverty line, including 15.2% of those under age 18 and 8.2% of those age 65 or over.
Common Questions
What is Per Capita Income in Prairie Du Chien?
Per Capita income in Prairie Du Chien is $28,255.
What is the Median Family Income in Prairie Du Chien?
Median Family Income in Prairie Du Chien is $71,042.
What is the Median Household income in Prairie Du Chien?
Median Household Income in Prairie Du Chien is $52,400.
What is Income or Wage Gap in Prairie Du Chien?
Income or Wage Gap in Prairie Du Chien is 17.5%.
Women in Prairie Du Chien earn 82.5 cents for every dollar earned by a man.
What is Inequality or Gini Index in Prairie Du Chien?
Inequality or Gini Index in Prairie Du Chien is 0.39.
What is the Total Population of Prairie Du Chien?
Total Population of Prairie Du Chien is 5,502.
What is the Total Male Population of Prairie Du Chien?
Total Male Population of Prairie Du Chien is 2,951.
What is the Total Female Population of Prairie Du Chien?
Total Female Population of Prairie Du Chien is 2,551.
What is the Ratio of Males per 100 Females in Prairie Du Chien?
There are 115.68 Males per 100 Females in Prairie Du Chien.
What is the Ratio of Females per 100 Males in Prairie Du Chien?
There are 86.45 Females per 100 Males in Prairie Du Chien.
What is the Median Population Age in Prairie Du Chien?
Median Population Age in Prairie Du Chien is 45.7 Years.
What is the Average Family Size in Prairie Du Chien
Average Family Size in Prairie Du Chien is 2.9 People.
What is the Average Household Size in Prairie Du Chien
Average Household Size in Prairie Du Chien is 2.2 People.
How Large is the Labor Force in Prairie Du Chien?
There are 2,440 People in the Labor Forcein in Prairie Du Chien.
What is the Percentage of People in the Labor Force in Prairie Du Chien?
53.0% of People are in the Labor Force in Prairie Du Chien.
What is the Unemployment Rate in Prairie Du Chien?
Unemployment Rate in Prairie Du Chien is 1.6%.