Evergreen, CO Map & Demographics
Evergreen Map
Evergreen Overview
$74,260
PER CAPITA INCOME
$165,563
AVG FAMILY INCOME
$144,858
AVG HOUSEHOLD INCOME
53.5%
WAGE / INCOME GAP [ % ]
46.5¢/ $1
WAGE / INCOME GAP [ $ ]
$12,967
FAMILY INCOME DEFICIT
0.43
INEQUALITY / GINI INDEX
8,972
TOTAL POPULATION
4,330
MALE POPULATION
4,642
FEMALE POPULATION
93.28
MALES / 100 FEMALES
107.21
FEMALES / 100 MALES
46.2
MEDIAN AGE
2.9
AVG FAMILY SIZE
2.5
AVG HOUSEHOLD SIZE
4,875
LABOR FORCE [ PEOPLE ]
67.0%
PERCENT IN LABOR FORCE
1.3%
UNEMPLOYMENT RATE
Evergreen Zip Codes
Income in Evergreen
Income Overview in Evergreen
Per Capita Income in Evergreen is $74,260, while median incomes of families and households are $165,563 and $144,858 respectively.
| Characteristic | Number | Measure |
| Per Capita Income | 8,972 | $74,260 |
| Median Family Income | 2,611 | $165,563 |
| Mean Family Income | 2,611 | $204,857 |
| Median Household Income | 3,633 | $144,858 |
| Mean Household Income | 3,633 | $178,074 |
| Income Deficit | 2,611 | $12,967 |
| Wage / Income Gap (%) | 8,972 | 53.53% |
| Wage / Income Gap ($) | 8,972 | 46.47¢ per $1 |
| Gini / Inequality Index | 8,972 | 0.43 |
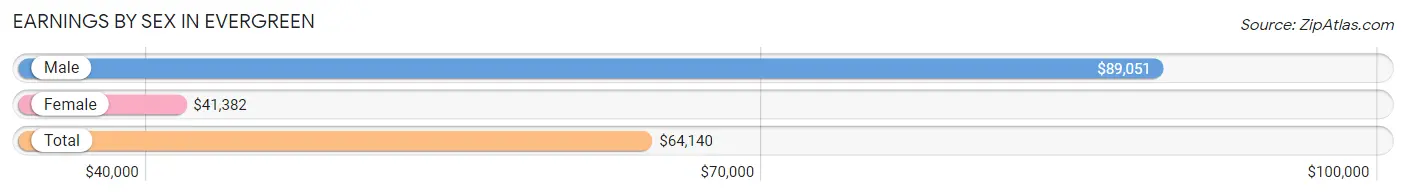
Earnings by Sex in Evergreen
Average Earnings in Evergreen are $64,140, $89,051 for men and $41,382 for women, a difference of 53.5%.
| Sex | Number | Average Earnings |
| Male | 2,835 (52.4%) | $89,051 |
| Female | 2,574 (47.6%) | $41,382 |
| Total | 5,409 (100.0%) | $64,140 |
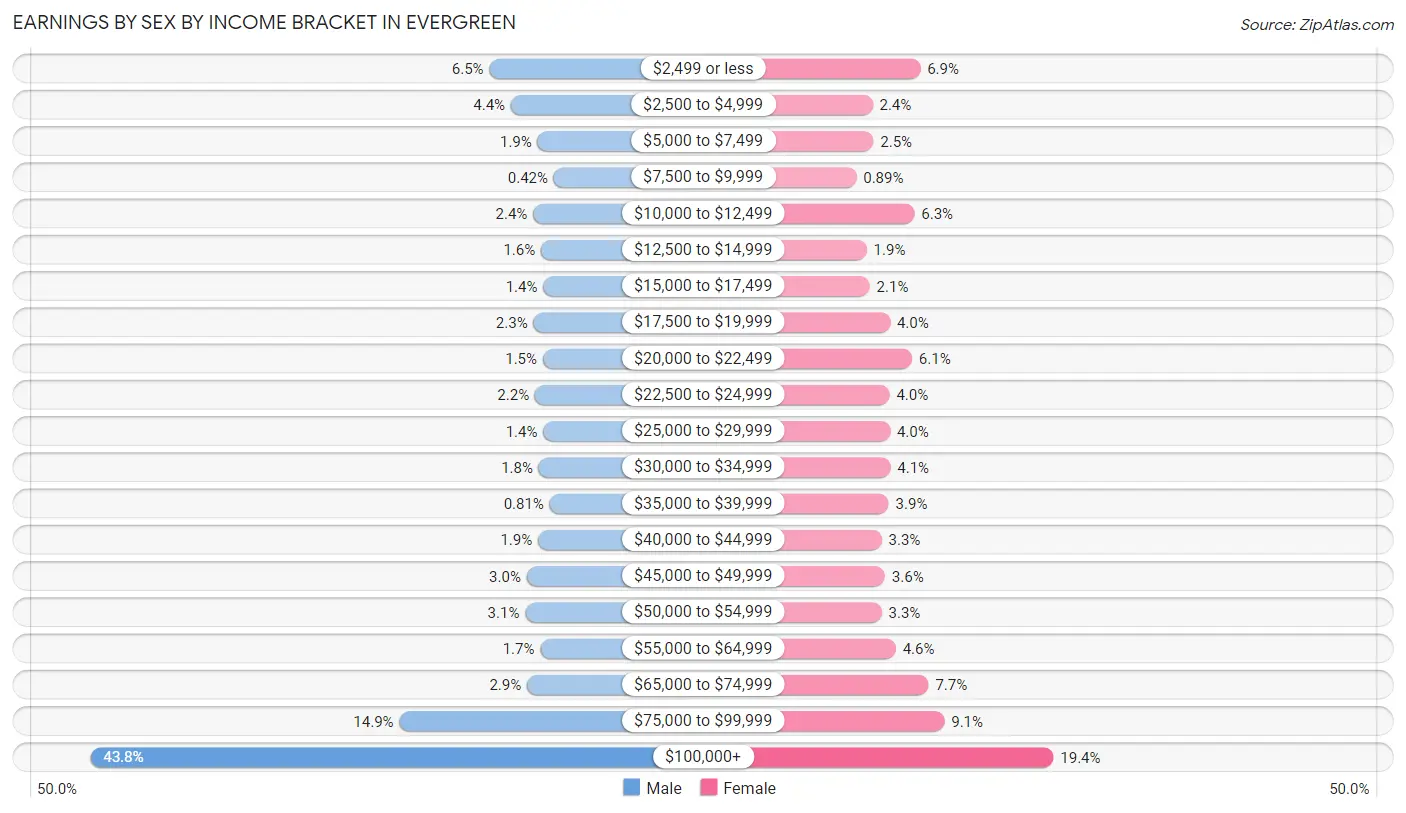
Earnings by Sex by Income Bracket in Evergreen
The most common earnings brackets in Evergreen are $100,000+ for men (1,243 | 43.8%) and $100,000+ for women (498 | 19.4%).
| Income | Male | Female |
| $2,499 or less | 183 (6.5%) | 177 (6.9%) |
| $2,500 to $4,999 | 126 (4.4%) | 62 (2.4%) |
| $5,000 to $7,499 | 55 (1.9%) | 64 (2.5%) |
| $7,500 to $9,999 | 12 (0.4%) | 23 (0.9%) |
| $10,000 to $12,499 | 67 (2.4%) | 163 (6.3%) |
| $12,500 to $14,999 | 46 (1.6%) | 48 (1.9%) |
| $15,000 to $17,499 | 40 (1.4%) | 55 (2.1%) |
| $17,500 to $19,999 | 66 (2.3%) | 104 (4.0%) |
| $20,000 to $22,499 | 41 (1.5%) | 157 (6.1%) |
| $22,500 to $24,999 | 62 (2.2%) | 103 (4.0%) |
| $25,000 to $29,999 | 40 (1.4%) | 104 (4.0%) |
| $30,000 to $34,999 | 52 (1.8%) | 105 (4.1%) |
| $35,000 to $39,999 | 23 (0.8%) | 101 (3.9%) |
| $40,000 to $44,999 | 54 (1.9%) | 84 (3.3%) |
| $45,000 to $49,999 | 84 (3.0%) | 92 (3.6%) |
| $50,000 to $54,999 | 88 (3.1%) | 84 (3.3%) |
| $55,000 to $64,999 | 48 (1.7%) | 118 (4.6%) |
| $65,000 to $74,999 | 83 (2.9%) | 197 (7.6%) |
| $75,000 to $99,999 | 422 (14.9%) | 235 (9.1%) |
| $100,000+ | 1,243 (43.8%) | 498 (19.4%) |
| Total | 2,835 (100.0%) | 2,574 (100.0%) |
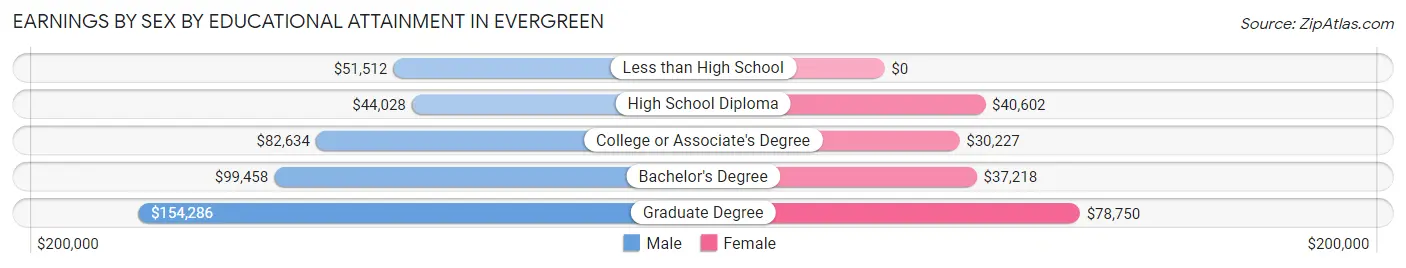
Earnings by Sex by Educational Attainment in Evergreen
Average earnings in Evergreen are $99,344 for men and $46,141 for women, a difference of 53.5%. Men with an educational attainment of graduate degree enjoy the highest average annual earnings of $154,286, while those with high school diploma education earn the least with $44,028. Women with an educational attainment of graduate degree earn the most with the average annual earnings of $78,750, while those with college or associate's degree education have the smallest earnings of $30,227.
| Educational Attainment | Male Income | Female Income |
| Less than High School | $51,512 | $0 |
| High School Diploma | $44,028 | $40,602 |
| College or Associate's Degree | $82,634 | $30,227 |
| Bachelor's Degree | $99,458 | $37,218 |
| Graduate Degree | $154,286 | $78,750 |
| Total | $99,344 | $46,141 |
Family Income in Evergreen
Family Income Brackets in Evergreen
According to the Evergreen family income data, there are 1,008 families falling into the $200,000+ income range, which is the most common income bracket and makes up 38.6% of all families. Conversely, the less than $10,000 income bracket is the least frequent group with only 10 families (0.4%) belonging to this category.
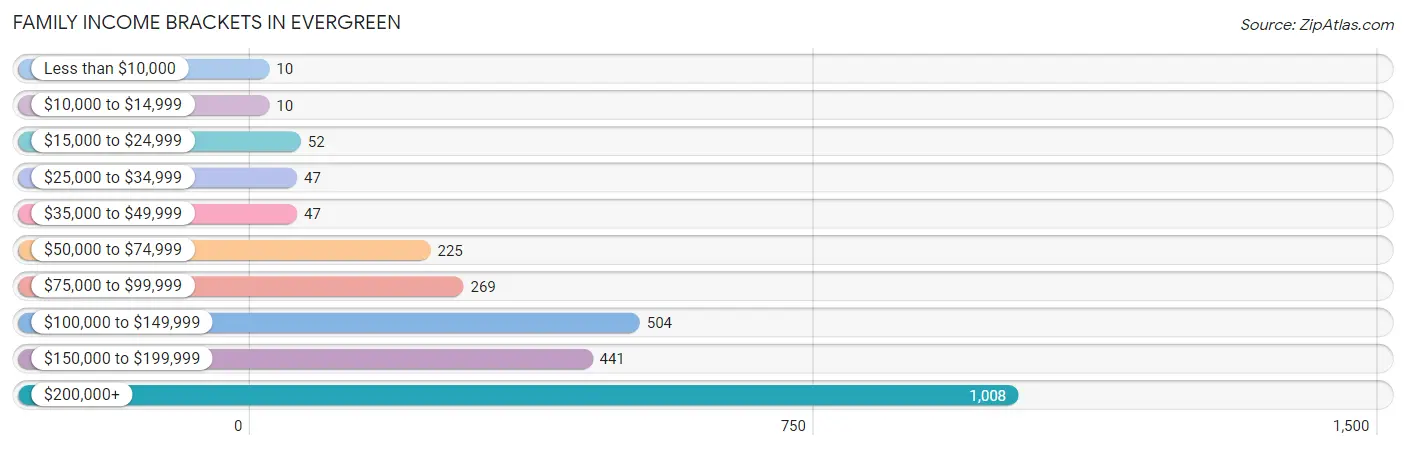
| Income Bracket | # Families | % Families |
| Less than $10,000 | 10 | 0.4% |
| $10,000 to $14,999 | 10 | 0.4% |
| $15,000 to $24,999 | 52 | 2.0% |
| $25,000 to $34,999 | 47 | 1.8% |
| $35,000 to $49,999 | 47 | 1.8% |
| $50,000 to $74,999 | 225 | 8.6% |
| $75,000 to $99,999 | 269 | 10.3% |
| $100,000 to $149,999 | 504 | 19.3% |
| $150,000 to $199,999 | 441 | 16.9% |
| $200,000+ | 1,008 | 38.6% |
Family Income by Famaliy Size in Evergreen
6-person families (62 | 2.4%) account for the highest median family income in Evergreen with $250,001 per family, while 2-person families (1,474 | 56.5%) have the highest median income of $70,170 per family member.
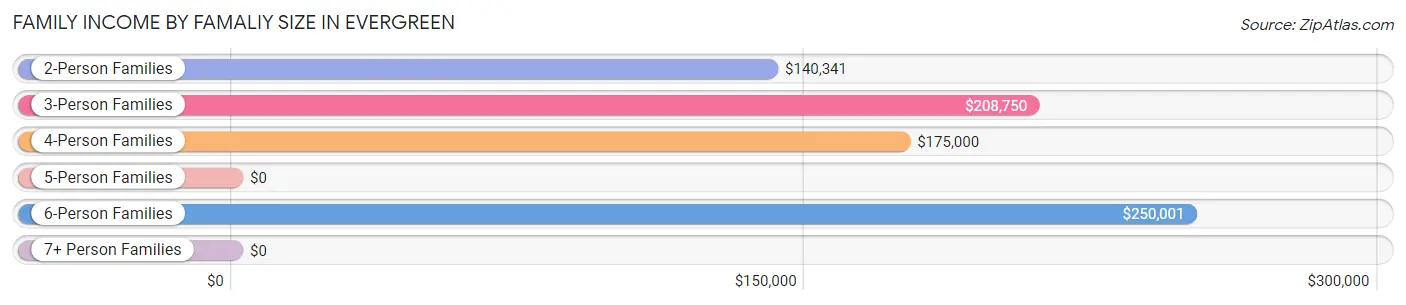
| Income Bracket | # Families | Median Income |
| 2-Person Families | 1,474 (56.5%) | $140,341 |
| 3-Person Families | 390 (14.9%) | $208,750 |
| 4-Person Families | 534 (20.4%) | $175,000 |
| 5-Person Families | 140 (5.4%) | $0 |
| 6-Person Families | 62 (2.4%) | $250,001 |
| 7+ Person Families | 11 (0.4%) | $0 |
| Total | 2,611 (100.0%) | $165,563 |
Family Income by Number of Earners in Evergreen
The median family income in Evergreen is $165,563, with families comprising 2 earners (1,400) having the highest median family income of $193,750, while families with no earners (304) have the lowest median family income of $97,222, accounting for 53.6% and 11.6% of families, respectively.
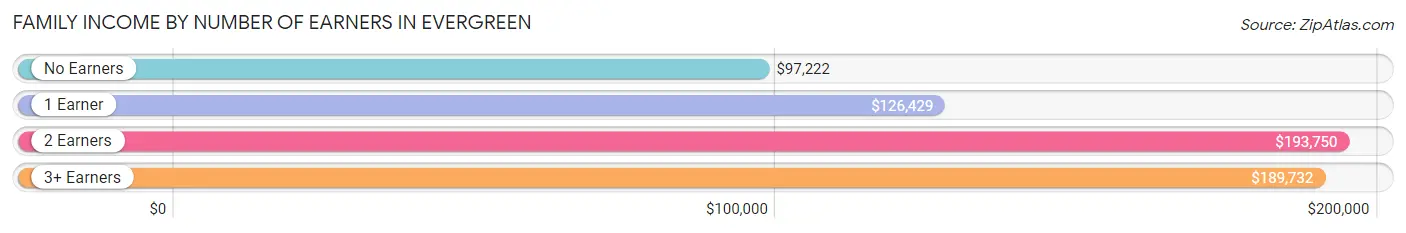
| Number of Earners | # Families | Median Income |
| No Earners | 304 (11.6%) | $97,222 |
| 1 Earner | 654 (25.1%) | $126,429 |
| 2 Earners | 1,400 (53.6%) | $193,750 |
| 3+ Earners | 253 (9.7%) | $189,732 |
| Total | 2,611 (100.0%) | $165,563 |
Household Income in Evergreen
Household Income Brackets in Evergreen
With 1,173 households falling in the category, the $200,000+ income range is the most frequent in Evergreen, accounting for 32.3% of all households. In contrast, only 33 households (0.9%) fall into the $10,000 to $14,999 income bracket, making it the least populous group.
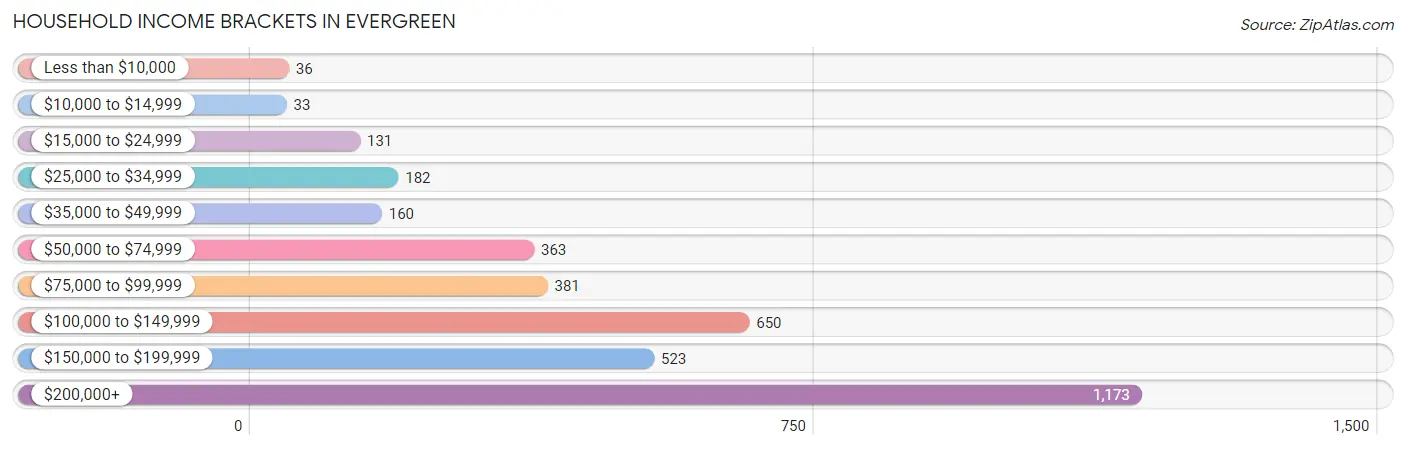
| Income Bracket | # Households | % Households |
| Less than $10,000 | 36 | 1.0% |
| $10,000 to $14,999 | 33 | 0.9% |
| $15,000 to $24,999 | 131 | 3.6% |
| $25,000 to $34,999 | 182 | 5.0% |
| $35,000 to $49,999 | 160 | 4.4% |
| $50,000 to $74,999 | 363 | 10.0% |
| $75,000 to $99,999 | 381 | 10.5% |
| $100,000 to $149,999 | 650 | 17.9% |
| $150,000 to $199,999 | 523 | 14.4% |
| $200,000+ | 1,173 | 32.3% |
Household Income by Householder Age in Evergreen
The median household income in Evergreen is $144,858, with the highest median household income of $173,934 found in the 45 to 64 years age bracket for the primary householder. A total of 1,483 households (40.8%) fall into this category. Meanwhile, the 15 to 24 years age bracket for the primary householder has the lowest median household income of $0, with 9 households (0.3%) in this group.
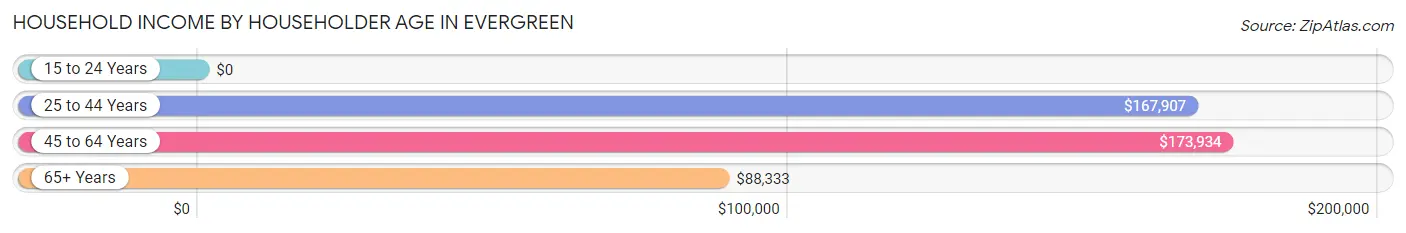
| Income Bracket | # Households | Median Income |
| 15 to 24 Years | 9 (0.3%) | $0 |
| 25 to 44 Years | 979 (27.0%) | $167,907 |
| 45 to 64 Years | 1,483 (40.8%) | $173,934 |
| 65+ Years | 1,162 (32.0%) | $88,333 |
| Total | 3,633 (100.0%) | $144,858 |
Poverty in Evergreen
Income Below Poverty by Sex and Age in Evergreen
With 2.0% poverty level for males and 6.1% for females among the residents of Evergreen, 25 to 34 year old males and under 5 year old females are the most vulnerable to poverty, with 44 males (12.8%) and 46 females (35.1%) in their respective age groups living below the poverty level.
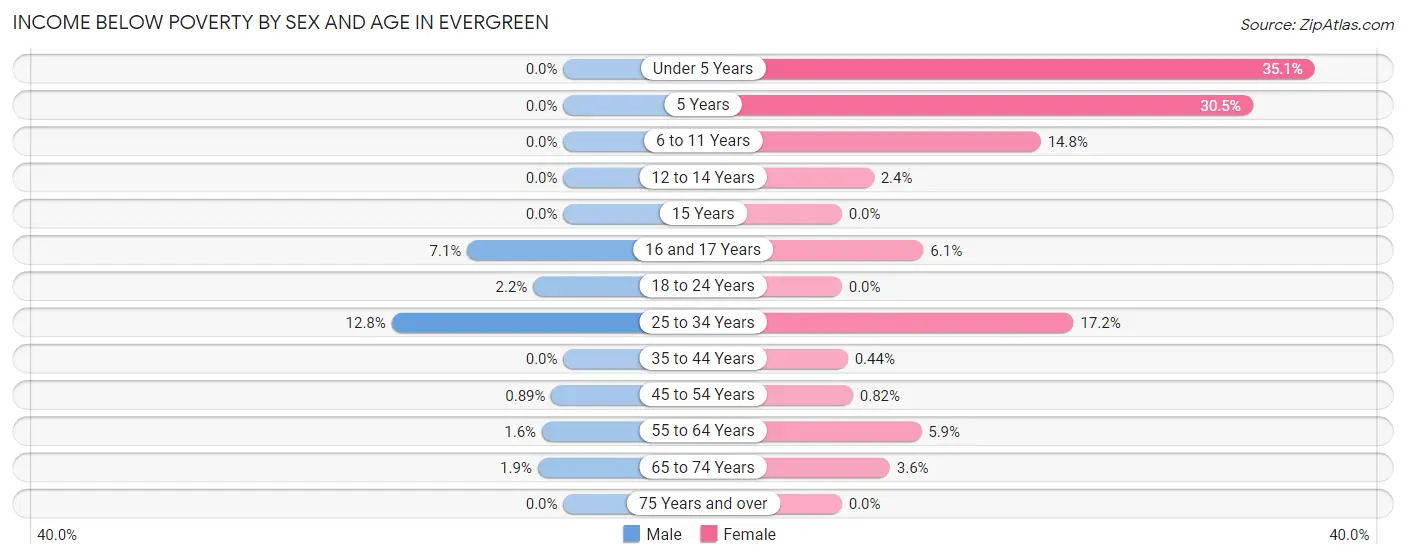
| Age Bracket | Male | Female |
| Under 5 Years | 0 (0.0%) | 46 (35.1%) |
| 5 Years | 0 (0.0%) | 43 (30.5%) |
| 6 to 11 Years | 0 (0.0%) | 44 (14.8%) |
| 12 to 14 Years | 0 (0.0%) | 6 (2.4%) |
| 15 Years | 0 (0.0%) | 0 (0.0%) |
| 16 and 17 Years | 8 (7.1%) | 6 (6.1%) |
| 18 to 24 Years | 5 (2.2%) | 0 (0.0%) |
| 25 to 34 Years | 44 (12.8%) | 59 (17.2%) |
| 35 to 44 Years | 0 (0.0%) | 3 (0.4%) |
| 45 to 54 Years | 6 (0.9%) | 5 (0.8%) |
| 55 to 64 Years | 11 (1.6%) | 47 (5.9%) |
| 65 to 74 Years | 11 (1.9%) | 24 (3.6%) |
| 75 Years and over | 0 (0.0%) | 0 (0.0%) |
| Total | 85 (2.0%) | 283 (6.1%) |
Income Above Poverty by Sex and Age in Evergreen
According to the poverty statistics in Evergreen, males aged under 5 years and females aged 15 years are the age groups that are most secure financially, with 100.0% of males and 100.0% of females in these age groups living above the poverty line.
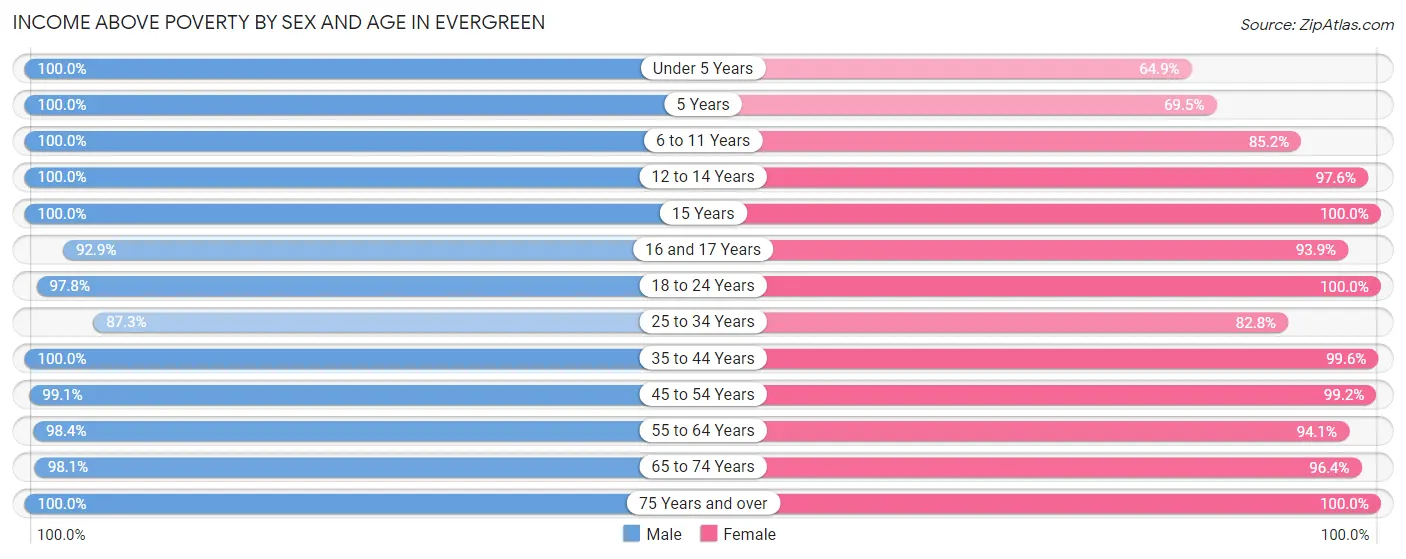
| Age Bracket | Male | Female |
| Under 5 Years | 202 (100.0%) | 85 (64.9%) |
| 5 Years | 36 (100.0%) | 98 (69.5%) |
| 6 to 11 Years | 361 (100.0%) | 254 (85.2%) |
| 12 to 14 Years | 123 (100.0%) | 247 (97.6%) |
| 15 Years | 84 (100.0%) | 56 (100.0%) |
| 16 and 17 Years | 104 (92.9%) | 93 (93.9%) |
| 18 to 24 Years | 218 (97.8%) | 172 (100.0%) |
| 25 to 34 Years | 301 (87.3%) | 284 (82.8%) |
| 35 to 44 Years | 609 (100.0%) | 677 (99.6%) |
| 45 to 54 Years | 671 (99.1%) | 607 (99.2%) |
| 55 to 64 Years | 683 (98.4%) | 749 (94.1%) |
| 65 to 74 Years | 567 (98.1%) | 648 (96.4%) |
| 75 Years and over | 274 (100.0%) | 383 (100.0%) |
| Total | 4,233 (98.0%) | 4,353 (93.9%) |
Income Below Poverty Among Married-Couple Families in Evergreen
The poverty statistics for married-couple families in Evergreen show that 3.2% or 72 of the total 2,271 families live below the poverty line. Families with 3 or 4 children have the highest poverty rate of 30.6%, comprising of 44 families. On the other hand, families with 1 or 2 children have the lowest poverty rate of 0.9%, which includes 6 families.
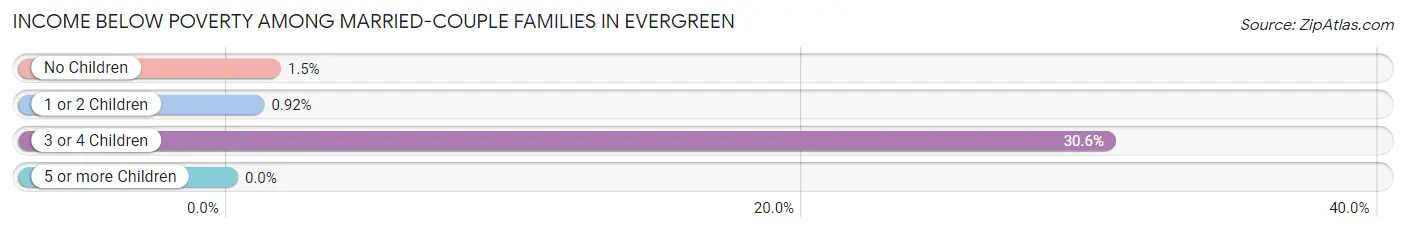
| Children | Above Poverty | Below Poverty |
| No Children | 1,454 (98.5%) | 22 (1.5%) |
| 1 or 2 Children | 645 (99.1%) | 6 (0.9%) |
| 3 or 4 Children | 100 (69.4%) | 44 (30.6%) |
| 5 or more Children | 0 (0.0%) | 0 (0.0%) |
| Total | 2,199 (96.8%) | 72 (3.2%) |
Income Below Poverty Among Single-Parent Households in Evergreen
| Children | Single Father | Single Mother |
| No Children | 0 (0.0%) | 0 (0.0%) |
| 1 or 2 Children | 0 (0.0%) | 0 (0.0%) |
| 3 or 4 Children | 0 (0.0%) | 0 (0.0%) |
| 5 or more Children | 0 (0.0%) | 0 (0.0%) |
| Total | 0 (0.0%) | 0 (0.0%) |
Income Below Poverty Among Married-Couple vs Single-Parent Households in Evergreen
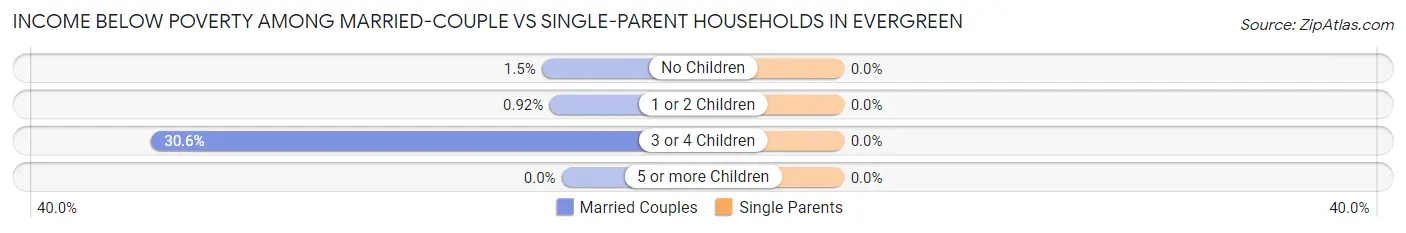
| Children | Married-Couple Families | Single-Parent Households |
| No Children | 22 (1.5%) | 0 (0.0%) |
| 1 or 2 Children | 6 (0.9%) | 0 (0.0%) |
| 3 or 4 Children | 44 (30.6%) | 0 (0.0%) |
| 5 or more Children | 0 (0.0%) | 0 (0.0%) |
| Total | 72 (3.2%) | 0 (0.0%) |
Race in Evergreen
The most populous races in Evergreen are White / Caucasian (8,432 | 94.0%), Hispanic or Latino (563 | 6.3%), and Two or more Races (338 | 3.8%).
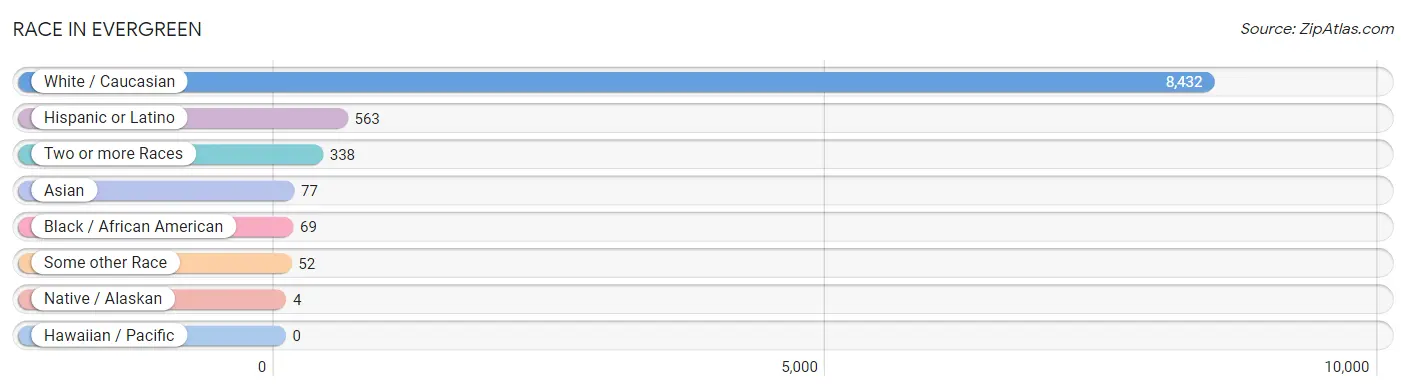
| Race | # Population | % Population |
| Asian | 77 | 0.9% |
| Black / African American | 69 | 0.8% |
| Hawaiian / Pacific | 0 | 0.0% |
| Hispanic or Latino | 563 | 6.3% |
| Native / Alaskan | 4 | 0.0% |
| White / Caucasian | 8,432 | 94.0% |
| Two or more Races | 338 | 3.8% |
| Some other Race | 52 | 0.6% |
| Total | 8,972 | 100.0% |
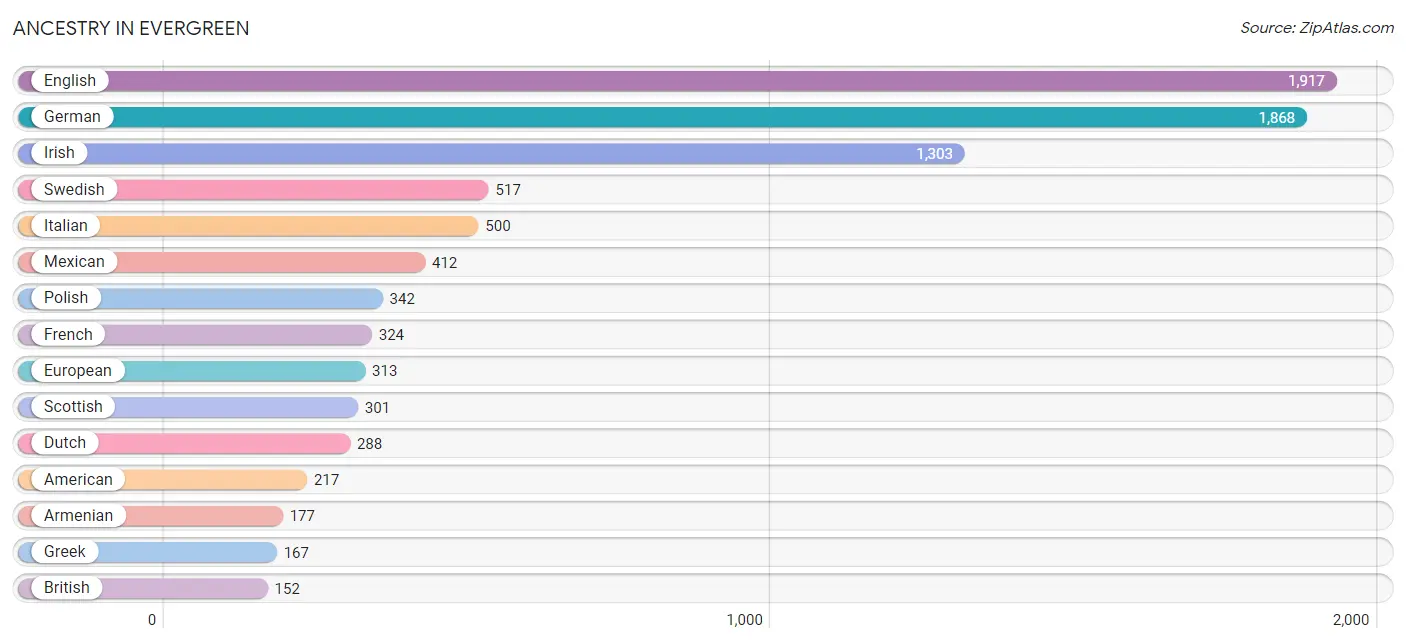
Ancestry in Evergreen
The most populous ancestries reported in Evergreen are English (1,917 | 21.4%), German (1,868 | 20.8%), Irish (1,303 | 14.5%), Swedish (517 | 5.8%), and Italian (500 | 5.6%), together accounting for 68.0% of all Evergreen residents.
| Ancestry | # Population | % Population |
| American | 217 | 2.4% |
| Arab | 54 | 0.6% |
| Armenian | 177 | 2.0% |
| Austrian | 43 | 0.5% |
| Belgian | 14 | 0.2% |
| Bhutanese | 44 | 0.5% |
| Brazilian | 28 | 0.3% |
| British | 152 | 1.7% |
| Burmese | 28 | 0.3% |
| Cajun | 30 | 0.3% |
| Canadian | 17 | 0.2% |
| Central American | 43 | 0.5% |
| Central American Indian | 1 | 0.0% |
| Chilean | 8 | 0.1% |
| Choctaw | 26 | 0.3% |
| Croatian | 17 | 0.2% |
| Czech | 68 | 0.8% |
| Danish | 97 | 1.1% |
| Dutch | 288 | 3.2% |
| Eastern European | 43 | 0.5% |
| Ecuadorian | 43 | 0.5% |
| Egyptian | 7 | 0.1% |
| English | 1,917 | 21.4% |
| European | 313 | 3.5% |
| Finnish | 23 | 0.3% |
| French | 324 | 3.6% |
| French Canadian | 61 | 0.7% |
| German | 1,868 | 20.8% |
| German Russian | 5 | 0.1% |
| Greek | 167 | 1.9% |
| Guatemalan | 1 | 0.0% |
| Hungarian | 112 | 1.3% |
| Icelander | 23 | 0.3% |
| Indian (Asian) | 13 | 0.1% |
| Irish | 1,303 | 14.5% |
| Iroquois | 11 | 0.1% |
| Italian | 500 | 5.6% |
| Korean | 43 | 0.5% |
| Lebanese | 23 | 0.3% |
| Mexican | 412 | 4.6% |
| Nicaraguan | 31 | 0.4% |
| Nigerian | 39 | 0.4% |
| Northern European | 85 | 0.9% |
| Norwegian | 147 | 1.6% |
| Palestinian | 24 | 0.3% |
| Panamanian | 11 | 0.1% |
| Polish | 342 | 3.8% |
| Portuguese | 33 | 0.4% |
| Puerto Rican | 23 | 0.3% |
| Russian | 85 | 0.9% |
| Scandinavian | 10 | 0.1% |
| Scotch-Irish | 27 | 0.3% |
| Scottish | 301 | 3.4% |
| Slovak | 7 | 0.1% |
| South American | 51 | 0.6% |
| Spaniard | 8 | 0.1% |
| Spanish | 14 | 0.2% |
| Subsaharan African | 61 | 0.7% |
| Swedish | 517 | 5.8% |
| Swiss | 100 | 1.1% |
| Ukrainian | 52 | 0.6% |
| Welsh | 64 | 0.7% | View All 62 Rows |
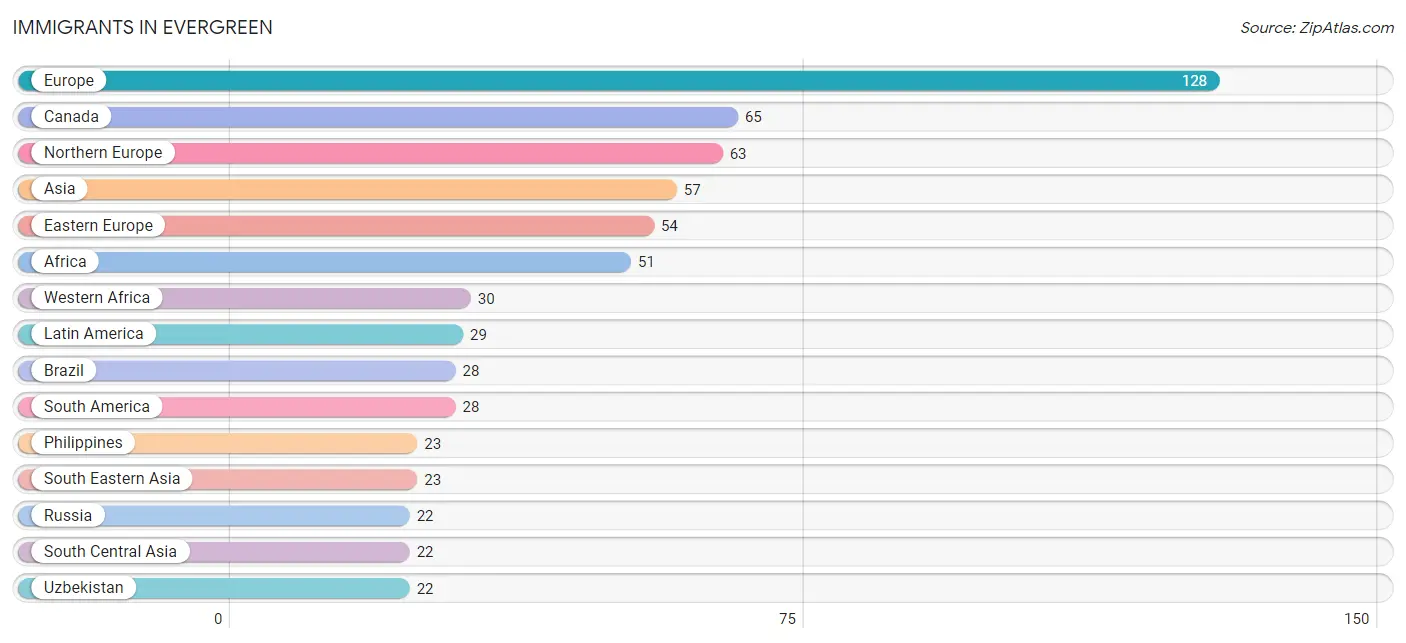
Immigrants in Evergreen
The most numerous immigrant groups reported in Evergreen came from Europe (128 | 1.4%), Canada (65 | 0.7%), Northern Europe (63 | 0.7%), Asia (57 | 0.6%), and Eastern Europe (54 | 0.6%), together accounting for 4.1% of all Evergreen residents.
| Immigration Origin | # Population | % Population |
| Africa | 51 | 0.6% |
| Asia | 57 | 0.6% |
| Australia | 21 | 0.2% |
| Bosnia and Herzegovina | 17 | 0.2% |
| Brazil | 28 | 0.3% |
| Canada | 65 | 0.7% |
| Central America | 1 | 0.0% |
| China | 12 | 0.1% |
| Czechoslovakia | 5 | 0.1% |
| Eastern Asia | 12 | 0.1% |
| Eastern Europe | 54 | 0.6% |
| England | 17 | 0.2% |
| Europe | 128 | 1.4% |
| Guatemala | 1 | 0.0% |
| Ireland | 5 | 0.1% |
| Latin America | 29 | 0.3% |
| Nigeria | 8 | 0.1% |
| Northern Europe | 63 | 0.7% |
| Norway | 9 | 0.1% |
| Oceania | 21 | 0.2% |
| Philippines | 23 | 0.3% |
| Poland | 10 | 0.1% |
| Russia | 22 | 0.3% |
| South Africa | 20 | 0.2% |
| South America | 28 | 0.3% |
| South Central Asia | 22 | 0.3% |
| South Eastern Asia | 23 | 0.3% |
| Switzerland | 11 | 0.1% |
| Uzbekistan | 22 | 0.3% |
| Western Africa | 30 | 0.3% |
| Western Europe | 11 | 0.1% | View All 31 Rows |
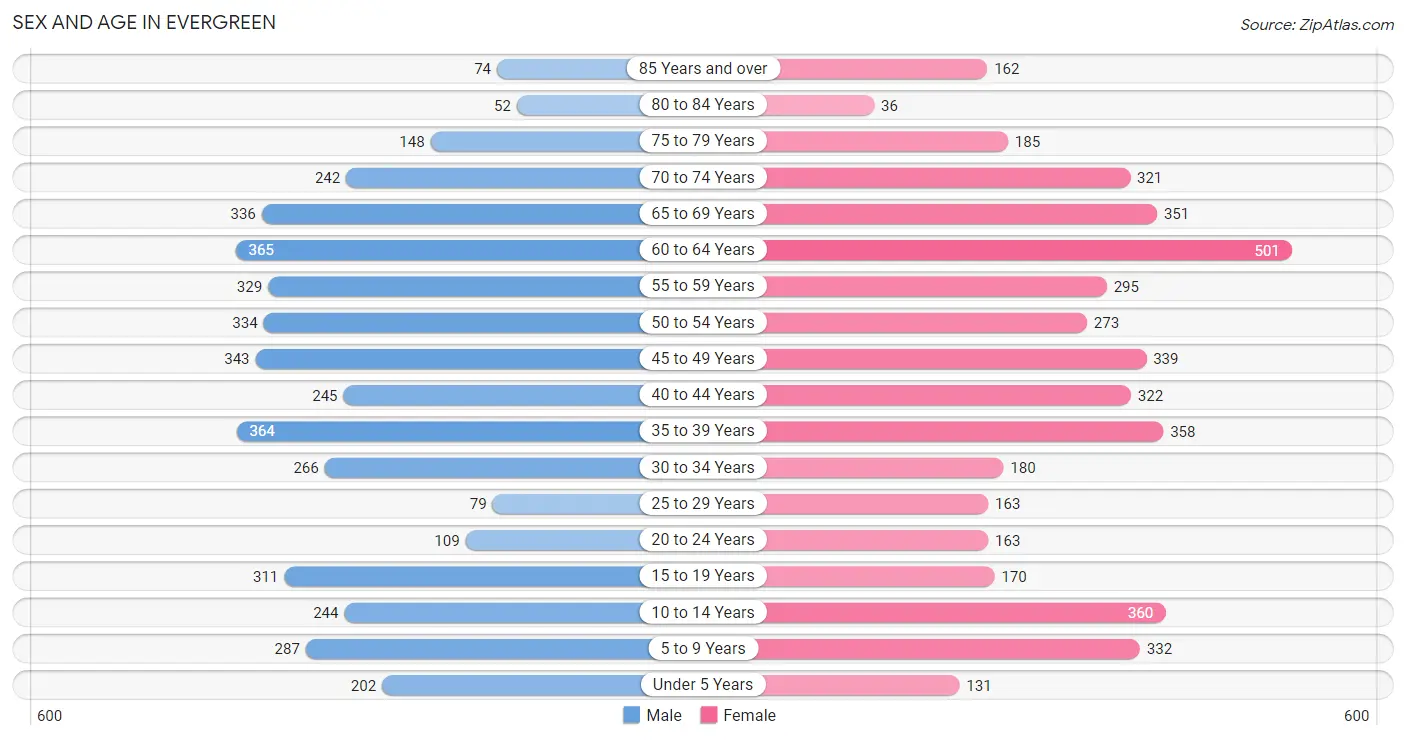
Sex and Age in Evergreen
Sex and Age in Evergreen
The most populous age groups in Evergreen are 60 to 64 Years (365 | 8.4%) for men and 60 to 64 Years (501 | 10.8%) for women.
| Age Bracket | Male | Female |
| Under 5 Years | 202 (4.7%) | 131 (2.8%) |
| 5 to 9 Years | 287 (6.6%) | 332 (7.1%) |
| 10 to 14 Years | 244 (5.6%) | 360 (7.8%) |
| 15 to 19 Years | 311 (7.2%) | 170 (3.7%) |
| 20 to 24 Years | 109 (2.5%) | 163 (3.5%) |
| 25 to 29 Years | 79 (1.8%) | 163 (3.5%) |
| 30 to 34 Years | 266 (6.1%) | 180 (3.9%) |
| 35 to 39 Years | 364 (8.4%) | 358 (7.7%) |
| 40 to 44 Years | 245 (5.7%) | 322 (6.9%) |
| 45 to 49 Years | 343 (7.9%) | 339 (7.3%) |
| 50 to 54 Years | 334 (7.7%) | 273 (5.9%) |
| 55 to 59 Years | 329 (7.6%) | 295 (6.4%) |
| 60 to 64 Years | 365 (8.4%) | 501 (10.8%) |
| 65 to 69 Years | 336 (7.8%) | 351 (7.6%) |
| 70 to 74 Years | 242 (5.6%) | 321 (6.9%) |
| 75 to 79 Years | 148 (3.4%) | 185 (4.0%) |
| 80 to 84 Years | 52 (1.2%) | 36 (0.8%) |
| 85 Years and over | 74 (1.7%) | 162 (3.5%) |
| Total | 4,330 (100.0%) | 4,642 (100.0%) |
Families and Households in Evergreen
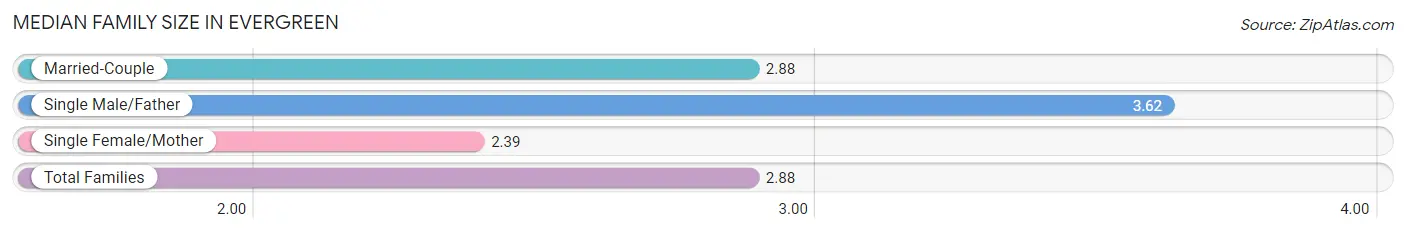
Median Family Size in Evergreen
The median family size in Evergreen is 2.88 persons per family, with single male/father families (128 | 4.9%) accounting for the largest median family size of 3.62 persons per family. On the other hand, single female/mother families (212 | 8.1%) represent the smallest median family size with 2.39 persons per family.
| Family Type | # Families | Family Size |
| Married-Couple | 2,271 (87.0%) | 2.88 |
| Single Male/Father | 128 (4.9%) | 3.62 |
| Single Female/Mother | 212 (8.1%) | 2.39 |
| Total Families | 2,611 (100.0%) | 2.88 |
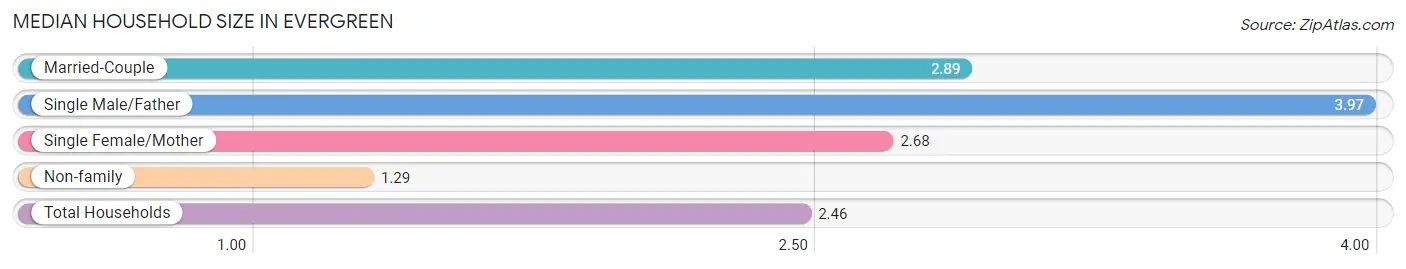
Median Household Size in Evergreen
The median household size in Evergreen is 2.46 persons per household, with single male/father households (128 | 3.5%) accounting for the largest median household size of 3.97 persons per household. non-family households (1,022 | 28.1%) represent the smallest median household size with 1.29 persons per household.
| Household Type | # Households | Household Size |
| Married-Couple | 2,271 (62.5%) | 2.89 |
| Single Male/Father | 128 (3.5%) | 3.97 |
| Single Female/Mother | 212 (5.8%) | 2.68 |
| Non-family | 1,022 (28.1%) | 1.29 |
| Total Households | 3,633 (100.0%) | 2.46 |
Household Size by Marriage Status in Evergreen
Out of a total of 3,633 households in Evergreen, 2,611 (71.9%) are family households, while 1,022 (28.1%) are nonfamily households. The most numerous type of family households are 2-person households, comprising 1,409, and the most common type of nonfamily households are 1-person households, comprising 740.
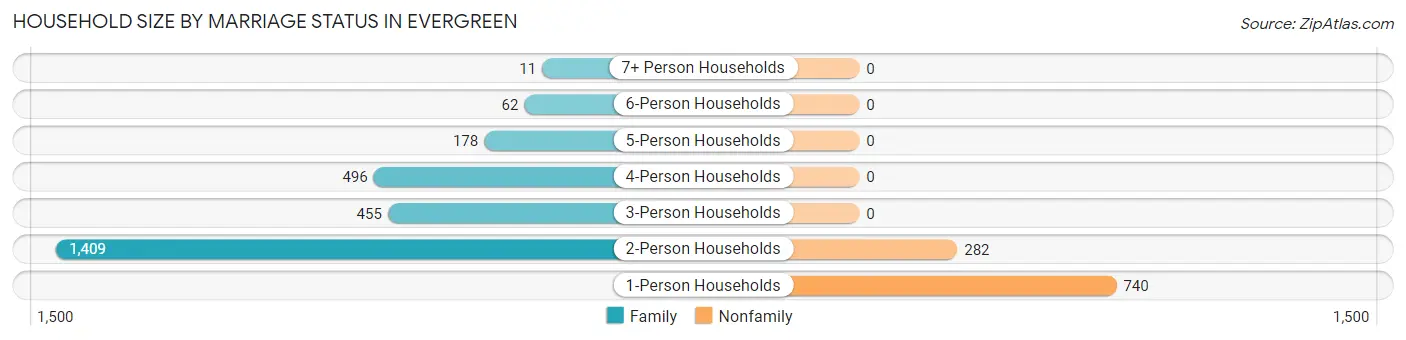
| Household Size | Family Households | Nonfamily Households |
| 1-Person Households | - | 740 (20.4%) |
| 2-Person Households | 1,409 (38.8%) | 282 (7.8%) |
| 3-Person Households | 455 (12.5%) | 0 (0.0%) |
| 4-Person Households | 496 (13.7%) | 0 (0.0%) |
| 5-Person Households | 178 (4.9%) | 0 (0.0%) |
| 6-Person Households | 62 (1.7%) | 0 (0.0%) |
| 7+ Person Households | 11 (0.3%) | 0 (0.0%) |
| Total | 2,611 (71.9%) | 1,022 (28.1%) |
Female Fertility in Evergreen
Fertility by Age in Evergreen
Average fertility rate in Evergreen is 5.0 births per 1,000 women. Women in the age bracket of 35 to 50 years have the highest fertility rate with 8.0 births per 1,000 women. Women in the age bracket of 35 to 50 years acount for 100.0% of all women with births.
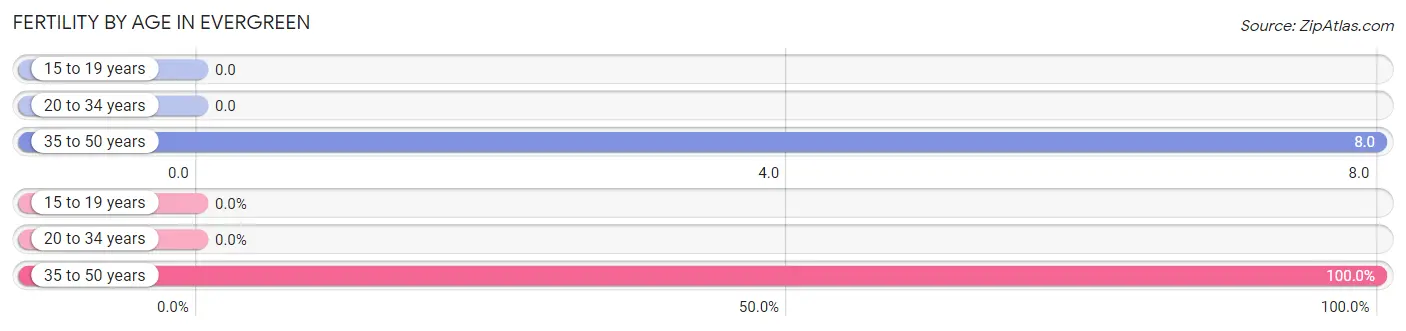
| Age Bracket | Women with Births | Births / 1,000 Women |
| 15 to 19 years | 0 (0.0%) | 0.0 |
| 20 to 34 years | 0 (0.0%) | 0.0 |
| 35 to 50 years | 8 (100.0%) | 8.0 |
| Total | 8 (100.0%) | 5.0 |
Fertility by Age by Marriage Status in Evergreen
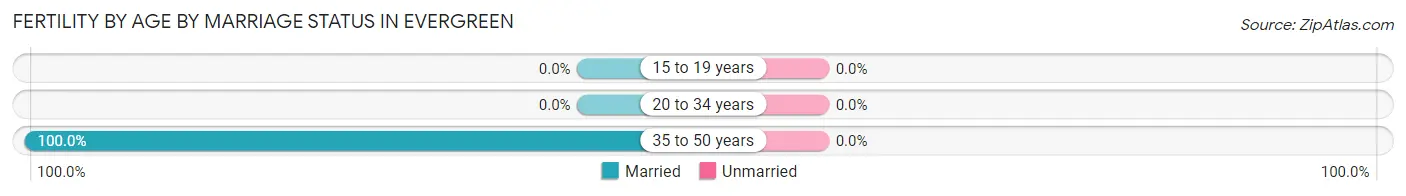
| Age Bracket | Married | Unmarried |
| 15 to 19 years | 0 (0.0%) | 0 (0.0%) |
| 20 to 34 years | 0 (0.0%) | 0 (0.0%) |
| 35 to 50 years | 8 (100.0%) | 0 (0.0%) |
| Total | 8 (100.0%) | 0 (0.0%) |
Fertility by Education in Evergreen
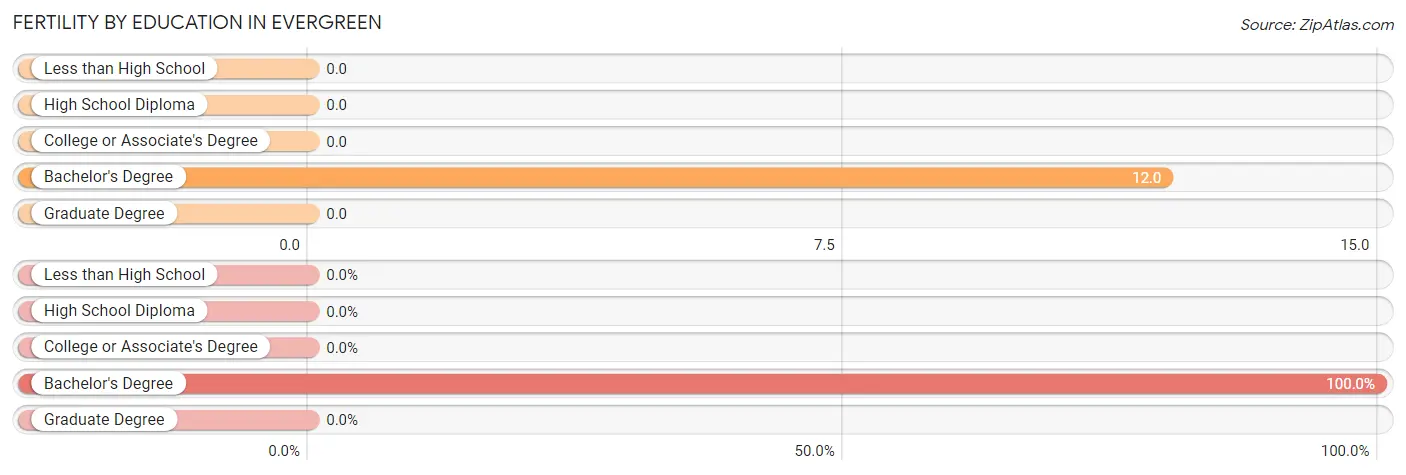
| Educational Attainment | Women with Births | Births / 1,000 Women |
| Less than High School | 0 (0.0%) | 0.0 |
| High School Diploma | 0 (0.0%) | 0.0 |
| College or Associate's Degree | 0 (0.0%) | 0.0 |
| Bachelor's Degree | 8 (100.0%) | 12.0 |
| Graduate Degree | 0 (0.0%) | 0.0 |
| Total | 8 (100.0%) | 5.0 |
Fertility by Education by Marriage Status in Evergreen
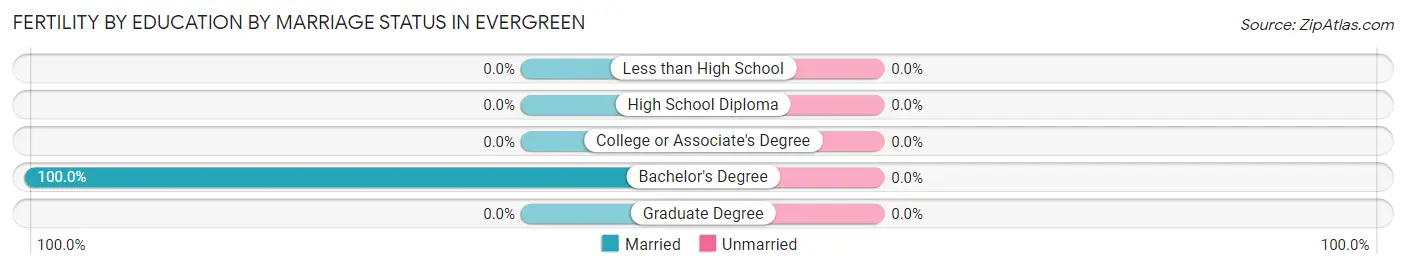
| Educational Attainment | Married | Unmarried |
| Less than High School | 0 (0.0%) | 0 (0.0%) |
| High School Diploma | 0 (0.0%) | 0 (0.0%) |
| College or Associate's Degree | 0 (0.0%) | 0 (0.0%) |
| Bachelor's Degree | 8 (100.0%) | 0 (0.0%) |
| Graduate Degree | 0 (0.0%) | 0 (0.0%) |
| Total | 8 (100.0%) | 0 (0.0%) |
Employment Characteristics in Evergreen
Employment by Class of Employer in Evergreen
Among the 4,768 employed individuals in Evergreen, private company employees (3,017 | 63.3%), self-employed (incorporated) (474 | 9.9%), and self-employed (not incorporated) (384 | 8.1%) make up the most common classes of employment.
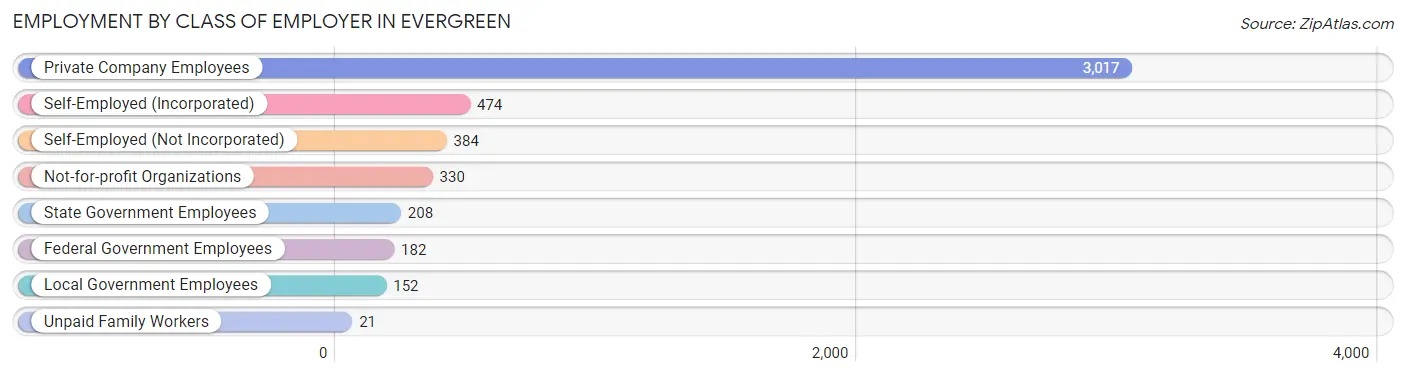
| Employer Class | # Employees | % Employees |
| Private Company Employees | 3,017 | 63.3% |
| Self-Employed (Incorporated) | 474 | 9.9% |
| Self-Employed (Not Incorporated) | 384 | 8.1% |
| Not-for-profit Organizations | 330 | 6.9% |
| Local Government Employees | 152 | 3.2% |
| State Government Employees | 208 | 4.4% |
| Federal Government Employees | 182 | 3.8% |
| Unpaid Family Workers | 21 | 0.4% |
| Total | 4,768 | 100.0% |
Employment Status by Age in Evergreen
According to the labor force statistics for Evergreen, out of the total population over 16 years of age (7,276), 67.0% or 4,875 individuals are in the labor force, with 1.3% or 63 of them unemployed. The age group with the highest labor force participation rate is 25 to 29 years, with 100.0% or 242 individuals in the labor force. Within the labor force, the 16 to 19 years age range has the highest percentage of unemployed individuals, with 7.7% or 9 of them being unemployed.
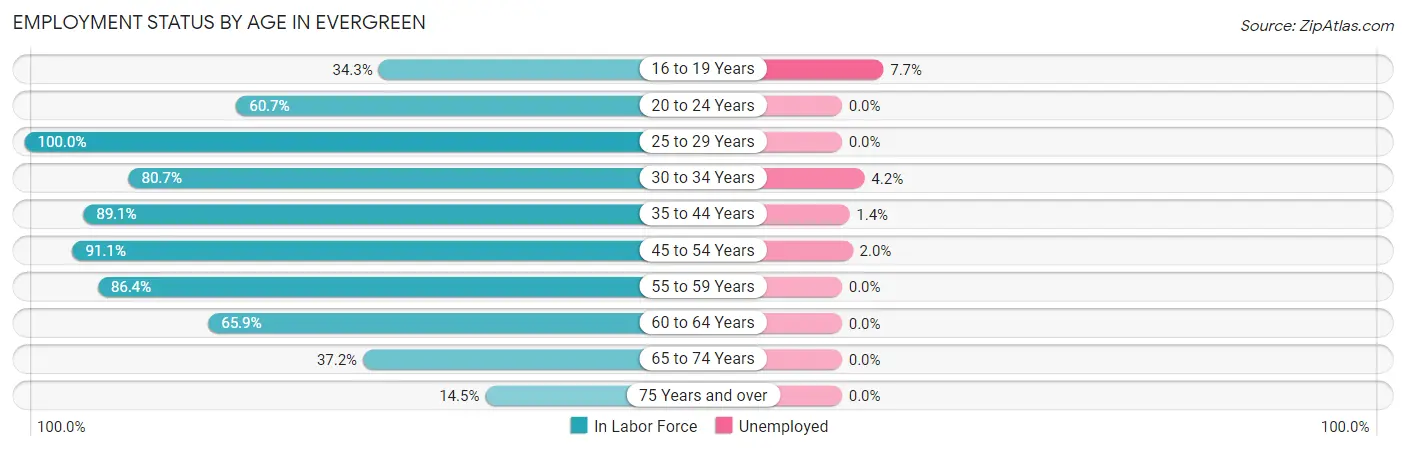
| Age Bracket | In Labor Force | Unemployed |
| 16 to 19 Years | 117 (34.3%) | 9 (7.7%) |
| 20 to 24 Years | 165 (60.7%) | 0 (0.0%) |
| 25 to 29 Years | 242 (100.0%) | 0 (0.0%) |
| 30 to 34 Years | 360 (80.7%) | 15 (4.2%) |
| 35 to 44 Years | 1,148 (89.1%) | 16 (1.4%) |
| 45 to 54 Years | 1,174 (91.1%) | 23 (2.0%) |
| 55 to 59 Years | 539 (86.4%) | 0 (0.0%) |
| 60 to 64 Years | 571 (65.9%) | 0 (0.0%) |
| 65 to 74 Years | 465 (37.2%) | 0 (0.0%) |
| 75 Years and over | 95 (14.5%) | 0 (0.0%) |
| Total | 4,875 (67.0%) | 63 (1.3%) |
Employment Status by Educational Attainment in Evergreen
According to labor force statistics for Evergreen, 84.8% of individuals (4,033) out of the total population between 25 and 64 years of age (4,756) are in the labor force, with 1.4% or 56 of them being unemployed. The group with the highest labor force participation rate are those with the educational attainment of less than high school, with 100.0% or 98 individuals in the labor force. Within the labor force, individuals with less than high school education have the highest percentage of unemployment, with 14.3% or 14 of them being unemployed.
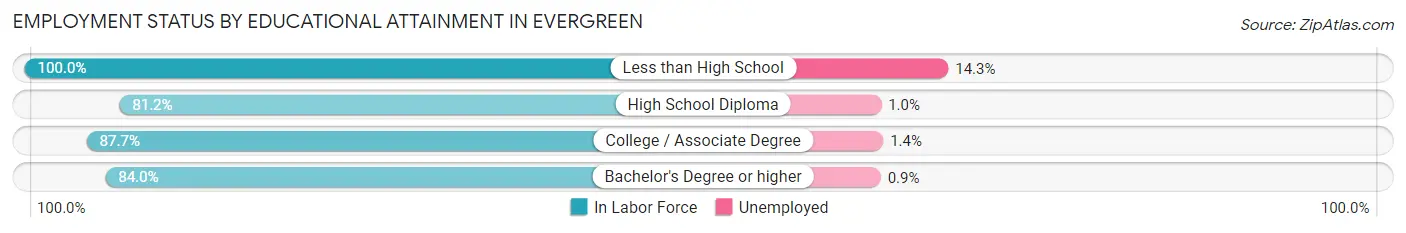
| Educational Attainment | In Labor Force | Unemployed |
| Less than High School | 98 (100.0%) | 14 (14.3%) |
| High School Diploma | 307 (81.2%) | 4 (1.0%) |
| College / Associate Degree | 829 (87.7%) | 13 (1.4%) |
| Bachelor's Degree or higher | 2,801 (84.0%) | 30 (0.9%) |
| Total | 4,033 (84.8%) | 67 (1.4%) |
Employment Occupations by Sex in Evergreen
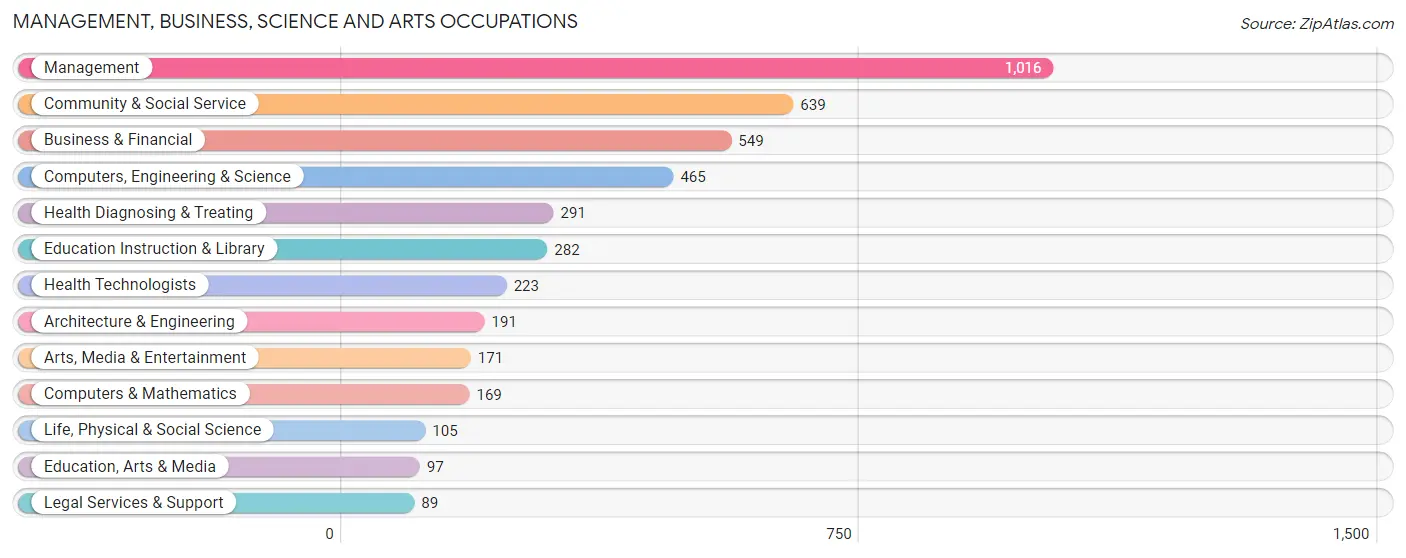
Management, Business, Science and Arts Occupations
The most common Management, Business, Science and Arts occupations in Evergreen are Management (1,016 | 21.2%), Community & Social Service (639 | 13.3%), Business & Financial (549 | 11.4%), Computers, Engineering & Science (465 | 9.7%), and Health Diagnosing & Treating (291 | 6.1%).
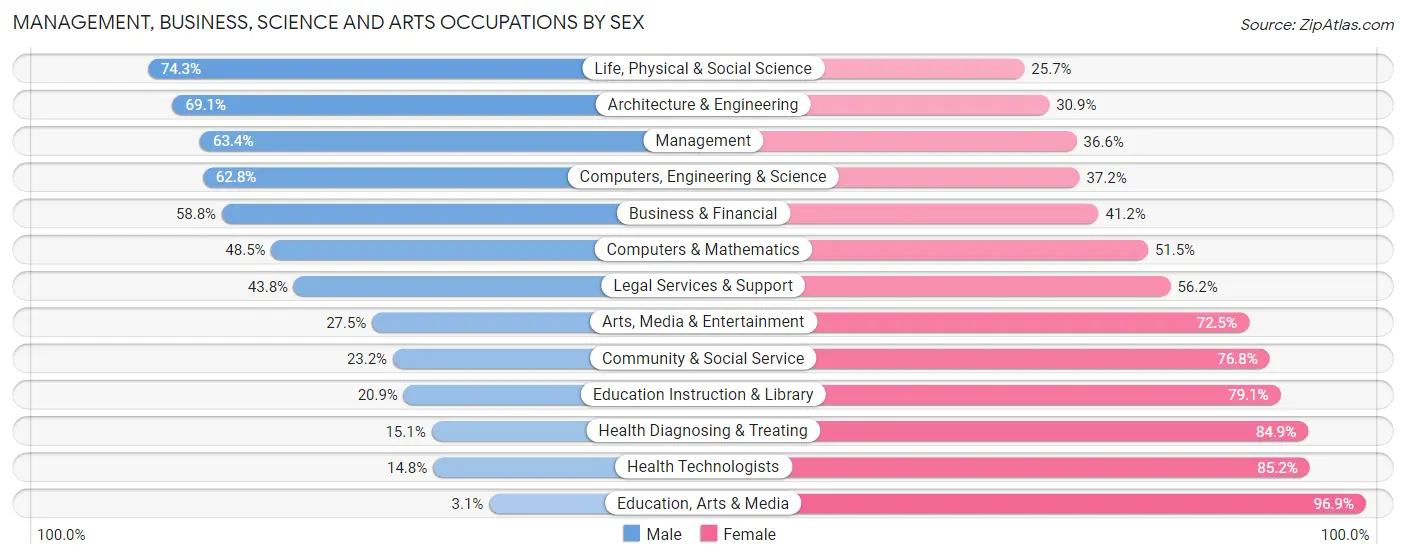
Management, Business, Science and Arts Occupations by Sex
Within the Management, Business, Science and Arts occupations in Evergreen, the most male-oriented occupations are Life, Physical & Social Science (74.3%), Architecture & Engineering (69.1%), and Management (63.4%), while the most female-oriented occupations are Education, Arts & Media (96.9%), Health Technologists (85.2%), and Health Diagnosing & Treating (84.9%).
| Occupation | Male | Female |
| Management | 644 (63.4%) | 372 (36.6%) |
| Business & Financial | 323 (58.8%) | 226 (41.2%) |
| Computers, Engineering & Science | 292 (62.8%) | 173 (37.2%) |
| Computers & Mathematics | 82 (48.5%) | 87 (51.5%) |
| Architecture & Engineering | 132 (69.1%) | 59 (30.9%) |
| Life, Physical & Social Science | 78 (74.3%) | 27 (25.7%) |
| Community & Social Service | 148 (23.2%) | 491 (76.8%) |
| Education, Arts & Media | 3 (3.1%) | 94 (96.9%) |
| Legal Services & Support | 39 (43.8%) | 50 (56.2%) |
| Education Instruction & Library | 59 (20.9%) | 223 (79.1%) |
| Arts, Media & Entertainment | 47 (27.5%) | 124 (72.5%) |
| Health Diagnosing & Treating | 44 (15.1%) | 247 (84.9%) |
| Health Technologists | 33 (14.8%) | 190 (85.2%) |
| Total (Category) | 1,451 (49.0%) | 1,509 (51.0%) |
| Total (Overall) | 2,515 (52.4%) | 2,282 (47.6%) |
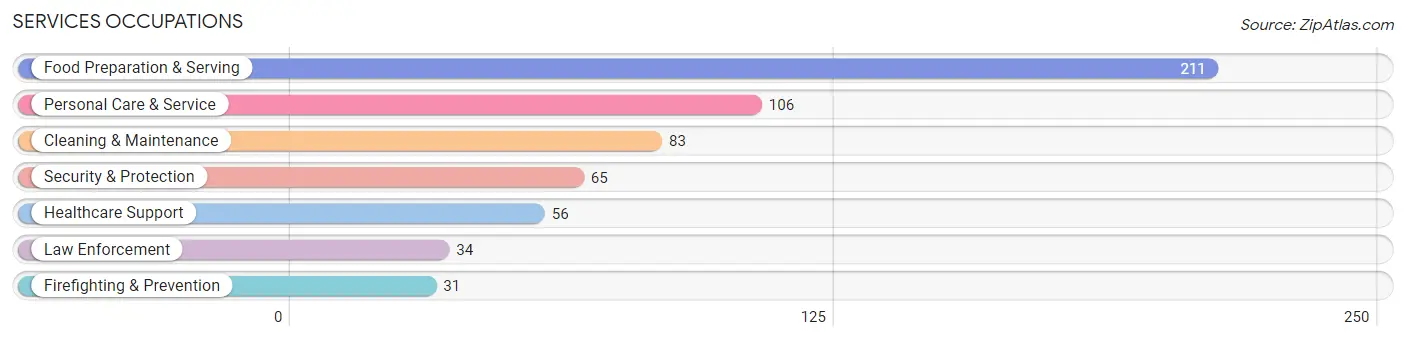
Services Occupations
The most common Services occupations in Evergreen are Food Preparation & Serving (211 | 4.4%), Personal Care & Service (106 | 2.2%), Cleaning & Maintenance (83 | 1.7%), Security & Protection (65 | 1.4%), and Healthcare Support (56 | 1.2%).
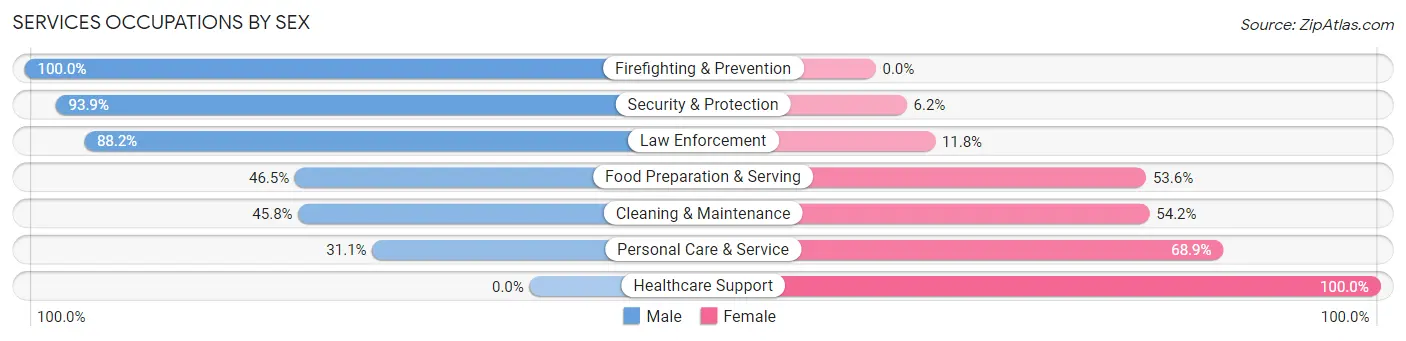
Services Occupations by Sex
Within the Services occupations in Evergreen, the most male-oriented occupations are Firefighting & Prevention (100.0%), Security & Protection (93.9%), and Law Enforcement (88.2%), while the most female-oriented occupations are Healthcare Support (100.0%), Personal Care & Service (68.9%), and Cleaning & Maintenance (54.2%).
| Occupation | Male | Female |
| Healthcare Support | 0 (0.0%) | 56 (100.0%) |
| Security & Protection | 61 (93.9%) | 4 (6.1%) |
| Firefighting & Prevention | 31 (100.0%) | 0 (0.0%) |
| Law Enforcement | 30 (88.2%) | 4 (11.8%) |
| Food Preparation & Serving | 98 (46.5%) | 113 (53.5%) |
| Cleaning & Maintenance | 38 (45.8%) | 45 (54.2%) |
| Personal Care & Service | 33 (31.1%) | 73 (68.9%) |
| Total (Category) | 230 (44.2%) | 291 (55.8%) |
| Total (Overall) | 2,515 (52.4%) | 2,282 (47.6%) |
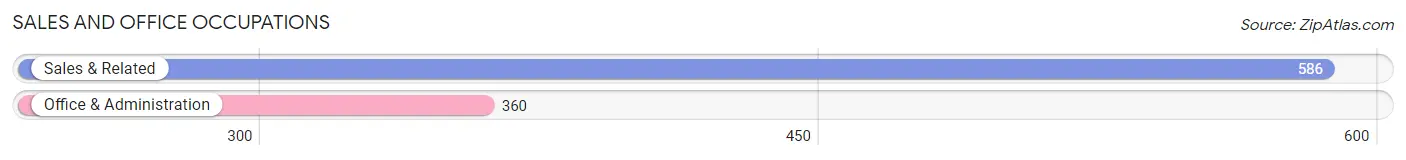
Sales and Office Occupations
The most common Sales and Office occupations in Evergreen are Sales & Related (586 | 12.2%), and Office & Administration (360 | 7.5%).
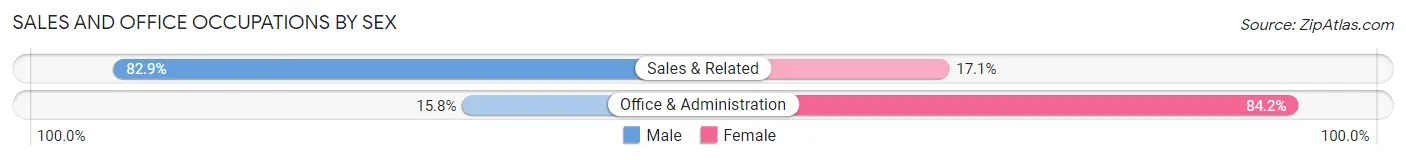
Sales and Office Occupations by Sex
| Occupation | Male | Female |
| Sales & Related | 486 (82.9%) | 100 (17.1%) |
| Office & Administration | 57 (15.8%) | 303 (84.2%) |
| Total (Category) | 543 (57.4%) | 403 (42.6%) |
| Total (Overall) | 2,515 (52.4%) | 2,282 (47.6%) |
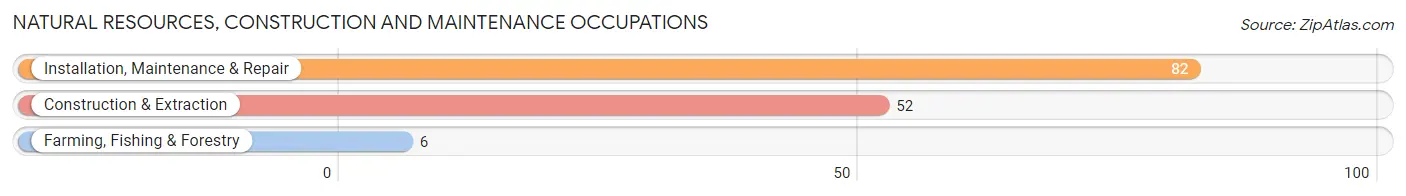
Natural Resources, Construction and Maintenance Occupations
The most common Natural Resources, Construction and Maintenance occupations in Evergreen are Installation, Maintenance & Repair (82 | 1.7%), Construction & Extraction (52 | 1.1%), and Farming, Fishing & Forestry (6 | 0.1%).
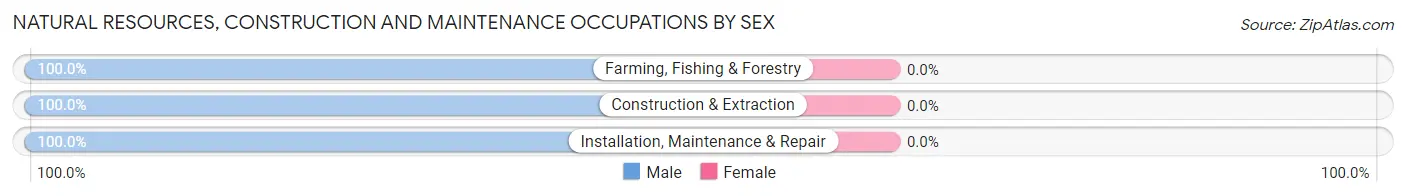
Natural Resources, Construction and Maintenance Occupations by Sex
| Occupation | Male | Female |
| Farming, Fishing & Forestry | 6 (100.0%) | 0 (0.0%) |
| Construction & Extraction | 52 (100.0%) | 0 (0.0%) |
| Installation, Maintenance & Repair | 82 (100.0%) | 0 (0.0%) |
| Total (Category) | 140 (100.0%) | 0 (0.0%) |
| Total (Overall) | 2,515 (52.4%) | 2,282 (47.6%) |
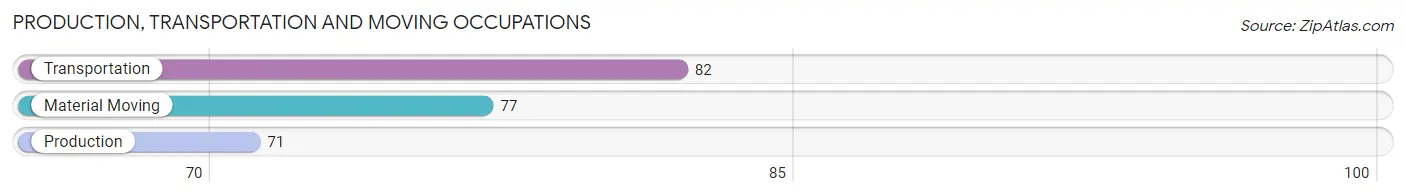
Production, Transportation and Moving Occupations
The most common Production, Transportation and Moving occupations in Evergreen are Transportation (82 | 1.7%), Material Moving (77 | 1.6%), and Production (71 | 1.5%).
Production, Transportation and Moving Occupations by Sex
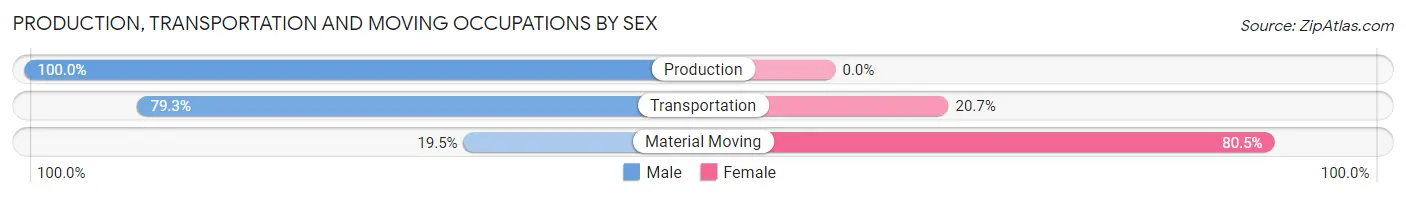
| Occupation | Male | Female |
| Production | 71 (100.0%) | 0 (0.0%) |
| Transportation | 65 (79.3%) | 17 (20.7%) |
| Material Moving | 15 (19.5%) | 62 (80.5%) |
| Total (Category) | 151 (65.6%) | 79 (34.4%) |
| Total (Overall) | 2,515 (52.4%) | 2,282 (47.6%) |
Employment Industries by Sex in Evergreen
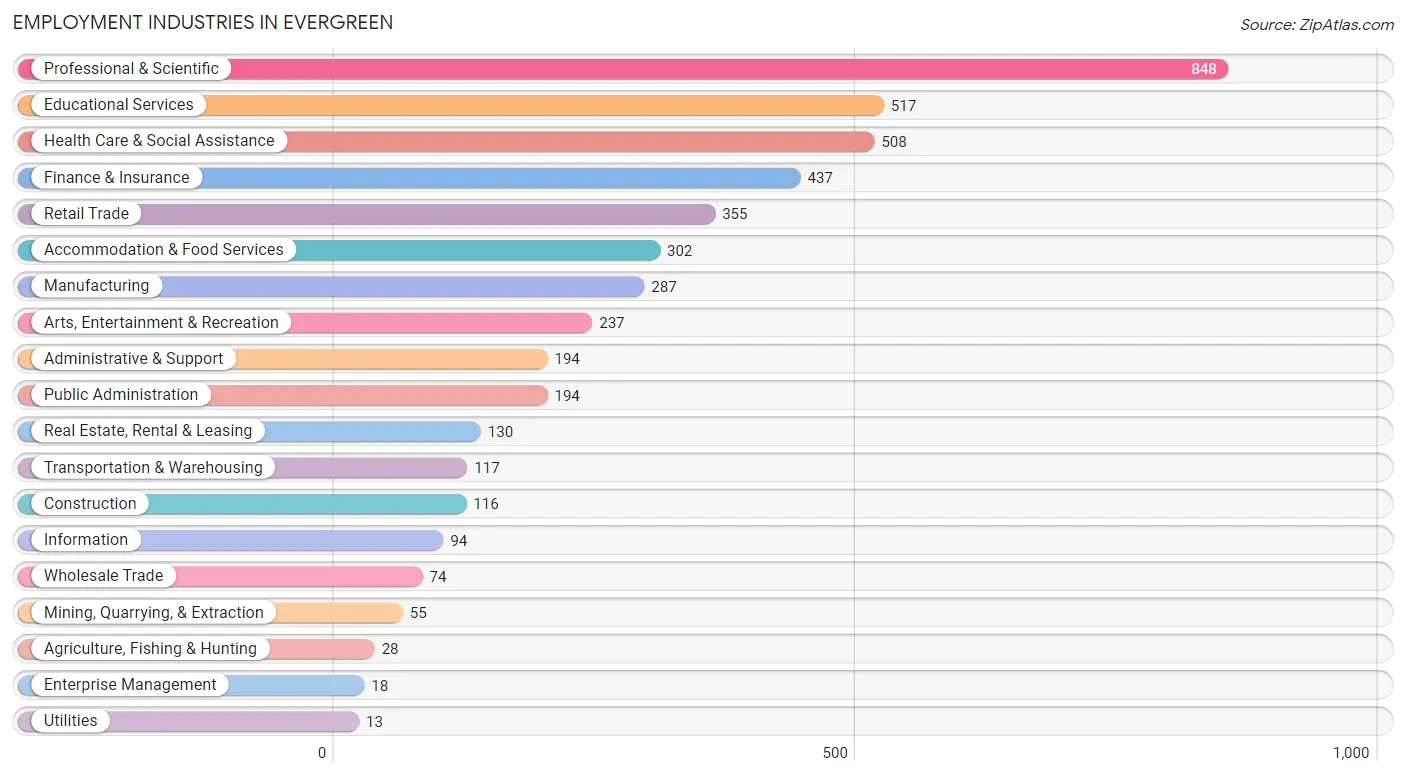
Employment Industries in Evergreen
The major employment industries in Evergreen include Professional & Scientific (848 | 17.7%), Educational Services (517 | 10.8%), Health Care & Social Assistance (508 | 10.6%), Finance & Insurance (437 | 9.1%), and Retail Trade (355 | 7.4%).
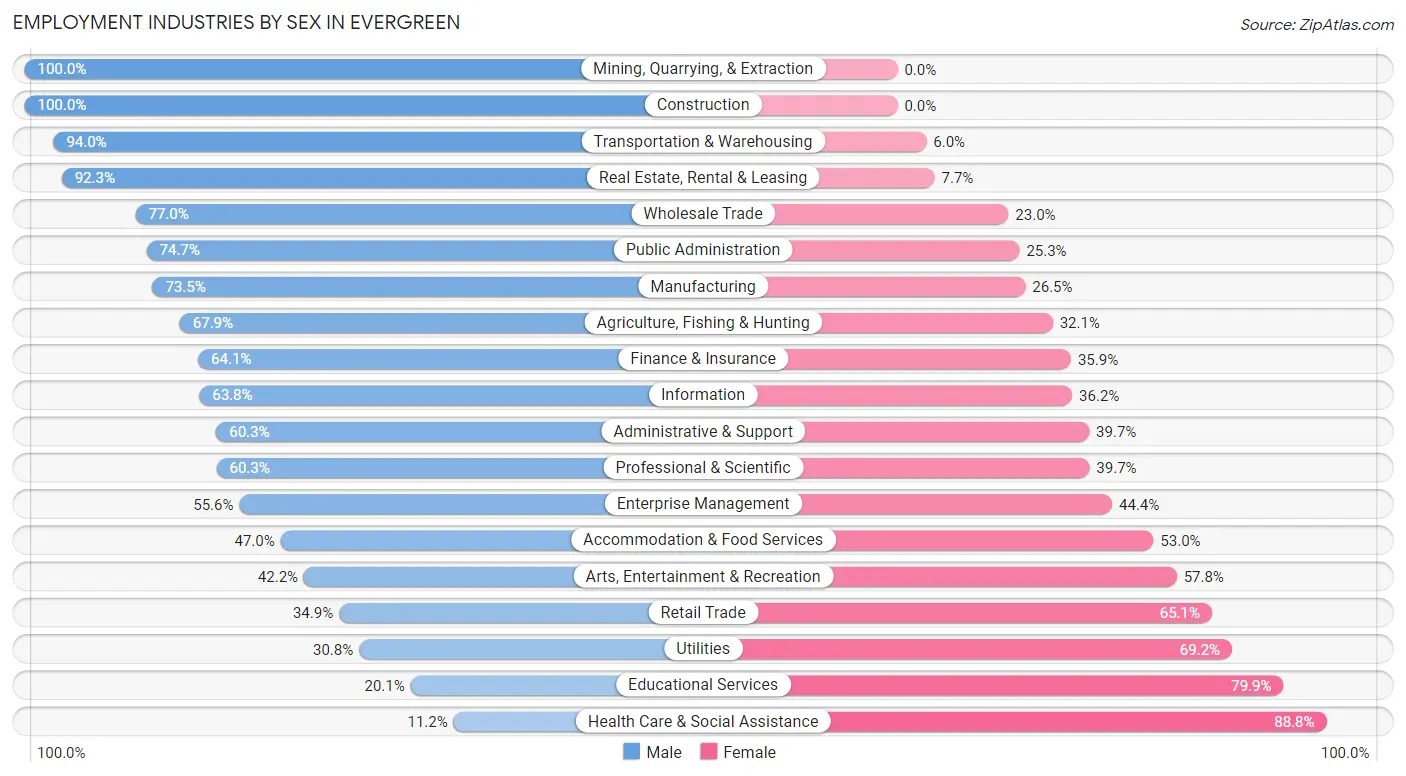
Employment Industries by Sex in Evergreen
The Evergreen industries that see more men than women are Mining, Quarrying, & Extraction (100.0%), Construction (100.0%), and Transportation & Warehousing (94.0%), whereas the industries that tend to have a higher number of women are Health Care & Social Assistance (88.8%), Educational Services (79.9%), and Utilities (69.2%).
| Industry | Male | Female |
| Agriculture, Fishing & Hunting | 19 (67.9%) | 9 (32.1%) |
| Mining, Quarrying, & Extraction | 55 (100.0%) | 0 (0.0%) |
| Construction | 116 (100.0%) | 0 (0.0%) |
| Manufacturing | 211 (73.5%) | 76 (26.5%) |
| Wholesale Trade | 57 (77.0%) | 17 (23.0%) |
| Retail Trade | 124 (34.9%) | 231 (65.1%) |
| Transportation & Warehousing | 110 (94.0%) | 7 (6.0%) |
| Utilities | 4 (30.8%) | 9 (69.2%) |
| Information | 60 (63.8%) | 34 (36.2%) |
| Finance & Insurance | 280 (64.1%) | 157 (35.9%) |
| Real Estate, Rental & Leasing | 120 (92.3%) | 10 (7.7%) |
| Professional & Scientific | 511 (60.3%) | 337 (39.7%) |
| Enterprise Management | 10 (55.6%) | 8 (44.4%) |
| Administrative & Support | 117 (60.3%) | 77 (39.7%) |
| Educational Services | 104 (20.1%) | 413 (79.9%) |
| Health Care & Social Assistance | 57 (11.2%) | 451 (88.8%) |
| Arts, Entertainment & Recreation | 100 (42.2%) | 137 (57.8%) |
| Accommodation & Food Services | 142 (47.0%) | 160 (53.0%) |
| Public Administration | 145 (74.7%) | 49 (25.3%) |
| Total | 2,515 (52.4%) | 2,282 (47.6%) |
Education in Evergreen
School Enrollment in Evergreen
The most common levels of schooling among the 2,086 students in Evergreen are middle school (539 | 25.8%), high school (459 | 22.0%), and elementary school (431 | 20.7%).
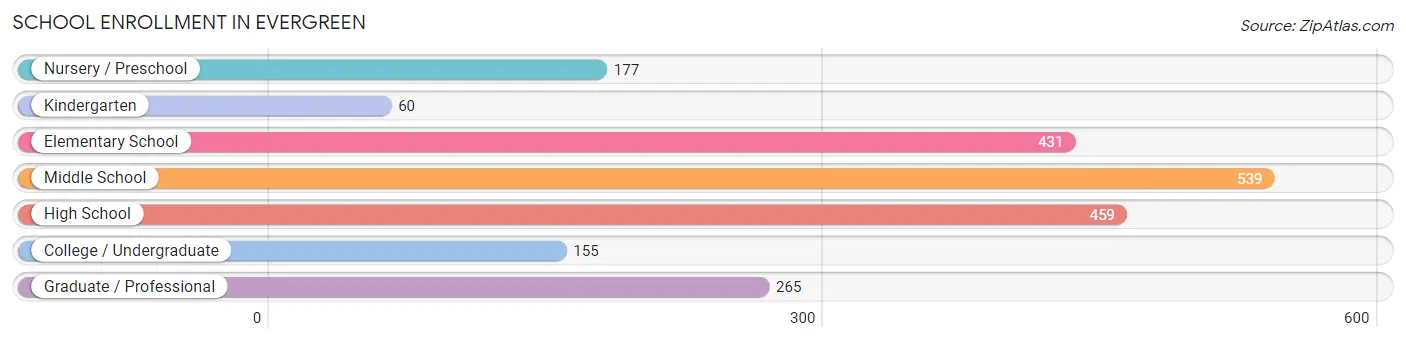
| School Level | # Students | % Students |
| Nursery / Preschool | 177 | 8.5% |
| Kindergarten | 60 | 2.9% |
| Elementary School | 431 | 20.7% |
| Middle School | 539 | 25.8% |
| High School | 459 | 22.0% |
| College / Undergraduate | 155 | 7.4% |
| Graduate / Professional | 265 | 12.7% |
| Total | 2,086 | 100.0% |
School Enrollment by Age by Funding Source in Evergreen
Out of a total of 2,086 students who are enrolled in schools in Evergreen, 363 (17.4%) attend a private institution, while the remaining 1,723 (82.6%) are enrolled in public schools. The age group of 3 to 4 year olds has the highest likelihood of being enrolled in private schools, with 66 (80.5% in the age bracket) enrolled. Conversely, the age group of 20 to 24 year olds has the lowest likelihood of being enrolled in a private school, with 160 (100.0% in the age bracket) attending a public institution.
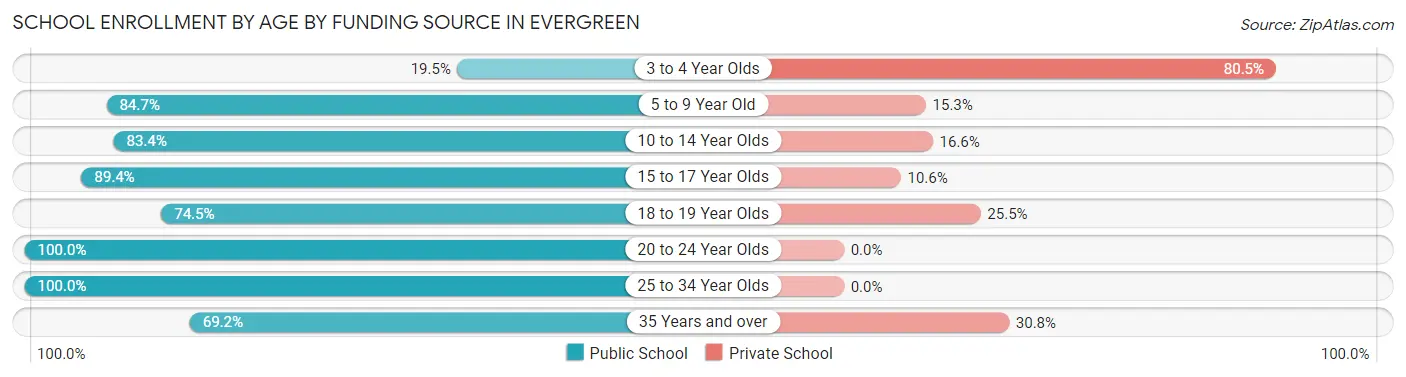
| Age Bracket | Public School | Private School |
| 3 to 4 Year Olds | 16 (19.5%) | 66 (80.5%) |
| 5 to 9 Year Old | 472 (84.7%) | 85 (15.3%) |
| 10 to 14 Year Olds | 504 (83.4%) | 100 (16.6%) |
| 15 to 17 Year Olds | 304 (89.4%) | 36 (10.6%) |
| 18 to 19 Year Olds | 79 (74.5%) | 27 (25.5%) |
| 20 to 24 Year Olds | 160 (100.0%) | 0 (0.0%) |
| 25 to 34 Year Olds | 81 (100.0%) | 0 (0.0%) |
| 35 Years and over | 108 (69.2%) | 48 (30.8%) |
| Total | 1,723 (82.6%) | 363 (17.4%) |
Educational Attainment by Field of Study in Evergreen
Business (1,002 | 20.5%), education (526 | 10.7%), literature & languages (437 | 8.9%), arts & humanities (368 | 7.5%), and communications (339 | 6.9%) are the most common fields of study among 4,898 individuals in Evergreen who have obtained a bachelor's degree or higher.
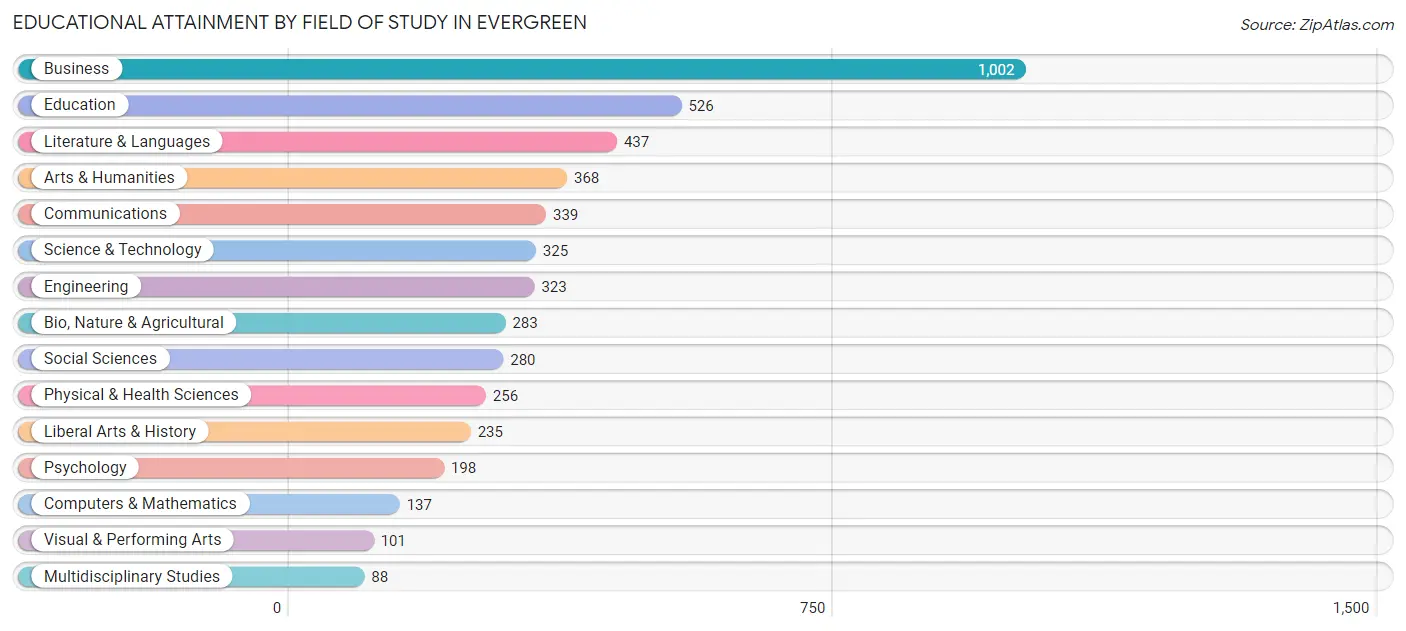
| Field of Study | # Graduates | % Graduates |
| Computers & Mathematics | 137 | 2.8% |
| Bio, Nature & Agricultural | 283 | 5.8% |
| Physical & Health Sciences | 256 | 5.2% |
| Psychology | 198 | 4.0% |
| Social Sciences | 280 | 5.7% |
| Engineering | 323 | 6.6% |
| Multidisciplinary Studies | 88 | 1.8% |
| Science & Technology | 325 | 6.6% |
| Business | 1,002 | 20.5% |
| Education | 526 | 10.7% |
| Literature & Languages | 437 | 8.9% |
| Liberal Arts & History | 235 | 4.8% |
| Visual & Performing Arts | 101 | 2.1% |
| Communications | 339 | 6.9% |
| Arts & Humanities | 368 | 7.5% |
| Total | 4,898 | 100.0% |
Transportation & Commute in Evergreen
Vehicle Availability by Sex in Evergreen
The most prevalent vehicle ownership categories in Evergreen are males with 2 vehicles (1,314, accounting for 52.7%) and females with 2 vehicles (1,145, making up 57.8%).
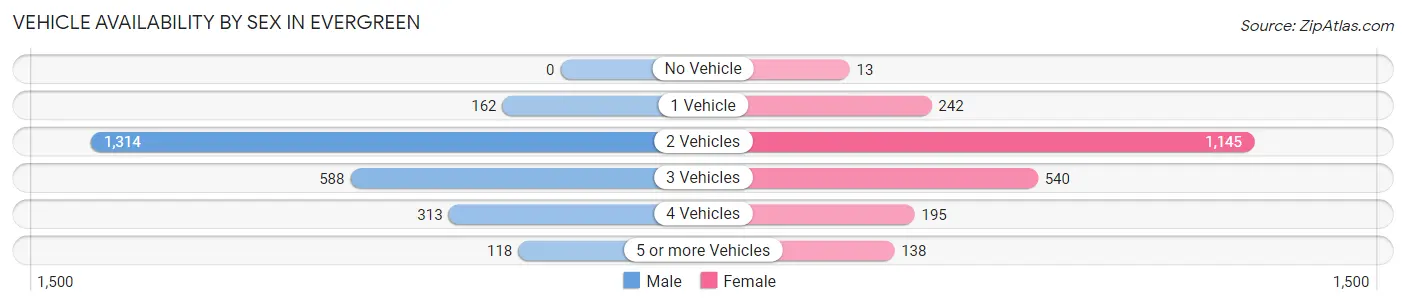
| Vehicles Available | Male | Female |
| No Vehicle | 0 (0.0%) | 13 (0.6%) |
| 1 Vehicle | 162 (6.5%) | 242 (10.6%) |
| 2 Vehicles | 1,314 (52.7%) | 1,145 (50.4%) |
| 3 Vehicles | 588 (23.6%) | 540 (23.8%) |
| 4 Vehicles | 313 (12.6%) | 195 (8.6%) |
| 5 or more Vehicles | 118 (4.7%) | 138 (6.1%) |
| Total | 2,495 (100.0%) | 2,273 (100.0%) |
Commute Time in Evergreen
The most frequently occuring commute durations in Evergreen are 45 to 59 minutes (568 commuters, 16.0%), 15 to 19 minutes (471 commuters, 13.3%), and 35 to 39 minutes (460 commuters, 13.0%).
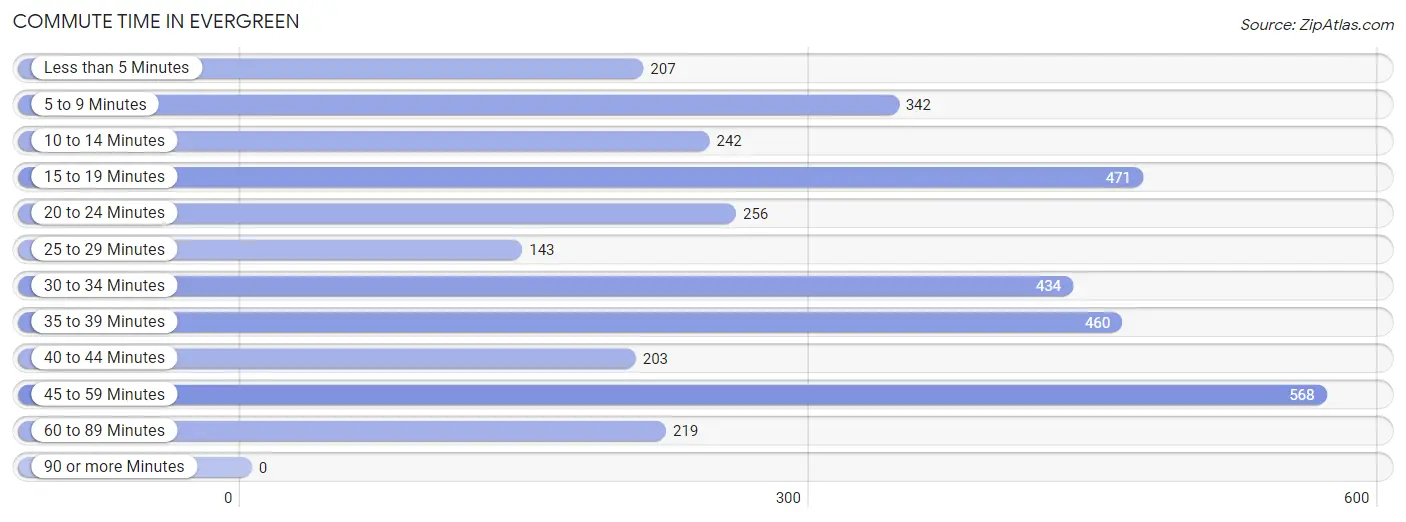
| Commute Time | # Commuters | % Commuters |
| Less than 5 Minutes | 207 | 5.8% |
| 5 to 9 Minutes | 342 | 9.7% |
| 10 to 14 Minutes | 242 | 6.8% |
| 15 to 19 Minutes | 471 | 13.3% |
| 20 to 24 Minutes | 256 | 7.2% |
| 25 to 29 Minutes | 143 | 4.0% |
| 30 to 34 Minutes | 434 | 12.2% |
| 35 to 39 Minutes | 460 | 13.0% |
| 40 to 44 Minutes | 203 | 5.7% |
| 45 to 59 Minutes | 568 | 16.0% |
| 60 to 89 Minutes | 219 | 6.2% |
| 90 or more Minutes | 0 | 0.0% |
Commute Time by Sex in Evergreen
The most common commute times in Evergreen are 45 to 59 minutes (348 commuters, 19.0%) for males and 5 to 9 minutes (272 commuters, 15.9%) for females.
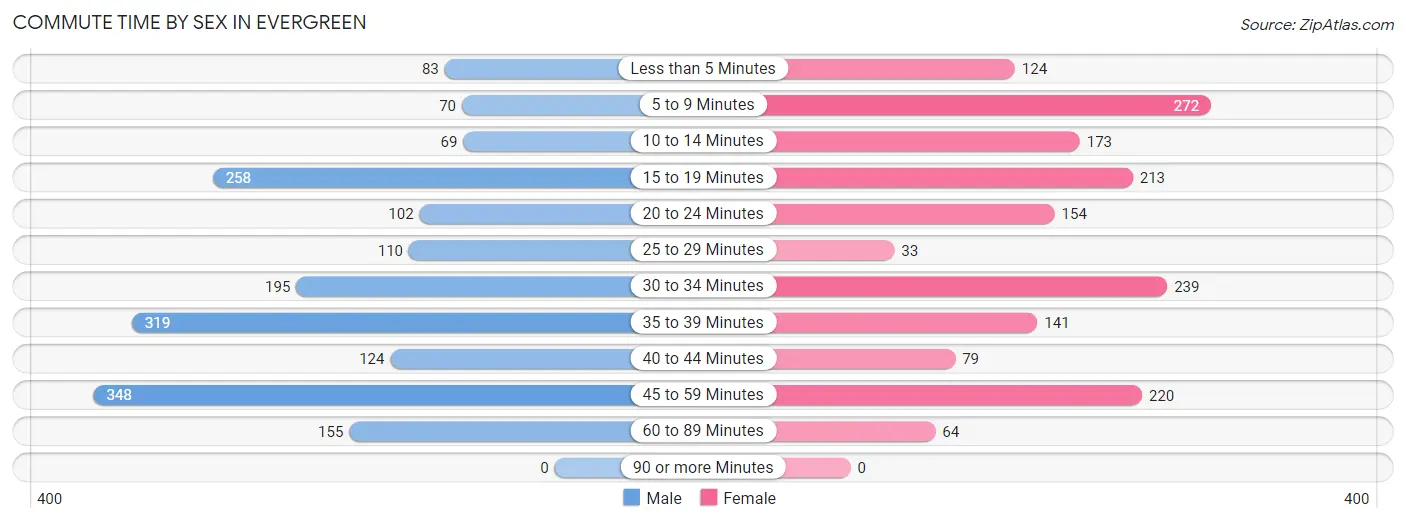
| Commute Time | Male | Female |
| Less than 5 Minutes | 83 (4.5%) | 124 (7.2%) |
| 5 to 9 Minutes | 70 (3.8%) | 272 (15.9%) |
| 10 to 14 Minutes | 69 (3.8%) | 173 (10.1%) |
| 15 to 19 Minutes | 258 (14.1%) | 213 (12.4%) |
| 20 to 24 Minutes | 102 (5.6%) | 154 (9.0%) |
| 25 to 29 Minutes | 110 (6.0%) | 33 (1.9%) |
| 30 to 34 Minutes | 195 (10.6%) | 239 (14.0%) |
| 35 to 39 Minutes | 319 (17.4%) | 141 (8.2%) |
| 40 to 44 Minutes | 124 (6.8%) | 79 (4.6%) |
| 45 to 59 Minutes | 348 (19.0%) | 220 (12.9%) |
| 60 to 89 Minutes | 155 (8.5%) | 64 (3.7%) |
| 90 or more Minutes | 0 (0.0%) | 0 (0.0%) |
Time of Departure to Work by Sex in Evergreen
The most frequent times of departure to work in Evergreen are 7:00 AM to 7:29 AM (393, 21.4%) for males and 7:00 AM to 7:29 AM (265, 15.5%) for females.
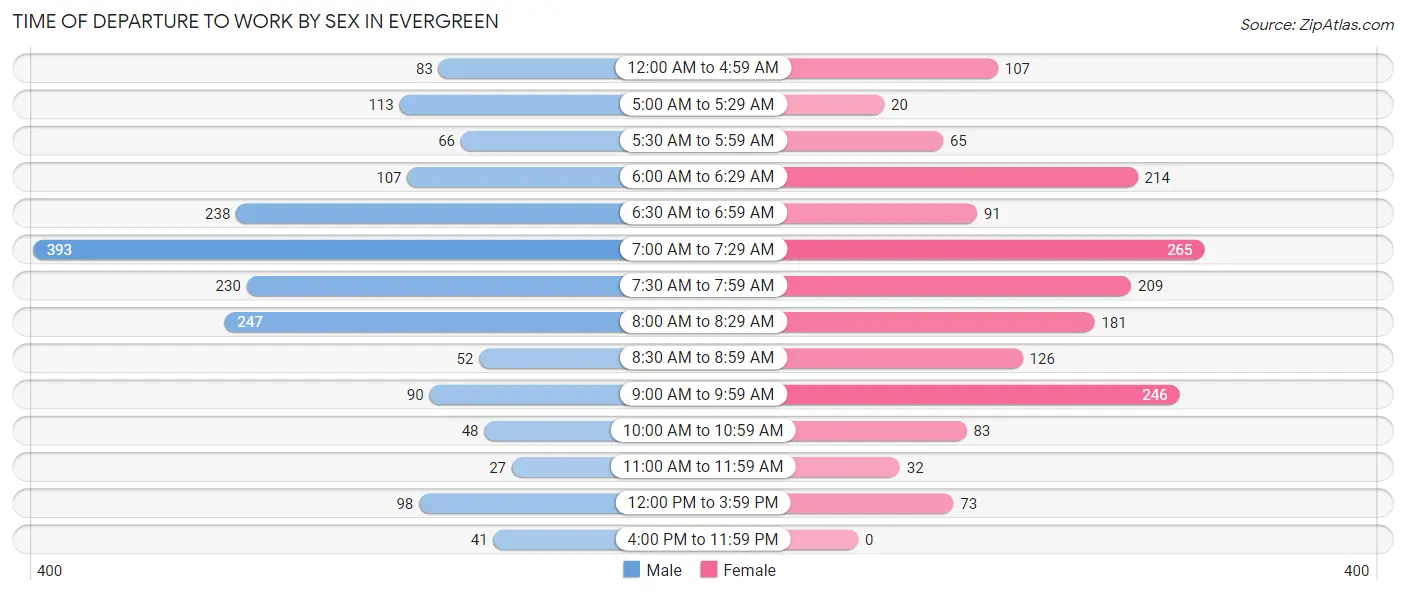
| Time of Departure | Male | Female |
| 12:00 AM to 4:59 AM | 83 (4.5%) | 107 (6.2%) |
| 5:00 AM to 5:29 AM | 113 (6.2%) | 20 (1.2%) |
| 5:30 AM to 5:59 AM | 66 (3.6%) | 65 (3.8%) |
| 6:00 AM to 6:29 AM | 107 (5.8%) | 214 (12.5%) |
| 6:30 AM to 6:59 AM | 238 (13.0%) | 91 (5.3%) |
| 7:00 AM to 7:29 AM | 393 (21.4%) | 265 (15.5%) |
| 7:30 AM to 7:59 AM | 230 (12.6%) | 209 (12.2%) |
| 8:00 AM to 8:29 AM | 247 (13.5%) | 181 (10.6%) |
| 8:30 AM to 8:59 AM | 52 (2.8%) | 126 (7.4%) |
| 9:00 AM to 9:59 AM | 90 (4.9%) | 246 (14.4%) |
| 10:00 AM to 10:59 AM | 48 (2.6%) | 83 (4.9%) |
| 11:00 AM to 11:59 AM | 27 (1.5%) | 32 (1.9%) |
| 12:00 PM to 3:59 PM | 98 (5.3%) | 73 (4.3%) |
| 4:00 PM to 11:59 PM | 41 (2.2%) | 0 (0.0%) |
| Total | 1,833 (100.0%) | 1,712 (100.0%) |
Housing Occupancy in Evergreen
Occupancy by Ownership in Evergreen
Of the total 3,633 dwellings in Evergreen, owner-occupied units account for 3,209 (88.3%), while renter-occupied units make up 424 (11.7%).
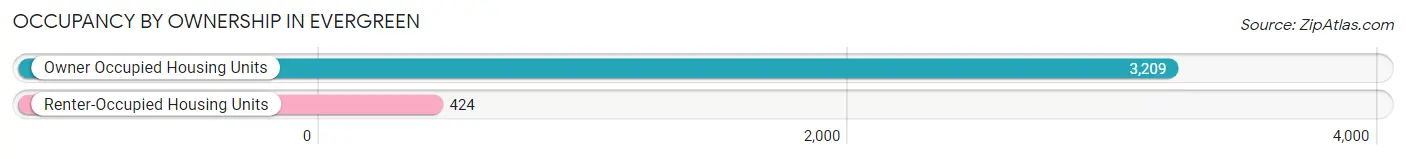
| Occupancy | # Housing Units | % Housing Units |
| Owner Occupied Housing Units | 3,209 | 88.3% |
| Renter-Occupied Housing Units | 424 | 11.7% |
| Total Occupied Housing Units | 3,633 | 100.0% |
Occupancy by Household Size in Evergreen
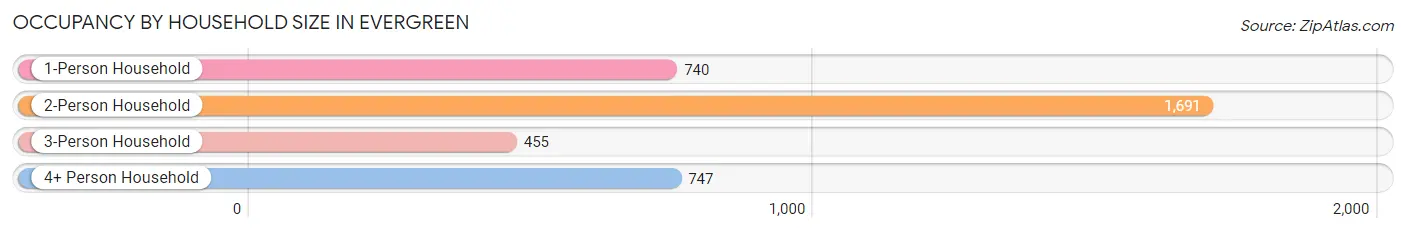
| Household Size | # Housing Units | % Housing Units |
| 1-Person Household | 740 | 20.4% |
| 2-Person Household | 1,691 | 46.6% |
| 3-Person Household | 455 | 12.5% |
| 4+ Person Household | 747 | 20.6% |
| Total Housing Units | 3,633 | 100.0% |
Occupancy by Ownership by Household Size in Evergreen
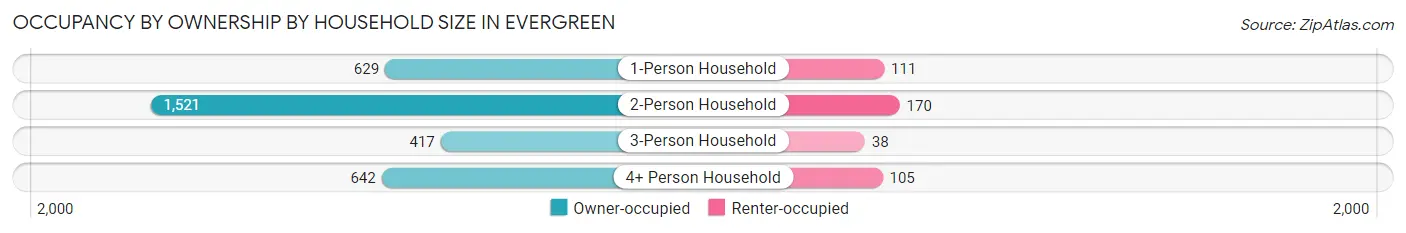
| Household Size | Owner-occupied | Renter-occupied |
| 1-Person Household | 629 (85.0%) | 111 (15.0%) |
| 2-Person Household | 1,521 (89.9%) | 170 (10.1%) |
| 3-Person Household | 417 (91.6%) | 38 (8.4%) |
| 4+ Person Household | 642 (85.9%) | 105 (14.1%) |
| Total Housing Units | 3,209 (88.3%) | 424 (11.7%) |
Occupancy by Educational Attainment in Evergreen
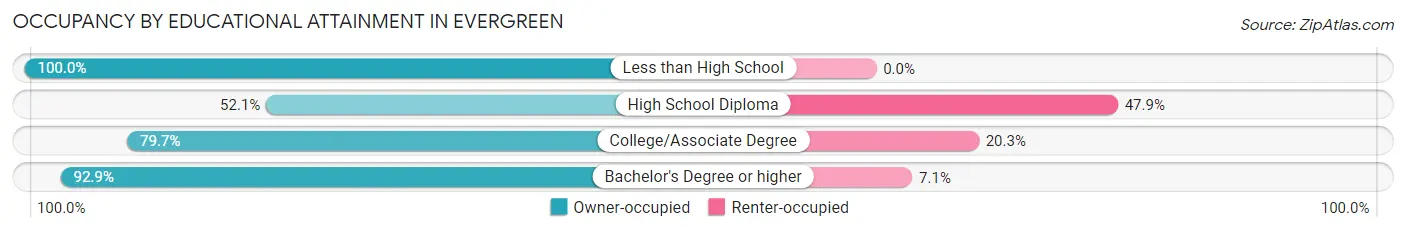
| Household Size | Owner-occupied | Renter-occupied |
| Less than High School | 45 (100.0%) | 0 (0.0%) |
| High School Diploma | 74 (52.1%) | 68 (47.9%) |
| College/Associate Degree | 666 (79.7%) | 170 (20.3%) |
| Bachelor's Degree or higher | 2,424 (92.9%) | 186 (7.1%) |
Occupancy by Age of Householder in Evergreen
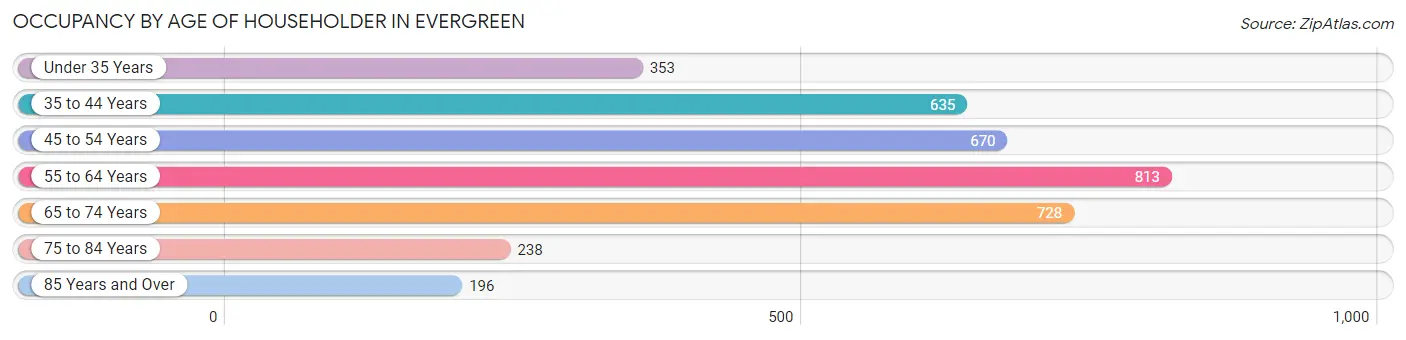
| Age Bracket | # Households | % Households |
| Under 35 Years | 353 | 9.7% |
| 35 to 44 Years | 635 | 17.5% |
| 45 to 54 Years | 670 | 18.4% |
| 55 to 64 Years | 813 | 22.4% |
| 65 to 74 Years | 728 | 20.0% |
| 75 to 84 Years | 238 | 6.6% |
| 85 Years and Over | 196 | 5.4% |
| Total | 3,633 | 100.0% |
Housing Finances in Evergreen
Median Income by Occupancy in Evergreen
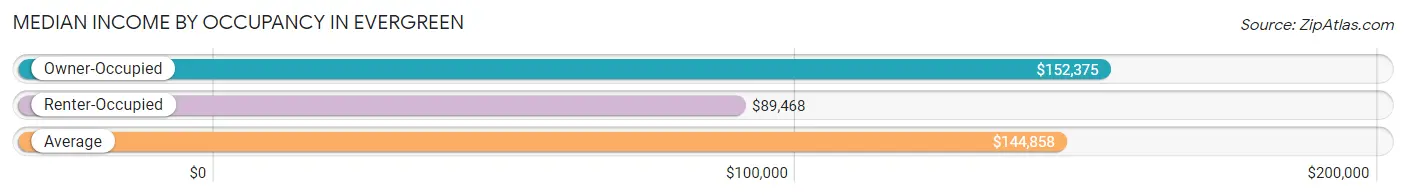
| Occupancy Type | # Households | Median Income |
| Owner-Occupied | 3,209 (88.3%) | $152,375 |
| Renter-Occupied | 424 (11.7%) | $89,468 |
| Average | 3,633 (100.0%) | $144,858 |
Occupancy by Householder Income Bracket in Evergreen
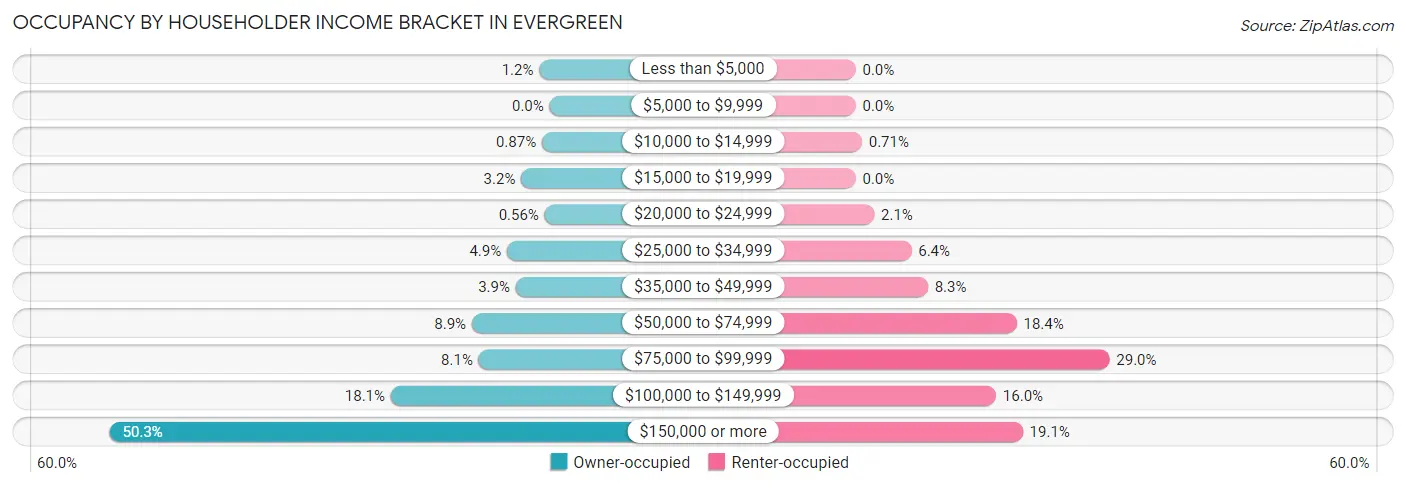
| Income Bracket | Owner-occupied | Renter-occupied |
| Less than $5,000 | 38 (1.2%) | 0 (0.0%) |
| $5,000 to $9,999 | 0 (0.0%) | 0 (0.0%) |
| $10,000 to $14,999 | 28 (0.9%) | 3 (0.7%) |
| $15,000 to $19,999 | 104 (3.2%) | 0 (0.0%) |
| $20,000 to $24,999 | 18 (0.6%) | 9 (2.1%) |
| $25,000 to $34,999 | 156 (4.9%) | 27 (6.4%) |
| $35,000 to $49,999 | 124 (3.9%) | 35 (8.3%) |
| $50,000 to $74,999 | 285 (8.9%) | 78 (18.4%) |
| $75,000 to $99,999 | 260 (8.1%) | 123 (29.0%) |
| $100,000 to $149,999 | 582 (18.1%) | 68 (16.0%) |
| $150,000 or more | 1,614 (50.3%) | 81 (19.1%) |
| Total | 3,209 (100.0%) | 424 (100.0%) |
Monthly Housing Cost Tiers in Evergreen
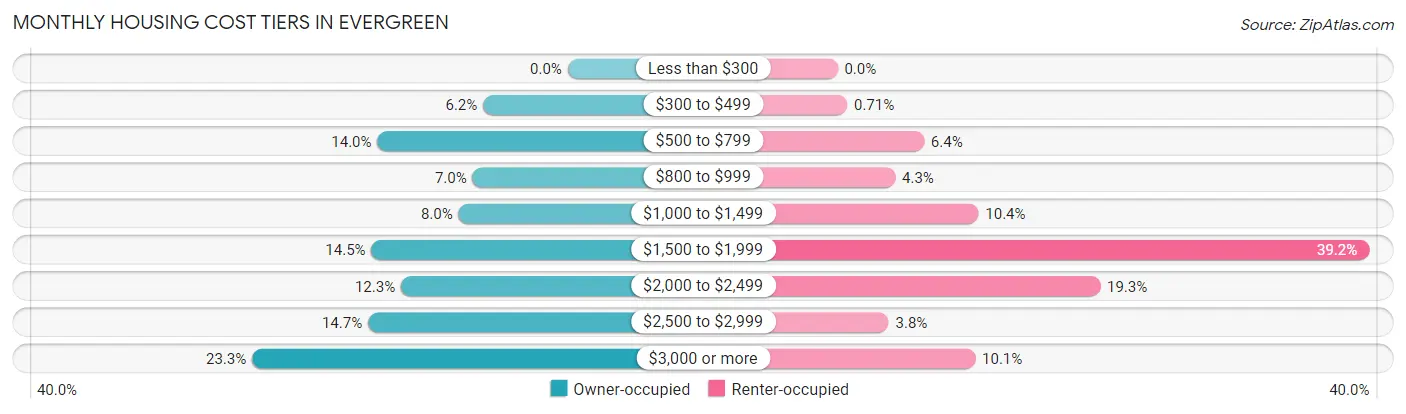
| Monthly Cost | Owner-occupied | Renter-occupied |
| Less than $300 | 0 (0.0%) | 0 (0.0%) |
| $300 to $499 | 200 (6.2%) | 3 (0.7%) |
| $500 to $799 | 450 (14.0%) | 27 (6.4%) |
| $800 to $999 | 225 (7.0%) | 18 (4.3%) |
| $1,000 to $1,499 | 258 (8.0%) | 44 (10.4%) |
| $1,500 to $1,999 | 464 (14.5%) | 166 (39.2%) |
| $2,000 to $2,499 | 394 (12.3%) | 82 (19.3%) |
| $2,500 to $2,999 | 472 (14.7%) | 16 (3.8%) |
| $3,000 or more | 746 (23.3%) | 43 (10.1%) |
| Total | 3,209 (100.0%) | 424 (100.0%) |
Physical Housing Characteristics in Evergreen
Housing Structures in Evergreen
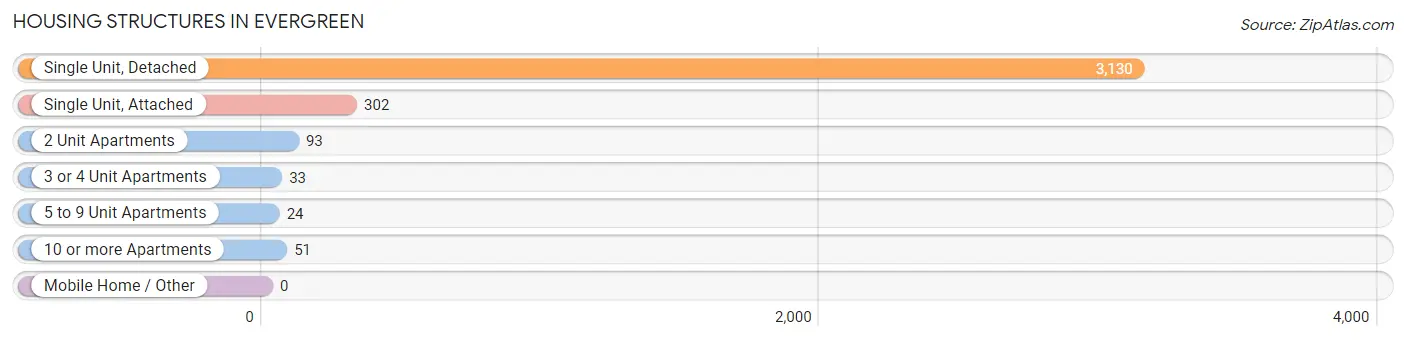
| Structure Type | # Housing Units | % Housing Units |
| Single Unit, Detached | 3,130 | 86.2% |
| Single Unit, Attached | 302 | 8.3% |
| 2 Unit Apartments | 93 | 2.6% |
| 3 or 4 Unit Apartments | 33 | 0.9% |
| 5 to 9 Unit Apartments | 24 | 0.7% |
| 10 or more Apartments | 51 | 1.4% |
| Mobile Home / Other | 0 | 0.0% |
| Total | 3,633 | 100.0% |
Housing Structures by Occupancy in Evergreen
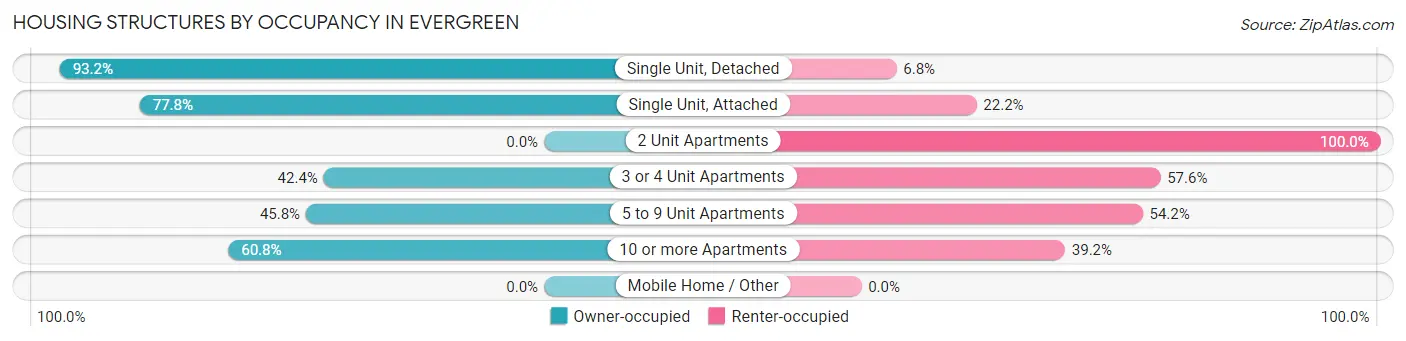
| Structure Type | Owner-occupied | Renter-occupied |
| Single Unit, Detached | 2,918 (93.2%) | 212 (6.8%) |
| Single Unit, Attached | 235 (77.8%) | 67 (22.2%) |
| 2 Unit Apartments | 0 (0.0%) | 93 (100.0%) |
| 3 or 4 Unit Apartments | 14 (42.4%) | 19 (57.6%) |
| 5 to 9 Unit Apartments | 11 (45.8%) | 13 (54.2%) |
| 10 or more Apartments | 31 (60.8%) | 20 (39.2%) |
| Mobile Home / Other | 0 (0.0%) | 0 (0.0%) |
| Total | 3,209 (88.3%) | 424 (11.7%) |
Housing Structures by Number of Rooms in Evergreen
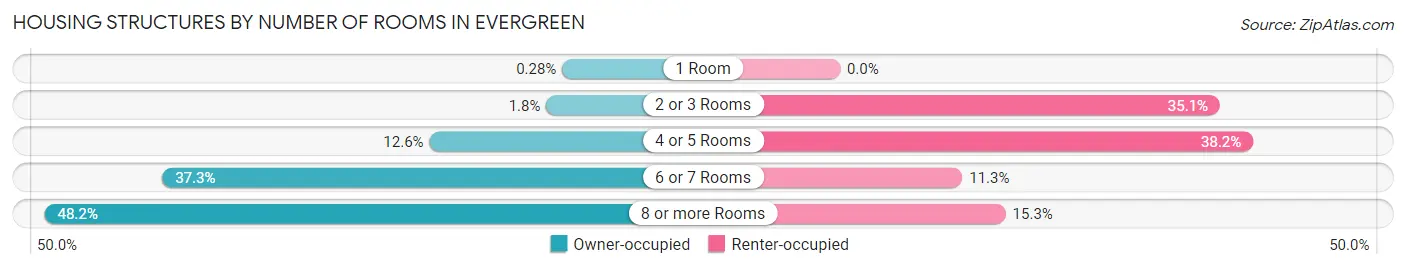
| Number of Rooms | Owner-occupied | Renter-occupied |
| 1 Room | 9 (0.3%) | 0 (0.0%) |
| 2 or 3 Rooms | 56 (1.8%) | 149 (35.1%) |
| 4 or 5 Rooms | 403 (12.6%) | 162 (38.2%) |
| 6 or 7 Rooms | 1,196 (37.3%) | 48 (11.3%) |
| 8 or more Rooms | 1,545 (48.1%) | 65 (15.3%) |
| Total | 3,209 (100.0%) | 424 (100.0%) |
Housing Structure by Heating Type in Evergreen
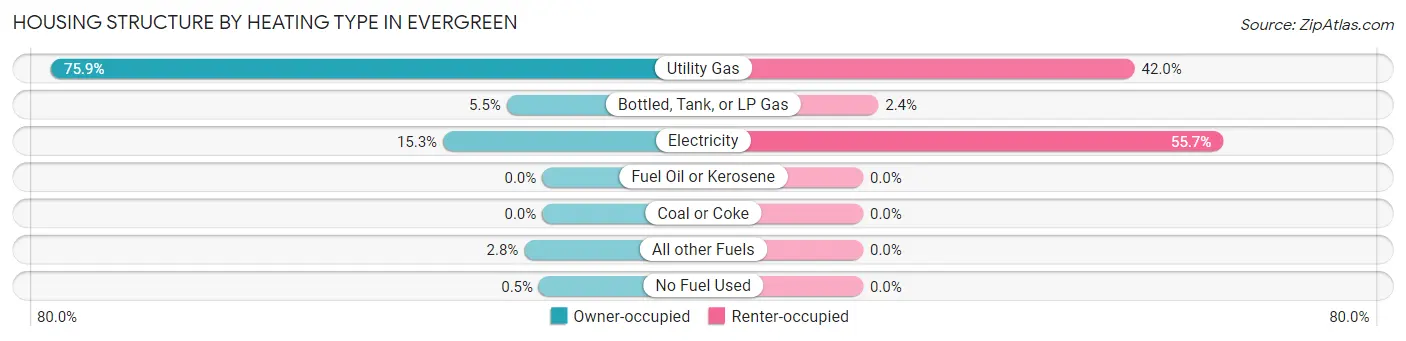
| Heating Type | Owner-occupied | Renter-occupied |
| Utility Gas | 2,436 (75.9%) | 178 (42.0%) |
| Bottled, Tank, or LP Gas | 176 (5.5%) | 10 (2.4%) |
| Electricity | 492 (15.3%) | 236 (55.7%) |
| Fuel Oil or Kerosene | 0 (0.0%) | 0 (0.0%) |
| Coal or Coke | 0 (0.0%) | 0 (0.0%) |
| All other Fuels | 89 (2.8%) | 0 (0.0%) |
| No Fuel Used | 16 (0.5%) | 0 (0.0%) |
| Total | 3,209 (100.0%) | 424 (100.0%) |
Household Vehicle Usage in Evergreen
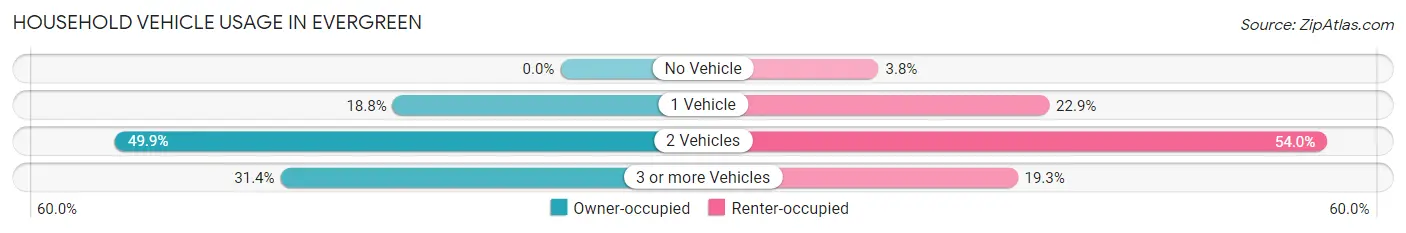
| Vehicles per Household | Owner-occupied | Renter-occupied |
| No Vehicle | 0 (0.0%) | 16 (3.8%) |
| 1 Vehicle | 603 (18.8%) | 97 (22.9%) |
| 2 Vehicles | 1,600 (49.9%) | 229 (54.0%) |
| 3 or more Vehicles | 1,006 (31.4%) | 82 (19.3%) |
| Total | 3,209 (100.0%) | 424 (100.0%) |
Real Estate & Mortgages in Evergreen
Real Estate and Mortgage Overview in Evergreen
| Characteristic | Without Mortgage | With Mortgage |
| Housing Units | 913 | 2,296 |
| Median Property Value | $692,700 | $670,400 |
| Median Household Income | $99,071 | $1,322 |
| Monthly Housing Costs | $683 | $746 |
| Real Estate Taxes | $3,297 | $11 |
Property Value by Mortgage Status in Evergreen
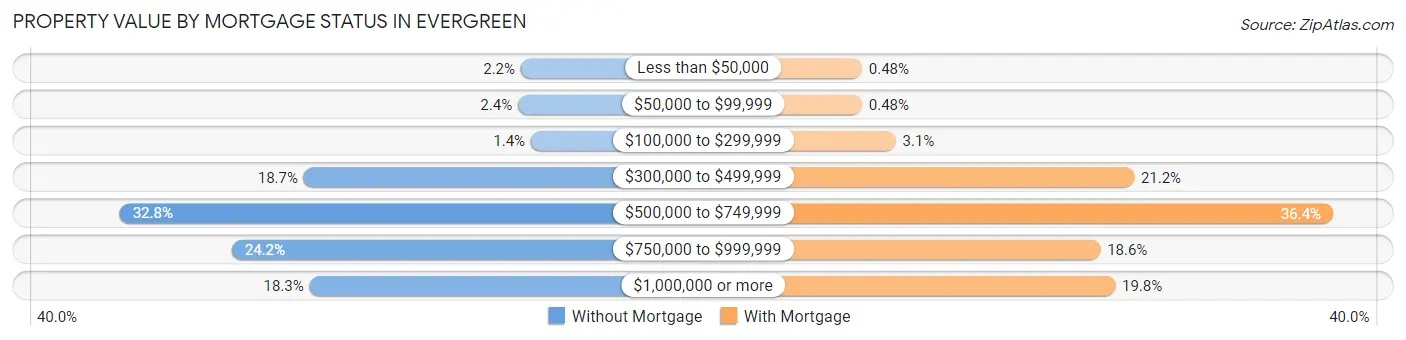
| Property Value | Without Mortgage | With Mortgage |
| Less than $50,000 | 20 (2.2%) | 11 (0.5%) |
| $50,000 to $99,999 | 22 (2.4%) | 11 (0.5%) |
| $100,000 to $299,999 | 13 (1.4%) | 70 (3.0%) |
| $300,000 to $499,999 | 171 (18.7%) | 487 (21.2%) |
| $500,000 to $749,999 | 299 (32.8%) | 835 (36.4%) |
| $750,000 to $999,999 | 221 (24.2%) | 428 (18.6%) |
| $1,000,000 or more | 167 (18.3%) | 454 (19.8%) |
| Total | 913 (100.0%) | 2,296 (100.0%) |
Household Income by Mortgage Status in Evergreen
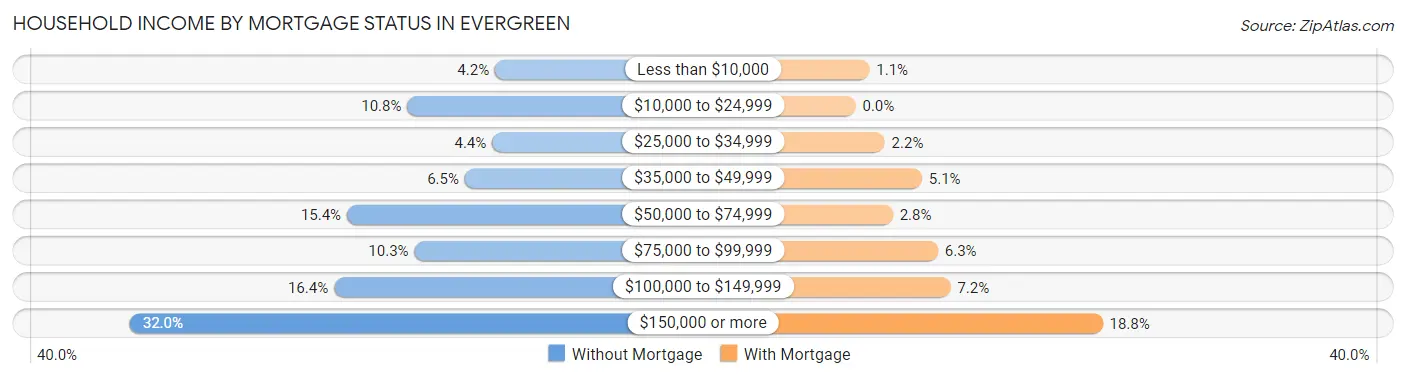
| Household Income | Without Mortgage | With Mortgage |
| Less than $10,000 | 38 (4.2%) | 24 (1.1%) |
| $10,000 to $24,999 | 99 (10.8%) | 0 (0.0%) |
| $25,000 to $34,999 | 40 (4.4%) | 51 (2.2%) |
| $35,000 to $49,999 | 59 (6.5%) | 116 (5.1%) |
| $50,000 to $74,999 | 141 (15.4%) | 65 (2.8%) |
| $75,000 to $99,999 | 94 (10.3%) | 144 (6.3%) |
| $100,000 to $149,999 | 150 (16.4%) | 166 (7.2%) |
| $150,000 or more | 292 (32.0%) | 432 (18.8%) |
| Total | 913 (100.0%) | 2,296 (100.0%) |
Property Value to Household Income Ratio in Evergreen
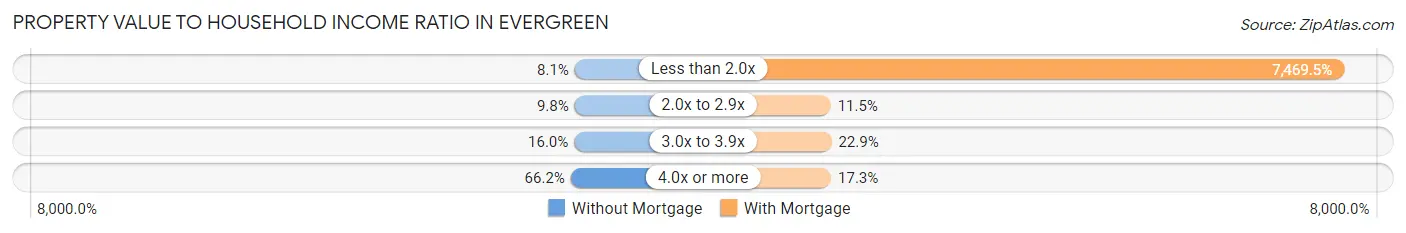
| Value-to-Income Ratio | Without Mortgage | With Mortgage |
| Less than 2.0x | 74 (8.1%) | 171,500 (7,469.5%) |
| 2.0x to 2.9x | 89 (9.8%) | 264 (11.5%) |
| 3.0x to 3.9x | 146 (16.0%) | 525 (22.9%) |
| 4.0x or more | 604 (66.2%) | 396 (17.2%) |
| Total | 913 (100.0%) | 2,296 (100.0%) |
Real Estate Taxes by Mortgage Status in Evergreen
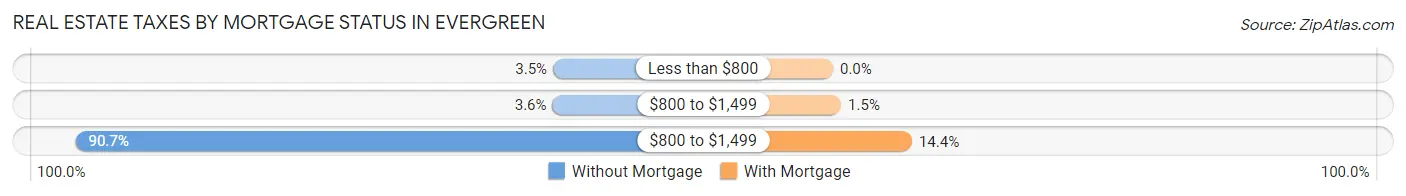
| Property Taxes | Without Mortgage | With Mortgage |
| Less than $800 | 32 (3.5%) | 0 (0.0%) |
| $800 to $1,499 | 33 (3.6%) | 34 (1.5%) |
| $800 to $1,499 | 828 (90.7%) | 331 (14.4%) |
| Total | 913 (100.0%) | 2,296 (100.0%) |
Health & Disability in Evergreen
Health Insurance Coverage by Age in Evergreen
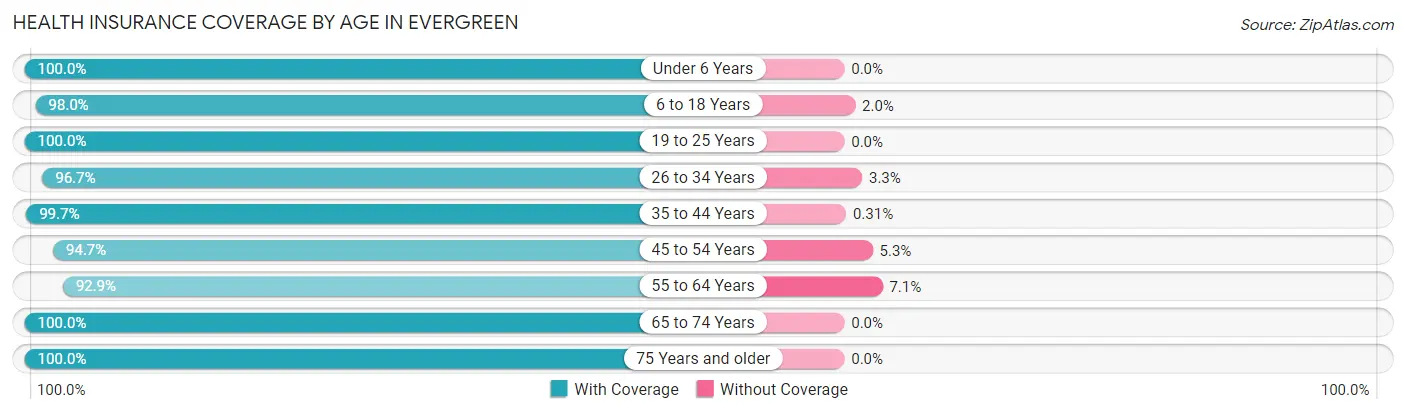
| Age Bracket | With Coverage | Without Coverage |
| Under 6 Years | 510 (100.0%) | 0 (0.0%) |
| 6 to 18 Years | 1,452 (98.0%) | 30 (2.0%) |
| 19 to 25 Years | 336 (100.0%) | 0 (0.0%) |
| 26 to 34 Years | 614 (96.7%) | 21 (3.3%) |
| 35 to 44 Years | 1,285 (99.7%) | 4 (0.3%) |
| 45 to 54 Years | 1,221 (94.7%) | 68 (5.3%) |
| 55 to 64 Years | 1,384 (92.9%) | 106 (7.1%) |
| 65 to 74 Years | 1,250 (100.0%) | 0 (0.0%) |
| 75 Years and older | 657 (100.0%) | 0 (0.0%) |
| Total | 8,709 (97.4%) | 229 (2.6%) |
Health Insurance Coverage by Citizenship Status in Evergreen
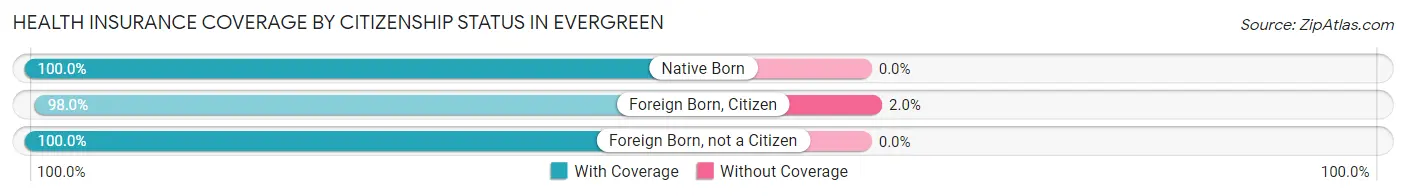
| Citizenship Status | With Coverage | Without Coverage |
| Native Born | 510 (100.0%) | 0 (0.0%) |
| Foreign Born, Citizen | 1,452 (98.0%) | 30 (2.0%) |
| Foreign Born, not a Citizen | 336 (100.0%) | 0 (0.0%) |
Health Insurance Coverage by Household Income in Evergreen
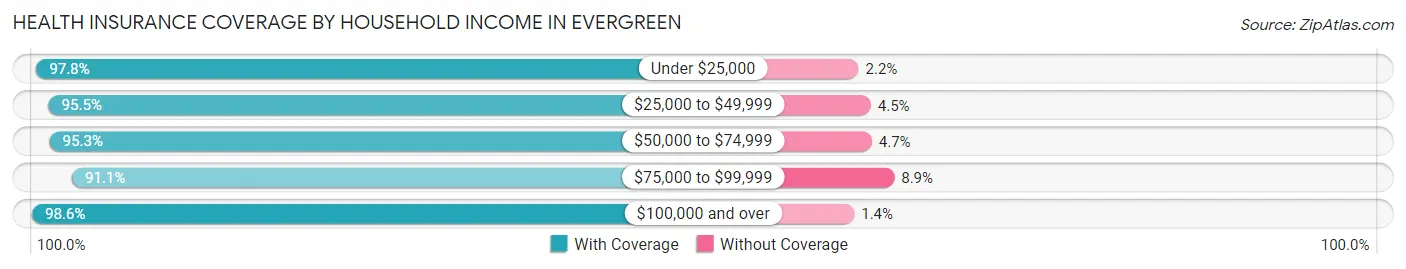
| Household Income | With Coverage | Without Coverage |
| Under $25,000 | 399 (97.8%) | 9 (2.2%) |
| $25,000 to $49,999 | 466 (95.5%) | 22 (4.5%) |
| $50,000 to $74,999 | 750 (95.3%) | 37 (4.7%) |
| $75,000 to $99,999 | 727 (91.1%) | 71 (8.9%) |
| $100,000 and over | 6,361 (98.6%) | 90 (1.4%) |
Public vs Private Health Insurance Coverage by Age in Evergreen
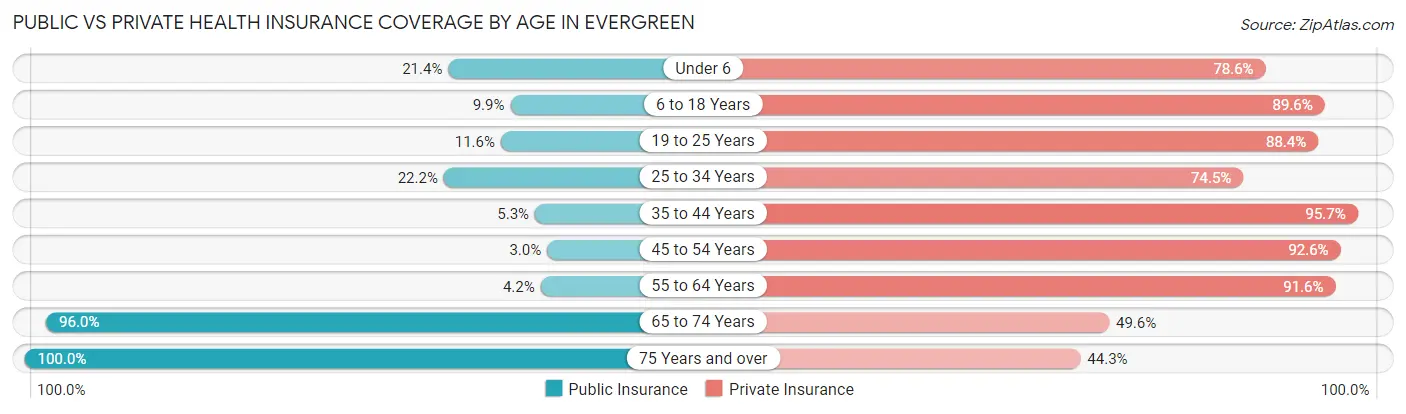
| Age Bracket | Public Insurance | Private Insurance |
| Under 6 | 109 (21.4%) | 401 (78.6%) |
| 6 to 18 Years | 146 (9.9%) | 1,328 (89.6%) |
| 19 to 25 Years | 39 (11.6%) | 297 (88.4%) |
| 25 to 34 Years | 141 (22.2%) | 473 (74.5%) |
| 35 to 44 Years | 68 (5.3%) | 1,234 (95.7%) |
| 45 to 54 Years | 39 (3.0%) | 1,193 (92.5%) |
| 55 to 64 Years | 63 (4.2%) | 1,365 (91.6%) |
| 65 to 74 Years | 1,200 (96.0%) | 620 (49.6%) |
| 75 Years and over | 657 (100.0%) | 291 (44.3%) |
| Total | 2,462 (27.6%) | 7,202 (80.6%) |
Disability Status by Sex by Age in Evergreen
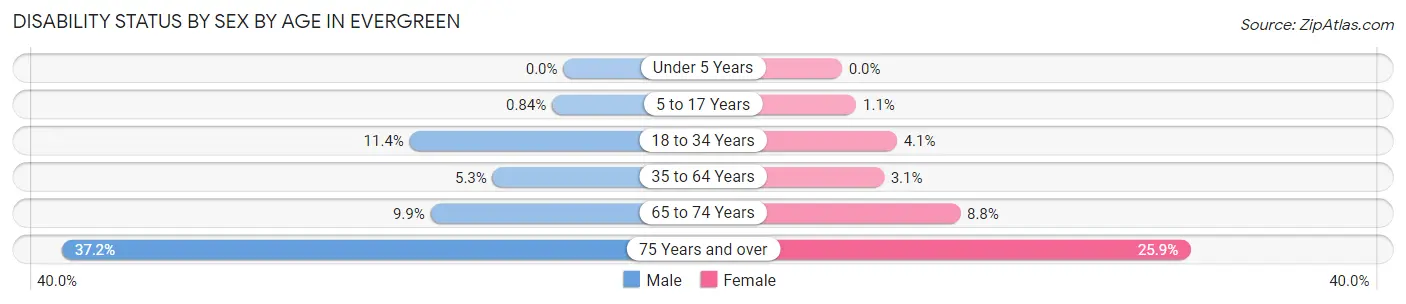
| Age Bracket | Male | Female |
| Under 5 Years | 0 (0.0%) | 0 (0.0%) |
| 5 to 17 Years | 6 (0.8%) | 9 (1.1%) |
| 18 to 34 Years | 63 (11.4%) | 21 (4.1%) |
| 35 to 64 Years | 104 (5.2%) | 65 (3.1%) |
| 65 to 74 Years | 57 (9.9%) | 59 (8.8%) |
| 75 Years and over | 102 (37.2%) | 99 (25.9%) |
Disability Class by Sex by Age in Evergreen
Disability Class: Hearing Difficulty
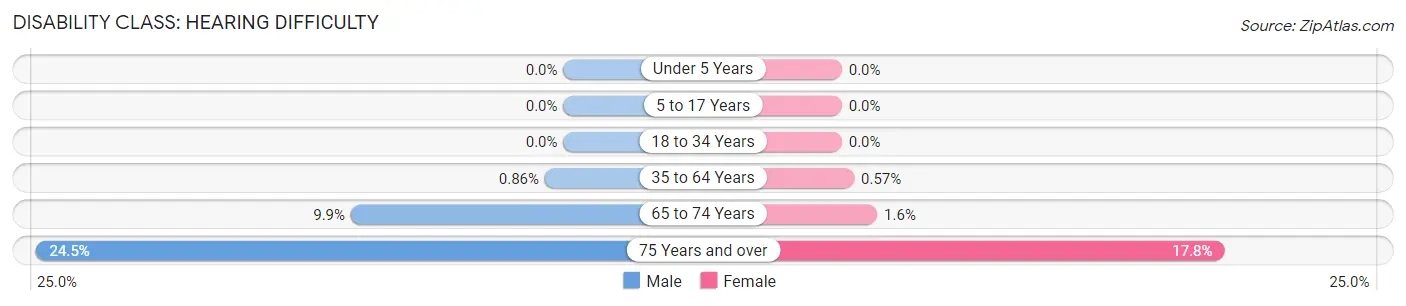
| Age Bracket | Male | Female |
| Under 5 Years | 0 (0.0%) | 0 (0.0%) |
| 5 to 17 Years | 0 (0.0%) | 0 (0.0%) |
| 18 to 34 Years | 0 (0.0%) | 0 (0.0%) |
| 35 to 64 Years | 17 (0.9%) | 12 (0.6%) |
| 65 to 74 Years | 57 (9.9%) | 11 (1.6%) |
| 75 Years and over | 67 (24.4%) | 68 (17.7%) |
Disability Class: Vision Difficulty
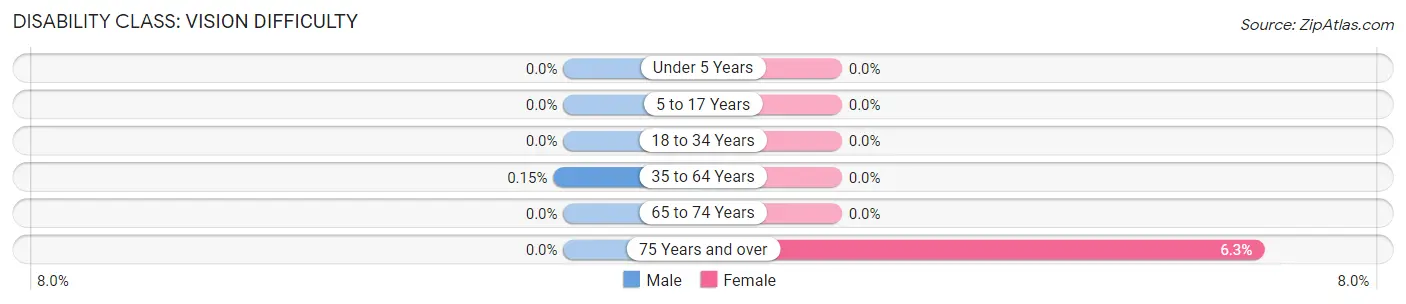
| Age Bracket | Male | Female |
| Under 5 Years | 0 (0.0%) | 0 (0.0%) |
| 5 to 17 Years | 0 (0.0%) | 0 (0.0%) |
| 18 to 34 Years | 0 (0.0%) | 0 (0.0%) |
| 35 to 64 Years | 3 (0.2%) | 0 (0.0%) |
| 65 to 74 Years | 0 (0.0%) | 0 (0.0%) |
| 75 Years and over | 0 (0.0%) | 24 (6.3%) |
Disability Class: Cognitive Difficulty
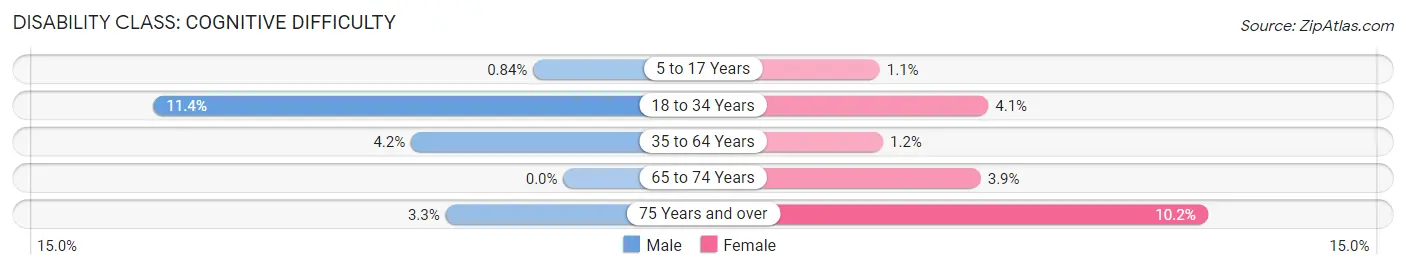
| Age Bracket | Male | Female |
| 5 to 17 Years | 6 (0.8%) | 9 (1.1%) |
| 18 to 34 Years | 63 (11.4%) | 21 (4.1%) |
| 35 to 64 Years | 84 (4.2%) | 24 (1.1%) |
| 65 to 74 Years | 0 (0.0%) | 26 (3.9%) |
| 75 Years and over | 9 (3.3%) | 39 (10.2%) |
Disability Class: Ambulatory Difficulty
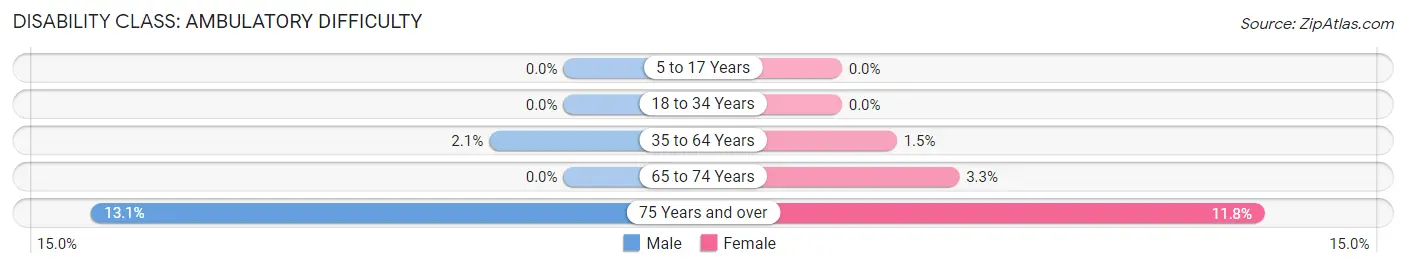
| Age Bracket | Male | Female |
| 5 to 17 Years | 0 (0.0%) | 0 (0.0%) |
| 18 to 34 Years | 0 (0.0%) | 0 (0.0%) |
| 35 to 64 Years | 41 (2.1%) | 32 (1.5%) |
| 65 to 74 Years | 0 (0.0%) | 22 (3.3%) |
| 75 Years and over | 36 (13.1%) | 45 (11.7%) |
Disability Class: Self-Care Difficulty
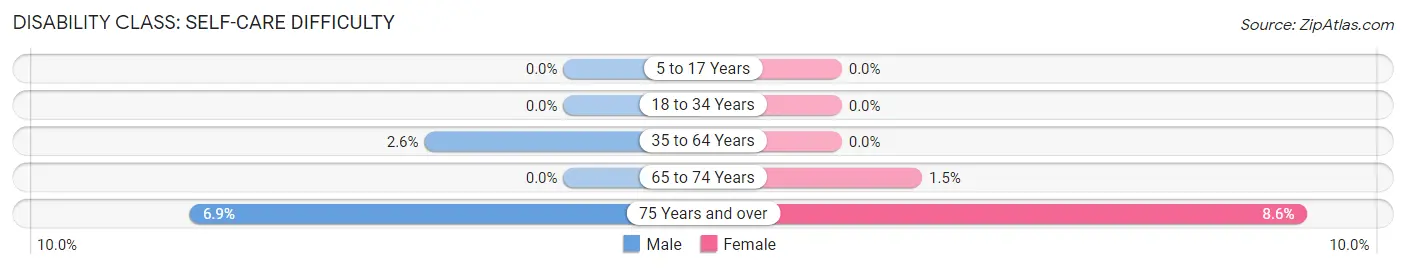
| Age Bracket | Male | Female |
| 5 to 17 Years | 0 (0.0%) | 0 (0.0%) |
| 18 to 34 Years | 0 (0.0%) | 0 (0.0%) |
| 35 to 64 Years | 51 (2.6%) | 0 (0.0%) |
| 65 to 74 Years | 0 (0.0%) | 10 (1.5%) |
| 75 Years and over | 19 (6.9%) | 33 (8.6%) |
Technology Access in Evergreen
Computing Device Access in Evergreen
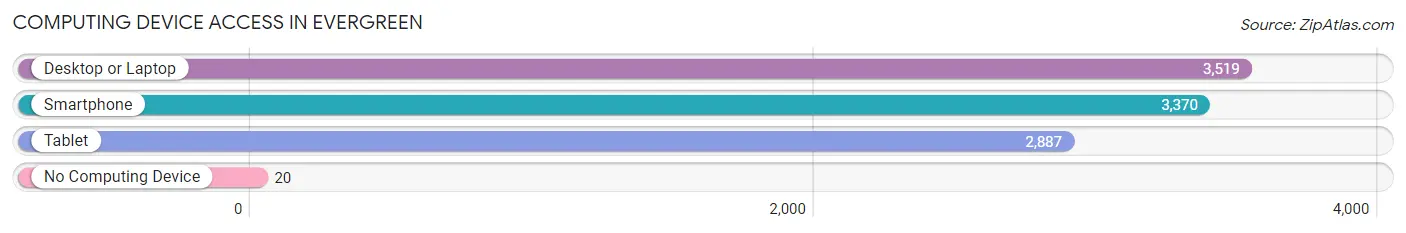
| Device Type | # Households | % Households |
| Desktop or Laptop | 3,519 | 96.9% |
| Smartphone | 3,370 | 92.8% |
| Tablet | 2,887 | 79.5% |
| No Computing Device | 20 | 0.5% |
| Total | 3,633 | 100.0% |
Internet Access in Evergreen
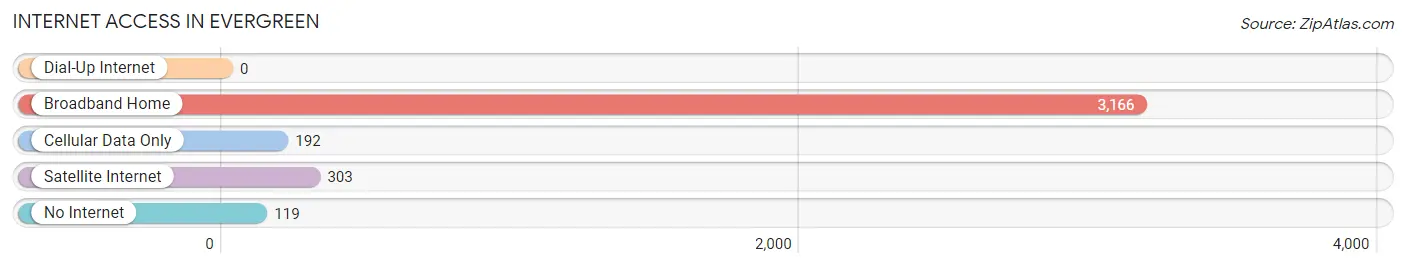
| Internet Type | # Households | % Households |
| Dial-Up Internet | 0 | 0.0% |
| Broadband Home | 3,166 | 87.2% |
| Cellular Data Only | 192 | 5.3% |
| Satellite Internet | 303 | 8.3% |
| No Internet | 119 | 3.3% |
| Total | 3,633 | 100.0% |
Evergreen Summary
History
The history of Evergreen, Colorado dates back to the mid-1800s when the area was first settled by homesteaders. The first settlers were mostly miners and ranchers who were attracted to the area due to its abundant natural resources. The town was officially founded in 1859 and was named after the evergreen trees that grew in the area.
The town quickly grew and by the late 1800s, it had become a popular tourist destination due to its proximity to Denver and the Rocky Mountains. The town was also home to a number of resorts and hotels, which attracted visitors from all over the country.
In the early 1900s, the town began to experience a period of growth and development. The Denver & Rio Grande Railroad was extended to Evergreen in 1906, which allowed for increased access to the area. This led to the development of a number of businesses, including a sawmill, a flour mill, and a brickyard.
The town continued to grow throughout the 20th century, and by the 1970s, it had become a popular residential area for people who wanted to live close to Denver but still enjoy the beauty of the Rocky Mountains.
Geography
Evergreen is located in the foothills of the Rocky Mountains in Jefferson County, Colorado. The town is situated at an elevation of 7,200 feet and is surrounded by the Arapaho National Forest. The town is located approximately 25 miles west of Denver and is accessible via Interstate 70.
The town is situated in a valley surrounded by mountains, including Mount Evans, Mount Bierstadt, and Mount Evans Wilderness Area. The town is also home to a number of lakes, including Evergreen Lake, which is the largest lake in the area.
Economy
The economy of Evergreen is largely based on tourism and the service industry. The town is home to a number of resorts and hotels, which attract visitors from all over the country. The town is also home to a number of restaurants, shops, and other businesses that cater to tourists.
In addition to tourism, the town is also home to a number of businesses that provide services to the local community. These businesses include medical centers, banks, and other professional services.
Demographics
As of the 2010 census, the population of Evergreen was 9,038. The town has a median age of 44.7 years and a median household income of $77,945. The town is predominantly white (90.2%) and has a small Hispanic population (4.3%).
The town is home to a number of educational institutions, including Evergreen High School, Evergreen Middle School, and Wilmot Elementary School. The town is also home to a number of churches, including the Evergreen Presbyterian Church and the Evergreen United Methodist Church.
Common Questions
What is Per Capita Income in Evergreen?
Per Capita income in Evergreen is $74,260.
What is the Median Family Income in Evergreen?
Median Family Income in Evergreen is $165,563.
What is the Median Household income in Evergreen?
Median Household Income in Evergreen is $144,858.
What is Income or Wage Gap in Evergreen?
Income or Wage Gap in Evergreen is 53.5%.
Women in Evergreen earn 46.5 cents for every dollar earned by a man.
What is Family Income Deficit in Evergreen?
Family Income Deficit in Evergreen is $12,967.
Families that are below poverty line in Evergreen earn $12,967 less on average than the poverty threshold level.
What is Inequality or Gini Index in Evergreen?
Inequality or Gini Index in Evergreen is 0.43.
What is the Total Population of Evergreen?
Total Population of Evergreen is 8,972.
What is the Total Male Population of Evergreen?
Total Male Population of Evergreen is 4,330.
What is the Total Female Population of Evergreen?
Total Female Population of Evergreen is 4,642.
What is the Ratio of Males per 100 Females in Evergreen?
There are 93.28 Males per 100 Females in Evergreen.
What is the Ratio of Females per 100 Males in Evergreen?
There are 107.21 Females per 100 Males in Evergreen.
What is the Median Population Age in Evergreen?
Median Population Age in Evergreen is 46.2 Years.
What is the Average Family Size in Evergreen
Average Family Size in Evergreen is 2.9 People.
What is the Average Household Size in Evergreen
Average Household Size in Evergreen is 2.5 People.
How Large is the Labor Force in Evergreen?
There are 4,875 People in the Labor Forcein in Evergreen.
What is the Percentage of People in the Labor Force in Evergreen?
67.0% of People are in the Labor Force in Evergreen.
What is the Unemployment Rate in Evergreen?
Unemployment Rate in Evergreen is 1.3%.