Guanica, PR Map & Demographics
Guanica Overview
$8,691
PER CAPITA INCOME
$18,991
AVG FAMILY INCOME
$14,017
AVG HOUSEHOLD INCOME
7.3%
WAGE / INCOME GAP [ % ]
92.7¢/ $1
WAGE / INCOME GAP [ $ ]
$11,075
FAMILY INCOME DEFICIT
0.52
INEQUALITY / GINI INDEX
5,516
TOTAL POPULATION
2,797
MALE POPULATION
2,719
FEMALE POPULATION
102.87
MALES / 100 FEMALES
97.21
FEMALES / 100 MALES
49.0
MEDIAN AGE
3.1
AVG FAMILY SIZE
2.4
AVG HOUSEHOLD SIZE
1,565
LABOR FORCE [ PEOPLE ]
33.7%
PERCENT IN LABOR FORCE
29.1%
UNEMPLOYMENT RATE
Guanica Zip Codes
Guanica Area Codes
Income in Guanica
Income Overview in Guanica
Per Capita Income in Guanica is $8,691, while median incomes of families and households are $18,991 and $14,017 respectively.
| Characteristic | Number | Measure |
| Per Capita Income | 5,516 | $8,691 |
| Median Family Income | 1,396 | $18,991 |
| Mean Family Income | 1,396 | $24,987 |
| Median Household Income | 2,320 | $14,017 |
| Mean Household Income | 2,320 | $20,766 |
| Income Deficit | 1,396 | $11,075 |
| Wage / Income Gap (%) | 5,516 | 7.31% |
| Wage / Income Gap ($) | 5,516 | 92.69¢ per $1 |
| Gini / Inequality Index | 5,516 | 0.52 |
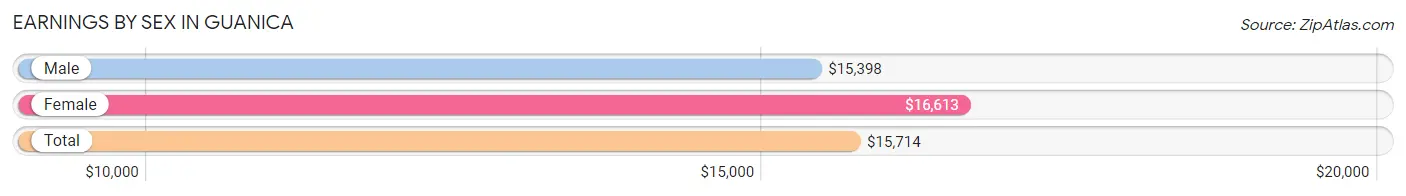
Earnings by Sex in Guanica
Average Earnings in Guanica are $15,714, $15,398 for men and $16,613 for women, a difference of 7.3%.
| Sex | Number | Average Earnings |
| Male | 680 (57.1%) | $15,398 |
| Female | 510 (42.9%) | $16,613 |
| Total | 1,190 (100.0%) | $15,714 |
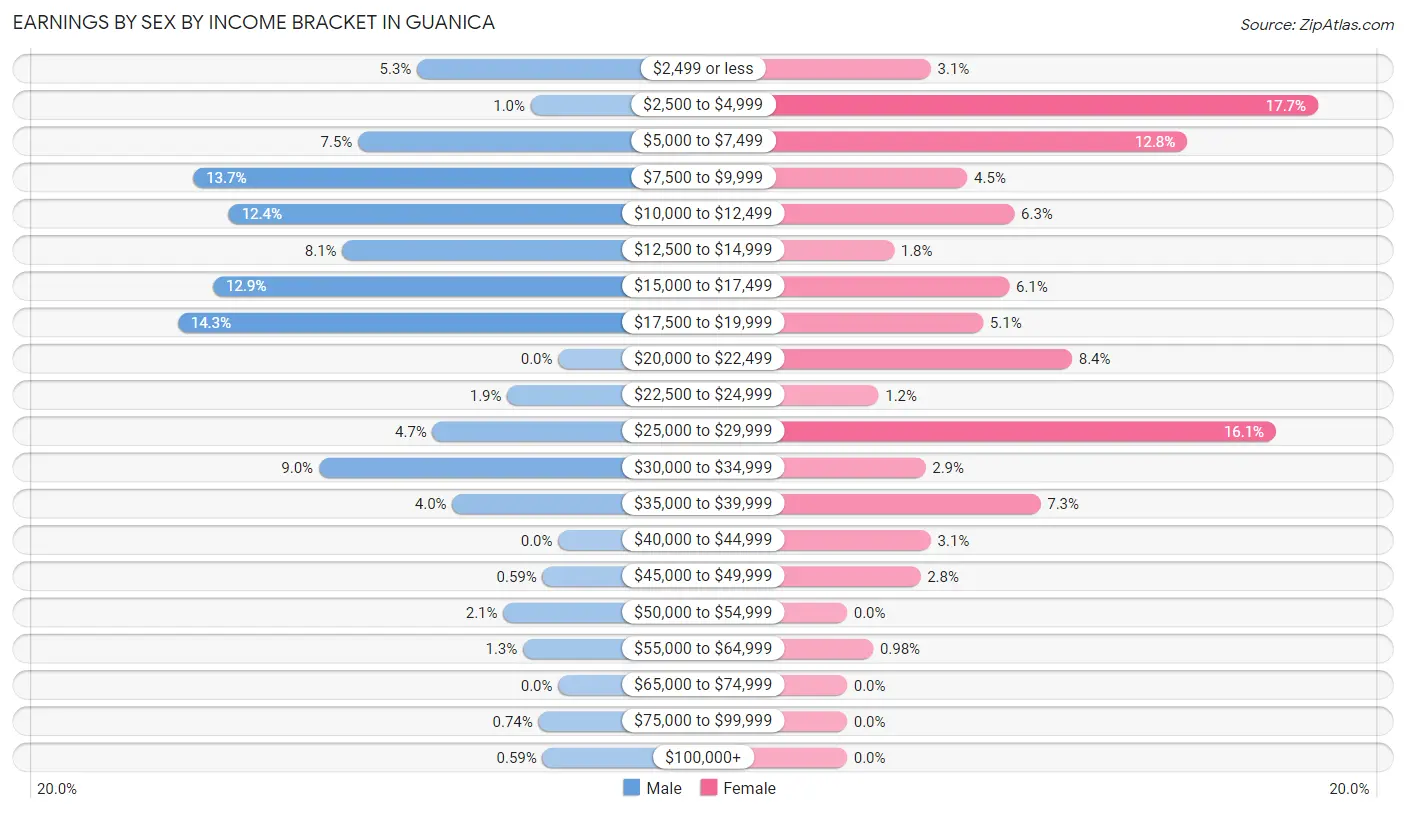
Earnings by Sex by Income Bracket in Guanica
The most common earnings brackets in Guanica are $17,500 to $19,999 for men (97 | 14.3%) and $2,500 to $4,999 for women (90 | 17.6%).
| Income | Male | Female |
| $2,499 or less | 36 (5.3%) | 16 (3.1%) |
| $2,500 to $4,999 | 7 (1.0%) | 90 (17.6%) |
| $5,000 to $7,499 | 51 (7.5%) | 65 (12.8%) |
| $7,500 to $9,999 | 93 (13.7%) | 23 (4.5%) |
| $10,000 to $12,499 | 84 (12.3%) | 32 (6.3%) |
| $12,500 to $14,999 | 55 (8.1%) | 9 (1.8%) |
| $15,000 to $17,499 | 88 (12.9%) | 31 (6.1%) |
| $17,500 to $19,999 | 97 (14.3%) | 26 (5.1%) |
| $20,000 to $22,499 | 0 (0.0%) | 43 (8.4%) |
| $22,500 to $24,999 | 13 (1.9%) | 6 (1.2%) |
| $25,000 to $29,999 | 32 (4.7%) | 82 (16.1%) |
| $30,000 to $34,999 | 61 (9.0%) | 15 (2.9%) |
| $35,000 to $39,999 | 27 (4.0%) | 37 (7.2%) |
| $40,000 to $44,999 | 0 (0.0%) | 16 (3.1%) |
| $45,000 to $49,999 | 4 (0.6%) | 14 (2.8%) |
| $50,000 to $54,999 | 14 (2.1%) | 0 (0.0%) |
| $55,000 to $64,999 | 9 (1.3%) | 5 (1.0%) |
| $65,000 to $74,999 | 0 (0.0%) | 0 (0.0%) |
| $75,000 to $99,999 | 5 (0.7%) | 0 (0.0%) |
| $100,000+ | 4 (0.6%) | 0 (0.0%) |
| Total | 680 (100.0%) | 510 (100.0%) |
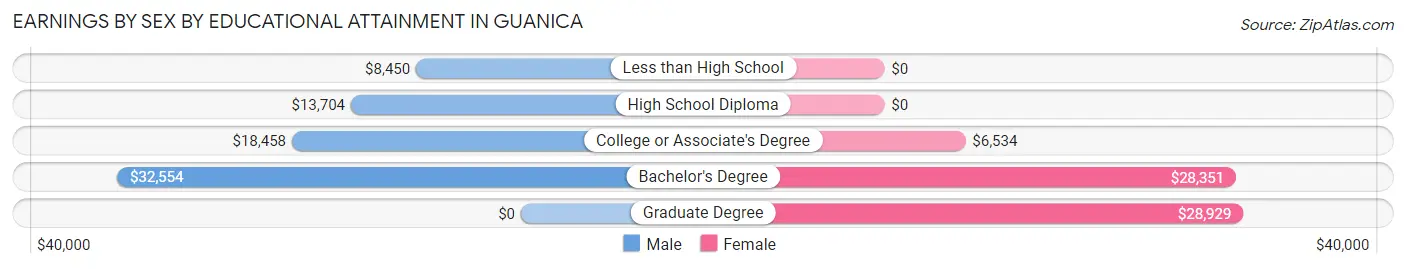
Earnings by Sex by Educational Attainment in Guanica
Average earnings in Guanica are $15,653 for men and $21,512 for women, a difference of 27.2%. Men with an educational attainment of bachelor's degree enjoy the highest average annual earnings of $32,554, while those with less than high school education earn the least with $8,450. Women with an educational attainment of graduate degree earn the most with the average annual earnings of $28,929, while those with college or associate's degree education have the smallest earnings of $6,534.
| Educational Attainment | Male Income | Female Income |
| Less than High School | $8,450 | $0 |
| High School Diploma | $13,704 | $0 |
| College or Associate's Degree | $18,458 | $6,534 |
| Bachelor's Degree | $32,554 | $28,351 |
| Graduate Degree | - | - |
| Total | $15,653 | $21,512 |
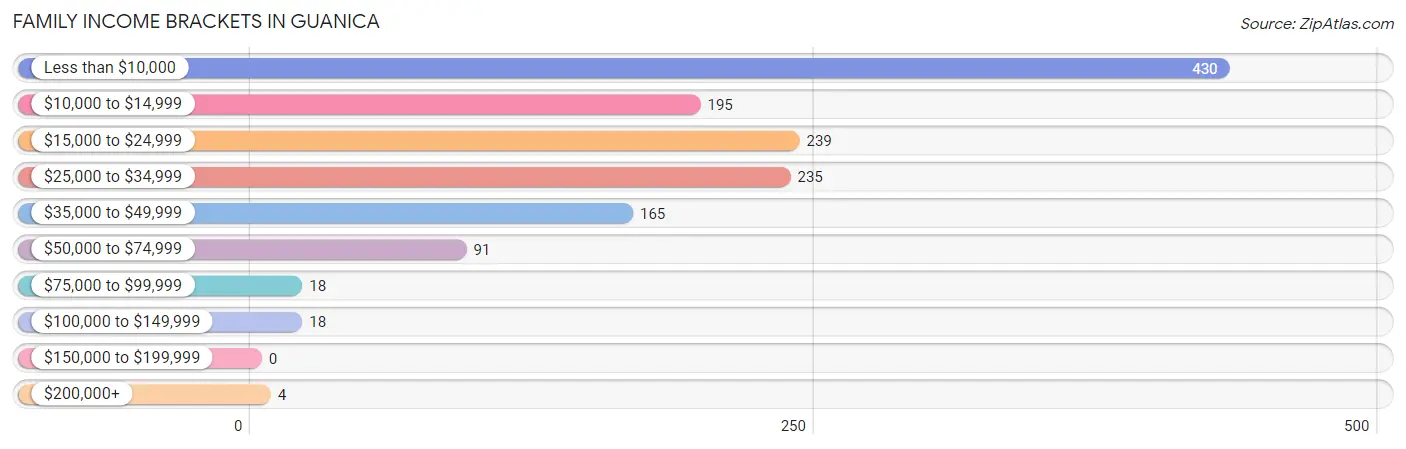
Family Income in Guanica
Family Income Brackets in Guanica
According to the Guanica family income data, there are 430 families falling into the less than $10,000 income range, which is the most common income bracket and makes up 30.8% of all families.
| Income Bracket | # Families | % Families |
| Less than $10,000 | 430 | 30.8% |
| $10,000 to $14,999 | 195 | 14.0% |
| $15,000 to $24,999 | 239 | 17.1% |
| $25,000 to $34,999 | 235 | 16.8% |
| $35,000 to $49,999 | 165 | 11.8% |
| $50,000 to $74,999 | 91 | 6.5% |
| $75,000 to $99,999 | 18 | 1.3% |
| $100,000 to $149,999 | 18 | 1.3% |
| $150,000 to $199,999 | 0 | 0.0% |
| $200,000+ | 4 | 0.3% |
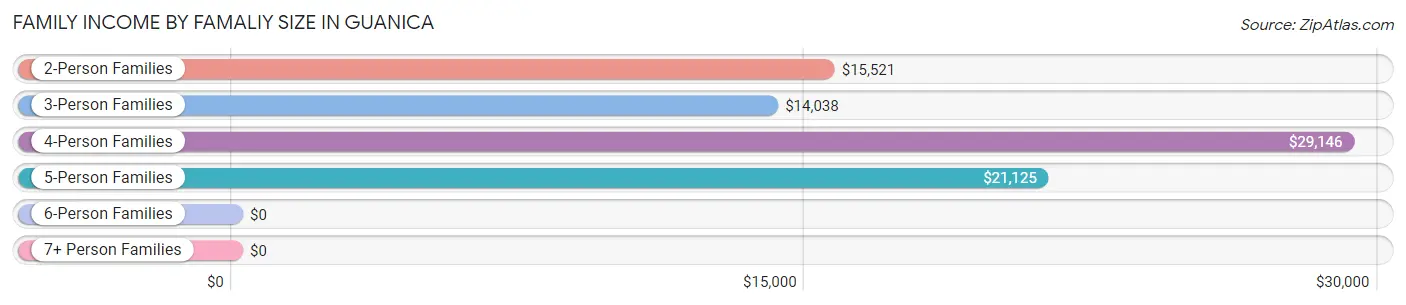
Family Income by Famaliy Size in Guanica
4-person families (208 | 14.9%) account for the highest median family income in Guanica with $29,146 per family, while 2-person families (708 | 50.7%) have the highest median income of $7,760 per family member.
| Income Bracket | # Families | Median Income |
| 2-Person Families | 708 (50.7%) | $15,521 |
| 3-Person Families | 394 (28.2%) | $14,038 |
| 4-Person Families | 208 (14.9%) | $29,146 |
| 5-Person Families | 86 (6.2%) | $21,125 |
| 6-Person Families | 0 (0.0%) | $0 |
| 7+ Person Families | 0 (0.0%) | $0 |
| Total | 1,396 (100.0%) | $18,991 |
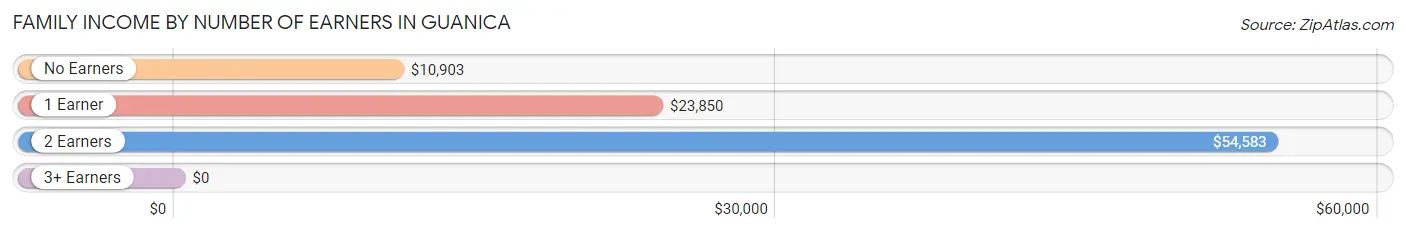
Family Income by Number of Earners in Guanica
| Number of Earners | # Families | Median Income |
| No Earners | 697 (49.9%) | $10,903 |
| 1 Earner | 575 (41.2%) | $23,850 |
| 2 Earners | 119 (8.5%) | $54,583 |
| 3+ Earners | 5 (0.4%) | $0 |
| Total | 1,396 (100.0%) | $18,991 |
Household Income in Guanica
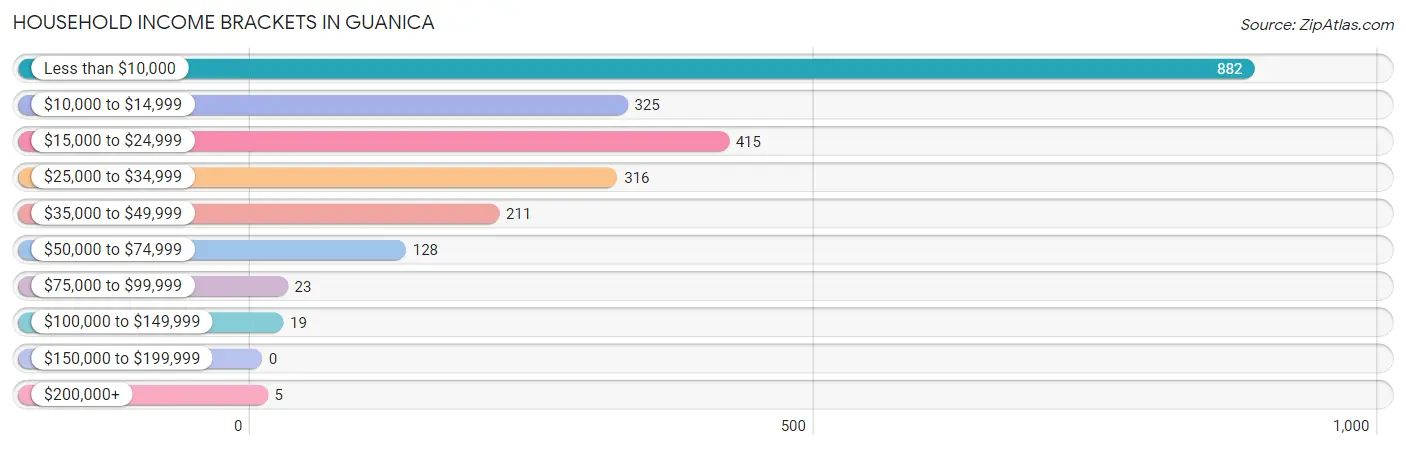
Household Income Brackets in Guanica
With 882 households falling in the category, the less than $10,000 income range is the most frequent in Guanica, accounting for 38.0% of all households.
| Income Bracket | # Households | % Households |
| Less than $10,000 | 882 | 38.0% |
| $10,000 to $14,999 | 325 | 14.0% |
| $15,000 to $24,999 | 415 | 17.9% |
| $25,000 to $34,999 | 316 | 13.6% |
| $35,000 to $49,999 | 211 | 9.1% |
| $50,000 to $74,999 | 128 | 5.5% |
| $75,000 to $99,999 | 23 | 1.0% |
| $100,000 to $149,999 | 19 | 0.8% |
| $150,000 to $199,999 | 0 | 0.0% |
| $200,000+ | 5 | 0.2% |
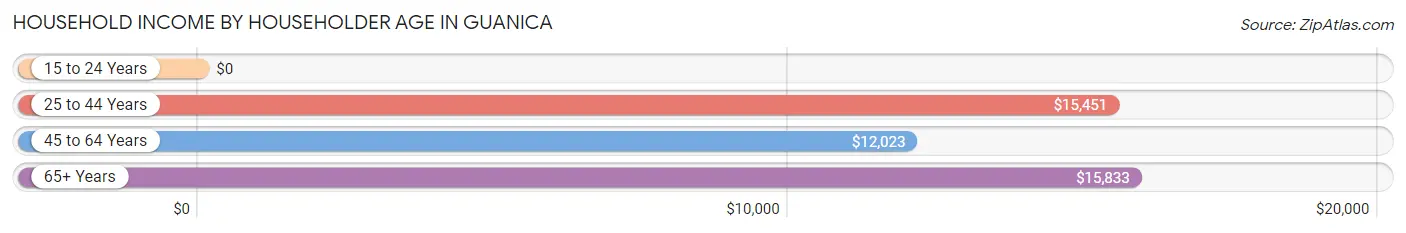
Household Income by Householder Age in Guanica
The median household income in Guanica is $14,017, with the highest median household income of $15,833 found in the 65+ years age bracket for the primary householder. A total of 1,122 households (48.4%) fall into this category. Meanwhile, the 15 to 24 years age bracket for the primary householder has the lowest median household income of $0, with 20 households (0.9%) in this group.
| Income Bracket | # Households | Median Income |
| 15 to 24 Years | 20 (0.9%) | $0 |
| 25 to 44 Years | 329 (14.2%) | $15,451 |
| 45 to 64 Years | 849 (36.6%) | $12,023 |
| 65+ Years | 1,122 (48.4%) | $15,833 |
| Total | 2,320 (100.0%) | $14,017 |
Poverty in Guanica
Income Below Poverty by Sex and Age in Guanica
With 65.2% poverty level for males and 64.7% for females among the residents of Guanica, 5 year old males and 6 to 11 year old females are the most vulnerable to poverty, with 42 males (100.0%) and 70 females (100.0%) in their respective age groups living below the poverty level.
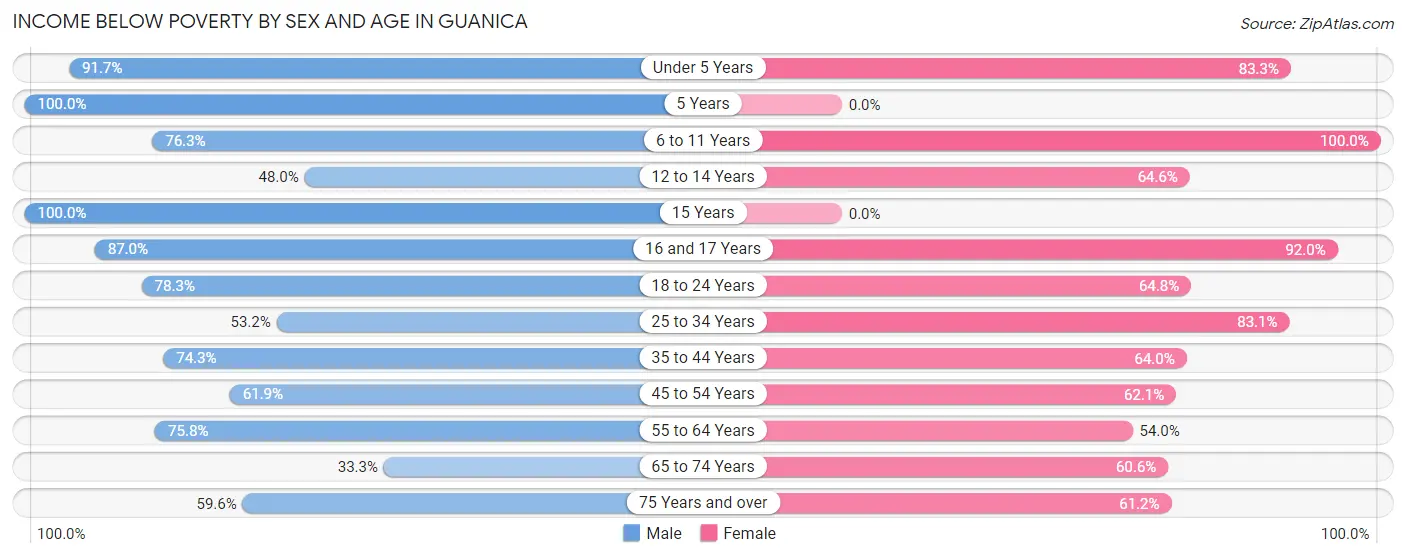
| Age Bracket | Male | Female |
| Under 5 Years | 100 (91.7%) | 95 (83.3%) |
| 5 Years | 42 (100.0%) | 0 (0.0%) |
| 6 to 11 Years | 148 (76.3%) | 70 (100.0%) |
| 12 to 14 Years | 86 (48.0%) | 82 (64.6%) |
| 15 Years | 22 (100.0%) | 0 (0.0%) |
| 16 and 17 Years | 60 (87.0%) | 46 (92.0%) |
| 18 to 24 Years | 155 (78.3%) | 223 (64.8%) |
| 25 to 34 Years | 107 (53.2%) | 152 (83.1%) |
| 35 to 44 Years | 271 (74.3%) | 135 (64.0%) |
| 45 to 54 Years | 195 (61.9%) | 242 (62.1%) |
| 55 to 64 Years | 275 (75.8%) | 204 (54.0%) |
| 65 to 74 Years | 100 (33.3%) | 235 (60.6%) |
| 75 Years and over | 262 (59.6%) | 274 (61.2%) |
| Total | 1,823 (65.2%) | 1,758 (64.7%) |
Income Above Poverty by Sex and Age in Guanica
According to the poverty statistics in Guanica, males aged 65 to 74 years and females aged 15 years are the age groups that are most secure financially, with 66.7% of males and 100.0% of females in these age groups living above the poverty line.
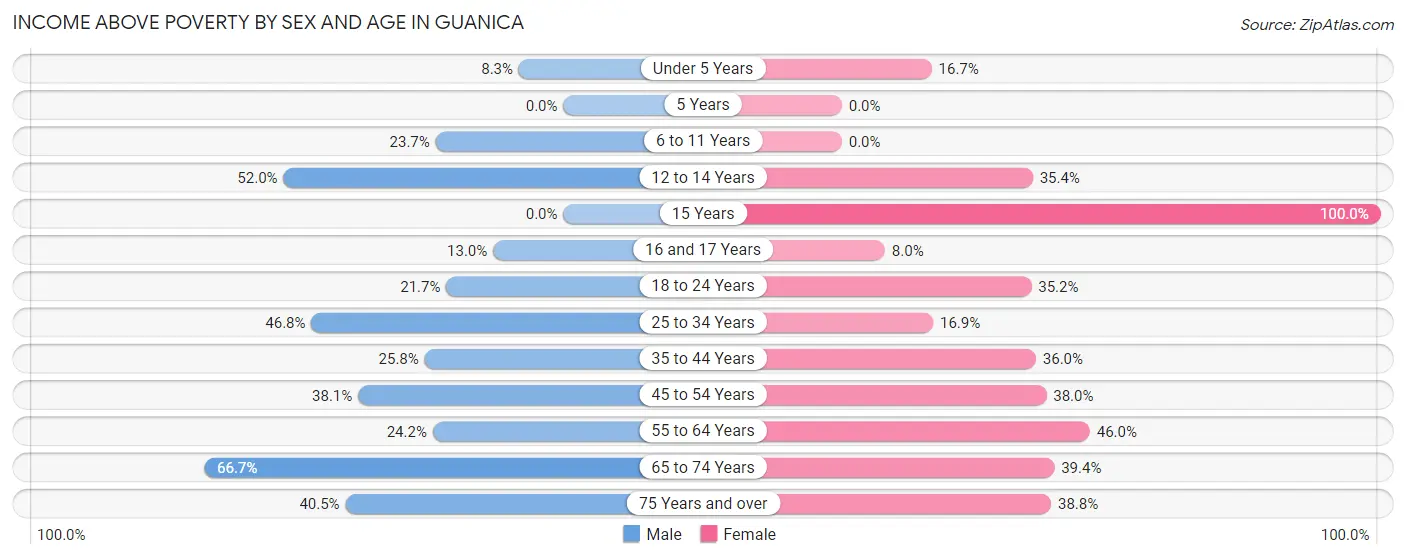
| Age Bracket | Male | Female |
| Under 5 Years | 9 (8.3%) | 19 (16.7%) |
| 5 Years | 0 (0.0%) | 0 (0.0%) |
| 6 to 11 Years | 46 (23.7%) | 0 (0.0%) |
| 12 to 14 Years | 93 (52.0%) | 45 (35.4%) |
| 15 Years | 0 (0.0%) | 16 (100.0%) |
| 16 and 17 Years | 9 (13.0%) | 4 (8.0%) |
| 18 to 24 Years | 43 (21.7%) | 121 (35.2%) |
| 25 to 34 Years | 94 (46.8%) | 31 (16.9%) |
| 35 to 44 Years | 94 (25.8%) | 76 (36.0%) |
| 45 to 54 Years | 120 (38.1%) | 148 (38.0%) |
| 55 to 64 Years | 88 (24.2%) | 174 (46.0%) |
| 65 to 74 Years | 200 (66.7%) | 153 (39.4%) |
| 75 Years and over | 178 (40.5%) | 174 (38.8%) |
| Total | 974 (34.8%) | 961 (35.3%) |
Income Below Poverty Among Married-Couple Families in Guanica
The poverty statistics for married-couple families in Guanica show that 51.2% or 418 of the total 817 families live below the poverty line. Families with 3 or 4 children have the highest poverty rate of 100.0%, comprising of 5 families. On the other hand, families with no children have the lowest poverty rate of 49.1%, which includes 316 families.
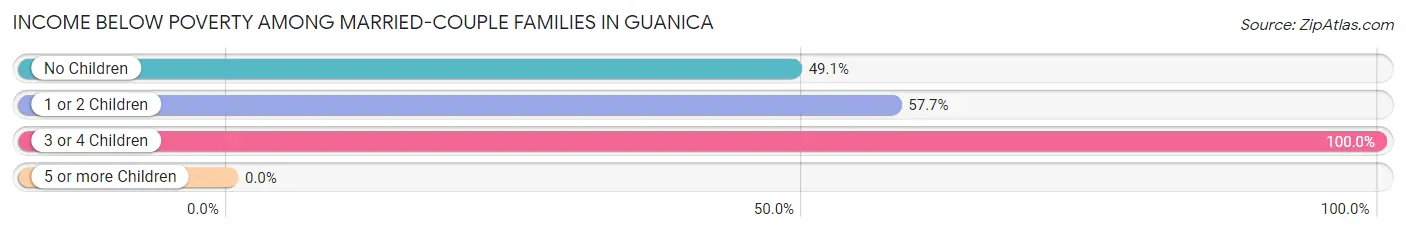
| Children | Above Poverty | Below Poverty |
| No Children | 328 (50.9%) | 316 (49.1%) |
| 1 or 2 Children | 71 (42.3%) | 97 (57.7%) |
| 3 or 4 Children | 0 (0.0%) | 5 (100.0%) |
| 5 or more Children | 0 (0.0%) | 0 (0.0%) |
| Total | 399 (48.8%) | 418 (51.2%) |
Income Below Poverty Among Single-Parent Households in Guanica
According to the poverty data in Guanica, 68.7% or 90 single-father households and 71.4% or 320 single-mother households are living below the poverty line. Among single-father households, those with 1 or 2 children have the highest poverty rate, with 35 households (79.5%) experiencing poverty. Likewise, among single-mother households, those with 3 or 4 children have the highest poverty rate, with 20 households (100.0%) falling below the poverty line.
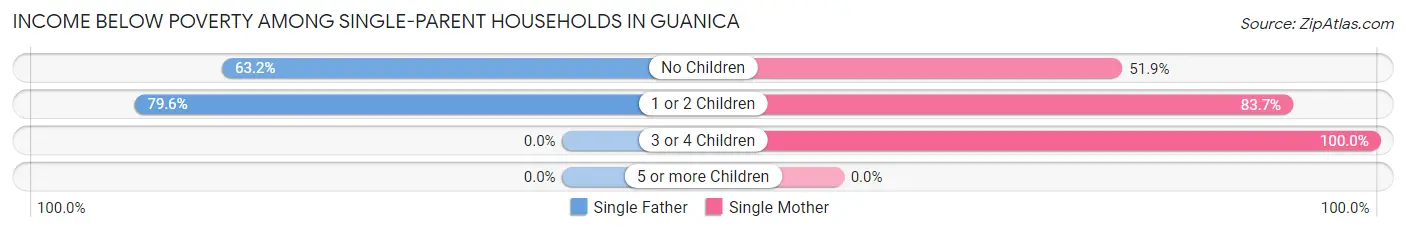
| Children | Single Father | Single Mother |
| No Children | 55 (63.2%) | 95 (51.9%) |
| 1 or 2 Children | 35 (79.5%) | 205 (83.7%) |
| 3 or 4 Children | 0 (0.0%) | 20 (100.0%) |
| 5 or more Children | 0 (0.0%) | 0 (0.0%) |
| Total | 90 (68.7%) | 320 (71.4%) |
Income Below Poverty Among Married-Couple vs Single-Parent Households in Guanica
The poverty data for Guanica shows that 418 of the married-couple family households (51.2%) and 410 of the single-parent households (70.8%) are living below the poverty level. Within the married-couple family households, those with 3 or 4 children have the highest poverty rate, with 5 households (100.0%) falling below the poverty line. Among the single-parent households, those with 3 or 4 children have the highest poverty rate, with 20 household (100.0%) living below poverty.
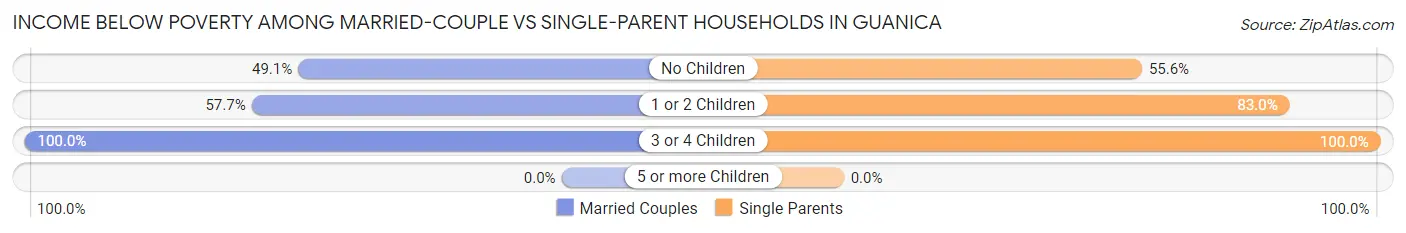
| Children | Married-Couple Families | Single-Parent Households |
| No Children | 316 (49.1%) | 150 (55.6%) |
| 1 or 2 Children | 97 (57.7%) | 240 (83.0%) |
| 3 or 4 Children | 5 (100.0%) | 20 (100.0%) |
| 5 or more Children | 0 (0.0%) | 0 (0.0%) |
| Total | 418 (51.2%) | 410 (70.8%) |
Race in Guanica
The most populous races in Guanica are Hispanic or Latino (5,449 | 98.8%), White / Caucasian (3,161 | 57.3%), and Some other Race (1,847 | 33.5%).
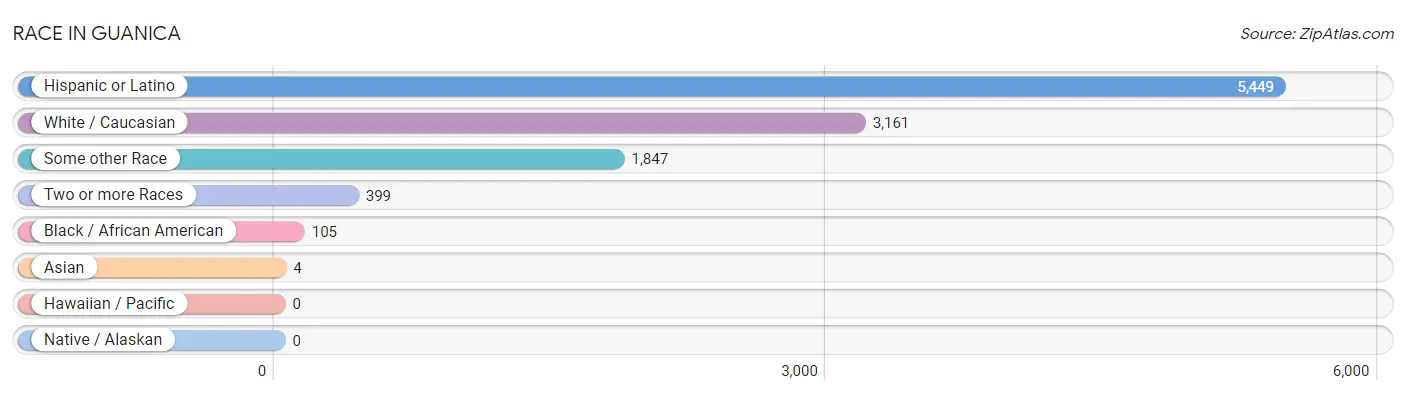
| Race | # Population | % Population |
| Asian | 4 | 0.1% |
| Black / African American | 105 | 1.9% |
| Hawaiian / Pacific | 0 | 0.0% |
| Hispanic or Latino | 5,449 | 98.8% |
| Native / Alaskan | 0 | 0.0% |
| White / Caucasian | 3,161 | 57.3% |
| Two or more Races | 399 | 7.2% |
| Some other Race | 1,847 | 33.5% |
| Total | 5,516 | 100.0% |
Ancestry in Guanica
The most populous ancestries reported in Guanica are Puerto Rican (5,438 | 98.6%), Bhutanese (27 | 0.5%), African (18 | 0.3%), Subsaharan African (18 | 0.3%), and Burmese (13 | 0.2%), together accounting for 100.0% of all Guanica residents.
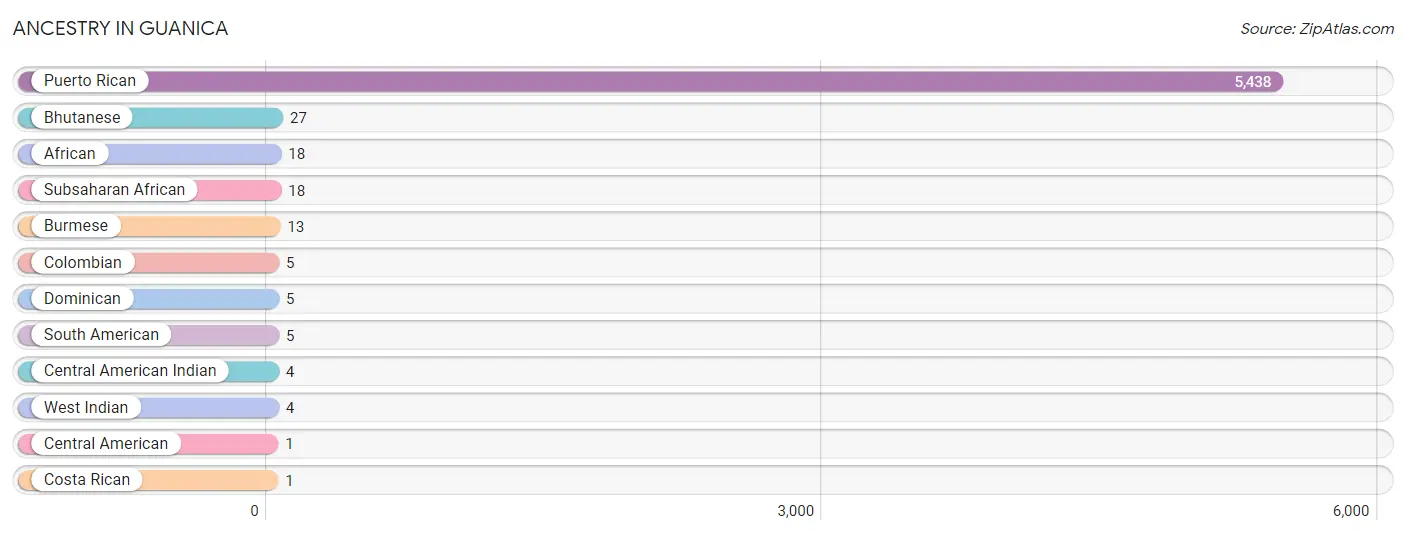
| Ancestry | # Population | % Population |
| African | 18 | 0.3% |
| Bhutanese | 27 | 0.5% |
| Burmese | 13 | 0.2% |
| Central American | 1 | 0.0% |
| Central American Indian | 4 | 0.1% |
| Colombian | 5 | 0.1% |
| Costa Rican | 1 | 0.0% |
| Dominican | 5 | 0.1% |
| Puerto Rican | 5,438 | 98.6% |
| South American | 5 | 0.1% |
| Subsaharan African | 18 | 0.3% |
| West Indian | 4 | 0.1% | View All 12 Rows |
Immigrants in Guanica

| Immigration Origin | # Population | % Population | View All 0 Rows |
Sex and Age in Guanica
Sex and Age in Guanica
The most populous age groups in Guanica are 10 to 14 Years (324 | 11.6%) for men and 20 to 24 Years (279 | 10.3%) for women.
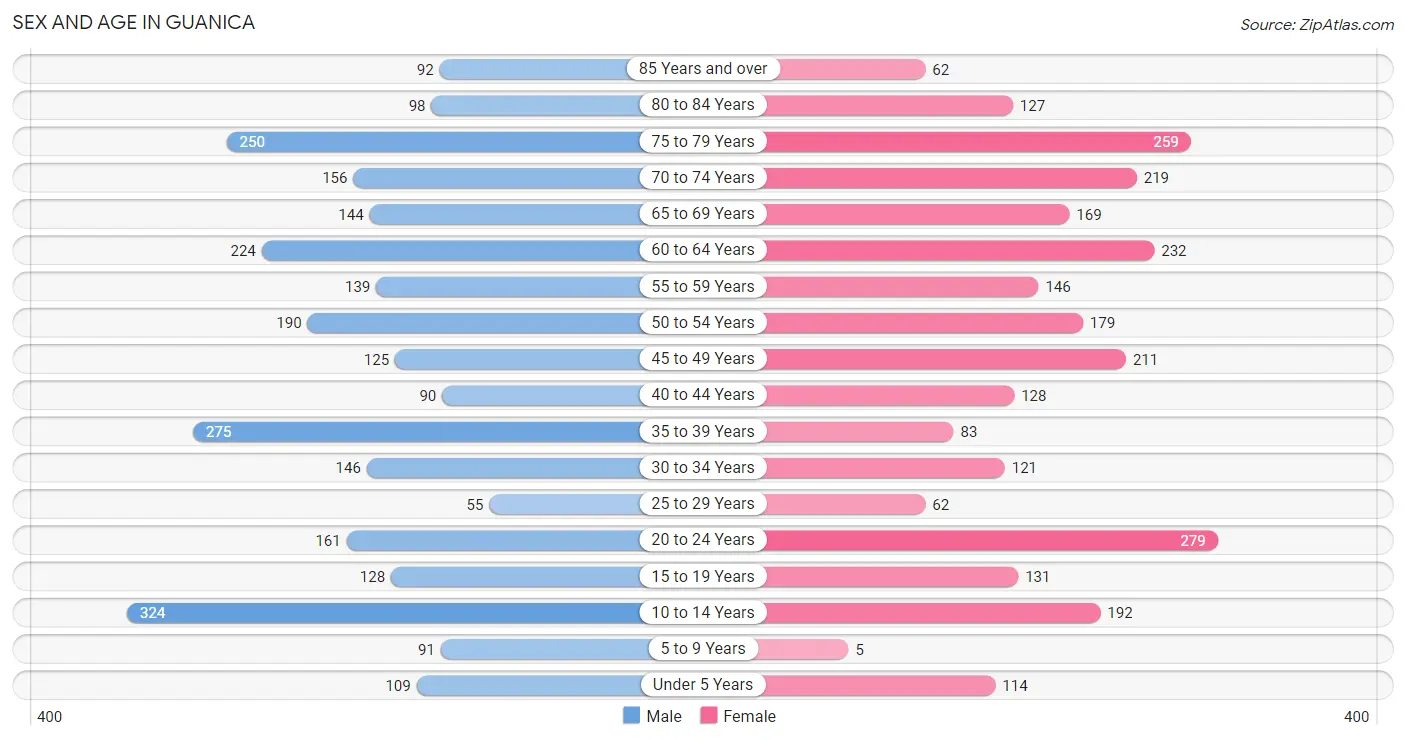
| Age Bracket | Male | Female |
| Under 5 Years | 109 (3.9%) | 114 (4.2%) |
| 5 to 9 Years | 91 (3.3%) | 5 (0.2%) |
| 10 to 14 Years | 324 (11.6%) | 192 (7.1%) |
| 15 to 19 Years | 128 (4.6%) | 131 (4.8%) |
| 20 to 24 Years | 161 (5.8%) | 279 (10.3%) |
| 25 to 29 Years | 55 (2.0%) | 62 (2.3%) |
| 30 to 34 Years | 146 (5.2%) | 121 (4.4%) |
| 35 to 39 Years | 275 (9.8%) | 83 (3.0%) |
| 40 to 44 Years | 90 (3.2%) | 128 (4.7%) |
| 45 to 49 Years | 125 (4.5%) | 211 (7.8%) |
| 50 to 54 Years | 190 (6.8%) | 179 (6.6%) |
| 55 to 59 Years | 139 (5.0%) | 146 (5.4%) |
| 60 to 64 Years | 224 (8.0%) | 232 (8.5%) |
| 65 to 69 Years | 144 (5.1%) | 169 (6.2%) |
| 70 to 74 Years | 156 (5.6%) | 219 (8.1%) |
| 75 to 79 Years | 250 (8.9%) | 259 (9.5%) |
| 80 to 84 Years | 98 (3.5%) | 127 (4.7%) |
| 85 Years and over | 92 (3.3%) | 62 (2.3%) |
| Total | 2,797 (100.0%) | 2,719 (100.0%) |
Families and Households in Guanica
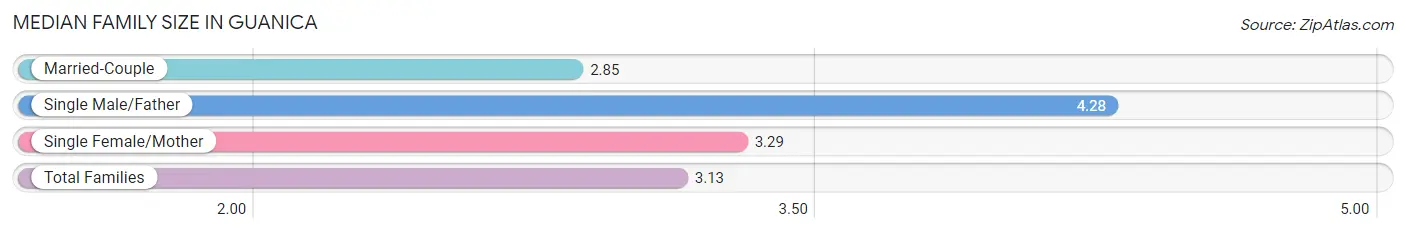
Median Family Size in Guanica
The median family size in Guanica is 3.13 persons per family, with single male/father families (131 | 9.4%) accounting for the largest median family size of 4.28 persons per family. On the other hand, married-couple families (817 | 58.5%) represent the smallest median family size with 2.85 persons per family.
| Family Type | # Families | Family Size |
| Married-Couple | 817 (58.5%) | 2.85 |
| Single Male/Father | 131 (9.4%) | 4.28 |
| Single Female/Mother | 448 (32.1%) | 3.29 |
| Total Families | 1,396 (100.0%) | 3.13 |
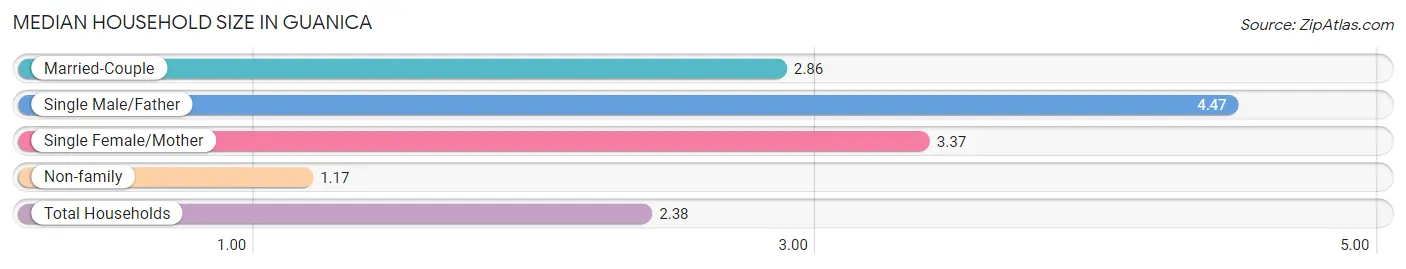
Median Household Size in Guanica
The median household size in Guanica is 2.38 persons per household, with single male/father households (131 | 5.7%) accounting for the largest median household size of 4.47 persons per household. non-family households (924 | 39.8%) represent the smallest median household size with 1.17 persons per household.
| Household Type | # Households | Household Size |
| Married-Couple | 817 (35.2%) | 2.86 |
| Single Male/Father | 131 (5.7%) | 4.47 |
| Single Female/Mother | 448 (19.3%) | 3.37 |
| Non-family | 924 (39.8%) | 1.17 |
| Total Households | 2,320 (100.0%) | 2.38 |
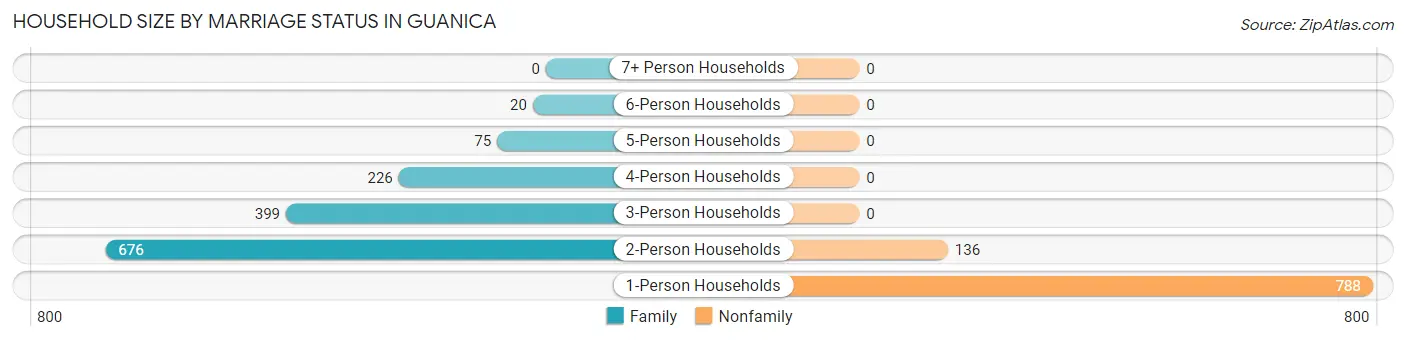
Household Size by Marriage Status in Guanica
Out of a total of 2,320 households in Guanica, 1,396 (60.2%) are family households, while 924 (39.8%) are nonfamily households. The most numerous type of family households are 2-person households, comprising 676, and the most common type of nonfamily households are 1-person households, comprising 788.
| Household Size | Family Households | Nonfamily Households |
| 1-Person Households | - | 788 (34.0%) |
| 2-Person Households | 676 (29.1%) | 136 (5.9%) |
| 3-Person Households | 399 (17.2%) | 0 (0.0%) |
| 4-Person Households | 226 (9.7%) | 0 (0.0%) |
| 5-Person Households | 75 (3.2%) | 0 (0.0%) |
| 6-Person Households | 20 (0.9%) | 0 (0.0%) |
| 7+ Person Households | 0 (0.0%) | 0 (0.0%) |
| Total | 1,396 (60.2%) | 924 (39.8%) |
Female Fertility in Guanica
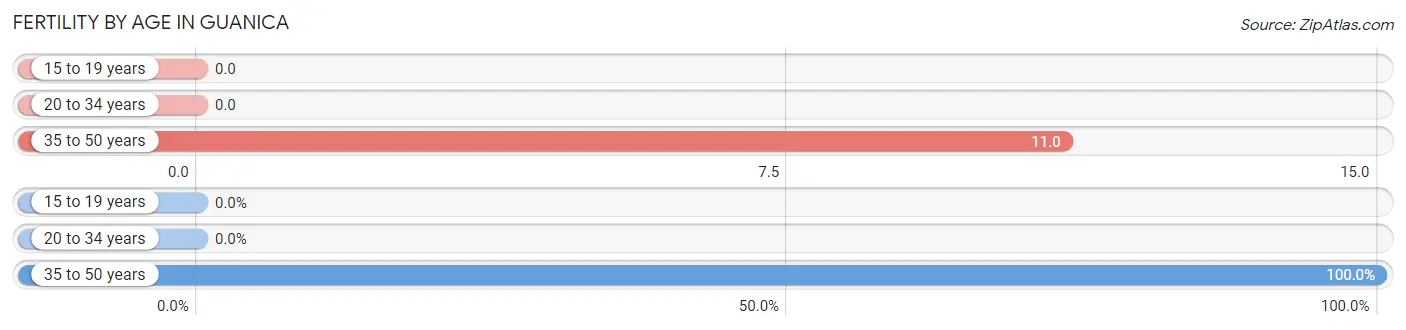
Fertility by Age in Guanica
Average fertility rate in Guanica is 5.0 births per 1,000 women. Women in the age bracket of 35 to 50 years have the highest fertility rate with 11.0 births per 1,000 women. Women in the age bracket of 35 to 50 years acount for 100.0% of all women with births.
| Age Bracket | Women with Births | Births / 1,000 Women |
| 15 to 19 years | 0 (0.0%) | 0.0 |
| 20 to 34 years | 0 (0.0%) | 0.0 |
| 35 to 50 years | 5 (100.0%) | 11.0 |
| Total | 5 (100.0%) | 5.0 |
Fertility by Age by Marriage Status in Guanica
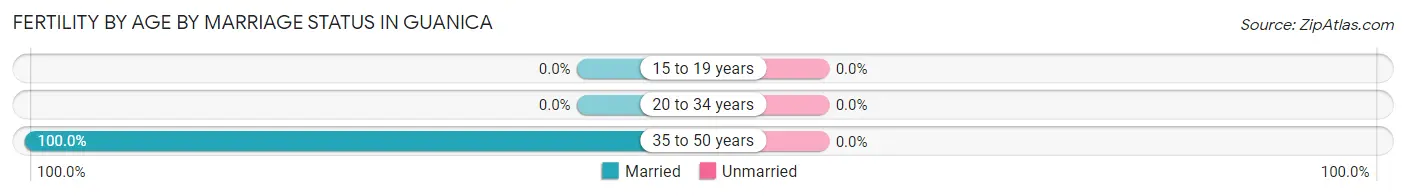
| Age Bracket | Married | Unmarried |
| 15 to 19 years | 0 (0.0%) | 0 (0.0%) |
| 20 to 34 years | 0 (0.0%) | 0 (0.0%) |
| 35 to 50 years | 5 (100.0%) | 0 (0.0%) |
| Total | 5 (100.0%) | 0 (0.0%) |
Fertility by Education in Guanica
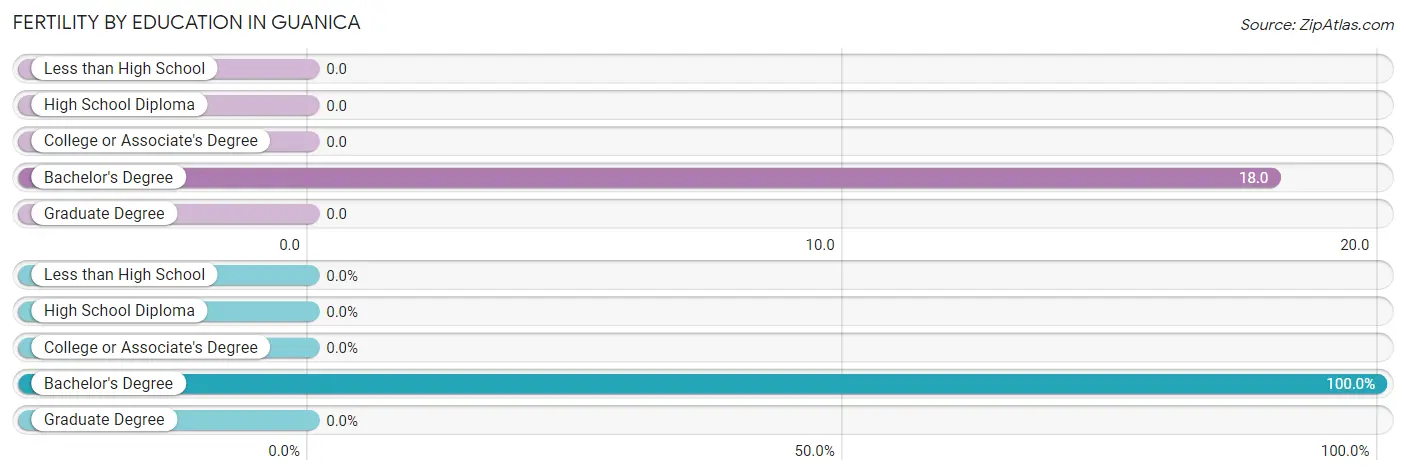
| Educational Attainment | Women with Births | Births / 1,000 Women |
| Less than High School | 0 (0.0%) | 0.0 |
| High School Diploma | 0 (0.0%) | 0.0 |
| College or Associate's Degree | 0 (0.0%) | 0.0 |
| Bachelor's Degree | 5 (100.0%) | 18.0 |
| Graduate Degree | 0 (0.0%) | 0.0 |
| Total | 5 (100.0%) | 5.0 |
Fertility by Education by Marriage Status in Guanica
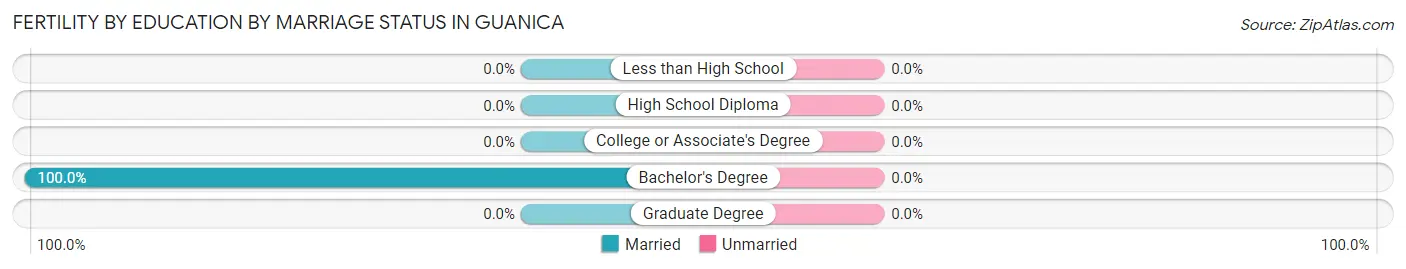
| Educational Attainment | Married | Unmarried |
| Less than High School | 0 (0.0%) | 0 (0.0%) |
| High School Diploma | 0 (0.0%) | 0 (0.0%) |
| College or Associate's Degree | 0 (0.0%) | 0 (0.0%) |
| Bachelor's Degree | 5 (100.0%) | 0 (0.0%) |
| Graduate Degree | 0 (0.0%) | 0 (0.0%) |
| Total | 5 (100.0%) | 0 (0.0%) |
Employment Characteristics in Guanica
Employment by Class of Employer in Guanica
Among the 1,098 employed individuals in Guanica, private company employees (671 | 61.1%), state government employees (224 | 20.4%), and self-employed (not incorporated) (66 | 6.0%) make up the most common classes of employment.
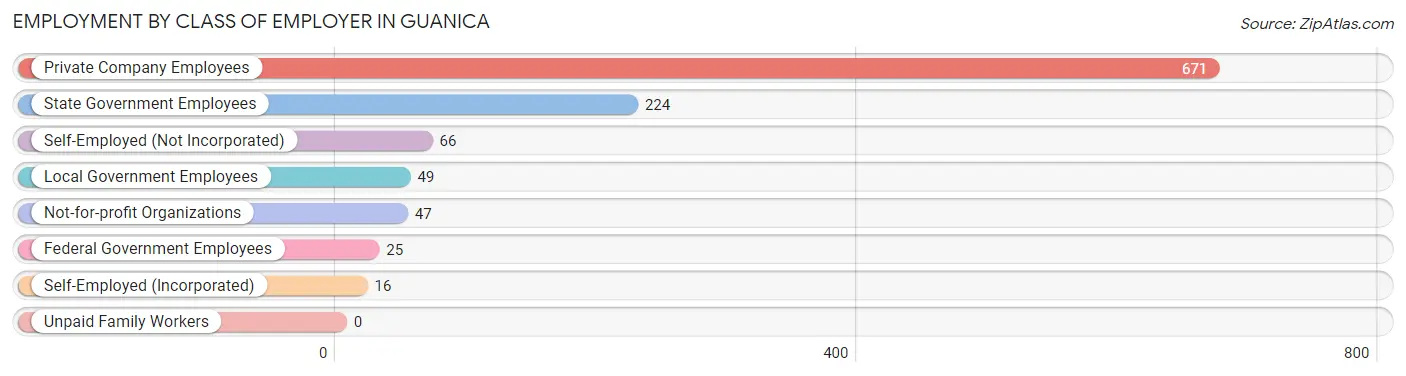
| Employer Class | # Employees | % Employees |
| Private Company Employees | 671 | 61.1% |
| Self-Employed (Incorporated) | 16 | 1.5% |
| Self-Employed (Not Incorporated) | 66 | 6.0% |
| Not-for-profit Organizations | 47 | 4.3% |
| Local Government Employees | 49 | 4.5% |
| State Government Employees | 224 | 20.4% |
| Federal Government Employees | 25 | 2.3% |
| Unpaid Family Workers | 0 | 0.0% |
| Total | 1,098 | 100.0% |
Employment Status by Age in Guanica
According to the labor force statistics for Guanica, out of the total population over 16 years of age (4,643), 33.7% or 1,565 individuals are in the labor force, with 29.1% or 455 of them unemployed. The age group with the highest labor force participation rate is 35 to 44 years, with 74.8% or 431 individuals in the labor force. Within the labor force, the 16 to 19 years age range has the highest percentage of unemployed individuals, with 100.0% or 18 of them being unemployed.
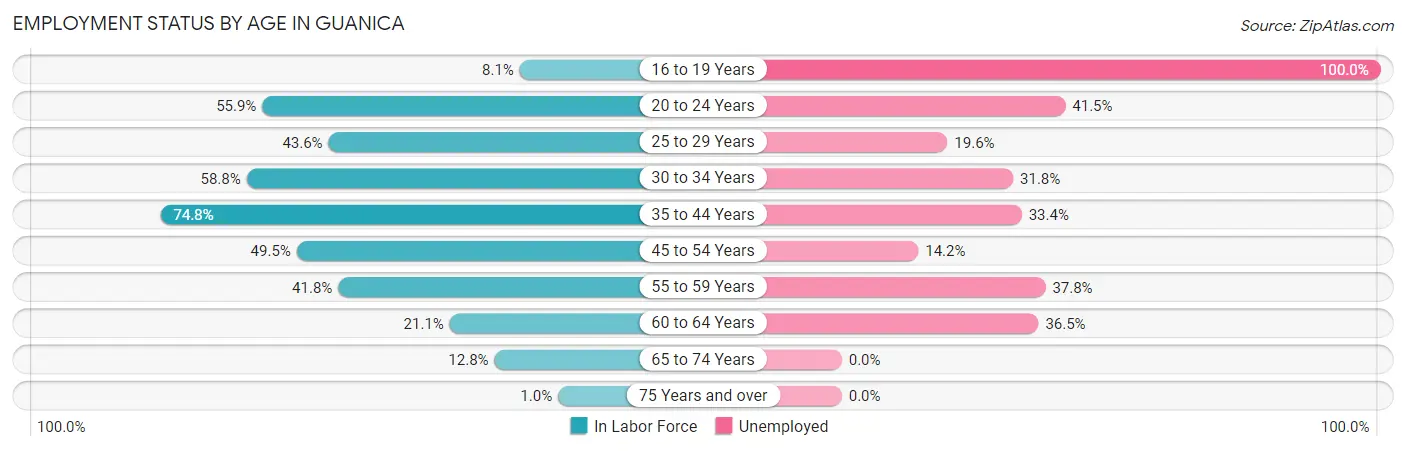
| Age Bracket | In Labor Force | Unemployed |
| 16 to 19 Years | 18 (8.1%) | 18 (100.0%) |
| 20 to 24 Years | 246 (55.9%) | 102 (41.5%) |
| 25 to 29 Years | 51 (43.6%) | 10 (19.6%) |
| 30 to 34 Years | 157 (58.8%) | 50 (31.8%) |
| 35 to 44 Years | 431 (74.8%) | 144 (33.4%) |
| 45 to 54 Years | 349 (49.5%) | 50 (14.2%) |
| 55 to 59 Years | 119 (41.8%) | 45 (37.8%) |
| 60 to 64 Years | 96 (21.1%) | 35 (36.5%) |
| 65 to 74 Years | 88 (12.8%) | 0 (0.0%) |
| 75 Years and over | 9 (1.0%) | 0 (0.0%) |
| Total | 1,565 (33.7%) | 455 (29.1%) |
Employment Status by Educational Attainment in Guanica
According to labor force statistics for Guanica, 50.0% of individuals (1,203) out of the total population between 25 and 64 years of age (2,406) are in the labor force, with 27.8% or 334 of them being unemployed. The group with the highest labor force participation rate are those with the educational attainment of college / associate degree, with 71.2% or 418 individuals in the labor force. Within the labor force, individuals with less than high school education have the highest percentage of unemployment, with 54.7% or 76 of them being unemployed.
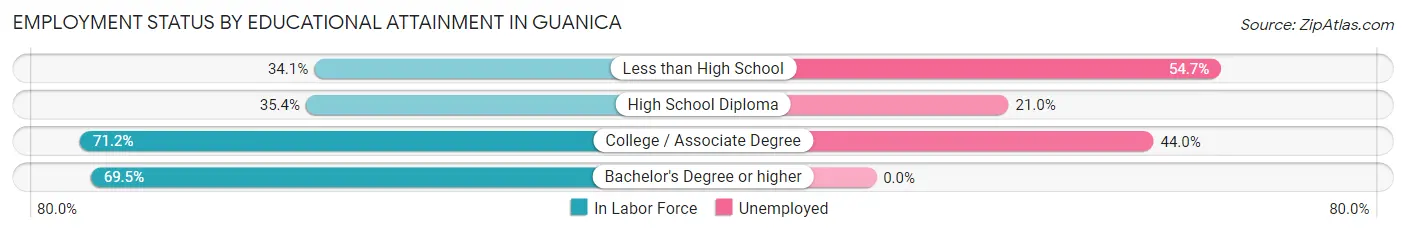
| Educational Attainment | In Labor Force | Unemployed |
| Less than High School | 139 (34.1%) | 223 (54.7%) |
| High School Diploma | 348 (35.4%) | 206 (21.0%) |
| College / Associate Degree | 418 (71.2%) | 258 (44.0%) |
| Bachelor's Degree or higher | 298 (69.5%) | 0 (0.0%) |
| Total | 1,203 (50.0%) | 669 (27.8%) |
Employment Occupations by Sex in Guanica
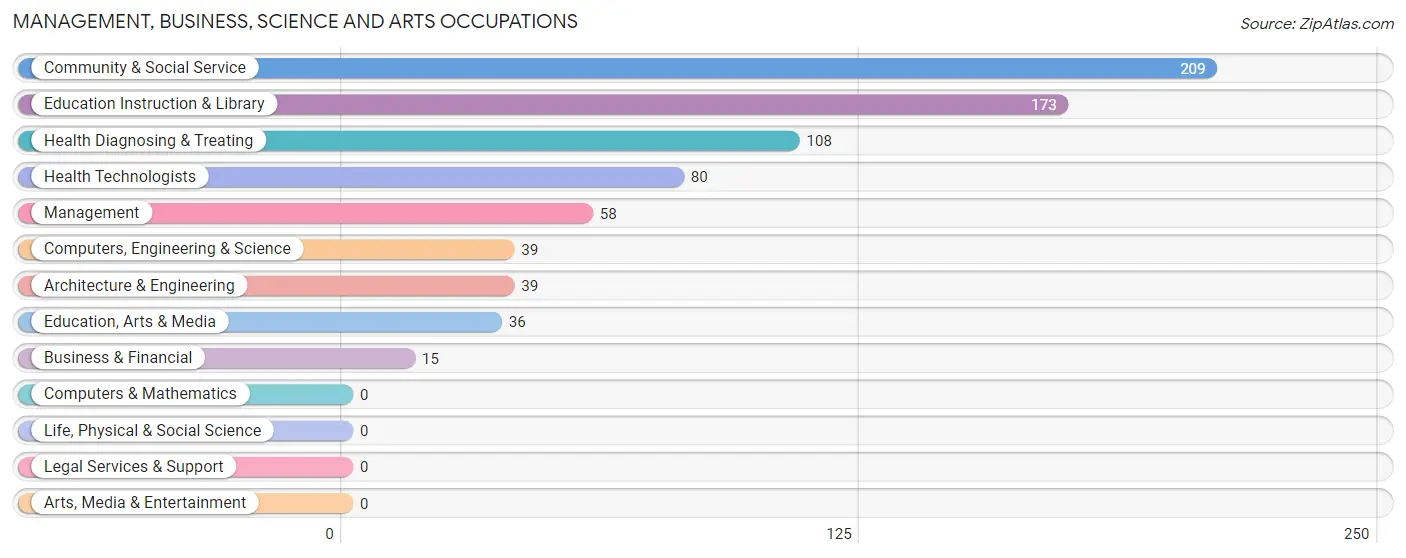
Management, Business, Science and Arts Occupations
The most common Management, Business, Science and Arts occupations in Guanica are Community & Social Service (209 | 18.9%), Education Instruction & Library (173 | 15.6%), Health Diagnosing & Treating (108 | 9.8%), Health Technologists (80 | 7.2%), and Management (58 | 5.2%).
Management, Business, Science and Arts Occupations by Sex
Within the Management, Business, Science and Arts occupations in Guanica, the most male-oriented occupations are Education, Arts & Media (100.0%), Management (75.9%), and Computers, Engineering & Science (43.6%), while the most female-oriented occupations are Health Technologists (100.0%), Education Instruction & Library (87.9%), and Health Diagnosing & Treating (78.7%).
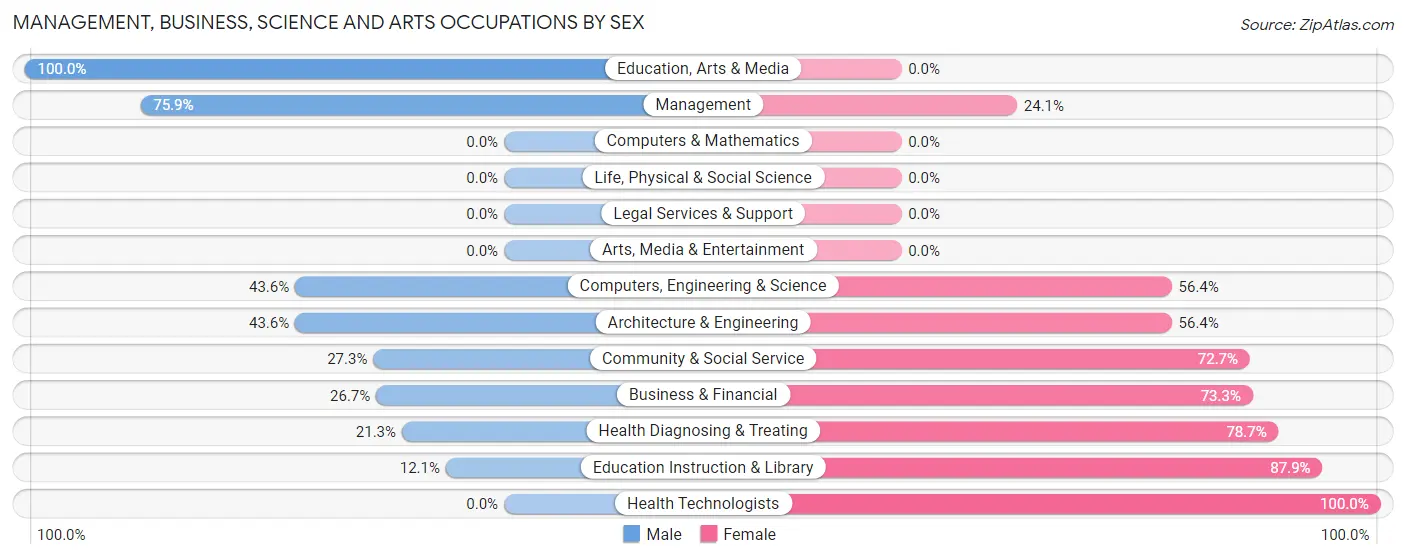
| Occupation | Male | Female |
| Management | 44 (75.9%) | 14 (24.1%) |
| Business & Financial | 4 (26.7%) | 11 (73.3%) |
| Computers, Engineering & Science | 17 (43.6%) | 22 (56.4%) |
| Computers & Mathematics | 0 (0.0%) | 0 (0.0%) |
| Architecture & Engineering | 17 (43.6%) | 22 (56.4%) |
| Life, Physical & Social Science | 0 (0.0%) | 0 (0.0%) |
| Community & Social Service | 57 (27.3%) | 152 (72.7%) |
| Education, Arts & Media | 36 (100.0%) | 0 (0.0%) |
| Legal Services & Support | 0 (0.0%) | 0 (0.0%) |
| Education Instruction & Library | 21 (12.1%) | 152 (87.9%) |
| Arts, Media & Entertainment | 0 (0.0%) | 0 (0.0%) |
| Health Diagnosing & Treating | 23 (21.3%) | 85 (78.7%) |
| Health Technologists | 0 (0.0%) | 80 (100.0%) |
| Total (Category) | 145 (33.8%) | 284 (66.2%) |
| Total (Overall) | 604 (54.6%) | 502 (45.4%) |
Services Occupations
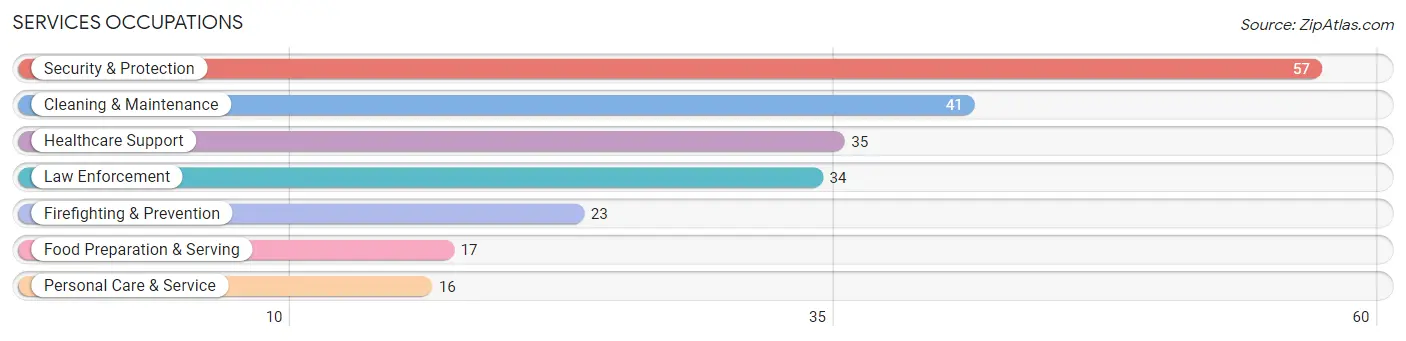
The most common Services occupations in Guanica are Security & Protection (57 | 5.1%), Cleaning & Maintenance (41 | 3.7%), Healthcare Support (35 | 3.2%), Law Enforcement (34 | 3.1%), and Firefighting & Prevention (23 | 2.1%).
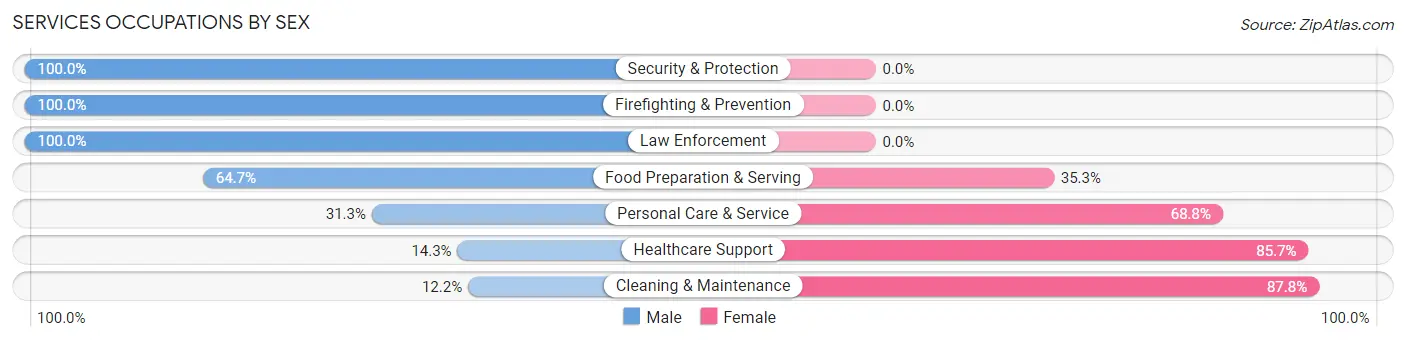
Services Occupations by Sex
Within the Services occupations in Guanica, the most male-oriented occupations are Security & Protection (100.0%), Firefighting & Prevention (100.0%), and Law Enforcement (100.0%), while the most female-oriented occupations are Cleaning & Maintenance (87.8%), Healthcare Support (85.7%), and Personal Care & Service (68.8%).
| Occupation | Male | Female |
| Healthcare Support | 5 (14.3%) | 30 (85.7%) |
| Security & Protection | 57 (100.0%) | 0 (0.0%) |
| Firefighting & Prevention | 23 (100.0%) | 0 (0.0%) |
| Law Enforcement | 34 (100.0%) | 0 (0.0%) |
| Food Preparation & Serving | 11 (64.7%) | 6 (35.3%) |
| Cleaning & Maintenance | 5 (12.2%) | 36 (87.8%) |
| Personal Care & Service | 5 (31.2%) | 11 (68.8%) |
| Total (Category) | 83 (50.0%) | 83 (50.0%) |
| Total (Overall) | 604 (54.6%) | 502 (45.4%) |
Sales and Office Occupations
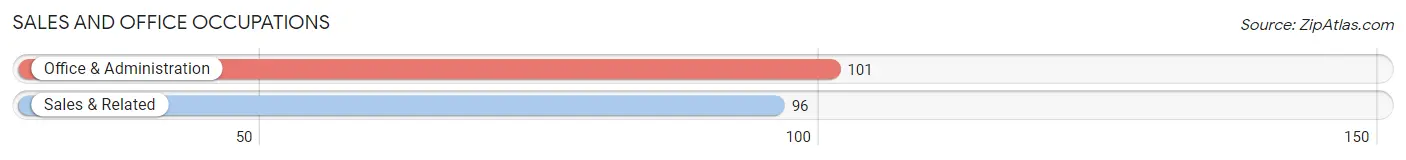
The most common Sales and Office occupations in Guanica are Office & Administration (101 | 9.1%), and Sales & Related (96 | 8.7%).
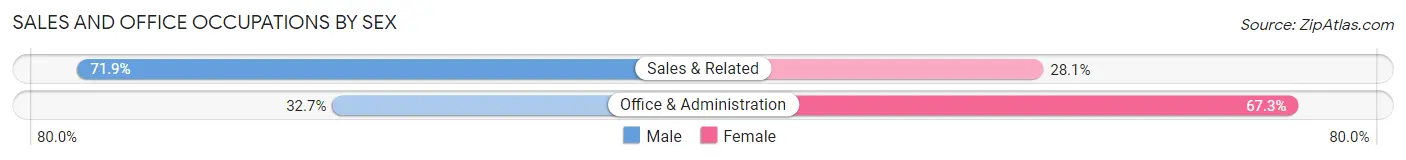
Sales and Office Occupations by Sex
| Occupation | Male | Female |
| Sales & Related | 69 (71.9%) | 27 (28.1%) |
| Office & Administration | 33 (32.7%) | 68 (67.3%) |
| Total (Category) | 102 (51.8%) | 95 (48.2%) |
| Total (Overall) | 604 (54.6%) | 502 (45.4%) |
Natural Resources, Construction and Maintenance Occupations
The most common Natural Resources, Construction and Maintenance occupations in Guanica are Installation, Maintenance & Repair (78 | 7.0%), Construction & Extraction (38 | 3.4%), and Farming, Fishing & Forestry (21 | 1.9%).
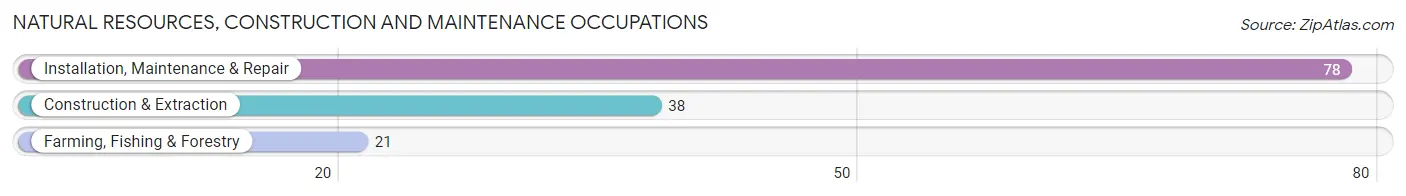
Natural Resources, Construction and Maintenance Occupations by Sex
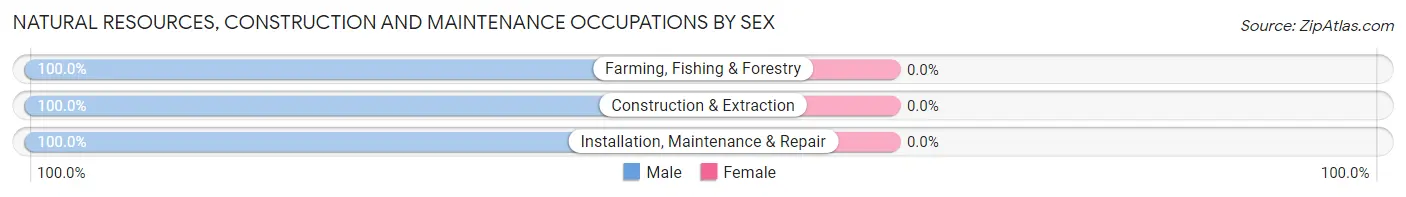
| Occupation | Male | Female |
| Farming, Fishing & Forestry | 21 (100.0%) | 0 (0.0%) |
| Construction & Extraction | 38 (100.0%) | 0 (0.0%) |
| Installation, Maintenance & Repair | 78 (100.0%) | 0 (0.0%) |
| Total (Category) | 137 (100.0%) | 0 (0.0%) |
| Total (Overall) | 604 (54.6%) | 502 (45.4%) |
Production, Transportation and Moving Occupations
The most common Production, Transportation and Moving occupations in Guanica are Production (111 | 10.0%), Material Moving (57 | 5.1%), and Transportation (9 | 0.8%).

Production, Transportation and Moving Occupations by Sex
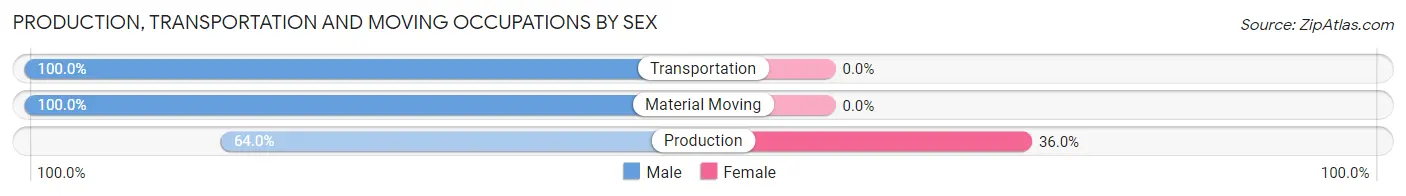
| Occupation | Male | Female |
| Production | 71 (64.0%) | 40 (36.0%) |
| Transportation | 9 (100.0%) | 0 (0.0%) |
| Material Moving | 57 (100.0%) | 0 (0.0%) |
| Total (Category) | 137 (77.4%) | 40 (22.6%) |
| Total (Overall) | 604 (54.6%) | 502 (45.4%) |
Employment Industries by Sex in Guanica
Employment Industries in Guanica
The major employment industries in Guanica include Educational Services (195 | 17.6%), Health Care & Social Assistance (187 | 16.9%), Manufacturing (150 | 13.6%), Retail Trade (133 | 12.0%), and Public Administration (79 | 7.1%).
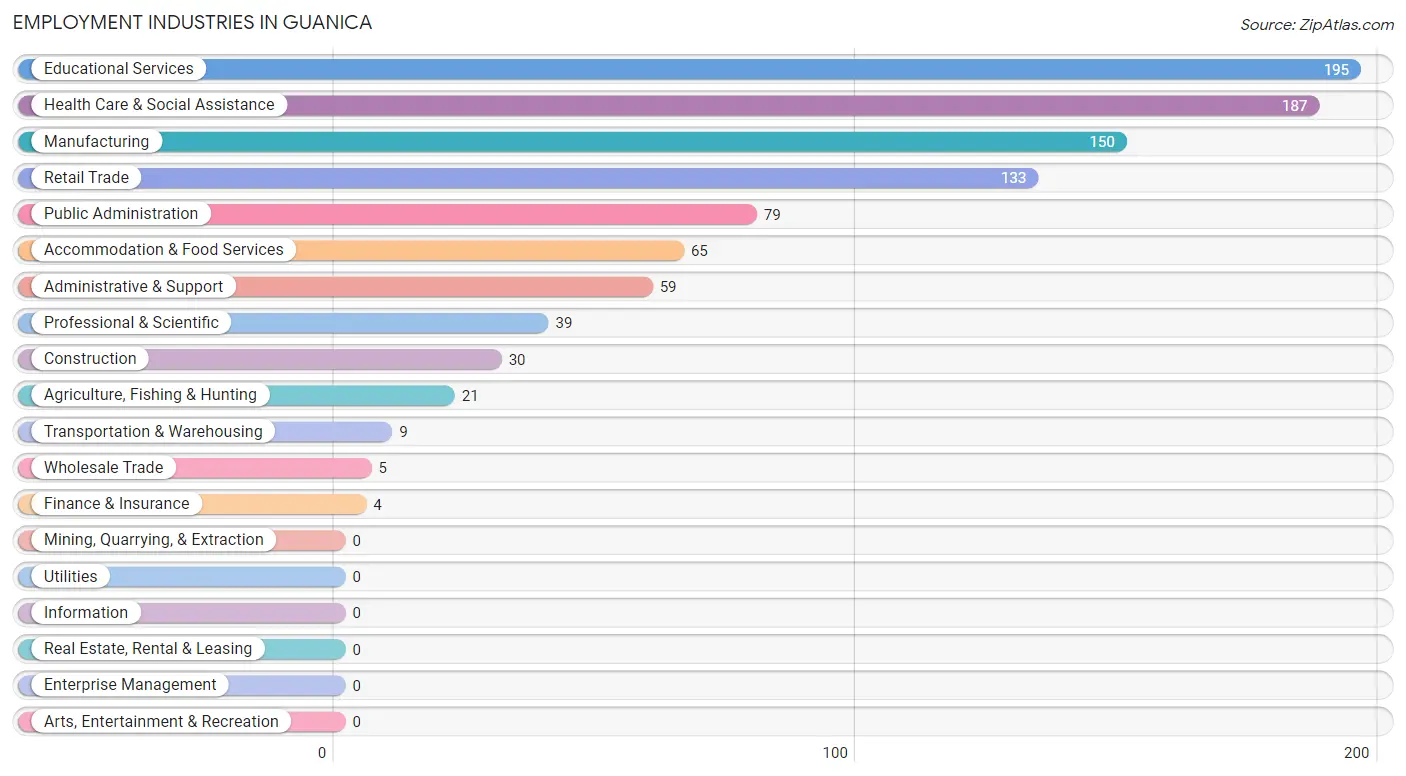
Employment Industries by Sex in Guanica
The Guanica industries that see more men than women are Agriculture, Fishing & Hunting (100.0%), Construction (100.0%), and Retail Trade (100.0%), whereas the industries that tend to have a higher number of women are Wholesale Trade (100.0%), Educational Services (86.7%), and Health Care & Social Assistance (75.9%).
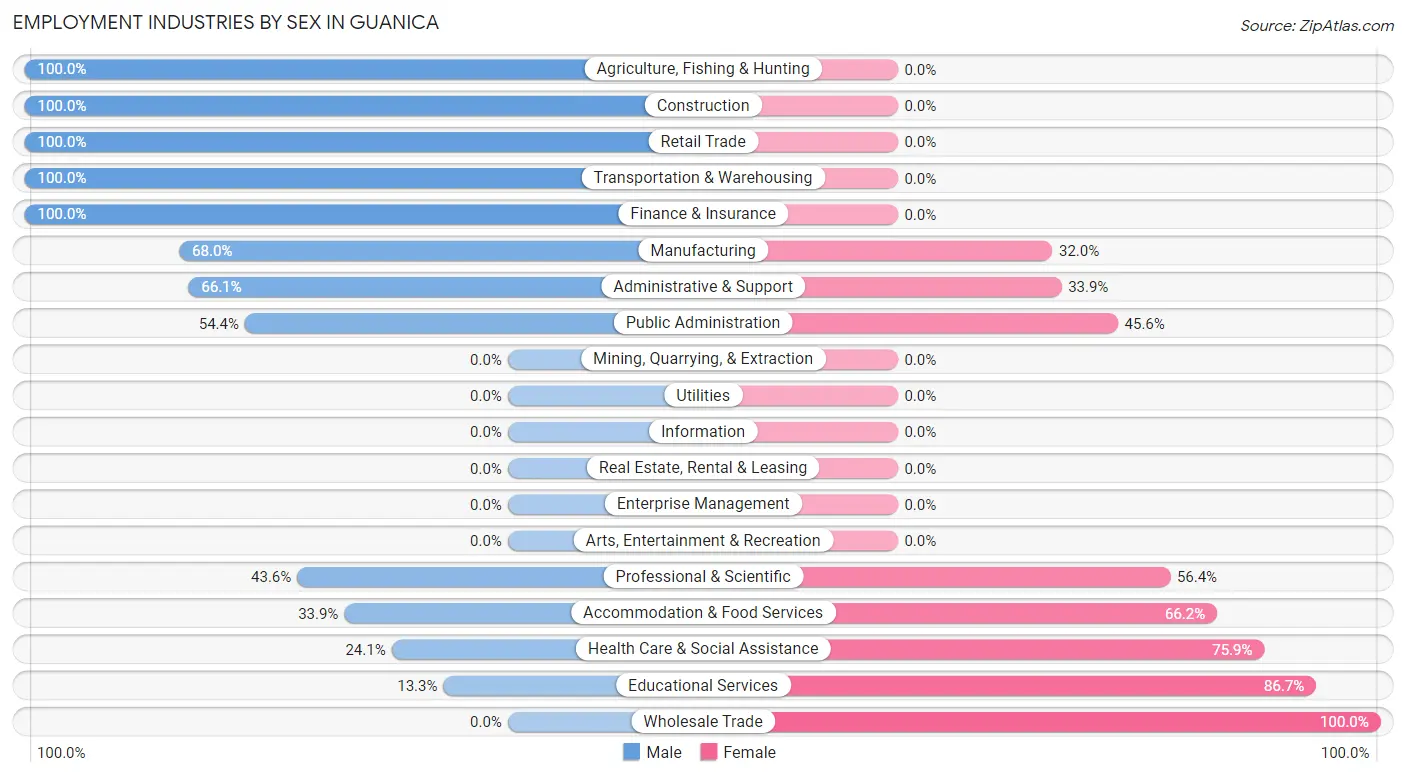
| Industry | Male | Female |
| Agriculture, Fishing & Hunting | 21 (100.0%) | 0 (0.0%) |
| Mining, Quarrying, & Extraction | 0 (0.0%) | 0 (0.0%) |
| Construction | 30 (100.0%) | 0 (0.0%) |
| Manufacturing | 102 (68.0%) | 48 (32.0%) |
| Wholesale Trade | 0 (0.0%) | 5 (100.0%) |
| Retail Trade | 133 (100.0%) | 0 (0.0%) |
| Transportation & Warehousing | 9 (100.0%) | 0 (0.0%) |
| Utilities | 0 (0.0%) | 0 (0.0%) |
| Information | 0 (0.0%) | 0 (0.0%) |
| Finance & Insurance | 4 (100.0%) | 0 (0.0%) |
| Real Estate, Rental & Leasing | 0 (0.0%) | 0 (0.0%) |
| Professional & Scientific | 17 (43.6%) | 22 (56.4%) |
| Enterprise Management | 0 (0.0%) | 0 (0.0%) |
| Administrative & Support | 39 (66.1%) | 20 (33.9%) |
| Educational Services | 26 (13.3%) | 169 (86.7%) |
| Health Care & Social Assistance | 45 (24.1%) | 142 (75.9%) |
| Arts, Entertainment & Recreation | 0 (0.0%) | 0 (0.0%) |
| Accommodation & Food Services | 22 (33.9%) | 43 (66.1%) |
| Public Administration | 43 (54.4%) | 36 (45.6%) |
| Total | 604 (54.6%) | 502 (45.4%) |
Education in Guanica
School Enrollment in Guanica
The most common levels of schooling among the 1,195 students in Guanica are middle school (346 | 28.9%), college / undergraduate (312 | 26.1%), and high school (282 | 23.6%).
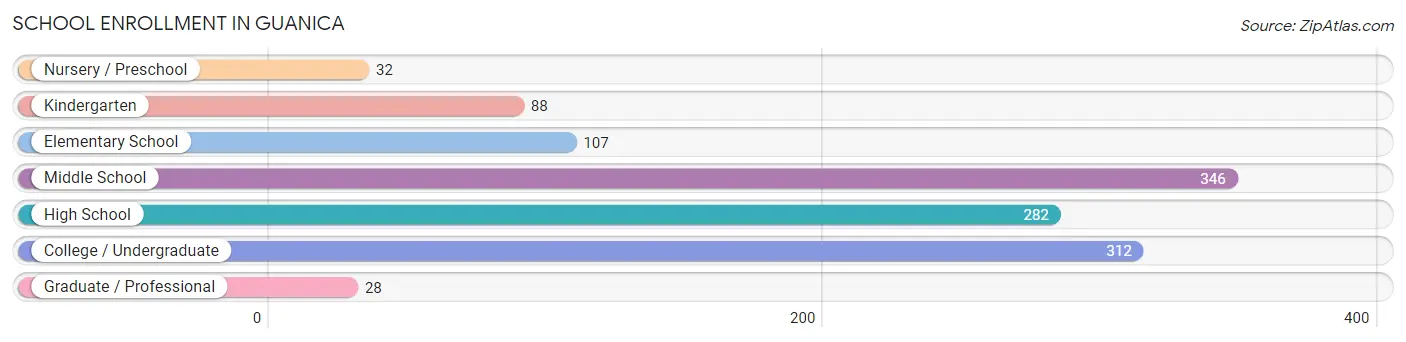
| School Level | # Students | % Students |
| Nursery / Preschool | 32 | 2.7% |
| Kindergarten | 88 | 7.4% |
| Elementary School | 107 | 8.9% |
| Middle School | 346 | 28.9% |
| High School | 282 | 23.6% |
| College / Undergraduate | 312 | 26.1% |
| Graduate / Professional | 28 | 2.3% |
| Total | 1,195 | 100.0% |
School Enrollment by Age by Funding Source in Guanica
Out of a total of 1,195 students who are enrolled in schools in Guanica, 143 (12.0%) attend a private institution, while the remaining 1,052 (88.0%) are enrolled in public schools. The age group of 25 to 34 year olds has the highest likelihood of being enrolled in private schools, with 39 (84.8% in the age bracket) enrolled. Conversely, the age group of 3 to 4 year olds has the lowest likelihood of being enrolled in a private school, with 78 (100.0% in the age bracket) attending a public institution.
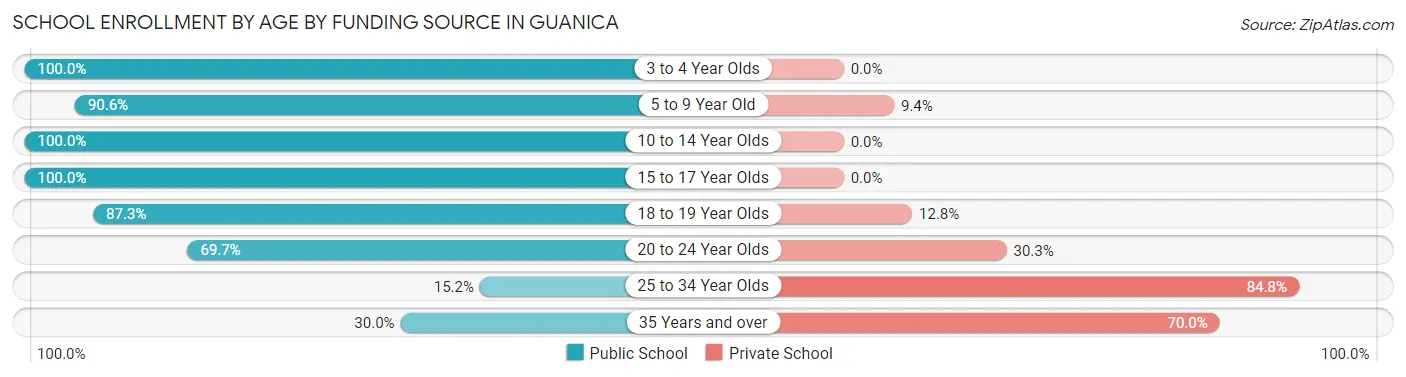
| Age Bracket | Public School | Private School |
| 3 to 4 Year Olds | 78 (100.0%) | 0 (0.0%) |
| 5 to 9 Year Old | 87 (90.6%) | 9 (9.4%) |
| 10 to 14 Year Olds | 516 (100.0%) | 0 (0.0%) |
| 15 to 17 Year Olds | 139 (100.0%) | 0 (0.0%) |
| 18 to 19 Year Olds | 89 (87.3%) | 13 (12.8%) |
| 20 to 24 Year Olds | 124 (69.7%) | 54 (30.3%) |
| 25 to 34 Year Olds | 7 (15.2%) | 39 (84.8%) |
| 35 Years and over | 12 (30.0%) | 28 (70.0%) |
| Total | 1,052 (88.0%) | 143 (12.0%) |
Educational Attainment by Field of Study in Guanica
Education (152 | 26.8%), science & technology (118 | 20.8%), business (76 | 13.4%), arts & humanities (73 | 12.9%), and engineering (45 | 7.9%) are the most common fields of study among 568 individuals in Guanica who have obtained a bachelor's degree or higher.
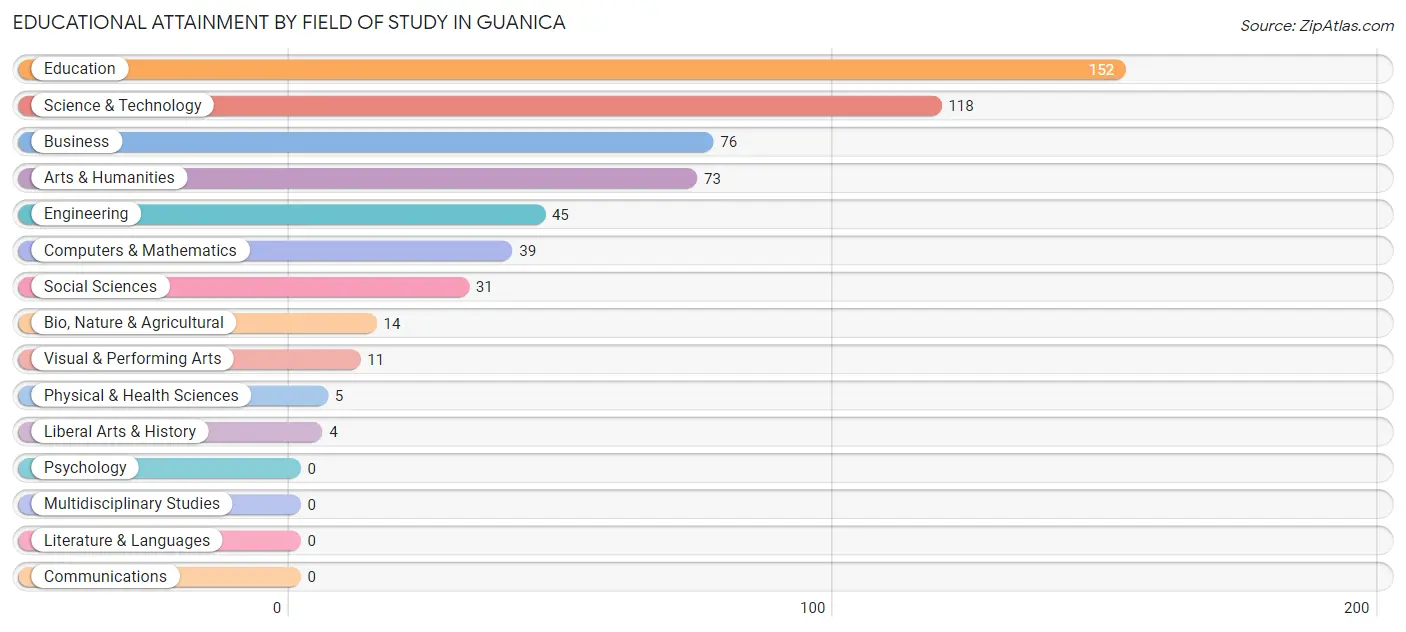
| Field of Study | # Graduates | % Graduates |
| Computers & Mathematics | 39 | 6.9% |
| Bio, Nature & Agricultural | 14 | 2.5% |
| Physical & Health Sciences | 5 | 0.9% |
| Psychology | 0 | 0.0% |
| Social Sciences | 31 | 5.5% |
| Engineering | 45 | 7.9% |
| Multidisciplinary Studies | 0 | 0.0% |
| Science & Technology | 118 | 20.8% |
| Business | 76 | 13.4% |
| Education | 152 | 26.8% |
| Literature & Languages | 0 | 0.0% |
| Liberal Arts & History | 4 | 0.7% |
| Visual & Performing Arts | 11 | 1.9% |
| Communications | 0 | 0.0% |
| Arts & Humanities | 73 | 12.9% |
| Total | 568 | 100.0% |
Transportation & Commute in Guanica
Vehicle Availability by Sex in Guanica
The most prevalent vehicle ownership categories in Guanica are males with 1 vehicle (314, accounting for 52.0%) and females with 1 vehicle (105, making up 63.6%).
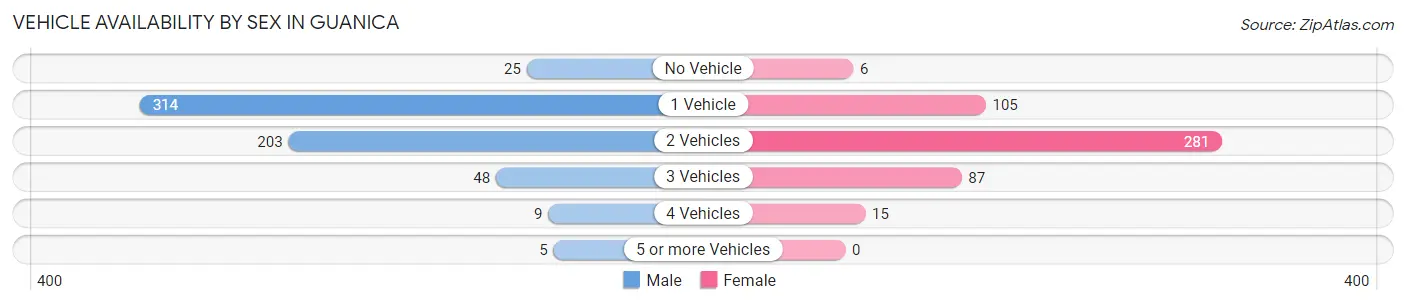
| Vehicles Available | Male | Female |
| No Vehicle | 25 (4.1%) | 6 (1.2%) |
| 1 Vehicle | 314 (52.0%) | 105 (21.3%) |
| 2 Vehicles | 203 (33.6%) | 281 (56.9%) |
| 3 Vehicles | 48 (8.0%) | 87 (17.6%) |
| 4 Vehicles | 9 (1.5%) | 15 (3.0%) |
| 5 or more Vehicles | 5 (0.8%) | 0 (0.0%) |
| Total | 604 (100.0%) | 494 (100.0%) |
Commute Time in Guanica
The most frequently occuring commute durations in Guanica are 10 to 14 minutes (365 commuters, 35.0%), 30 to 34 minutes (179 commuters, 17.2%), and 15 to 19 minutes (160 commuters, 15.3%).
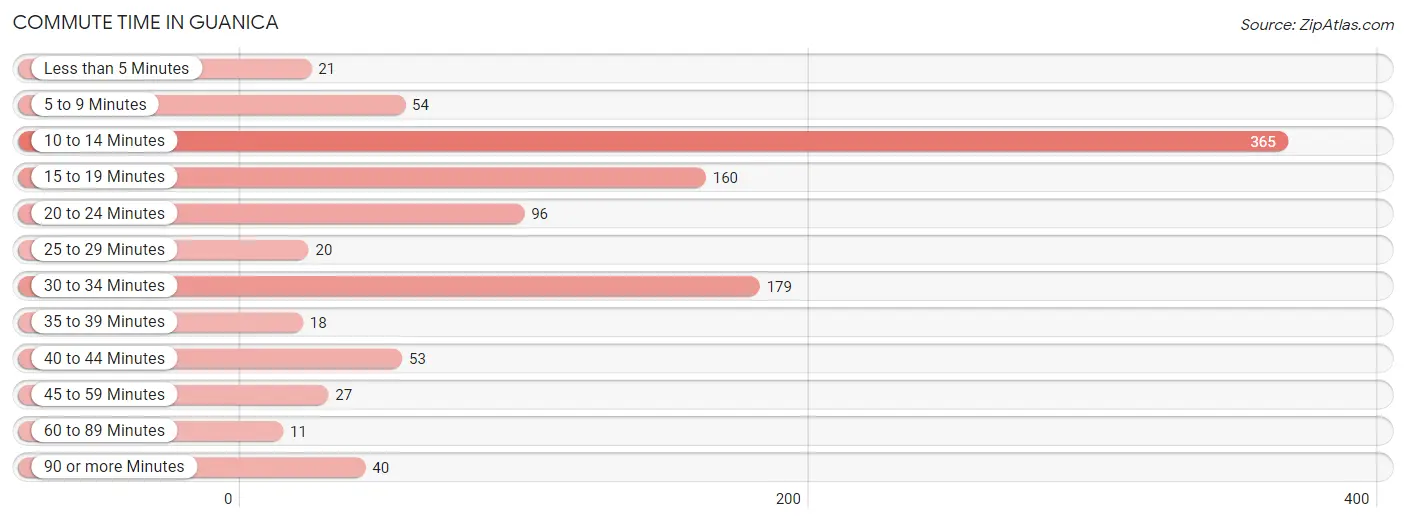
| Commute Time | # Commuters | % Commuters |
| Less than 5 Minutes | 21 | 2.0% |
| 5 to 9 Minutes | 54 | 5.2% |
| 10 to 14 Minutes | 365 | 35.0% |
| 15 to 19 Minutes | 160 | 15.3% |
| 20 to 24 Minutes | 96 | 9.2% |
| 25 to 29 Minutes | 20 | 1.9% |
| 30 to 34 Minutes | 179 | 17.2% |
| 35 to 39 Minutes | 18 | 1.7% |
| 40 to 44 Minutes | 53 | 5.1% |
| 45 to 59 Minutes | 27 | 2.6% |
| 60 to 89 Minutes | 11 | 1.1% |
| 90 or more Minutes | 40 | 3.8% |
Commute Time by Sex in Guanica
The most common commute times in Guanica are 10 to 14 minutes (308 commuters, 53.0%) for males and 30 to 34 minutes (157 commuters, 33.9%) for females.
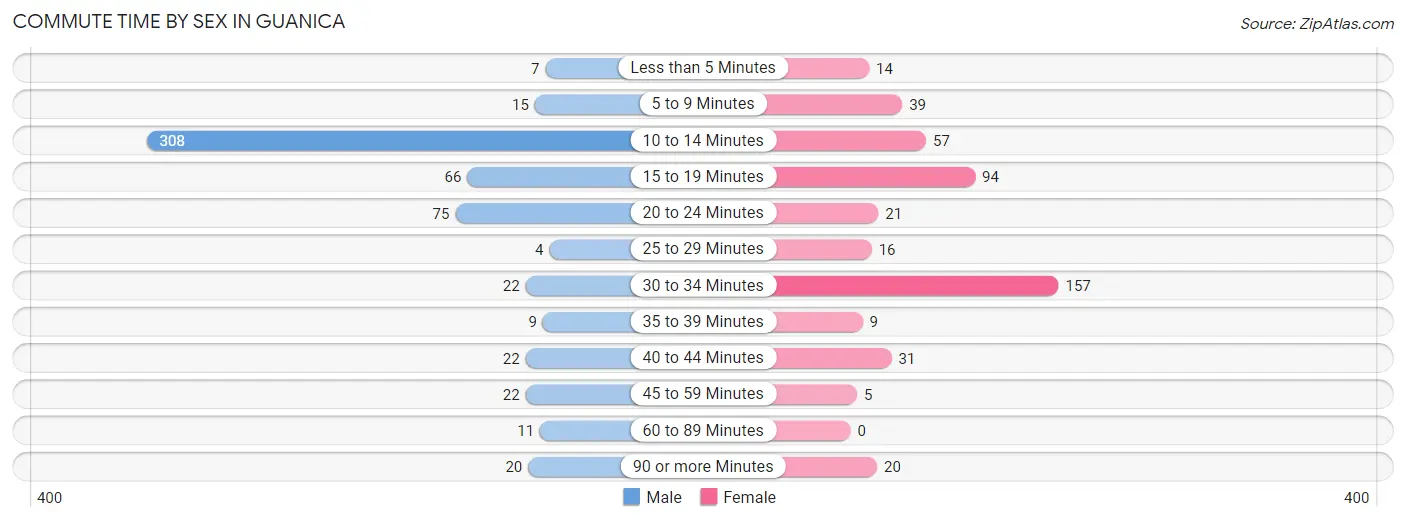
| Commute Time | Male | Female |
| Less than 5 Minutes | 7 (1.2%) | 14 (3.0%) |
| 5 to 9 Minutes | 15 (2.6%) | 39 (8.4%) |
| 10 to 14 Minutes | 308 (53.0%) | 57 (12.3%) |
| 15 to 19 Minutes | 66 (11.4%) | 94 (20.3%) |
| 20 to 24 Minutes | 75 (12.9%) | 21 (4.5%) |
| 25 to 29 Minutes | 4 (0.7%) | 16 (3.5%) |
| 30 to 34 Minutes | 22 (3.8%) | 157 (33.9%) |
| 35 to 39 Minutes | 9 (1.5%) | 9 (1.9%) |
| 40 to 44 Minutes | 22 (3.8%) | 31 (6.7%) |
| 45 to 59 Minutes | 22 (3.8%) | 5 (1.1%) |
| 60 to 89 Minutes | 11 (1.9%) | 0 (0.0%) |
| 90 or more Minutes | 20 (3.4%) | 20 (4.3%) |
Time of Departure to Work by Sex in Guanica
The most frequent times of departure to work in Guanica are 7:00 AM to 7:29 AM (122, 21.0%) for males and 6:00 AM to 6:29 AM (119, 25.7%) for females.
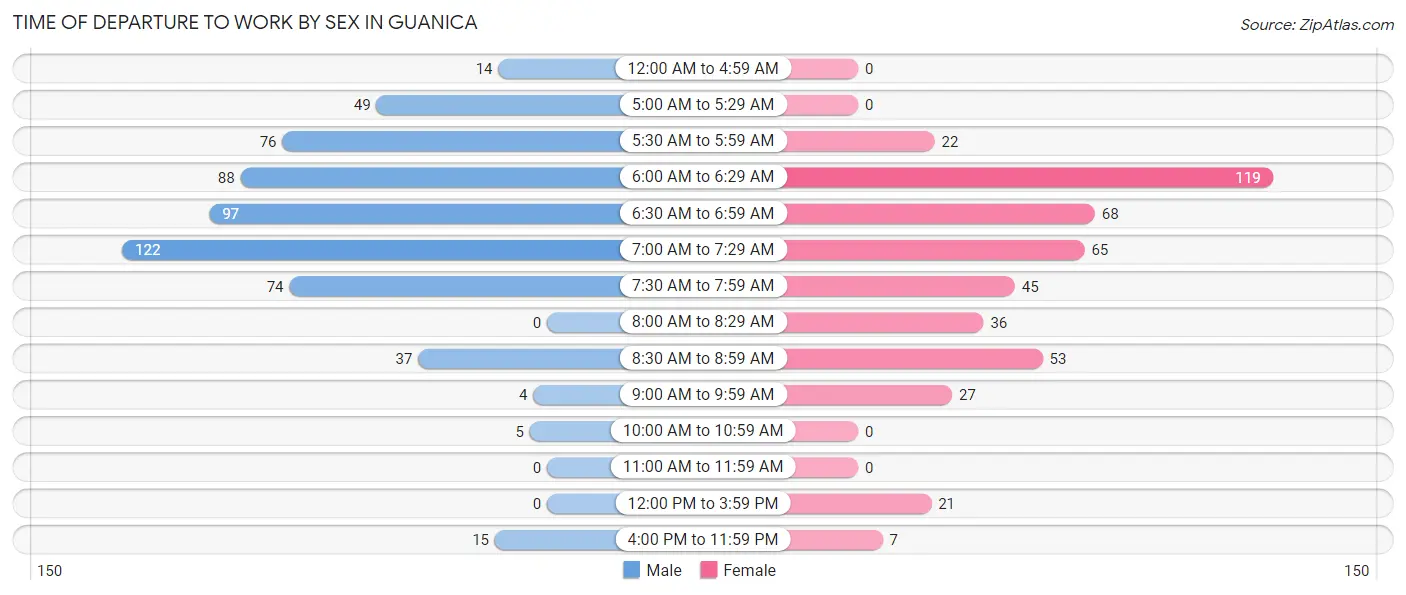
| Time of Departure | Male | Female |
| 12:00 AM to 4:59 AM | 14 (2.4%) | 0 (0.0%) |
| 5:00 AM to 5:29 AM | 49 (8.4%) | 0 (0.0%) |
| 5:30 AM to 5:59 AM | 76 (13.1%) | 22 (4.8%) |
| 6:00 AM to 6:29 AM | 88 (15.1%) | 119 (25.7%) |
| 6:30 AM to 6:59 AM | 97 (16.7%) | 68 (14.7%) |
| 7:00 AM to 7:29 AM | 122 (21.0%) | 65 (14.0%) |
| 7:30 AM to 7:59 AM | 74 (12.7%) | 45 (9.7%) |
| 8:00 AM to 8:29 AM | 0 (0.0%) | 36 (7.8%) |
| 8:30 AM to 8:59 AM | 37 (6.4%) | 53 (11.5%) |
| 9:00 AM to 9:59 AM | 4 (0.7%) | 27 (5.8%) |
| 10:00 AM to 10:59 AM | 5 (0.9%) | 0 (0.0%) |
| 11:00 AM to 11:59 AM | 0 (0.0%) | 0 (0.0%) |
| 12:00 PM to 3:59 PM | 0 (0.0%) | 21 (4.5%) |
| 4:00 PM to 11:59 PM | 15 (2.6%) | 7 (1.5%) |
| Total | 581 (100.0%) | 463 (100.0%) |
Housing Occupancy in Guanica
Occupancy by Ownership in Guanica
Of the total 2,320 dwellings in Guanica, owner-occupied units account for 1,573 (67.8%), while renter-occupied units make up 747 (32.2%).
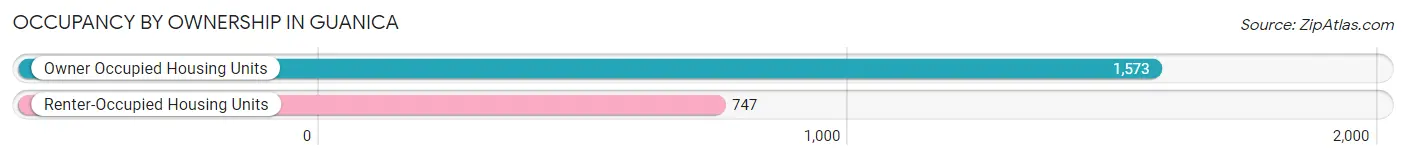
| Occupancy | # Housing Units | % Housing Units |
| Owner Occupied Housing Units | 1,573 | 67.8% |
| Renter-Occupied Housing Units | 747 | 32.2% |
| Total Occupied Housing Units | 2,320 | 100.0% |
Occupancy by Household Size in Guanica
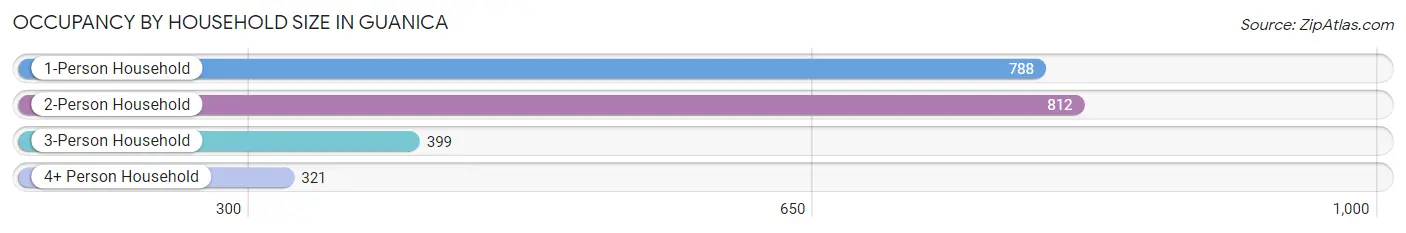
| Household Size | # Housing Units | % Housing Units |
| 1-Person Household | 788 | 34.0% |
| 2-Person Household | 812 | 35.0% |
| 3-Person Household | 399 | 17.2% |
| 4+ Person Household | 321 | 13.8% |
| Total Housing Units | 2,320 | 100.0% |
Occupancy by Ownership by Household Size in Guanica
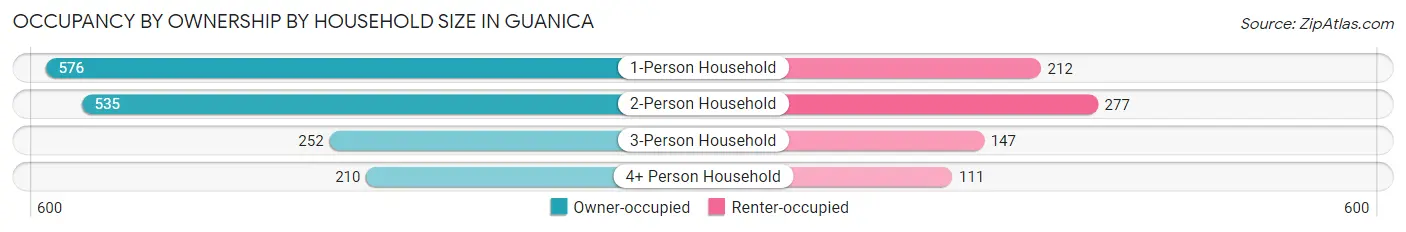
| Household Size | Owner-occupied | Renter-occupied |
| 1-Person Household | 576 (73.1%) | 212 (26.9%) |
| 2-Person Household | 535 (65.9%) | 277 (34.1%) |
| 3-Person Household | 252 (63.2%) | 147 (36.8%) |
| 4+ Person Household | 210 (65.4%) | 111 (34.6%) |
| Total Housing Units | 1,573 (67.8%) | 747 (32.2%) |
Occupancy by Educational Attainment in Guanica
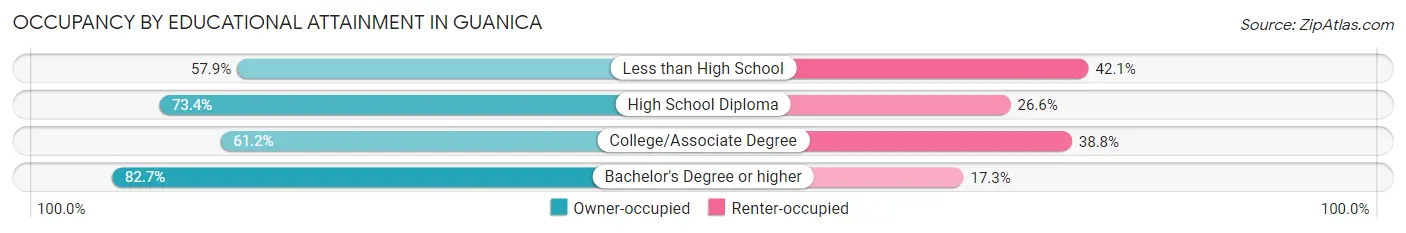
| Household Size | Owner-occupied | Renter-occupied |
| Less than High School | 382 (57.9%) | 278 (42.1%) |
| High School Diploma | 727 (73.4%) | 264 (26.6%) |
| College/Associate Degree | 254 (61.2%) | 161 (38.8%) |
| Bachelor's Degree or higher | 210 (82.7%) | 44 (17.3%) |
Occupancy by Age of Householder in Guanica
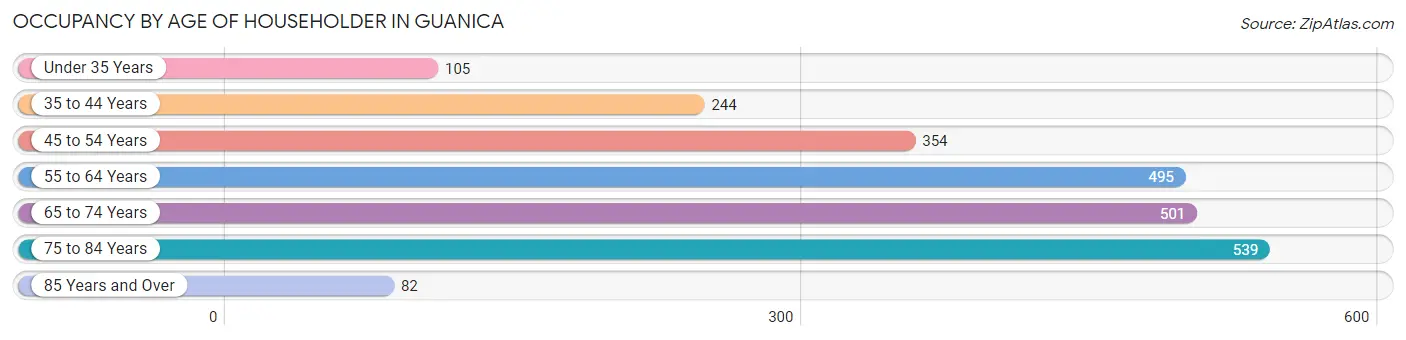
| Age Bracket | # Households | % Households |
| Under 35 Years | 105 | 4.5% |
| 35 to 44 Years | 244 | 10.5% |
| 45 to 54 Years | 354 | 15.3% |
| 55 to 64 Years | 495 | 21.3% |
| 65 to 74 Years | 501 | 21.6% |
| 75 to 84 Years | 539 | 23.2% |
| 85 Years and Over | 82 | 3.5% |
| Total | 2,320 | 100.0% |
Housing Finances in Guanica
Median Income by Occupancy in Guanica
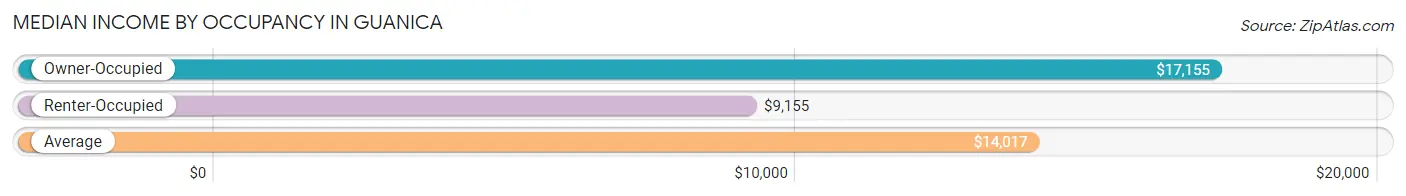
| Occupancy Type | # Households | Median Income |
| Owner-Occupied | 1,573 (67.8%) | $17,155 |
| Renter-Occupied | 747 (32.2%) | $9,155 |
| Average | 2,320 (100.0%) | $14,017 |
Occupancy by Householder Income Bracket in Guanica
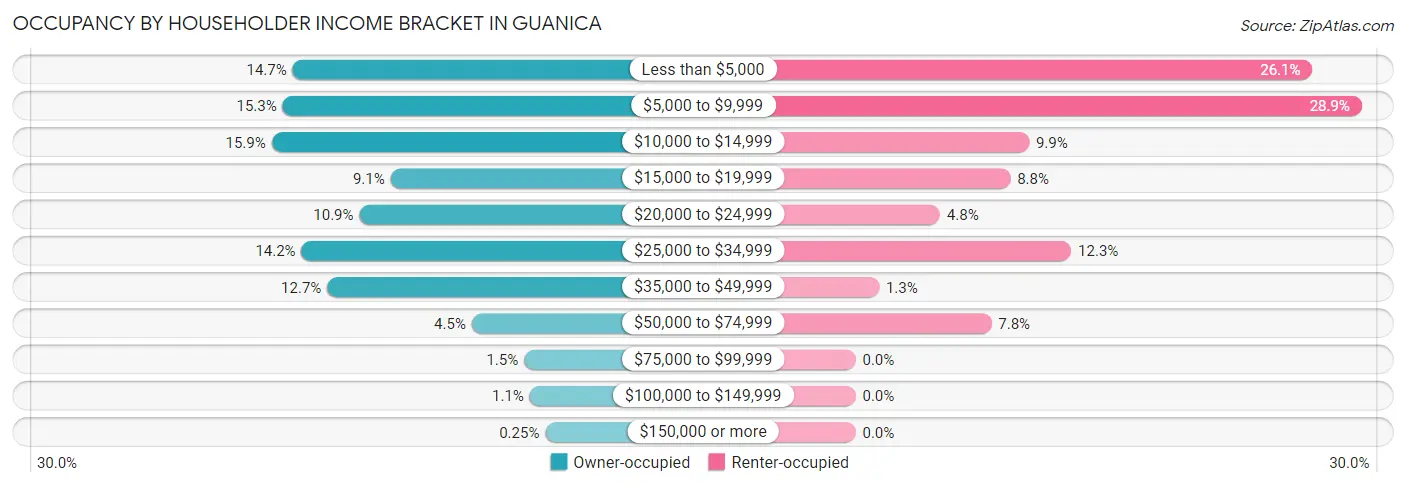
| Income Bracket | Owner-occupied | Renter-occupied |
| Less than $5,000 | 231 (14.7%) | 195 (26.1%) |
| $5,000 to $9,999 | 240 (15.3%) | 216 (28.9%) |
| $10,000 to $14,999 | 250 (15.9%) | 74 (9.9%) |
| $15,000 to $19,999 | 143 (9.1%) | 66 (8.8%) |
| $20,000 to $24,999 | 171 (10.9%) | 36 (4.8%) |
| $25,000 to $34,999 | 223 (14.2%) | 92 (12.3%) |
| $35,000 to $49,999 | 200 (12.7%) | 10 (1.3%) |
| $50,000 to $74,999 | 70 (4.4%) | 58 (7.8%) |
| $75,000 to $99,999 | 23 (1.5%) | 0 (0.0%) |
| $100,000 to $149,999 | 18 (1.1%) | 0 (0.0%) |
| $150,000 or more | 4 (0.3%) | 0 (0.0%) |
| Total | 1,573 (100.0%) | 747 (100.0%) |
Monthly Housing Cost Tiers in Guanica
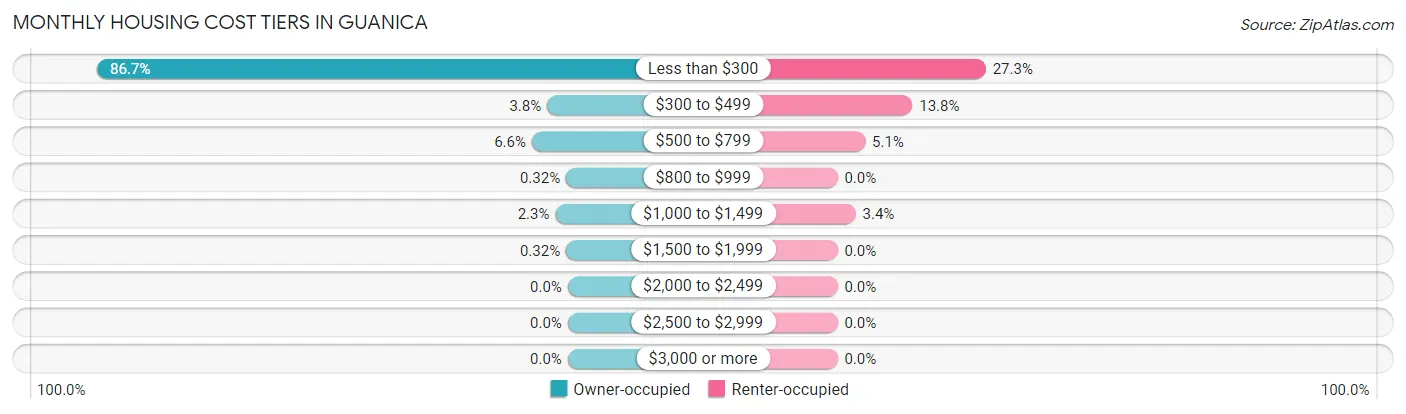
| Monthly Cost | Owner-occupied | Renter-occupied |
| Less than $300 | 1,363 (86.7%) | 204 (27.3%) |
| $300 to $499 | 60 (3.8%) | 103 (13.8%) |
| $500 to $799 | 104 (6.6%) | 38 (5.1%) |
| $800 to $999 | 5 (0.3%) | 0 (0.0%) |
| $1,000 to $1,499 | 36 (2.3%) | 25 (3.4%) |
| $1,500 to $1,999 | 5 (0.3%) | 0 (0.0%) |
| $2,000 to $2,499 | 0 (0.0%) | 0 (0.0%) |
| $2,500 to $2,999 | 0 (0.0%) | 0 (0.0%) |
| $3,000 or more | 0 (0.0%) | 0 (0.0%) |
| Total | 1,573 (100.0%) | 747 (100.0%) |
Physical Housing Characteristics in Guanica
Housing Structures in Guanica
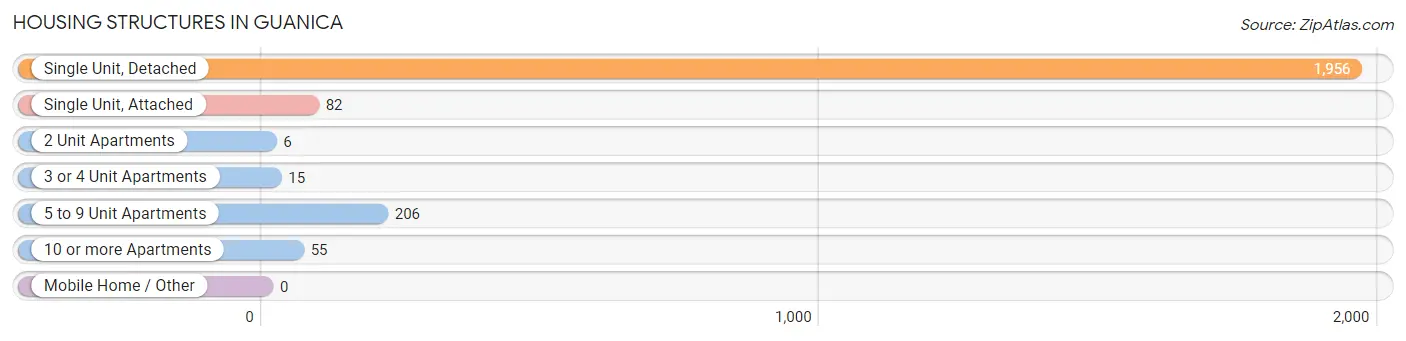
| Structure Type | # Housing Units | % Housing Units |
| Single Unit, Detached | 1,956 | 84.3% |
| Single Unit, Attached | 82 | 3.5% |
| 2 Unit Apartments | 6 | 0.3% |
| 3 or 4 Unit Apartments | 15 | 0.6% |
| 5 to 9 Unit Apartments | 206 | 8.9% |
| 10 or more Apartments | 55 | 2.4% |
| Mobile Home / Other | 0 | 0.0% |
| Total | 2,320 | 100.0% |
Housing Structures by Occupancy in Guanica
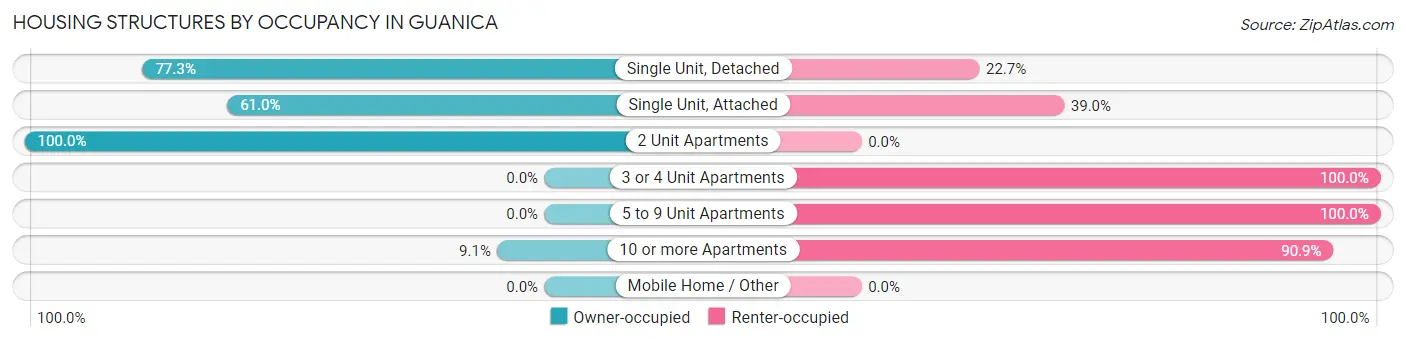
| Structure Type | Owner-occupied | Renter-occupied |
| Single Unit, Detached | 1,512 (77.3%) | 444 (22.7%) |
| Single Unit, Attached | 50 (61.0%) | 32 (39.0%) |
| 2 Unit Apartments | 6 (100.0%) | 0 (0.0%) |
| 3 or 4 Unit Apartments | 0 (0.0%) | 15 (100.0%) |
| 5 to 9 Unit Apartments | 0 (0.0%) | 206 (100.0%) |
| 10 or more Apartments | 5 (9.1%) | 50 (90.9%) |
| Mobile Home / Other | 0 (0.0%) | 0 (0.0%) |
| Total | 1,573 (67.8%) | 747 (32.2%) |
Housing Structures by Number of Rooms in Guanica
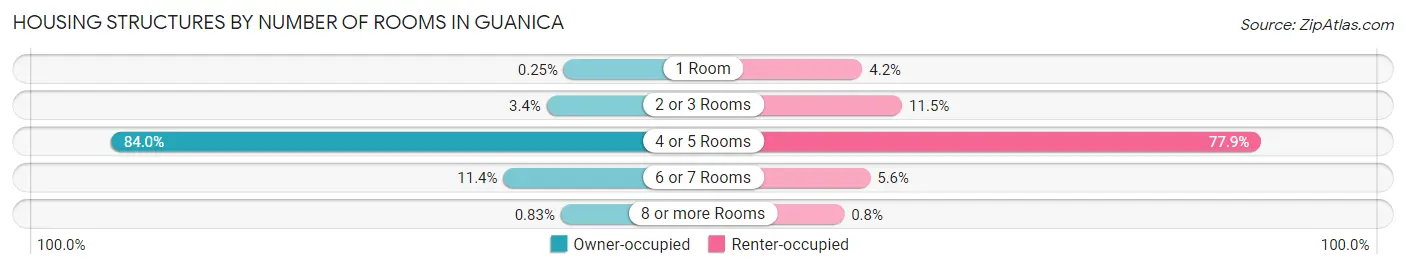
| Number of Rooms | Owner-occupied | Renter-occupied |
| 1 Room | 4 (0.3%) | 31 (4.2%) |
| 2 or 3 Rooms | 54 (3.4%) | 86 (11.5%) |
| 4 or 5 Rooms | 1,322 (84.0%) | 582 (77.9%) |
| 6 or 7 Rooms | 180 (11.4%) | 42 (5.6%) |
| 8 or more Rooms | 13 (0.8%) | 6 (0.8%) |
| Total | 1,573 (100.0%) | 747 (100.0%) |
Housing Structure by Heating Type in Guanica
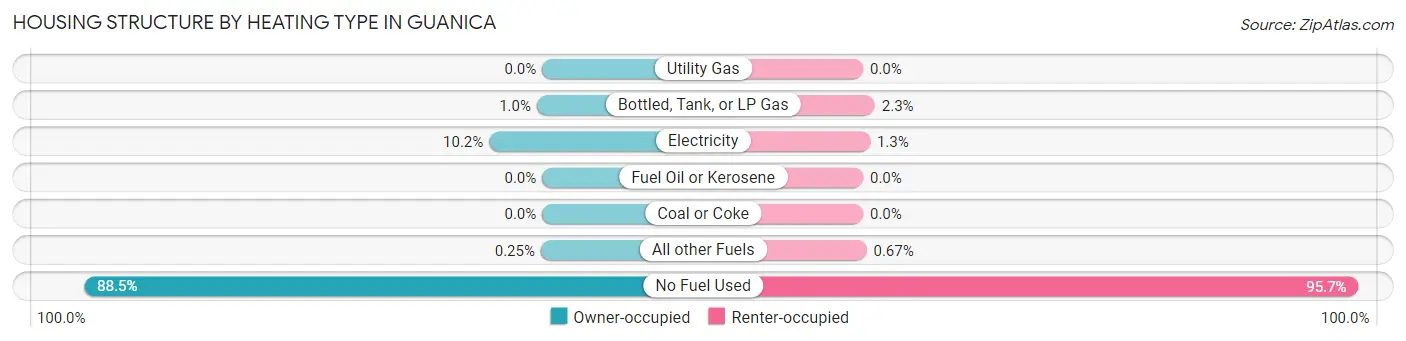
| Heating Type | Owner-occupied | Renter-occupied |
| Utility Gas | 0 (0.0%) | 0 (0.0%) |
| Bottled, Tank, or LP Gas | 16 (1.0%) | 17 (2.3%) |
| Electricity | 161 (10.2%) | 10 (1.3%) |
| Fuel Oil or Kerosene | 0 (0.0%) | 0 (0.0%) |
| Coal or Coke | 0 (0.0%) | 0 (0.0%) |
| All other Fuels | 4 (0.3%) | 5 (0.7%) |
| No Fuel Used | 1,392 (88.5%) | 715 (95.7%) |
| Total | 1,573 (100.0%) | 747 (100.0%) |
Household Vehicle Usage in Guanica
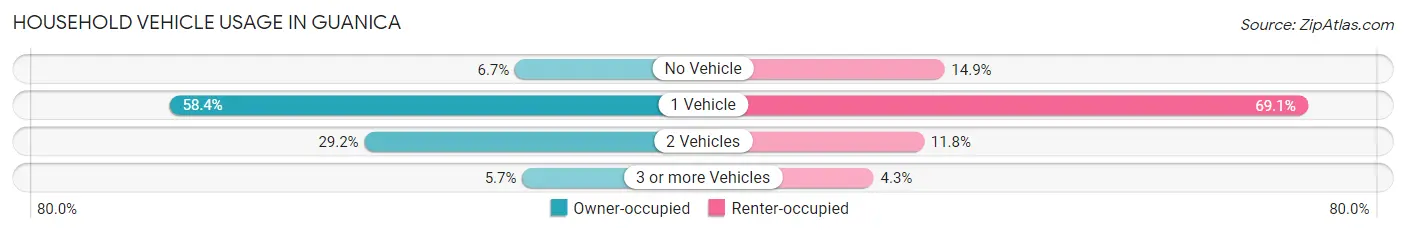
| Vehicles per Household | Owner-occupied | Renter-occupied |
| No Vehicle | 106 (6.7%) | 111 (14.9%) |
| 1 Vehicle | 918 (58.4%) | 516 (69.1%) |
| 2 Vehicles | 460 (29.2%) | 88 (11.8%) |
| 3 or more Vehicles | 89 (5.7%) | 32 (4.3%) |
| Total | 1,573 (100.0%) | 747 (100.0%) |
Real Estate & Mortgages in Guanica
Real Estate and Mortgage Overview in Guanica
| Characteristic | Without Mortgage | With Mortgage |
| Housing Units | 1,461 | 112 |
| Median Property Value | $77,400 | $100,000 |
| Median Household Income | $15,970 | $0 |
| Monthly Housing Costs | $134 | $0 |
| Real Estate Taxes | $253 | $112 |
Property Value by Mortgage Status in Guanica
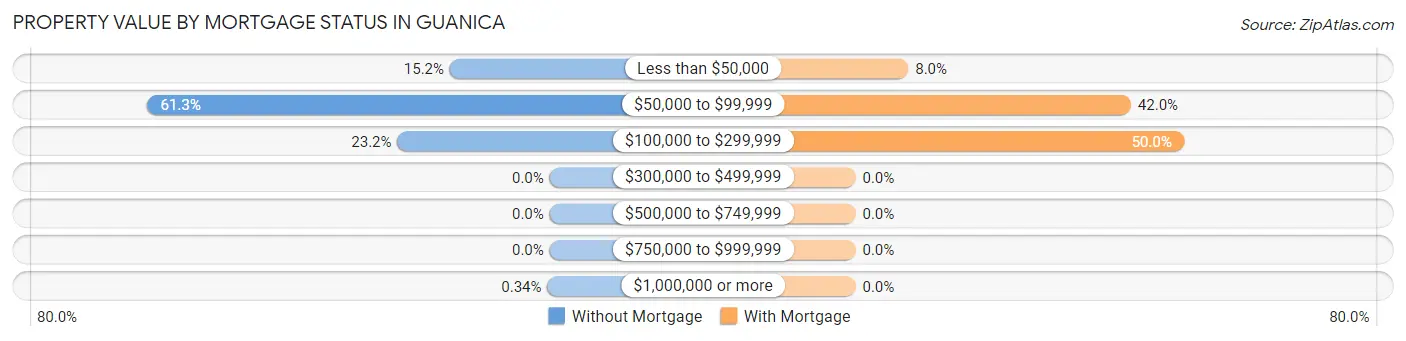
| Property Value | Without Mortgage | With Mortgage |
| Less than $50,000 | 222 (15.2%) | 9 (8.0%) |
| $50,000 to $99,999 | 895 (61.3%) | 47 (42.0%) |
| $100,000 to $299,999 | 339 (23.2%) | 56 (50.0%) |
| $300,000 to $499,999 | 0 (0.0%) | 0 (0.0%) |
| $500,000 to $749,999 | 0 (0.0%) | 0 (0.0%) |
| $750,000 to $999,999 | 0 (0.0%) | 0 (0.0%) |
| $1,000,000 or more | 5 (0.3%) | 0 (0.0%) |
| Total | 1,461 (100.0%) | 112 (100.0%) |
Household Income by Mortgage Status in Guanica
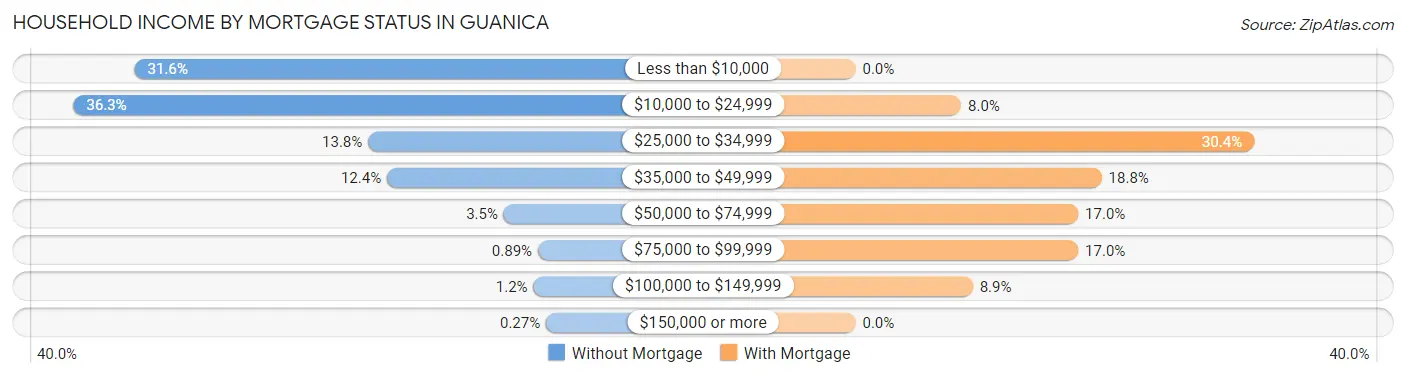
| Household Income | Without Mortgage | With Mortgage |
| Less than $10,000 | 462 (31.6%) | 0 (0.0%) |
| $10,000 to $24,999 | 530 (36.3%) | 9 (8.0%) |
| $25,000 to $34,999 | 202 (13.8%) | 34 (30.4%) |
| $35,000 to $49,999 | 181 (12.4%) | 21 (18.8%) |
| $50,000 to $74,999 | 51 (3.5%) | 19 (17.0%) |
| $75,000 to $99,999 | 13 (0.9%) | 19 (17.0%) |
| $100,000 to $149,999 | 18 (1.2%) | 10 (8.9%) |
| $150,000 or more | 4 (0.3%) | 0 (0.0%) |
| Total | 1,461 (100.0%) | 112 (100.0%) |
Property Value to Household Income Ratio in Guanica
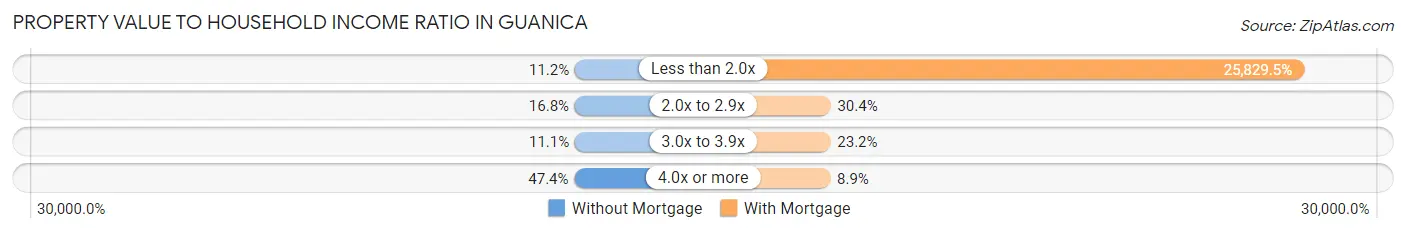
| Value-to-Income Ratio | Without Mortgage | With Mortgage |
| Less than 2.0x | 163 (11.2%) | 28,929 (25,829.5%) |
| 2.0x to 2.9x | 246 (16.8%) | 34 (30.4%) |
| 3.0x to 3.9x | 162 (11.1%) | 26 (23.2%) |
| 4.0x or more | 692 (47.4%) | 10 (8.9%) |
| Total | 1,461 (100.0%) | 112 (100.0%) |
Real Estate Taxes by Mortgage Status in Guanica
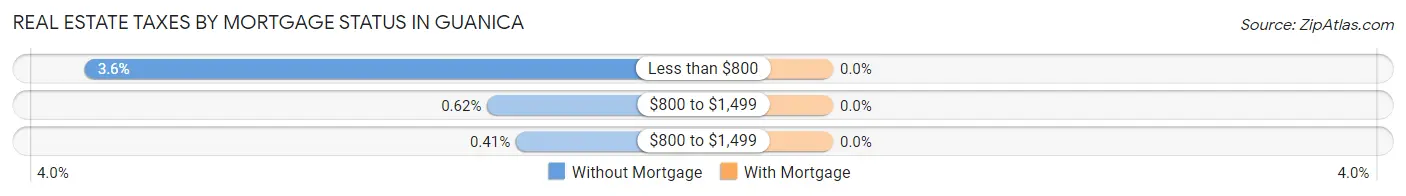
| Property Taxes | Without Mortgage | With Mortgage |
| Less than $800 | 52 (3.6%) | 0 (0.0%) |
| $800 to $1,499 | 9 (0.6%) | 0 (0.0%) |
| $800 to $1,499 | 6 (0.4%) | 0 (0.0%) |
| Total | 1,461 (100.0%) | 112 (100.0%) |
Health & Disability in Guanica
Health Insurance Coverage by Age in Guanica
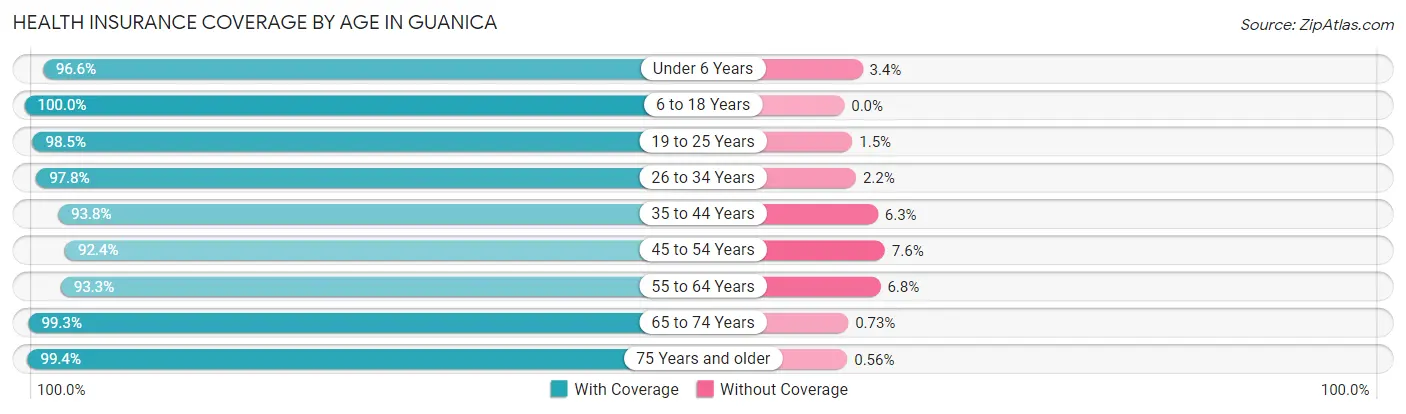
| Age Bracket | With Coverage | Without Coverage |
| Under 6 Years | 256 (96.6%) | 9 (3.4%) |
| 6 to 18 Years | 818 (100.0%) | 0 (0.0%) |
| 19 to 25 Years | 461 (98.5%) | 7 (1.5%) |
| 26 to 34 Years | 359 (97.8%) | 8 (2.2%) |
| 35 to 44 Years | 540 (93.8%) | 36 (6.2%) |
| 45 to 54 Years | 647 (92.4%) | 53 (7.6%) |
| 55 to 64 Years | 691 (93.2%) | 50 (6.8%) |
| 65 to 74 Years | 683 (99.3%) | 5 (0.7%) |
| 75 Years and older | 883 (99.4%) | 5 (0.6%) |
| Total | 5,338 (96.9%) | 173 (3.1%) |
Health Insurance Coverage by Citizenship Status in Guanica
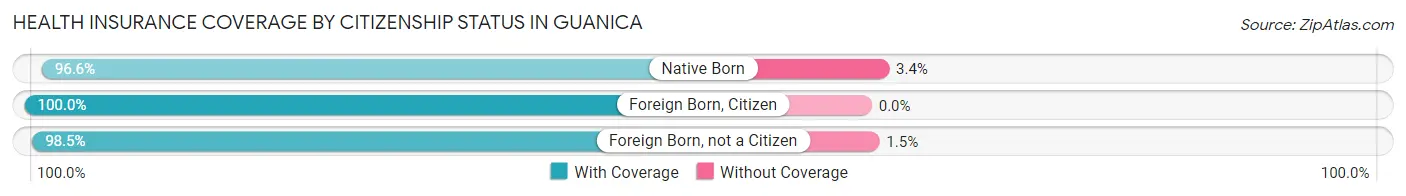
| Citizenship Status | With Coverage | Without Coverage |
| Native Born | 256 (96.6%) | 9 (3.4%) |
| Foreign Born, Citizen | 818 (100.0%) | 0 (0.0%) |
| Foreign Born, not a Citizen | 461 (98.5%) | 7 (1.5%) |
Health Insurance Coverage by Household Income in Guanica
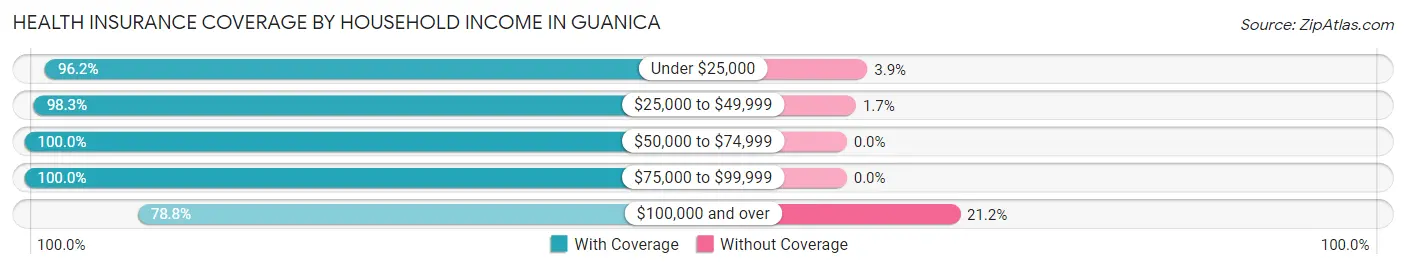
| Household Income | With Coverage | Without Coverage |
| Under $25,000 | 3,293 (96.2%) | 132 (3.8%) |
| $25,000 to $49,999 | 1,490 (98.3%) | 26 (1.7%) |
| $50,000 to $74,999 | 410 (100.0%) | 0 (0.0%) |
| $75,000 to $99,999 | 91 (100.0%) | 0 (0.0%) |
| $100,000 and over | 52 (78.8%) | 14 (21.2%) |
Public vs Private Health Insurance Coverage by Age in Guanica
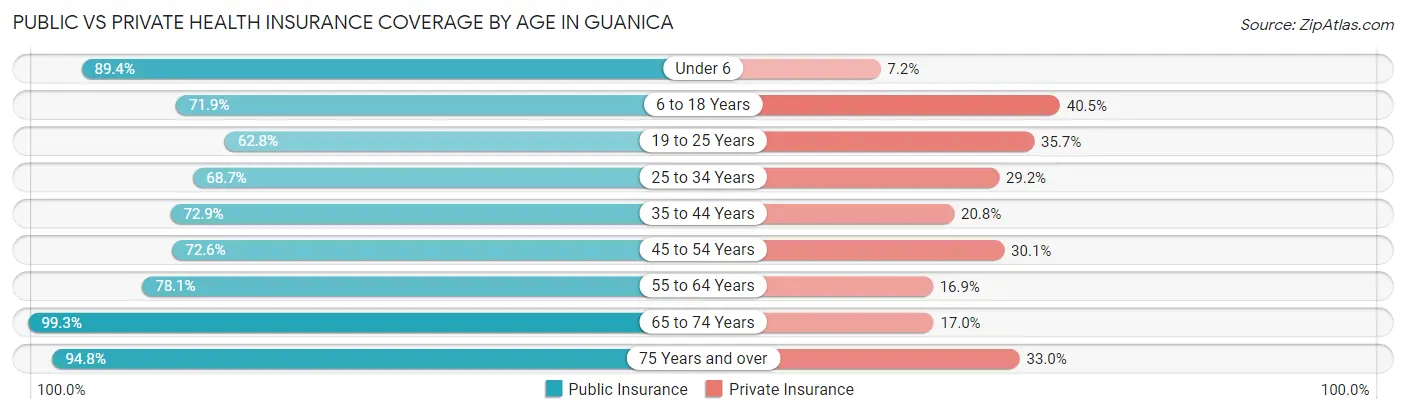
| Age Bracket | Public Insurance | Private Insurance |
| Under 6 | 237 (89.4%) | 19 (7.2%) |
| 6 to 18 Years | 588 (71.9%) | 331 (40.5%) |
| 19 to 25 Years | 294 (62.8%) | 167 (35.7%) |
| 25 to 34 Years | 252 (68.7%) | 107 (29.2%) |
| 35 to 44 Years | 420 (72.9%) | 120 (20.8%) |
| 45 to 54 Years | 508 (72.6%) | 211 (30.1%) |
| 55 to 64 Years | 579 (78.1%) | 125 (16.9%) |
| 65 to 74 Years | 683 (99.3%) | 117 (17.0%) |
| 75 Years and over | 842 (94.8%) | 293 (33.0%) |
| Total | 4,403 (79.9%) | 1,490 (27.0%) |
Disability Status by Sex by Age in Guanica
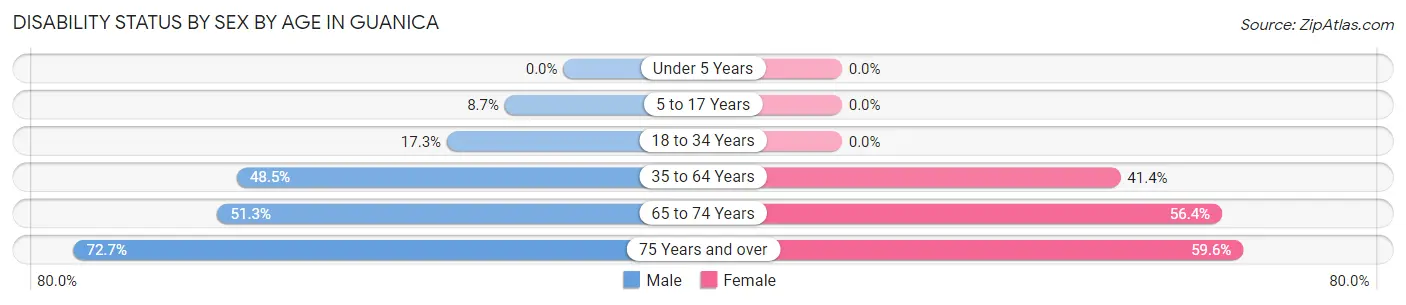
| Age Bracket | Male | Female |
| Under 5 Years | 0 (0.0%) | 0 (0.0%) |
| 5 to 17 Years | 44 (8.7%) | 0 (0.0%) |
| 18 to 34 Years | 69 (17.3%) | 0 (0.0%) |
| 35 to 64 Years | 503 (48.5%) | 405 (41.4%) |
| 65 to 74 Years | 154 (51.3%) | 219 (56.4%) |
| 75 Years and over | 320 (72.7%) | 267 (59.6%) |
Disability Class by Sex by Age in Guanica
Disability Class: Hearing Difficulty
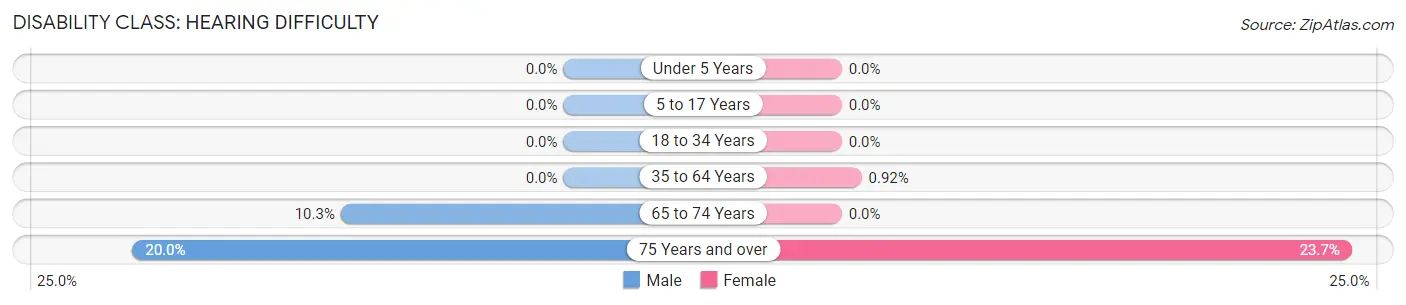
| Age Bracket | Male | Female |
| Under 5 Years | 0 (0.0%) | 0 (0.0%) |
| 5 to 17 Years | 0 (0.0%) | 0 (0.0%) |
| 18 to 34 Years | 0 (0.0%) | 0 (0.0%) |
| 35 to 64 Years | 0 (0.0%) | 9 (0.9%) |
| 65 to 74 Years | 31 (10.3%) | 0 (0.0%) |
| 75 Years and over | 88 (20.0%) | 106 (23.7%) |
Disability Class: Vision Difficulty
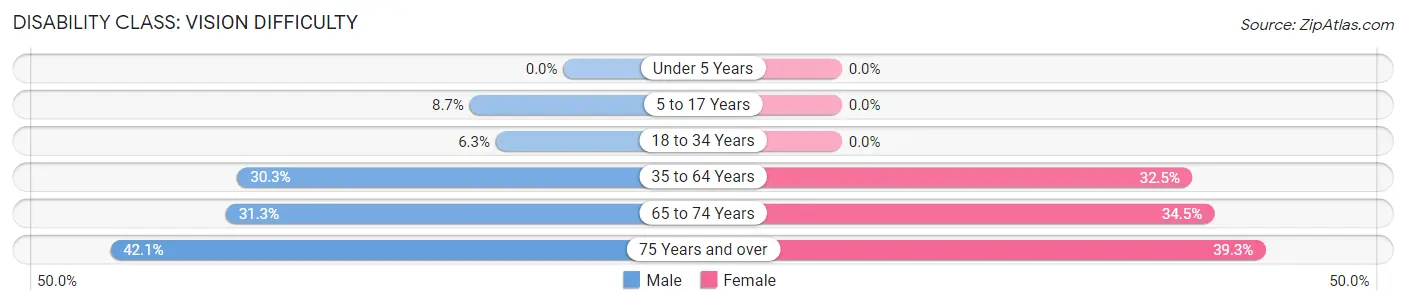
| Age Bracket | Male | Female |
| Under 5 Years | 0 (0.0%) | 0 (0.0%) |
| 5 to 17 Years | 44 (8.7%) | 0 (0.0%) |
| 18 to 34 Years | 25 (6.3%) | 0 (0.0%) |
| 35 to 64 Years | 314 (30.2%) | 318 (32.5%) |
| 65 to 74 Years | 94 (31.3%) | 134 (34.5%) |
| 75 Years and over | 185 (42.0%) | 176 (39.3%) |
Disability Class: Cognitive Difficulty
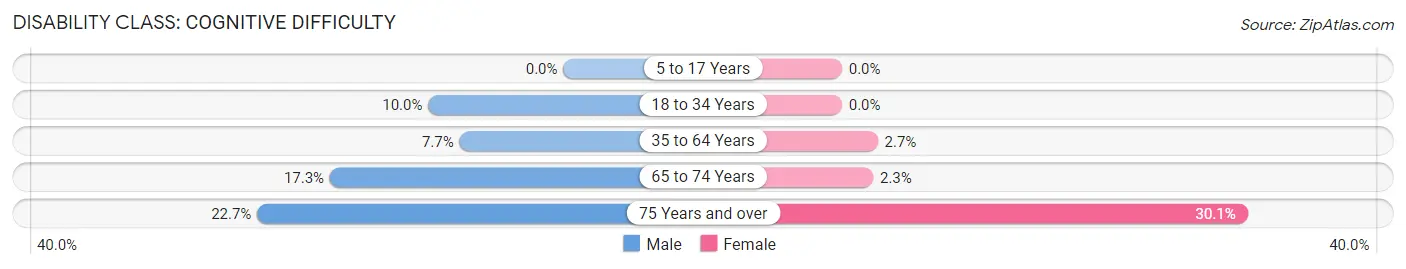
| Age Bracket | Male | Female |
| 5 to 17 Years | 0 (0.0%) | 0 (0.0%) |
| 18 to 34 Years | 40 (10.0%) | 0 (0.0%) |
| 35 to 64 Years | 80 (7.7%) | 26 (2.7%) |
| 65 to 74 Years | 52 (17.3%) | 9 (2.3%) |
| 75 Years and over | 100 (22.7%) | 135 (30.1%) |
Disability Class: Ambulatory Difficulty
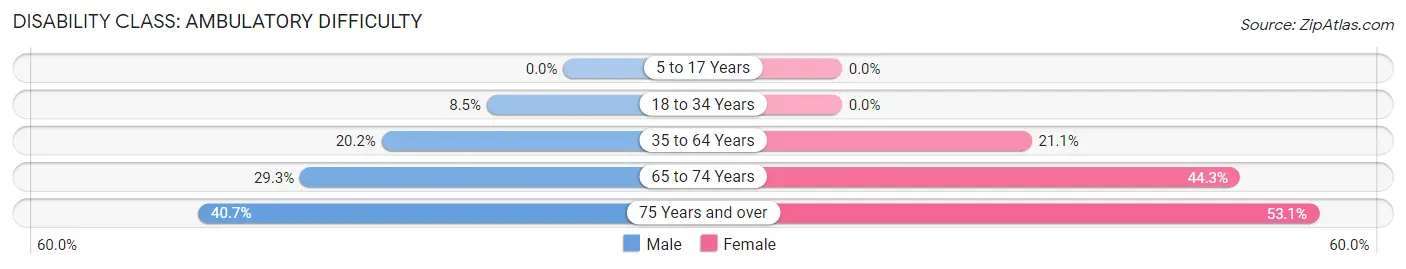
| Age Bracket | Male | Female |
| 5 to 17 Years | 0 (0.0%) | 0 (0.0%) |
| 18 to 34 Years | 34 (8.5%) | 0 (0.0%) |
| 35 to 64 Years | 210 (20.2%) | 207 (21.1%) |
| 65 to 74 Years | 88 (29.3%) | 172 (44.3%) |
| 75 Years and over | 179 (40.7%) | 238 (53.1%) |
Disability Class: Self-Care Difficulty
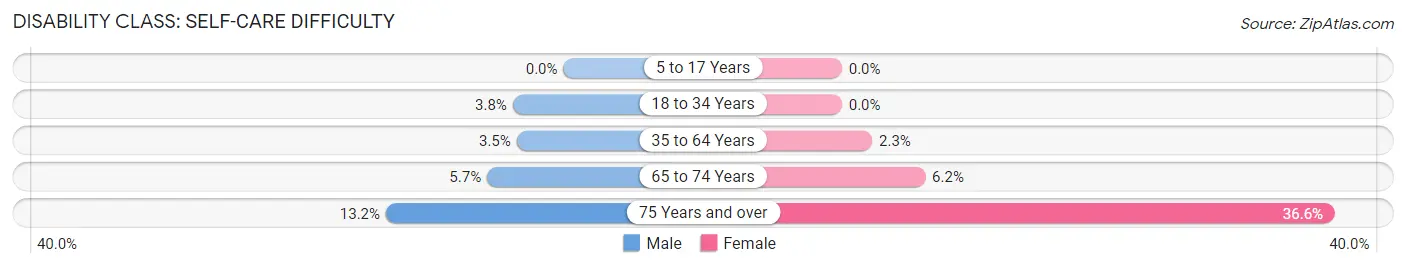
| Age Bracket | Male | Female |
| 5 to 17 Years | 0 (0.0%) | 0 (0.0%) |
| 18 to 34 Years | 15 (3.8%) | 0 (0.0%) |
| 35 to 64 Years | 36 (3.5%) | 22 (2.2%) |
| 65 to 74 Years | 17 (5.7%) | 24 (6.2%) |
| 75 Years and over | 58 (13.2%) | 164 (36.6%) |
Technology Access in Guanica
Computing Device Access in Guanica
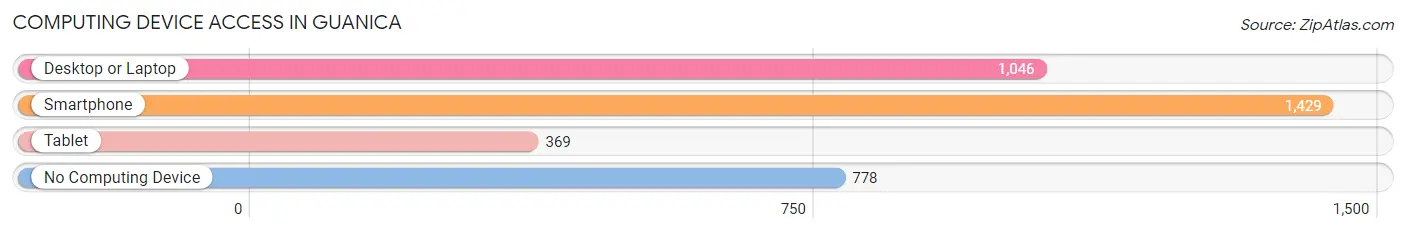
| Device Type | # Households | % Households |
| Desktop or Laptop | 1,046 | 45.1% |
| Smartphone | 1,429 | 61.6% |
| Tablet | 369 | 15.9% |
| No Computing Device | 778 | 33.5% |
| Total | 2,320 | 100.0% |
Internet Access in Guanica
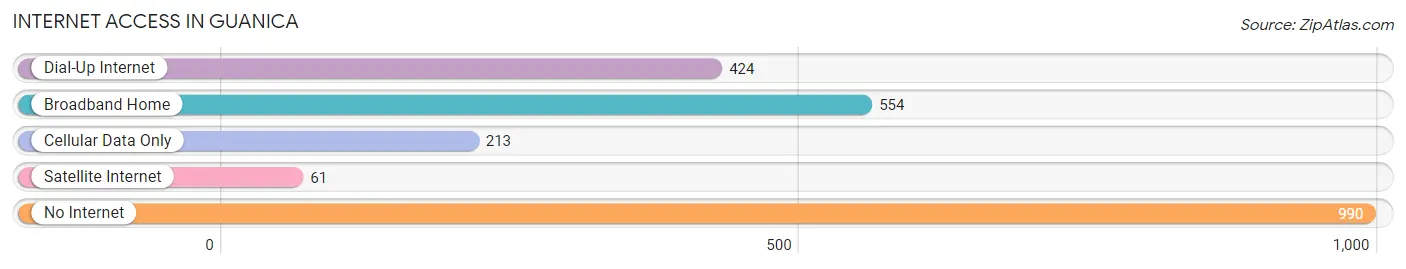
| Internet Type | # Households | % Households |
| Dial-Up Internet | 424 | 18.3% |
| Broadband Home | 554 | 23.9% |
| Cellular Data Only | 213 | 9.2% |
| Satellite Internet | 61 | 2.6% |
| No Internet | 990 | 42.7% |
| Total | 2,320 | 100.0% |
Guanica Summary
Guanica is a municipality located in the southwestern region of Puerto Rico. It is bordered by the municipalities of Yauco, Lajas, and Sabana Grande. The municipality is spread over an area of approximately 40 square miles and is home to a population of approximately 20,000 people.
History
Guanica was founded in 1736 by Spanish settlers. The name of the town is derived from the Taino word “Guayacan” which means “place of many trees”. The town was originally a small fishing village and was known for its abundance of guayacan trees. During the 19th century, the town experienced a period of growth and development as it became an important port for the export of sugar and coffee.
In 1898, Guanica was occupied by the United States during the Spanish-American War. The town was later incorporated as a municipality in 1902. During the 20th century, the town experienced a period of economic decline as the sugar and coffee industries declined. In the late 20th century, the town experienced a period of revitalization as tourism began to increase.
Geography
Guanica is located in the southwestern region of Puerto Rico. It is bordered by the municipalities of Yauco, Lajas, and Sabana Grande. The municipality is spread over an area of approximately 40 square miles and is home to a population of approximately 20,000 people.
The terrain of the municipality is mostly flat with some hills and mountains. The highest point in the municipality is Cerro de Punta which is located at an elevation of 1,087 feet. The municipality is located near the Caribbean Sea and is home to several beaches including Playa Santa and Playa Guanica.
Economy
The economy of Guanica is largely based on tourism. The municipality is home to several resorts and hotels which attract visitors from around the world. The town is also home to several restaurants and bars which cater to tourists.
In addition to tourism, the municipality is also home to several small businesses which provide goods and services to the local population. These businesses include grocery stores, clothing stores, and hardware stores.
Demographics
As of the 2000 census, the population of Guanica was approximately 20,000 people. The majority of the population is of Hispanic or Latino descent. The median household income in the municipality is approximately $20,000. The unemployment rate in the municipality is approximately 10%.
The majority of the population is Roman Catholic. The municipality is also home to several Protestant churches. The town is also home to several schools which provide education to the local population.
Conclusion
Guanica is a municipality located in the southwestern region of Puerto Rico. It is bordered by the municipalities of Yauco, Lajas, and Sabana Grande. The municipality is spread over an area of approximately 40 square miles and is home to a population of approximately 20,000 people. The economy of the municipality is largely based on tourism and small businesses. The majority of the population is of Hispanic or Latino descent and is Roman Catholic. The town is home to several schools which provide education to the local population.
Common Questions
What is Per Capita Income in Guanica?
Per Capita income in Guanica is $8,691.
What is the Median Family Income in Guanica?
Median Family Income in Guanica is $18,991.
What is the Median Household income in Guanica?
Median Household Income in Guanica is $14,017.
What is Income or Wage Gap in Guanica?
Income or Wage Gap in Guanica is 7.3%.
Women in Guanica earn 92.7 cents for every dollar earned by a man.
What is Family Income Deficit in Guanica?
Family Income Deficit in Guanica is $11,075.
Families that are below poverty line in Guanica earn $11,075 less on average than the poverty threshold level.
What is Inequality or Gini Index in Guanica?
Inequality or Gini Index in Guanica is 0.52.
What is the Total Population of Guanica?
Total Population of Guanica is 5,516.
What is the Total Male Population of Guanica?
Total Male Population of Guanica is 2,797.
What is the Total Female Population of Guanica?
Total Female Population of Guanica is 2,719.
What is the Ratio of Males per 100 Females in Guanica?
There are 102.87 Males per 100 Females in Guanica.
What is the Ratio of Females per 100 Males in Guanica?
There are 97.21 Females per 100 Males in Guanica.
What is the Median Population Age in Guanica?
Median Population Age in Guanica is 49.0 Years.
What is the Average Family Size in Guanica
Average Family Size in Guanica is 3.1 People.
What is the Average Household Size in Guanica
Average Household Size in Guanica is 2.4 People.
How Large is the Labor Force in Guanica?
There are 1,565 People in the Labor Forcein in Guanica.
What is the Percentage of People in the Labor Force in Guanica?
33.7% of People are in the Labor Force in Guanica.
What is the Unemployment Rate in Guanica?
Unemployment Rate in Guanica is 29.1%.