Taos, NM Map & Demographics
Taos Map
Taos Overview
$36,669
PER CAPITA INCOME
$48,813
AVG FAMILY INCOME
$40,185
AVG HOUSEHOLD INCOME
20.7%
WAGE / INCOME GAP [ % ]
79.3¢/ $1
WAGE / INCOME GAP [ $ ]
$9,580
FAMILY INCOME DEFICIT
0.54
INEQUALITY / GINI INDEX
6,458
TOTAL POPULATION
3,247
MALE POPULATION
3,211
FEMALE POPULATION
101.12
MALES / 100 FEMALES
98.89
FEMALES / 100 MALES
49.3
MEDIAN AGE
3.8
AVG FAMILY SIZE
2.1
AVG HOUSEHOLD SIZE
3,137
LABOR FORCE [ PEOPLE ]
53.0%
PERCENT IN LABOR FORCE
8.9%
UNEMPLOYMENT RATE
Taos Zip Codes
Taos Area Codes
Income in Taos
Income Overview in Taos
Per Capita Income in Taos is $36,669, while median incomes of families and households are $48,813 and $40,185 respectively.
| Characteristic | Number | Measure |
| Per Capita Income | 6,458 | $36,669 |
| Median Family Income | 1,071 | $48,813 |
| Mean Family Income | 1,071 | $75,511 |
| Median Household Income | 2,886 | $40,185 |
| Mean Household Income | 2,886 | $69,813 |
| Income Deficit | 1,071 | $9,580 |
| Wage / Income Gap (%) | 6,458 | 20.73% |
| Wage / Income Gap ($) | 6,458 | 79.27¢ per $1 |
| Gini / Inequality Index | 6,458 | 0.54 |
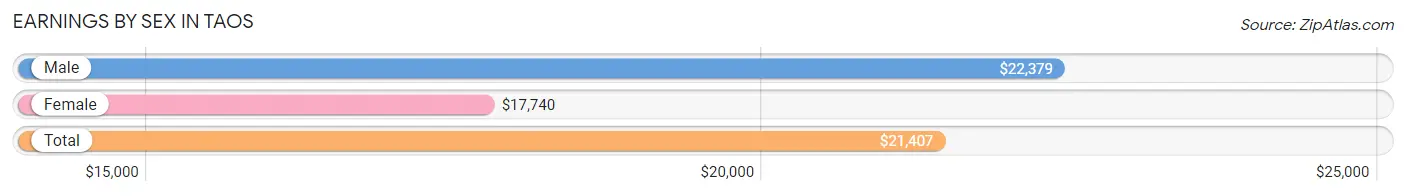
Earnings by Sex in Taos
Average Earnings in Taos are $21,407, $22,379 for men and $17,740 for women, a difference of 20.7%.
| Sex | Number | Average Earnings |
| Male | 1,555 (47.3%) | $22,379 |
| Female | 1,731 (52.7%) | $17,740 |
| Total | 3,286 (100.0%) | $21,407 |
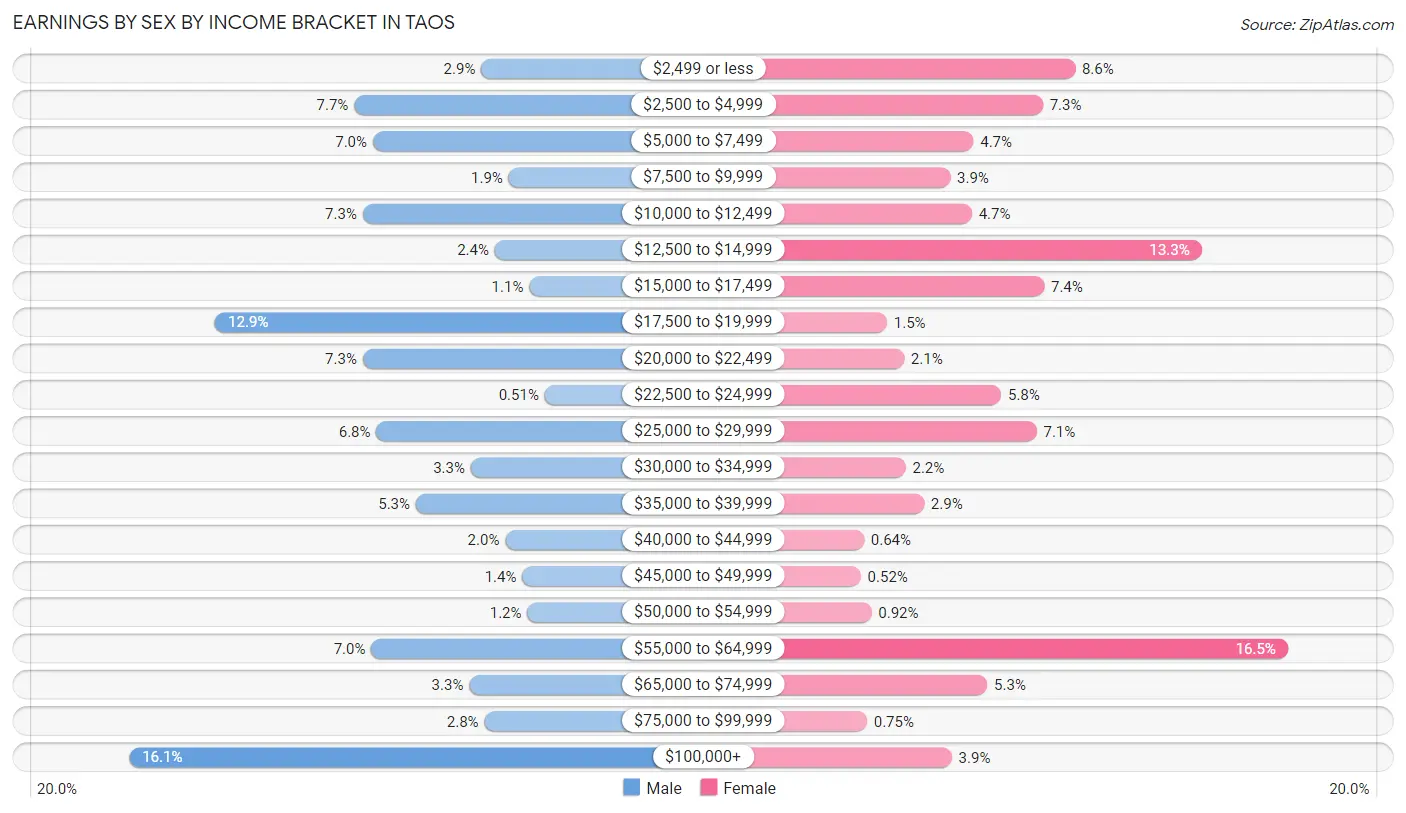
Earnings by Sex by Income Bracket in Taos
The most common earnings brackets in Taos are $100,000+ for men (250 | 16.1%) and $55,000 to $64,999 for women (286 | 16.5%).
| Income | Male | Female |
| $2,499 or less | 45 (2.9%) | 148 (8.6%) |
| $2,500 to $4,999 | 119 (7.6%) | 127 (7.3%) |
| $5,000 to $7,499 | 108 (7.0%) | 82 (4.7%) |
| $7,500 to $9,999 | 29 (1.9%) | 67 (3.9%) |
| $10,000 to $12,499 | 114 (7.3%) | 81 (4.7%) |
| $12,500 to $14,999 | 37 (2.4%) | 230 (13.3%) |
| $15,000 to $17,499 | 17 (1.1%) | 128 (7.4%) |
| $17,500 to $19,999 | 200 (12.9%) | 26 (1.5%) |
| $20,000 to $22,499 | 114 (7.3%) | 37 (2.1%) |
| $22,500 to $24,999 | 8 (0.5%) | 100 (5.8%) |
| $25,000 to $29,999 | 106 (6.8%) | 123 (7.1%) |
| $30,000 to $34,999 | 51 (3.3%) | 38 (2.2%) |
| $35,000 to $39,999 | 83 (5.3%) | 50 (2.9%) |
| $40,000 to $44,999 | 31 (2.0%) | 11 (0.6%) |
| $45,000 to $49,999 | 21 (1.3%) | 9 (0.5%) |
| $50,000 to $54,999 | 18 (1.2%) | 16 (0.9%) |
| $55,000 to $64,999 | 109 (7.0%) | 286 (16.5%) |
| $65,000 to $74,999 | 52 (3.3%) | 91 (5.3%) |
| $75,000 to $99,999 | 43 (2.8%) | 13 (0.7%) |
| $100,000+ | 250 (16.1%) | 68 (3.9%) |
| Total | 1,555 (100.0%) | 1,731 (100.0%) |
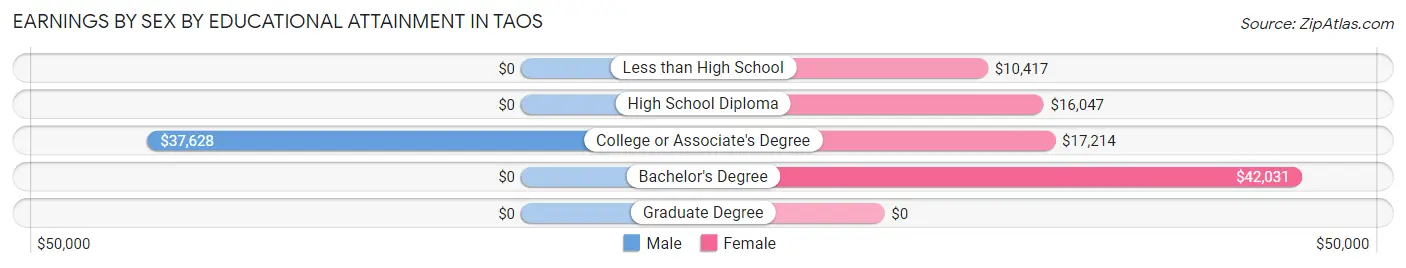
Earnings by Sex by Educational Attainment in Taos
Average earnings in Taos are $34,414 for men and $23,238 for women, a difference of 32.5%. Men with an educational attainment of college or associate's degree enjoy the highest average annual earnings of $37,628, while those with college or associate's degree education earn the least with $37,628. Women with an educational attainment of bachelor's degree earn the most with the average annual earnings of $42,031, while those with less than high school education have the smallest earnings of $10,417.
| Educational Attainment | Male Income | Female Income |
| Less than High School | - | - |
| High School Diploma | - | - |
| College or Associate's Degree | $37,628 | $17,214 |
| Bachelor's Degree | - | - |
| Graduate Degree | - | - |
| Total | $34,414 | $23,238 |
Family Income in Taos
Family Income Brackets in Taos
According to the Taos family income data, there are 239 families falling into the $15,000 to $24,999 income range, which is the most common income bracket and makes up 22.3% of all families. Conversely, the $10,000 to $14,999 income bracket is the least frequent group with only 18 families (1.7%) belonging to this category.
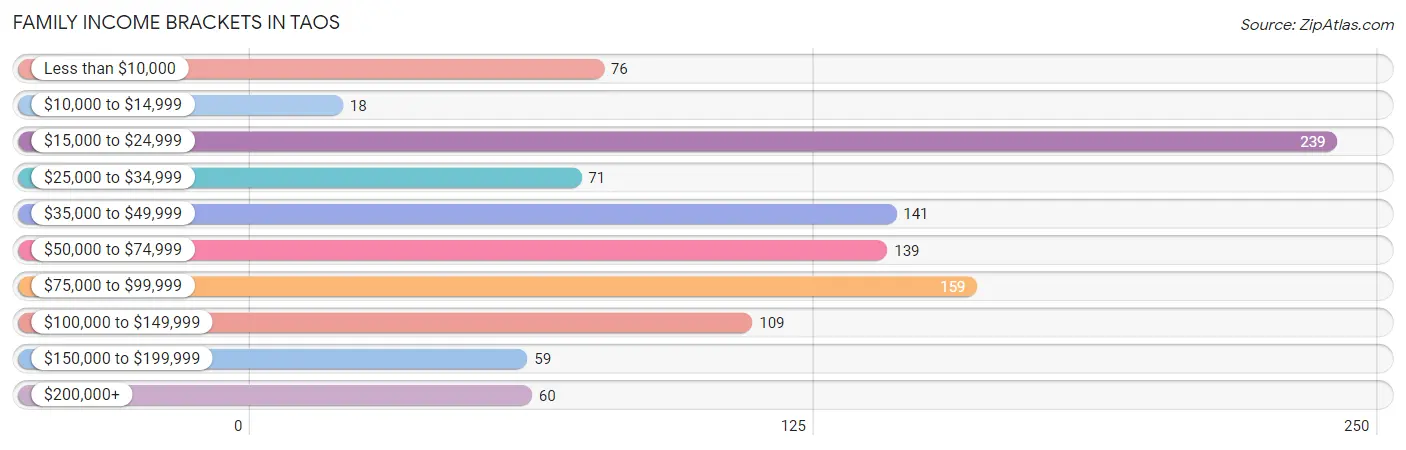
| Income Bracket | # Families | % Families |
| Less than $10,000 | 76 | 7.1% |
| $10,000 to $14,999 | 18 | 1.7% |
| $15,000 to $24,999 | 239 | 22.3% |
| $25,000 to $34,999 | 71 | 6.6% |
| $35,000 to $49,999 | 141 | 13.2% |
| $50,000 to $74,999 | 139 | 13.0% |
| $75,000 to $99,999 | 159 | 14.8% |
| $100,000 to $149,999 | 109 | 10.2% |
| $150,000 to $199,999 | 59 | 5.5% |
| $200,000+ | 60 | 5.6% |
Family Income by Famaliy Size in Taos
5-person families (102 | 9.5%) account for the highest median family income in Taos with $81,542 per family, while 3-person families (137 | 12.8%) have the highest median income of $20,972 per family member.
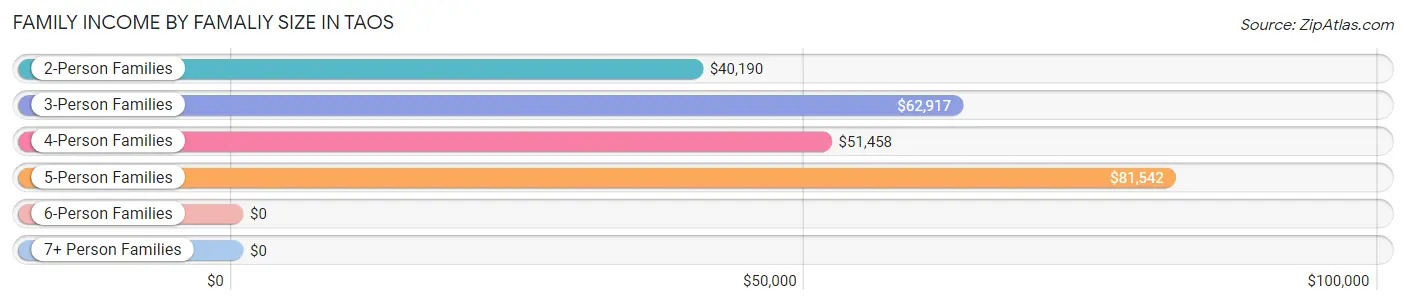
| Income Bracket | # Families | Median Income |
| 2-Person Families | 767 (71.6%) | $40,190 |
| 3-Person Families | 137 (12.8%) | $62,917 |
| 4-Person Families | 65 (6.1%) | $51,458 |
| 5-Person Families | 102 (9.5%) | $81,542 |
| 6-Person Families | 0 (0.0%) | $0 |
| 7+ Person Families | 0 (0.0%) | $0 |
| Total | 1,071 (100.0%) | $48,813 |
Family Income by Number of Earners in Taos
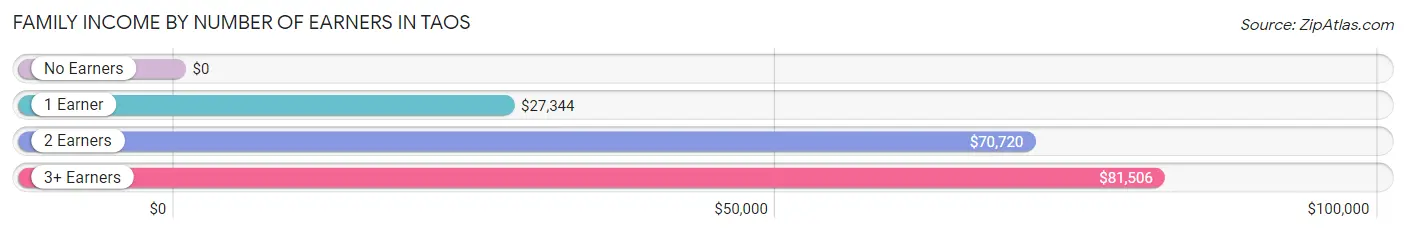
| Number of Earners | # Families | Median Income |
| No Earners | 239 (22.3%) | $0 |
| 1 Earner | 429 (40.1%) | $27,344 |
| 2 Earners | 281 (26.2%) | $70,720 |
| 3+ Earners | 122 (11.4%) | $81,506 |
| Total | 1,071 (100.0%) | $48,813 |
Household Income in Taos
Household Income Brackets in Taos
With 646 households falling in the category, the $15,000 to $24,999 income range is the most frequent in Taos, accounting for 22.4% of all households. In contrast, only 66 households (2.3%) fall into the $150,000 to $199,999 income bracket, making it the least populous group.
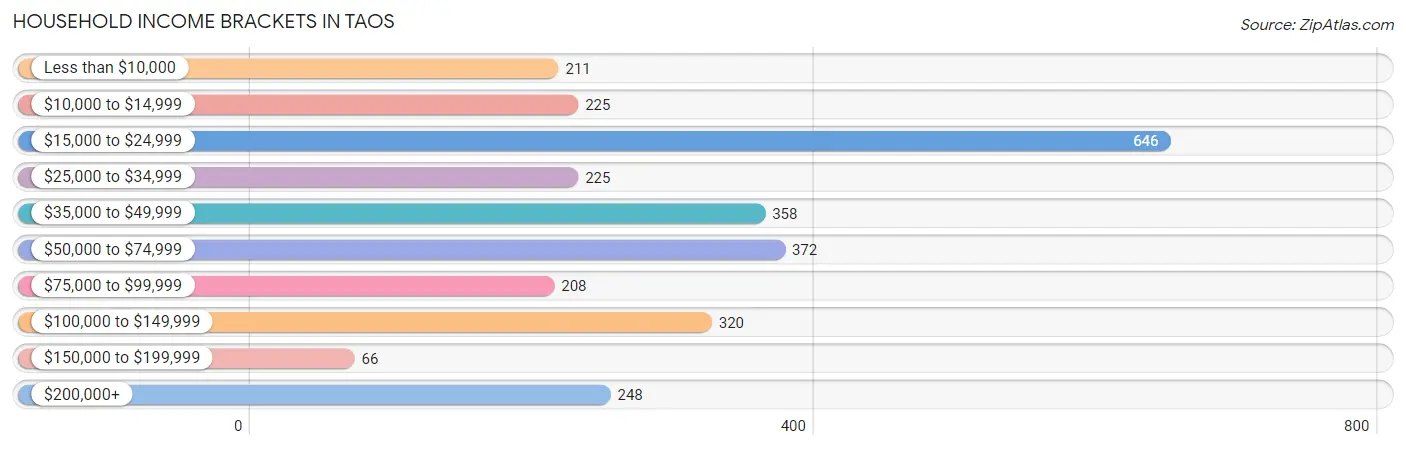
| Income Bracket | # Households | % Households |
| Less than $10,000 | 211 | 7.3% |
| $10,000 to $14,999 | 225 | 7.8% |
| $15,000 to $24,999 | 646 | 22.4% |
| $25,000 to $34,999 | 225 | 7.8% |
| $35,000 to $49,999 | 358 | 12.4% |
| $50,000 to $74,999 | 372 | 12.9% |
| $75,000 to $99,999 | 208 | 7.2% |
| $100,000 to $149,999 | 320 | 11.1% |
| $150,000 to $199,999 | 66 | 2.3% |
| $200,000+ | 248 | 8.6% |
Household Income by Householder Age in Taos
The median household income in Taos is $40,185, with the highest median household income of $61,250 found in the 25 to 44 years age bracket for the primary householder. A total of 481 households (16.7%) fall into this category. Meanwhile, the 65+ years age bracket for the primary householder has the lowest median household income of $34,091, with 1,238 households (42.9%) in this group.
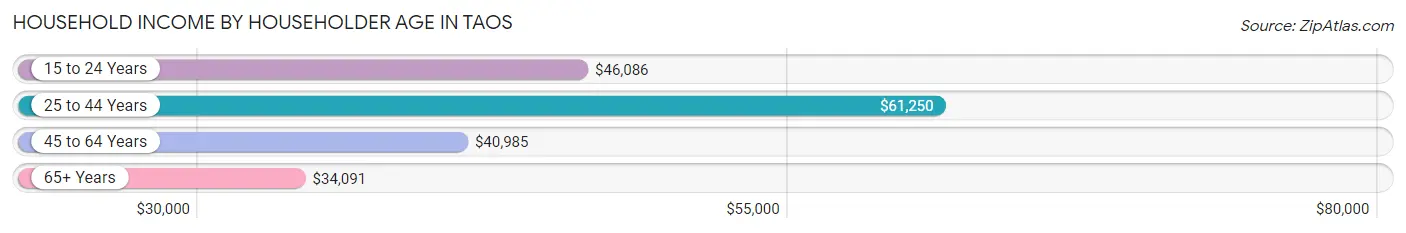
| Income Bracket | # Households | Median Income |
| 15 to 24 Years | 125 (4.3%) | $46,086 |
| 25 to 44 Years | 481 (16.7%) | $61,250 |
| 45 to 64 Years | 1,042 (36.1%) | $40,985 |
| 65+ Years | 1,238 (42.9%) | $34,091 |
| Total | 2,886 (100.0%) | $40,185 |
Poverty in Taos
Income Below Poverty by Sex and Age in Taos
With 14.6% poverty level for males and 18.0% for females among the residents of Taos, 5 year old males and 25 to 34 year old females are the most vulnerable to poverty, with 15 males (100.0%) and 132 females (55.0%) in their respective age groups living below the poverty level.
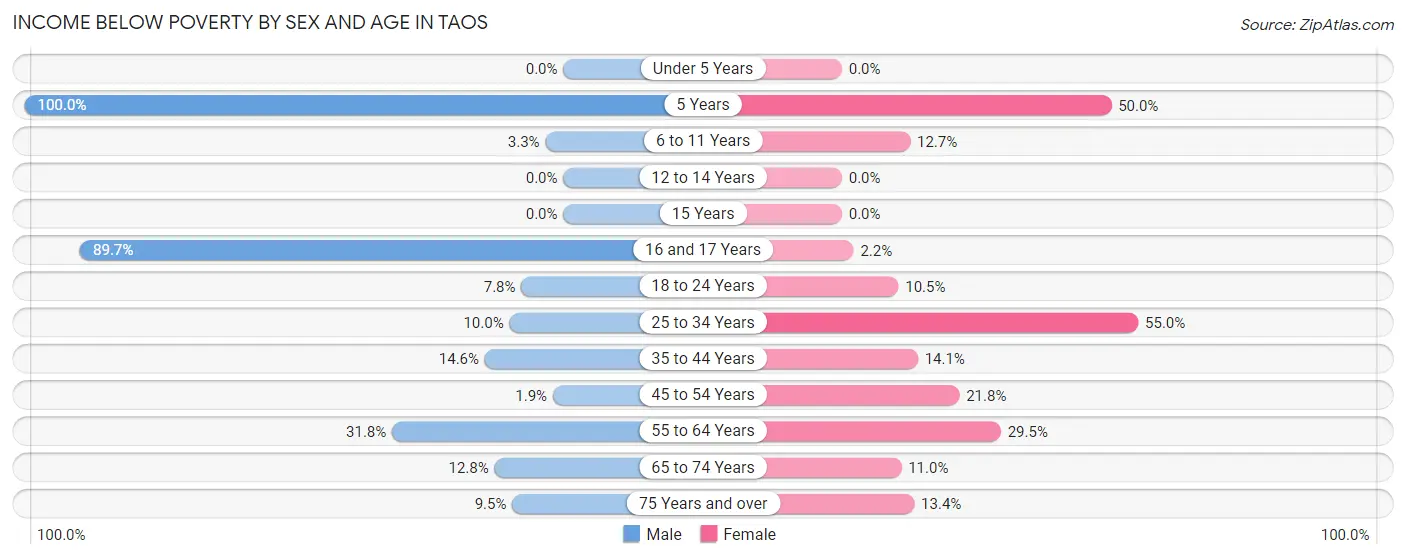
| Age Bracket | Male | Female |
| Under 5 Years | 0 (0.0%) | 0 (0.0%) |
| 5 Years | 15 (100.0%) | 3 (50.0%) |
| 6 to 11 Years | 5 (3.3%) | 10 (12.7%) |
| 12 to 14 Years | 0 (0.0%) | 0 (0.0%) |
| 15 Years | 0 (0.0%) | 0 (0.0%) |
| 16 and 17 Years | 87 (89.7%) | 3 (2.2%) |
| 18 to 24 Years | 25 (7.8%) | 28 (10.5%) |
| 25 to 34 Years | 22 (10.0%) | 132 (55.0%) |
| 35 to 44 Years | 66 (14.6%) | 73 (14.1%) |
| 45 to 54 Years | 8 (1.9%) | 63 (21.8%) |
| 55 to 64 Years | 117 (31.8%) | 123 (29.5%) |
| 65 to 74 Years | 93 (12.8%) | 57 (11.0%) |
| 75 Years and over | 22 (9.5%) | 67 (13.4%) |
| Total | 460 (14.6%) | 559 (18.0%) |
Income Above Poverty by Sex and Age in Taos
According to the poverty statistics in Taos, males aged under 5 years and females aged under 5 years are the age groups that are most secure financially, with 100.0% of males and 100.0% of females in these age groups living above the poverty line.
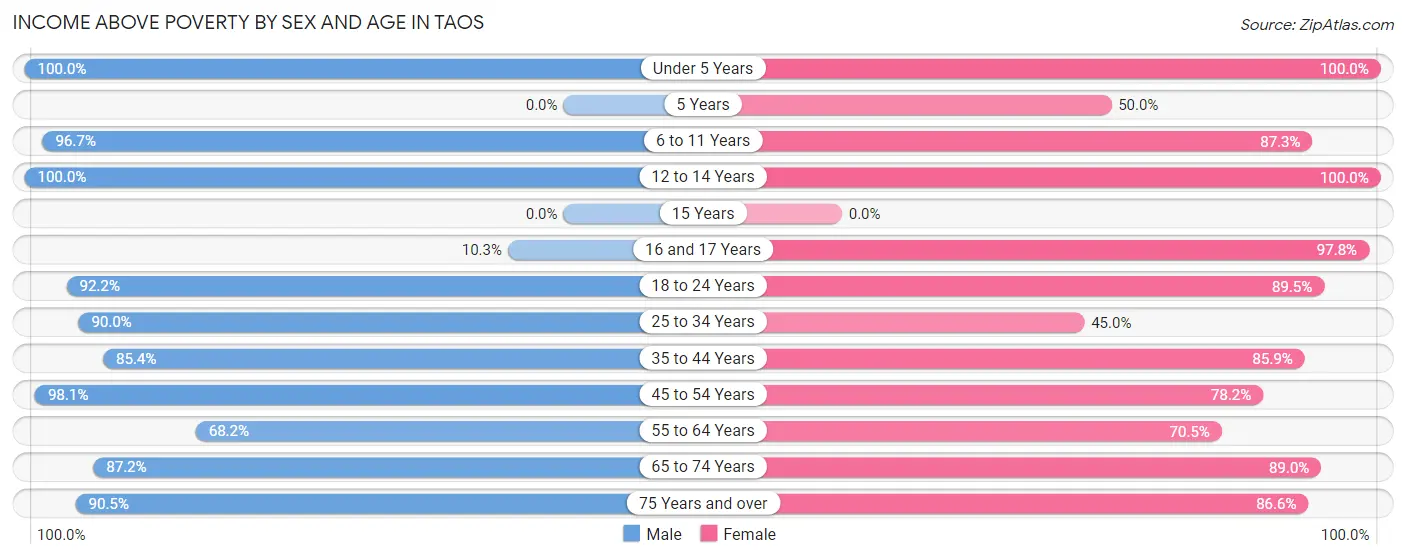
| Age Bracket | Male | Female |
| Under 5 Years | 7 (100.0%) | 70 (100.0%) |
| 5 Years | 0 (0.0%) | 3 (50.0%) |
| 6 to 11 Years | 145 (96.7%) | 69 (87.3%) |
| 12 to 14 Years | 145 (100.0%) | 64 (100.0%) |
| 15 Years | 0 (0.0%) | 0 (0.0%) |
| 16 and 17 Years | 10 (10.3%) | 135 (97.8%) |
| 18 to 24 Years | 296 (92.2%) | 239 (89.5%) |
| 25 to 34 Years | 198 (90.0%) | 108 (45.0%) |
| 35 to 44 Years | 387 (85.4%) | 445 (85.9%) |
| 45 to 54 Years | 407 (98.1%) | 226 (78.2%) |
| 55 to 64 Years | 251 (68.2%) | 294 (70.5%) |
| 65 to 74 Years | 635 (87.2%) | 460 (89.0%) |
| 75 Years and over | 210 (90.5%) | 432 (86.6%) |
| Total | 2,691 (85.4%) | 2,545 (82.0%) |
Income Below Poverty Among Married-Couple Families in Taos
The poverty statistics for married-couple families in Taos show that 13.9% or 92 of the total 663 families live below the poverty line. Families with no children have the highest poverty rate of 16.9%, comprising of 85 families. On the other hand, families with 3 or 4 children have the lowest poverty rate of 0.0%, which includes 0 families.
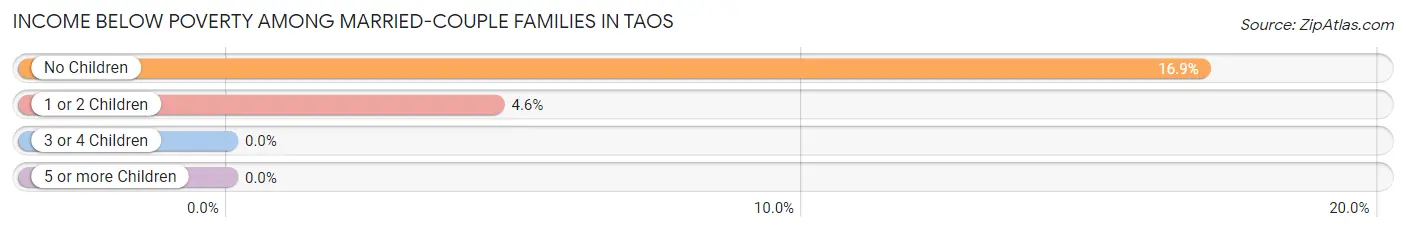
| Children | Above Poverty | Below Poverty |
| No Children | 417 (83.1%) | 85 (16.9%) |
| 1 or 2 Children | 144 (95.4%) | 7 (4.6%) |
| 3 or 4 Children | 10 (100.0%) | 0 (0.0%) |
| 5 or more Children | 0 (0.0%) | 0 (0.0%) |
| Total | 571 (86.1%) | 92 (13.9%) |
Income Below Poverty Among Single-Parent Households in Taos
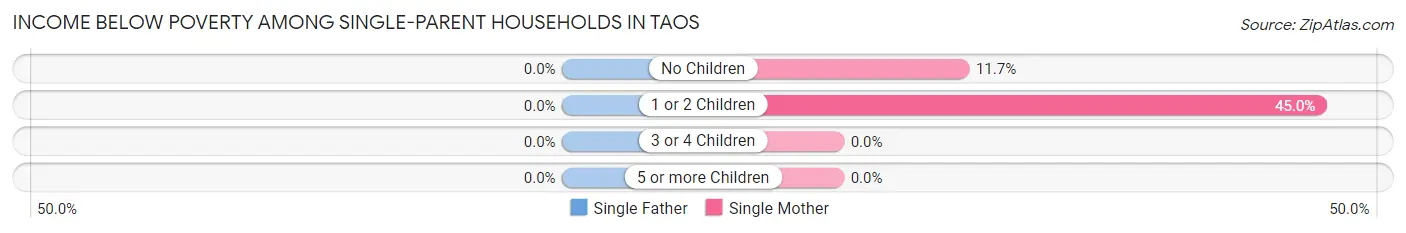
| Children | Single Father | Single Mother |
| No Children | 0 (0.0%) | 21 (11.7%) |
| 1 or 2 Children | 0 (0.0%) | 68 (45.0%) |
| 3 or 4 Children | 0 (0.0%) | 0 (0.0%) |
| 5 or more Children | 0 (0.0%) | 0 (0.0%) |
| Total | 0 (0.0%) | 89 (26.9%) |
Income Below Poverty Among Married-Couple vs Single-Parent Households in Taos
The poverty data for Taos shows that 92 of the married-couple family households (13.9%) and 89 of the single-parent households (21.8%) are living below the poverty level. Within the married-couple family households, those with no children have the highest poverty rate, with 85 households (16.9%) falling below the poverty line. Among the single-parent households, those with 1 or 2 children have the highest poverty rate, with 68 household (33.7%) living below poverty.
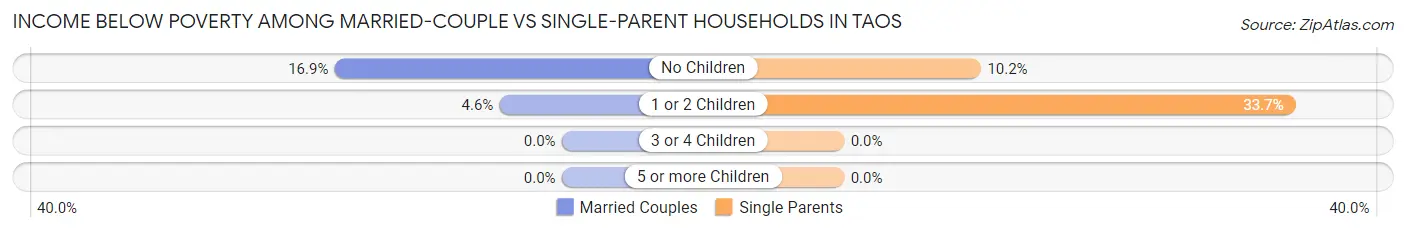
| Children | Married-Couple Families | Single-Parent Households |
| No Children | 85 (16.9%) | 21 (10.2%) |
| 1 or 2 Children | 7 (4.6%) | 68 (33.7%) |
| 3 or 4 Children | 0 (0.0%) | 0 (0.0%) |
| 5 or more Children | 0 (0.0%) | 0 (0.0%) |
| Total | 92 (13.9%) | 89 (21.8%) |
Race in Taos
The most populous races in Taos are White / Caucasian (4,203 | 65.1%), Hispanic or Latino (3,108 | 48.1%), and Two or more Races (1,220 | 18.9%).
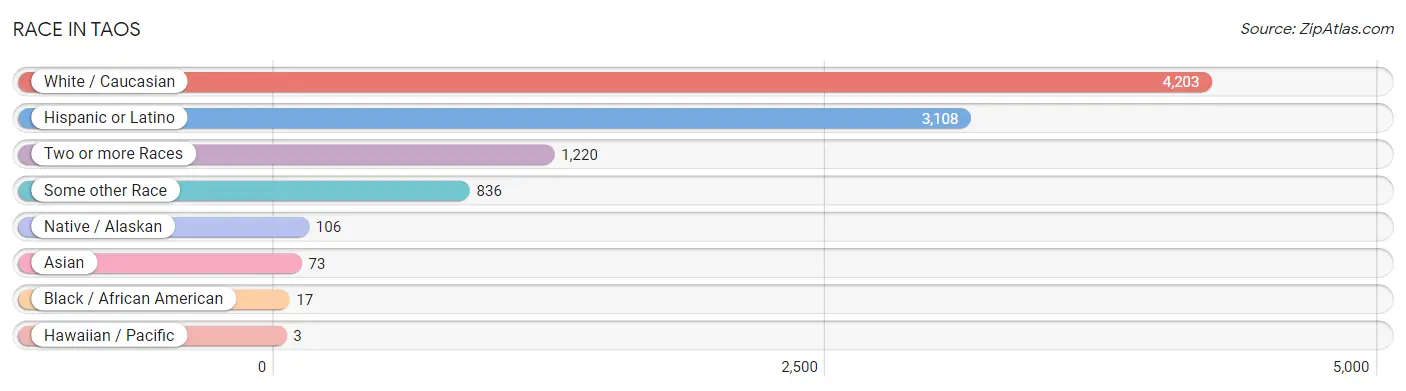
| Race | # Population | % Population |
| Asian | 73 | 1.1% |
| Black / African American | 17 | 0.3% |
| Hawaiian / Pacific | 3 | 0.1% |
| Hispanic or Latino | 3,108 | 48.1% |
| Native / Alaskan | 106 | 1.6% |
| White / Caucasian | 4,203 | 65.1% |
| Two or more Races | 1,220 | 18.9% |
| Some other Race | 836 | 13.0% |
| Total | 6,458 | 100.0% |
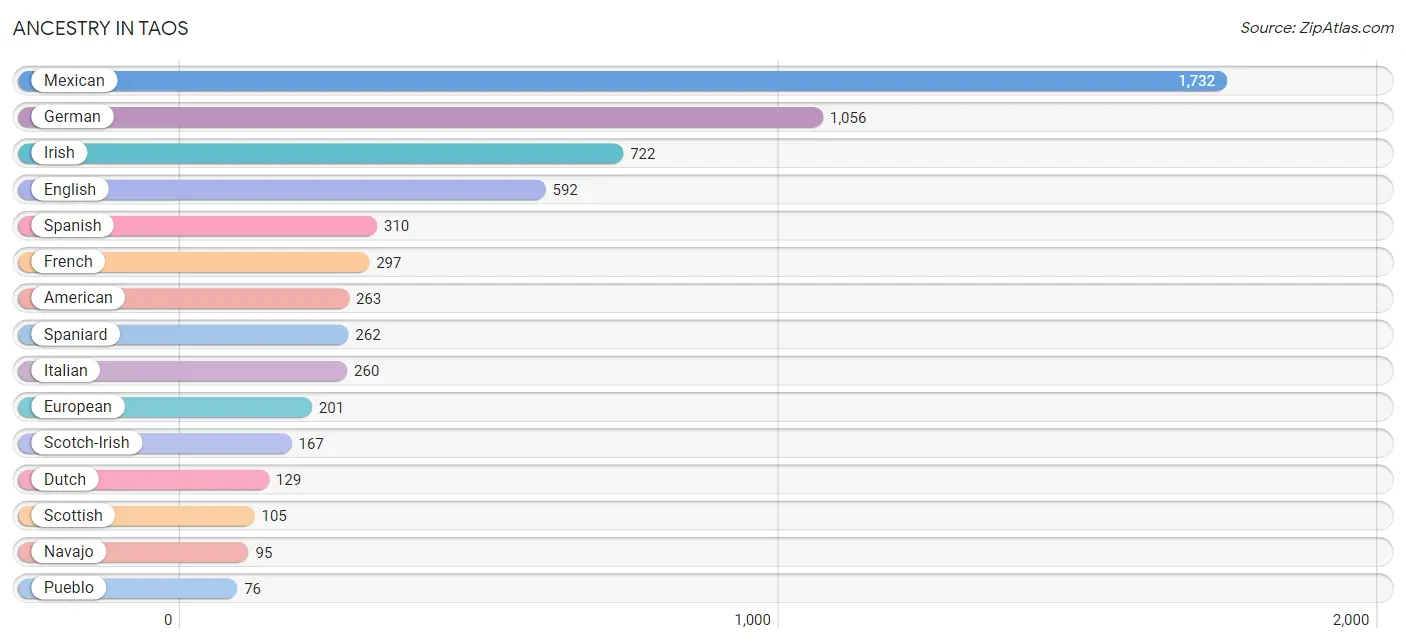
Ancestry in Taos
The most populous ancestries reported in Taos are Mexican (1,732 | 26.8%), German (1,056 | 16.4%), Irish (722 | 11.2%), English (592 | 9.2%), and Spanish (310 | 4.8%), together accounting for 68.3% of all Taos residents.
| Ancestry | # Population | % Population |
| African | 1 | 0.0% |
| American | 263 | 4.1% |
| Apache | 29 | 0.4% |
| Arab | 4 | 0.1% |
| Armenian | 6 | 0.1% |
| Austrian | 3 | 0.1% |
| Belgian | 3 | 0.1% |
| Bhutanese | 21 | 0.3% |
| British | 16 | 0.3% |
| Cajun | 9 | 0.1% |
| Canadian | 38 | 0.6% |
| Celtic | 3 | 0.1% |
| Central American | 47 | 0.7% |
| Central American Indian | 3 | 0.1% |
| Colombian | 5 | 0.1% |
| Croatian | 4 | 0.1% |
| Czech | 63 | 1.0% |
| Czechoslovakian | 8 | 0.1% |
| Danish | 59 | 0.9% |
| Dutch | 129 | 2.0% |
| English | 592 | 9.2% |
| European | 201 | 3.1% |
| Finnish | 3 | 0.1% |
| French | 297 | 4.6% |
| French Canadian | 9 | 0.1% |
| German | 1,056 | 16.4% |
| Greek | 3 | 0.1% |
| Guamanian / Chamorro | 3 | 0.1% |
| Guatemalan | 34 | 0.5% |
| Honduran | 13 | 0.2% |
| Hungarian | 22 | 0.3% |
| Irish | 722 | 11.2% |
| Italian | 260 | 4.0% |
| Korean | 31 | 0.5% |
| Latvian | 9 | 0.1% |
| Lebanese | 4 | 0.1% |
| Lithuanian | 30 | 0.5% |
| Luxembourger | 3 | 0.1% |
| Mexican | 1,732 | 26.8% |
| Navajo | 95 | 1.5% |
| Northern European | 22 | 0.3% |
| Norwegian | 59 | 0.9% |
| Pima | 3 | 0.1% |
| Polish | 70 | 1.1% |
| Portuguese | 15 | 0.2% |
| Pueblo | 76 | 1.2% |
| Puerto Rican | 20 | 0.3% |
| Romanian | 21 | 0.3% |
| Russian | 15 | 0.2% |
| Samoan | 70 | 1.1% |
| Scandinavian | 4 | 0.1% |
| Scotch-Irish | 167 | 2.6% |
| Scottish | 105 | 1.6% |
| Serbian | 6 | 0.1% |
| Slovene | 4 | 0.1% |
| South American | 5 | 0.1% |
| Soviet Union | 2 | 0.0% |
| Spaniard | 262 | 4.1% |
| Spanish | 310 | 4.8% |
| Spanish American | 22 | 0.3% |
| Sri Lankan | 64 | 1.0% |
| Subsaharan African | 1 | 0.0% |
| Swedish | 68 | 1.1% |
| Swiss | 30 | 0.5% |
| Ukrainian | 9 | 0.1% |
| Ute | 4 | 0.1% |
| Welsh | 21 | 0.3% | View All 67 Rows |
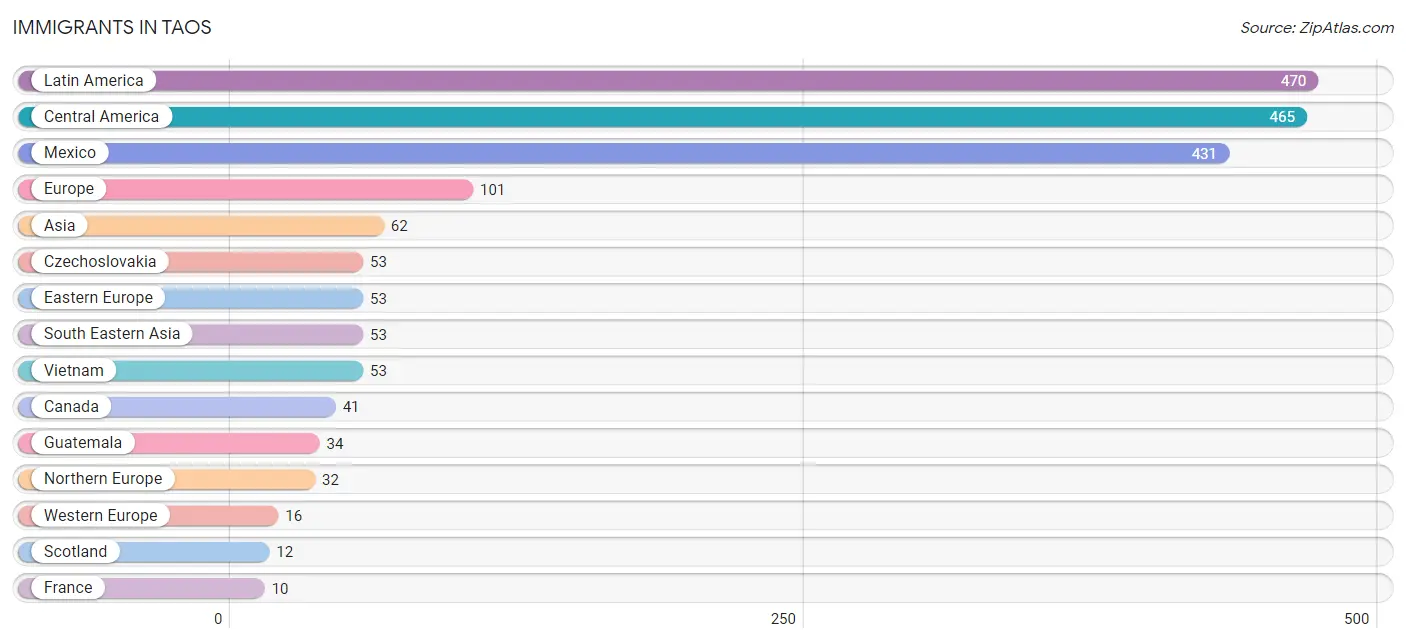
Immigrants in Taos
The most numerous immigrant groups reported in Taos came from Latin America (470 | 7.3%), Central America (465 | 7.2%), Mexico (431 | 6.7%), Europe (101 | 1.6%), and Asia (62 | 1.0%), together accounting for 23.7% of all Taos residents.
| Immigration Origin | # Population | % Population |
| Africa | 3 | 0.1% |
| Asia | 62 | 1.0% |
| Australia | 8 | 0.1% |
| Canada | 41 | 0.6% |
| Central America | 465 | 7.2% |
| Colombia | 5 | 0.1% |
| Czechoslovakia | 53 | 0.8% |
| Eastern Africa | 3 | 0.1% |
| Eastern Asia | 9 | 0.1% |
| Eastern Europe | 53 | 0.8% |
| England | 7 | 0.1% |
| Europe | 101 | 1.6% |
| France | 10 | 0.2% |
| Germany | 6 | 0.1% |
| Guatemala | 34 | 0.5% |
| Japan | 9 | 0.1% |
| Latin America | 470 | 7.3% |
| Mexico | 431 | 6.7% |
| Northern Europe | 32 | 0.5% |
| Oceania | 8 | 0.1% |
| Scotland | 12 | 0.2% |
| South America | 5 | 0.1% |
| South Eastern Asia | 53 | 0.8% |
| Sweden | 3 | 0.1% |
| Vietnam | 53 | 0.8% |
| Western Europe | 16 | 0.3% | View All 26 Rows |
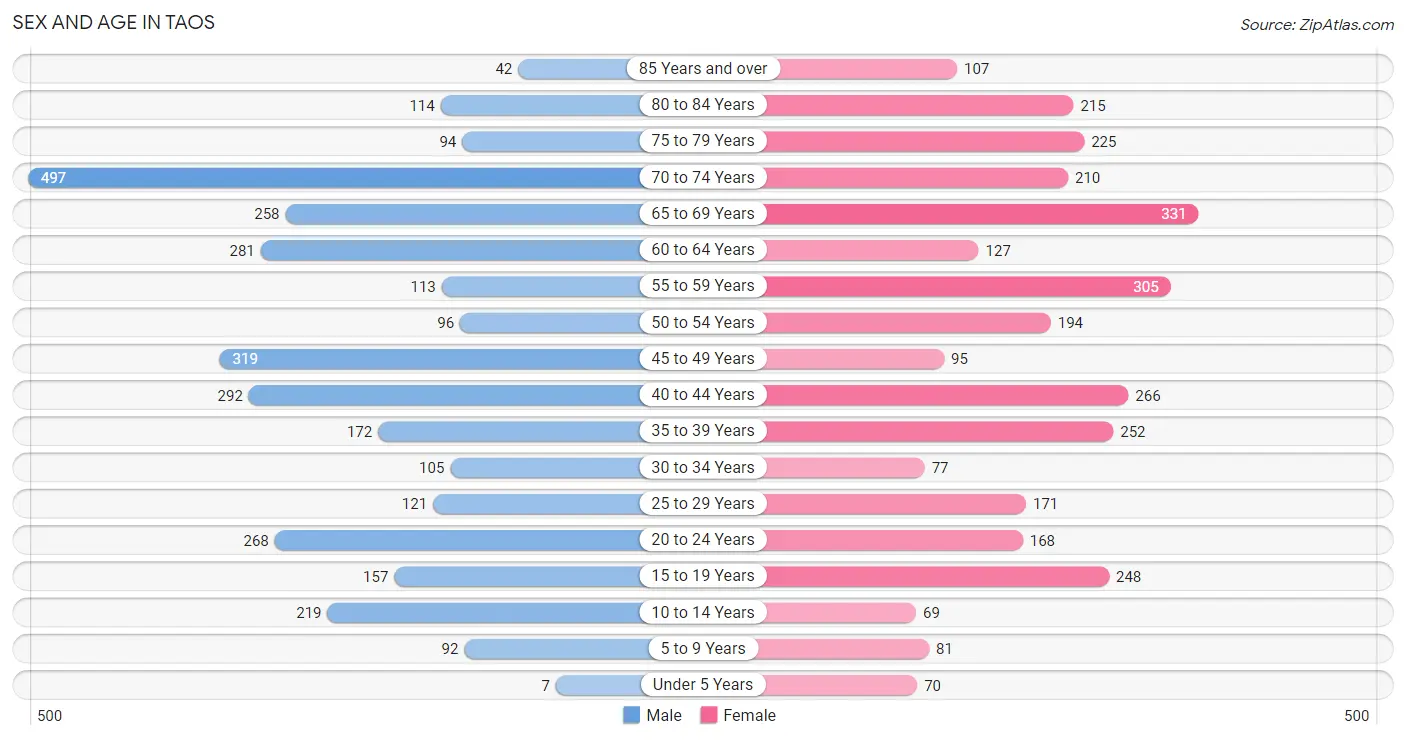
Sex and Age in Taos
Sex and Age in Taos
The most populous age groups in Taos are 70 to 74 Years (497 | 15.3%) for men and 65 to 69 Years (331 | 10.3%) for women.
| Age Bracket | Male | Female |
| Under 5 Years | 7 (0.2%) | 70 (2.2%) |
| 5 to 9 Years | 92 (2.8%) | 81 (2.5%) |
| 10 to 14 Years | 219 (6.7%) | 69 (2.1%) |
| 15 to 19 Years | 157 (4.8%) | 248 (7.7%) |
| 20 to 24 Years | 268 (8.3%) | 168 (5.2%) |
| 25 to 29 Years | 121 (3.7%) | 171 (5.3%) |
| 30 to 34 Years | 105 (3.2%) | 77 (2.4%) |
| 35 to 39 Years | 172 (5.3%) | 252 (7.9%) |
| 40 to 44 Years | 292 (9.0%) | 266 (8.3%) |
| 45 to 49 Years | 319 (9.8%) | 95 (3.0%) |
| 50 to 54 Years | 96 (3.0%) | 194 (6.0%) |
| 55 to 59 Years | 113 (3.5%) | 305 (9.5%) |
| 60 to 64 Years | 281 (8.6%) | 127 (4.0%) |
| 65 to 69 Years | 258 (8.0%) | 331 (10.3%) |
| 70 to 74 Years | 497 (15.3%) | 210 (6.5%) |
| 75 to 79 Years | 94 (2.9%) | 225 (7.0%) |
| 80 to 84 Years | 114 (3.5%) | 215 (6.7%) |
| 85 Years and over | 42 (1.3%) | 107 (3.3%) |
| Total | 3,247 (100.0%) | 3,211 (100.0%) |
Families and Households in Taos
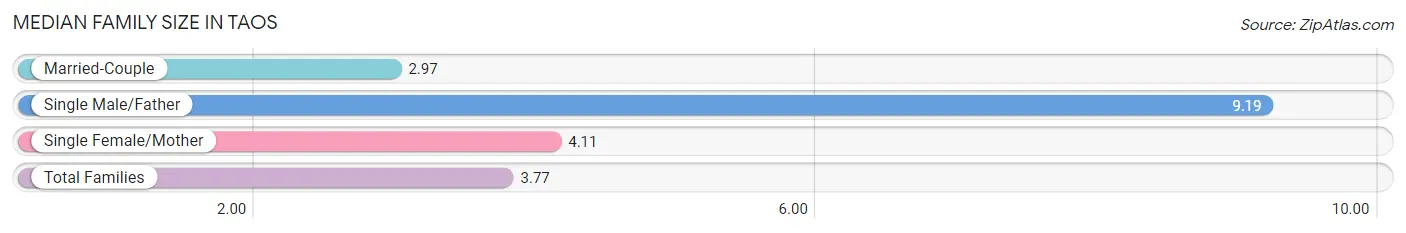
Median Family Size in Taos
The median family size in Taos is 3.77 persons per family, with single male/father families (77 | 7.2%) accounting for the largest median family size of 9.19 persons per family. On the other hand, married-couple families (663 | 61.9%) represent the smallest median family size with 2.97 persons per family.
| Family Type | # Families | Family Size |
| Married-Couple | 663 (61.9%) | 2.97 |
| Single Male/Father | 77 (7.2%) | 9.19 |
| Single Female/Mother | 331 (30.9%) | 4.11 |
| Total Families | 1,071 (100.0%) | 3.77 |
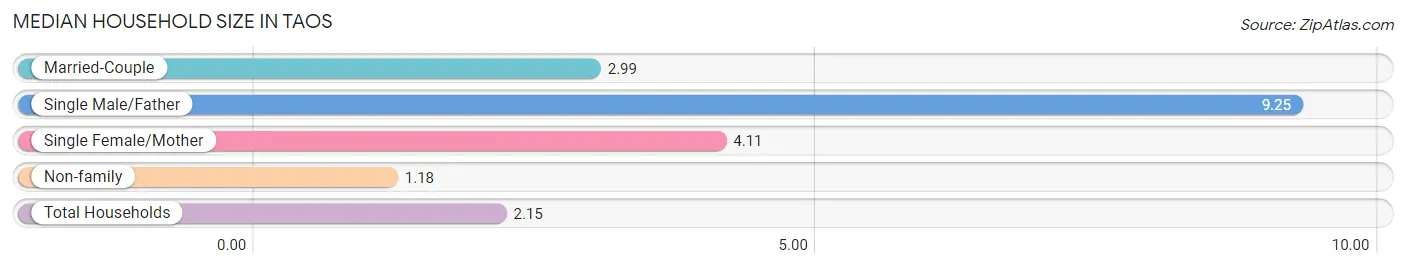
Median Household Size in Taos
The median household size in Taos is 2.15 persons per household, with single male/father households (77 | 2.7%) accounting for the largest median household size of 9.25 persons per household. non-family households (1,815 | 62.9%) represent the smallest median household size with 1.18 persons per household.
| Household Type | # Households | Household Size |
| Married-Couple | 663 (23.0%) | 2.99 |
| Single Male/Father | 77 (2.7%) | 9.25 |
| Single Female/Mother | 331 (11.5%) | 4.11 |
| Non-family | 1,815 (62.9%) | 1.18 |
| Total Households | 2,886 (100.0%) | 2.15 |
Household Size by Marriage Status in Taos
Out of a total of 2,886 households in Taos, 1,071 (37.1%) are family households, while 1,815 (62.9%) are nonfamily households. The most numerous type of family households are 2-person households, comprising 756, and the most common type of nonfamily households are 1-person households, comprising 1,578.
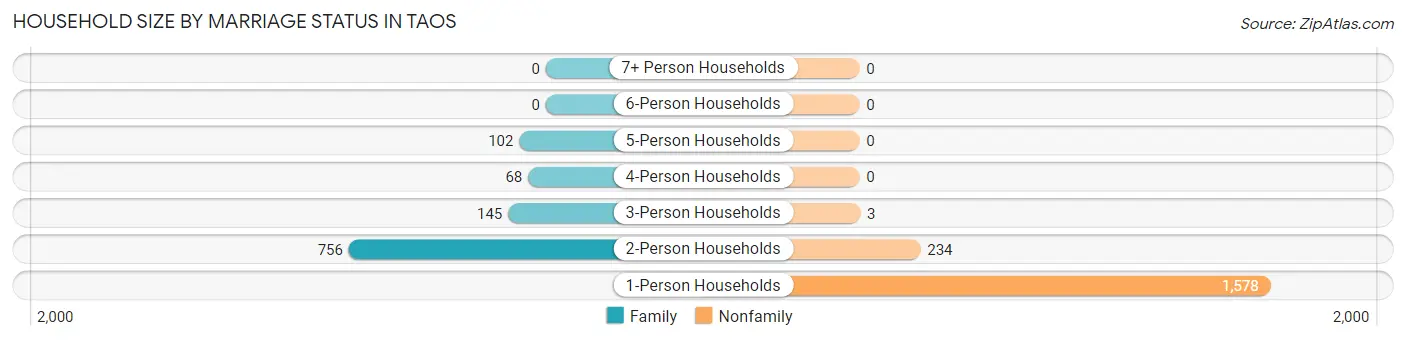
| Household Size | Family Households | Nonfamily Households |
| 1-Person Households | - | 1,578 (54.7%) |
| 2-Person Households | 756 (26.2%) | 234 (8.1%) |
| 3-Person Households | 145 (5.0%) | 3 (0.1%) |
| 4-Person Households | 68 (2.4%) | 0 (0.0%) |
| 5-Person Households | 102 (3.5%) | 0 (0.0%) |
| 6-Person Households | 0 (0.0%) | 0 (0.0%) |
| 7+ Person Households | 0 (0.0%) | 0 (0.0%) |
| Total | 1,071 (37.1%) | 1,815 (62.9%) |
Female Fertility in Taos
Fertility by Age in Taos
Average fertility rate in Taos is 4.0 births per 1,000 women. Women in the age bracket of 20 to 34 years have the highest fertility rate with 14.0 births per 1,000 women. Women in the age bracket of 20 to 34 years acount for 100.0% of all women with births.
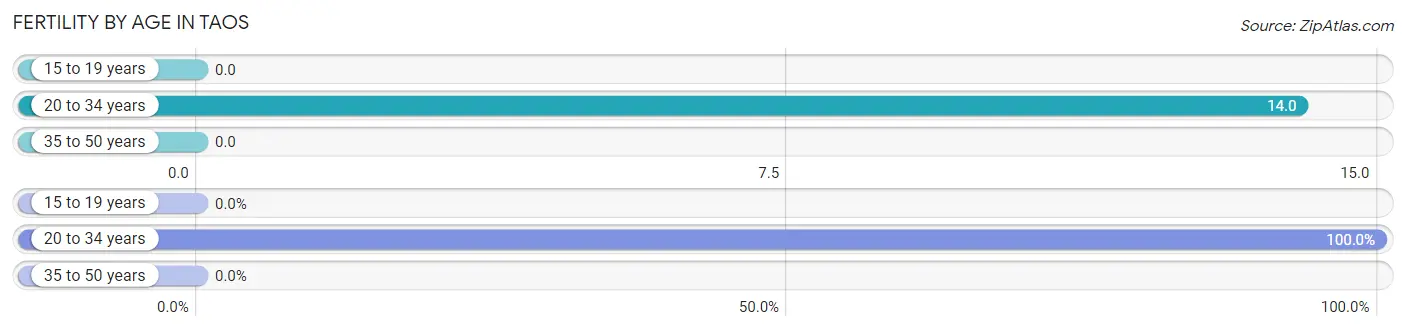
| Age Bracket | Women with Births | Births / 1,000 Women |
| 15 to 19 years | 0 (0.0%) | 0.0 |
| 20 to 34 years | 6 (100.0%) | 14.0 |
| 35 to 50 years | 0 (0.0%) | 0.0 |
| Total | 6 (100.0%) | 4.0 |
Fertility by Age by Marriage Status in Taos
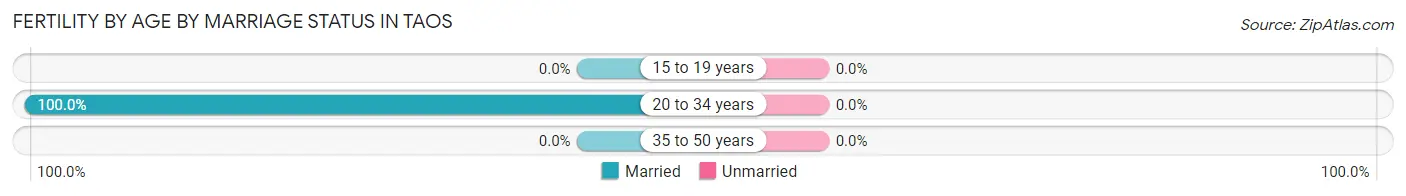
| Age Bracket | Married | Unmarried |
| 15 to 19 years | 0 (0.0%) | 0 (0.0%) |
| 20 to 34 years | 6 (100.0%) | 0 (0.0%) |
| 35 to 50 years | 0 (0.0%) | 0 (0.0%) |
| Total | 6 (100.0%) | 0 (0.0%) |
Fertility by Education in Taos
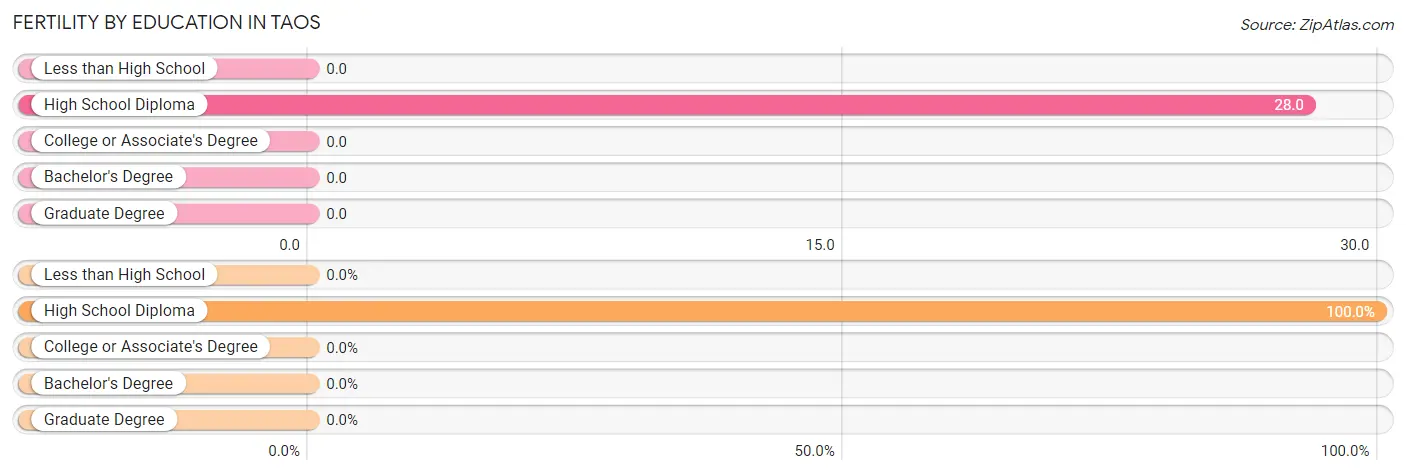
| Educational Attainment | Women with Births | Births / 1,000 Women |
| Less than High School | 0 (0.0%) | 0.0 |
| High School Diploma | 6 (100.0%) | 28.0 |
| College or Associate's Degree | 0 (0.0%) | 0.0 |
| Bachelor's Degree | 0 (0.0%) | 0.0 |
| Graduate Degree | 0 (0.0%) | 0.0 |
| Total | 6 (100.0%) | 4.0 |
Fertility by Education by Marriage Status in Taos
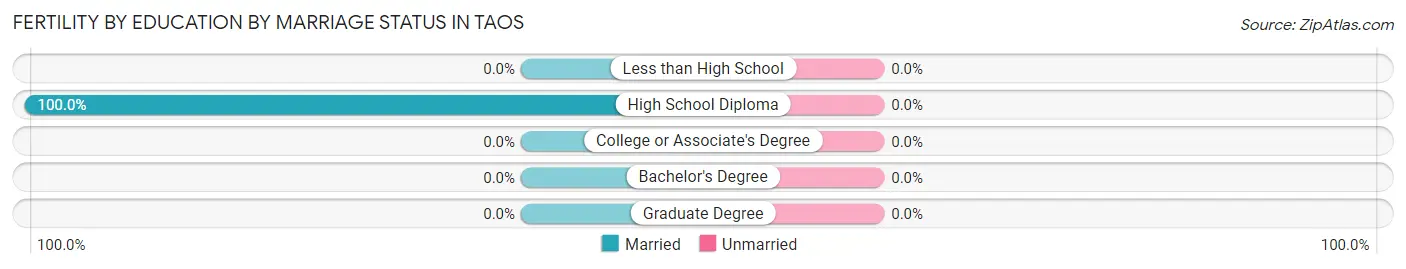
| Educational Attainment | Married | Unmarried |
| Less than High School | 0 (0.0%) | 0 (0.0%) |
| High School Diploma | 6 (100.0%) | 0 (0.0%) |
| College or Associate's Degree | 0 (0.0%) | 0 (0.0%) |
| Bachelor's Degree | 0 (0.0%) | 0 (0.0%) |
| Graduate Degree | 0 (0.0%) | 0 (0.0%) |
| Total | 6 (100.0%) | 0 (0.0%) |
Employment Characteristics in Taos
Employment by Class of Employer in Taos
Among the 2,709 employed individuals in Taos, private company employees (1,291 | 47.7%), not-for-profit organizations (420 | 15.5%), and self-employed (not incorporated) (354 | 13.1%) make up the most common classes of employment.
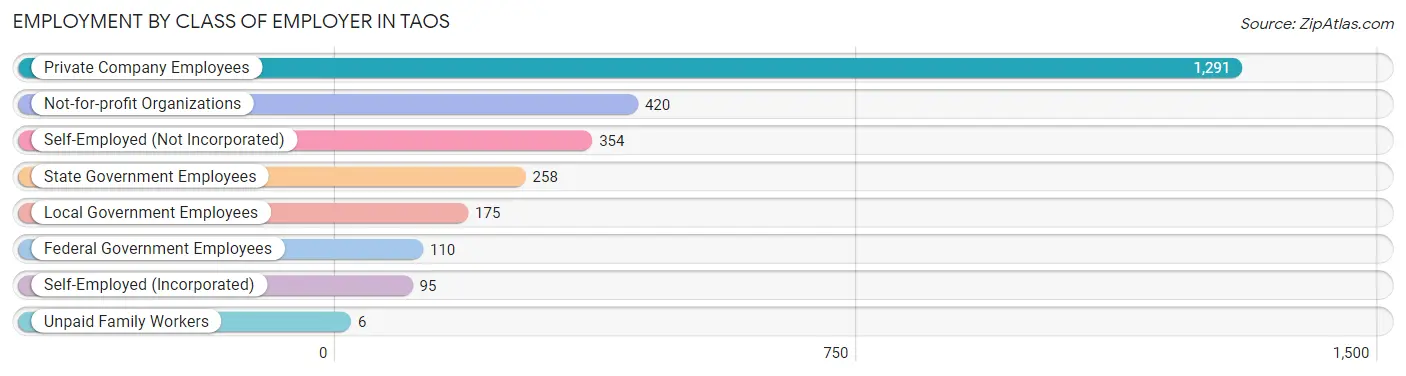
| Employer Class | # Employees | % Employees |
| Private Company Employees | 1,291 | 47.7% |
| Self-Employed (Incorporated) | 95 | 3.5% |
| Self-Employed (Not Incorporated) | 354 | 13.1% |
| Not-for-profit Organizations | 420 | 15.5% |
| Local Government Employees | 175 | 6.5% |
| State Government Employees | 258 | 9.5% |
| Federal Government Employees | 110 | 4.1% |
| Unpaid Family Workers | 6 | 0.2% |
| Total | 2,709 | 100.0% |
Employment Status by Age in Taos
According to the labor force statistics for Taos, out of the total population over 16 years of age (5,918), 53.0% or 3,137 individuals are in the labor force, with 8.9% or 279 of them unemployed. The age group with the highest labor force participation rate is 20 to 24 years, with 86.9% or 379 individuals in the labor force. Within the labor force, the 25 to 29 years age range has the highest percentage of unemployed individuals, with 56.4% or 102 of them being unemployed.
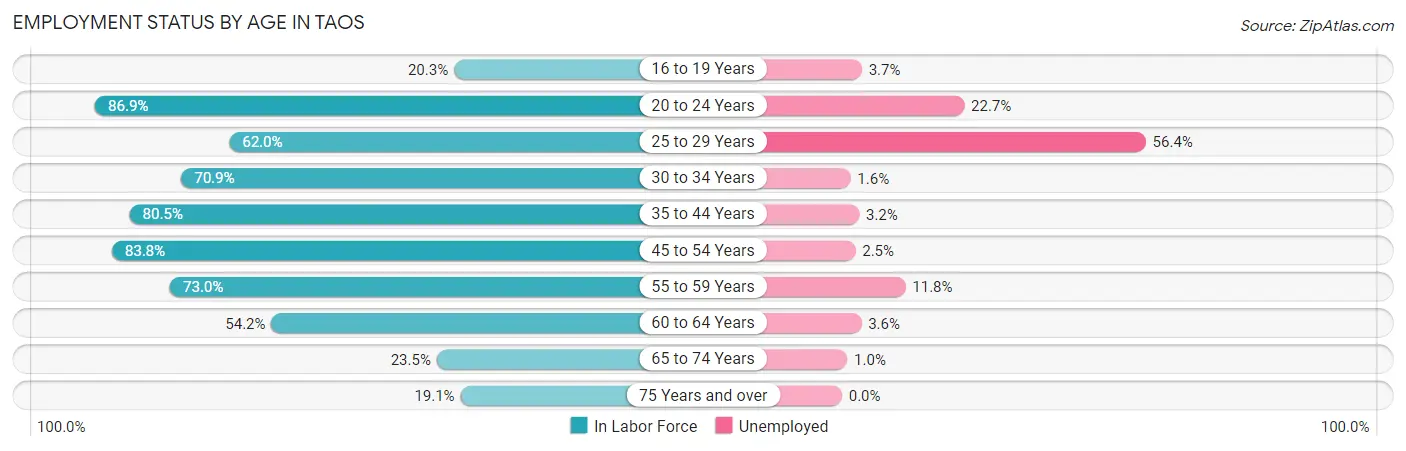
| Age Bracket | In Labor Force | Unemployed |
| 16 to 19 Years | 82 (20.3%) | 3 (3.7%) |
| 20 to 24 Years | 379 (86.9%) | 86 (22.7%) |
| 25 to 29 Years | 181 (62.0%) | 102 (56.4%) |
| 30 to 34 Years | 129 (70.9%) | 2 (1.6%) |
| 35 to 44 Years | 791 (80.5%) | 25 (3.2%) |
| 45 to 54 Years | 590 (83.8%) | 15 (2.5%) |
| 55 to 59 Years | 305 (73.0%) | 36 (11.8%) |
| 60 to 64 Years | 221 (54.2%) | 8 (3.6%) |
| 65 to 74 Years | 305 (23.5%) | 3 (1.0%) |
| 75 Years and over | 152 (19.1%) | 0 (0.0%) |
| Total | 3,137 (53.0%) | 279 (8.9%) |
Employment Status by Educational Attainment in Taos
According to labor force statistics for Taos, 74.2% of individuals (2,216) out of the total population between 25 and 64 years of age (2,986) are in the labor force, with 8.5% or 188 of them being unemployed. The group with the highest labor force participation rate are those with the educational attainment of bachelor's degree or higher, with 86.7% or 816 individuals in the labor force. Within the labor force, individuals with less than high school education have the highest percentage of unemployment, with 29.0% or 49 of them being unemployed.
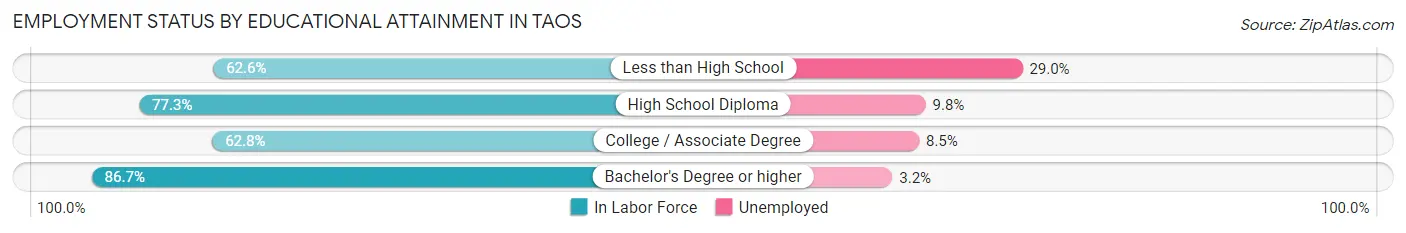
| Educational Attainment | In Labor Force | Unemployed |
| Less than High School | 169 (62.6%) | 78 (29.0%) |
| High School Diploma | 623 (77.3%) | 79 (9.8%) |
| College / Associate Degree | 609 (62.8%) | 82 (8.5%) |
| Bachelor's Degree or higher | 816 (86.7%) | 30 (3.2%) |
| Total | 2,216 (74.2%) | 254 (8.5%) |
Employment Occupations by Sex in Taos
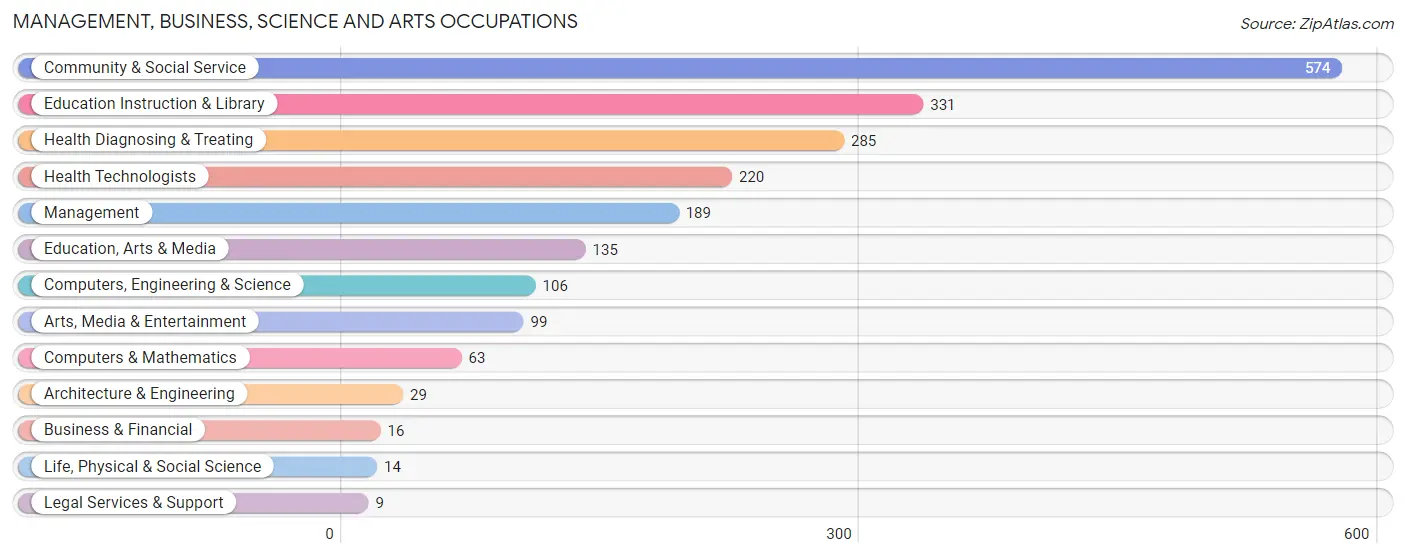
Management, Business, Science and Arts Occupations
The most common Management, Business, Science and Arts occupations in Taos are Community & Social Service (574 | 20.1%), Education Instruction & Library (331 | 11.6%), Health Diagnosing & Treating (285 | 10.0%), Health Technologists (220 | 7.7%), and Management (189 | 6.6%).
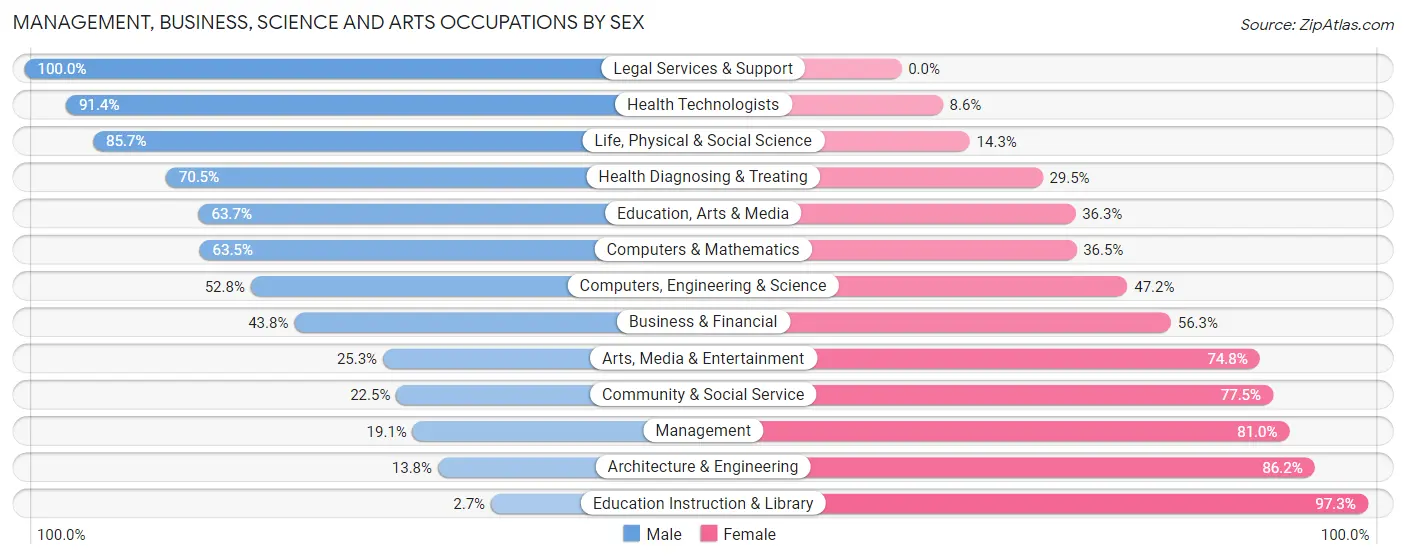
Management, Business, Science and Arts Occupations by Sex
Within the Management, Business, Science and Arts occupations in Taos, the most male-oriented occupations are Legal Services & Support (100.0%), Health Technologists (91.4%), and Life, Physical & Social Science (85.7%), while the most female-oriented occupations are Education Instruction & Library (97.3%), Architecture & Engineering (86.2%), and Management (80.9%).
| Occupation | Male | Female |
| Management | 36 (19.1%) | 153 (80.9%) |
| Business & Financial | 7 (43.8%) | 9 (56.2%) |
| Computers, Engineering & Science | 56 (52.8%) | 50 (47.2%) |
| Computers & Mathematics | 40 (63.5%) | 23 (36.5%) |
| Architecture & Engineering | 4 (13.8%) | 25 (86.2%) |
| Life, Physical & Social Science | 12 (85.7%) | 2 (14.3%) |
| Community & Social Service | 129 (22.5%) | 445 (77.5%) |
| Education, Arts & Media | 86 (63.7%) | 49 (36.3%) |
| Legal Services & Support | 9 (100.0%) | 0 (0.0%) |
| Education Instruction & Library | 9 (2.7%) | 322 (97.3%) |
| Arts, Media & Entertainment | 25 (25.3%) | 74 (74.8%) |
| Health Diagnosing & Treating | 201 (70.5%) | 84 (29.5%) |
| Health Technologists | 201 (91.4%) | 19 (8.6%) |
| Total (Category) | 429 (36.7%) | 741 (63.3%) |
| Total (Overall) | 1,406 (49.2%) | 1,449 (50.7%) |
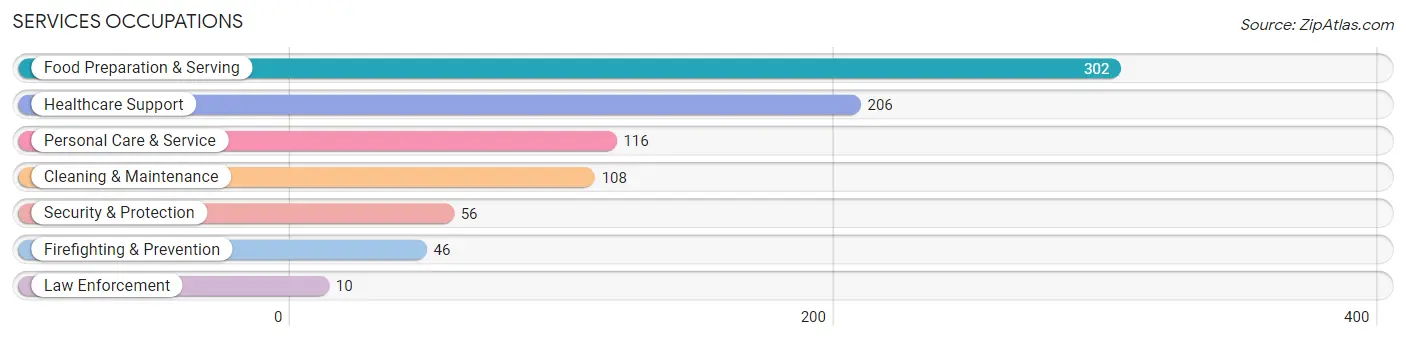
Services Occupations
The most common Services occupations in Taos are Food Preparation & Serving (302 | 10.6%), Healthcare Support (206 | 7.2%), Personal Care & Service (116 | 4.1%), Cleaning & Maintenance (108 | 3.8%), and Security & Protection (56 | 2.0%).
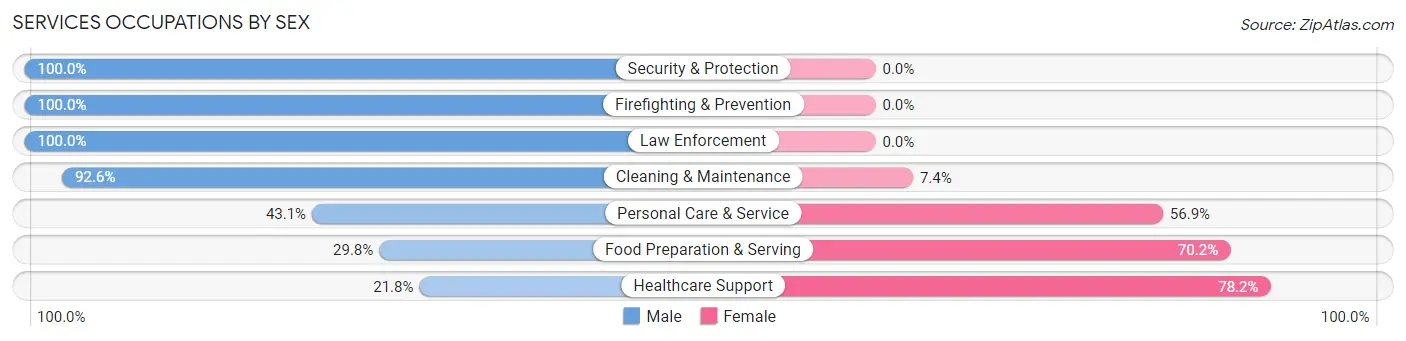
Services Occupations by Sex
Within the Services occupations in Taos, the most male-oriented occupations are Security & Protection (100.0%), Firefighting & Prevention (100.0%), and Law Enforcement (100.0%), while the most female-oriented occupations are Healthcare Support (78.2%), Food Preparation & Serving (70.2%), and Personal Care & Service (56.9%).
| Occupation | Male | Female |
| Healthcare Support | 45 (21.8%) | 161 (78.2%) |
| Security & Protection | 56 (100.0%) | 0 (0.0%) |
| Firefighting & Prevention | 46 (100.0%) | 0 (0.0%) |
| Law Enforcement | 10 (100.0%) | 0 (0.0%) |
| Food Preparation & Serving | 90 (29.8%) | 212 (70.2%) |
| Cleaning & Maintenance | 100 (92.6%) | 8 (7.4%) |
| Personal Care & Service | 50 (43.1%) | 66 (56.9%) |
| Total (Category) | 341 (43.3%) | 447 (56.7%) |
| Total (Overall) | 1,406 (49.2%) | 1,449 (50.7%) |
Sales and Office Occupations
The most common Sales and Office occupations in Taos are Sales & Related (207 | 7.2%), and Office & Administration (147 | 5.1%).

Sales and Office Occupations by Sex
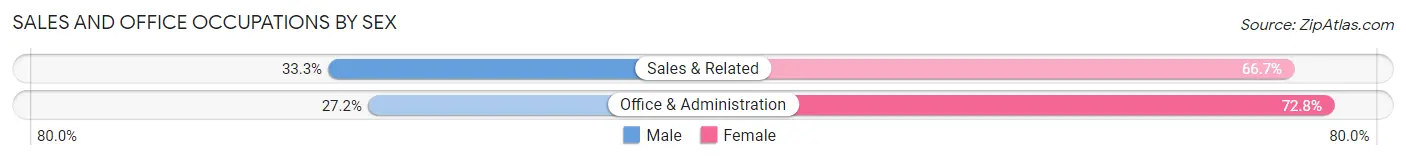
| Occupation | Male | Female |
| Sales & Related | 69 (33.3%) | 138 (66.7%) |
| Office & Administration | 40 (27.2%) | 107 (72.8%) |
| Total (Category) | 109 (30.8%) | 245 (69.2%) |
| Total (Overall) | 1,406 (49.2%) | 1,449 (50.7%) |
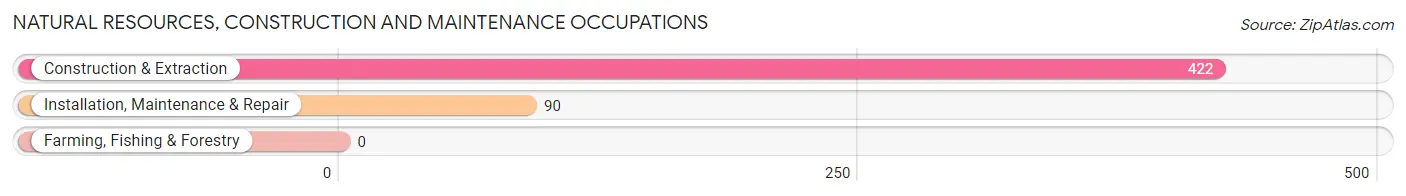
Natural Resources, Construction and Maintenance Occupations
The most common Natural Resources, Construction and Maintenance occupations in Taos are Construction & Extraction (422 | 14.8%), and Installation, Maintenance & Repair (90 | 3.2%).
Natural Resources, Construction and Maintenance Occupations by Sex
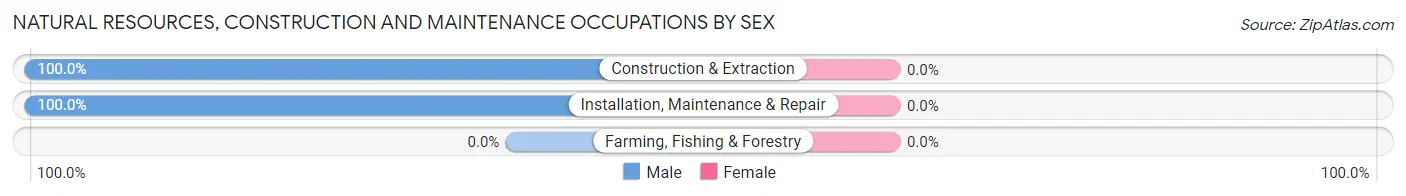
| Occupation | Male | Female |
| Farming, Fishing & Forestry | 0 (0.0%) | 0 (0.0%) |
| Construction & Extraction | 422 (100.0%) | 0 (0.0%) |
| Installation, Maintenance & Repair | 90 (100.0%) | 0 (0.0%) |
| Total (Category) | 512 (100.0%) | 0 (0.0%) |
| Total (Overall) | 1,406 (49.2%) | 1,449 (50.7%) |
Production, Transportation and Moving Occupations
The most common Production, Transportation and Moving occupations in Taos are Transportation (16 | 0.6%), Production (14 | 0.5%), and Material Moving (1 | 0.0%).
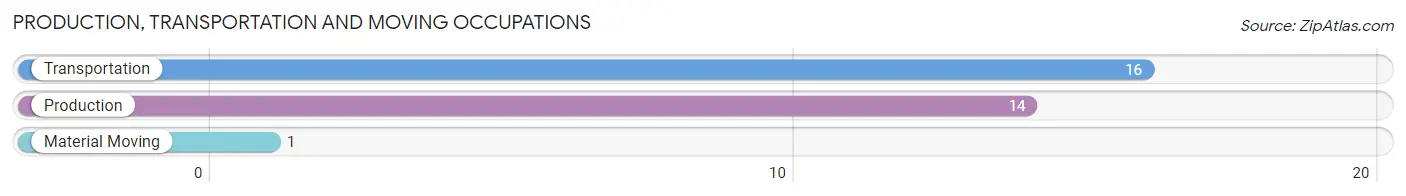
Production, Transportation and Moving Occupations by Sex
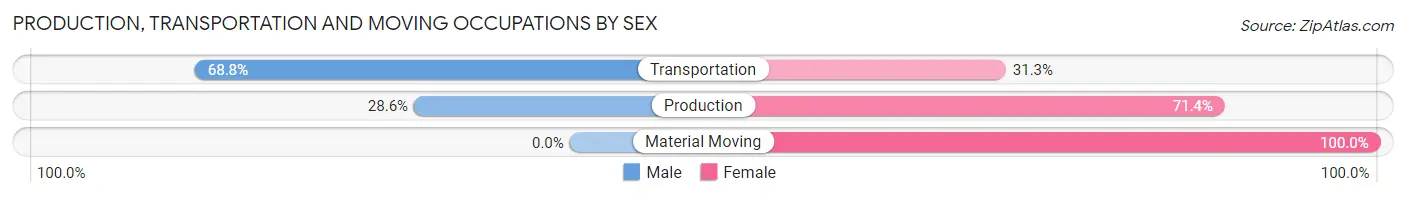
| Occupation | Male | Female |
| Production | 4 (28.6%) | 10 (71.4%) |
| Transportation | 11 (68.8%) | 5 (31.2%) |
| Material Moving | 0 (0.0%) | 1 (100.0%) |
| Total (Category) | 15 (48.4%) | 16 (51.6%) |
| Total (Overall) | 1,406 (49.2%) | 1,449 (50.7%) |
Employment Industries by Sex in Taos
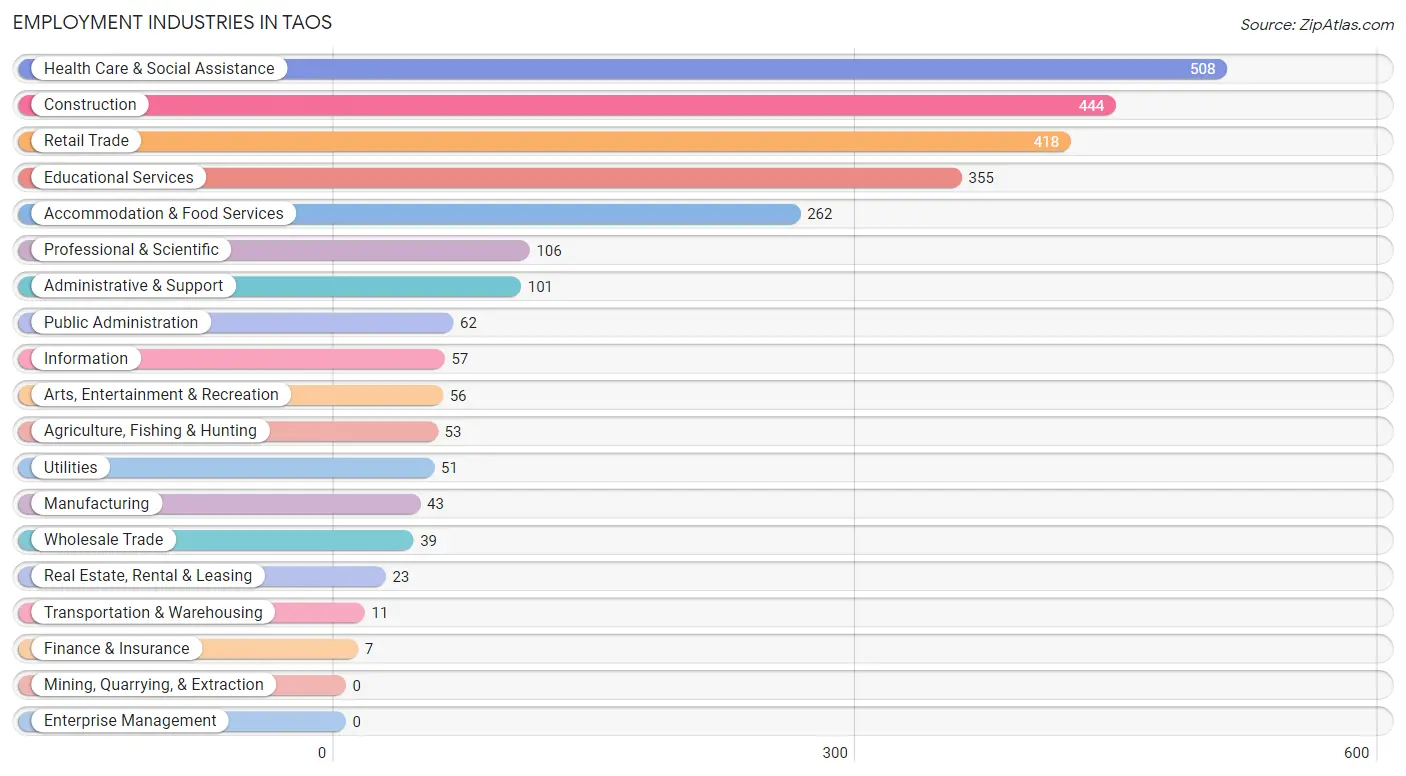
Employment Industries in Taos
The major employment industries in Taos include Health Care & Social Assistance (508 | 17.8%), Construction (444 | 15.5%), Retail Trade (418 | 14.6%), Educational Services (355 | 12.4%), and Accommodation & Food Services (262 | 9.2%).
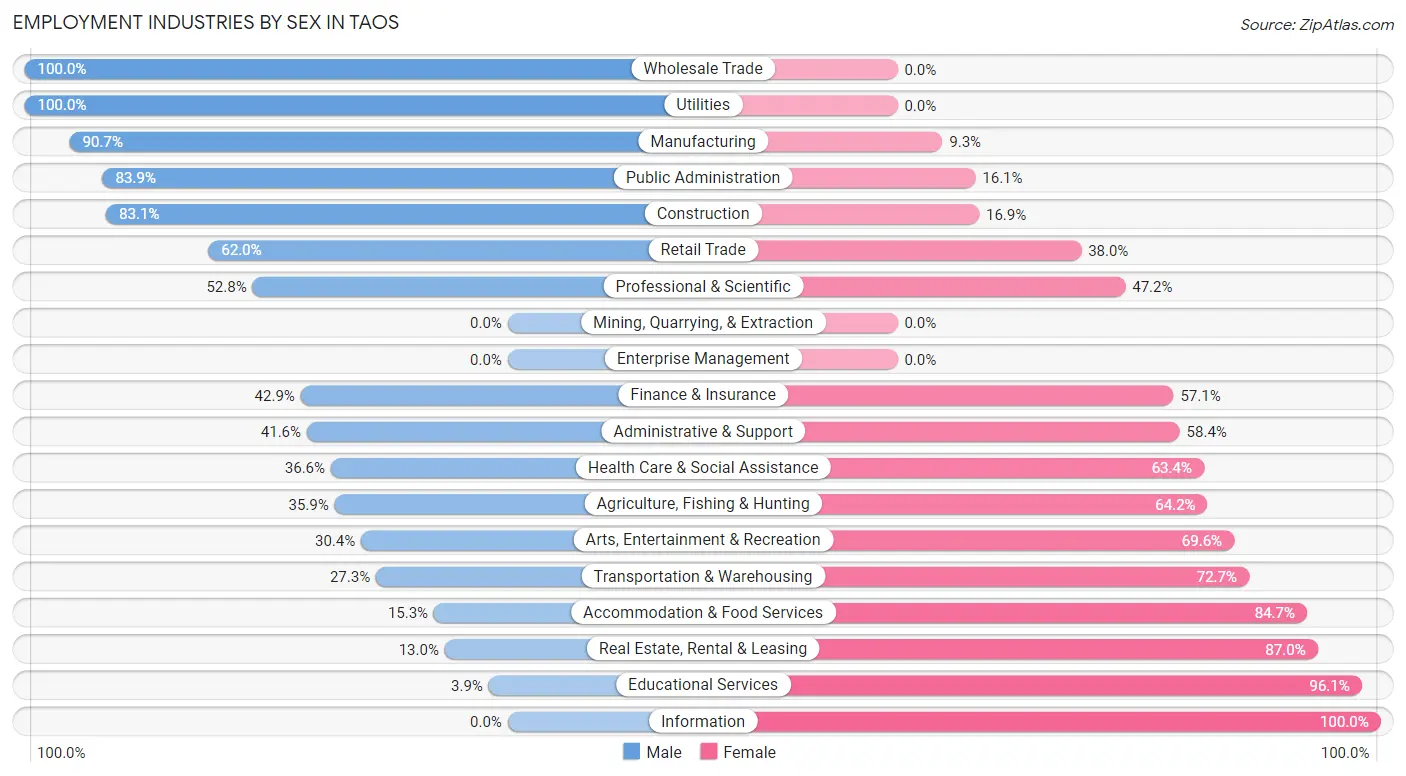
Employment Industries by Sex in Taos
The Taos industries that see more men than women are Wholesale Trade (100.0%), Utilities (100.0%), and Manufacturing (90.7%), whereas the industries that tend to have a higher number of women are Information (100.0%), Educational Services (96.1%), and Real Estate, Rental & Leasing (87.0%).
| Industry | Male | Female |
| Agriculture, Fishing & Hunting | 19 (35.8%) | 34 (64.1%) |
| Mining, Quarrying, & Extraction | 0 (0.0%) | 0 (0.0%) |
| Construction | 369 (83.1%) | 75 (16.9%) |
| Manufacturing | 39 (90.7%) | 4 (9.3%) |
| Wholesale Trade | 39 (100.0%) | 0 (0.0%) |
| Retail Trade | 259 (62.0%) | 159 (38.0%) |
| Transportation & Warehousing | 3 (27.3%) | 8 (72.7%) |
| Utilities | 51 (100.0%) | 0 (0.0%) |
| Information | 0 (0.0%) | 57 (100.0%) |
| Finance & Insurance | 3 (42.9%) | 4 (57.1%) |
| Real Estate, Rental & Leasing | 3 (13.0%) | 20 (87.0%) |
| Professional & Scientific | 56 (52.8%) | 50 (47.2%) |
| Enterprise Management | 0 (0.0%) | 0 (0.0%) |
| Administrative & Support | 42 (41.6%) | 59 (58.4%) |
| Educational Services | 14 (3.9%) | 341 (96.1%) |
| Health Care & Social Assistance | 186 (36.6%) | 322 (63.4%) |
| Arts, Entertainment & Recreation | 17 (30.4%) | 39 (69.6%) |
| Accommodation & Food Services | 40 (15.3%) | 222 (84.7%) |
| Public Administration | 52 (83.9%) | 10 (16.1%) |
| Total | 1,406 (49.2%) | 1,449 (50.7%) |
Education in Taos
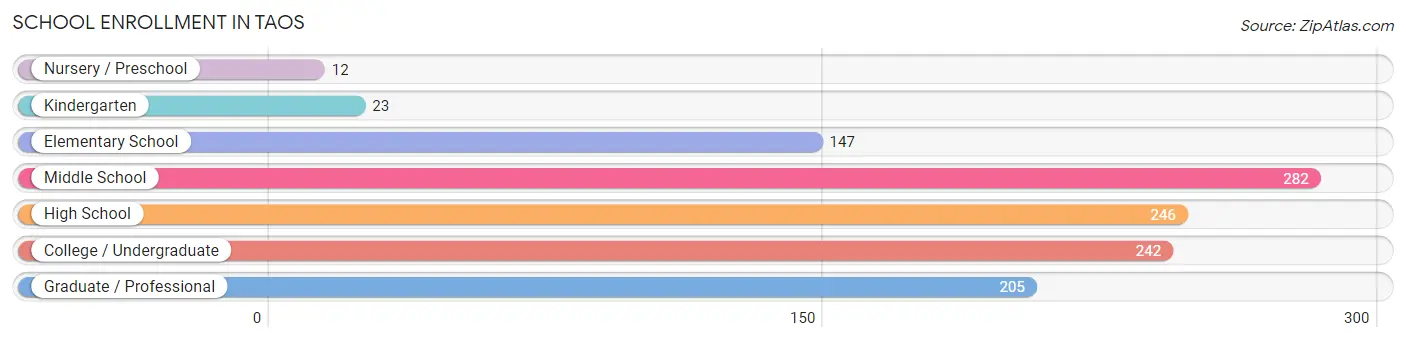
School Enrollment in Taos
The most common levels of schooling among the 1,157 students in Taos are middle school (282 | 24.4%), high school (246 | 21.3%), and college / undergraduate (242 | 20.9%).
| School Level | # Students | % Students |
| Nursery / Preschool | 12 | 1.0% |
| Kindergarten | 23 | 2.0% |
| Elementary School | 147 | 12.7% |
| Middle School | 282 | 24.4% |
| High School | 246 | 21.3% |
| College / Undergraduate | 242 | 20.9% |
| Graduate / Professional | 205 | 17.7% |
| Total | 1,157 | 100.0% |
School Enrollment by Age by Funding Source in Taos
Out of a total of 1,157 students who are enrolled in schools in Taos, 215 (18.6%) attend a private institution, while the remaining 942 (81.4%) are enrolled in public schools. The age group of 35 years and over has the highest likelihood of being enrolled in private schools, with 150 (48.7% in the age bracket) enrolled. Conversely, the age group of 3 to 4 year olds has the lowest likelihood of being enrolled in a private school, with 9 (100.0% in the age bracket) attending a public institution.
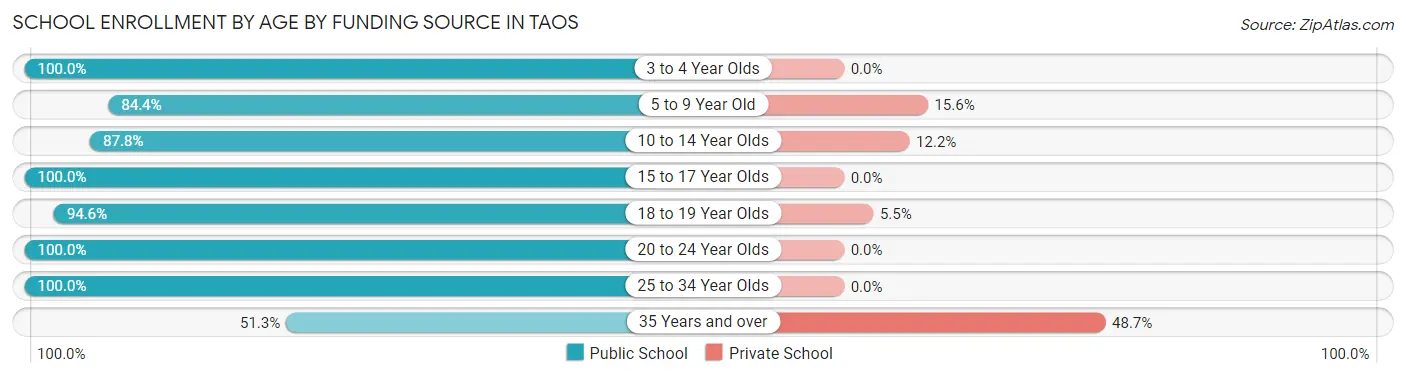
| Age Bracket | Public School | Private School |
| 3 to 4 Year Olds | 9 (100.0%) | 0 (0.0%) |
| 5 to 9 Year Old | 146 (84.4%) | 27 (15.6%) |
| 10 to 14 Year Olds | 252 (87.8%) | 35 (12.2%) |
| 15 to 17 Year Olds | 230 (100.0%) | 0 (0.0%) |
| 18 to 19 Year Olds | 52 (94.6%) | 3 (5.4%) |
| 20 to 24 Year Olds | 27 (100.0%) | 0 (0.0%) |
| 25 to 34 Year Olds | 68 (100.0%) | 0 (0.0%) |
| 35 Years and over | 158 (51.3%) | 150 (48.7%) |
| Total | 942 (81.4%) | 215 (18.6%) |
Educational Attainment by Field of Study in Taos
Education (398 | 17.3%), bio, nature & agricultural (264 | 11.5%), literature & languages (234 | 10.2%), physical & health sciences (198 | 8.6%), and visual & performing arts (193 | 8.4%) are the most common fields of study among 2,306 individuals in Taos who have obtained a bachelor's degree or higher.
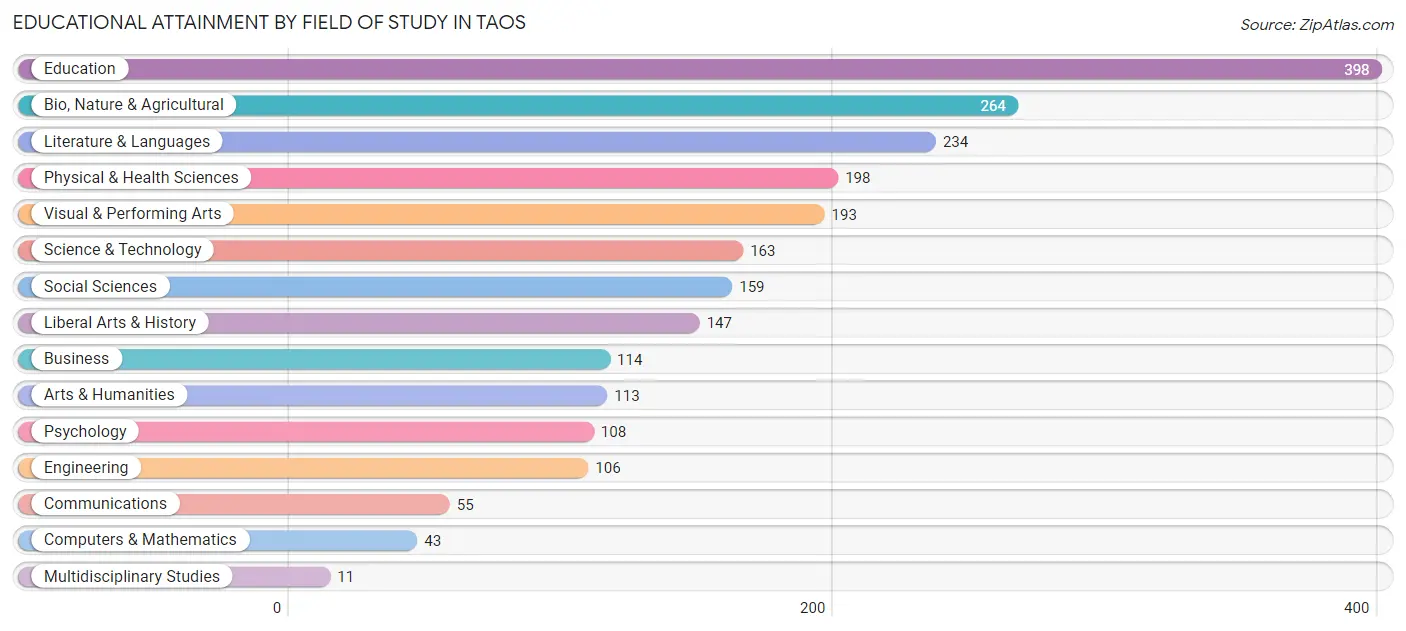
| Field of Study | # Graduates | % Graduates |
| Computers & Mathematics | 43 | 1.9% |
| Bio, Nature & Agricultural | 264 | 11.5% |
| Physical & Health Sciences | 198 | 8.6% |
| Psychology | 108 | 4.7% |
| Social Sciences | 159 | 6.9% |
| Engineering | 106 | 4.6% |
| Multidisciplinary Studies | 11 | 0.5% |
| Science & Technology | 163 | 7.1% |
| Business | 114 | 4.9% |
| Education | 398 | 17.3% |
| Literature & Languages | 234 | 10.2% |
| Liberal Arts & History | 147 | 6.4% |
| Visual & Performing Arts | 193 | 8.4% |
| Communications | 55 | 2.4% |
| Arts & Humanities | 113 | 4.9% |
| Total | 2,306 | 100.0% |
Transportation & Commute in Taos
Vehicle Availability by Sex in Taos
The most prevalent vehicle ownership categories in Taos are males with 2 vehicles (489, accounting for 38.2%) and females with 2 vehicles (541, making up 35.4%).
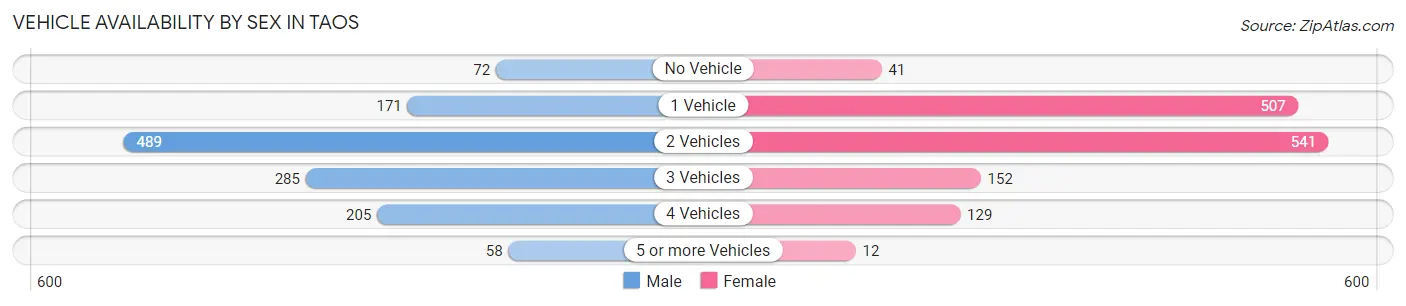
| Vehicles Available | Male | Female |
| No Vehicle | 72 (5.6%) | 41 (3.0%) |
| 1 Vehicle | 171 (13.4%) | 507 (36.7%) |
| 2 Vehicles | 489 (38.2%) | 541 (39.2%) |
| 3 Vehicles | 285 (22.3%) | 152 (11.0%) |
| 4 Vehicles | 205 (16.0%) | 129 (9.3%) |
| 5 or more Vehicles | 58 (4.5%) | 12 (0.9%) |
| Total | 1,280 (100.0%) | 1,382 (100.0%) |
Commute Time in Taos
The most frequently occuring commute durations in Taos are 10 to 14 minutes (567 commuters, 23.7%), 5 to 9 minutes (496 commuters, 20.8%), and 20 to 24 minutes (302 commuters, 12.6%).
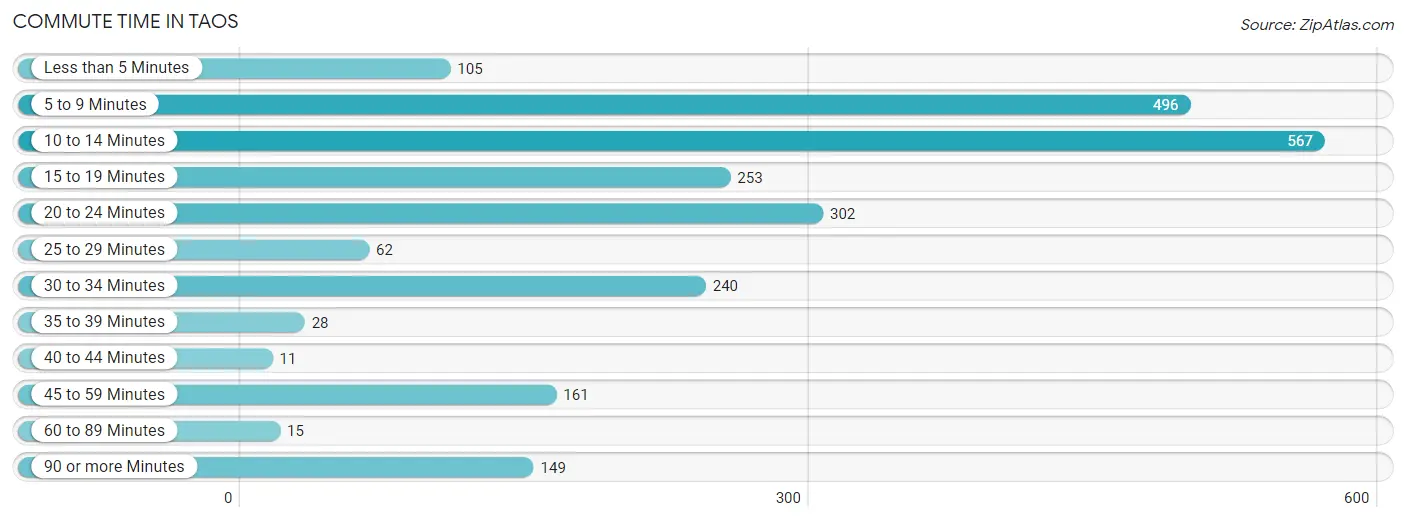
| Commute Time | # Commuters | % Commuters |
| Less than 5 Minutes | 105 | 4.4% |
| 5 to 9 Minutes | 496 | 20.8% |
| 10 to 14 Minutes | 567 | 23.7% |
| 15 to 19 Minutes | 253 | 10.6% |
| 20 to 24 Minutes | 302 | 12.6% |
| 25 to 29 Minutes | 62 | 2.6% |
| 30 to 34 Minutes | 240 | 10.1% |
| 35 to 39 Minutes | 28 | 1.2% |
| 40 to 44 Minutes | 11 | 0.5% |
| 45 to 59 Minutes | 161 | 6.7% |
| 60 to 89 Minutes | 15 | 0.6% |
| 90 or more Minutes | 149 | 6.2% |
Commute Time by Sex in Taos
The most common commute times in Taos are 30 to 34 minutes (230 commuters, 19.3%) for males and 5 to 9 minutes (429 commuters, 35.9%) for females.
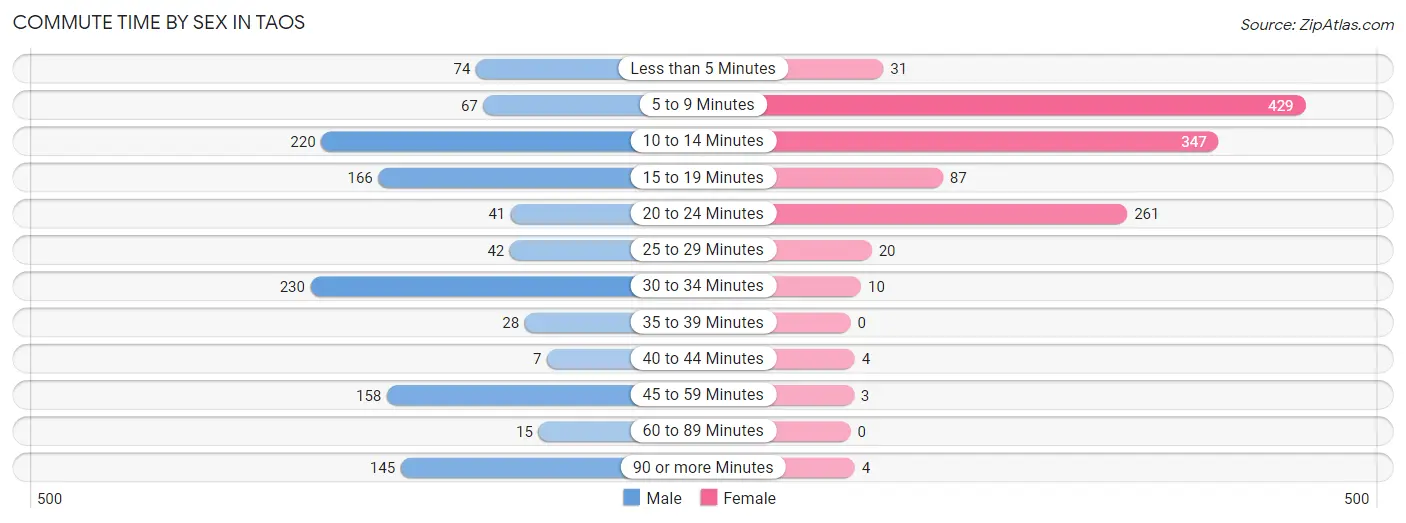
| Commute Time | Male | Female |
| Less than 5 Minutes | 74 (6.2%) | 31 (2.6%) |
| 5 to 9 Minutes | 67 (5.6%) | 429 (35.9%) |
| 10 to 14 Minutes | 220 (18.4%) | 347 (29.0%) |
| 15 to 19 Minutes | 166 (13.9%) | 87 (7.3%) |
| 20 to 24 Minutes | 41 (3.4%) | 261 (21.8%) |
| 25 to 29 Minutes | 42 (3.5%) | 20 (1.7%) |
| 30 to 34 Minutes | 230 (19.3%) | 10 (0.8%) |
| 35 to 39 Minutes | 28 (2.4%) | 0 (0.0%) |
| 40 to 44 Minutes | 7 (0.6%) | 4 (0.3%) |
| 45 to 59 Minutes | 158 (13.2%) | 3 (0.3%) |
| 60 to 89 Minutes | 15 (1.3%) | 0 (0.0%) |
| 90 or more Minutes | 145 (12.1%) | 4 (0.3%) |
Time of Departure to Work by Sex in Taos
The most frequent times of departure to work in Taos are 8:00 AM to 8:29 AM (331, 27.8%) for males and 7:30 AM to 7:59 AM (374, 31.3%) for females.
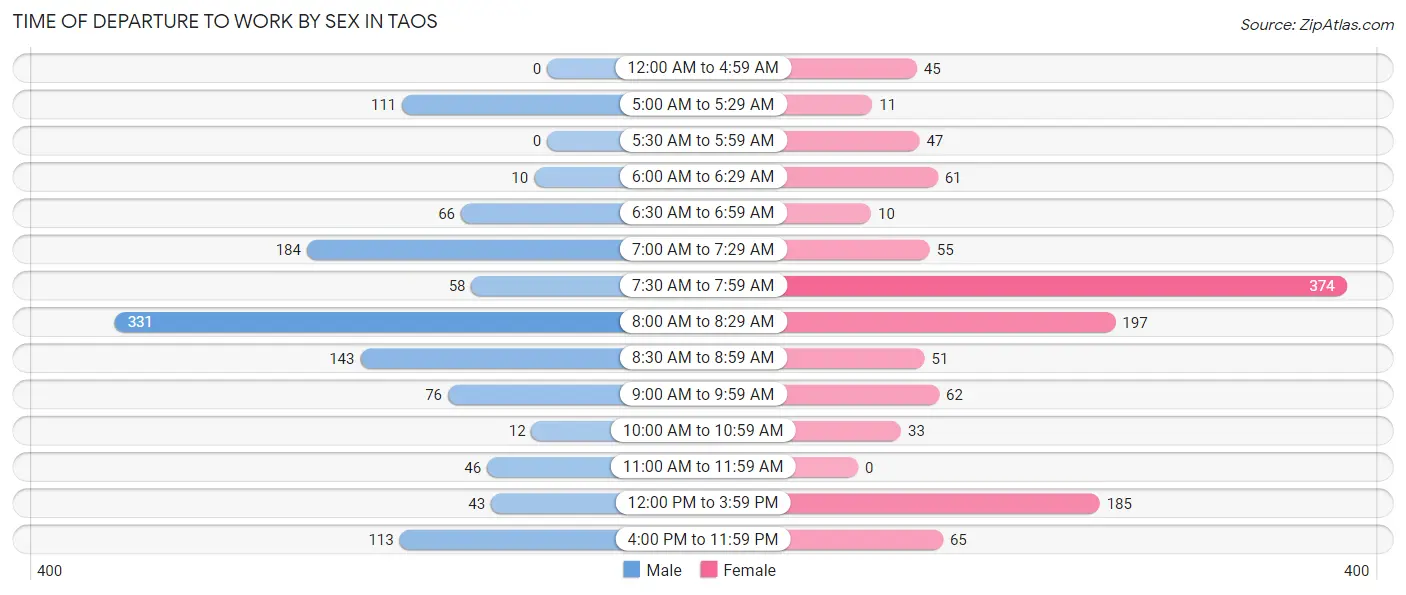
| Time of Departure | Male | Female |
| 12:00 AM to 4:59 AM | 0 (0.0%) | 45 (3.8%) |
| 5:00 AM to 5:29 AM | 111 (9.3%) | 11 (0.9%) |
| 5:30 AM to 5:59 AM | 0 (0.0%) | 47 (3.9%) |
| 6:00 AM to 6:29 AM | 10 (0.8%) | 61 (5.1%) |
| 6:30 AM to 6:59 AM | 66 (5.5%) | 10 (0.8%) |
| 7:00 AM to 7:29 AM | 184 (15.4%) | 55 (4.6%) |
| 7:30 AM to 7:59 AM | 58 (4.9%) | 374 (31.3%) |
| 8:00 AM to 8:29 AM | 331 (27.8%) | 197 (16.5%) |
| 8:30 AM to 8:59 AM | 143 (12.0%) | 51 (4.3%) |
| 9:00 AM to 9:59 AM | 76 (6.4%) | 62 (5.2%) |
| 10:00 AM to 10:59 AM | 12 (1.0%) | 33 (2.8%) |
| 11:00 AM to 11:59 AM | 46 (3.9%) | 0 (0.0%) |
| 12:00 PM to 3:59 PM | 43 (3.6%) | 185 (15.5%) |
| 4:00 PM to 11:59 PM | 113 (9.5%) | 65 (5.4%) |
| Total | 1,193 (100.0%) | 1,196 (100.0%) |
Housing Occupancy in Taos
Occupancy by Ownership in Taos
Of the total 2,886 dwellings in Taos, owner-occupied units account for 1,719 (59.6%), while renter-occupied units make up 1,167 (40.4%).
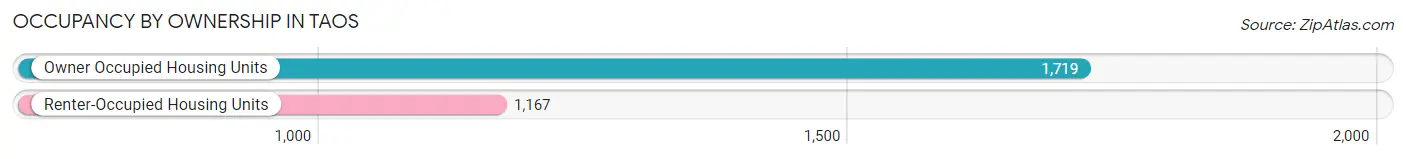
| Occupancy | # Housing Units | % Housing Units |
| Owner Occupied Housing Units | 1,719 | 59.6% |
| Renter-Occupied Housing Units | 1,167 | 40.4% |
| Total Occupied Housing Units | 2,886 | 100.0% |
Occupancy by Household Size in Taos
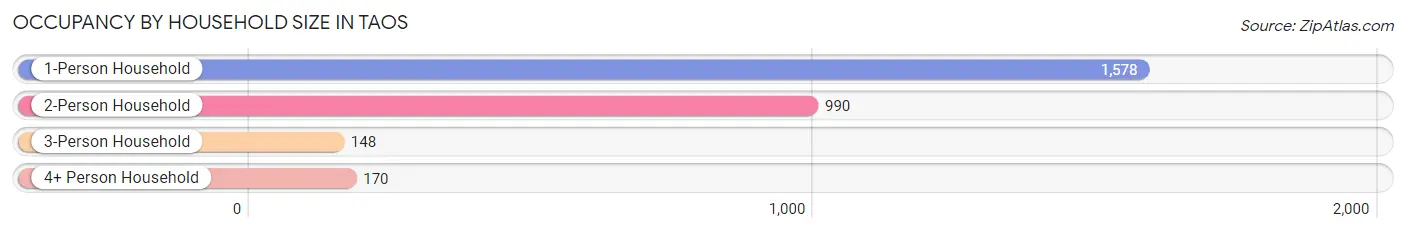
| Household Size | # Housing Units | % Housing Units |
| 1-Person Household | 1,578 | 54.7% |
| 2-Person Household | 990 | 34.3% |
| 3-Person Household | 148 | 5.1% |
| 4+ Person Household | 170 | 5.9% |
| Total Housing Units | 2,886 | 100.0% |
Occupancy by Ownership by Household Size in Taos
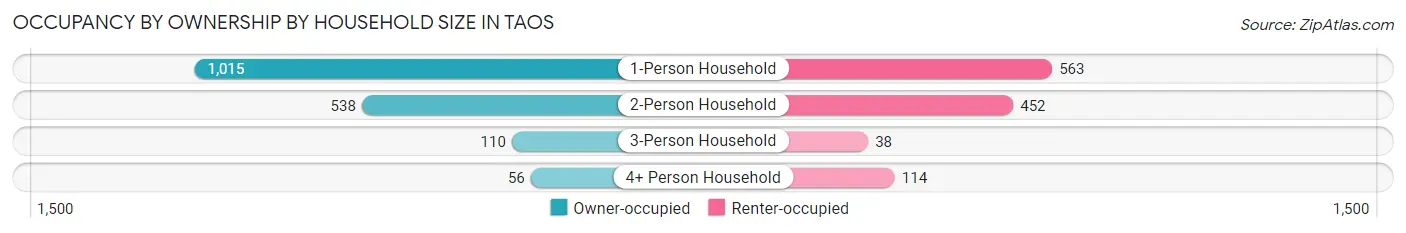
| Household Size | Owner-occupied | Renter-occupied |
| 1-Person Household | 1,015 (64.3%) | 563 (35.7%) |
| 2-Person Household | 538 (54.3%) | 452 (45.7%) |
| 3-Person Household | 110 (74.3%) | 38 (25.7%) |
| 4+ Person Household | 56 (32.9%) | 114 (67.1%) |
| Total Housing Units | 1,719 (59.6%) | 1,167 (40.4%) |
Occupancy by Educational Attainment in Taos
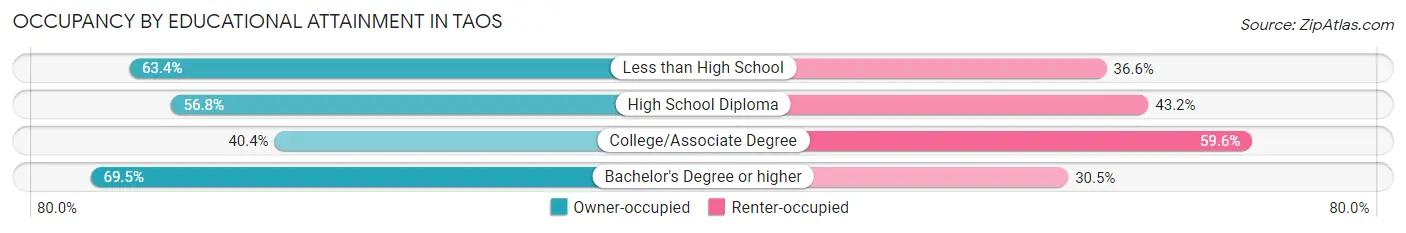
| Household Size | Owner-occupied | Renter-occupied |
| Less than High School | 59 (63.4%) | 34 (36.6%) |
| High School Diploma | 341 (56.8%) | 259 (43.2%) |
| College/Associate Degree | 285 (40.4%) | 421 (59.6%) |
| Bachelor's Degree or higher | 1,034 (69.5%) | 453 (30.5%) |
Occupancy by Age of Householder in Taos
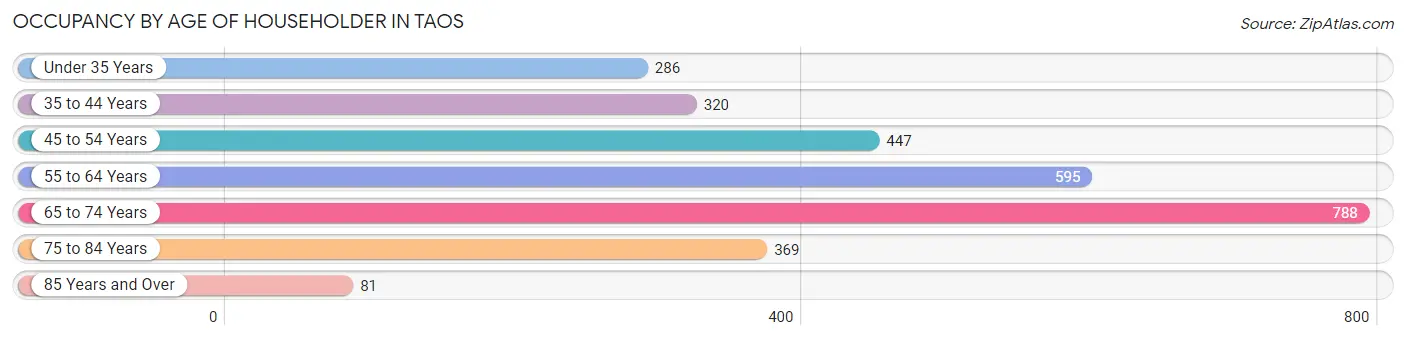
| Age Bracket | # Households | % Households |
| Under 35 Years | 286 | 9.9% |
| 35 to 44 Years | 320 | 11.1% |
| 45 to 54 Years | 447 | 15.5% |
| 55 to 64 Years | 595 | 20.6% |
| 65 to 74 Years | 788 | 27.3% |
| 75 to 84 Years | 369 | 12.8% |
| 85 Years and Over | 81 | 2.8% |
| Total | 2,886 | 100.0% |
Housing Finances in Taos
Median Income by Occupancy in Taos
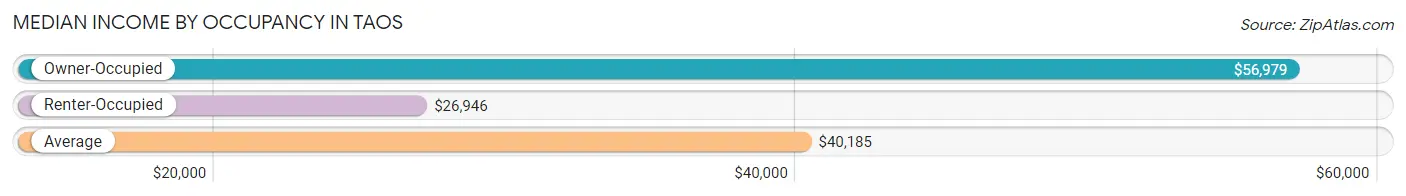
| Occupancy Type | # Households | Median Income |
| Owner-Occupied | 1,719 (59.6%) | $56,979 |
| Renter-Occupied | 1,167 (40.4%) | $26,946 |
| Average | 2,886 (100.0%) | $40,185 |
Occupancy by Householder Income Bracket in Taos
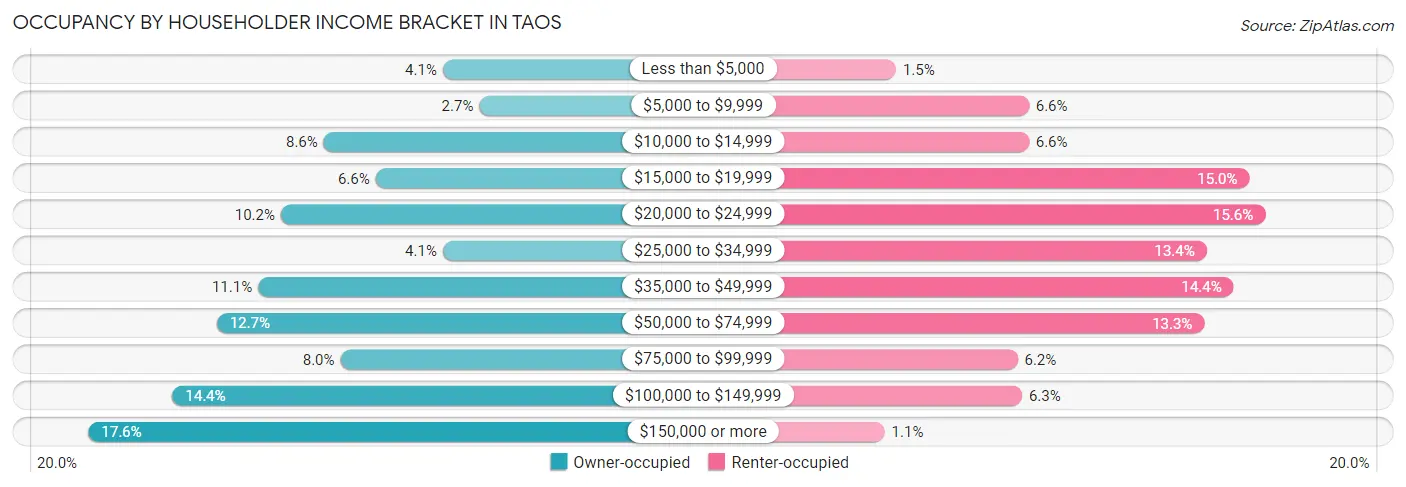
| Income Bracket | Owner-occupied | Renter-occupied |
| Less than $5,000 | 70 (4.1%) | 18 (1.5%) |
| $5,000 to $9,999 | 46 (2.7%) | 77 (6.6%) |
| $10,000 to $14,999 | 148 (8.6%) | 77 (6.6%) |
| $15,000 to $19,999 | 114 (6.6%) | 175 (15.0%) |
| $20,000 to $24,999 | 176 (10.2%) | 182 (15.6%) |
| $25,000 to $34,999 | 70 (4.1%) | 156 (13.4%) |
| $35,000 to $49,999 | 191 (11.1%) | 168 (14.4%) |
| $50,000 to $74,999 | 218 (12.7%) | 155 (13.3%) |
| $75,000 to $99,999 | 137 (8.0%) | 72 (6.2%) |
| $100,000 to $149,999 | 247 (14.4%) | 74 (6.3%) |
| $150,000 or more | 302 (17.6%) | 13 (1.1%) |
| Total | 1,719 (100.0%) | 1,167 (100.0%) |
Monthly Housing Cost Tiers in Taos
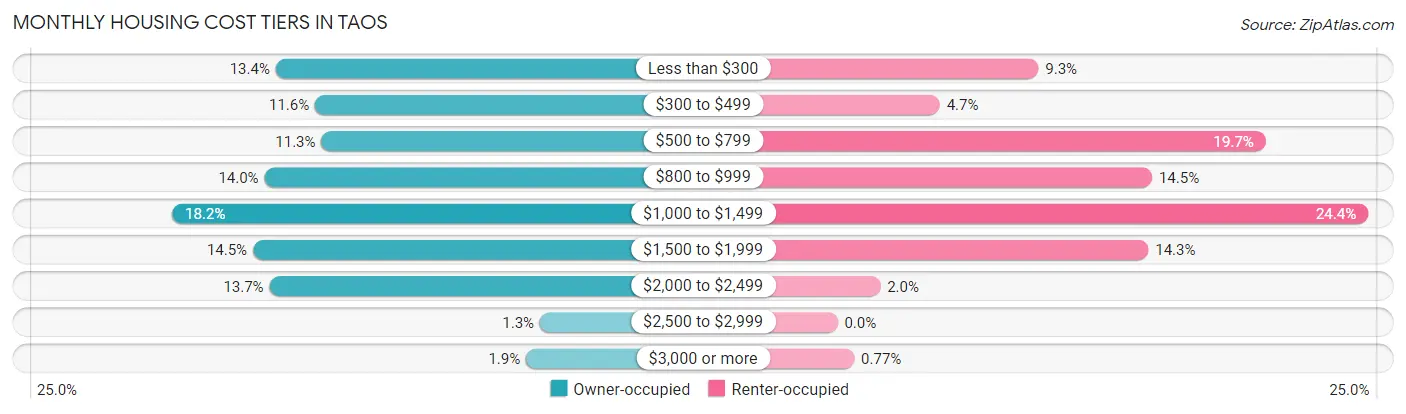
| Monthly Cost | Owner-occupied | Renter-occupied |
| Less than $300 | 231 (13.4%) | 108 (9.2%) |
| $300 to $499 | 200 (11.6%) | 55 (4.7%) |
| $500 to $799 | 195 (11.3%) | 230 (19.7%) |
| $800 to $999 | 240 (14.0%) | 169 (14.5%) |
| $1,000 to $1,499 | 313 (18.2%) | 285 (24.4%) |
| $1,500 to $1,999 | 249 (14.5%) | 167 (14.3%) |
| $2,000 to $2,499 | 236 (13.7%) | 23 (2.0%) |
| $2,500 to $2,999 | 22 (1.3%) | 0 (0.0%) |
| $3,000 or more | 33 (1.9%) | 9 (0.8%) |
| Total | 1,719 (100.0%) | 1,167 (100.0%) |
Physical Housing Characteristics in Taos
Housing Structures in Taos
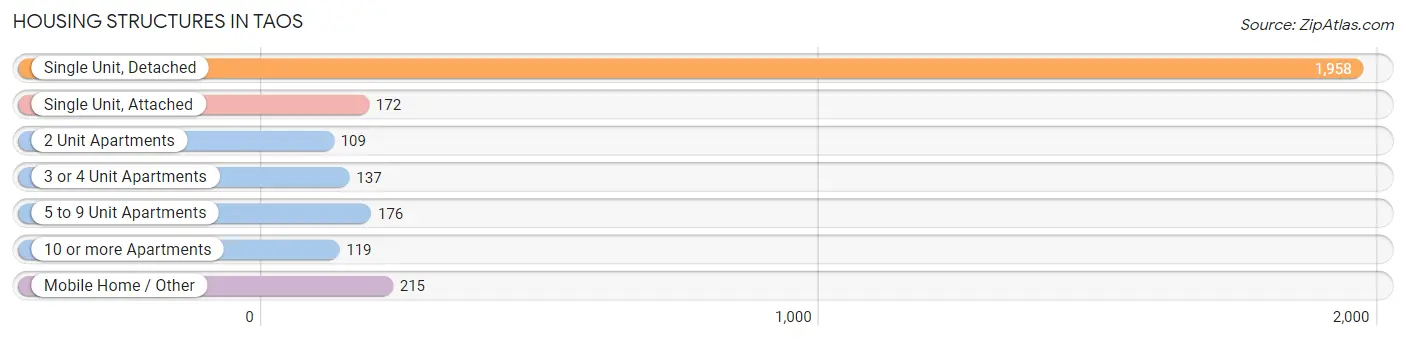
| Structure Type | # Housing Units | % Housing Units |
| Single Unit, Detached | 1,958 | 67.8% |
| Single Unit, Attached | 172 | 6.0% |
| 2 Unit Apartments | 109 | 3.8% |
| 3 or 4 Unit Apartments | 137 | 4.8% |
| 5 to 9 Unit Apartments | 176 | 6.1% |
| 10 or more Apartments | 119 | 4.1% |
| Mobile Home / Other | 215 | 7.4% |
| Total | 2,886 | 100.0% |
Housing Structures by Occupancy in Taos
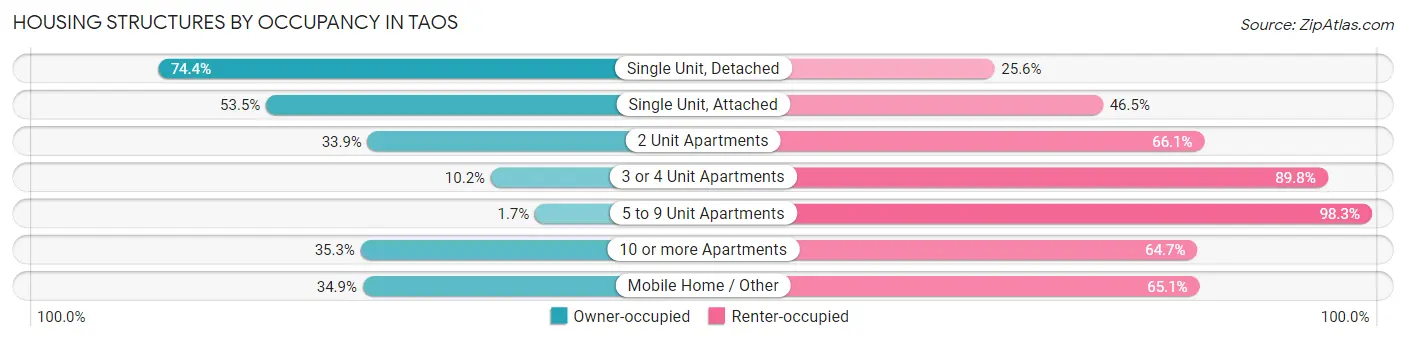
| Structure Type | Owner-occupied | Renter-occupied |
| Single Unit, Detached | 1,456 (74.4%) | 502 (25.6%) |
| Single Unit, Attached | 92 (53.5%) | 80 (46.5%) |
| 2 Unit Apartments | 37 (33.9%) | 72 (66.1%) |
| 3 or 4 Unit Apartments | 14 (10.2%) | 123 (89.8%) |
| 5 to 9 Unit Apartments | 3 (1.7%) | 173 (98.3%) |
| 10 or more Apartments | 42 (35.3%) | 77 (64.7%) |
| Mobile Home / Other | 75 (34.9%) | 140 (65.1%) |
| Total | 1,719 (59.6%) | 1,167 (40.4%) |
Housing Structures by Number of Rooms in Taos
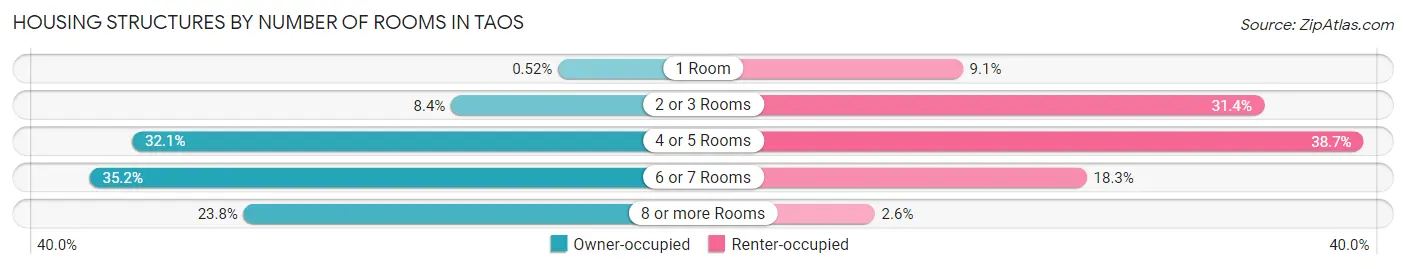
| Number of Rooms | Owner-occupied | Renter-occupied |
| 1 Room | 9 (0.5%) | 106 (9.1%) |
| 2 or 3 Rooms | 145 (8.4%) | 366 (31.4%) |
| 4 or 5 Rooms | 551 (32.1%) | 452 (38.7%) |
| 6 or 7 Rooms | 605 (35.2%) | 213 (18.2%) |
| 8 or more Rooms | 409 (23.8%) | 30 (2.6%) |
| Total | 1,719 (100.0%) | 1,167 (100.0%) |
Housing Structure by Heating Type in Taos
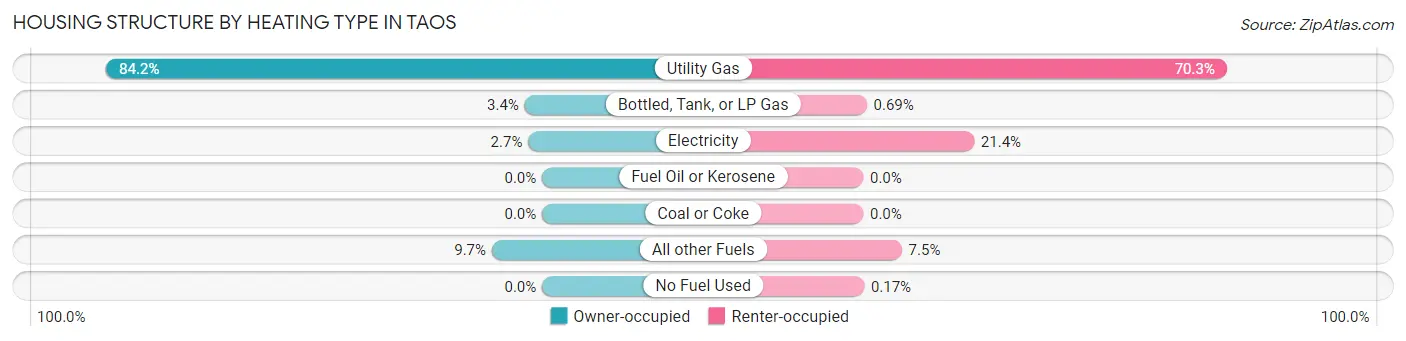
| Heating Type | Owner-occupied | Renter-occupied |
| Utility Gas | 1,448 (84.2%) | 820 (70.3%) |
| Bottled, Tank, or LP Gas | 58 (3.4%) | 8 (0.7%) |
| Electricity | 46 (2.7%) | 250 (21.4%) |
| Fuel Oil or Kerosene | 0 (0.0%) | 0 (0.0%) |
| Coal or Coke | 0 (0.0%) | 0 (0.0%) |
| All other Fuels | 167 (9.7%) | 87 (7.5%) |
| No Fuel Used | 0 (0.0%) | 2 (0.2%) |
| Total | 1,719 (100.0%) | 1,167 (100.0%) |
Household Vehicle Usage in Taos
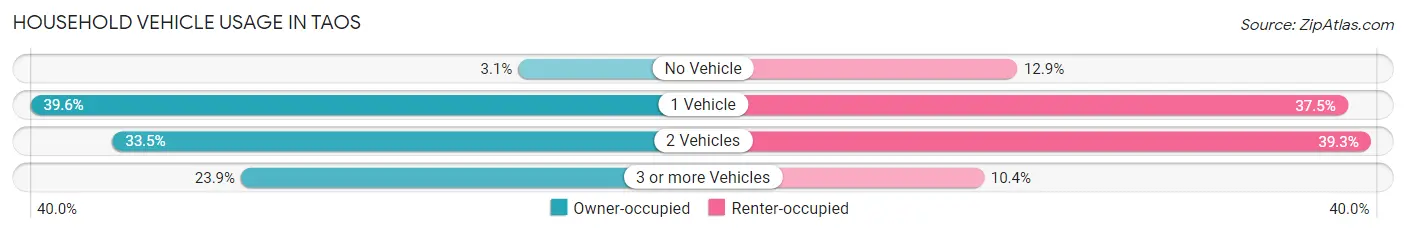
| Vehicles per Household | Owner-occupied | Renter-occupied |
| No Vehicle | 54 (3.1%) | 150 (12.9%) |
| 1 Vehicle | 680 (39.6%) | 438 (37.5%) |
| 2 Vehicles | 575 (33.5%) | 458 (39.3%) |
| 3 or more Vehicles | 410 (23.8%) | 121 (10.4%) |
| Total | 1,719 (100.0%) | 1,167 (100.0%) |
Real Estate & Mortgages in Taos
Real Estate and Mortgage Overview in Taos
| Characteristic | Without Mortgage | With Mortgage |
| Housing Units | 707 | 1,012 |
| Median Property Value | $317,000 | $339,600 |
| Median Household Income | $40,094 | $250 |
| Monthly Housing Costs | $437 | $29 |
| Real Estate Taxes | $1,339 | $1 |
Property Value by Mortgage Status in Taos
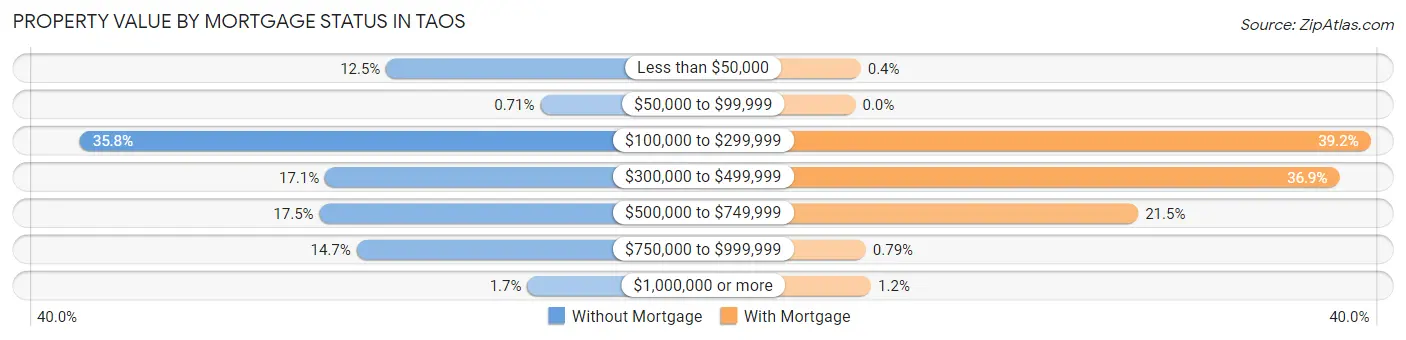
| Property Value | Without Mortgage | With Mortgage |
| Less than $50,000 | 88 (12.4%) | 4 (0.4%) |
| $50,000 to $99,999 | 5 (0.7%) | 0 (0.0%) |
| $100,000 to $299,999 | 253 (35.8%) | 397 (39.2%) |
| $300,000 to $499,999 | 121 (17.1%) | 373 (36.9%) |
| $500,000 to $749,999 | 124 (17.5%) | 218 (21.5%) |
| $750,000 to $999,999 | 104 (14.7%) | 8 (0.8%) |
| $1,000,000 or more | 12 (1.7%) | 12 (1.2%) |
| Total | 707 (100.0%) | 1,012 (100.0%) |
Household Income by Mortgage Status in Taos
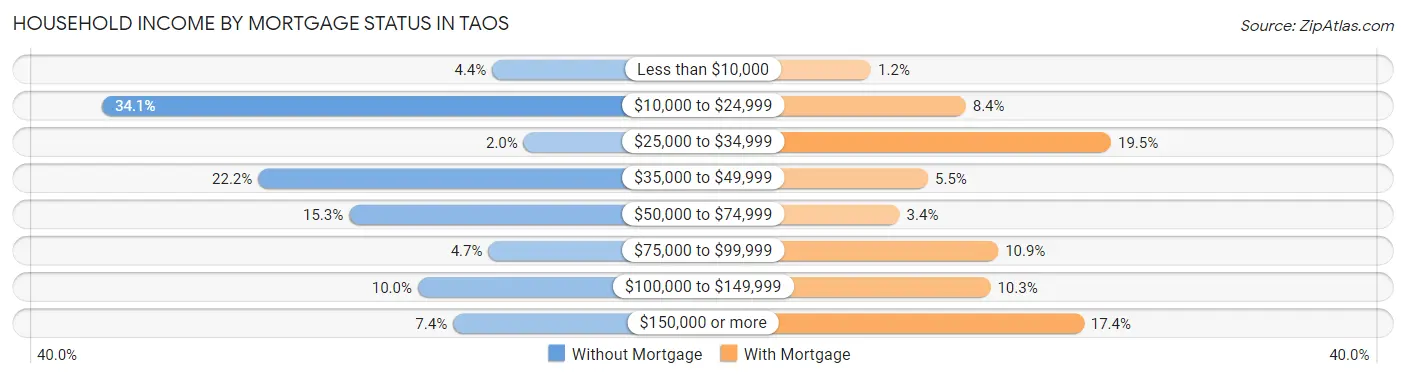
| Household Income | Without Mortgage | With Mortgage |
| Less than $10,000 | 31 (4.4%) | 12 (1.2%) |
| $10,000 to $24,999 | 241 (34.1%) | 85 (8.4%) |
| $25,000 to $34,999 | 14 (2.0%) | 197 (19.5%) |
| $35,000 to $49,999 | 157 (22.2%) | 56 (5.5%) |
| $50,000 to $74,999 | 108 (15.3%) | 34 (3.4%) |
| $75,000 to $99,999 | 33 (4.7%) | 110 (10.9%) |
| $100,000 to $149,999 | 71 (10.0%) | 104 (10.3%) |
| $150,000 or more | 52 (7.4%) | 176 (17.4%) |
| Total | 707 (100.0%) | 1,012 (100.0%) |
Property Value to Household Income Ratio in Taos
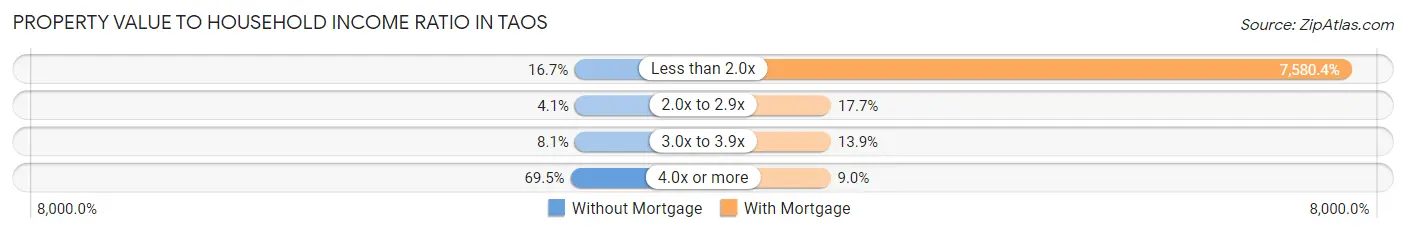
| Value-to-Income Ratio | Without Mortgage | With Mortgage |
| Less than 2.0x | 118 (16.7%) | 76,714 (7,580.4%) |
| 2.0x to 2.9x | 29 (4.1%) | 179 (17.7%) |
| 3.0x to 3.9x | 57 (8.1%) | 141 (13.9%) |
| 4.0x or more | 491 (69.5%) | 91 (9.0%) |
| Total | 707 (100.0%) | 1,012 (100.0%) |
Real Estate Taxes by Mortgage Status in Taos
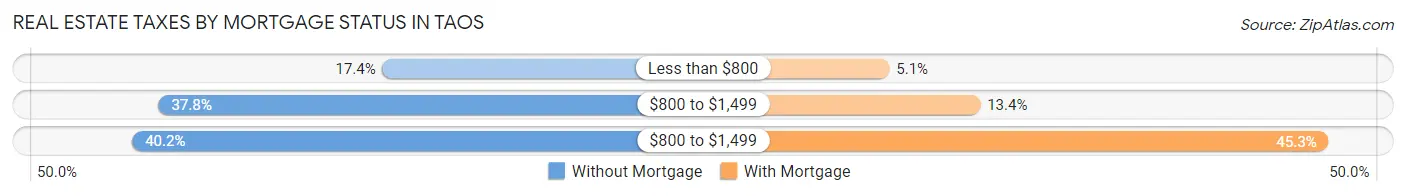
| Property Taxes | Without Mortgage | With Mortgage |
| Less than $800 | 123 (17.4%) | 52 (5.1%) |
| $800 to $1,499 | 267 (37.8%) | 136 (13.4%) |
| $800 to $1,499 | 284 (40.2%) | 458 (45.3%) |
| Total | 707 (100.0%) | 1,012 (100.0%) |
Health & Disability in Taos
Health Insurance Coverage by Age in Taos
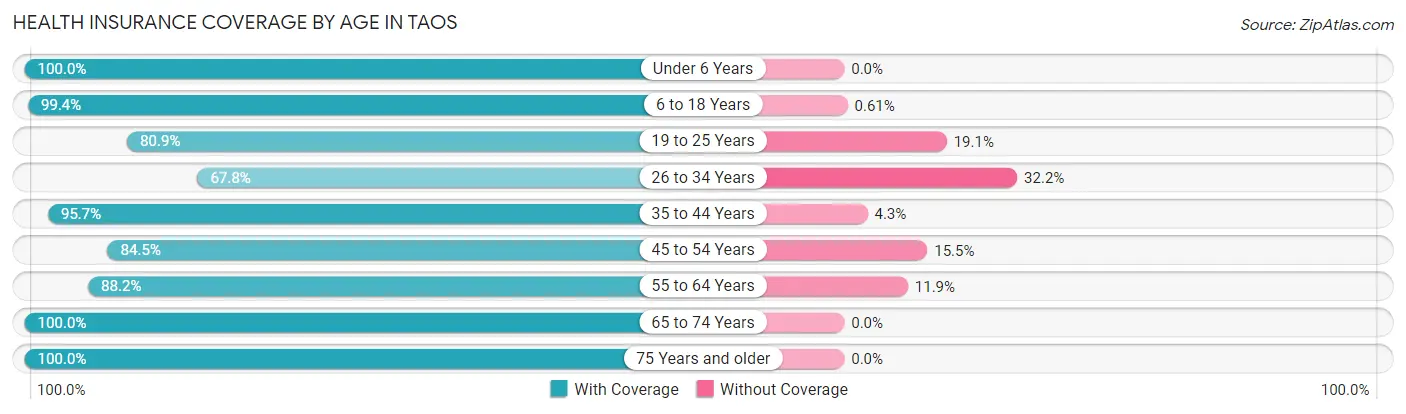
| Age Bracket | With Coverage | Without Coverage |
| Under 6 Years | 98 (100.0%) | 0 (0.0%) |
| 6 to 18 Years | 821 (99.4%) | 5 (0.6%) |
| 19 to 25 Years | 487 (80.9%) | 115 (19.1%) |
| 26 to 34 Years | 206 (67.8%) | 98 (32.2%) |
| 35 to 44 Years | 929 (95.7%) | 42 (4.3%) |
| 45 to 54 Years | 595 (84.5%) | 109 (15.5%) |
| 55 to 64 Years | 692 (88.1%) | 93 (11.8%) |
| 65 to 74 Years | 1,245 (100.0%) | 0 (0.0%) |
| 75 Years and older | 731 (100.0%) | 0 (0.0%) |
| Total | 5,804 (92.6%) | 462 (7.4%) |
Health Insurance Coverage by Citizenship Status in Taos
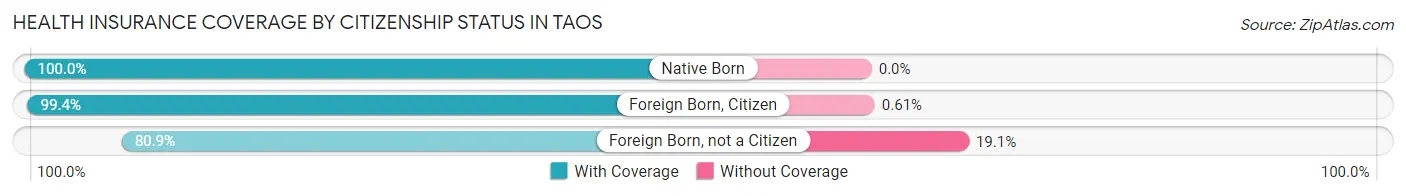
| Citizenship Status | With Coverage | Without Coverage |
| Native Born | 98 (100.0%) | 0 (0.0%) |
| Foreign Born, Citizen | 821 (99.4%) | 5 (0.6%) |
| Foreign Born, not a Citizen | 487 (80.9%) | 115 (19.1%) |
Health Insurance Coverage by Household Income in Taos
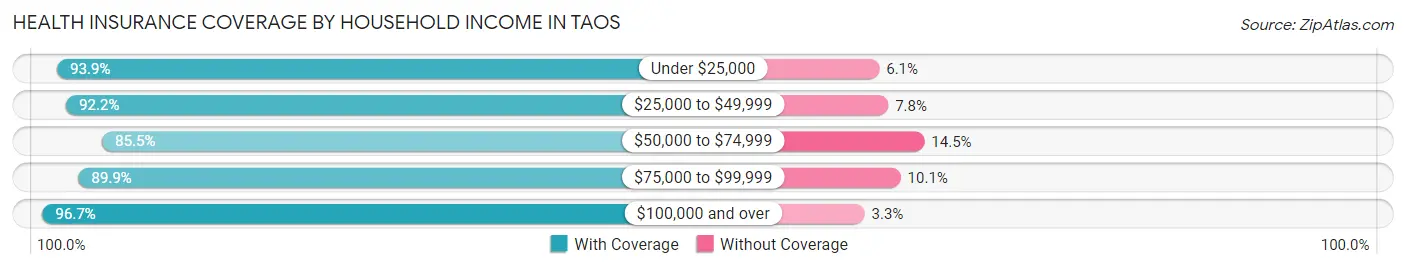
| Household Income | With Coverage | Without Coverage |
| Under $25,000 | 1,681 (93.9%) | 109 (6.1%) |
| $25,000 to $49,999 | 1,165 (92.2%) | 98 (7.8%) |
| $50,000 to $74,999 | 782 (85.5%) | 133 (14.5%) |
| $75,000 to $99,999 | 606 (89.9%) | 68 (10.1%) |
| $100,000 and over | 1,504 (96.7%) | 52 (3.3%) |
Public vs Private Health Insurance Coverage by Age in Taos
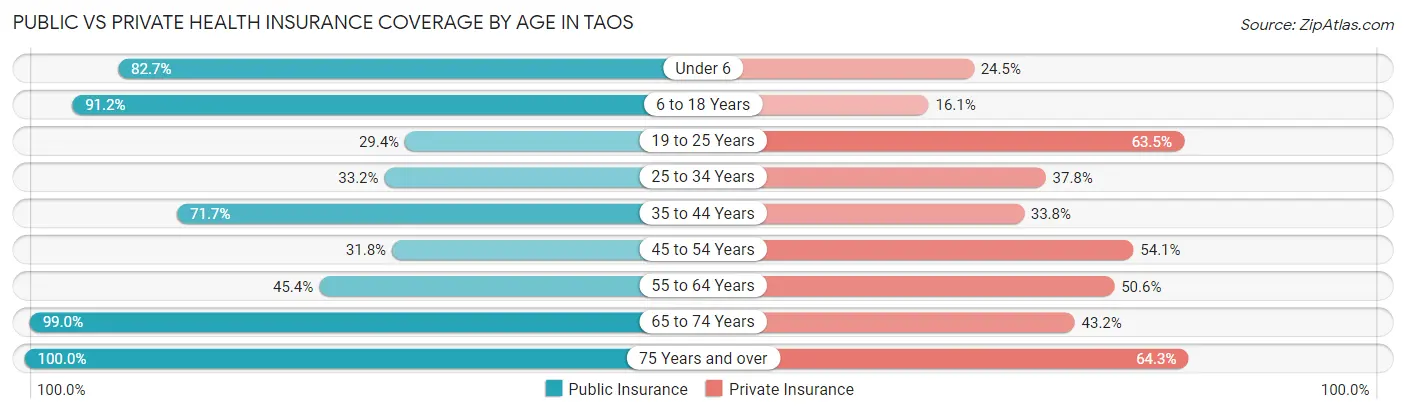
| Age Bracket | Public Insurance | Private Insurance |
| Under 6 | 81 (82.7%) | 24 (24.5%) |
| 6 to 18 Years | 753 (91.2%) | 133 (16.1%) |
| 19 to 25 Years | 177 (29.4%) | 382 (63.5%) |
| 25 to 34 Years | 101 (33.2%) | 115 (37.8%) |
| 35 to 44 Years | 696 (71.7%) | 328 (33.8%) |
| 45 to 54 Years | 224 (31.8%) | 381 (54.1%) |
| 55 to 64 Years | 356 (45.4%) | 397 (50.6%) |
| 65 to 74 Years | 1,233 (99.0%) | 538 (43.2%) |
| 75 Years and over | 731 (100.0%) | 470 (64.3%) |
| Total | 4,352 (69.5%) | 2,768 (44.2%) |
Disability Status by Sex by Age in Taos
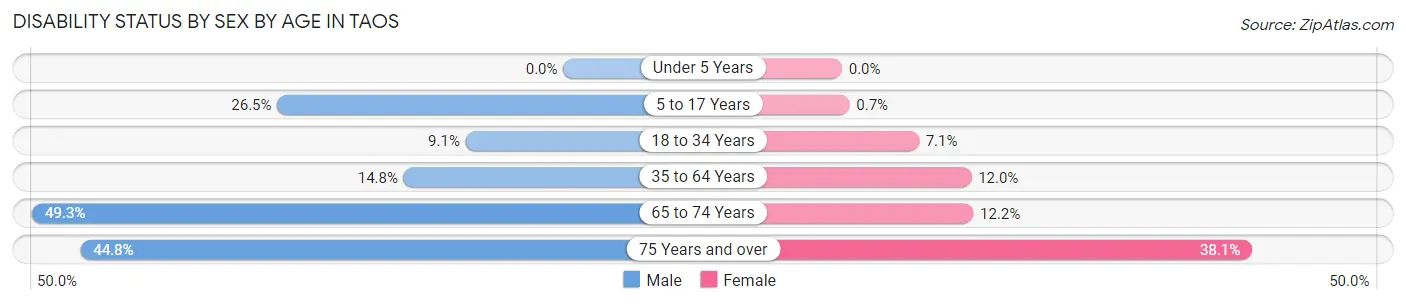
| Age Bracket | Male | Female |
| Under 5 Years | 0 (0.0%) | 0 (0.0%) |
| 5 to 17 Years | 108 (26.5%) | 2 (0.7%) |
| 18 to 34 Years | 49 (9.1%) | 37 (7.1%) |
| 35 to 64 Years | 183 (14.8%) | 147 (12.0%) |
| 65 to 74 Years | 359 (49.3%) | 63 (12.2%) |
| 75 Years and over | 104 (44.8%) | 190 (38.1%) |
Disability Class by Sex by Age in Taos
Disability Class: Hearing Difficulty
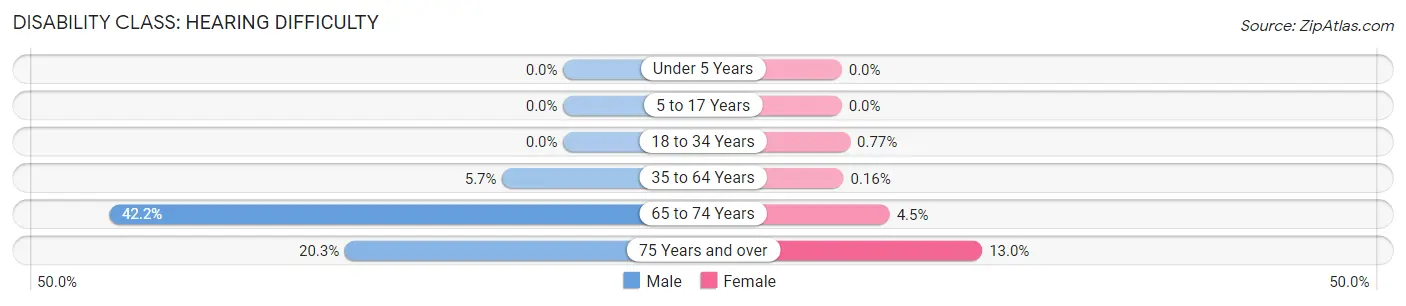
| Age Bracket | Male | Female |
| Under 5 Years | 0 (0.0%) | 0 (0.0%) |
| 5 to 17 Years | 0 (0.0%) | 0 (0.0%) |
| 18 to 34 Years | 0 (0.0%) | 4 (0.8%) |
| 35 to 64 Years | 70 (5.7%) | 2 (0.2%) |
| 65 to 74 Years | 307 (42.2%) | 23 (4.4%) |
| 75 Years and over | 47 (20.3%) | 65 (13.0%) |
Disability Class: Vision Difficulty
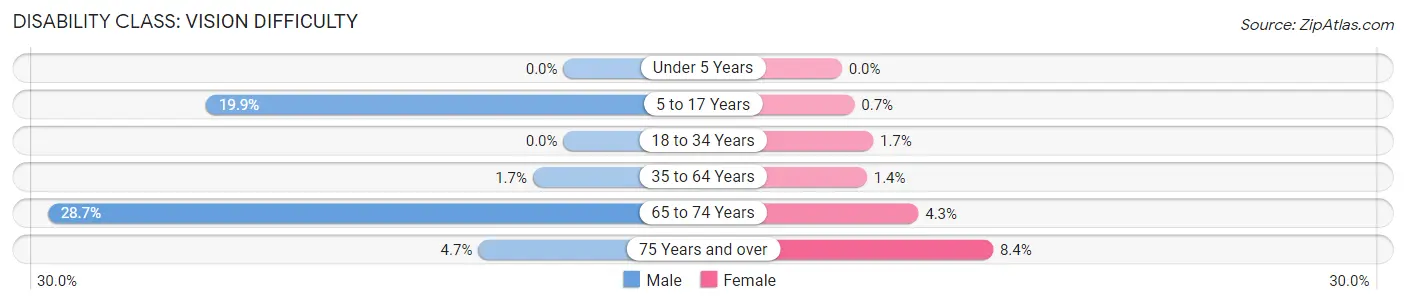
| Age Bracket | Male | Female |
| Under 5 Years | 0 (0.0%) | 0 (0.0%) |
| 5 to 17 Years | 81 (19.9%) | 2 (0.7%) |
| 18 to 34 Years | 0 (0.0%) | 9 (1.7%) |
| 35 to 64 Years | 21 (1.7%) | 17 (1.4%) |
| 65 to 74 Years | 209 (28.7%) | 22 (4.3%) |
| 75 Years and over | 11 (4.7%) | 42 (8.4%) |
Disability Class: Cognitive Difficulty
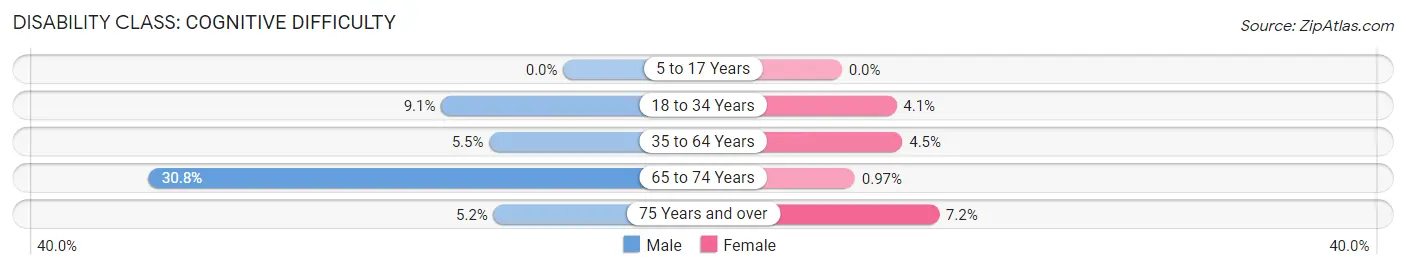
| Age Bracket | Male | Female |
| 5 to 17 Years | 0 (0.0%) | 0 (0.0%) |
| 18 to 34 Years | 49 (9.1%) | 21 (4.1%) |
| 35 to 64 Years | 68 (5.5%) | 55 (4.5%) |
| 65 to 74 Years | 224 (30.8%) | 5 (1.0%) |
| 75 Years and over | 12 (5.2%) | 36 (7.2%) |
Disability Class: Ambulatory Difficulty
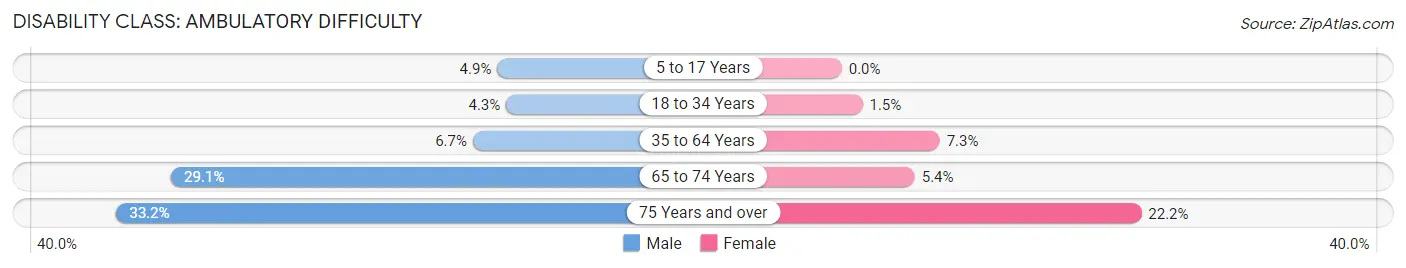
| Age Bracket | Male | Female |
| 5 to 17 Years | 20 (4.9%) | 0 (0.0%) |
| 18 to 34 Years | 23 (4.3%) | 8 (1.5%) |
| 35 to 64 Years | 83 (6.7%) | 89 (7.3%) |
| 65 to 74 Years | 212 (29.1%) | 28 (5.4%) |
| 75 Years and over | 77 (33.2%) | 111 (22.2%) |
Disability Class: Self-Care Difficulty
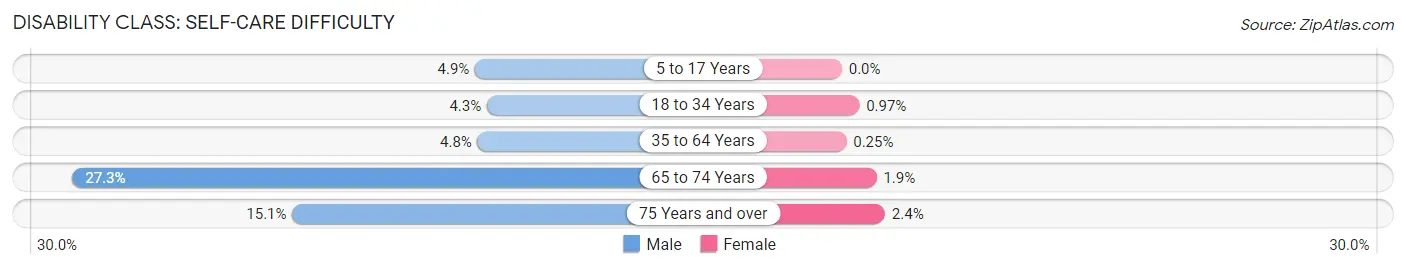
| Age Bracket | Male | Female |
| 5 to 17 Years | 20 (4.9%) | 0 (0.0%) |
| 18 to 34 Years | 23 (4.3%) | 5 (1.0%) |
| 35 to 64 Years | 59 (4.8%) | 3 (0.3%) |
| 65 to 74 Years | 199 (27.3%) | 10 (1.9%) |
| 75 Years and over | 35 (15.1%) | 12 (2.4%) |
Technology Access in Taos
Computing Device Access in Taos
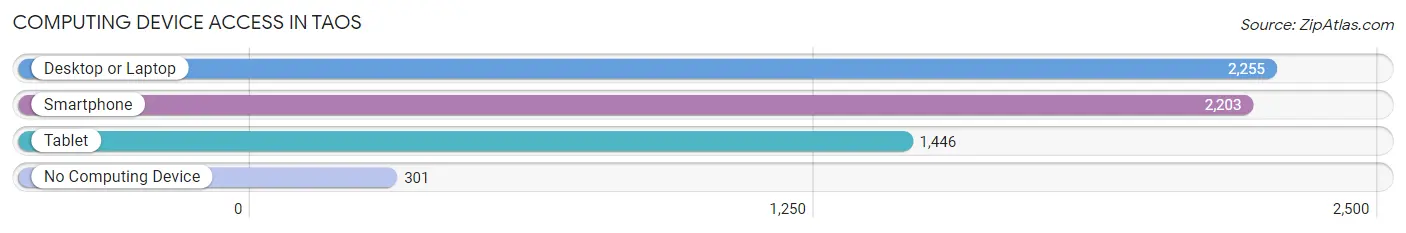
| Device Type | # Households | % Households |
| Desktop or Laptop | 2,255 | 78.1% |
| Smartphone | 2,203 | 76.3% |
| Tablet | 1,446 | 50.1% |
| No Computing Device | 301 | 10.4% |
| Total | 2,886 | 100.0% |
Internet Access in Taos
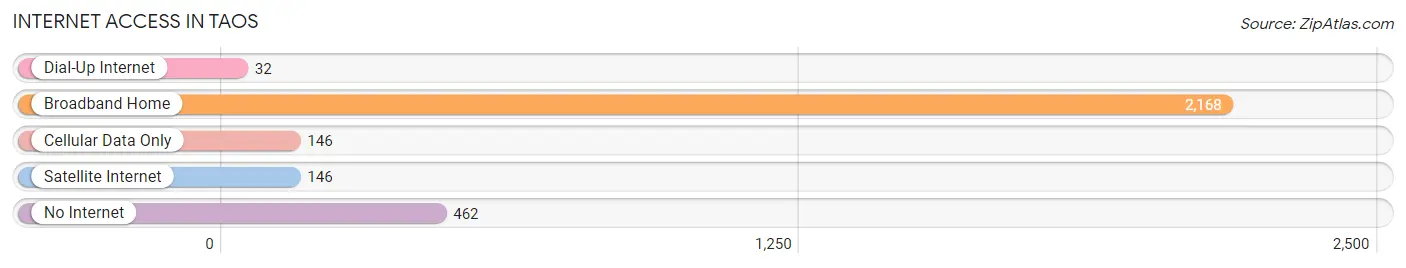
| Internet Type | # Households | % Households |
| Dial-Up Internet | 32 | 1.1% |
| Broadband Home | 2,168 | 75.1% |
| Cellular Data Only | 146 | 5.1% |
| Satellite Internet | 146 | 5.1% |
| No Internet | 462 | 16.0% |
| Total | 2,886 | 100.0% |
Taos Summary
Taos, New Mexico is a small town located in the northern part of the state, near the Colorado border. It is the county seat of Taos County and is the largest town in the area. The town is known for its rich cultural heritage, its stunning natural beauty, and its vibrant art scene.
History
Taos has a long and rich history that dates back to the early 1500s when the Taos Indians settled in the area. The Taos Indians were a nomadic tribe of Native Americans who lived in the area for centuries before the arrival of the Spanish in the late 1500s. The Spanish established a mission in the area in 1617 and the town of Taos was officially founded in 1680.
The town was a major trading center for the region and was a major stop on the Santa Fe Trail. During the Mexican-American War, Taos was the site of a major battle between the American and Mexican forces. After the war, the town became part of the United States and was incorporated in 1834.
In the late 1800s, Taos became a popular destination for artists and writers, including D.H. Lawrence, Georgia O’Keeffe, and Ansel Adams. The town was also home to the Taos Society of Artists, which was founded in 1915.
Geography
Taos is located in the northern part of New Mexico, near the Colorado border. The town is situated in the Sangre de Cristo Mountains and is surrounded by the Carson National Forest. The Rio Grande River runs through the town and is a popular destination for rafting and fishing.
The town has a total area of 8.3 square miles and has an elevation of 7,000 feet. The climate is semi-arid and the average temperature in the summer is around 80 degrees Fahrenheit.
Economy
Taos has a diverse economy that is largely based on tourism. The town is home to several ski resorts, including Taos Ski Valley and Red River Ski Area. The town is also home to several art galleries, museums, and other attractions that draw visitors from around the world.
The town is also home to several manufacturing companies, including Taos Pueblo Industries, which produces furniture and other wood products. The town is also home to several technology companies, including TaosNet, which provides internet and other technology services.
Demographics
As of the 2010 census, the population of Taos was 5,716. The town has a population density of 690 people per square mile. The median age of the population is 41.7 years and the median household income is $37,941.
The town is predominantly Hispanic, with a population that is 73.3% Hispanic, 22.2% White, and 4.5% Native American. The town is also home to a large number of immigrants, with a population that is 11.3% foreign-born.
Taos is a vibrant and diverse town that is known for its rich cultural heritage, stunning natural beauty, and vibrant art scene. The town has a diverse economy that is largely based on tourism and is home to several ski resorts, art galleries, and other attractions. The town is predominantly Hispanic and is home to a large number of immigrants.
Common Questions
What is Per Capita Income in Taos?
Per Capita income in Taos is $36,669.
What is the Median Family Income in Taos?
Median Family Income in Taos is $48,813.
What is the Median Household income in Taos?
Median Household Income in Taos is $40,185.
What is Income or Wage Gap in Taos?
Income or Wage Gap in Taos is 20.7%.
Women in Taos earn 79.3 cents for every dollar earned by a man.
What is Family Income Deficit in Taos?
Family Income Deficit in Taos is $9,580.
Families that are below poverty line in Taos earn $9,580 less on average than the poverty threshold level.
What is Inequality or Gini Index in Taos?
Inequality or Gini Index in Taos is 0.54.
What is the Total Population of Taos?
Total Population of Taos is 6,458.
What is the Total Male Population of Taos?
Total Male Population of Taos is 3,247.
What is the Total Female Population of Taos?
Total Female Population of Taos is 3,211.
What is the Ratio of Males per 100 Females in Taos?
There are 101.12 Males per 100 Females in Taos.
What is the Ratio of Females per 100 Males in Taos?
There are 98.89 Females per 100 Males in Taos.
What is the Median Population Age in Taos?
Median Population Age in Taos is 49.3 Years.
What is the Average Family Size in Taos
Average Family Size in Taos is 3.8 People.
What is the Average Household Size in Taos
Average Household Size in Taos is 2.1 People.
How Large is the Labor Force in Taos?
There are 3,137 People in the Labor Forcein in Taos.
What is the Percentage of People in the Labor Force in Taos?
53.0% of People are in the Labor Force in Taos.
What is the Unemployment Rate in Taos?
Unemployment Rate in Taos is 8.9%.