Darlington, SC Map & Demographics
Darlington Map
Darlington Overview
$33,259
PER CAPITA INCOME
$44,286
AVG FAMILY INCOME
$33,750
AVG HOUSEHOLD INCOME
55.3%
WAGE / INCOME GAP [ % ]
44.7¢/ $1
WAGE / INCOME GAP [ $ ]
0.67
INEQUALITY / GINI INDEX
6,172
TOTAL POPULATION
2,469
MALE POPULATION
3,703
FEMALE POPULATION
66.68
MALES / 100 FEMALES
149.98
FEMALES / 100 MALES
49.8
MEDIAN AGE
3.1
AVG FAMILY SIZE
2.3
AVG HOUSEHOLD SIZE
2,364
LABOR FORCE [ PEOPLE ]
45.8%
PERCENT IN LABOR FORCE
8.9%
UNEMPLOYMENT RATE
Darlington Area Codes
Income in Darlington
Income Overview in Darlington
Per Capita Income in Darlington is $33,259, while median incomes of families and households are $44,286 and $33,750 respectively.
| Characteristic | Number | Measure |
| Per Capita Income | 6,172 | $33,259 |
| Median Family Income | 1,522 | $44,286 |
| Mean Family Income | 1,522 | $117,188 |
| Median Household Income | 2,563 | $33,750 |
| Mean Household Income | 2,563 | $80,793 |
| Income Deficit | 1,522 | $0 |
| Wage / Income Gap (%) | 6,172 | 55.28% |
| Wage / Income Gap ($) | 6,172 | 44.72¢ per $1 |
| Gini / Inequality Index | 6,172 | 0.67 |
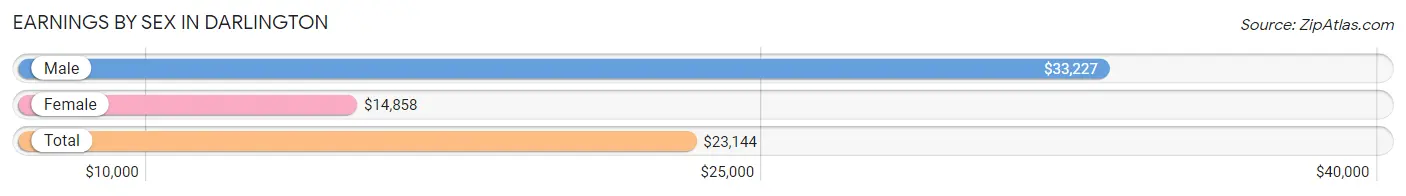
Earnings by Sex in Darlington
Average Earnings in Darlington are $23,144, $33,227 for men and $14,858 for women, a difference of 55.3%.
| Sex | Number | Average Earnings |
| Male | 981 (40.6%) | $33,227 |
| Female | 1,437 (59.4%) | $14,858 |
| Total | 2,418 (100.0%) | $23,144 |
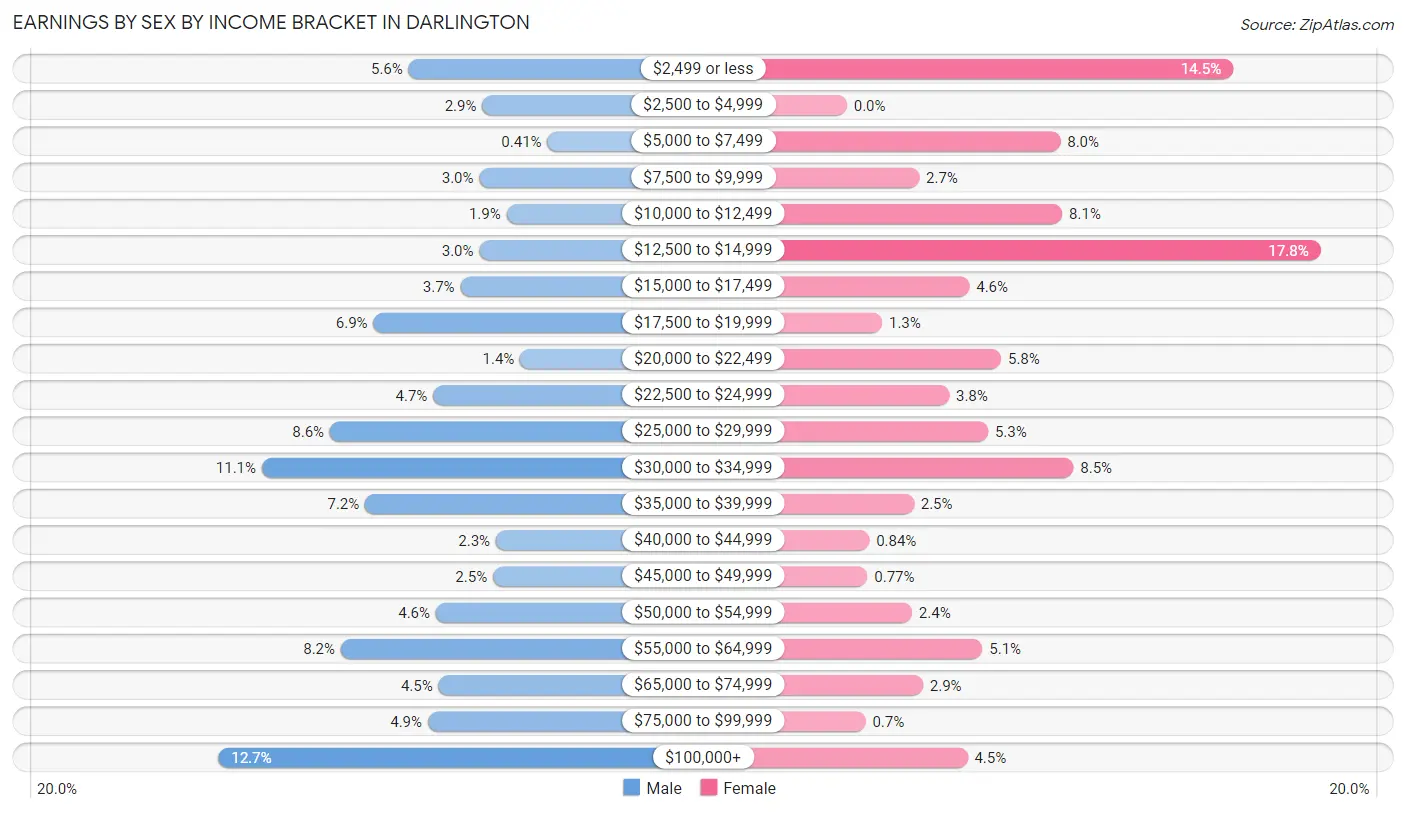
Earnings by Sex by Income Bracket in Darlington
The most common earnings brackets in Darlington are $100,000+ for men (125 | 12.7%) and $12,500 to $14,999 for women (255 | 17.7%).
| Income | Male | Female |
| $2,499 or less | 55 (5.6%) | 208 (14.5%) |
| $2,500 to $4,999 | 28 (2.9%) | 0 (0.0%) |
| $5,000 to $7,499 | 4 (0.4%) | 115 (8.0%) |
| $7,500 to $9,999 | 29 (3.0%) | 39 (2.7%) |
| $10,000 to $12,499 | 19 (1.9%) | 116 (8.1%) |
| $12,500 to $14,999 | 29 (3.0%) | 255 (17.7%) |
| $15,000 to $17,499 | 36 (3.7%) | 66 (4.6%) |
| $17,500 to $19,999 | 68 (6.9%) | 19 (1.3%) |
| $20,000 to $22,499 | 14 (1.4%) | 83 (5.8%) |
| $22,500 to $24,999 | 46 (4.7%) | 55 (3.8%) |
| $25,000 to $29,999 | 84 (8.6%) | 76 (5.3%) |
| $30,000 to $34,999 | 109 (11.1%) | 122 (8.5%) |
| $35,000 to $39,999 | 71 (7.2%) | 36 (2.5%) |
| $40,000 to $44,999 | 23 (2.3%) | 12 (0.8%) |
| $45,000 to $49,999 | 24 (2.5%) | 11 (0.8%) |
| $50,000 to $54,999 | 45 (4.6%) | 35 (2.4%) |
| $55,000 to $64,999 | 80 (8.2%) | 73 (5.1%) |
| $65,000 to $74,999 | 44 (4.5%) | 41 (2.9%) |
| $75,000 to $99,999 | 48 (4.9%) | 10 (0.7%) |
| $100,000+ | 125 (12.7%) | 65 (4.5%) |
| Total | 981 (100.0%) | 1,437 (100.0%) |
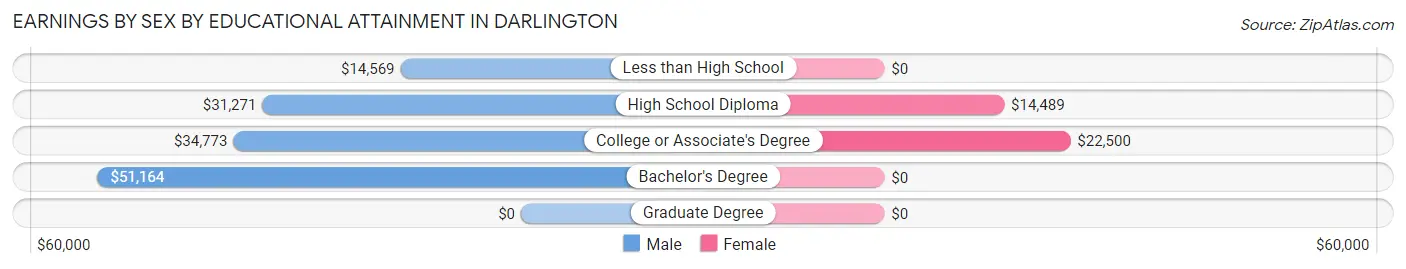
Earnings by Sex by Educational Attainment in Darlington
Average earnings in Darlington are $37,647 for men and $17,244 for women, a difference of 54.2%. Men with an educational attainment of bachelor's degree enjoy the highest average annual earnings of $51,164, while those with less than high school education earn the least with $14,569. Women with an educational attainment of college or associate's degree earn the most with the average annual earnings of $22,500, while those with high school diploma education have the smallest earnings of $14,489.
| Educational Attainment | Male Income | Female Income |
| Less than High School | $14,569 | $0 |
| High School Diploma | $31,271 | $14,489 |
| College or Associate's Degree | $34,773 | $22,500 |
| Bachelor's Degree | $51,164 | $0 |
| Graduate Degree | - | - |
| Total | $37,647 | $17,244 |
Family Income in Darlington
Family Income Brackets in Darlington
According to the Darlington family income data, there are 324 families falling into the $35,000 to $49,999 income range, which is the most common income bracket and makes up 21.3% of all families. Conversely, the $10,000 to $14,999 income bracket is the least frequent group with only 47 families (3.1%) belonging to this category.
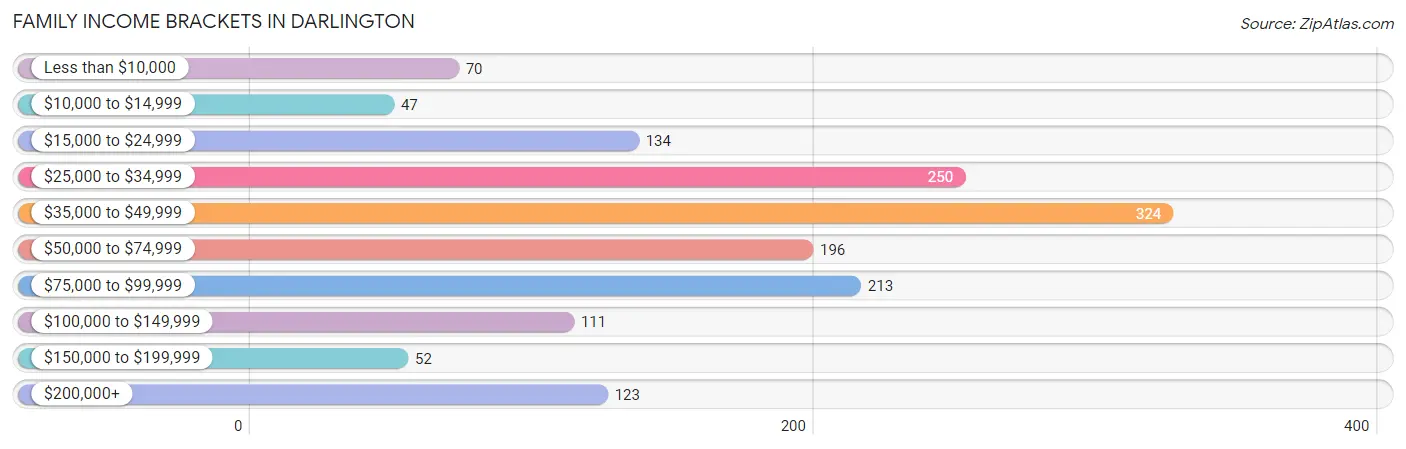
| Income Bracket | # Families | % Families |
| Less than $10,000 | 70 | 4.6% |
| $10,000 to $14,999 | 47 | 3.1% |
| $15,000 to $24,999 | 134 | 8.8% |
| $25,000 to $34,999 | 250 | 16.4% |
| $35,000 to $49,999 | 324 | 21.3% |
| $50,000 to $74,999 | 196 | 12.9% |
| $75,000 to $99,999 | 213 | 14.0% |
| $100,000 to $149,999 | 111 | 7.3% |
| $150,000 to $199,999 | 52 | 3.4% |
| $200,000+ | 123 | 8.1% |
Family Income by Famaliy Size in Darlington
4-person families (249 | 16.4%) account for the highest median family income in Darlington with $93,472 per family, while 4-person families (249 | 16.4%) have the highest median income of $23,368 per family member.
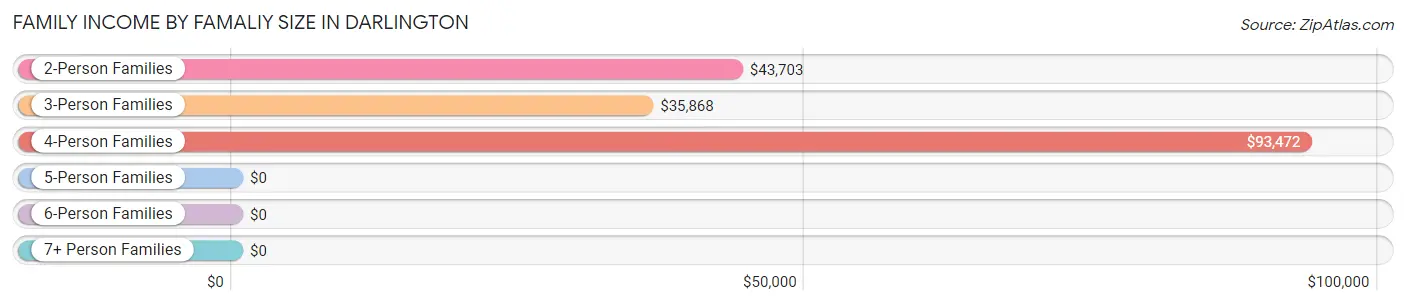
| Income Bracket | # Families | Median Income |
| 2-Person Families | 760 (49.9%) | $43,703 |
| 3-Person Families | 329 (21.6%) | $35,868 |
| 4-Person Families | 249 (16.4%) | $93,472 |
| 5-Person Families | 184 (12.1%) | $0 |
| 6-Person Families | 0 (0.0%) | $0 |
| 7+ Person Families | 0 (0.0%) | $0 |
| Total | 1,522 (100.0%) | $44,286 |
Family Income by Number of Earners in Darlington
The median family income in Darlington is $44,286, with families comprising 2 earners (379) having the highest median family income of $106,146, while families with 1 earner (725) have the lowest median family income of $34,212, accounting for 24.9% and 47.6% of families, respectively.
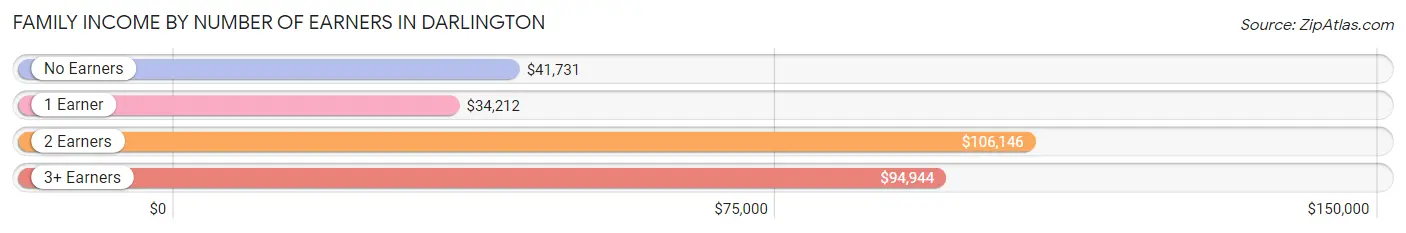
| Number of Earners | # Families | Median Income |
| No Earners | 310 (20.4%) | $41,731 |
| 1 Earner | 725 (47.6%) | $34,212 |
| 2 Earners | 379 (24.9%) | $106,146 |
| 3+ Earners | 108 (7.1%) | $94,944 |
| Total | 1,522 (100.0%) | $44,286 |
Household Income in Darlington
Household Income Brackets in Darlington
With 423 households falling in the category, the $35,000 to $49,999 income range is the most frequent in Darlington, accounting for 16.5% of all households. In contrast, only 51 households (2.0%) fall into the $150,000 to $199,999 income bracket, making it the least populous group.
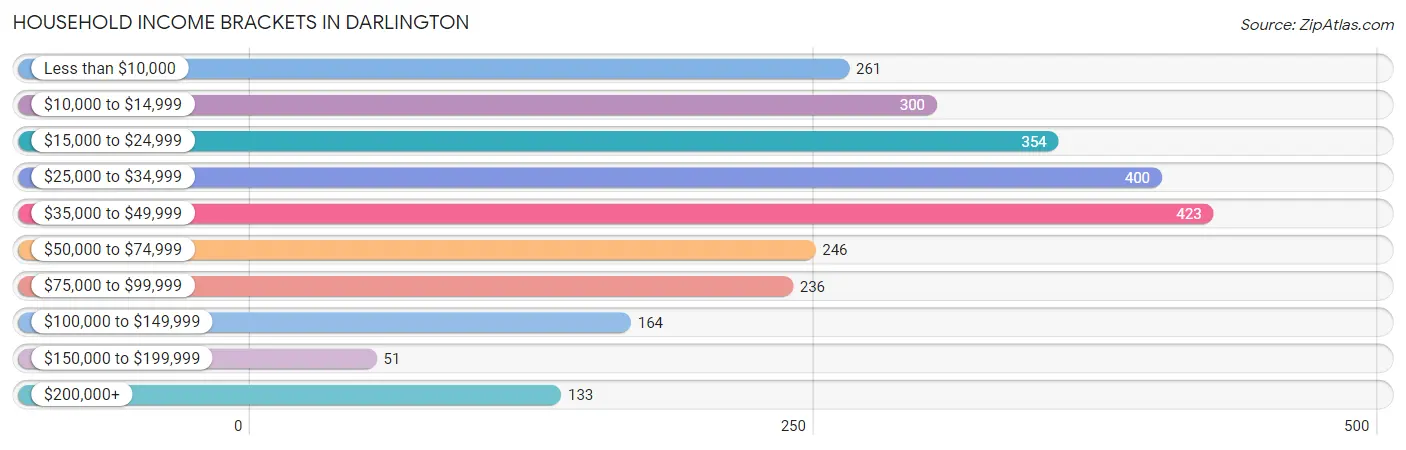
| Income Bracket | # Households | % Households |
| Less than $10,000 | 261 | 10.2% |
| $10,000 to $14,999 | 300 | 11.7% |
| $15,000 to $24,999 | 354 | 13.8% |
| $25,000 to $34,999 | 400 | 15.6% |
| $35,000 to $49,999 | 423 | 16.5% |
| $50,000 to $74,999 | 246 | 9.6% |
| $75,000 to $99,999 | 236 | 9.2% |
| $100,000 to $149,999 | 164 | 6.4% |
| $150,000 to $199,999 | 51 | 2.0% |
| $200,000+ | 133 | 5.2% |
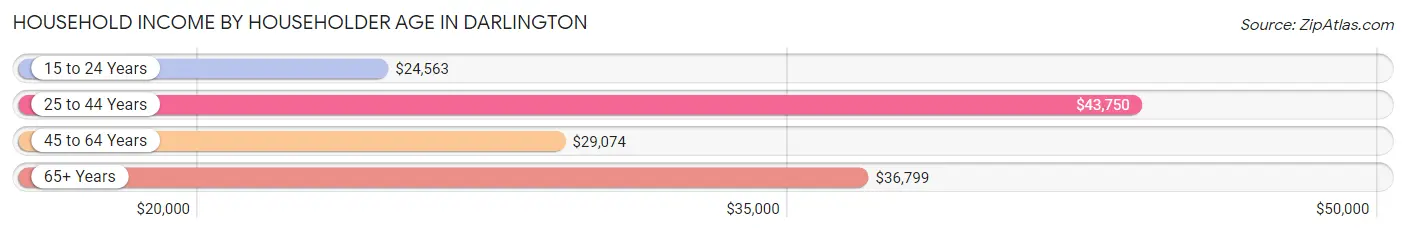
Household Income by Householder Age in Darlington
The median household income in Darlington is $33,750, with the highest median household income of $43,750 found in the 25 to 44 years age bracket for the primary householder. A total of 563 households (22.0%) fall into this category. Meanwhile, the 15 to 24 years age bracket for the primary householder has the lowest median household income of $24,563, with 61 households (2.4%) in this group.
| Income Bracket | # Households | Median Income |
| 15 to 24 Years | 61 (2.4%) | $24,563 |
| 25 to 44 Years | 563 (22.0%) | $43,750 |
| 45 to 64 Years | 818 (31.9%) | $29,074 |
| 65+ Years | 1,121 (43.7%) | $36,799 |
| Total | 2,563 (100.0%) | $33,750 |
Poverty in Darlington
Income Below Poverty by Sex and Age in Darlington
With 19.3% poverty level for males and 38.8% for females among the residents of Darlington, 16 and 17 year old males and 5 year old females are the most vulnerable to poverty, with 65 males (79.3%) and 31 females (100.0%) in their respective age groups living below the poverty level.
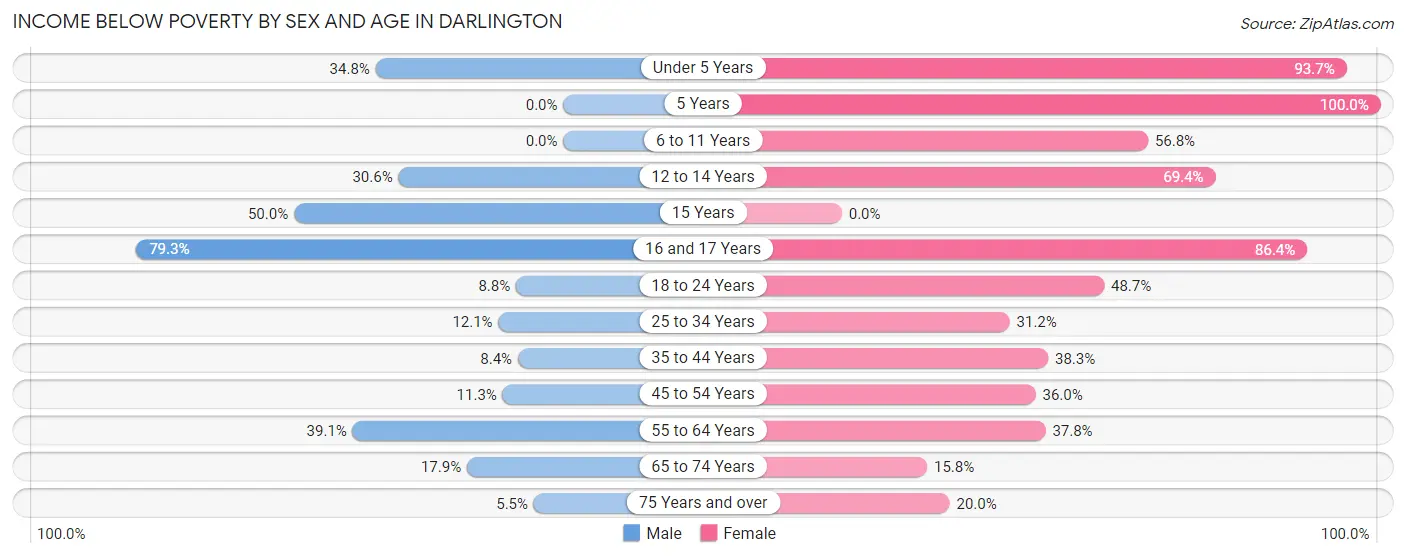
| Age Bracket | Male | Female |
| Under 5 Years | 54 (34.8%) | 74 (93.7%) |
| 5 Years | 0 (0.0%) | 31 (100.0%) |
| 6 to 11 Years | 0 (0.0%) | 104 (56.8%) |
| 12 to 14 Years | 41 (30.6%) | 129 (69.4%) |
| 15 Years | 28 (50.0%) | 0 (0.0%) |
| 16 and 17 Years | 65 (79.3%) | 133 (86.4%) |
| 18 to 24 Years | 18 (8.8%) | 129 (48.7%) |
| 25 to 34 Years | 20 (12.0%) | 100 (31.1%) |
| 35 to 44 Years | 22 (8.4%) | 160 (38.3%) |
| 45 to 54 Years | 23 (11.3%) | 109 (36.0%) |
| 55 to 64 Years | 106 (39.1%) | 240 (37.8%) |
| 65 to 74 Years | 68 (17.9%) | 85 (15.8%) |
| 75 Years and over | 18 (5.5%) | 82 (20.0%) |
| Total | 463 (19.3%) | 1,376 (38.8%) |
Income Above Poverty by Sex and Age in Darlington
According to the poverty statistics in Darlington, males aged 5 years and females aged 15 years are the age groups that are most secure financially, with 100.0% of males and 100.0% of females in these age groups living above the poverty line.
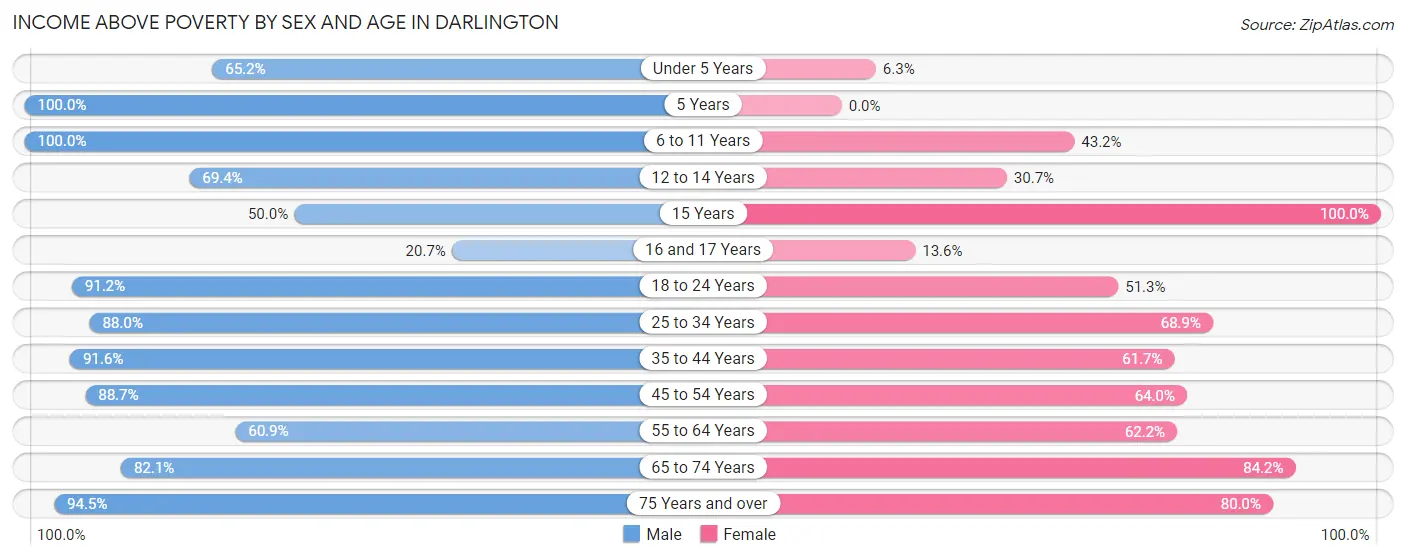
| Age Bracket | Male | Female |
| Under 5 Years | 101 (65.2%) | 5 (6.3%) |
| 5 Years | 14 (100.0%) | 0 (0.0%) |
| 6 to 11 Years | 146 (100.0%) | 79 (43.2%) |
| 12 to 14 Years | 93 (69.4%) | 57 (30.6%) |
| 15 Years | 28 (50.0%) | 27 (100.0%) |
| 16 and 17 Years | 17 (20.7%) | 21 (13.6%) |
| 18 to 24 Years | 187 (91.2%) | 136 (51.3%) |
| 25 to 34 Years | 146 (87.9%) | 221 (68.9%) |
| 35 to 44 Years | 239 (91.6%) | 258 (61.7%) |
| 45 to 54 Years | 181 (88.7%) | 194 (64.0%) |
| 55 to 64 Years | 165 (60.9%) | 395 (62.2%) |
| 65 to 74 Years | 312 (82.1%) | 452 (84.2%) |
| 75 Years and over | 311 (94.5%) | 328 (80.0%) |
| Total | 1,940 (80.7%) | 2,173 (61.2%) |
Income Below Poverty Among Married-Couple Families in Darlington
The poverty statistics for married-couple families in Darlington show that 4.8% or 39 of the total 812 families live below the poverty line. Families with 1 or 2 children have the highest poverty rate of 19.4%, comprising of 39 families. On the other hand, families with no children have the lowest poverty rate of 0.0%, which includes 0 families.
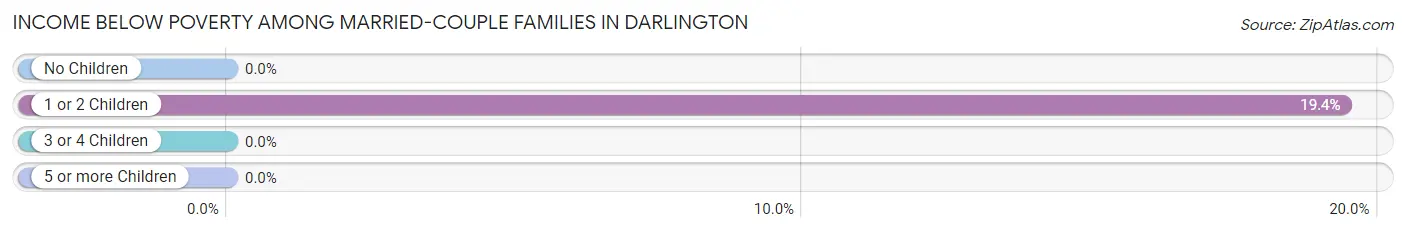
| Children | Above Poverty | Below Poverty |
| No Children | 571 (100.0%) | 0 (0.0%) |
| 1 or 2 Children | 162 (80.6%) | 39 (19.4%) |
| 3 or 4 Children | 40 (100.0%) | 0 (0.0%) |
| 5 or more Children | 0 (0.0%) | 0 (0.0%) |
| Total | 773 (95.2%) | 39 (4.8%) |
Income Below Poverty Among Single-Parent Households in Darlington
According to the poverty data in Darlington, 6.7% or 6 single-father households and 46.5% or 288 single-mother households are living below the poverty line. Among single-father households, those with no children have the highest poverty rate, with 6 households (22.2%) experiencing poverty. Likewise, among single-mother households, those with 3 or 4 children have the highest poverty rate, with 89 households (79.5%) falling below the poverty line.
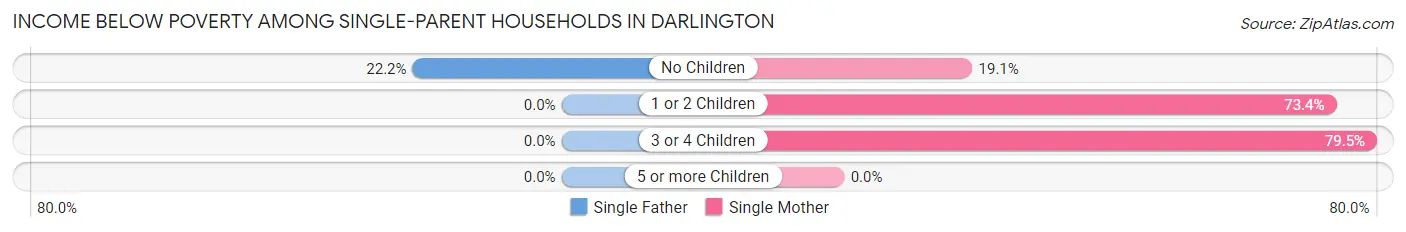
| Children | Single Father | Single Mother |
| No Children | 6 (22.2%) | 61 (19.1%) |
| 1 or 2 Children | 0 (0.0%) | 138 (73.4%) |
| 3 or 4 Children | 0 (0.0%) | 89 (79.5%) |
| 5 or more Children | 0 (0.0%) | 0 (0.0%) |
| Total | 6 (6.7%) | 288 (46.5%) |
Income Below Poverty Among Married-Couple vs Single-Parent Households in Darlington
The poverty data for Darlington shows that 39 of the married-couple family households (4.8%) and 294 of the single-parent households (41.4%) are living below the poverty level. Within the married-couple family households, those with 1 or 2 children have the highest poverty rate, with 39 households (19.4%) falling below the poverty line. Among the single-parent households, those with 3 or 4 children have the highest poverty rate, with 89 household (69.5%) living below poverty.
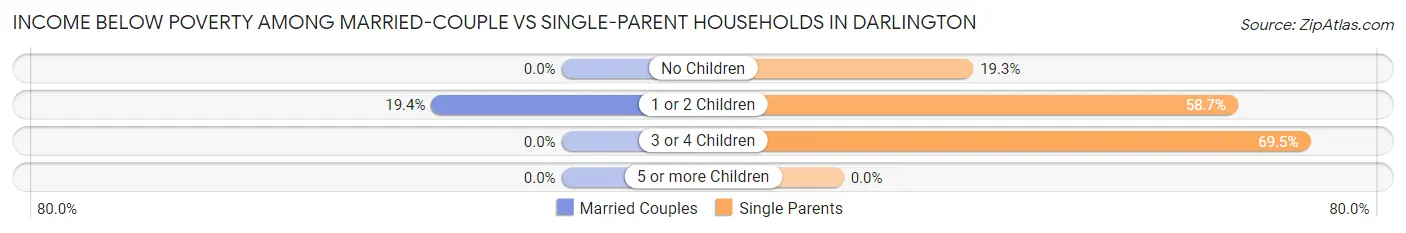
| Children | Married-Couple Families | Single-Parent Households |
| No Children | 0 (0.0%) | 67 (19.3%) |
| 1 or 2 Children | 39 (19.4%) | 138 (58.7%) |
| 3 or 4 Children | 0 (0.0%) | 89 (69.5%) |
| 5 or more Children | 0 (0.0%) | 0 (0.0%) |
| Total | 39 (4.8%) | 294 (41.4%) |
Race in Darlington
The most populous races in Darlington are Black / African American (3,846 | 62.3%), White / Caucasian (2,146 | 34.8%), and Two or more Races (169 | 2.7%).
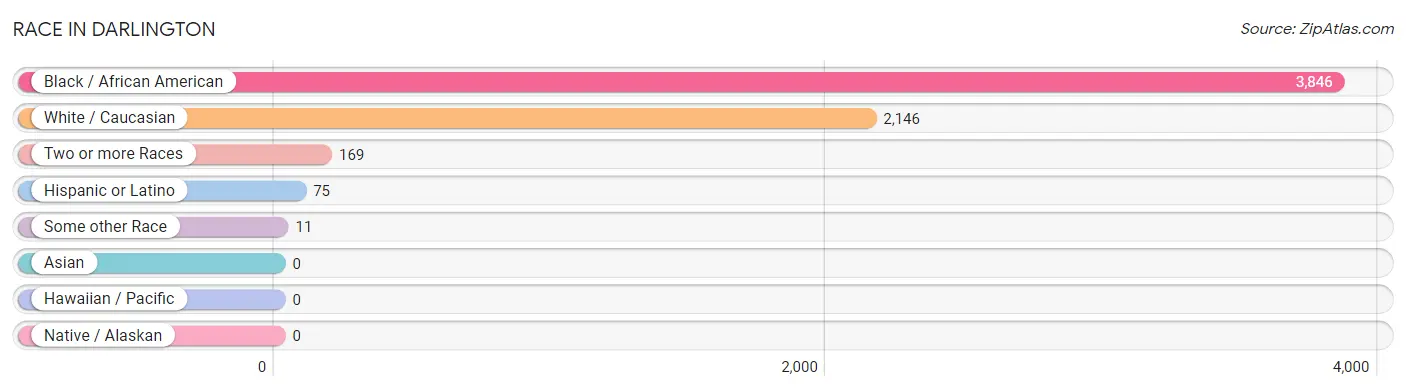
| Race | # Population | % Population |
| Asian | 0 | 0.0% |
| Black / African American | 3,846 | 62.3% |
| Hawaiian / Pacific | 0 | 0.0% |
| Hispanic or Latino | 75 | 1.2% |
| Native / Alaskan | 0 | 0.0% |
| White / Caucasian | 2,146 | 34.8% |
| Two or more Races | 169 | 2.7% |
| Some other Race | 11 | 0.2% |
| Total | 6,172 | 100.0% |
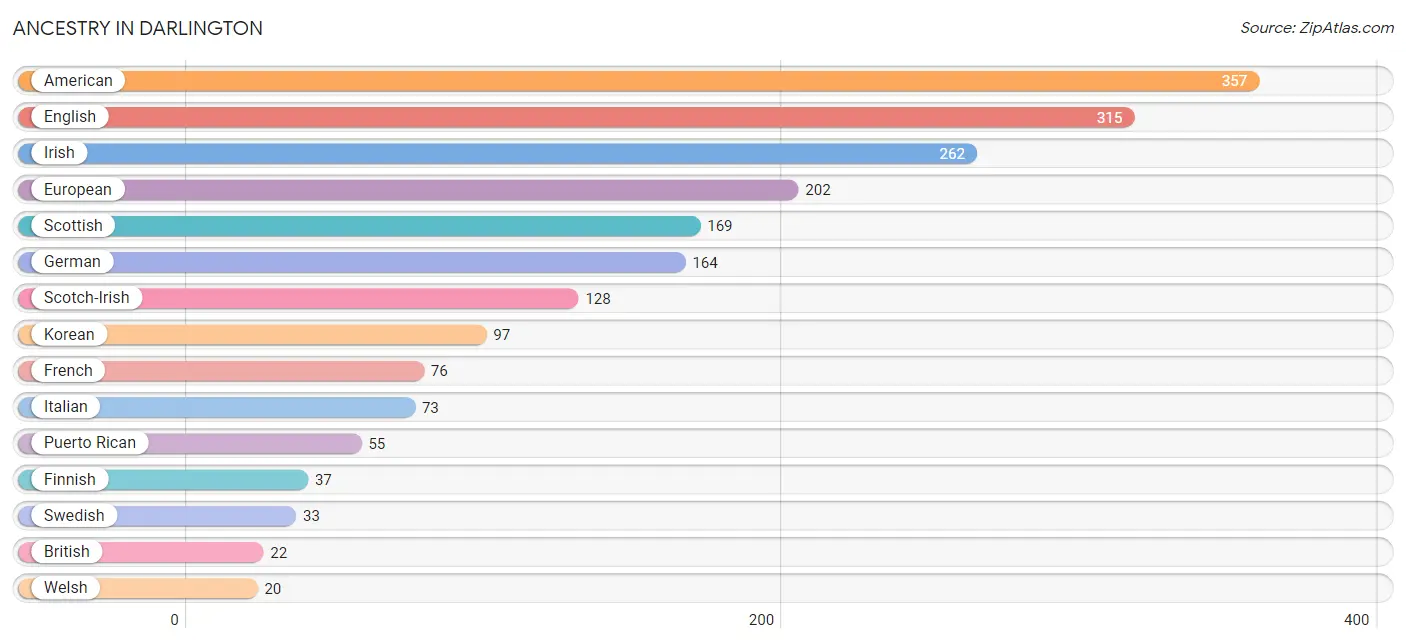
Ancestry in Darlington
The most populous ancestries reported in Darlington are American (357 | 5.8%), English (315 | 5.1%), Irish (262 | 4.2%), European (202 | 3.3%), and Scottish (169 | 2.7%), together accounting for 21.1% of all Darlington residents.
| Ancestry | # Population | % Population |
| African | 7 | 0.1% |
| American | 357 | 5.8% |
| Barbadian | 5 | 0.1% |
| British | 22 | 0.4% |
| Canadian | 6 | 0.1% |
| Cherokee | 1 | 0.0% |
| Czech | 16 | 0.3% |
| Danish | 6 | 0.1% |
| Eastern European | 7 | 0.1% |
| English | 315 | 5.1% |
| European | 202 | 3.3% |
| Finnish | 37 | 0.6% |
| French | 76 | 1.2% |
| German | 164 | 2.7% |
| Greek | 4 | 0.1% |
| Indian (Asian) | 11 | 0.2% |
| Irish | 262 | 4.2% |
| Italian | 73 | 1.2% |
| Jamaican | 9 | 0.2% |
| Korean | 97 | 1.6% |
| Mexican | 11 | 0.2% |
| Puerto Rican | 55 | 0.9% |
| Scotch-Irish | 128 | 2.1% |
| Scottish | 169 | 2.7% |
| Subsaharan African | 7 | 0.1% |
| Swedish | 33 | 0.5% |
| Welsh | 20 | 0.3% | View All 27 Rows |
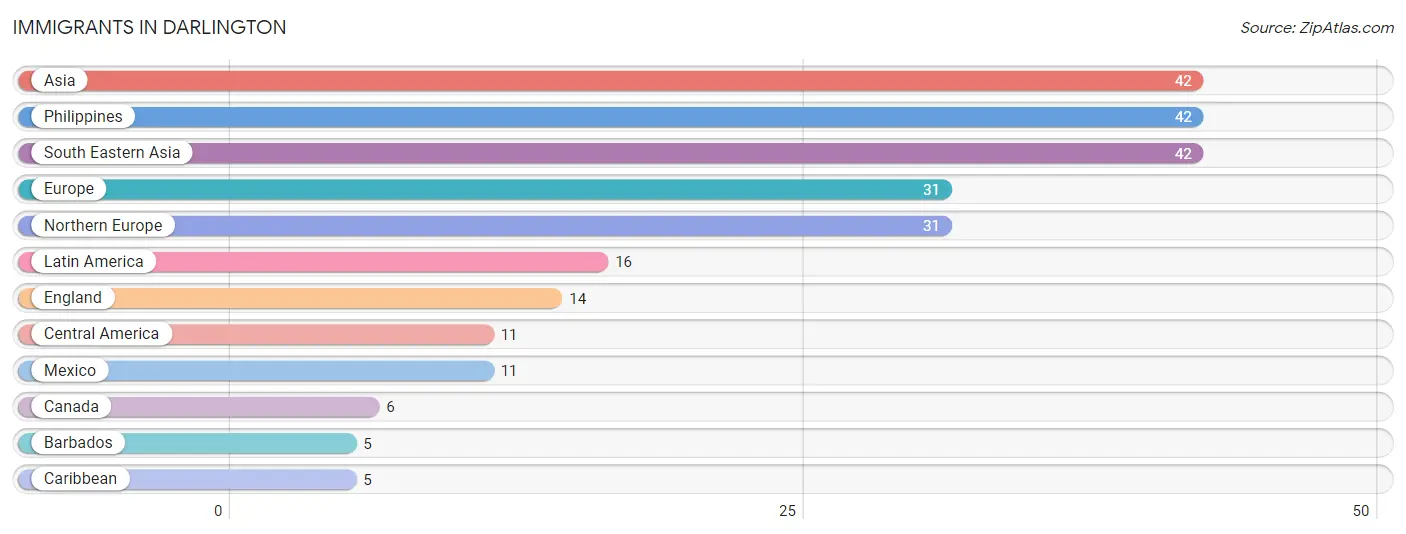
Immigrants in Darlington
The most numerous immigrant groups reported in Darlington came from Asia (42 | 0.7%), Philippines (42 | 0.7%), South Eastern Asia (42 | 0.7%), Europe (31 | 0.5%), and Northern Europe (31 | 0.5%), together accounting for 3.0% of all Darlington residents.
| Immigration Origin | # Population | % Population |
| Asia | 42 | 0.7% |
| Barbados | 5 | 0.1% |
| Canada | 6 | 0.1% |
| Caribbean | 5 | 0.1% |
| Central America | 11 | 0.2% |
| England | 14 | 0.2% |
| Europe | 31 | 0.5% |
| Latin America | 16 | 0.3% |
| Mexico | 11 | 0.2% |
| Northern Europe | 31 | 0.5% |
| Philippines | 42 | 0.7% |
| South Eastern Asia | 42 | 0.7% | View All 12 Rows |
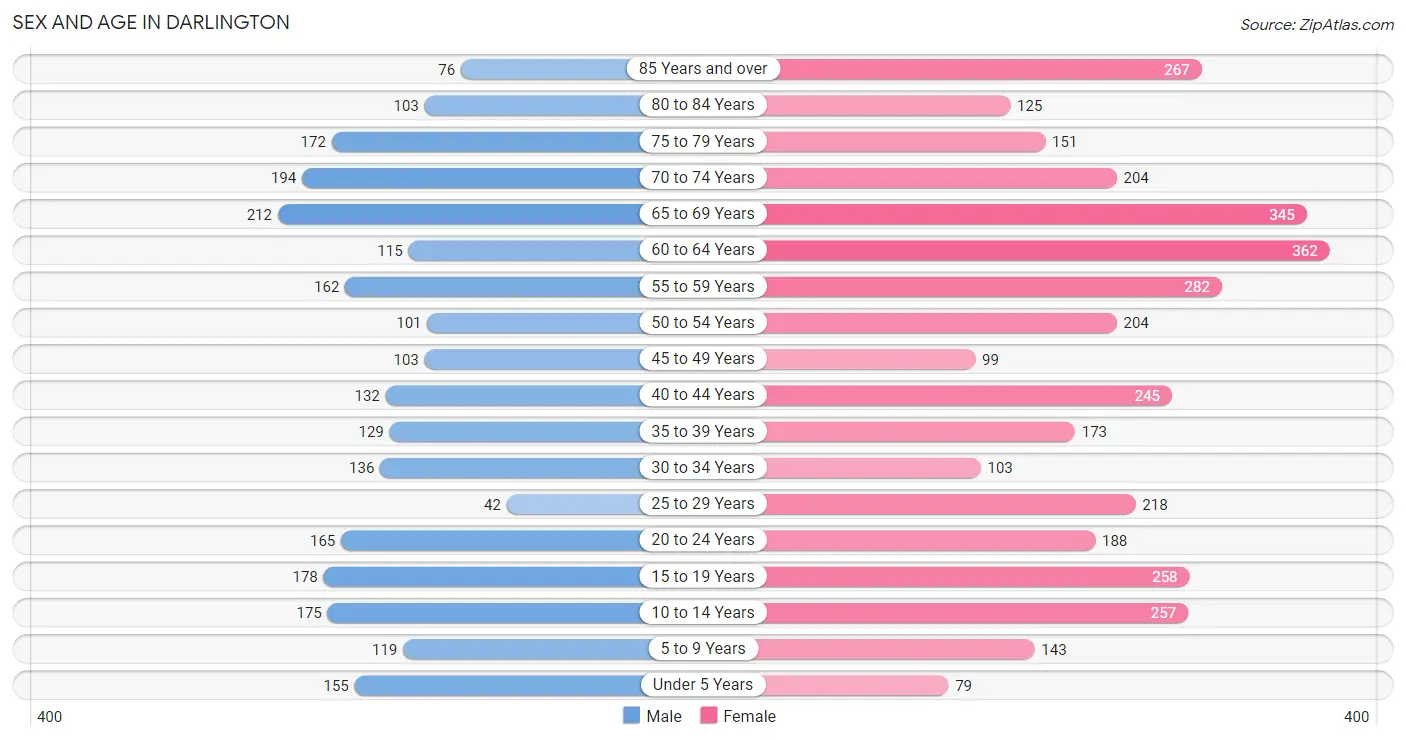
Sex and Age in Darlington
Sex and Age in Darlington
The most populous age groups in Darlington are 65 to 69 Years (212 | 8.6%) for men and 60 to 64 Years (362 | 9.8%) for women.
| Age Bracket | Male | Female |
| Under 5 Years | 155 (6.3%) | 79 (2.1%) |
| 5 to 9 Years | 119 (4.8%) | 143 (3.9%) |
| 10 to 14 Years | 175 (7.1%) | 257 (6.9%) |
| 15 to 19 Years | 178 (7.2%) | 258 (7.0%) |
| 20 to 24 Years | 165 (6.7%) | 188 (5.1%) |
| 25 to 29 Years | 42 (1.7%) | 218 (5.9%) |
| 30 to 34 Years | 136 (5.5%) | 103 (2.8%) |
| 35 to 39 Years | 129 (5.2%) | 173 (4.7%) |
| 40 to 44 Years | 132 (5.3%) | 245 (6.6%) |
| 45 to 49 Years | 103 (4.2%) | 99 (2.7%) |
| 50 to 54 Years | 101 (4.1%) | 204 (5.5%) |
| 55 to 59 Years | 162 (6.6%) | 282 (7.6%) |
| 60 to 64 Years | 115 (4.7%) | 362 (9.8%) |
| 65 to 69 Years | 212 (8.6%) | 345 (9.3%) |
| 70 to 74 Years | 194 (7.9%) | 204 (5.5%) |
| 75 to 79 Years | 172 (7.0%) | 151 (4.1%) |
| 80 to 84 Years | 103 (4.2%) | 125 (3.4%) |
| 85 Years and over | 76 (3.1%) | 267 (7.2%) |
| Total | 2,469 (100.0%) | 3,703 (100.0%) |
Families and Households in Darlington
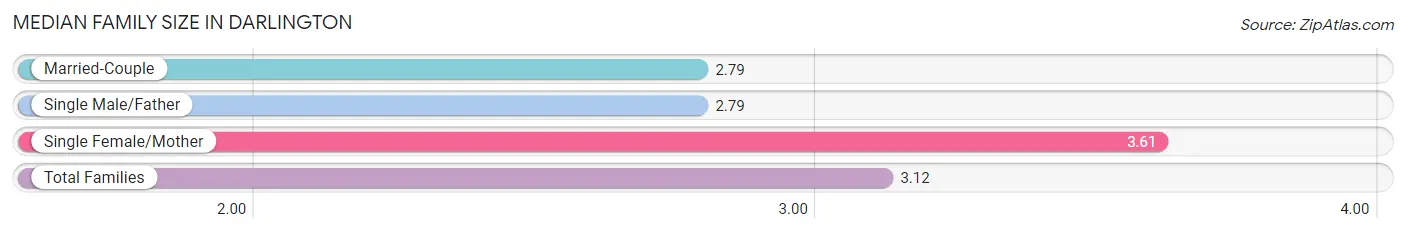
Median Family Size in Darlington
The median family size in Darlington is 3.12 persons per family, with single female/mother families (620 | 40.7%) accounting for the largest median family size of 3.61 persons per family. On the other hand, married-couple families (812 | 53.3%) represent the smallest median family size with 2.79 persons per family.
| Family Type | # Families | Family Size |
| Married-Couple | 812 (53.3%) | 2.79 |
| Single Male/Father | 90 (5.9%) | 2.79 |
| Single Female/Mother | 620 (40.7%) | 3.61 |
| Total Families | 1,522 (100.0%) | 3.12 |
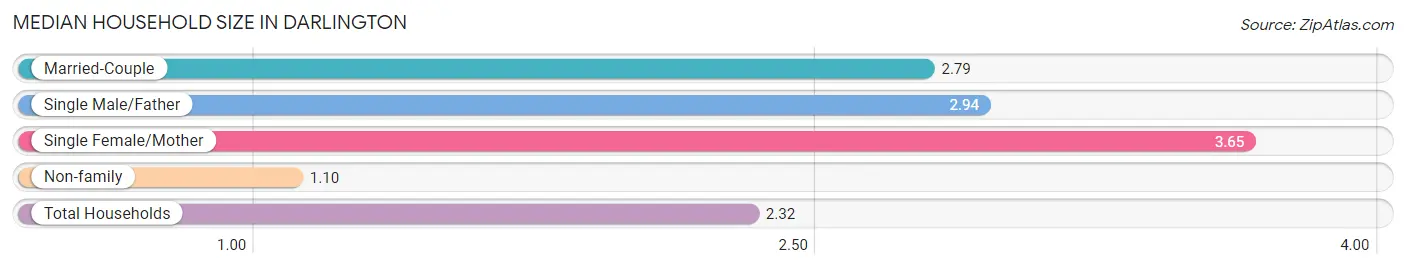
Median Household Size in Darlington
The median household size in Darlington is 2.32 persons per household, with single female/mother households (620 | 24.2%) accounting for the largest median household size of 3.65 persons per household. non-family households (1,041 | 40.6%) represent the smallest median household size with 1.10 persons per household.
| Household Type | # Households | Household Size |
| Married-Couple | 812 (31.7%) | 2.79 |
| Single Male/Father | 90 (3.5%) | 2.94 |
| Single Female/Mother | 620 (24.2%) | 3.65 |
| Non-family | 1,041 (40.6%) | 1.10 |
| Total Households | 2,563 (100.0%) | 2.32 |
Household Size by Marriage Status in Darlington
Out of a total of 2,563 households in Darlington, 1,522 (59.4%) are family households, while 1,041 (40.6%) are nonfamily households. The most numerous type of family households are 2-person households, comprising 742, and the most common type of nonfamily households are 1-person households, comprising 964.
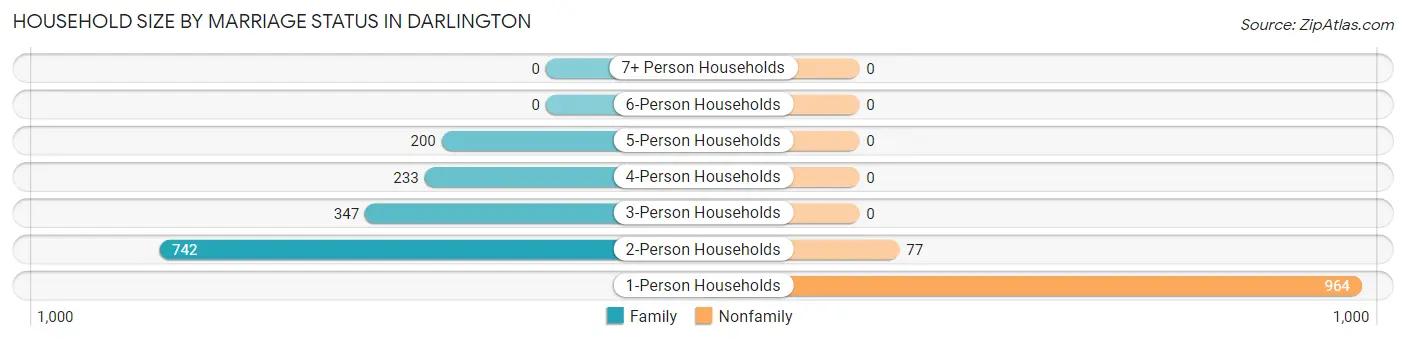
| Household Size | Family Households | Nonfamily Households |
| 1-Person Households | - | 964 (37.6%) |
| 2-Person Households | 742 (28.9%) | 77 (3.0%) |
| 3-Person Households | 347 (13.5%) | 0 (0.0%) |
| 4-Person Households | 233 (9.1%) | 0 (0.0%) |
| 5-Person Households | 200 (7.8%) | 0 (0.0%) |
| 6-Person Households | 0 (0.0%) | 0 (0.0%) |
| 7+ Person Households | 0 (0.0%) | 0 (0.0%) |
| Total | 1,522 (59.4%) | 1,041 (40.6%) |
Female Fertility in Darlington
Fertility by Age in Darlington
Average fertility rate in Darlington is 3.0 births per 1,000 women. Women in the age bracket of 20 to 34 years have the highest fertility rate with 8.0 births per 1,000 women. Women in the age bracket of 20 to 34 years acount for 100.0% of all women with births.
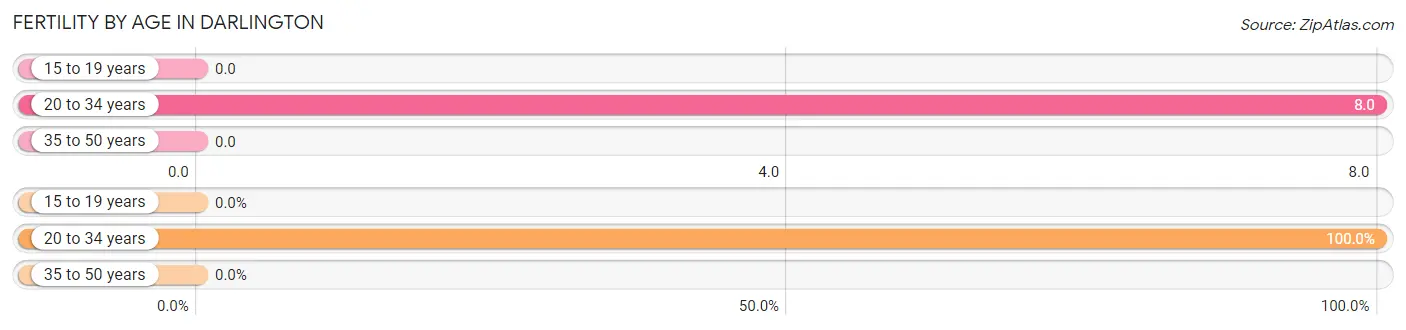
| Age Bracket | Women with Births | Births / 1,000 Women |
| 15 to 19 years | 0 (0.0%) | 0.0 |
| 20 to 34 years | 4 (100.0%) | 8.0 |
| 35 to 50 years | 0 (0.0%) | 0.0 |
| Total | 4 (100.0%) | 3.0 |
Fertility by Age by Marriage Status in Darlington
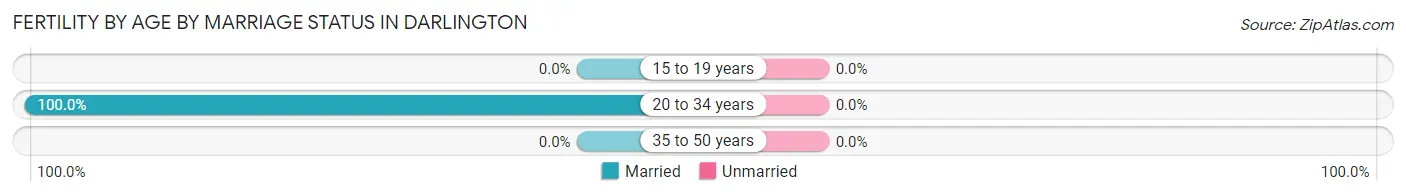
| Age Bracket | Married | Unmarried |
| 15 to 19 years | 0 (0.0%) | 0 (0.0%) |
| 20 to 34 years | 4 (100.0%) | 0 (0.0%) |
| 35 to 50 years | 0 (0.0%) | 0 (0.0%) |
| Total | 4 (100.0%) | 0 (0.0%) |
Fertility by Education in Darlington
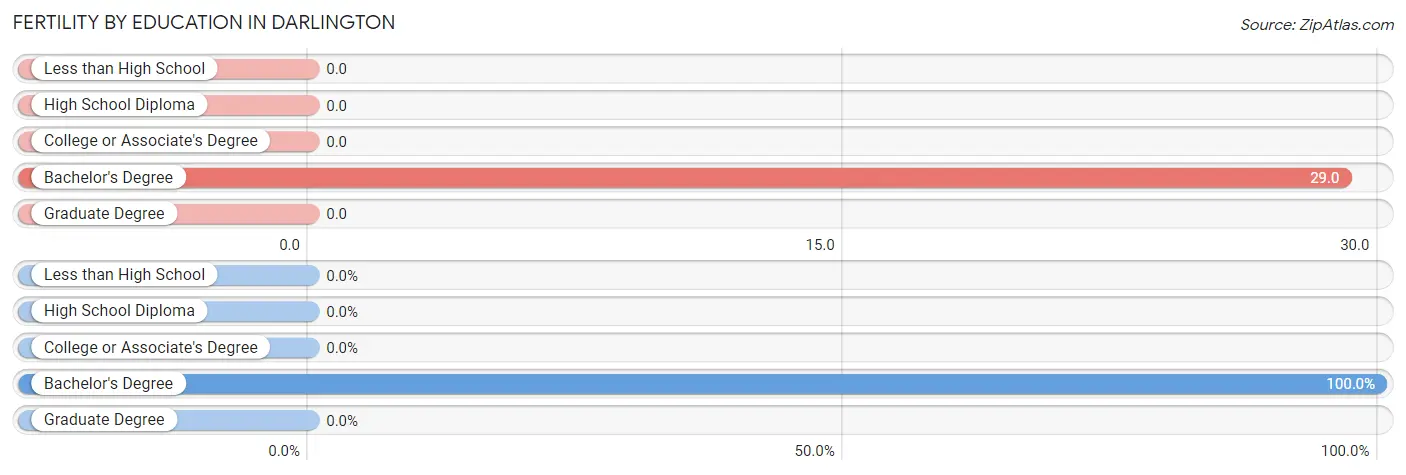
| Educational Attainment | Women with Births | Births / 1,000 Women |
| Less than High School | 0 (0.0%) | 0.0 |
| High School Diploma | 0 (0.0%) | 0.0 |
| College or Associate's Degree | 0 (0.0%) | 0.0 |
| Bachelor's Degree | 4 (100.0%) | 29.0 |
| Graduate Degree | 0 (0.0%) | 0.0 |
| Total | 4 (100.0%) | 3.0 |
Fertility by Education by Marriage Status in Darlington
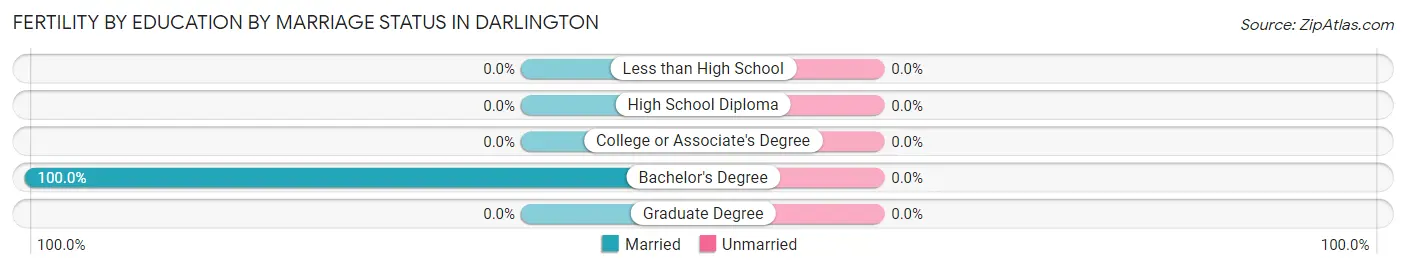
| Educational Attainment | Married | Unmarried |
| Less than High School | 0 (0.0%) | 0 (0.0%) |
| High School Diploma | 0 (0.0%) | 0 (0.0%) |
| College or Associate's Degree | 0 (0.0%) | 0 (0.0%) |
| Bachelor's Degree | 4 (100.0%) | 0 (0.0%) |
| Graduate Degree | 0 (0.0%) | 0 (0.0%) |
| Total | 4 (100.0%) | 0 (0.0%) |
Employment Characteristics in Darlington
Employment by Class of Employer in Darlington
Among the 2,067 employed individuals in Darlington, private company employees (1,244 | 60.2%), state government employees (274 | 13.3%), and local government employees (169 | 8.2%) make up the most common classes of employment.
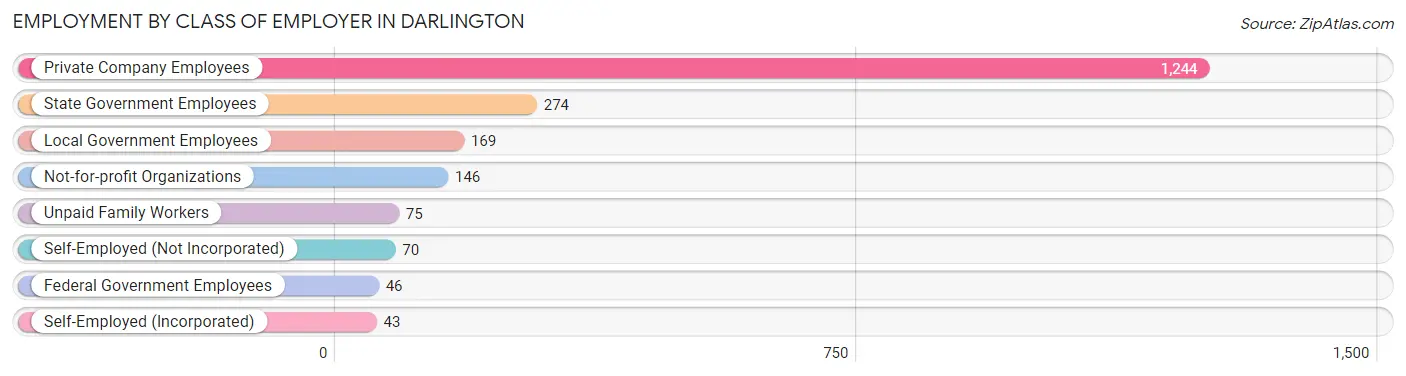
| Employer Class | # Employees | % Employees |
| Private Company Employees | 1,244 | 60.2% |
| Self-Employed (Incorporated) | 43 | 2.1% |
| Self-Employed (Not Incorporated) | 70 | 3.4% |
| Not-for-profit Organizations | 146 | 7.1% |
| Local Government Employees | 169 | 8.2% |
| State Government Employees | 274 | 13.3% |
| Federal Government Employees | 46 | 2.2% |
| Unpaid Family Workers | 75 | 3.6% |
| Total | 2,067 | 100.0% |
Employment Status by Age in Darlington
According to the labor force statistics for Darlington, out of the total population over 16 years of age (5,161), 45.8% or 2,364 individuals are in the labor force, with 8.9% or 210 of them unemployed. The age group with the highest labor force participation rate is 20 to 24 years, with 80.7% or 285 individuals in the labor force. Within the labor force, the 45 to 54 years age range has the highest percentage of unemployed individuals, with 33.4% or 110 of them being unemployed.
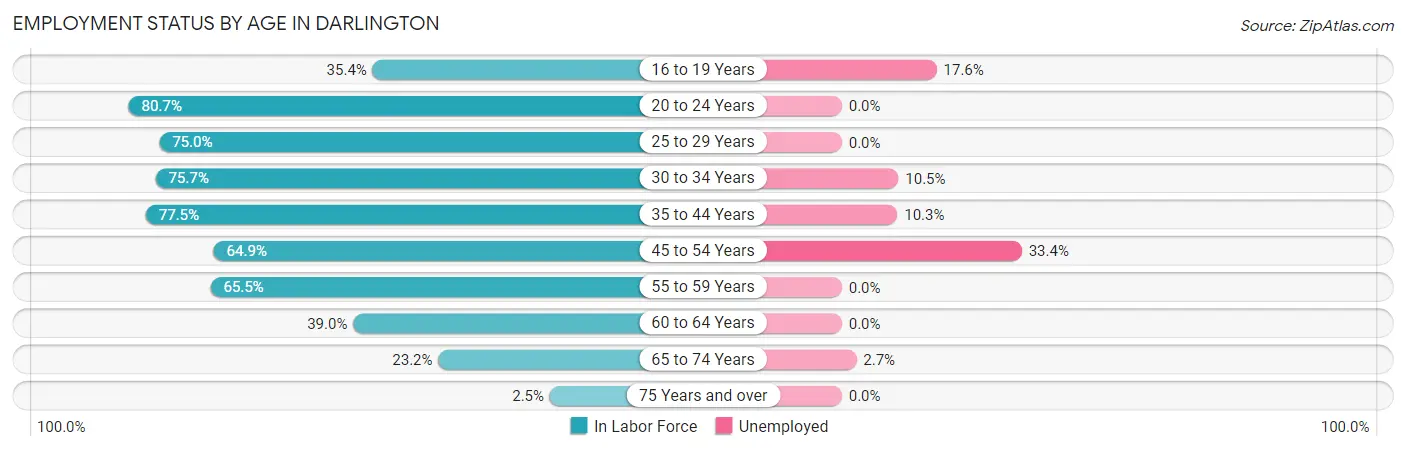
| Age Bracket | In Labor Force | Unemployed |
| 16 to 19 Years | 125 (35.4%) | 22 (17.6%) |
| 20 to 24 Years | 285 (80.7%) | 0 (0.0%) |
| 25 to 29 Years | 195 (75.0%) | 0 (0.0%) |
| 30 to 34 Years | 181 (75.7%) | 19 (10.5%) |
| 35 to 44 Years | 526 (77.5%) | 54 (10.3%) |
| 45 to 54 Years | 329 (64.9%) | 110 (33.4%) |
| 55 to 59 Years | 291 (65.5%) | 0 (0.0%) |
| 60 to 64 Years | 186 (39.0%) | 0 (0.0%) |
| 65 to 74 Years | 222 (23.2%) | 6 (2.7%) |
| 75 Years and over | 22 (2.5%) | 0 (0.0%) |
| Total | 2,364 (45.8%) | 210 (8.9%) |
Employment Status by Educational Attainment in Darlington
According to labor force statistics for Darlington, 65.5% of individuals (1,707) out of the total population between 25 and 64 years of age (2,606) are in the labor force, with 10.7% or 183 of them being unemployed. The group with the highest labor force participation rate are those with the educational attainment of college / associate degree, with 80.3% or 565 individuals in the labor force. Within the labor force, individuals with high school diploma education have the highest percentage of unemployment, with 16.4% or 101 of them being unemployed.
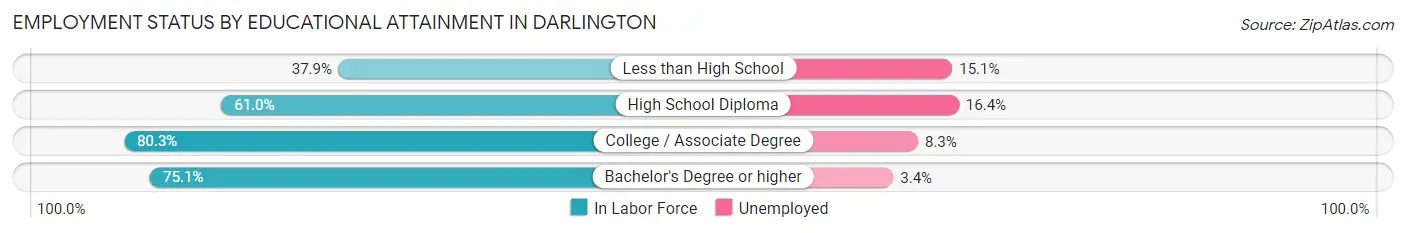
| Educational Attainment | In Labor Force | Unemployed |
| Less than High School | 146 (37.9%) | 58 (15.1%) |
| High School Diploma | 616 (61.0%) | 166 (16.4%) |
| College / Associate Degree | 565 (80.3%) | 58 (8.3%) |
| Bachelor's Degree or higher | 381 (75.1%) | 17 (3.4%) |
| Total | 1,707 (65.5%) | 279 (10.7%) |
Employment Occupations by Sex in Darlington
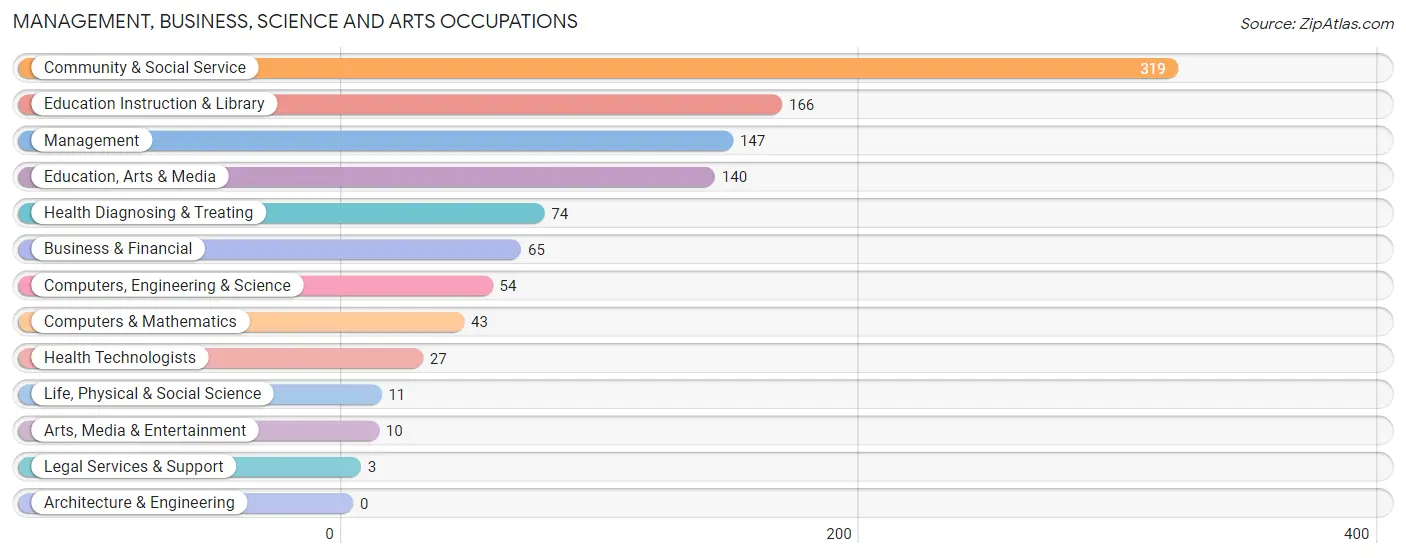
Management, Business, Science and Arts Occupations
The most common Management, Business, Science and Arts occupations in Darlington are Community & Social Service (319 | 14.8%), Education Instruction & Library (166 | 7.7%), Management (147 | 6.8%), Education, Arts & Media (140 | 6.5%), and Health Diagnosing & Treating (74 | 3.4%).
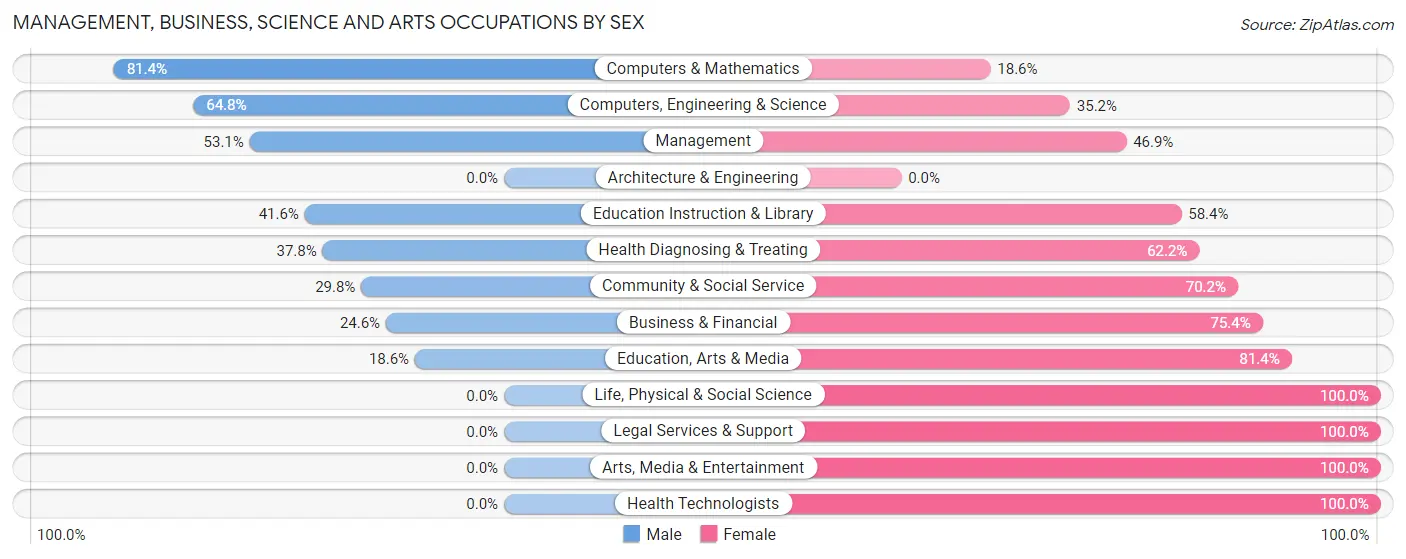
Management, Business, Science and Arts Occupations by Sex
Within the Management, Business, Science and Arts occupations in Darlington, the most male-oriented occupations are Computers & Mathematics (81.4%), Computers, Engineering & Science (64.8%), and Management (53.1%), while the most female-oriented occupations are Life, Physical & Social Science (100.0%), Legal Services & Support (100.0%), and Arts, Media & Entertainment (100.0%).
| Occupation | Male | Female |
| Management | 78 (53.1%) | 69 (46.9%) |
| Business & Financial | 16 (24.6%) | 49 (75.4%) |
| Computers, Engineering & Science | 35 (64.8%) | 19 (35.2%) |
| Computers & Mathematics | 35 (81.4%) | 8 (18.6%) |
| Architecture & Engineering | 0 (0.0%) | 0 (0.0%) |
| Life, Physical & Social Science | 0 (0.0%) | 11 (100.0%) |
| Community & Social Service | 95 (29.8%) | 224 (70.2%) |
| Education, Arts & Media | 26 (18.6%) | 114 (81.4%) |
| Legal Services & Support | 0 (0.0%) | 3 (100.0%) |
| Education Instruction & Library | 69 (41.6%) | 97 (58.4%) |
| Arts, Media & Entertainment | 0 (0.0%) | 10 (100.0%) |
| Health Diagnosing & Treating | 28 (37.8%) | 46 (62.2%) |
| Health Technologists | 0 (0.0%) | 27 (100.0%) |
| Total (Category) | 252 (38.2%) | 407 (61.8%) |
| Total (Overall) | 895 (41.6%) | 1,256 (58.4%) |
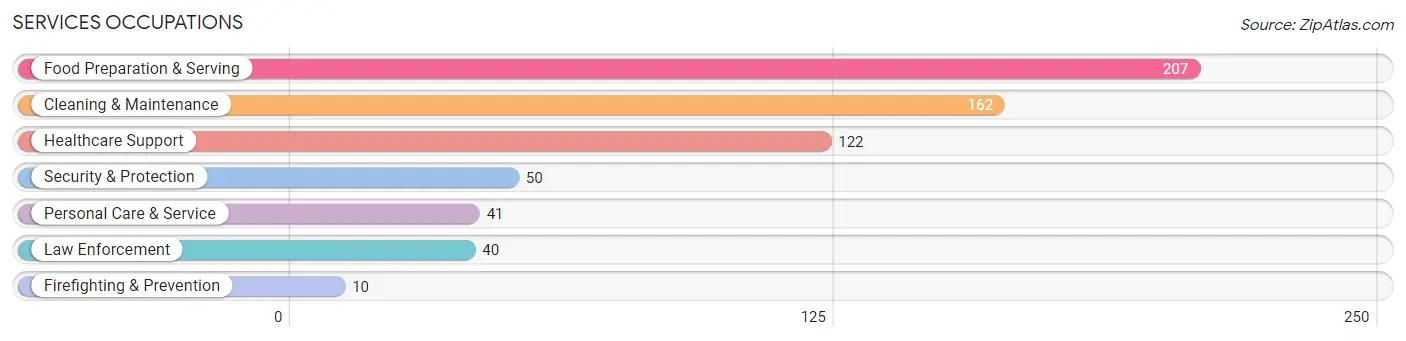
Services Occupations
The most common Services occupations in Darlington are Food Preparation & Serving (207 | 9.6%), Cleaning & Maintenance (162 | 7.5%), Healthcare Support (122 | 5.7%), Security & Protection (50 | 2.3%), and Personal Care & Service (41 | 1.9%).
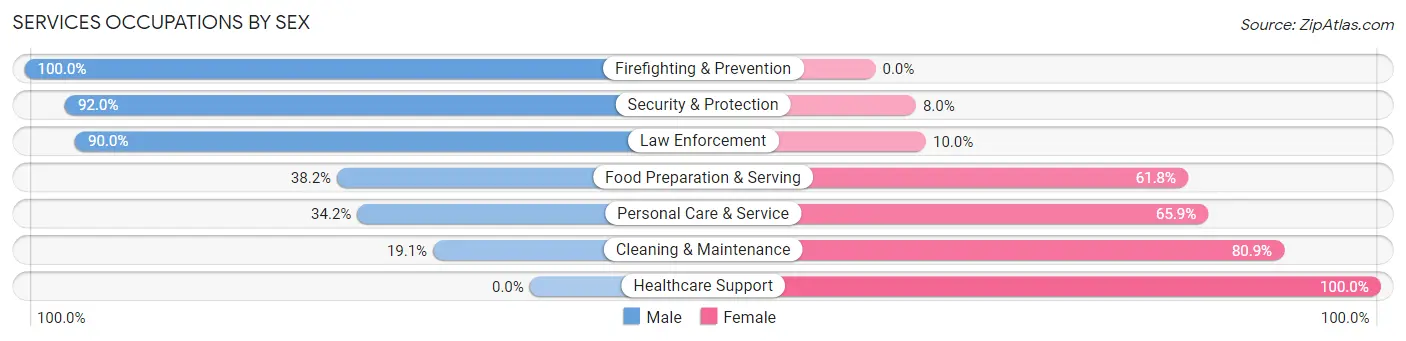
Services Occupations by Sex
Within the Services occupations in Darlington, the most male-oriented occupations are Firefighting & Prevention (100.0%), Security & Protection (92.0%), and Law Enforcement (90.0%), while the most female-oriented occupations are Healthcare Support (100.0%), Cleaning & Maintenance (80.9%), and Personal Care & Service (65.8%).
| Occupation | Male | Female |
| Healthcare Support | 0 (0.0%) | 122 (100.0%) |
| Security & Protection | 46 (92.0%) | 4 (8.0%) |
| Firefighting & Prevention | 10 (100.0%) | 0 (0.0%) |
| Law Enforcement | 36 (90.0%) | 4 (10.0%) |
| Food Preparation & Serving | 79 (38.2%) | 128 (61.8%) |
| Cleaning & Maintenance | 31 (19.1%) | 131 (80.9%) |
| Personal Care & Service | 14 (34.2%) | 27 (65.8%) |
| Total (Category) | 170 (29.2%) | 412 (70.8%) |
| Total (Overall) | 895 (41.6%) | 1,256 (58.4%) |
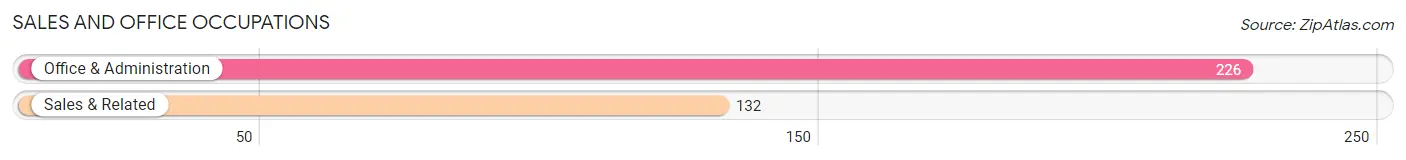
Sales and Office Occupations
The most common Sales and Office occupations in Darlington are Office & Administration (226 | 10.5%), and Sales & Related (132 | 6.1%).
Sales and Office Occupations by Sex
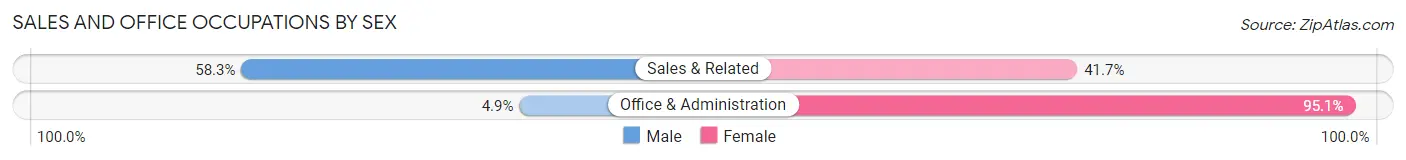
| Occupation | Male | Female |
| Sales & Related | 77 (58.3%) | 55 (41.7%) |
| Office & Administration | 11 (4.9%) | 215 (95.1%) |
| Total (Category) | 88 (24.6%) | 270 (75.4%) |
| Total (Overall) | 895 (41.6%) | 1,256 (58.4%) |
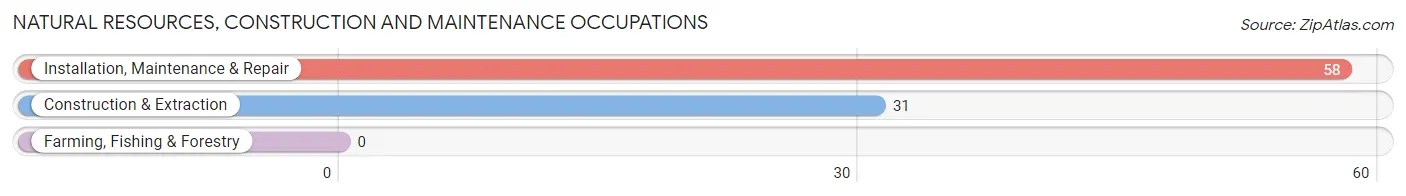
Natural Resources, Construction and Maintenance Occupations
The most common Natural Resources, Construction and Maintenance occupations in Darlington are Installation, Maintenance & Repair (58 | 2.7%), and Construction & Extraction (31 | 1.4%).
Natural Resources, Construction and Maintenance Occupations by Sex
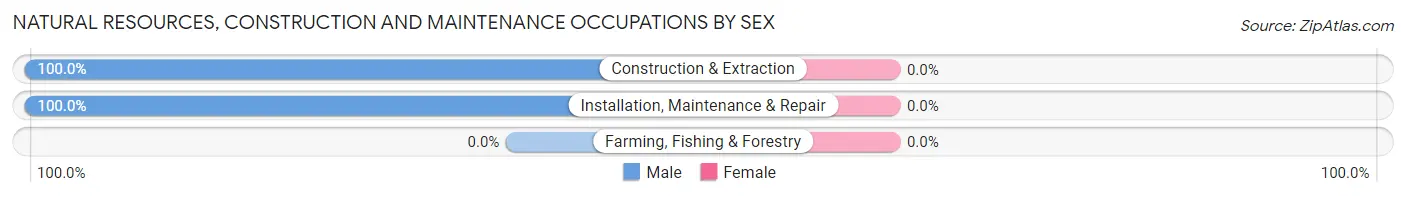
| Occupation | Male | Female |
| Farming, Fishing & Forestry | 0 (0.0%) | 0 (0.0%) |
| Construction & Extraction | 31 (100.0%) | 0 (0.0%) |
| Installation, Maintenance & Repair | 58 (100.0%) | 0 (0.0%) |
| Total (Category) | 89 (100.0%) | 0 (0.0%) |
| Total (Overall) | 895 (41.6%) | 1,256 (58.4%) |
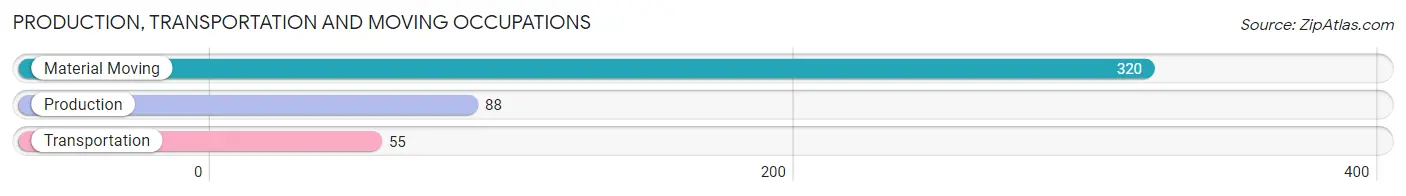
Production, Transportation and Moving Occupations
The most common Production, Transportation and Moving occupations in Darlington are Material Moving (320 | 14.9%), Production (88 | 4.1%), and Transportation (55 | 2.6%).
Production, Transportation and Moving Occupations by Sex
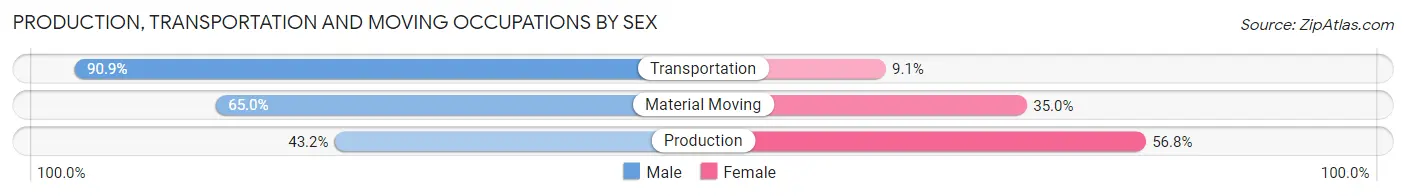
| Occupation | Male | Female |
| Production | 38 (43.2%) | 50 (56.8%) |
| Transportation | 50 (90.9%) | 5 (9.1%) |
| Material Moving | 208 (65.0%) | 112 (35.0%) |
| Total (Category) | 296 (63.9%) | 167 (36.1%) |
| Total (Overall) | 895 (41.6%) | 1,256 (58.4%) |
Employment Industries by Sex in Darlington
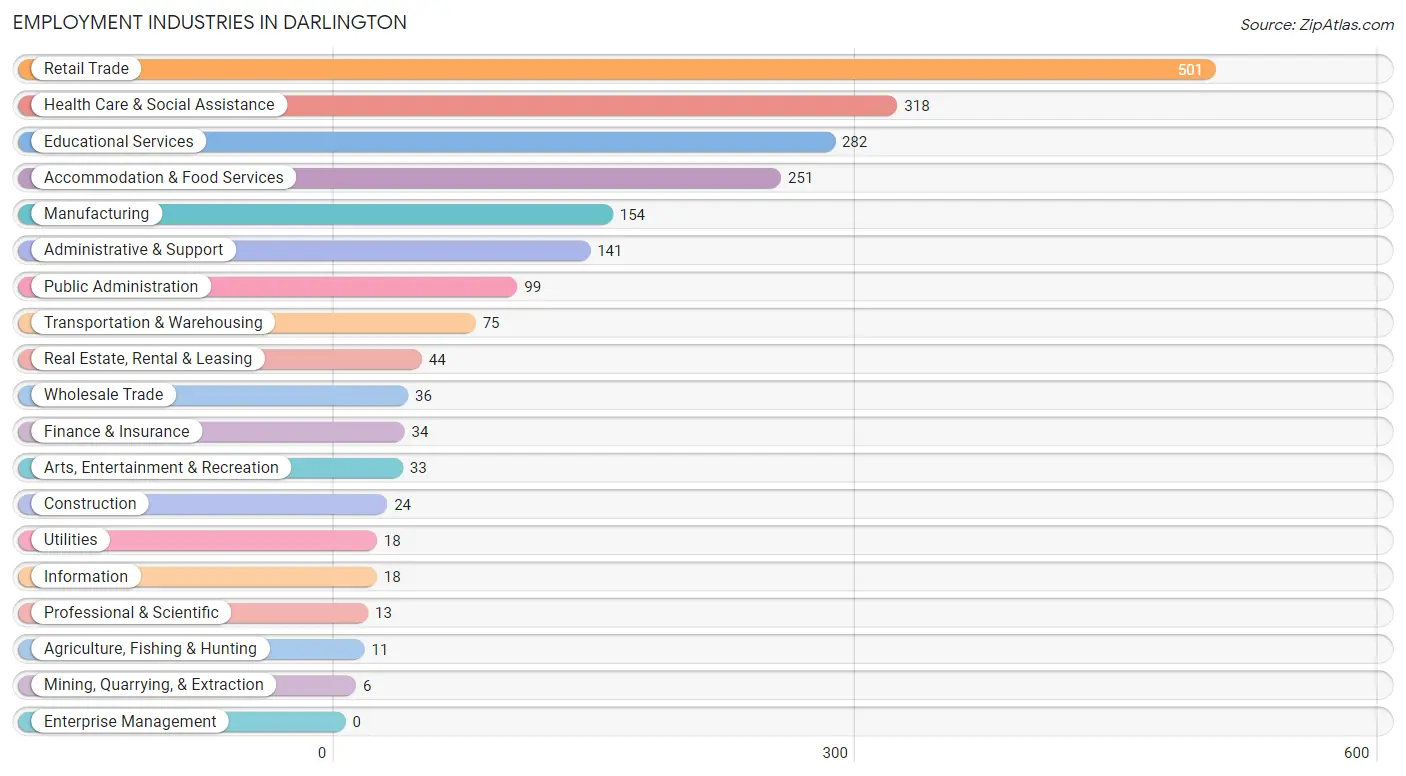
Employment Industries in Darlington
The major employment industries in Darlington include Retail Trade (501 | 23.3%), Health Care & Social Assistance (318 | 14.8%), Educational Services (282 | 13.1%), Accommodation & Food Services (251 | 11.7%), and Manufacturing (154 | 7.2%).
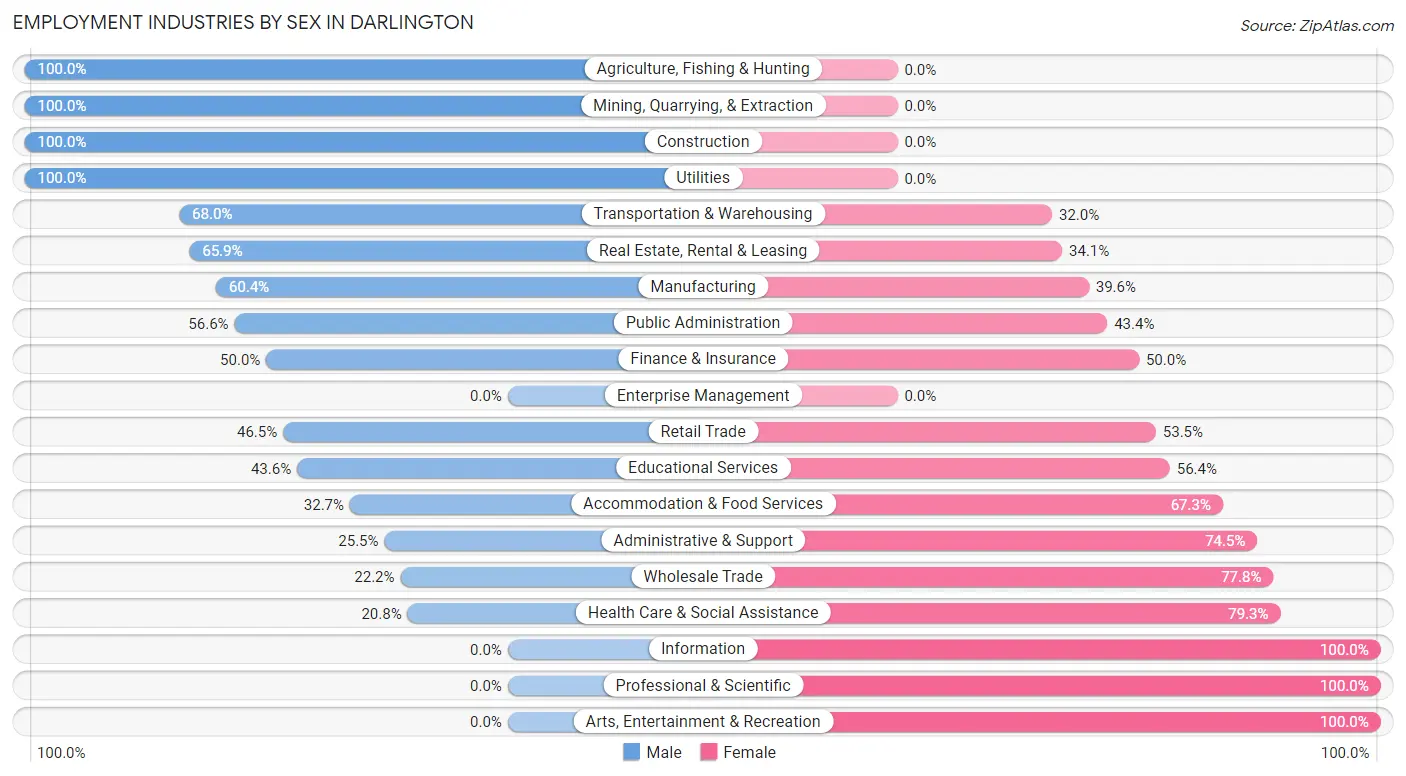
Employment Industries by Sex in Darlington
The Darlington industries that see more men than women are Agriculture, Fishing & Hunting (100.0%), Mining, Quarrying, & Extraction (100.0%), and Construction (100.0%), whereas the industries that tend to have a higher number of women are Information (100.0%), Professional & Scientific (100.0%), and Arts, Entertainment & Recreation (100.0%).
| Industry | Male | Female |
| Agriculture, Fishing & Hunting | 11 (100.0%) | 0 (0.0%) |
| Mining, Quarrying, & Extraction | 6 (100.0%) | 0 (0.0%) |
| Construction | 24 (100.0%) | 0 (0.0%) |
| Manufacturing | 93 (60.4%) | 61 (39.6%) |
| Wholesale Trade | 8 (22.2%) | 28 (77.8%) |
| Retail Trade | 233 (46.5%) | 268 (53.5%) |
| Transportation & Warehousing | 51 (68.0%) | 24 (32.0%) |
| Utilities | 18 (100.0%) | 0 (0.0%) |
| Information | 0 (0.0%) | 18 (100.0%) |
| Finance & Insurance | 17 (50.0%) | 17 (50.0%) |
| Real Estate, Rental & Leasing | 29 (65.9%) | 15 (34.1%) |
| Professional & Scientific | 0 (0.0%) | 13 (100.0%) |
| Enterprise Management | 0 (0.0%) | 0 (0.0%) |
| Administrative & Support | 36 (25.5%) | 105 (74.5%) |
| Educational Services | 123 (43.6%) | 159 (56.4%) |
| Health Care & Social Assistance | 66 (20.7%) | 252 (79.2%) |
| Arts, Entertainment & Recreation | 0 (0.0%) | 33 (100.0%) |
| Accommodation & Food Services | 82 (32.7%) | 169 (67.3%) |
| Public Administration | 56 (56.6%) | 43 (43.4%) |
| Total | 895 (41.6%) | 1,256 (58.4%) |
Education in Darlington
School Enrollment in Darlington
The most common levels of schooling among the 1,215 students in Darlington are high school (370 | 30.4%), middle school (320 | 26.3%), and elementary school (216 | 17.8%).
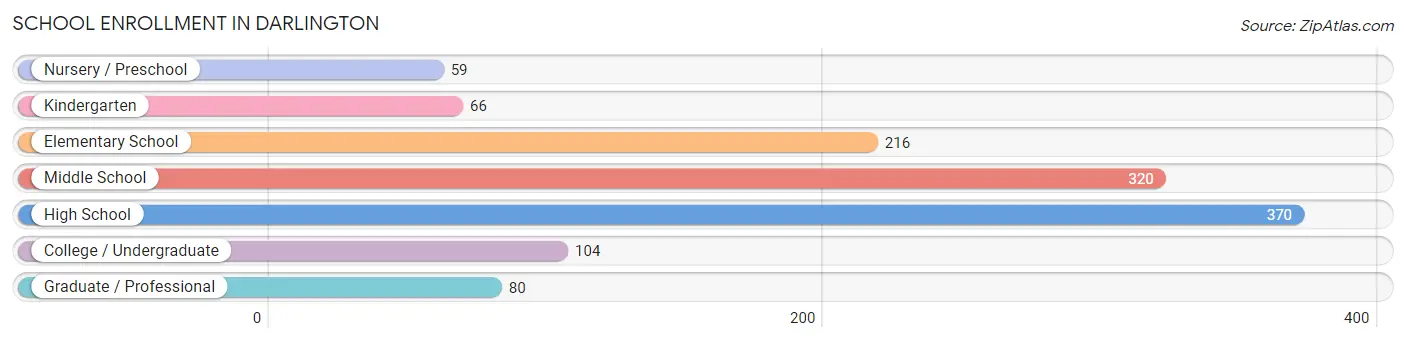
| School Level | # Students | % Students |
| Nursery / Preschool | 59 | 4.9% |
| Kindergarten | 66 | 5.4% |
| Elementary School | 216 | 17.8% |
| Middle School | 320 | 26.3% |
| High School | 370 | 30.4% |
| College / Undergraduate | 104 | 8.6% |
| Graduate / Professional | 80 | 6.6% |
| Total | 1,215 | 100.0% |
School Enrollment by Age by Funding Source in Darlington
Out of a total of 1,215 students who are enrolled in schools in Darlington, 170 (14.0%) attend a private institution, while the remaining 1,045 (86.0%) are enrolled in public schools. The age group of 18 to 19 year olds has the highest likelihood of being enrolled in private schools, with 20 (50.0% in the age bracket) enrolled. Conversely, the age group of 3 to 4 year olds has the lowest likelihood of being enrolled in a private school, with 59 (100.0% in the age bracket) attending a public institution.
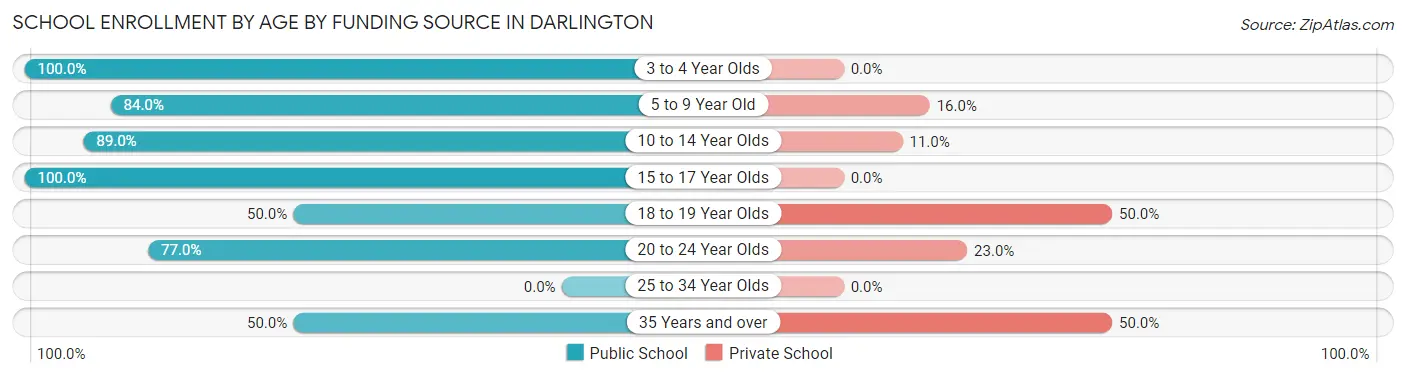
| Age Bracket | Public School | Private School |
| 3 to 4 Year Olds | 59 (100.0%) | 0 (0.0%) |
| 5 to 9 Year Old | 220 (84.0%) | 42 (16.0%) |
| 10 to 14 Year Olds | 325 (89.0%) | 40 (11.0%) |
| 15 to 17 Year Olds | 299 (100.0%) | 0 (0.0%) |
| 18 to 19 Year Olds | 20 (50.0%) | 20 (50.0%) |
| 20 to 24 Year Olds | 77 (77.0%) | 23 (23.0%) |
| 25 to 34 Year Olds | 0 (0.0%) | 0 (0.0%) |
| 35 Years and over | 45 (50.0%) | 45 (50.0%) |
| Total | 1,045 (86.0%) | 170 (14.0%) |
Educational Attainment by Field of Study in Darlington
Education (156 | 18.9%), business (133 | 16.1%), psychology (102 | 12.3%), science & technology (81 | 9.8%), and visual & performing arts (74 | 8.9%) are the most common fields of study among 827 individuals in Darlington who have obtained a bachelor's degree or higher.
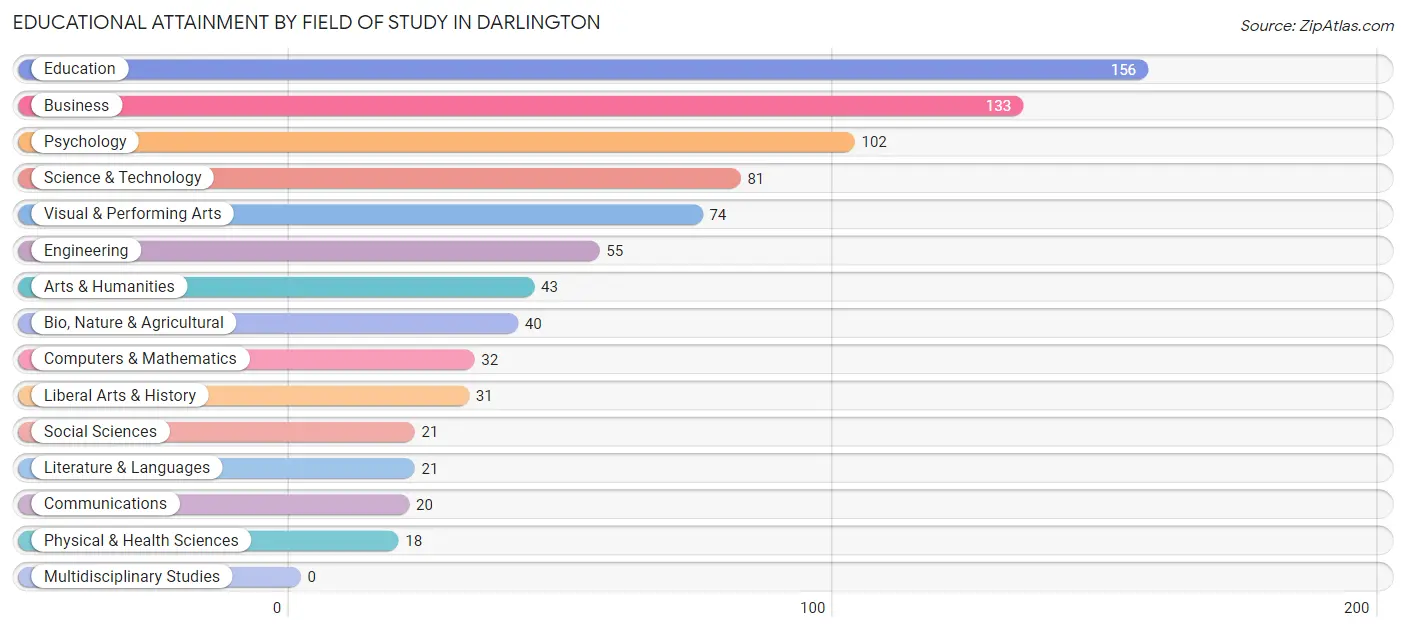
| Field of Study | # Graduates | % Graduates |
| Computers & Mathematics | 32 | 3.9% |
| Bio, Nature & Agricultural | 40 | 4.8% |
| Physical & Health Sciences | 18 | 2.2% |
| Psychology | 102 | 12.3% |
| Social Sciences | 21 | 2.5% |
| Engineering | 55 | 6.7% |
| Multidisciplinary Studies | 0 | 0.0% |
| Science & Technology | 81 | 9.8% |
| Business | 133 | 16.1% |
| Education | 156 | 18.9% |
| Literature & Languages | 21 | 2.5% |
| Liberal Arts & History | 31 | 3.7% |
| Visual & Performing Arts | 74 | 8.9% |
| Communications | 20 | 2.4% |
| Arts & Humanities | 43 | 5.2% |
| Total | 827 | 100.0% |
Transportation & Commute in Darlington
Vehicle Availability by Sex in Darlington
The most prevalent vehicle ownership categories in Darlington are males with 1 vehicle (301, accounting for 36.8%) and females with 1 vehicle (296, making up 24.2%).
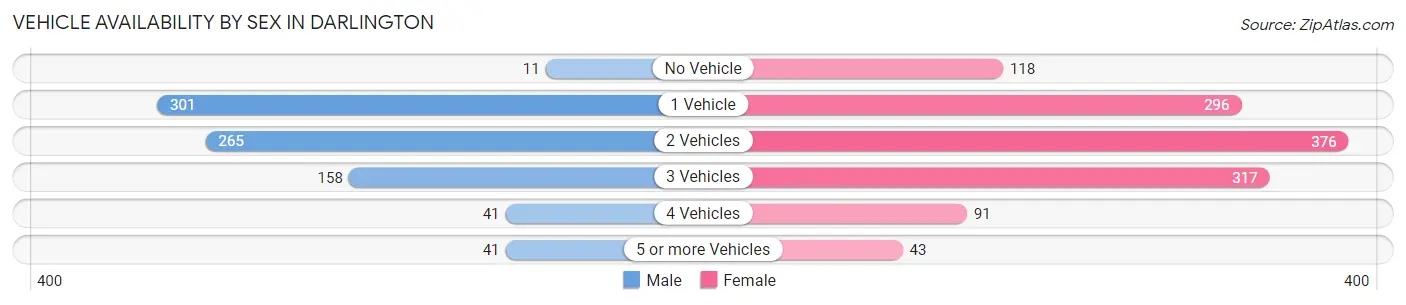
| Vehicles Available | Male | Female |
| No Vehicle | 11 (1.3%) | 118 (9.5%) |
| 1 Vehicle | 301 (36.8%) | 296 (23.8%) |
| 2 Vehicles | 265 (32.4%) | 376 (30.3%) |
| 3 Vehicles | 158 (19.3%) | 317 (25.5%) |
| 4 Vehicles | 41 (5.0%) | 91 (7.3%) |
| 5 or more Vehicles | 41 (5.0%) | 43 (3.5%) |
| Total | 817 (100.0%) | 1,241 (100.0%) |
Commute Time in Darlington
The most frequently occuring commute durations in Darlington are 30 to 34 minutes (381 commuters, 18.7%), 10 to 14 minutes (335 commuters, 16.4%), and 15 to 19 minutes (315 commuters, 15.4%).
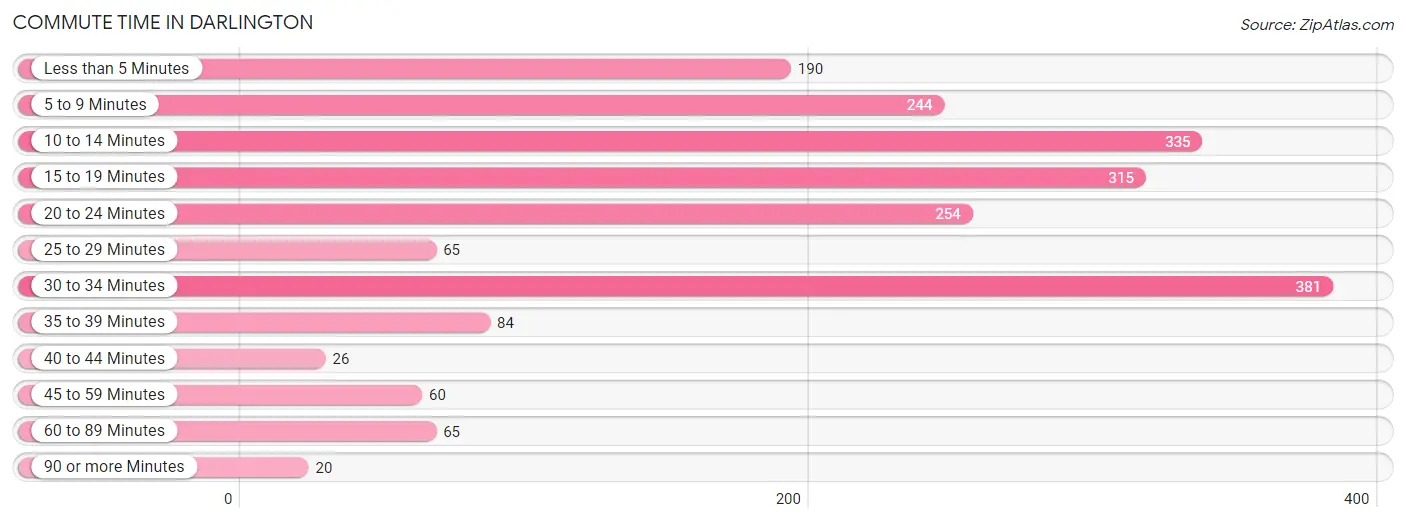
| Commute Time | # Commuters | % Commuters |
| Less than 5 Minutes | 190 | 9.3% |
| 5 to 9 Minutes | 244 | 12.0% |
| 10 to 14 Minutes | 335 | 16.4% |
| 15 to 19 Minutes | 315 | 15.4% |
| 20 to 24 Minutes | 254 | 12.5% |
| 25 to 29 Minutes | 65 | 3.2% |
| 30 to 34 Minutes | 381 | 18.7% |
| 35 to 39 Minutes | 84 | 4.1% |
| 40 to 44 Minutes | 26 | 1.3% |
| 45 to 59 Minutes | 60 | 2.9% |
| 60 to 89 Minutes | 65 | 3.2% |
| 90 or more Minutes | 20 | 1.0% |
Commute Time by Sex in Darlington
The most common commute times in Darlington are 30 to 34 minutes (170 commuters, 20.6%) for males and 10 to 14 minutes (253 commuters, 20.8%) for females.
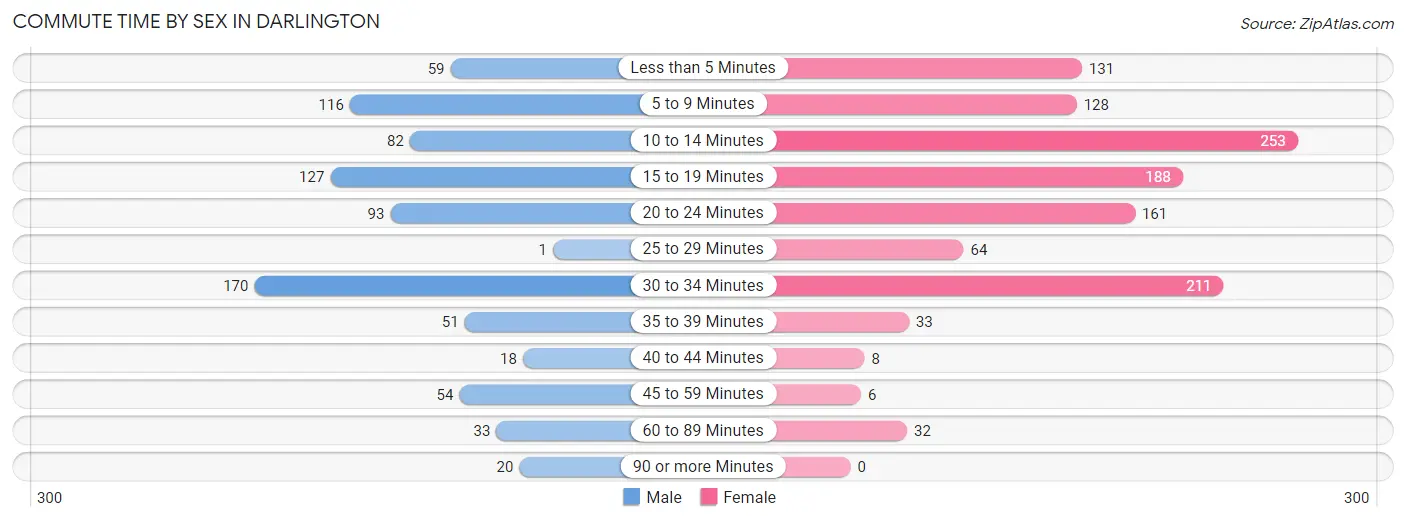
| Commute Time | Male | Female |
| Less than 5 Minutes | 59 (7.2%) | 131 (10.8%) |
| 5 to 9 Minutes | 116 (14.1%) | 128 (10.5%) |
| 10 to 14 Minutes | 82 (10.0%) | 253 (20.8%) |
| 15 to 19 Minutes | 127 (15.4%) | 188 (15.5%) |
| 20 to 24 Minutes | 93 (11.3%) | 161 (13.3%) |
| 25 to 29 Minutes | 1 (0.1%) | 64 (5.3%) |
| 30 to 34 Minutes | 170 (20.6%) | 211 (17.4%) |
| 35 to 39 Minutes | 51 (6.2%) | 33 (2.7%) |
| 40 to 44 Minutes | 18 (2.2%) | 8 (0.7%) |
| 45 to 59 Minutes | 54 (6.6%) | 6 (0.5%) |
| 60 to 89 Minutes | 33 (4.0%) | 32 (2.6%) |
| 90 or more Minutes | 20 (2.4%) | 0 (0.0%) |
Time of Departure to Work by Sex in Darlington
The most frequent times of departure to work in Darlington are 7:30 AM to 7:59 AM (164, 19.9%) for males and 7:30 AM to 7:59 AM (312, 25.7%) for females.
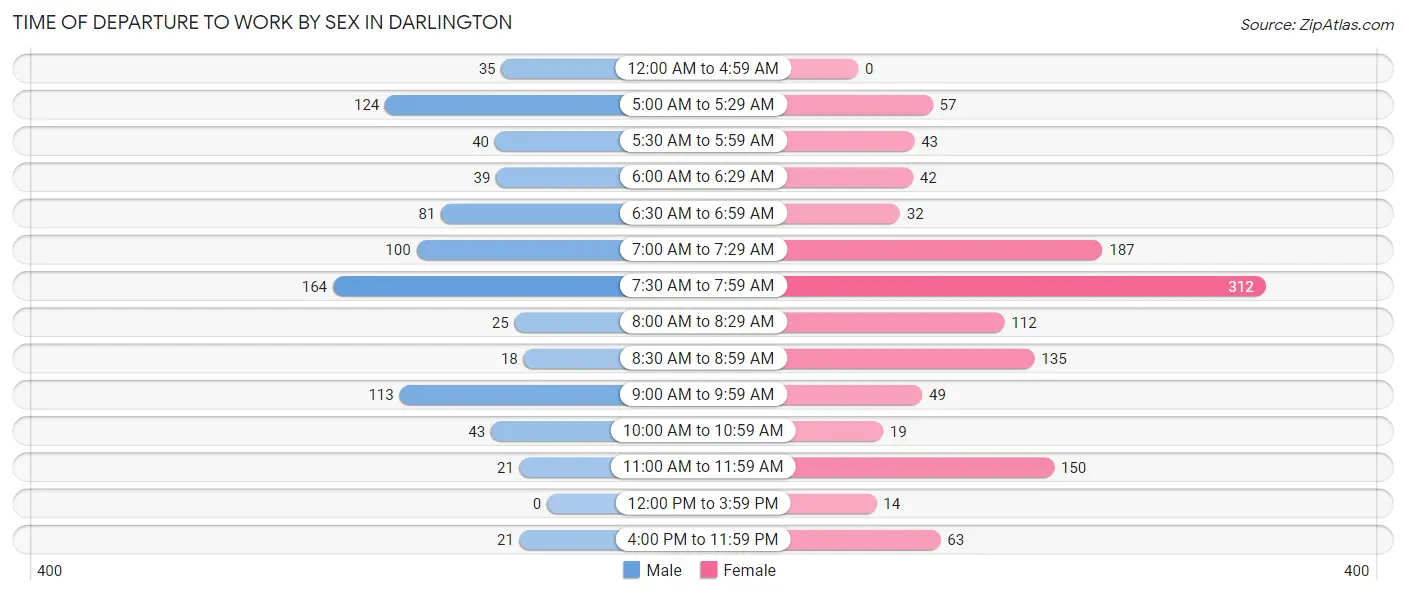
| Time of Departure | Male | Female |
| 12:00 AM to 4:59 AM | 35 (4.3%) | 0 (0.0%) |
| 5:00 AM to 5:29 AM | 124 (15.0%) | 57 (4.7%) |
| 5:30 AM to 5:59 AM | 40 (4.9%) | 43 (3.5%) |
| 6:00 AM to 6:29 AM | 39 (4.7%) | 42 (3.5%) |
| 6:30 AM to 6:59 AM | 81 (9.8%) | 32 (2.6%) |
| 7:00 AM to 7:29 AM | 100 (12.1%) | 187 (15.4%) |
| 7:30 AM to 7:59 AM | 164 (19.9%) | 312 (25.7%) |
| 8:00 AM to 8:29 AM | 25 (3.0%) | 112 (9.2%) |
| 8:30 AM to 8:59 AM | 18 (2.2%) | 135 (11.1%) |
| 9:00 AM to 9:59 AM | 113 (13.7%) | 49 (4.0%) |
| 10:00 AM to 10:59 AM | 43 (5.2%) | 19 (1.6%) |
| 11:00 AM to 11:59 AM | 21 (2.5%) | 150 (12.3%) |
| 12:00 PM to 3:59 PM | 0 (0.0%) | 14 (1.1%) |
| 4:00 PM to 11:59 PM | 21 (2.5%) | 63 (5.2%) |
| Total | 824 (100.0%) | 1,215 (100.0%) |
Housing Occupancy in Darlington
Occupancy by Ownership in Darlington
Of the total 2,563 dwellings in Darlington, owner-occupied units account for 1,244 (48.5%), while renter-occupied units make up 1,319 (51.5%).
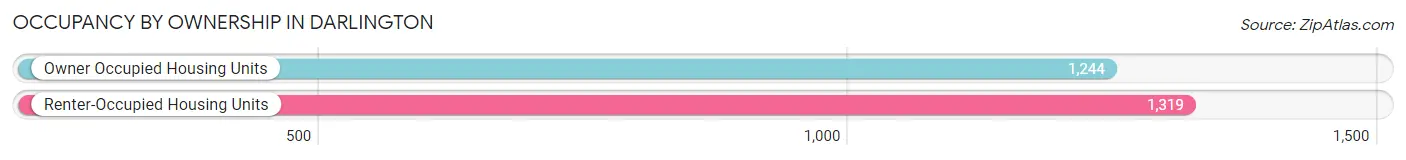
| Occupancy | # Housing Units | % Housing Units |
| Owner Occupied Housing Units | 1,244 | 48.5% |
| Renter-Occupied Housing Units | 1,319 | 51.5% |
| Total Occupied Housing Units | 2,563 | 100.0% |
Occupancy by Household Size in Darlington
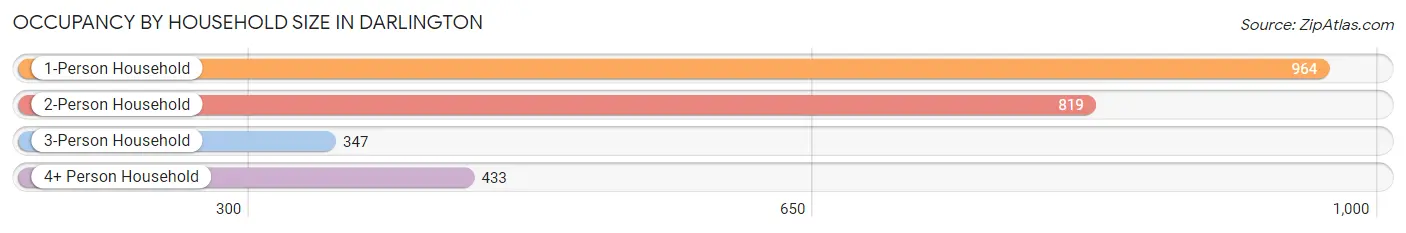
| Household Size | # Housing Units | % Housing Units |
| 1-Person Household | 964 | 37.6% |
| 2-Person Household | 819 | 32.0% |
| 3-Person Household | 347 | 13.5% |
| 4+ Person Household | 433 | 16.9% |
| Total Housing Units | 2,563 | 100.0% |
Occupancy by Ownership by Household Size in Darlington
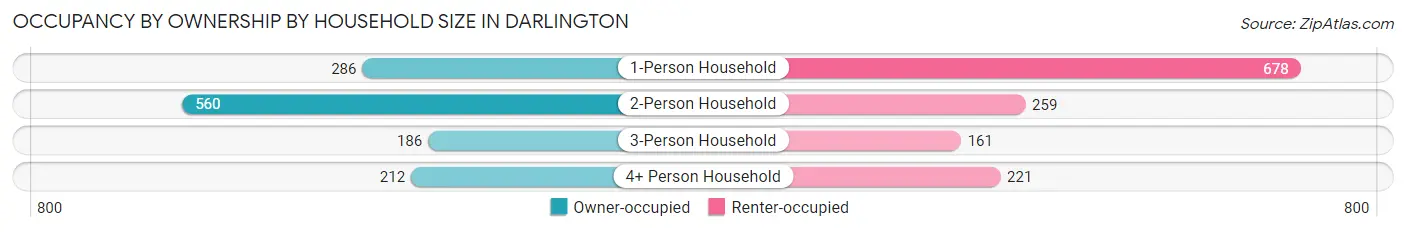
| Household Size | Owner-occupied | Renter-occupied |
| 1-Person Household | 286 (29.7%) | 678 (70.3%) |
| 2-Person Household | 560 (68.4%) | 259 (31.6%) |
| 3-Person Household | 186 (53.6%) | 161 (46.4%) |
| 4+ Person Household | 212 (49.0%) | 221 (51.0%) |
| Total Housing Units | 1,244 (48.5%) | 1,319 (51.5%) |
Occupancy by Educational Attainment in Darlington
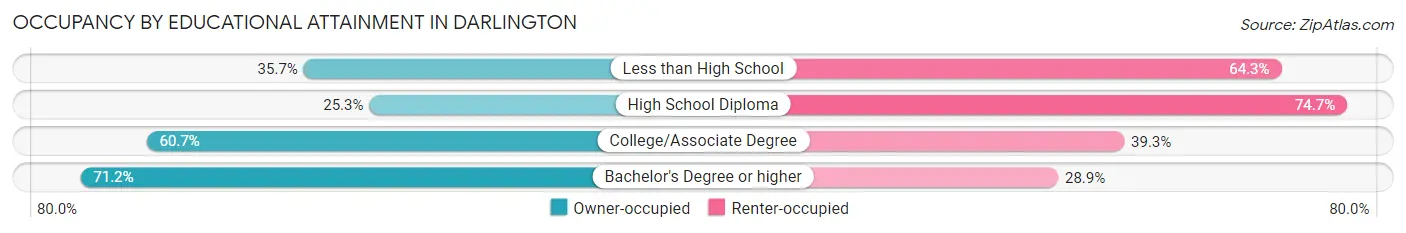
| Household Size | Owner-occupied | Renter-occupied |
| Less than High School | 178 (35.7%) | 320 (64.3%) |
| High School Diploma | 173 (25.3%) | 510 (74.7%) |
| College/Associate Degree | 523 (60.7%) | 339 (39.3%) |
| Bachelor's Degree or higher | 370 (71.2%) | 150 (28.8%) |
Occupancy by Age of Householder in Darlington
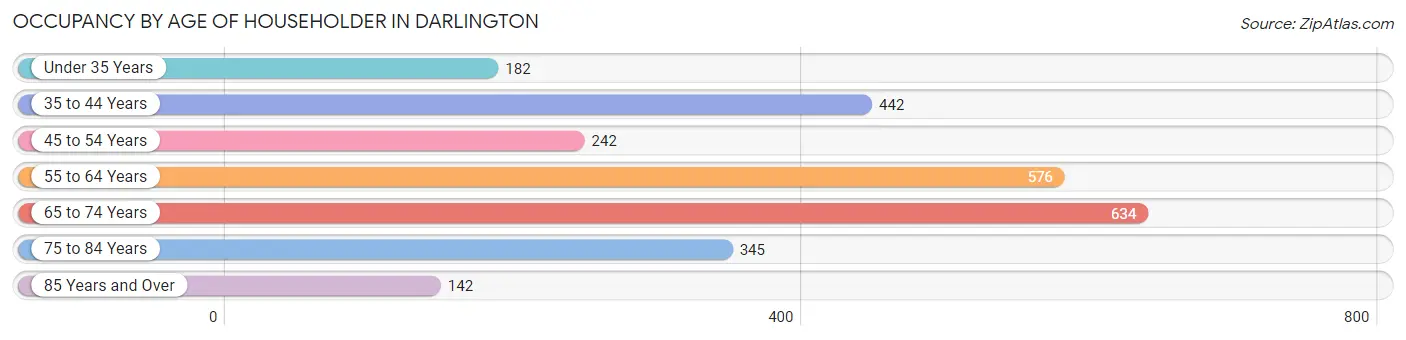
| Age Bracket | # Households | % Households |
| Under 35 Years | 182 | 7.1% |
| 35 to 44 Years | 442 | 17.2% |
| 45 to 54 Years | 242 | 9.4% |
| 55 to 64 Years | 576 | 22.5% |
| 65 to 74 Years | 634 | 24.7% |
| 75 to 84 Years | 345 | 13.5% |
| 85 Years and Over | 142 | 5.5% |
| Total | 2,563 | 100.0% |
Housing Finances in Darlington
Median Income by Occupancy in Darlington
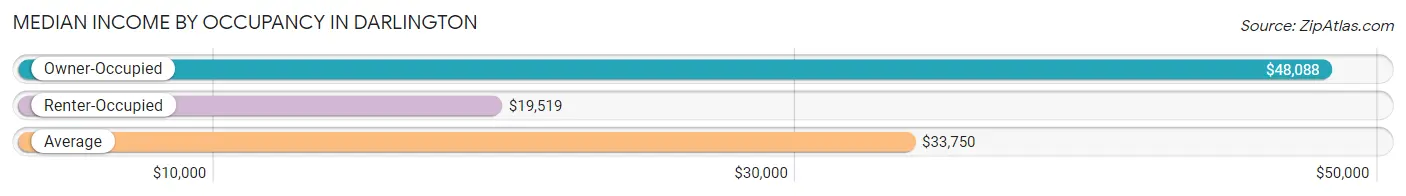
| Occupancy Type | # Households | Median Income |
| Owner-Occupied | 1,244 (48.5%) | $48,088 |
| Renter-Occupied | 1,319 (51.5%) | $19,519 |
| Average | 2,563 (100.0%) | $33,750 |
Occupancy by Householder Income Bracket in Darlington

| Income Bracket | Owner-occupied | Renter-occupied |
| Less than $5,000 | 19 (1.5%) | 168 (12.7%) |
| $5,000 to $9,999 | 0 (0.0%) | 75 (5.7%) |
| $10,000 to $14,999 | 40 (3.2%) | 259 (19.6%) |
| $15,000 to $19,999 | 62 (5.0%) | 170 (12.9%) |
| $20,000 to $24,999 | 24 (1.9%) | 97 (7.3%) |
| $25,000 to $34,999 | 135 (10.8%) | 264 (20.0%) |
| $35,000 to $49,999 | 355 (28.5%) | 67 (5.1%) |
| $50,000 to $74,999 | 156 (12.5%) | 89 (6.8%) |
| $75,000 to $99,999 | 121 (9.7%) | 115 (8.7%) |
| $100,000 to $149,999 | 148 (11.9%) | 15 (1.1%) |
| $150,000 or more | 184 (14.8%) | 0 (0.0%) |
| Total | 1,244 (100.0%) | 1,319 (100.0%) |
Monthly Housing Cost Tiers in Darlington
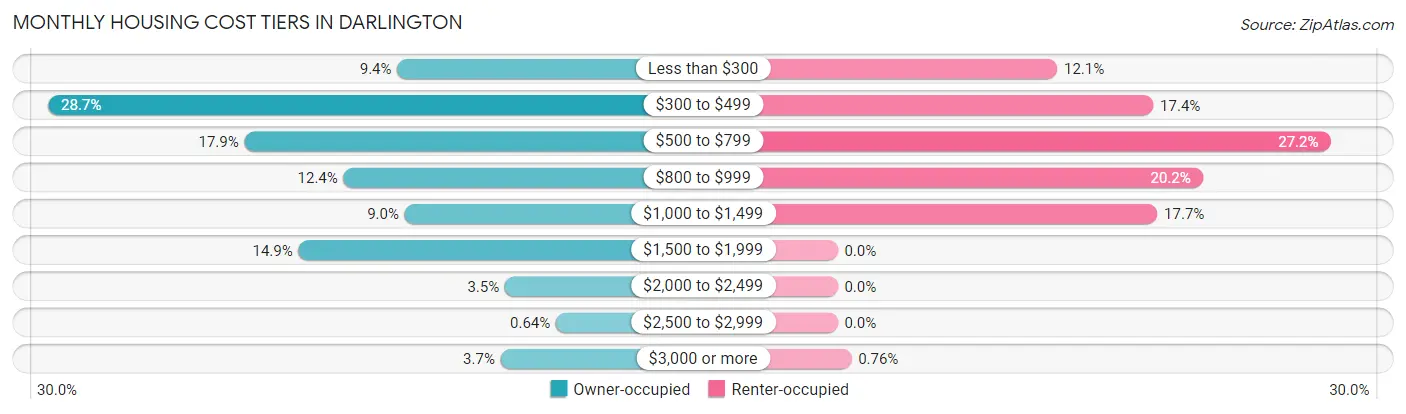
| Monthly Cost | Owner-occupied | Renter-occupied |
| Less than $300 | 117 (9.4%) | 160 (12.1%) |
| $300 to $499 | 357 (28.7%) | 230 (17.4%) |
| $500 to $799 | 222 (17.8%) | 359 (27.2%) |
| $800 to $999 | 154 (12.4%) | 266 (20.2%) |
| $1,000 to $1,499 | 112 (9.0%) | 233 (17.7%) |
| $1,500 to $1,999 | 185 (14.9%) | 0 (0.0%) |
| $2,000 to $2,499 | 43 (3.5%) | 0 (0.0%) |
| $2,500 to $2,999 | 8 (0.6%) | 0 (0.0%) |
| $3,000 or more | 46 (3.7%) | 10 (0.8%) |
| Total | 1,244 (100.0%) | 1,319 (100.0%) |
Physical Housing Characteristics in Darlington
Housing Structures in Darlington
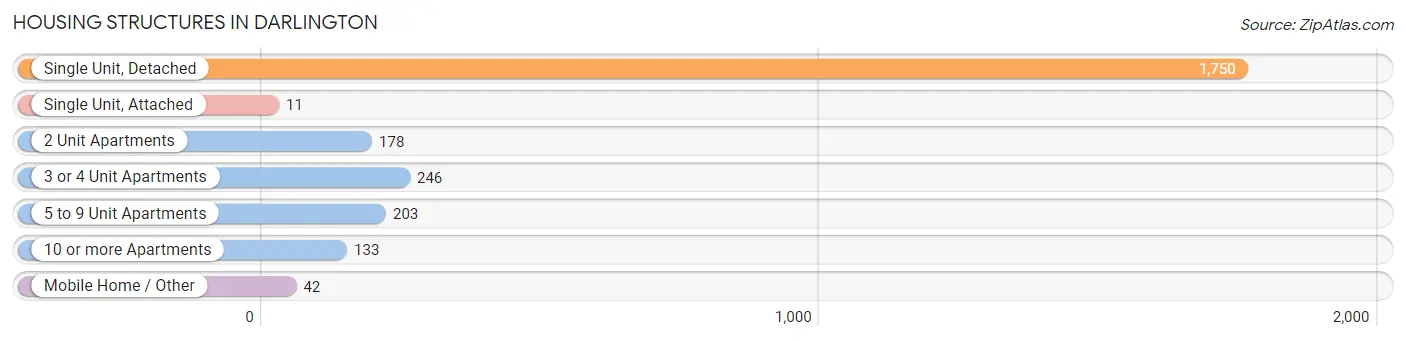
| Structure Type | # Housing Units | % Housing Units |
| Single Unit, Detached | 1,750 | 68.3% |
| Single Unit, Attached | 11 | 0.4% |
| 2 Unit Apartments | 178 | 6.9% |
| 3 or 4 Unit Apartments | 246 | 9.6% |
| 5 to 9 Unit Apartments | 203 | 7.9% |
| 10 or more Apartments | 133 | 5.2% |
| Mobile Home / Other | 42 | 1.6% |
| Total | 2,563 | 100.0% |
Housing Structures by Occupancy in Darlington
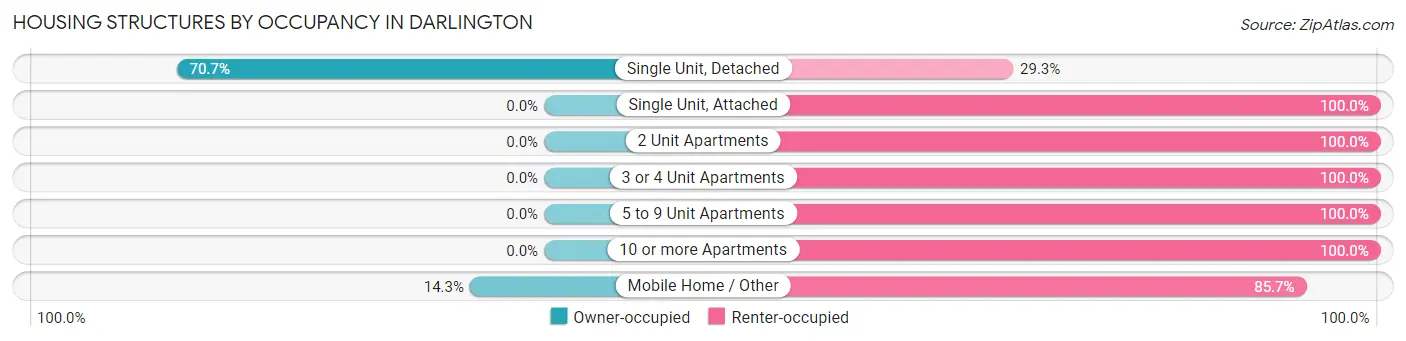
| Structure Type | Owner-occupied | Renter-occupied |
| Single Unit, Detached | 1,238 (70.7%) | 512 (29.3%) |
| Single Unit, Attached | 0 (0.0%) | 11 (100.0%) |
| 2 Unit Apartments | 0 (0.0%) | 178 (100.0%) |
| 3 or 4 Unit Apartments | 0 (0.0%) | 246 (100.0%) |
| 5 to 9 Unit Apartments | 0 (0.0%) | 203 (100.0%) |
| 10 or more Apartments | 0 (0.0%) | 133 (100.0%) |
| Mobile Home / Other | 6 (14.3%) | 36 (85.7%) |
| Total | 1,244 (48.5%) | 1,319 (51.5%) |
Housing Structures by Number of Rooms in Darlington
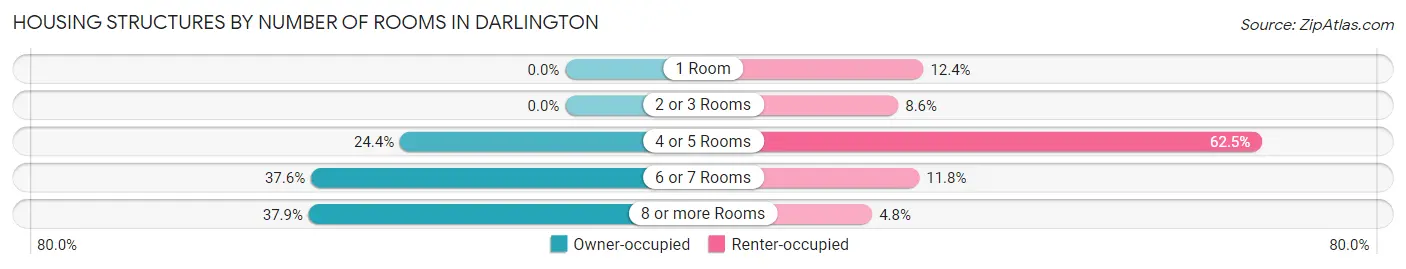
| Number of Rooms | Owner-occupied | Renter-occupied |
| 1 Room | 0 (0.0%) | 163 (12.4%) |
| 2 or 3 Rooms | 0 (0.0%) | 114 (8.6%) |
| 4 or 5 Rooms | 304 (24.4%) | 824 (62.5%) |
| 6 or 7 Rooms | 468 (37.6%) | 155 (11.7%) |
| 8 or more Rooms | 472 (37.9%) | 63 (4.8%) |
| Total | 1,244 (100.0%) | 1,319 (100.0%) |
Housing Structure by Heating Type in Darlington
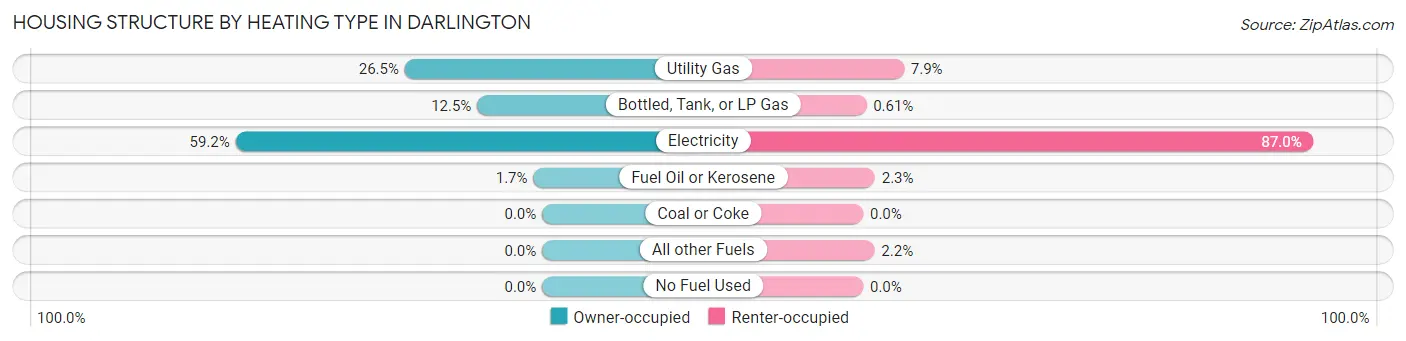
| Heating Type | Owner-occupied | Renter-occupied |
| Utility Gas | 330 (26.5%) | 104 (7.9%) |
| Bottled, Tank, or LP Gas | 156 (12.5%) | 8 (0.6%) |
| Electricity | 737 (59.2%) | 1,148 (87.0%) |
| Fuel Oil or Kerosene | 21 (1.7%) | 30 (2.3%) |
| Coal or Coke | 0 (0.0%) | 0 (0.0%) |
| All other Fuels | 0 (0.0%) | 29 (2.2%) |
| No Fuel Used | 0 (0.0%) | 0 (0.0%) |
| Total | 1,244 (100.0%) | 1,319 (100.0%) |
Household Vehicle Usage in Darlington
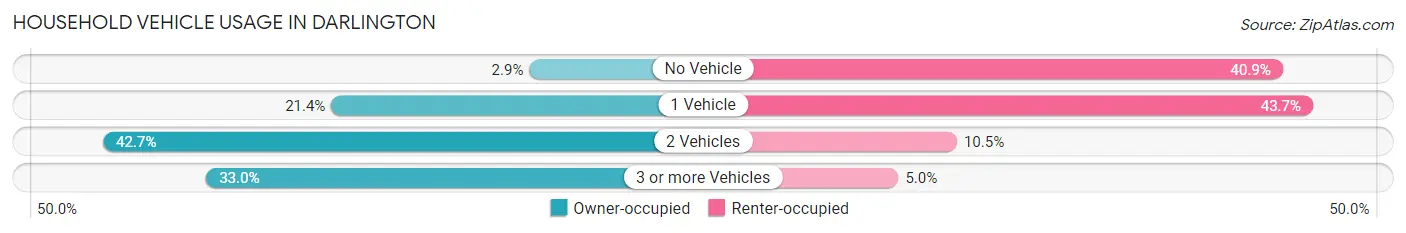
| Vehicles per Household | Owner-occupied | Renter-occupied |
| No Vehicle | 36 (2.9%) | 539 (40.9%) |
| 1 Vehicle | 266 (21.4%) | 576 (43.7%) |
| 2 Vehicles | 531 (42.7%) | 138 (10.5%) |
| 3 or more Vehicles | 411 (33.0%) | 66 (5.0%) |
| Total | 1,244 (100.0%) | 1,319 (100.0%) |
Real Estate & Mortgages in Darlington
Real Estate and Mortgage Overview in Darlington
| Characteristic | Without Mortgage | With Mortgage |
| Housing Units | 682 | 562 |
| Median Property Value | $131,600 | $204,200 |
| Median Household Income | $42,230 | $118 |
| Monthly Housing Costs | $408 | $46 |
| Real Estate Taxes | $479 | $16 |
Property Value by Mortgage Status in Darlington
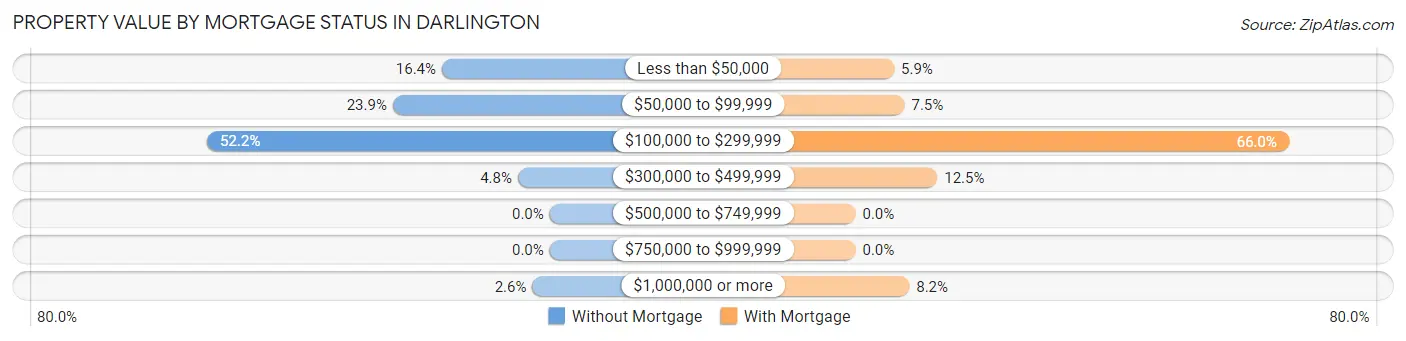
| Property Value | Without Mortgage | With Mortgage |
| Less than $50,000 | 112 (16.4%) | 33 (5.9%) |
| $50,000 to $99,999 | 163 (23.9%) | 42 (7.5%) |
| $100,000 to $299,999 | 356 (52.2%) | 371 (66.0%) |
| $300,000 to $499,999 | 33 (4.8%) | 70 (12.5%) |
| $500,000 to $749,999 | 0 (0.0%) | 0 (0.0%) |
| $750,000 to $999,999 | 0 (0.0%) | 0 (0.0%) |
| $1,000,000 or more | 18 (2.6%) | 46 (8.2%) |
| Total | 682 (100.0%) | 562 (100.0%) |
Household Income by Mortgage Status in Darlington
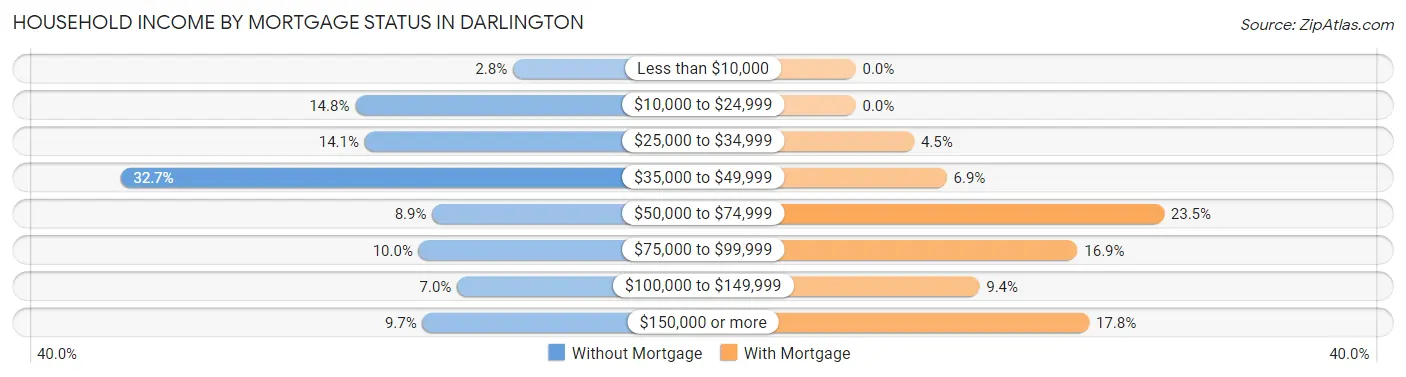
| Household Income | Without Mortgage | With Mortgage |
| Less than $10,000 | 19 (2.8%) | 0 (0.0%) |
| $10,000 to $24,999 | 101 (14.8%) | 0 (0.0%) |
| $25,000 to $34,999 | 96 (14.1%) | 25 (4.4%) |
| $35,000 to $49,999 | 223 (32.7%) | 39 (6.9%) |
| $50,000 to $74,999 | 61 (8.9%) | 132 (23.5%) |
| $75,000 to $99,999 | 68 (10.0%) | 95 (16.9%) |
| $100,000 to $149,999 | 48 (7.0%) | 53 (9.4%) |
| $150,000 or more | 66 (9.7%) | 100 (17.8%) |
| Total | 682 (100.0%) | 562 (100.0%) |
Property Value to Household Income Ratio in Darlington
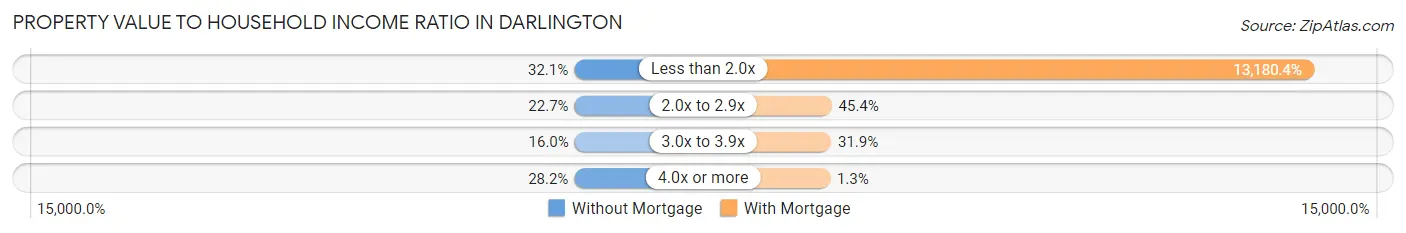
| Value-to-Income Ratio | Without Mortgage | With Mortgage |
| Less than 2.0x | 219 (32.1%) | 74,074 (13,180.4%) |
| 2.0x to 2.9x | 155 (22.7%) | 255 (45.4%) |
| 3.0x to 3.9x | 109 (16.0%) | 179 (31.9%) |
| 4.0x or more | 192 (28.1%) | 7 (1.3%) |
| Total | 682 (100.0%) | 562 (100.0%) |
Real Estate Taxes by Mortgage Status in Darlington
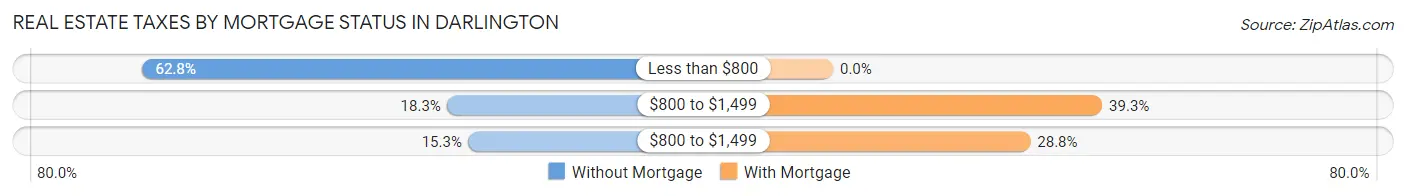
| Property Taxes | Without Mortgage | With Mortgage |
| Less than $800 | 428 (62.8%) | 0 (0.0%) |
| $800 to $1,499 | 125 (18.3%) | 221 (39.3%) |
| $800 to $1,499 | 104 (15.2%) | 162 (28.8%) |
| Total | 682 (100.0%) | 562 (100.0%) |
Health & Disability in Darlington
Health Insurance Coverage by Age in Darlington
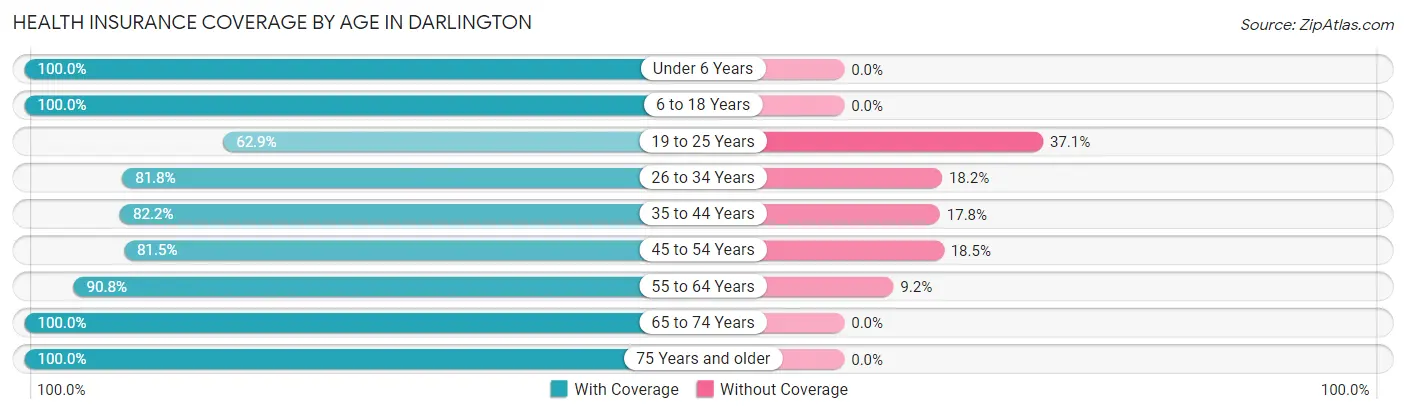
| Age Bracket | With Coverage | Without Coverage |
| Under 6 Years | 279 (100.0%) | 0 (0.0%) |
| 6 to 18 Years | 1,008 (100.0%) | 0 (0.0%) |
| 19 to 25 Years | 287 (62.9%) | 169 (37.1%) |
| 26 to 34 Years | 377 (81.8%) | 84 (18.2%) |
| 35 to 44 Years | 558 (82.2%) | 121 (17.8%) |
| 45 to 54 Years | 413 (81.5%) | 94 (18.5%) |
| 55 to 64 Years | 823 (90.8%) | 83 (9.2%) |
| 65 to 74 Years | 917 (100.0%) | 0 (0.0%) |
| 75 Years and older | 739 (100.0%) | 0 (0.0%) |
| Total | 5,401 (90.7%) | 551 (9.3%) |
Health Insurance Coverage by Citizenship Status in Darlington
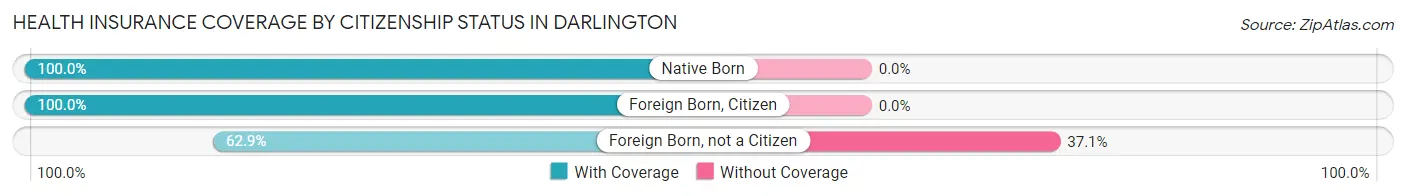
| Citizenship Status | With Coverage | Without Coverage |
| Native Born | 279 (100.0%) | 0 (0.0%) |
| Foreign Born, Citizen | 1,008 (100.0%) | 0 (0.0%) |
| Foreign Born, not a Citizen | 287 (62.9%) | 169 (37.1%) |
Health Insurance Coverage by Household Income in Darlington
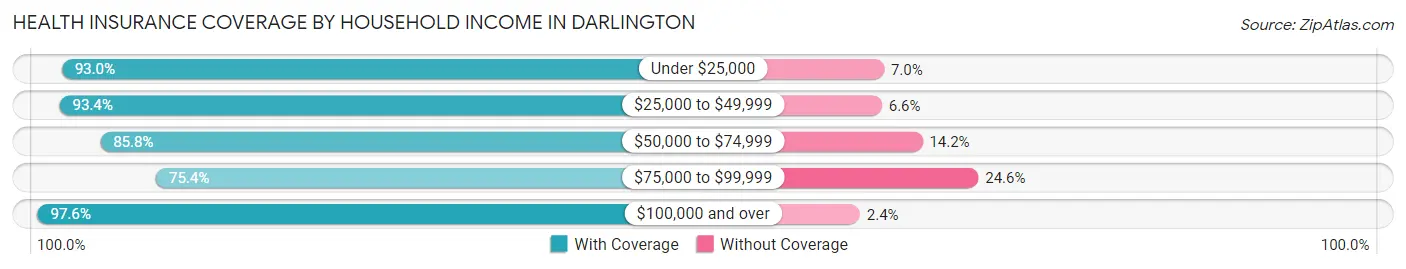
| Household Income | With Coverage | Without Coverage |
| Under $25,000 | 1,416 (93.0%) | 106 (7.0%) |
| $25,000 to $49,999 | 1,795 (93.4%) | 126 (6.6%) |
| $50,000 to $74,999 | 551 (85.8%) | 91 (14.2%) |
| $75,000 to $99,999 | 621 (75.4%) | 203 (24.6%) |
| $100,000 and over | 1,000 (97.6%) | 25 (2.4%) |
Public vs Private Health Insurance Coverage by Age in Darlington
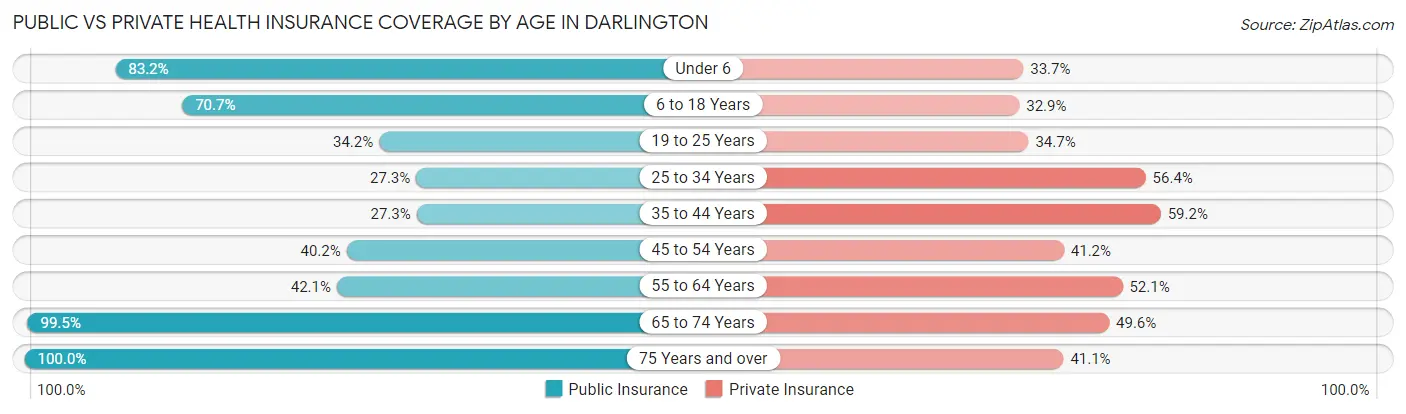
| Age Bracket | Public Insurance | Private Insurance |
| Under 6 | 232 (83.2%) | 94 (33.7%) |
| 6 to 18 Years | 713 (70.7%) | 332 (32.9%) |
| 19 to 25 Years | 156 (34.2%) | 158 (34.6%) |
| 25 to 34 Years | 126 (27.3%) | 260 (56.4%) |
| 35 to 44 Years | 185 (27.3%) | 402 (59.2%) |
| 45 to 54 Years | 204 (40.2%) | 209 (41.2%) |
| 55 to 64 Years | 381 (42.0%) | 472 (52.1%) |
| 65 to 74 Years | 912 (99.5%) | 455 (49.6%) |
| 75 Years and over | 739 (100.0%) | 304 (41.1%) |
| Total | 3,648 (61.3%) | 2,686 (45.1%) |
Disability Status by Sex by Age in Darlington
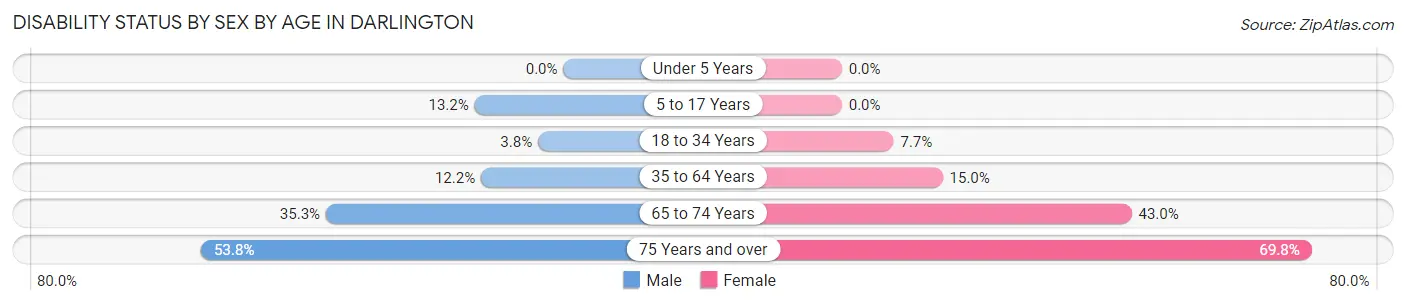
| Age Bracket | Male | Female |
| Under 5 Years | 0 (0.0%) | 0 (0.0%) |
| 5 to 17 Years | 57 (13.2%) | 0 (0.0%) |
| 18 to 34 Years | 14 (3.8%) | 45 (7.7%) |
| 35 to 64 Years | 90 (12.2%) | 203 (15.0%) |
| 65 to 74 Years | 134 (35.3%) | 231 (43.0%) |
| 75 Years and over | 177 (53.8%) | 286 (69.8%) |
Disability Class by Sex by Age in Darlington
Disability Class: Hearing Difficulty
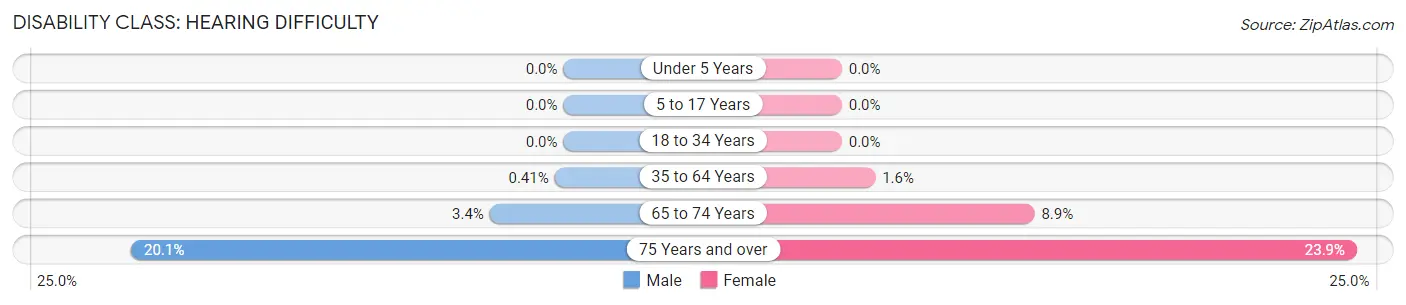
| Age Bracket | Male | Female |
| Under 5 Years | 0 (0.0%) | 0 (0.0%) |
| 5 to 17 Years | 0 (0.0%) | 0 (0.0%) |
| 18 to 34 Years | 0 (0.0%) | 0 (0.0%) |
| 35 to 64 Years | 3 (0.4%) | 21 (1.5%) |
| 65 to 74 Years | 13 (3.4%) | 48 (8.9%) |
| 75 Years and over | 66 (20.1%) | 98 (23.9%) |
Disability Class: Vision Difficulty
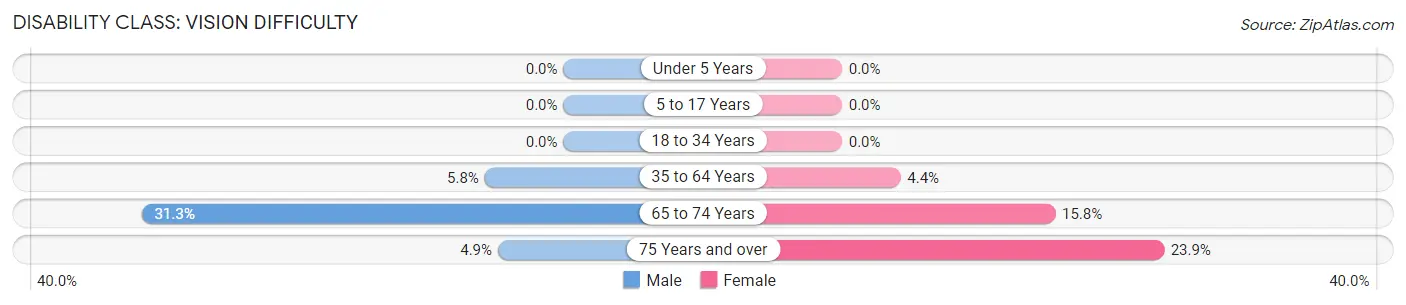
| Age Bracket | Male | Female |
| Under 5 Years | 0 (0.0%) | 0 (0.0%) |
| 5 to 17 Years | 0 (0.0%) | 0 (0.0%) |
| 18 to 34 Years | 0 (0.0%) | 0 (0.0%) |
| 35 to 64 Years | 43 (5.8%) | 59 (4.3%) |
| 65 to 74 Years | 119 (31.3%) | 85 (15.8%) |
| 75 Years and over | 16 (4.9%) | 98 (23.9%) |
Disability Class: Cognitive Difficulty
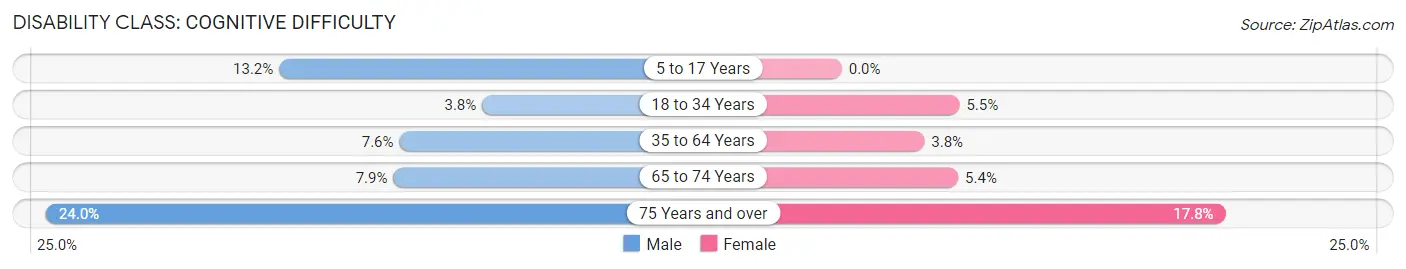
| Age Bracket | Male | Female |
| 5 to 17 Years | 57 (13.2%) | 0 (0.0%) |
| 18 to 34 Years | 14 (3.8%) | 32 (5.5%) |
| 35 to 64 Years | 56 (7.6%) | 52 (3.8%) |
| 65 to 74 Years | 30 (7.9%) | 29 (5.4%) |
| 75 Years and over | 79 (24.0%) | 73 (17.8%) |
Disability Class: Ambulatory Difficulty
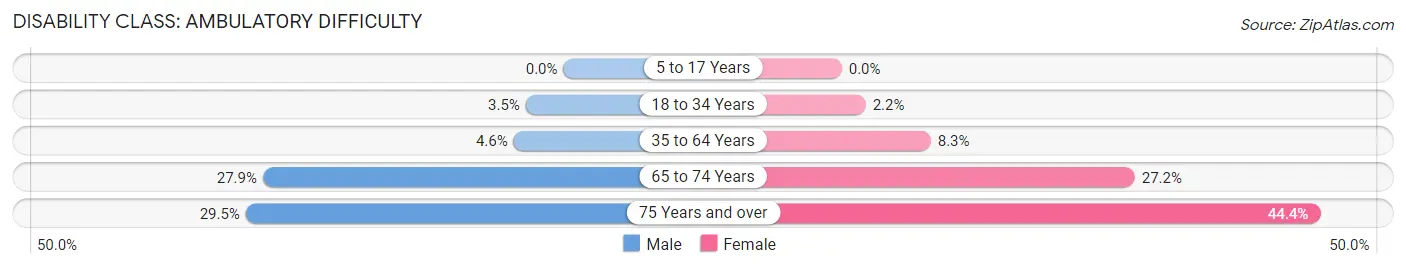
| Age Bracket | Male | Female |
| 5 to 17 Years | 0 (0.0%) | 0 (0.0%) |
| 18 to 34 Years | 13 (3.5%) | 13 (2.2%) |
| 35 to 64 Years | 34 (4.6%) | 112 (8.3%) |
| 65 to 74 Years | 106 (27.9%) | 146 (27.2%) |
| 75 Years and over | 97 (29.5%) | 182 (44.4%) |
Disability Class: Self-Care Difficulty
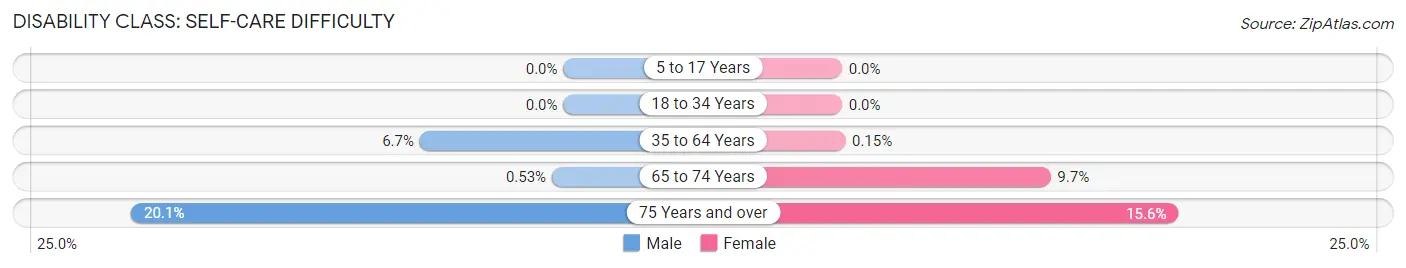
| Age Bracket | Male | Female |
| 5 to 17 Years | 0 (0.0%) | 0 (0.0%) |
| 18 to 34 Years | 0 (0.0%) | 0 (0.0%) |
| 35 to 64 Years | 49 (6.7%) | 2 (0.2%) |
| 65 to 74 Years | 2 (0.5%) | 52 (9.7%) |
| 75 Years and over | 66 (20.1%) | 64 (15.6%) |
Technology Access in Darlington
Computing Device Access in Darlington
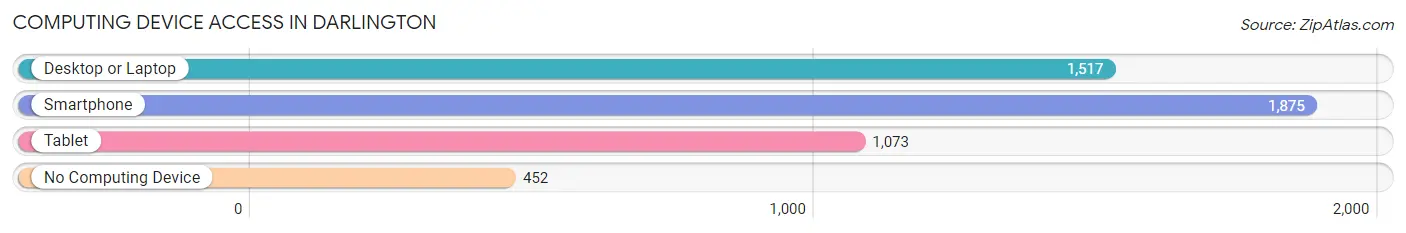
| Device Type | # Households | % Households |
| Desktop or Laptop | 1,517 | 59.2% |
| Smartphone | 1,875 | 73.2% |
| Tablet | 1,073 | 41.9% |
| No Computing Device | 452 | 17.6% |
| Total | 2,563 | 100.0% |
Internet Access in Darlington
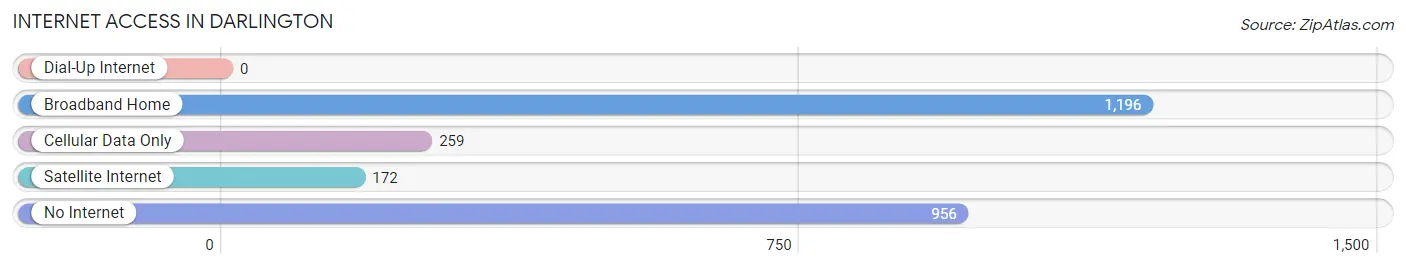
| Internet Type | # Households | % Households |
| Dial-Up Internet | 0 | 0.0% |
| Broadband Home | 1,196 | 46.7% |
| Cellular Data Only | 259 | 10.1% |
| Satellite Internet | 172 | 6.7% |
| No Internet | 956 | 37.3% |
| Total | 2,563 | 100.0% |
Darlington Summary
Darlington, South Carolina is a small city located in the Pee Dee region of the state. It is the county seat of Darlington County and is located about halfway between Florence and Hartsville. The city has a population of 6,720 people, according to the 2010 census.
History
The area that is now Darlington was first settled in the late 1700s by a group of Scotch-Irish immigrants. The town was officially established in 1817 and was named after the Earl of Darlington. The town was incorporated in 1823 and quickly became a center of commerce and industry. The town was home to several cotton mills, a railroad, and a number of other businesses.
In the late 1800s, Darlington was a major stop on the Seaboard Air Line Railroad. The railroad brought many new people to the area and helped to spur economic growth. The town was also home to several cotton mills, which provided jobs for many of the town’s residents.
In the early 1900s, Darlington was a major center of the tobacco industry. The town was home to several tobacco warehouses and factories, which provided jobs for many of the town’s residents.
Geography
Darlington is located in the Pee Dee region of South Carolina. The city is situated on the banks of the Great Pee Dee River, which flows through the city. The city is located about halfway between Florence and Hartsville.
The city has a total area of 8.2 square miles, of which 8.1 square miles is land and 0.1 square miles is water. The city is located in a humid subtropical climate zone, with hot, humid summers and mild winters.
Economy
The economy of Darlington is largely based on agriculture and manufacturing. The city is home to several large farms, which produce a variety of crops, including cotton, soybeans, corn, and tobacco. The city is also home to several manufacturing companies, which produce a variety of products, including textiles, furniture, and automotive parts.
The city is also home to several retail stores, restaurants, and other businesses. The city is home to several banks, which provide financial services to the city’s residents.
Demographics
According to the 2010 census, the population of Darlington was 6,720 people. The population is made up of a diverse mix of races and ethnicities. The largest racial group is African American, making up 57.3% of the population. White people make up 37.2% of the population, while Hispanic or Latino people make up 3.3% of the population.
The median household income in Darlington is $30,945, and the median family income is $37,917. The city has a poverty rate of 24.3%, which is higher than the national average. The city also has a high unemployment rate of 8.2%.
Conclusion
Darlington, South Carolina is a small city located in the Pee Dee region of the state. The city has a population of 6,720 people, according to the 2010 census. The city’s economy is largely based on agriculture and manufacturing, and the city is home to several large farms and manufacturing companies. The city also has a diverse population, with African Americans making up the largest racial group. The city has a median household income of $30,945 and a poverty rate of 24.3%.
Common Questions
What is Per Capita Income in Darlington?
Per Capita income in Darlington is $33,259.
What is the Median Family Income in Darlington?
Median Family Income in Darlington is $44,286.
What is the Median Household income in Darlington?
Median Household Income in Darlington is $33,750.
What is Income or Wage Gap in Darlington?
Income or Wage Gap in Darlington is 55.3%.
Women in Darlington earn 44.7 cents for every dollar earned by a man.
What is Inequality or Gini Index in Darlington?
Inequality or Gini Index in Darlington is 0.67.
What is the Total Population of Darlington?
Total Population of Darlington is 6,172.
What is the Total Male Population of Darlington?
Total Male Population of Darlington is 2,469.
What is the Total Female Population of Darlington?
Total Female Population of Darlington is 3,703.
What is the Ratio of Males per 100 Females in Darlington?
There are 66.68 Males per 100 Females in Darlington.
What is the Ratio of Females per 100 Males in Darlington?
There are 149.98 Females per 100 Males in Darlington.
What is the Median Population Age in Darlington?
Median Population Age in Darlington is 49.8 Years.
What is the Average Family Size in Darlington
Average Family Size in Darlington is 3.1 People.
What is the Average Household Size in Darlington
Average Household Size in Darlington is 2.3 People.
How Large is the Labor Force in Darlington?
There are 2,364 People in the Labor Forcein in Darlington.
What is the Percentage of People in the Labor Force in Darlington?
45.8% of People are in the Labor Force in Darlington.
What is the Unemployment Rate in Darlington?
Unemployment Rate in Darlington is 8.9%.