Contoocook, NH Map & Demographics
Contoocook Map
Contoocook Overview
$72,362
PER CAPITA INCOME
$119,471
AVG FAMILY INCOME
$103,317
AVG HOUSEHOLD INCOME
31.7%
WAGE / INCOME GAP [ % ]
68.3¢/ $1
WAGE / INCOME GAP [ $ ]
0.46
INEQUALITY / GINI INDEX
1,295
TOTAL POPULATION
717
MALE POPULATION
578
FEMALE POPULATION
124.05
MALES / 100 FEMALES
80.61
FEMALES / 100 MALES
43.6
MEDIAN AGE
3.1
AVG FAMILY SIZE
2.4
AVG HOUSEHOLD SIZE
817
LABOR FORCE [ PEOPLE ]
79.6%
PERCENT IN LABOR FORCE
2.2%
UNEMPLOYMENT RATE
Contoocook Zip Codes
Contoocook Area Codes
Income in Contoocook
Income Overview in Contoocook
Per Capita Income in Contoocook is $72,362, while median incomes of families and households are $119,471 and $103,317 respectively.
| Characteristic | Number | Measure |
| Per Capita Income | 1,295 | $72,362 |
| Median Family Income | 319 | $119,471 |
| Mean Family Income | 319 | $150,350 |
| Median Household Income | 539 | $103,317 |
| Mean Household Income | 539 | $174,013 |
| Income Deficit | 319 | $0 |
| Wage / Income Gap (%) | 1,295 | 31.71% |
| Wage / Income Gap ($) | 1,295 | 68.29¢ per $1 |
| Gini / Inequality Index | 1,295 | 0.46 |
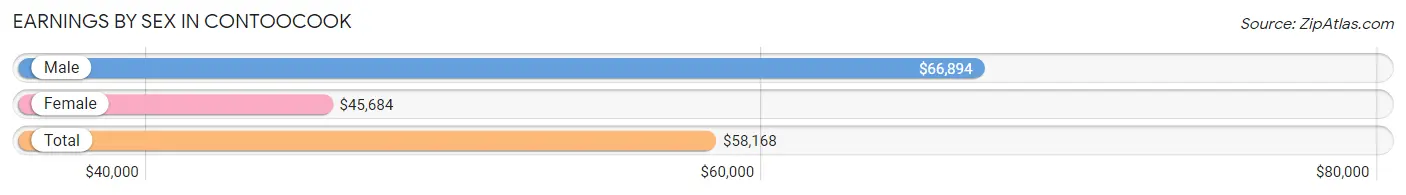
Earnings by Sex in Contoocook
Average Earnings in Contoocook are $58,168, $66,894 for men and $45,684 for women, a difference of 31.7%.
| Sex | Number | Average Earnings |
| Male | 490 (55.1%) | $66,894 |
| Female | 399 (44.9%) | $45,684 |
| Total | 889 (100.0%) | $58,168 |
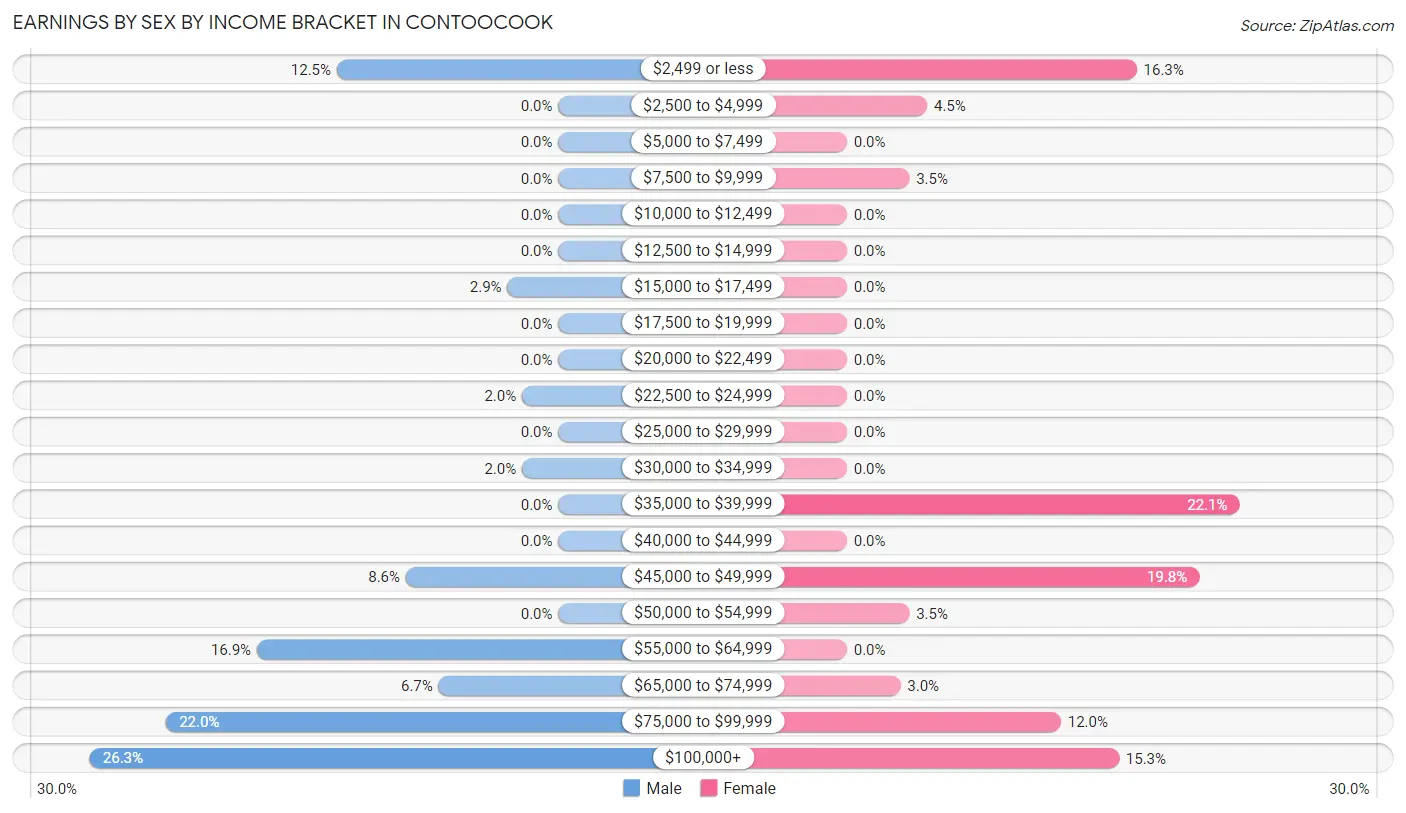
Earnings by Sex by Income Bracket in Contoocook
The most common earnings brackets in Contoocook are $100,000+ for men (129 | 26.3%) and $35,000 to $39,999 for women (88 | 22.1%).
| Income | Male | Female |
| $2,499 or less | 61 (12.4%) | 65 (16.3%) |
| $2,500 to $4,999 | 0 (0.0%) | 18 (4.5%) |
| $5,000 to $7,499 | 0 (0.0%) | 0 (0.0%) |
| $7,500 to $9,999 | 0 (0.0%) | 14 (3.5%) |
| $10,000 to $12,499 | 0 (0.0%) | 0 (0.0%) |
| $12,500 to $14,999 | 0 (0.0%) | 0 (0.0%) |
| $15,000 to $17,499 | 14 (2.9%) | 0 (0.0%) |
| $17,500 to $19,999 | 0 (0.0%) | 0 (0.0%) |
| $20,000 to $22,499 | 0 (0.0%) | 0 (0.0%) |
| $22,500 to $24,999 | 10 (2.0%) | 0 (0.0%) |
| $25,000 to $29,999 | 0 (0.0%) | 0 (0.0%) |
| $30,000 to $34,999 | 10 (2.0%) | 0 (0.0%) |
| $35,000 to $39,999 | 0 (0.0%) | 88 (22.1%) |
| $40,000 to $44,999 | 0 (0.0%) | 0 (0.0%) |
| $45,000 to $49,999 | 42 (8.6%) | 79 (19.8%) |
| $50,000 to $54,999 | 0 (0.0%) | 14 (3.5%) |
| $55,000 to $64,999 | 83 (16.9%) | 0 (0.0%) |
| $65,000 to $74,999 | 33 (6.7%) | 12 (3.0%) |
| $75,000 to $99,999 | 108 (22.0%) | 48 (12.0%) |
| $100,000+ | 129 (26.3%) | 61 (15.3%) |
| Total | 490 (100.0%) | 399 (100.0%) |
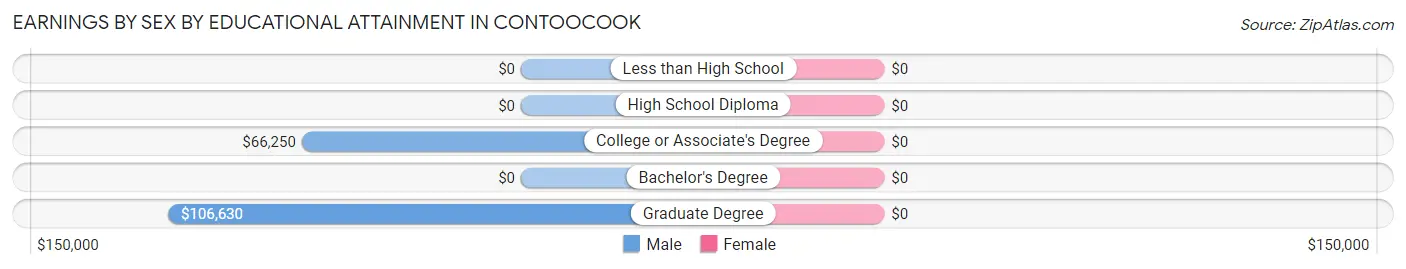
Earnings by Sex by Educational Attainment in Contoocook
| Educational Attainment | Male Income | Female Income |
| Less than High School | - | - |
| High School Diploma | - | - |
| College or Associate's Degree | $66,250 | $0 |
| Bachelor's Degree | - | - |
| Graduate Degree | $106,630 | $0 |
| Total | $88,702 | $46,981 |
Family Income in Contoocook
Family Income Brackets in Contoocook
According to the Contoocook family income data, there are 100 families falling into the $150,000 to $199,999 income range, which is the most common income bracket and makes up 31.4% of all families.
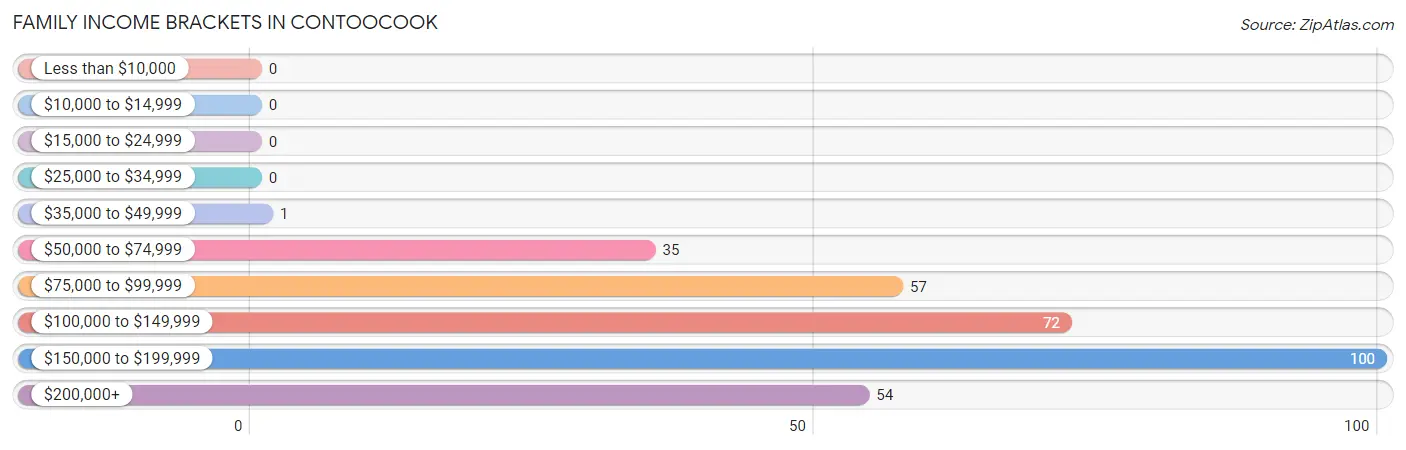
| Income Bracket | # Families | % Families |
| Less than $10,000 | 0 | 0.0% |
| $10,000 to $14,999 | 0 | 0.0% |
| $15,000 to $24,999 | 0 | 0.0% |
| $25,000 to $34,999 | 0 | 0.0% |
| $35,000 to $49,999 | 1 | 0.3% |
| $50,000 to $74,999 | 35 | 11.0% |
| $75,000 to $99,999 | 57 | 17.9% |
| $100,000 to $149,999 | 72 | 22.6% |
| $150,000 to $199,999 | 100 | 31.3% |
| $200,000+ | 54 | 16.9% |
Family Income by Famaliy Size in Contoocook
4-person families (116 | 36.4%) account for the highest median family income in Contoocook with $163,846 per family, while 2-person families (130 | 40.7%) have the highest median income of $48,462 per family member.
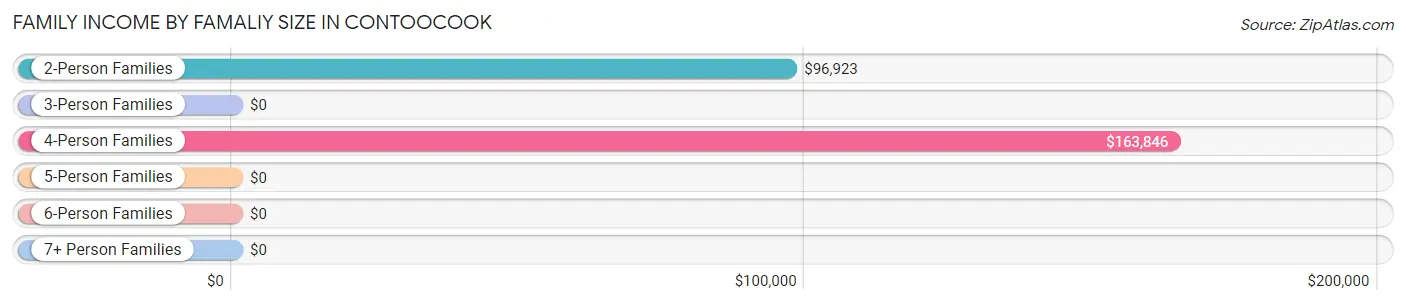
| Income Bracket | # Families | Median Income |
| 2-Person Families | 130 (40.7%) | $96,923 |
| 3-Person Families | 72 (22.6%) | $0 |
| 4-Person Families | 116 (36.4%) | $163,846 |
| 5-Person Families | 1 (0.3%) | $0 |
| 6-Person Families | 0 (0.0%) | $0 |
| 7+ Person Families | 0 (0.0%) | $0 |
| Total | 319 (100.0%) | $119,471 |
Family Income by Number of Earners in Contoocook
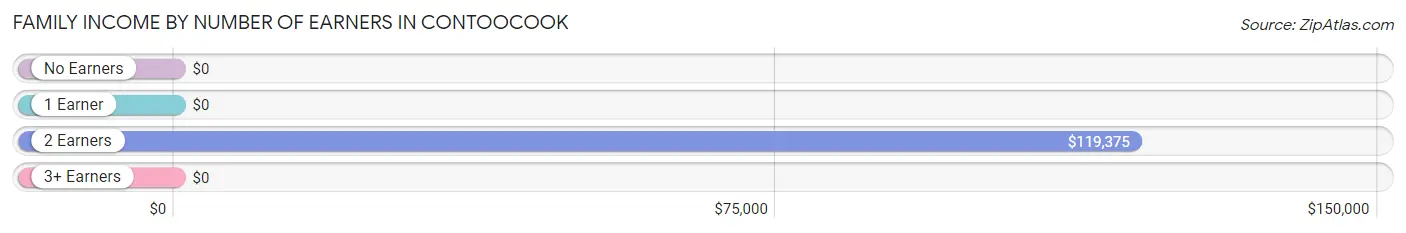
| Number of Earners | # Families | Median Income |
| No Earners | 35 (11.0%) | $0 |
| 1 Earner | 57 (17.9%) | $0 |
| 2 Earners | 209 (65.5%) | $119,375 |
| 3+ Earners | 18 (5.6%) | $0 |
| Total | 319 (100.0%) | $119,471 |
Household Income in Contoocook
Household Income Brackets in Contoocook
With 148 households falling in the category, the $75,000 to $99,999 income range is the most frequent in Contoocook, accounting for 27.5% of all households.
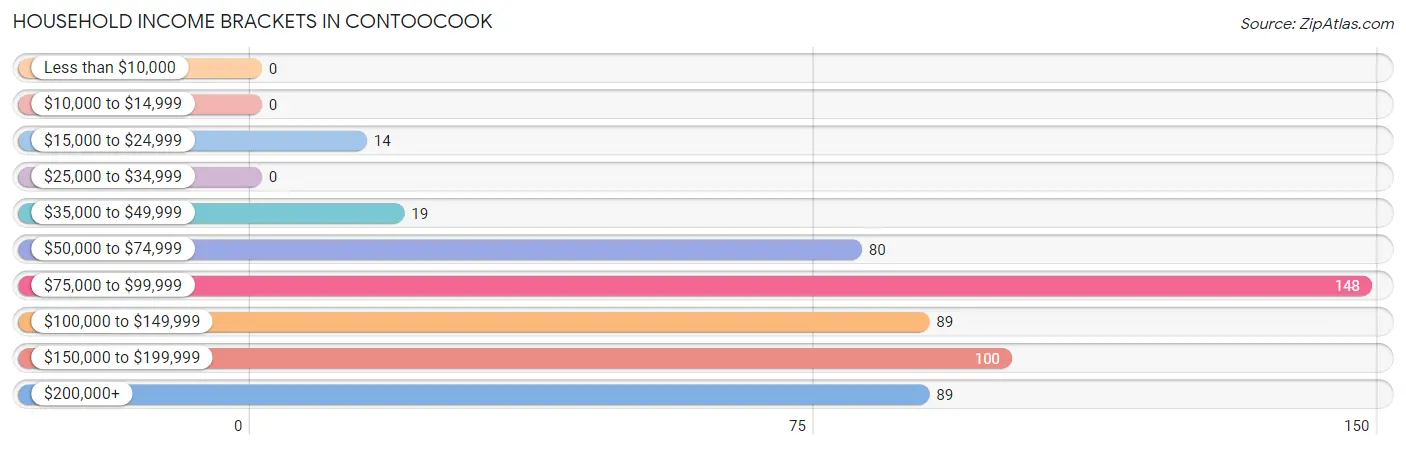
| Income Bracket | # Households | % Households |
| Less than $10,000 | 0 | 0.0% |
| $10,000 to $14,999 | 0 | 0.0% |
| $15,000 to $24,999 | 14 | 2.6% |
| $25,000 to $34,999 | 0 | 0.0% |
| $35,000 to $49,999 | 19 | 3.5% |
| $50,000 to $74,999 | 80 | 14.8% |
| $75,000 to $99,999 | 148 | 27.5% |
| $100,000 to $149,999 | 89 | 16.5% |
| $150,000 to $199,999 | 100 | 18.6% |
| $200,000+ | 89 | 16.5% |
Household Income by Householder Age in Contoocook
The median household income in Contoocook is $103,317, with the highest median household income of $103,510 found in the 45 to 64 years age bracket for the primary householder. A total of 265 households (49.2%) fall into this category. Meanwhile, the 15 to 24 years age bracket for the primary householder has the lowest median household income of $0, with 38 households (7.0%) in this group.
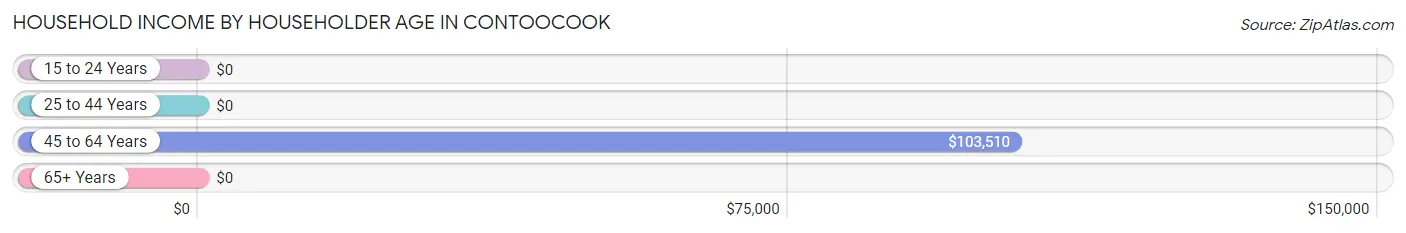
| Income Bracket | # Households | Median Income |
| 15 to 24 Years | 38 (7.0%) | $0 |
| 25 to 44 Years | 131 (24.3%) | $0 |
| 45 to 64 Years | 265 (49.2%) | $103,510 |
| 65+ Years | 105 (19.5%) | $0 |
| Total | 539 (100.0%) | $103,317 |
Poverty in Contoocook
Income Below Poverty by Sex and Age in Contoocook
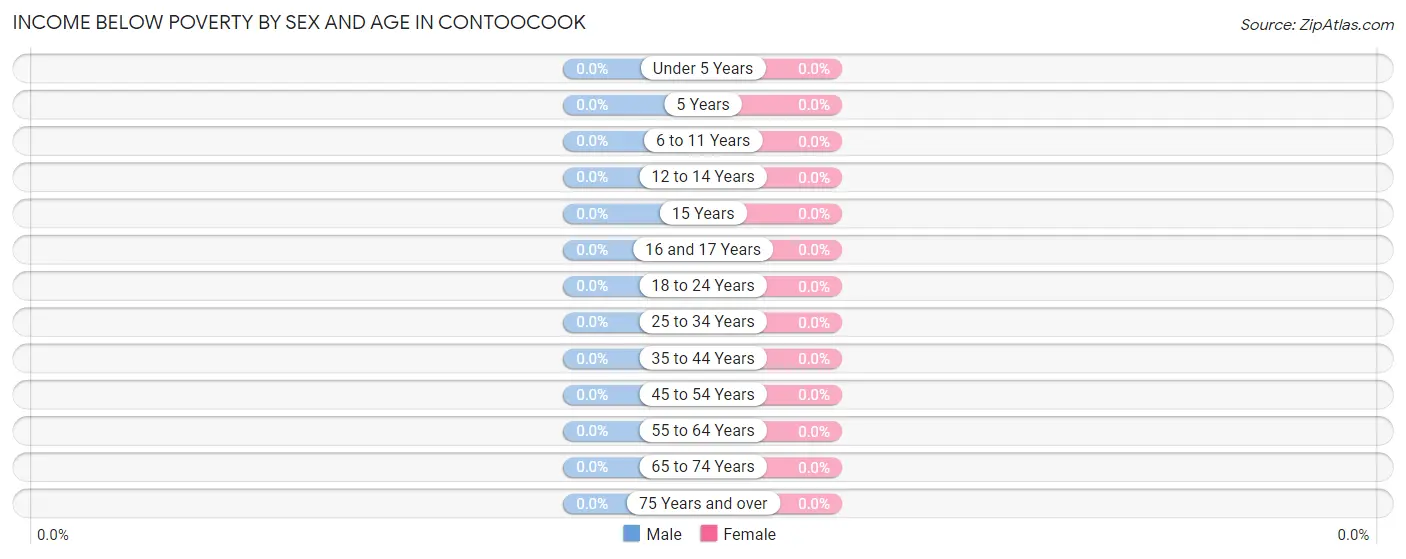
| Age Bracket | Male | Female |
| Under 5 Years | 0 (0.0%) | 0 (0.0%) |
| 5 Years | 0 (0.0%) | 0 (0.0%) |
| 6 to 11 Years | 0 (0.0%) | 0 (0.0%) |
| 12 to 14 Years | 0 (0.0%) | 0 (0.0%) |
| 15 Years | 0 (0.0%) | 0 (0.0%) |
| 16 and 17 Years | 0 (0.0%) | 0 (0.0%) |
| 18 to 24 Years | 0 (0.0%) | 0 (0.0%) |
| 25 to 34 Years | 0 (0.0%) | 0 (0.0%) |
| 35 to 44 Years | 0 (0.0%) | 0 (0.0%) |
| 45 to 54 Years | 0 (0.0%) | 0 (0.0%) |
| 55 to 64 Years | 0 (0.0%) | 0 (0.0%) |
| 65 to 74 Years | 0 (0.0%) | 0 (0.0%) |
| 75 Years and over | 0 (0.0%) | 0 (0.0%) |
| Total | 0 (0.0%) | 0 (0.0%) |
Income Above Poverty by Sex and Age in Contoocook
According to the poverty statistics in Contoocook, males aged under 5 years and females aged under 5 years are the age groups that are most secure financially, with 100.0% of males and 100.0% of females in these age groups living above the poverty line.
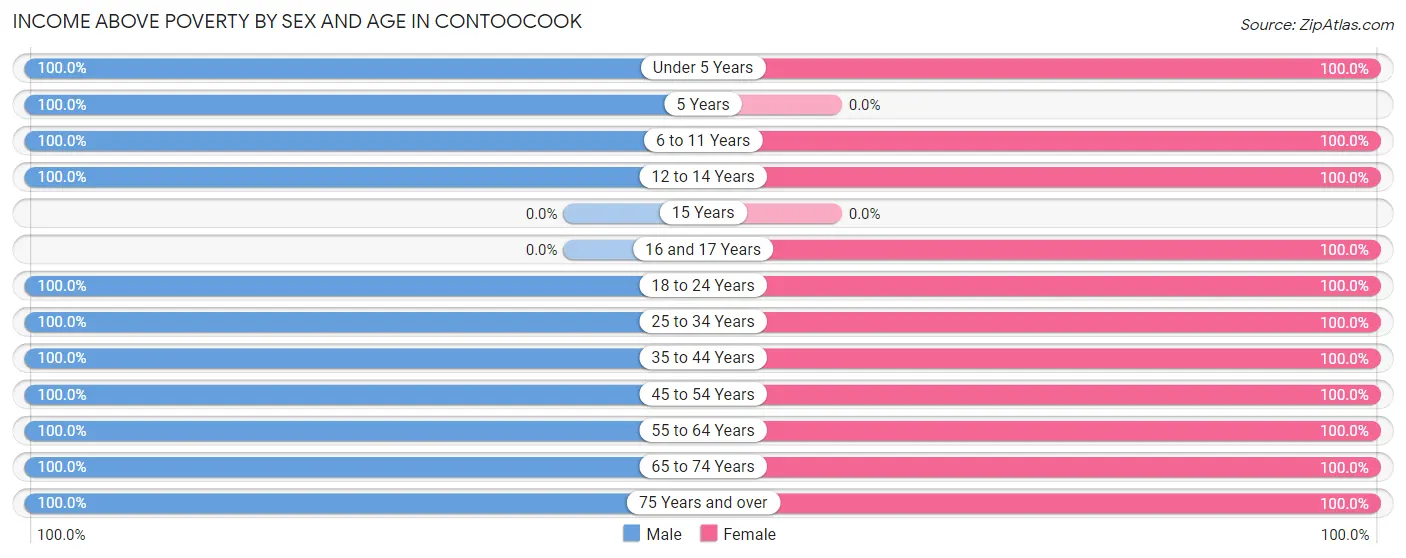
| Age Bracket | Male | Female |
| Under 5 Years | 29 (100.0%) | 22 (100.0%) |
| 5 Years | 1 (100.0%) | 0 (0.0%) |
| 6 to 11 Years | 70 (100.0%) | 42 (100.0%) |
| 12 to 14 Years | 69 (100.0%) | 35 (100.0%) |
| 15 Years | 0 (0.0%) | 0 (0.0%) |
| 16 and 17 Years | 0 (0.0%) | 11 (100.0%) |
| 18 to 24 Years | 99 (100.0%) | 44 (100.0%) |
| 25 to 34 Years | 43 (100.0%) | 47 (100.0%) |
| 35 to 44 Years | 88 (100.0%) | 102 (100.0%) |
| 45 to 54 Years | 81 (100.0%) | 101 (100.0%) |
| 55 to 64 Years | 159 (100.0%) | 64 (100.0%) |
| 65 to 74 Years | 54 (100.0%) | 56 (100.0%) |
| 75 Years and over | 24 (100.0%) | 54 (100.0%) |
| Total | 717 (100.0%) | 578 (100.0%) |
Income Below Poverty Among Married-Couple Families in Contoocook
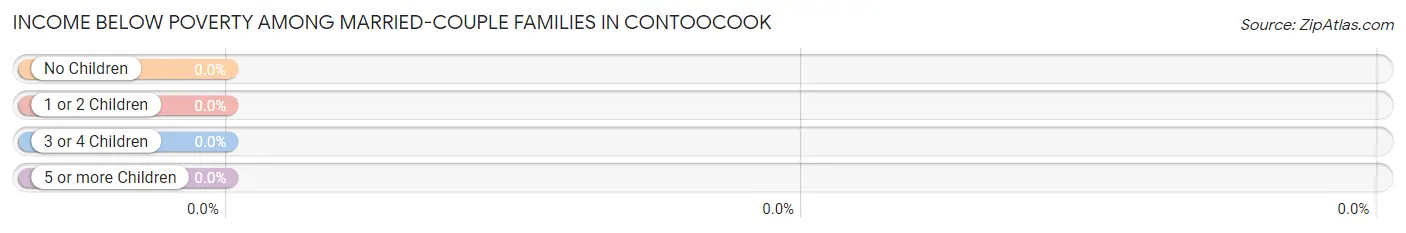
| Children | Above Poverty | Below Poverty |
| No Children | 130 (100.0%) | 0 (0.0%) |
| 1 or 2 Children | 188 (100.0%) | 0 (0.0%) |
| 3 or 4 Children | 1 (100.0%) | 0 (0.0%) |
| 5 or more Children | 0 (0.0%) | 0 (0.0%) |
| Total | 319 (100.0%) | 0 (0.0%) |
Income Below Poverty Among Single-Parent Households in Contoocook
| Children | Single Father | Single Mother |
| No Children | 0 (0.0%) | 0 (0.0%) |
| 1 or 2 Children | 0 (0.0%) | 0 (0.0%) |
| 3 or 4 Children | 0 (0.0%) | 0 (0.0%) |
| 5 or more Children | 0 (0.0%) | 0 (0.0%) |
| Total | 0 (0.0%) | 0 (0.0%) |
Income Below Poverty Among Married-Couple vs Single-Parent Households in Contoocook
| Children | Married-Couple Families | Single-Parent Households |
| No Children | 0 (0.0%) | 0 (0.0%) |
| 1 or 2 Children | 0 (0.0%) | 0 (0.0%) |
| 3 or 4 Children | 0 (0.0%) | 0 (0.0%) |
| 5 or more Children | 0 (0.0%) | 0 (0.0%) |
| Total | 0 (0.0%) | 0 (0.0%) |
Race in Contoocook
The most populous races in Contoocook are White / Caucasian (1,291 | 99.7%), Hispanic or Latino (4 | 0.3%), and Two or more Races (4 | 0.3%).
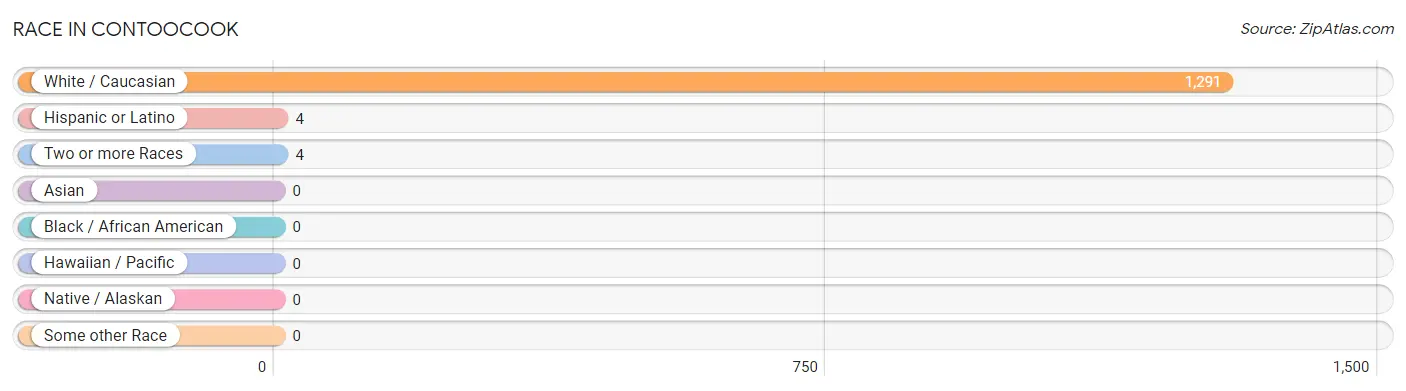
| Race | # Population | % Population |
| Asian | 0 | 0.0% |
| Black / African American | 0 | 0.0% |
| Hawaiian / Pacific | 0 | 0.0% |
| Hispanic or Latino | 4 | 0.3% |
| Native / Alaskan | 0 | 0.0% |
| White / Caucasian | 1,291 | 99.7% |
| Two or more Races | 4 | 0.3% |
| Some other Race | 0 | 0.0% |
| Total | 1,295 | 100.0% |
Ancestry in Contoocook
The most populous ancestries reported in Contoocook are Irish (341 | 26.3%), German (219 | 16.9%), French (209 | 16.1%), English (189 | 14.6%), and British (182 | 14.1%), together accounting for 88.0% of all Contoocook residents.
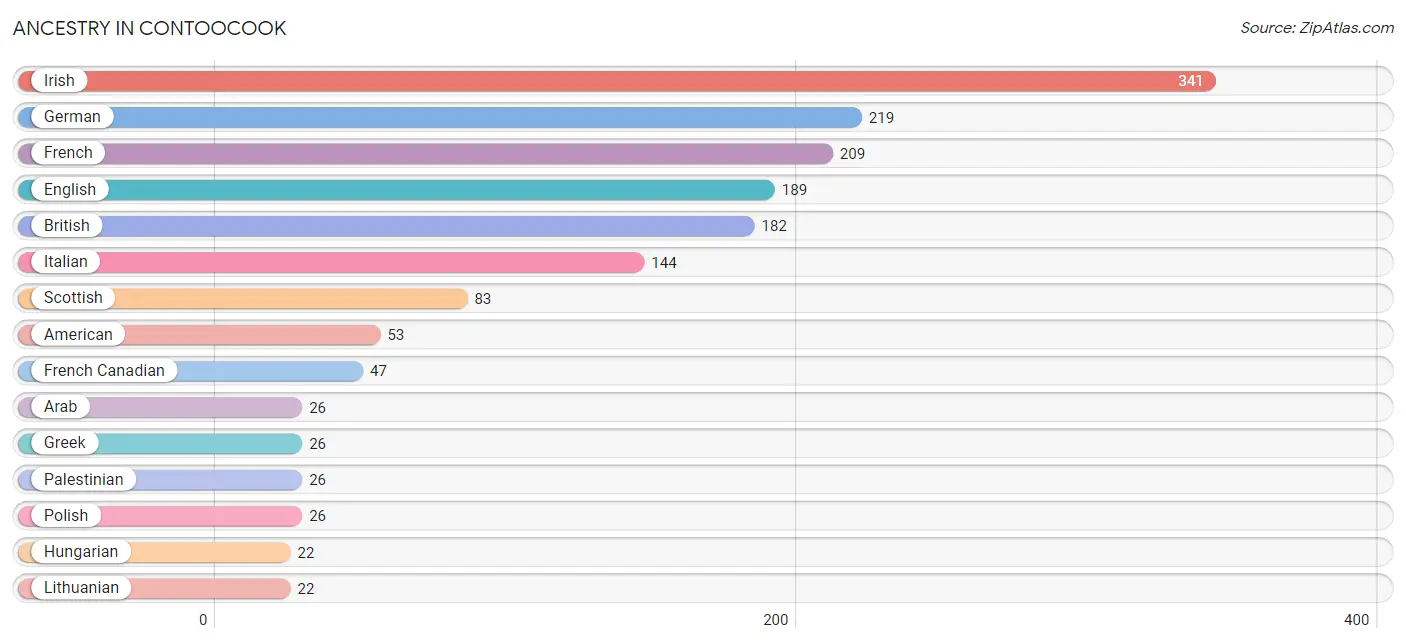
| Ancestry | # Population | % Population |
| American | 53 | 4.1% |
| Arab | 26 | 2.0% |
| British | 182 | 14.1% |
| Dutch | 10 | 0.8% |
| English | 189 | 14.6% |
| European | 13 | 1.0% |
| French | 209 | 16.1% |
| French Canadian | 47 | 3.6% |
| German | 219 | 16.9% |
| Greek | 26 | 2.0% |
| Hungarian | 22 | 1.7% |
| Irish | 341 | 26.3% |
| Italian | 144 | 11.1% |
| Korean | 4 | 0.3% |
| Lithuanian | 22 | 1.7% |
| Native Hawaiian | 4 | 0.3% |
| Palestinian | 26 | 2.0% |
| Polish | 26 | 2.0% |
| Puerto Rican | 4 | 0.3% |
| Scottish | 83 | 6.4% |
| Swedish | 10 | 0.8% | View All 21 Rows |
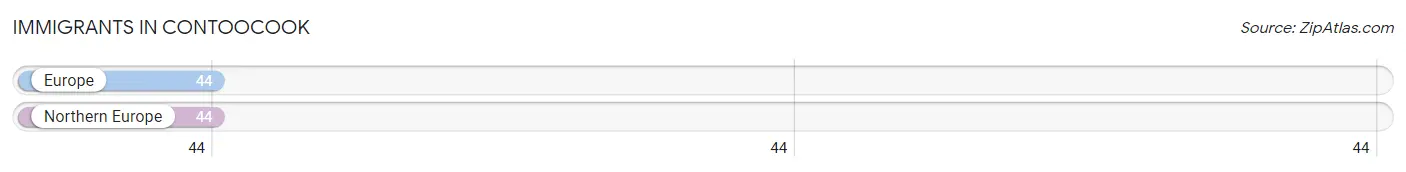
Immigrants in Contoocook
The most numerous immigrant groups reported in Contoocook came from Europe (44 | 3.4%), and Northern Europe (44 | 3.4%), together accounting for 6.8% of all Contoocook residents.
| Immigration Origin | # Population | % Population |
| Europe | 44 | 3.4% |
| Northern Europe | 44 | 3.4% | View All 2 Rows |
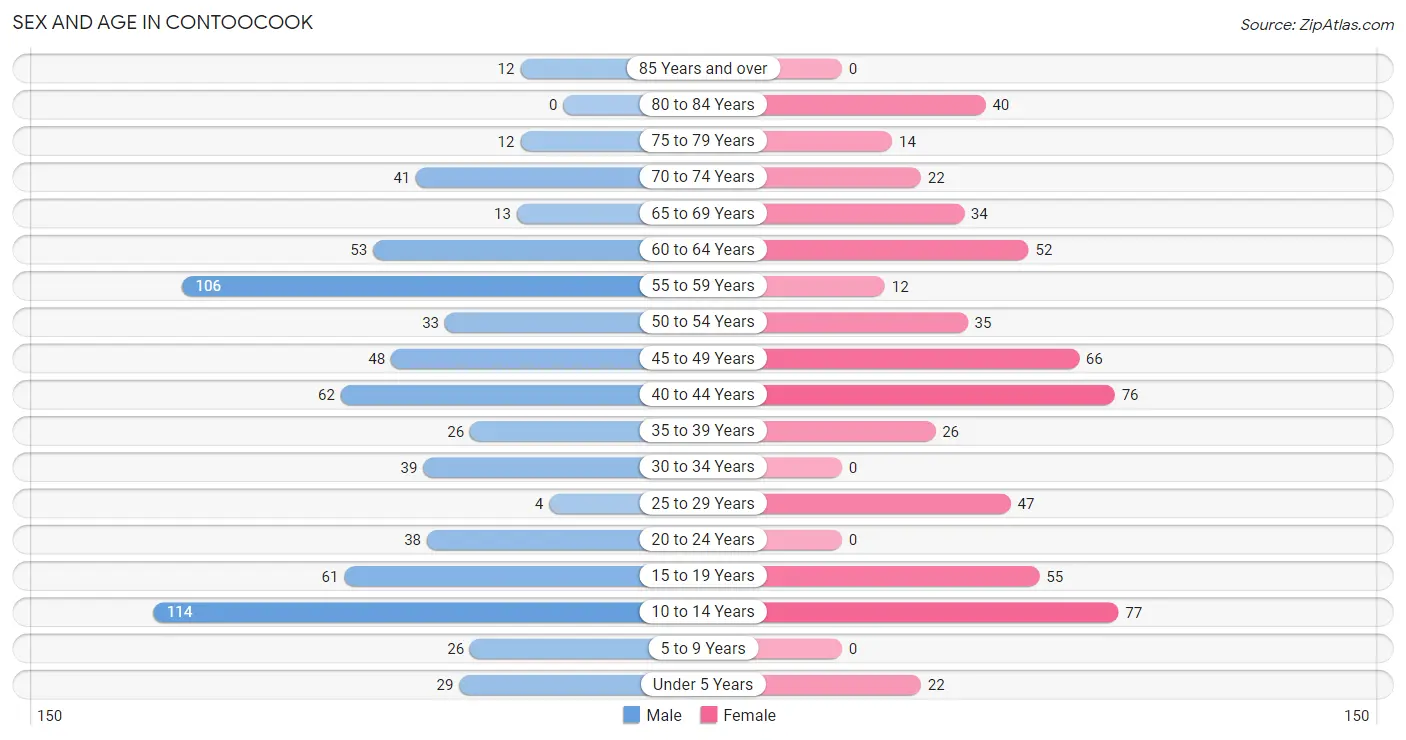
Sex and Age in Contoocook
Sex and Age in Contoocook
The most populous age groups in Contoocook are 10 to 14 Years (114 | 15.9%) for men and 10 to 14 Years (77 | 13.3%) for women.
| Age Bracket | Male | Female |
| Under 5 Years | 29 (4.0%) | 22 (3.8%) |
| 5 to 9 Years | 26 (3.6%) | 0 (0.0%) |
| 10 to 14 Years | 114 (15.9%) | 77 (13.3%) |
| 15 to 19 Years | 61 (8.5%) | 55 (9.5%) |
| 20 to 24 Years | 38 (5.3%) | 0 (0.0%) |
| 25 to 29 Years | 4 (0.6%) | 47 (8.1%) |
| 30 to 34 Years | 39 (5.4%) | 0 (0.0%) |
| 35 to 39 Years | 26 (3.6%) | 26 (4.5%) |
| 40 to 44 Years | 62 (8.6%) | 76 (13.2%) |
| 45 to 49 Years | 48 (6.7%) | 66 (11.4%) |
| 50 to 54 Years | 33 (4.6%) | 35 (6.1%) |
| 55 to 59 Years | 106 (14.8%) | 12 (2.1%) |
| 60 to 64 Years | 53 (7.4%) | 52 (9.0%) |
| 65 to 69 Years | 13 (1.8%) | 34 (5.9%) |
| 70 to 74 Years | 41 (5.7%) | 22 (3.8%) |
| 75 to 79 Years | 12 (1.7%) | 14 (2.4%) |
| 80 to 84 Years | 0 (0.0%) | 40 (6.9%) |
| 85 Years and over | 12 (1.7%) | 0 (0.0%) |
| Total | 717 (100.0%) | 578 (100.0%) |
Families and Households in Contoocook
Median Family Size in Contoocook
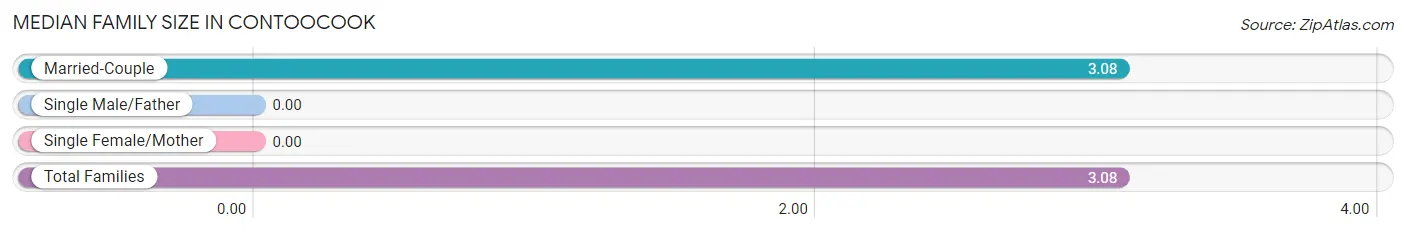
| Family Type | # Families | Family Size |
| Married-Couple | 319 (100.0%) | 3.08 |
| Single Male/Father | 0 (0.0%) | - |
| Single Female/Mother | 0 (0.0%) | - |
| Total Families | 319 (100.0%) | 3.08 |
Median Household Size in Contoocook
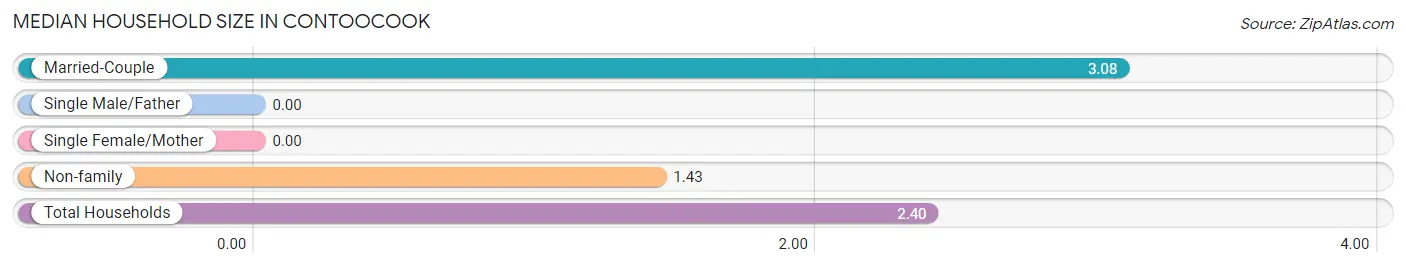
| Household Type | # Households | Household Size |
| Married-Couple | 319 (59.2%) | 3.08 |
| Single Male/Father | 0 (0.0%) | - |
| Single Female/Mother | 0 (0.0%) | - |
| Non-family | 220 (40.8%) | 1.43 |
| Total Households | 539 (100.0%) | 2.40 |
Household Size by Marriage Status in Contoocook
Out of a total of 539 households in Contoocook, 319 (59.2%) are family households, while 220 (40.8%) are nonfamily households. The most numerous type of family households are 2-person households, comprising 130, and the most common type of nonfamily households are 1-person households, comprising 130.
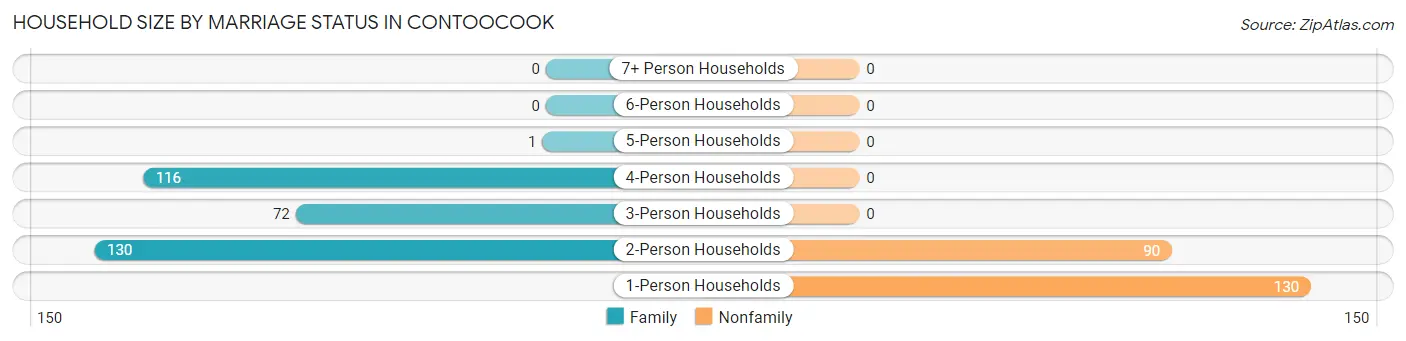
| Household Size | Family Households | Nonfamily Households |
| 1-Person Households | - | 130 (24.1%) |
| 2-Person Households | 130 (24.1%) | 90 (16.7%) |
| 3-Person Households | 72 (13.4%) | 0 (0.0%) |
| 4-Person Households | 116 (21.5%) | 0 (0.0%) |
| 5-Person Households | 1 (0.2%) | 0 (0.0%) |
| 6-Person Households | 0 (0.0%) | 0 (0.0%) |
| 7+ Person Households | 0 (0.0%) | 0 (0.0%) |
| Total | 319 (59.2%) | 220 (40.8%) |
Female Fertility in Contoocook
Fertility by Age in Contoocook
Average fertility rate in Contoocook is 4.0 births per 1,000 women. Women in the age bracket of 20 to 34 years have the highest fertility rate with 21.0 births per 1,000 women. Women in the age bracket of 20 to 34 years acount for 100.0% of all women with births.
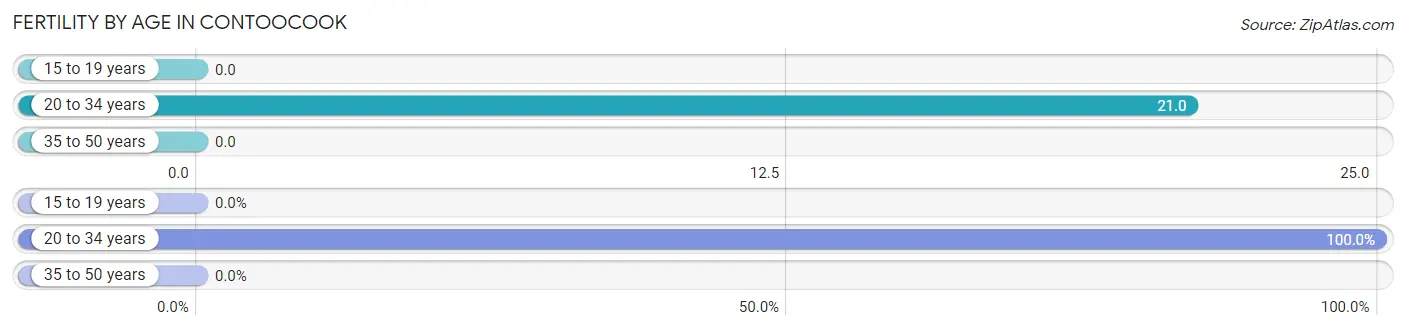
| Age Bracket | Women with Births | Births / 1,000 Women |
| 15 to 19 years | 0 (0.0%) | 0.0 |
| 20 to 34 years | 1 (100.0%) | 21.0 |
| 35 to 50 years | 0 (0.0%) | 0.0 |
| Total | 1 (100.0%) | 4.0 |
Fertility by Age by Marriage Status in Contoocook
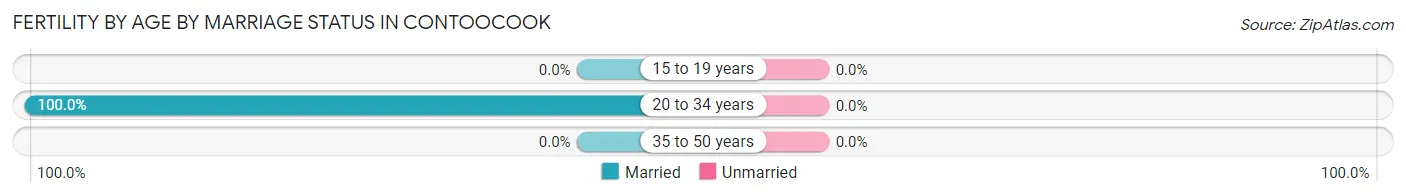
| Age Bracket | Married | Unmarried |
| 15 to 19 years | 0 (0.0%) | 0 (0.0%) |
| 20 to 34 years | 1 (100.0%) | 0 (0.0%) |
| 35 to 50 years | 0 (0.0%) | 0 (0.0%) |
| Total | 1 (100.0%) | 0 (0.0%) |
Fertility by Education in Contoocook
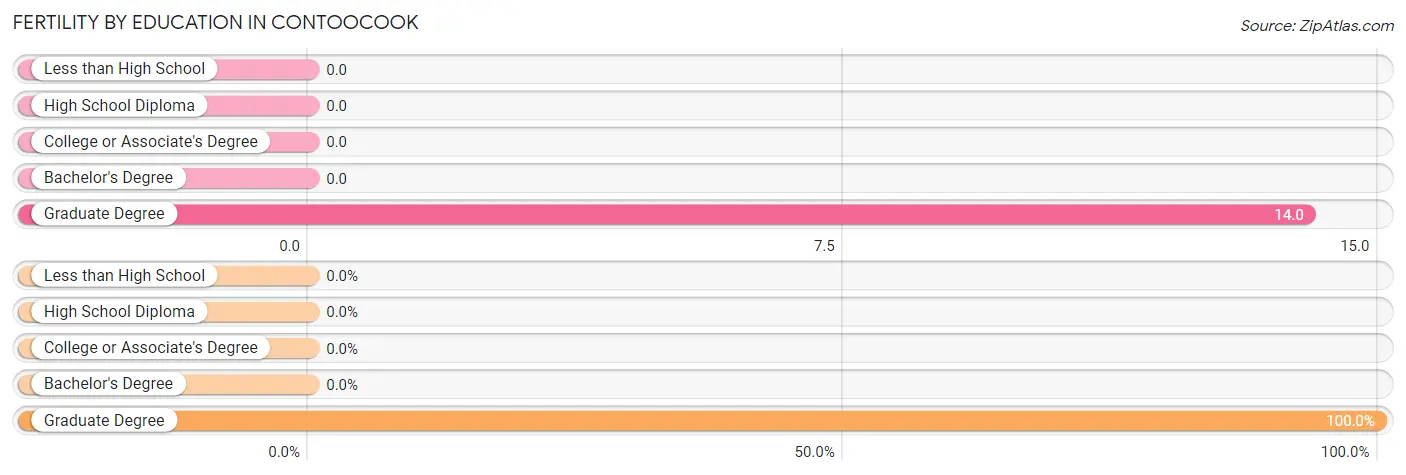
| Educational Attainment | Women with Births | Births / 1,000 Women |
| Less than High School | 0 (0.0%) | 0.0 |
| High School Diploma | 0 (0.0%) | 0.0 |
| College or Associate's Degree | 0 (0.0%) | 0.0 |
| Bachelor's Degree | 0 (0.0%) | 0.0 |
| Graduate Degree | 1 (100.0%) | 14.0 |
| Total | 1 (100.0%) | 4.0 |
Fertility by Education by Marriage Status in Contoocook
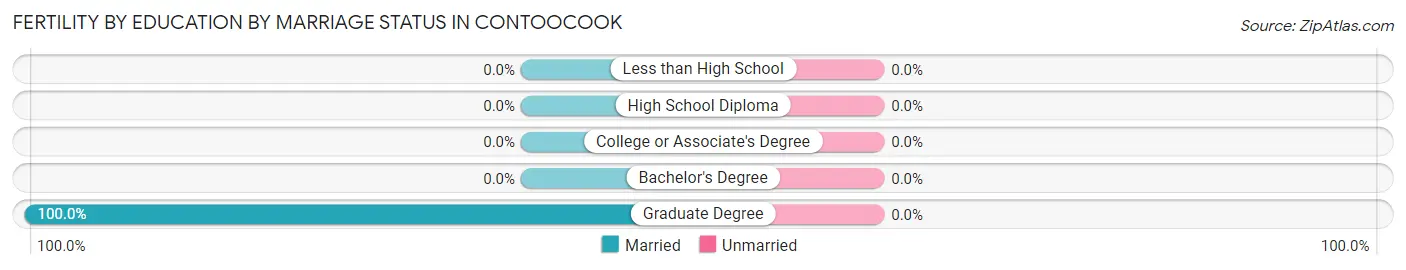
| Educational Attainment | Married | Unmarried |
| Less than High School | 0 (0.0%) | 0 (0.0%) |
| High School Diploma | 0 (0.0%) | 0 (0.0%) |
| College or Associate's Degree | 0 (0.0%) | 0 (0.0%) |
| Bachelor's Degree | 0 (0.0%) | 0 (0.0%) |
| Graduate Degree | 1 (100.0%) | 0 (0.0%) |
| Total | 1 (100.0%) | 0 (0.0%) |
Employment Characteristics in Contoocook
Employment by Class of Employer in Contoocook
Among the 761 employed individuals in Contoocook, private company employees (394 | 51.8%), local government employees (168 | 22.1%), and self-employed (not incorporated) (74 | 9.7%) make up the most common classes of employment.
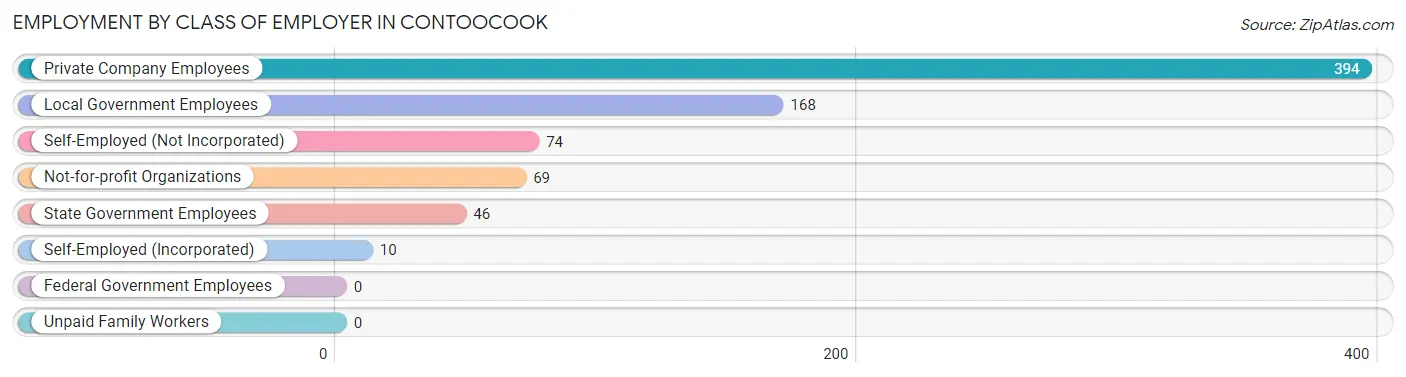
| Employer Class | # Employees | % Employees |
| Private Company Employees | 394 | 51.8% |
| Self-Employed (Incorporated) | 10 | 1.3% |
| Self-Employed (Not Incorporated) | 74 | 9.7% |
| Not-for-profit Organizations | 69 | 9.1% |
| Local Government Employees | 168 | 22.1% |
| State Government Employees | 46 | 6.0% |
| Federal Government Employees | 0 | 0.0% |
| Unpaid Family Workers | 0 | 0.0% |
| Total | 761 | 100.0% |
Employment Status by Age in Contoocook
According to the labor force statistics for Contoocook, out of the total population over 16 years of age (1,027), 79.6% or 817 individuals are in the labor force, with 2.2% or 18 of them unemployed. The age group with the highest labor force participation rate is 20 to 24 years, with 100.0% or 38 individuals in the labor force. Within the labor force, the 45 to 54 years age range has the highest percentage of unemployed individuals, with 11.3% or 18 of them being unemployed.
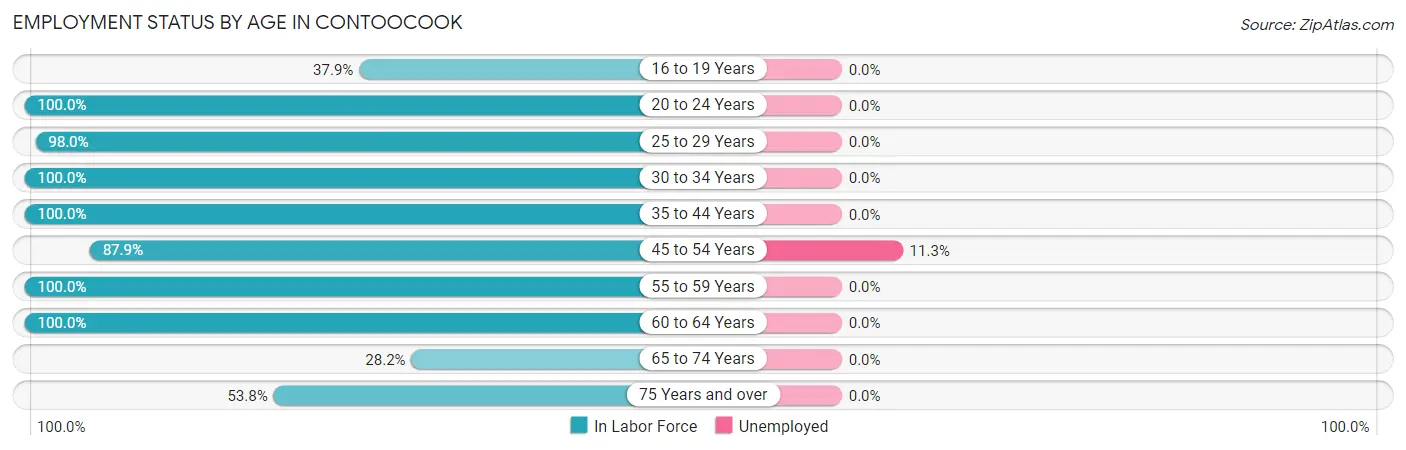
| Age Bracket | In Labor Force | Unemployed |
| 16 to 19 Years | 44 (37.9%) | 0 (0.0%) |
| 20 to 24 Years | 38 (100.0%) | 0 (0.0%) |
| 25 to 29 Years | 50 (98.0%) | 0 (0.0%) |
| 30 to 34 Years | 39 (100.0%) | 0 (0.0%) |
| 35 to 44 Years | 190 (100.0%) | 0 (0.0%) |
| 45 to 54 Years | 160 (87.9%) | 18 (11.3%) |
| 55 to 59 Years | 118 (100.0%) | 0 (0.0%) |
| 60 to 64 Years | 105 (100.0%) | 0 (0.0%) |
| 65 to 74 Years | 31 (28.2%) | 0 (0.0%) |
| 75 Years and over | 42 (53.8%) | 0 (0.0%) |
| Total | 817 (79.6%) | 18 (2.2%) |
Employment Status by Educational Attainment in Contoocook
According to labor force statistics for Contoocook, 96.6% of individuals (662) out of the total population between 25 and 64 years of age (685) are in the labor force, with 2.7% or 18 of them being unemployed. The group with the highest labor force participation rate are those with the educational attainment of less than high school, with 100.0% or 14 individuals in the labor force. Within the labor force, individuals with bachelor's degree or higher education have the highest percentage of unemployment, with 5.1% or 18 of them being unemployed.
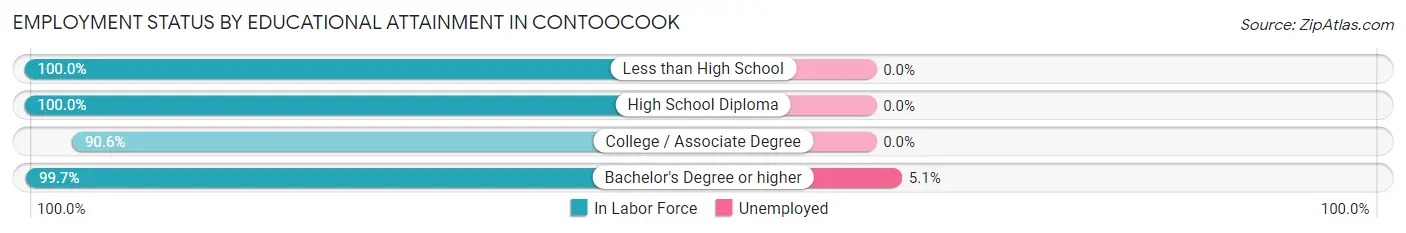
| Educational Attainment | In Labor Force | Unemployed |
| Less than High School | 14 (100.0%) | 0 (0.0%) |
| High School Diploma | 83 (100.0%) | 0 (0.0%) |
| College / Associate Degree | 213 (90.6%) | 0 (0.0%) |
| Bachelor's Degree or higher | 352 (99.7%) | 18 (5.1%) |
| Total | 662 (96.6%) | 18 (2.7%) |
Employment Occupations by Sex in Contoocook
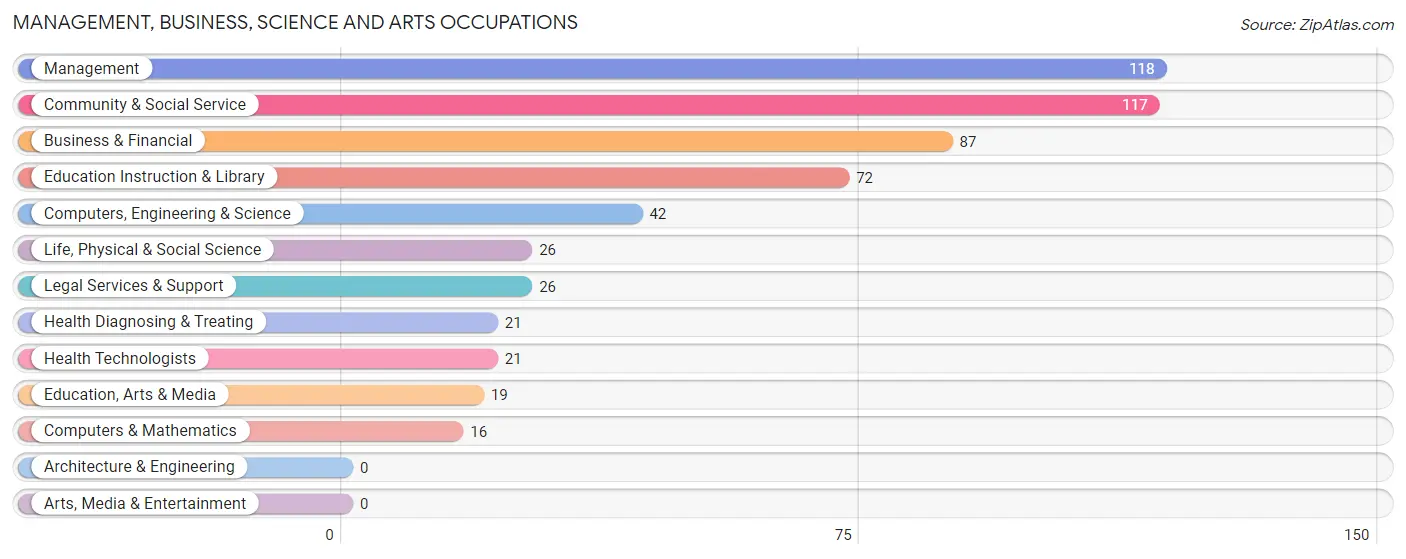
Management, Business, Science and Arts Occupations
The most common Management, Business, Science and Arts occupations in Contoocook are Management (118 | 14.8%), Community & Social Service (117 | 14.6%), Business & Financial (87 | 10.9%), Education Instruction & Library (72 | 9.0%), and Computers, Engineering & Science (42 | 5.3%).
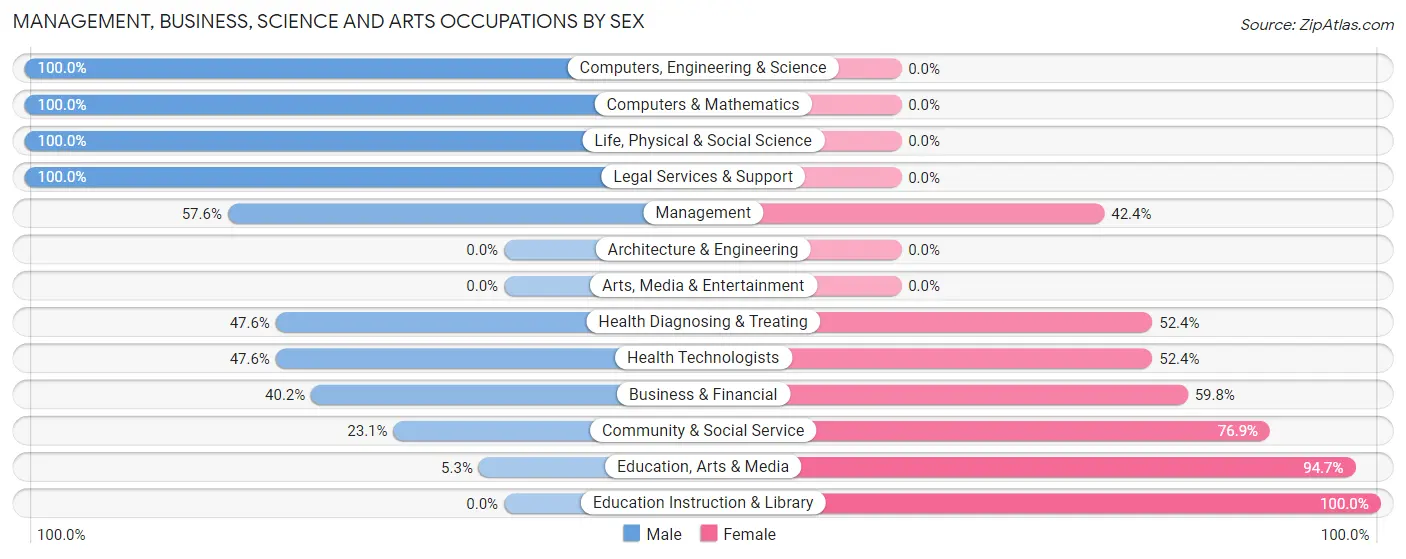
Management, Business, Science and Arts Occupations by Sex
Within the Management, Business, Science and Arts occupations in Contoocook, the most male-oriented occupations are Computers, Engineering & Science (100.0%), Computers & Mathematics (100.0%), and Life, Physical & Social Science (100.0%), while the most female-oriented occupations are Education Instruction & Library (100.0%), Education, Arts & Media (94.7%), and Community & Social Service (76.9%).
| Occupation | Male | Female |
| Management | 68 (57.6%) | 50 (42.4%) |
| Business & Financial | 35 (40.2%) | 52 (59.8%) |
| Computers, Engineering & Science | 42 (100.0%) | 0 (0.0%) |
| Computers & Mathematics | 16 (100.0%) | 0 (0.0%) |
| Architecture & Engineering | 0 (0.0%) | 0 (0.0%) |
| Life, Physical & Social Science | 26 (100.0%) | 0 (0.0%) |
| Community & Social Service | 27 (23.1%) | 90 (76.9%) |
| Education, Arts & Media | 1 (5.3%) | 18 (94.7%) |
| Legal Services & Support | 26 (100.0%) | 0 (0.0%) |
| Education Instruction & Library | 0 (0.0%) | 72 (100.0%) |
| Arts, Media & Entertainment | 0 (0.0%) | 0 (0.0%) |
| Health Diagnosing & Treating | 10 (47.6%) | 11 (52.4%) |
| Health Technologists | 10 (47.6%) | 11 (52.4%) |
| Total (Category) | 182 (47.3%) | 203 (52.7%) |
| Total (Overall) | 429 (53.7%) | 370 (46.3%) |
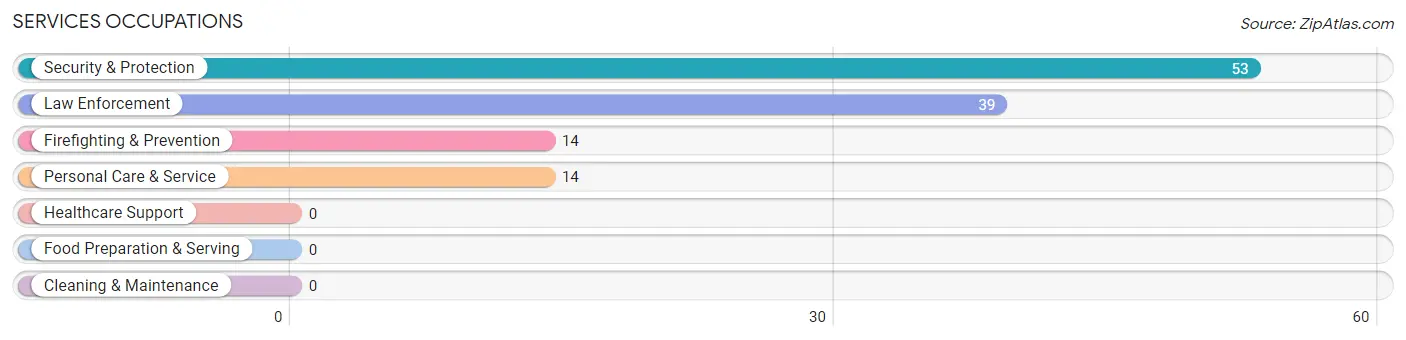
Services Occupations
The most common Services occupations in Contoocook are Security & Protection (53 | 6.6%), Law Enforcement (39 | 4.9%), Firefighting & Prevention (14 | 1.8%), and Personal Care & Service (14 | 1.8%).
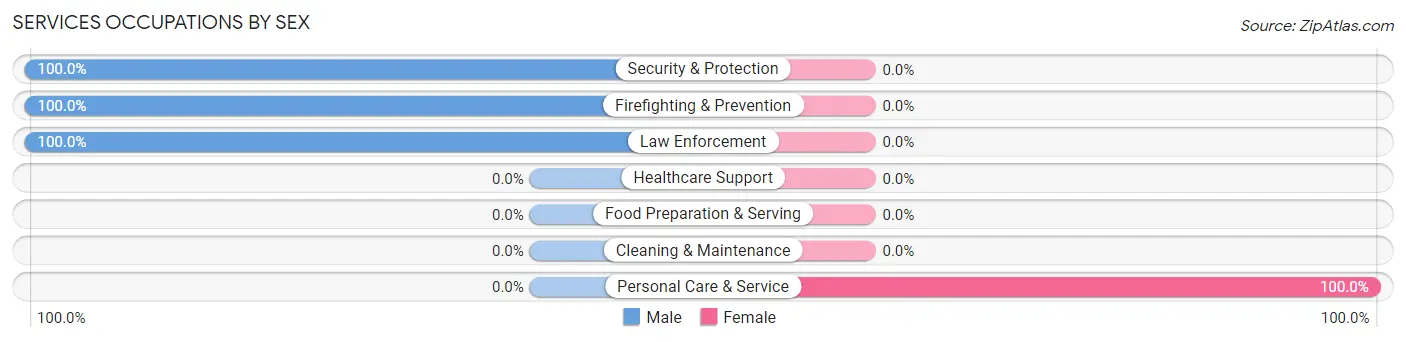
Services Occupations by Sex
| Occupation | Male | Female |
| Healthcare Support | 0 (0.0%) | 0 (0.0%) |
| Security & Protection | 53 (100.0%) | 0 (0.0%) |
| Firefighting & Prevention | 14 (100.0%) | 0 (0.0%) |
| Law Enforcement | 39 (100.0%) | 0 (0.0%) |
| Food Preparation & Serving | 0 (0.0%) | 0 (0.0%) |
| Cleaning & Maintenance | 0 (0.0%) | 0 (0.0%) |
| Personal Care & Service | 0 (0.0%) | 14 (100.0%) |
| Total (Category) | 53 (79.1%) | 14 (20.9%) |
| Total (Overall) | 429 (53.7%) | 370 (46.3%) |
Sales and Office Occupations
The most common Sales and Office occupations in Contoocook are Office & Administration (93 | 11.6%), and Sales & Related (86 | 10.8%).
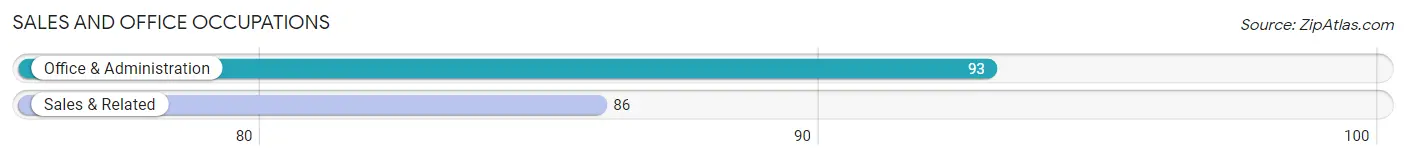
Sales and Office Occupations by Sex
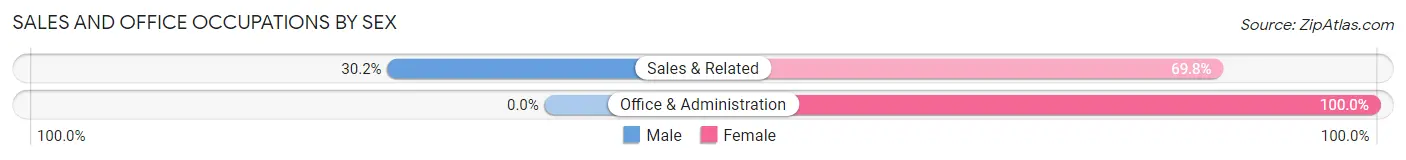
| Occupation | Male | Female |
| Sales & Related | 26 (30.2%) | 60 (69.8%) |
| Office & Administration | 0 (0.0%) | 93 (100.0%) |
| Total (Category) | 26 (14.5%) | 153 (85.5%) |
| Total (Overall) | 429 (53.7%) | 370 (46.3%) |
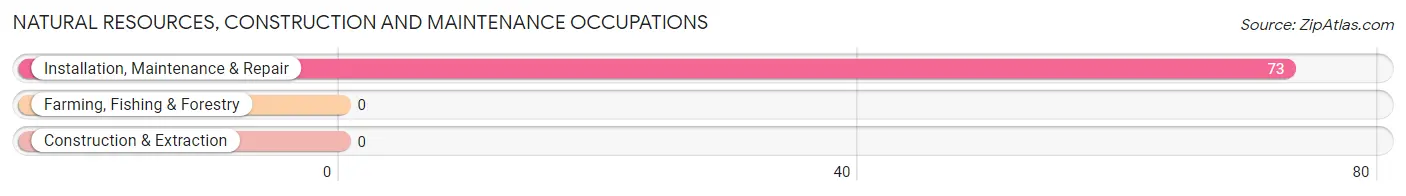
Natural Resources, Construction and Maintenance Occupations
The most common Natural Resources, Construction and Maintenance occupations in Contoocook are , and Installation, Maintenance & Repair (73 | 9.1%).
Natural Resources, Construction and Maintenance Occupations by Sex
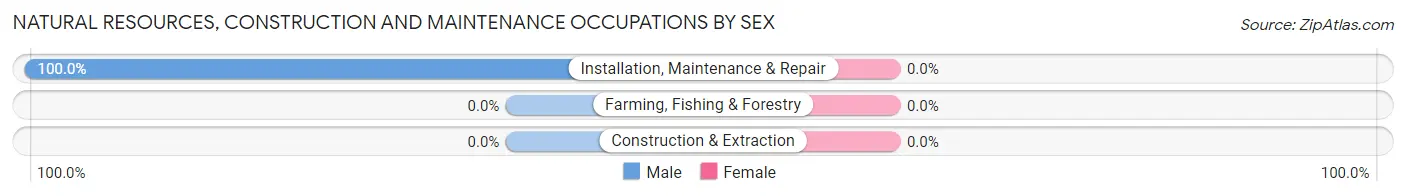
| Occupation | Male | Female |
| Farming, Fishing & Forestry | 0 (0.0%) | 0 (0.0%) |
| Construction & Extraction | 0 (0.0%) | 0 (0.0%) |
| Installation, Maintenance & Repair | 73 (100.0%) | 0 (0.0%) |
| Total (Category) | 73 (100.0%) | 0 (0.0%) |
| Total (Overall) | 429 (53.7%) | 370 (46.3%) |
Production, Transportation and Moving Occupations
The most common Production, Transportation and Moving occupations in Contoocook are Transportation (43 | 5.4%), Production (38 | 4.8%), and Material Moving (14 | 1.8%).

Production, Transportation and Moving Occupations by Sex
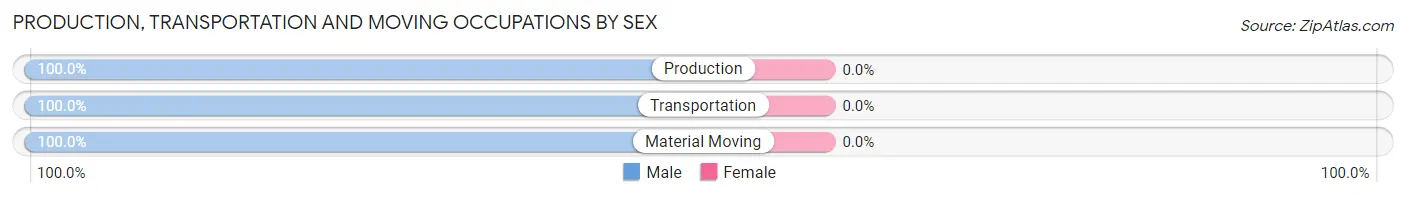
| Occupation | Male | Female |
| Production | 38 (100.0%) | 0 (0.0%) |
| Transportation | 43 (100.0%) | 0 (0.0%) |
| Material Moving | 14 (100.0%) | 0 (0.0%) |
| Total (Category) | 95 (100.0%) | 0 (0.0%) |
| Total (Overall) | 429 (53.7%) | 370 (46.3%) |
Employment Industries by Sex in Contoocook
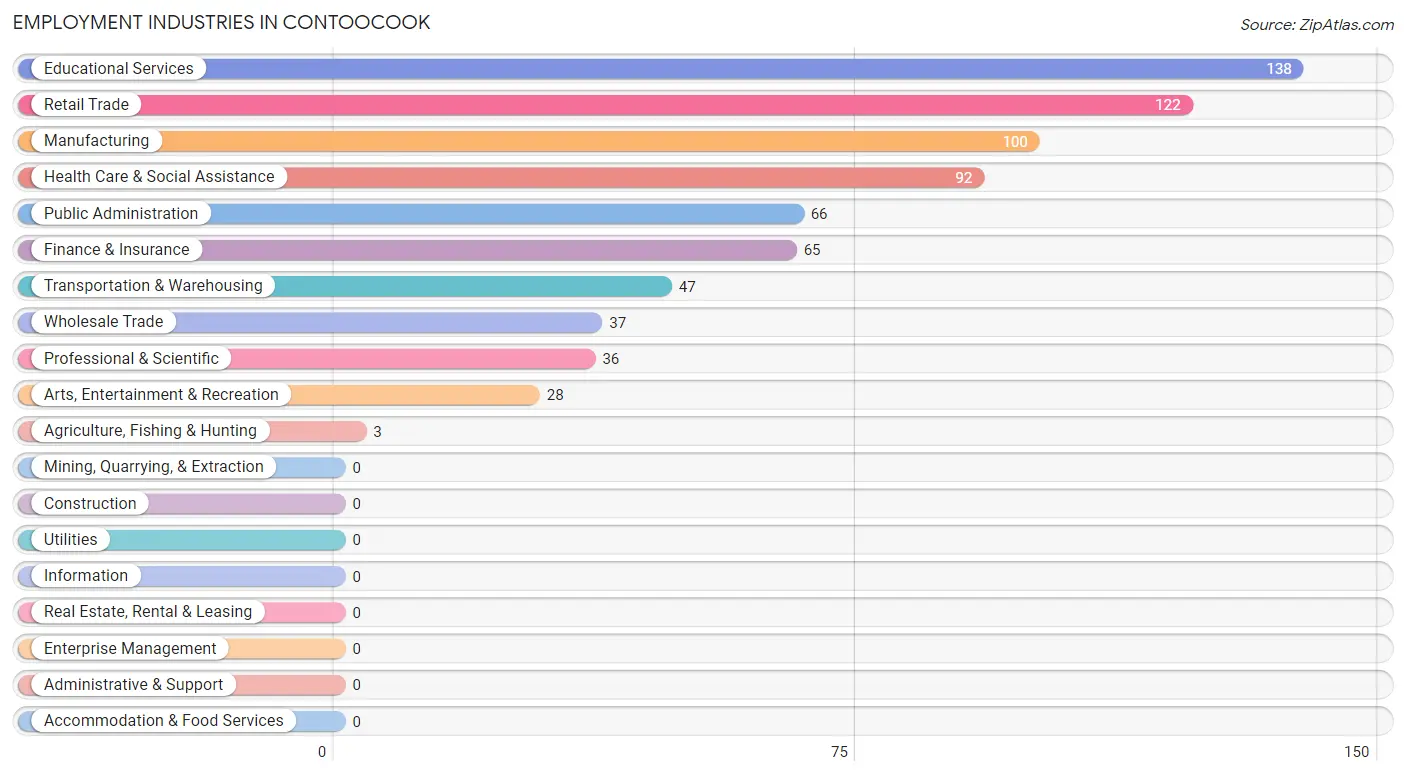
Employment Industries in Contoocook
The major employment industries in Contoocook include Educational Services (138 | 17.3%), Retail Trade (122 | 15.3%), Manufacturing (100 | 12.5%), Health Care & Social Assistance (92 | 11.5%), and Public Administration (66 | 8.3%).
Employment Industries by Sex in Contoocook
The Contoocook industries that see more men than women are Agriculture, Fishing & Hunting (100.0%), Transportation & Warehousing (100.0%), and Professional & Scientific (100.0%), whereas the industries that tend to have a higher number of women are Wholesale Trade (100.0%), Arts, Entertainment & Recreation (100.0%), and Manufacturing (78.0%).
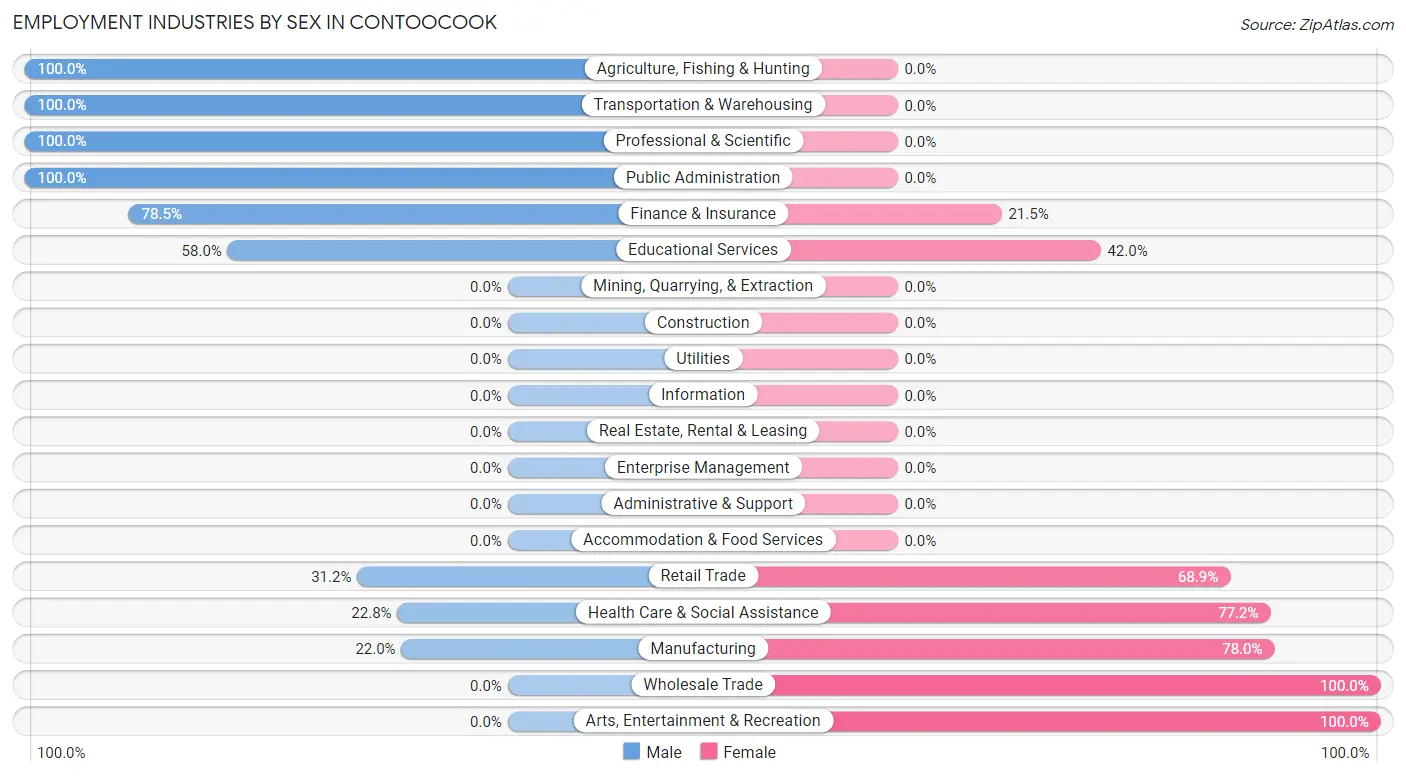
| Industry | Male | Female |
| Agriculture, Fishing & Hunting | 3 (100.0%) | 0 (0.0%) |
| Mining, Quarrying, & Extraction | 0 (0.0%) | 0 (0.0%) |
| Construction | 0 (0.0%) | 0 (0.0%) |
| Manufacturing | 22 (22.0%) | 78 (78.0%) |
| Wholesale Trade | 0 (0.0%) | 37 (100.0%) |
| Retail Trade | 38 (31.1%) | 84 (68.9%) |
| Transportation & Warehousing | 47 (100.0%) | 0 (0.0%) |
| Utilities | 0 (0.0%) | 0 (0.0%) |
| Information | 0 (0.0%) | 0 (0.0%) |
| Finance & Insurance | 51 (78.5%) | 14 (21.5%) |
| Real Estate, Rental & Leasing | 0 (0.0%) | 0 (0.0%) |
| Professional & Scientific | 36 (100.0%) | 0 (0.0%) |
| Enterprise Management | 0 (0.0%) | 0 (0.0%) |
| Administrative & Support | 0 (0.0%) | 0 (0.0%) |
| Educational Services | 80 (58.0%) | 58 (42.0%) |
| Health Care & Social Assistance | 21 (22.8%) | 71 (77.2%) |
| Arts, Entertainment & Recreation | 0 (0.0%) | 28 (100.0%) |
| Accommodation & Food Services | 0 (0.0%) | 0 (0.0%) |
| Public Administration | 66 (100.0%) | 0 (0.0%) |
| Total | 429 (53.7%) | 370 (46.3%) |
Education in Contoocook
School Enrollment in Contoocook
The most common levels of schooling among the 383 students in Contoocook are middle school (156 | 40.7%), high school (151 | 39.4%), and nursery / preschool (51 | 13.3%).
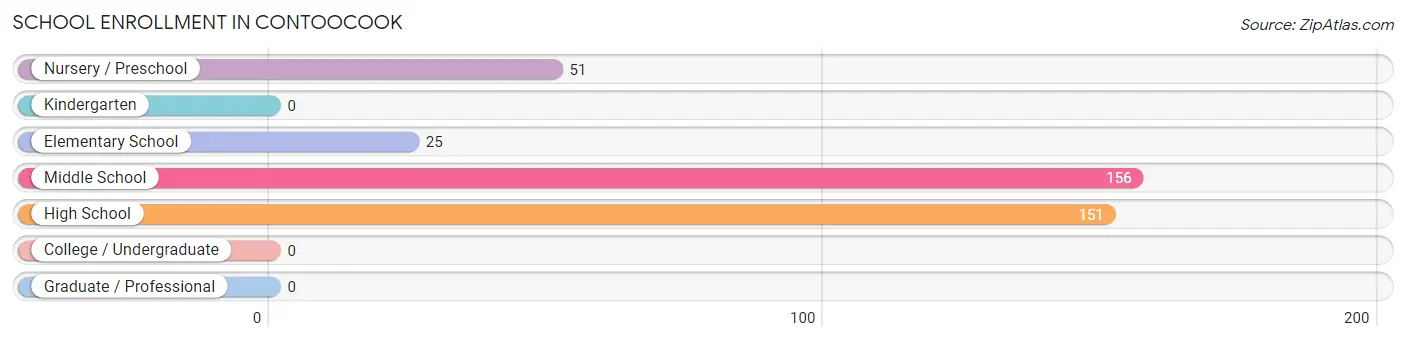
| School Level | # Students | % Students |
| Nursery / Preschool | 51 | 13.3% |
| Kindergarten | 0 | 0.0% |
| Elementary School | 25 | 6.5% |
| Middle School | 156 | 40.7% |
| High School | 151 | 39.4% |
| College / Undergraduate | 0 | 0.0% |
| Graduate / Professional | 0 | 0.0% |
| Total | 383 | 100.0% |
School Enrollment by Age by Funding Source in Contoocook
Out of a total of 383 students who are enrolled in schools in Contoocook, 28 (7.3%) attend a private institution, while the remaining 355 (92.7%) are enrolled in public schools. The age group of 3 to 4 year olds has the highest likelihood of being enrolled in private schools, with 28 (56.0% in the age bracket) enrolled. Conversely, the age group of 5 to 9 year old has the lowest likelihood of being enrolled in a private school, with 26 (100.0% in the age bracket) attending a public institution.
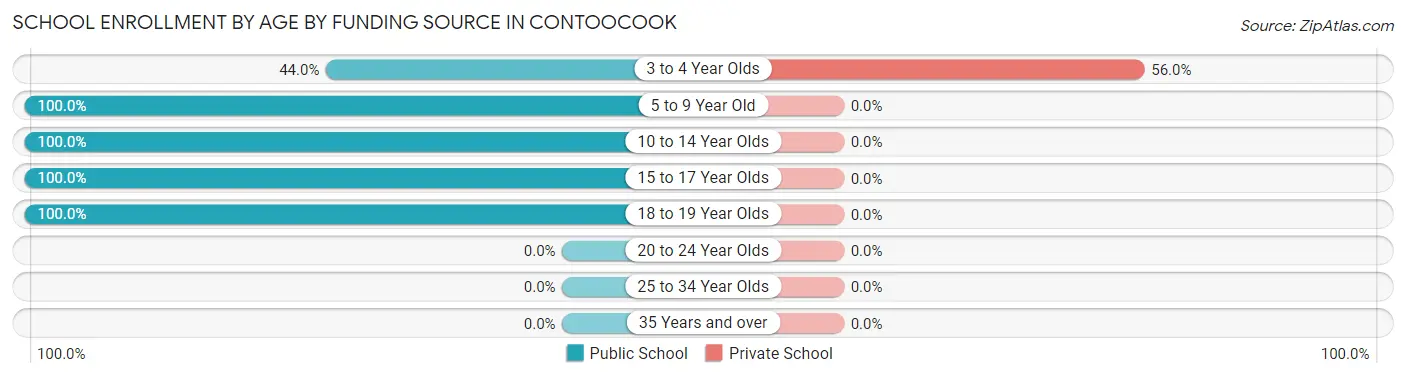
| Age Bracket | Public School | Private School |
| 3 to 4 Year Olds | 22 (44.0%) | 28 (56.0%) |
| 5 to 9 Year Old | 26 (100.0%) | 0 (0.0%) |
| 10 to 14 Year Olds | 191 (100.0%) | 0 (0.0%) |
| 15 to 17 Year Olds | 11 (100.0%) | 0 (0.0%) |
| 18 to 19 Year Olds | 105 (100.0%) | 0 (0.0%) |
| 20 to 24 Year Olds | 0 (0.0%) | 0 (0.0%) |
| 25 to 34 Year Olds | 0 (0.0%) | 0 (0.0%) |
| 35 Years and over | 0 (0.0%) | 0 (0.0%) |
| Total | 355 (92.7%) | 28 (7.3%) |
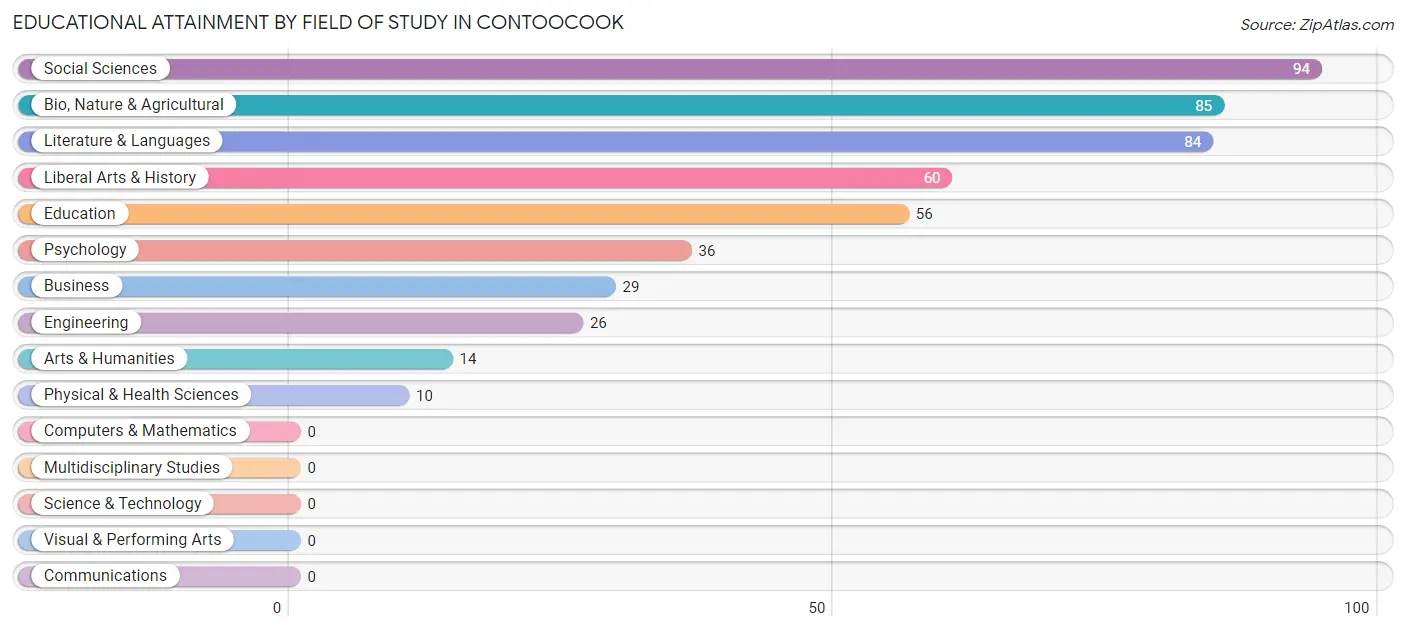
Educational Attainment by Field of Study in Contoocook
Social sciences (94 | 19.0%), bio, nature & agricultural (85 | 17.2%), literature & languages (84 | 17.0%), liberal arts & history (60 | 12.1%), and education (56 | 11.3%) are the most common fields of study among 494 individuals in Contoocook who have obtained a bachelor's degree or higher.
| Field of Study | # Graduates | % Graduates |
| Computers & Mathematics | 0 | 0.0% |
| Bio, Nature & Agricultural | 85 | 17.2% |
| Physical & Health Sciences | 10 | 2.0% |
| Psychology | 36 | 7.3% |
| Social Sciences | 94 | 19.0% |
| Engineering | 26 | 5.3% |
| Multidisciplinary Studies | 0 | 0.0% |
| Science & Technology | 0 | 0.0% |
| Business | 29 | 5.9% |
| Education | 56 | 11.3% |
| Literature & Languages | 84 | 17.0% |
| Liberal Arts & History | 60 | 12.1% |
| Visual & Performing Arts | 0 | 0.0% |
| Communications | 0 | 0.0% |
| Arts & Humanities | 14 | 2.8% |
| Total | 494 | 100.0% |
Transportation & Commute in Contoocook
Vehicle Availability by Sex in Contoocook
The most prevalent vehicle ownership categories in Contoocook are males with 2 vehicles (223, accounting for 57.0%) and females with 2 vehicles (246, making up 60.3%).
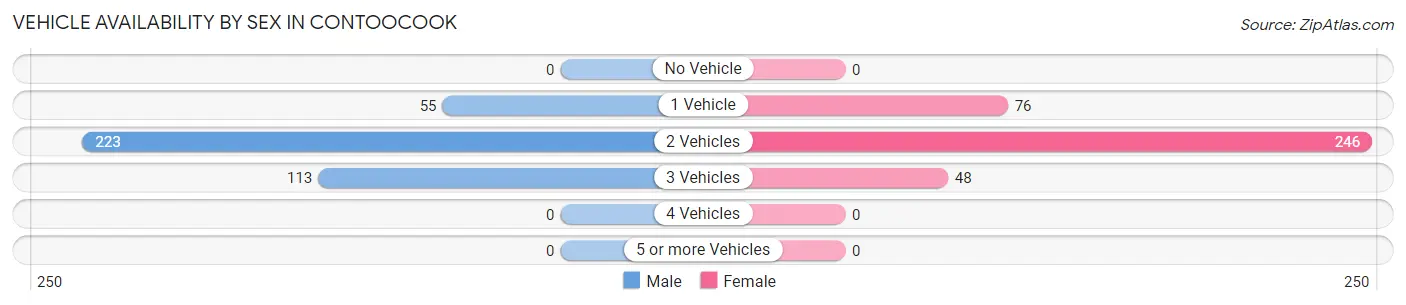
| Vehicles Available | Male | Female |
| No Vehicle | 0 (0.0%) | 0 (0.0%) |
| 1 Vehicle | 55 (14.1%) | 76 (20.5%) |
| 2 Vehicles | 223 (57.0%) | 246 (66.5%) |
| 3 Vehicles | 113 (28.9%) | 48 (13.0%) |
| 4 Vehicles | 0 (0.0%) | 0 (0.0%) |
| 5 or more Vehicles | 0 (0.0%) | 0 (0.0%) |
| Total | 391 (100.0%) | 370 (100.0%) |
Commute Time in Contoocook
The most frequently occuring commute durations in Contoocook are 15 to 19 minutes (123 commuters, 22.0%), 30 to 34 minutes (78 commuters, 14.0%), and 10 to 14 minutes (62 commuters, 11.1%).
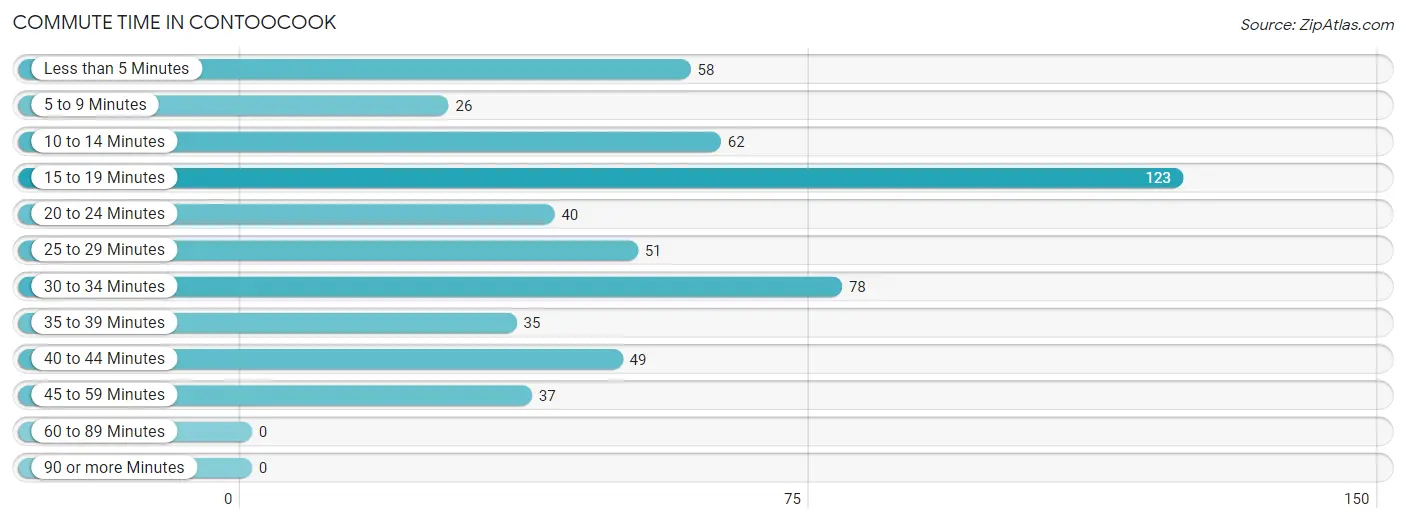
| Commute Time | # Commuters | % Commuters |
| Less than 5 Minutes | 58 | 10.4% |
| 5 to 9 Minutes | 26 | 4.6% |
| 10 to 14 Minutes | 62 | 11.1% |
| 15 to 19 Minutes | 123 | 22.0% |
| 20 to 24 Minutes | 40 | 7.2% |
| 25 to 29 Minutes | 51 | 9.1% |
| 30 to 34 Minutes | 78 | 14.0% |
| 35 to 39 Minutes | 35 | 6.3% |
| 40 to 44 Minutes | 49 | 8.8% |
| 45 to 59 Minutes | 37 | 6.6% |
| 60 to 89 Minutes | 0 | 0.0% |
| 90 or more Minutes | 0 | 0.0% |
Commute Time by Sex in Contoocook
The most common commute times in Contoocook are 30 to 34 minutes (64 commuters, 21.8%) for males and 15 to 19 minutes (90 commuters, 34.0%) for females.
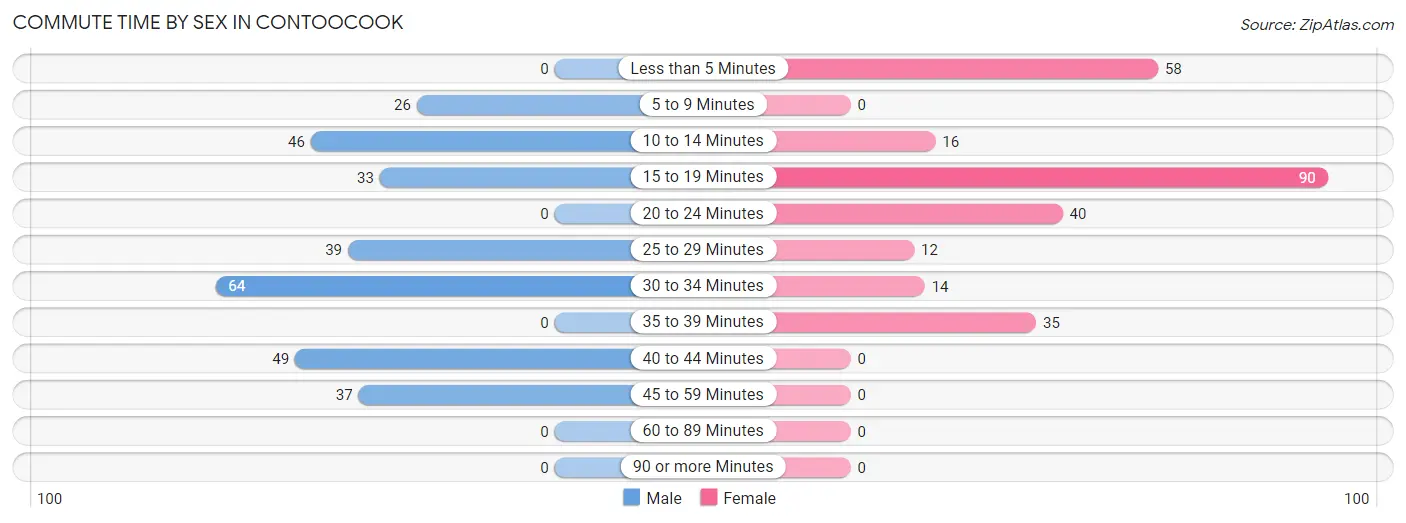
| Commute Time | Male | Female |
| Less than 5 Minutes | 0 (0.0%) | 58 (21.9%) |
| 5 to 9 Minutes | 26 (8.8%) | 0 (0.0%) |
| 10 to 14 Minutes | 46 (15.7%) | 16 (6.0%) |
| 15 to 19 Minutes | 33 (11.2%) | 90 (34.0%) |
| 20 to 24 Minutes | 0 (0.0%) | 40 (15.1%) |
| 25 to 29 Minutes | 39 (13.3%) | 12 (4.5%) |
| 30 to 34 Minutes | 64 (21.8%) | 14 (5.3%) |
| 35 to 39 Minutes | 0 (0.0%) | 35 (13.2%) |
| 40 to 44 Minutes | 49 (16.7%) | 0 (0.0%) |
| 45 to 59 Minutes | 37 (12.6%) | 0 (0.0%) |
| 60 to 89 Minutes | 0 (0.0%) | 0 (0.0%) |
| 90 or more Minutes | 0 (0.0%) | 0 (0.0%) |
Time of Departure to Work by Sex in Contoocook
The most frequent times of departure to work in Contoocook are 6:00 AM to 6:29 AM (89, 30.3%) for males and 8:00 AM to 8:29 AM (86, 32.5%) for females.
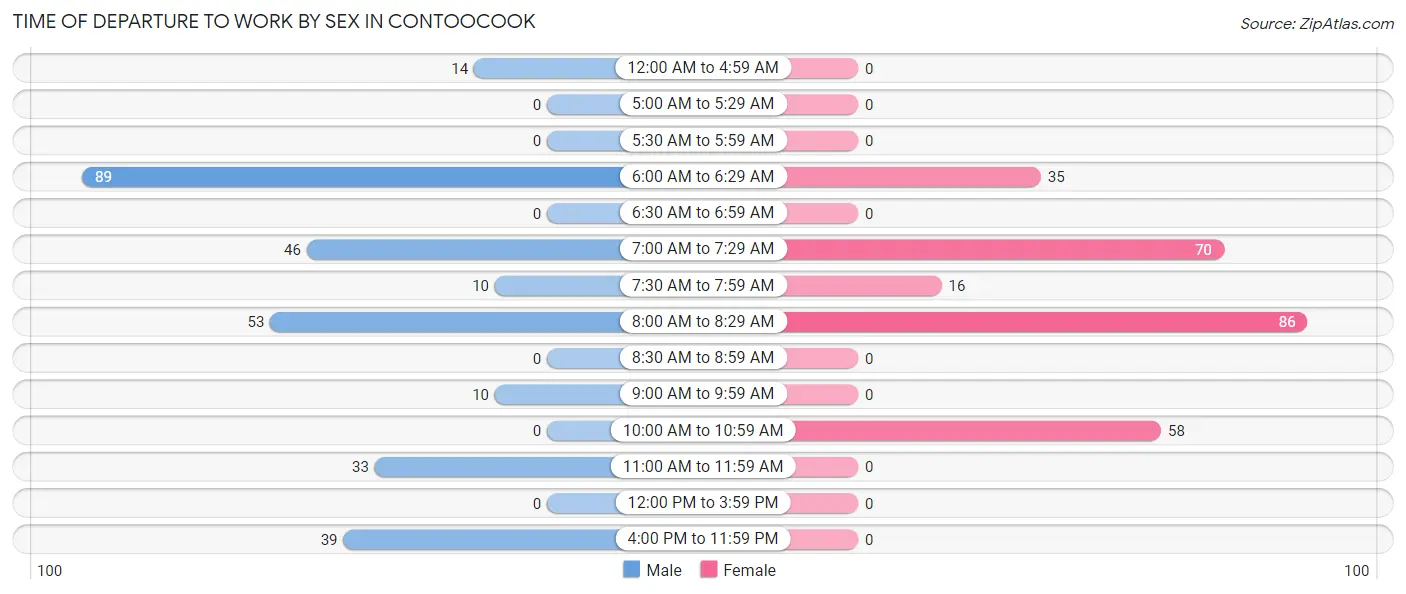
| Time of Departure | Male | Female |
| 12:00 AM to 4:59 AM | 14 (4.8%) | 0 (0.0%) |
| 5:00 AM to 5:29 AM | 0 (0.0%) | 0 (0.0%) |
| 5:30 AM to 5:59 AM | 0 (0.0%) | 0 (0.0%) |
| 6:00 AM to 6:29 AM | 89 (30.3%) | 35 (13.2%) |
| 6:30 AM to 6:59 AM | 0 (0.0%) | 0 (0.0%) |
| 7:00 AM to 7:29 AM | 46 (15.7%) | 70 (26.4%) |
| 7:30 AM to 7:59 AM | 10 (3.4%) | 16 (6.0%) |
| 8:00 AM to 8:29 AM | 53 (18.0%) | 86 (32.5%) |
| 8:30 AM to 8:59 AM | 0 (0.0%) | 0 (0.0%) |
| 9:00 AM to 9:59 AM | 10 (3.4%) | 0 (0.0%) |
| 10:00 AM to 10:59 AM | 0 (0.0%) | 58 (21.9%) |
| 11:00 AM to 11:59 AM | 33 (11.2%) | 0 (0.0%) |
| 12:00 PM to 3:59 PM | 0 (0.0%) | 0 (0.0%) |
| 4:00 PM to 11:59 PM | 39 (13.3%) | 0 (0.0%) |
| Total | 294 (100.0%) | 265 (100.0%) |
Housing Occupancy in Contoocook
Occupancy by Ownership in Contoocook
Of the total 539 dwellings in Contoocook, owner-occupied units account for 467 (86.6%), while renter-occupied units make up 72 (13.4%).
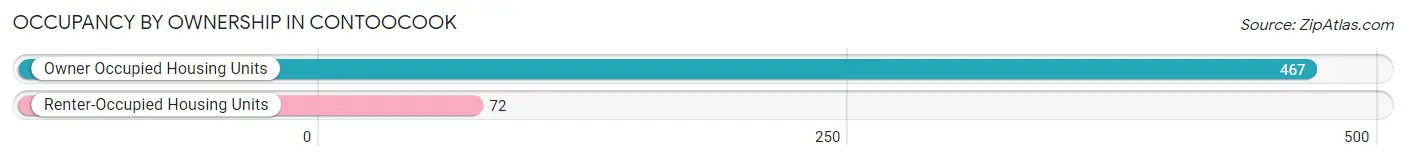
| Occupancy | # Housing Units | % Housing Units |
| Owner Occupied Housing Units | 467 | 86.6% |
| Renter-Occupied Housing Units | 72 | 13.4% |
| Total Occupied Housing Units | 539 | 100.0% |
Occupancy by Household Size in Contoocook
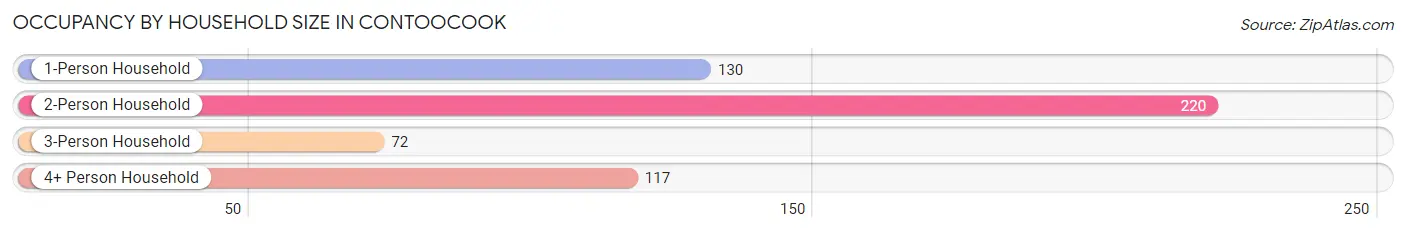
| Household Size | # Housing Units | % Housing Units |
| 1-Person Household | 130 | 24.1% |
| 2-Person Household | 220 | 40.8% |
| 3-Person Household | 72 | 13.4% |
| 4+ Person Household | 117 | 21.7% |
| Total Housing Units | 539 | 100.0% |
Occupancy by Ownership by Household Size in Contoocook
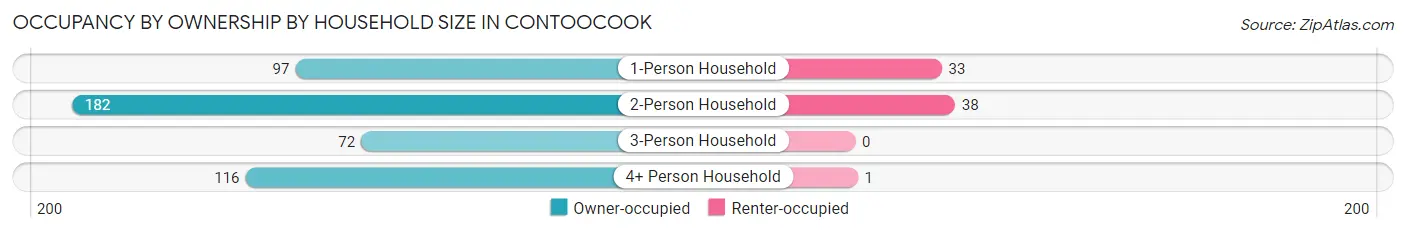
| Household Size | Owner-occupied | Renter-occupied |
| 1-Person Household | 97 (74.6%) | 33 (25.4%) |
| 2-Person Household | 182 (82.7%) | 38 (17.3%) |
| 3-Person Household | 72 (100.0%) | 0 (0.0%) |
| 4+ Person Household | 116 (99.2%) | 1 (0.9%) |
| Total Housing Units | 467 (86.6%) | 72 (13.4%) |
Occupancy by Educational Attainment in Contoocook
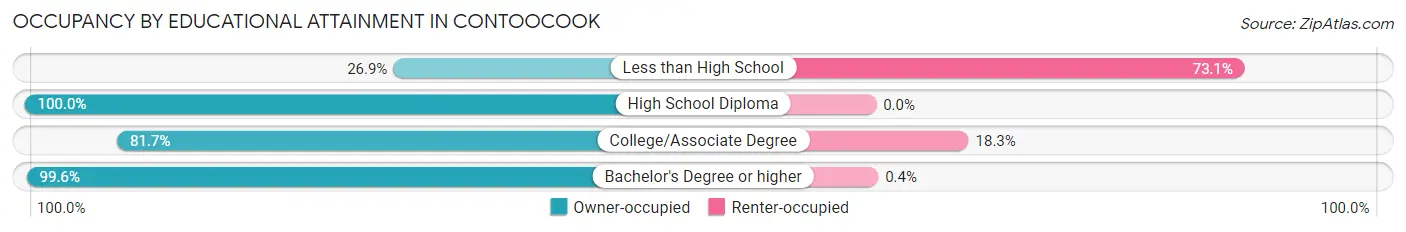
| Household Size | Owner-occupied | Renter-occupied |
| Less than High School | 14 (26.9%) | 38 (73.1%) |
| High School Diploma | 58 (100.0%) | 0 (0.0%) |
| College/Associate Degree | 147 (81.7%) | 33 (18.3%) |
| Bachelor's Degree or higher | 248 (99.6%) | 1 (0.4%) |
Occupancy by Age of Householder in Contoocook
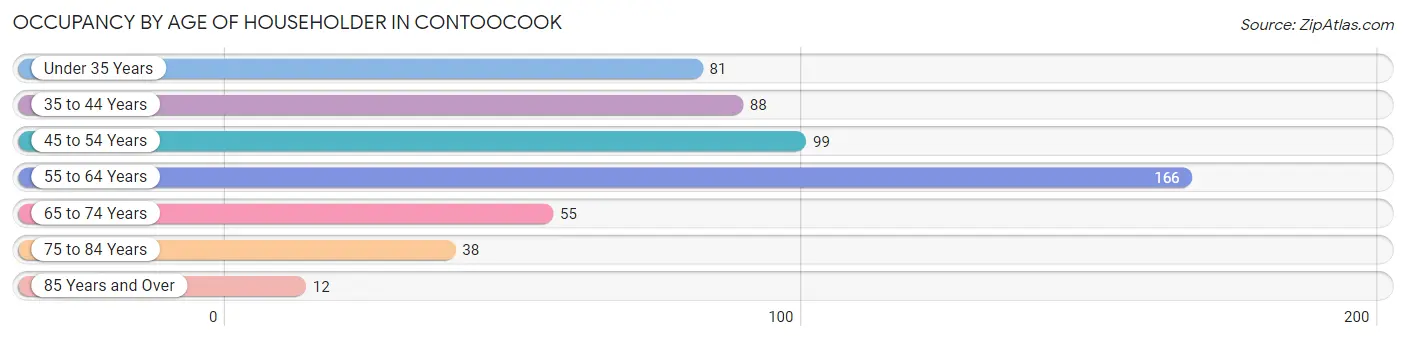
| Age Bracket | # Households | % Households |
| Under 35 Years | 81 | 15.0% |
| 35 to 44 Years | 88 | 16.3% |
| 45 to 54 Years | 99 | 18.4% |
| 55 to 64 Years | 166 | 30.8% |
| 65 to 74 Years | 55 | 10.2% |
| 75 to 84 Years | 38 | 7.0% |
| 85 Years and Over | 12 | 2.2% |
| Total | 539 | 100.0% |
Housing Finances in Contoocook
Median Income by Occupancy in Contoocook
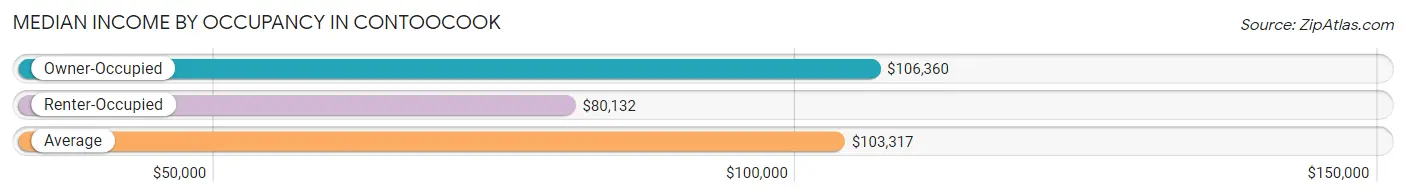
| Occupancy Type | # Households | Median Income |
| Owner-Occupied | 467 (86.6%) | $106,360 |
| Renter-Occupied | 72 (13.4%) | $80,132 |
| Average | 539 (100.0%) | $103,317 |
Occupancy by Householder Income Bracket in Contoocook
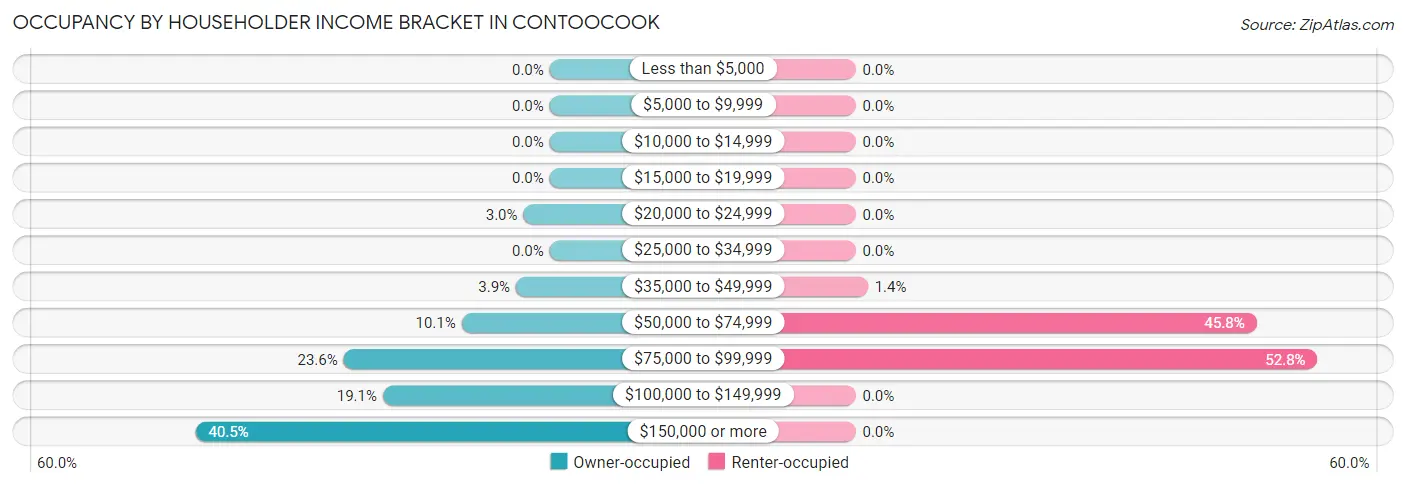
| Income Bracket | Owner-occupied | Renter-occupied |
| Less than $5,000 | 0 (0.0%) | 0 (0.0%) |
| $5,000 to $9,999 | 0 (0.0%) | 0 (0.0%) |
| $10,000 to $14,999 | 0 (0.0%) | 0 (0.0%) |
| $15,000 to $19,999 | 0 (0.0%) | 0 (0.0%) |
| $20,000 to $24,999 | 14 (3.0%) | 0 (0.0%) |
| $25,000 to $34,999 | 0 (0.0%) | 0 (0.0%) |
| $35,000 to $49,999 | 18 (3.8%) | 1 (1.4%) |
| $50,000 to $74,999 | 47 (10.1%) | 33 (45.8%) |
| $75,000 to $99,999 | 110 (23.5%) | 38 (52.8%) |
| $100,000 to $149,999 | 89 (19.1%) | 0 (0.0%) |
| $150,000 or more | 189 (40.5%) | 0 (0.0%) |
| Total | 467 (100.0%) | 72 (100.0%) |
Monthly Housing Cost Tiers in Contoocook
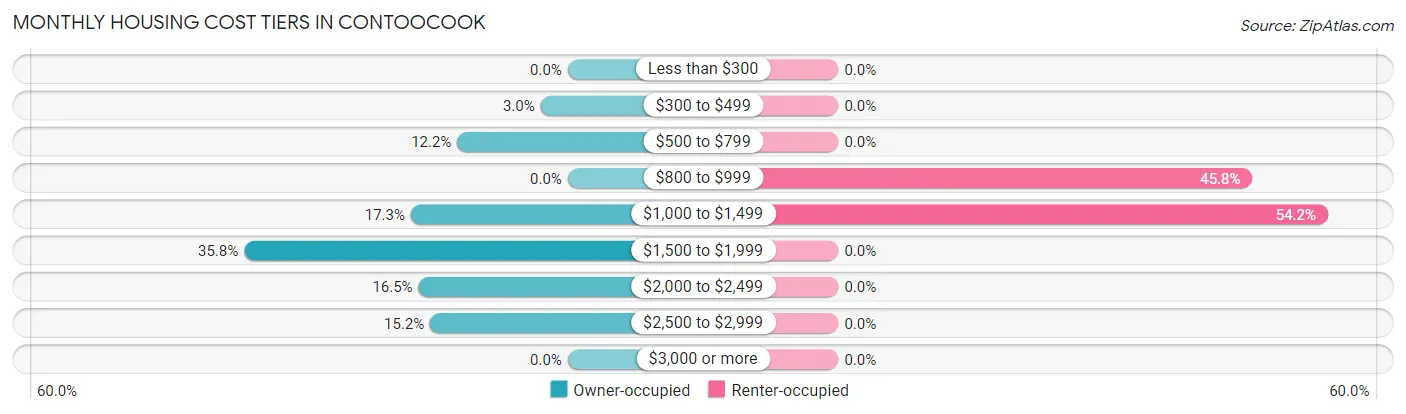
| Monthly Cost | Owner-occupied | Renter-occupied |
| Less than $300 | 0 (0.0%) | 0 (0.0%) |
| $300 to $499 | 14 (3.0%) | 0 (0.0%) |
| $500 to $799 | 57 (12.2%) | 0 (0.0%) |
| $800 to $999 | 0 (0.0%) | 33 (45.8%) |
| $1,000 to $1,499 | 81 (17.3%) | 39 (54.2%) |
| $1,500 to $1,999 | 167 (35.8%) | 0 (0.0%) |
| $2,000 to $2,499 | 77 (16.5%) | 0 (0.0%) |
| $2,500 to $2,999 | 71 (15.2%) | 0 (0.0%) |
| $3,000 or more | 0 (0.0%) | 0 (0.0%) |
| Total | 467 (100.0%) | 72 (100.0%) |
Physical Housing Characteristics in Contoocook
Housing Structures in Contoocook
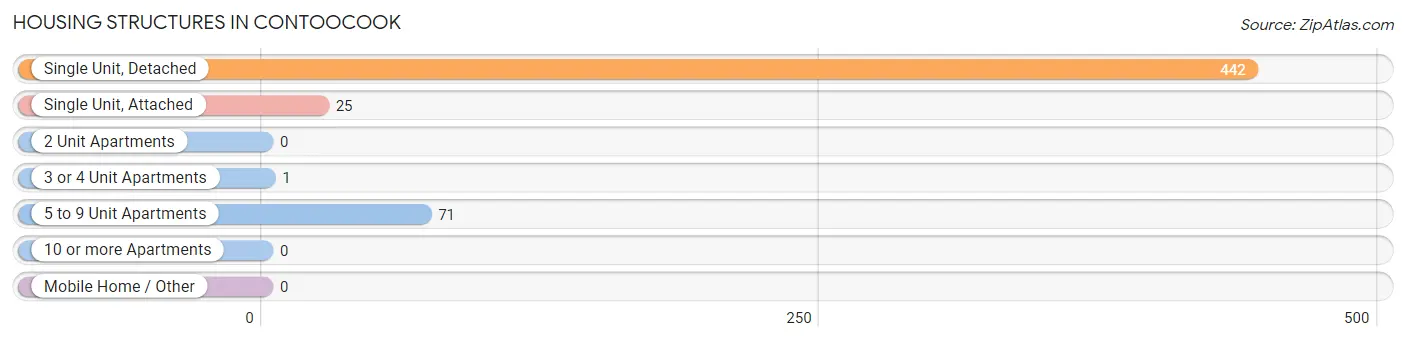
| Structure Type | # Housing Units | % Housing Units |
| Single Unit, Detached | 442 | 82.0% |
| Single Unit, Attached | 25 | 4.6% |
| 2 Unit Apartments | 0 | 0.0% |
| 3 or 4 Unit Apartments | 1 | 0.2% |
| 5 to 9 Unit Apartments | 71 | 13.2% |
| 10 or more Apartments | 0 | 0.0% |
| Mobile Home / Other | 0 | 0.0% |
| Total | 539 | 100.0% |
Housing Structures by Occupancy in Contoocook
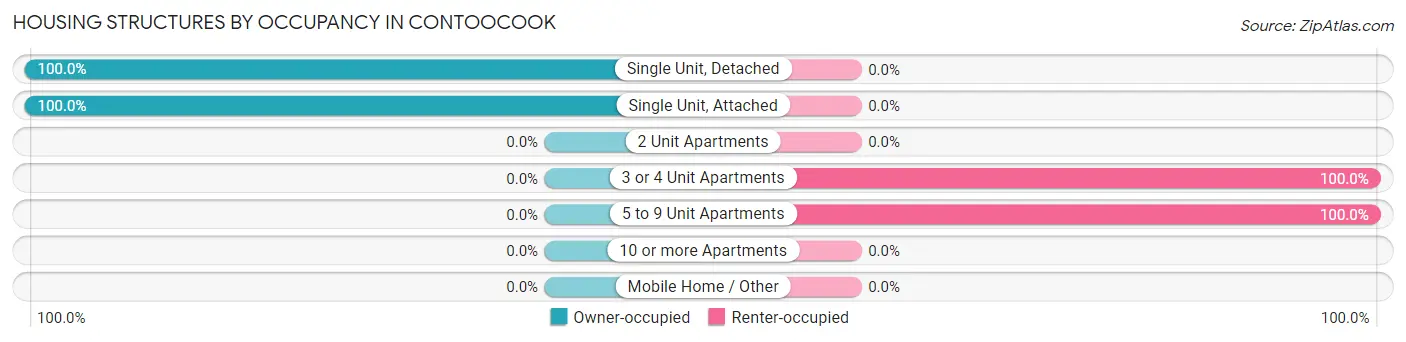
| Structure Type | Owner-occupied | Renter-occupied |
| Single Unit, Detached | 442 (100.0%) | 0 (0.0%) |
| Single Unit, Attached | 25 (100.0%) | 0 (0.0%) |
| 2 Unit Apartments | 0 (0.0%) | 0 (0.0%) |
| 3 or 4 Unit Apartments | 0 (0.0%) | 1 (100.0%) |
| 5 to 9 Unit Apartments | 0 (0.0%) | 71 (100.0%) |
| 10 or more Apartments | 0 (0.0%) | 0 (0.0%) |
| Mobile Home / Other | 0 (0.0%) | 0 (0.0%) |
| Total | 467 (86.6%) | 72 (13.4%) |
Housing Structures by Number of Rooms in Contoocook
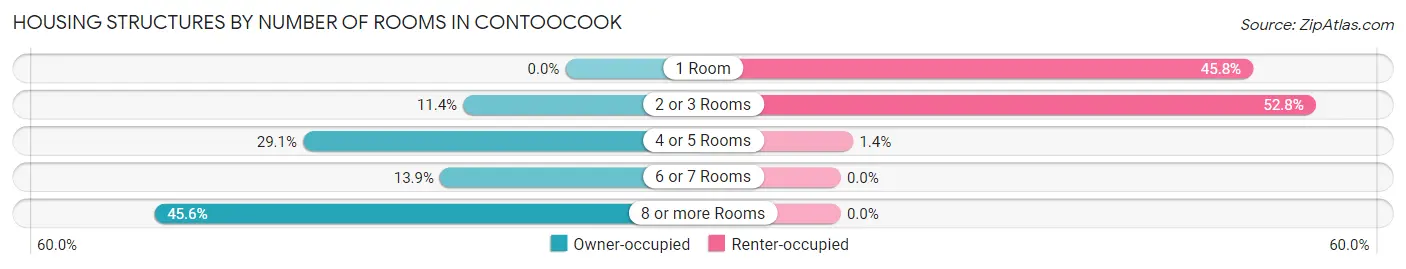
| Number of Rooms | Owner-occupied | Renter-occupied |
| 1 Room | 0 (0.0%) | 33 (45.8%) |
| 2 or 3 Rooms | 53 (11.4%) | 38 (52.8%) |
| 4 or 5 Rooms | 136 (29.1%) | 1 (1.4%) |
| 6 or 7 Rooms | 65 (13.9%) | 0 (0.0%) |
| 8 or more Rooms | 213 (45.6%) | 0 (0.0%) |
| Total | 467 (100.0%) | 72 (100.0%) |
Housing Structure by Heating Type in Contoocook
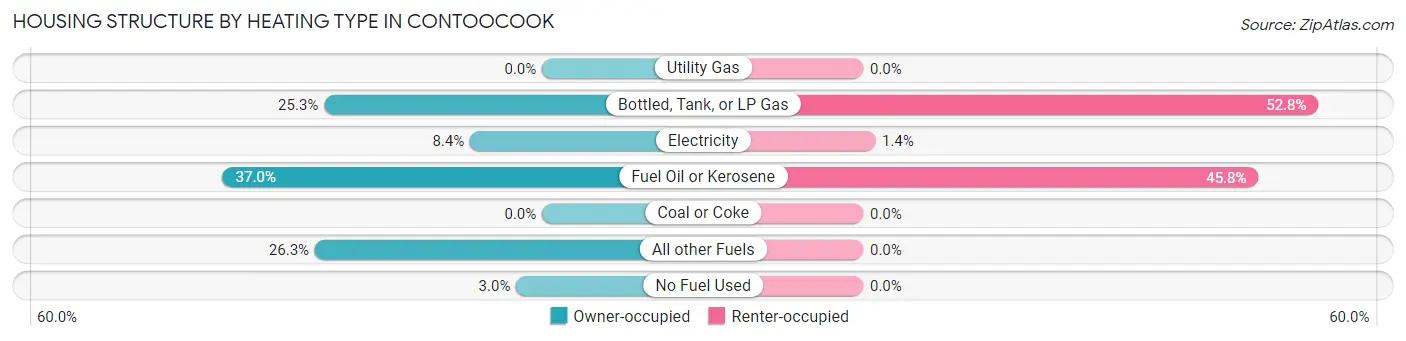
| Heating Type | Owner-occupied | Renter-occupied |
| Utility Gas | 0 (0.0%) | 0 (0.0%) |
| Bottled, Tank, or LP Gas | 118 (25.3%) | 38 (52.8%) |
| Electricity | 39 (8.4%) | 1 (1.4%) |
| Fuel Oil or Kerosene | 173 (37.0%) | 33 (45.8%) |
| Coal or Coke | 0 (0.0%) | 0 (0.0%) |
| All other Fuels | 123 (26.3%) | 0 (0.0%) |
| No Fuel Used | 14 (3.0%) | 0 (0.0%) |
| Total | 467 (100.0%) | 72 (100.0%) |
Household Vehicle Usage in Contoocook
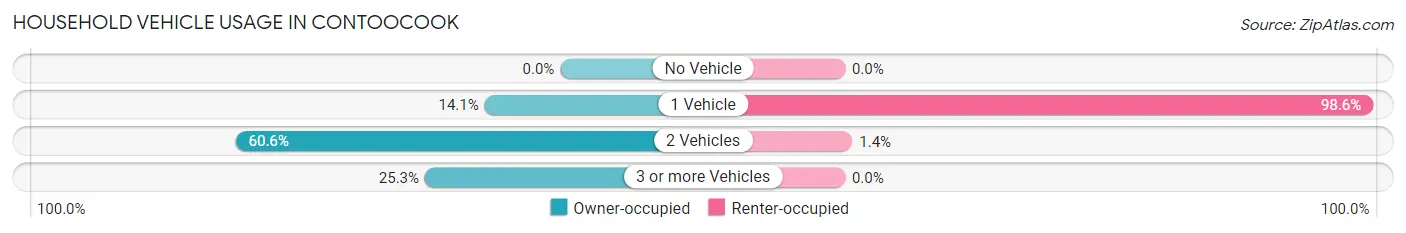
| Vehicles per Household | Owner-occupied | Renter-occupied |
| No Vehicle | 0 (0.0%) | 0 (0.0%) |
| 1 Vehicle | 66 (14.1%) | 71 (98.6%) |
| 2 Vehicles | 283 (60.6%) | 1 (1.4%) |
| 3 or more Vehicles | 118 (25.3%) | 0 (0.0%) |
| Total | 467 (100.0%) | 72 (100.0%) |
Real Estate & Mortgages in Contoocook
Real Estate and Mortgage Overview in Contoocook
| Characteristic | Without Mortgage | With Mortgage |
| Housing Units | 231 | 236 |
| Median Property Value | $303,400 | $285,700 |
| Median Household Income | $102,813 | $84 |
| Monthly Housing Costs | $1,258 | $0 |
| Real Estate Taxes | $9,390 | $0 |
Property Value by Mortgage Status in Contoocook
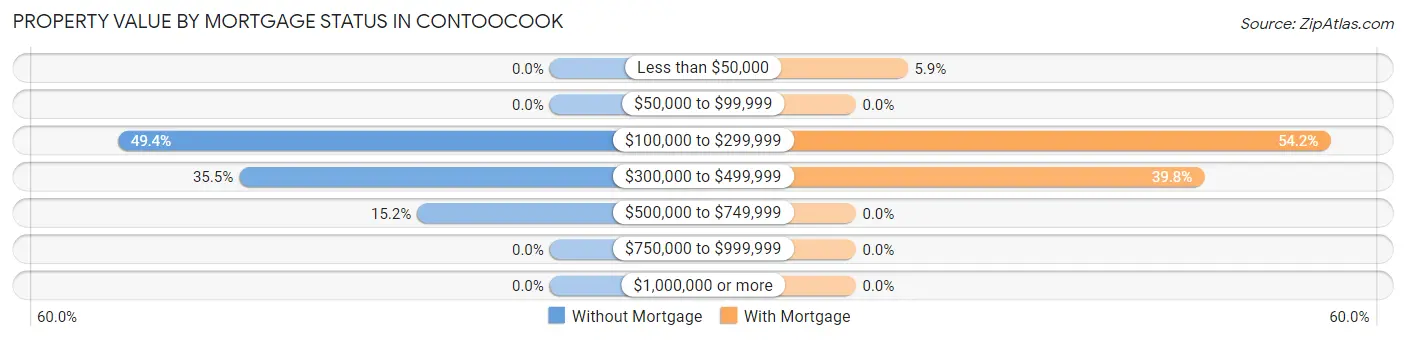
| Property Value | Without Mortgage | With Mortgage |
| Less than $50,000 | 0 (0.0%) | 14 (5.9%) |
| $50,000 to $99,999 | 0 (0.0%) | 0 (0.0%) |
| $100,000 to $299,999 | 114 (49.3%) | 128 (54.2%) |
| $300,000 to $499,999 | 82 (35.5%) | 94 (39.8%) |
| $500,000 to $749,999 | 35 (15.1%) | 0 (0.0%) |
| $750,000 to $999,999 | 0 (0.0%) | 0 (0.0%) |
| $1,000,000 or more | 0 (0.0%) | 0 (0.0%) |
| Total | 231 (100.0%) | 236 (100.0%) |
Household Income by Mortgage Status in Contoocook
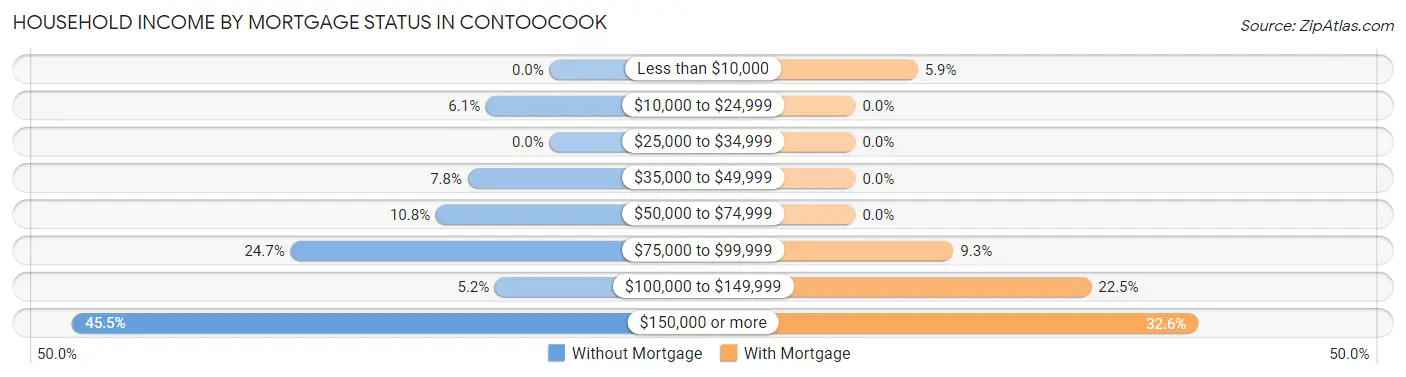
| Household Income | Without Mortgage | With Mortgage |
| Less than $10,000 | 0 (0.0%) | 14 (5.9%) |
| $10,000 to $24,999 | 14 (6.1%) | 0 (0.0%) |
| $25,000 to $34,999 | 0 (0.0%) | 0 (0.0%) |
| $35,000 to $49,999 | 18 (7.8%) | 0 (0.0%) |
| $50,000 to $74,999 | 25 (10.8%) | 0 (0.0%) |
| $75,000 to $99,999 | 57 (24.7%) | 22 (9.3%) |
| $100,000 to $149,999 | 12 (5.2%) | 53 (22.5%) |
| $150,000 or more | 105 (45.5%) | 77 (32.6%) |
| Total | 231 (100.0%) | 236 (100.0%) |
Property Value to Household Income Ratio in Contoocook
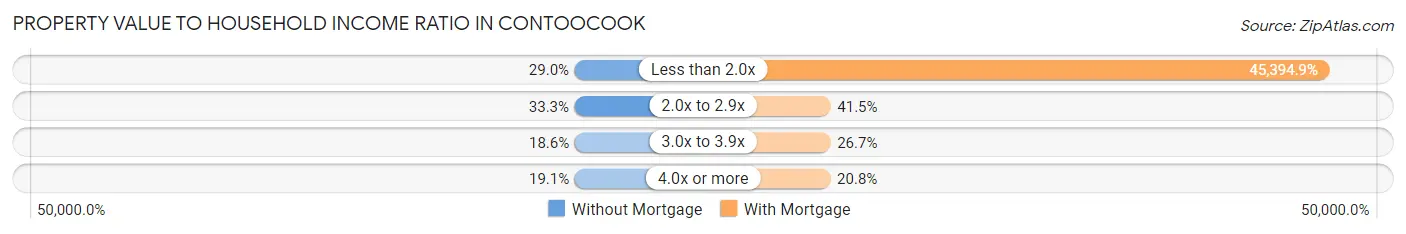
| Value-to-Income Ratio | Without Mortgage | With Mortgage |
| Less than 2.0x | 67 (29.0%) | 107,132 (45,394.9%) |
| 2.0x to 2.9x | 77 (33.3%) | 98 (41.5%) |
| 3.0x to 3.9x | 43 (18.6%) | 63 (26.7%) |
| 4.0x or more | 44 (19.1%) | 49 (20.8%) |
| Total | 231 (100.0%) | 236 (100.0%) |
Real Estate Taxes by Mortgage Status in Contoocook
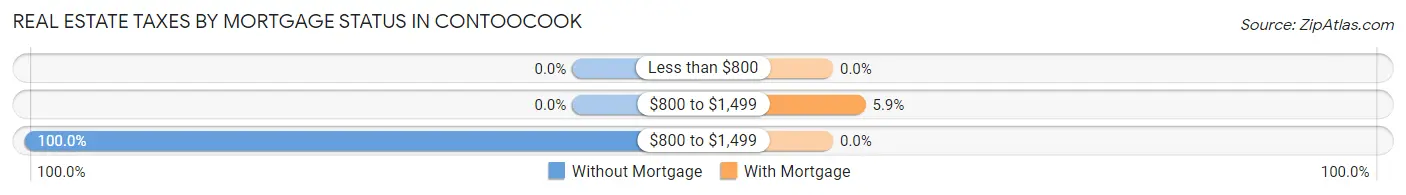
| Property Taxes | Without Mortgage | With Mortgage |
| Less than $800 | 0 (0.0%) | 0 (0.0%) |
| $800 to $1,499 | 0 (0.0%) | 14 (5.9%) |
| $800 to $1,499 | 231 (100.0%) | 0 (0.0%) |
| Total | 231 (100.0%) | 236 (100.0%) |
Health & Disability in Contoocook
Health Insurance Coverage by Age in Contoocook
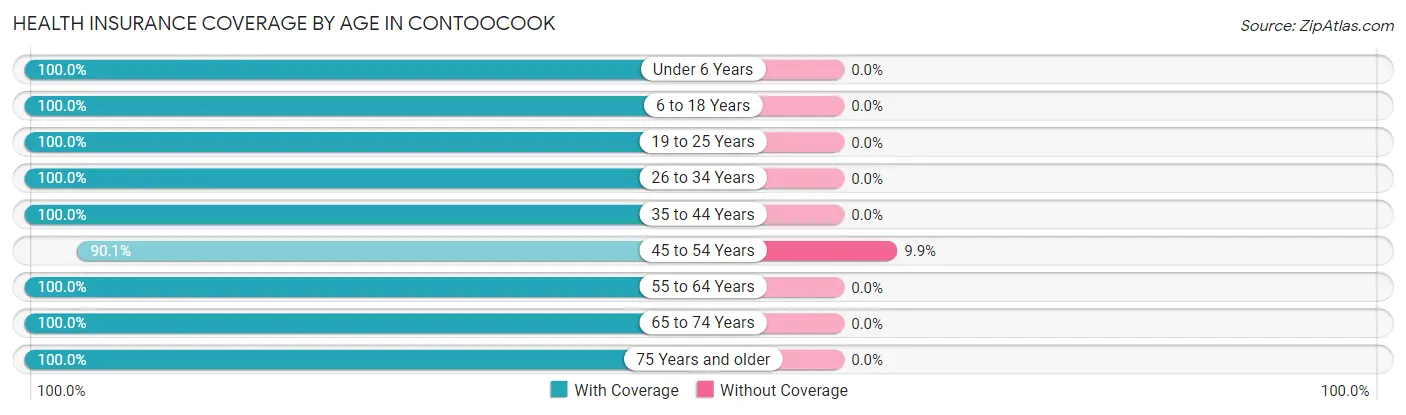
| Age Bracket | With Coverage | Without Coverage |
| Under 6 Years | 52 (100.0%) | 0 (0.0%) |
| 6 to 18 Years | 332 (100.0%) | 0 (0.0%) |
| 19 to 25 Years | 38 (100.0%) | 0 (0.0%) |
| 26 to 34 Years | 90 (100.0%) | 0 (0.0%) |
| 35 to 44 Years | 190 (100.0%) | 0 (0.0%) |
| 45 to 54 Years | 164 (90.1%) | 18 (9.9%) |
| 55 to 64 Years | 223 (100.0%) | 0 (0.0%) |
| 65 to 74 Years | 110 (100.0%) | 0 (0.0%) |
| 75 Years and older | 78 (100.0%) | 0 (0.0%) |
| Total | 1,277 (98.6%) | 18 (1.4%) |
Health Insurance Coverage by Citizenship Status in Contoocook
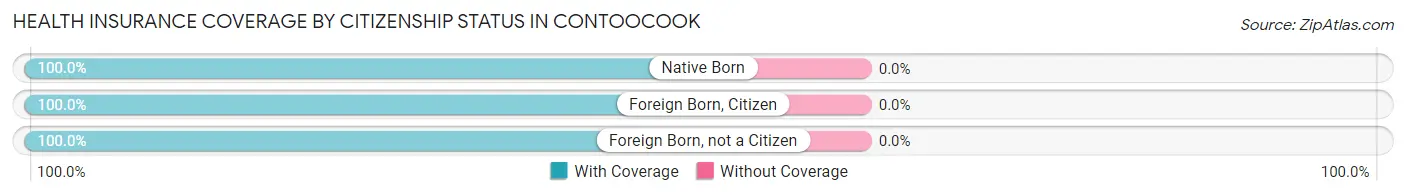
| Citizenship Status | With Coverage | Without Coverage |
| Native Born | 52 (100.0%) | 0 (0.0%) |
| Foreign Born, Citizen | 332 (100.0%) | 0 (0.0%) |
| Foreign Born, not a Citizen | 38 (100.0%) | 0 (0.0%) |
Health Insurance Coverage by Household Income in Contoocook
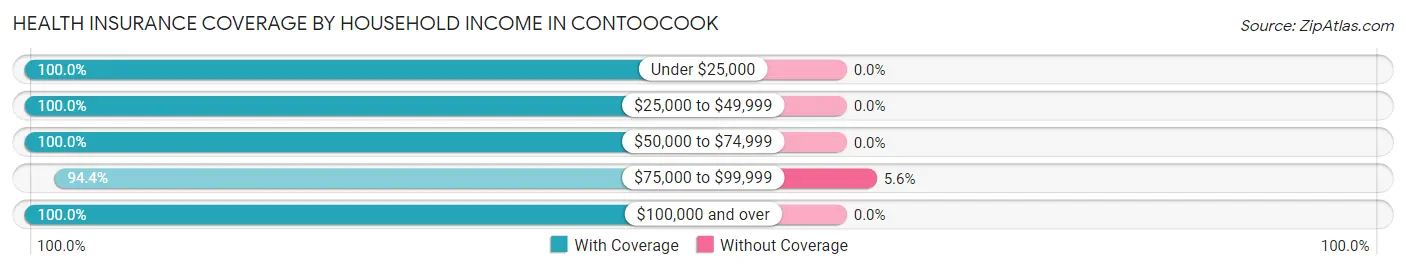
| Household Income | With Coverage | Without Coverage |
| Under $25,000 | 14 (100.0%) | 0 (0.0%) |
| $25,000 to $49,999 | 23 (100.0%) | 0 (0.0%) |
| $50,000 to $74,999 | 117 (100.0%) | 0 (0.0%) |
| $75,000 to $99,999 | 303 (94.4%) | 18 (5.6%) |
| $100,000 and over | 820 (100.0%) | 0 (0.0%) |
Public vs Private Health Insurance Coverage by Age in Contoocook
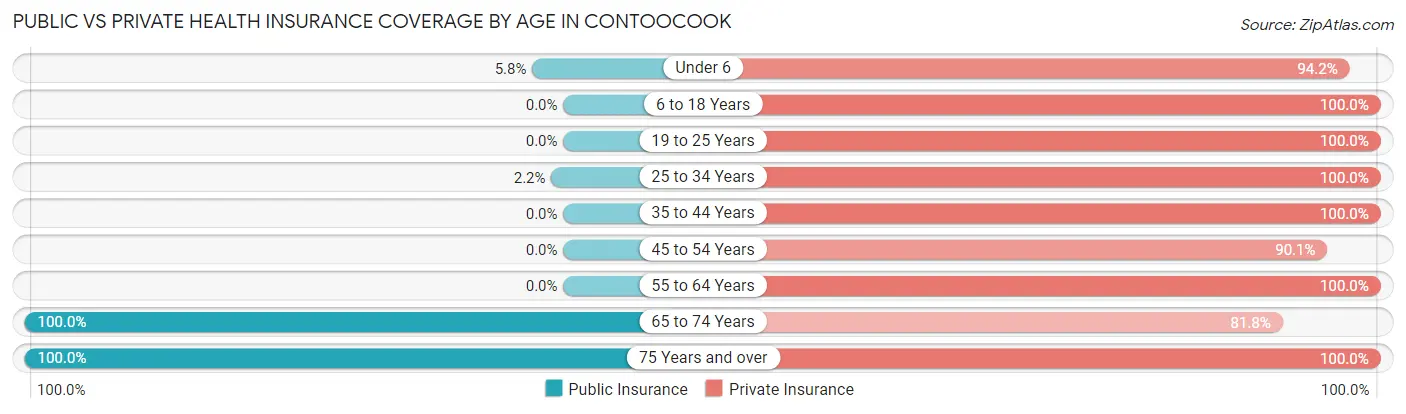
| Age Bracket | Public Insurance | Private Insurance |
| Under 6 | 3 (5.8%) | 49 (94.2%) |
| 6 to 18 Years | 0 (0.0%) | 332 (100.0%) |
| 19 to 25 Years | 0 (0.0%) | 38 (100.0%) |
| 25 to 34 Years | 2 (2.2%) | 90 (100.0%) |
| 35 to 44 Years | 0 (0.0%) | 190 (100.0%) |
| 45 to 54 Years | 0 (0.0%) | 164 (90.1%) |
| 55 to 64 Years | 0 (0.0%) | 223 (100.0%) |
| 65 to 74 Years | 110 (100.0%) | 90 (81.8%) |
| 75 Years and over | 78 (100.0%) | 78 (100.0%) |
| Total | 193 (14.9%) | 1,254 (96.8%) |
Disability Status by Sex by Age in Contoocook
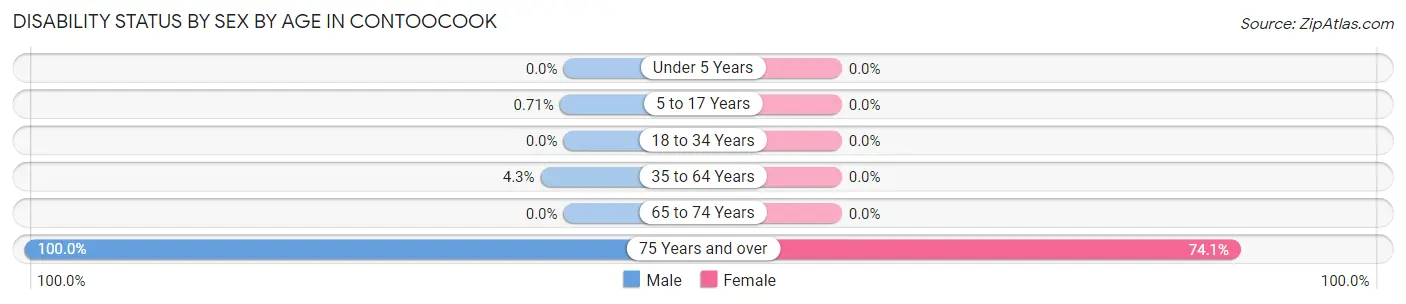
| Age Bracket | Male | Female |
| Under 5 Years | 0 (0.0%) | 0 (0.0%) |
| 5 to 17 Years | 1 (0.7%) | 0 (0.0%) |
| 18 to 34 Years | 0 (0.0%) | 0 (0.0%) |
| 35 to 64 Years | 14 (4.3%) | 0 (0.0%) |
| 65 to 74 Years | 0 (0.0%) | 0 (0.0%) |
| 75 Years and over | 24 (100.0%) | 40 (74.1%) |
Disability Class by Sex by Age in Contoocook
Disability Class: Hearing Difficulty
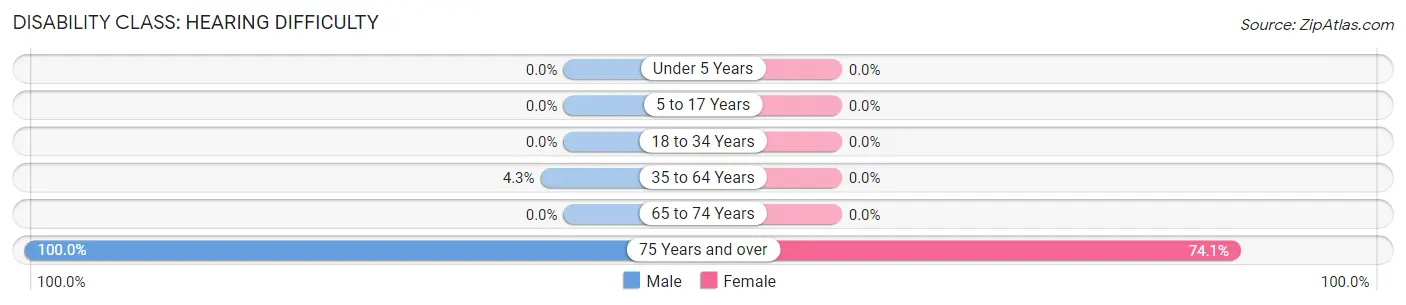
| Age Bracket | Male | Female |
| Under 5 Years | 0 (0.0%) | 0 (0.0%) |
| 5 to 17 Years | 0 (0.0%) | 0 (0.0%) |
| 18 to 34 Years | 0 (0.0%) | 0 (0.0%) |
| 35 to 64 Years | 14 (4.3%) | 0 (0.0%) |
| 65 to 74 Years | 0 (0.0%) | 0 (0.0%) |
| 75 Years and over | 24 (100.0%) | 40 (74.1%) |
Disability Class: Vision Difficulty
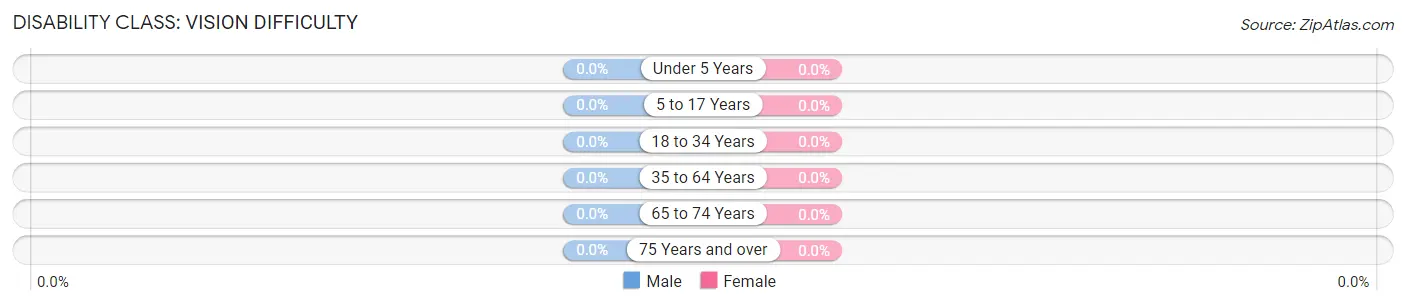
| Age Bracket | Male | Female |
| Under 5 Years | 0 (0.0%) | 0 (0.0%) |
| 5 to 17 Years | 0 (0.0%) | 0 (0.0%) |
| 18 to 34 Years | 0 (0.0%) | 0 (0.0%) |
| 35 to 64 Years | 0 (0.0%) | 0 (0.0%) |
| 65 to 74 Years | 0 (0.0%) | 0 (0.0%) |
| 75 Years and over | 0 (0.0%) | 0 (0.0%) |
Disability Class: Cognitive Difficulty
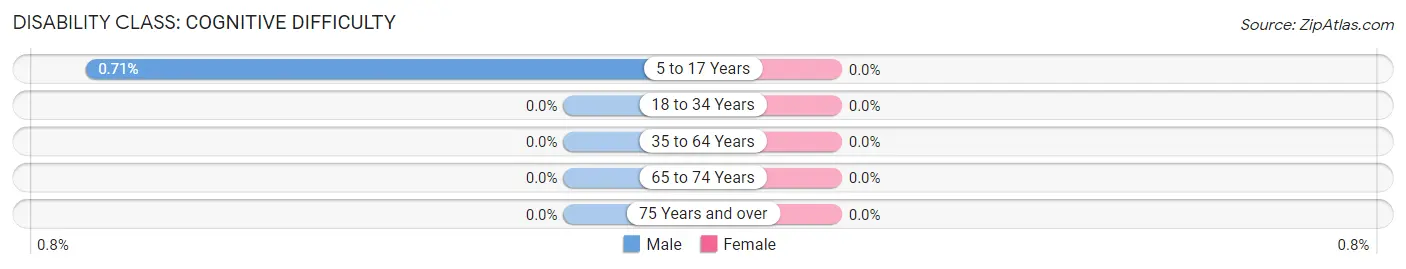
| Age Bracket | Male | Female |
| 5 to 17 Years | 1 (0.7%) | 0 (0.0%) |
| 18 to 34 Years | 0 (0.0%) | 0 (0.0%) |
| 35 to 64 Years | 0 (0.0%) | 0 (0.0%) |
| 65 to 74 Years | 0 (0.0%) | 0 (0.0%) |
| 75 Years and over | 0 (0.0%) | 0 (0.0%) |
Disability Class: Ambulatory Difficulty
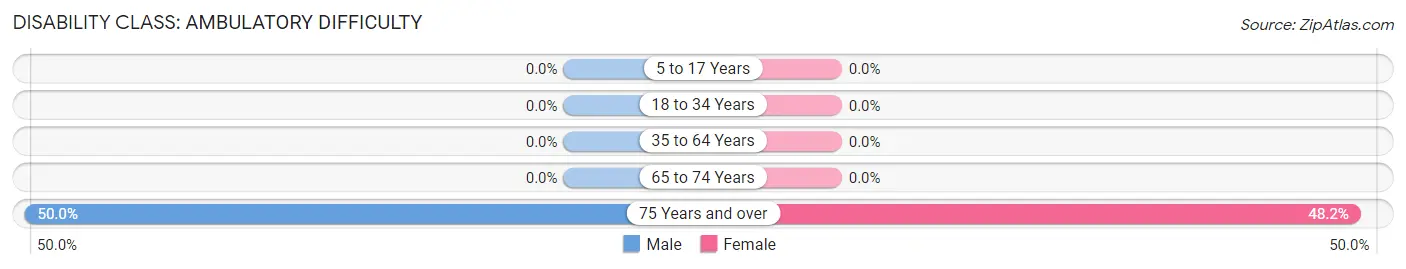
| Age Bracket | Male | Female |
| 5 to 17 Years | 0 (0.0%) | 0 (0.0%) |
| 18 to 34 Years | 0 (0.0%) | 0 (0.0%) |
| 35 to 64 Years | 0 (0.0%) | 0 (0.0%) |
| 65 to 74 Years | 0 (0.0%) | 0 (0.0%) |
| 75 Years and over | 12 (50.0%) | 26 (48.1%) |
Disability Class: Self-Care Difficulty
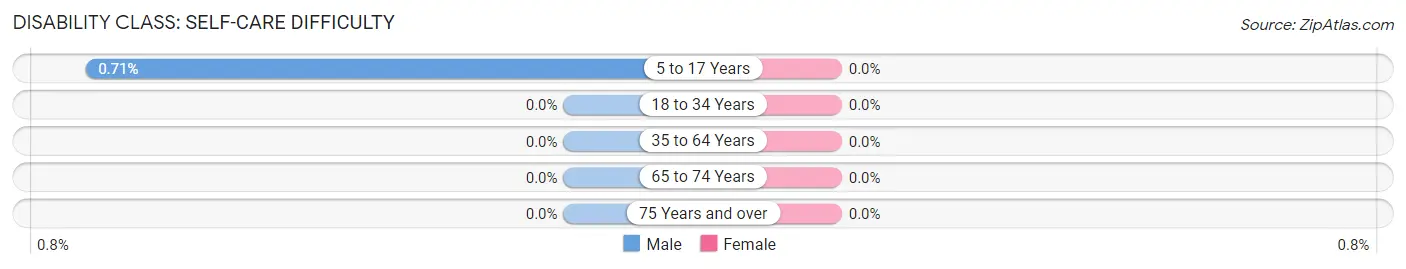
| Age Bracket | Male | Female |
| 5 to 17 Years | 1 (0.7%) | 0 (0.0%) |
| 18 to 34 Years | 0 (0.0%) | 0 (0.0%) |
| 35 to 64 Years | 0 (0.0%) | 0 (0.0%) |
| 65 to 74 Years | 0 (0.0%) | 0 (0.0%) |
| 75 Years and over | 0 (0.0%) | 0 (0.0%) |
Technology Access in Contoocook
Computing Device Access in Contoocook
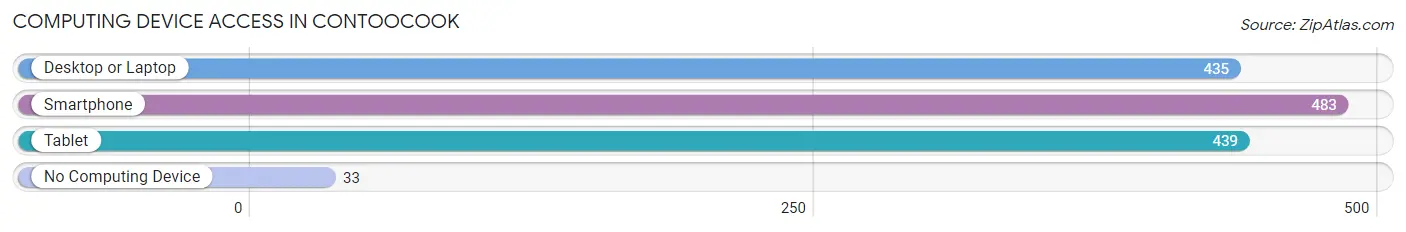
| Device Type | # Households | % Households |
| Desktop or Laptop | 435 | 80.7% |
| Smartphone | 483 | 89.6% |
| Tablet | 439 | 81.5% |
| No Computing Device | 33 | 6.1% |
| Total | 539 | 100.0% |
Internet Access in Contoocook
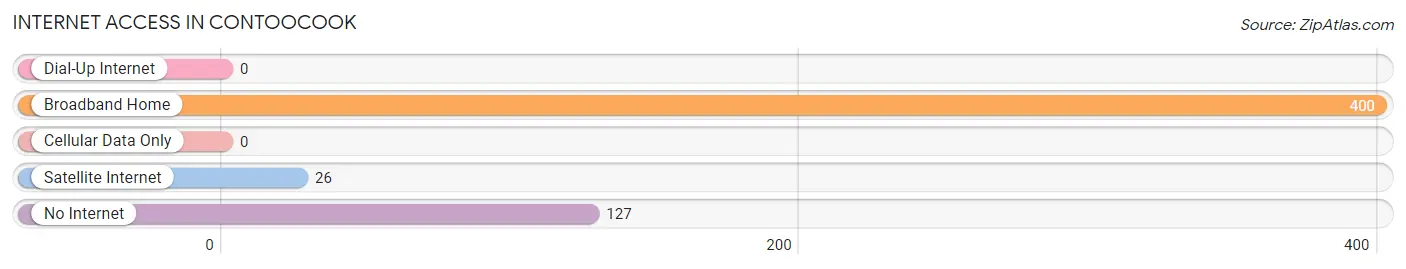
| Internet Type | # Households | % Households |
| Dial-Up Internet | 0 | 0.0% |
| Broadband Home | 400 | 74.2% |
| Cellular Data Only | 0 | 0.0% |
| Satellite Internet | 26 | 4.8% |
| No Internet | 127 | 23.6% |
| Total | 539 | 100.0% |
Contoocook Summary
Contoocook, New Hampshire is a small town located in Merrimack County, in the southern part of the state. It is situated on the Contoocook River, which is a tributary of the Merrimack River. The town was first settled in 1735 and was incorporated in 1767. The population of Contoocook was 2,845 as of the 2010 census.
History
Contoocook was first settled in 1735 by a group of settlers from Massachusetts. The town was originally known as "Contoocook Plantation" and was part of the Massachusetts Bay Colony. In 1767, the town was incorporated as Contoocook, New Hampshire.
The town was named after the Contoocook River, which was named by the Abenaki Indians. The name is believed to mean "place of the river with many bends".
The town was an important stop on the stagecoach route between Concord and Boston. The stagecoaches would stop at the Contoocook House, which was built in 1790 and is now a historic landmark.
The town was also an important stop on the railroad line between Concord and Boston. The railroad line was built in 1848 and was an important part of the town's economy.
Geography
Contoocook is located in Merrimack County, in the southern part of the state. It is situated on the Contoocook River, which is a tributary of the Merrimack River. The town is bordered by Hopkinton to the north, Henniker to the east, Warner to the south, and Webster to the west.
The town has a total area of 16.2 square miles, of which 15.9 square miles is land and 0.3 square miles is water. The highest point in the town is the summit of Mount Kearsarge, which has an elevation of 1,937 feet.
Economy
The economy of Contoocook is largely based on agriculture and tourism. The town is home to several farms, including the Contoocook Creamery, which produces artisanal cheeses.
The town is also home to several small businesses, including a brewery, a winery, and a distillery. The town is also home to several antique shops and art galleries.
Tourism is an important part of the town's economy. The town is home to several historic sites, including the Contoocook House, which was built in 1790 and is now a historic landmark. The town is also home to several parks and recreational areas, including the Contoocook River Park and the Contoocook River Trail.
Demographics
As of the 2010 census, the population of Contoocook was 2,845. The racial makeup of the town was 97.2% White, 0.7% African American, 0.3% Native American, 0.4% Asian, 0.1% Pacific Islander, 0.3% from other races, and 1.0% from two or more races. Hispanic or Latino of any race were 1.2% of the population.
The median household income in the town was $60,938, and the median family income was $71,250. The per capita income in the town was $27,945. About 4.3% of families and 5.7% of the population were below the poverty line.
Common Questions
What is Per Capita Income in Contoocook?
Per Capita income in Contoocook is $72,362.
What is the Median Family Income in Contoocook?
Median Family Income in Contoocook is $119,471.
What is the Median Household income in Contoocook?
Median Household Income in Contoocook is $103,317.
What is Income or Wage Gap in Contoocook?
Income or Wage Gap in Contoocook is 31.7%.
Women in Contoocook earn 68.3 cents for every dollar earned by a man.
What is Inequality or Gini Index in Contoocook?
Inequality or Gini Index in Contoocook is 0.46.
What is the Total Population of Contoocook?
Total Population of Contoocook is 1,295.
What is the Total Male Population of Contoocook?
Total Male Population of Contoocook is 717.
What is the Total Female Population of Contoocook?
Total Female Population of Contoocook is 578.
What is the Ratio of Males per 100 Females in Contoocook?
There are 124.05 Males per 100 Females in Contoocook.
What is the Ratio of Females per 100 Males in Contoocook?
There are 80.61 Females per 100 Males in Contoocook.
What is the Median Population Age in Contoocook?
Median Population Age in Contoocook is 43.6 Years.
What is the Average Family Size in Contoocook
Average Family Size in Contoocook is 3.1 People.
What is the Average Household Size in Contoocook
Average Household Size in Contoocook is 2.4 People.
How Large is the Labor Force in Contoocook?
There are 817 People in the Labor Forcein in Contoocook.
What is the Percentage of People in the Labor Force in Contoocook?
79.6% of People are in the Labor Force in Contoocook.
What is the Unemployment Rate in Contoocook?
Unemployment Rate in Contoocook is 2.2%.