Batavia, OH Map & Demographics
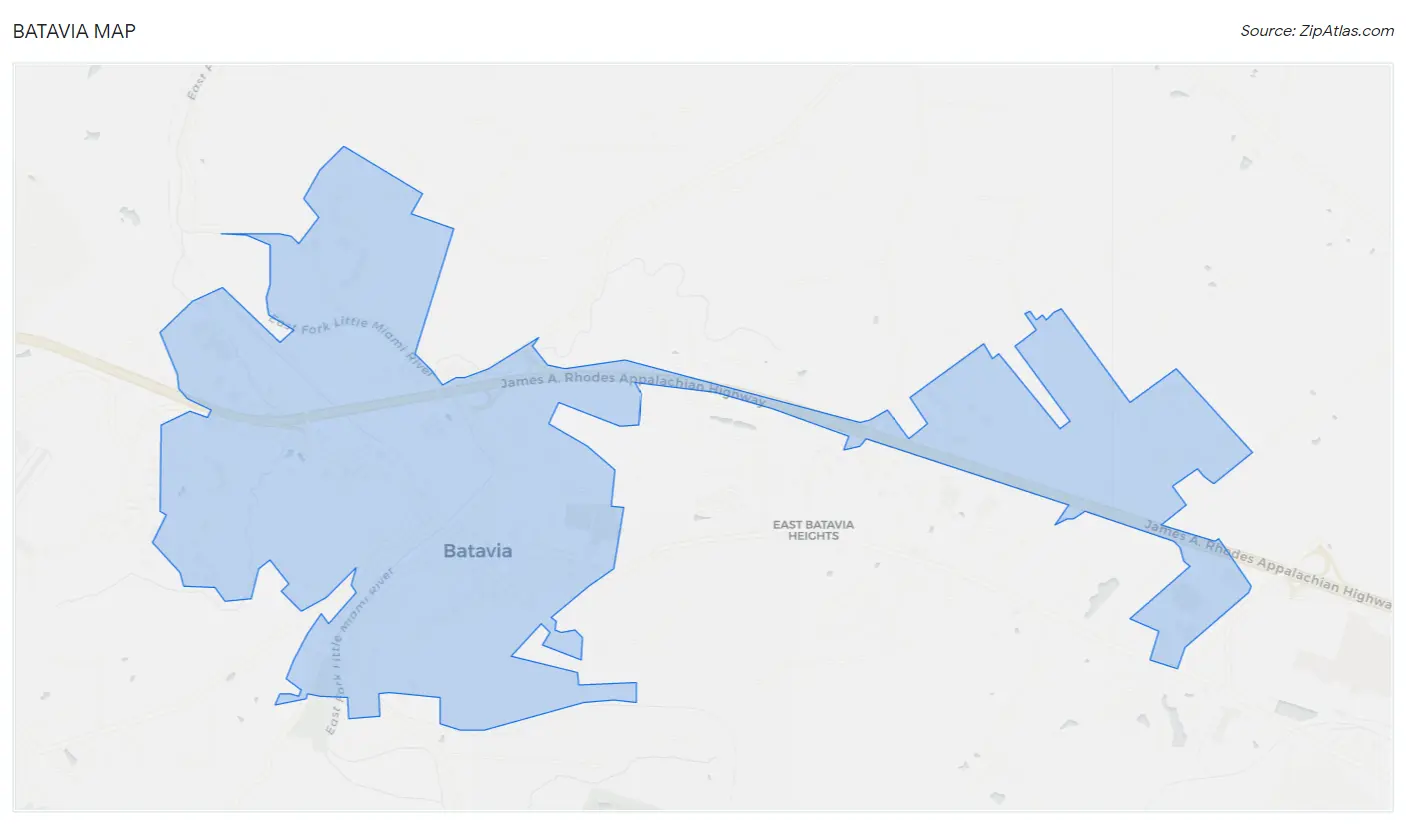
Batavia Map
Batavia Overview
$23,930
PER CAPITA INCOME
$66,343
AVG FAMILY INCOME
$55,169
AVG HOUSEHOLD INCOME
0.8%
WAGE / INCOME GAP [ % ]
99.2¢/ $1
WAGE / INCOME GAP [ $ ]
0.38
INEQUALITY / GINI INDEX
2,606
TOTAL POPULATION
1,403
MALE POPULATION
1,203
FEMALE POPULATION
116.63
MALES / 100 FEMALES
85.74
FEMALES / 100 MALES
38.3
MEDIAN AGE
3.2
AVG FAMILY SIZE
2.6
AVG HOUSEHOLD SIZE
1,023
LABOR FORCE [ PEOPLE ]
46.7%
PERCENT IN LABOR FORCE
16.1%
UNEMPLOYMENT RATE
Batavia Zip Codes
Batavia Area Codes
Income in Batavia
Income Overview in Batavia
Per Capita Income in Batavia is $23,930, while median incomes of families and households are $66,343 and $55,169 respectively.
| Characteristic | Number | Measure |
| Per Capita Income | 2,606 | $23,930 |
| Median Family Income | 511 | $66,343 |
| Mean Family Income | 511 | $73,226 |
| Median Household Income | 839 | $55,169 |
| Mean Household Income | 839 | $63,354 |
| Income Deficit | 511 | $0 |
| Wage / Income Gap (%) | 2,606 | 0.81% |
| Wage / Income Gap ($) | 2,606 | 99.19¢ per $1 |
| Gini / Inequality Index | 2,606 | 0.38 |
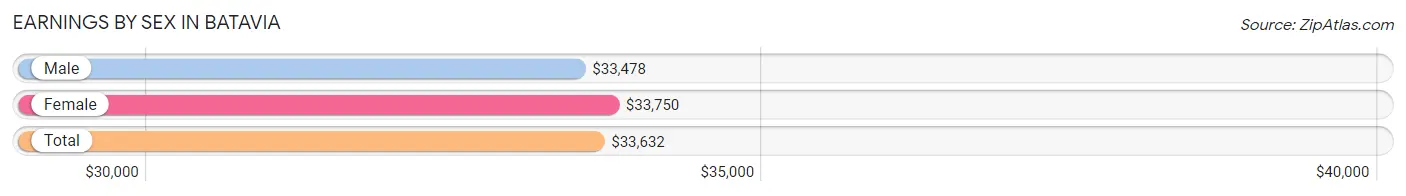
Earnings by Sex in Batavia
Average Earnings in Batavia are $33,632, $33,478 for men and $33,750 for women, a difference of 0.8%.
| Sex | Number | Average Earnings |
| Male | 610 (54.4%) | $33,478 |
| Female | 512 (45.6%) | $33,750 |
| Total | 1,122 (100.0%) | $33,632 |
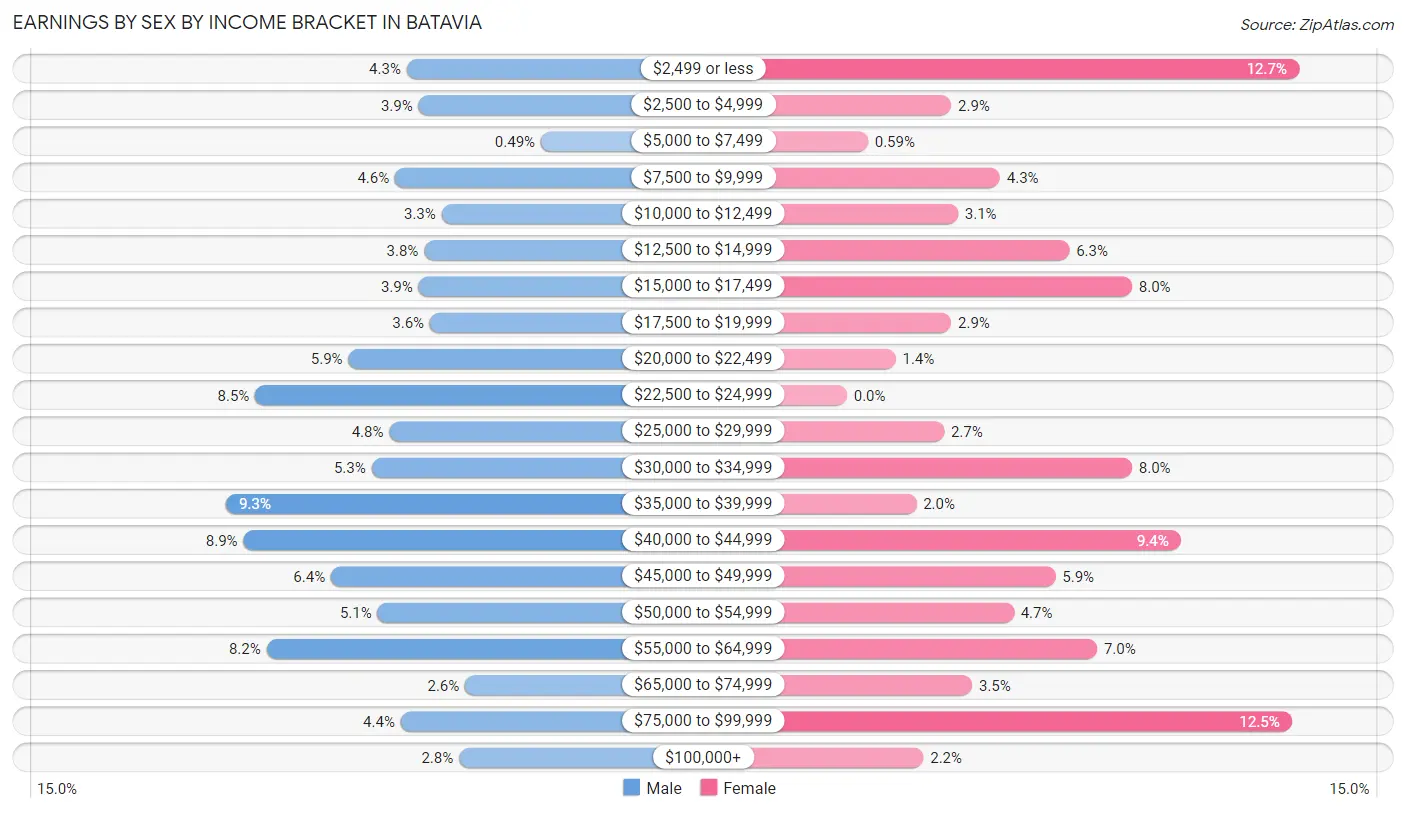
Earnings by Sex by Income Bracket in Batavia
The most common earnings brackets in Batavia are $35,000 to $39,999 for men (57 | 9.3%) and $2,499 or less for women (65 | 12.7%).
| Income | Male | Female |
| $2,499 or less | 26 (4.3%) | 65 (12.7%) |
| $2,500 to $4,999 | 24 (3.9%) | 15 (2.9%) |
| $5,000 to $7,499 | 3 (0.5%) | 3 (0.6%) |
| $7,500 to $9,999 | 28 (4.6%) | 22 (4.3%) |
| $10,000 to $12,499 | 20 (3.3%) | 16 (3.1%) |
| $12,500 to $14,999 | 23 (3.8%) | 32 (6.2%) |
| $15,000 to $17,499 | 24 (3.9%) | 41 (8.0%) |
| $17,500 to $19,999 | 22 (3.6%) | 15 (2.9%) |
| $20,000 to $22,499 | 36 (5.9%) | 7 (1.4%) |
| $22,500 to $24,999 | 52 (8.5%) | 0 (0.0%) |
| $25,000 to $29,999 | 29 (4.8%) | 14 (2.7%) |
| $30,000 to $34,999 | 32 (5.2%) | 41 (8.0%) |
| $35,000 to $39,999 | 57 (9.3%) | 10 (1.9%) |
| $40,000 to $44,999 | 54 (8.8%) | 48 (9.4%) |
| $45,000 to $49,999 | 39 (6.4%) | 30 (5.9%) |
| $50,000 to $54,999 | 31 (5.1%) | 24 (4.7%) |
| $55,000 to $64,999 | 50 (8.2%) | 36 (7.0%) |
| $65,000 to $74,999 | 16 (2.6%) | 18 (3.5%) |
| $75,000 to $99,999 | 27 (4.4%) | 64 (12.5%) |
| $100,000+ | 17 (2.8%) | 11 (2.1%) |
| Total | 610 (100.0%) | 512 (100.0%) |
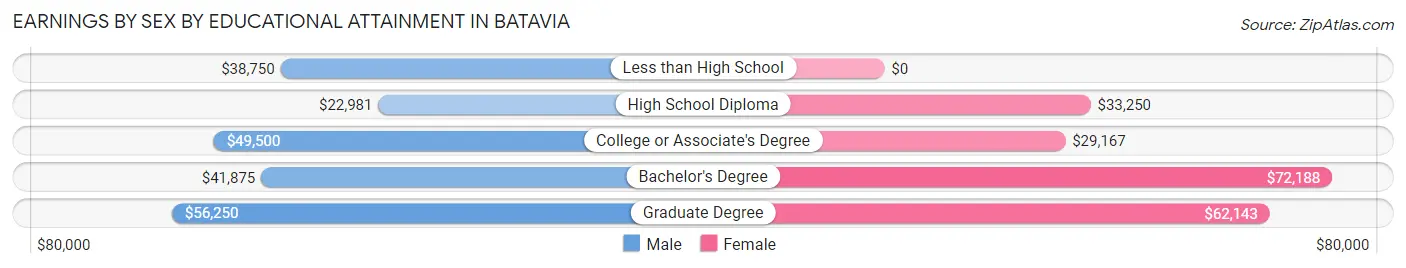
Earnings by Sex by Educational Attainment in Batavia
Average earnings in Batavia are $37,083 for men and $36,500 for women, a difference of 1.6%. Men with an educational attainment of graduate degree enjoy the highest average annual earnings of $56,250, while those with high school diploma education earn the least with $22,981. Women with an educational attainment of bachelor's degree earn the most with the average annual earnings of $72,188, while those with college or associate's degree education have the smallest earnings of $29,167.
| Educational Attainment | Male Income | Female Income |
| Less than High School | $38,750 | $0 |
| High School Diploma | $22,981 | $33,250 |
| College or Associate's Degree | $49,500 | $29,167 |
| Bachelor's Degree | $41,875 | $72,188 |
| Graduate Degree | $56,250 | $62,143 |
| Total | $37,083 | $36,500 |
Family Income in Batavia
Family Income Brackets in Batavia
According to the Batavia family income data, there are 143 families falling into the $50,000 to $74,999 income range, which is the most common income bracket and makes up 28.0% of all families. Conversely, the $10,000 to $14,999 income bracket is the least frequent group with only 3 families (0.6%) belonging to this category.
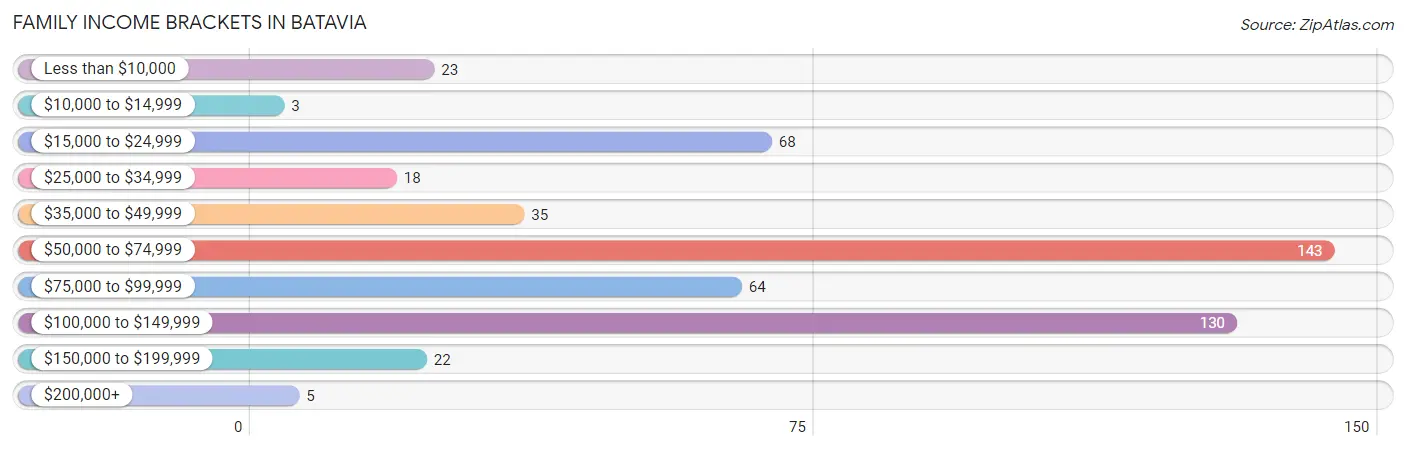
| Income Bracket | # Families | % Families |
| Less than $10,000 | 23 | 4.5% |
| $10,000 to $14,999 | 3 | 0.6% |
| $15,000 to $24,999 | 68 | 13.3% |
| $25,000 to $34,999 | 18 | 3.5% |
| $35,000 to $49,999 | 35 | 6.8% |
| $50,000 to $74,999 | 143 | 28.0% |
| $75,000 to $99,999 | 64 | 12.5% |
| $100,000 to $149,999 | 130 | 25.4% |
| $150,000 to $199,999 | 22 | 4.3% |
| $200,000+ | 5 | 1.0% |
Family Income by Famaliy Size in Batavia
5-person families (24 | 4.7%) account for the highest median family income in Batavia with $123,750 per family, while 2-person families (227 | 44.4%) have the highest median income of $34,062 per family member.
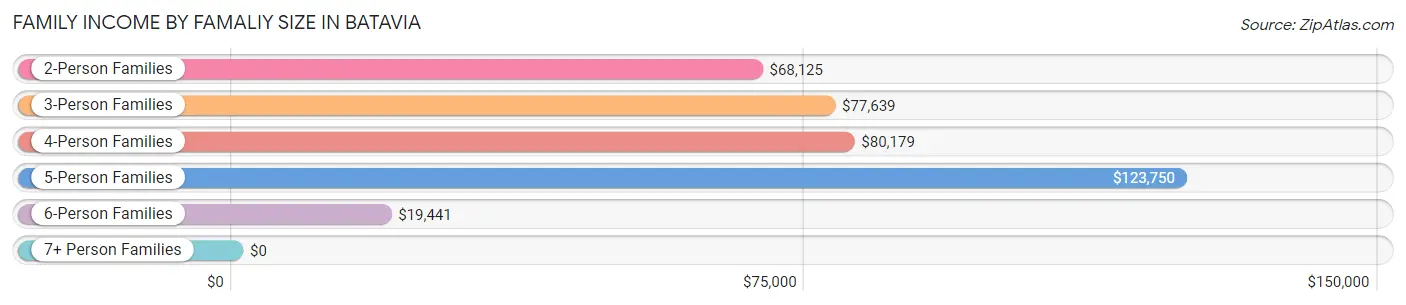
| Income Bracket | # Families | Median Income |
| 2-Person Families | 227 (44.4%) | $68,125 |
| 3-Person Families | 111 (21.7%) | $77,639 |
| 4-Person Families | 79 (15.5%) | $80,179 |
| 5-Person Families | 24 (4.7%) | $123,750 |
| 6-Person Families | 59 (11.6%) | $19,441 |
| 7+ Person Families | 11 (2.1%) | $0 |
| Total | 511 (100.0%) | $66,343 |
Family Income by Number of Earners in Batavia
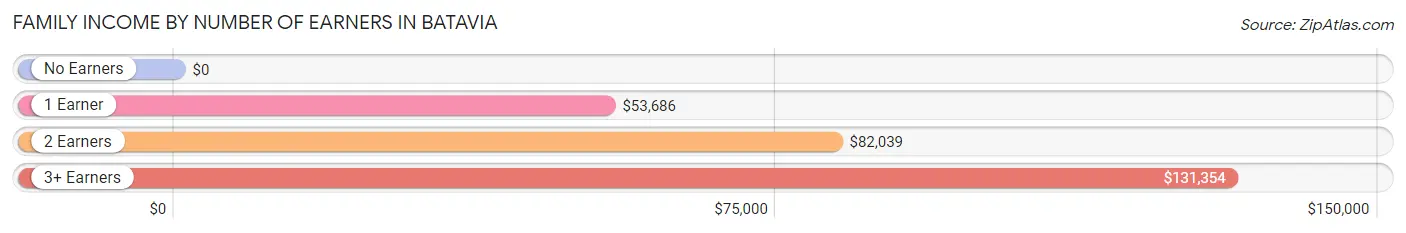
| Number of Earners | # Families | Median Income |
| No Earners | 122 (23.9%) | $0 |
| 1 Earner | 191 (37.4%) | $53,686 |
| 2 Earners | 171 (33.5%) | $82,039 |
| 3+ Earners | 27 (5.3%) | $131,354 |
| Total | 511 (100.0%) | $66,343 |
Household Income in Batavia
Household Income Brackets in Batavia
With 215 households falling in the category, the $50,000 to $74,999 income range is the most frequent in Batavia, accounting for 25.6% of all households. In contrast, only 11 households (1.3%) fall into the $200,000+ income bracket, making it the least populous group.
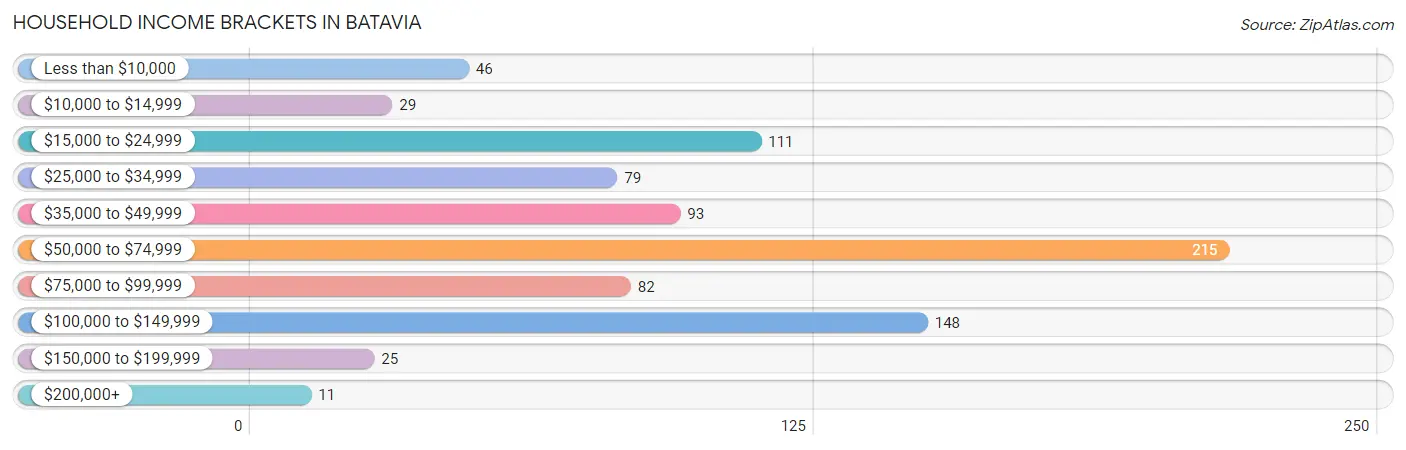
| Income Bracket | # Households | % Households |
| Less than $10,000 | 46 | 5.5% |
| $10,000 to $14,999 | 29 | 3.5% |
| $15,000 to $24,999 | 111 | 13.2% |
| $25,000 to $34,999 | 79 | 9.4% |
| $35,000 to $49,999 | 93 | 11.1% |
| $50,000 to $74,999 | 215 | 25.6% |
| $75,000 to $99,999 | 82 | 9.8% |
| $100,000 to $149,999 | 148 | 17.6% |
| $150,000 to $199,999 | 25 | 3.0% |
| $200,000+ | 11 | 1.3% |
Household Income by Householder Age in Batavia
The median household income in Batavia is $55,169, with the highest median household income of $68,690 found in the 25 to 44 years age bracket for the primary householder. A total of 272 households (32.4%) fall into this category. Meanwhile, the 15 to 24 years age bracket for the primary householder has the lowest median household income of $0, with 15 households (1.8%) in this group.
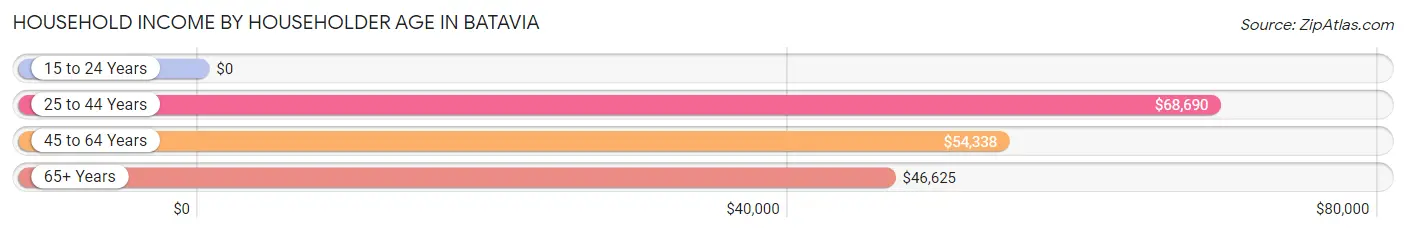
| Income Bracket | # Households | Median Income |
| 15 to 24 Years | 15 (1.8%) | $0 |
| 25 to 44 Years | 272 (32.4%) | $68,690 |
| 45 to 64 Years | 295 (35.2%) | $54,338 |
| 65+ Years | 257 (30.6%) | $46,625 |
| Total | 839 (100.0%) | $55,169 |
Poverty in Batavia
Income Below Poverty by Sex and Age in Batavia
With 25.5% poverty level for males and 27.7% for females among the residents of Batavia, under 5 year old males and 5 year old females are the most vulnerable to poverty, with 38 males (50.0%) and 36 females (87.8%) in their respective age groups living below the poverty level.
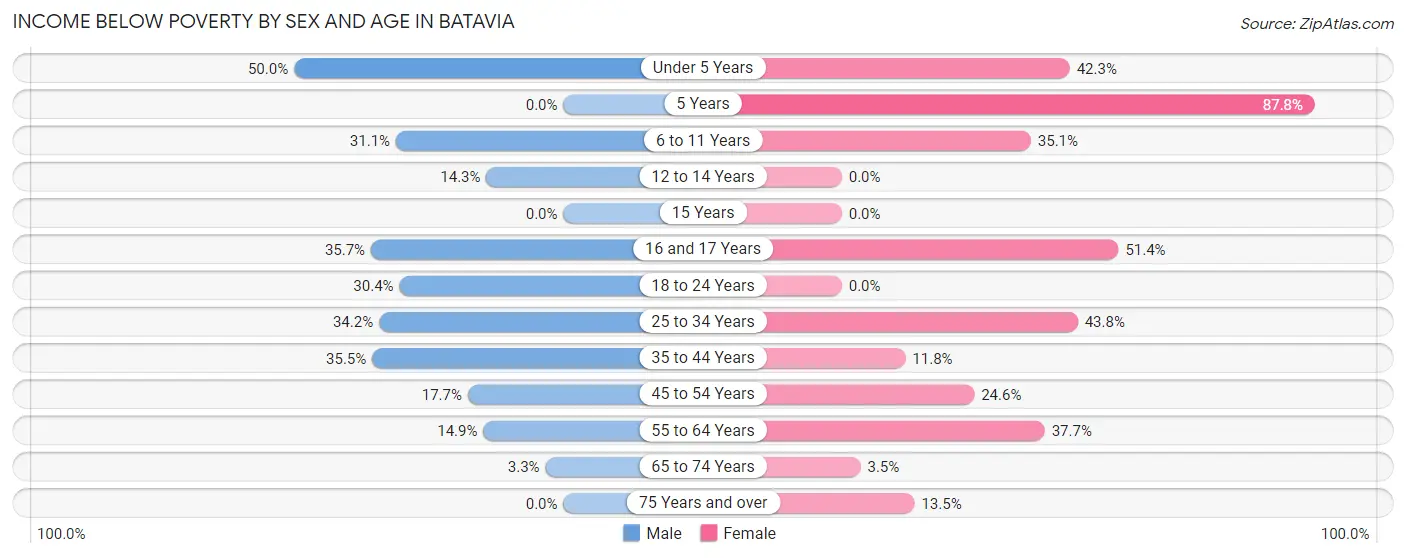
| Age Bracket | Male | Female |
| Under 5 Years | 38 (50.0%) | 22 (42.3%) |
| 5 Years | 0 (0.0%) | 36 (87.8%) |
| 6 to 11 Years | 23 (31.1%) | 20 (35.1%) |
| 12 to 14 Years | 6 (14.3%) | 0 (0.0%) |
| 15 Years | 0 (0.0%) | 0 (0.0%) |
| 16 and 17 Years | 15 (35.7%) | 19 (51.3%) |
| 18 to 24 Years | 21 (30.4%) | 0 (0.0%) |
| 25 to 34 Years | 77 (34.2%) | 67 (43.8%) |
| 35 to 44 Years | 71 (35.5%) | 17 (11.8%) |
| 45 to 54 Years | 22 (17.7%) | 29 (24.6%) |
| 55 to 64 Years | 22 (14.9%) | 84 (37.7%) |
| 65 to 74 Years | 3 (3.3%) | 4 (3.5%) |
| 75 Years and over | 0 (0.0%) | 17 (13.5%) |
| Total | 298 (25.5%) | 315 (27.7%) |
Income Above Poverty by Sex and Age in Batavia
According to the poverty statistics in Batavia, males aged 5 years and females aged 12 to 14 years are the age groups that are most secure financially, with 100.0% of males and 100.0% of females in these age groups living above the poverty line.
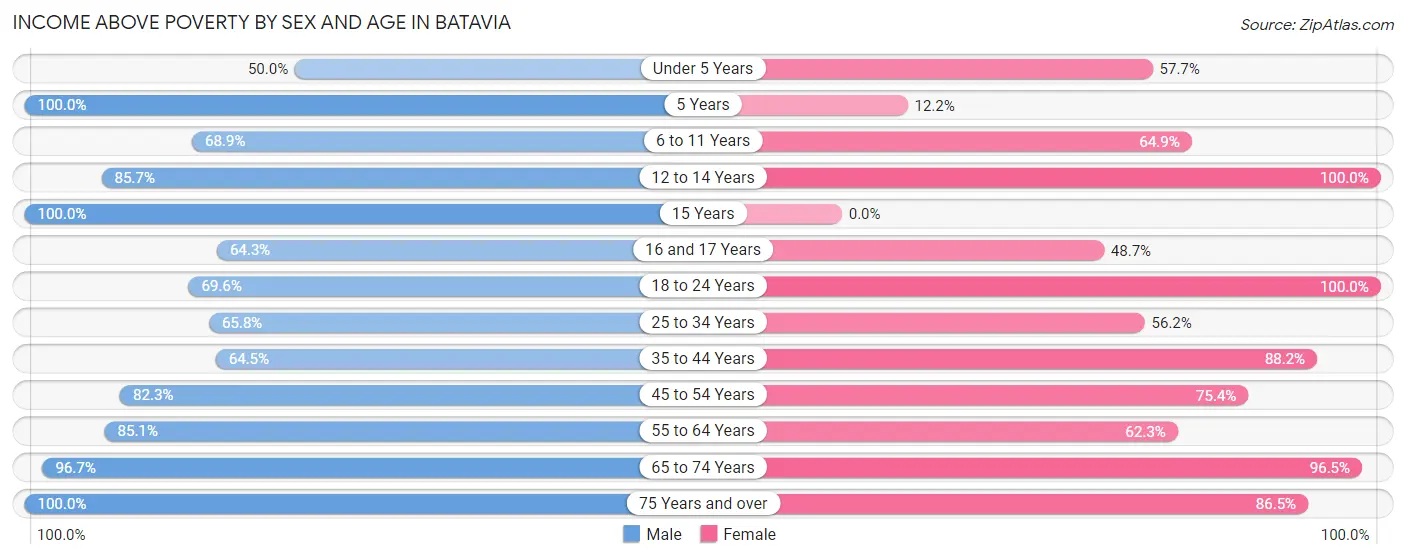
| Age Bracket | Male | Female |
| Under 5 Years | 38 (50.0%) | 30 (57.7%) |
| 5 Years | 23 (100.0%) | 5 (12.2%) |
| 6 to 11 Years | 51 (68.9%) | 37 (64.9%) |
| 12 to 14 Years | 36 (85.7%) | 36 (100.0%) |
| 15 Years | 14 (100.0%) | 0 (0.0%) |
| 16 and 17 Years | 27 (64.3%) | 18 (48.6%) |
| 18 to 24 Years | 48 (69.6%) | 36 (100.0%) |
| 25 to 34 Years | 148 (65.8%) | 86 (56.2%) |
| 35 to 44 Years | 129 (64.5%) | 127 (88.2%) |
| 45 to 54 Years | 102 (82.3%) | 89 (75.4%) |
| 55 to 64 Years | 126 (85.1%) | 139 (62.3%) |
| 65 to 74 Years | 87 (96.7%) | 111 (96.5%) |
| 75 Years and over | 44 (100.0%) | 109 (86.5%) |
| Total | 873 (74.6%) | 823 (72.3%) |
Income Below Poverty Among Married-Couple Families in Batavia
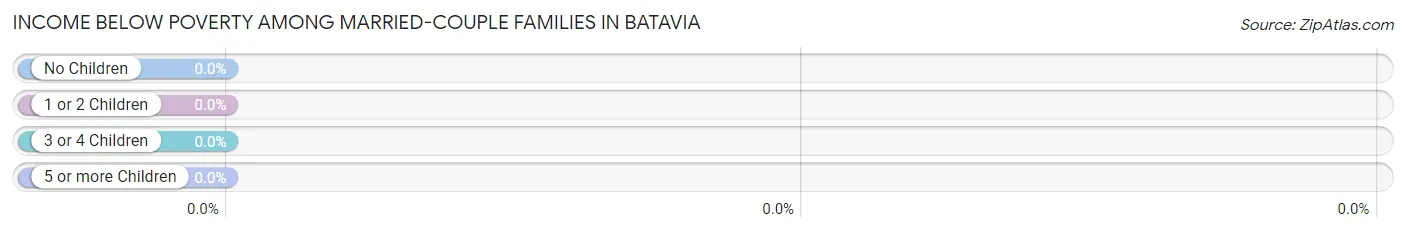
| Children | Above Poverty | Below Poverty |
| No Children | 222 (100.0%) | 0 (0.0%) |
| 1 or 2 Children | 57 (100.0%) | 0 (0.0%) |
| 3 or 4 Children | 29 (100.0%) | 0 (0.0%) |
| 5 or more Children | 11 (100.0%) | 0 (0.0%) |
| Total | 319 (100.0%) | 0 (0.0%) |
Income Below Poverty Among Single-Parent Households in Batavia
According to the poverty data in Batavia, 18.2% or 8 single-father households and 54.0% or 80 single-mother households are living below the poverty line. Among single-father households, those with 1 or 2 children have the highest poverty rate, with 8 households (27.6%) experiencing poverty. Likewise, among single-mother households, those with 1 or 2 children have the highest poverty rate, with 64 households (71.1%) falling below the poverty line.
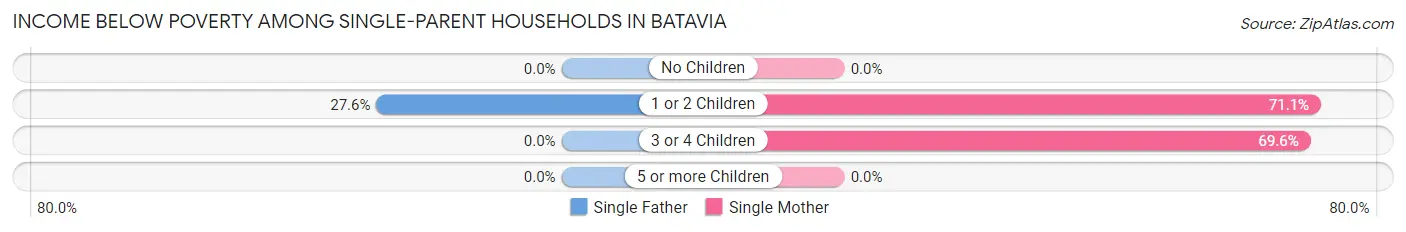
| Children | Single Father | Single Mother |
| No Children | 0 (0.0%) | 0 (0.0%) |
| 1 or 2 Children | 8 (27.6%) | 64 (71.1%) |
| 3 or 4 Children | 0 (0.0%) | 16 (69.6%) |
| 5 or more Children | 0 (0.0%) | 0 (0.0%) |
| Total | 8 (18.2%) | 80 (54.0%) |
Income Below Poverty Among Married-Couple vs Single-Parent Households in Batavia
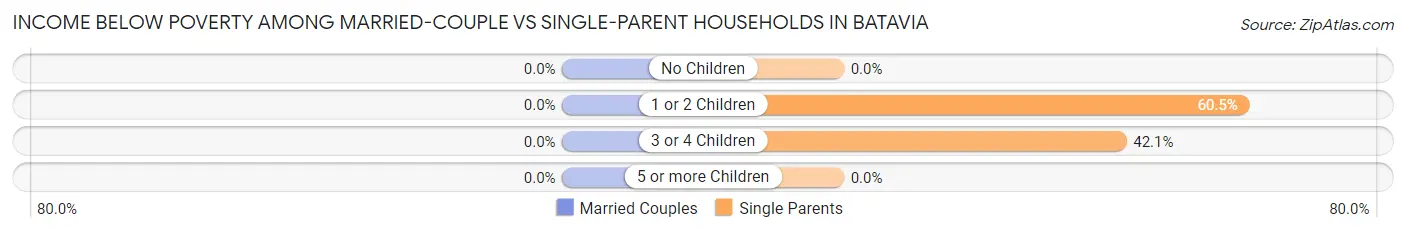
| Children | Married-Couple Families | Single-Parent Households |
| No Children | 0 (0.0%) | 0 (0.0%) |
| 1 or 2 Children | 0 (0.0%) | 72 (60.5%) |
| 3 or 4 Children | 0 (0.0%) | 16 (42.1%) |
| 5 or more Children | 0 (0.0%) | 0 (0.0%) |
| Total | 0 (0.0%) | 88 (45.8%) |
Race in Batavia
The most populous races in Batavia are White / Caucasian (2,362 | 90.6%), Two or more Races (138 | 5.3%), and Black / African American (103 | 4.0%).
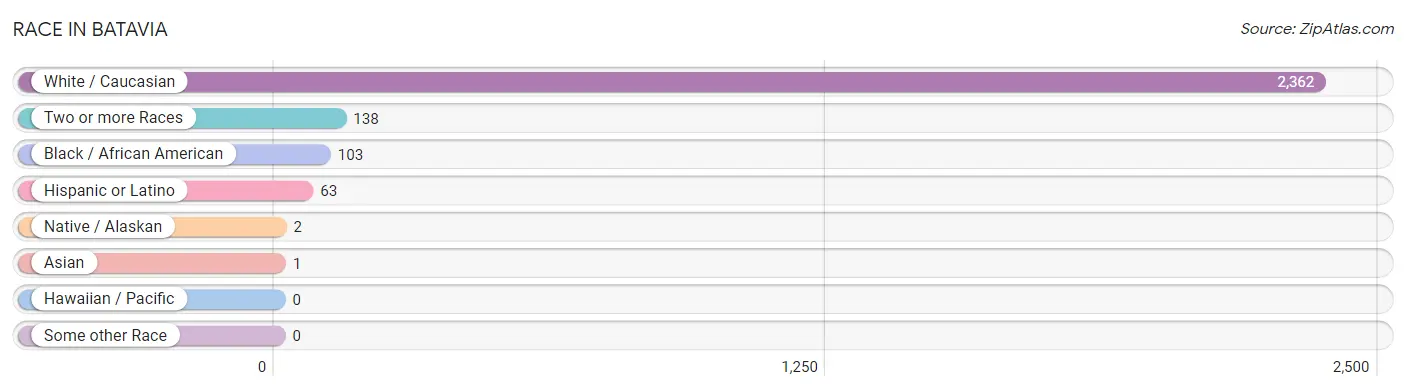
| Race | # Population | % Population |
| Asian | 1 | 0.0% |
| Black / African American | 103 | 4.0% |
| Hawaiian / Pacific | 0 | 0.0% |
| Hispanic or Latino | 63 | 2.4% |
| Native / Alaskan | 2 | 0.1% |
| White / Caucasian | 2,362 | 90.6% |
| Two or more Races | 138 | 5.3% |
| Some other Race | 0 | 0.0% |
| Total | 2,606 | 100.0% |
Ancestry in Batavia
The most populous ancestries reported in Batavia are German (520 | 20.0%), American (301 | 11.6%), Irish (293 | 11.2%), English (291 | 11.2%), and Italian (168 | 6.5%), together accounting for 60.4% of all Batavia residents.
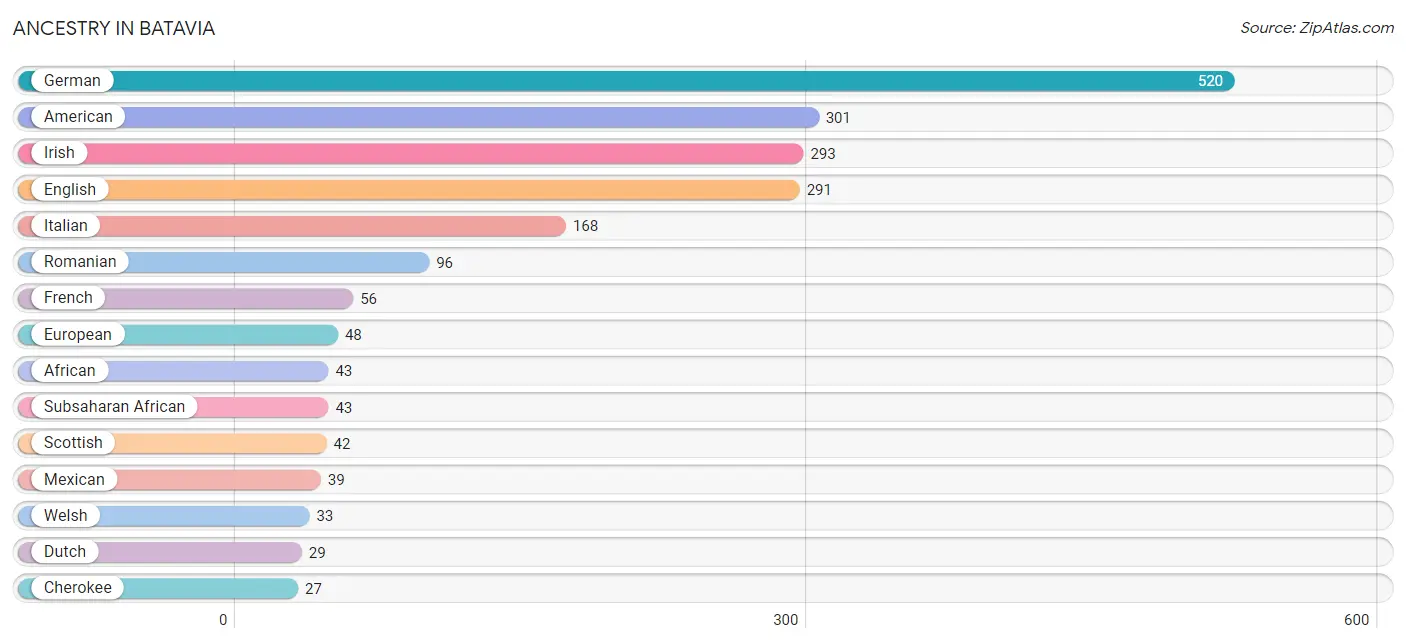
| Ancestry | # Population | % Population |
| African | 43 | 1.7% |
| American | 301 | 11.6% |
| Apache | 9 | 0.4% |
| Arab | 5 | 0.2% |
| Bhutanese | 1 | 0.0% |
| Blackfeet | 8 | 0.3% |
| Cherokee | 27 | 1.0% |
| Choctaw | 8 | 0.3% |
| Creek | 5 | 0.2% |
| Czech | 15 | 0.6% |
| Czechoslovakian | 12 | 0.5% |
| Dutch | 29 | 1.1% |
| English | 291 | 11.2% |
| European | 48 | 1.8% |
| French | 56 | 2.1% |
| German | 520 | 20.0% |
| Greek | 17 | 0.6% |
| Irish | 293 | 11.2% |
| Italian | 168 | 6.5% |
| Mexican | 39 | 1.5% |
| Polish | 21 | 0.8% |
| Portuguese | 6 | 0.2% |
| Puerto Rican | 6 | 0.2% |
| Romanian | 96 | 3.7% |
| Russian | 11 | 0.4% |
| Scotch-Irish | 16 | 0.6% |
| Scottish | 42 | 1.6% |
| South American | 9 | 0.4% |
| Spanish | 9 | 0.4% |
| Subsaharan African | 43 | 1.7% |
| Swedish | 8 | 0.3% |
| Venezuelan | 9 | 0.4% |
| Welsh | 33 | 1.3% | View All 33 Rows |
Immigrants in Batavia
The most numerous immigrant groups reported in Batavia came from Europe (6 | 0.2%), Eastern Europe (3 | 0.1%), Germany (3 | 0.1%), Russia (3 | 0.1%), and Western Europe (3 | 0.1%), together accounting for 0.7% of all Batavia residents.
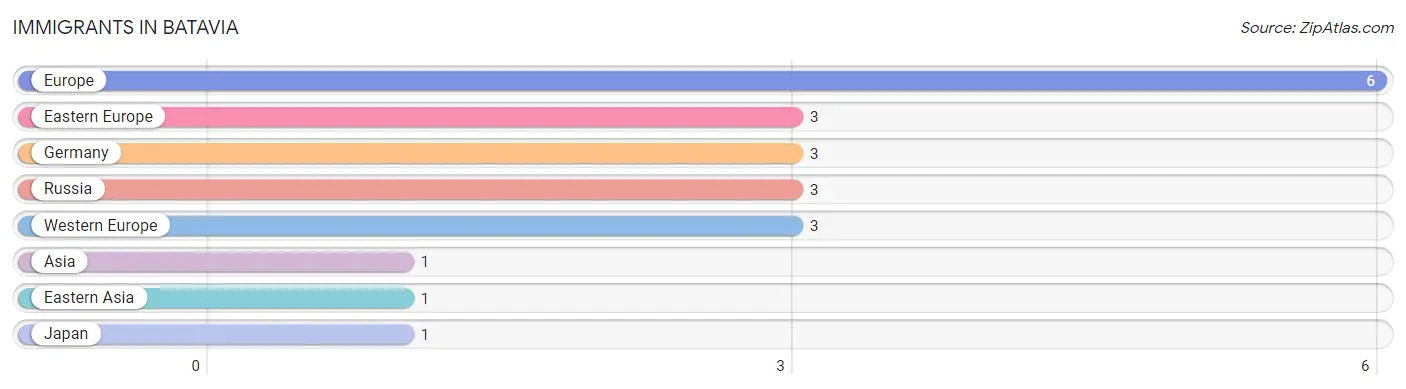
| Immigration Origin | # Population | % Population |
| Asia | 1 | 0.0% |
| Eastern Asia | 1 | 0.0% |
| Eastern Europe | 3 | 0.1% |
| Europe | 6 | 0.2% |
| Germany | 3 | 0.1% |
| Japan | 1 | 0.0% |
| Russia | 3 | 0.1% |
| Western Europe | 3 | 0.1% | View All 8 Rows |
Sex and Age in Batavia
Sex and Age in Batavia
The most populous age groups in Batavia are 25 to 29 Years (214 | 15.2%) for men and 55 to 59 Years (141 | 11.7%) for women.
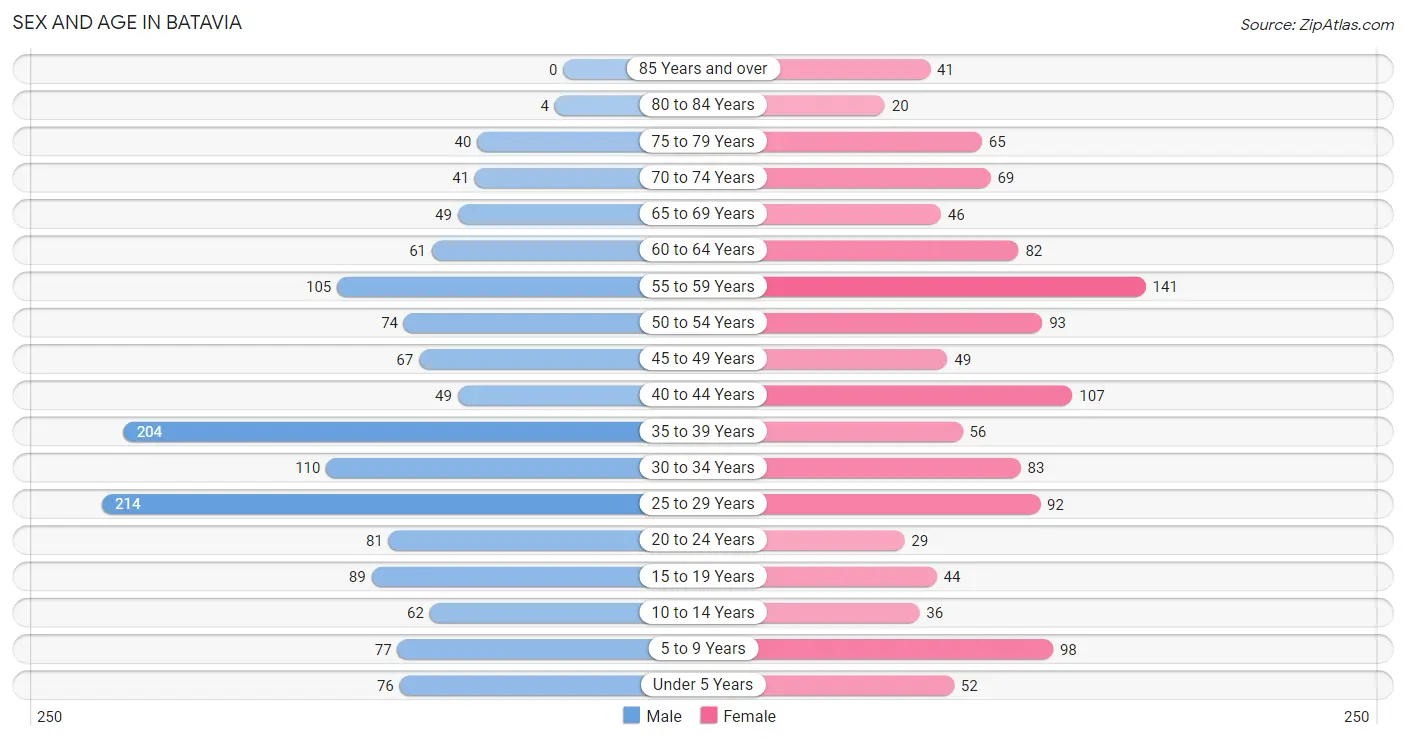
| Age Bracket | Male | Female |
| Under 5 Years | 76 (5.4%) | 52 (4.3%) |
| 5 to 9 Years | 77 (5.5%) | 98 (8.2%) |
| 10 to 14 Years | 62 (4.4%) | 36 (3.0%) |
| 15 to 19 Years | 89 (6.3%) | 44 (3.7%) |
| 20 to 24 Years | 81 (5.8%) | 29 (2.4%) |
| 25 to 29 Years | 214 (15.2%) | 92 (7.6%) |
| 30 to 34 Years | 110 (7.8%) | 83 (6.9%) |
| 35 to 39 Years | 204 (14.5%) | 56 (4.7%) |
| 40 to 44 Years | 49 (3.5%) | 107 (8.9%) |
| 45 to 49 Years | 67 (4.8%) | 49 (4.1%) |
| 50 to 54 Years | 74 (5.3%) | 93 (7.7%) |
| 55 to 59 Years | 105 (7.5%) | 141 (11.7%) |
| 60 to 64 Years | 61 (4.3%) | 82 (6.8%) |
| 65 to 69 Years | 49 (3.5%) | 46 (3.8%) |
| 70 to 74 Years | 41 (2.9%) | 69 (5.7%) |
| 75 to 79 Years | 40 (2.9%) | 65 (5.4%) |
| 80 to 84 Years | 4 (0.3%) | 20 (1.7%) |
| 85 Years and over | 0 (0.0%) | 41 (3.4%) |
| Total | 1,403 (100.0%) | 1,203 (100.0%) |
Families and Households in Batavia
Median Family Size in Batavia
The median family size in Batavia is 3.19 persons per family, with single female/mother families (148 | 29.0%) accounting for the largest median family size of 3.58 persons per family. On the other hand, single male/father families (44 | 8.6%) represent the smallest median family size with 2.95 persons per family.
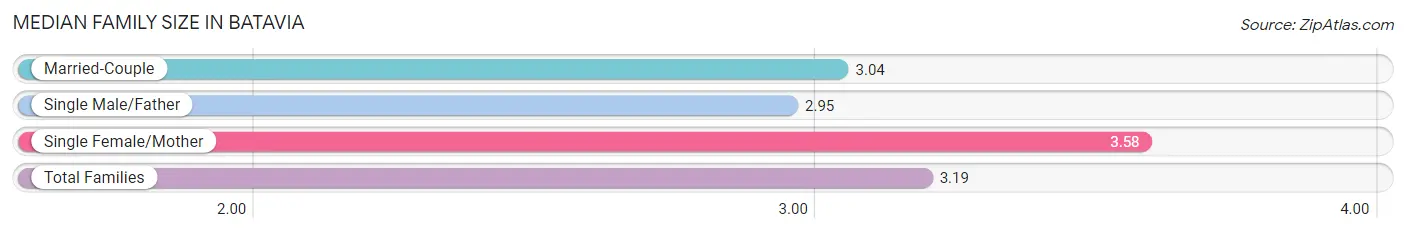
| Family Type | # Families | Family Size |
| Married-Couple | 319 (62.4%) | 3.04 |
| Single Male/Father | 44 (8.6%) | 2.95 |
| Single Female/Mother | 148 (29.0%) | 3.58 |
| Total Families | 511 (100.0%) | 3.19 |
Median Household Size in Batavia
The median household size in Batavia is 2.59 persons per household, with single female/mother households (148 | 17.6%) accounting for the largest median household size of 3.81 persons per household. non-family households (328 | 39.1%) represent the smallest median household size with 1.43 persons per household.
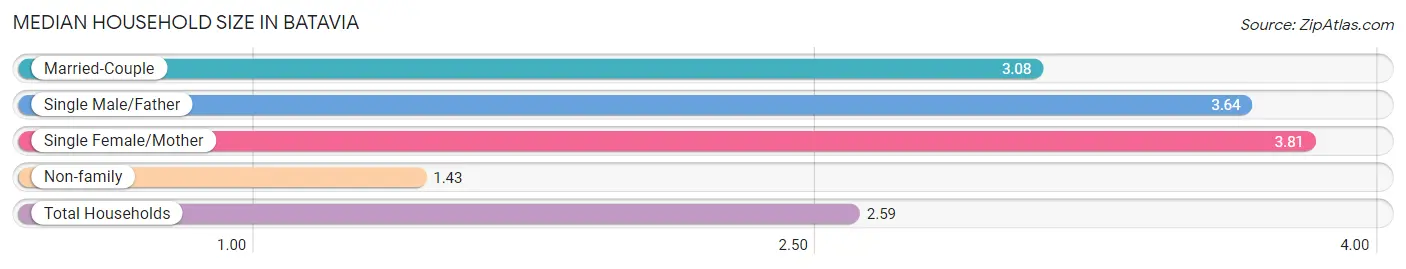
| Household Type | # Households | Household Size |
| Married-Couple | 319 (38.0%) | 3.08 |
| Single Male/Father | 44 (5.2%) | 3.64 |
| Single Female/Mother | 148 (17.6%) | 3.81 |
| Non-family | 328 (39.1%) | 1.43 |
| Total Households | 839 (100.0%) | 2.59 |
Household Size by Marriage Status in Batavia
Out of a total of 839 households in Batavia, 511 (60.9%) are family households, while 328 (39.1%) are nonfamily households. The most numerous type of family households are 2-person households, comprising 212, and the most common type of nonfamily households are 1-person households, comprising 232.
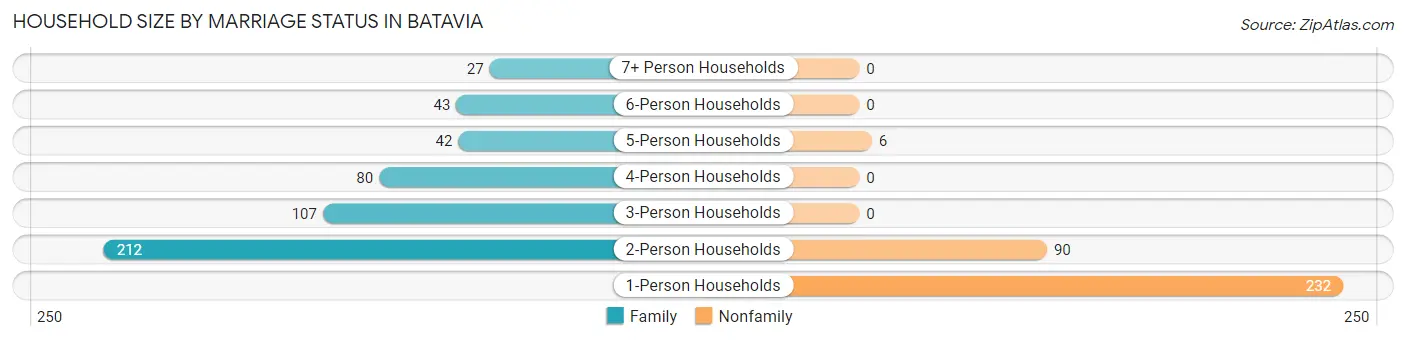
| Household Size | Family Households | Nonfamily Households |
| 1-Person Households | - | 232 (27.7%) |
| 2-Person Households | 212 (25.3%) | 90 (10.7%) |
| 3-Person Households | 107 (12.8%) | 0 (0.0%) |
| 4-Person Households | 80 (9.5%) | 0 (0.0%) |
| 5-Person Households | 42 (5.0%) | 6 (0.7%) |
| 6-Person Households | 43 (5.1%) | 0 (0.0%) |
| 7+ Person Households | 27 (3.2%) | 0 (0.0%) |
| Total | 511 (60.9%) | 328 (39.1%) |
Female Fertility in Batavia
Fertility by Age in Batavia
Average fertility rate in Batavia is 4.0 births per 1,000 women. Women in the age bracket of 20 to 34 years have the highest fertility rate with 10.0 births per 1,000 women. Women in the age bracket of 20 to 34 years acount for 100.0% of all women with births.
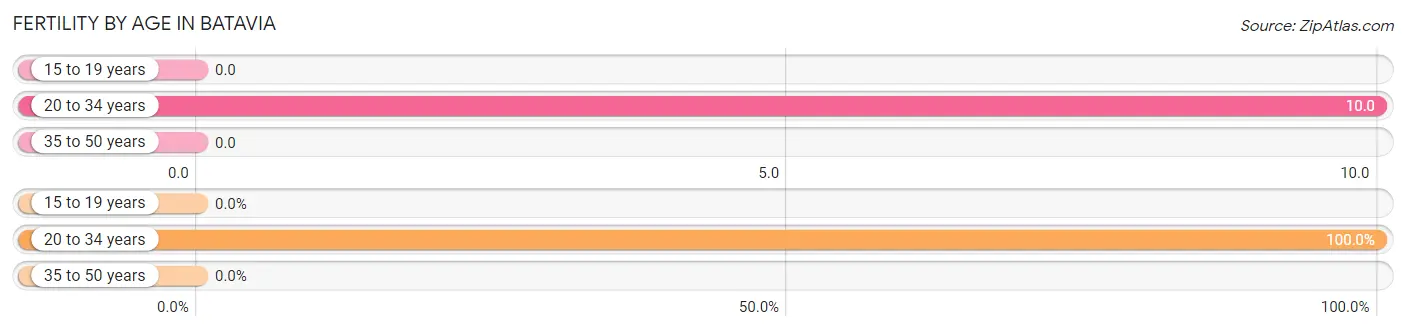
| Age Bracket | Women with Births | Births / 1,000 Women |
| 15 to 19 years | 0 (0.0%) | 0.0 |
| 20 to 34 years | 2 (100.0%) | 10.0 |
| 35 to 50 years | 0 (0.0%) | 0.0 |
| Total | 2 (100.0%) | 4.0 |
Fertility by Age by Marriage Status in Batavia
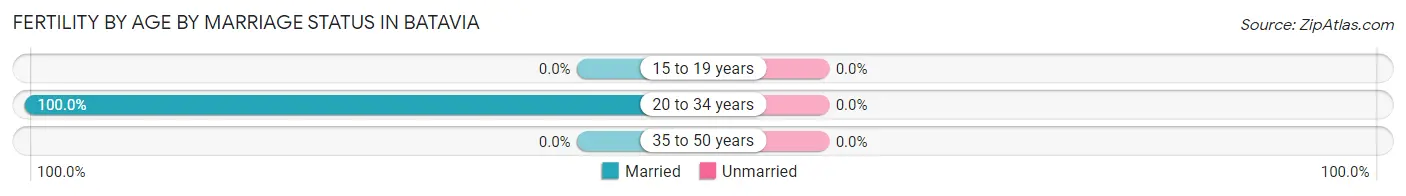
| Age Bracket | Married | Unmarried |
| 15 to 19 years | 0 (0.0%) | 0 (0.0%) |
| 20 to 34 years | 2 (100.0%) | 0 (0.0%) |
| 35 to 50 years | 0 (0.0%) | 0 (0.0%) |
| Total | 2 (100.0%) | 0 (0.0%) |
Fertility by Education in Batavia
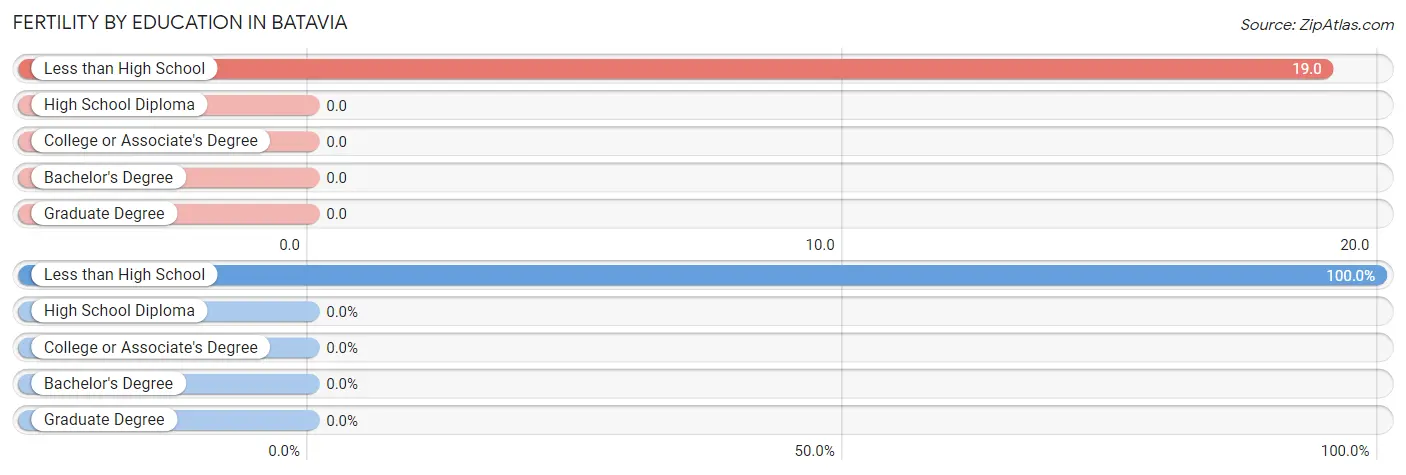
| Educational Attainment | Women with Births | Births / 1,000 Women |
| Less than High School | 2 (100.0%) | 19.0 |
| High School Diploma | 0 (0.0%) | 0.0 |
| College or Associate's Degree | 0 (0.0%) | 0.0 |
| Bachelor's Degree | 0 (0.0%) | 0.0 |
| Graduate Degree | 0 (0.0%) | 0.0 |
| Total | 2 (100.0%) | 4.0 |
Fertility by Education by Marriage Status in Batavia
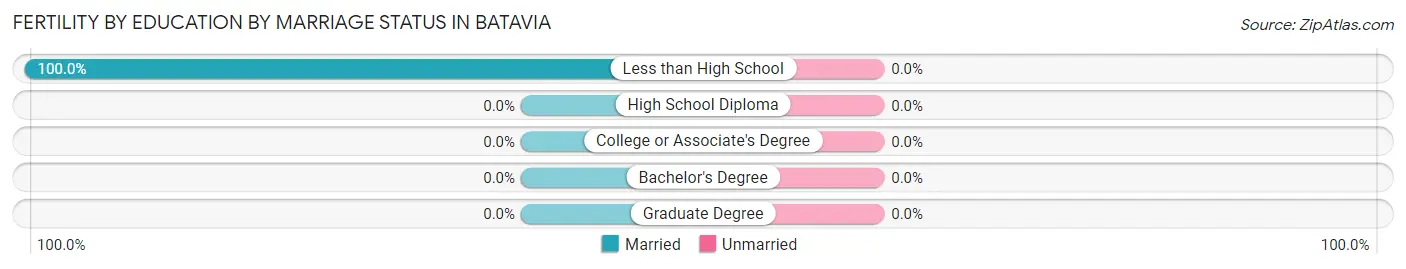
| Educational Attainment | Married | Unmarried |
| Less than High School | 2 (100.0%) | 0 (0.0%) |
| High School Diploma | 0 (0.0%) | 0 (0.0%) |
| College or Associate's Degree | 0 (0.0%) | 0 (0.0%) |
| Bachelor's Degree | 0 (0.0%) | 0 (0.0%) |
| Graduate Degree | 0 (0.0%) | 0 (0.0%) |
| Total | 2 (100.0%) | 0 (0.0%) |
Employment Characteristics in Batavia
Employment by Class of Employer in Batavia
Among the 835 employed individuals in Batavia, private company employees (557 | 66.7%), local government employees (75 | 9.0%), and not-for-profit organizations (61 | 7.3%) make up the most common classes of employment.
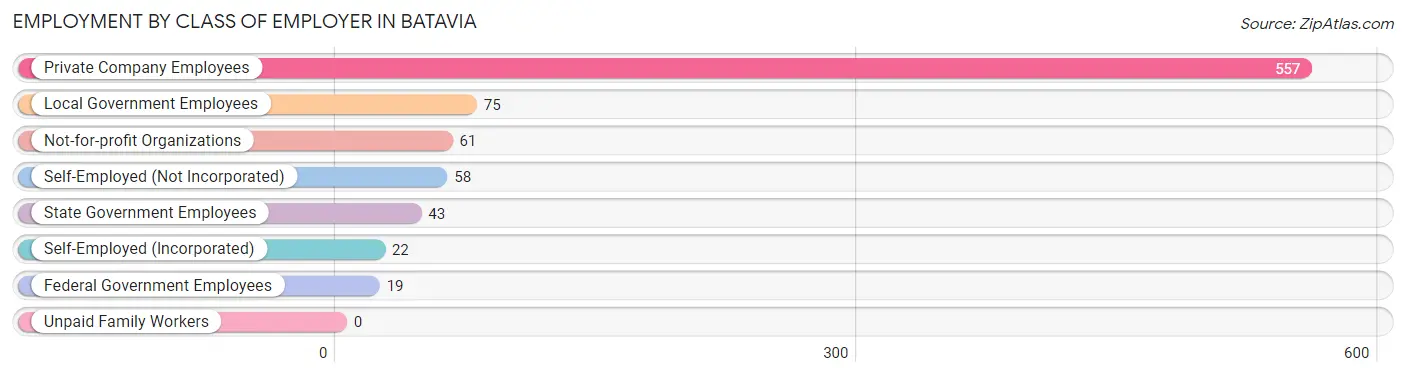
| Employer Class | # Employees | % Employees |
| Private Company Employees | 557 | 66.7% |
| Self-Employed (Incorporated) | 22 | 2.6% |
| Self-Employed (Not Incorporated) | 58 | 7.0% |
| Not-for-profit Organizations | 61 | 7.3% |
| Local Government Employees | 75 | 9.0% |
| State Government Employees | 43 | 5.1% |
| Federal Government Employees | 19 | 2.3% |
| Unpaid Family Workers | 0 | 0.0% |
| Total | 835 | 100.0% |
Employment Status by Age in Batavia
According to the labor force statistics for Batavia, out of the total population over 16 years of age (2,191), 46.7% or 1,023 individuals are in the labor force, with 16.1% or 165 of them unemployed. The age group with the highest labor force participation rate is 25 to 29 years, with 71.2% or 218 individuals in the labor force. Within the labor force, the 16 to 19 years age range has the highest percentage of unemployed individuals, with 37.0% or 20 of them being unemployed.
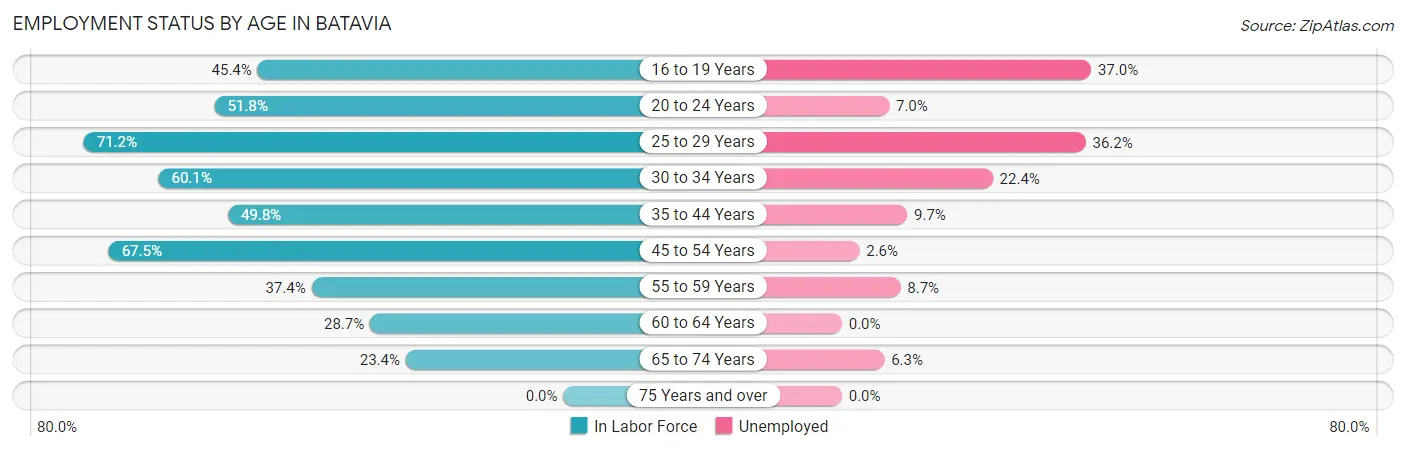
| Age Bracket | In Labor Force | Unemployed |
| 16 to 19 Years | 54 (45.4%) | 20 (37.0%) |
| 20 to 24 Years | 57 (51.8%) | 4 (7.0%) |
| 25 to 29 Years | 218 (71.2%) | 79 (36.2%) |
| 30 to 34 Years | 116 (60.1%) | 26 (22.4%) |
| 35 to 44 Years | 207 (49.8%) | 20 (9.7%) |
| 45 to 54 Years | 191 (67.5%) | 5 (2.6%) |
| 55 to 59 Years | 92 (37.4%) | 8 (8.7%) |
| 60 to 64 Years | 41 (28.7%) | 0 (0.0%) |
| 65 to 74 Years | 48 (23.4%) | 3 (6.3%) |
| 75 Years and over | 0 (0.0%) | 0 (0.0%) |
| Total | 1,023 (46.7%) | 165 (16.1%) |
Employment Status by Educational Attainment in Batavia
According to labor force statistics for Batavia, 54.5% of individuals (865) out of the total population between 25 and 64 years of age (1,587) are in the labor force, with 16.0% or 138 of them being unemployed. The group with the highest labor force participation rate are those with the educational attainment of bachelor's degree or higher, with 83.4% or 161 individuals in the labor force. Within the labor force, individuals with less than high school education have the highest percentage of unemployment, with 42.7% or 53 of them being unemployed.
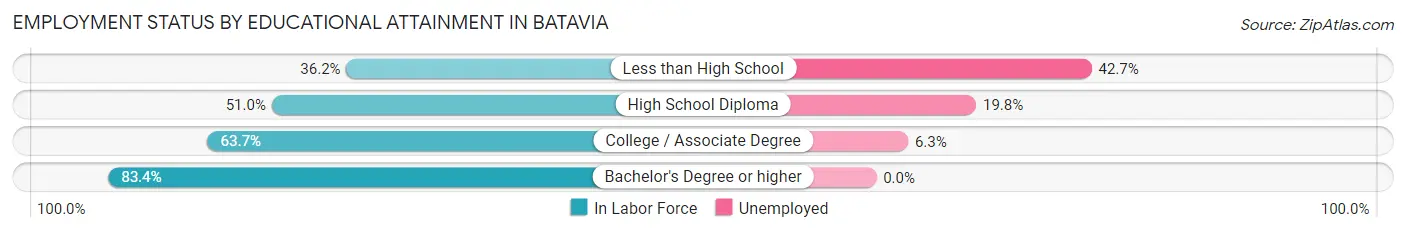
| Educational Attainment | In Labor Force | Unemployed |
| Less than High School | 124 (36.2%) | 146 (42.7%) |
| High School Diploma | 359 (51.0%) | 139 (19.8%) |
| College / Associate Degree | 221 (63.7%) | 22 (6.3%) |
| Bachelor's Degree or higher | 161 (83.4%) | 0 (0.0%) |
| Total | 865 (54.5%) | 254 (16.0%) |
Employment Occupations by Sex in Batavia
Management, Business, Science and Arts Occupations
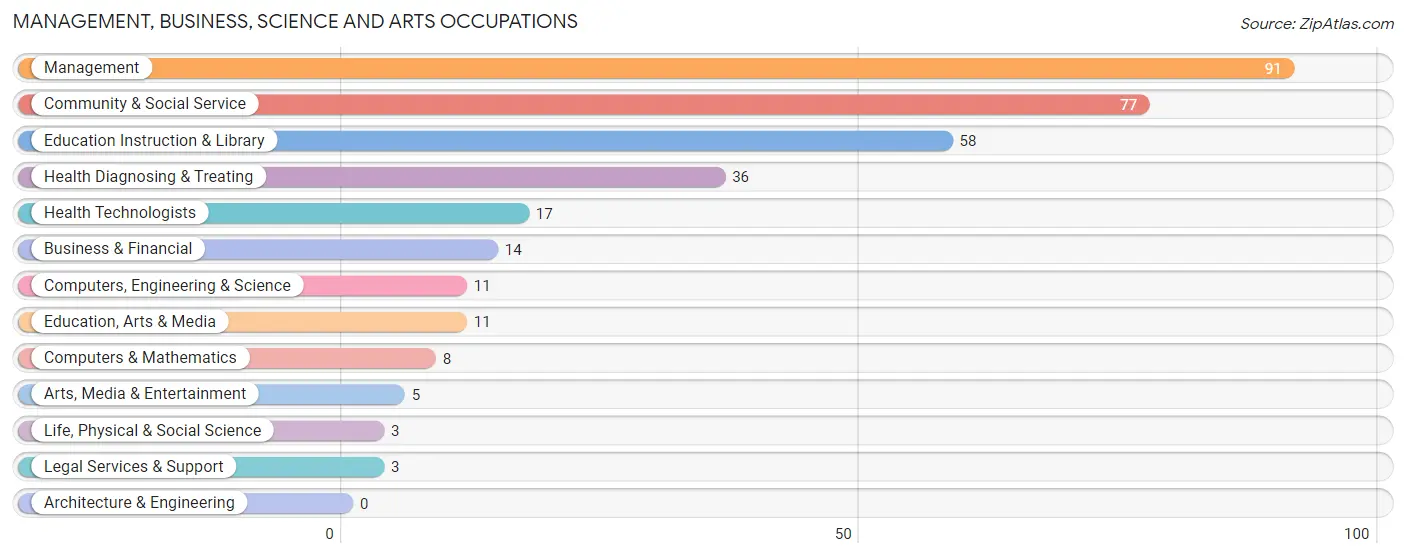
The most common Management, Business, Science and Arts occupations in Batavia are Management (91 | 10.6%), Community & Social Service (77 | 9.0%), Education Instruction & Library (58 | 6.8%), Health Diagnosing & Treating (36 | 4.2%), and Health Technologists (17 | 2.0%).
Management, Business, Science and Arts Occupations by Sex
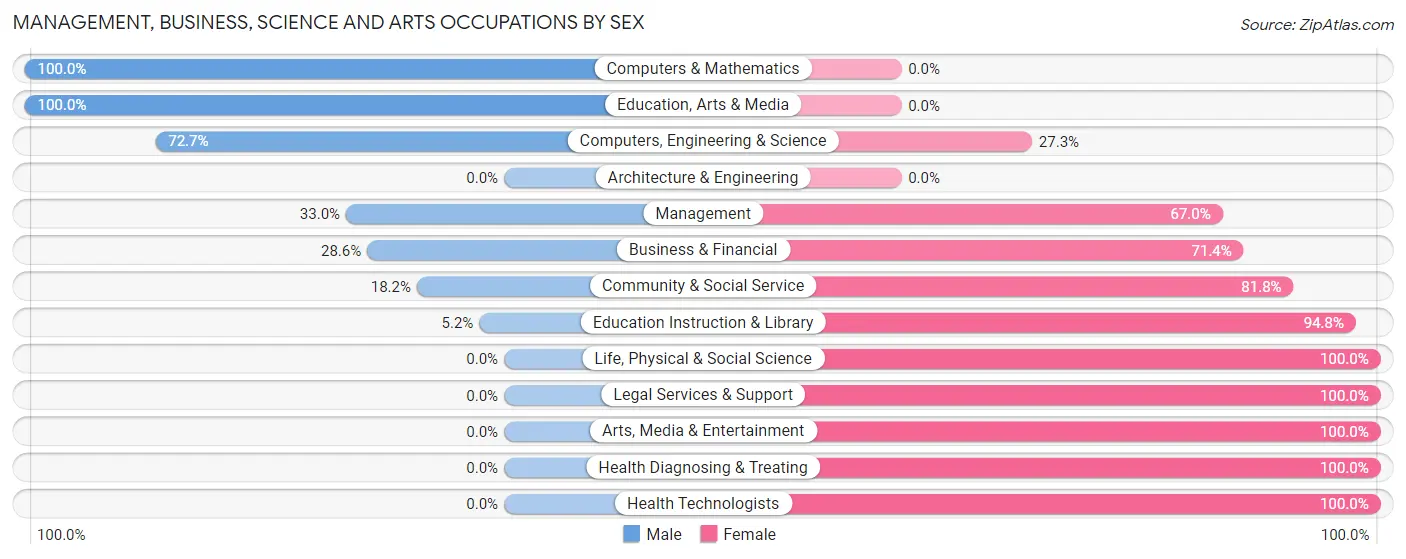
Within the Management, Business, Science and Arts occupations in Batavia, the most male-oriented occupations are Computers & Mathematics (100.0%), Education, Arts & Media (100.0%), and Computers, Engineering & Science (72.7%), while the most female-oriented occupations are Life, Physical & Social Science (100.0%), Legal Services & Support (100.0%), and Arts, Media & Entertainment (100.0%).
| Occupation | Male | Female |
| Management | 30 (33.0%) | 61 (67.0%) |
| Business & Financial | 4 (28.6%) | 10 (71.4%) |
| Computers, Engineering & Science | 8 (72.7%) | 3 (27.3%) |
| Computers & Mathematics | 8 (100.0%) | 0 (0.0%) |
| Architecture & Engineering | 0 (0.0%) | 0 (0.0%) |
| Life, Physical & Social Science | 0 (0.0%) | 3 (100.0%) |
| Community & Social Service | 14 (18.2%) | 63 (81.8%) |
| Education, Arts & Media | 11 (100.0%) | 0 (0.0%) |
| Legal Services & Support | 0 (0.0%) | 3 (100.0%) |
| Education Instruction & Library | 3 (5.2%) | 55 (94.8%) |
| Arts, Media & Entertainment | 0 (0.0%) | 5 (100.0%) |
| Health Diagnosing & Treating | 0 (0.0%) | 36 (100.0%) |
| Health Technologists | 0 (0.0%) | 17 (100.0%) |
| Total (Category) | 56 (24.4%) | 173 (75.5%) |
| Total (Overall) | 414 (48.2%) | 445 (51.8%) |
Services Occupations
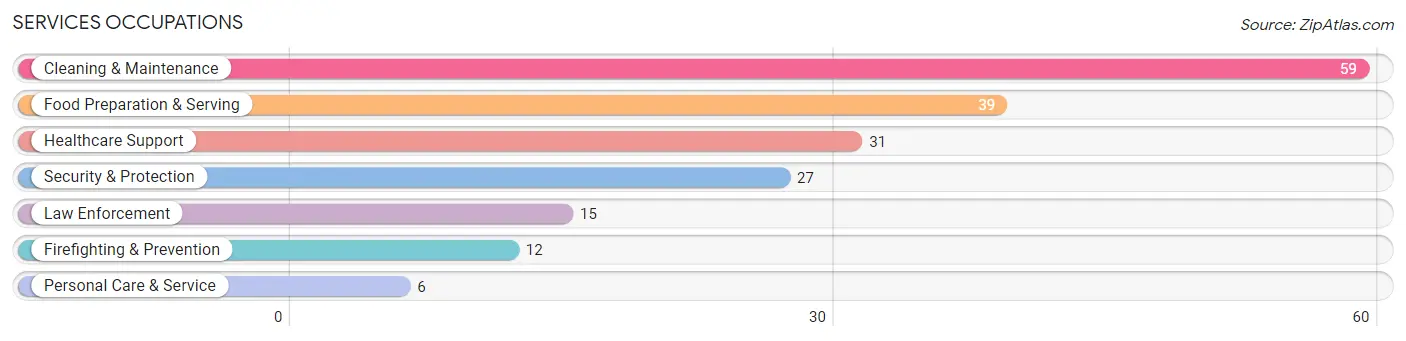
The most common Services occupations in Batavia are Cleaning & Maintenance (59 | 6.9%), Food Preparation & Serving (39 | 4.5%), Healthcare Support (31 | 3.6%), Security & Protection (27 | 3.1%), and Law Enforcement (15 | 1.8%).
Services Occupations by Sex
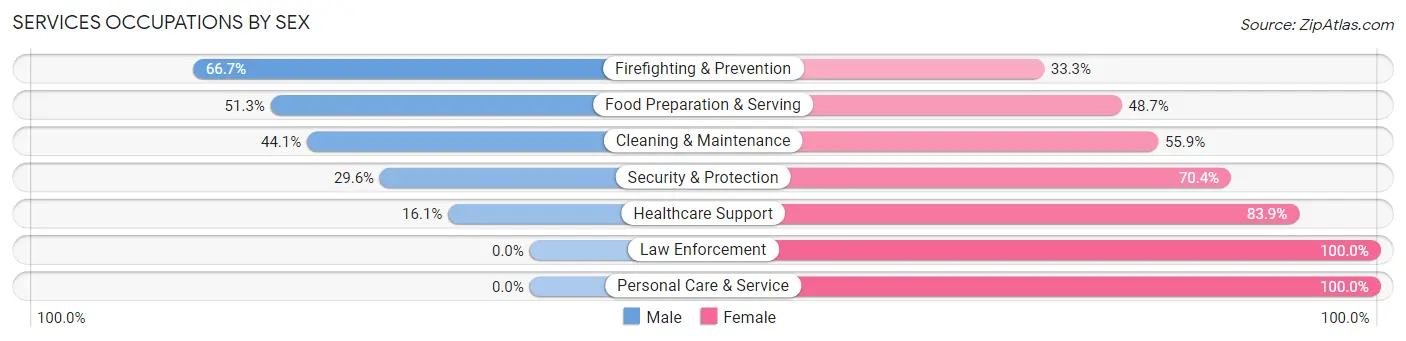
Within the Services occupations in Batavia, the most male-oriented occupations are Firefighting & Prevention (66.7%), Food Preparation & Serving (51.3%), and Cleaning & Maintenance (44.1%), while the most female-oriented occupations are Law Enforcement (100.0%), Personal Care & Service (100.0%), and Healthcare Support (83.9%).
| Occupation | Male | Female |
| Healthcare Support | 5 (16.1%) | 26 (83.9%) |
| Security & Protection | 8 (29.6%) | 19 (70.4%) |
| Firefighting & Prevention | 8 (66.7%) | 4 (33.3%) |
| Law Enforcement | 0 (0.0%) | 15 (100.0%) |
| Food Preparation & Serving | 20 (51.3%) | 19 (48.7%) |
| Cleaning & Maintenance | 26 (44.1%) | 33 (55.9%) |
| Personal Care & Service | 0 (0.0%) | 6 (100.0%) |
| Total (Category) | 59 (36.4%) | 103 (63.6%) |
| Total (Overall) | 414 (48.2%) | 445 (51.8%) |
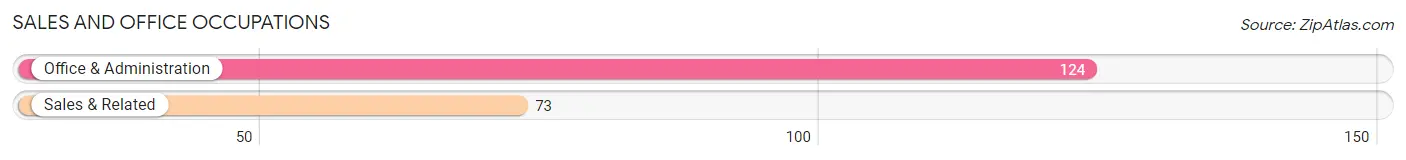
Sales and Office Occupations
The most common Sales and Office occupations in Batavia are Office & Administration (124 | 14.4%), and Sales & Related (73 | 8.5%).
Sales and Office Occupations by Sex
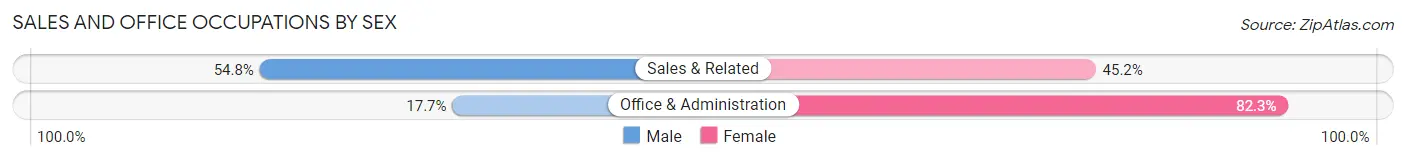
| Occupation | Male | Female |
| Sales & Related | 40 (54.8%) | 33 (45.2%) |
| Office & Administration | 22 (17.7%) | 102 (82.3%) |
| Total (Category) | 62 (31.5%) | 135 (68.5%) |
| Total (Overall) | 414 (48.2%) | 445 (51.8%) |
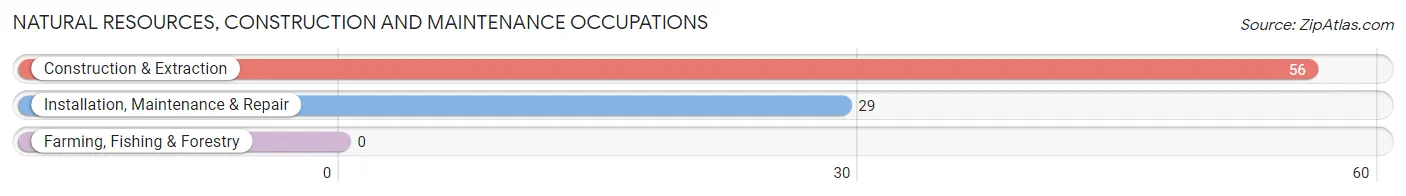
Natural Resources, Construction and Maintenance Occupations
The most common Natural Resources, Construction and Maintenance occupations in Batavia are Construction & Extraction (56 | 6.5%), and Installation, Maintenance & Repair (29 | 3.4%).
Natural Resources, Construction and Maintenance Occupations by Sex
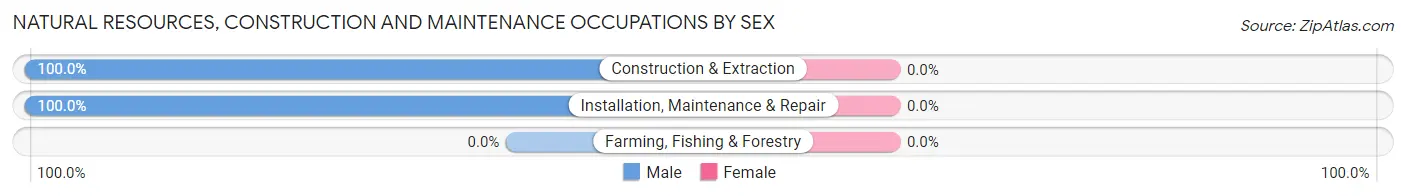
| Occupation | Male | Female |
| Farming, Fishing & Forestry | 0 (0.0%) | 0 (0.0%) |
| Construction & Extraction | 56 (100.0%) | 0 (0.0%) |
| Installation, Maintenance & Repair | 29 (100.0%) | 0 (0.0%) |
| Total (Category) | 85 (100.0%) | 0 (0.0%) |
| Total (Overall) | 414 (48.2%) | 445 (51.8%) |
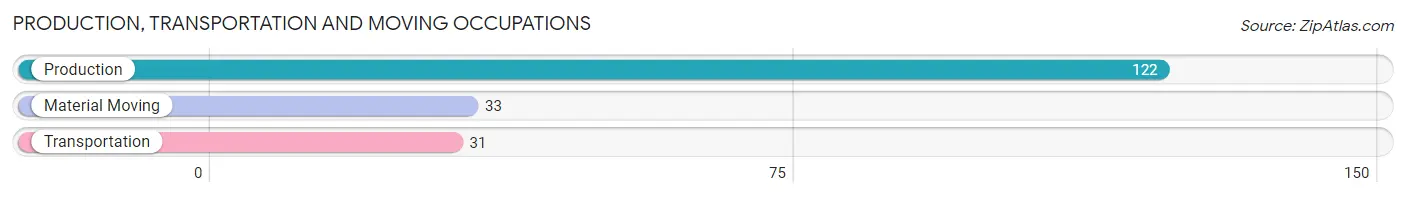
Production, Transportation and Moving Occupations
The most common Production, Transportation and Moving occupations in Batavia are Production (122 | 14.2%), Material Moving (33 | 3.8%), and Transportation (31 | 3.6%).
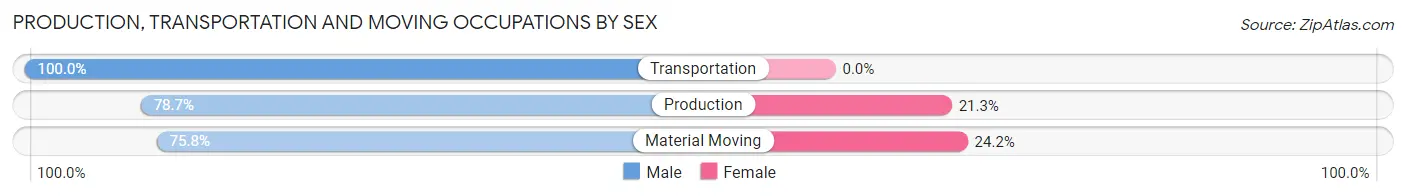
Production, Transportation and Moving Occupations by Sex
| Occupation | Male | Female |
| Production | 96 (78.7%) | 26 (21.3%) |
| Transportation | 31 (100.0%) | 0 (0.0%) |
| Material Moving | 25 (75.8%) | 8 (24.2%) |
| Total (Category) | 152 (81.7%) | 34 (18.3%) |
| Total (Overall) | 414 (48.2%) | 445 (51.8%) |
Employment Industries by Sex in Batavia
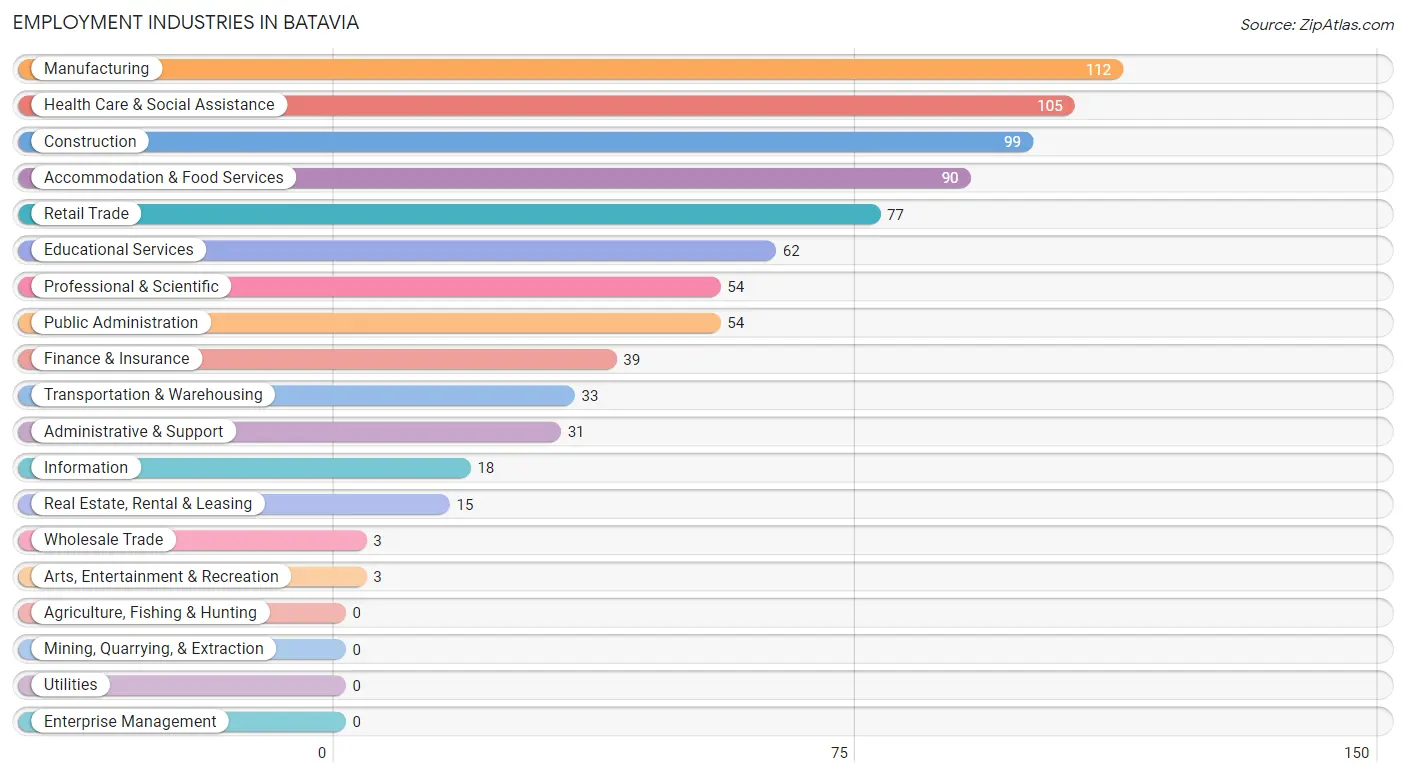
Employment Industries in Batavia
The major employment industries in Batavia include Manufacturing (112 | 13.0%), Health Care & Social Assistance (105 | 12.2%), Construction (99 | 11.5%), Accommodation & Food Services (90 | 10.5%), and Retail Trade (77 | 9.0%).
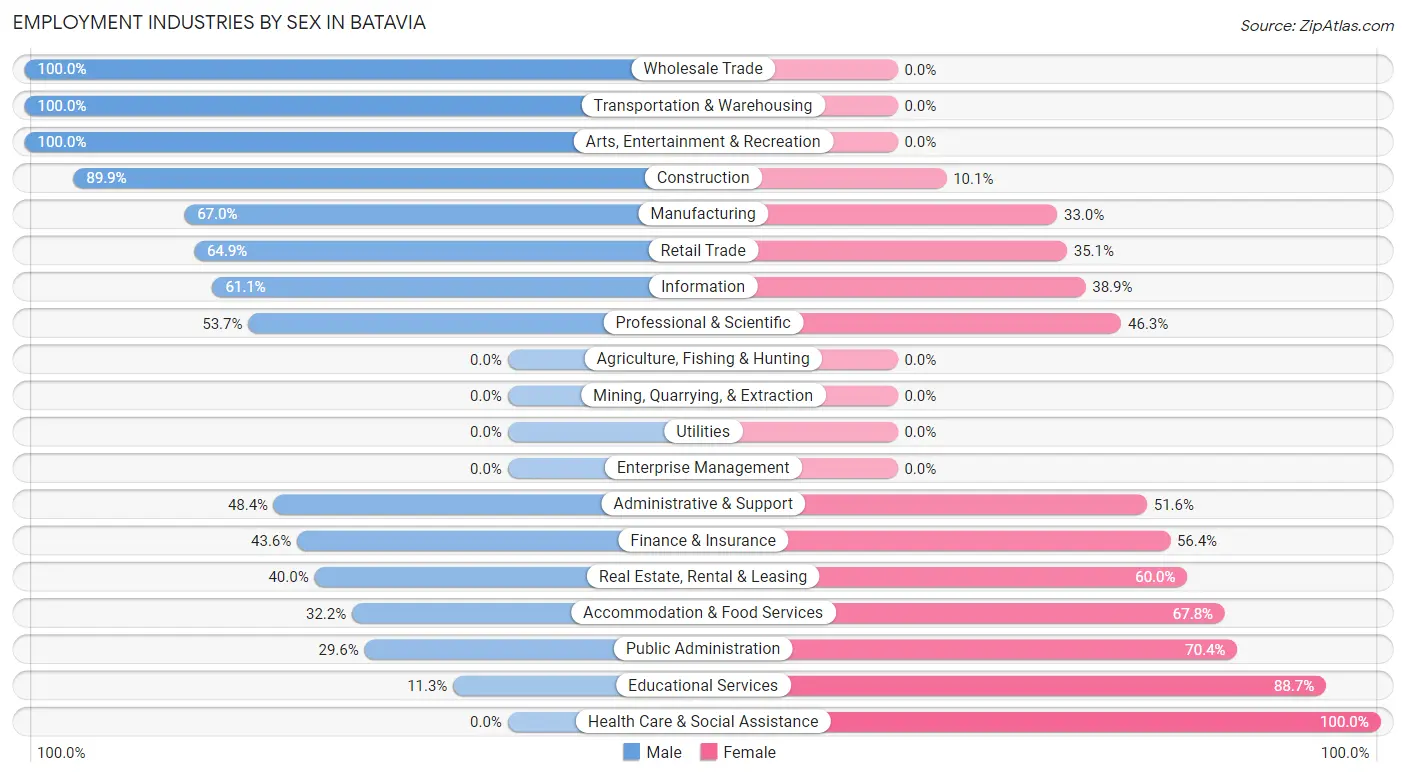
Employment Industries by Sex in Batavia
The Batavia industries that see more men than women are Wholesale Trade (100.0%), Transportation & Warehousing (100.0%), and Arts, Entertainment & Recreation (100.0%), whereas the industries that tend to have a higher number of women are Health Care & Social Assistance (100.0%), Educational Services (88.7%), and Public Administration (70.4%).
| Industry | Male | Female |
| Agriculture, Fishing & Hunting | 0 (0.0%) | 0 (0.0%) |
| Mining, Quarrying, & Extraction | 0 (0.0%) | 0 (0.0%) |
| Construction | 89 (89.9%) | 10 (10.1%) |
| Manufacturing | 75 (67.0%) | 37 (33.0%) |
| Wholesale Trade | 3 (100.0%) | 0 (0.0%) |
| Retail Trade | 50 (64.9%) | 27 (35.1%) |
| Transportation & Warehousing | 33 (100.0%) | 0 (0.0%) |
| Utilities | 0 (0.0%) | 0 (0.0%) |
| Information | 11 (61.1%) | 7 (38.9%) |
| Finance & Insurance | 17 (43.6%) | 22 (56.4%) |
| Real Estate, Rental & Leasing | 6 (40.0%) | 9 (60.0%) |
| Professional & Scientific | 29 (53.7%) | 25 (46.3%) |
| Enterprise Management | 0 (0.0%) | 0 (0.0%) |
| Administrative & Support | 15 (48.4%) | 16 (51.6%) |
| Educational Services | 7 (11.3%) | 55 (88.7%) |
| Health Care & Social Assistance | 0 (0.0%) | 105 (100.0%) |
| Arts, Entertainment & Recreation | 3 (100.0%) | 0 (0.0%) |
| Accommodation & Food Services | 29 (32.2%) | 61 (67.8%) |
| Public Administration | 16 (29.6%) | 38 (70.4%) |
| Total | 414 (48.2%) | 445 (51.8%) |
Education in Batavia
School Enrollment in Batavia
The most common levels of schooling among the 428 students in Batavia are high school (104 | 24.3%), middle school (88 | 20.6%), and elementary school (85 | 19.9%).
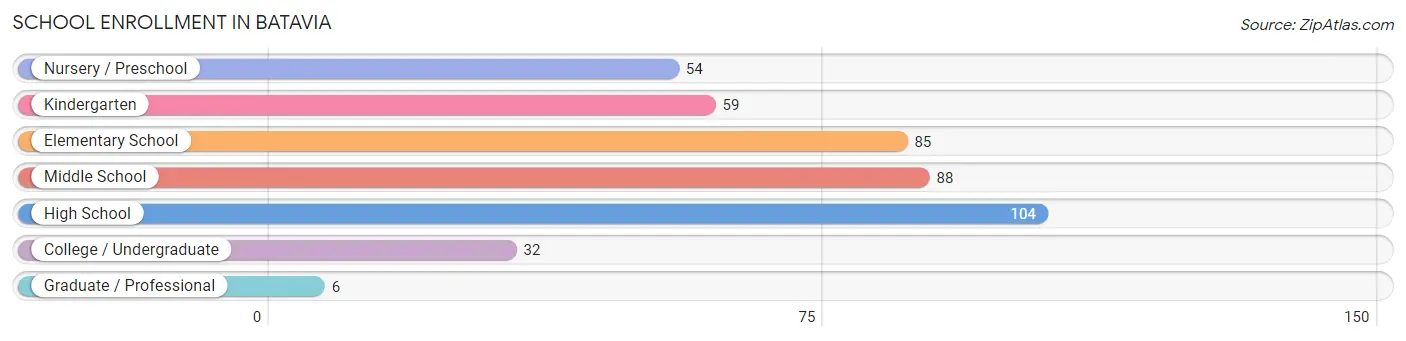
| School Level | # Students | % Students |
| Nursery / Preschool | 54 | 12.6% |
| Kindergarten | 59 | 13.8% |
| Elementary School | 85 | 19.9% |
| Middle School | 88 | 20.6% |
| High School | 104 | 24.3% |
| College / Undergraduate | 32 | 7.5% |
| Graduate / Professional | 6 | 1.4% |
| Total | 428 | 100.0% |
School Enrollment by Age by Funding Source in Batavia
Out of a total of 428 students who are enrolled in schools in Batavia, 56 (13.1%) attend a private institution, while the remaining 372 (86.9%) are enrolled in public schools. The age group of 25 to 34 year olds has the highest likelihood of being enrolled in private schools, with 6 (60.0% in the age bracket) enrolled. Conversely, the age group of 18 to 19 year olds has the lowest likelihood of being enrolled in a private school, with 21 (100.0% in the age bracket) attending a public institution.
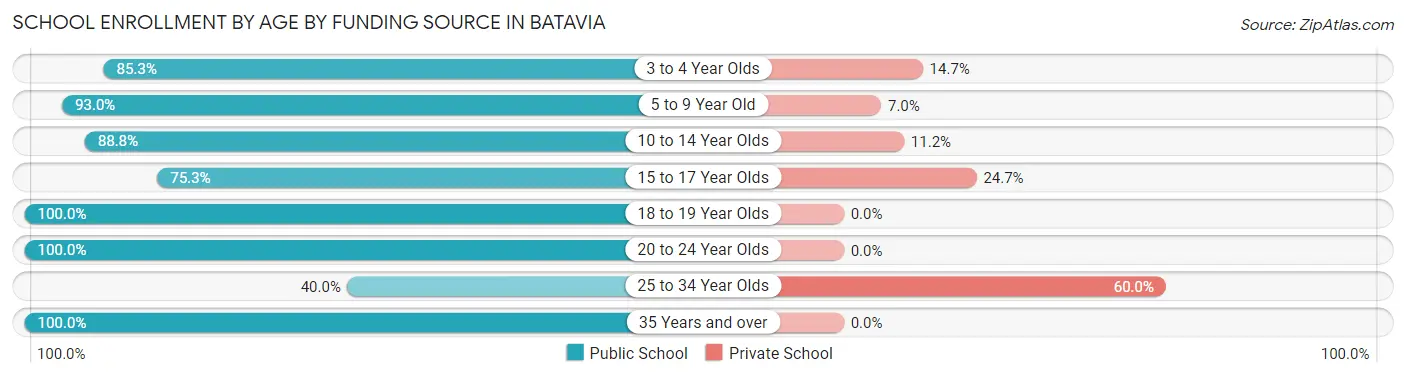
| Age Bracket | Public School | Private School |
| 3 to 4 Year Olds | 29 (85.3%) | 5 (14.7%) |
| 5 to 9 Year Old | 147 (93.0%) | 11 (7.0%) |
| 10 to 14 Year Olds | 87 (88.8%) | 11 (11.2%) |
| 15 to 17 Year Olds | 70 (75.3%) | 23 (24.7%) |
| 18 to 19 Year Olds | 21 (100.0%) | 0 (0.0%) |
| 20 to 24 Year Olds | 11 (100.0%) | 0 (0.0%) |
| 25 to 34 Year Olds | 4 (40.0%) | 6 (60.0%) |
| 35 Years and over | 3 (100.0%) | 0 (0.0%) |
| Total | 372 (86.9%) | 56 (13.1%) |
Educational Attainment by Field of Study in Batavia
Education (48 | 17.8%), business (45 | 16.7%), science & technology (36 | 13.3%), liberal arts & history (34 | 12.6%), and visual & performing arts (23 | 8.5%) are the most common fields of study among 270 individuals in Batavia who have obtained a bachelor's degree or higher.
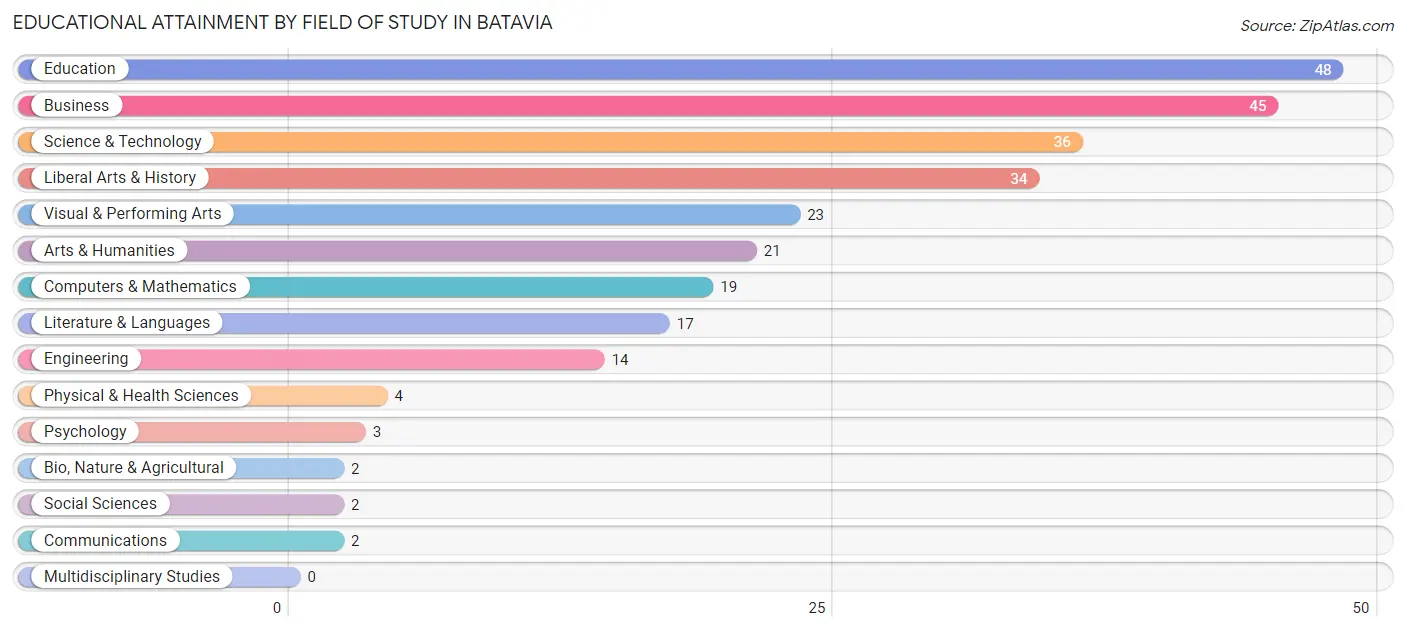
| Field of Study | # Graduates | % Graduates |
| Computers & Mathematics | 19 | 7.0% |
| Bio, Nature & Agricultural | 2 | 0.7% |
| Physical & Health Sciences | 4 | 1.5% |
| Psychology | 3 | 1.1% |
| Social Sciences | 2 | 0.7% |
| Engineering | 14 | 5.2% |
| Multidisciplinary Studies | 0 | 0.0% |
| Science & Technology | 36 | 13.3% |
| Business | 45 | 16.7% |
| Education | 48 | 17.8% |
| Literature & Languages | 17 | 6.3% |
| Liberal Arts & History | 34 | 12.6% |
| Visual & Performing Arts | 23 | 8.5% |
| Communications | 2 | 0.7% |
| Arts & Humanities | 21 | 7.8% |
| Total | 270 | 100.0% |
Transportation & Commute in Batavia
Vehicle Availability by Sex in Batavia
The most prevalent vehicle ownership categories in Batavia are males with 2 vehicles (113, accounting for 29.3%) and females with 2 vehicles (183, making up 25.7%).
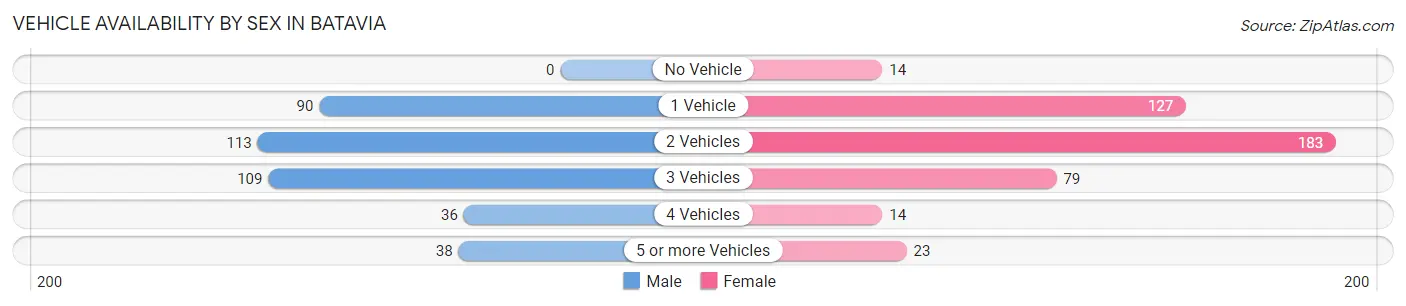
| Vehicles Available | Male | Female |
| No Vehicle | 0 (0.0%) | 14 (3.2%) |
| 1 Vehicle | 90 (23.3%) | 127 (28.9%) |
| 2 Vehicles | 113 (29.3%) | 183 (41.6%) |
| 3 Vehicles | 109 (28.2%) | 79 (17.9%) |
| 4 Vehicles | 36 (9.3%) | 14 (3.2%) |
| 5 or more Vehicles | 38 (9.8%) | 23 (5.2%) |
| Total | 386 (100.0%) | 440 (100.0%) |
Commute Time in Batavia
The most frequently occuring commute durations in Batavia are 5 to 9 minutes (160 commuters, 21.6%), 45 to 59 minutes (123 commuters, 16.6%), and 15 to 19 minutes (91 commuters, 12.3%).
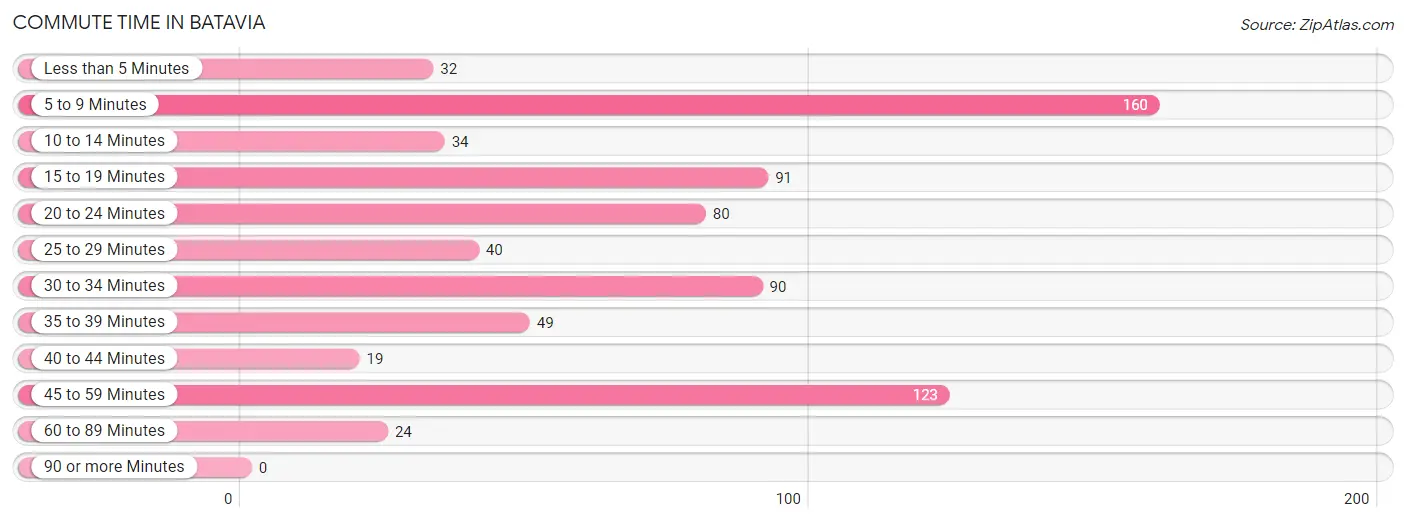
| Commute Time | # Commuters | % Commuters |
| Less than 5 Minutes | 32 | 4.3% |
| 5 to 9 Minutes | 160 | 21.6% |
| 10 to 14 Minutes | 34 | 4.6% |
| 15 to 19 Minutes | 91 | 12.3% |
| 20 to 24 Minutes | 80 | 10.8% |
| 25 to 29 Minutes | 40 | 5.4% |
| 30 to 34 Minutes | 90 | 12.1% |
| 35 to 39 Minutes | 49 | 6.6% |
| 40 to 44 Minutes | 19 | 2.6% |
| 45 to 59 Minutes | 123 | 16.6% |
| 60 to 89 Minutes | 24 | 3.2% |
| 90 or more Minutes | 0 | 0.0% |
Commute Time by Sex in Batavia
The most common commute times in Batavia are 45 to 59 minutes (89 commuters, 25.0%) for males and 15 to 19 minutes (87 commuters, 22.5%) for females.
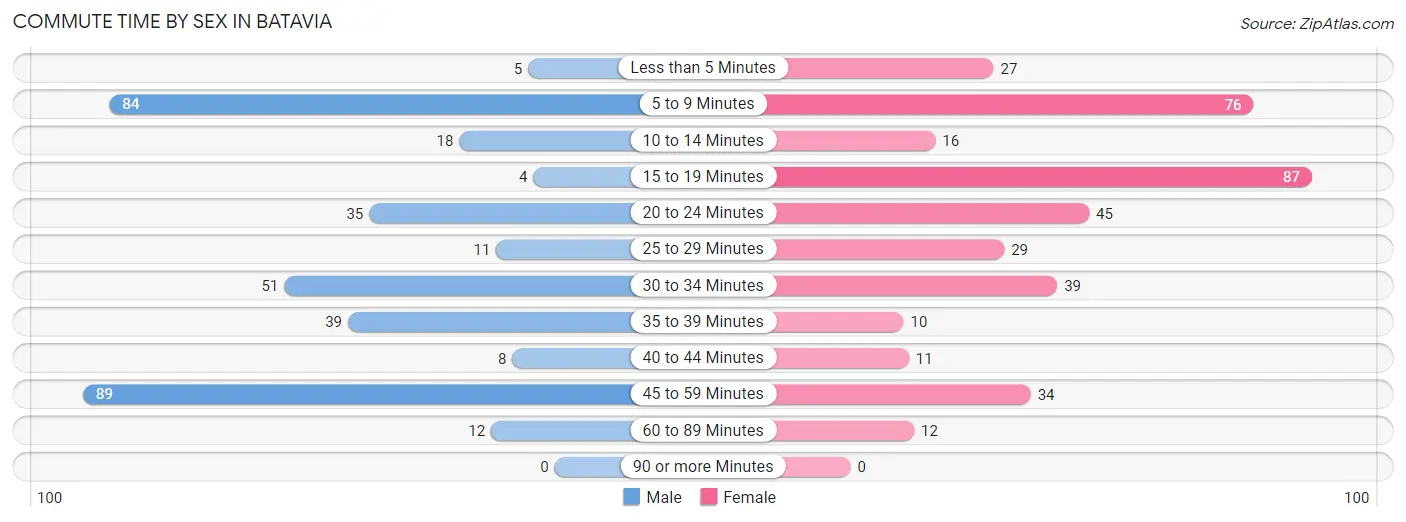
| Commute Time | Male | Female |
| Less than 5 Minutes | 5 (1.4%) | 27 (7.0%) |
| 5 to 9 Minutes | 84 (23.6%) | 76 (19.7%) |
| 10 to 14 Minutes | 18 (5.1%) | 16 (4.2%) |
| 15 to 19 Minutes | 4 (1.1%) | 87 (22.5%) |
| 20 to 24 Minutes | 35 (9.8%) | 45 (11.7%) |
| 25 to 29 Minutes | 11 (3.1%) | 29 (7.5%) |
| 30 to 34 Minutes | 51 (14.3%) | 39 (10.1%) |
| 35 to 39 Minutes | 39 (11.0%) | 10 (2.6%) |
| 40 to 44 Minutes | 8 (2.2%) | 11 (2.9%) |
| 45 to 59 Minutes | 89 (25.0%) | 34 (8.8%) |
| 60 to 89 Minutes | 12 (3.4%) | 12 (3.1%) |
| 90 or more Minutes | 0 (0.0%) | 0 (0.0%) |
Time of Departure to Work by Sex in Batavia
The most frequent times of departure to work in Batavia are 6:30 AM to 6:59 AM (55, 15.4%) for males and 8:00 AM to 8:29 AM (85, 22.0%) for females.
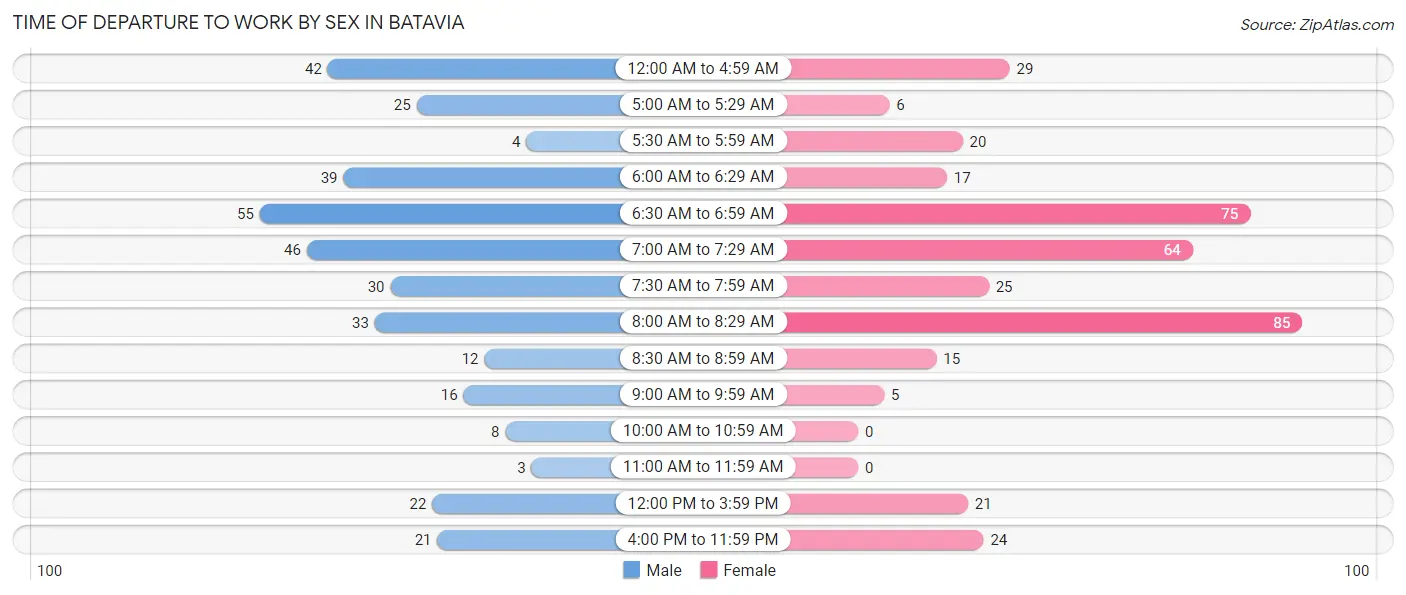
| Time of Departure | Male | Female |
| 12:00 AM to 4:59 AM | 42 (11.8%) | 29 (7.5%) |
| 5:00 AM to 5:29 AM | 25 (7.0%) | 6 (1.5%) |
| 5:30 AM to 5:59 AM | 4 (1.1%) | 20 (5.2%) |
| 6:00 AM to 6:29 AM | 39 (11.0%) | 17 (4.4%) |
| 6:30 AM to 6:59 AM | 55 (15.4%) | 75 (19.4%) |
| 7:00 AM to 7:29 AM | 46 (12.9%) | 64 (16.6%) |
| 7:30 AM to 7:59 AM | 30 (8.4%) | 25 (6.5%) |
| 8:00 AM to 8:29 AM | 33 (9.3%) | 85 (22.0%) |
| 8:30 AM to 8:59 AM | 12 (3.4%) | 15 (3.9%) |
| 9:00 AM to 9:59 AM | 16 (4.5%) | 5 (1.3%) |
| 10:00 AM to 10:59 AM | 8 (2.2%) | 0 (0.0%) |
| 11:00 AM to 11:59 AM | 3 (0.8%) | 0 (0.0%) |
| 12:00 PM to 3:59 PM | 22 (6.2%) | 21 (5.4%) |
| 4:00 PM to 11:59 PM | 21 (5.9%) | 24 (6.2%) |
| Total | 356 (100.0%) | 386 (100.0%) |
Housing Occupancy in Batavia
Occupancy by Ownership in Batavia
Of the total 839 dwellings in Batavia, owner-occupied units account for 433 (51.6%), while renter-occupied units make up 406 (48.4%).
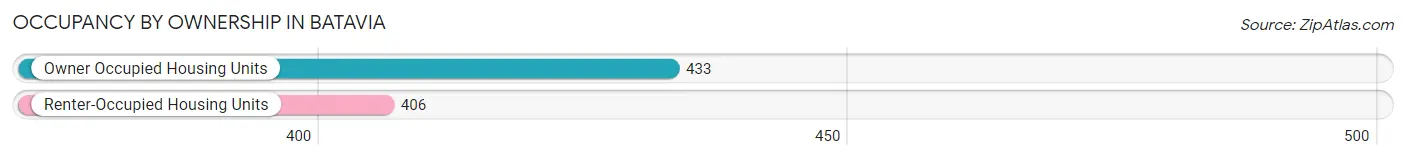
| Occupancy | # Housing Units | % Housing Units |
| Owner Occupied Housing Units | 433 | 51.6% |
| Renter-Occupied Housing Units | 406 | 48.4% |
| Total Occupied Housing Units | 839 | 100.0% |
Occupancy by Household Size in Batavia
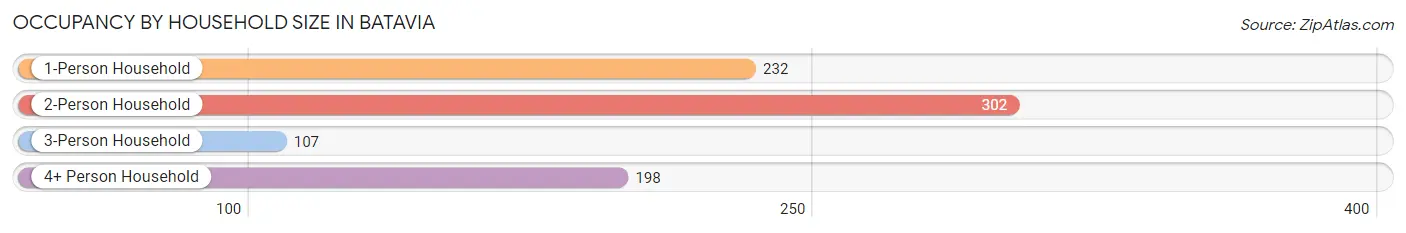
| Household Size | # Housing Units | % Housing Units |
| 1-Person Household | 232 | 27.7% |
| 2-Person Household | 302 | 36.0% |
| 3-Person Household | 107 | 12.8% |
| 4+ Person Household | 198 | 23.6% |
| Total Housing Units | 839 | 100.0% |
Occupancy by Ownership by Household Size in Batavia
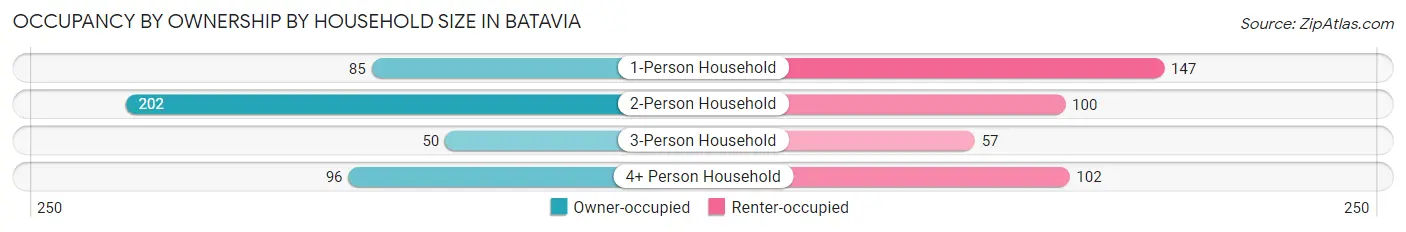
| Household Size | Owner-occupied | Renter-occupied |
| 1-Person Household | 85 (36.6%) | 147 (63.4%) |
| 2-Person Household | 202 (66.9%) | 100 (33.1%) |
| 3-Person Household | 50 (46.7%) | 57 (53.3%) |
| 4+ Person Household | 96 (48.5%) | 102 (51.5%) |
| Total Housing Units | 433 (51.6%) | 406 (48.4%) |
Occupancy by Educational Attainment in Batavia
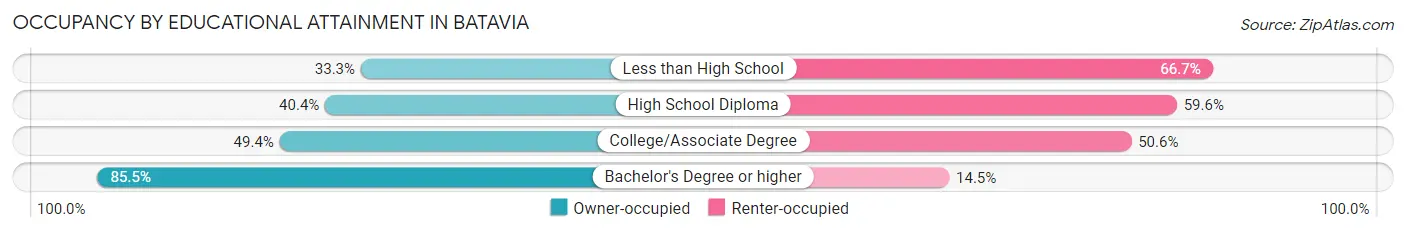
| Household Size | Owner-occupied | Renter-occupied |
| Less than High School | 23 (33.3%) | 46 (66.7%) |
| High School Diploma | 137 (40.4%) | 202 (59.6%) |
| College/Associate Degree | 131 (49.4%) | 134 (50.6%) |
| Bachelor's Degree or higher | 142 (85.5%) | 24 (14.5%) |
Occupancy by Age of Householder in Batavia
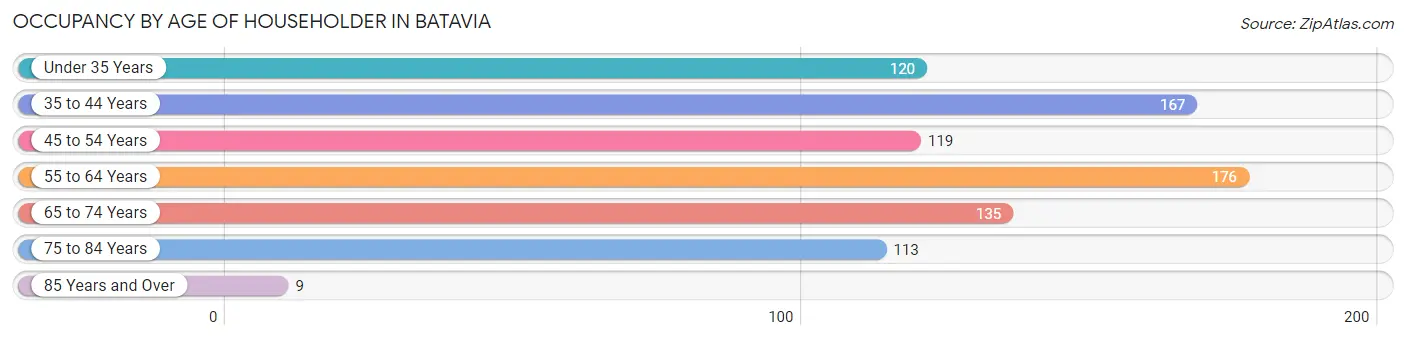
| Age Bracket | # Households | % Households |
| Under 35 Years | 120 | 14.3% |
| 35 to 44 Years | 167 | 19.9% |
| 45 to 54 Years | 119 | 14.2% |
| 55 to 64 Years | 176 | 21.0% |
| 65 to 74 Years | 135 | 16.1% |
| 75 to 84 Years | 113 | 13.5% |
| 85 Years and Over | 9 | 1.1% |
| Total | 839 | 100.0% |
Housing Finances in Batavia
Median Income by Occupancy in Batavia
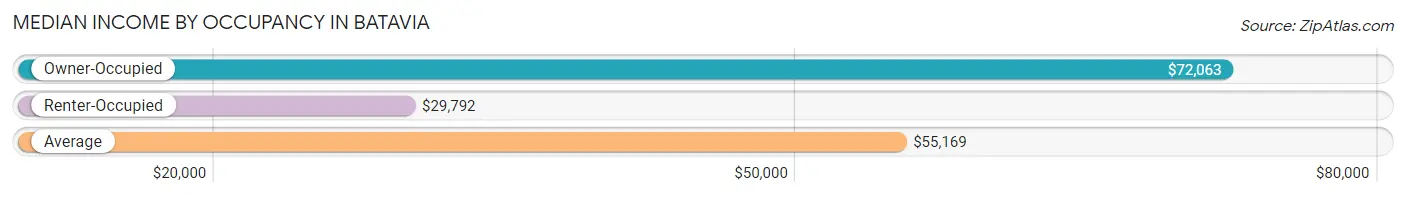
| Occupancy Type | # Households | Median Income |
| Owner-Occupied | 433 (51.6%) | $72,063 |
| Renter-Occupied | 406 (48.4%) | $29,792 |
| Average | 839 (100.0%) | $55,169 |
Occupancy by Householder Income Bracket in Batavia
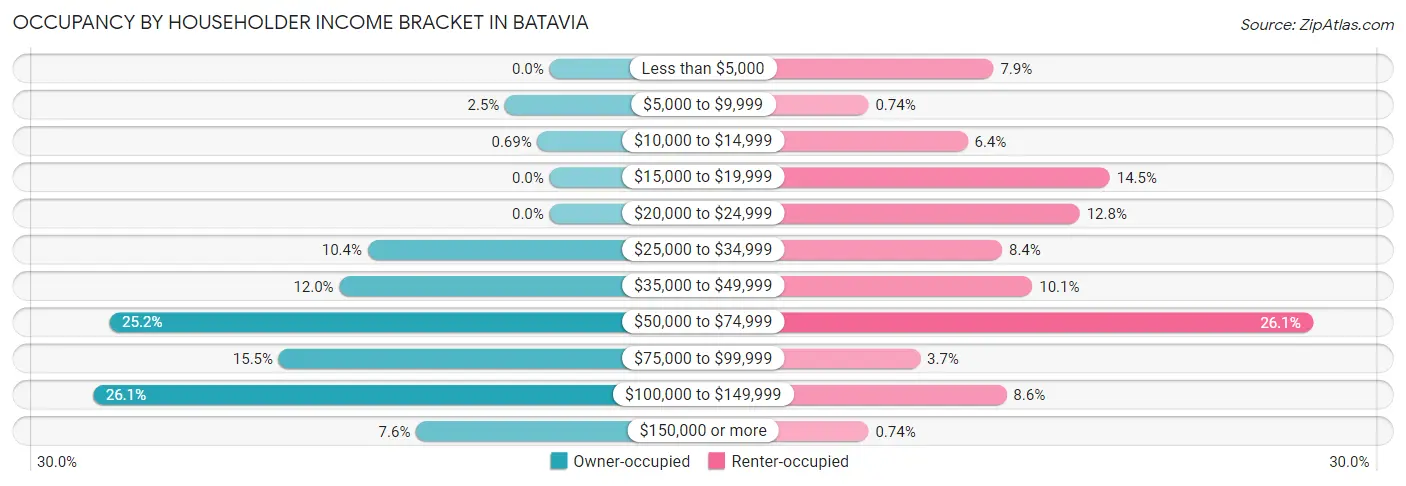
| Income Bracket | Owner-occupied | Renter-occupied |
| Less than $5,000 | 0 (0.0%) | 32 (7.9%) |
| $5,000 to $9,999 | 11 (2.5%) | 3 (0.7%) |
| $10,000 to $14,999 | 3 (0.7%) | 26 (6.4%) |
| $15,000 to $19,999 | 0 (0.0%) | 59 (14.5%) |
| $20,000 to $24,999 | 0 (0.0%) | 52 (12.8%) |
| $25,000 to $34,999 | 45 (10.4%) | 34 (8.4%) |
| $35,000 to $49,999 | 52 (12.0%) | 41 (10.1%) |
| $50,000 to $74,999 | 109 (25.2%) | 106 (26.1%) |
| $75,000 to $99,999 | 67 (15.5%) | 15 (3.7%) |
| $100,000 to $149,999 | 113 (26.1%) | 35 (8.6%) |
| $150,000 or more | 33 (7.6%) | 3 (0.7%) |
| Total | 433 (100.0%) | 406 (100.0%) |
Monthly Housing Cost Tiers in Batavia
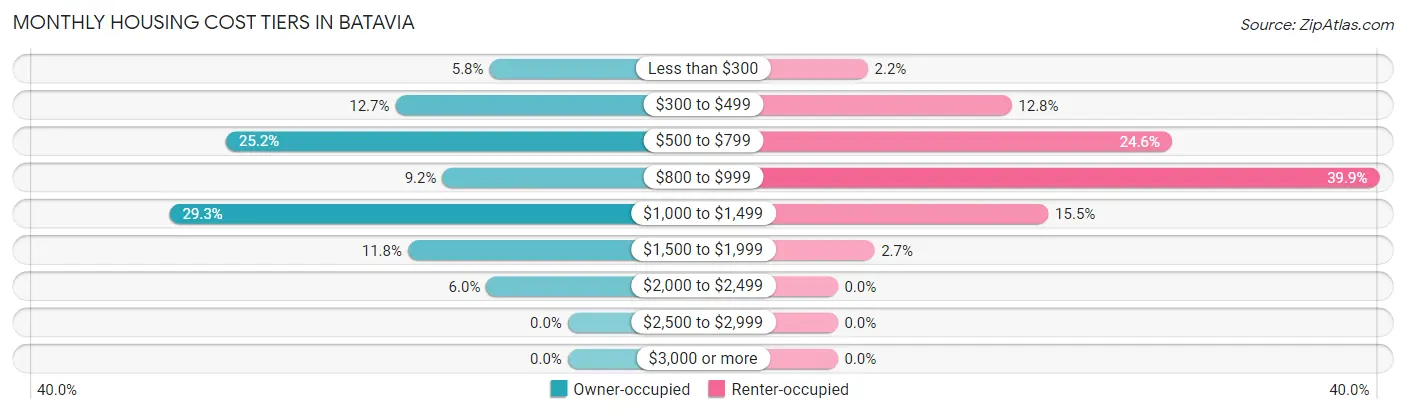
| Monthly Cost | Owner-occupied | Renter-occupied |
| Less than $300 | 25 (5.8%) | 9 (2.2%) |
| $300 to $499 | 55 (12.7%) | 52 (12.8%) |
| $500 to $799 | 109 (25.2%) | 100 (24.6%) |
| $800 to $999 | 40 (9.2%) | 162 (39.9%) |
| $1,000 to $1,499 | 127 (29.3%) | 63 (15.5%) |
| $1,500 to $1,999 | 51 (11.8%) | 11 (2.7%) |
| $2,000 to $2,499 | 26 (6.0%) | 0 (0.0%) |
| $2,500 to $2,999 | 0 (0.0%) | 0 (0.0%) |
| $3,000 or more | 0 (0.0%) | 0 (0.0%) |
| Total | 433 (100.0%) | 406 (100.0%) |
Physical Housing Characteristics in Batavia
Housing Structures in Batavia
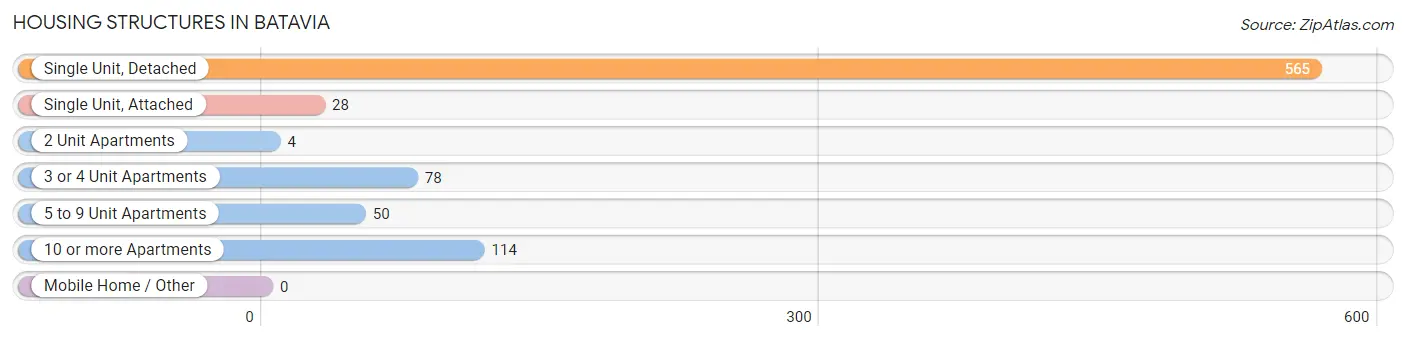
| Structure Type | # Housing Units | % Housing Units |
| Single Unit, Detached | 565 | 67.3% |
| Single Unit, Attached | 28 | 3.3% |
| 2 Unit Apartments | 4 | 0.5% |
| 3 or 4 Unit Apartments | 78 | 9.3% |
| 5 to 9 Unit Apartments | 50 | 6.0% |
| 10 or more Apartments | 114 | 13.6% |
| Mobile Home / Other | 0 | 0.0% |
| Total | 839 | 100.0% |
Housing Structures by Occupancy in Batavia
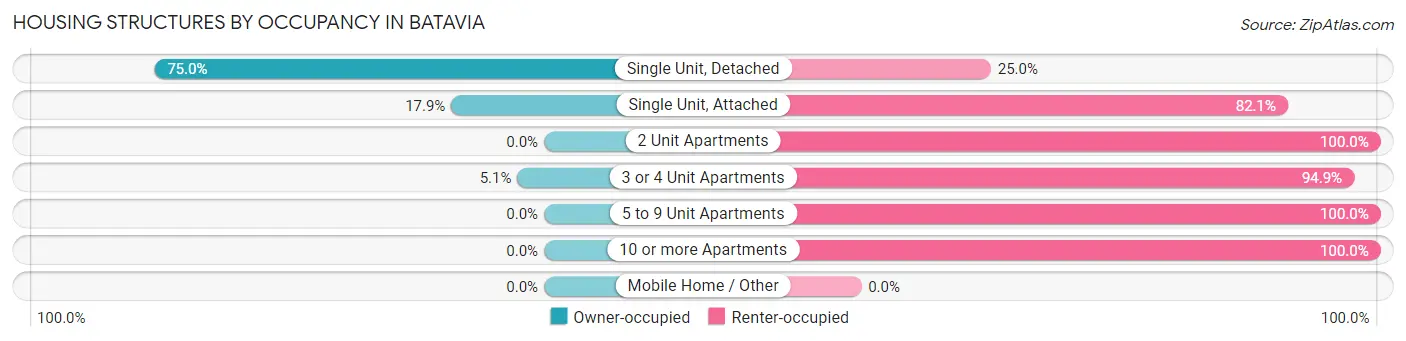
| Structure Type | Owner-occupied | Renter-occupied |
| Single Unit, Detached | 424 (75.0%) | 141 (25.0%) |
| Single Unit, Attached | 5 (17.9%) | 23 (82.1%) |
| 2 Unit Apartments | 0 (0.0%) | 4 (100.0%) |
| 3 or 4 Unit Apartments | 4 (5.1%) | 74 (94.9%) |
| 5 to 9 Unit Apartments | 0 (0.0%) | 50 (100.0%) |
| 10 or more Apartments | 0 (0.0%) | 114 (100.0%) |
| Mobile Home / Other | 0 (0.0%) | 0 (0.0%) |
| Total | 433 (51.6%) | 406 (48.4%) |
Housing Structures by Number of Rooms in Batavia
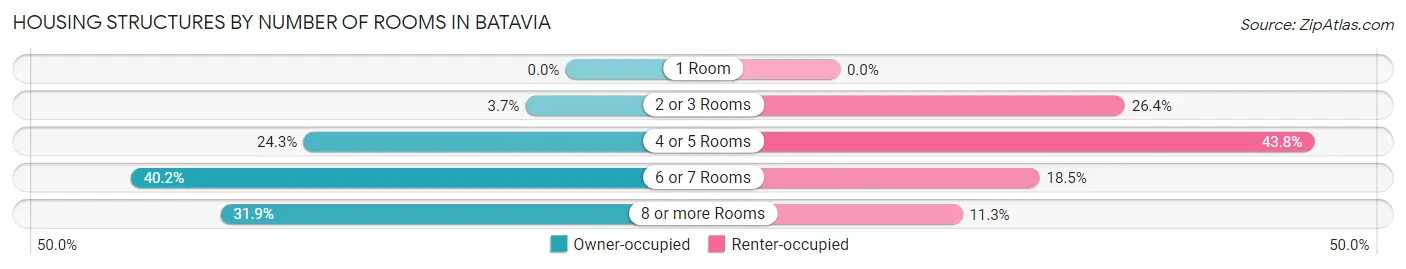
| Number of Rooms | Owner-occupied | Renter-occupied |
| 1 Room | 0 (0.0%) | 0 (0.0%) |
| 2 or 3 Rooms | 16 (3.7%) | 107 (26.4%) |
| 4 or 5 Rooms | 105 (24.2%) | 178 (43.8%) |
| 6 or 7 Rooms | 174 (40.2%) | 75 (18.5%) |
| 8 or more Rooms | 138 (31.9%) | 46 (11.3%) |
| Total | 433 (100.0%) | 406 (100.0%) |
Housing Structure by Heating Type in Batavia
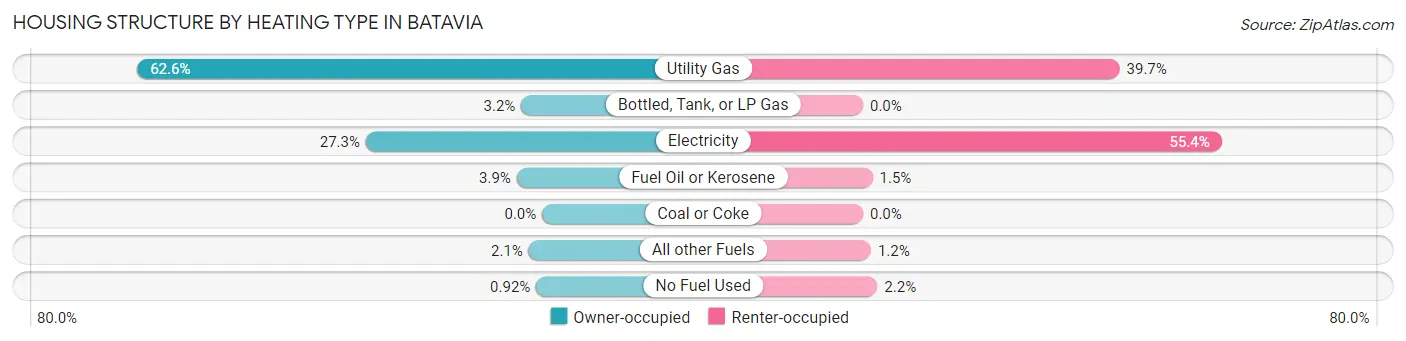
| Heating Type | Owner-occupied | Renter-occupied |
| Utility Gas | 271 (62.6%) | 161 (39.7%) |
| Bottled, Tank, or LP Gas | 14 (3.2%) | 0 (0.0%) |
| Electricity | 118 (27.3%) | 225 (55.4%) |
| Fuel Oil or Kerosene | 17 (3.9%) | 6 (1.5%) |
| Coal or Coke | 0 (0.0%) | 0 (0.0%) |
| All other Fuels | 9 (2.1%) | 5 (1.2%) |
| No Fuel Used | 4 (0.9%) | 9 (2.2%) |
| Total | 433 (100.0%) | 406 (100.0%) |
Household Vehicle Usage in Batavia
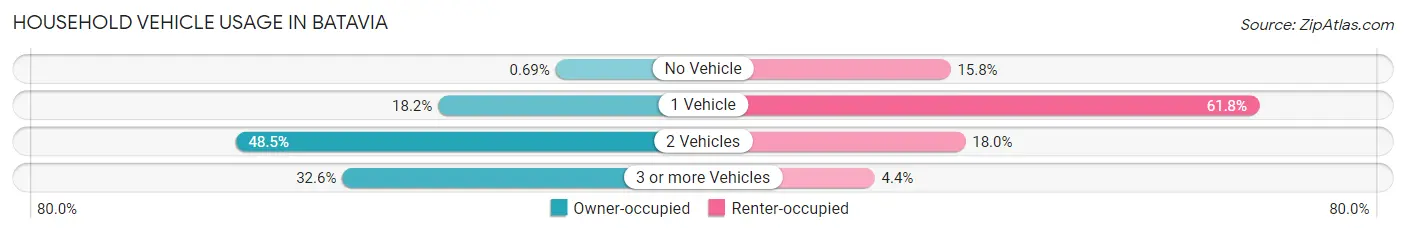
| Vehicles per Household | Owner-occupied | Renter-occupied |
| No Vehicle | 3 (0.7%) | 64 (15.8%) |
| 1 Vehicle | 79 (18.2%) | 251 (61.8%) |
| 2 Vehicles | 210 (48.5%) | 73 (18.0%) |
| 3 or more Vehicles | 141 (32.6%) | 18 (4.4%) |
| Total | 433 (100.0%) | 406 (100.0%) |
Real Estate & Mortgages in Batavia
Real Estate and Mortgage Overview in Batavia
| Characteristic | Without Mortgage | With Mortgage |
| Housing Units | 157 | 276 |
| Median Property Value | $209,300 | $165,200 |
| Median Household Income | $89,750 | $20 |
| Monthly Housing Costs | $503 | $0 |
| Real Estate Taxes | $1,542 | $3 |
Property Value by Mortgage Status in Batavia
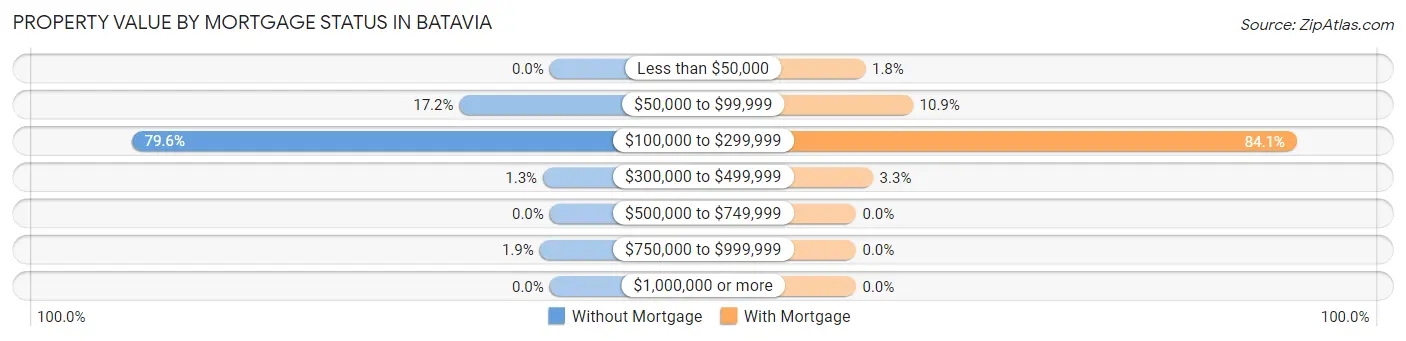
| Property Value | Without Mortgage | With Mortgage |
| Less than $50,000 | 0 (0.0%) | 5 (1.8%) |
| $50,000 to $99,999 | 27 (17.2%) | 30 (10.9%) |
| $100,000 to $299,999 | 125 (79.6%) | 232 (84.1%) |
| $300,000 to $499,999 | 2 (1.3%) | 9 (3.3%) |
| $500,000 to $749,999 | 0 (0.0%) | 0 (0.0%) |
| $750,000 to $999,999 | 3 (1.9%) | 0 (0.0%) |
| $1,000,000 or more | 0 (0.0%) | 0 (0.0%) |
| Total | 157 (100.0%) | 276 (100.0%) |
Household Income by Mortgage Status in Batavia
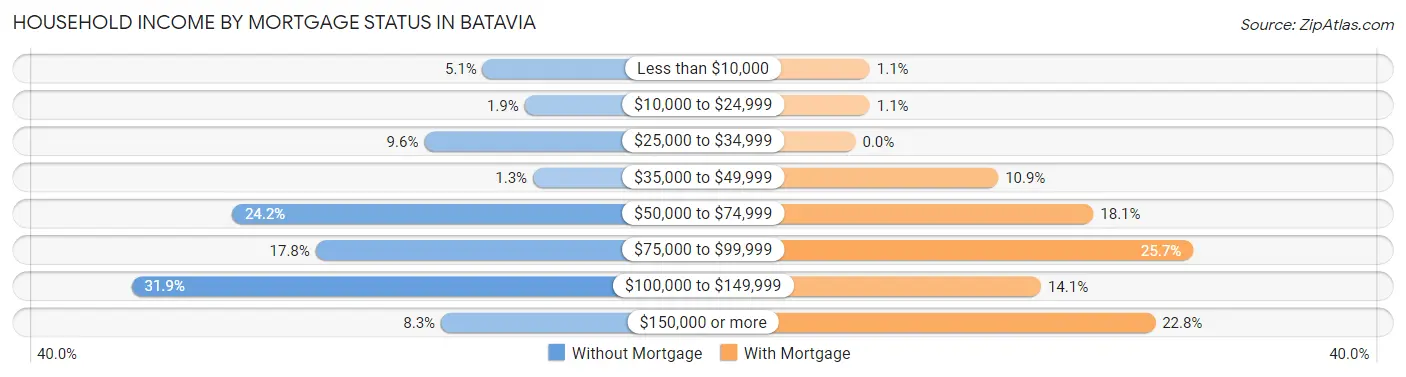
| Household Income | Without Mortgage | With Mortgage |
| Less than $10,000 | 8 (5.1%) | 3 (1.1%) |
| $10,000 to $24,999 | 3 (1.9%) | 3 (1.1%) |
| $25,000 to $34,999 | 15 (9.6%) | 0 (0.0%) |
| $35,000 to $49,999 | 2 (1.3%) | 30 (10.9%) |
| $50,000 to $74,999 | 38 (24.2%) | 50 (18.1%) |
| $75,000 to $99,999 | 28 (17.8%) | 71 (25.7%) |
| $100,000 to $149,999 | 50 (31.9%) | 39 (14.1%) |
| $150,000 or more | 13 (8.3%) | 63 (22.8%) |
| Total | 157 (100.0%) | 276 (100.0%) |
Property Value to Household Income Ratio in Batavia
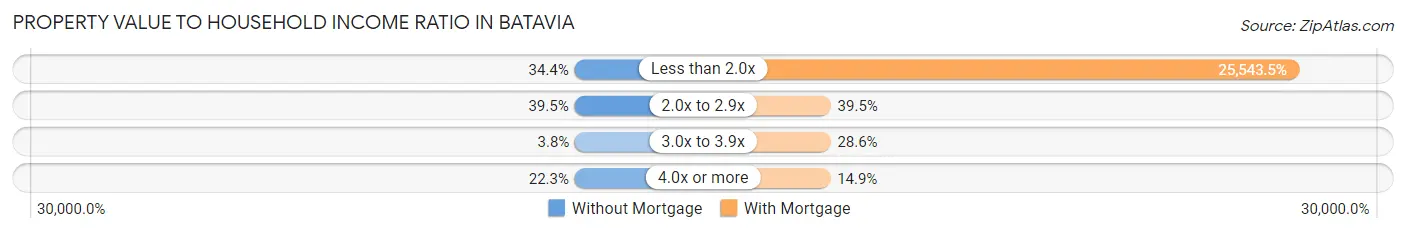
| Value-to-Income Ratio | Without Mortgage | With Mortgage |
| Less than 2.0x | 54 (34.4%) | 70,500 (25,543.5%) |
| 2.0x to 2.9x | 62 (39.5%) | 109 (39.5%) |
| 3.0x to 3.9x | 6 (3.8%) | 79 (28.6%) |
| 4.0x or more | 35 (22.3%) | 41 (14.9%) |
| Total | 157 (100.0%) | 276 (100.0%) |
Real Estate Taxes by Mortgage Status in Batavia
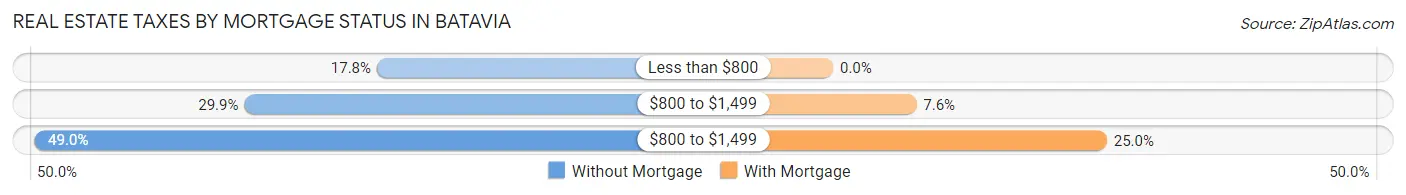
| Property Taxes | Without Mortgage | With Mortgage |
| Less than $800 | 28 (17.8%) | 0 (0.0%) |
| $800 to $1,499 | 47 (29.9%) | 21 (7.6%) |
| $800 to $1,499 | 77 (49.0%) | 69 (25.0%) |
| Total | 157 (100.0%) | 276 (100.0%) |
Health & Disability in Batavia
Health Insurance Coverage by Age in Batavia
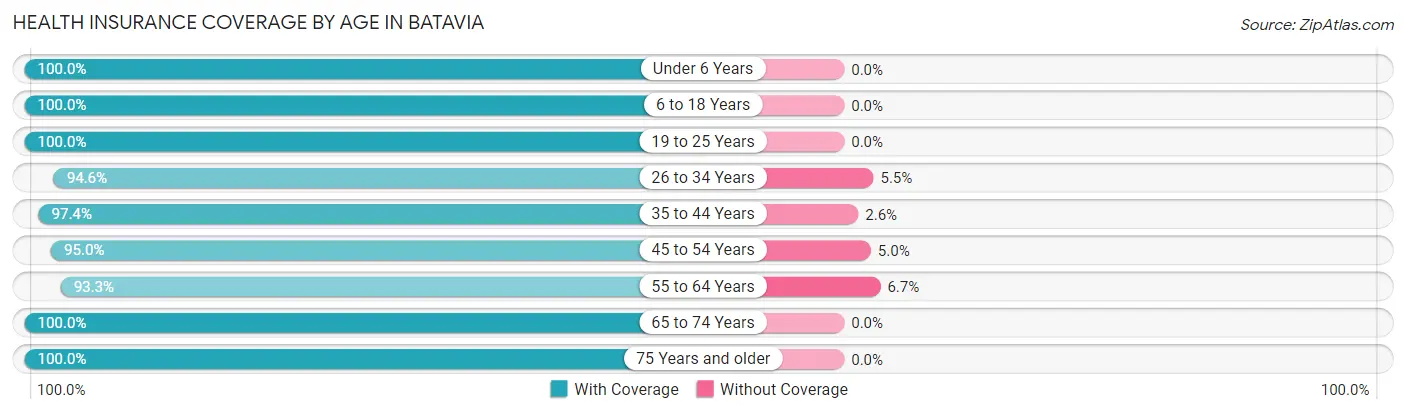
| Age Bracket | With Coverage | Without Coverage |
| Under 6 Years | 192 (100.0%) | 0 (0.0%) |
| 6 to 18 Years | 322 (100.0%) | 0 (0.0%) |
| 19 to 25 Years | 96 (100.0%) | 0 (0.0%) |
| 26 to 34 Years | 347 (94.6%) | 20 (5.4%) |
| 35 to 44 Years | 335 (97.4%) | 9 (2.6%) |
| 45 to 54 Years | 230 (95.0%) | 12 (5.0%) |
| 55 to 64 Years | 346 (93.3%) | 25 (6.7%) |
| 65 to 74 Years | 205 (100.0%) | 0 (0.0%) |
| 75 Years and older | 170 (100.0%) | 0 (0.0%) |
| Total | 2,243 (97.1%) | 66 (2.9%) |
Health Insurance Coverage by Citizenship Status in Batavia
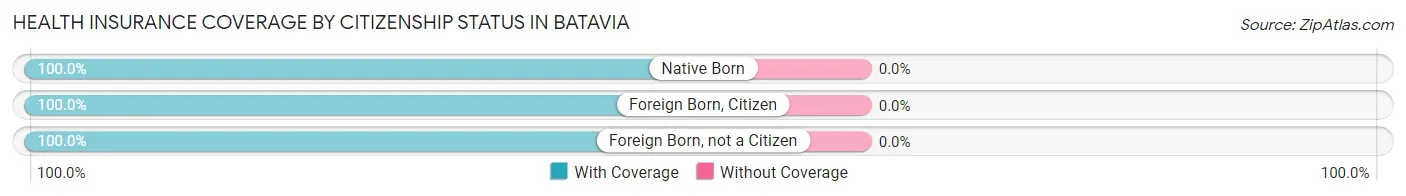
| Citizenship Status | With Coverage | Without Coverage |
| Native Born | 192 (100.0%) | 0 (0.0%) |
| Foreign Born, Citizen | 322 (100.0%) | 0 (0.0%) |
| Foreign Born, not a Citizen | 96 (100.0%) | 0 (0.0%) |
Health Insurance Coverage by Household Income in Batavia
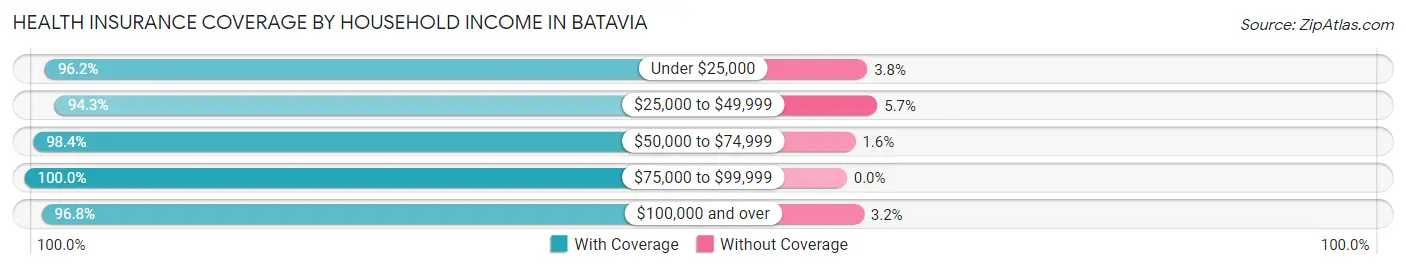
| Household Income | With Coverage | Without Coverage |
| Under $25,000 | 402 (96.2%) | 16 (3.8%) |
| $25,000 to $49,999 | 363 (94.3%) | 22 (5.7%) |
| $50,000 to $74,999 | 546 (98.4%) | 9 (1.6%) |
| $75,000 to $99,999 | 222 (100.0%) | 0 (0.0%) |
| $100,000 and over | 574 (96.8%) | 19 (3.2%) |
Public vs Private Health Insurance Coverage by Age in Batavia
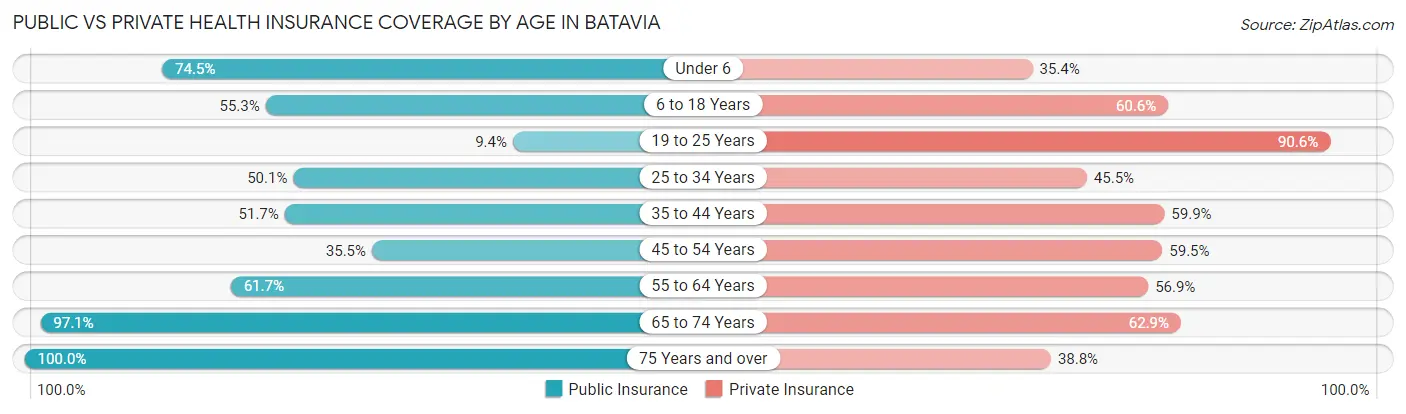
| Age Bracket | Public Insurance | Private Insurance |
| Under 6 | 143 (74.5%) | 68 (35.4%) |
| 6 to 18 Years | 178 (55.3%) | 195 (60.6%) |
| 19 to 25 Years | 9 (9.4%) | 87 (90.6%) |
| 25 to 34 Years | 184 (50.1%) | 167 (45.5%) |
| 35 to 44 Years | 178 (51.7%) | 206 (59.9%) |
| 45 to 54 Years | 86 (35.5%) | 144 (59.5%) |
| 55 to 64 Years | 229 (61.7%) | 211 (56.9%) |
| 65 to 74 Years | 199 (97.1%) | 129 (62.9%) |
| 75 Years and over | 170 (100.0%) | 66 (38.8%) |
| Total | 1,376 (59.6%) | 1,273 (55.1%) |
Disability Status by Sex by Age in Batavia
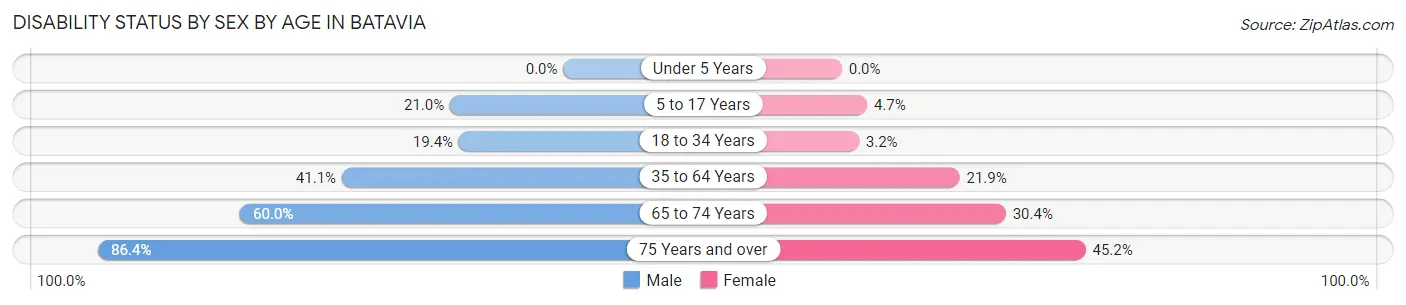
| Age Bracket | Male | Female |
| Under 5 Years | 0 (0.0%) | 0 (0.0%) |
| 5 to 17 Years | 41 (21.0%) | 8 (4.7%) |
| 18 to 34 Years | 57 (19.4%) | 6 (3.2%) |
| 35 to 64 Years | 194 (41.1%) | 106 (21.9%) |
| 65 to 74 Years | 54 (60.0%) | 35 (30.4%) |
| 75 Years and over | 38 (86.4%) | 57 (45.2%) |
Disability Class by Sex by Age in Batavia
Disability Class: Hearing Difficulty
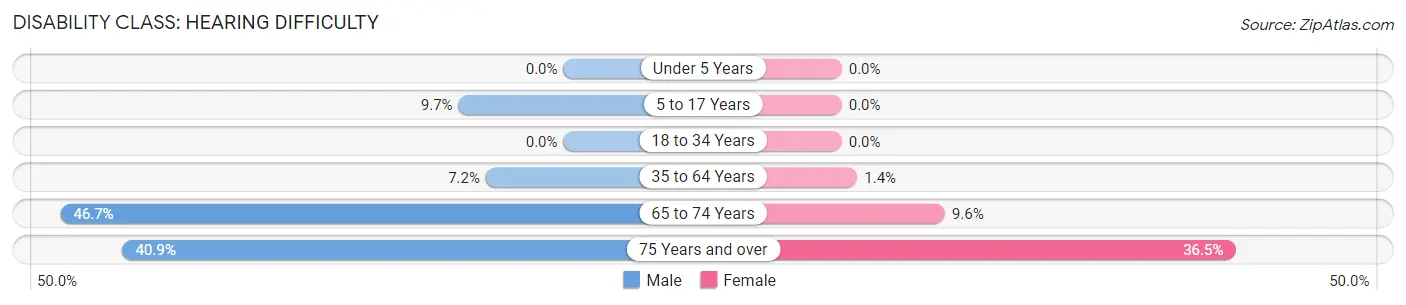
| Age Bracket | Male | Female |
| Under 5 Years | 0 (0.0%) | 0 (0.0%) |
| 5 to 17 Years | 19 (9.7%) | 0 (0.0%) |
| 18 to 34 Years | 0 (0.0%) | 0 (0.0%) |
| 35 to 64 Years | 34 (7.2%) | 7 (1.4%) |
| 65 to 74 Years | 42 (46.7%) | 11 (9.6%) |
| 75 Years and over | 18 (40.9%) | 46 (36.5%) |
Disability Class: Vision Difficulty
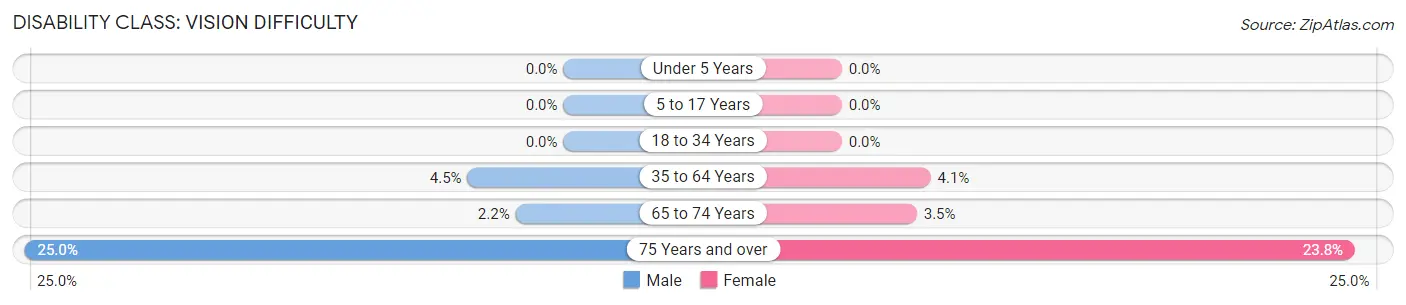
| Age Bracket | Male | Female |
| Under 5 Years | 0 (0.0%) | 0 (0.0%) |
| 5 to 17 Years | 0 (0.0%) | 0 (0.0%) |
| 18 to 34 Years | 0 (0.0%) | 0 (0.0%) |
| 35 to 64 Years | 21 (4.4%) | 20 (4.1%) |
| 65 to 74 Years | 2 (2.2%) | 4 (3.5%) |
| 75 Years and over | 11 (25.0%) | 30 (23.8%) |
Disability Class: Cognitive Difficulty
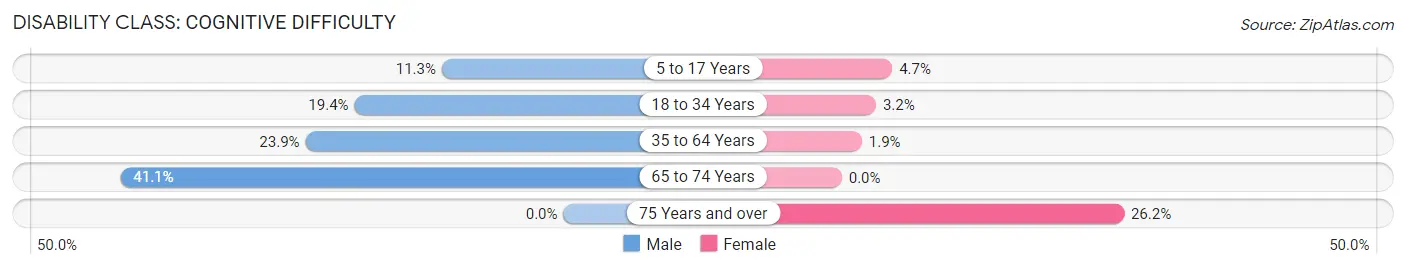
| Age Bracket | Male | Female |
| 5 to 17 Years | 22 (11.3%) | 8 (4.7%) |
| 18 to 34 Years | 57 (19.4%) | 6 (3.2%) |
| 35 to 64 Years | 113 (23.9%) | 9 (1.9%) |
| 65 to 74 Years | 37 (41.1%) | 0 (0.0%) |
| 75 Years and over | 0 (0.0%) | 33 (26.2%) |
Disability Class: Ambulatory Difficulty
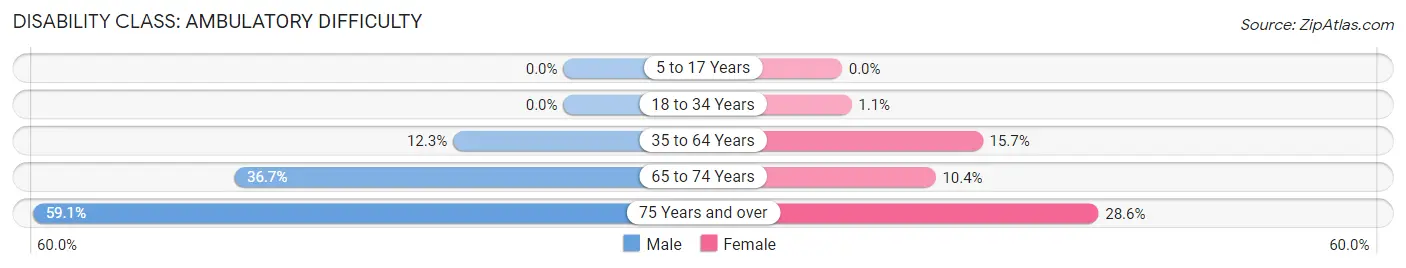
| Age Bracket | Male | Female |
| 5 to 17 Years | 0 (0.0%) | 0 (0.0%) |
| 18 to 34 Years | 0 (0.0%) | 2 (1.1%) |
| 35 to 64 Years | 58 (12.3%) | 76 (15.7%) |
| 65 to 74 Years | 33 (36.7%) | 12 (10.4%) |
| 75 Years and over | 26 (59.1%) | 36 (28.6%) |
Disability Class: Self-Care Difficulty
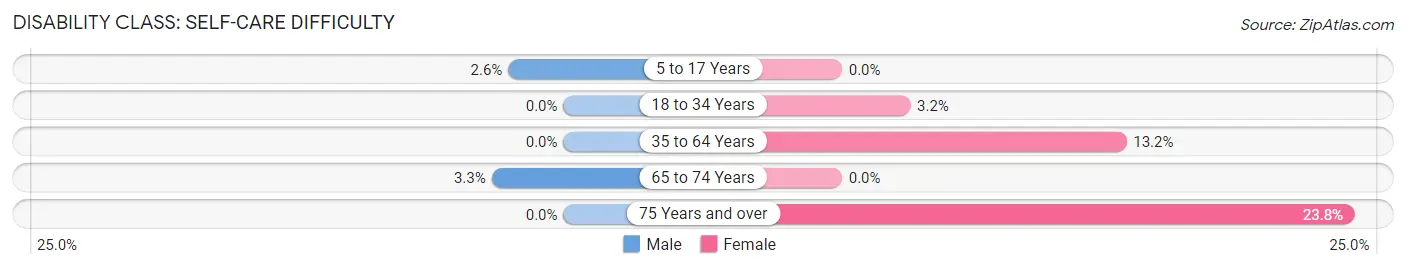
| Age Bracket | Male | Female |
| 5 to 17 Years | 5 (2.6%) | 0 (0.0%) |
| 18 to 34 Years | 0 (0.0%) | 6 (3.2%) |
| 35 to 64 Years | 0 (0.0%) | 64 (13.2%) |
| 65 to 74 Years | 3 (3.3%) | 0 (0.0%) |
| 75 Years and over | 0 (0.0%) | 30 (23.8%) |
Technology Access in Batavia
Computing Device Access in Batavia
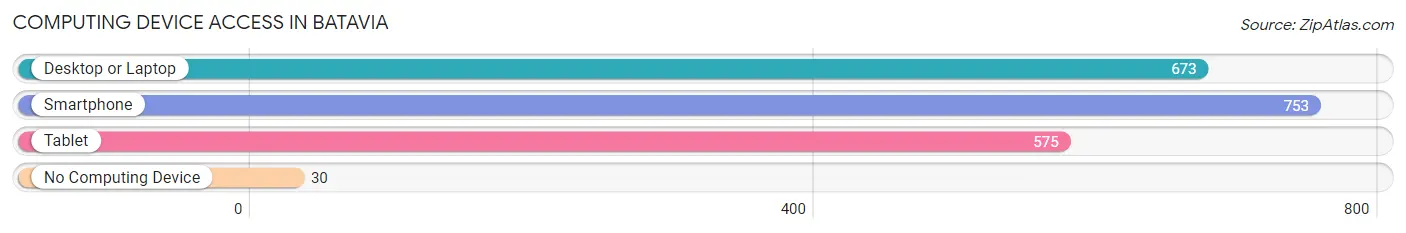
| Device Type | # Households | % Households |
| Desktop or Laptop | 673 | 80.2% |
| Smartphone | 753 | 89.7% |
| Tablet | 575 | 68.5% |
| No Computing Device | 30 | 3.6% |
| Total | 839 | 100.0% |
Internet Access in Batavia
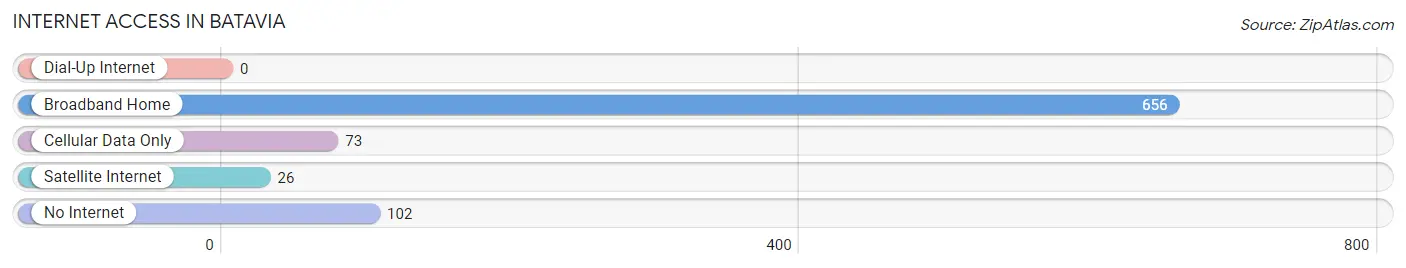
| Internet Type | # Households | % Households |
| Dial-Up Internet | 0 | 0.0% |
| Broadband Home | 656 | 78.2% |
| Cellular Data Only | 73 | 8.7% |
| Satellite Internet | 26 | 3.1% |
| No Internet | 102 | 12.2% |
| Total | 839 | 100.0% |
Batavia Summary
Batavia, Ohio is a small village located in Clermont County, Ohio. It is situated on the banks of the East Fork of the Little Miami River, approximately 25 miles east of Cincinnati. The village has a population of approximately 2,500 people and covers an area of 1.3 square miles.
History
Batavia was founded in 1814 by a group of settlers from New England. The village was named after the city of Batavia in New York, which was the hometown of one of the settlers. The settlers were attracted to the area due to its fertile soil and abundant natural resources. The village was incorporated in 1845 and quickly became a thriving agricultural community.
In the late 19th century, Batavia began to experience a period of growth and development. The village was connected to the outside world by the Cincinnati, Hamilton and Dayton Railroad in 1881. This allowed for the transportation of goods and people to and from the village. The railroad also allowed for the development of industry in the area, including a flour mill, a sawmill, and a brickyard.
Geography
Batavia is located in Clermont County, Ohio. It is situated on the banks of the East Fork of the Little Miami River, approximately 25 miles east of Cincinnati. The village has a total area of 1.3 square miles, all of which is land. The terrain is mostly flat, with some rolling hills in the surrounding area.
The climate in Batavia is classified as humid continental, with hot summers and cold winters. The average temperature in the summer is around 75 degrees Fahrenheit, while the average temperature in the winter is around 30 degrees Fahrenheit. The average annual precipitation is around 40 inches.
Economy
The economy of Batavia is largely based on agriculture and manufacturing. The village is home to several farms, which produce a variety of crops, including corn, soybeans, and wheat. The village also has several manufacturing companies, which produce a variety of products, including furniture, clothing, and automotive parts.
The village also has a number of small businesses, including restaurants, retail stores, and service providers. The village is also home to a number of professional services, such as lawyers, accountants, and doctors.
Demographics
As of the 2010 census, the population of Batavia was 2,500. The racial makeup of the village was 97.2% White, 0.8% African American, 0.4% Native American, 0.4% Asian, and 1.2% from other races. The median household income was $50,000, and the median family income was $60,000.
The village is served by the Batavia Local School District, which consists of two elementary schools, one middle school, and one high school. The village is also home to a branch of the Clermont County Public Library.
Conclusion
Batavia, Ohio is a small village located in Clermont County, Ohio. It is situated on the banks of the East Fork of the Little Miami River, approximately 25 miles east of Cincinnati. The village has a population of approximately 2,500 people and covers an area of 1.3 square miles. The economy of Batavia is largely based on agriculture and manufacturing, and the village is served by the Batavia Local School District. The racial makeup of the village is 97.2% White, 0.8% African American, 0.4% Native American, 0.4% Asian, and 1.2% from other races. The median household income was $50,000, and the median family income was $60,000.
Common Questions
What is Per Capita Income in Batavia?
Per Capita income in Batavia is $23,930.
What is the Median Family Income in Batavia?
Median Family Income in Batavia is $66,343.
What is the Median Household income in Batavia?
Median Household Income in Batavia is $55,169.
What is Income or Wage Gap in Batavia?
Income or Wage Gap in Batavia is 0.8%.
Women in Batavia earn 99.2 cents for every dollar earned by a man.
What is Inequality or Gini Index in Batavia?
Inequality or Gini Index in Batavia is 0.38.
What is the Total Population of Batavia?
Total Population of Batavia is 2,606.
What is the Total Male Population of Batavia?
Total Male Population of Batavia is 1,403.
What is the Total Female Population of Batavia?
Total Female Population of Batavia is 1,203.
What is the Ratio of Males per 100 Females in Batavia?
There are 116.63 Males per 100 Females in Batavia.
What is the Ratio of Females per 100 Males in Batavia?
There are 85.74 Females per 100 Males in Batavia.
What is the Median Population Age in Batavia?
Median Population Age in Batavia is 38.3 Years.
What is the Average Family Size in Batavia
Average Family Size in Batavia is 3.2 People.
What is the Average Household Size in Batavia
Average Household Size in Batavia is 2.6 People.
How Large is the Labor Force in Batavia?
There are 1,023 People in the Labor Forcein in Batavia.
What is the Percentage of People in the Labor Force in Batavia?
46.7% of People are in the Labor Force in Batavia.
What is the Unemployment Rate in Batavia?
Unemployment Rate in Batavia is 16.1%.