Talent, OR Map & Demographics
Talent Map
Talent Overview
$29,606
PER CAPITA INCOME
$79,157
AVG FAMILY INCOME
$51,215
AVG HOUSEHOLD INCOME
12.9%
WAGE / INCOME GAP [ % ]
87.1¢/ $1
WAGE / INCOME GAP [ $ ]
0.39
INEQUALITY / GINI INDEX
6,256
TOTAL POPULATION
2,951
MALE POPULATION
3,305
FEMALE POPULATION
89.29
MALES / 100 FEMALES
112.00
FEMALES / 100 MALES
37.4
MEDIAN AGE
3.2
AVG FAMILY SIZE
2.2
AVG HOUSEHOLD SIZE
3,165
LABOR FORCE [ PEOPLE ]
60.3%
PERCENT IN LABOR FORCE
2.7%
UNEMPLOYMENT RATE
Talent Zip Codes
Talent Area Codes
Income in Talent
Income Overview in Talent
Per Capita Income in Talent is $29,606, while median incomes of families and households are $79,157 and $51,215 respectively.
| Characteristic | Number | Measure |
| Per Capita Income | 6,256 | $29,606 |
| Median Family Income | 1,243 | $79,157 |
| Mean Family Income | 1,243 | $81,423 |
| Median Household Income | 2,782 | $51,215 |
| Mean Household Income | 2,782 | $61,868 |
| Income Deficit | 1,243 | $0 |
| Wage / Income Gap (%) | 6,256 | 12.91% |
| Wage / Income Gap ($) | 6,256 | 87.09¢ per $1 |
| Gini / Inequality Index | 6,256 | 0.39 |
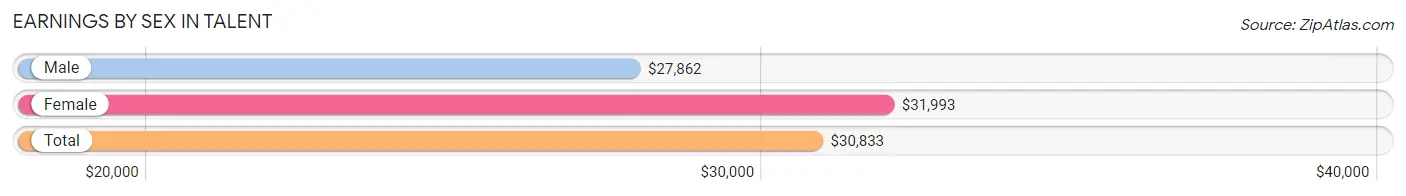
Earnings by Sex in Talent
Average Earnings in Talent are $30,833, $27,862 for men and $31,993 for women, a difference of 12.9%.
| Sex | Number | Average Earnings |
| Male | 1,594 (47.3%) | $27,862 |
| Female | 1,778 (52.7%) | $31,993 |
| Total | 3,372 (100.0%) | $30,833 |
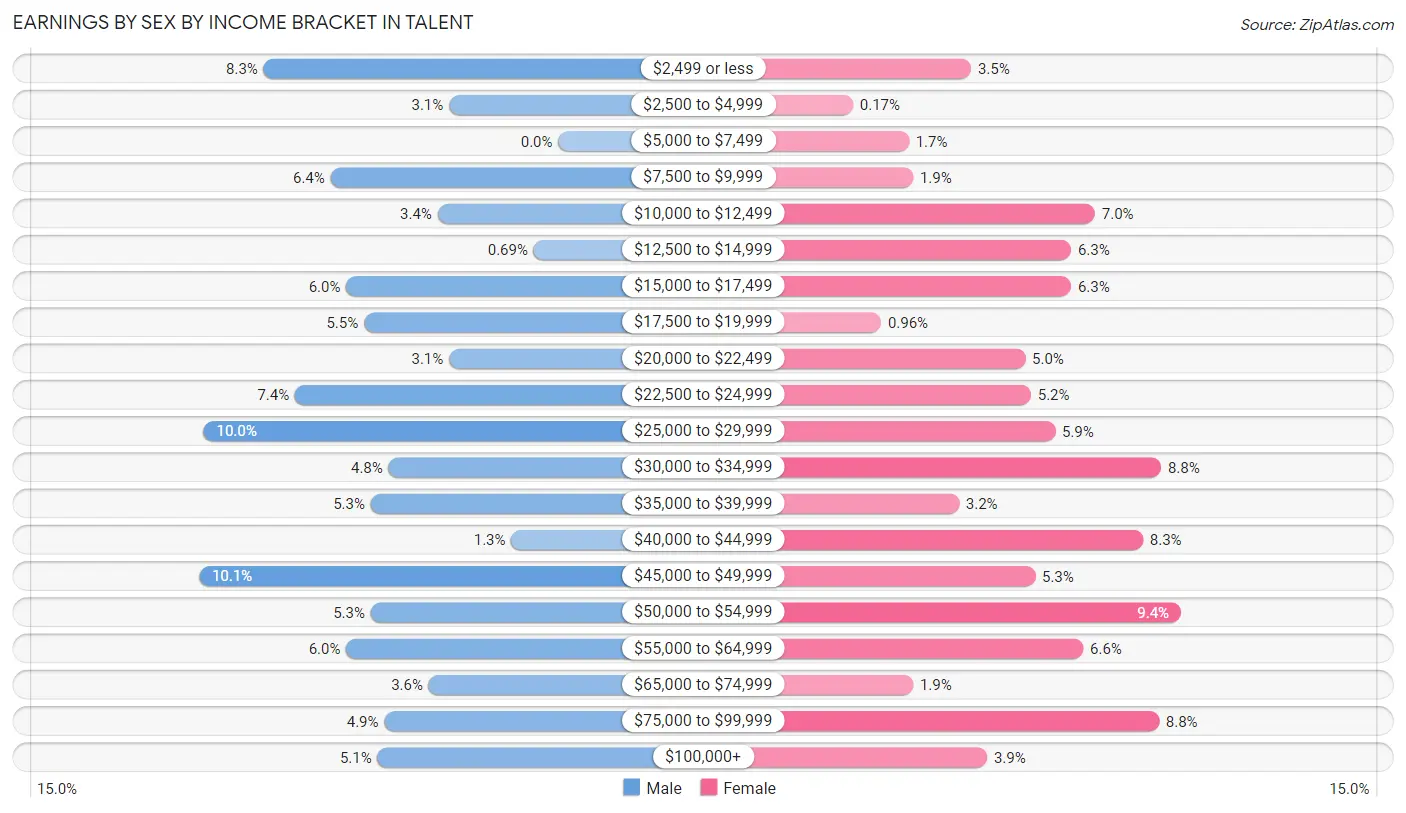
Earnings by Sex by Income Bracket in Talent
The most common earnings brackets in Talent are $45,000 to $49,999 for men (161 | 10.1%) and $50,000 to $54,999 for women (167 | 9.4%).
| Income | Male | Female |
| $2,499 or less | 132 (8.3%) | 62 (3.5%) |
| $2,500 to $4,999 | 49 (3.1%) | 3 (0.2%) |
| $5,000 to $7,499 | 0 (0.0%) | 31 (1.7%) |
| $7,500 to $9,999 | 102 (6.4%) | 33 (1.9%) |
| $10,000 to $12,499 | 54 (3.4%) | 124 (7.0%) |
| $12,500 to $14,999 | 11 (0.7%) | 112 (6.3%) |
| $15,000 to $17,499 | 95 (6.0%) | 112 (6.3%) |
| $17,500 to $19,999 | 87 (5.5%) | 17 (1.0%) |
| $20,000 to $22,499 | 49 (3.1%) | 89 (5.0%) |
| $22,500 to $24,999 | 118 (7.4%) | 92 (5.2%) |
| $25,000 to $29,999 | 159 (10.0%) | 104 (5.9%) |
| $30,000 to $34,999 | 76 (4.8%) | 157 (8.8%) |
| $35,000 to $39,999 | 84 (5.3%) | 56 (3.2%) |
| $40,000 to $44,999 | 21 (1.3%) | 148 (8.3%) |
| $45,000 to $49,999 | 161 (10.1%) | 94 (5.3%) |
| $50,000 to $54,999 | 84 (5.3%) | 167 (9.4%) |
| $55,000 to $64,999 | 95 (6.0%) | 118 (6.6%) |
| $65,000 to $74,999 | 58 (3.6%) | 33 (1.9%) |
| $75,000 to $99,999 | 78 (4.9%) | 156 (8.8%) |
| $100,000+ | 81 (5.1%) | 70 (3.9%) |
| Total | 1,594 (100.0%) | 1,778 (100.0%) |
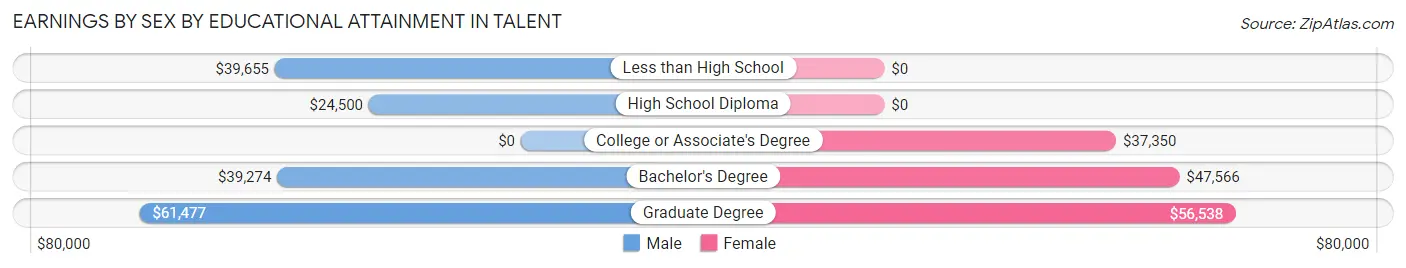
Earnings by Sex by Educational Attainment in Talent
Average earnings in Talent are $35,313 for men and $42,234 for women, a difference of 16.4%. Men with an educational attainment of graduate degree enjoy the highest average annual earnings of $61,477, while those with high school diploma education earn the least with $24,500. Women with an educational attainment of graduate degree earn the most with the average annual earnings of $56,538, while those with college or associate's degree education have the smallest earnings of $37,350.
| Educational Attainment | Male Income | Female Income |
| Less than High School | $39,655 | $0 |
| High School Diploma | $24,500 | $0 |
| College or Associate's Degree | - | - |
| Bachelor's Degree | $39,274 | $47,566 |
| Graduate Degree | $61,477 | $56,538 |
| Total | $35,313 | $42,234 |
Family Income in Talent
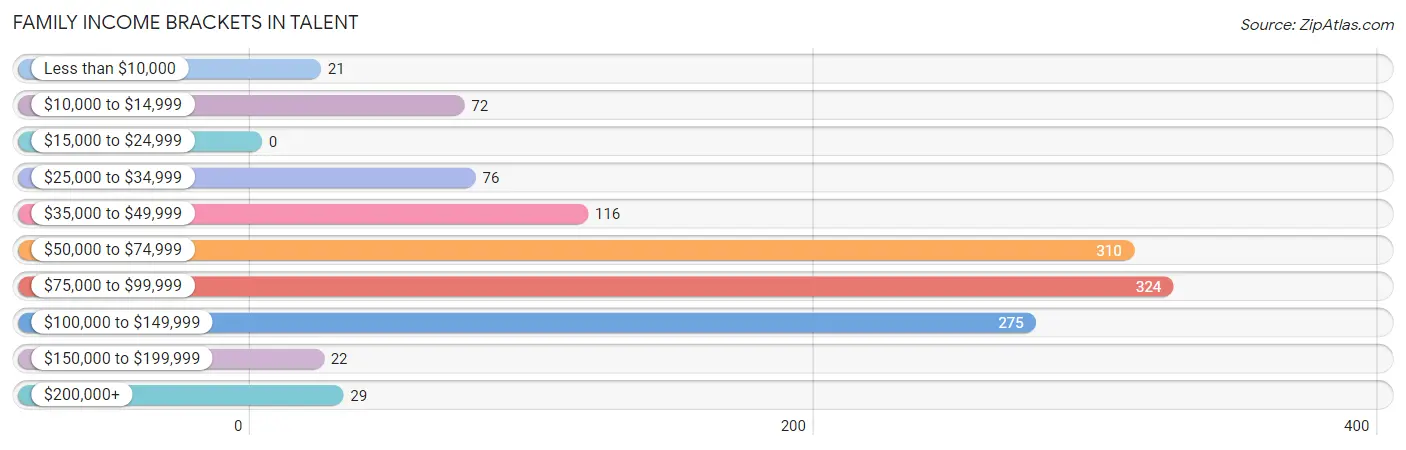
Family Income Brackets in Talent
According to the Talent family income data, there are 324 families falling into the $75,000 to $99,999 income range, which is the most common income bracket and makes up 26.1% of all families.
| Income Bracket | # Families | % Families |
| Less than $10,000 | 21 | 1.7% |
| $10,000 to $14,999 | 72 | 5.8% |
| $15,000 to $24,999 | 0 | 0.0% |
| $25,000 to $34,999 | 76 | 6.1% |
| $35,000 to $49,999 | 116 | 9.3% |
| $50,000 to $74,999 | 310 | 24.9% |
| $75,000 to $99,999 | 324 | 26.1% |
| $100,000 to $149,999 | 275 | 22.1% |
| $150,000 to $199,999 | 22 | 1.8% |
| $200,000+ | 29 | 2.3% |
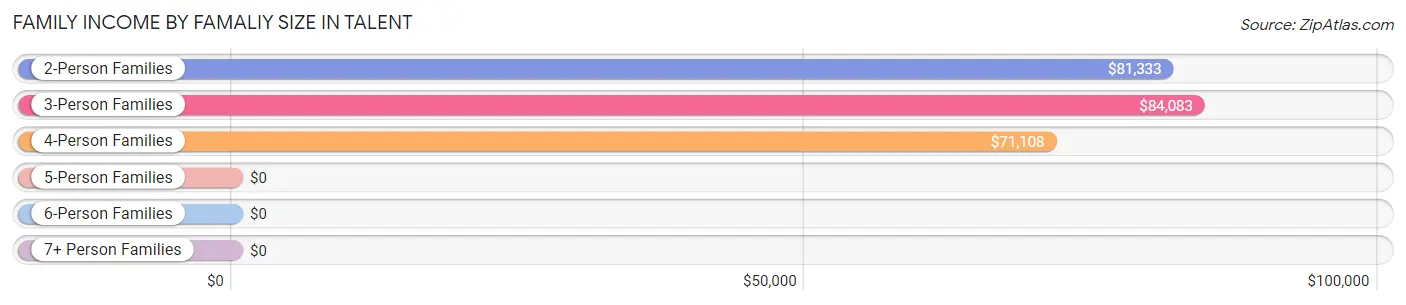
Family Income by Famaliy Size in Talent
3-person families (390 | 31.4%) account for the highest median family income in Talent with $84,083 per family, while 2-person families (552 | 44.4%) have the highest median income of $40,666 per family member.
| Income Bracket | # Families | Median Income |
| 2-Person Families | 552 (44.4%) | $81,333 |
| 3-Person Families | 390 (31.4%) | $84,083 |
| 4-Person Families | 230 (18.5%) | $71,108 |
| 5-Person Families | 70 (5.6%) | $0 |
| 6-Person Families | 0 (0.0%) | $0 |
| 7+ Person Families | 1 (0.1%) | $0 |
| Total | 1,243 (100.0%) | $79,157 |
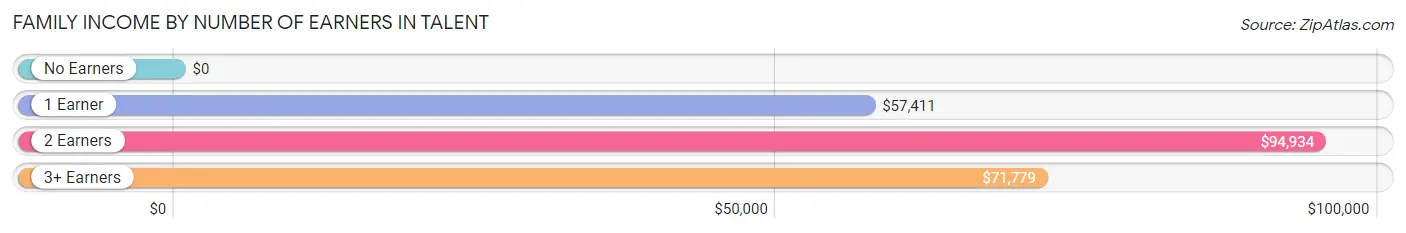
Family Income by Number of Earners in Talent
| Number of Earners | # Families | Median Income |
| No Earners | 191 (15.4%) | $0 |
| 1 Earner | 355 (28.6%) | $57,411 |
| 2 Earners | 523 (42.1%) | $94,934 |
| 3+ Earners | 174 (14.0%) | $71,779 |
| Total | 1,243 (100.0%) | $79,157 |
Household Income in Talent
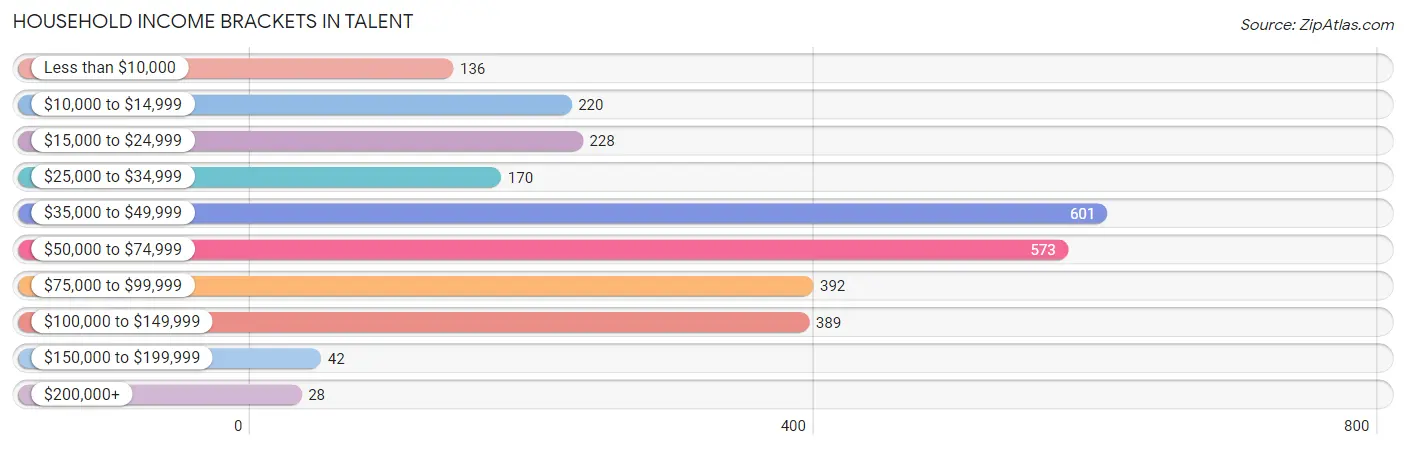
Household Income Brackets in Talent
With 601 households falling in the category, the $35,000 to $49,999 income range is the most frequent in Talent, accounting for 21.6% of all households. In contrast, only 28 households (1.0%) fall into the $200,000+ income bracket, making it the least populous group.
| Income Bracket | # Households | % Households |
| Less than $10,000 | 136 | 4.9% |
| $10,000 to $14,999 | 220 | 7.9% |
| $15,000 to $24,999 | 228 | 8.2% |
| $25,000 to $34,999 | 170 | 6.1% |
| $35,000 to $49,999 | 601 | 21.6% |
| $50,000 to $74,999 | 573 | 20.6% |
| $75,000 to $99,999 | 392 | 14.1% |
| $100,000 to $149,999 | 389 | 14.0% |
| $150,000 to $199,999 | 42 | 1.5% |
| $200,000+ | 28 | 1.0% |
Household Income by Householder Age in Talent
The median household income in Talent is $51,215, with the highest median household income of $79,125 found in the 25 to 44 years age bracket for the primary householder. A total of 668 households (24.0%) fall into this category. Meanwhile, the 65+ years age bracket for the primary householder has the lowest median household income of $40,028, with 1,019 households (36.6%) in this group.
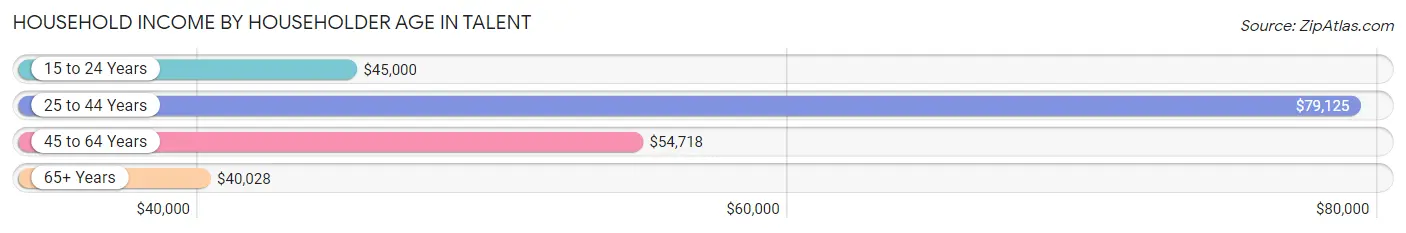
| Income Bracket | # Households | Median Income |
| 15 to 24 Years | 248 (8.9%) | $45,000 |
| 25 to 44 Years | 668 (24.0%) | $79,125 |
| 45 to 64 Years | 847 (30.4%) | $54,718 |
| 65+ Years | 1,019 (36.6%) | $40,028 |
| Total | 2,782 (100.0%) | $51,215 |
Poverty in Talent
Income Below Poverty by Sex and Age in Talent
With 11.5% poverty level for males and 18.4% for females among the residents of Talent, 45 to 54 year old males and 5 year old females are the most vulnerable to poverty, with 101 males (29.1%) and 24 females (100.0%) in their respective age groups living below the poverty level.
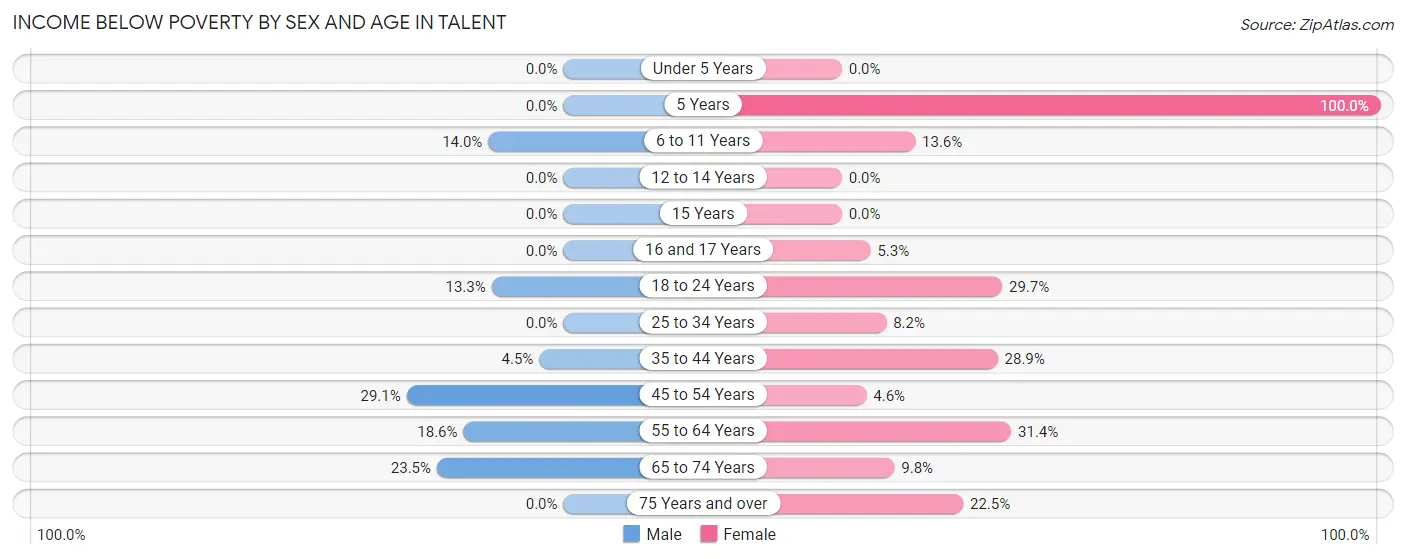
| Age Bracket | Male | Female |
| Under 5 Years | 0 (0.0%) | 0 (0.0%) |
| 5 Years | 0 (0.0%) | 24 (100.0%) |
| 6 to 11 Years | 24 (14.0%) | 20 (13.6%) |
| 12 to 14 Years | 0 (0.0%) | 0 (0.0%) |
| 15 Years | 0 (0.0%) | 0 (0.0%) |
| 16 and 17 Years | 0 (0.0%) | 5 (5.3%) |
| 18 to 24 Years | 69 (13.3%) | 127 (29.7%) |
| 25 to 34 Years | 0 (0.0%) | 44 (8.2%) |
| 35 to 44 Years | 14 (4.5%) | 120 (28.9%) |
| 45 to 54 Years | 101 (29.1%) | 11 (4.5%) |
| 55 to 64 Years | 49 (18.6%) | 121 (31.4%) |
| 65 to 74 Years | 81 (23.5%) | 36 (9.8%) |
| 75 Years and over | 0 (0.0%) | 99 (22.5%) |
| Total | 338 (11.5%) | 607 (18.4%) |
Income Above Poverty by Sex and Age in Talent
According to the poverty statistics in Talent, males aged under 5 years and females aged under 5 years are the age groups that are most secure financially, with 100.0% of males and 100.0% of females in these age groups living above the poverty line.
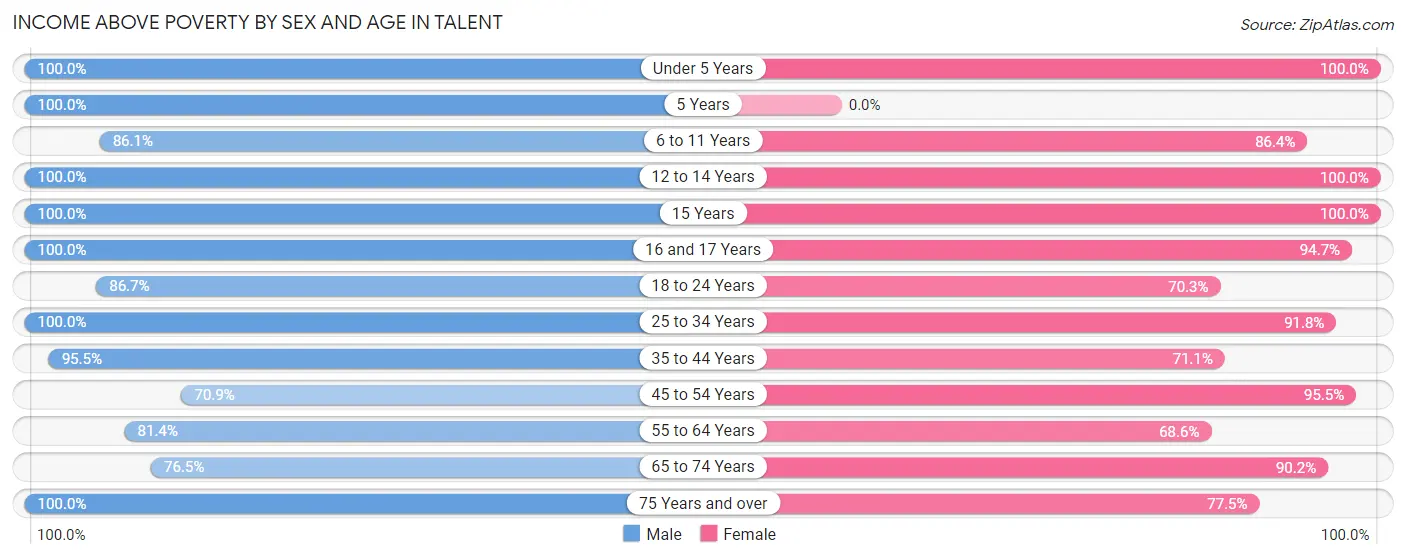
| Age Bracket | Male | Female |
| Under 5 Years | 136 (100.0%) | 89 (100.0%) |
| 5 Years | 18 (100.0%) | 0 (0.0%) |
| 6 to 11 Years | 148 (86.1%) | 127 (86.4%) |
| 12 to 14 Years | 192 (100.0%) | 107 (100.0%) |
| 15 Years | 77 (100.0%) | 17 (100.0%) |
| 16 and 17 Years | 86 (100.0%) | 89 (94.7%) |
| 18 to 24 Years | 449 (86.7%) | 300 (70.3%) |
| 25 to 34 Years | 296 (100.0%) | 490 (91.8%) |
| 35 to 44 Years | 298 (95.5%) | 295 (71.1%) |
| 45 to 54 Years | 246 (70.9%) | 231 (95.5%) |
| 55 to 64 Years | 215 (81.4%) | 264 (68.6%) |
| 65 to 74 Years | 264 (76.5%) | 333 (90.2%) |
| 75 Years and over | 175 (100.0%) | 341 (77.5%) |
| Total | 2,600 (88.5%) | 2,683 (81.6%) |
Income Below Poverty Among Married-Couple Families in Talent
The poverty statistics for married-couple families in Talent show that 2.5% or 22 of the total 865 families live below the poverty line. Families with 1 or 2 children have the highest poverty rate of 6.8%, comprising of 22 families. On the other hand, families with no children have the lowest poverty rate of 0.0%, which includes 0 families.
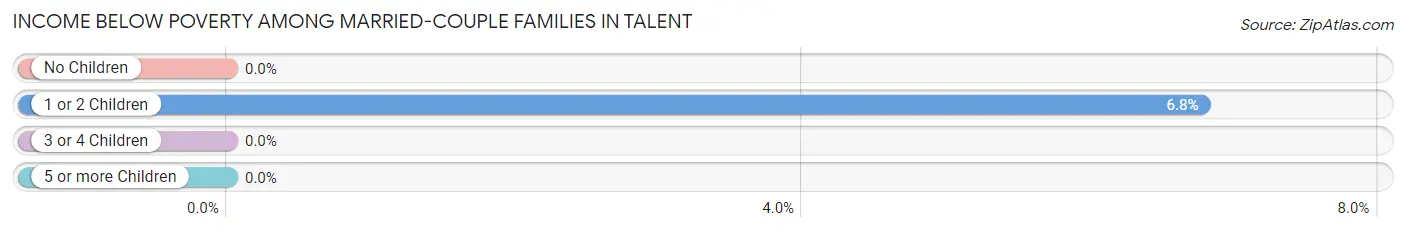
| Children | Above Poverty | Below Poverty |
| No Children | 497 (100.0%) | 0 (0.0%) |
| 1 or 2 Children | 303 (93.2%) | 22 (6.8%) |
| 3 or 4 Children | 43 (100.0%) | 0 (0.0%) |
| 5 or more Children | 0 (0.0%) | 0 (0.0%) |
| Total | 843 (97.5%) | 22 (2.5%) |
Income Below Poverty Among Single-Parent Households in Talent
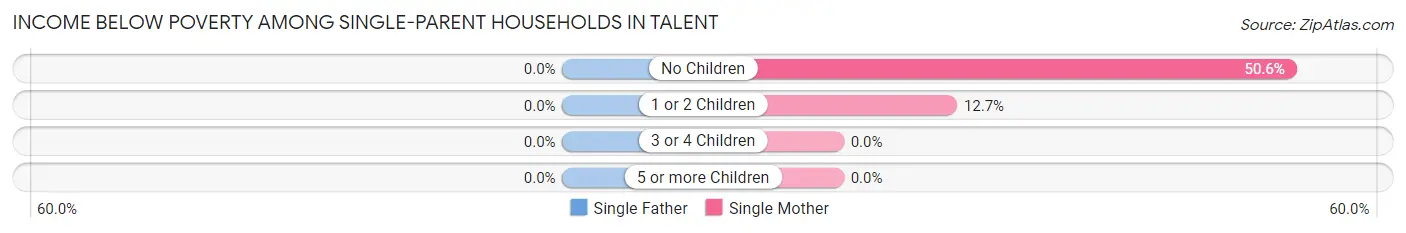
| Children | Single Father | Single Mother |
| No Children | 0 (0.0%) | 41 (50.6%) |
| 1 or 2 Children | 0 (0.0%) | 30 (12.7%) |
| 3 or 4 Children | 0 (0.0%) | 0 (0.0%) |
| 5 or more Children | 0 (0.0%) | 0 (0.0%) |
| Total | 0 (0.0%) | 71 (22.3%) |
Income Below Poverty Among Married-Couple vs Single-Parent Households in Talent
The poverty data for Talent shows that 22 of the married-couple family households (2.5%) and 71 of the single-parent households (18.8%) are living below the poverty level. Within the married-couple family households, those with 1 or 2 children have the highest poverty rate, with 22 households (6.8%) falling below the poverty line. Among the single-parent households, those with no children have the highest poverty rate, with 41 household (42.3%) living below poverty.
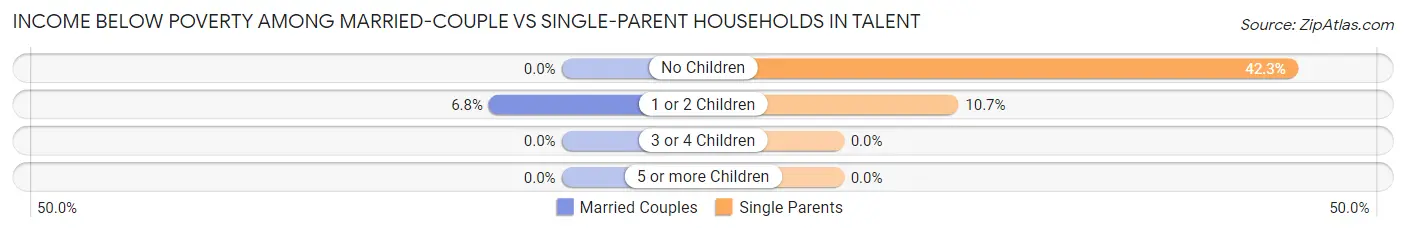
| Children | Married-Couple Families | Single-Parent Households |
| No Children | 0 (0.0%) | 41 (42.3%) |
| 1 or 2 Children | 22 (6.8%) | 30 (10.7%) |
| 3 or 4 Children | 0 (0.0%) | 0 (0.0%) |
| 5 or more Children | 0 (0.0%) | 0 (0.0%) |
| Total | 22 (2.5%) | 71 (18.8%) |
Race in Talent
The most populous races in Talent are White / Caucasian (5,498 | 87.9%), Hispanic or Latino (931 | 14.9%), and Two or more Races (457 | 7.3%).
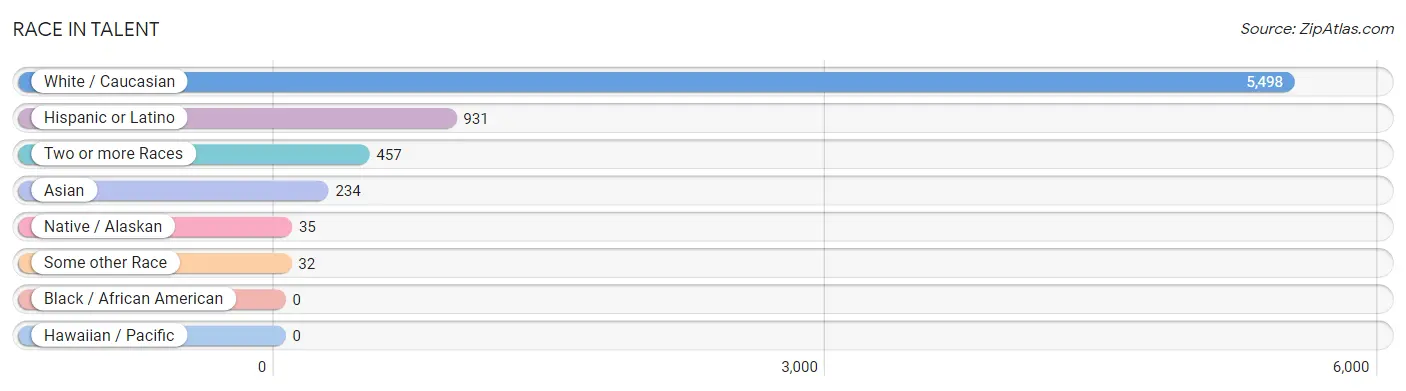
| Race | # Population | % Population |
| Asian | 234 | 3.7% |
| Black / African American | 0 | 0.0% |
| Hawaiian / Pacific | 0 | 0.0% |
| Hispanic or Latino | 931 | 14.9% |
| Native / Alaskan | 35 | 0.6% |
| White / Caucasian | 5,498 | 87.9% |
| Two or more Races | 457 | 7.3% |
| Some other Race | 32 | 0.5% |
| Total | 6,256 | 100.0% |
Ancestry in Talent
The most populous ancestries reported in Talent are German (1,090 | 17.4%), Mexican (773 | 12.4%), English (722 | 11.5%), Irish (541 | 8.6%), and Norwegian (314 | 5.0%), together accounting for 55.0% of all Talent residents.
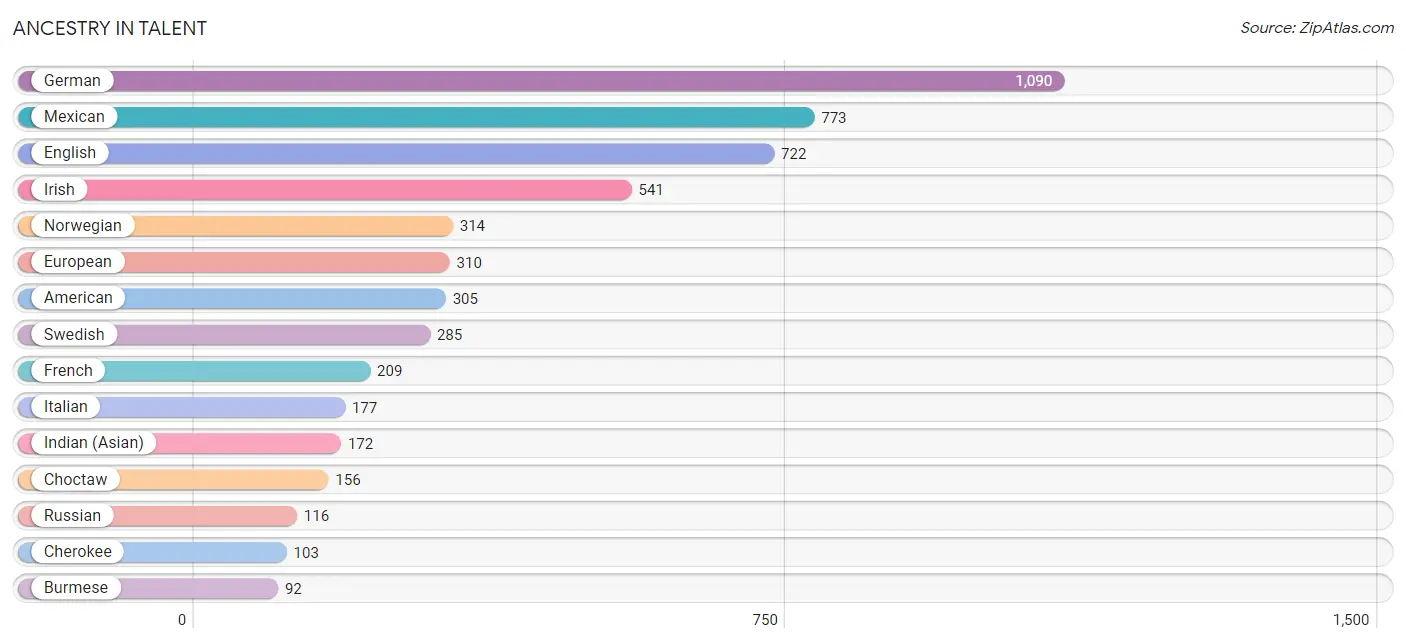
| Ancestry | # Population | % Population |
| African | 4 | 0.1% |
| American | 305 | 4.9% |
| Apache | 24 | 0.4% |
| Arab | 22 | 0.4% |
| Armenian | 66 | 1.1% |
| Bhutanese | 8 | 0.1% |
| Burmese | 92 | 1.5% |
| Central American | 67 | 1.1% |
| Cherokee | 103 | 1.7% |
| Choctaw | 156 | 2.5% |
| Costa Rican | 62 | 1.0% |
| Cuban | 22 | 0.4% |
| Czech | 55 | 0.9% |
| Czechoslovakian | 41 | 0.7% |
| Danish | 51 | 0.8% |
| Dutch | 11 | 0.2% |
| Eastern European | 43 | 0.7% |
| Egyptian | 22 | 0.4% |
| English | 722 | 11.5% |
| European | 310 | 5.0% |
| Finnish | 30 | 0.5% |
| French | 209 | 3.3% |
| French Canadian | 13 | 0.2% |
| German | 1,090 | 17.4% |
| Greek | 21 | 0.3% |
| Guatemalan | 5 | 0.1% |
| Hungarian | 38 | 0.6% |
| Icelander | 25 | 0.4% |
| Indian (Asian) | 172 | 2.8% |
| Irish | 541 | 8.6% |
| Italian | 177 | 2.8% |
| Korean | 15 | 0.2% |
| Mexican | 773 | 12.4% |
| Norwegian | 314 | 5.0% |
| Peruvian | 8 | 0.1% |
| Polish | 48 | 0.8% |
| Portuguese | 67 | 1.1% |
| Puerto Rican | 26 | 0.4% |
| Russian | 116 | 1.8% |
| Scandinavian | 75 | 1.2% |
| Scotch-Irish | 28 | 0.4% |
| Scottish | 62 | 1.0% |
| South American | 8 | 0.1% |
| Spaniard | 24 | 0.4% |
| Spanish | 11 | 0.2% |
| Subsaharan African | 53 | 0.9% |
| Swedish | 285 | 4.6% |
| Swiss | 21 | 0.3% |
| Thai | 5 | 0.1% |
| Ukrainian | 24 | 0.4% |
| Welsh | 30 | 0.5% | View All 51 Rows |
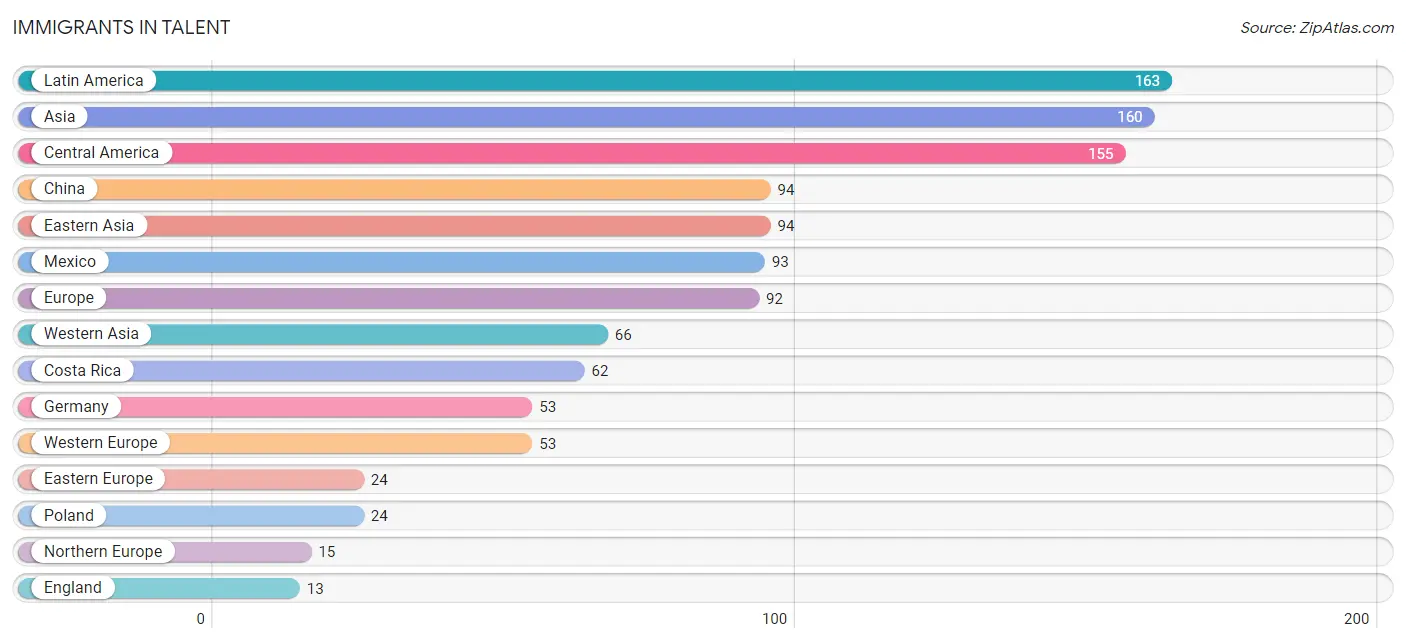
Immigrants in Talent
The most numerous immigrant groups reported in Talent came from Latin America (163 | 2.6%), Asia (160 | 2.6%), Central America (155 | 2.5%), China (94 | 1.5%), and Eastern Asia (94 | 1.5%), together accounting for 10.6% of all Talent residents.
| Immigration Origin | # Population | % Population |
| Africa | 10 | 0.2% |
| Asia | 160 | 2.6% |
| Central America | 155 | 2.5% |
| China | 94 | 1.5% |
| Costa Rica | 62 | 1.0% |
| Eastern Asia | 94 | 1.5% |
| Eastern Europe | 24 | 0.4% |
| England | 13 | 0.2% |
| Europe | 92 | 1.5% |
| Germany | 53 | 0.9% |
| Latin America | 163 | 2.6% |
| Mexico | 93 | 1.5% |
| Northern Africa | 10 | 0.2% |
| Northern Europe | 15 | 0.2% |
| Peru | 8 | 0.1% |
| Poland | 24 | 0.4% |
| South America | 8 | 0.1% |
| Sweden | 2 | 0.0% |
| Western Asia | 66 | 1.1% |
| Western Europe | 53 | 0.9% | View All 20 Rows |
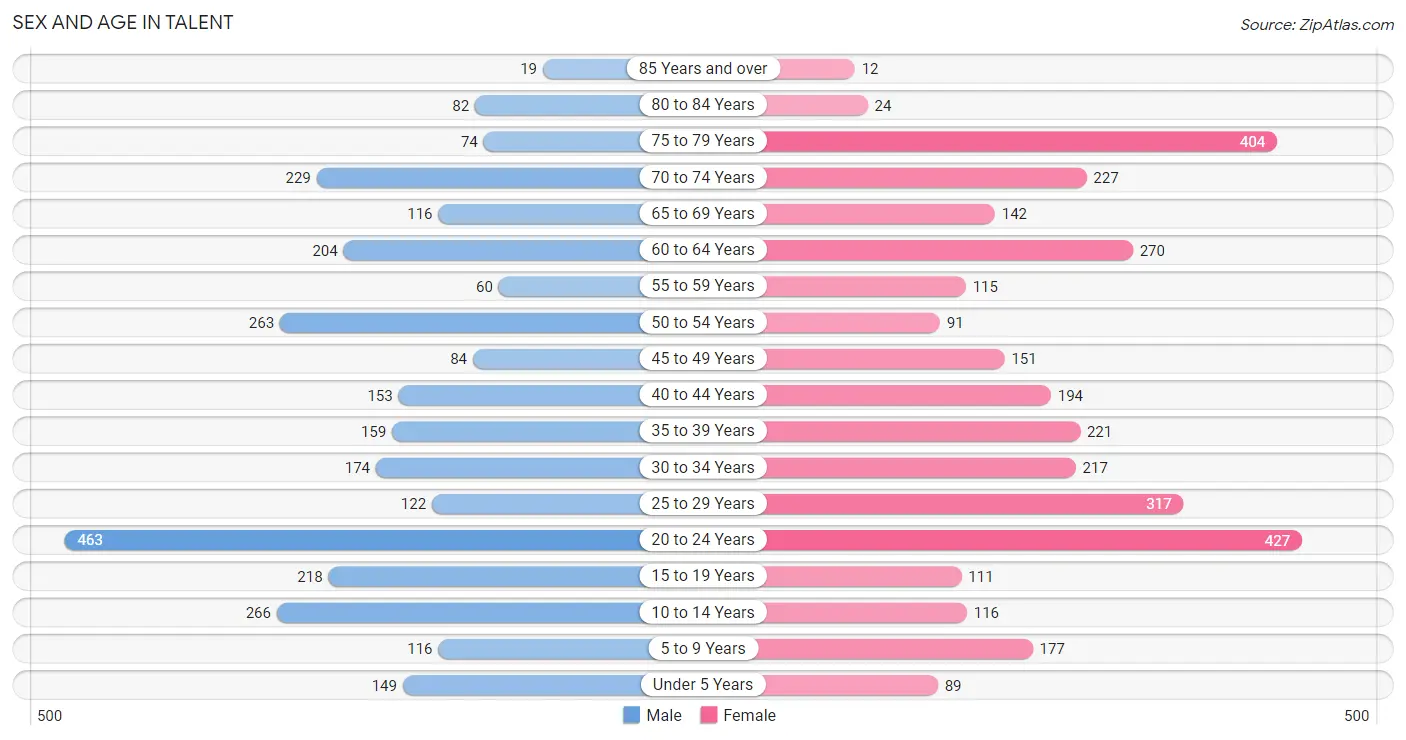
Sex and Age in Talent
Sex and Age in Talent
The most populous age groups in Talent are 20 to 24 Years (463 | 15.7%) for men and 20 to 24 Years (427 | 12.9%) for women.
| Age Bracket | Male | Female |
| Under 5 Years | 149 (5.1%) | 89 (2.7%) |
| 5 to 9 Years | 116 (3.9%) | 177 (5.4%) |
| 10 to 14 Years | 266 (9.0%) | 116 (3.5%) |
| 15 to 19 Years | 218 (7.4%) | 111 (3.4%) |
| 20 to 24 Years | 463 (15.7%) | 427 (12.9%) |
| 25 to 29 Years | 122 (4.1%) | 317 (9.6%) |
| 30 to 34 Years | 174 (5.9%) | 217 (6.6%) |
| 35 to 39 Years | 159 (5.4%) | 221 (6.7%) |
| 40 to 44 Years | 153 (5.2%) | 194 (5.9%) |
| 45 to 49 Years | 84 (2.9%) | 151 (4.6%) |
| 50 to 54 Years | 263 (8.9%) | 91 (2.8%) |
| 55 to 59 Years | 60 (2.0%) | 115 (3.5%) |
| 60 to 64 Years | 204 (6.9%) | 270 (8.2%) |
| 65 to 69 Years | 116 (3.9%) | 142 (4.3%) |
| 70 to 74 Years | 229 (7.8%) | 227 (6.9%) |
| 75 to 79 Years | 74 (2.5%) | 404 (12.2%) |
| 80 to 84 Years | 82 (2.8%) | 24 (0.7%) |
| 85 Years and over | 19 (0.6%) | 12 (0.4%) |
| Total | 2,951 (100.0%) | 3,305 (100.0%) |
Families and Households in Talent
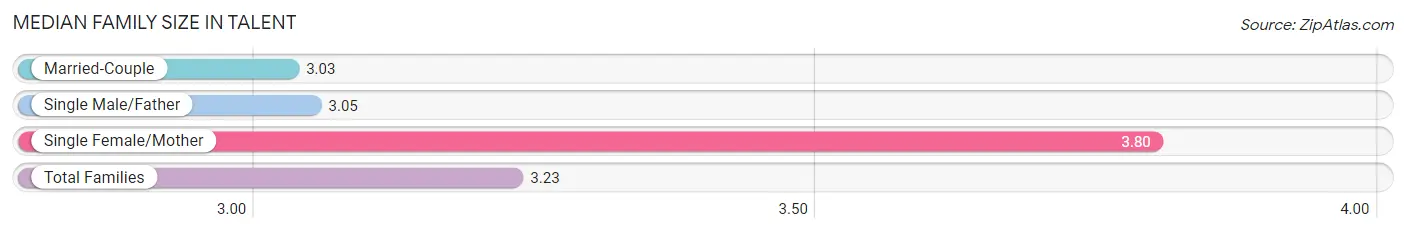
Median Family Size in Talent
The median family size in Talent is 3.23 persons per family, with single female/mother families (318 | 25.6%) accounting for the largest median family size of 3.8 persons per family. On the other hand, married-couple families (865 | 69.6%) represent the smallest median family size with 3.03 persons per family.
| Family Type | # Families | Family Size |
| Married-Couple | 865 (69.6%) | 3.03 |
| Single Male/Father | 60 (4.8%) | 3.05 |
| Single Female/Mother | 318 (25.6%) | 3.80 |
| Total Families | 1,243 (100.0%) | 3.23 |
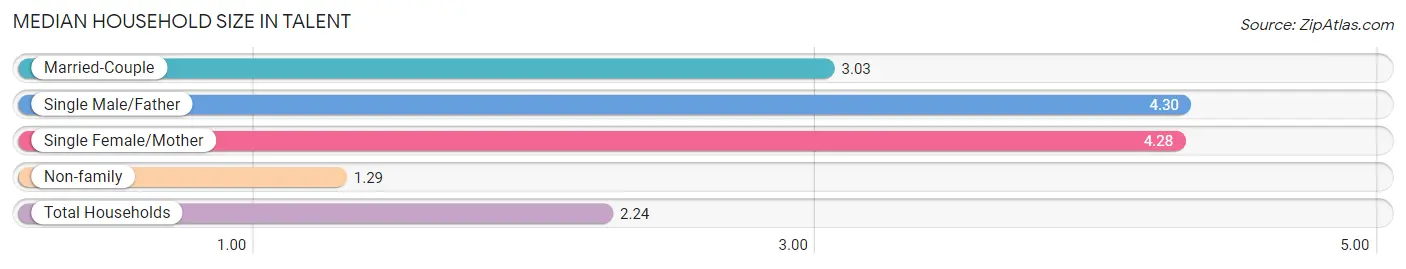
Median Household Size in Talent
The median household size in Talent is 2.24 persons per household, with single male/father households (60 | 2.2%) accounting for the largest median household size of 4.3 persons per household. non-family households (1,539 | 55.3%) represent the smallest median household size with 1.29 persons per household.
| Household Type | # Households | Household Size |
| Married-Couple | 865 (31.1%) | 3.03 |
| Single Male/Father | 60 (2.2%) | 4.30 |
| Single Female/Mother | 318 (11.4%) | 4.28 |
| Non-family | 1,539 (55.3%) | 1.29 |
| Total Households | 2,782 (100.0%) | 2.24 |
Household Size by Marriage Status in Talent
Out of a total of 2,782 households in Talent, 1,243 (44.7%) are family households, while 1,539 (55.3%) are nonfamily households. The most numerous type of family households are 2-person households, comprising 502, and the most common type of nonfamily households are 1-person households, comprising 1,166.
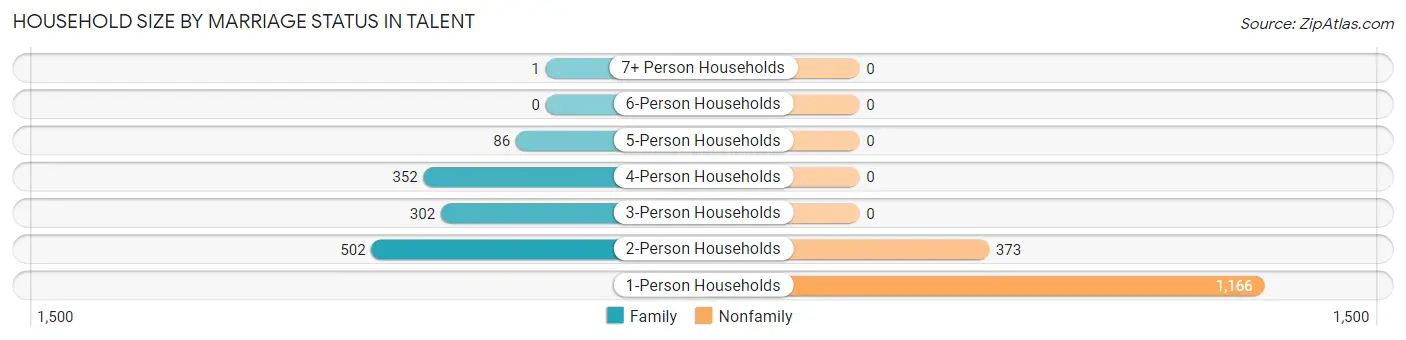
| Household Size | Family Households | Nonfamily Households |
| 1-Person Households | - | 1,166 (41.9%) |
| 2-Person Households | 502 (18.0%) | 373 (13.4%) |
| 3-Person Households | 302 (10.9%) | 0 (0.0%) |
| 4-Person Households | 352 (12.7%) | 0 (0.0%) |
| 5-Person Households | 86 (3.1%) | 0 (0.0%) |
| 6-Person Households | 0 (0.0%) | 0 (0.0%) |
| 7+ Person Households | 1 (0.0%) | 0 (0.0%) |
| Total | 1,243 (44.7%) | 1,539 (55.3%) |
Female Fertility in Talent
Fertility by Age in Talent
Average fertility rate in Talent is 3.0 births per 1,000 women. Women in the age bracket of 20 to 34 years have the highest fertility rate with 5.0 births per 1,000 women. Women in the age bracket of 20 to 34 years acount for 100.0% of all women with births.
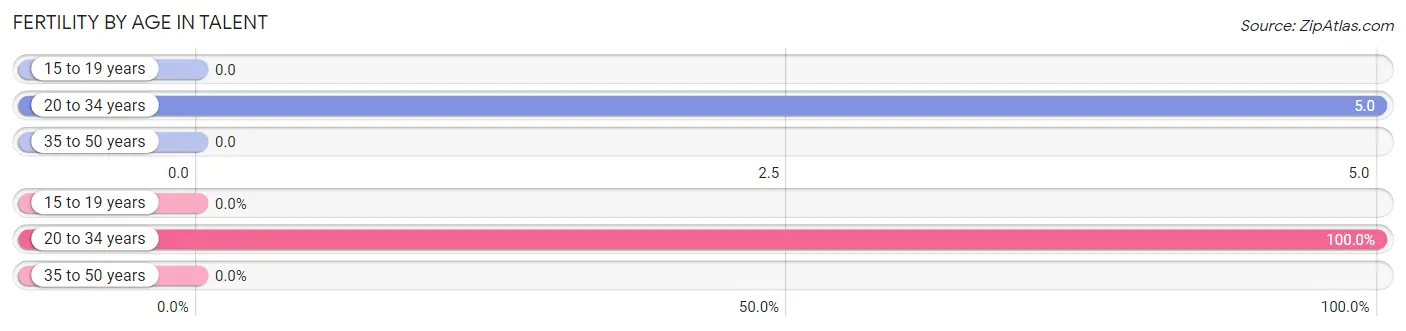
| Age Bracket | Women with Births | Births / 1,000 Women |
| 15 to 19 years | 0 (0.0%) | 0.0 |
| 20 to 34 years | 5 (100.0%) | 5.0 |
| 35 to 50 years | 0 (0.0%) | 0.0 |
| Total | 5 (100.0%) | 3.0 |
Fertility by Age by Marriage Status in Talent
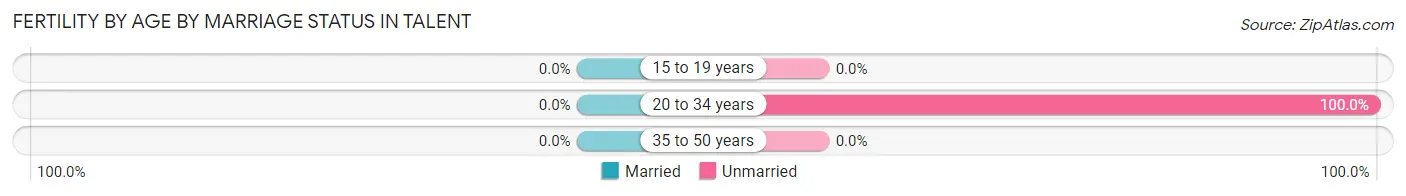
| Age Bracket | Married | Unmarried |
| 15 to 19 years | 0 (0.0%) | 0 (0.0%) |
| 20 to 34 years | 0 (0.0%) | 5 (100.0%) |
| 35 to 50 years | 0 (0.0%) | 0 (0.0%) |
| Total | 0 (0.0%) | 5 (100.0%) |
Fertility by Education in Talent
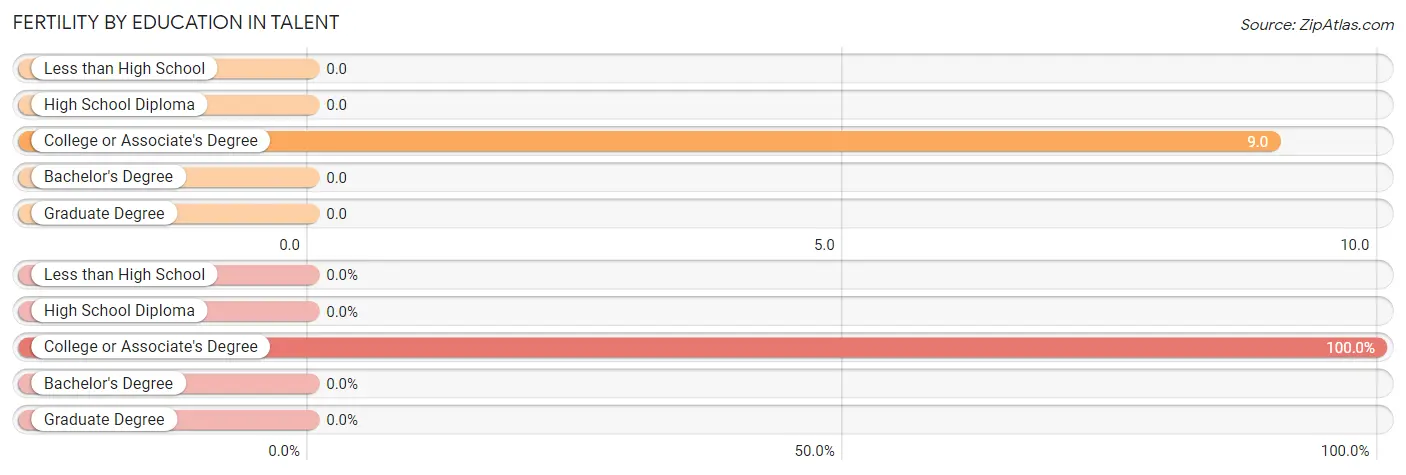
| Educational Attainment | Women with Births | Births / 1,000 Women |
| Less than High School | 0 (0.0%) | 0.0 |
| High School Diploma | 0 (0.0%) | 0.0 |
| College or Associate's Degree | 5 (100.0%) | 9.0 |
| Bachelor's Degree | 0 (0.0%) | 0.0 |
| Graduate Degree | 0 (0.0%) | 0.0 |
| Total | 5 (100.0%) | 3.0 |
Fertility by Education by Marriage Status in Talent
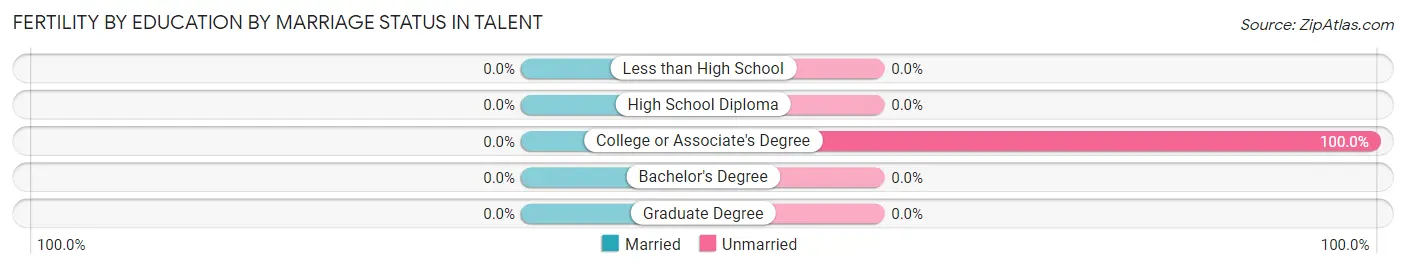
| Educational Attainment | Married | Unmarried |
| Less than High School | 0 (0.0%) | 0 (0.0%) |
| High School Diploma | 0 (0.0%) | 0 (0.0%) |
| College or Associate's Degree | 0 (0.0%) | 5 (100.0%) |
| Bachelor's Degree | 0 (0.0%) | 0 (0.0%) |
| Graduate Degree | 0 (0.0%) | 0 (0.0%) |
| Total | 0 (0.0%) | 5 (100.0%) |
Employment Characteristics in Talent
Employment by Class of Employer in Talent
Among the 2,946 employed individuals in Talent, private company employees (1,715 | 58.2%), not-for-profit organizations (505 | 17.1%), and self-employed (not incorporated) (299 | 10.2%) make up the most common classes of employment.
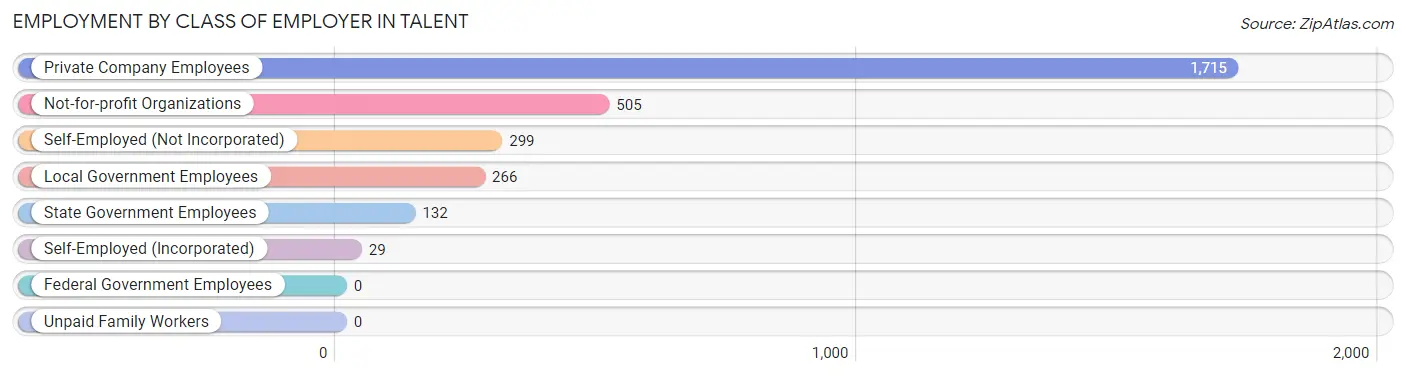
| Employer Class | # Employees | % Employees |
| Private Company Employees | 1,715 | 58.2% |
| Self-Employed (Incorporated) | 29 | 1.0% |
| Self-Employed (Not Incorporated) | 299 | 10.2% |
| Not-for-profit Organizations | 505 | 17.1% |
| Local Government Employees | 266 | 9.0% |
| State Government Employees | 132 | 4.5% |
| Federal Government Employees | 0 | 0.0% |
| Unpaid Family Workers | 0 | 0.0% |
| Total | 2,946 | 100.0% |
Employment Status by Age in Talent
According to the labor force statistics for Talent, out of the total population over 16 years of age (5,249), 60.3% or 3,165 individuals are in the labor force, with 2.7% or 85 of them unemployed. The age group with the highest labor force participation rate is 25 to 29 years, with 100.0% or 439 individuals in the labor force. Within the labor force, the 75 years and over age range has the highest percentage of unemployed individuals, with 32.4% or 23 of them being unemployed.
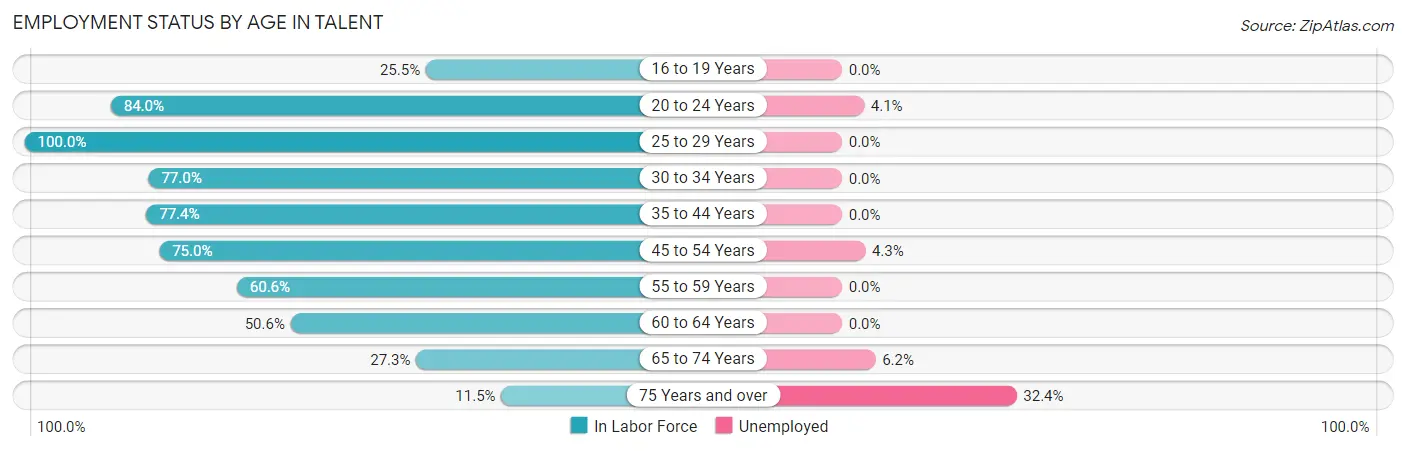
| Age Bracket | In Labor Force | Unemployed |
| 16 to 19 Years | 60 (25.5%) | 0 (0.0%) |
| 20 to 24 Years | 748 (84.0%) | 31 (4.1%) |
| 25 to 29 Years | 439 (100.0%) | 0 (0.0%) |
| 30 to 34 Years | 301 (77.0%) | 0 (0.0%) |
| 35 to 44 Years | 563 (77.4%) | 0 (0.0%) |
| 45 to 54 Years | 442 (75.0%) | 19 (4.3%) |
| 55 to 59 Years | 106 (60.6%) | 0 (0.0%) |
| 60 to 64 Years | 240 (50.6%) | 0 (0.0%) |
| 65 to 74 Years | 195 (27.3%) | 12 (6.2%) |
| 75 Years and over | 71 (11.5%) | 23 (32.4%) |
| Total | 3,165 (60.3%) | 85 (2.7%) |
Employment Status by Educational Attainment in Talent
According to labor force statistics for Talent, 74.8% of individuals (2,091) out of the total population between 25 and 64 years of age (2,795) are in the labor force, with 0.9% or 19 of them being unemployed. The group with the highest labor force participation rate are those with the educational attainment of bachelor's degree or higher, with 83.1% or 961 individuals in the labor force. Within the labor force, individuals with college / associate degree education have the highest percentage of unemployment, with 2.4% or 19 of them being unemployed.
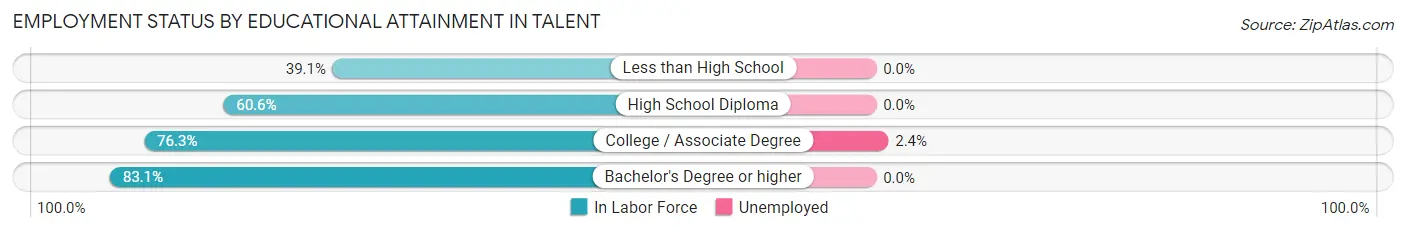
| Educational Attainment | In Labor Force | Unemployed |
| Less than High School | 50 (39.1%) | 0 (0.0%) |
| High School Diploma | 277 (60.6%) | 0 (0.0%) |
| College / Associate Degree | 803 (76.3%) | 25 (2.4%) |
| Bachelor's Degree or higher | 961 (83.1%) | 0 (0.0%) |
| Total | 2,091 (74.8%) | 25 (0.9%) |
Employment Occupations by Sex in Talent
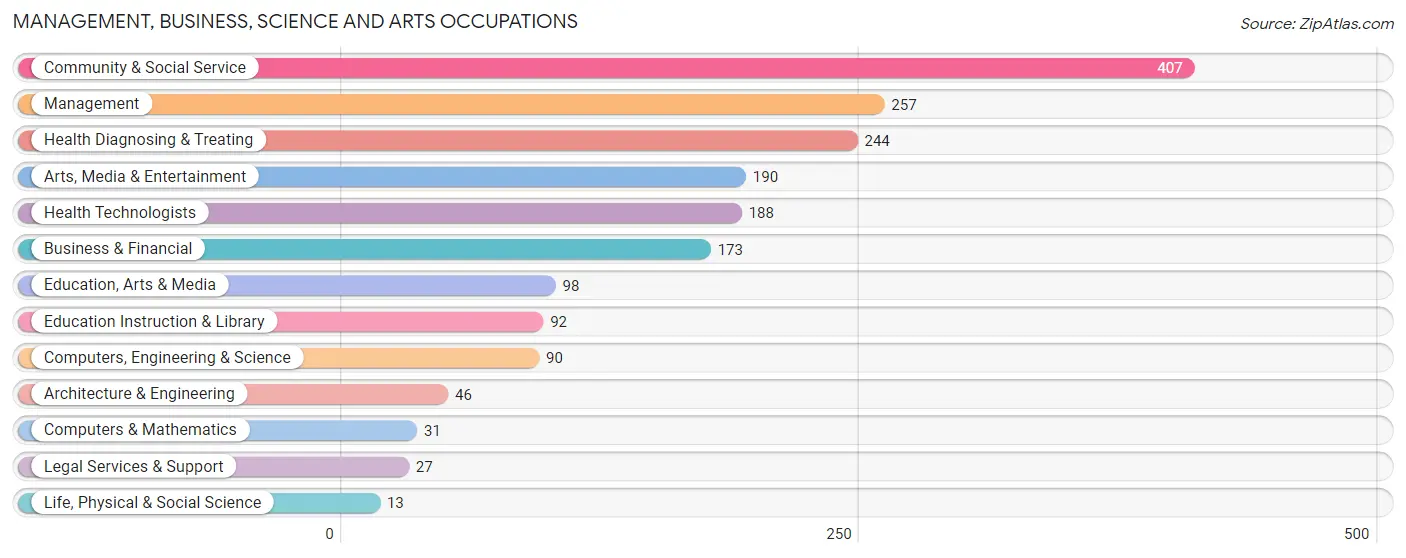
Management, Business, Science and Arts Occupations
The most common Management, Business, Science and Arts occupations in Talent are Community & Social Service (407 | 13.2%), Management (257 | 8.3%), Health Diagnosing & Treating (244 | 7.9%), Arts, Media & Entertainment (190 | 6.2%), and Health Technologists (188 | 6.1%).
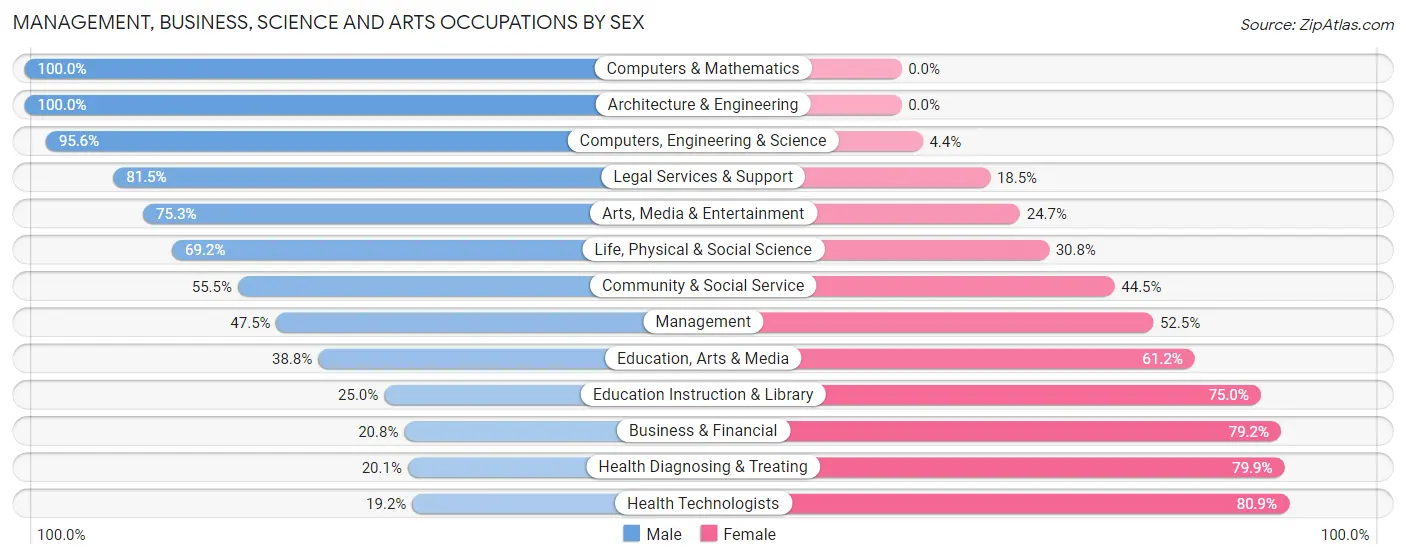
Management, Business, Science and Arts Occupations by Sex
Within the Management, Business, Science and Arts occupations in Talent, the most male-oriented occupations are Computers & Mathematics (100.0%), Architecture & Engineering (100.0%), and Computers, Engineering & Science (95.6%), while the most female-oriented occupations are Health Technologists (80.8%), Health Diagnosing & Treating (79.9%), and Business & Financial (79.2%).
| Occupation | Male | Female |
| Management | 122 (47.5%) | 135 (52.5%) |
| Business & Financial | 36 (20.8%) | 137 (79.2%) |
| Computers, Engineering & Science | 86 (95.6%) | 4 (4.4%) |
| Computers & Mathematics | 31 (100.0%) | 0 (0.0%) |
| Architecture & Engineering | 46 (100.0%) | 0 (0.0%) |
| Life, Physical & Social Science | 9 (69.2%) | 4 (30.8%) |
| Community & Social Service | 226 (55.5%) | 181 (44.5%) |
| Education, Arts & Media | 38 (38.8%) | 60 (61.2%) |
| Legal Services & Support | 22 (81.5%) | 5 (18.5%) |
| Education Instruction & Library | 23 (25.0%) | 69 (75.0%) |
| Arts, Media & Entertainment | 143 (75.3%) | 47 (24.7%) |
| Health Diagnosing & Treating | 49 (20.1%) | 195 (79.9%) |
| Health Technologists | 36 (19.2%) | 152 (80.8%) |
| Total (Category) | 519 (44.3%) | 652 (55.7%) |
| Total (Overall) | 1,437 (46.7%) | 1,643 (53.3%) |
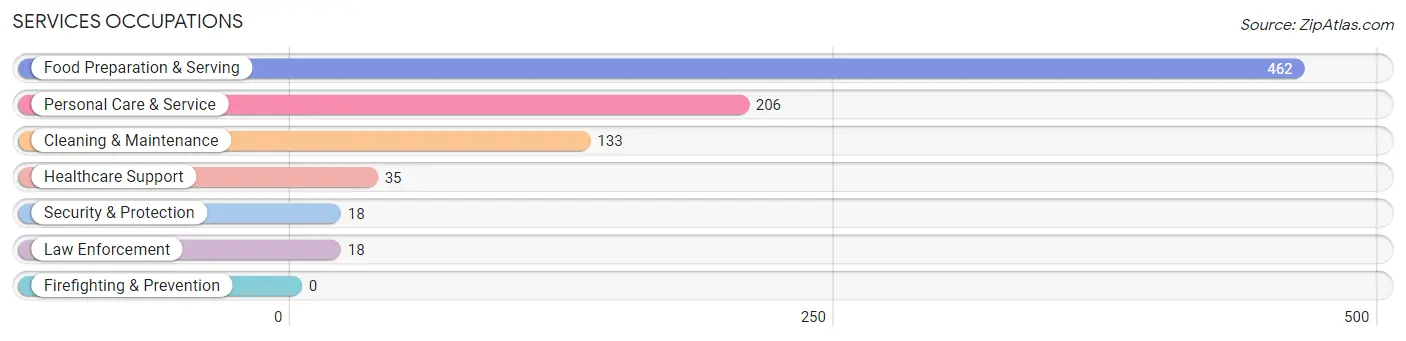
Services Occupations
The most common Services occupations in Talent are Food Preparation & Serving (462 | 15.0%), Personal Care & Service (206 | 6.7%), Cleaning & Maintenance (133 | 4.3%), Healthcare Support (35 | 1.1%), and Security & Protection (18 | 0.6%).
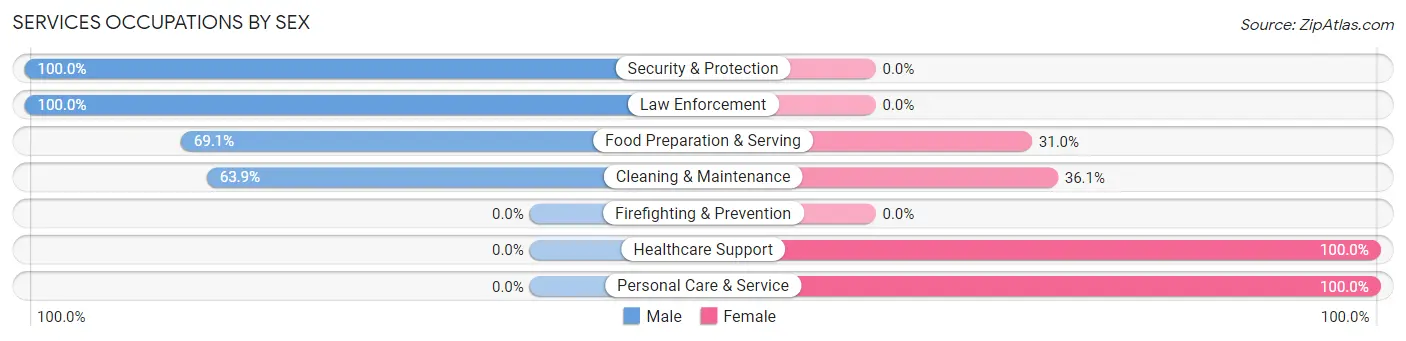
Services Occupations by Sex
Within the Services occupations in Talent, the most male-oriented occupations are Security & Protection (100.0%), Law Enforcement (100.0%), and Food Preparation & Serving (69.1%), while the most female-oriented occupations are Healthcare Support (100.0%), Personal Care & Service (100.0%), and Cleaning & Maintenance (36.1%).
| Occupation | Male | Female |
| Healthcare Support | 0 (0.0%) | 35 (100.0%) |
| Security & Protection | 18 (100.0%) | 0 (0.0%) |
| Firefighting & Prevention | 0 (0.0%) | 0 (0.0%) |
| Law Enforcement | 18 (100.0%) | 0 (0.0%) |
| Food Preparation & Serving | 319 (69.1%) | 143 (30.9%) |
| Cleaning & Maintenance | 85 (63.9%) | 48 (36.1%) |
| Personal Care & Service | 0 (0.0%) | 206 (100.0%) |
| Total (Category) | 422 (49.4%) | 432 (50.6%) |
| Total (Overall) | 1,437 (46.7%) | 1,643 (53.3%) |
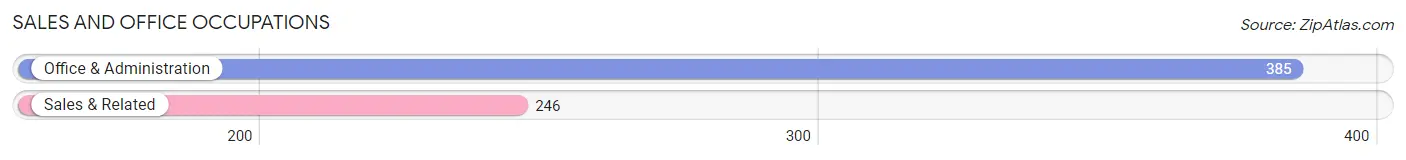
Sales and Office Occupations
The most common Sales and Office occupations in Talent are Office & Administration (385 | 12.5%), and Sales & Related (246 | 8.0%).
Sales and Office Occupations by Sex
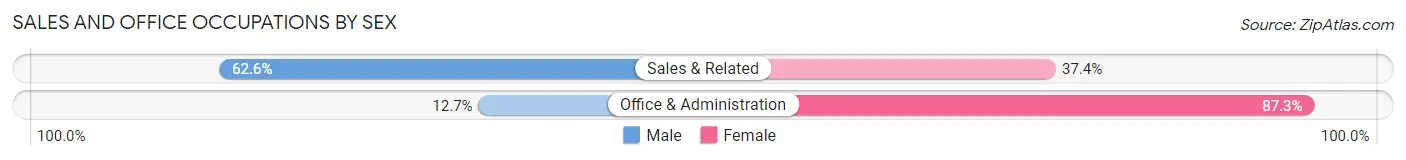
| Occupation | Male | Female |
| Sales & Related | 154 (62.6%) | 92 (37.4%) |
| Office & Administration | 49 (12.7%) | 336 (87.3%) |
| Total (Category) | 203 (32.2%) | 428 (67.8%) |
| Total (Overall) | 1,437 (46.7%) | 1,643 (53.3%) |
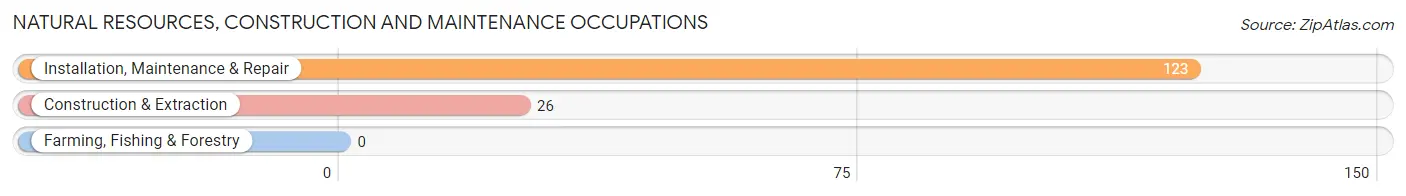
Natural Resources, Construction and Maintenance Occupations
The most common Natural Resources, Construction and Maintenance occupations in Talent are Installation, Maintenance & Repair (123 | 4.0%), and Construction & Extraction (26 | 0.8%).
Natural Resources, Construction and Maintenance Occupations by Sex
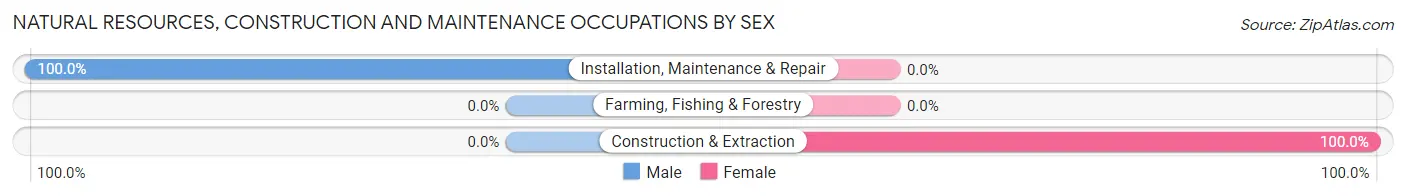
| Occupation | Male | Female |
| Farming, Fishing & Forestry | 0 (0.0%) | 0 (0.0%) |
| Construction & Extraction | 0 (0.0%) | 26 (100.0%) |
| Installation, Maintenance & Repair | 123 (100.0%) | 0 (0.0%) |
| Total (Category) | 123 (82.6%) | 26 (17.4%) |
| Total (Overall) | 1,437 (46.7%) | 1,643 (53.3%) |
Production, Transportation and Moving Occupations
The most common Production, Transportation and Moving occupations in Talent are Production (182 | 5.9%), Material Moving (60 | 1.9%), and Transportation (33 | 1.1%).
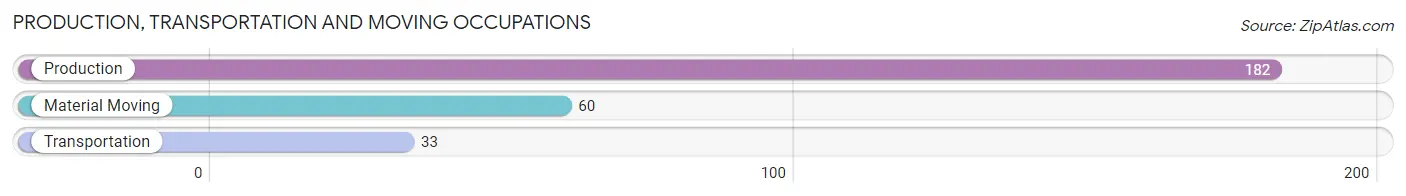
Production, Transportation and Moving Occupations by Sex
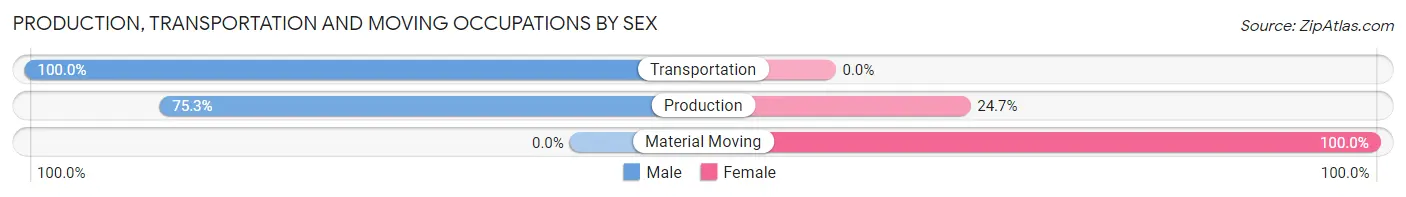
| Occupation | Male | Female |
| Production | 137 (75.3%) | 45 (24.7%) |
| Transportation | 33 (100.0%) | 0 (0.0%) |
| Material Moving | 0 (0.0%) | 60 (100.0%) |
| Total (Category) | 170 (61.8%) | 105 (38.2%) |
| Total (Overall) | 1,437 (46.7%) | 1,643 (53.3%) |
Employment Industries by Sex in Talent
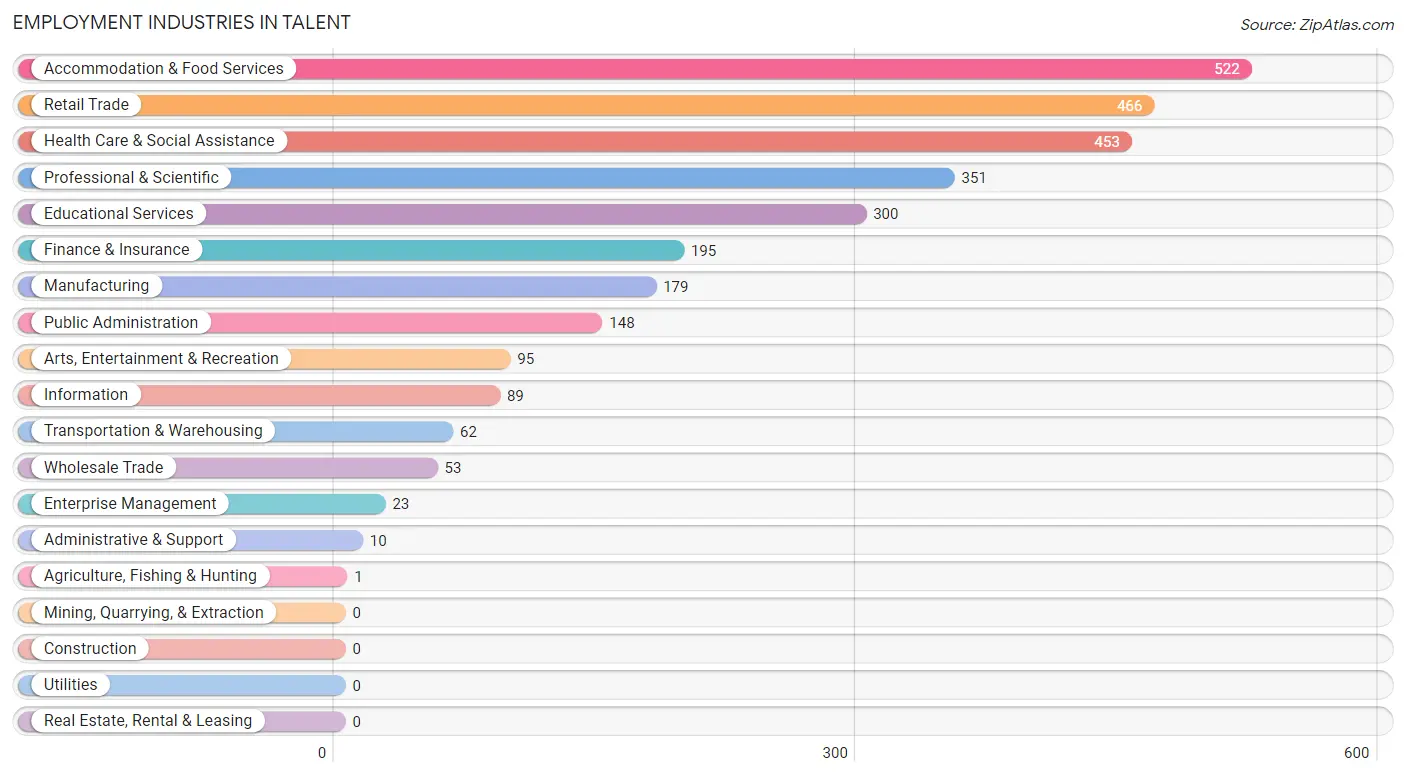
Employment Industries in Talent
The major employment industries in Talent include Accommodation & Food Services (522 | 17.0%), Retail Trade (466 | 15.1%), Health Care & Social Assistance (453 | 14.7%), Professional & Scientific (351 | 11.4%), and Educational Services (300 | 9.7%).
Employment Industries by Sex in Talent
The Talent industries that see more men than women are Wholesale Trade (100.0%), Transportation & Warehousing (100.0%), and Administrative & Support (90.0%), whereas the industries that tend to have a higher number of women are Agriculture, Fishing & Hunting (100.0%), Enterprise Management (100.0%), and Arts, Entertainment & Recreation (100.0%).
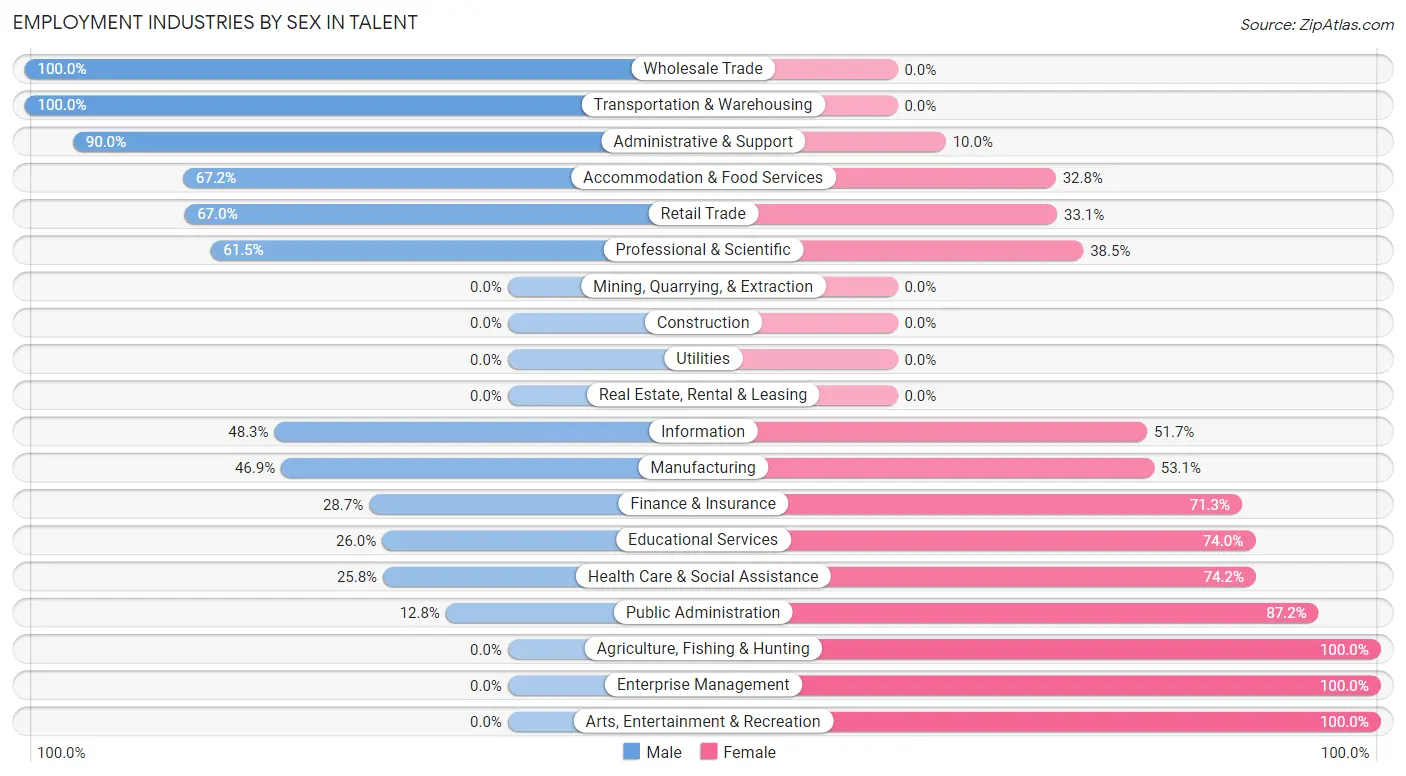
| Industry | Male | Female |
| Agriculture, Fishing & Hunting | 0 (0.0%) | 1 (100.0%) |
| Mining, Quarrying, & Extraction | 0 (0.0%) | 0 (0.0%) |
| Construction | 0 (0.0%) | 0 (0.0%) |
| Manufacturing | 84 (46.9%) | 95 (53.1%) |
| Wholesale Trade | 53 (100.0%) | 0 (0.0%) |
| Retail Trade | 312 (66.9%) | 154 (33.1%) |
| Transportation & Warehousing | 62 (100.0%) | 0 (0.0%) |
| Utilities | 0 (0.0%) | 0 (0.0%) |
| Information | 43 (48.3%) | 46 (51.7%) |
| Finance & Insurance | 56 (28.7%) | 139 (71.3%) |
| Real Estate, Rental & Leasing | 0 (0.0%) | 0 (0.0%) |
| Professional & Scientific | 216 (61.5%) | 135 (38.5%) |
| Enterprise Management | 0 (0.0%) | 23 (100.0%) |
| Administrative & Support | 9 (90.0%) | 1 (10.0%) |
| Educational Services | 78 (26.0%) | 222 (74.0%) |
| Health Care & Social Assistance | 117 (25.8%) | 336 (74.2%) |
| Arts, Entertainment & Recreation | 0 (0.0%) | 95 (100.0%) |
| Accommodation & Food Services | 351 (67.2%) | 171 (32.8%) |
| Public Administration | 19 (12.8%) | 129 (87.2%) |
| Total | 1,437 (46.7%) | 1,643 (53.3%) |
Education in Talent
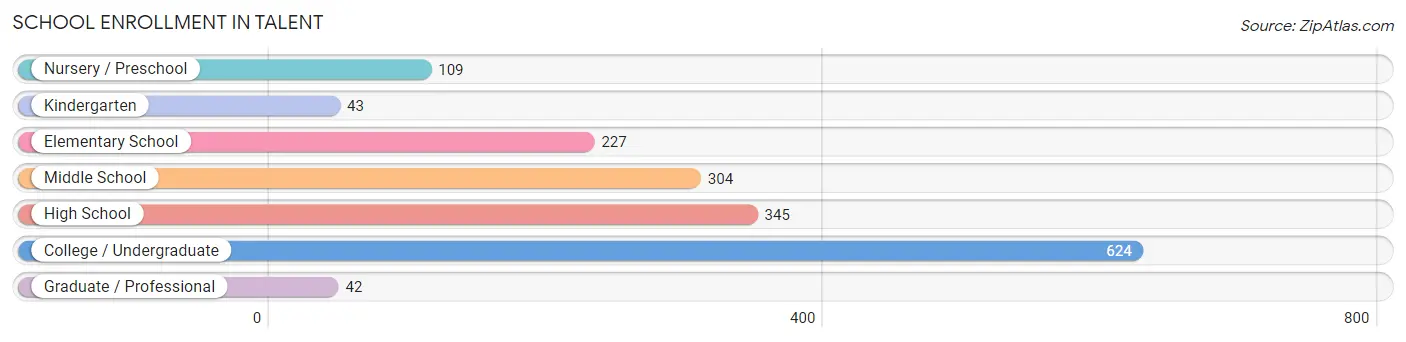
School Enrollment in Talent
The most common levels of schooling among the 1,694 students in Talent are college / undergraduate (624 | 36.8%), high school (345 | 20.4%), and middle school (304 | 17.9%).
| School Level | # Students | % Students |
| Nursery / Preschool | 109 | 6.4% |
| Kindergarten | 43 | 2.5% |
| Elementary School | 227 | 13.4% |
| Middle School | 304 | 17.9% |
| High School | 345 | 20.4% |
| College / Undergraduate | 624 | 36.8% |
| Graduate / Professional | 42 | 2.5% |
| Total | 1,694 | 100.0% |
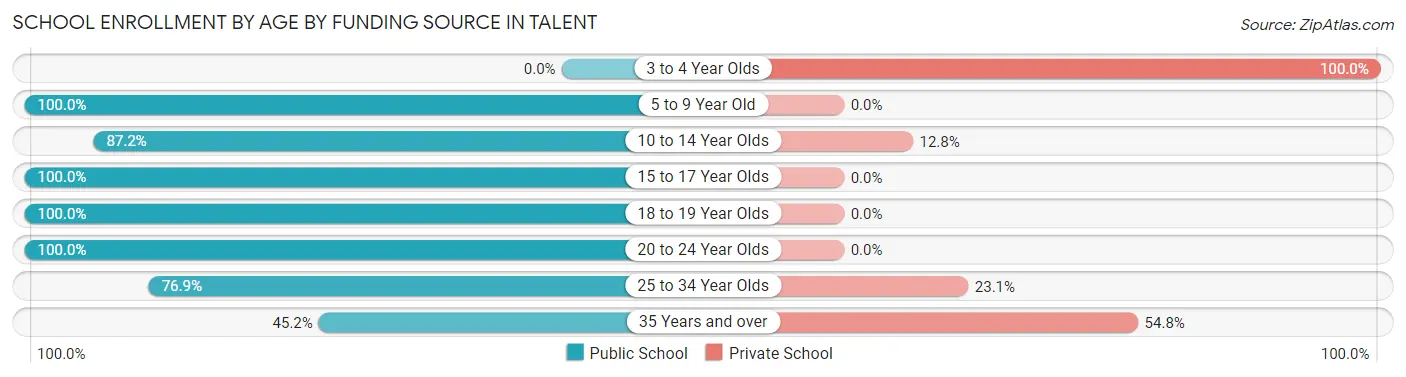
School Enrollment by Age by Funding Source in Talent
Out of a total of 1,694 students who are enrolled in schools in Talent, 173 (10.2%) attend a private institution, while the remaining 1,521 (89.8%) are enrolled in public schools. The age group of 3 to 4 year olds has the highest likelihood of being enrolled in private schools, with 67 (100.0% in the age bracket) enrolled. Conversely, the age group of 5 to 9 year old has the lowest likelihood of being enrolled in a private school, with 293 (100.0% in the age bracket) attending a public institution.
| Age Bracket | Public School | Private School |
| 3 to 4 Year Olds | 0 (0.0%) | 67 (100.0%) |
| 5 to 9 Year Old | 293 (100.0%) | 0 (0.0%) |
| 10 to 14 Year Olds | 333 (87.2%) | 49 (12.8%) |
| 15 to 17 Year Olds | 274 (100.0%) | 0 (0.0%) |
| 18 to 19 Year Olds | 12 (100.0%) | 0 (0.0%) |
| 20 to 24 Year Olds | 477 (100.0%) | 0 (0.0%) |
| 25 to 34 Year Olds | 113 (76.9%) | 34 (23.1%) |
| 35 Years and over | 19 (45.2%) | 23 (54.8%) |
| Total | 1,521 (89.8%) | 173 (10.2%) |
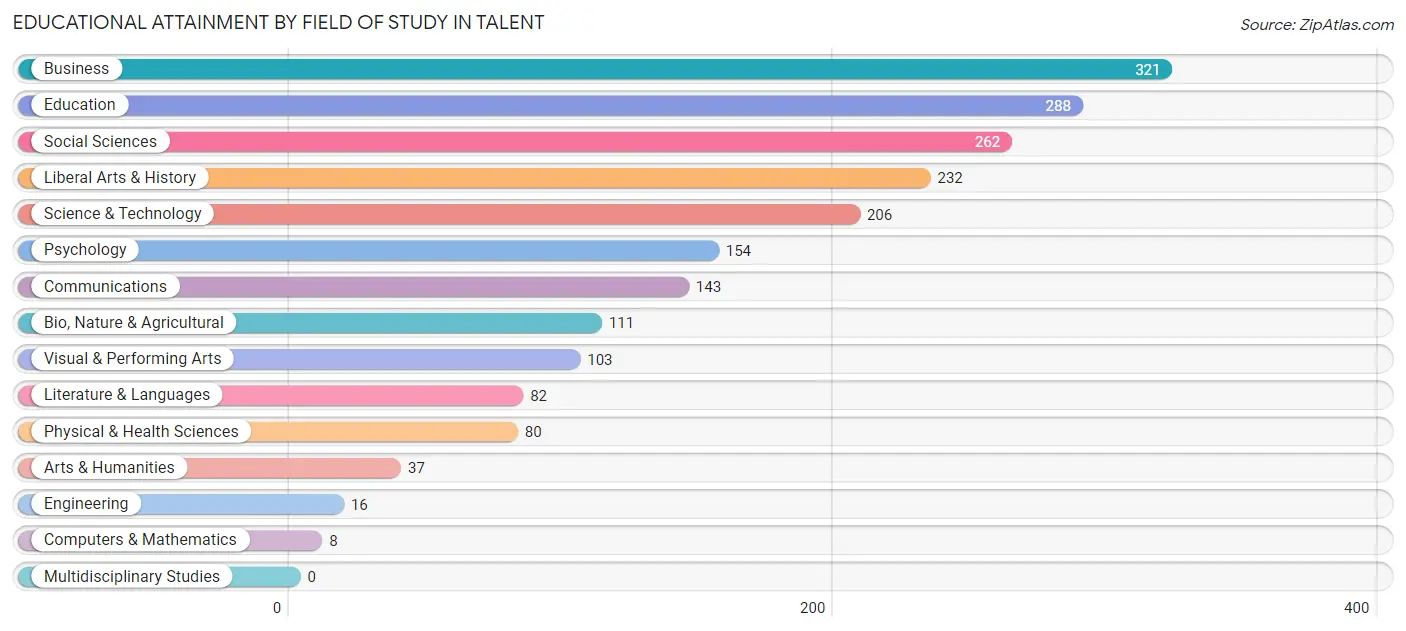
Educational Attainment by Field of Study in Talent
Business (321 | 15.7%), education (288 | 14.1%), social sciences (262 | 12.8%), liberal arts & history (232 | 11.4%), and science & technology (206 | 10.1%) are the most common fields of study among 2,043 individuals in Talent who have obtained a bachelor's degree or higher.
| Field of Study | # Graduates | % Graduates |
| Computers & Mathematics | 8 | 0.4% |
| Bio, Nature & Agricultural | 111 | 5.4% |
| Physical & Health Sciences | 80 | 3.9% |
| Psychology | 154 | 7.5% |
| Social Sciences | 262 | 12.8% |
| Engineering | 16 | 0.8% |
| Multidisciplinary Studies | 0 | 0.0% |
| Science & Technology | 206 | 10.1% |
| Business | 321 | 15.7% |
| Education | 288 | 14.1% |
| Literature & Languages | 82 | 4.0% |
| Liberal Arts & History | 232 | 11.4% |
| Visual & Performing Arts | 103 | 5.0% |
| Communications | 143 | 7.0% |
| Arts & Humanities | 37 | 1.8% |
| Total | 2,043 | 100.0% |
Transportation & Commute in Talent
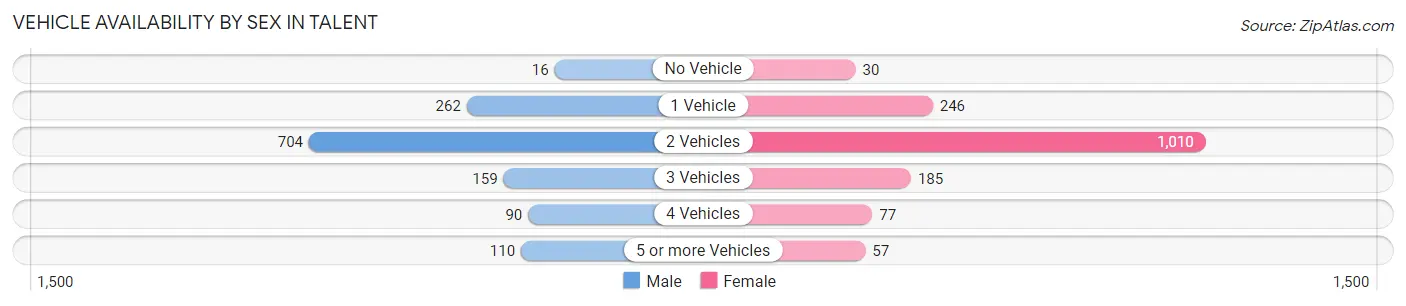
Vehicle Availability by Sex in Talent
The most prevalent vehicle ownership categories in Talent are males with 2 vehicles (704, accounting for 52.5%) and females with 2 vehicles (1,010, making up 43.9%).
| Vehicles Available | Male | Female |
| No Vehicle | 16 (1.2%) | 30 (1.9%) |
| 1 Vehicle | 262 (19.5%) | 246 (15.3%) |
| 2 Vehicles | 704 (52.5%) | 1,010 (62.9%) |
| 3 Vehicles | 159 (11.9%) | 185 (11.5%) |
| 4 Vehicles | 90 (6.7%) | 77 (4.8%) |
| 5 or more Vehicles | 110 (8.2%) | 57 (3.5%) |
| Total | 1,341 (100.0%) | 1,605 (100.0%) |
Commute Time in Talent
The most frequently occuring commute durations in Talent are 15 to 19 minutes (774 commuters, 29.3%), 20 to 24 minutes (618 commuters, 23.4%), and 10 to 14 minutes (510 commuters, 19.3%).
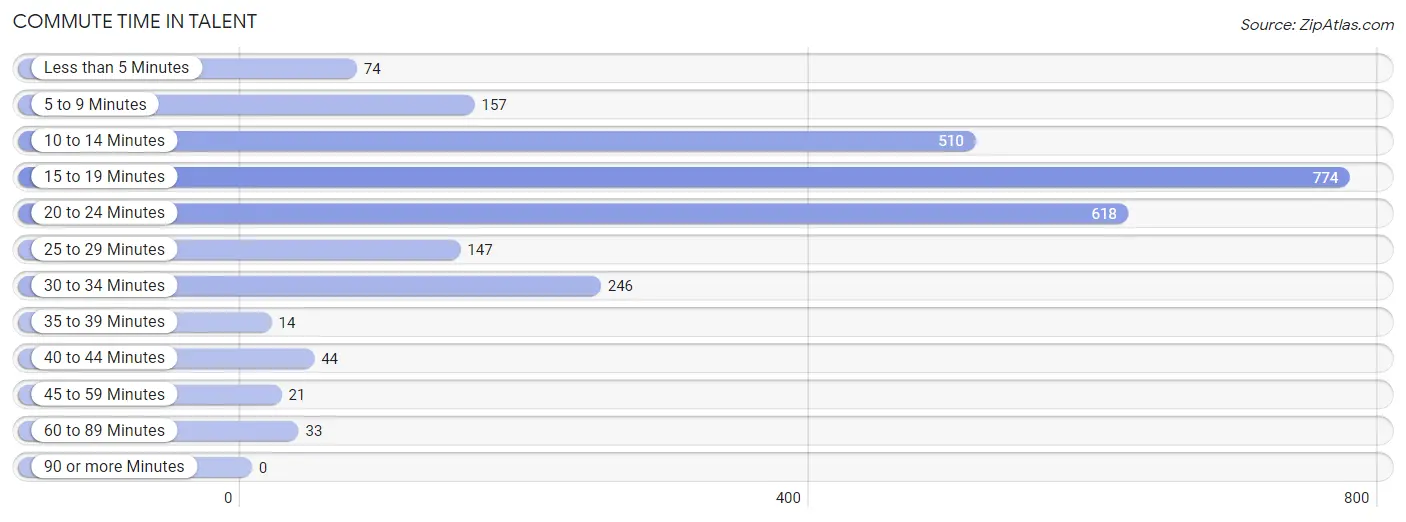
| Commute Time | # Commuters | % Commuters |
| Less than 5 Minutes | 74 | 2.8% |
| 5 to 9 Minutes | 157 | 5.9% |
| 10 to 14 Minutes | 510 | 19.3% |
| 15 to 19 Minutes | 774 | 29.3% |
| 20 to 24 Minutes | 618 | 23.4% |
| 25 to 29 Minutes | 147 | 5.6% |
| 30 to 34 Minutes | 246 | 9.3% |
| 35 to 39 Minutes | 14 | 0.5% |
| 40 to 44 Minutes | 44 | 1.7% |
| 45 to 59 Minutes | 21 | 0.8% |
| 60 to 89 Minutes | 33 | 1.3% |
| 90 or more Minutes | 0 | 0.0% |
Commute Time by Sex in Talent
The most common commute times in Talent are 20 to 24 minutes (317 commuters, 26.6%) for males and 15 to 19 minutes (466 commuters, 32.3%) for females.
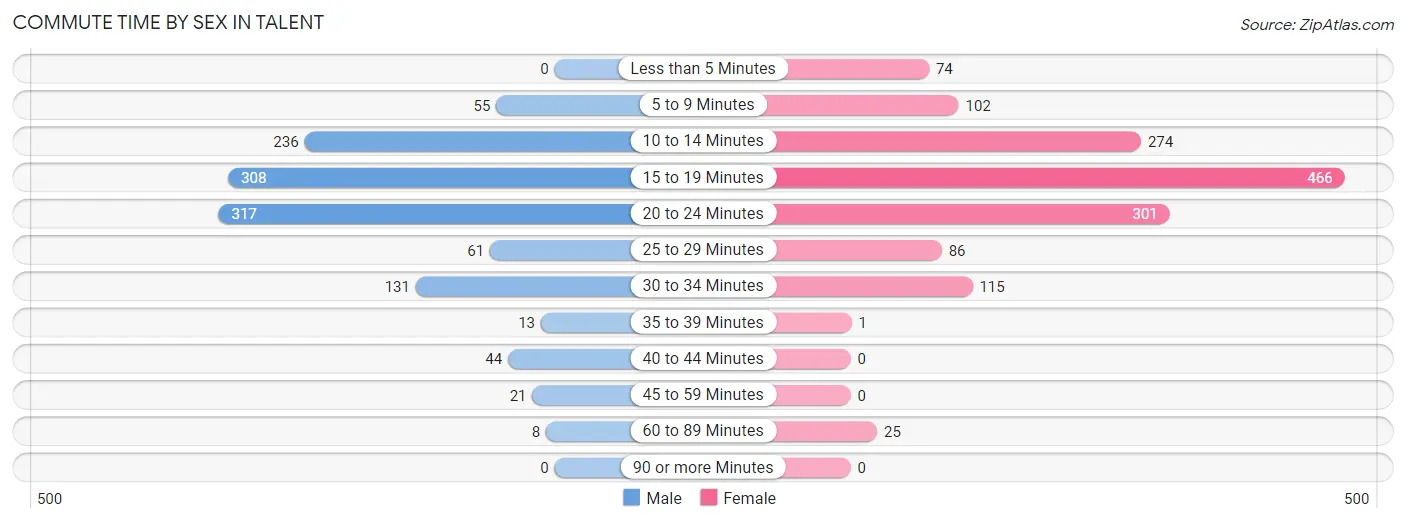
| Commute Time | Male | Female |
| Less than 5 Minutes | 0 (0.0%) | 74 (5.1%) |
| 5 to 9 Minutes | 55 (4.6%) | 102 (7.1%) |
| 10 to 14 Minutes | 236 (19.8%) | 274 (19.0%) |
| 15 to 19 Minutes | 308 (25.8%) | 466 (32.3%) |
| 20 to 24 Minutes | 317 (26.6%) | 301 (20.8%) |
| 25 to 29 Minutes | 61 (5.1%) | 86 (6.0%) |
| 30 to 34 Minutes | 131 (11.0%) | 115 (8.0%) |
| 35 to 39 Minutes | 13 (1.1%) | 1 (0.1%) |
| 40 to 44 Minutes | 44 (3.7%) | 0 (0.0%) |
| 45 to 59 Minutes | 21 (1.8%) | 0 (0.0%) |
| 60 to 89 Minutes | 8 (0.7%) | 25 (1.7%) |
| 90 or more Minutes | 0 (0.0%) | 0 (0.0%) |
Time of Departure to Work by Sex in Talent
The most frequent times of departure to work in Talent are 8:00 AM to 8:29 AM (257, 21.5%) for males and 8:30 AM to 8:59 AM (302, 20.9%) for females.
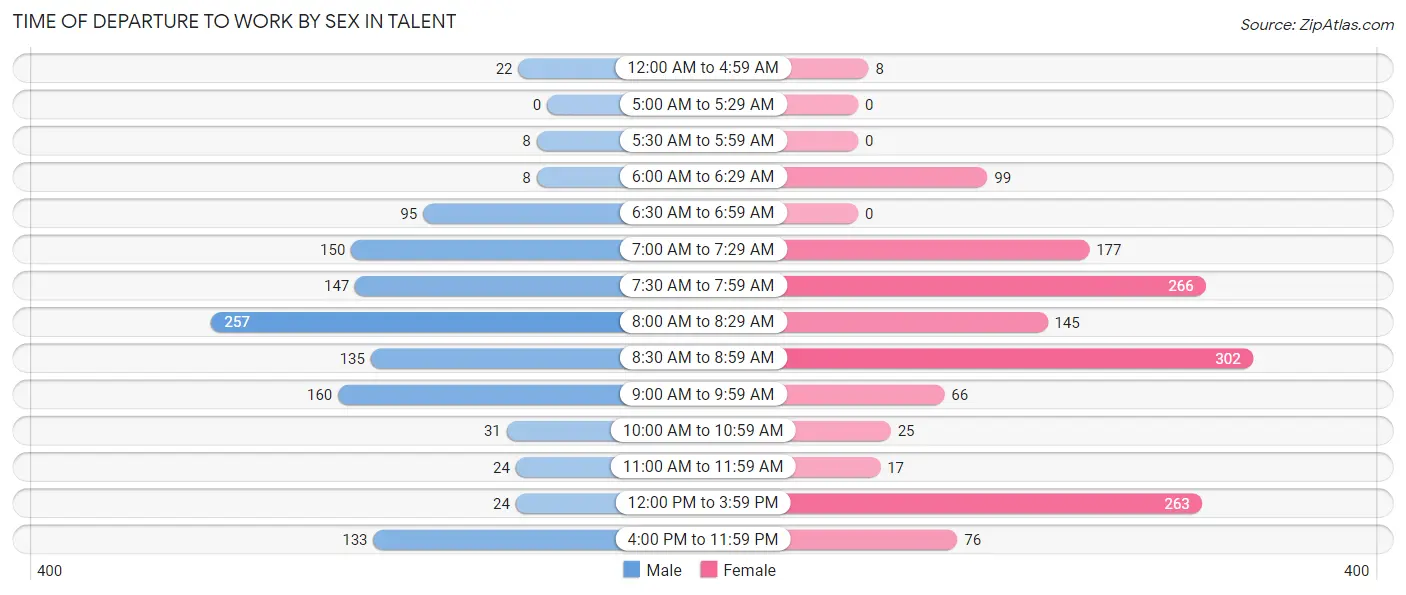
| Time of Departure | Male | Female |
| 12:00 AM to 4:59 AM | 22 (1.8%) | 8 (0.5%) |
| 5:00 AM to 5:29 AM | 0 (0.0%) | 0 (0.0%) |
| 5:30 AM to 5:59 AM | 8 (0.7%) | 0 (0.0%) |
| 6:00 AM to 6:29 AM | 8 (0.7%) | 99 (6.9%) |
| 6:30 AM to 6:59 AM | 95 (8.0%) | 0 (0.0%) |
| 7:00 AM to 7:29 AM | 150 (12.6%) | 177 (12.3%) |
| 7:30 AM to 7:59 AM | 147 (12.3%) | 266 (18.4%) |
| 8:00 AM to 8:29 AM | 257 (21.5%) | 145 (10.0%) |
| 8:30 AM to 8:59 AM | 135 (11.3%) | 302 (20.9%) |
| 9:00 AM to 9:59 AM | 160 (13.4%) | 66 (4.6%) |
| 10:00 AM to 10:59 AM | 31 (2.6%) | 25 (1.7%) |
| 11:00 AM to 11:59 AM | 24 (2.0%) | 17 (1.2%) |
| 12:00 PM to 3:59 PM | 24 (2.0%) | 263 (18.2%) |
| 4:00 PM to 11:59 PM | 133 (11.1%) | 76 (5.3%) |
| Total | 1,194 (100.0%) | 1,444 (100.0%) |
Housing Occupancy in Talent
Occupancy by Ownership in Talent
Of the total 2,782 dwellings in Talent, owner-occupied units account for 1,504 (54.1%), while renter-occupied units make up 1,278 (45.9%).
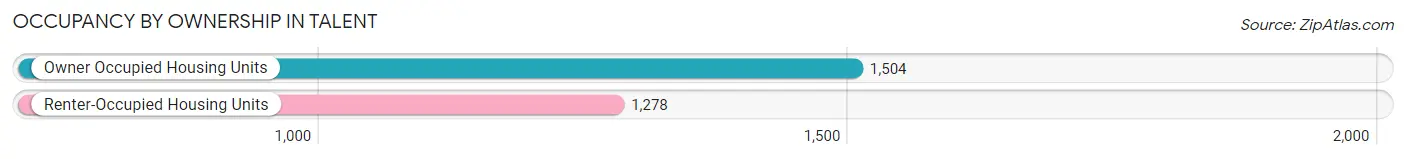
| Occupancy | # Housing Units | % Housing Units |
| Owner Occupied Housing Units | 1,504 | 54.1% |
| Renter-Occupied Housing Units | 1,278 | 45.9% |
| Total Occupied Housing Units | 2,782 | 100.0% |
Occupancy by Household Size in Talent
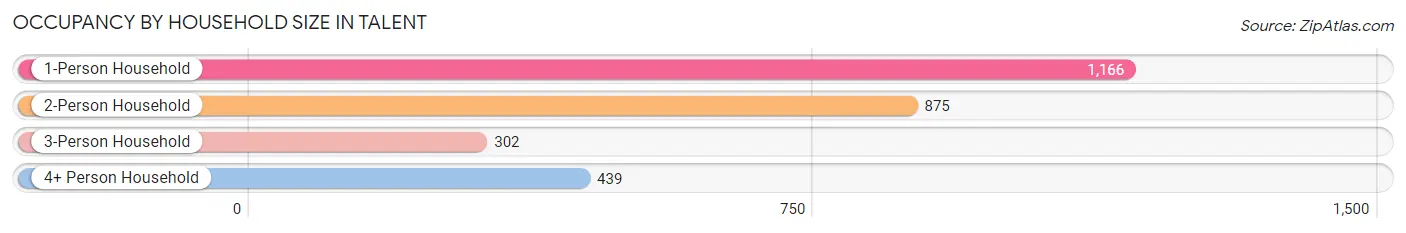
| Household Size | # Housing Units | % Housing Units |
| 1-Person Household | 1,166 | 41.9% |
| 2-Person Household | 875 | 31.5% |
| 3-Person Household | 302 | 10.9% |
| 4+ Person Household | 439 | 15.8% |
| Total Housing Units | 2,782 | 100.0% |
Occupancy by Ownership by Household Size in Talent
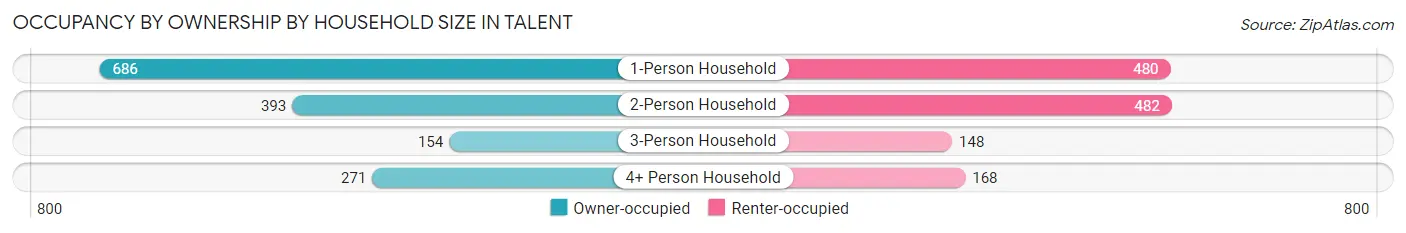
| Household Size | Owner-occupied | Renter-occupied |
| 1-Person Household | 686 (58.8%) | 480 (41.2%) |
| 2-Person Household | 393 (44.9%) | 482 (55.1%) |
| 3-Person Household | 154 (51.0%) | 148 (49.0%) |
| 4+ Person Household | 271 (61.7%) | 168 (38.3%) |
| Total Housing Units | 1,504 (54.1%) | 1,278 (45.9%) |
Occupancy by Educational Attainment in Talent
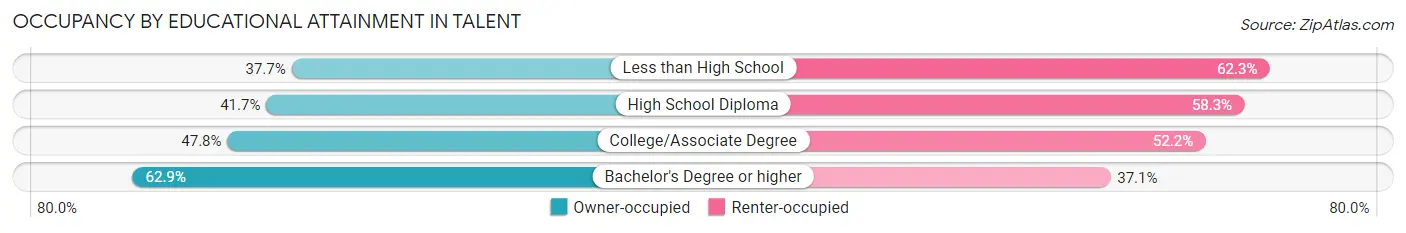
| Household Size | Owner-occupied | Renter-occupied |
| Less than High School | 29 (37.7%) | 48 (62.3%) |
| High School Diploma | 40 (41.7%) | 56 (58.3%) |
| College/Associate Degree | 653 (47.8%) | 712 (52.2%) |
| Bachelor's Degree or higher | 782 (62.9%) | 462 (37.1%) |
Occupancy by Age of Householder in Talent
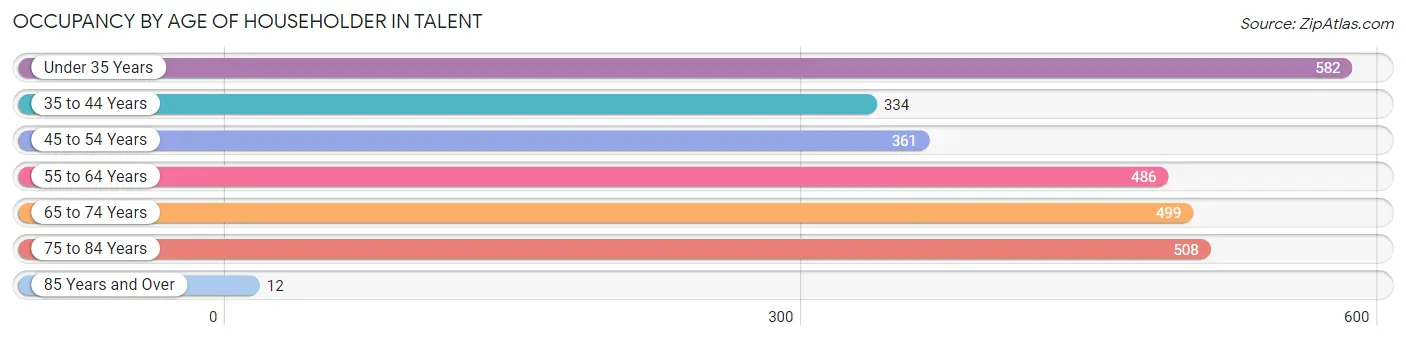
| Age Bracket | # Households | % Households |
| Under 35 Years | 582 | 20.9% |
| 35 to 44 Years | 334 | 12.0% |
| 45 to 54 Years | 361 | 13.0% |
| 55 to 64 Years | 486 | 17.5% |
| 65 to 74 Years | 499 | 17.9% |
| 75 to 84 Years | 508 | 18.3% |
| 85 Years and Over | 12 | 0.4% |
| Total | 2,782 | 100.0% |
Housing Finances in Talent
Median Income by Occupancy in Talent
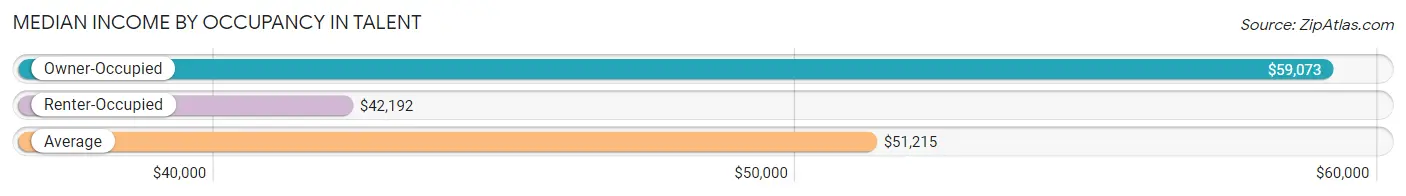
| Occupancy Type | # Households | Median Income |
| Owner-Occupied | 1,504 (54.1%) | $59,073 |
| Renter-Occupied | 1,278 (45.9%) | $42,192 |
| Average | 2,782 (100.0%) | $51,215 |
Occupancy by Householder Income Bracket in Talent
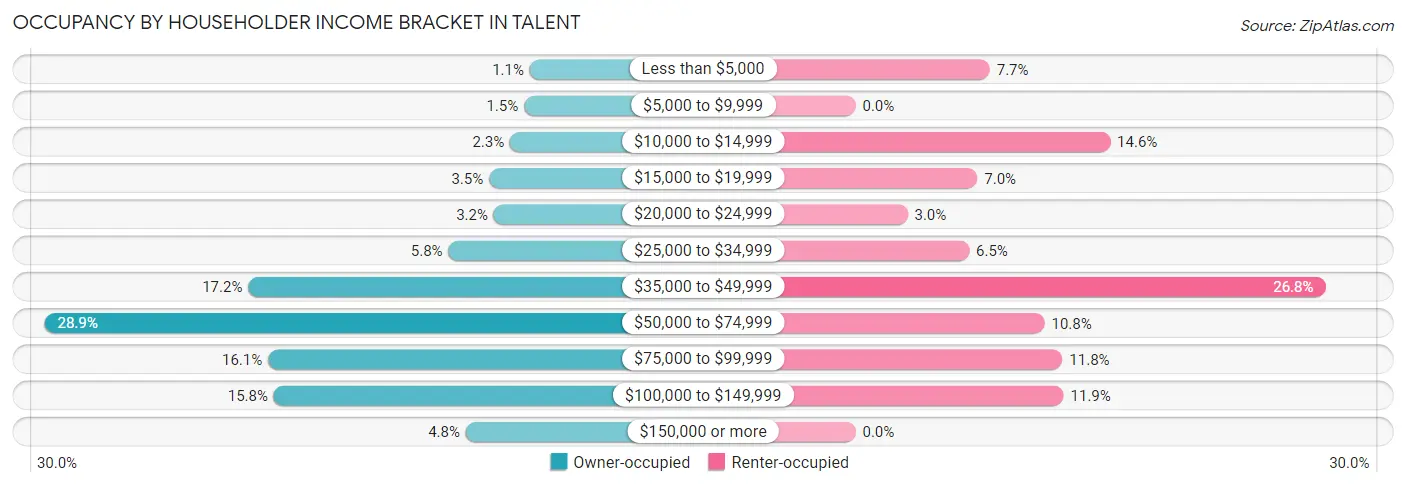
| Income Bracket | Owner-occupied | Renter-occupied |
| Less than $5,000 | 17 (1.1%) | 98 (7.7%) |
| $5,000 to $9,999 | 22 (1.5%) | 0 (0.0%) |
| $10,000 to $14,999 | 34 (2.3%) | 186 (14.5%) |
| $15,000 to $19,999 | 52 (3.5%) | 89 (7.0%) |
| $20,000 to $24,999 | 48 (3.2%) | 38 (3.0%) |
| $25,000 to $34,999 | 87 (5.8%) | 83 (6.5%) |
| $35,000 to $49,999 | 259 (17.2%) | 343 (26.8%) |
| $50,000 to $74,999 | 434 (28.9%) | 138 (10.8%) |
| $75,000 to $99,999 | 242 (16.1%) | 151 (11.8%) |
| $100,000 to $149,999 | 237 (15.8%) | 152 (11.9%) |
| $150,000 or more | 72 (4.8%) | 0 (0.0%) |
| Total | 1,504 (100.0%) | 1,278 (100.0%) |
Monthly Housing Cost Tiers in Talent
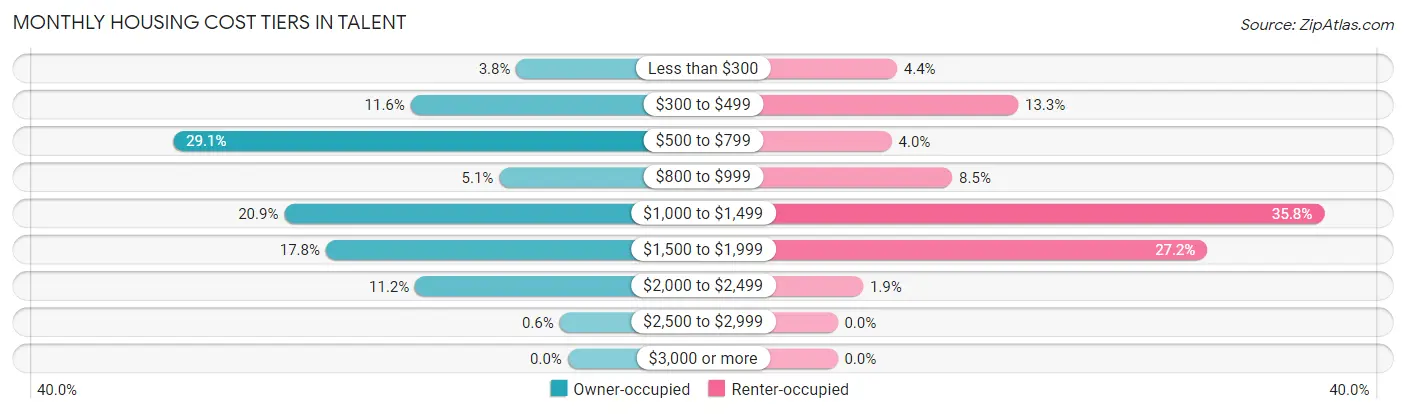
| Monthly Cost | Owner-occupied | Renter-occupied |
| Less than $300 | 57 (3.8%) | 56 (4.4%) |
| $300 to $499 | 174 (11.6%) | 170 (13.3%) |
| $500 to $799 | 437 (29.1%) | 51 (4.0%) |
| $800 to $999 | 76 (5.1%) | 108 (8.5%) |
| $1,000 to $1,499 | 314 (20.9%) | 458 (35.8%) |
| $1,500 to $1,999 | 268 (17.8%) | 348 (27.2%) |
| $2,000 to $2,499 | 169 (11.2%) | 24 (1.9%) |
| $2,500 to $2,999 | 9 (0.6%) | 0 (0.0%) |
| $3,000 or more | 0 (0.0%) | 0 (0.0%) |
| Total | 1,504 (100.0%) | 1,278 (100.0%) |
Physical Housing Characteristics in Talent
Housing Structures in Talent
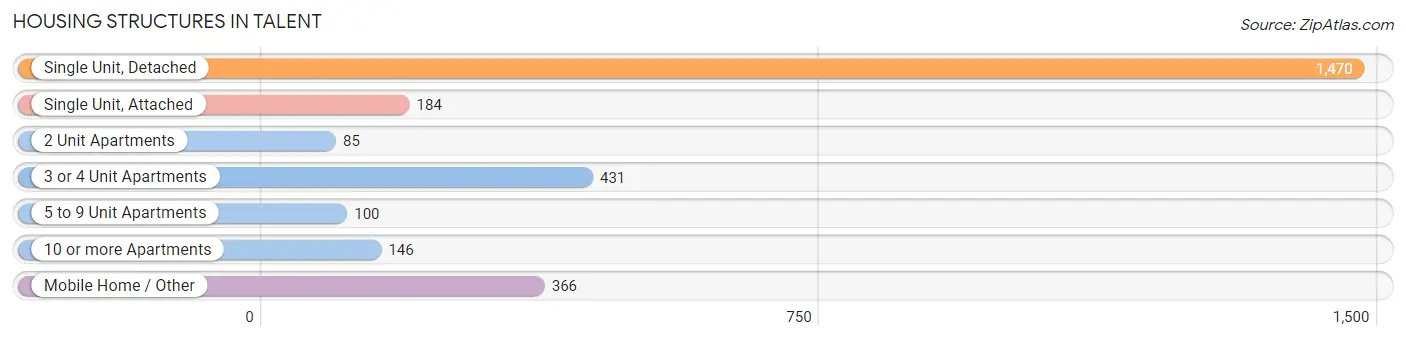
| Structure Type | # Housing Units | % Housing Units |
| Single Unit, Detached | 1,470 | 52.8% |
| Single Unit, Attached | 184 | 6.6% |
| 2 Unit Apartments | 85 | 3.1% |
| 3 or 4 Unit Apartments | 431 | 15.5% |
| 5 to 9 Unit Apartments | 100 | 3.6% |
| 10 or more Apartments | 146 | 5.2% |
| Mobile Home / Other | 366 | 13.2% |
| Total | 2,782 | 100.0% |
Housing Structures by Occupancy in Talent
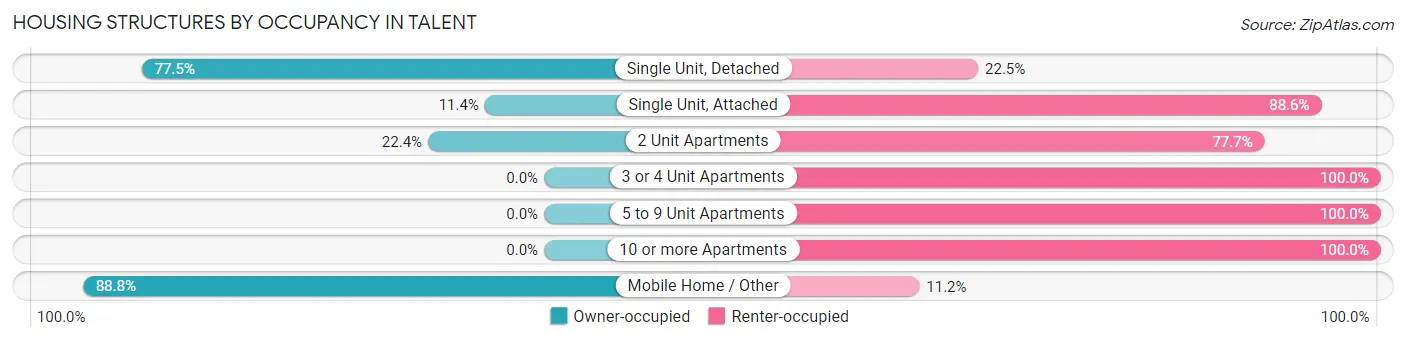
| Structure Type | Owner-occupied | Renter-occupied |
| Single Unit, Detached | 1,139 (77.5%) | 331 (22.5%) |
| Single Unit, Attached | 21 (11.4%) | 163 (88.6%) |
| 2 Unit Apartments | 19 (22.4%) | 66 (77.6%) |
| 3 or 4 Unit Apartments | 0 (0.0%) | 431 (100.0%) |
| 5 to 9 Unit Apartments | 0 (0.0%) | 100 (100.0%) |
| 10 or more Apartments | 0 (0.0%) | 146 (100.0%) |
| Mobile Home / Other | 325 (88.8%) | 41 (11.2%) |
| Total | 1,504 (54.1%) | 1,278 (45.9%) |
Housing Structures by Number of Rooms in Talent
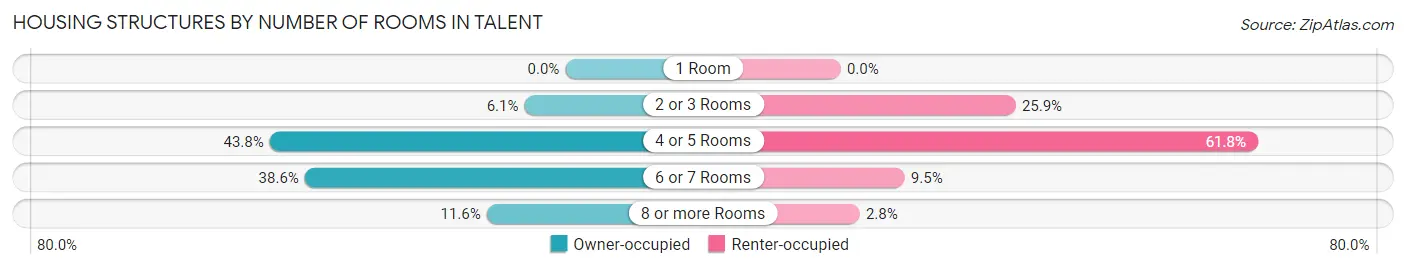
| Number of Rooms | Owner-occupied | Renter-occupied |
| 1 Room | 0 (0.0%) | 0 (0.0%) |
| 2 or 3 Rooms | 91 (6.0%) | 331 (25.9%) |
| 4 or 5 Rooms | 658 (43.8%) | 790 (61.8%) |
| 6 or 7 Rooms | 580 (38.6%) | 121 (9.5%) |
| 8 or more Rooms | 175 (11.6%) | 36 (2.8%) |
| Total | 1,504 (100.0%) | 1,278 (100.0%) |
Housing Structure by Heating Type in Talent
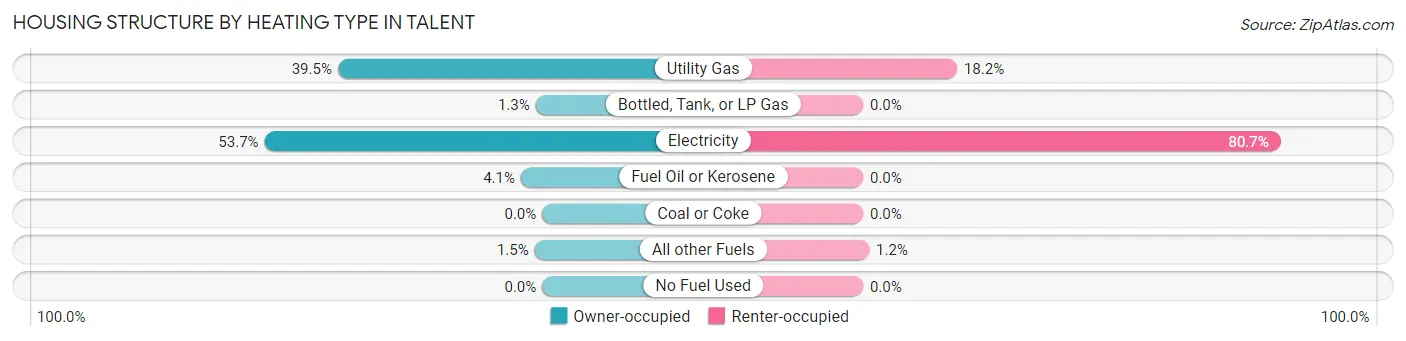
| Heating Type | Owner-occupied | Renter-occupied |
| Utility Gas | 594 (39.5%) | 232 (18.1%) |
| Bottled, Tank, or LP Gas | 19 (1.3%) | 0 (0.0%) |
| Electricity | 807 (53.7%) | 1,031 (80.7%) |
| Fuel Oil or Kerosene | 62 (4.1%) | 0 (0.0%) |
| Coal or Coke | 0 (0.0%) | 0 (0.0%) |
| All other Fuels | 22 (1.5%) | 15 (1.2%) |
| No Fuel Used | 0 (0.0%) | 0 (0.0%) |
| Total | 1,504 (100.0%) | 1,278 (100.0%) |
Household Vehicle Usage in Talent
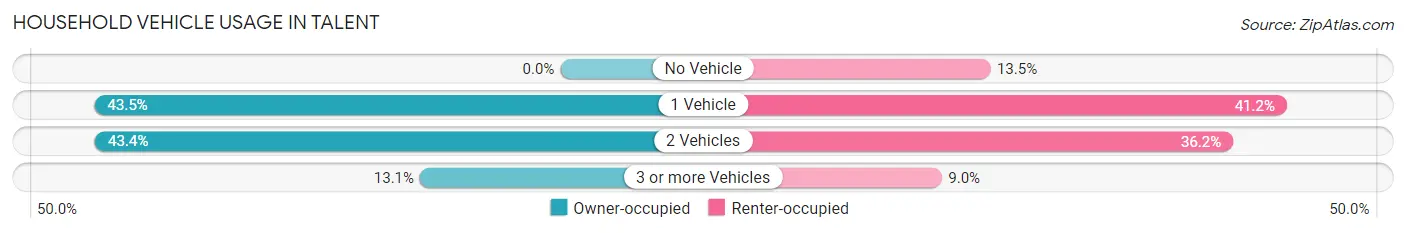
| Vehicles per Household | Owner-occupied | Renter-occupied |
| No Vehicle | 0 (0.0%) | 173 (13.5%) |
| 1 Vehicle | 654 (43.5%) | 527 (41.2%) |
| 2 Vehicles | 653 (43.4%) | 463 (36.2%) |
| 3 or more Vehicles | 197 (13.1%) | 115 (9.0%) |
| Total | 1,504 (100.0%) | 1,278 (100.0%) |
Real Estate & Mortgages in Talent
Real Estate and Mortgage Overview in Talent
| Characteristic | Without Mortgage | With Mortgage |
| Housing Units | 704 | 800 |
| Median Property Value | - | - |
| Median Household Income | $50,833 | $72 |
| Monthly Housing Costs | $570 | $0 |
| Real Estate Taxes | - | - |
Property Value by Mortgage Status in Talent
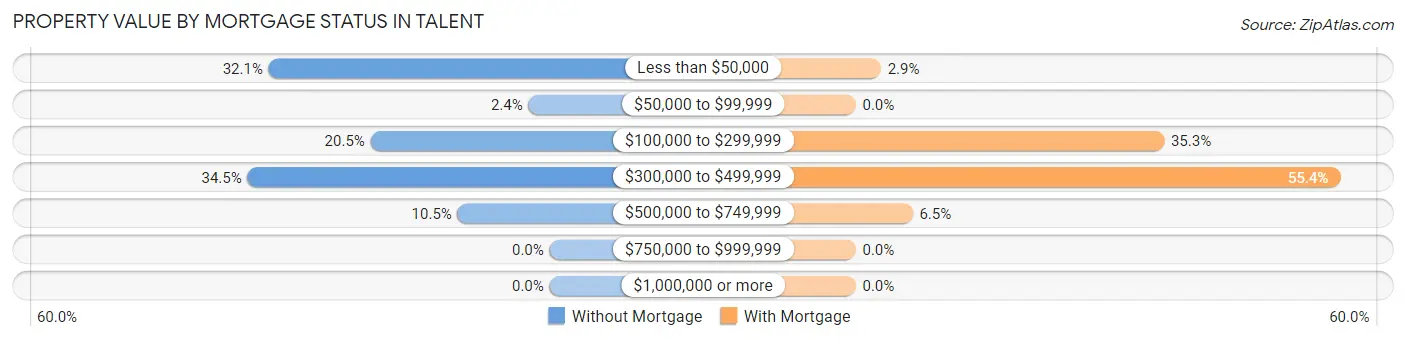
| Property Value | Without Mortgage | With Mortgage |
| Less than $50,000 | 226 (32.1%) | 23 (2.9%) |
| $50,000 to $99,999 | 17 (2.4%) | 0 (0.0%) |
| $100,000 to $299,999 | 144 (20.4%) | 282 (35.2%) |
| $300,000 to $499,999 | 243 (34.5%) | 443 (55.4%) |
| $500,000 to $749,999 | 74 (10.5%) | 52 (6.5%) |
| $750,000 to $999,999 | 0 (0.0%) | 0 (0.0%) |
| $1,000,000 or more | 0 (0.0%) | 0 (0.0%) |
| Total | 704 (100.0%) | 800 (100.0%) |
Household Income by Mortgage Status in Talent
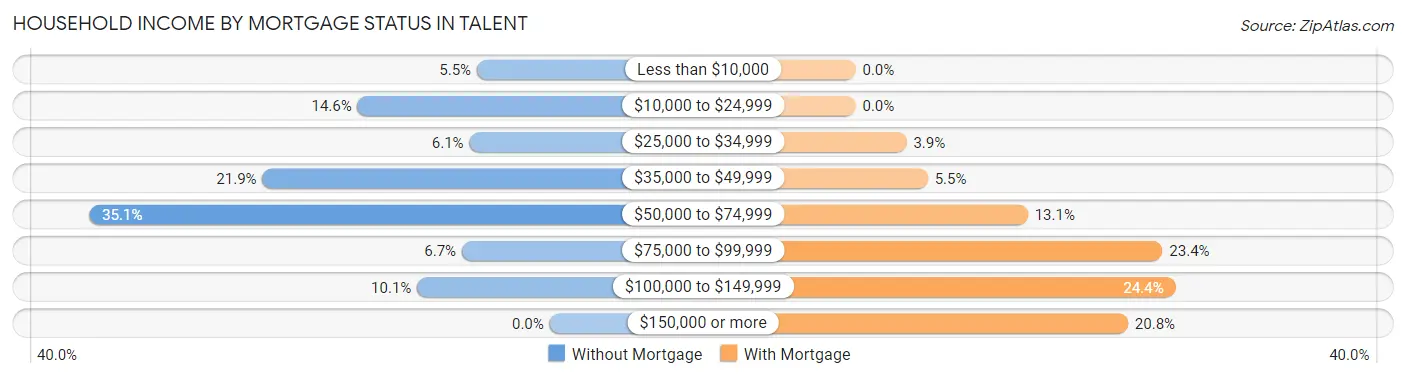
| Household Income | Without Mortgage | With Mortgage |
| Less than $10,000 | 39 (5.5%) | 0 (0.0%) |
| $10,000 to $24,999 | 103 (14.6%) | 0 (0.0%) |
| $25,000 to $34,999 | 43 (6.1%) | 31 (3.9%) |
| $35,000 to $49,999 | 154 (21.9%) | 44 (5.5%) |
| $50,000 to $74,999 | 247 (35.1%) | 105 (13.1%) |
| $75,000 to $99,999 | 47 (6.7%) | 187 (23.4%) |
| $100,000 to $149,999 | 71 (10.1%) | 195 (24.4%) |
| $150,000 or more | 0 (0.0%) | 166 (20.7%) |
| Total | 704 (100.0%) | 800 (100.0%) |
Property Value to Household Income Ratio in Talent
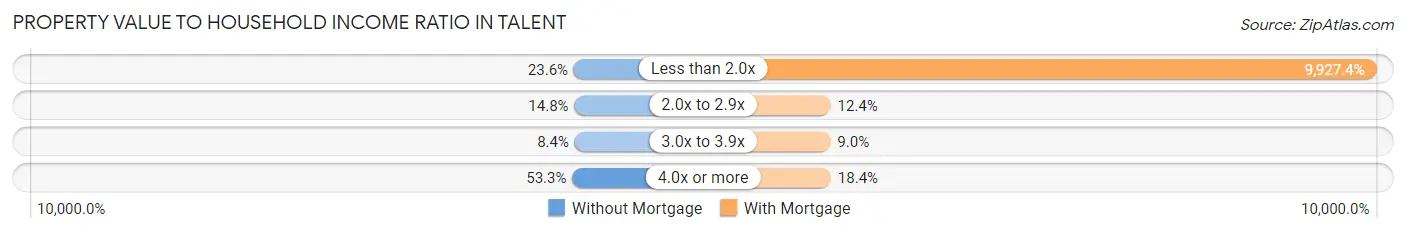
| Value-to-Income Ratio | Without Mortgage | With Mortgage |
| Less than 2.0x | 166 (23.6%) | 79,419 (9,927.4%) |
| 2.0x to 2.9x | 104 (14.8%) | 99 (12.4%) |
| 3.0x to 3.9x | 59 (8.4%) | 72 (9.0%) |
| 4.0x or more | 375 (53.3%) | 147 (18.4%) |
| Total | 704 (100.0%) | 800 (100.0%) |
Real Estate Taxes by Mortgage Status in Talent
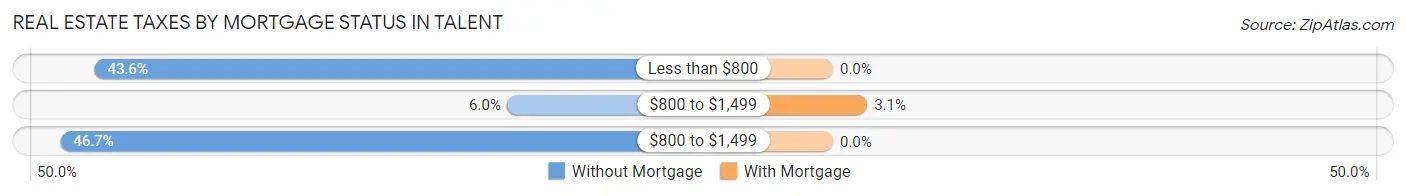
| Property Taxes | Without Mortgage | With Mortgage |
| Less than $800 | 307 (43.6%) | 0 (0.0%) |
| $800 to $1,499 | 42 (6.0%) | 25 (3.1%) |
| $800 to $1,499 | 329 (46.7%) | 0 (0.0%) |
| Total | 704 (100.0%) | 800 (100.0%) |
Health & Disability in Talent
Health Insurance Coverage by Age in Talent
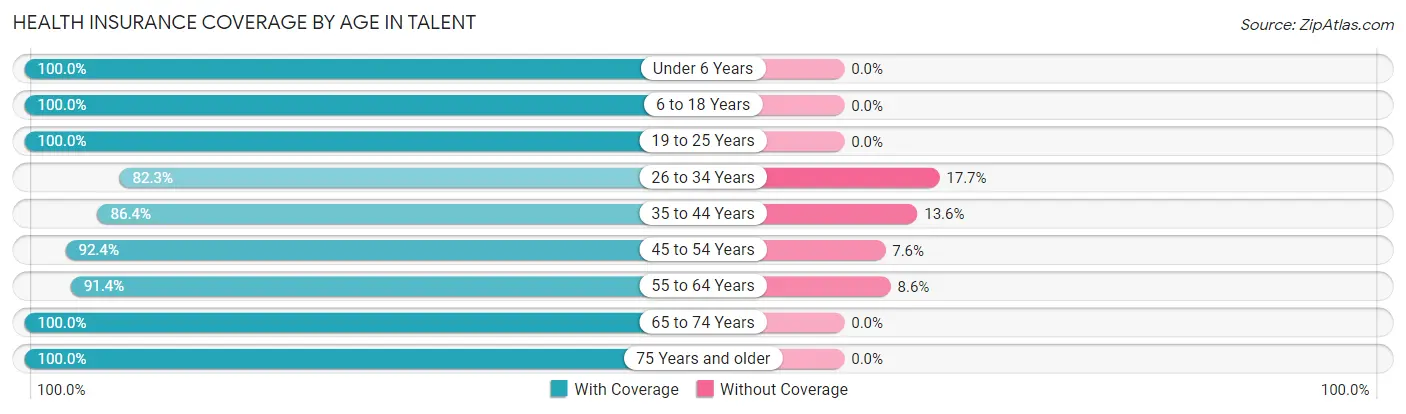
| Age Bracket | With Coverage | Without Coverage |
| Under 6 Years | 280 (100.0%) | 0 (0.0%) |
| 6 to 18 Years | 919 (100.0%) | 0 (0.0%) |
| 19 to 25 Years | 1,075 (100.0%) | 0 (0.0%) |
| 26 to 34 Years | 566 (82.3%) | 122 (17.7%) |
| 35 to 44 Years | 628 (86.4%) | 99 (13.6%) |
| 45 to 54 Years | 544 (92.4%) | 45 (7.6%) |
| 55 to 64 Years | 593 (91.4%) | 56 (8.6%) |
| 65 to 74 Years | 714 (100.0%) | 0 (0.0%) |
| 75 Years and older | 615 (100.0%) | 0 (0.0%) |
| Total | 5,934 (94.9%) | 322 (5.1%) |
Health Insurance Coverage by Citizenship Status in Talent
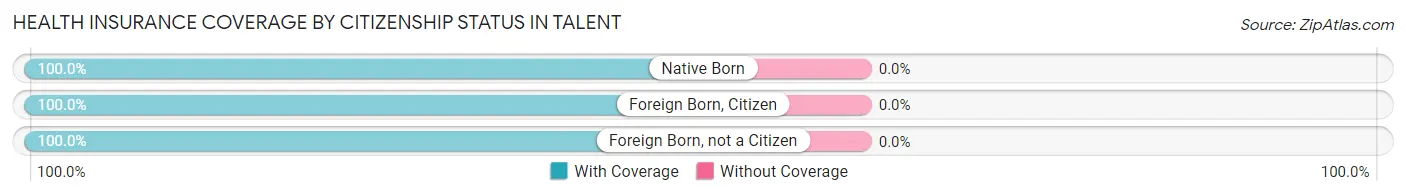
| Citizenship Status | With Coverage | Without Coverage |
| Native Born | 280 (100.0%) | 0 (0.0%) |
| Foreign Born, Citizen | 919 (100.0%) | 0 (0.0%) |
| Foreign Born, not a Citizen | 1,075 (100.0%) | 0 (0.0%) |
Health Insurance Coverage by Household Income in Talent
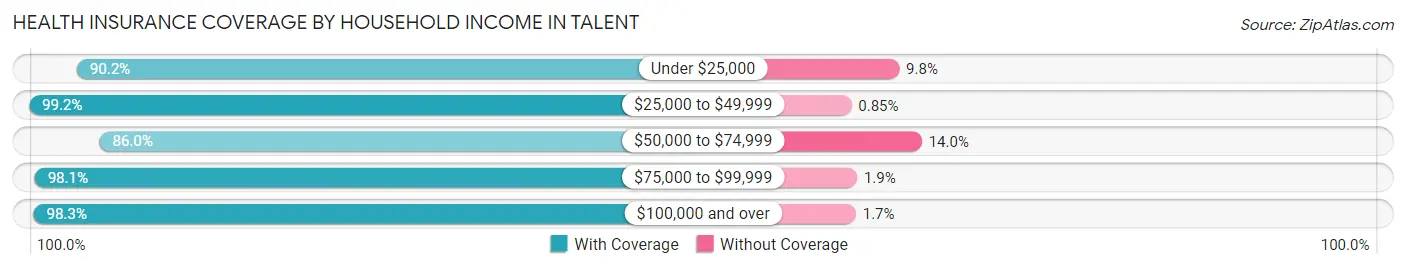
| Household Income | With Coverage | Without Coverage |
| Under $25,000 | 708 (90.2%) | 77 (9.8%) |
| $25,000 to $49,999 | 1,522 (99.2%) | 13 (0.9%) |
| $50,000 to $74,999 | 1,139 (86.0%) | 186 (14.0%) |
| $75,000 to $99,999 | 1,081 (98.1%) | 21 (1.9%) |
| $100,000 and over | 1,454 (98.3%) | 25 (1.7%) |
Public vs Private Health Insurance Coverage by Age in Talent
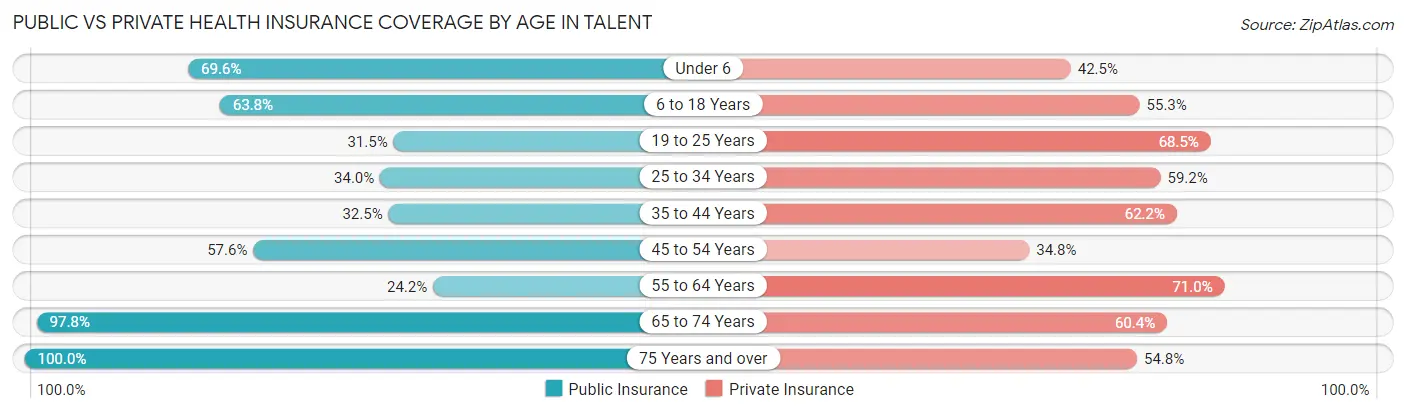
| Age Bracket | Public Insurance | Private Insurance |
| Under 6 | 195 (69.6%) | 119 (42.5%) |
| 6 to 18 Years | 586 (63.8%) | 508 (55.3%) |
| 19 to 25 Years | 339 (31.5%) | 736 (68.5%) |
| 25 to 34 Years | 234 (34.0%) | 407 (59.2%) |
| 35 to 44 Years | 236 (32.5%) | 452 (62.2%) |
| 45 to 54 Years | 339 (57.6%) | 205 (34.8%) |
| 55 to 64 Years | 157 (24.2%) | 461 (71.0%) |
| 65 to 74 Years | 698 (97.8%) | 431 (60.4%) |
| 75 Years and over | 615 (100.0%) | 337 (54.8%) |
| Total | 3,399 (54.3%) | 3,656 (58.4%) |
Disability Status by Sex by Age in Talent
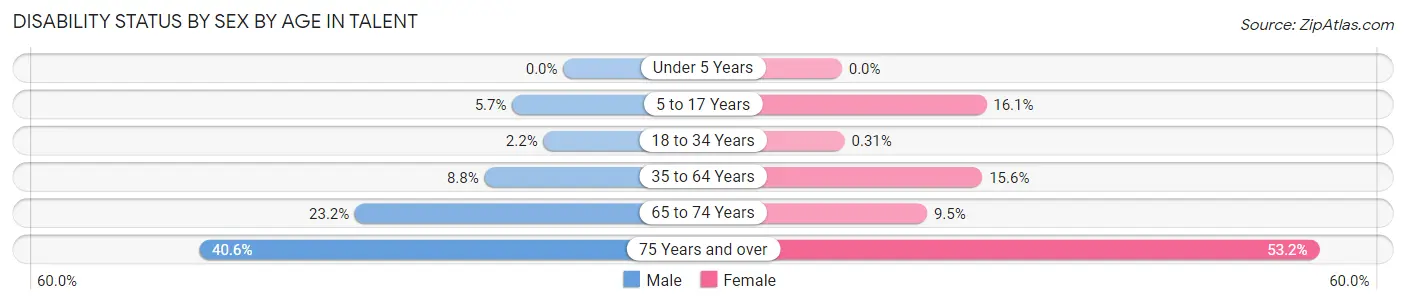
| Age Bracket | Male | Female |
| Under 5 Years | 0 (0.0%) | 0 (0.0%) |
| 5 to 17 Years | 31 (5.7%) | 65 (16.1%) |
| 18 to 34 Years | 18 (2.2%) | 3 (0.3%) |
| 35 to 64 Years | 81 (8.8%) | 163 (15.6%) |
| 65 to 74 Years | 80 (23.2%) | 35 (9.5%) |
| 75 Years and over | 71 (40.6%) | 234 (53.2%) |
Disability Class by Sex by Age in Talent
Disability Class: Hearing Difficulty
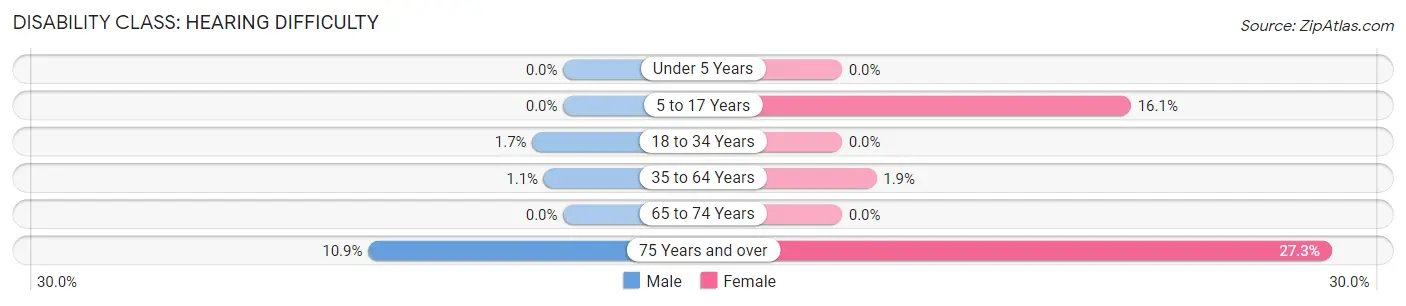
| Age Bracket | Male | Female |
| Under 5 Years | 0 (0.0%) | 0 (0.0%) |
| 5 to 17 Years | 0 (0.0%) | 65 (16.1%) |
| 18 to 34 Years | 14 (1.7%) | 0 (0.0%) |
| 35 to 64 Years | 10 (1.1%) | 20 (1.9%) |
| 65 to 74 Years | 0 (0.0%) | 0 (0.0%) |
| 75 Years and over | 19 (10.9%) | 120 (27.3%) |
Disability Class: Vision Difficulty
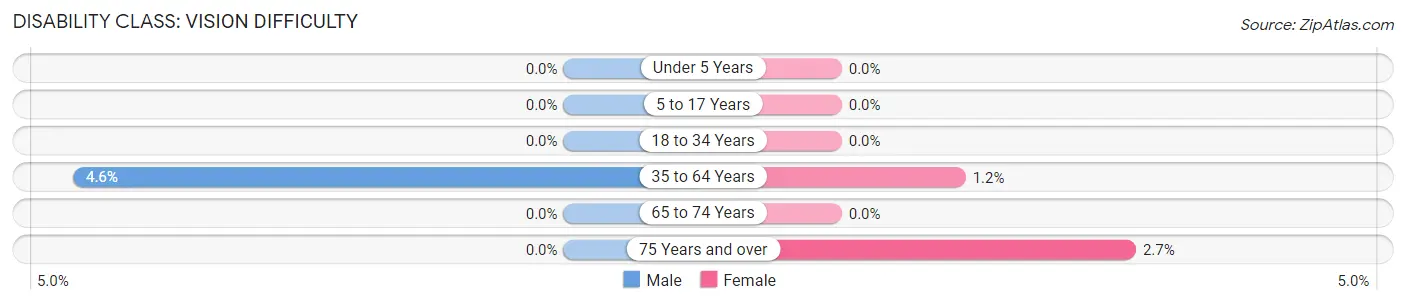
| Age Bracket | Male | Female |
| Under 5 Years | 0 (0.0%) | 0 (0.0%) |
| 5 to 17 Years | 0 (0.0%) | 0 (0.0%) |
| 18 to 34 Years | 0 (0.0%) | 0 (0.0%) |
| 35 to 64 Years | 42 (4.5%) | 12 (1.1%) |
| 65 to 74 Years | 0 (0.0%) | 0 (0.0%) |
| 75 Years and over | 0 (0.0%) | 12 (2.7%) |
Disability Class: Cognitive Difficulty
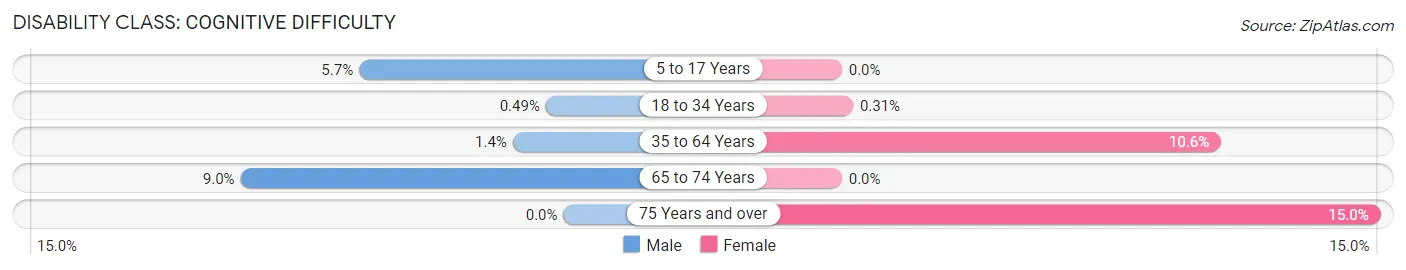
| Age Bracket | Male | Female |
| 5 to 17 Years | 31 (5.7%) | 0 (0.0%) |
| 18 to 34 Years | 4 (0.5%) | 3 (0.3%) |
| 35 to 64 Years | 13 (1.4%) | 110 (10.6%) |
| 65 to 74 Years | 31 (9.0%) | 0 (0.0%) |
| 75 Years and over | 0 (0.0%) | 66 (15.0%) |
Disability Class: Ambulatory Difficulty
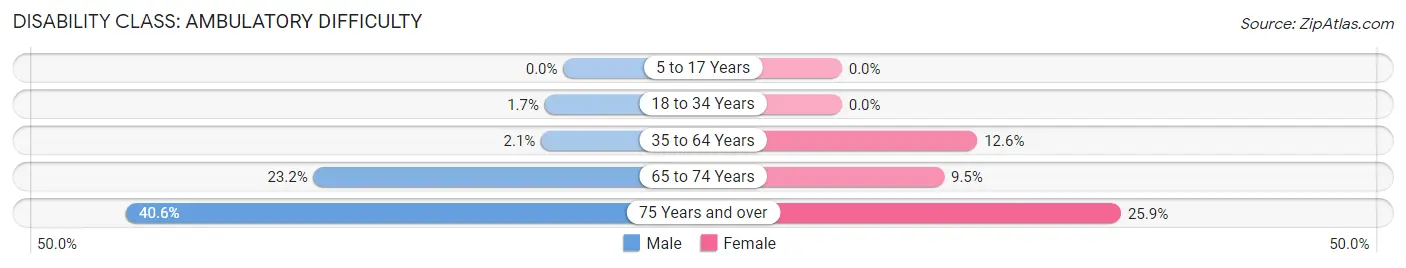
| Age Bracket | Male | Female |
| 5 to 17 Years | 0 (0.0%) | 0 (0.0%) |
| 18 to 34 Years | 14 (1.7%) | 0 (0.0%) |
| 35 to 64 Years | 19 (2.1%) | 131 (12.6%) |
| 65 to 74 Years | 80 (23.2%) | 35 (9.5%) |
| 75 Years and over | 71 (40.6%) | 114 (25.9%) |
Disability Class: Self-Care Difficulty
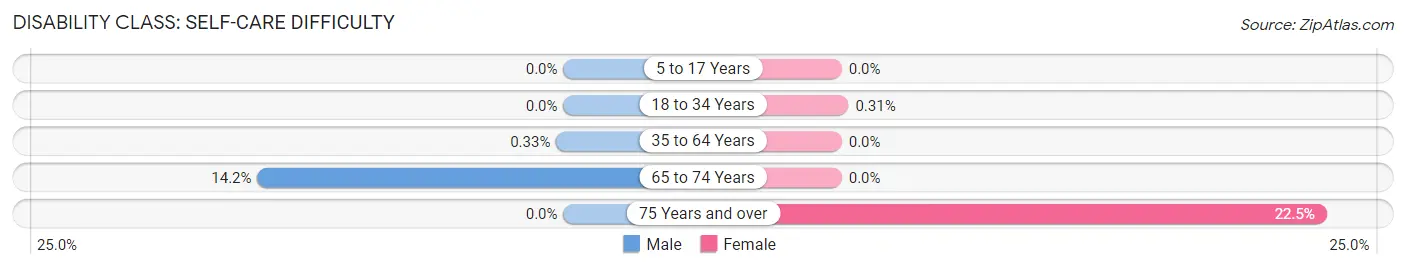
| Age Bracket | Male | Female |
| 5 to 17 Years | 0 (0.0%) | 0 (0.0%) |
| 18 to 34 Years | 0 (0.0%) | 3 (0.3%) |
| 35 to 64 Years | 3 (0.3%) | 0 (0.0%) |
| 65 to 74 Years | 49 (14.2%) | 0 (0.0%) |
| 75 Years and over | 0 (0.0%) | 99 (22.5%) |
Technology Access in Talent
Computing Device Access in Talent
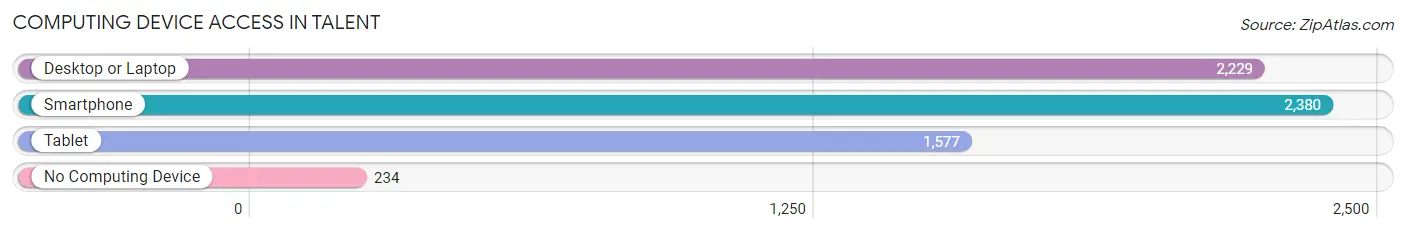
| Device Type | # Households | % Households |
| Desktop or Laptop | 2,229 | 80.1% |
| Smartphone | 2,380 | 85.6% |
| Tablet | 1,577 | 56.7% |
| No Computing Device | 234 | 8.4% |
| Total | 2,782 | 100.0% |
Internet Access in Talent
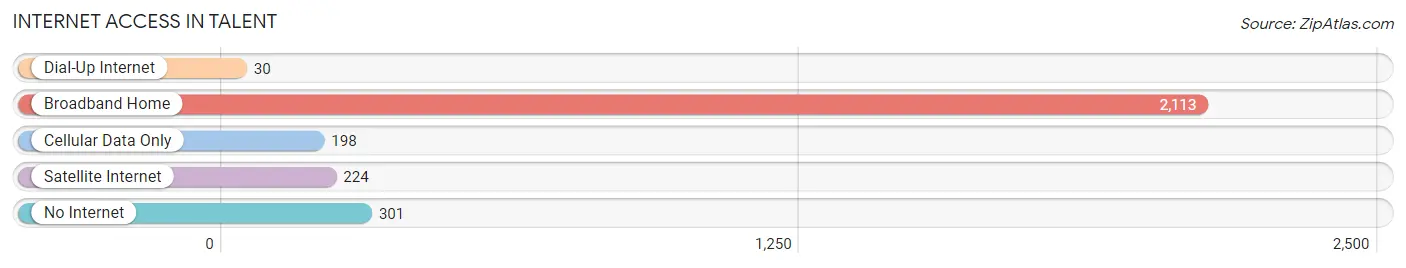
| Internet Type | # Households | % Households |
| Dial-Up Internet | 30 | 1.1% |
| Broadband Home | 2,113 | 75.9% |
| Cellular Data Only | 198 | 7.1% |
| Satellite Internet | 224 | 8.1% |
| No Internet | 301 | 10.8% |
| Total | 2,782 | 100.0% |
Talent Summary
Talent, OR is a small city located in Jackson County, Oregon. It is situated in the Rogue Valley, a region of southwestern Oregon known for its mild climate and abundant natural beauty. The city has a population of 8,717 as of the 2020 census, making it the second-largest city in Jackson County.
History
The area that is now Talent was first inhabited by the Takelma people, who lived in the Rogue Valley for thousands of years before the arrival of European settlers. The first European settlers arrived in the area in the early 1850s, and the town of Talent was officially founded in 1884. The town was named after the nearby Talent Creek, which was named by early settlers who believed the creek had a “talent” for producing gold.
The town grew slowly but steadily over the next several decades, and by the early 1900s, it had become a thriving agricultural community. The town was also home to several lumber mills, which provided employment for many of the town’s residents.
In the 1950s, Talent began to experience a period of rapid growth. This was due in part to the construction of the Rogue Valley Mall, which opened in 1959 and quickly became the largest shopping center in the region. The mall attracted many new businesses and residents to the area, and the population of Talent more than doubled between 1950 and 1960.
Geography
Talent is located in the Rogue Valley, a region of southwestern Oregon known for its mild climate and abundant natural beauty. The city is situated in the foothills of the Cascade Mountains, and is surrounded by lush forests and rolling hills. The city is located approximately 10 miles north of Medford, the largest city in the Rogue Valley.
The climate in Talent is mild and temperate, with warm summers and cool winters. The average high temperature in the summer is around 85 degrees Fahrenheit, and the average low temperature in the winter is around 35 degrees Fahrenheit.
Economy
The economy of Talent is largely based on agriculture and tourism. The city is home to several wineries, and the surrounding area is known for its production of pears, apples, and other fruits. The city is also home to several manufacturing companies, including a paper mill and a wood products plant.
The city is also a popular tourist destination, and is home to several attractions, including the Rogue Valley Mall, the Talent Historical Museum, and the Talent Art Gallery. The city is also home to several festivals and events throughout the year, including the Talent Summer Festival and the Talent Harvest Festival.
Demographics
As of the 2020 census, the population of Talent was 8,717. The racial makeup of the city was 87.3% White, 4.2% Hispanic or Latino, 2.3% Asian, 1.7% African American, 0.3% Native American, and 4.2% from other races. The median household income in Talent was $50,945, and the median age was 38.7 years.
Conclusion
Talent, OR is a small city located in Jackson County, Oregon. It is situated in the Rogue Valley, a region of southwestern Oregon known for its mild climate and abundant natural beauty. The city has a population of 8,717 as of the 2020 census, making it the second-largest city in Jackson County. The economy of Talent is largely based on agriculture and tourism, and the city is home to several wineries, manufacturing companies, and tourist attractions. The racial makeup of the city is 87.3% White, 4.2% Hispanic or Latino, 2.3% Asian, 1.7% African American, 0.3% Native American, and 4.2% from other races. The median household income in Talent was $50,945, and the median age was 38.7 years.
Common Questions
What is Per Capita Income in Talent?
Per Capita income in Talent is $29,606.
What is the Median Family Income in Talent?
Median Family Income in Talent is $79,157.
What is the Median Household income in Talent?
Median Household Income in Talent is $51,215.
What is Income or Wage Gap in Talent?
Income or Wage Gap in Talent is 12.9%.
Women in Talent earn 87.1 cents for every dollar earned by a man.
What is Inequality or Gini Index in Talent?
Inequality or Gini Index in Talent is 0.39.
What is the Total Population of Talent?
Total Population of Talent is 6,256.
What is the Total Male Population of Talent?
Total Male Population of Talent is 2,951.
What is the Total Female Population of Talent?
Total Female Population of Talent is 3,305.
What is the Ratio of Males per 100 Females in Talent?
There are 89.29 Males per 100 Females in Talent.
What is the Ratio of Females per 100 Males in Talent?
There are 112.00 Females per 100 Males in Talent.
What is the Median Population Age in Talent?
Median Population Age in Talent is 37.4 Years.
What is the Average Family Size in Talent
Average Family Size in Talent is 3.2 People.
What is the Average Household Size in Talent
Average Household Size in Talent is 2.2 People.
How Large is the Labor Force in Talent?
There are 3,165 People in the Labor Forcein in Talent.
What is the Percentage of People in the Labor Force in Talent?
60.3% of People are in the Labor Force in Talent.
What is the Unemployment Rate in Talent?
Unemployment Rate in Talent is 2.7%.