Avon Park, FL Map & Demographics
Avon Park Map
Avon Park Overview
$24,399
PER CAPITA INCOME
$38,043
AVG FAMILY INCOME
$35,340
AVG HOUSEHOLD INCOME
23.7%
WAGE / INCOME GAP [ % ]
76.3¢/ $1
WAGE / INCOME GAP [ $ ]
0.49
INEQUALITY / GINI INDEX
9,789
TOTAL POPULATION
4,835
MALE POPULATION
4,954
FEMALE POPULATION
97.60
MALES / 100 FEMALES
102.46
FEMALES / 100 MALES
42.9
MEDIAN AGE
2.9
AVG FAMILY SIZE
2.3
AVG HOUSEHOLD SIZE
3,602
LABOR FORCE [ PEOPLE ]
45.5%
PERCENT IN LABOR FORCE
11.7%
UNEMPLOYMENT RATE
Avon Park Zip Codes
Avon Park Area Codes
Income in Avon Park
Income Overview in Avon Park
Per Capita Income in Avon Park is $24,399, while median incomes of families and households are $38,043 and $35,340 respectively.
| Characteristic | Number | Measure |
| Per Capita Income | 9,789 | $24,399 |
| Median Family Income | 2,654 | $38,043 |
| Mean Family Income | 2,654 | $62,403 |
| Median Household Income | 4,080 | $35,340 |
| Mean Household Income | 4,080 | $54,070 |
| Income Deficit | 2,654 | $0 |
| Wage / Income Gap (%) | 9,789 | 23.73% |
| Wage / Income Gap ($) | 9,789 | 76.27¢ per $1 |
| Gini / Inequality Index | 9,789 | 0.49 |
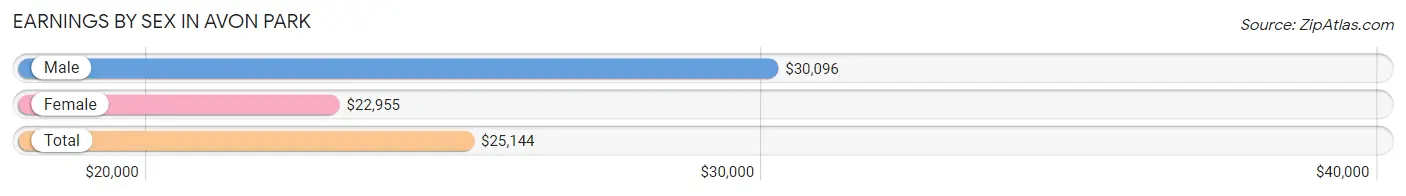
Earnings by Sex in Avon Park
Average Earnings in Avon Park are $25,144, $30,096 for men and $22,955 for women, a difference of 23.7%.
| Sex | Number | Average Earnings |
| Male | 1,800 (47.8%) | $30,096 |
| Female | 1,962 (52.1%) | $22,955 |
| Total | 3,762 (100.0%) | $25,144 |
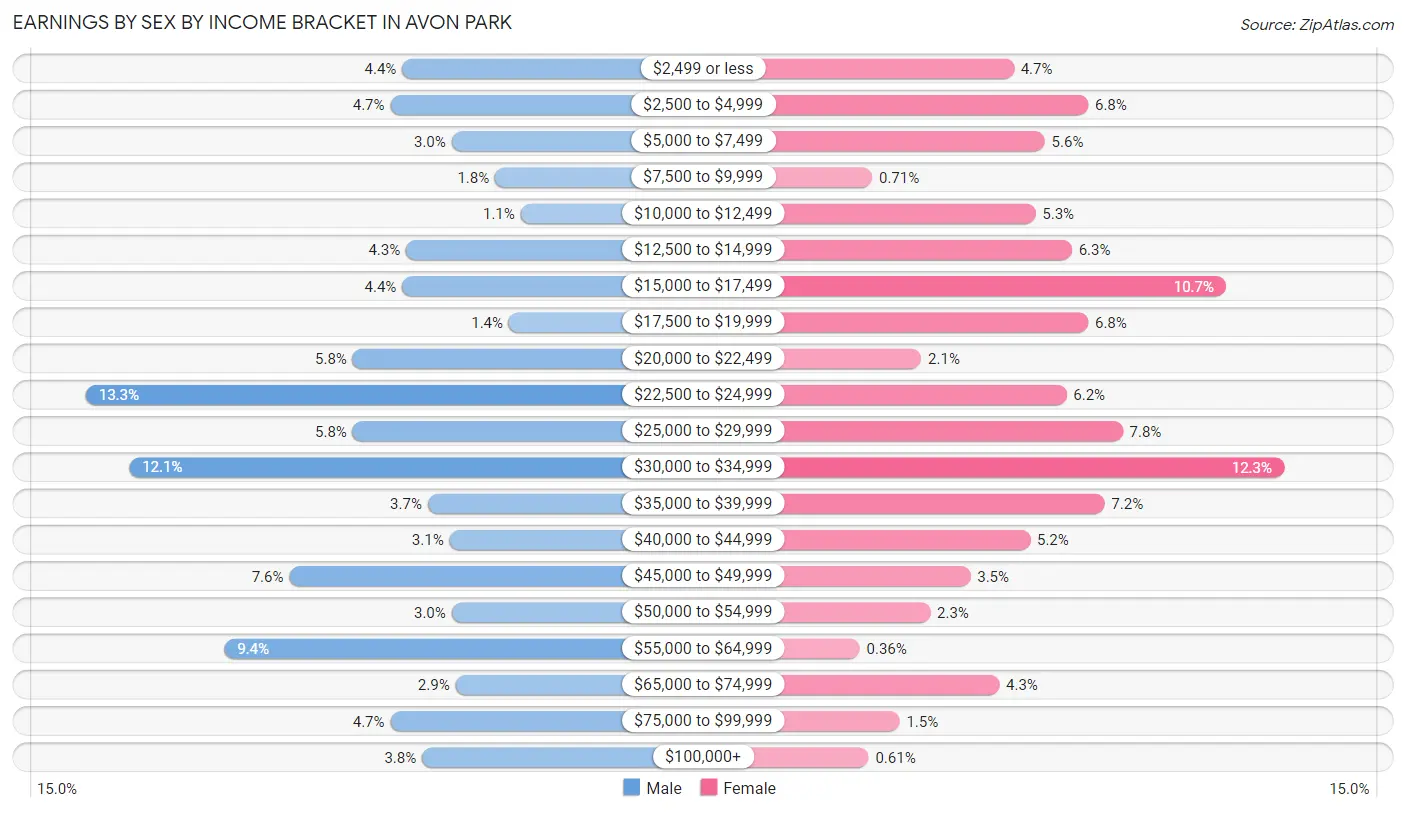
Earnings by Sex by Income Bracket in Avon Park
The most common earnings brackets in Avon Park are $22,500 to $24,999 for men (239 | 13.3%) and $30,000 to $34,999 for women (241 | 12.3%).
| Income | Male | Female |
| $2,499 or less | 79 (4.4%) | 92 (4.7%) |
| $2,500 to $4,999 | 85 (4.7%) | 133 (6.8%) |
| $5,000 to $7,499 | 54 (3.0%) | 109 (5.6%) |
| $7,500 to $9,999 | 32 (1.8%) | 14 (0.7%) |
| $10,000 to $12,499 | 19 (1.1%) | 104 (5.3%) |
| $12,500 to $14,999 | 77 (4.3%) | 124 (6.3%) |
| $15,000 to $17,499 | 79 (4.4%) | 209 (10.6%) |
| $17,500 to $19,999 | 25 (1.4%) | 133 (6.8%) |
| $20,000 to $22,499 | 104 (5.8%) | 41 (2.1%) |
| $22,500 to $24,999 | 239 (13.3%) | 121 (6.2%) |
| $25,000 to $29,999 | 104 (5.8%) | 152 (7.7%) |
| $30,000 to $34,999 | 217 (12.1%) | 241 (12.3%) |
| $35,000 to $39,999 | 66 (3.7%) | 142 (7.2%) |
| $40,000 to $44,999 | 55 (3.1%) | 101 (5.1%) |
| $45,000 to $49,999 | 136 (7.6%) | 68 (3.5%) |
| $50,000 to $54,999 | 54 (3.0%) | 46 (2.3%) |
| $55,000 to $64,999 | 169 (9.4%) | 7 (0.4%) |
| $65,000 to $74,999 | 52 (2.9%) | 84 (4.3%) |
| $75,000 to $99,999 | 85 (4.7%) | 29 (1.5%) |
| $100,000+ | 69 (3.8%) | 12 (0.6%) |
| Total | 1,800 (100.0%) | 1,962 (100.0%) |
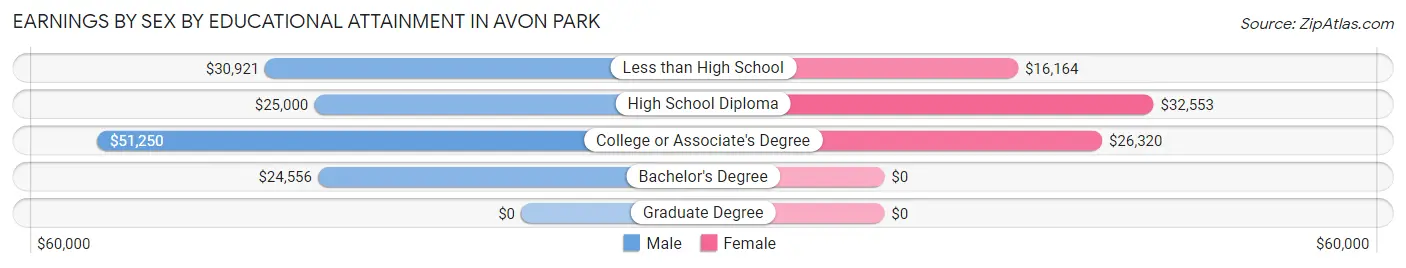
Earnings by Sex by Educational Attainment in Avon Park
Average earnings in Avon Park are $32,319 for men and $23,781 for women, a difference of 26.4%. Men with an educational attainment of college or associate's degree enjoy the highest average annual earnings of $51,250, while those with bachelor's degree education earn the least with $24,556. Women with an educational attainment of high school diploma earn the most with the average annual earnings of $32,553, while those with less than high school education have the smallest earnings of $16,164.
| Educational Attainment | Male Income | Female Income |
| Less than High School | $30,921 | $16,164 |
| High School Diploma | $25,000 | $32,553 |
| College or Associate's Degree | $51,250 | $26,320 |
| Bachelor's Degree | $24,556 | $0 |
| Graduate Degree | - | - |
| Total | $32,319 | $23,781 |
Family Income in Avon Park
Family Income Brackets in Avon Park
According to the Avon Park family income data, there are 557 families falling into the $50,000 to $74,999 income range, which is the most common income bracket and makes up 21.0% of all families. Conversely, the $150,000 to $199,999 income bracket is the least frequent group with only 37 families (1.4%) belonging to this category.
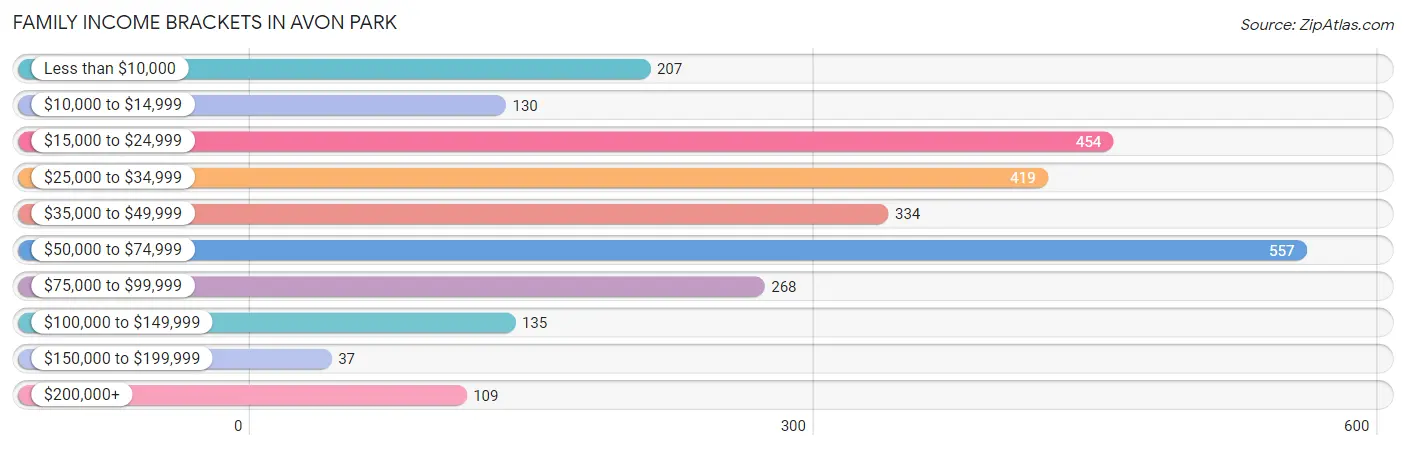
| Income Bracket | # Families | % Families |
| Less than $10,000 | 207 | 7.8% |
| $10,000 to $14,999 | 130 | 4.9% |
| $15,000 to $24,999 | 454 | 17.1% |
| $25,000 to $34,999 | 419 | 15.8% |
| $35,000 to $49,999 | 334 | 12.6% |
| $50,000 to $74,999 | 557 | 21.0% |
| $75,000 to $99,999 | 268 | 10.1% |
| $100,000 to $149,999 | 135 | 5.1% |
| $150,000 to $199,999 | 37 | 1.4% |
| $200,000+ | 109 | 4.1% |
Family Income by Famaliy Size in Avon Park
4-person families (296 | 11.2%) account for the highest median family income in Avon Park with $63,889 per family, while 2-person families (1,506 | 56.7%) have the highest median income of $16,943 per family member.
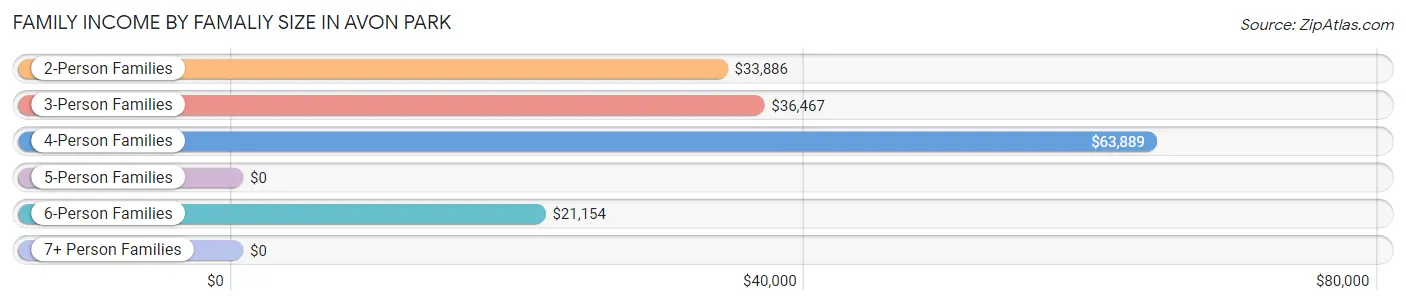
| Income Bracket | # Families | Median Income |
| 2-Person Families | 1,506 (56.7%) | $33,886 |
| 3-Person Families | 622 (23.4%) | $36,467 |
| 4-Person Families | 296 (11.2%) | $63,889 |
| 5-Person Families | 117 (4.4%) | $0 |
| 6-Person Families | 42 (1.6%) | $21,154 |
| 7+ Person Families | 71 (2.7%) | $0 |
| Total | 2,654 (100.0%) | $38,043 |
Family Income by Number of Earners in Avon Park
The median family income in Avon Park is $38,043, with families comprising 3+ earners (134) having the highest median family income of $88,478, while families with no earners (897) have the lowest median family income of $25,875, accounting for 5.1% and 33.8% of families, respectively.
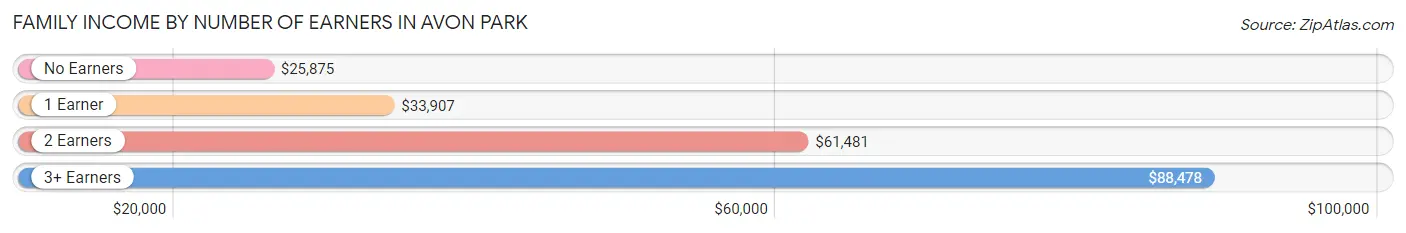
| Number of Earners | # Families | Median Income |
| No Earners | 897 (33.8%) | $25,875 |
| 1 Earner | 999 (37.6%) | $33,907 |
| 2 Earners | 624 (23.5%) | $61,481 |
| 3+ Earners | 134 (5.1%) | $88,478 |
| Total | 2,654 (100.0%) | $38,043 |
Household Income in Avon Park
Household Income Brackets in Avon Park
With 804 households falling in the category, the $50,000 to $74,999 income range is the most frequent in Avon Park, accounting for 19.7% of all households. In contrast, only 61 households (1.5%) fall into the $150,000 to $199,999 income bracket, making it the least populous group.
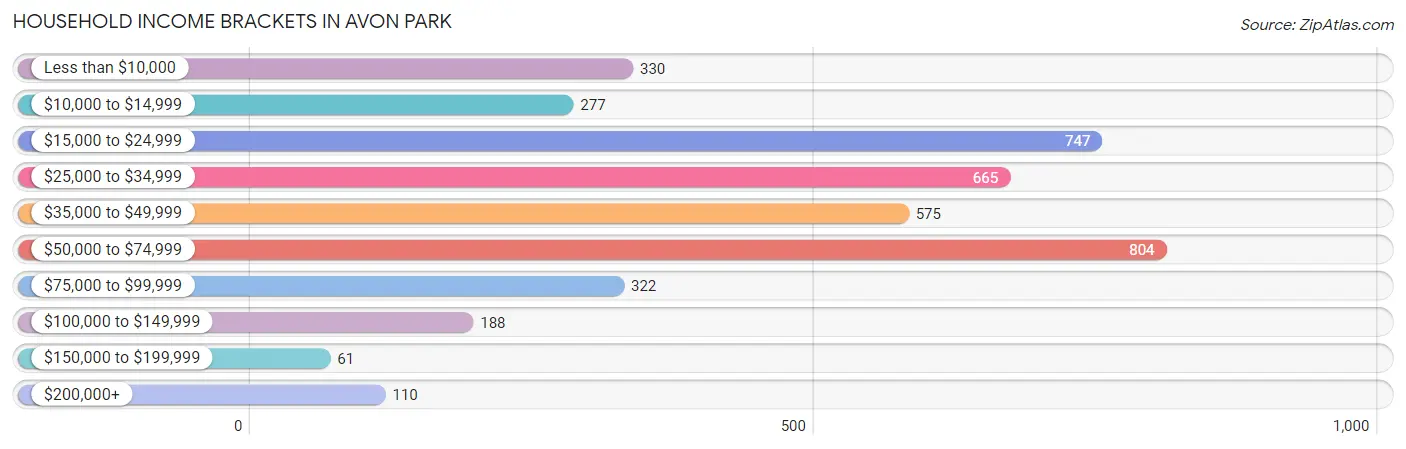
| Income Bracket | # Households | % Households |
| Less than $10,000 | 330 | 8.1% |
| $10,000 to $14,999 | 277 | 6.8% |
| $15,000 to $24,999 | 747 | 18.3% |
| $25,000 to $34,999 | 665 | 16.3% |
| $35,000 to $49,999 | 575 | 14.1% |
| $50,000 to $74,999 | 804 | 19.7% |
| $75,000 to $99,999 | 322 | 7.9% |
| $100,000 to $149,999 | 188 | 4.6% |
| $150,000 to $199,999 | 61 | 1.5% |
| $200,000+ | 110 | 2.7% |
Household Income by Householder Age in Avon Park
The median household income in Avon Park is $35,340, with the highest median household income of $37,917 found in the 65+ years age bracket for the primary householder. A total of 1,429 households (35.0%) fall into this category. Meanwhile, the 25 to 44 years age bracket for the primary householder has the lowest median household income of $34,455, with 1,365 households (33.5%) in this group.
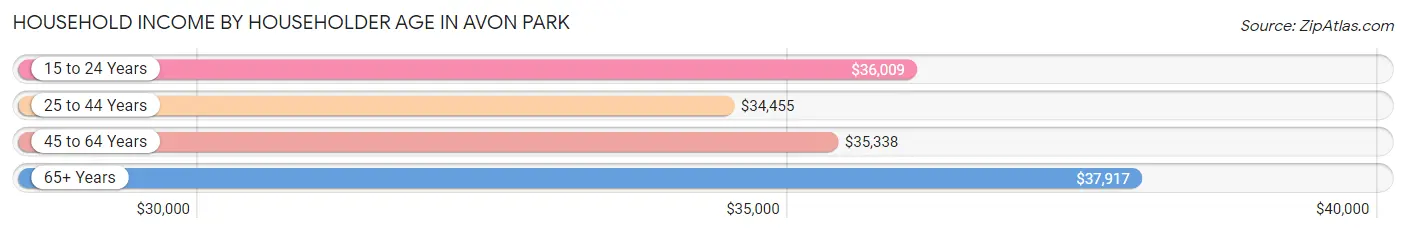
| Income Bracket | # Households | Median Income |
| 15 to 24 Years | 104 (2.5%) | $36,009 |
| 25 to 44 Years | 1,365 (33.5%) | $34,455 |
| 45 to 64 Years | 1,182 (29.0%) | $35,338 |
| 65+ Years | 1,429 (35.0%) | $37,917 |
| Total | 4,080 (100.0%) | $35,340 |
Poverty in Avon Park
Income Below Poverty by Sex and Age in Avon Park
With 19.3% poverty level for males and 25.8% for females among the residents of Avon Park, 5 year old males and 12 to 14 year old females are the most vulnerable to poverty, with 32 males (60.4%) and 112 females (69.1%) in their respective age groups living below the poverty level.
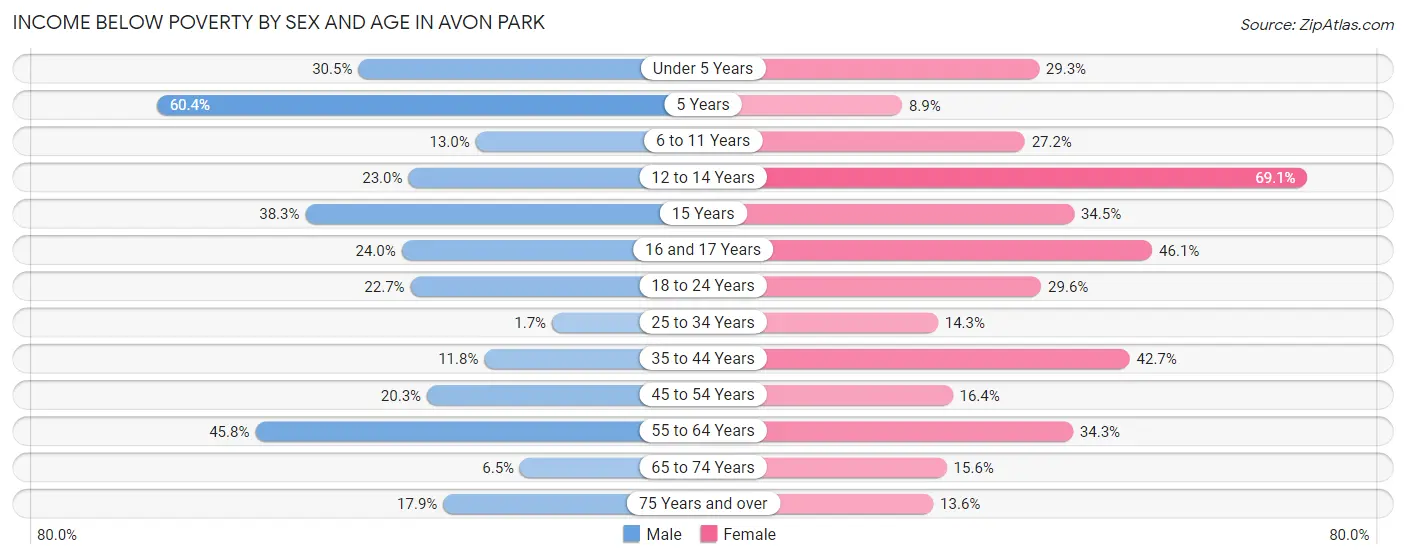
| Age Bracket | Male | Female |
| Under 5 Years | 113 (30.5%) | 84 (29.3%) |
| 5 Years | 32 (60.4%) | 5 (8.9%) |
| 6 to 11 Years | 45 (13.0%) | 63 (27.2%) |
| 12 to 14 Years | 32 (23.0%) | 112 (69.1%) |
| 15 Years | 41 (38.3%) | 40 (34.5%) |
| 16 and 17 Years | 43 (24.0%) | 53 (46.1%) |
| 18 to 24 Years | 94 (22.7%) | 103 (29.6%) |
| 25 to 34 Years | 9 (1.7%) | 77 (14.3%) |
| 35 to 44 Years | 63 (11.7%) | 253 (42.7%) |
| 45 to 54 Years | 92 (20.3%) | 95 (16.4%) |
| 55 to 64 Years | 194 (45.8%) | 150 (34.3%) |
| 65 to 74 Years | 33 (6.5%) | 109 (15.6%) |
| 75 Years and over | 118 (17.8%) | 79 (13.6%) |
| Total | 909 (19.3%) | 1,223 (25.8%) |
Income Above Poverty by Sex and Age in Avon Park
According to the poverty statistics in Avon Park, males aged 25 to 34 years and females aged 5 years are the age groups that are most secure financially, with 98.3% of males and 91.1% of females in these age groups living above the poverty line.
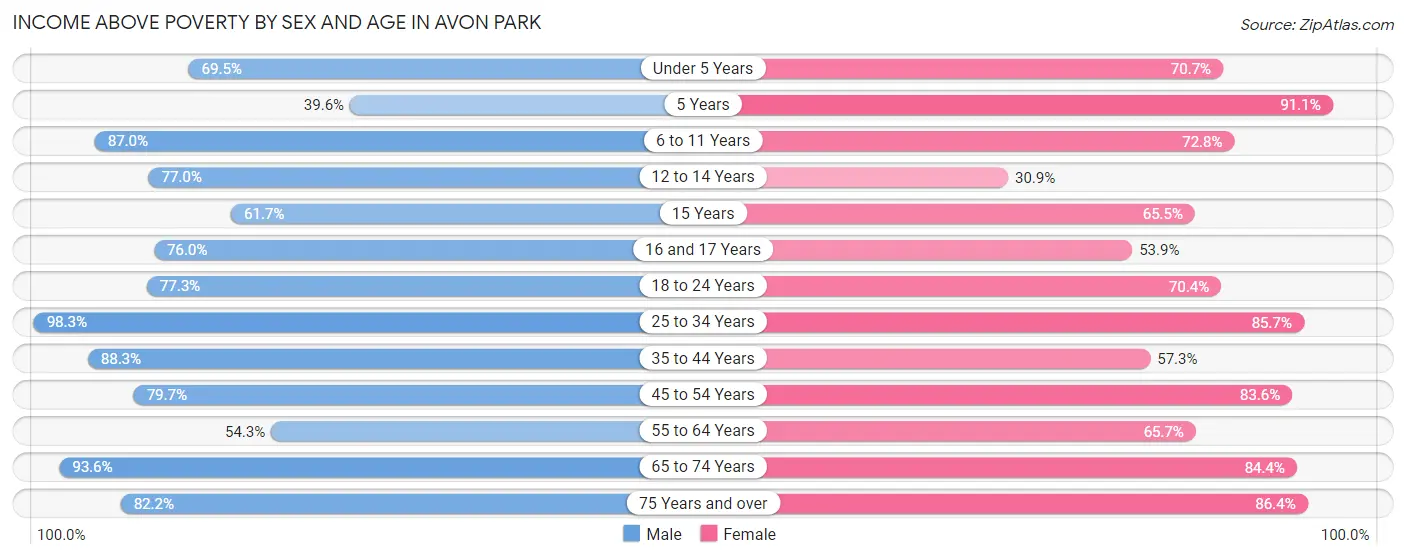
| Age Bracket | Male | Female |
| Under 5 Years | 258 (69.5%) | 203 (70.7%) |
| 5 Years | 21 (39.6%) | 51 (91.1%) |
| 6 to 11 Years | 300 (87.0%) | 169 (72.8%) |
| 12 to 14 Years | 107 (77.0%) | 50 (30.9%) |
| 15 Years | 66 (61.7%) | 76 (65.5%) |
| 16 and 17 Years | 136 (76.0%) | 62 (53.9%) |
| 18 to 24 Years | 320 (77.3%) | 245 (70.4%) |
| 25 to 34 Years | 519 (98.3%) | 463 (85.7%) |
| 35 to 44 Years | 473 (88.2%) | 339 (57.3%) |
| 45 to 54 Years | 362 (79.7%) | 483 (83.6%) |
| 55 to 64 Years | 230 (54.2%) | 287 (65.7%) |
| 65 to 74 Years | 479 (93.5%) | 591 (84.4%) |
| 75 Years and over | 543 (82.2%) | 503 (86.4%) |
| Total | 3,814 (80.7%) | 3,522 (74.2%) |
Income Below Poverty Among Married-Couple Families in Avon Park
The poverty statistics for married-couple families in Avon Park show that 16.4% or 253 of the total 1,544 families live below the poverty line. Families with 3 or 4 children have the highest poverty rate of 60.3%, comprising of 44 families. On the other hand, families with 5 or more children have the lowest poverty rate of 0.0%, which includes 0 families.
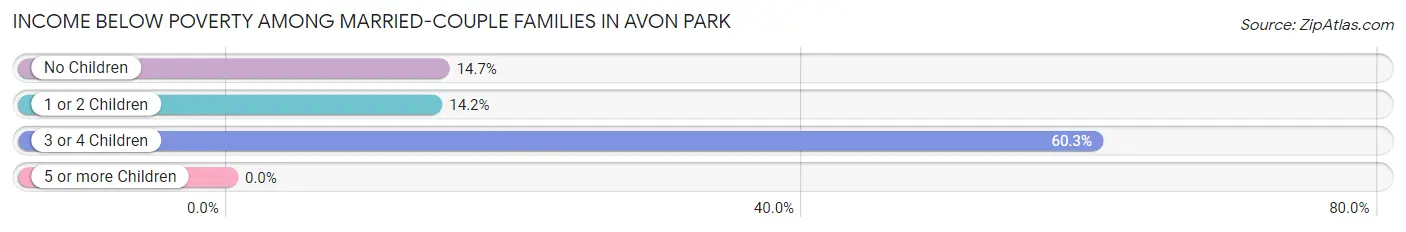
| Children | Above Poverty | Below Poverty |
| No Children | 983 (85.3%) | 170 (14.7%) |
| 1 or 2 Children | 235 (85.8%) | 39 (14.2%) |
| 3 or 4 Children | 29 (39.7%) | 44 (60.3%) |
| 5 or more Children | 44 (100.0%) | 0 (0.0%) |
| Total | 1,291 (83.6%) | 253 (16.4%) |
Income Below Poverty Among Single-Parent Households in Avon Park
According to the poverty data in Avon Park, 3.0% or 8 single-father households and 34.1% or 288 single-mother households are living below the poverty line. Among single-father households, those with no children have the highest poverty rate, with 8 households (7.4%) experiencing poverty. Likewise, among single-mother households, those with 5 or more children have the highest poverty rate, with 27 households (100.0%) falling below the poverty line.
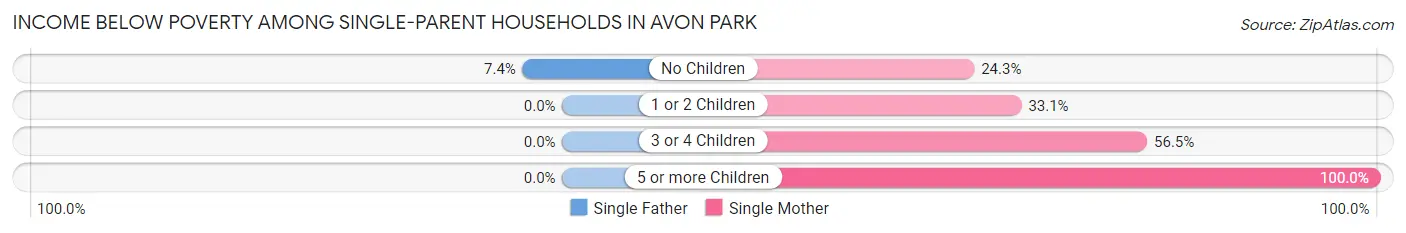
| Children | Single Father | Single Mother |
| No Children | 8 (7.4%) | 72 (24.3%) |
| 1 or 2 Children | 0 (0.0%) | 150 (33.1%) |
| 3 or 4 Children | 0 (0.0%) | 39 (56.5%) |
| 5 or more Children | 0 (0.0%) | 27 (100.0%) |
| Total | 8 (3.0%) | 288 (34.1%) |
Income Below Poverty Among Married-Couple vs Single-Parent Households in Avon Park
The poverty data for Avon Park shows that 253 of the married-couple family households (16.4%) and 296 of the single-parent households (26.7%) are living below the poverty level. Within the married-couple family households, those with 3 or 4 children have the highest poverty rate, with 44 households (60.3%) falling below the poverty line. Among the single-parent households, those with 5 or more children have the highest poverty rate, with 27 household (100.0%) living below poverty.
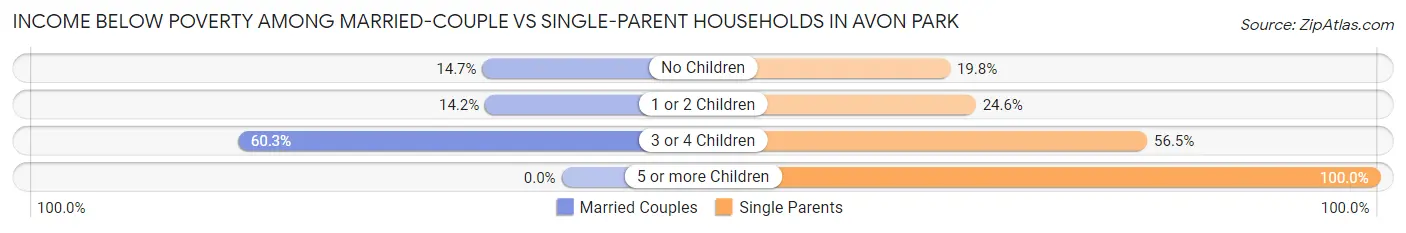
| Children | Married-Couple Families | Single-Parent Households |
| No Children | 170 (14.7%) | 80 (19.8%) |
| 1 or 2 Children | 39 (14.2%) | 150 (24.6%) |
| 3 or 4 Children | 44 (60.3%) | 39 (56.5%) |
| 5 or more Children | 0 (0.0%) | 27 (100.0%) |
| Total | 253 (16.4%) | 296 (26.7%) |
Race in Avon Park
The most populous races in Avon Park are White / Caucasian (4,334 | 44.3%), Hispanic or Latino (3,482 | 35.6%), and Black / African American (2,590 | 26.5%).
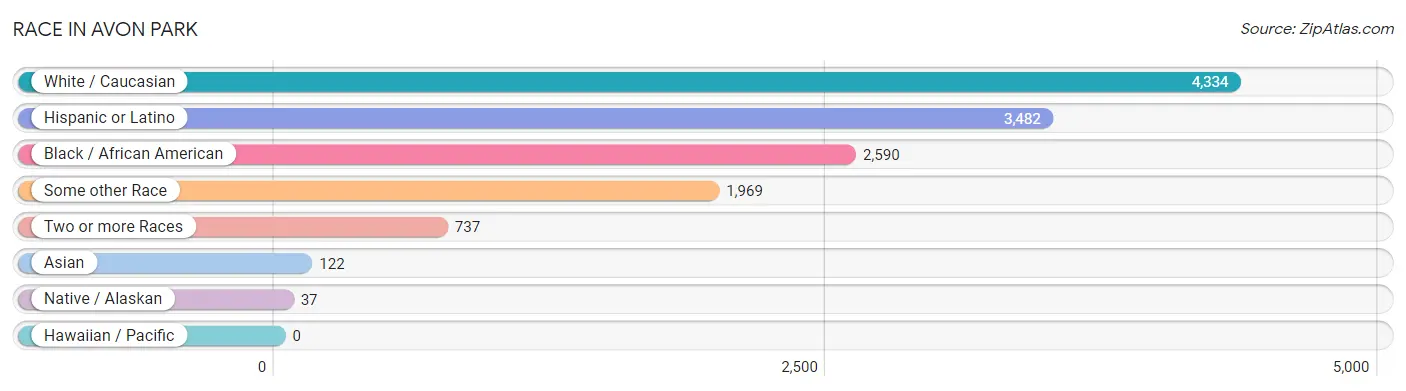
| Race | # Population | % Population |
| Asian | 122 | 1.3% |
| Black / African American | 2,590 | 26.5% |
| Hawaiian / Pacific | 0 | 0.0% |
| Hispanic or Latino | 3,482 | 35.6% |
| Native / Alaskan | 37 | 0.4% |
| White / Caucasian | 4,334 | 44.3% |
| Two or more Races | 737 | 7.5% |
| Some other Race | 1,969 | 20.1% |
| Total | 9,789 | 100.0% |
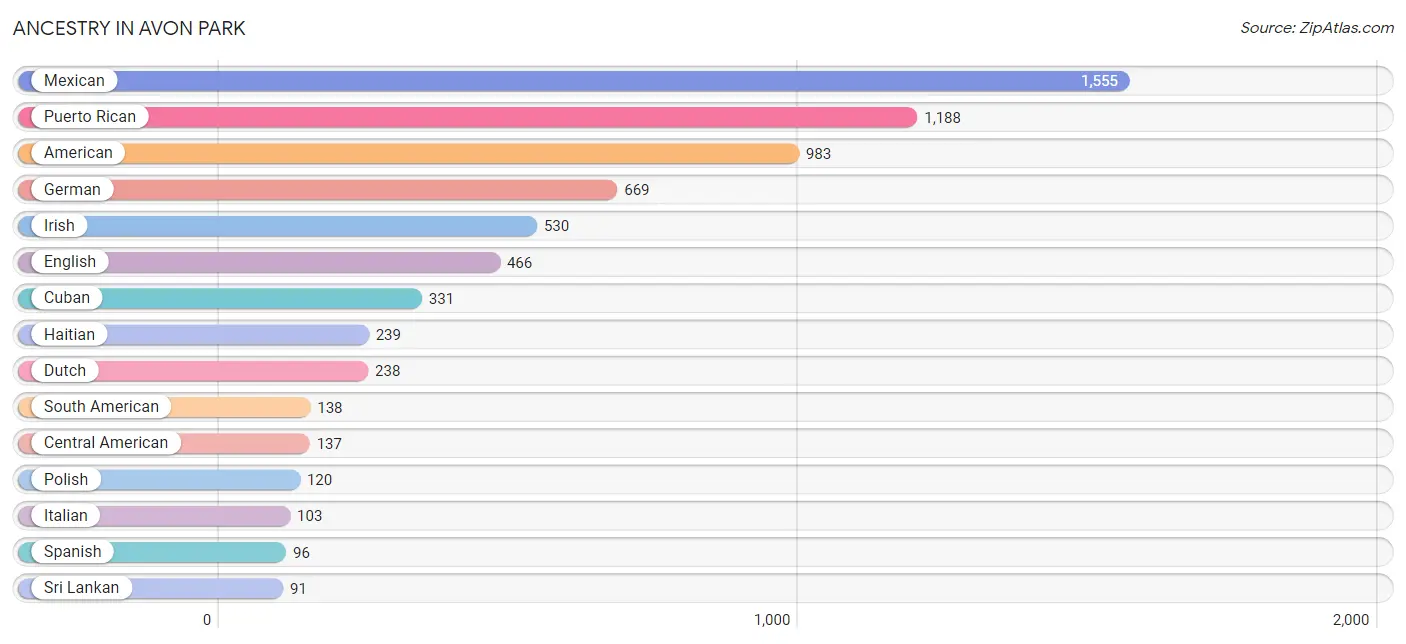
Ancestry in Avon Park
The most populous ancestries reported in Avon Park are Mexican (1,555 | 15.9%), Puerto Rican (1,188 | 12.1%), American (983 | 10.0%), German (669 | 6.8%), and Irish (530 | 5.4%), together accounting for 50.3% of all Avon Park residents.
| Ancestry | # Population | % Population |
| Afghan | 7 | 0.1% |
| African | 25 | 0.3% |
| American | 983 | 10.0% |
| Arab | 28 | 0.3% |
| Bhutanese | 27 | 0.3% |
| Blackfeet | 55 | 0.6% |
| British | 7 | 0.1% |
| British West Indian | 13 | 0.1% |
| Canadian | 10 | 0.1% |
| Central American | 137 | 1.4% |
| Colombian | 31 | 0.3% |
| Costa Rican | 37 | 0.4% |
| Croatian | 7 | 0.1% |
| Cuban | 331 | 3.4% |
| Dominican | 26 | 0.3% |
| Dutch | 238 | 2.4% |
| Ecuadorian | 47 | 0.5% |
| Egyptian | 28 | 0.3% |
| English | 466 | 4.8% |
| European | 11 | 0.1% |
| Filipino | 43 | 0.4% |
| Finnish | 5 | 0.1% |
| French | 85 | 0.9% |
| French Canadian | 6 | 0.1% |
| German | 669 | 6.8% |
| Ghanaian | 9 | 0.1% |
| Guatemalan | 35 | 0.4% |
| Haitian | 239 | 2.4% |
| Honduran | 6 | 0.1% |
| Hungarian | 26 | 0.3% |
| Irish | 530 | 5.4% |
| Italian | 103 | 1.1% |
| Jamaican | 23 | 0.2% |
| Korean | 12 | 0.1% |
| Mexican | 1,555 | 15.9% |
| Mongolian | 3 | 0.0% |
| Norwegian | 28 | 0.3% |
| Polish | 120 | 1.2% |
| Portuguese | 5 | 0.1% |
| Puerto Rican | 1,188 | 12.1% |
| Russian | 12 | 0.1% |
| Salvadoran | 59 | 0.6% |
| Scotch-Irish | 20 | 0.2% |
| Scottish | 35 | 0.4% |
| South American | 138 | 1.4% |
| Spanish | 96 | 1.0% |
| Sri Lankan | 91 | 0.9% |
| Subsaharan African | 34 | 0.4% |
| Swedish | 7 | 0.1% |
| Trinidadian and Tobagonian | 77 | 0.8% |
| Ukrainian | 57 | 0.6% |
| Venezuelan | 60 | 0.6% |
| Welsh | 23 | 0.2% |
| West Indian | 5 | 0.1% | View All 54 Rows |
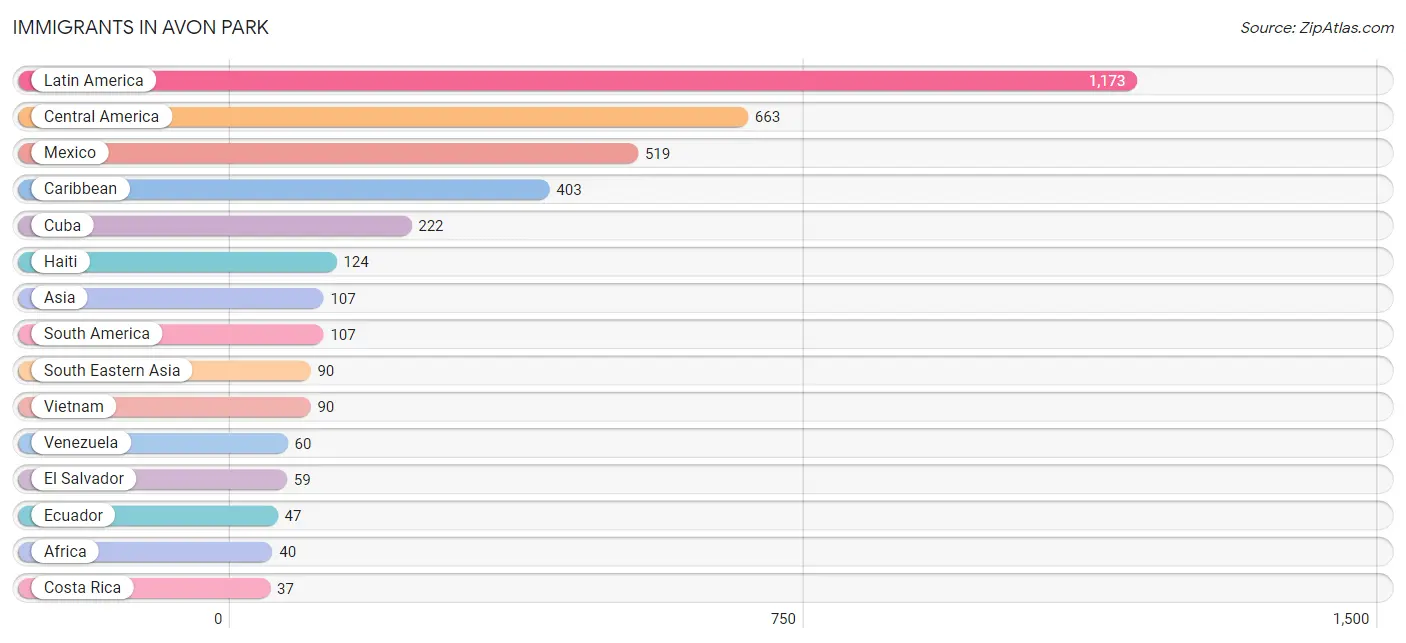
Immigrants in Avon Park
The most numerous immigrant groups reported in Avon Park came from Latin America (1,173 | 12.0%), Central America (663 | 6.8%), Mexico (519 | 5.3%), Caribbean (403 | 4.1%), and Cuba (222 | 2.3%), together accounting for 30.4% of all Avon Park residents.
| Immigration Origin | # Population | % Population |
| Afghanistan | 7 | 0.1% |
| Africa | 40 | 0.4% |
| Asia | 107 | 1.1% |
| Canada | 20 | 0.2% |
| Caribbean | 403 | 4.1% |
| Central America | 663 | 6.8% |
| Costa Rica | 37 | 0.4% |
| Cuba | 222 | 2.3% |
| Dominican Republic | 26 | 0.3% |
| Eastern Asia | 10 | 0.1% |
| Ecuador | 47 | 0.5% |
| Egypt | 28 | 0.3% |
| El Salvador | 59 | 0.6% |
| Europe | 23 | 0.2% |
| Guatemala | 35 | 0.4% |
| Haiti | 124 | 1.3% |
| Honduras | 13 | 0.1% |
| Jamaica | 18 | 0.2% |
| Japan | 10 | 0.1% |
| Latin America | 1,173 | 12.0% |
| Mexico | 519 | 5.3% |
| Netherlands | 11 | 0.1% |
| Northern Africa | 28 | 0.3% |
| Northern Europe | 12 | 0.1% |
| South Africa | 12 | 0.1% |
| South America | 107 | 1.1% |
| South Central Asia | 7 | 0.1% |
| South Eastern Asia | 90 | 0.9% |
| Venezuela | 60 | 0.6% |
| Vietnam | 90 | 0.9% |
| Western Europe | 11 | 0.1% | View All 31 Rows |
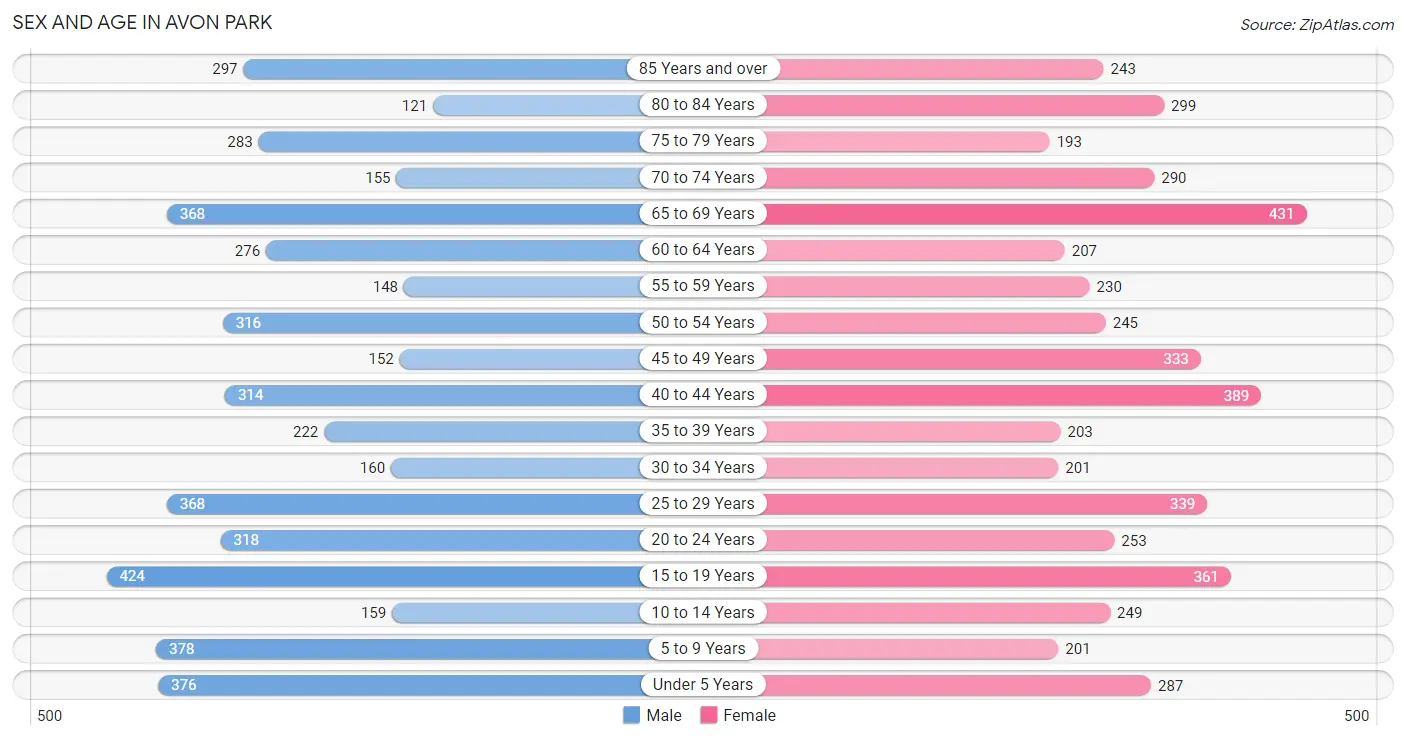
Sex and Age in Avon Park
Sex and Age in Avon Park
The most populous age groups in Avon Park are 15 to 19 Years (424 | 8.8%) for men and 65 to 69 Years (431 | 8.7%) for women.
| Age Bracket | Male | Female |
| Under 5 Years | 376 (7.8%) | 287 (5.8%) |
| 5 to 9 Years | 378 (7.8%) | 201 (4.1%) |
| 10 to 14 Years | 159 (3.3%) | 249 (5.0%) |
| 15 to 19 Years | 424 (8.8%) | 361 (7.3%) |
| 20 to 24 Years | 318 (6.6%) | 253 (5.1%) |
| 25 to 29 Years | 368 (7.6%) | 339 (6.8%) |
| 30 to 34 Years | 160 (3.3%) | 201 (4.1%) |
| 35 to 39 Years | 222 (4.6%) | 203 (4.1%) |
| 40 to 44 Years | 314 (6.5%) | 389 (7.9%) |
| 45 to 49 Years | 152 (3.1%) | 333 (6.7%) |
| 50 to 54 Years | 316 (6.5%) | 245 (5.0%) |
| 55 to 59 Years | 148 (3.1%) | 230 (4.6%) |
| 60 to 64 Years | 276 (5.7%) | 207 (4.2%) |
| 65 to 69 Years | 368 (7.6%) | 431 (8.7%) |
| 70 to 74 Years | 155 (3.2%) | 290 (5.9%) |
| 75 to 79 Years | 283 (5.9%) | 193 (3.9%) |
| 80 to 84 Years | 121 (2.5%) | 299 (6.0%) |
| 85 Years and over | 297 (6.1%) | 243 (4.9%) |
| Total | 4,835 (100.0%) | 4,954 (100.0%) |
Families and Households in Avon Park
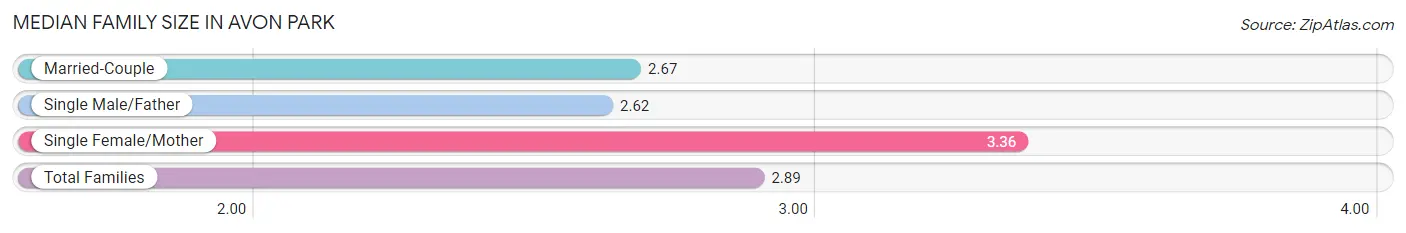
Median Family Size in Avon Park
The median family size in Avon Park is 2.89 persons per family, with single female/mother families (845 | 31.8%) accounting for the largest median family size of 3.36 persons per family. On the other hand, single male/father families (265 | 10.0%) represent the smallest median family size with 2.62 persons per family.
| Family Type | # Families | Family Size |
| Married-Couple | 1,544 (58.2%) | 2.67 |
| Single Male/Father | 265 (10.0%) | 2.62 |
| Single Female/Mother | 845 (31.8%) | 3.36 |
| Total Families | 2,654 (100.0%) | 2.89 |
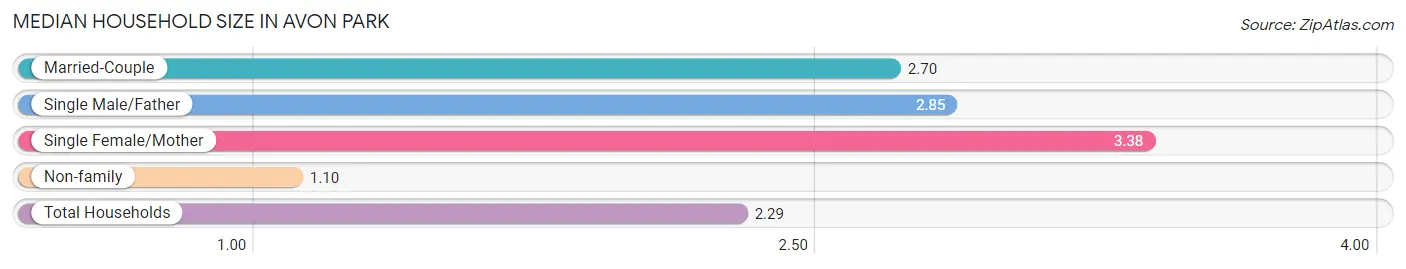
Median Household Size in Avon Park
The median household size in Avon Park is 2.29 persons per household, with single female/mother households (845 | 20.7%) accounting for the largest median household size of 3.38 persons per household. non-family households (1,426 | 34.9%) represent the smallest median household size with 1.10 persons per household.
| Household Type | # Households | Household Size |
| Married-Couple | 1,544 (37.8%) | 2.70 |
| Single Male/Father | 265 (6.5%) | 2.85 |
| Single Female/Mother | 845 (20.7%) | 3.38 |
| Non-family | 1,426 (34.9%) | 1.10 |
| Total Households | 4,080 (100.0%) | 2.29 |
Household Size by Marriage Status in Avon Park
Out of a total of 4,080 households in Avon Park, 2,654 (65.0%) are family households, while 1,426 (34.9%) are nonfamily households. The most numerous type of family households are 2-person households, comprising 1,492, and the most common type of nonfamily households are 1-person households, comprising 1,258.
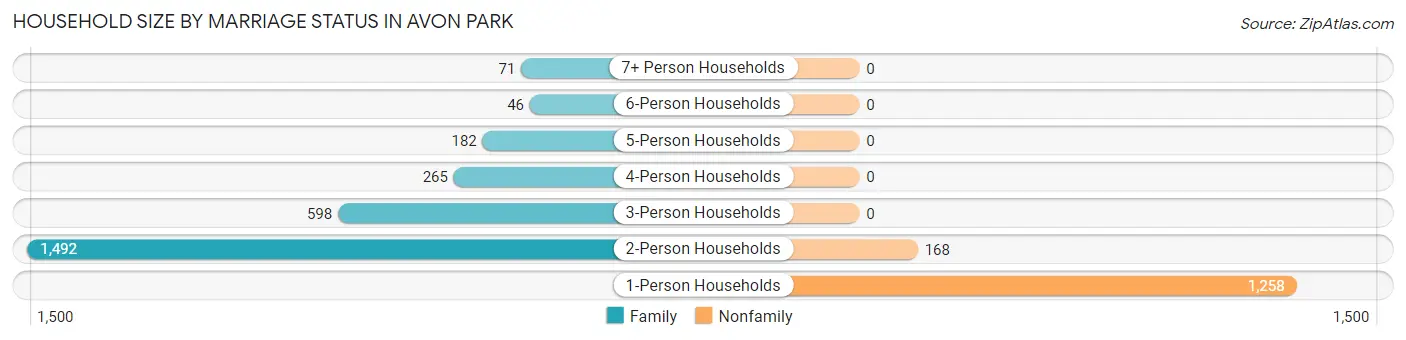
| Household Size | Family Households | Nonfamily Households |
| 1-Person Households | - | 1,258 (30.8%) |
| 2-Person Households | 1,492 (36.6%) | 168 (4.1%) |
| 3-Person Households | 598 (14.7%) | 0 (0.0%) |
| 4-Person Households | 265 (6.5%) | 0 (0.0%) |
| 5-Person Households | 182 (4.5%) | 0 (0.0%) |
| 6-Person Households | 46 (1.1%) | 0 (0.0%) |
| 7+ Person Households | 71 (1.7%) | 0 (0.0%) |
| Total | 2,654 (65.0%) | 1,426 (34.9%) |
Female Fertility in Avon Park
Fertility by Age in Avon Park
Average fertility rate in Avon Park is 4.0 births per 1,000 women. Women in the age bracket of 35 to 50 years have the highest fertility rate with 9.0 births per 1,000 women. Women in the age bracket of 35 to 50 years acount for 100.0% of all women with births.
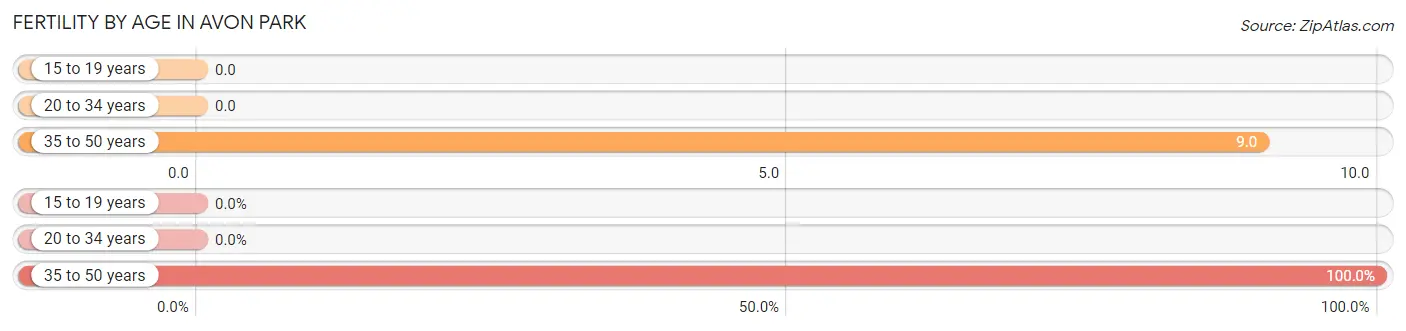
| Age Bracket | Women with Births | Births / 1,000 Women |
| 15 to 19 years | 0 (0.0%) | 0.0 |
| 20 to 34 years | 0 (0.0%) | 0.0 |
| 35 to 50 years | 9 (100.0%) | 9.0 |
| Total | 9 (100.0%) | 4.0 |
Fertility by Age by Marriage Status in Avon Park
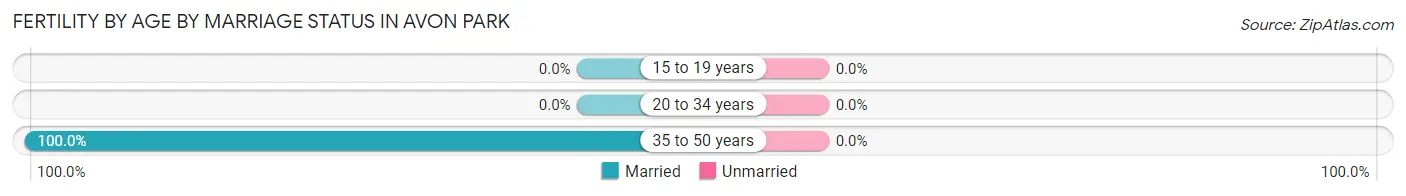
| Age Bracket | Married | Unmarried |
| 15 to 19 years | 0 (0.0%) | 0 (0.0%) |
| 20 to 34 years | 0 (0.0%) | 0 (0.0%) |
| 35 to 50 years | 9 (100.0%) | 0 (0.0%) |
| Total | 9 (100.0%) | 0 (0.0%) |
Fertility by Education in Avon Park
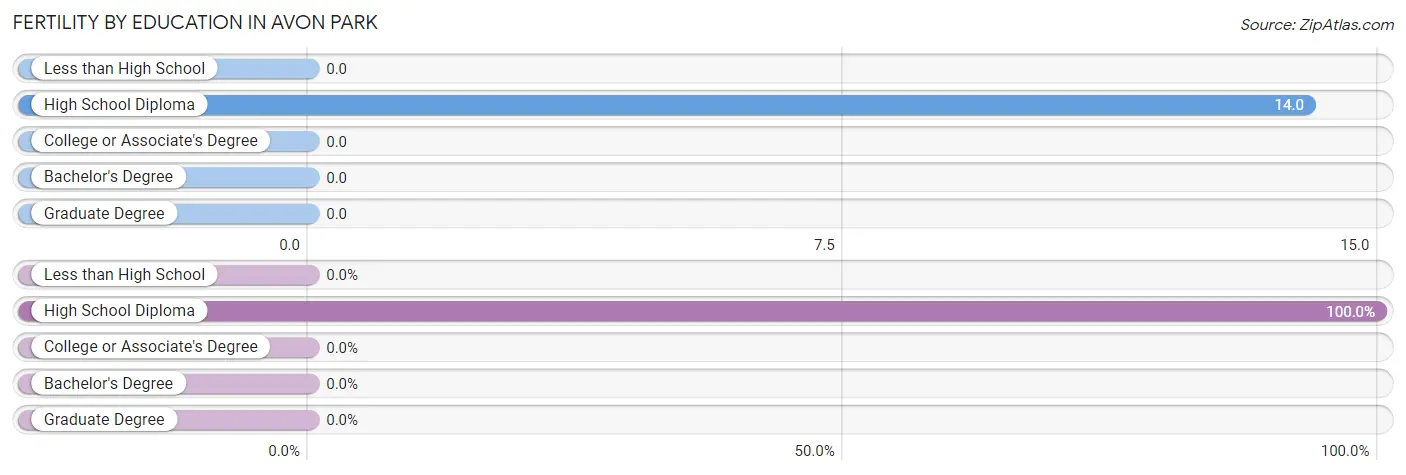
| Educational Attainment | Women with Births | Births / 1,000 Women |
| Less than High School | 0 (0.0%) | 0.0 |
| High School Diploma | 9 (100.0%) | 14.0 |
| College or Associate's Degree | 0 (0.0%) | 0.0 |
| Bachelor's Degree | 0 (0.0%) | 0.0 |
| Graduate Degree | 0 (0.0%) | 0.0 |
| Total | 9 (100.0%) | 4.0 |
Fertility by Education by Marriage Status in Avon Park
| Educational Attainment | Married | Unmarried |
| Less than High School | 0 (0.0%) | 0 (0.0%) |
| High School Diploma | 9 (100.0%) | 0 (0.0%) |
| College or Associate's Degree | 0 (0.0%) | 0 (0.0%) |
| Bachelor's Degree | 0 (0.0%) | 0 (0.0%) |
| Graduate Degree | 0 (0.0%) | 0 (0.0%) |
| Total | 9 (100.0%) | 0 (0.0%) |
Employment Characteristics in Avon Park
Employment by Class of Employer in Avon Park
Among the 3,167 employed individuals in Avon Park, private company employees (2,171 | 68.5%), not-for-profit organizations (299 | 9.4%), and state government employees (195 | 6.2%) make up the most common classes of employment.
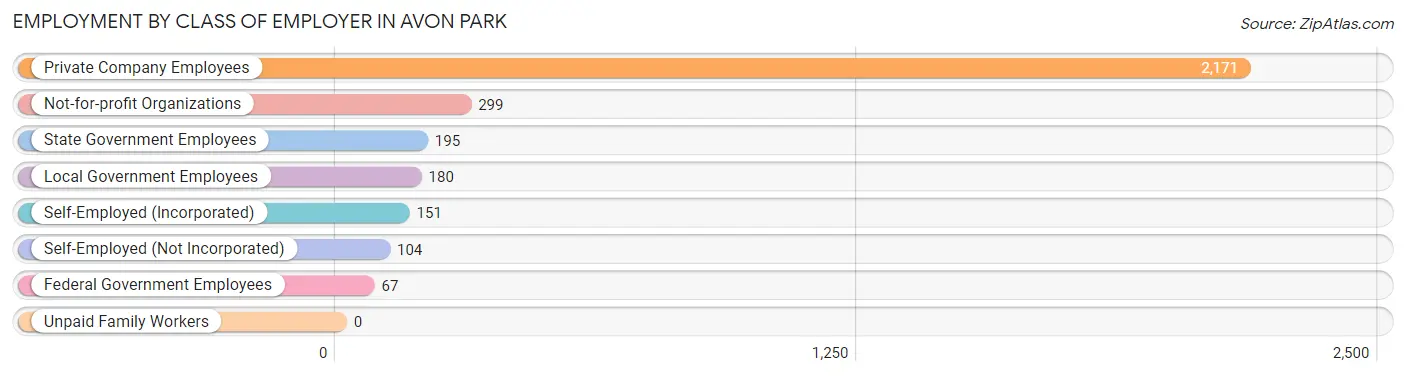
| Employer Class | # Employees | % Employees |
| Private Company Employees | 2,171 | 68.5% |
| Self-Employed (Incorporated) | 151 | 4.8% |
| Self-Employed (Not Incorporated) | 104 | 3.3% |
| Not-for-profit Organizations | 299 | 9.4% |
| Local Government Employees | 180 | 5.7% |
| State Government Employees | 195 | 6.2% |
| Federal Government Employees | 67 | 2.1% |
| Unpaid Family Workers | 0 | 0.0% |
| Total | 3,167 | 100.0% |
Employment Status by Age in Avon Park
According to the labor force statistics for Avon Park, out of the total population over 16 years of age (7,916), 45.5% or 3,602 individuals are in the labor force, with 11.7% or 421 of them unemployed. The age group with the highest labor force participation rate is 30 to 34 years, with 96.1% or 347 individuals in the labor force. Within the labor force, the 16 to 19 years age range has the highest percentage of unemployed individuals, with 32.4% or 66 of them being unemployed.
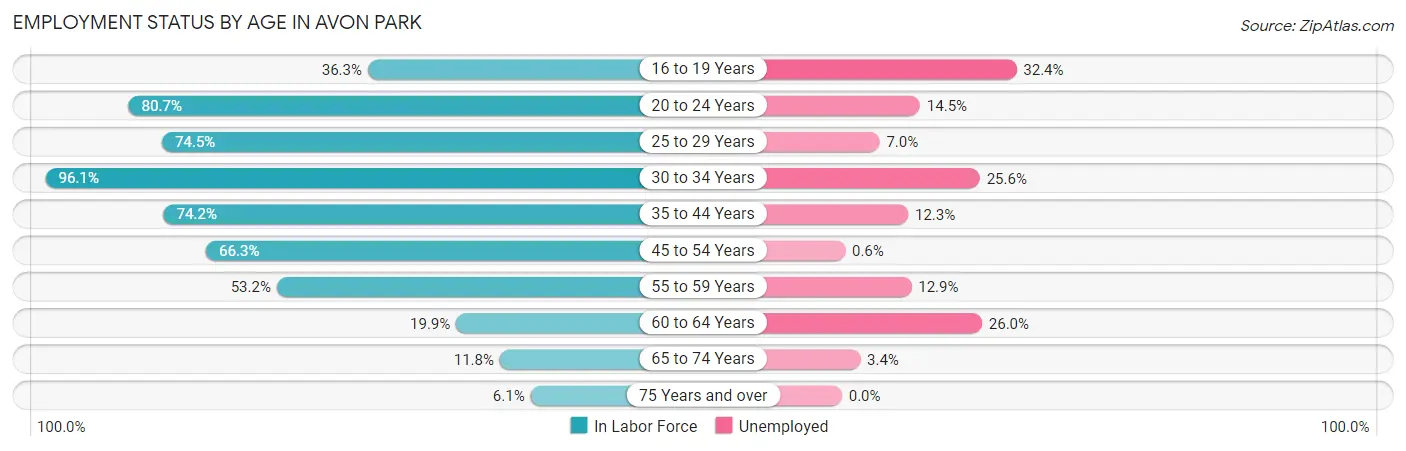
| Age Bracket | In Labor Force | Unemployed |
| 16 to 19 Years | 204 (36.3%) | 66 (32.4%) |
| 20 to 24 Years | 461 (80.7%) | 67 (14.5%) |
| 25 to 29 Years | 527 (74.5%) | 37 (7.0%) |
| 30 to 34 Years | 347 (96.1%) | 89 (25.6%) |
| 35 to 44 Years | 837 (74.2%) | 103 (12.3%) |
| 45 to 54 Years | 693 (66.3%) | 4 (0.6%) |
| 55 to 59 Years | 201 (53.2%) | 26 (12.9%) |
| 60 to 64 Years | 96 (19.9%) | 25 (26.0%) |
| 65 to 74 Years | 147 (11.8%) | 5 (3.4%) |
| 75 Years and over | 88 (6.1%) | 0 (0.0%) |
| Total | 3,602 (45.5%) | 421 (11.7%) |
Employment Status by Educational Attainment in Avon Park
According to labor force statistics for Avon Park, 65.8% of individuals (2,700) out of the total population between 25 and 64 years of age (4,103) are in the labor force, with 10.5% or 284 of them being unemployed. The group with the highest labor force participation rate are those with the educational attainment of high school diploma, with 71.1% or 1,010 individuals in the labor force. Within the labor force, individuals with less than high school education have the highest percentage of unemployment, with 19.4% or 120 of them being unemployed.
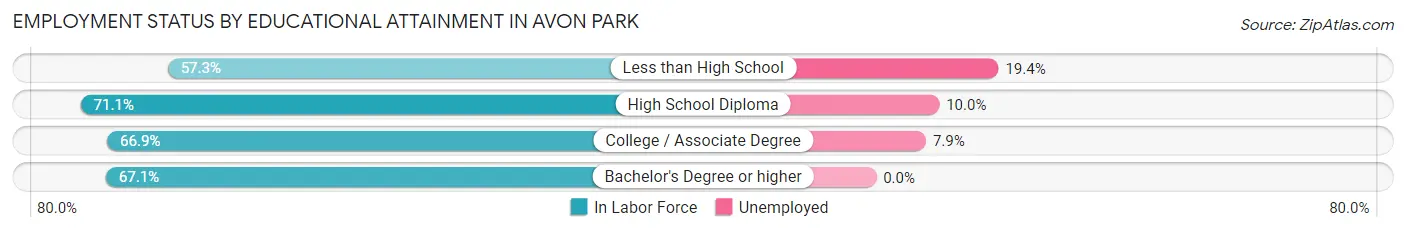
| Educational Attainment | In Labor Force | Unemployed |
| Less than High School | 617 (57.3%) | 209 (19.4%) |
| High School Diploma | 1,010 (71.1%) | 142 (10.0%) |
| College / Associate Degree | 800 (66.9%) | 94 (7.9%) |
| Bachelor's Degree or higher | 275 (67.1%) | 0 (0.0%) |
| Total | 2,700 (65.8%) | 431 (10.5%) |
Employment Occupations by Sex in Avon Park
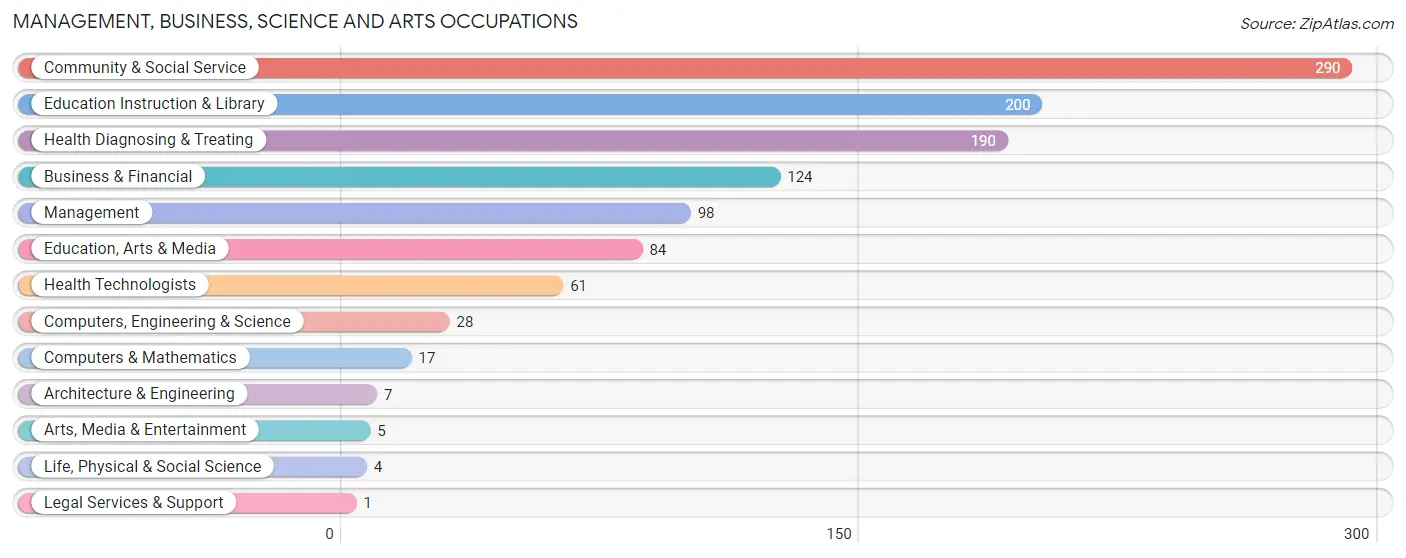
Management, Business, Science and Arts Occupations
The most common Management, Business, Science and Arts occupations in Avon Park are Community & Social Service (290 | 9.1%), Education Instruction & Library (200 | 6.3%), Health Diagnosing & Treating (190 | 6.0%), Business & Financial (124 | 3.9%), and Management (98 | 3.1%).
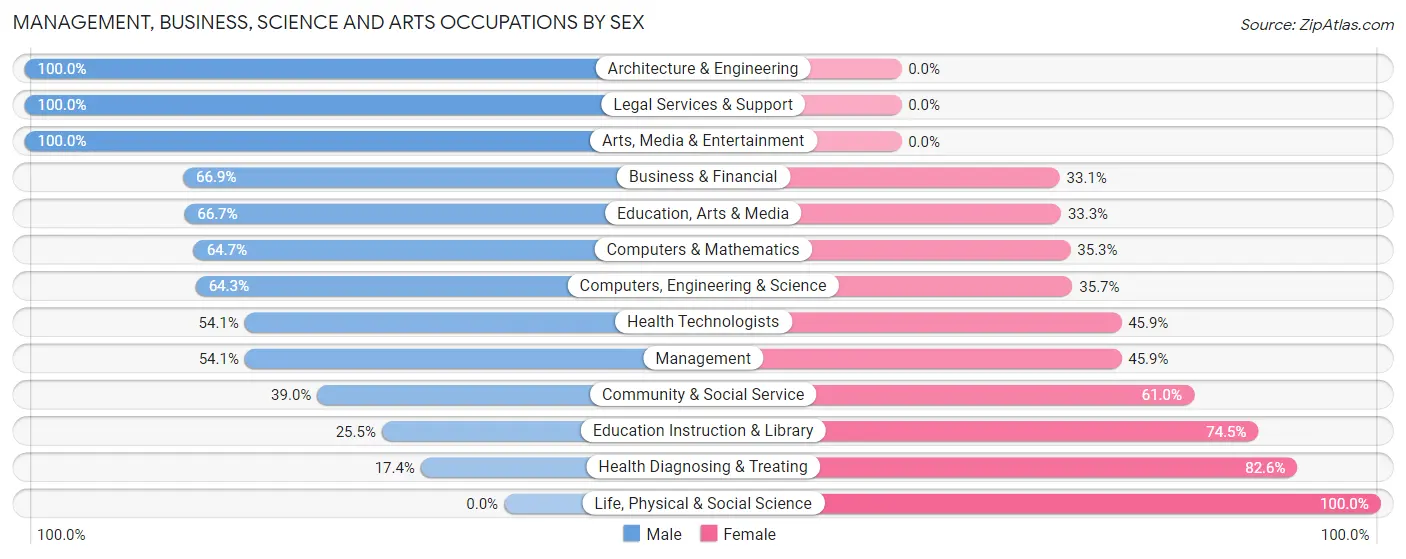
Management, Business, Science and Arts Occupations by Sex
Within the Management, Business, Science and Arts occupations in Avon Park, the most male-oriented occupations are Architecture & Engineering (100.0%), Legal Services & Support (100.0%), and Arts, Media & Entertainment (100.0%), while the most female-oriented occupations are Life, Physical & Social Science (100.0%), Health Diagnosing & Treating (82.6%), and Education Instruction & Library (74.5%).
| Occupation | Male | Female |
| Management | 53 (54.1%) | 45 (45.9%) |
| Business & Financial | 83 (66.9%) | 41 (33.1%) |
| Computers, Engineering & Science | 18 (64.3%) | 10 (35.7%) |
| Computers & Mathematics | 11 (64.7%) | 6 (35.3%) |
| Architecture & Engineering | 7 (100.0%) | 0 (0.0%) |
| Life, Physical & Social Science | 0 (0.0%) | 4 (100.0%) |
| Community & Social Service | 113 (39.0%) | 177 (61.0%) |
| Education, Arts & Media | 56 (66.7%) | 28 (33.3%) |
| Legal Services & Support | 1 (100.0%) | 0 (0.0%) |
| Education Instruction & Library | 51 (25.5%) | 149 (74.5%) |
| Arts, Media & Entertainment | 5 (100.0%) | 0 (0.0%) |
| Health Diagnosing & Treating | 33 (17.4%) | 157 (82.6%) |
| Health Technologists | 33 (54.1%) | 28 (45.9%) |
| Total (Category) | 300 (41.1%) | 430 (58.9%) |
| Total (Overall) | 1,652 (52.0%) | 1,527 (48.0%) |
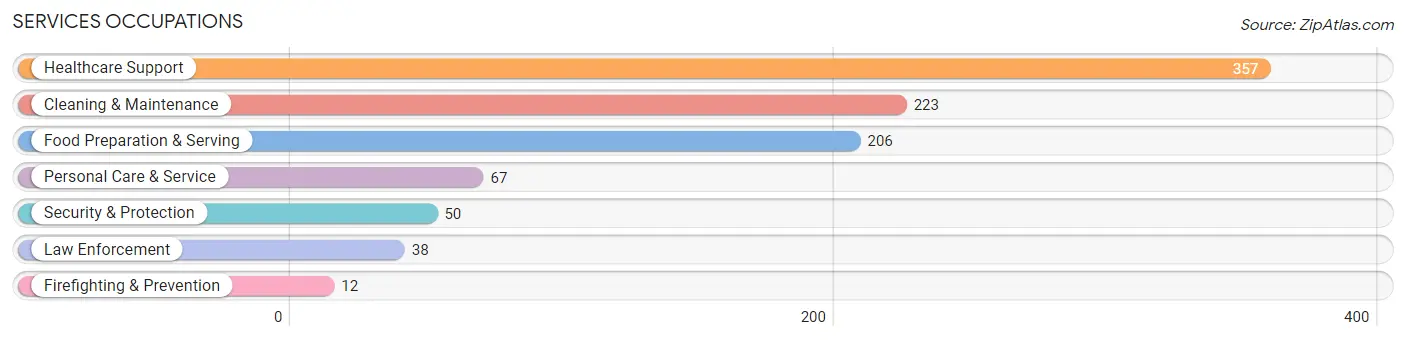
Services Occupations
The most common Services occupations in Avon Park are Healthcare Support (357 | 11.2%), Cleaning & Maintenance (223 | 7.0%), Food Preparation & Serving (206 | 6.5%), Personal Care & Service (67 | 2.1%), and Security & Protection (50 | 1.6%).
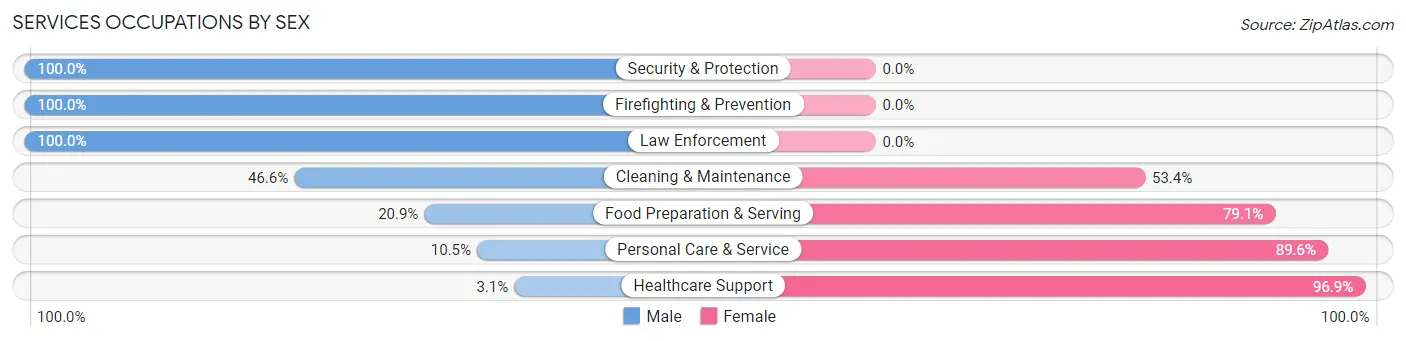
Services Occupations by Sex
Within the Services occupations in Avon Park, the most male-oriented occupations are Security & Protection (100.0%), Firefighting & Prevention (100.0%), and Law Enforcement (100.0%), while the most female-oriented occupations are Healthcare Support (96.9%), Personal Care & Service (89.5%), and Food Preparation & Serving (79.1%).
| Occupation | Male | Female |
| Healthcare Support | 11 (3.1%) | 346 (96.9%) |
| Security & Protection | 50 (100.0%) | 0 (0.0%) |
| Firefighting & Prevention | 12 (100.0%) | 0 (0.0%) |
| Law Enforcement | 38 (100.0%) | 0 (0.0%) |
| Food Preparation & Serving | 43 (20.9%) | 163 (79.1%) |
| Cleaning & Maintenance | 104 (46.6%) | 119 (53.4%) |
| Personal Care & Service | 7 (10.4%) | 60 (89.5%) |
| Total (Category) | 215 (23.8%) | 688 (76.2%) |
| Total (Overall) | 1,652 (52.0%) | 1,527 (48.0%) |
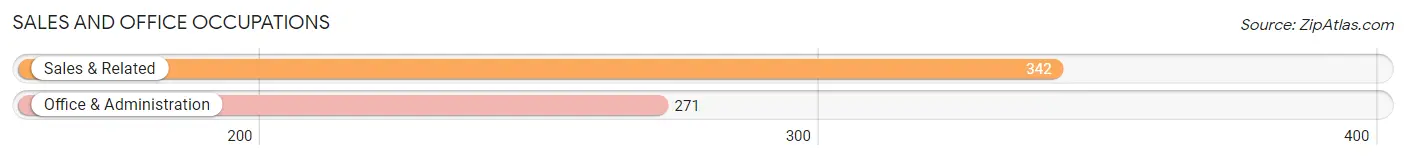
Sales and Office Occupations
The most common Sales and Office occupations in Avon Park are Sales & Related (342 | 10.8%), and Office & Administration (271 | 8.5%).
Sales and Office Occupations by Sex
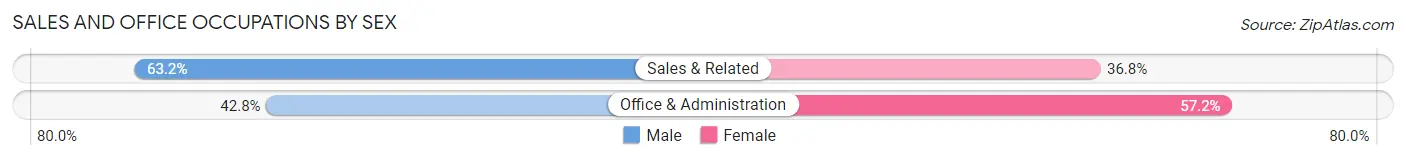
| Occupation | Male | Female |
| Sales & Related | 216 (63.2%) | 126 (36.8%) |
| Office & Administration | 116 (42.8%) | 155 (57.2%) |
| Total (Category) | 332 (54.2%) | 281 (45.8%) |
| Total (Overall) | 1,652 (52.0%) | 1,527 (48.0%) |
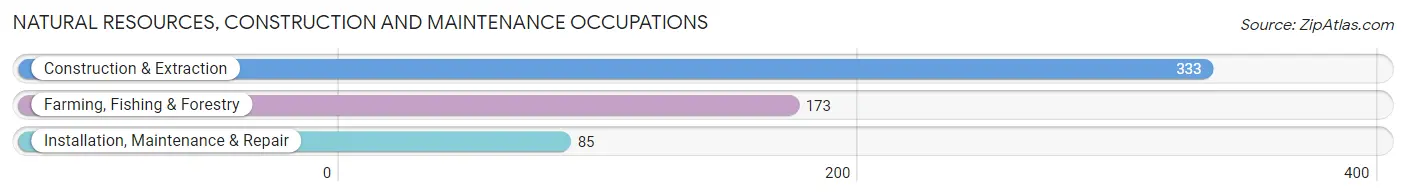
Natural Resources, Construction and Maintenance Occupations
The most common Natural Resources, Construction and Maintenance occupations in Avon Park are Construction & Extraction (333 | 10.5%), Farming, Fishing & Forestry (173 | 5.4%), and Installation, Maintenance & Repair (85 | 2.7%).
Natural Resources, Construction and Maintenance Occupations by Sex
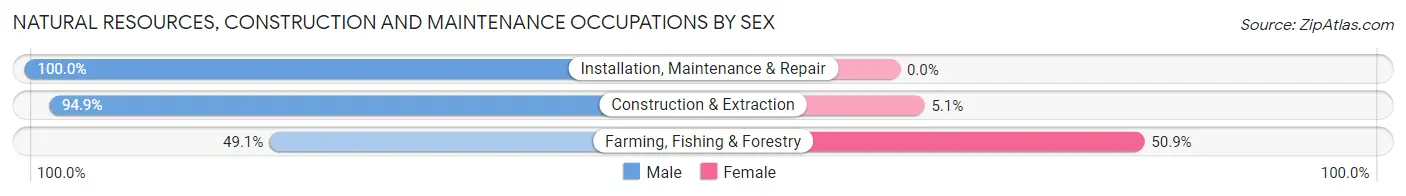
| Occupation | Male | Female |
| Farming, Fishing & Forestry | 85 (49.1%) | 88 (50.9%) |
| Construction & Extraction | 316 (94.9%) | 17 (5.1%) |
| Installation, Maintenance & Repair | 85 (100.0%) | 0 (0.0%) |
| Total (Category) | 486 (82.2%) | 105 (17.8%) |
| Total (Overall) | 1,652 (52.0%) | 1,527 (48.0%) |
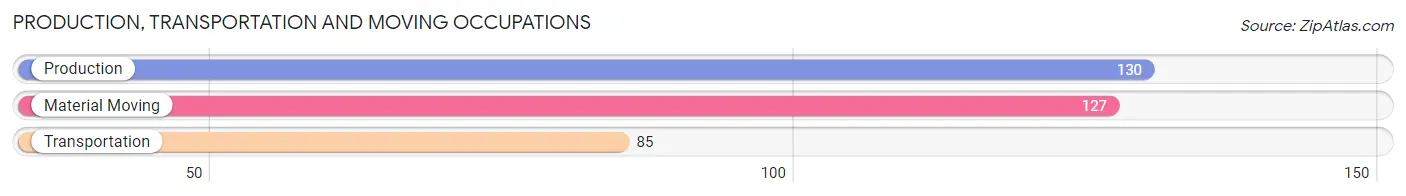
Production, Transportation and Moving Occupations
The most common Production, Transportation and Moving occupations in Avon Park are Production (130 | 4.1%), Material Moving (127 | 4.0%), and Transportation (85 | 2.7%).
Production, Transportation and Moving Occupations by Sex
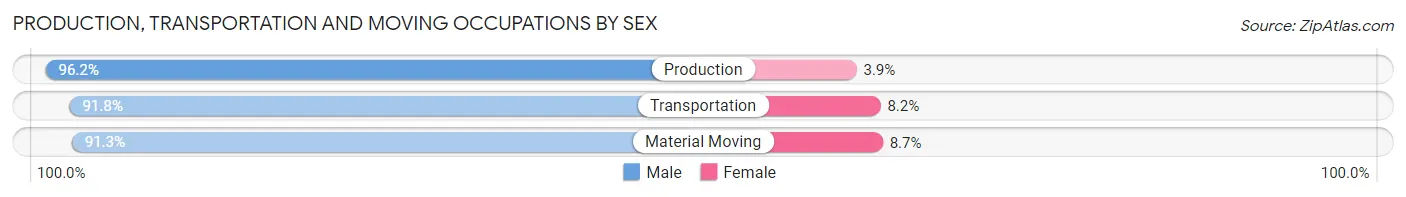
| Occupation | Male | Female |
| Production | 125 (96.2%) | 5 (3.8%) |
| Transportation | 78 (91.8%) | 7 (8.2%) |
| Material Moving | 116 (91.3%) | 11 (8.7%) |
| Total (Category) | 319 (93.3%) | 23 (6.7%) |
| Total (Overall) | 1,652 (52.0%) | 1,527 (48.0%) |
Employment Industries by Sex in Avon Park
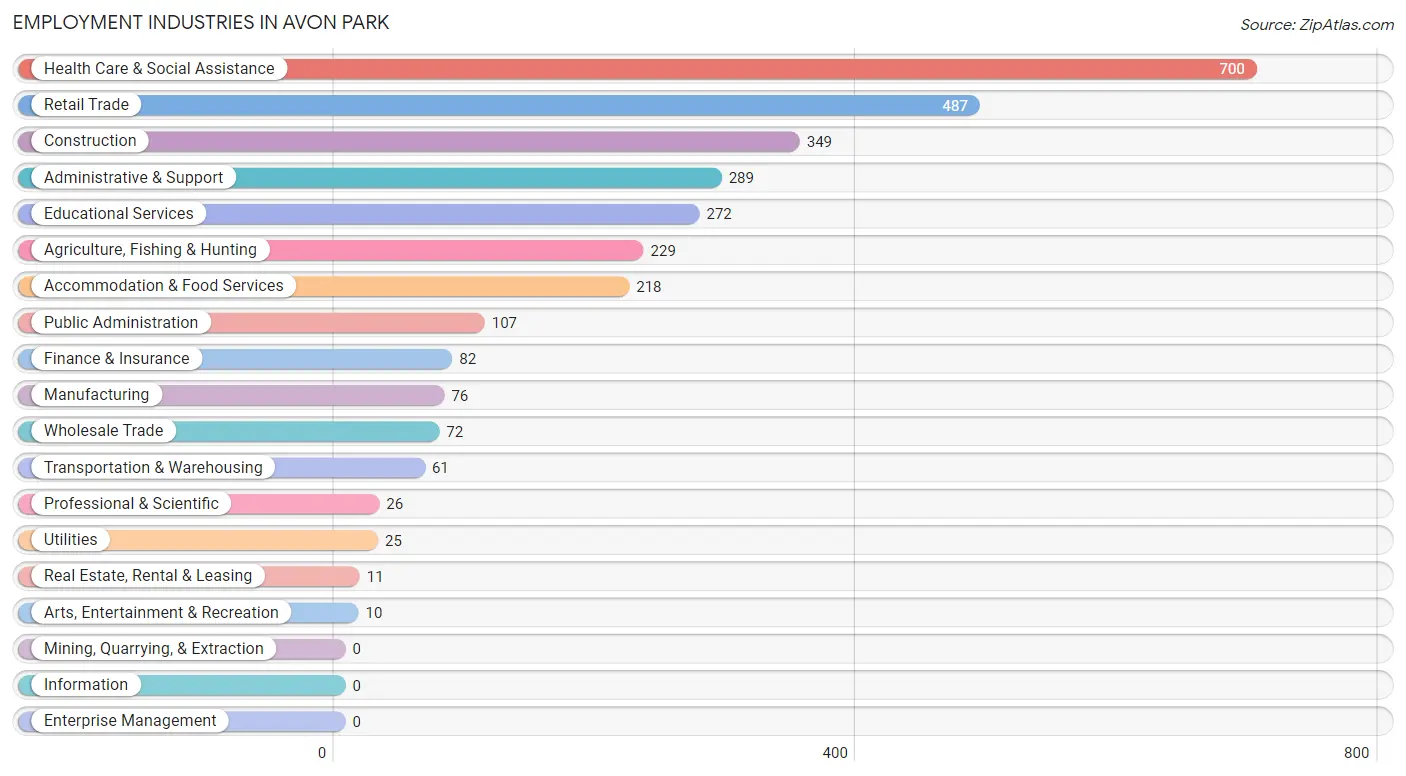
Employment Industries in Avon Park
The major employment industries in Avon Park include Health Care & Social Assistance (700 | 22.0%), Retail Trade (487 | 15.3%), Construction (349 | 11.0%), Administrative & Support (289 | 9.1%), and Educational Services (272 | 8.6%).
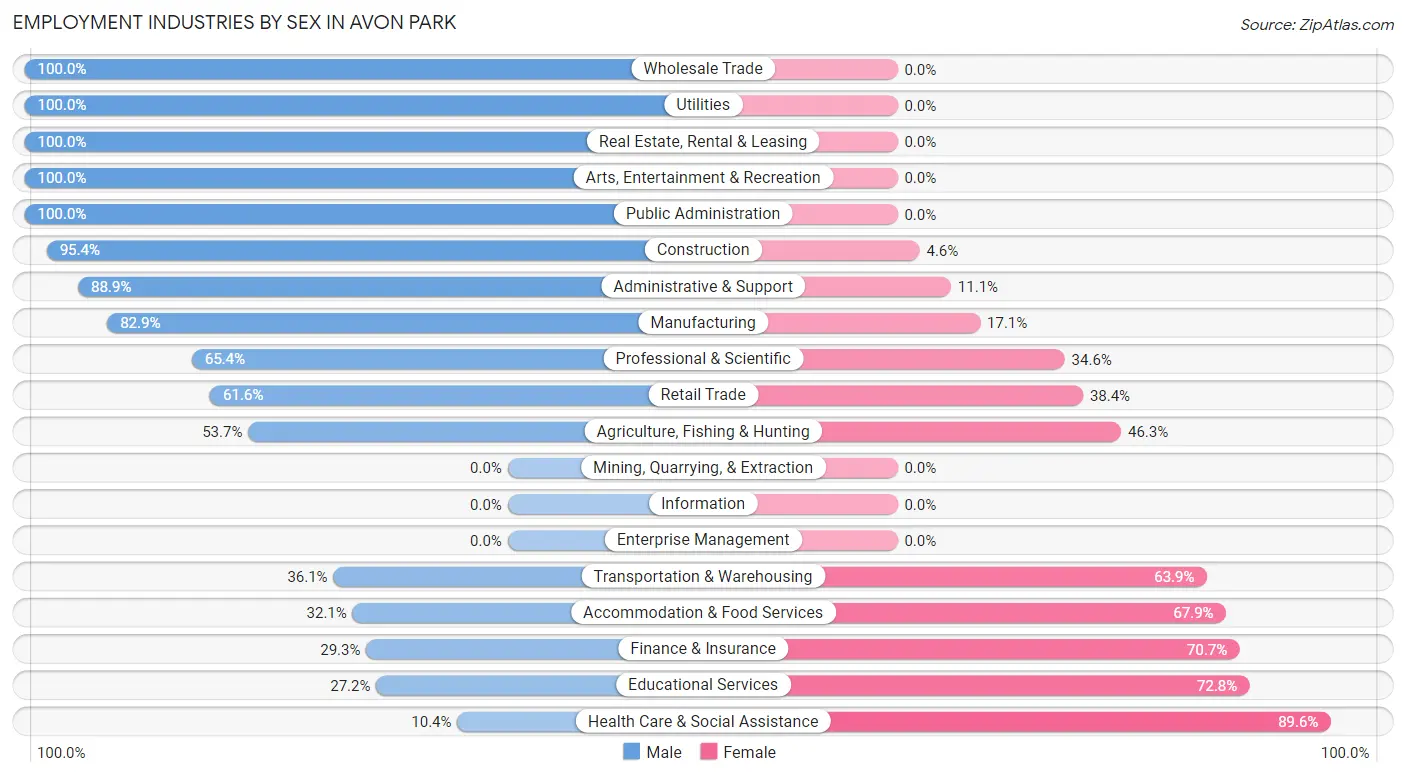
Employment Industries by Sex in Avon Park
The Avon Park industries that see more men than women are Wholesale Trade (100.0%), Utilities (100.0%), and Real Estate, Rental & Leasing (100.0%), whereas the industries that tend to have a higher number of women are Health Care & Social Assistance (89.6%), Educational Services (72.8%), and Finance & Insurance (70.7%).
| Industry | Male | Female |
| Agriculture, Fishing & Hunting | 123 (53.7%) | 106 (46.3%) |
| Mining, Quarrying, & Extraction | 0 (0.0%) | 0 (0.0%) |
| Construction | 333 (95.4%) | 16 (4.6%) |
| Manufacturing | 63 (82.9%) | 13 (17.1%) |
| Wholesale Trade | 72 (100.0%) | 0 (0.0%) |
| Retail Trade | 300 (61.6%) | 187 (38.4%) |
| Transportation & Warehousing | 22 (36.1%) | 39 (63.9%) |
| Utilities | 25 (100.0%) | 0 (0.0%) |
| Information | 0 (0.0%) | 0 (0.0%) |
| Finance & Insurance | 24 (29.3%) | 58 (70.7%) |
| Real Estate, Rental & Leasing | 11 (100.0%) | 0 (0.0%) |
| Professional & Scientific | 17 (65.4%) | 9 (34.6%) |
| Enterprise Management | 0 (0.0%) | 0 (0.0%) |
| Administrative & Support | 257 (88.9%) | 32 (11.1%) |
| Educational Services | 74 (27.2%) | 198 (72.8%) |
| Health Care & Social Assistance | 73 (10.4%) | 627 (89.6%) |
| Arts, Entertainment & Recreation | 10 (100.0%) | 0 (0.0%) |
| Accommodation & Food Services | 70 (32.1%) | 148 (67.9%) |
| Public Administration | 107 (100.0%) | 0 (0.0%) |
| Total | 1,652 (52.0%) | 1,527 (48.0%) |
Education in Avon Park
School Enrollment in Avon Park
The most common levels of schooling among the 2,093 students in Avon Park are college / undergraduate (544 | 26.0%), elementary school (480 | 22.9%), and high school (463 | 22.1%).
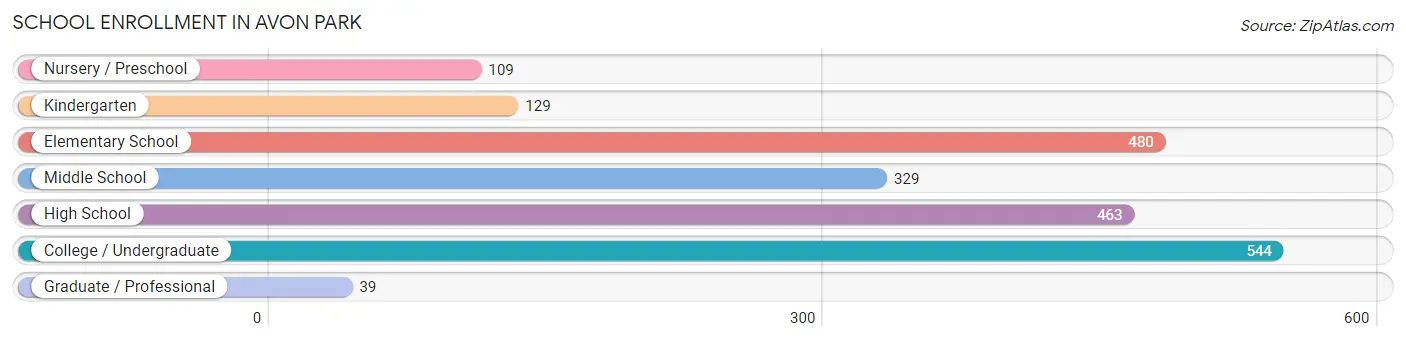
| School Level | # Students | % Students |
| Nursery / Preschool | 109 | 5.2% |
| Kindergarten | 129 | 6.2% |
| Elementary School | 480 | 22.9% |
| Middle School | 329 | 15.7% |
| High School | 463 | 22.1% |
| College / Undergraduate | 544 | 26.0% |
| Graduate / Professional | 39 | 1.9% |
| Total | 2,093 | 100.0% |
School Enrollment by Age by Funding Source in Avon Park
Out of a total of 2,093 students who are enrolled in schools in Avon Park, 186 (8.9%) attend a private institution, while the remaining 1,907 (91.1%) are enrolled in public schools. The age group of 18 to 19 year olds has the highest likelihood of being enrolled in private schools, with 52 (42.3% in the age bracket) enrolled. Conversely, the age group of 3 to 4 year olds has the lowest likelihood of being enrolled in a private school, with 72 (100.0% in the age bracket) attending a public institution.
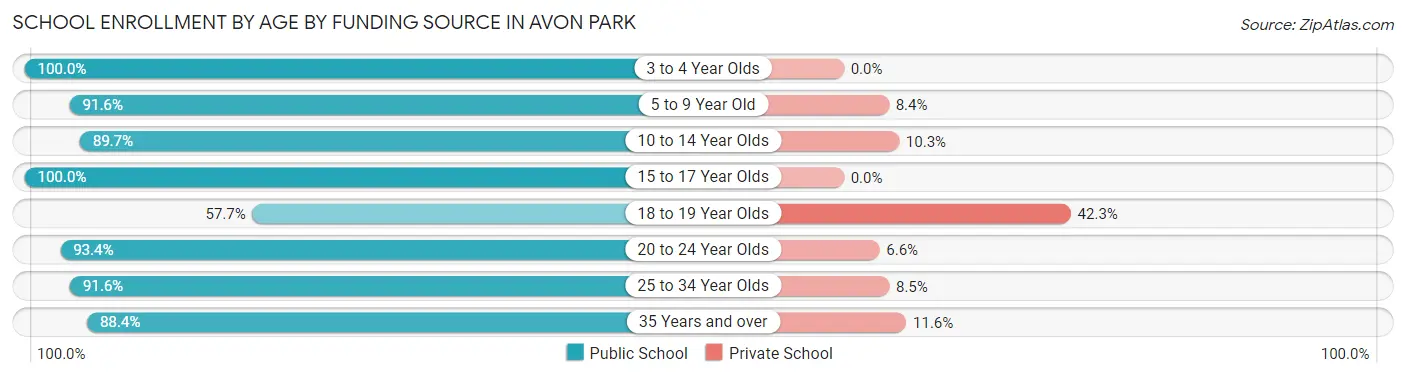
| Age Bracket | Public School | Private School |
| 3 to 4 Year Olds | 72 (100.0%) | 0 (0.0%) |
| 5 to 9 Year Old | 524 (91.6%) | 48 (8.4%) |
| 10 to 14 Year Olds | 366 (89.7%) | 42 (10.3%) |
| 15 to 17 Year Olds | 421 (100.0%) | 0 (0.0%) |
| 18 to 19 Year Olds | 71 (57.7%) | 52 (42.3%) |
| 20 to 24 Year Olds | 197 (93.4%) | 14 (6.6%) |
| 25 to 34 Year Olds | 65 (91.5%) | 6 (8.5%) |
| 35 Years and over | 190 (88.4%) | 25 (11.6%) |
| Total | 1,907 (91.1%) | 186 (8.9%) |
Educational Attainment by Field of Study in Avon Park
Education (296 | 33.0%), business (211 | 23.5%), science & technology (89 | 9.9%), liberal arts & history (76 | 8.5%), and psychology (42 | 4.7%) are the most common fields of study among 897 individuals in Avon Park who have obtained a bachelor's degree or higher.
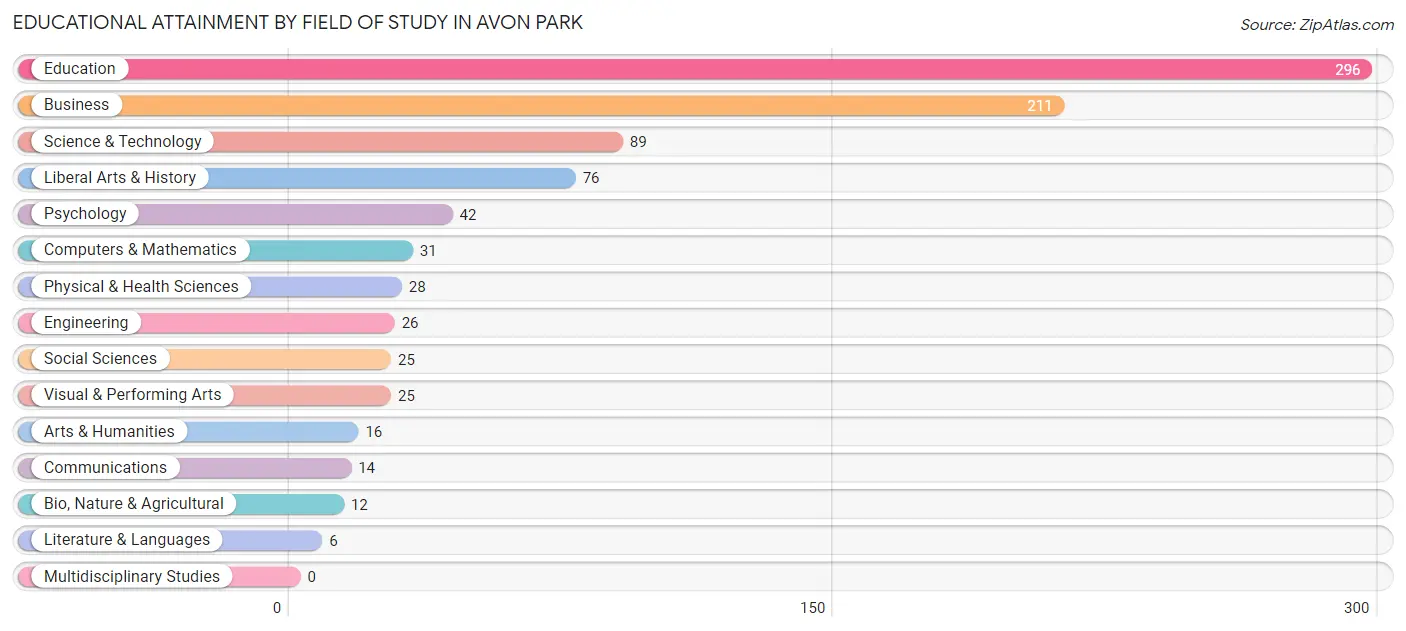
| Field of Study | # Graduates | % Graduates |
| Computers & Mathematics | 31 | 3.5% |
| Bio, Nature & Agricultural | 12 | 1.3% |
| Physical & Health Sciences | 28 | 3.1% |
| Psychology | 42 | 4.7% |
| Social Sciences | 25 | 2.8% |
| Engineering | 26 | 2.9% |
| Multidisciplinary Studies | 0 | 0.0% |
| Science & Technology | 89 | 9.9% |
| Business | 211 | 23.5% |
| Education | 296 | 33.0% |
| Literature & Languages | 6 | 0.7% |
| Liberal Arts & History | 76 | 8.5% |
| Visual & Performing Arts | 25 | 2.8% |
| Communications | 14 | 1.6% |
| Arts & Humanities | 16 | 1.8% |
| Total | 897 | 100.0% |
Transportation & Commute in Avon Park
Vehicle Availability by Sex in Avon Park
The most prevalent vehicle ownership categories in Avon Park are males with 2 vehicles (618, accounting for 39.5%) and females with 2 vehicles (583, making up 40.9%).
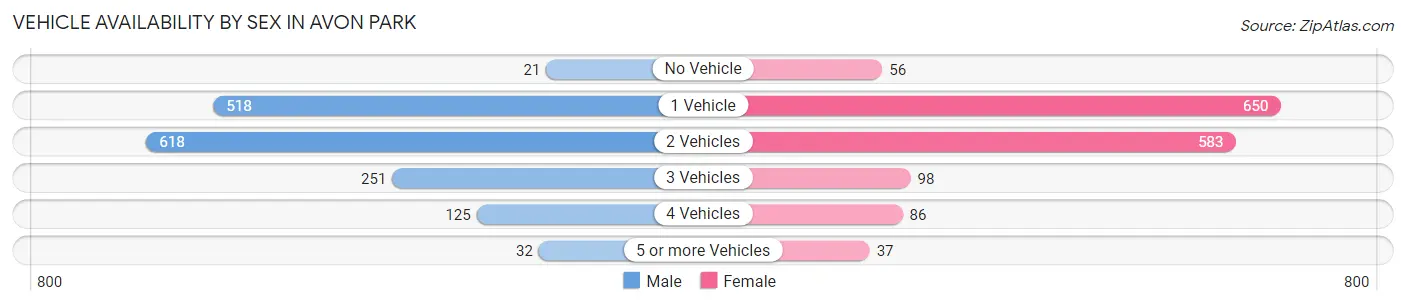
| Vehicles Available | Male | Female |
| No Vehicle | 21 (1.3%) | 56 (3.7%) |
| 1 Vehicle | 518 (33.1%) | 650 (43.0%) |
| 2 Vehicles | 618 (39.5%) | 583 (38.6%) |
| 3 Vehicles | 251 (16.0%) | 98 (6.5%) |
| 4 Vehicles | 125 (8.0%) | 86 (5.7%) |
| 5 or more Vehicles | 32 (2.0%) | 37 (2.5%) |
| Total | 1,565 (100.0%) | 1,510 (100.0%) |
Commute Time in Avon Park
The most frequently occuring commute durations in Avon Park are 20 to 24 minutes (615 commuters, 19.9%), 10 to 14 minutes (558 commuters, 18.0%), and 15 to 19 minutes (410 commuters, 13.3%).
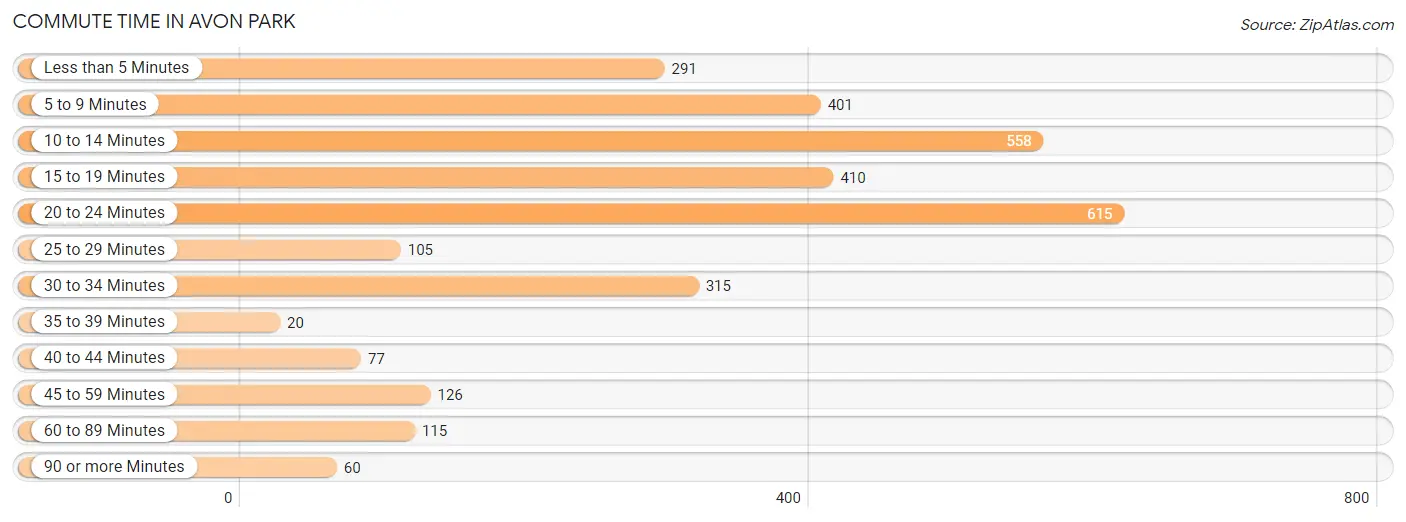
| Commute Time | # Commuters | % Commuters |
| Less than 5 Minutes | 291 | 9.4% |
| 5 to 9 Minutes | 401 | 13.0% |
| 10 to 14 Minutes | 558 | 18.0% |
| 15 to 19 Minutes | 410 | 13.3% |
| 20 to 24 Minutes | 615 | 19.9% |
| 25 to 29 Minutes | 105 | 3.4% |
| 30 to 34 Minutes | 315 | 10.2% |
| 35 to 39 Minutes | 20 | 0.6% |
| 40 to 44 Minutes | 77 | 2.5% |
| 45 to 59 Minutes | 126 | 4.1% |
| 60 to 89 Minutes | 115 | 3.7% |
| 90 or more Minutes | 60 | 1.9% |
Commute Time by Sex in Avon Park
The most common commute times in Avon Park are 10 to 14 minutes (287 commuters, 17.8%) for males and 20 to 24 minutes (445 commuters, 30.0%) for females.
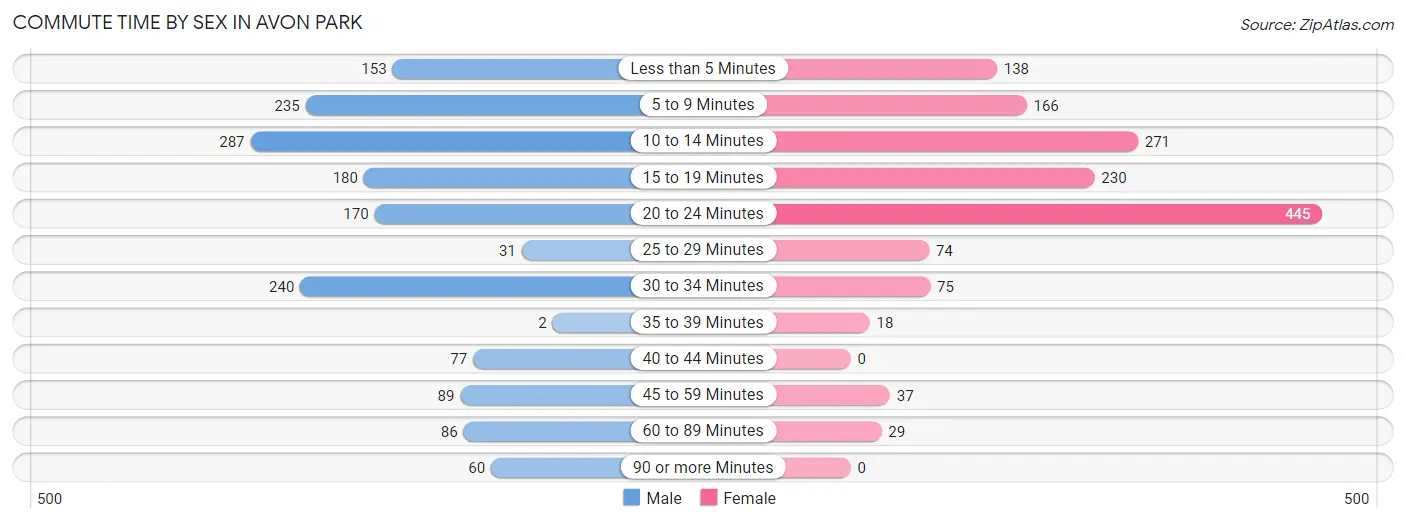
| Commute Time | Male | Female |
| Less than 5 Minutes | 153 (9.5%) | 138 (9.3%) |
| 5 to 9 Minutes | 235 (14.6%) | 166 (11.2%) |
| 10 to 14 Minutes | 287 (17.8%) | 271 (18.3%) |
| 15 to 19 Minutes | 180 (11.2%) | 230 (15.5%) |
| 20 to 24 Minutes | 170 (10.6%) | 445 (30.0%) |
| 25 to 29 Minutes | 31 (1.9%) | 74 (5.0%) |
| 30 to 34 Minutes | 240 (14.9%) | 75 (5.1%) |
| 35 to 39 Minutes | 2 (0.1%) | 18 (1.2%) |
| 40 to 44 Minutes | 77 (4.8%) | 0 (0.0%) |
| 45 to 59 Minutes | 89 (5.5%) | 37 (2.5%) |
| 60 to 89 Minutes | 86 (5.3%) | 29 (2.0%) |
| 90 or more Minutes | 60 (3.7%) | 0 (0.0%) |
Time of Departure to Work by Sex in Avon Park
The most frequent times of departure to work in Avon Park are 6:30 AM to 6:59 AM (250, 15.5%) for males and 7:00 AM to 7:29 AM (304, 20.5%) for females.
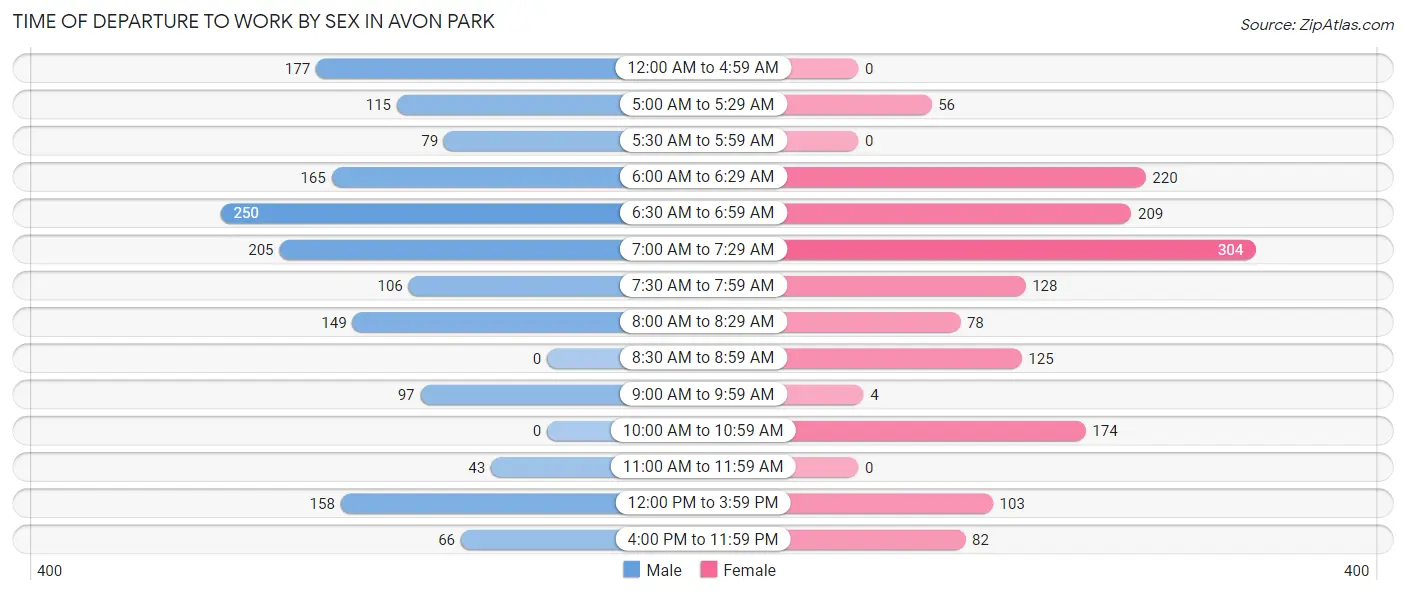
| Time of Departure | Male | Female |
| 12:00 AM to 4:59 AM | 177 (11.0%) | 0 (0.0%) |
| 5:00 AM to 5:29 AM | 115 (7.1%) | 56 (3.8%) |
| 5:30 AM to 5:59 AM | 79 (4.9%) | 0 (0.0%) |
| 6:00 AM to 6:29 AM | 165 (10.2%) | 220 (14.8%) |
| 6:30 AM to 6:59 AM | 250 (15.5%) | 209 (14.1%) |
| 7:00 AM to 7:29 AM | 205 (12.7%) | 304 (20.5%) |
| 7:30 AM to 7:59 AM | 106 (6.6%) | 128 (8.6%) |
| 8:00 AM to 8:29 AM | 149 (9.2%) | 78 (5.3%) |
| 8:30 AM to 8:59 AM | 0 (0.0%) | 125 (8.4%) |
| 9:00 AM to 9:59 AM | 97 (6.0%) | 4 (0.3%) |
| 10:00 AM to 10:59 AM | 0 (0.0%) | 174 (11.7%) |
| 11:00 AM to 11:59 AM | 43 (2.7%) | 0 (0.0%) |
| 12:00 PM to 3:59 PM | 158 (9.8%) | 103 (7.0%) |
| 4:00 PM to 11:59 PM | 66 (4.1%) | 82 (5.5%) |
| Total | 1,610 (100.0%) | 1,483 (100.0%) |
Housing Occupancy in Avon Park
Occupancy by Ownership in Avon Park
Of the total 4,080 dwellings in Avon Park, owner-occupied units account for 2,403 (58.9%), while renter-occupied units make up 1,677 (41.1%).
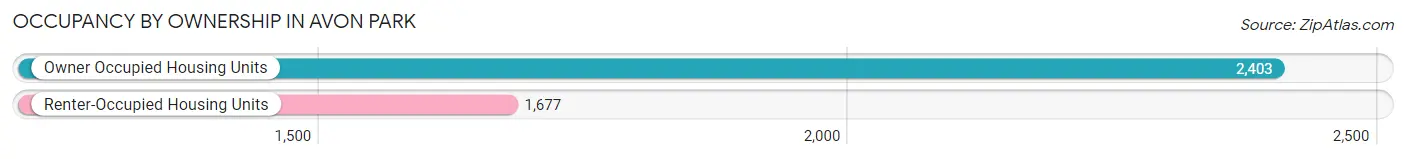
| Occupancy | # Housing Units | % Housing Units |
| Owner Occupied Housing Units | 2,403 | 58.9% |
| Renter-Occupied Housing Units | 1,677 | 41.1% |
| Total Occupied Housing Units | 4,080 | 100.0% |
Occupancy by Household Size in Avon Park
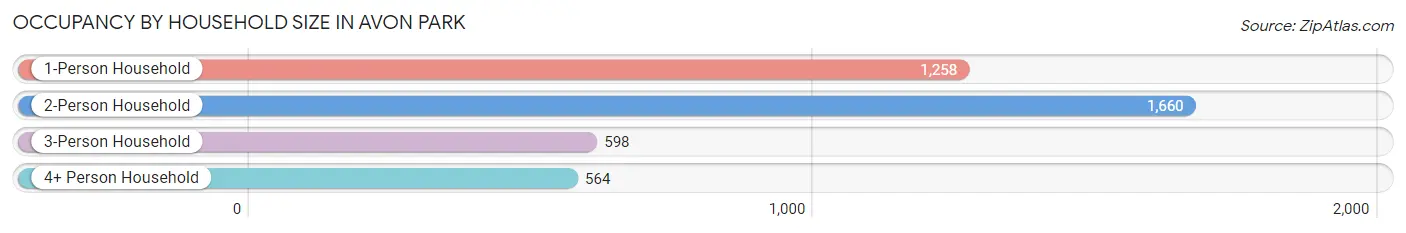
| Household Size | # Housing Units | % Housing Units |
| 1-Person Household | 1,258 | 30.8% |
| 2-Person Household | 1,660 | 40.7% |
| 3-Person Household | 598 | 14.7% |
| 4+ Person Household | 564 | 13.8% |
| Total Housing Units | 4,080 | 100.0% |
Occupancy by Ownership by Household Size in Avon Park
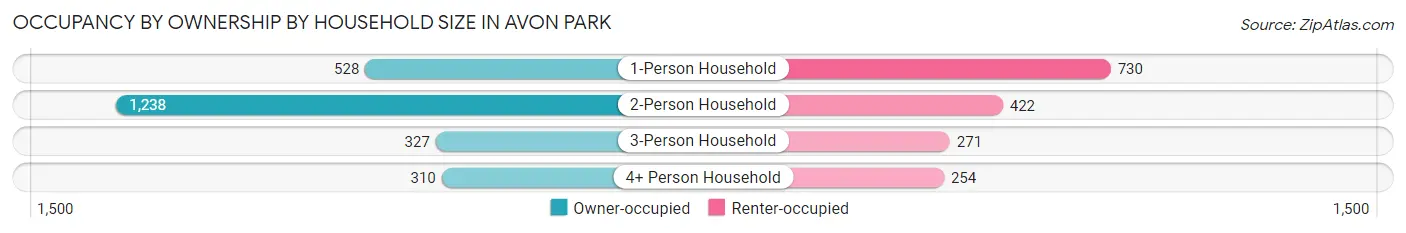
| Household Size | Owner-occupied | Renter-occupied |
| 1-Person Household | 528 (42.0%) | 730 (58.0%) |
| 2-Person Household | 1,238 (74.6%) | 422 (25.4%) |
| 3-Person Household | 327 (54.7%) | 271 (45.3%) |
| 4+ Person Household | 310 (55.0%) | 254 (45.0%) |
| Total Housing Units | 2,403 (58.9%) | 1,677 (41.1%) |
Occupancy by Educational Attainment in Avon Park
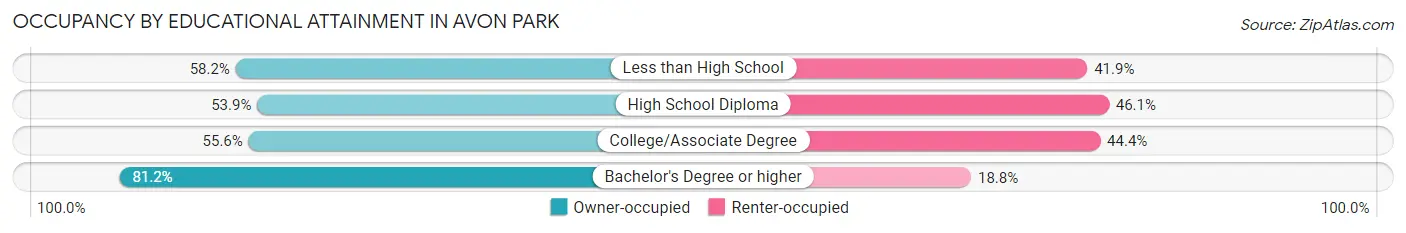
| Household Size | Owner-occupied | Renter-occupied |
| Less than High School | 592 (58.2%) | 426 (41.8%) |
| High School Diploma | 645 (53.9%) | 552 (46.1%) |
| College/Associate Degree | 756 (55.6%) | 604 (44.4%) |
| Bachelor's Degree or higher | 410 (81.2%) | 95 (18.8%) |
Occupancy by Age of Householder in Avon Park
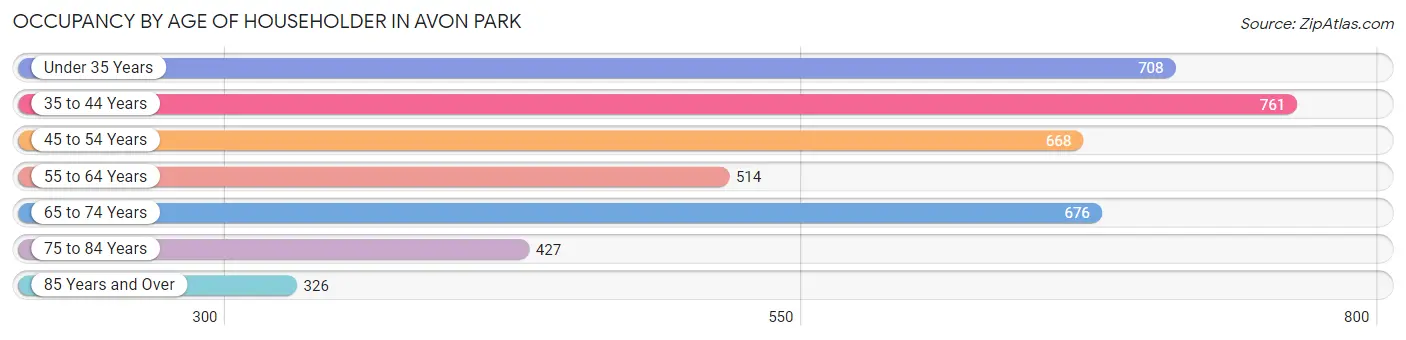
| Age Bracket | # Households | % Households |
| Under 35 Years | 708 | 17.3% |
| 35 to 44 Years | 761 | 18.6% |
| 45 to 54 Years | 668 | 16.4% |
| 55 to 64 Years | 514 | 12.6% |
| 65 to 74 Years | 676 | 16.6% |
| 75 to 84 Years | 427 | 10.5% |
| 85 Years and Over | 326 | 8.0% |
| Total | 4,080 | 100.0% |
Housing Finances in Avon Park
Median Income by Occupancy in Avon Park
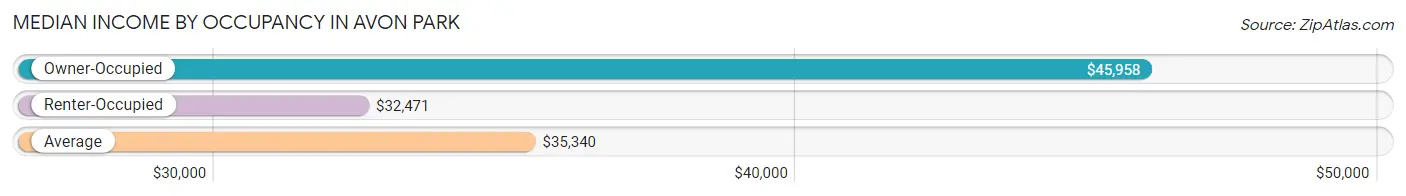
| Occupancy Type | # Households | Median Income |
| Owner-Occupied | 2,403 (58.9%) | $45,958 |
| Renter-Occupied | 1,677 (41.1%) | $32,471 |
| Average | 4,080 (100.0%) | $35,340 |
Occupancy by Householder Income Bracket in Avon Park
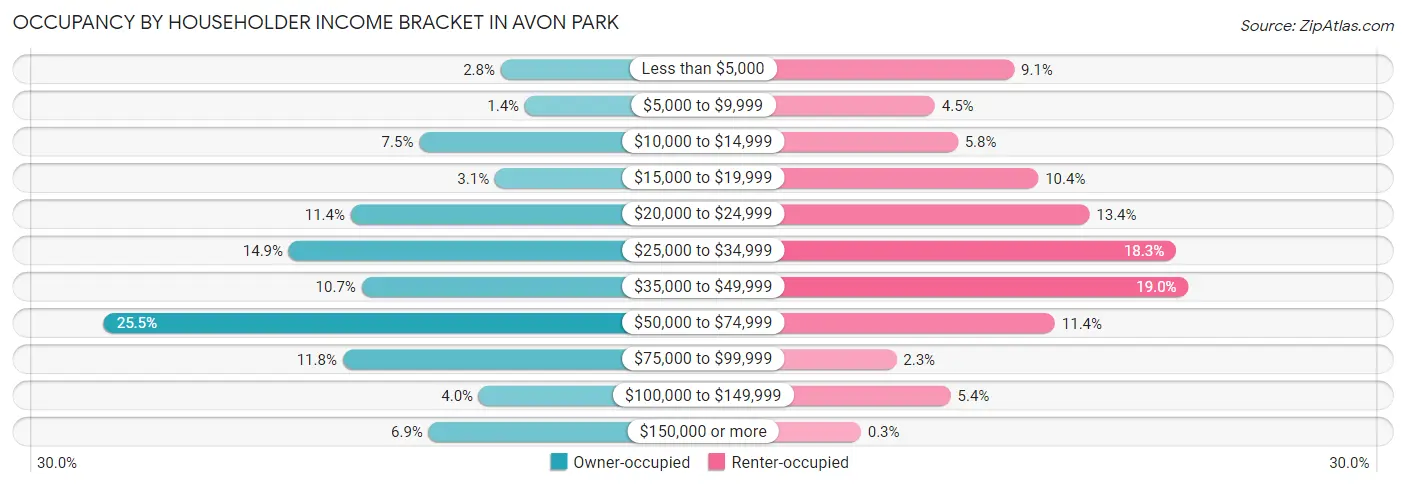
| Income Bracket | Owner-occupied | Renter-occupied |
| Less than $5,000 | 67 (2.8%) | 152 (9.1%) |
| $5,000 to $9,999 | 34 (1.4%) | 76 (4.5%) |
| $10,000 to $14,999 | 179 (7.4%) | 98 (5.8%) |
| $15,000 to $19,999 | 75 (3.1%) | 175 (10.4%) |
| $20,000 to $24,999 | 273 (11.4%) | 224 (13.4%) |
| $25,000 to $34,999 | 358 (14.9%) | 307 (18.3%) |
| $35,000 to $49,999 | 258 (10.7%) | 319 (19.0%) |
| $50,000 to $74,999 | 612 (25.5%) | 191 (11.4%) |
| $75,000 to $99,999 | 284 (11.8%) | 39 (2.3%) |
| $100,000 to $149,999 | 97 (4.0%) | 91 (5.4%) |
| $150,000 or more | 166 (6.9%) | 5 (0.3%) |
| Total | 2,403 (100.0%) | 1,677 (100.0%) |
Monthly Housing Cost Tiers in Avon Park
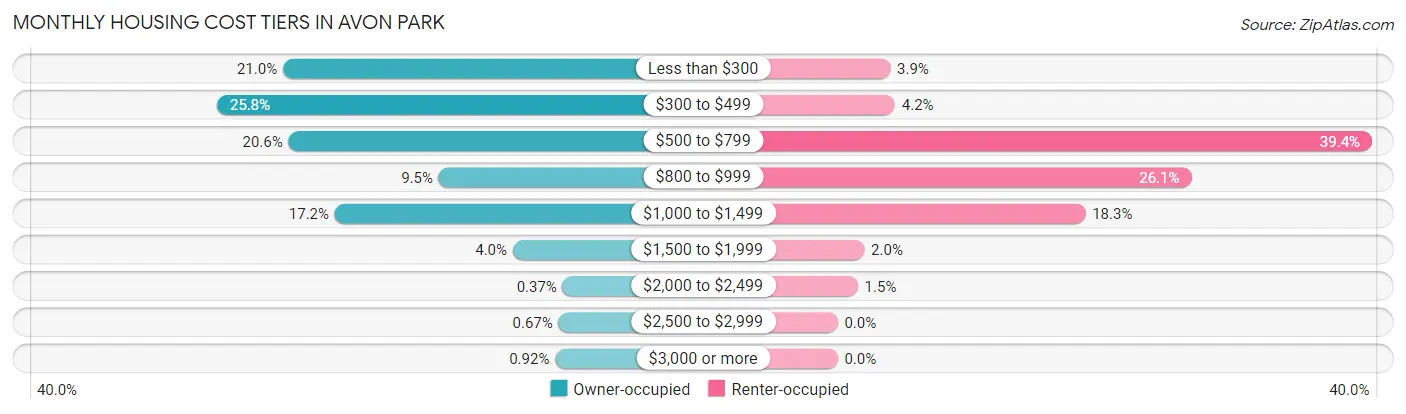
| Monthly Cost | Owner-occupied | Renter-occupied |
| Less than $300 | 504 (21.0%) | 65 (3.9%) |
| $300 to $499 | 621 (25.8%) | 71 (4.2%) |
| $500 to $799 | 494 (20.6%) | 660 (39.4%) |
| $800 to $999 | 228 (9.5%) | 437 (26.1%) |
| $1,000 to $1,499 | 412 (17.2%) | 306 (18.2%) |
| $1,500 to $1,999 | 97 (4.0%) | 33 (2.0%) |
| $2,000 to $2,499 | 9 (0.4%) | 25 (1.5%) |
| $2,500 to $2,999 | 16 (0.7%) | 0 (0.0%) |
| $3,000 or more | 22 (0.9%) | 0 (0.0%) |
| Total | 2,403 (100.0%) | 1,677 (100.0%) |
Physical Housing Characteristics in Avon Park
Housing Structures in Avon Park
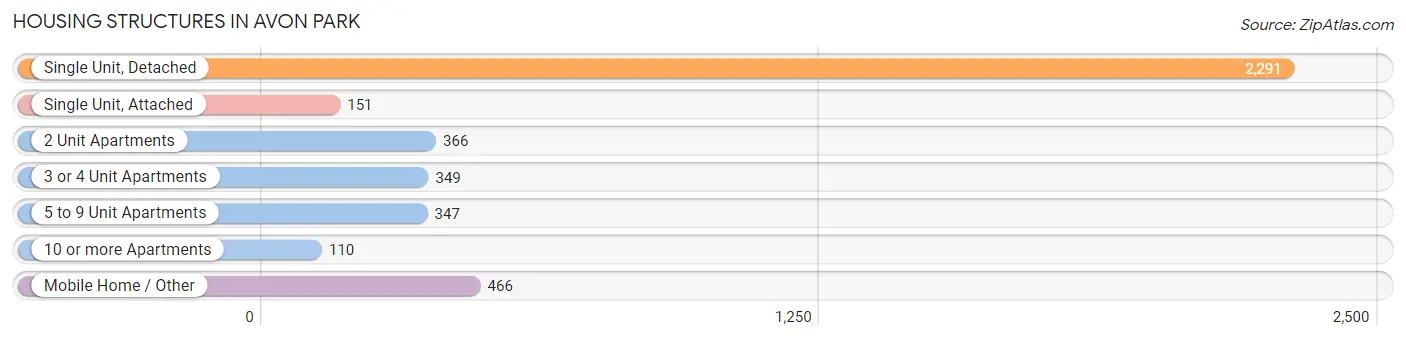
| Structure Type | # Housing Units | % Housing Units |
| Single Unit, Detached | 2,291 | 56.1% |
| Single Unit, Attached | 151 | 3.7% |
| 2 Unit Apartments | 366 | 9.0% |
| 3 or 4 Unit Apartments | 349 | 8.6% |
| 5 to 9 Unit Apartments | 347 | 8.5% |
| 10 or more Apartments | 110 | 2.7% |
| Mobile Home / Other | 466 | 11.4% |
| Total | 4,080 | 100.0% |
Housing Structures by Occupancy in Avon Park
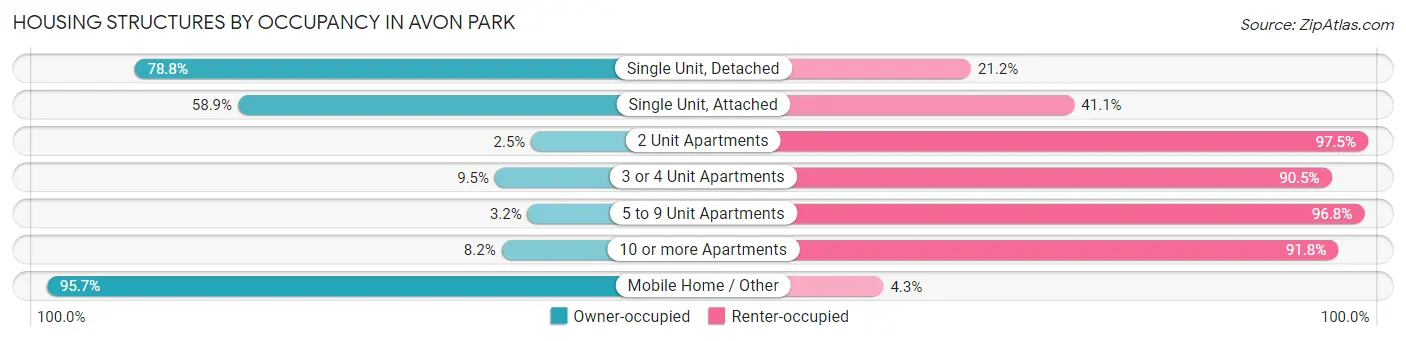
| Structure Type | Owner-occupied | Renter-occupied |
| Single Unit, Detached | 1,806 (78.8%) | 485 (21.2%) |
| Single Unit, Attached | 89 (58.9%) | 62 (41.1%) |
| 2 Unit Apartments | 9 (2.5%) | 357 (97.5%) |
| 3 or 4 Unit Apartments | 33 (9.5%) | 316 (90.5%) |
| 5 to 9 Unit Apartments | 11 (3.2%) | 336 (96.8%) |
| 10 or more Apartments | 9 (8.2%) | 101 (91.8%) |
| Mobile Home / Other | 446 (95.7%) | 20 (4.3%) |
| Total | 2,403 (58.9%) | 1,677 (41.1%) |
Housing Structures by Number of Rooms in Avon Park
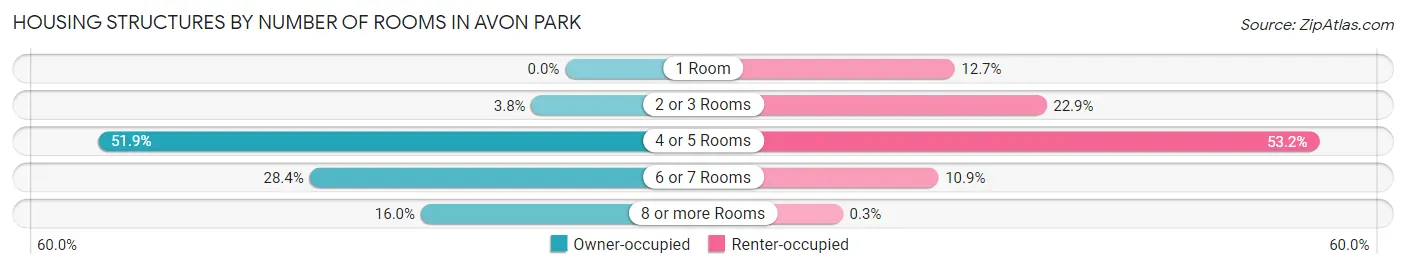
| Number of Rooms | Owner-occupied | Renter-occupied |
| 1 Room | 0 (0.0%) | 213 (12.7%) |
| 2 or 3 Rooms | 90 (3.7%) | 384 (22.9%) |
| 4 or 5 Rooms | 1,246 (51.8%) | 892 (53.2%) |
| 6 or 7 Rooms | 682 (28.4%) | 183 (10.9%) |
| 8 or more Rooms | 385 (16.0%) | 5 (0.3%) |
| Total | 2,403 (100.0%) | 1,677 (100.0%) |
Housing Structure by Heating Type in Avon Park
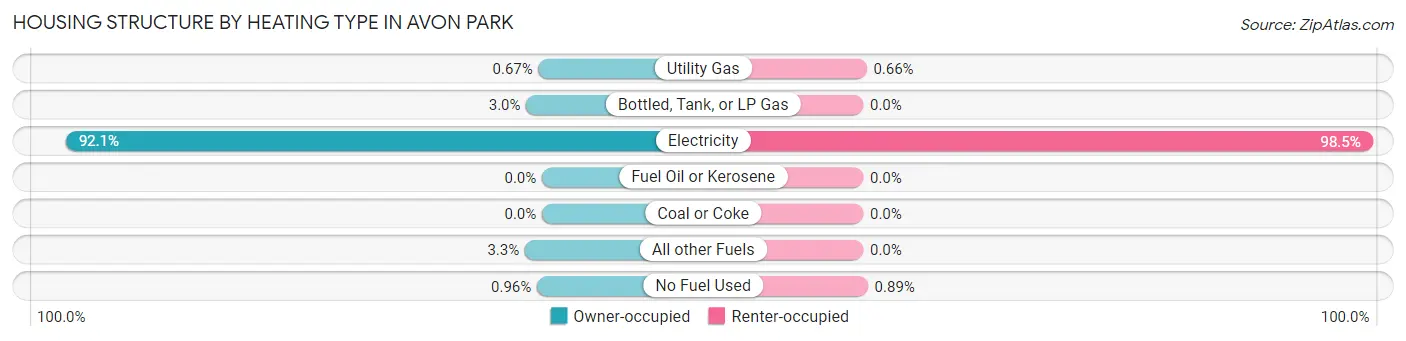
| Heating Type | Owner-occupied | Renter-occupied |
| Utility Gas | 16 (0.7%) | 11 (0.7%) |
| Bottled, Tank, or LP Gas | 73 (3.0%) | 0 (0.0%) |
| Electricity | 2,212 (92.0%) | 1,651 (98.5%) |
| Fuel Oil or Kerosene | 0 (0.0%) | 0 (0.0%) |
| Coal or Coke | 0 (0.0%) | 0 (0.0%) |
| All other Fuels | 79 (3.3%) | 0 (0.0%) |
| No Fuel Used | 23 (1.0%) | 15 (0.9%) |
| Total | 2,403 (100.0%) | 1,677 (100.0%) |
Household Vehicle Usage in Avon Park
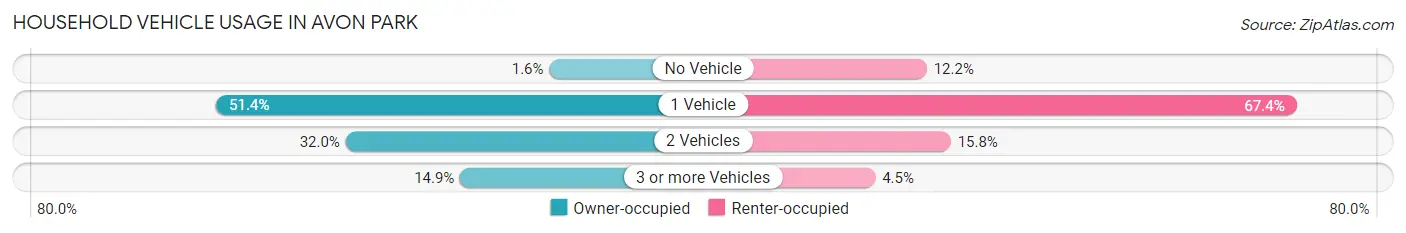
| Vehicles per Household | Owner-occupied | Renter-occupied |
| No Vehicle | 39 (1.6%) | 205 (12.2%) |
| 1 Vehicle | 1,235 (51.4%) | 1,131 (67.4%) |
| 2 Vehicles | 770 (32.0%) | 265 (15.8%) |
| 3 or more Vehicles | 359 (14.9%) | 76 (4.5%) |
| Total | 2,403 (100.0%) | 1,677 (100.0%) |
Real Estate & Mortgages in Avon Park
Real Estate and Mortgage Overview in Avon Park
| Characteristic | Without Mortgage | With Mortgage |
| Housing Units | 1,568 | 835 |
| Median Property Value | $92,100 | $154,500 |
| Median Household Income | $49,000 | $73 |
| Monthly Housing Costs | $386 | $22 |
| Real Estate Taxes | $417 | $87 |
Property Value by Mortgage Status in Avon Park
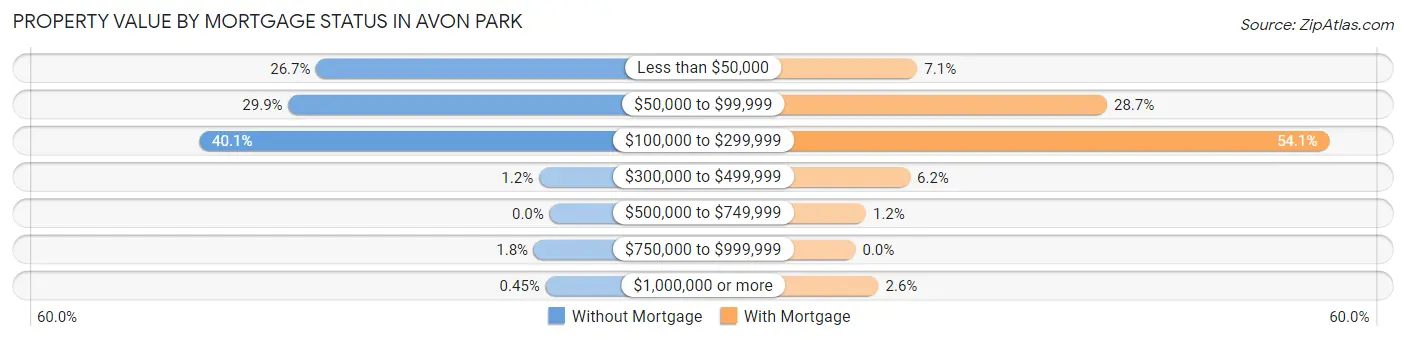
| Property Value | Without Mortgage | With Mortgage |
| Less than $50,000 | 418 (26.7%) | 59 (7.1%) |
| $50,000 to $99,999 | 468 (29.8%) | 240 (28.7%) |
| $100,000 to $299,999 | 628 (40.1%) | 452 (54.1%) |
| $300,000 to $499,999 | 19 (1.2%) | 52 (6.2%) |
| $500,000 to $749,999 | 0 (0.0%) | 10 (1.2%) |
| $750,000 to $999,999 | 28 (1.8%) | 0 (0.0%) |
| $1,000,000 or more | 7 (0.4%) | 22 (2.6%) |
| Total | 1,568 (100.0%) | 835 (100.0%) |
Household Income by Mortgage Status in Avon Park
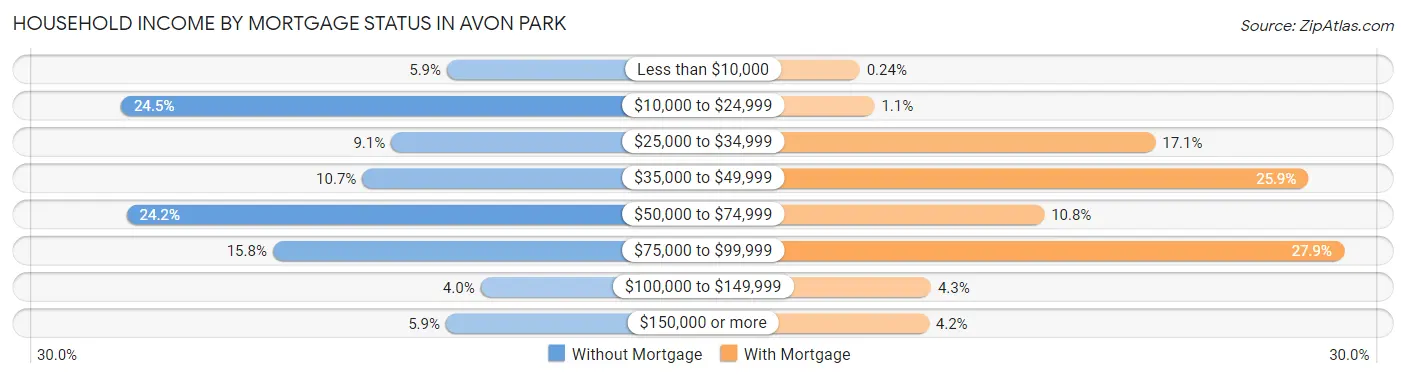
| Household Income | Without Mortgage | With Mortgage |
| Less than $10,000 | 92 (5.9%) | 2 (0.2%) |
| $10,000 to $24,999 | 384 (24.5%) | 9 (1.1%) |
| $25,000 to $34,999 | 142 (9.1%) | 143 (17.1%) |
| $35,000 to $49,999 | 168 (10.7%) | 216 (25.9%) |
| $50,000 to $74,999 | 379 (24.2%) | 90 (10.8%) |
| $75,000 to $99,999 | 248 (15.8%) | 233 (27.9%) |
| $100,000 to $149,999 | 62 (4.0%) | 36 (4.3%) |
| $150,000 or more | 93 (5.9%) | 35 (4.2%) |
| Total | 1,568 (100.0%) | 835 (100.0%) |
Property Value to Household Income Ratio in Avon Park
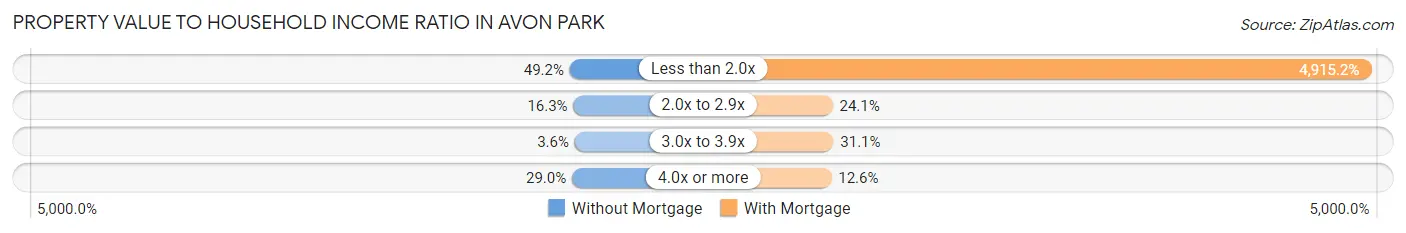
| Value-to-Income Ratio | Without Mortgage | With Mortgage |
| Less than 2.0x | 771 (49.2%) | 41,042 (4,915.2%) |
| 2.0x to 2.9x | 255 (16.3%) | 201 (24.1%) |
| 3.0x to 3.9x | 56 (3.6%) | 260 (31.1%) |
| 4.0x or more | 455 (29.0%) | 105 (12.6%) |
| Total | 1,568 (100.0%) | 835 (100.0%) |
Real Estate Taxes by Mortgage Status in Avon Park
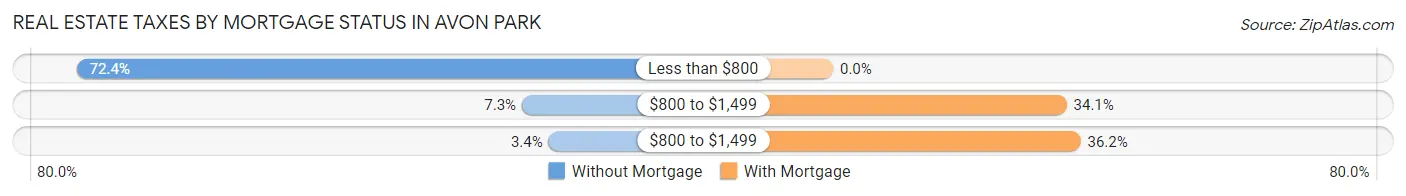
| Property Taxes | Without Mortgage | With Mortgage |
| Less than $800 | 1,135 (72.4%) | 0 (0.0%) |
| $800 to $1,499 | 115 (7.3%) | 285 (34.1%) |
| $800 to $1,499 | 54 (3.4%) | 302 (36.2%) |
| Total | 1,568 (100.0%) | 835 (100.0%) |
Health & Disability in Avon Park
Health Insurance Coverage by Age in Avon Park
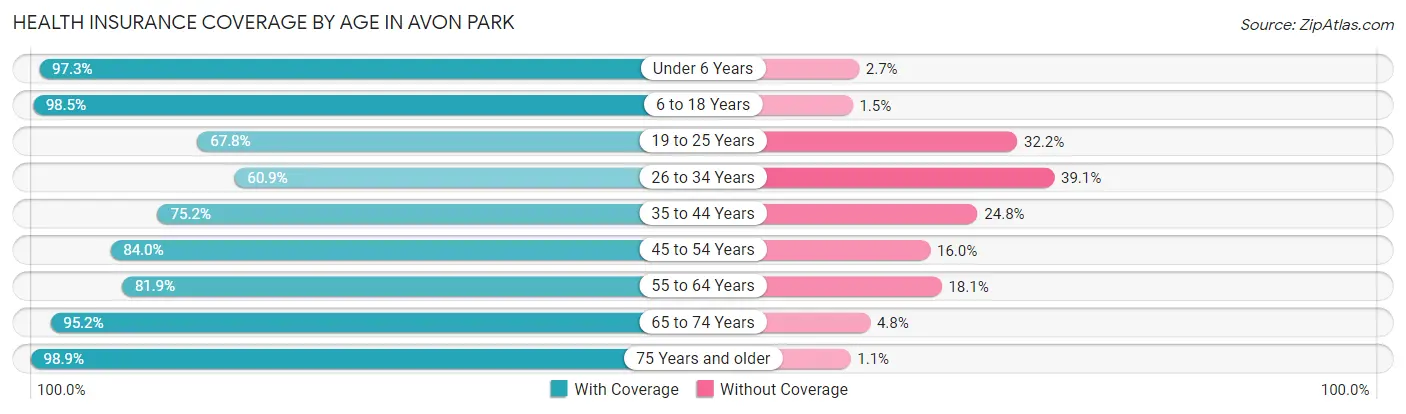
| Age Bracket | With Coverage | Without Coverage |
| Under 6 Years | 751 (97.3%) | 21 (2.7%) |
| 6 to 18 Years | 1,488 (98.5%) | 23 (1.5%) |
| 19 to 25 Years | 526 (67.8%) | 250 (32.2%) |
| 26 to 34 Years | 618 (60.9%) | 397 (39.1%) |
| 35 to 44 Years | 848 (75.2%) | 280 (24.8%) |
| 45 to 54 Years | 867 (84.0%) | 165 (16.0%) |
| 55 to 64 Years | 705 (81.9%) | 156 (18.1%) |
| 65 to 74 Years | 1,154 (95.2%) | 58 (4.8%) |
| 75 Years and older | 1,229 (98.9%) | 14 (1.1%) |
| Total | 8,186 (85.7%) | 1,364 (14.3%) |
Health Insurance Coverage by Citizenship Status in Avon Park
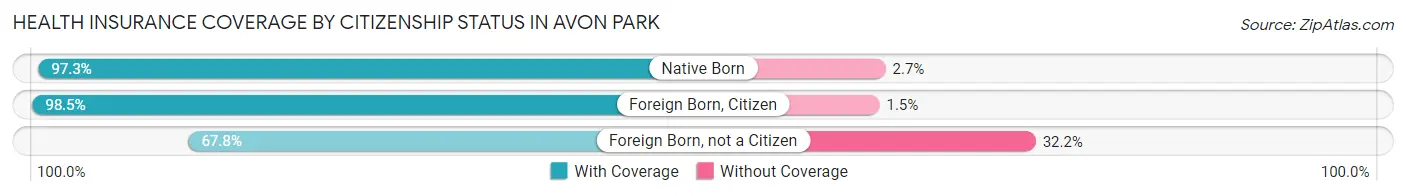
| Citizenship Status | With Coverage | Without Coverage |
| Native Born | 751 (97.3%) | 21 (2.7%) |
| Foreign Born, Citizen | 1,488 (98.5%) | 23 (1.5%) |
| Foreign Born, not a Citizen | 526 (67.8%) | 250 (32.2%) |
Health Insurance Coverage by Household Income in Avon Park
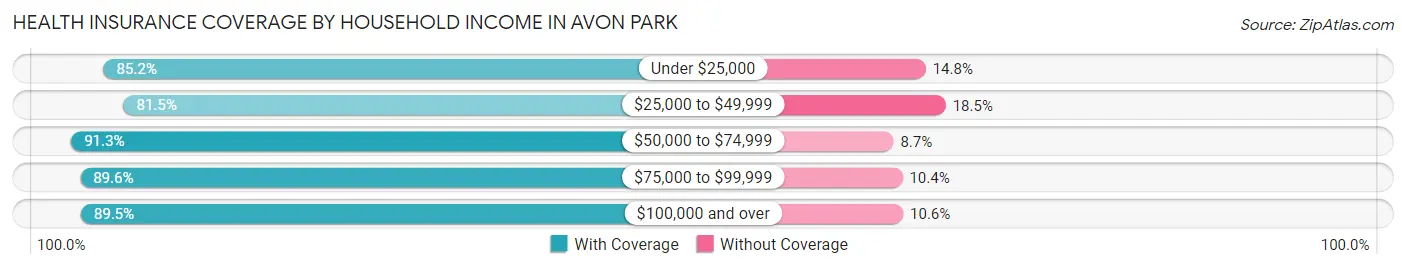
| Household Income | With Coverage | Without Coverage |
| Under $25,000 | 2,334 (85.2%) | 405 (14.8%) |
| $25,000 to $49,999 | 2,205 (81.5%) | 502 (18.5%) |
| $50,000 to $74,999 | 1,827 (91.3%) | 175 (8.7%) |
| $75,000 to $99,999 | 653 (89.6%) | 76 (10.4%) |
| $100,000 and over | 1,051 (89.4%) | 124 (10.5%) |
Public vs Private Health Insurance Coverage by Age in Avon Park
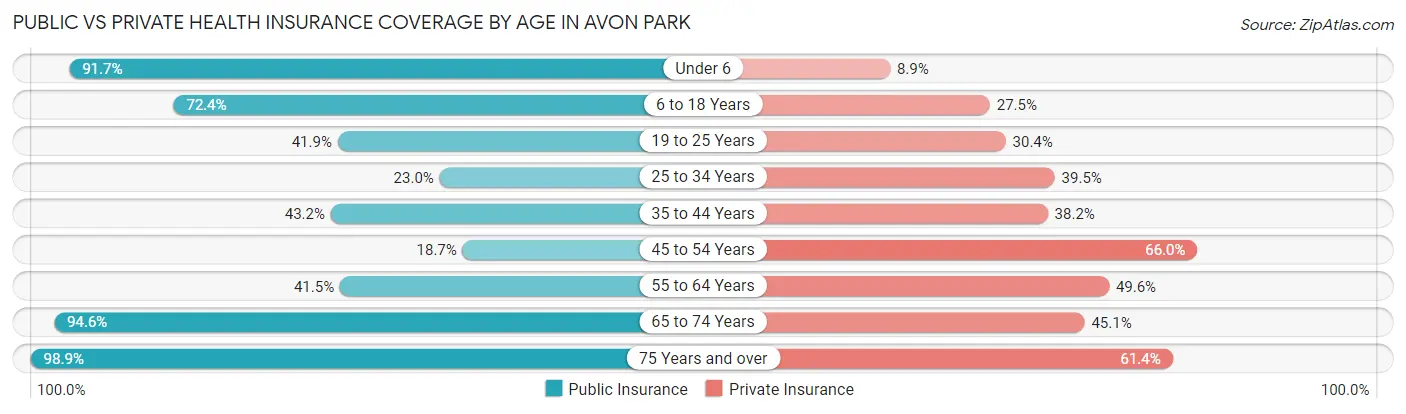
| Age Bracket | Public Insurance | Private Insurance |
| Under 6 | 708 (91.7%) | 69 (8.9%) |
| 6 to 18 Years | 1,094 (72.4%) | 415 (27.5%) |
| 19 to 25 Years | 325 (41.9%) | 236 (30.4%) |
| 25 to 34 Years | 233 (23.0%) | 401 (39.5%) |
| 35 to 44 Years | 487 (43.2%) | 431 (38.2%) |
| 45 to 54 Years | 193 (18.7%) | 681 (66.0%) |
| 55 to 64 Years | 357 (41.5%) | 427 (49.6%) |
| 65 to 74 Years | 1,146 (94.6%) | 546 (45.1%) |
| 75 Years and over | 1,229 (98.9%) | 763 (61.4%) |
| Total | 5,772 (60.4%) | 3,969 (41.6%) |
Disability Status by Sex by Age in Avon Park
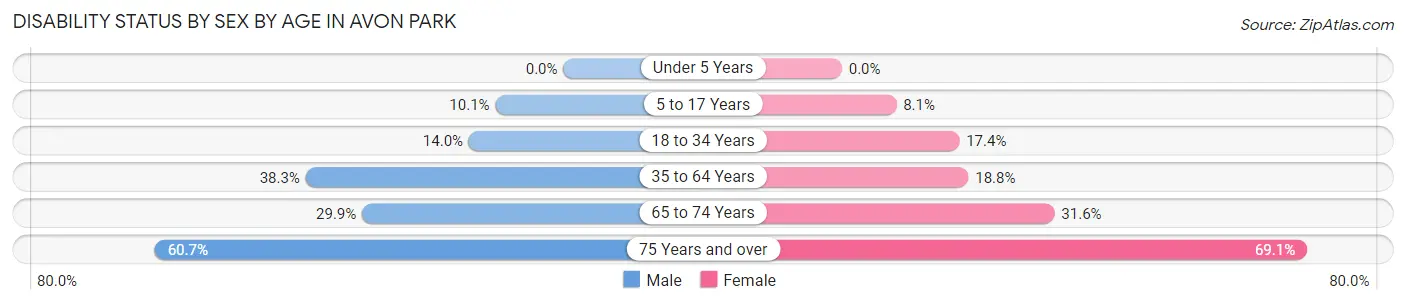
| Age Bracket | Male | Female |
| Under 5 Years | 0 (0.0%) | 0 (0.0%) |
| 5 to 17 Years | 83 (10.1%) | 55 (8.1%) |
| 18 to 34 Years | 138 (14.0%) | 161 (17.4%) |
| 35 to 64 Years | 541 (38.3%) | 302 (18.8%) |
| 65 to 74 Years | 153 (29.9%) | 221 (31.6%) |
| 75 Years and over | 401 (60.7%) | 402 (69.1%) |
Disability Class by Sex by Age in Avon Park
Disability Class: Hearing Difficulty
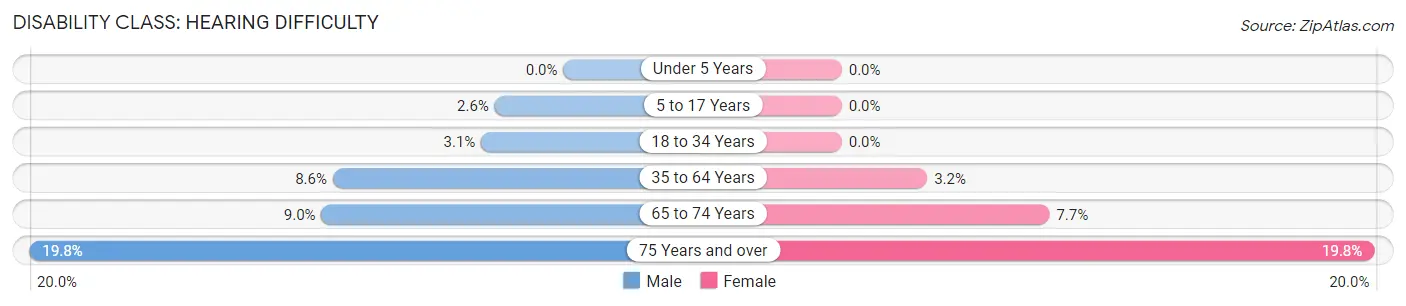
| Age Bracket | Male | Female |
| Under 5 Years | 0 (0.0%) | 0 (0.0%) |
| 5 to 17 Years | 21 (2.5%) | 0 (0.0%) |
| 18 to 34 Years | 30 (3.0%) | 0 (0.0%) |
| 35 to 64 Years | 121 (8.6%) | 51 (3.2%) |
| 65 to 74 Years | 46 (9.0%) | 54 (7.7%) |
| 75 Years and over | 131 (19.8%) | 115 (19.8%) |
Disability Class: Vision Difficulty
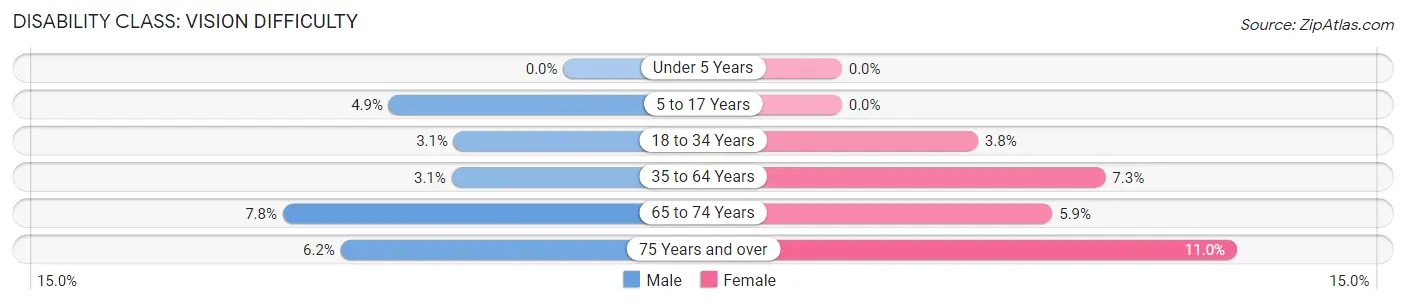
| Age Bracket | Male | Female |
| Under 5 Years | 0 (0.0%) | 0 (0.0%) |
| 5 to 17 Years | 40 (4.9%) | 0 (0.0%) |
| 18 to 34 Years | 30 (3.0%) | 35 (3.8%) |
| 35 to 64 Years | 44 (3.1%) | 118 (7.3%) |
| 65 to 74 Years | 40 (7.8%) | 41 (5.9%) |
| 75 Years and over | 41 (6.2%) | 64 (11.0%) |
Disability Class: Cognitive Difficulty
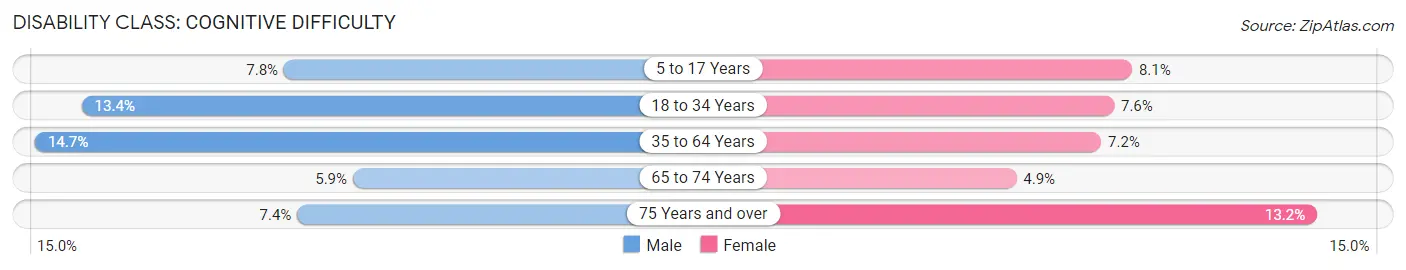
| Age Bracket | Male | Female |
| 5 to 17 Years | 64 (7.8%) | 55 (8.1%) |
| 18 to 34 Years | 132 (13.4%) | 70 (7.6%) |
| 35 to 64 Years | 208 (14.7%) | 116 (7.2%) |
| 65 to 74 Years | 30 (5.9%) | 34 (4.9%) |
| 75 Years and over | 49 (7.4%) | 77 (13.2%) |
Disability Class: Ambulatory Difficulty
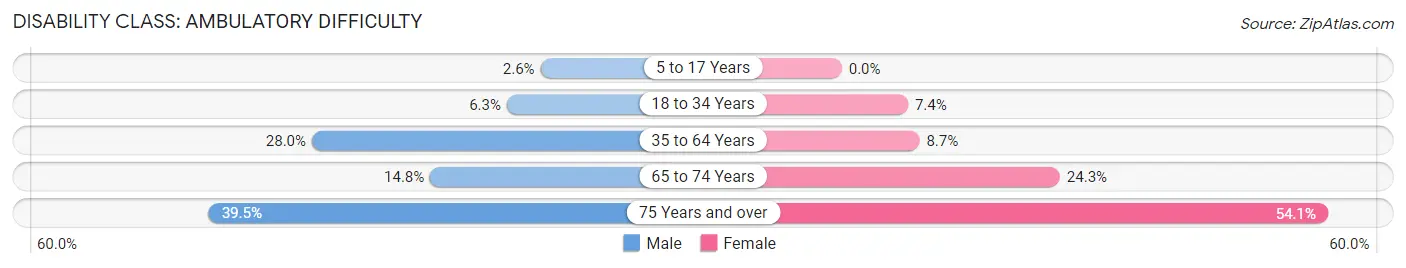
| Age Bracket | Male | Female |
| 5 to 17 Years | 21 (2.5%) | 0 (0.0%) |
| 18 to 34 Years | 62 (6.3%) | 68 (7.4%) |
| 35 to 64 Years | 396 (28.0%) | 139 (8.6%) |
| 65 to 74 Years | 76 (14.8%) | 170 (24.3%) |
| 75 Years and over | 261 (39.5%) | 315 (54.1%) |
Disability Class: Self-Care Difficulty
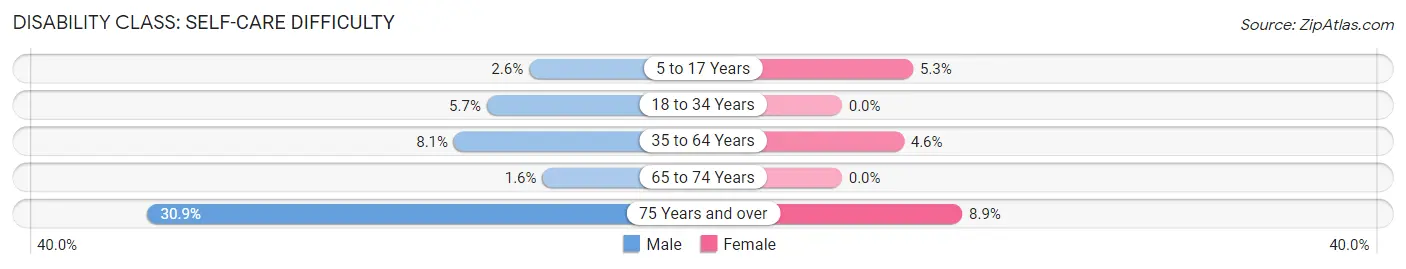
| Age Bracket | Male | Female |
| 5 to 17 Years | 21 (2.5%) | 36 (5.3%) |
| 18 to 34 Years | 56 (5.7%) | 0 (0.0%) |
| 35 to 64 Years | 115 (8.1%) | 74 (4.6%) |
| 65 to 74 Years | 8 (1.6%) | 0 (0.0%) |
| 75 Years and over | 204 (30.9%) | 52 (8.9%) |
Technology Access in Avon Park
Computing Device Access in Avon Park
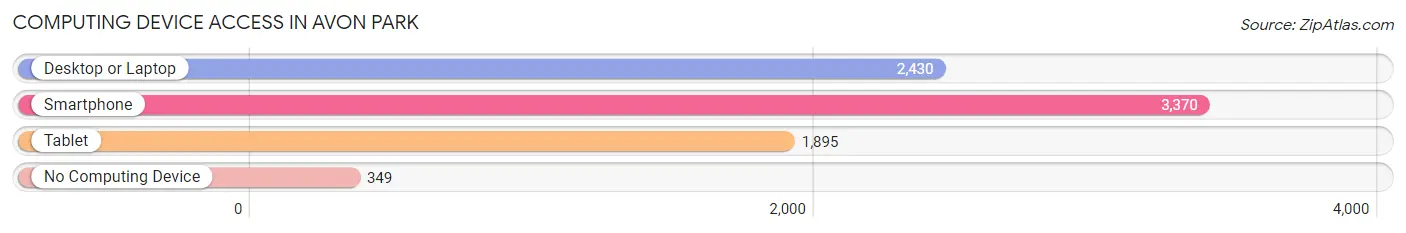
| Device Type | # Households | % Households |
| Desktop or Laptop | 2,430 | 59.6% |
| Smartphone | 3,370 | 82.6% |
| Tablet | 1,895 | 46.5% |
| No Computing Device | 349 | 8.6% |
| Total | 4,080 | 100.0% |
Internet Access in Avon Park
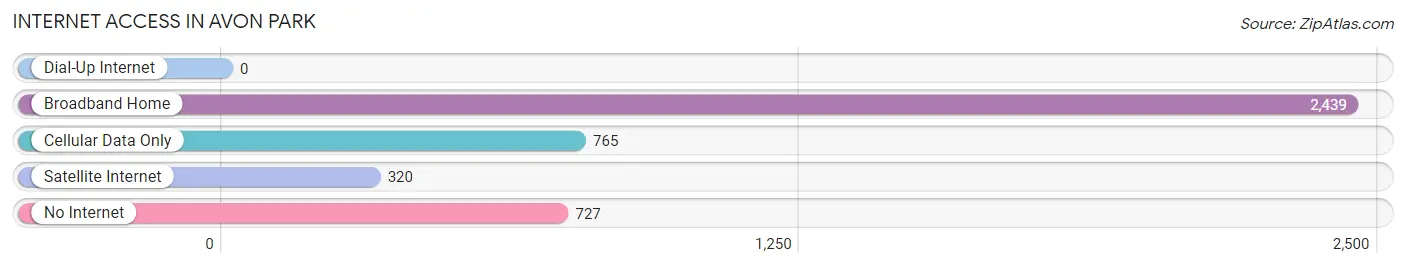
| Internet Type | # Households | % Households |
| Dial-Up Internet | 0 | 0.0% |
| Broadband Home | 2,439 | 59.8% |
| Cellular Data Only | 765 | 18.8% |
| Satellite Internet | 320 | 7.8% |
| No Internet | 727 | 17.8% |
| Total | 4,080 | 100.0% |
Avon Park Summary
Avon Park is a city located in Highlands County, Florida, United States. It is the oldest city in Highlands County, having been founded in 1884. The city is located in the heart of Central Florida, approximately 50 miles southeast of Tampa and 75 miles southwest of Orlando. As of the 2010 census, the population of Avon Park was 8,836.
History
Avon Park was founded in 1884 by a group of settlers from Ohio, led by Dr. J.C. Mendenhall. The settlers purchased the land from the State of Florida and named the town after Stratford-upon-Avon, England. The town was incorporated in 1911 and was the first city in Highlands County.
Avon Park was a popular winter resort destination in the early 20th century, with many wealthy northerners coming to the area to escape the cold winter months. The city was also home to a large citrus industry, with many groves and packing houses located in the area.
Geography
Avon Park is located at 27°37'N 81°30'W (27.619, -81.500). According to the United States Census Bureau, the city has a total area of 8.2 square miles (21.2 km2), of which 8.1 square miles (21.0 km2) is land and 0.1 square miles (0.2 km2) is water.
Economy
Avon Park is home to a variety of businesses, including manufacturing, retail, and service industries. The city is also home to South Florida State College, which provides educational opportunities to the local community.
Avon Park is also home to a number of tourist attractions, including the Avon Park Air Force Range, the Avon Park Historic District, and the Avon Park Lakes.
Demographics
As of the 2010 census, there were 8,836 people, 3,717 households, and 2,092 families residing in the city. The population density was 1,093.3 people per square mile (421.9/km2). There were 4,541 housing units at an average density of 562.3 per square mile (217.3/km2). The racial makeup of the city was 68.2% White, 22.3% African American, 0.5% Native American, 0.7% Asian, 0.1% Pacific Islander, 6.2% from other races, and 2.1% from two or more races. Hispanic or Latino of any race were 16.2% of the population.
There were 3,717 households, out of which 24.2% had children under the age of 18 living with them, 37.2% were married couples living together, 17.2% had a female householder with no husband present, and 39.7% were non-families. 33.2% of all households were made up of individuals, and 14.2% had someone living alone who was 65 years of age or older. The average household size was 2.35 and the average family size was 2.97.
In the city, the population was spread out, with 24.2% under the age of 18, 9.2% from 18 to 24, 24.2% from 25 to 44, 22.3% from 45 to 64, and 20.1% who were 65 years of age or older. The median age was 38 years. For every 100 females, there were 91.2 males. For every 100 females age 18 and over, there were 87.2 males.
The median income for a household in the city was $22,813, and the median income for a family was $27,917. Males had a median income of $25,938 versus $19,919 for females. The per capita income for the city was $13,945. About 18.2% of families and 22.2% of the population were below the poverty line, including 33.2% of those under age 18 and 11.2% of those age 65 or over.
Common Questions
What is Per Capita Income in Avon Park?
Per Capita income in Avon Park is $24,399.
What is the Median Family Income in Avon Park?
Median Family Income in Avon Park is $38,043.
What is the Median Household income in Avon Park?
Median Household Income in Avon Park is $35,340.
What is Income or Wage Gap in Avon Park?
Income or Wage Gap in Avon Park is 23.7%.
Women in Avon Park earn 76.3 cents for every dollar earned by a man.
What is Inequality or Gini Index in Avon Park?
Inequality or Gini Index in Avon Park is 0.49.
What is the Total Population of Avon Park?
Total Population of Avon Park is 9,789.
What is the Total Male Population of Avon Park?
Total Male Population of Avon Park is 4,835.
What is the Total Female Population of Avon Park?
Total Female Population of Avon Park is 4,954.
What is the Ratio of Males per 100 Females in Avon Park?
There are 97.60 Males per 100 Females in Avon Park.
What is the Ratio of Females per 100 Males in Avon Park?
There are 102.46 Females per 100 Males in Avon Park.
What is the Median Population Age in Avon Park?
Median Population Age in Avon Park is 42.9 Years.
What is the Average Family Size in Avon Park
Average Family Size in Avon Park is 2.9 People.
What is the Average Household Size in Avon Park
Average Household Size in Avon Park is 2.3 People.
How Large is the Labor Force in Avon Park?
There are 3,602 People in the Labor Forcein in Avon Park.
What is the Percentage of People in the Labor Force in Avon Park?
45.5% of People are in the Labor Force in Avon Park.
What is the Unemployment Rate in Avon Park?
Unemployment Rate in Avon Park is 11.7%.