Bethany, WV Map & Demographics
Bethany Map
Bethany Overview
$15,571
PER CAPITA INCOME
$69,861
AVG FAMILY INCOME
$63,214
AVG HOUSEHOLD INCOME
23.9%
WAGE / INCOME GAP [ % ]
76.1¢/ $1
WAGE / INCOME GAP [ $ ]
0.38
INEQUALITY / GINI INDEX
1,125
TOTAL POPULATION
647
MALE POPULATION
478
FEMALE POPULATION
135.36
MALES / 100 FEMALES
73.88
FEMALES / 100 MALES
20.1
MEDIAN AGE
2.8
AVG FAMILY SIZE
2.1
AVG HOUSEHOLD SIZE
475
LABOR FORCE [ PEOPLE ]
45.0%
PERCENT IN LABOR FORCE
5.1%
UNEMPLOYMENT RATE
Bethany Zip Codes
Bethany Area Codes
Income in Bethany
Income Overview in Bethany
Per Capita Income in Bethany is $15,571, while median incomes of families and households are $69,861 and $63,214 respectively.
| Characteristic | Number | Measure |
| Per Capita Income | 1,125 | $15,571 |
| Median Family Income | 101 | $69,861 |
| Mean Family Income | 101 | $83,658 |
| Median Household Income | 176 | $63,214 |
| Mean Household Income | 176 | $73,111 |
| Income Deficit | 101 | $0 |
| Wage / Income Gap (%) | 1,125 | 23.90% |
| Wage / Income Gap ($) | 1,125 | 76.10¢ per $1 |
| Gini / Inequality Index | 1,125 | 0.38 |
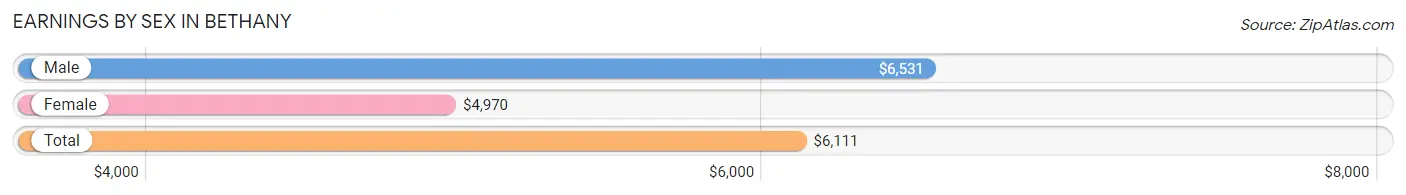
Earnings by Sex in Bethany
Average Earnings in Bethany are $6,111, $6,531 for men and $4,970 for women, a difference of 23.9%.
| Sex | Number | Average Earnings |
| Male | 442 (57.0%) | $6,531 |
| Female | 334 (43.0%) | $4,970 |
| Total | 776 (100.0%) | $6,111 |
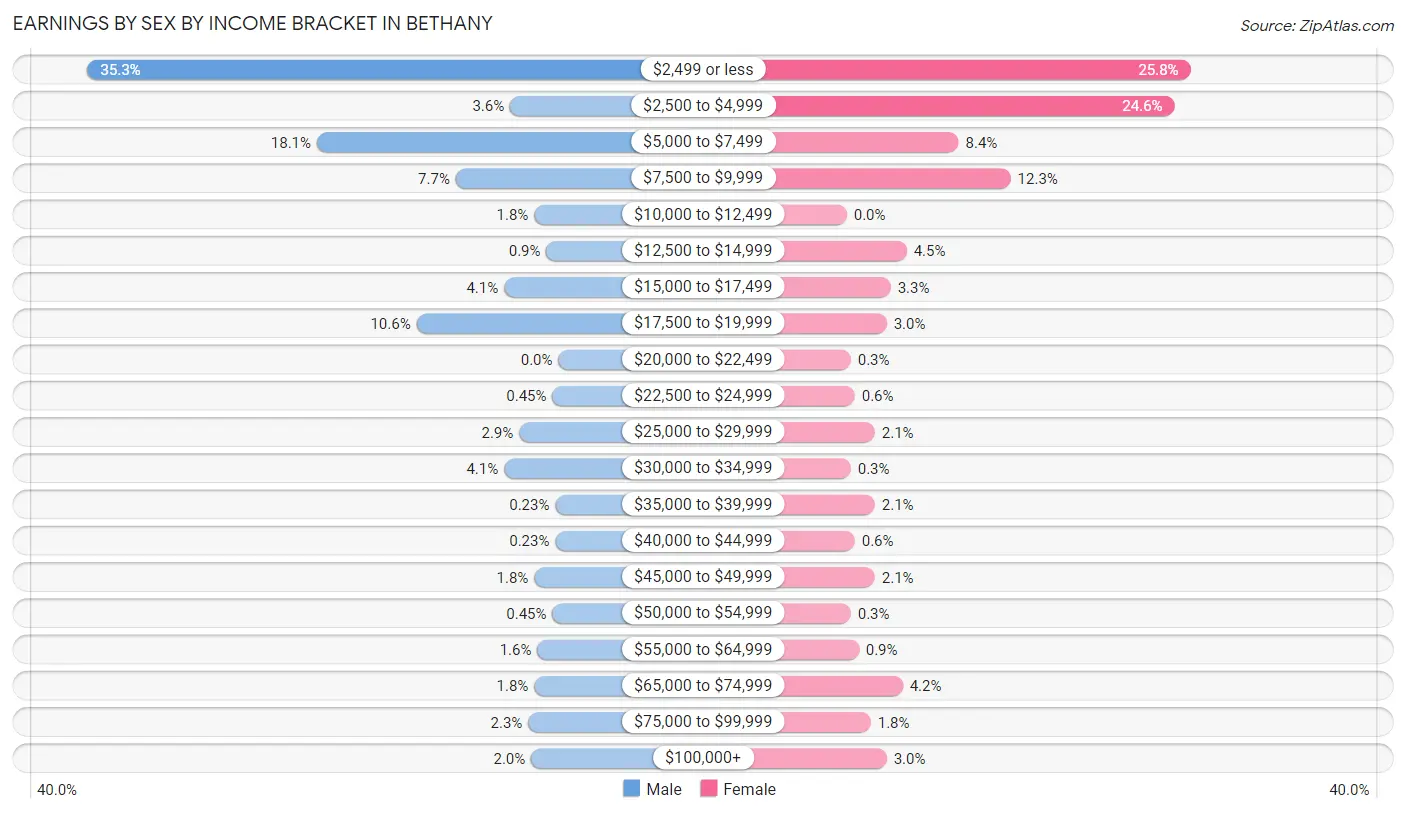
Earnings by Sex by Income Bracket in Bethany
The most common earnings brackets in Bethany are $2,499 or less for men (156 | 35.3%) and $2,499 or less for women (86 | 25.8%).
| Income | Male | Female |
| $2,499 or less | 156 (35.3%) | 86 (25.8%) |
| $2,500 to $4,999 | 16 (3.6%) | 82 (24.5%) |
| $5,000 to $7,499 | 80 (18.1%) | 28 (8.4%) |
| $7,500 to $9,999 | 34 (7.7%) | 41 (12.3%) |
| $10,000 to $12,499 | 8 (1.8%) | 0 (0.0%) |
| $12,500 to $14,999 | 4 (0.9%) | 15 (4.5%) |
| $15,000 to $17,499 | 18 (4.1%) | 11 (3.3%) |
| $17,500 to $19,999 | 47 (10.6%) | 10 (3.0%) |
| $20,000 to $22,499 | 0 (0.0%) | 1 (0.3%) |
| $22,500 to $24,999 | 2 (0.4%) | 2 (0.6%) |
| $25,000 to $29,999 | 13 (2.9%) | 7 (2.1%) |
| $30,000 to $34,999 | 18 (4.1%) | 1 (0.3%) |
| $35,000 to $39,999 | 1 (0.2%) | 7 (2.1%) |
| $40,000 to $44,999 | 1 (0.2%) | 2 (0.6%) |
| $45,000 to $49,999 | 8 (1.8%) | 7 (2.1%) |
| $50,000 to $54,999 | 2 (0.4%) | 1 (0.3%) |
| $55,000 to $64,999 | 7 (1.6%) | 3 (0.9%) |
| $65,000 to $74,999 | 8 (1.8%) | 14 (4.2%) |
| $75,000 to $99,999 | 10 (2.3%) | 6 (1.8%) |
| $100,000+ | 9 (2.0%) | 10 (3.0%) |
| Total | 442 (100.0%) | 334 (100.0%) |
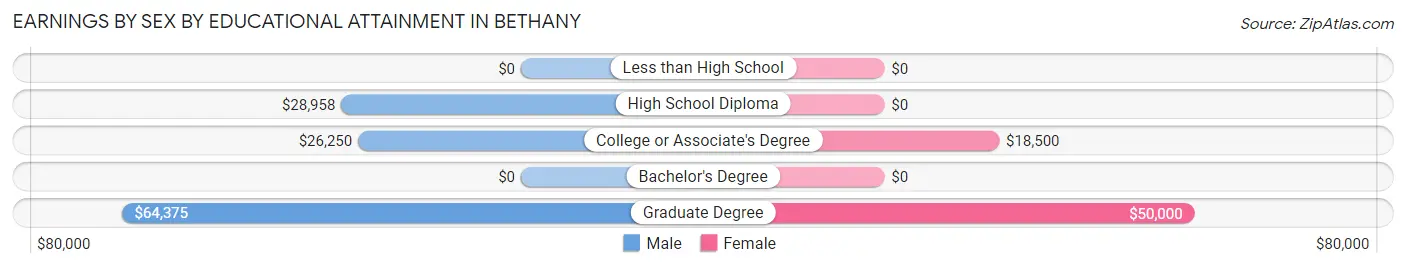
Earnings by Sex by Educational Attainment in Bethany
Average earnings in Bethany are $49,167 for men and $21,250 for women, a difference of 56.8%. Men with an educational attainment of graduate degree enjoy the highest average annual earnings of $64,375, while those with college or associate's degree education earn the least with $26,250. Women with an educational attainment of graduate degree earn the most with the average annual earnings of $50,000, while those with college or associate's degree education have the smallest earnings of $18,500.
| Educational Attainment | Male Income | Female Income |
| Less than High School | - | - |
| High School Diploma | $28,958 | $0 |
| College or Associate's Degree | $26,250 | $18,500 |
| Bachelor's Degree | - | - |
| Graduate Degree | $64,375 | $50,000 |
| Total | $49,167 | $21,250 |
Family Income in Bethany
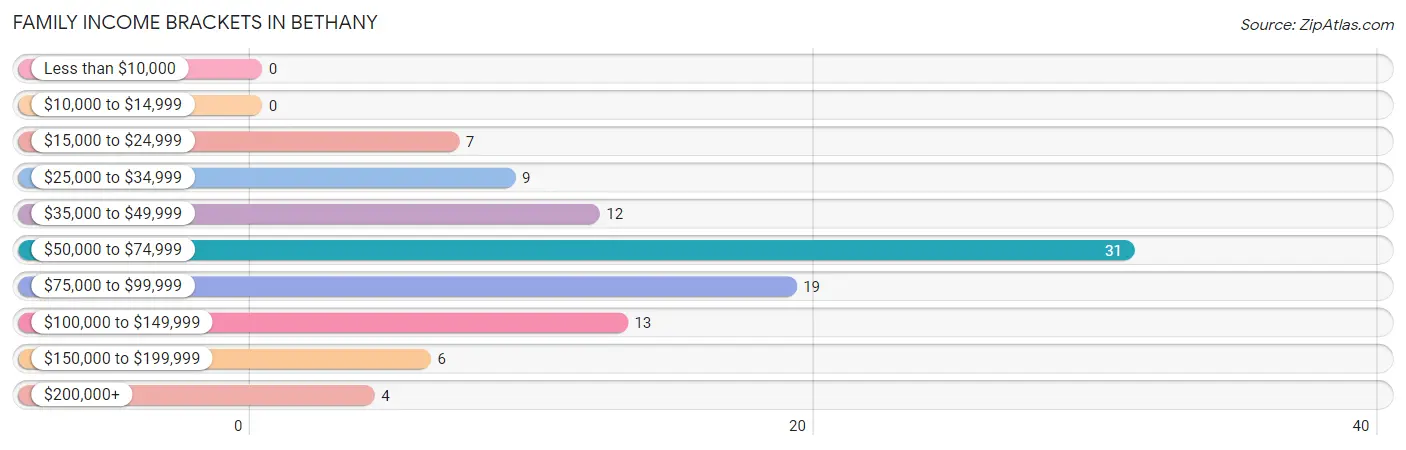
Family Income Brackets in Bethany
According to the Bethany family income data, there are 31 families falling into the $50,000 to $74,999 income range, which is the most common income bracket and makes up 30.7% of all families.
| Income Bracket | # Families | % Families |
| Less than $10,000 | 0 | 0.0% |
| $10,000 to $14,999 | 0 | 0.0% |
| $15,000 to $24,999 | 7 | 6.9% |
| $25,000 to $34,999 | 9 | 8.9% |
| $35,000 to $49,999 | 12 | 11.9% |
| $50,000 to $74,999 | 31 | 30.7% |
| $75,000 to $99,999 | 19 | 18.8% |
| $100,000 to $149,999 | 13 | 12.9% |
| $150,000 to $199,999 | 6 | 5.9% |
| $200,000+ | 4 | 4.0% |
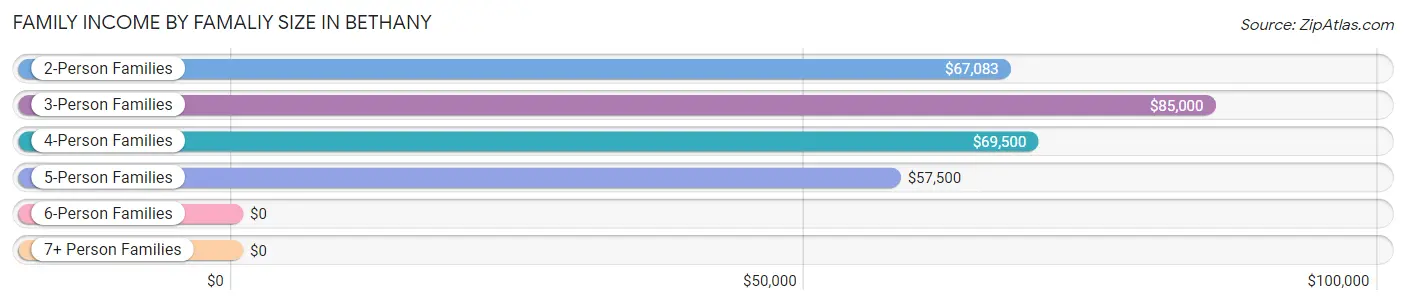
Family Income by Famaliy Size in Bethany
3-person families (16 | 15.8%) account for the highest median family income in Bethany with $85,000 per family, while 2-person families (66 | 65.3%) have the highest median income of $33,542 per family member.
| Income Bracket | # Families | Median Income |
| 2-Person Families | 66 (65.3%) | $67,083 |
| 3-Person Families | 16 (15.8%) | $85,000 |
| 4-Person Families | 8 (7.9%) | $69,500 |
| 5-Person Families | 8 (7.9%) | $57,500 |
| 6-Person Families | 3 (3.0%) | $0 |
| 7+ Person Families | 0 (0.0%) | $0 |
| Total | 101 (100.0%) | $69,861 |
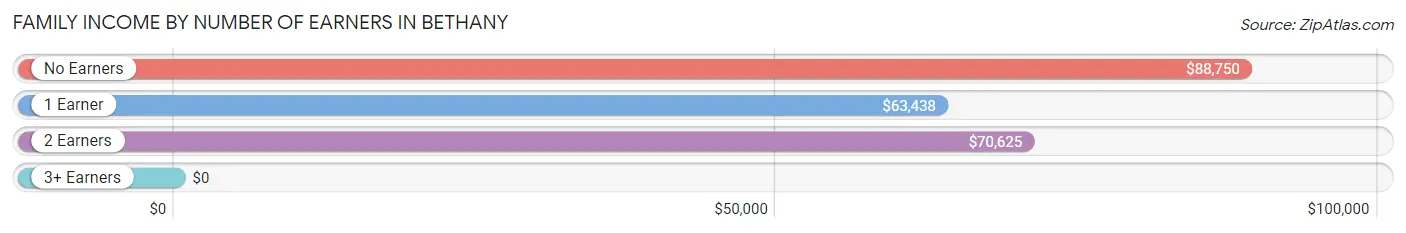
Family Income by Number of Earners in Bethany
| Number of Earners | # Families | Median Income |
| No Earners | 12 (11.9%) | $88,750 |
| 1 Earner | 39 (38.6%) | $63,438 |
| 2 Earners | 48 (47.5%) | $70,625 |
| 3+ Earners | 2 (2.0%) | $0 |
| Total | 101 (100.0%) | $69,861 |
Household Income in Bethany
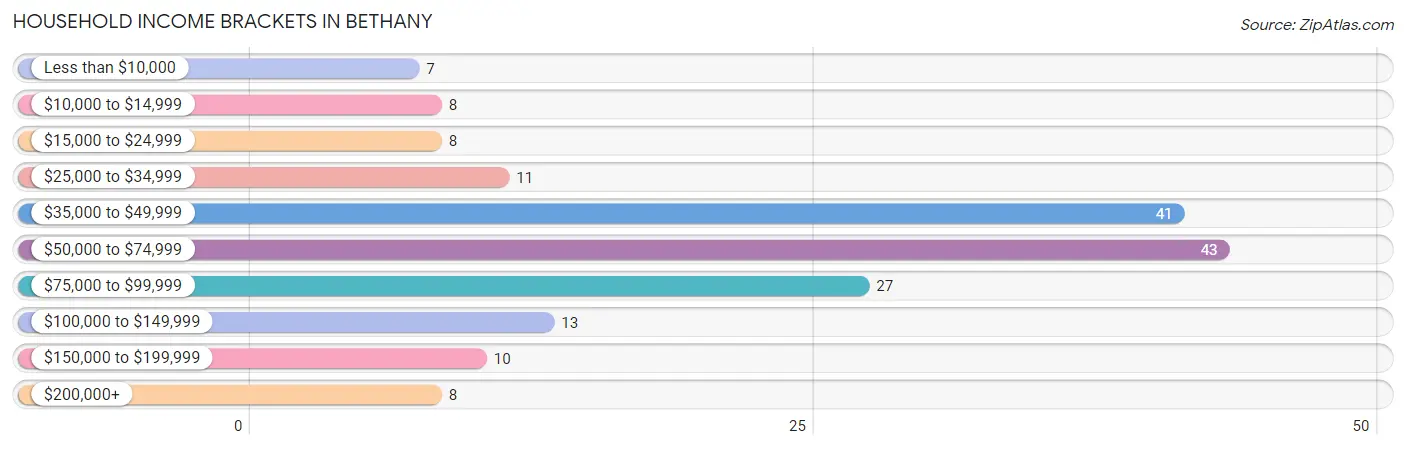
Household Income Brackets in Bethany
With 43 households falling in the category, the $50,000 to $74,999 income range is the most frequent in Bethany, accounting for 24.4% of all households. In contrast, only 7 households (4.0%) fall into the less than $10,000 income bracket, making it the least populous group.
| Income Bracket | # Households | % Households |
| Less than $10,000 | 7 | 4.0% |
| $10,000 to $14,999 | 8 | 4.5% |
| $15,000 to $24,999 | 8 | 4.5% |
| $25,000 to $34,999 | 11 | 6.3% |
| $35,000 to $49,999 | 41 | 23.3% |
| $50,000 to $74,999 | 43 | 24.4% |
| $75,000 to $99,999 | 27 | 15.3% |
| $100,000 to $149,999 | 13 | 7.4% |
| $150,000 to $199,999 | 10 | 5.7% |
| $200,000+ | 8 | 4.5% |
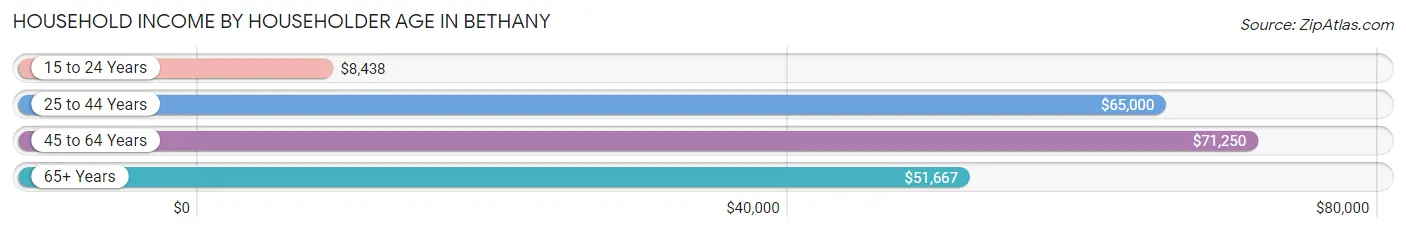
Household Income by Householder Age in Bethany
The median household income in Bethany is $63,214, with the highest median household income of $71,250 found in the 45 to 64 years age bracket for the primary householder. A total of 65 households (36.9%) fall into this category. Meanwhile, the 15 to 24 years age bracket for the primary householder has the lowest median household income of $8,438, with 5 households (2.8%) in this group.
| Income Bracket | # Households | Median Income |
| 15 to 24 Years | 5 (2.8%) | $8,438 |
| 25 to 44 Years | 34 (19.3%) | $65,000 |
| 45 to 64 Years | 65 (36.9%) | $71,250 |
| 65+ Years | 72 (40.9%) | $51,667 |
| Total | 176 (100.0%) | $63,214 |
Poverty in Bethany
Income Below Poverty by Sex and Age in Bethany
With 4.9% poverty level for males and 11.2% for females among the residents of Bethany, 18 to 24 year old males and 25 to 34 year old females are the most vulnerable to poverty, with 5 males (33.3%) and 6 females (27.3%) in their respective age groups living below the poverty level.
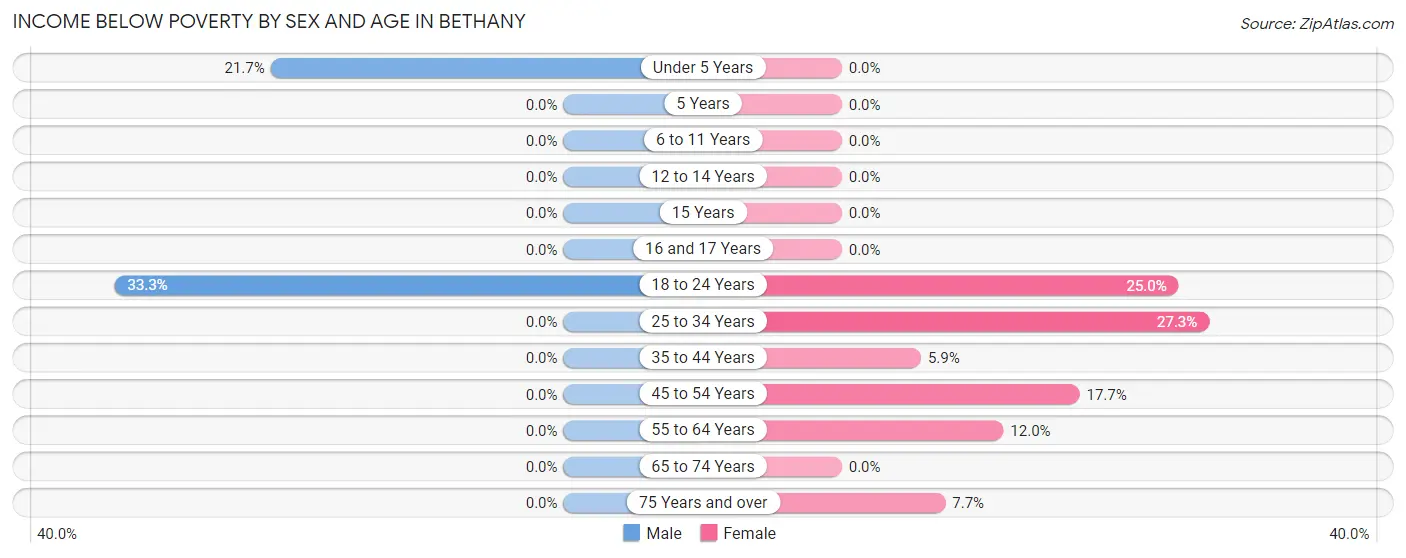
| Age Bracket | Male | Female |
| Under 5 Years | 5 (21.7%) | 0 (0.0%) |
| 5 Years | 0 (0.0%) | 0 (0.0%) |
| 6 to 11 Years | 0 (0.0%) | 0 (0.0%) |
| 12 to 14 Years | 0 (0.0%) | 0 (0.0%) |
| 15 Years | 0 (0.0%) | 0 (0.0%) |
| 16 and 17 Years | 0 (0.0%) | 0 (0.0%) |
| 18 to 24 Years | 5 (33.3%) | 1 (25.0%) |
| 25 to 34 Years | 0 (0.0%) | 6 (27.3%) |
| 35 to 44 Years | 0 (0.0%) | 1 (5.9%) |
| 45 to 54 Years | 0 (0.0%) | 6 (17.6%) |
| 55 to 64 Years | 0 (0.0%) | 3 (12.0%) |
| 65 to 74 Years | 0 (0.0%) | 0 (0.0%) |
| 75 Years and over | 0 (0.0%) | 1 (7.7%) |
| Total | 10 (4.9%) | 18 (11.2%) |
Income Above Poverty by Sex and Age in Bethany
According to the poverty statistics in Bethany, males aged 5 years and females aged under 5 years are the age groups that are most secure financially, with 100.0% of males and 100.0% of females in these age groups living above the poverty line.
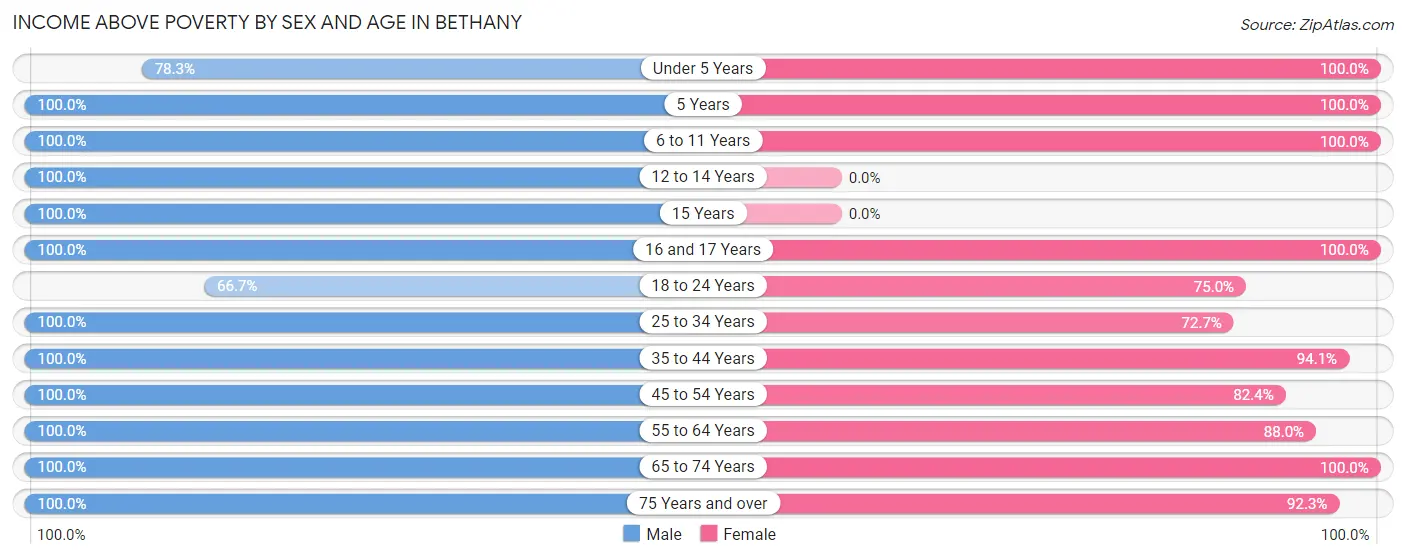
| Age Bracket | Male | Female |
| Under 5 Years | 18 (78.3%) | 9 (100.0%) |
| 5 Years | 1 (100.0%) | 2 (100.0%) |
| 6 to 11 Years | 15 (100.0%) | 13 (100.0%) |
| 12 to 14 Years | 1 (100.0%) | 0 (0.0%) |
| 15 Years | 2 (100.0%) | 0 (0.0%) |
| 16 and 17 Years | 2 (100.0%) | 1 (100.0%) |
| 18 to 24 Years | 10 (66.7%) | 3 (75.0%) |
| 25 to 34 Years | 13 (100.0%) | 16 (72.7%) |
| 35 to 44 Years | 27 (100.0%) | 16 (94.1%) |
| 45 to 54 Years | 11 (100.0%) | 28 (82.4%) |
| 55 to 64 Years | 33 (100.0%) | 22 (88.0%) |
| 65 to 74 Years | 26 (100.0%) | 21 (100.0%) |
| 75 Years and over | 36 (100.0%) | 12 (92.3%) |
| Total | 195 (95.1%) | 143 (88.8%) |
Income Below Poverty Among Married-Couple Families in Bethany
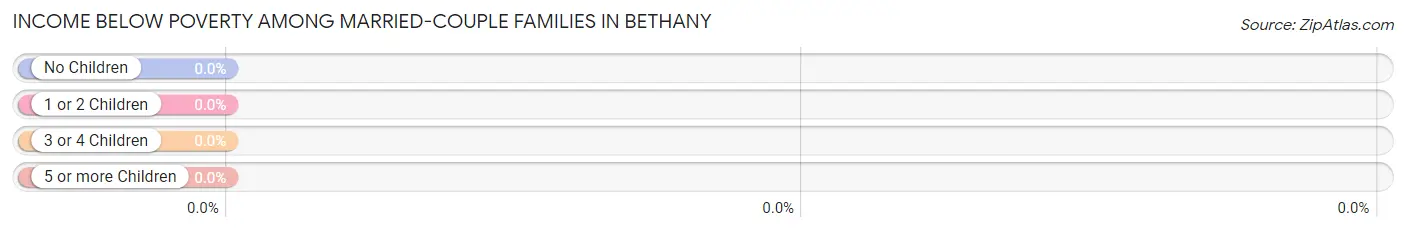
| Children | Above Poverty | Below Poverty |
| No Children | 59 (100.0%) | 0 (0.0%) |
| 1 or 2 Children | 11 (100.0%) | 0 (0.0%) |
| 3 or 4 Children | 10 (100.0%) | 0 (0.0%) |
| 5 or more Children | 0 (0.0%) | 0 (0.0%) |
| Total | 80 (100.0%) | 0 (0.0%) |
Income Below Poverty Among Single-Parent Households in Bethany
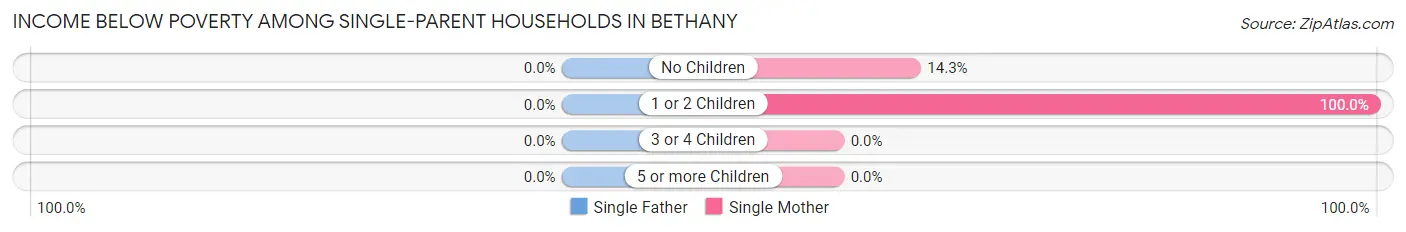
| Children | Single Father | Single Mother |
| No Children | 0 (0.0%) | 1 (14.3%) |
| 1 or 2 Children | 0 (0.0%) | 6 (100.0%) |
| 3 or 4 Children | 0 (0.0%) | 0 (0.0%) |
| 5 or more Children | 0 (0.0%) | 0 (0.0%) |
| Total | 0 (0.0%) | 7 (53.8%) |
Income Below Poverty Among Married-Couple vs Single-Parent Households in Bethany
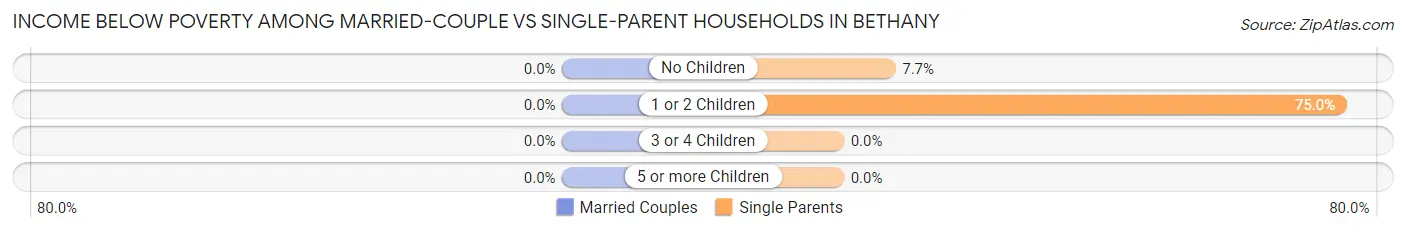
| Children | Married-Couple Families | Single-Parent Households |
| No Children | 0 (0.0%) | 1 (7.7%) |
| 1 or 2 Children | 0 (0.0%) | 6 (75.0%) |
| 3 or 4 Children | 0 (0.0%) | 0 (0.0%) |
| 5 or more Children | 0 (0.0%) | 0 (0.0%) |
| Total | 0 (0.0%) | 7 (33.3%) |
Race in Bethany
The most populous races in Bethany are White / Caucasian (832 | 74.0%), Black / African American (226 | 20.1%), and Two or more Races (64 | 5.7%).
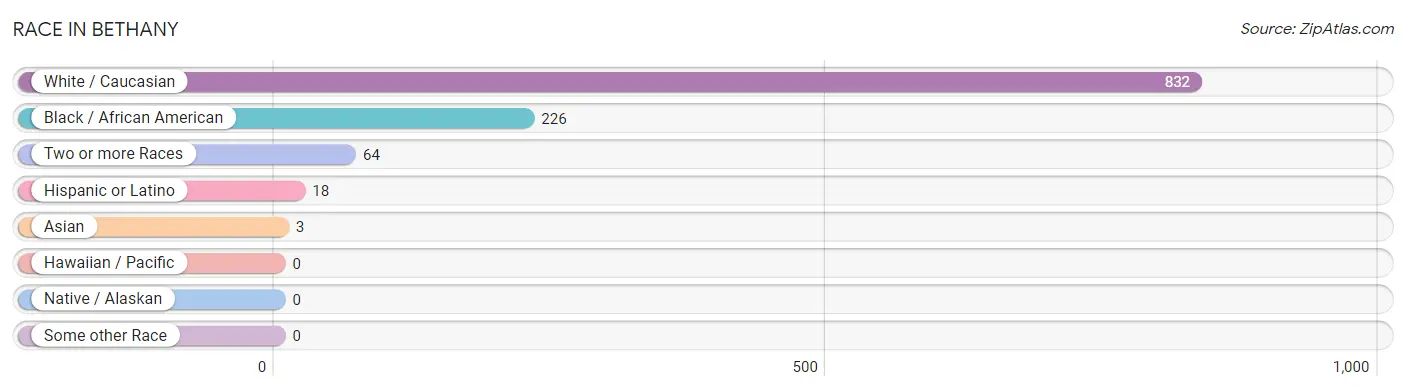
| Race | # Population | % Population |
| Asian | 3 | 0.3% |
| Black / African American | 226 | 20.1% |
| Hawaiian / Pacific | 0 | 0.0% |
| Hispanic or Latino | 18 | 1.6% |
| Native / Alaskan | 0 | 0.0% |
| White / Caucasian | 832 | 74.0% |
| Two or more Races | 64 | 5.7% |
| Some other Race | 0 | 0.0% |
| Total | 1,125 | 100.0% |
Ancestry in Bethany
The most populous ancestries reported in Bethany are German (180 | 16.0%), English (112 | 10.0%), Italian (109 | 9.7%), Irish (97 | 8.6%), and Czech (24 | 2.1%), together accounting for 46.4% of all Bethany residents.
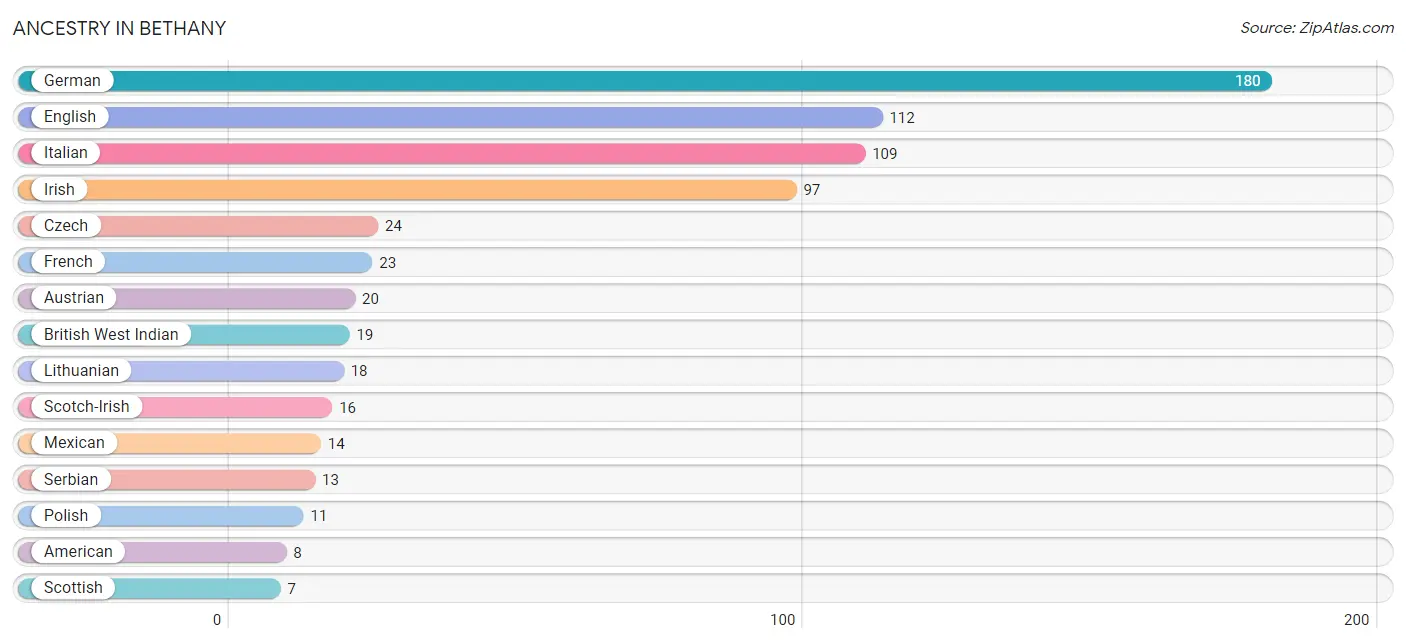
| Ancestry | # Population | % Population |
| American | 8 | 0.7% |
| Arab | 4 | 0.4% |
| Armenian | 1 | 0.1% |
| Austrian | 20 | 1.8% |
| Bhutanese | 3 | 0.3% |
| British | 3 | 0.3% |
| British West Indian | 19 | 1.7% |
| Czech | 24 | 2.1% |
| Dutch | 2 | 0.2% |
| English | 112 | 10.0% |
| Finnish | 1 | 0.1% |
| French | 23 | 2.0% |
| German | 180 | 16.0% |
| Ghanaian | 3 | 0.3% |
| Guyanese | 4 | 0.4% |
| Irish | 97 | 8.6% |
| Italian | 109 | 9.7% |
| Lebanese | 3 | 0.3% |
| Lithuanian | 18 | 1.6% |
| Mexican | 14 | 1.2% |
| Norwegian | 1 | 0.1% |
| Palestinian | 1 | 0.1% |
| Polish | 11 | 1.0% |
| Puerto Rican | 1 | 0.1% |
| Scandinavian | 6 | 0.5% |
| Scotch-Irish | 16 | 1.4% |
| Scottish | 7 | 0.6% |
| Serbian | 13 | 1.2% |
| Slovak | 2 | 0.2% |
| Slovene | 2 | 0.2% |
| Spaniard | 1 | 0.1% |
| Spanish | 2 | 0.2% |
| Subsaharan African | 3 | 0.3% |
| Swedish | 3 | 0.3% |
| Swiss | 2 | 0.2% |
| Thai | 1 | 0.1% |
| Welsh | 4 | 0.4% | View All 37 Rows |
Immigrants in Bethany
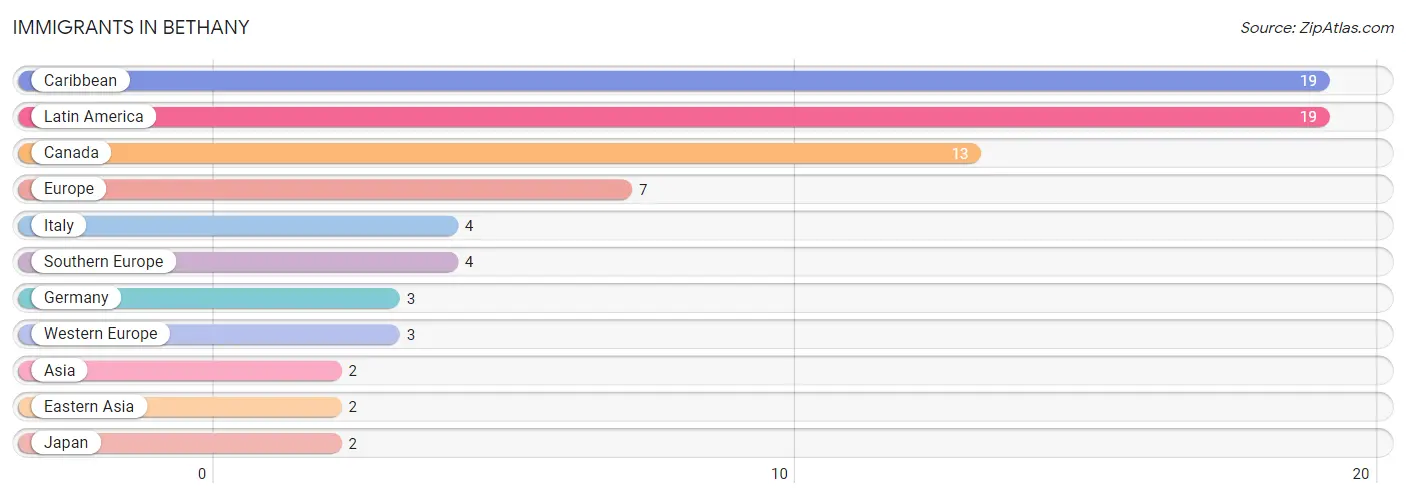
The most numerous immigrant groups reported in Bethany came from Caribbean (19 | 1.7%), Latin America (19 | 1.7%), Canada (13 | 1.2%), Europe (7 | 0.6%), and Italy (4 | 0.4%), together accounting for 5.5% of all Bethany residents.
| Immigration Origin | # Population | % Population |
| Asia | 2 | 0.2% |
| Canada | 13 | 1.2% |
| Caribbean | 19 | 1.7% |
| Eastern Asia | 2 | 0.2% |
| Europe | 7 | 0.6% |
| Germany | 3 | 0.3% |
| Italy | 4 | 0.4% |
| Japan | 2 | 0.2% |
| Latin America | 19 | 1.7% |
| Southern Europe | 4 | 0.4% |
| Western Europe | 3 | 0.3% | View All 11 Rows |
Sex and Age in Bethany
Sex and Age in Bethany
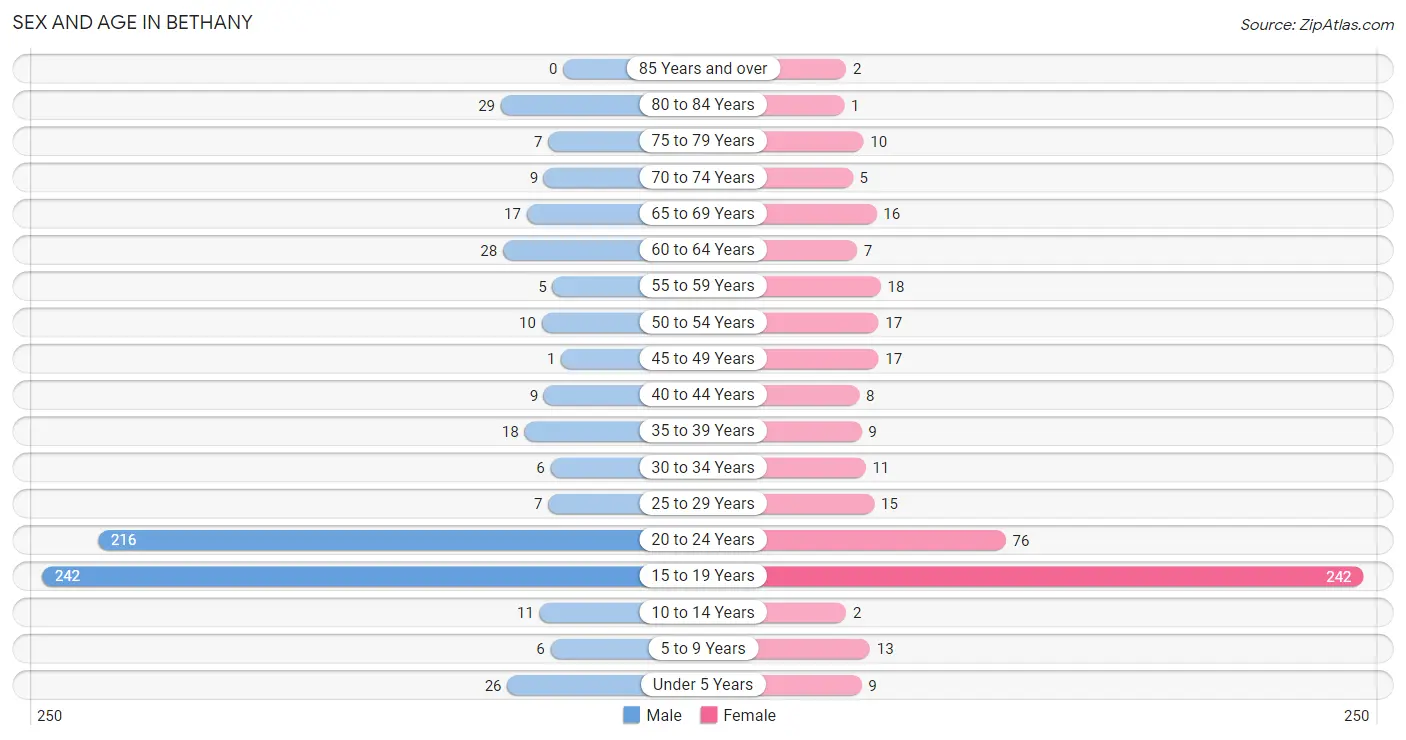
The most populous age groups in Bethany are 15 to 19 Years (242 | 37.4%) for men and 15 to 19 Years (242 | 50.6%) for women.
| Age Bracket | Male | Female |
| Under 5 Years | 26 (4.0%) | 9 (1.9%) |
| 5 to 9 Years | 6 (0.9%) | 13 (2.7%) |
| 10 to 14 Years | 11 (1.7%) | 2 (0.4%) |
| 15 to 19 Years | 242 (37.4%) | 242 (50.6%) |
| 20 to 24 Years | 216 (33.4%) | 76 (15.9%) |
| 25 to 29 Years | 7 (1.1%) | 15 (3.1%) |
| 30 to 34 Years | 6 (0.9%) | 11 (2.3%) |
| 35 to 39 Years | 18 (2.8%) | 9 (1.9%) |
| 40 to 44 Years | 9 (1.4%) | 8 (1.7%) |
| 45 to 49 Years | 1 (0.2%) | 17 (3.6%) |
| 50 to 54 Years | 10 (1.5%) | 17 (3.6%) |
| 55 to 59 Years | 5 (0.8%) | 18 (3.8%) |
| 60 to 64 Years | 28 (4.3%) | 7 (1.5%) |
| 65 to 69 Years | 17 (2.6%) | 16 (3.4%) |
| 70 to 74 Years | 9 (1.4%) | 5 (1.1%) |
| 75 to 79 Years | 7 (1.1%) | 10 (2.1%) |
| 80 to 84 Years | 29 (4.5%) | 1 (0.2%) |
| 85 Years and over | 0 (0.0%) | 2 (0.4%) |
| Total | 647 (100.0%) | 478 (100.0%) |
Families and Households in Bethany
Median Family Size in Bethany
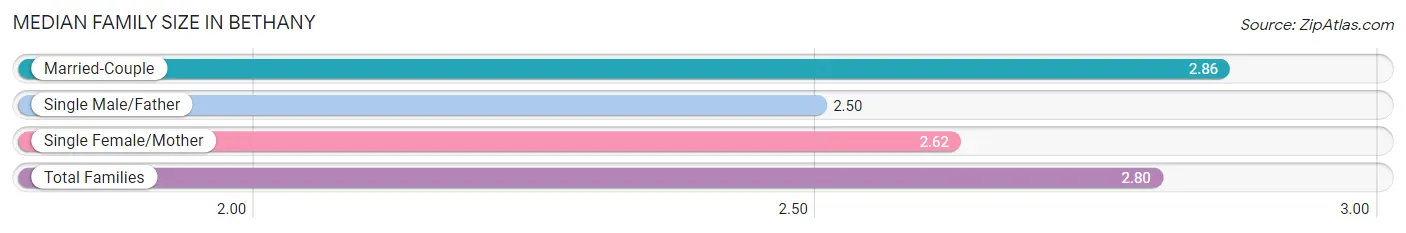
The median family size in Bethany is 2.80 persons per family, with married-couple families (80 | 79.2%) accounting for the largest median family size of 2.86 persons per family. On the other hand, single male/father families (8 | 7.9%) represent the smallest median family size with 2.50 persons per family.
| Family Type | # Families | Family Size |
| Married-Couple | 80 (79.2%) | 2.86 |
| Single Male/Father | 8 (7.9%) | 2.50 |
| Single Female/Mother | 13 (12.9%) | 2.62 |
| Total Families | 101 (100.0%) | 2.80 |
Median Household Size in Bethany
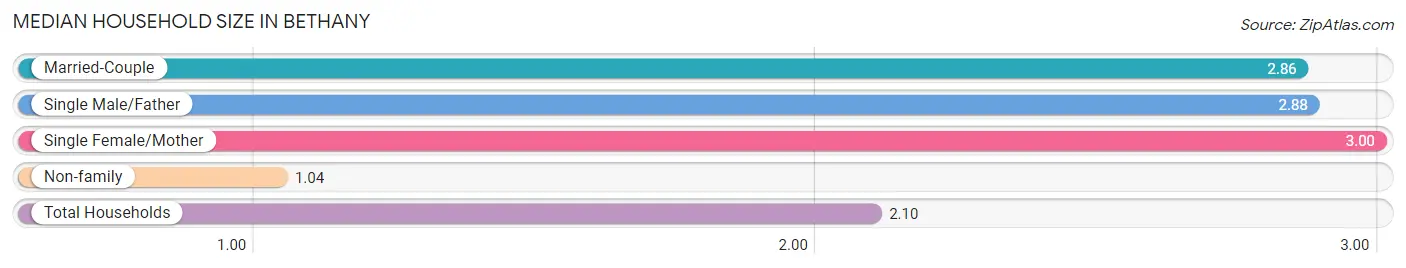
The median household size in Bethany is 2.10 persons per household, with single female/mother households (13 | 7.4%) accounting for the largest median household size of 3 persons per household. non-family households (75 | 42.6%) represent the smallest median household size with 1.04 persons per household.
| Household Type | # Households | Household Size |
| Married-Couple | 80 (45.5%) | 2.86 |
| Single Male/Father | 8 (4.5%) | 2.88 |
| Single Female/Mother | 13 (7.4%) | 3.00 |
| Non-family | 75 (42.6%) | 1.04 |
| Total Households | 176 (100.0%) | 2.10 |
Household Size by Marriage Status in Bethany
Out of a total of 176 households in Bethany, 101 (57.4%) are family households, while 75 (42.6%) are nonfamily households. The most numerous type of family households are 2-person households, comprising 57, and the most common type of nonfamily households are 1-person households, comprising 72.
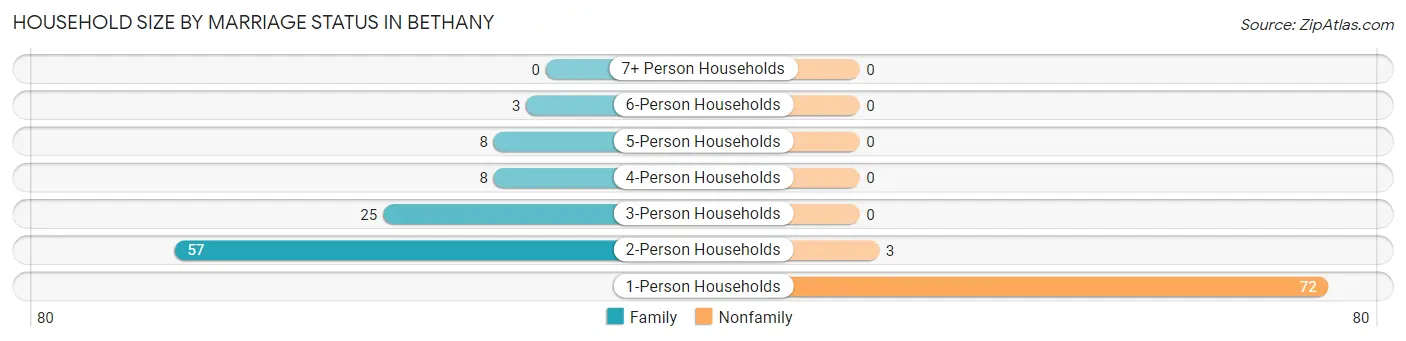
| Household Size | Family Households | Nonfamily Households |
| 1-Person Households | - | 72 (40.9%) |
| 2-Person Households | 57 (32.4%) | 3 (1.7%) |
| 3-Person Households | 25 (14.2%) | 0 (0.0%) |
| 4-Person Households | 8 (4.5%) | 0 (0.0%) |
| 5-Person Households | 8 (4.5%) | 0 (0.0%) |
| 6-Person Households | 3 (1.7%) | 0 (0.0%) |
| 7+ Person Households | 0 (0.0%) | 0 (0.0%) |
| Total | 101 (57.4%) | 75 (42.6%) |
Female Fertility in Bethany
Fertility by Age in Bethany
Average fertility rate in Bethany is 3.0 births per 1,000 women. Women in the age bracket of 20 to 34 years have the highest fertility rate with 10.0 births per 1,000 women. Women in the age bracket of 20 to 34 years acount for 100.0% of all women with births.
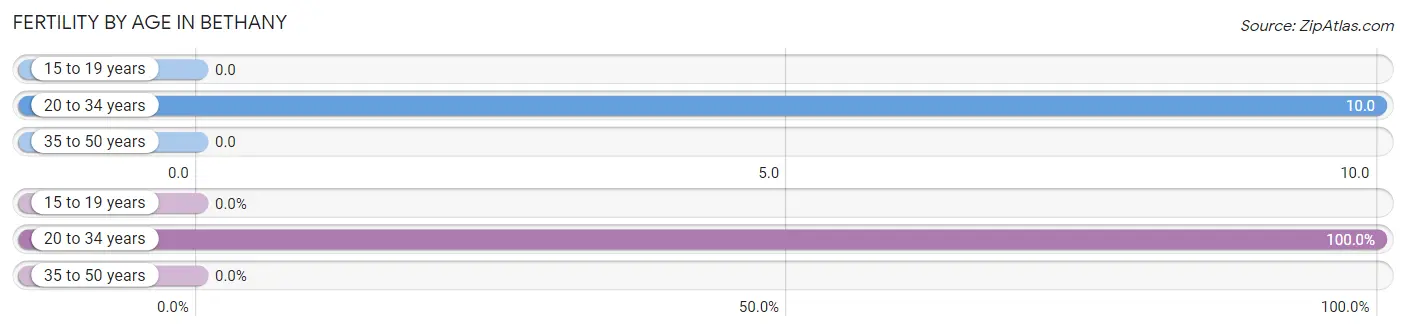
| Age Bracket | Women with Births | Births / 1,000 Women |
| 15 to 19 years | 0 (0.0%) | 0.0 |
| 20 to 34 years | 1 (100.0%) | 10.0 |
| 35 to 50 years | 0 (0.0%) | 0.0 |
| Total | 1 (100.0%) | 3.0 |
Fertility by Age by Marriage Status in Bethany
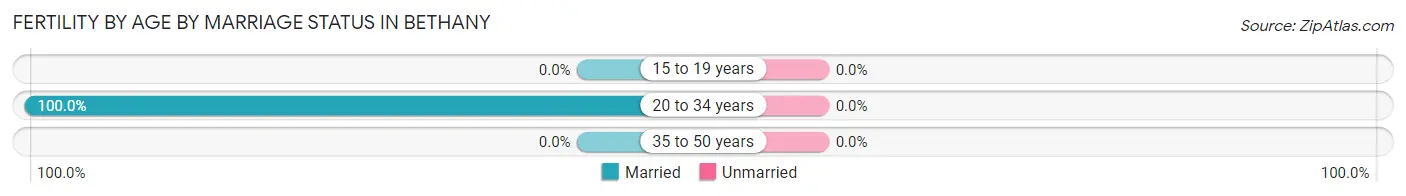
| Age Bracket | Married | Unmarried |
| 15 to 19 years | 0 (0.0%) | 0 (0.0%) |
| 20 to 34 years | 1 (100.0%) | 0 (0.0%) |
| 35 to 50 years | 0 (0.0%) | 0 (0.0%) |
| Total | 1 (100.0%) | 0 (0.0%) |
Fertility by Education in Bethany
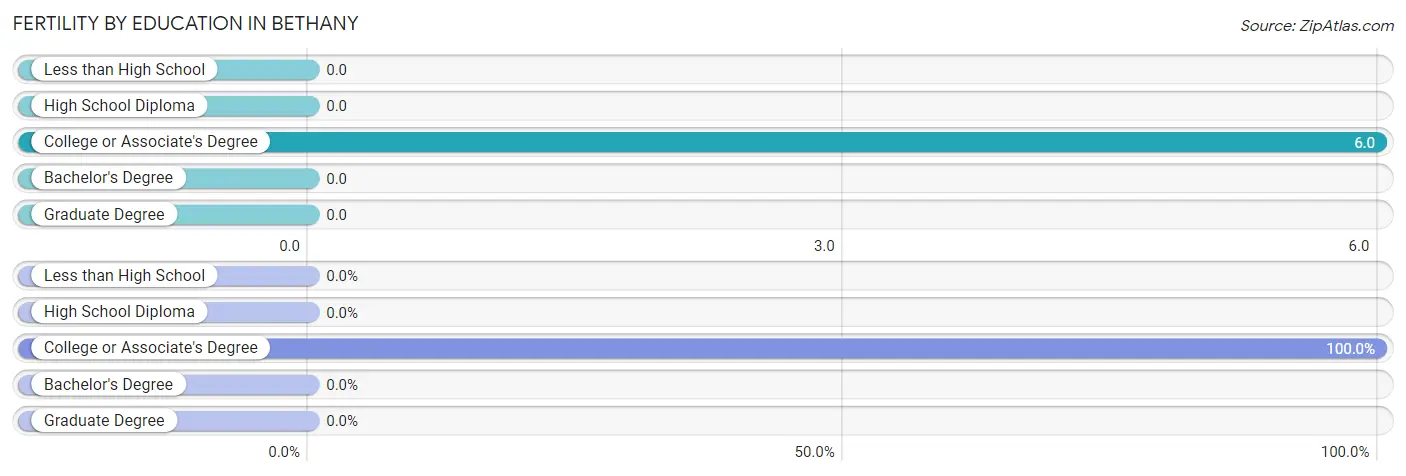
| Educational Attainment | Women with Births | Births / 1,000 Women |
| Less than High School | 0 (0.0%) | 0.0 |
| High School Diploma | 0 (0.0%) | 0.0 |
| College or Associate's Degree | 1 (100.0%) | 6.0 |
| Bachelor's Degree | 0 (0.0%) | 0.0 |
| Graduate Degree | 0 (0.0%) | 0.0 |
| Total | 1 (100.0%) | 3.0 |
Fertility by Education by Marriage Status in Bethany
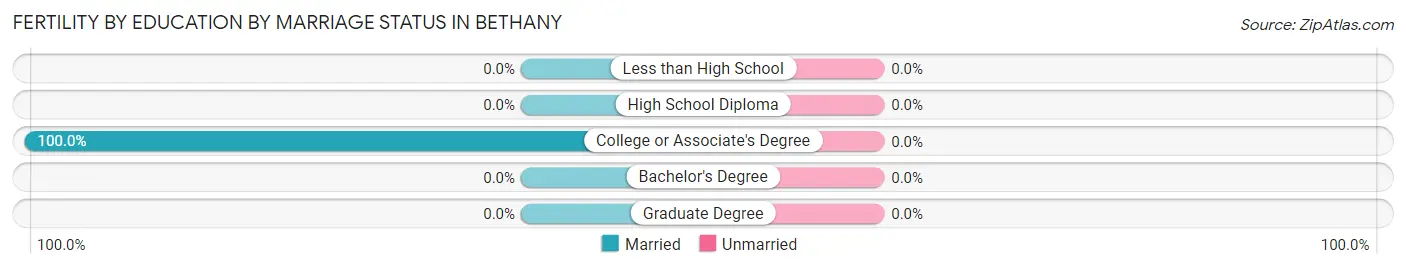
| Educational Attainment | Married | Unmarried |
| Less than High School | 0 (0.0%) | 0 (0.0%) |
| High School Diploma | 0 (0.0%) | 0 (0.0%) |
| College or Associate's Degree | 1 (100.0%) | 0 (0.0%) |
| Bachelor's Degree | 0 (0.0%) | 0 (0.0%) |
| Graduate Degree | 0 (0.0%) | 0 (0.0%) |
| Total | 1 (100.0%) | 0 (0.0%) |
Employment Characteristics in Bethany
Employment by Class of Employer in Bethany
Among the 410 employed individuals in Bethany, private company employees (250 | 61.0%), not-for-profit organizations (85 | 20.7%), and state government employees (40 | 9.8%) make up the most common classes of employment.
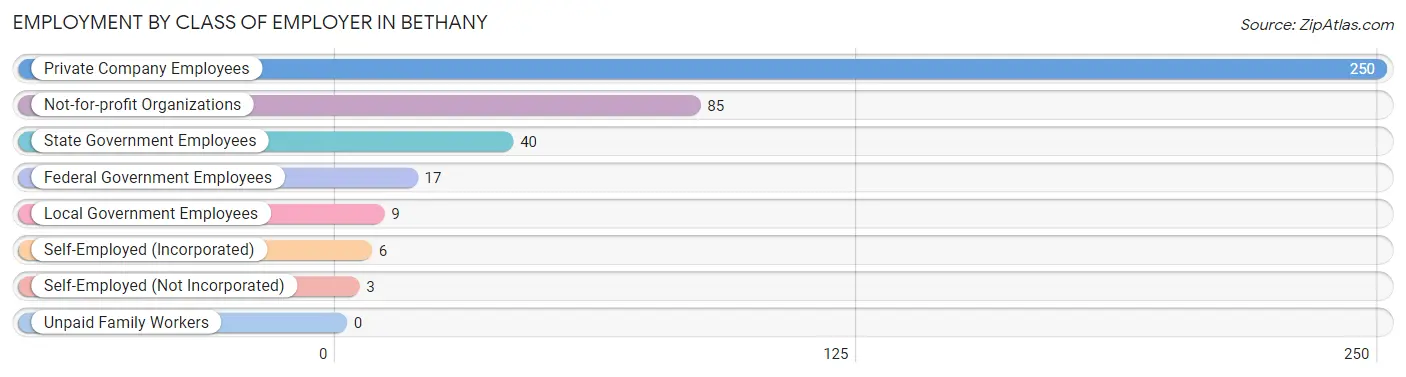
| Employer Class | # Employees | % Employees |
| Private Company Employees | 250 | 61.0% |
| Self-Employed (Incorporated) | 6 | 1.5% |
| Self-Employed (Not Incorporated) | 3 | 0.7% |
| Not-for-profit Organizations | 85 | 20.7% |
| Local Government Employees | 9 | 2.2% |
| State Government Employees | 40 | 9.8% |
| Federal Government Employees | 17 | 4.2% |
| Unpaid Family Workers | 0 | 0.0% |
| Total | 410 | 100.0% |
Employment Status by Age in Bethany
According to the labor force statistics for Bethany, out of the total population over 16 years of age (1,056), 45.0% or 475 individuals are in the labor force, with 5.1% or 24 of them unemployed. The age group with the highest labor force participation rate is 25 to 29 years, with 100.0% or 22 individuals in the labor force. Within the labor force, the 35 to 44 years age range has the highest percentage of unemployed individuals, with 22.9% or 8 of them being unemployed.
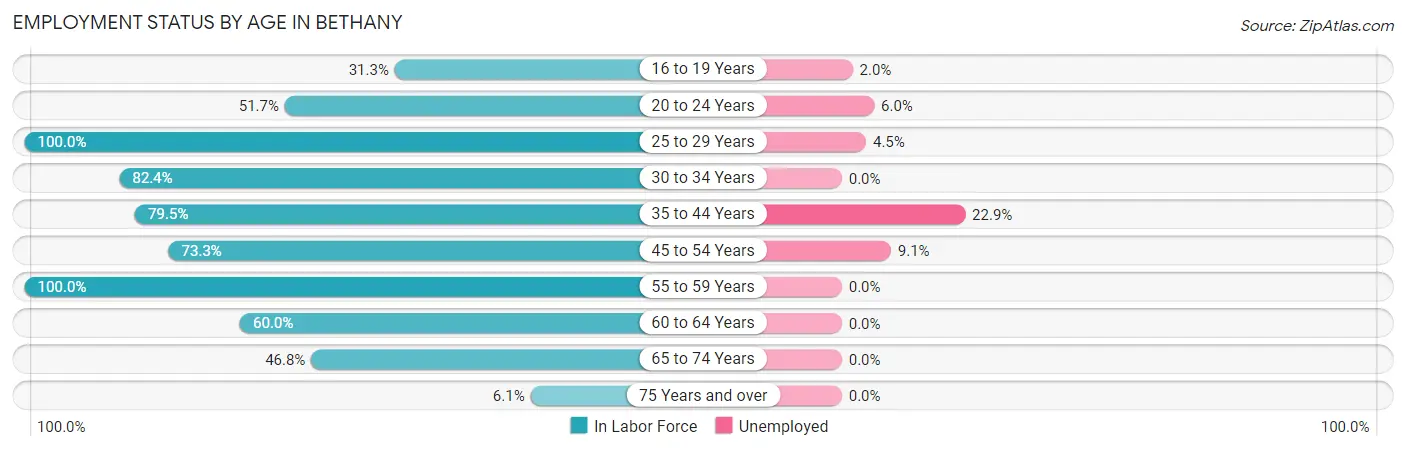
| Age Bracket | In Labor Force | Unemployed |
| 16 to 19 Years | 151 (31.3%) | 3 (2.0%) |
| 20 to 24 Years | 151 (51.7%) | 9 (6.0%) |
| 25 to 29 Years | 22 (100.0%) | 1 (4.5%) |
| 30 to 34 Years | 14 (82.4%) | 0 (0.0%) |
| 35 to 44 Years | 35 (79.5%) | 8 (22.9%) |
| 45 to 54 Years | 33 (73.3%) | 3 (9.1%) |
| 55 to 59 Years | 23 (100.0%) | 0 (0.0%) |
| 60 to 64 Years | 21 (60.0%) | 0 (0.0%) |
| 65 to 74 Years | 22 (46.8%) | 0 (0.0%) |
| 75 Years and over | 3 (6.1%) | 0 (0.0%) |
| Total | 475 (45.0%) | 24 (5.1%) |
Employment Status by Educational Attainment in Bethany
According to labor force statistics for Bethany, 79.6% of individuals (148) out of the total population between 25 and 64 years of age (186) are in the labor force, with 8.1% or 12 of them being unemployed. The group with the highest labor force participation rate are those with the educational attainment of bachelor's degree or higher, with 95.6% or 86 individuals in the labor force. Within the labor force, individuals with high school diploma education have the highest percentage of unemployment, with 27.8% or 5 of them being unemployed.
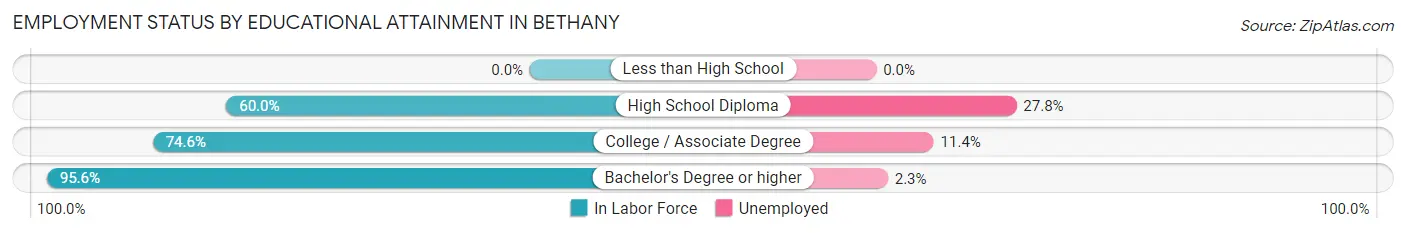
| Educational Attainment | In Labor Force | Unemployed |
| Less than High School | 0 (0.0%) | 0 (0.0%) |
| High School Diploma | 18 (60.0%) | 8 (27.8%) |
| College / Associate Degree | 44 (74.6%) | 7 (11.4%) |
| Bachelor's Degree or higher | 86 (95.6%) | 2 (2.3%) |
| Total | 148 (79.6%) | 15 (8.1%) |
Employment Occupations by Sex in Bethany
Management, Business, Science and Arts Occupations
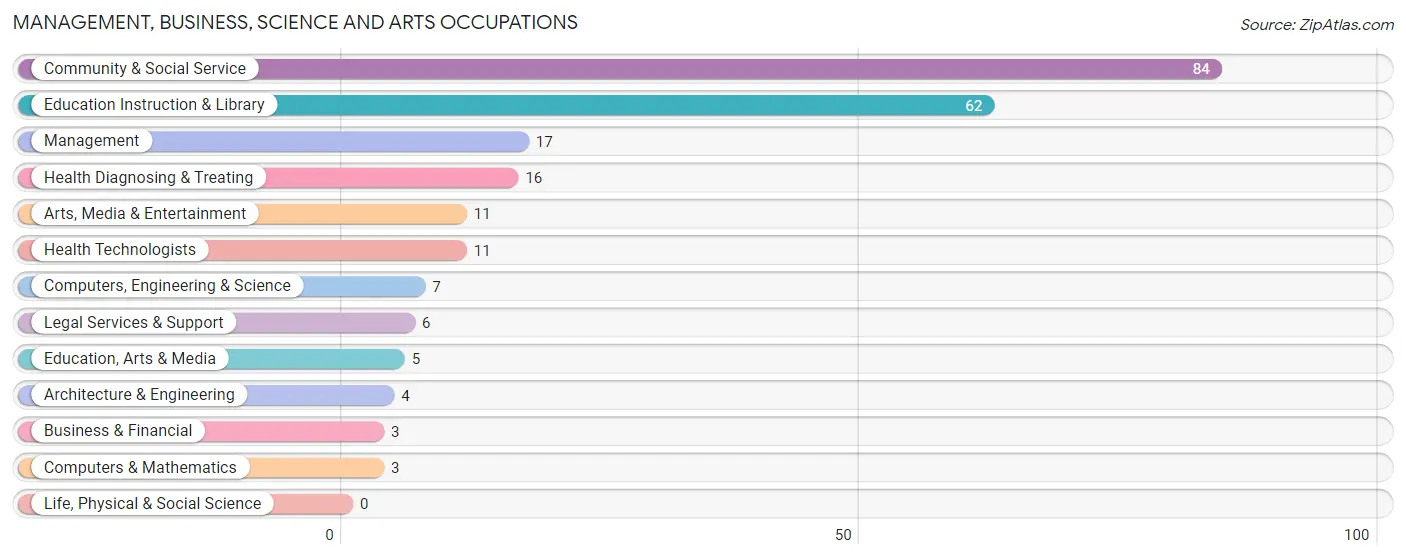
The most common Management, Business, Science and Arts occupations in Bethany are Community & Social Service (84 | 18.6%), Education Instruction & Library (62 | 13.8%), Management (17 | 3.8%), Health Diagnosing & Treating (16 | 3.5%), and Arts, Media & Entertainment (11 | 2.4%).
Management, Business, Science and Arts Occupations by Sex
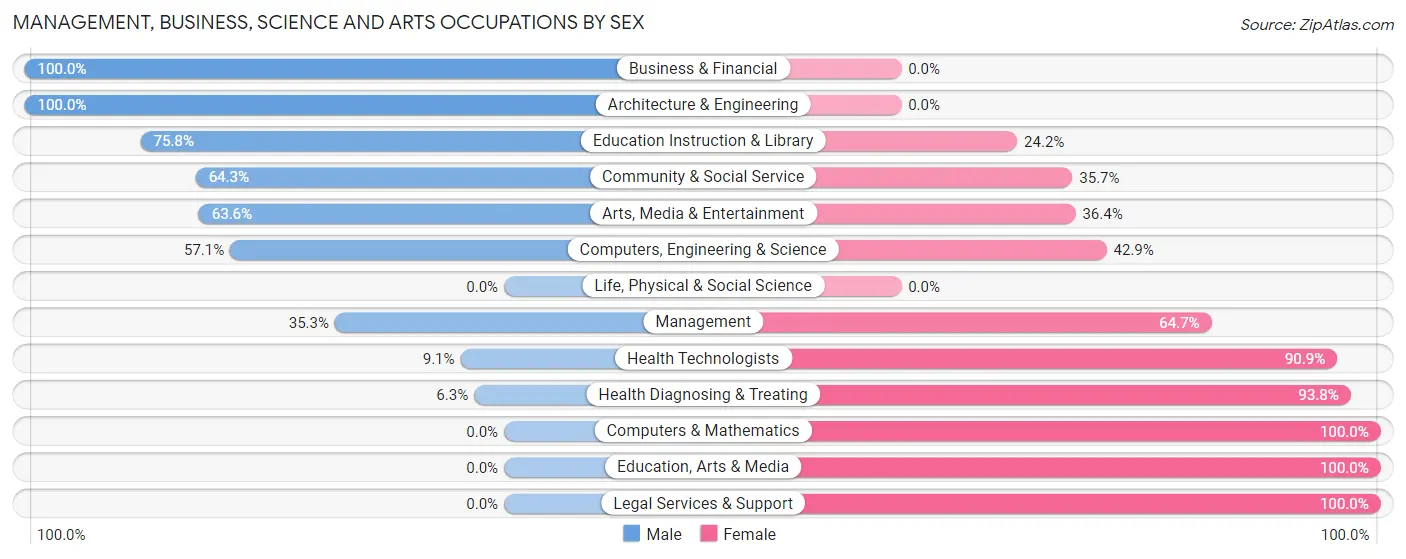
Within the Management, Business, Science and Arts occupations in Bethany, the most male-oriented occupations are Business & Financial (100.0%), Architecture & Engineering (100.0%), and Education Instruction & Library (75.8%), while the most female-oriented occupations are Computers & Mathematics (100.0%), Education, Arts & Media (100.0%), and Legal Services & Support (100.0%).
| Occupation | Male | Female |
| Management | 6 (35.3%) | 11 (64.7%) |
| Business & Financial | 3 (100.0%) | 0 (0.0%) |
| Computers, Engineering & Science | 4 (57.1%) | 3 (42.9%) |
| Computers & Mathematics | 0 (0.0%) | 3 (100.0%) |
| Architecture & Engineering | 4 (100.0%) | 0 (0.0%) |
| Life, Physical & Social Science | 0 (0.0%) | 0 (0.0%) |
| Community & Social Service | 54 (64.3%) | 30 (35.7%) |
| Education, Arts & Media | 0 (0.0%) | 5 (100.0%) |
| Legal Services & Support | 0 (0.0%) | 6 (100.0%) |
| Education Instruction & Library | 47 (75.8%) | 15 (24.2%) |
| Arts, Media & Entertainment | 7 (63.6%) | 4 (36.4%) |
| Health Diagnosing & Treating | 1 (6.2%) | 15 (93.8%) |
| Health Technologists | 1 (9.1%) | 10 (90.9%) |
| Total (Category) | 68 (53.5%) | 59 (46.5%) |
| Total (Overall) | 222 (49.2%) | 229 (50.8%) |
Services Occupations
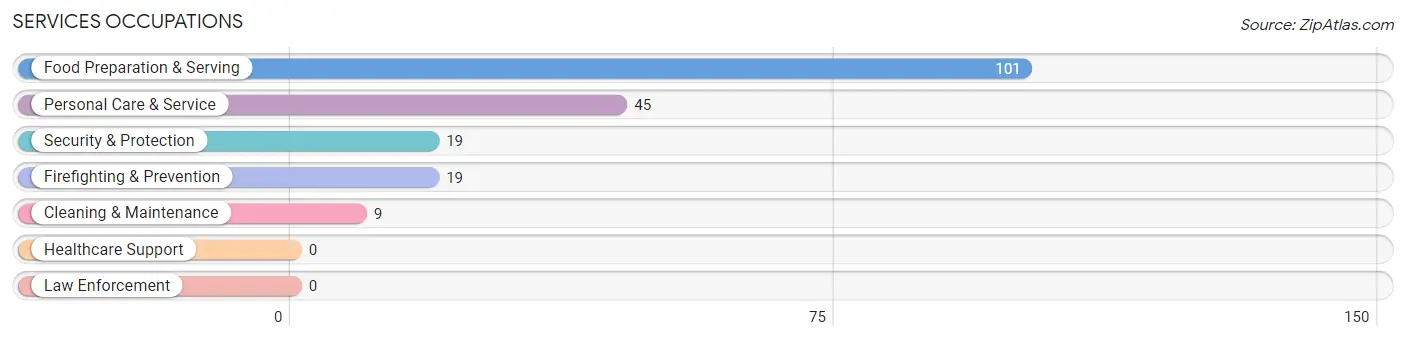
The most common Services occupations in Bethany are Food Preparation & Serving (101 | 22.4%), Personal Care & Service (45 | 10.0%), Security & Protection (19 | 4.2%), Firefighting & Prevention (19 | 4.2%), and Cleaning & Maintenance (9 | 2.0%).
Services Occupations by Sex
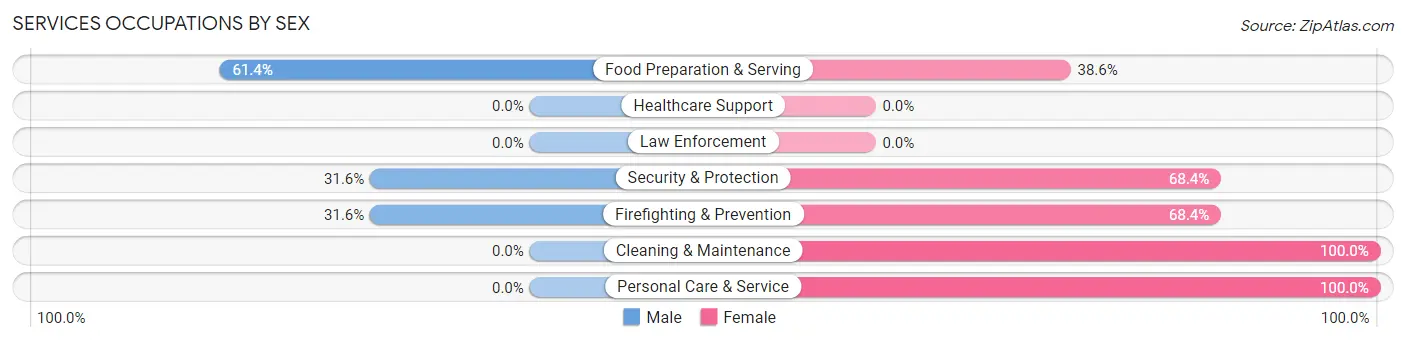
Within the Services occupations in Bethany, the most male-oriented occupations are Food Preparation & Serving (61.4%), Security & Protection (31.6%), and Firefighting & Prevention (31.6%), while the most female-oriented occupations are Cleaning & Maintenance (100.0%), Personal Care & Service (100.0%), and Security & Protection (68.4%).
| Occupation | Male | Female |
| Healthcare Support | 0 (0.0%) | 0 (0.0%) |
| Security & Protection | 6 (31.6%) | 13 (68.4%) |
| Firefighting & Prevention | 6 (31.6%) | 13 (68.4%) |
| Law Enforcement | 0 (0.0%) | 0 (0.0%) |
| Food Preparation & Serving | 62 (61.4%) | 39 (38.6%) |
| Cleaning & Maintenance | 0 (0.0%) | 9 (100.0%) |
| Personal Care & Service | 0 (0.0%) | 45 (100.0%) |
| Total (Category) | 68 (39.1%) | 106 (60.9%) |
| Total (Overall) | 222 (49.2%) | 229 (50.8%) |
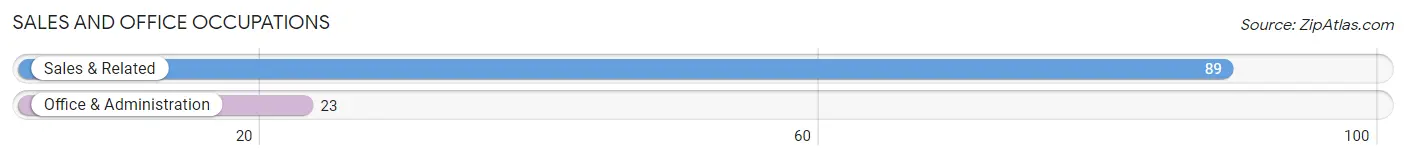
Sales and Office Occupations
The most common Sales and Office occupations in Bethany are Sales & Related (89 | 19.7%), and Office & Administration (23 | 5.1%).
Sales and Office Occupations by Sex
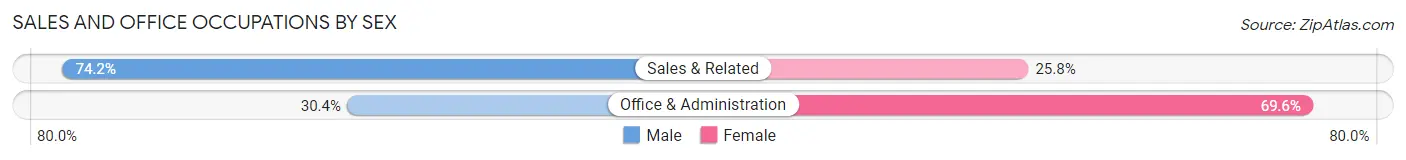
| Occupation | Male | Female |
| Sales & Related | 66 (74.2%) | 23 (25.8%) |
| Office & Administration | 7 (30.4%) | 16 (69.6%) |
| Total (Category) | 73 (65.2%) | 39 (34.8%) |
| Total (Overall) | 222 (49.2%) | 229 (50.8%) |
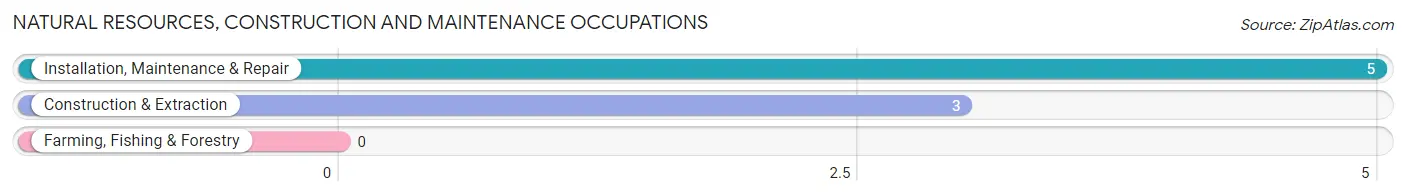
Natural Resources, Construction and Maintenance Occupations
The most common Natural Resources, Construction and Maintenance occupations in Bethany are Installation, Maintenance & Repair (5 | 1.1%), and Construction & Extraction (3 | 0.7%).
Natural Resources, Construction and Maintenance Occupations by Sex
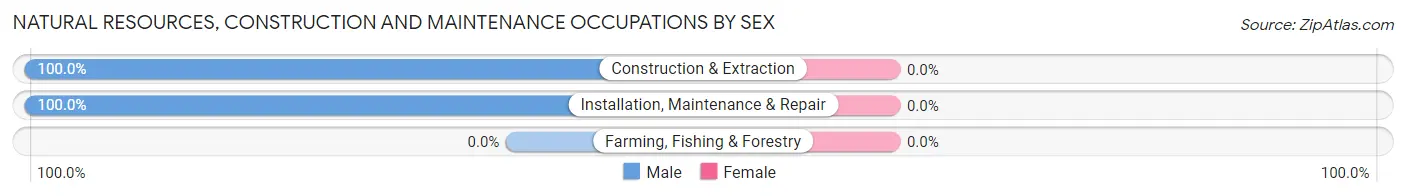
| Occupation | Male | Female |
| Farming, Fishing & Forestry | 0 (0.0%) | 0 (0.0%) |
| Construction & Extraction | 3 (100.0%) | 0 (0.0%) |
| Installation, Maintenance & Repair | 5 (100.0%) | 0 (0.0%) |
| Total (Category) | 8 (100.0%) | 0 (0.0%) |
| Total (Overall) | 222 (49.2%) | 229 (50.8%) |
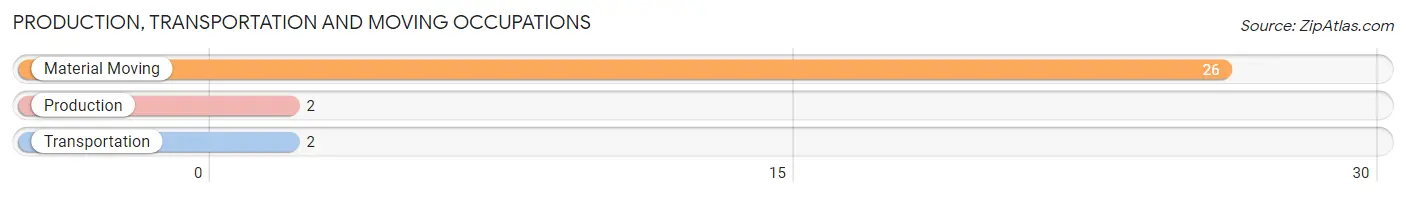
Production, Transportation and Moving Occupations
The most common Production, Transportation and Moving occupations in Bethany are Material Moving (26 | 5.8%), Production (2 | 0.4%), and Transportation (2 | 0.4%).
Production, Transportation and Moving Occupations by Sex
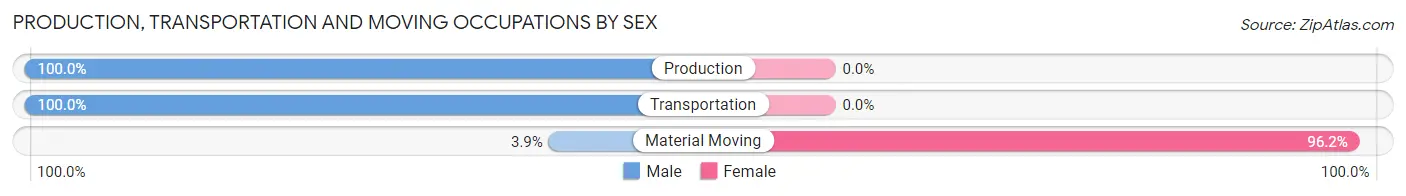
| Occupation | Male | Female |
| Production | 2 (100.0%) | 0 (0.0%) |
| Transportation | 2 (100.0%) | 0 (0.0%) |
| Material Moving | 1 (3.8%) | 25 (96.2%) |
| Total (Category) | 5 (16.7%) | 25 (83.3%) |
| Total (Overall) | 222 (49.2%) | 229 (50.8%) |
Employment Industries by Sex in Bethany
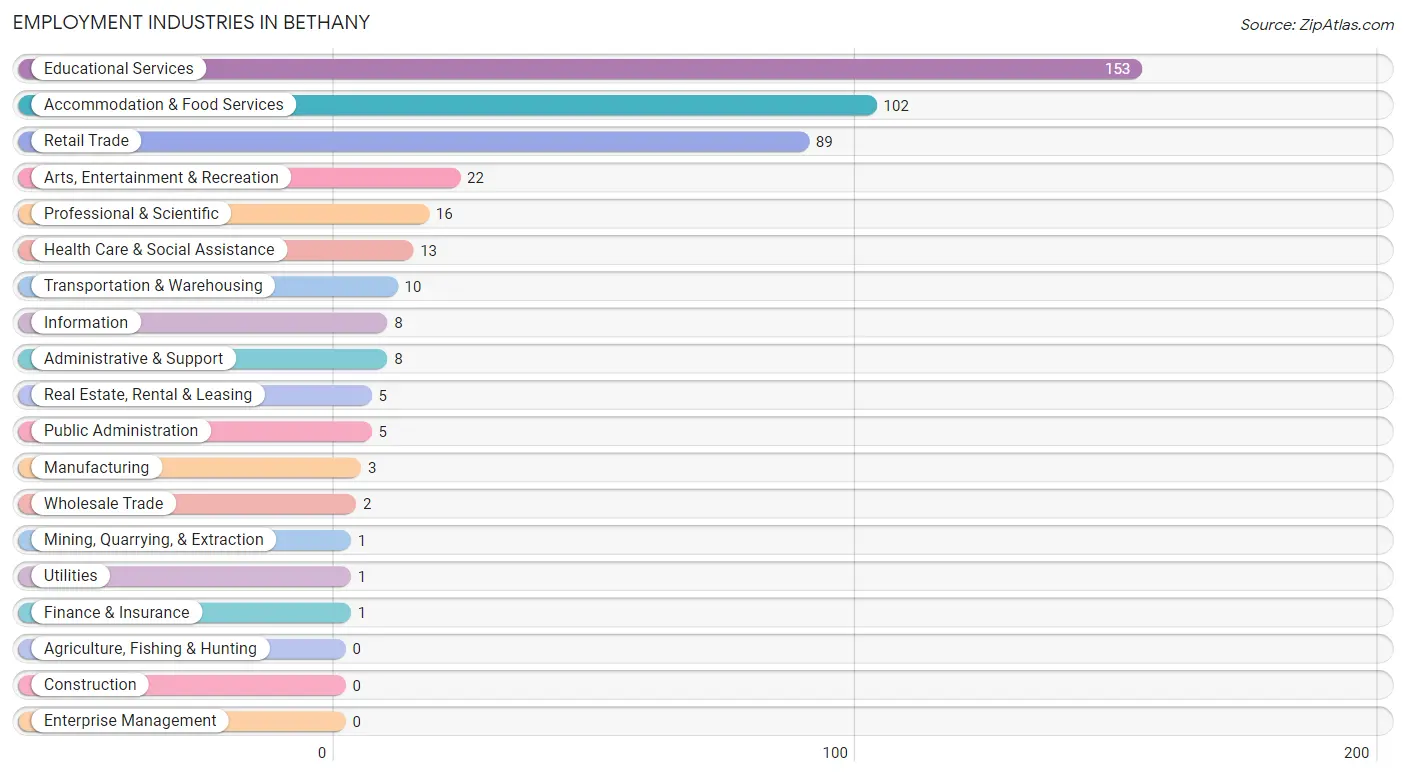
Employment Industries in Bethany
The major employment industries in Bethany include Educational Services (153 | 33.9%), Accommodation & Food Services (102 | 22.6%), Retail Trade (89 | 19.7%), Arts, Entertainment & Recreation (22 | 4.9%), and Professional & Scientific (16 | 3.5%).
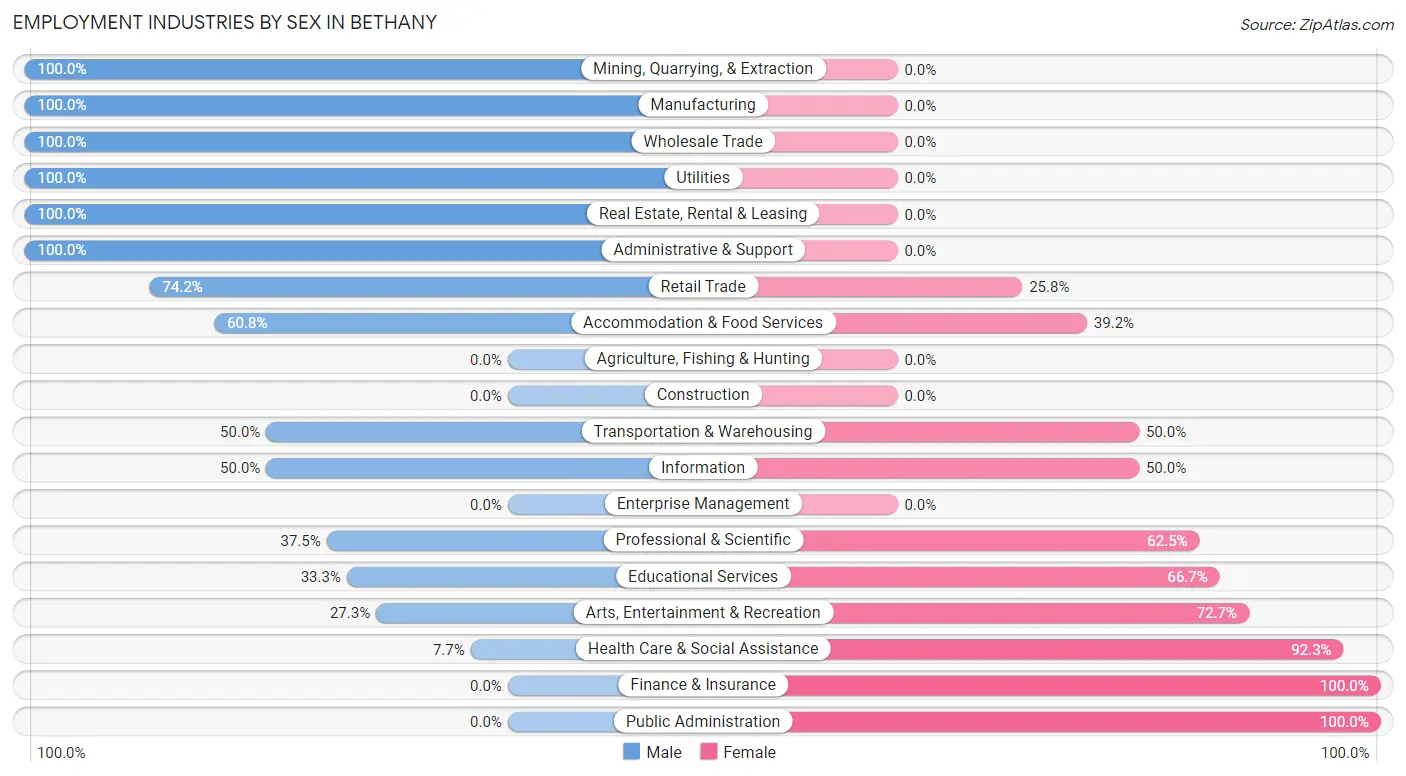
Employment Industries by Sex in Bethany
The Bethany industries that see more men than women are Mining, Quarrying, & Extraction (100.0%), Manufacturing (100.0%), and Wholesale Trade (100.0%), whereas the industries that tend to have a higher number of women are Finance & Insurance (100.0%), Public Administration (100.0%), and Health Care & Social Assistance (92.3%).
| Industry | Male | Female |
| Agriculture, Fishing & Hunting | 0 (0.0%) | 0 (0.0%) |
| Mining, Quarrying, & Extraction | 1 (100.0%) | 0 (0.0%) |
| Construction | 0 (0.0%) | 0 (0.0%) |
| Manufacturing | 3 (100.0%) | 0 (0.0%) |
| Wholesale Trade | 2 (100.0%) | 0 (0.0%) |
| Retail Trade | 66 (74.2%) | 23 (25.8%) |
| Transportation & Warehousing | 5 (50.0%) | 5 (50.0%) |
| Utilities | 1 (100.0%) | 0 (0.0%) |
| Information | 4 (50.0%) | 4 (50.0%) |
| Finance & Insurance | 0 (0.0%) | 1 (100.0%) |
| Real Estate, Rental & Leasing | 5 (100.0%) | 0 (0.0%) |
| Professional & Scientific | 6 (37.5%) | 10 (62.5%) |
| Enterprise Management | 0 (0.0%) | 0 (0.0%) |
| Administrative & Support | 8 (100.0%) | 0 (0.0%) |
| Educational Services | 51 (33.3%) | 102 (66.7%) |
| Health Care & Social Assistance | 1 (7.7%) | 12 (92.3%) |
| Arts, Entertainment & Recreation | 6 (27.3%) | 16 (72.7%) |
| Accommodation & Food Services | 62 (60.8%) | 40 (39.2%) |
| Public Administration | 0 (0.0%) | 5 (100.0%) |
| Total | 222 (49.2%) | 229 (50.8%) |
Education in Bethany
School Enrollment in Bethany
The most common levels of schooling among the 820 students in Bethany are college / undergraduate (760 | 92.7%), elementary school (18 | 2.2%), and nursery / preschool (10 | 1.2%).
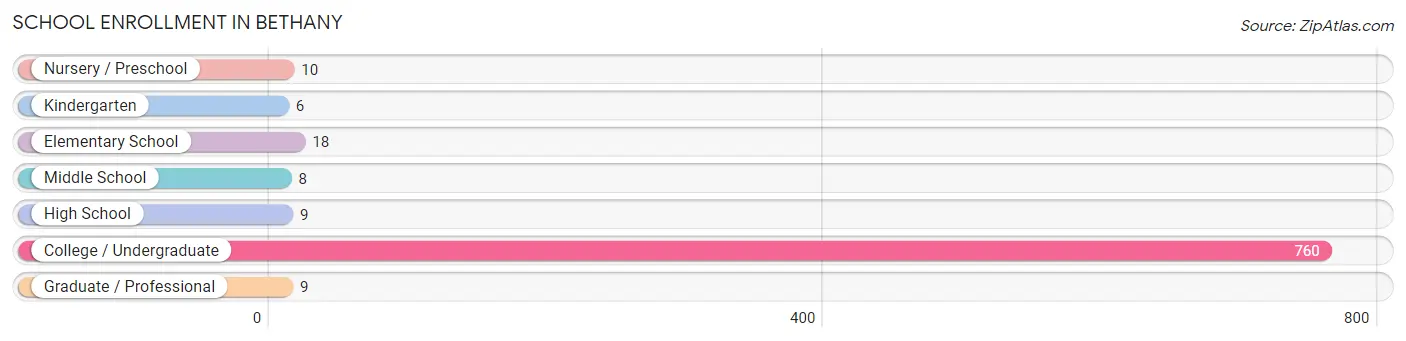
| School Level | # Students | % Students |
| Nursery / Preschool | 10 | 1.2% |
| Kindergarten | 6 | 0.7% |
| Elementary School | 18 | 2.2% |
| Middle School | 8 | 1.0% |
| High School | 9 | 1.1% |
| College / Undergraduate | 760 | 92.7% |
| Graduate / Professional | 9 | 1.1% |
| Total | 820 | 100.0% |
School Enrollment by Age by Funding Source in Bethany
Out of a total of 820 students who are enrolled in schools in Bethany, 711 (86.7%) attend a private institution, while the remaining 109 (13.3%) are enrolled in public schools. The age group of 25 to 34 year olds has the highest likelihood of being enrolled in private schools, with 5 (100.0% in the age bracket) enrolled. Conversely, the age group of 3 to 4 year olds has the lowest likelihood of being enrolled in a private school, with 10 (100.0% in the age bracket) attending a public institution.
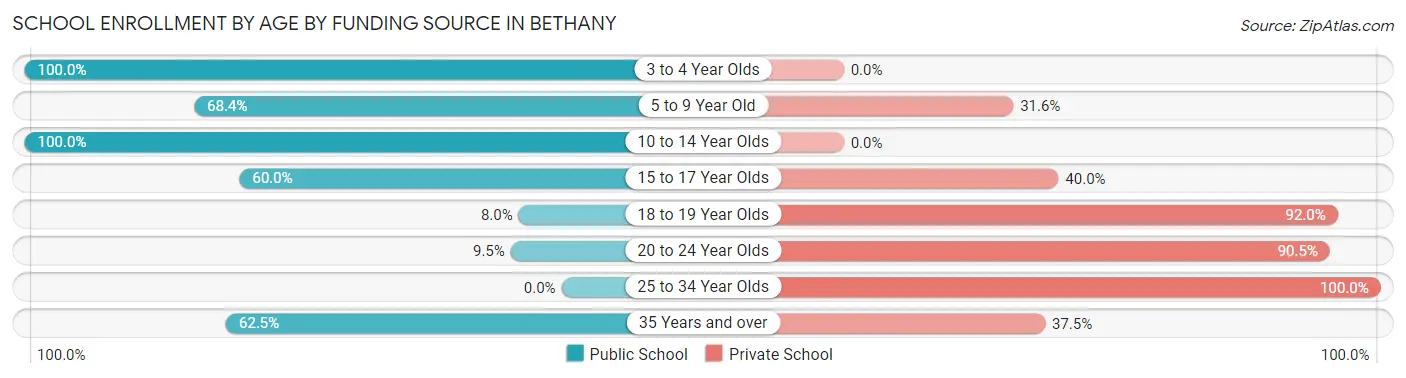
| Age Bracket | Public School | Private School |
| 3 to 4 Year Olds | 10 (100.0%) | 0 (0.0%) |
| 5 to 9 Year Old | 13 (68.4%) | 6 (31.6%) |
| 10 to 14 Year Olds | 13 (100.0%) | 0 (0.0%) |
| 15 to 17 Year Olds | 3 (60.0%) | 2 (40.0%) |
| 18 to 19 Year Olds | 38 (8.0%) | 437 (92.0%) |
| 20 to 24 Year Olds | 27 (9.5%) | 258 (90.5%) |
| 25 to 34 Year Olds | 0 (0.0%) | 5 (100.0%) |
| 35 Years and over | 5 (62.5%) | 3 (37.5%) |
| Total | 109 (13.3%) | 711 (86.7%) |
Educational Attainment by Field of Study in Bethany
Education (21 | 14.9%), bio, nature & agricultural (14 | 9.9%), social sciences (14 | 9.9%), literature & languages (14 | 9.9%), and arts & humanities (13 | 9.2%) are the most common fields of study among 141 individuals in Bethany who have obtained a bachelor's degree or higher.
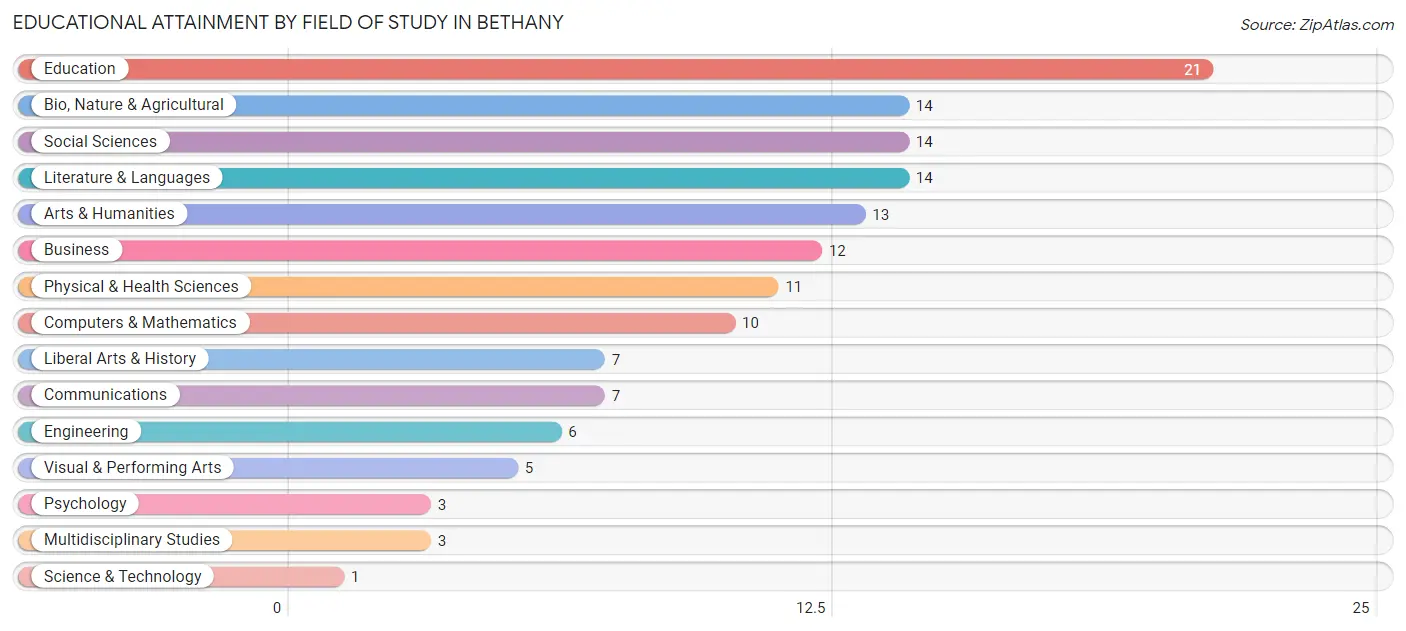
| Field of Study | # Graduates | % Graduates |
| Computers & Mathematics | 10 | 7.1% |
| Bio, Nature & Agricultural | 14 | 9.9% |
| Physical & Health Sciences | 11 | 7.8% |
| Psychology | 3 | 2.1% |
| Social Sciences | 14 | 9.9% |
| Engineering | 6 | 4.3% |
| Multidisciplinary Studies | 3 | 2.1% |
| Science & Technology | 1 | 0.7% |
| Business | 12 | 8.5% |
| Education | 21 | 14.9% |
| Literature & Languages | 14 | 9.9% |
| Liberal Arts & History | 7 | 5.0% |
| Visual & Performing Arts | 5 | 3.5% |
| Communications | 7 | 5.0% |
| Arts & Humanities | 13 | 9.2% |
| Total | 141 | 100.0% |
Transportation & Commute in Bethany
Vehicle Availability by Sex in Bethany
The most prevalent vehicle ownership categories in Bethany are males with 2 vehicles (47, accounting for 58.0%) and females with 2 vehicles (54, making up 55.3%).
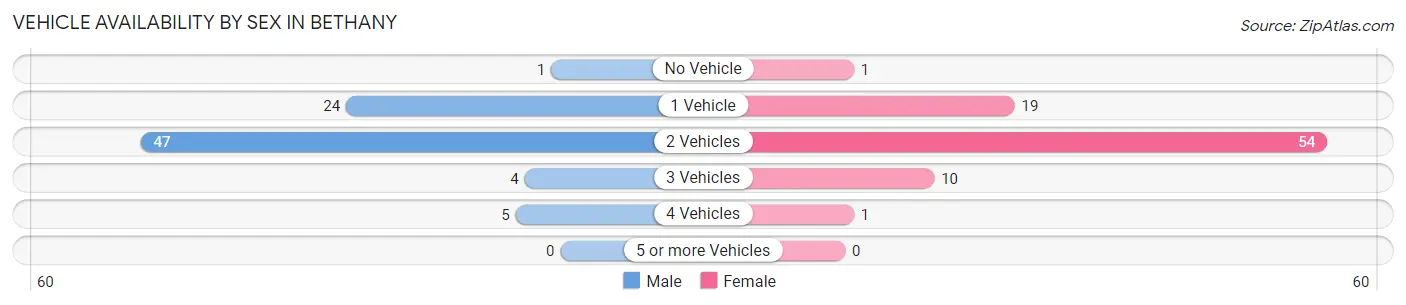
| Vehicles Available | Male | Female |
| No Vehicle | 1 (1.2%) | 1 (1.2%) |
| 1 Vehicle | 24 (29.6%) | 19 (22.4%) |
| 2 Vehicles | 47 (58.0%) | 54 (63.5%) |
| 3 Vehicles | 4 (4.9%) | 10 (11.8%) |
| 4 Vehicles | 5 (6.2%) | 1 (1.2%) |
| 5 or more Vehicles | 0 (0.0%) | 0 (0.0%) |
| Total | 81 (100.0%) | 85 (100.0%) |
Commute Time in Bethany
The most frequently occuring commute durations in Bethany are less than 5 minutes (95 commuters, 23.7%), 10 to 14 minutes (91 commuters, 22.8%), and 30 to 34 minutes (70 commuters, 17.5%).
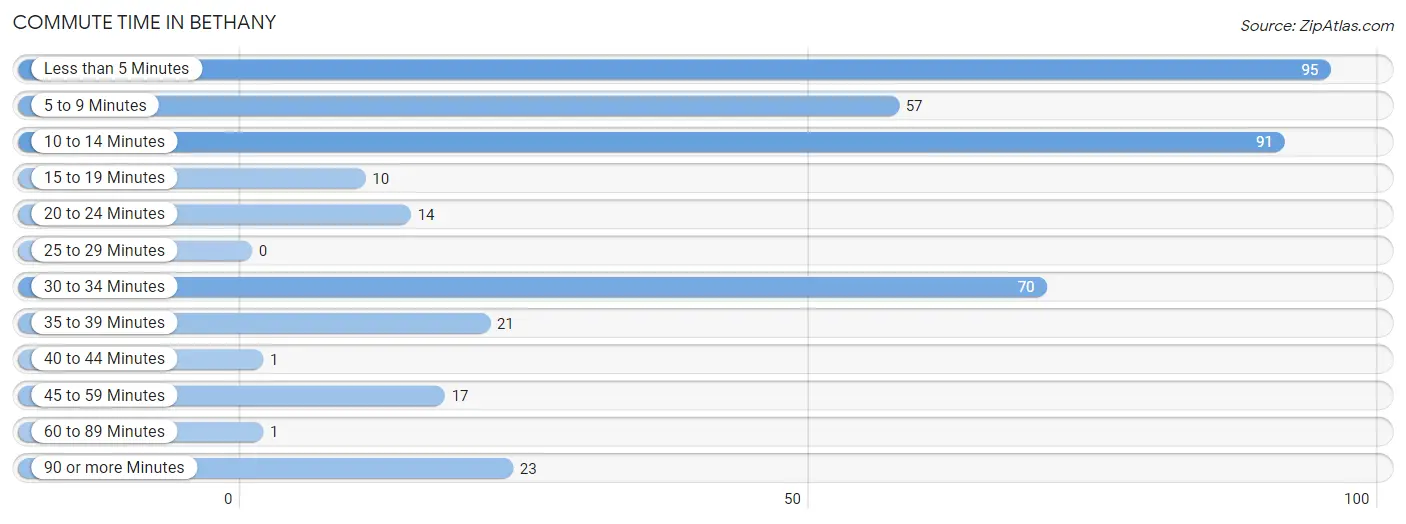
| Commute Time | # Commuters | % Commuters |
| Less than 5 Minutes | 95 | 23.7% |
| 5 to 9 Minutes | 57 | 14.2% |
| 10 to 14 Minutes | 91 | 22.8% |
| 15 to 19 Minutes | 10 | 2.5% |
| 20 to 24 Minutes | 14 | 3.5% |
| 25 to 29 Minutes | 0 | 0.0% |
| 30 to 34 Minutes | 70 | 17.5% |
| 35 to 39 Minutes | 21 | 5.2% |
| 40 to 44 Minutes | 1 | 0.3% |
| 45 to 59 Minutes | 17 | 4.3% |
| 60 to 89 Minutes | 1 | 0.3% |
| 90 or more Minutes | 23 | 5.8% |
Commute Time by Sex in Bethany
The most common commute times in Bethany are less than 5 minutes (56 commuters, 28.4%) for males and 10 to 14 minutes (61 commuters, 30.0%) for females.
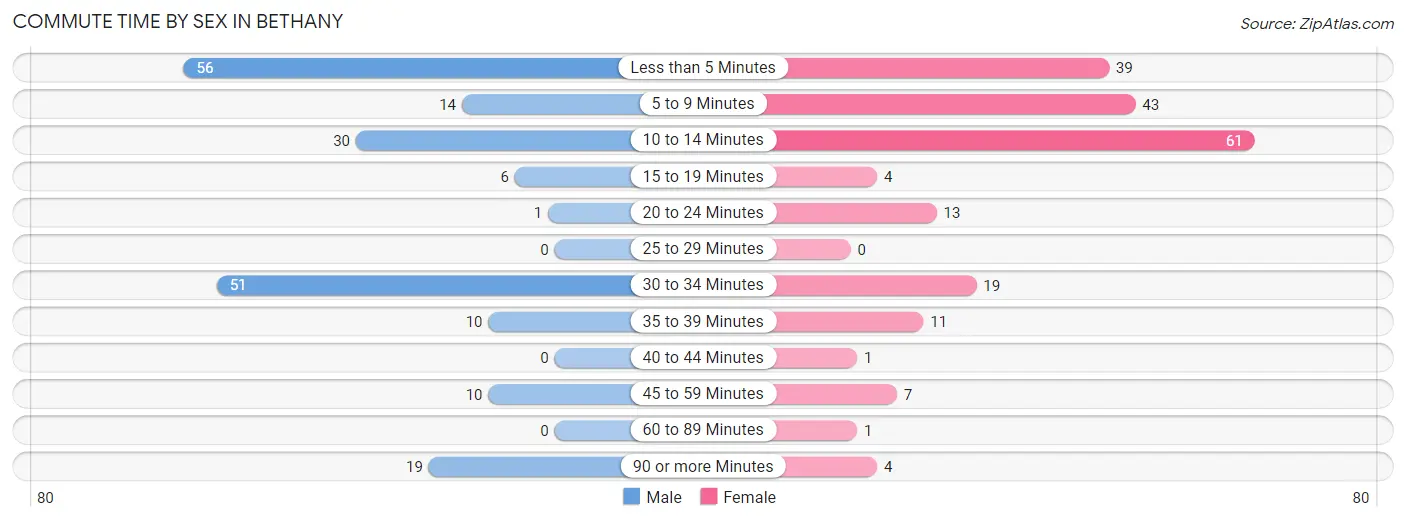
| Commute Time | Male | Female |
| Less than 5 Minutes | 56 (28.4%) | 39 (19.2%) |
| 5 to 9 Minutes | 14 (7.1%) | 43 (21.2%) |
| 10 to 14 Minutes | 30 (15.2%) | 61 (30.0%) |
| 15 to 19 Minutes | 6 (3.0%) | 4 (2.0%) |
| 20 to 24 Minutes | 1 (0.5%) | 13 (6.4%) |
| 25 to 29 Minutes | 0 (0.0%) | 0 (0.0%) |
| 30 to 34 Minutes | 51 (25.9%) | 19 (9.4%) |
| 35 to 39 Minutes | 10 (5.1%) | 11 (5.4%) |
| 40 to 44 Minutes | 0 (0.0%) | 1 (0.5%) |
| 45 to 59 Minutes | 10 (5.1%) | 7 (3.5%) |
| 60 to 89 Minutes | 0 (0.0%) | 1 (0.5%) |
| 90 or more Minutes | 19 (9.6%) | 4 (2.0%) |
Time of Departure to Work by Sex in Bethany
The most frequent times of departure to work in Bethany are 4:00 PM to 11:59 PM (31, 15.7%) for males and 4:00 PM to 11:59 PM (56, 27.6%) for females.
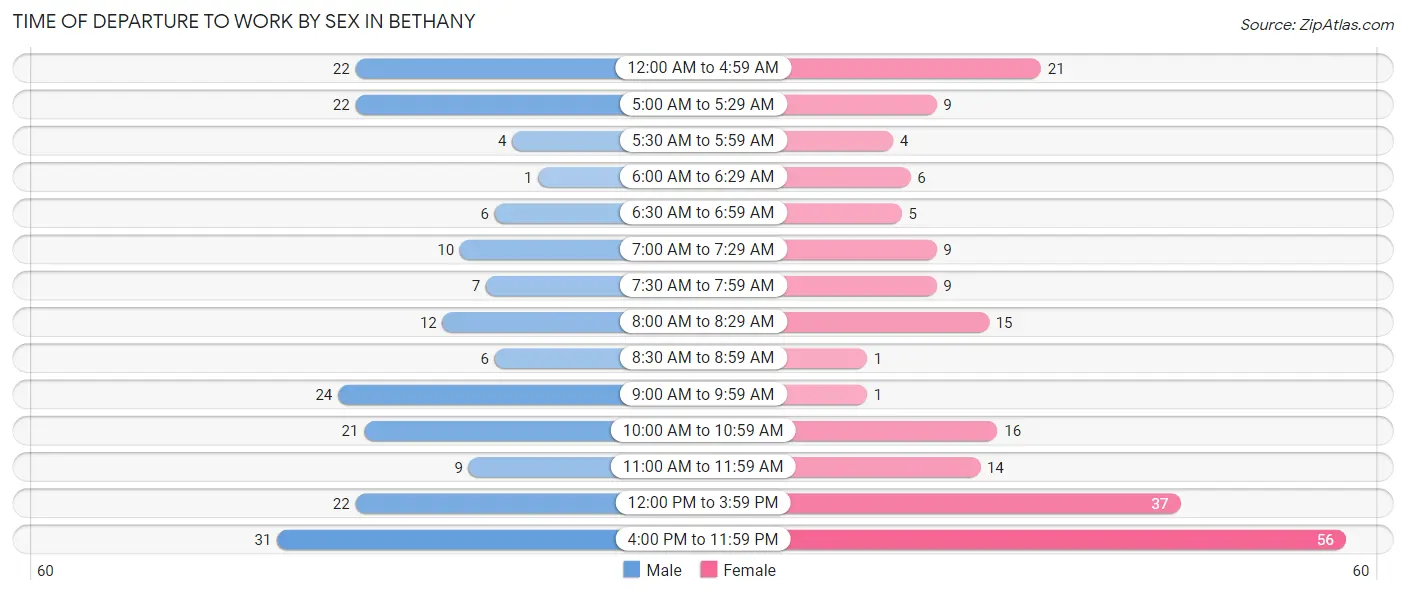
| Time of Departure | Male | Female |
| 12:00 AM to 4:59 AM | 22 (11.2%) | 21 (10.3%) |
| 5:00 AM to 5:29 AM | 22 (11.2%) | 9 (4.4%) |
| 5:30 AM to 5:59 AM | 4 (2.0%) | 4 (2.0%) |
| 6:00 AM to 6:29 AM | 1 (0.5%) | 6 (3.0%) |
| 6:30 AM to 6:59 AM | 6 (3.0%) | 5 (2.5%) |
| 7:00 AM to 7:29 AM | 10 (5.1%) | 9 (4.4%) |
| 7:30 AM to 7:59 AM | 7 (3.5%) | 9 (4.4%) |
| 8:00 AM to 8:29 AM | 12 (6.1%) | 15 (7.4%) |
| 8:30 AM to 8:59 AM | 6 (3.0%) | 1 (0.5%) |
| 9:00 AM to 9:59 AM | 24 (12.2%) | 1 (0.5%) |
| 10:00 AM to 10:59 AM | 21 (10.7%) | 16 (7.9%) |
| 11:00 AM to 11:59 AM | 9 (4.6%) | 14 (6.9%) |
| 12:00 PM to 3:59 PM | 22 (11.2%) | 37 (18.2%) |
| 4:00 PM to 11:59 PM | 31 (15.7%) | 56 (27.6%) |
| Total | 197 (100.0%) | 203 (100.0%) |
Housing Occupancy in Bethany
Occupancy by Ownership in Bethany
Of the total 176 dwellings in Bethany, owner-occupied units account for 129 (73.3%), while renter-occupied units make up 47 (26.7%).
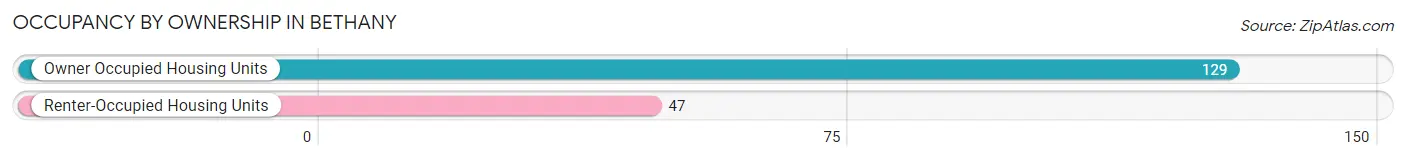
| Occupancy | # Housing Units | % Housing Units |
| Owner Occupied Housing Units | 129 | 73.3% |
| Renter-Occupied Housing Units | 47 | 26.7% |
| Total Occupied Housing Units | 176 | 100.0% |
Occupancy by Household Size in Bethany
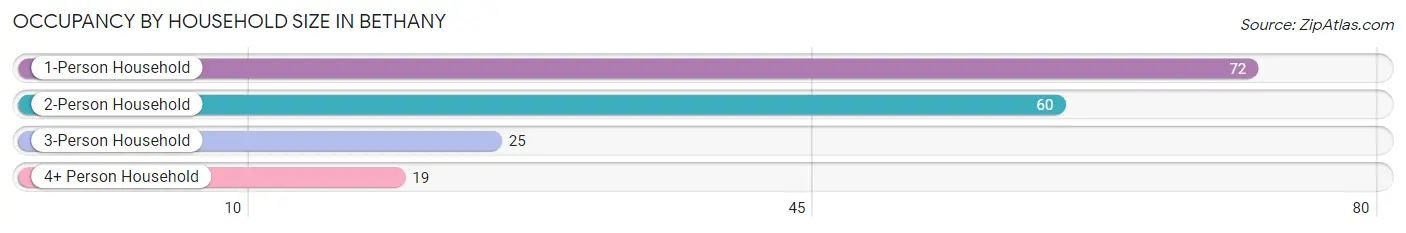
| Household Size | # Housing Units | % Housing Units |
| 1-Person Household | 72 | 40.9% |
| 2-Person Household | 60 | 34.1% |
| 3-Person Household | 25 | 14.2% |
| 4+ Person Household | 19 | 10.8% |
| Total Housing Units | 176 | 100.0% |
Occupancy by Ownership by Household Size in Bethany
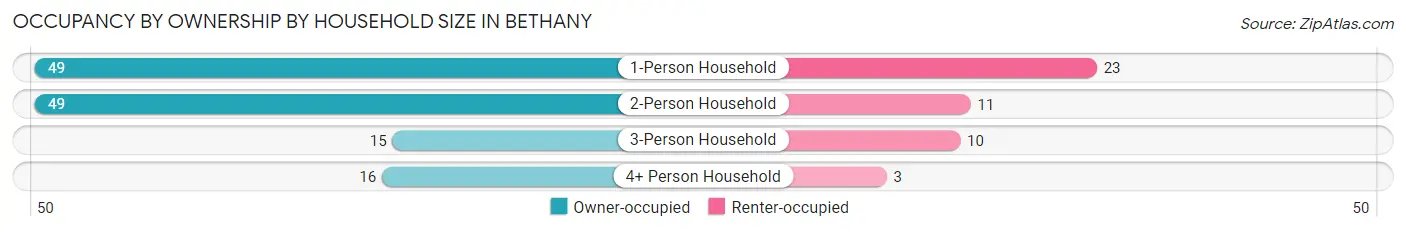
| Household Size | Owner-occupied | Renter-occupied |
| 1-Person Household | 49 (68.1%) | 23 (31.9%) |
| 2-Person Household | 49 (81.7%) | 11 (18.3%) |
| 3-Person Household | 15 (60.0%) | 10 (40.0%) |
| 4+ Person Household | 16 (84.2%) | 3 (15.8%) |
| Total Housing Units | 129 (73.3%) | 47 (26.7%) |
Occupancy by Educational Attainment in Bethany
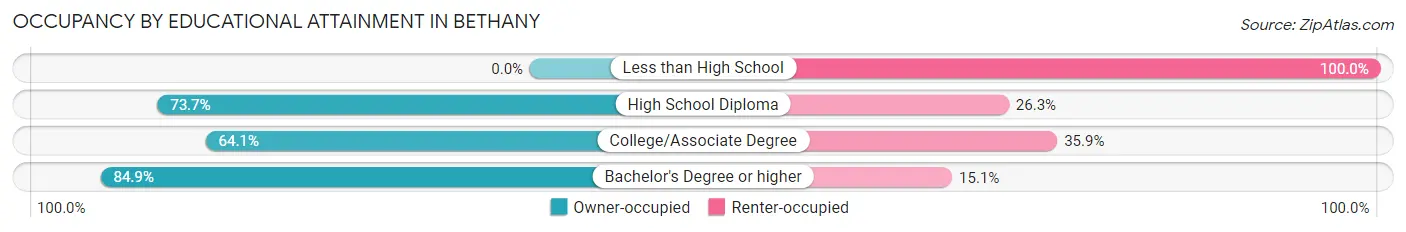
| Household Size | Owner-occupied | Renter-occupied |
| Less than High School | 0 (0.0%) | 7 (100.0%) |
| High School Diploma | 42 (73.7%) | 15 (26.3%) |
| College/Associate Degree | 25 (64.1%) | 14 (35.9%) |
| Bachelor's Degree or higher | 62 (84.9%) | 11 (15.1%) |
Occupancy by Age of Householder in Bethany
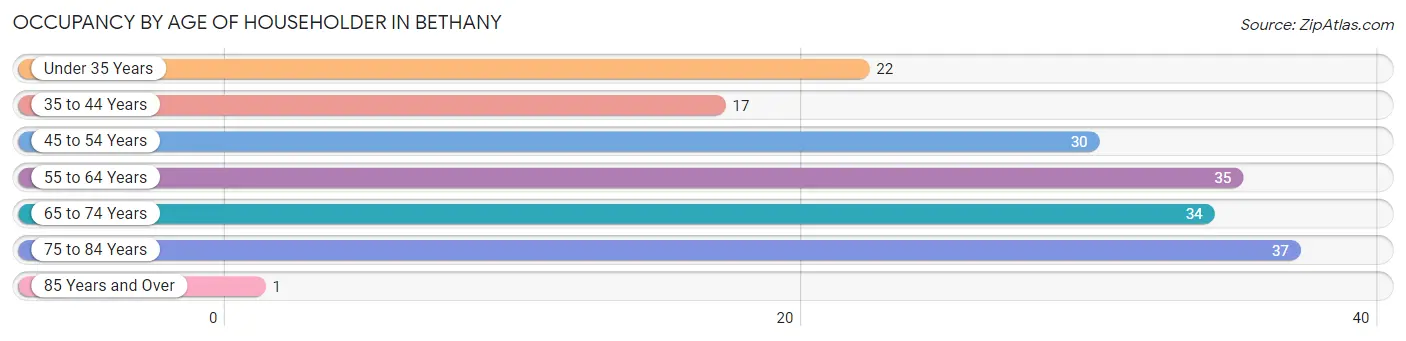
| Age Bracket | # Households | % Households |
| Under 35 Years | 22 | 12.5% |
| 35 to 44 Years | 17 | 9.7% |
| 45 to 54 Years | 30 | 17.1% |
| 55 to 64 Years | 35 | 19.9% |
| 65 to 74 Years | 34 | 19.3% |
| 75 to 84 Years | 37 | 21.0% |
| 85 Years and Over | 1 | 0.6% |
| Total | 176 | 100.0% |
Housing Finances in Bethany
Median Income by Occupancy in Bethany
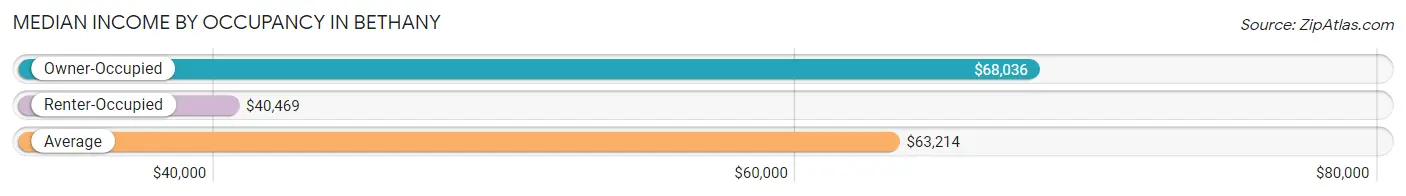
| Occupancy Type | # Households | Median Income |
| Owner-Occupied | 129 (73.3%) | $68,036 |
| Renter-Occupied | 47 (26.7%) | $40,469 |
| Average | 176 (100.0%) | $63,214 |
Occupancy by Householder Income Bracket in Bethany
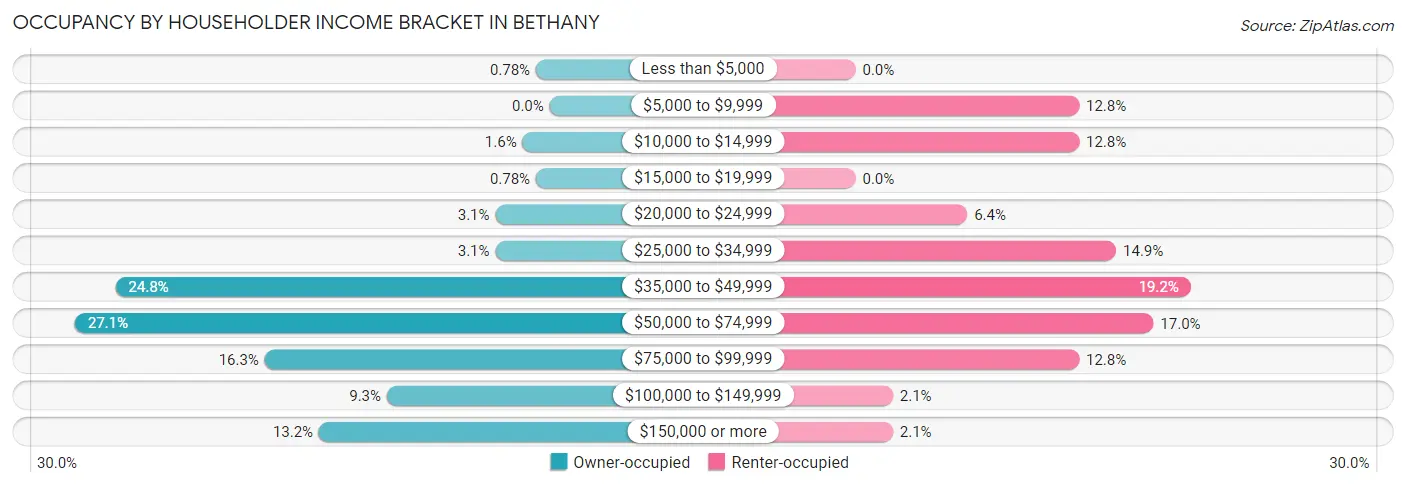
| Income Bracket | Owner-occupied | Renter-occupied |
| Less than $5,000 | 1 (0.8%) | 0 (0.0%) |
| $5,000 to $9,999 | 0 (0.0%) | 6 (12.8%) |
| $10,000 to $14,999 | 2 (1.5%) | 6 (12.8%) |
| $15,000 to $19,999 | 1 (0.8%) | 0 (0.0%) |
| $20,000 to $24,999 | 4 (3.1%) | 3 (6.4%) |
| $25,000 to $34,999 | 4 (3.1%) | 7 (14.9%) |
| $35,000 to $49,999 | 32 (24.8%) | 9 (19.2%) |
| $50,000 to $74,999 | 35 (27.1%) | 8 (17.0%) |
| $75,000 to $99,999 | 21 (16.3%) | 6 (12.8%) |
| $100,000 to $149,999 | 12 (9.3%) | 1 (2.1%) |
| $150,000 or more | 17 (13.2%) | 1 (2.1%) |
| Total | 129 (100.0%) | 47 (100.0%) |
Monthly Housing Cost Tiers in Bethany
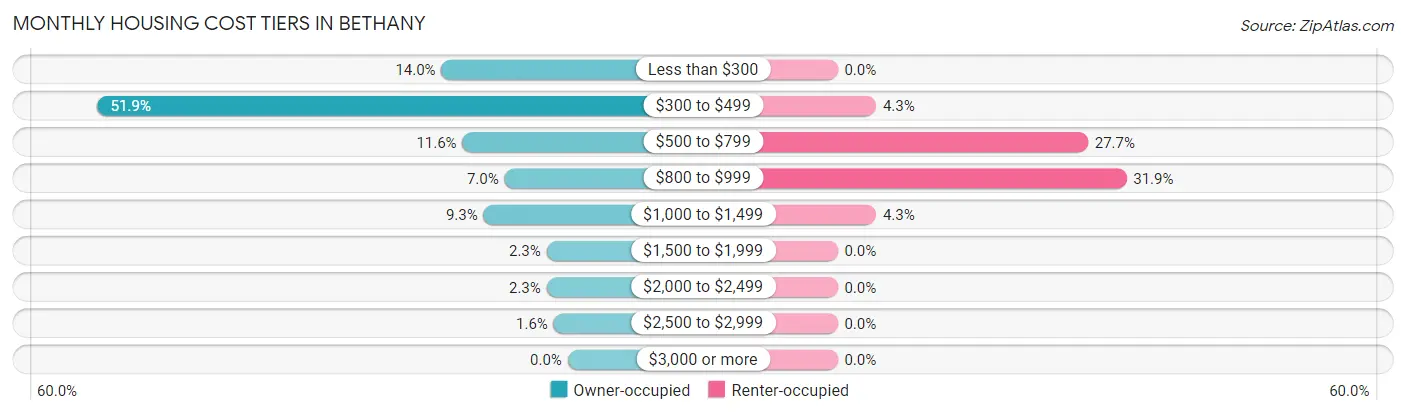
| Monthly Cost | Owner-occupied | Renter-occupied |
| Less than $300 | 18 (14.0%) | 0 (0.0%) |
| $300 to $499 | 67 (51.9%) | 2 (4.3%) |
| $500 to $799 | 15 (11.6%) | 13 (27.7%) |
| $800 to $999 | 9 (7.0%) | 15 (31.9%) |
| $1,000 to $1,499 | 12 (9.3%) | 2 (4.3%) |
| $1,500 to $1,999 | 3 (2.3%) | 0 (0.0%) |
| $2,000 to $2,499 | 3 (2.3%) | 0 (0.0%) |
| $2,500 to $2,999 | 2 (1.5%) | 0 (0.0%) |
| $3,000 or more | 0 (0.0%) | 0 (0.0%) |
| Total | 129 (100.0%) | 47 (100.0%) |
Physical Housing Characteristics in Bethany
Housing Structures in Bethany
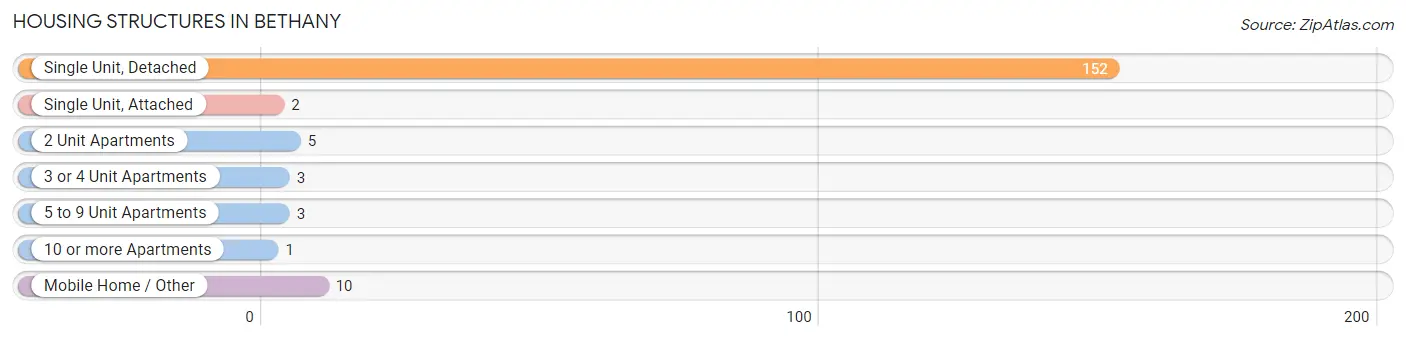
| Structure Type | # Housing Units | % Housing Units |
| Single Unit, Detached | 152 | 86.4% |
| Single Unit, Attached | 2 | 1.1% |
| 2 Unit Apartments | 5 | 2.8% |
| 3 or 4 Unit Apartments | 3 | 1.7% |
| 5 to 9 Unit Apartments | 3 | 1.7% |
| 10 or more Apartments | 1 | 0.6% |
| Mobile Home / Other | 10 | 5.7% |
| Total | 176 | 100.0% |
Housing Structures by Occupancy in Bethany
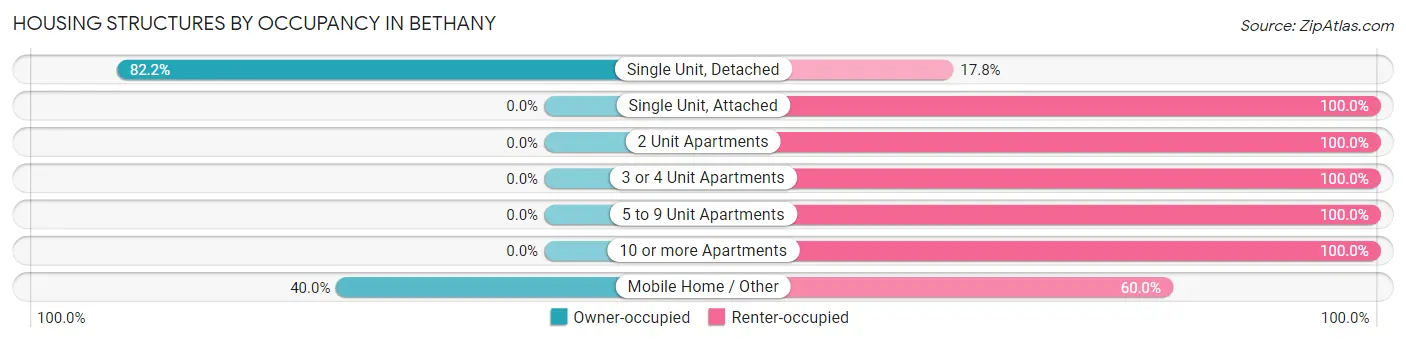
| Structure Type | Owner-occupied | Renter-occupied |
| Single Unit, Detached | 125 (82.2%) | 27 (17.8%) |
| Single Unit, Attached | 0 (0.0%) | 2 (100.0%) |
| 2 Unit Apartments | 0 (0.0%) | 5 (100.0%) |
| 3 or 4 Unit Apartments | 0 (0.0%) | 3 (100.0%) |
| 5 to 9 Unit Apartments | 0 (0.0%) | 3 (100.0%) |
| 10 or more Apartments | 0 (0.0%) | 1 (100.0%) |
| Mobile Home / Other | 4 (40.0%) | 6 (60.0%) |
| Total | 129 (73.3%) | 47 (26.7%) |
Housing Structures by Number of Rooms in Bethany
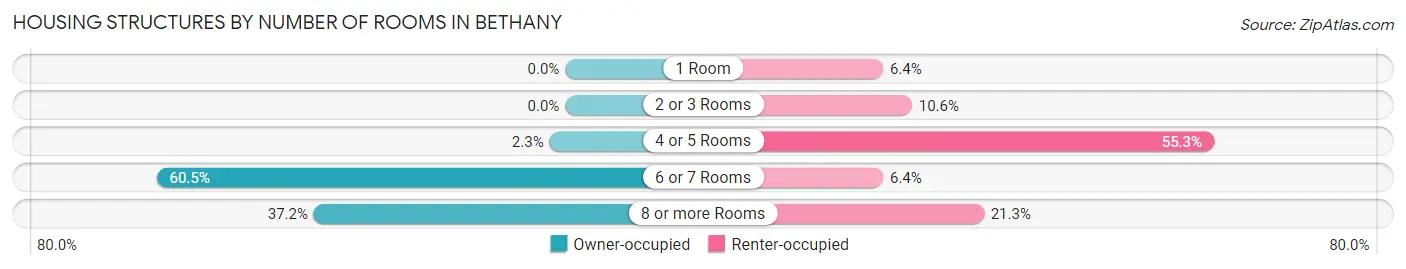
| Number of Rooms | Owner-occupied | Renter-occupied |
| 1 Room | 0 (0.0%) | 3 (6.4%) |
| 2 or 3 Rooms | 0 (0.0%) | 5 (10.6%) |
| 4 or 5 Rooms | 3 (2.3%) | 26 (55.3%) |
| 6 or 7 Rooms | 78 (60.5%) | 3 (6.4%) |
| 8 or more Rooms | 48 (37.2%) | 10 (21.3%) |
| Total | 129 (100.0%) | 47 (100.0%) |
Housing Structure by Heating Type in Bethany
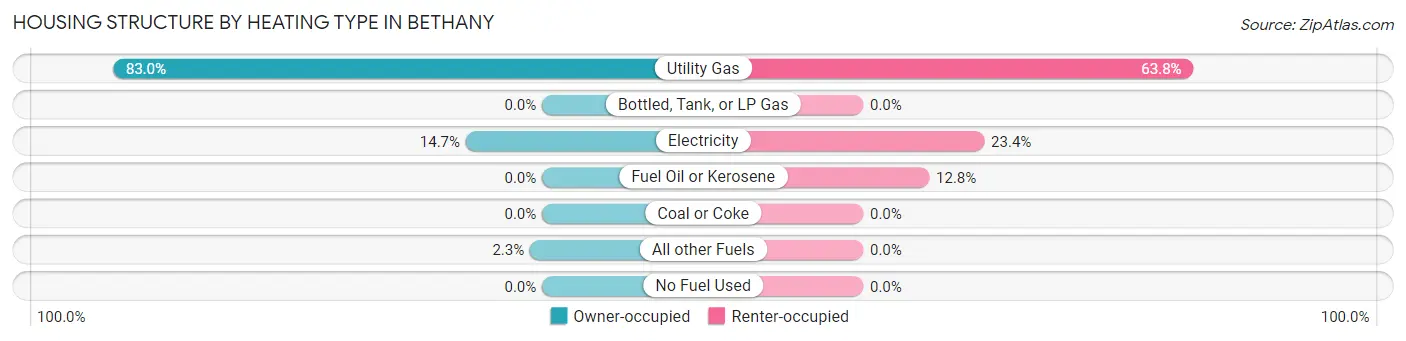
| Heating Type | Owner-occupied | Renter-occupied |
| Utility Gas | 107 (83.0%) | 30 (63.8%) |
| Bottled, Tank, or LP Gas | 0 (0.0%) | 0 (0.0%) |
| Electricity | 19 (14.7%) | 11 (23.4%) |
| Fuel Oil or Kerosene | 0 (0.0%) | 6 (12.8%) |
| Coal or Coke | 0 (0.0%) | 0 (0.0%) |
| All other Fuels | 3 (2.3%) | 0 (0.0%) |
| No Fuel Used | 0 (0.0%) | 0 (0.0%) |
| Total | 129 (100.0%) | 47 (100.0%) |
Household Vehicle Usage in Bethany
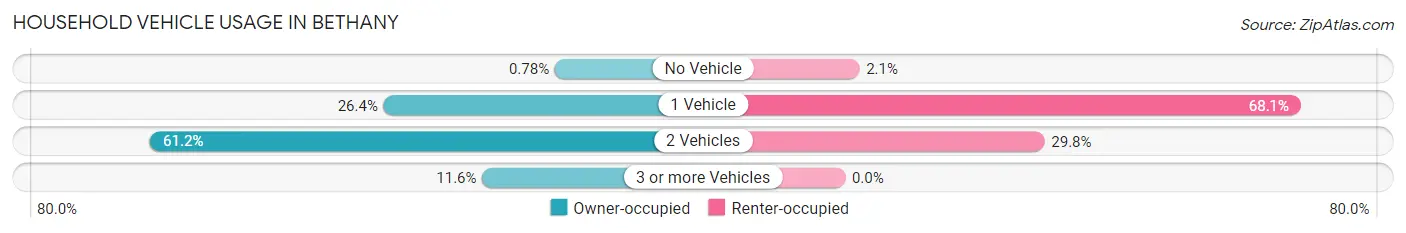
| Vehicles per Household | Owner-occupied | Renter-occupied |
| No Vehicle | 1 (0.8%) | 1 (2.1%) |
| 1 Vehicle | 34 (26.4%) | 32 (68.1%) |
| 2 Vehicles | 79 (61.2%) | 14 (29.8%) |
| 3 or more Vehicles | 15 (11.6%) | 0 (0.0%) |
| Total | 129 (100.0%) | 47 (100.0%) |
Real Estate & Mortgages in Bethany
Real Estate and Mortgage Overview in Bethany
| Characteristic | Without Mortgage | With Mortgage |
| Housing Units | 93 | 36 |
| Median Property Value | $97,000 | $137,500 |
| Median Household Income | $52,292 | $6 |
| Monthly Housing Costs | $351 | $0 |
| Real Estate Taxes | $494 | $0 |
Property Value by Mortgage Status in Bethany
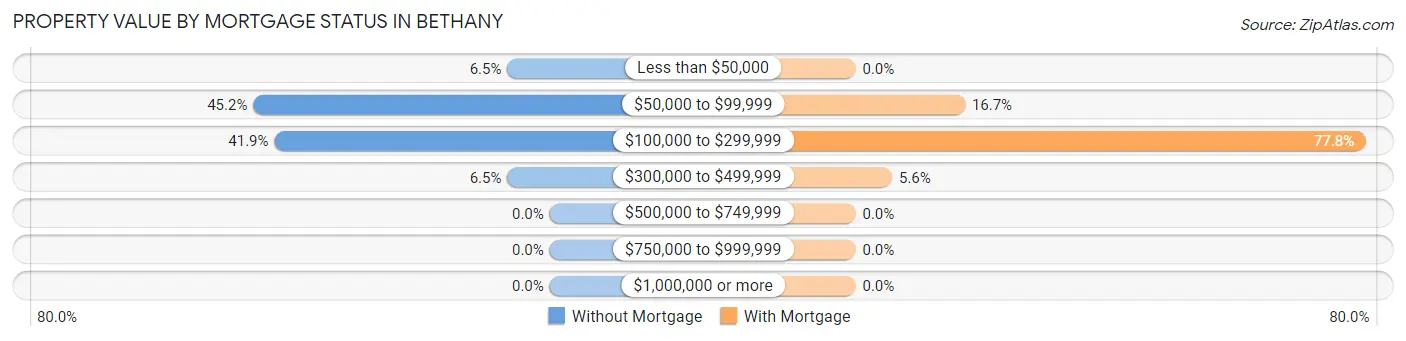
| Property Value | Without Mortgage | With Mortgage |
| Less than $50,000 | 6 (6.5%) | 0 (0.0%) |
| $50,000 to $99,999 | 42 (45.2%) | 6 (16.7%) |
| $100,000 to $299,999 | 39 (41.9%) | 28 (77.8%) |
| $300,000 to $499,999 | 6 (6.5%) | 2 (5.6%) |
| $500,000 to $749,999 | 0 (0.0%) | 0 (0.0%) |
| $750,000 to $999,999 | 0 (0.0%) | 0 (0.0%) |
| $1,000,000 or more | 0 (0.0%) | 0 (0.0%) |
| Total | 93 (100.0%) | 36 (100.0%) |
Household Income by Mortgage Status in Bethany
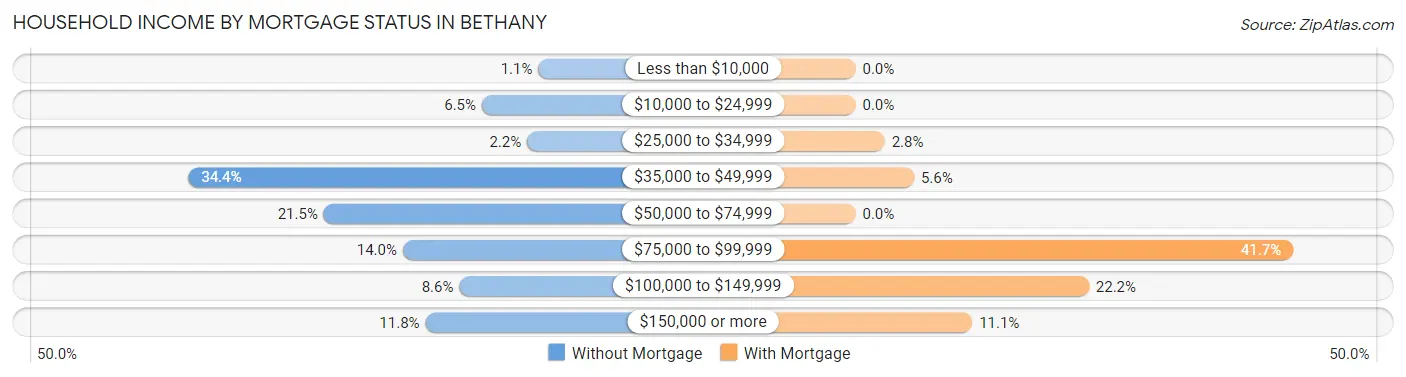
| Household Income | Without Mortgage | With Mortgage |
| Less than $10,000 | 1 (1.1%) | 0 (0.0%) |
| $10,000 to $24,999 | 6 (6.5%) | 0 (0.0%) |
| $25,000 to $34,999 | 2 (2.1%) | 1 (2.8%) |
| $35,000 to $49,999 | 32 (34.4%) | 2 (5.6%) |
| $50,000 to $74,999 | 20 (21.5%) | 0 (0.0%) |
| $75,000 to $99,999 | 13 (14.0%) | 15 (41.7%) |
| $100,000 to $149,999 | 8 (8.6%) | 8 (22.2%) |
| $150,000 or more | 11 (11.8%) | 4 (11.1%) |
| Total | 93 (100.0%) | 36 (100.0%) |
Property Value to Household Income Ratio in Bethany
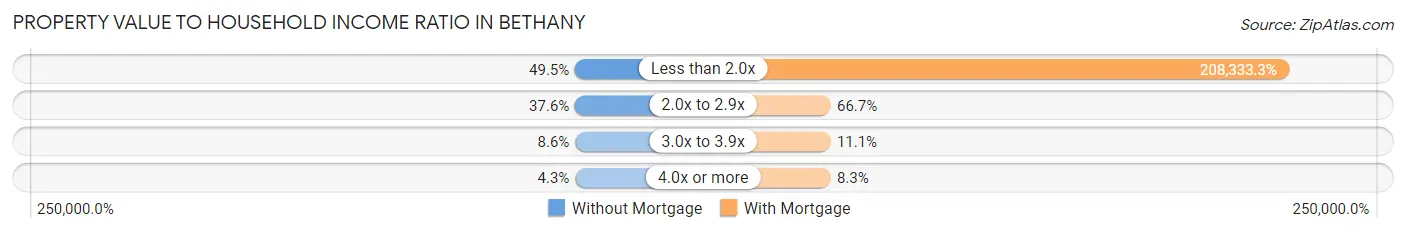
| Value-to-Income Ratio | Without Mortgage | With Mortgage |
| Less than 2.0x | 46 (49.5%) | 75,000 (208,333.3%) |
| 2.0x to 2.9x | 35 (37.6%) | 24 (66.7%) |
| 3.0x to 3.9x | 8 (8.6%) | 4 (11.1%) |
| 4.0x or more | 4 (4.3%) | 3 (8.3%) |
| Total | 93 (100.0%) | 36 (100.0%) |
Real Estate Taxes by Mortgage Status in Bethany
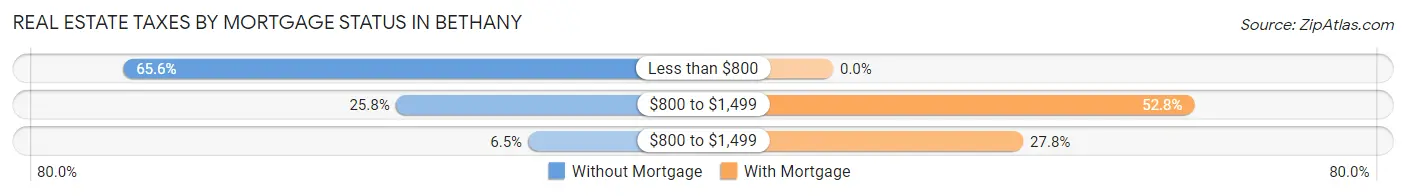
| Property Taxes | Without Mortgage | With Mortgage |
| Less than $800 | 61 (65.6%) | 0 (0.0%) |
| $800 to $1,499 | 24 (25.8%) | 19 (52.8%) |
| $800 to $1,499 | 6 (6.5%) | 10 (27.8%) |
| Total | 93 (100.0%) | 36 (100.0%) |
Health & Disability in Bethany
Health Insurance Coverage by Age in Bethany
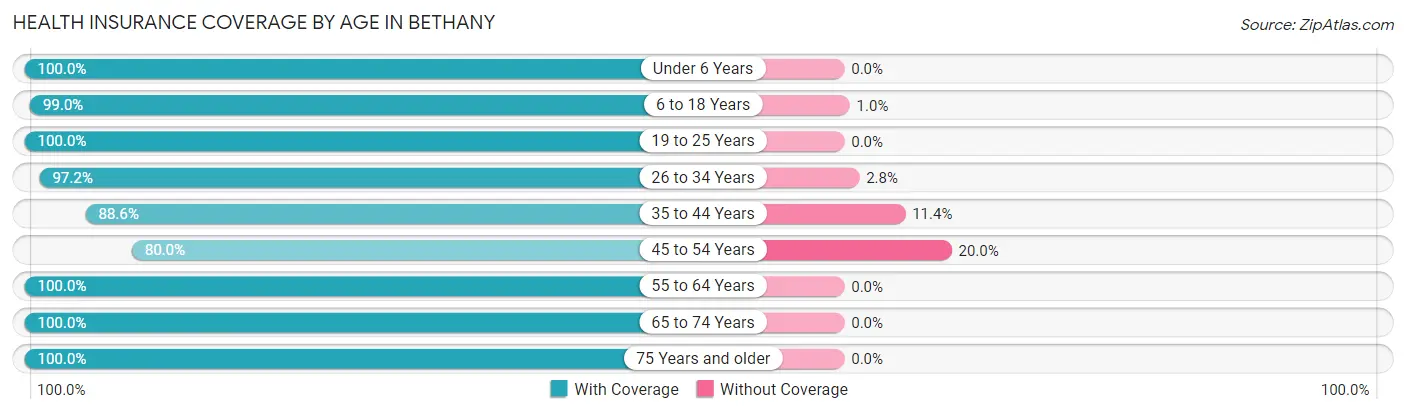
| Age Bracket | With Coverage | Without Coverage |
| Under 6 Years | 38 (100.0%) | 0 (0.0%) |
| 6 to 18 Years | 297 (99.0%) | 3 (1.0%) |
| 19 to 25 Years | 508 (100.0%) | 0 (0.0%) |
| 26 to 34 Years | 35 (97.2%) | 1 (2.8%) |
| 35 to 44 Years | 39 (88.6%) | 5 (11.4%) |
| 45 to 54 Years | 36 (80.0%) | 9 (20.0%) |
| 55 to 64 Years | 58 (100.0%) | 0 (0.0%) |
| 65 to 74 Years | 47 (100.0%) | 0 (0.0%) |
| 75 Years and older | 49 (100.0%) | 0 (0.0%) |
| Total | 1,107 (98.4%) | 18 (1.6%) |
Health Insurance Coverage by Citizenship Status in Bethany
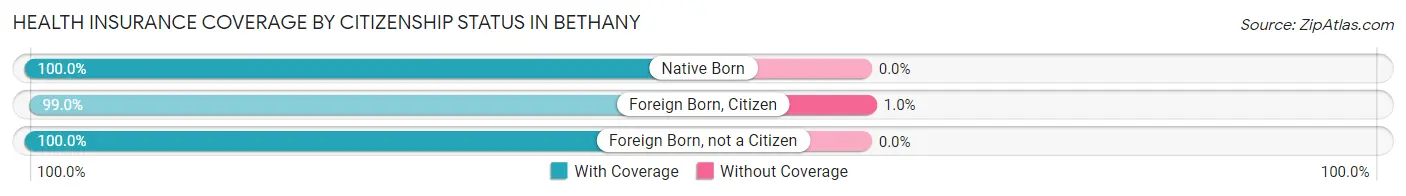
| Citizenship Status | With Coverage | Without Coverage |
| Native Born | 38 (100.0%) | 0 (0.0%) |
| Foreign Born, Citizen | 297 (99.0%) | 3 (1.0%) |
| Foreign Born, not a Citizen | 508 (100.0%) | 0 (0.0%) |
Health Insurance Coverage by Household Income in Bethany
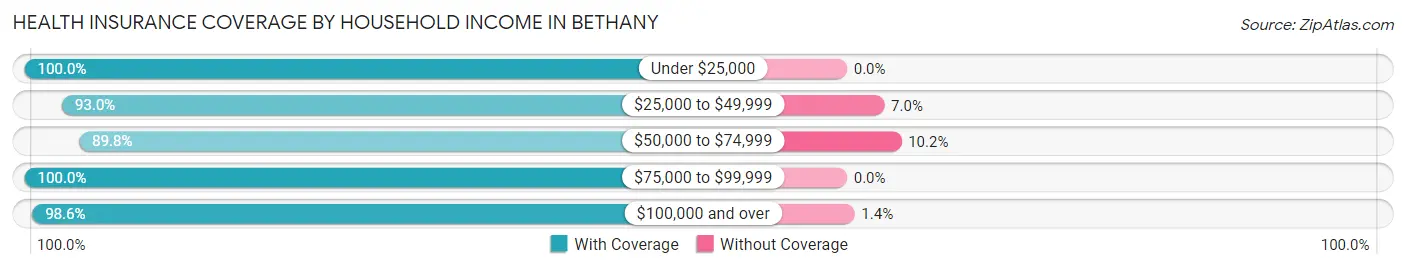
| Household Income | With Coverage | Without Coverage |
| Under $25,000 | 23 (100.0%) | 0 (0.0%) |
| $25,000 to $49,999 | 93 (93.0%) | 7 (7.0%) |
| $50,000 to $74,999 | 88 (89.8%) | 10 (10.2%) |
| $75,000 to $99,999 | 78 (100.0%) | 0 (0.0%) |
| $100,000 and over | 69 (98.6%) | 1 (1.4%) |
Public vs Private Health Insurance Coverage by Age in Bethany
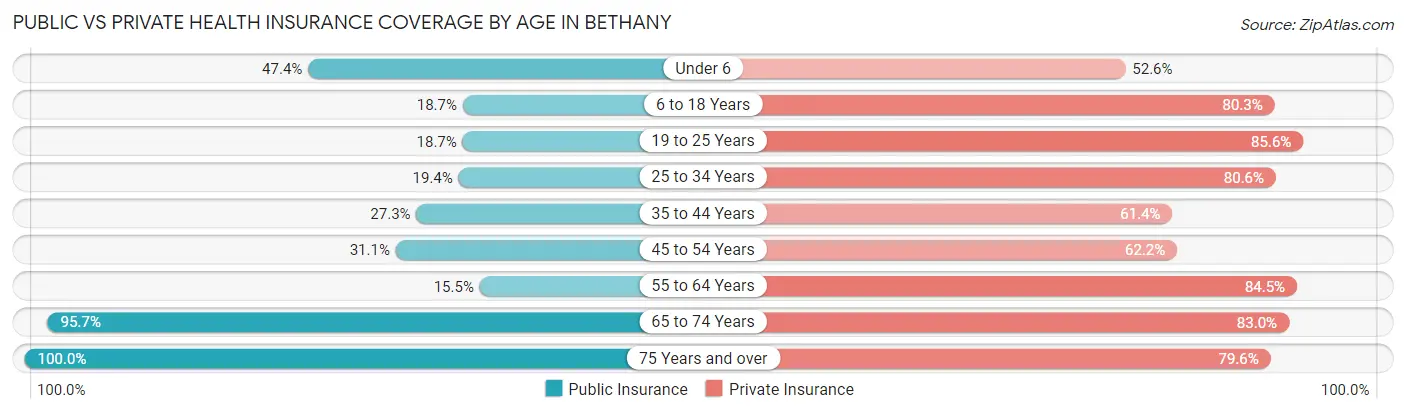
| Age Bracket | Public Insurance | Private Insurance |
| Under 6 | 18 (47.4%) | 20 (52.6%) |
| 6 to 18 Years | 56 (18.7%) | 241 (80.3%) |
| 19 to 25 Years | 95 (18.7%) | 435 (85.6%) |
| 25 to 34 Years | 7 (19.4%) | 29 (80.6%) |
| 35 to 44 Years | 12 (27.3%) | 27 (61.4%) |
| 45 to 54 Years | 14 (31.1%) | 28 (62.2%) |
| 55 to 64 Years | 9 (15.5%) | 49 (84.5%) |
| 65 to 74 Years | 45 (95.7%) | 39 (83.0%) |
| 75 Years and over | 49 (100.0%) | 39 (79.6%) |
| Total | 305 (27.1%) | 907 (80.6%) |
Disability Status by Sex by Age in Bethany
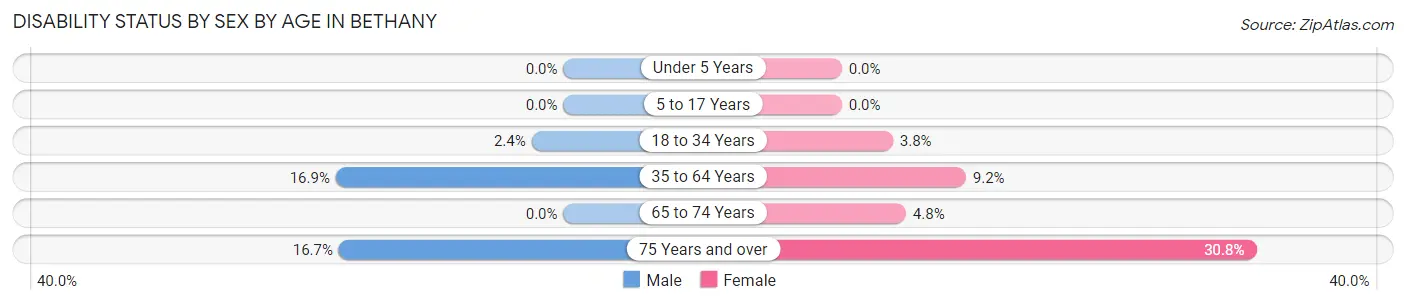
| Age Bracket | Male | Female |
| Under 5 Years | 0 (0.0%) | 0 (0.0%) |
| 5 to 17 Years | 0 (0.0%) | 0 (0.0%) |
| 18 to 34 Years | 11 (2.4%) | 13 (3.8%) |
| 35 to 64 Years | 12 (16.9%) | 7 (9.2%) |
| 65 to 74 Years | 0 (0.0%) | 1 (4.8%) |
| 75 Years and over | 6 (16.7%) | 4 (30.8%) |
Disability Class by Sex by Age in Bethany
Disability Class: Hearing Difficulty
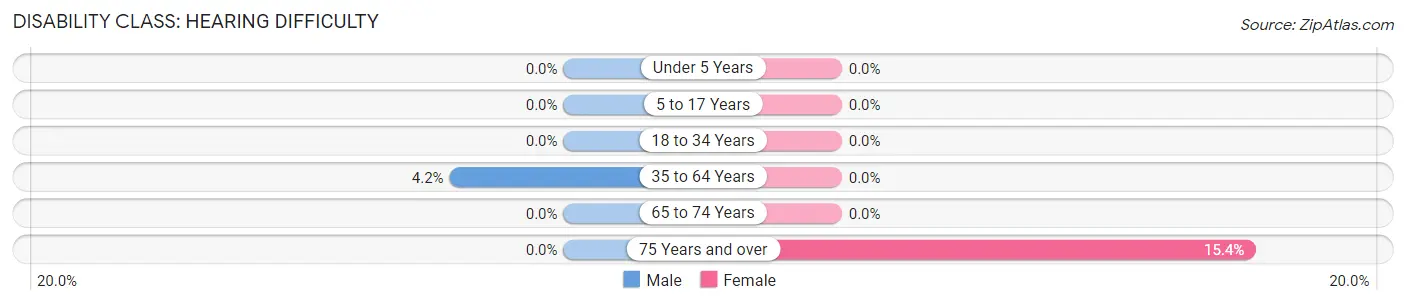
| Age Bracket | Male | Female |
| Under 5 Years | 0 (0.0%) | 0 (0.0%) |
| 5 to 17 Years | 0 (0.0%) | 0 (0.0%) |
| 18 to 34 Years | 0 (0.0%) | 0 (0.0%) |
| 35 to 64 Years | 3 (4.2%) | 0 (0.0%) |
| 65 to 74 Years | 0 (0.0%) | 0 (0.0%) |
| 75 Years and over | 0 (0.0%) | 2 (15.4%) |
Disability Class: Vision Difficulty
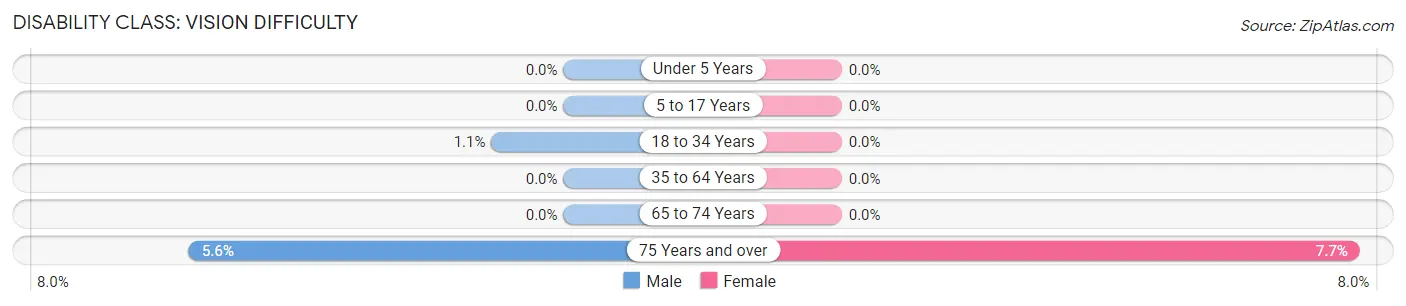
| Age Bracket | Male | Female |
| Under 5 Years | 0 (0.0%) | 0 (0.0%) |
| 5 to 17 Years | 0 (0.0%) | 0 (0.0%) |
| 18 to 34 Years | 5 (1.1%) | 0 (0.0%) |
| 35 to 64 Years | 0 (0.0%) | 0 (0.0%) |
| 65 to 74 Years | 0 (0.0%) | 0 (0.0%) |
| 75 Years and over | 2 (5.6%) | 1 (7.7%) |
Disability Class: Cognitive Difficulty
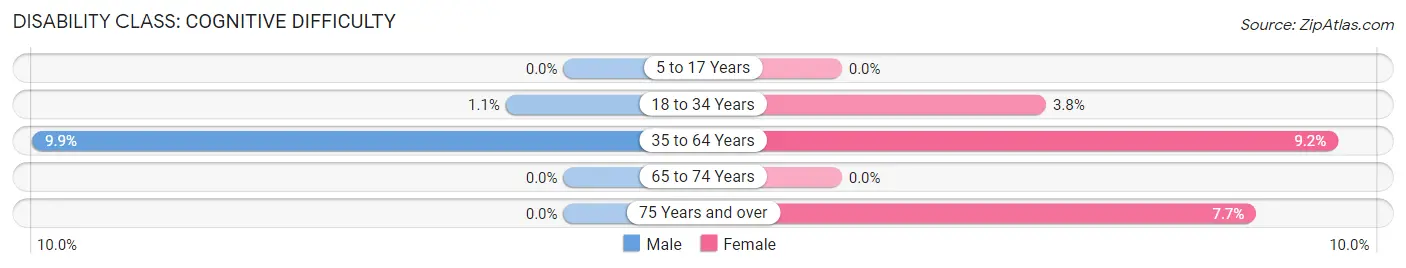
| Age Bracket | Male | Female |
| 5 to 17 Years | 0 (0.0%) | 0 (0.0%) |
| 18 to 34 Years | 5 (1.1%) | 13 (3.8%) |
| 35 to 64 Years | 7 (9.9%) | 7 (9.2%) |
| 65 to 74 Years | 0 (0.0%) | 0 (0.0%) |
| 75 Years and over | 0 (0.0%) | 1 (7.7%) |
Disability Class: Ambulatory Difficulty
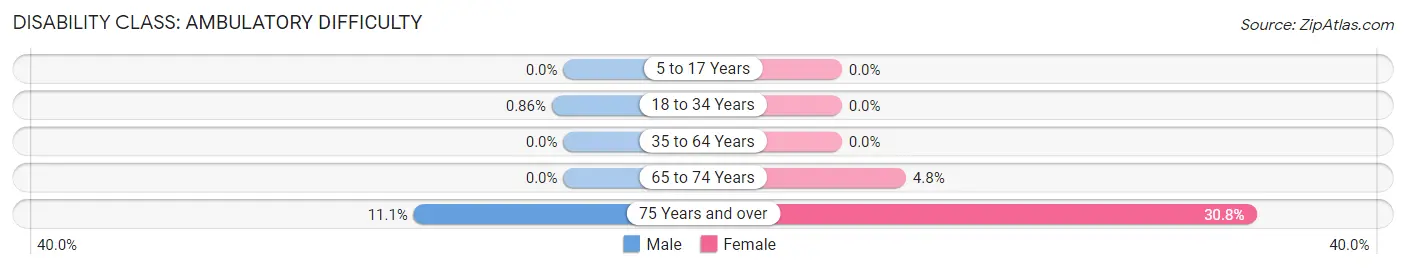
| Age Bracket | Male | Female |
| 5 to 17 Years | 0 (0.0%) | 0 (0.0%) |
| 18 to 34 Years | 4 (0.9%) | 0 (0.0%) |
| 35 to 64 Years | 0 (0.0%) | 0 (0.0%) |
| 65 to 74 Years | 0 (0.0%) | 1 (4.8%) |
| 75 Years and over | 4 (11.1%) | 4 (30.8%) |
Disability Class: Self-Care Difficulty
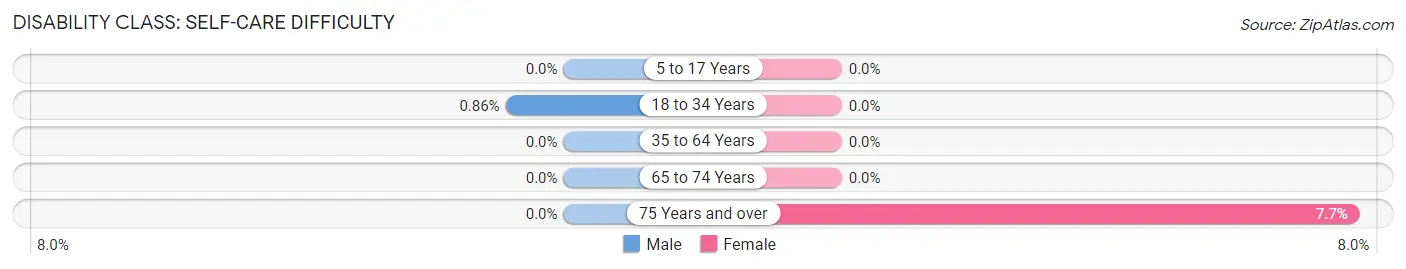
| Age Bracket | Male | Female |
| 5 to 17 Years | 0 (0.0%) | 0 (0.0%) |
| 18 to 34 Years | 4 (0.9%) | 0 (0.0%) |
| 35 to 64 Years | 0 (0.0%) | 0 (0.0%) |
| 65 to 74 Years | 0 (0.0%) | 0 (0.0%) |
| 75 Years and over | 0 (0.0%) | 1 (7.7%) |
Technology Access in Bethany
Computing Device Access in Bethany
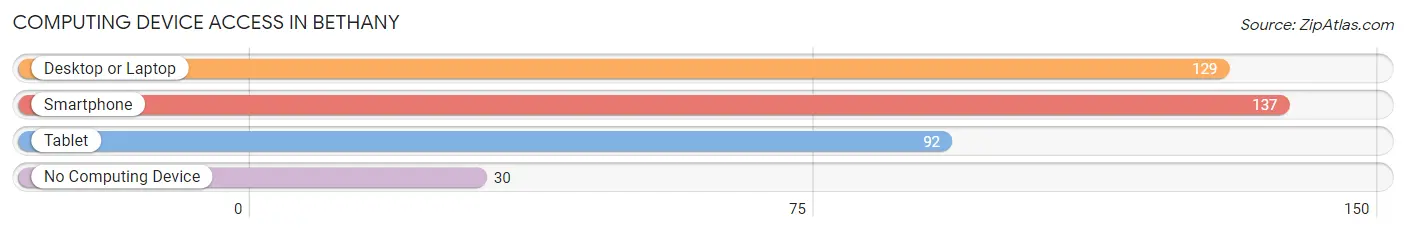
| Device Type | # Households | % Households |
| Desktop or Laptop | 129 | 73.3% |
| Smartphone | 137 | 77.8% |
| Tablet | 92 | 52.3% |
| No Computing Device | 30 | 17.1% |
| Total | 176 | 100.0% |
Internet Access in Bethany
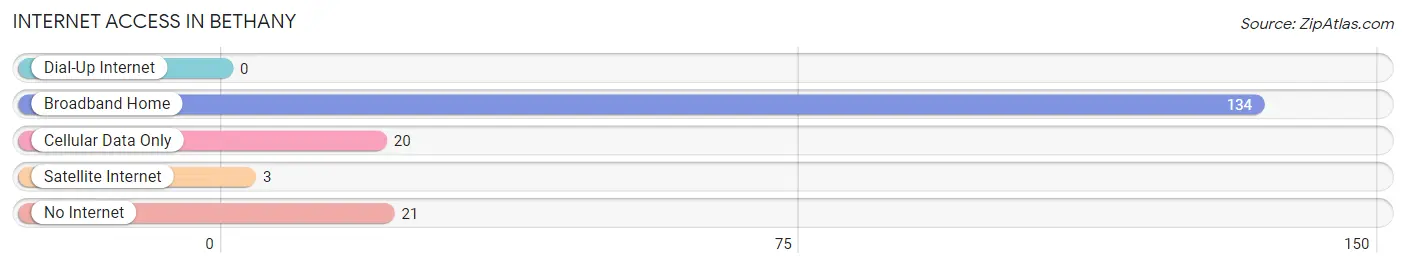
| Internet Type | # Households | % Households |
| Dial-Up Internet | 0 | 0.0% |
| Broadband Home | 134 | 76.1% |
| Cellular Data Only | 20 | 11.4% |
| Satellite Internet | 3 | 1.7% |
| No Internet | 21 | 11.9% |
| Total | 176 | 100.0% |
Bethany Summary
Bethany, West Virginia is a small town located in the northern panhandle of the state. It is situated in the Ohio River Valley, and is part of the Wheeling metropolitan area. The town was founded in 1818 by Alexander Campbell, a Scottish immigrant who was a leader in the Restoration Movement. The town was named after the biblical town of Bethany, and was the first college in the United States to be founded by a religious denomination.
Geography
Bethany is located in the northern panhandle of West Virginia, in the Ohio River Valley. It is situated in the northern part of Brooke County, and is bordered by the Ohio River to the north, and the states of Ohio and Pennsylvania to the east and west, respectively. The town is located approximately 30 miles west of Pittsburgh, Pennsylvania, and approximately 60 miles east of Columbus, Ohio. The town has a total area of 1.2 square miles, all of which is land.
Economy
Bethany is home to Bethany College, a private liberal arts college founded in 1840. The college is the oldest college in West Virginia, and is affiliated with the Christian Church (Disciples of Christ). The college is the primary economic driver in the town, providing jobs for faculty and staff, as well as students who work on campus. The town also has a few small businesses, including a grocery store, a hardware store, and a few restaurants.
Demographics
As of the 2010 census, Bethany had a population of 1,731. The racial makeup of the town was 95.3% White, 1.2% African American, 0.2% Native American, 0.7% Asian, 0.1% Pacific Islander, 0.7% from other races, and 1.9% from two or more races. Hispanic or Latino of any race were 1.7% of the population.
The median income for a household in the town was $37,500, and the median income for a family was $45,000. The per capita income for the town was $17,845. About 8.3% of families and 11.2% of the population were below the poverty line, including 14.3% of those under age 18 and 8.2% of those age 65 or over.
Conclusion
Bethany, West Virginia is a small town located in the northern panhandle of the state. It is situated in the Ohio River Valley, and is part of the Wheeling metropolitan area. The town was founded in 1818 by Alexander Campbell, a Scottish immigrant who was a leader in the Restoration Movement. The town is home to Bethany College, a private liberal arts college founded in 1840. The college is the primary economic driver in the town, providing jobs for faculty and staff, as well as students who work on campus. As of the 2010 census, Bethany had a population of 1,731. The median income for a household in the town was $37,500, and the median income for a family was $45,000. The town has a few small businesses, including a grocery store, a hardware store, and a few restaurants.
Common Questions
What is Per Capita Income in Bethany?
Per Capita income in Bethany is $15,571.
What is the Median Family Income in Bethany?
Median Family Income in Bethany is $69,861.
What is the Median Household income in Bethany?
Median Household Income in Bethany is $63,214.
What is Income or Wage Gap in Bethany?
Income or Wage Gap in Bethany is 23.9%.
Women in Bethany earn 76.1 cents for every dollar earned by a man.
What is Inequality or Gini Index in Bethany?
Inequality or Gini Index in Bethany is 0.38.
What is the Total Population of Bethany?
Total Population of Bethany is 1,125.
What is the Total Male Population of Bethany?
Total Male Population of Bethany is 647.
What is the Total Female Population of Bethany?
Total Female Population of Bethany is 478.
What is the Ratio of Males per 100 Females in Bethany?
There are 135.36 Males per 100 Females in Bethany.
What is the Ratio of Females per 100 Males in Bethany?
There are 73.88 Females per 100 Males in Bethany.
What is the Median Population Age in Bethany?
Median Population Age in Bethany is 20.1 Years.
What is the Average Family Size in Bethany
Average Family Size in Bethany is 2.8 People.
What is the Average Household Size in Bethany
Average Household Size in Bethany is 2.1 People.
How Large is the Labor Force in Bethany?
There are 475 People in the Labor Forcein in Bethany.
What is the Percentage of People in the Labor Force in Bethany?
45.0% of People are in the Labor Force in Bethany.
What is the Unemployment Rate in Bethany?
Unemployment Rate in Bethany is 5.1%.