Denmark, SC Map & Demographics
Denmark Map
Denmark Overview
$15,041
PER CAPITA INCOME
$58,819
AVG FAMILY INCOME
$32,679
AVG HOUSEHOLD INCOME
0.44
INEQUALITY / GINI INDEX
3,156
TOTAL POPULATION
1,540
MALE POPULATION
1,616
FEMALE POPULATION
95.30
MALES / 100 FEMALES
104.94
FEMALES / 100 MALES
29.6
MEDIAN AGE
4.5
AVG FAMILY SIZE
3.2
AVG HOUSEHOLD SIZE
1,086
LABOR FORCE [ PEOPLE ]
39.5%
PERCENT IN LABOR FORCE
16.3%
UNEMPLOYMENT RATE
Denmark Zip Codes
Denmark Area Codes
Income in Denmark
Income Overview in Denmark
Per Capita Income in Denmark is $15,041, while median incomes of families and households are $58,819 and $32,679 respectively.
| Characteristic | Number | Measure |
| Per Capita Income | 3,156 | $15,041 |
| Median Family Income | 426 | $58,819 |
| Mean Family Income | 426 | $55,662 |
| Median Household Income | 761 | $32,679 |
| Mean Household Income | 761 | $47,522 |
| Income Deficit | 426 | $0 |
| Wage / Income Gap (%) | 3,156 | 0.00% |
| Wage / Income Gap ($) | 3,156 | 100.00¢ per $1 |
| Gini / Inequality Index | 3,156 | 0.44 |
Earnings by Sex in Denmark
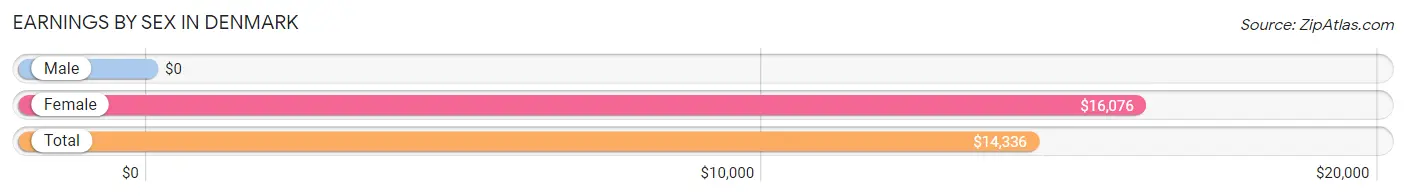
| Sex | Number | Average Earnings |
| Male | 627 (51.1%) | $0 |
| Female | 599 (48.9%) | $16,076 |
| Total | 1,226 (100.0%) | $14,336 |
Earnings by Sex by Income Bracket in Denmark
The most common earnings brackets in Denmark are $2,499 or less for men (203 | 32.4%) and $40,000 to $44,999 for women (79 | 13.2%).
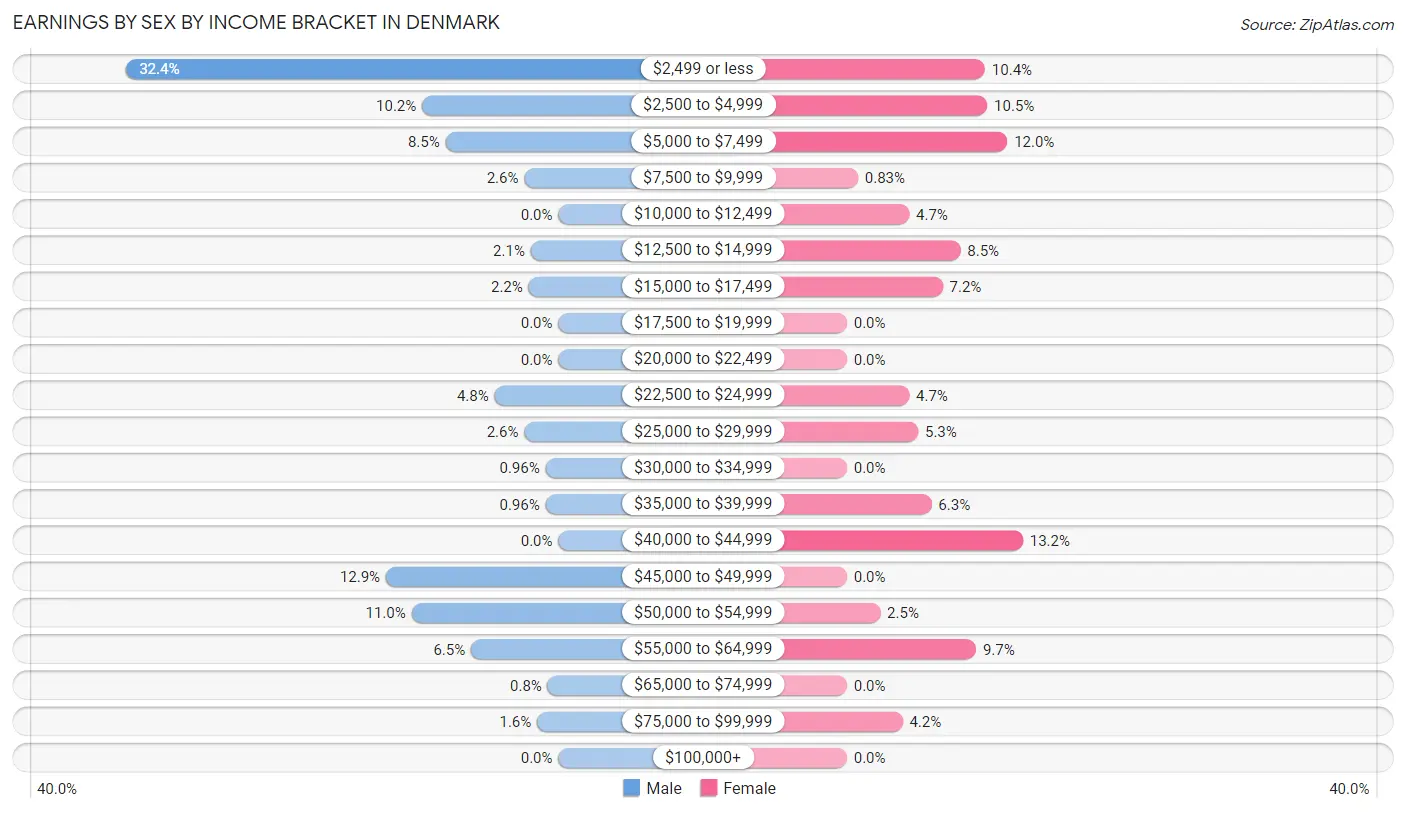
| Income | Male | Female |
| $2,499 or less | 203 (32.4%) | 62 (10.3%) |
| $2,500 to $4,999 | 64 (10.2%) | 63 (10.5%) |
| $5,000 to $7,499 | 53 (8.5%) | 72 (12.0%) |
| $7,500 to $9,999 | 16 (2.5%) | 5 (0.8%) |
| $10,000 to $12,499 | 0 (0.0%) | 28 (4.7%) |
| $12,500 to $14,999 | 13 (2.1%) | 51 (8.5%) |
| $15,000 to $17,499 | 14 (2.2%) | 43 (7.2%) |
| $17,500 to $19,999 | 0 (0.0%) | 0 (0.0%) |
| $20,000 to $22,499 | 0 (0.0%) | 0 (0.0%) |
| $22,500 to $24,999 | 30 (4.8%) | 28 (4.7%) |
| $25,000 to $29,999 | 16 (2.5%) | 32 (5.3%) |
| $30,000 to $34,999 | 6 (1.0%) | 0 (0.0%) |
| $35,000 to $39,999 | 6 (1.0%) | 38 (6.3%) |
| $40,000 to $44,999 | 0 (0.0%) | 79 (13.2%) |
| $45,000 to $49,999 | 81 (12.9%) | 0 (0.0%) |
| $50,000 to $54,999 | 69 (11.0%) | 15 (2.5%) |
| $55,000 to $64,999 | 41 (6.5%) | 58 (9.7%) |
| $65,000 to $74,999 | 5 (0.8%) | 0 (0.0%) |
| $75,000 to $99,999 | 10 (1.6%) | 25 (4.2%) |
| $100,000+ | 0 (0.0%) | 0 (0.0%) |
| Total | 627 (100.0%) | 599 (100.0%) |
Earnings by Sex by Educational Attainment in Denmark
Average earnings in Denmark are $49,599 for men and $40,167 for women, a difference of 19.0%. Men with an educational attainment of high school diploma enjoy the highest average annual earnings of $24,792, while those with high school diploma education earn the least with $24,792. Women with an educational attainment of graduate degree earn the most with the average annual earnings of $56,354, while those with high school diploma education have the smallest earnings of $16,750.
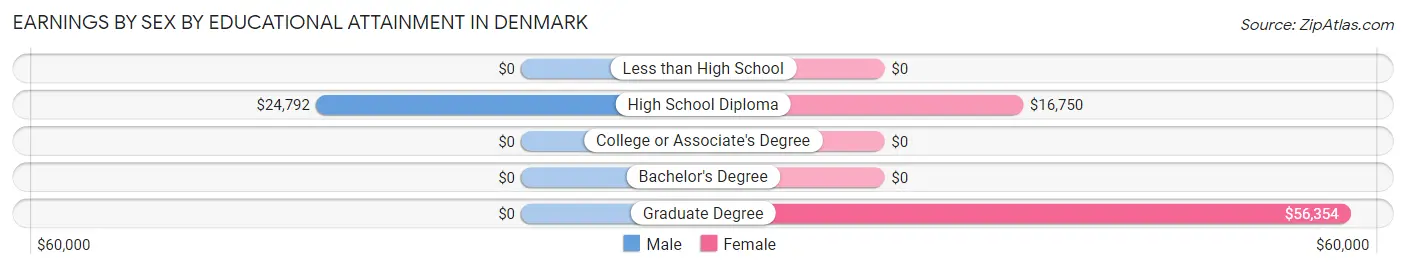
| Educational Attainment | Male Income | Female Income |
| Less than High School | - | - |
| High School Diploma | $24,792 | $16,750 |
| College or Associate's Degree | - | - |
| Bachelor's Degree | - | - |
| Graduate Degree | - | - |
| Total | $49,599 | $40,167 |
Family Income in Denmark
Family Income Brackets in Denmark
According to the Denmark family income data, there are 130 families falling into the $50,000 to $74,999 income range, which is the most common income bracket and makes up 30.5% of all families.
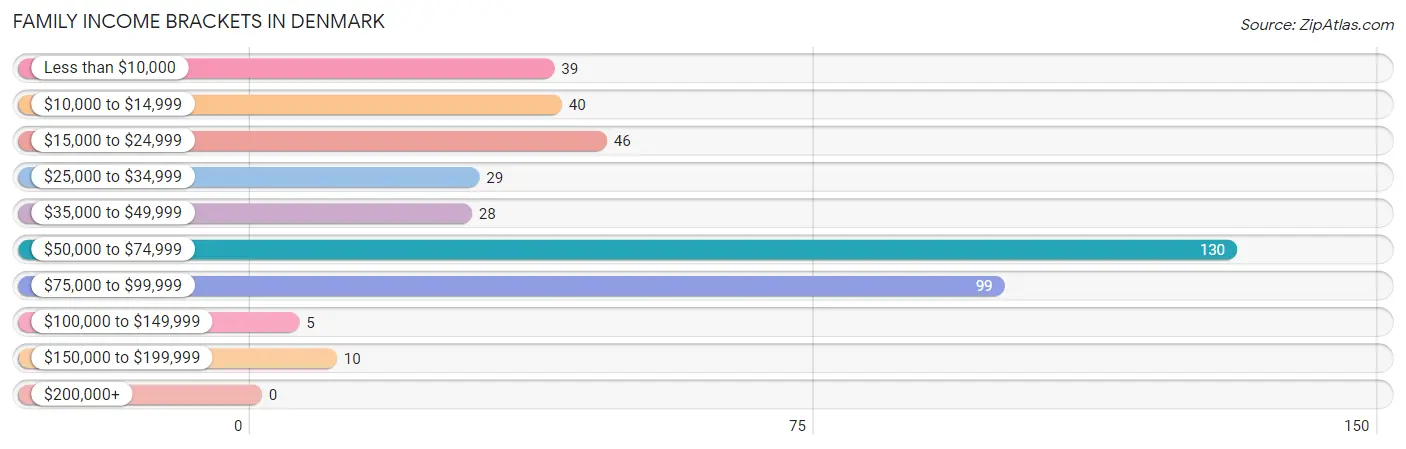
| Income Bracket | # Families | % Families |
| Less than $10,000 | 39 | 9.2% |
| $10,000 to $14,999 | 40 | 9.4% |
| $15,000 to $24,999 | 46 | 10.8% |
| $25,000 to $34,999 | 29 | 6.8% |
| $35,000 to $49,999 | 28 | 6.6% |
| $50,000 to $74,999 | 130 | 30.5% |
| $75,000 to $99,999 | 99 | 23.2% |
| $100,000 to $149,999 | 5 | 1.2% |
| $150,000 to $199,999 | 10 | 2.3% |
| $200,000+ | 0 | 0.0% |
Family Income by Famaliy Size in Denmark
3-person families (71 | 16.7%) account for the highest median family income in Denmark with $67,958 per family, while 3-person families (71 | 16.7%) have the highest median income of $22,653 per family member.
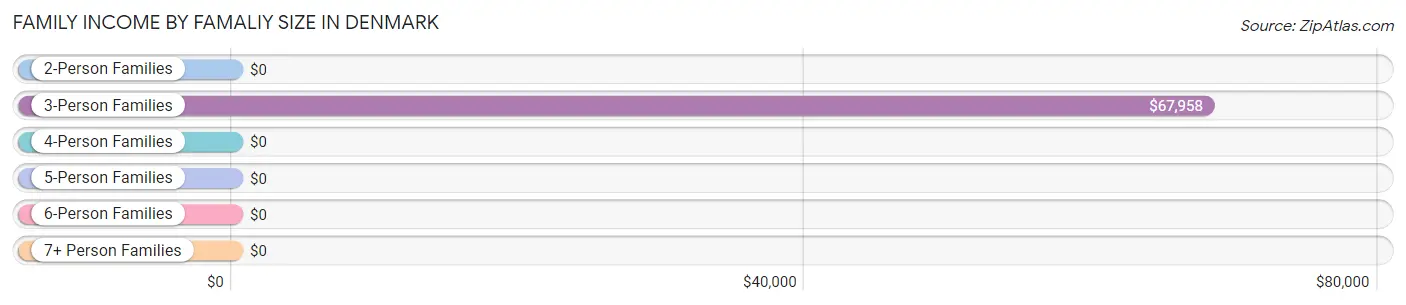
| Income Bracket | # Families | Median Income |
| 2-Person Families | 171 (40.1%) | $0 |
| 3-Person Families | 71 (16.7%) | $67,958 |
| 4-Person Families | 21 (4.9%) | $0 |
| 5-Person Families | 94 (22.1%) | $0 |
| 6-Person Families | 69 (16.2%) | $0 |
| 7+ Person Families | 0 (0.0%) | $0 |
| Total | 426 (100.0%) | $58,819 |
Family Income by Number of Earners in Denmark
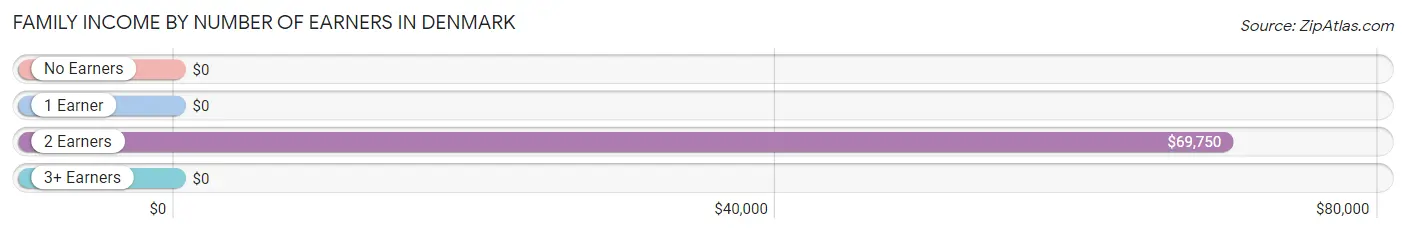
| Number of Earners | # Families | Median Income |
| No Earners | 94 (22.1%) | $0 |
| 1 Earner | 168 (39.4%) | $0 |
| 2 Earners | 164 (38.5%) | $69,750 |
| 3+ Earners | 0 (0.0%) | $0 |
| Total | 426 (100.0%) | $58,819 |
Household Income in Denmark
Household Income Brackets in Denmark
With 164 households falling in the category, the $10,000 to $14,999 income range is the most frequent in Denmark, accounting for 21.5% of all households.
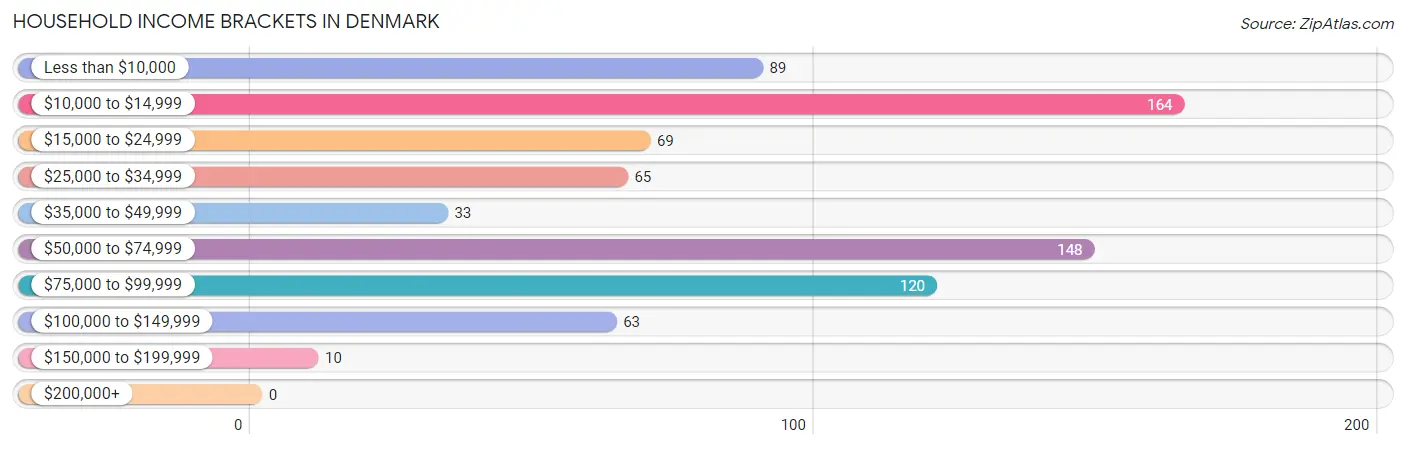
| Income Bracket | # Households | % Households |
| Less than $10,000 | 89 | 11.7% |
| $10,000 to $14,999 | 164 | 21.6% |
| $15,000 to $24,999 | 69 | 9.1% |
| $25,000 to $34,999 | 65 | 8.5% |
| $35,000 to $49,999 | 33 | 4.3% |
| $50,000 to $74,999 | 148 | 19.4% |
| $75,000 to $99,999 | 120 | 15.8% |
| $100,000 to $149,999 | 63 | 8.3% |
| $150,000 to $199,999 | 10 | 1.3% |
| $200,000+ | 0 | 0.0% |
Household Income by Householder Age in Denmark
The median household income in Denmark is $32,679, with the highest median household income of $69,071 found in the 45 to 64 years age bracket for the primary householder. A total of 330 households (43.4%) fall into this category. Meanwhile, the 15 to 24 years age bracket for the primary householder has the lowest median household income of $0, with 11 households (1.5%) in this group.
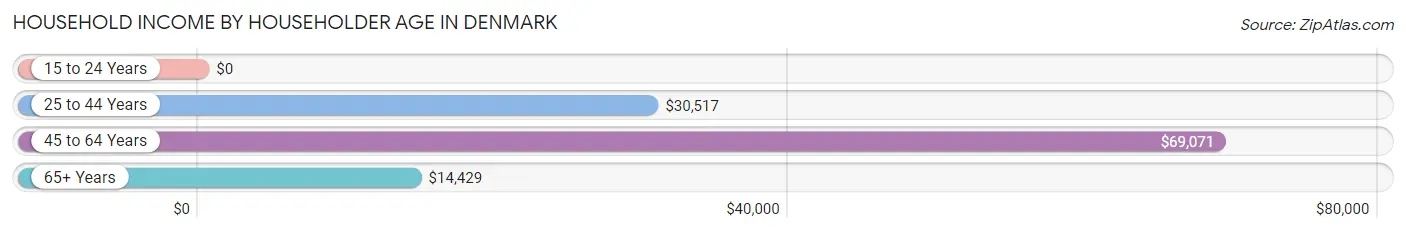
| Income Bracket | # Households | Median Income |
| 15 to 24 Years | 11 (1.5%) | $0 |
| 25 to 44 Years | 206 (27.1%) | $30,517 |
| 45 to 64 Years | 330 (43.4%) | $69,071 |
| 65+ Years | 214 (28.1%) | $14,429 |
| Total | 761 (100.0%) | $32,679 |
Poverty in Denmark
Income Below Poverty by Sex and Age in Denmark
With 29.0% poverty level for males and 30.0% for females among the residents of Denmark, under 5 year old males and under 5 year old females are the most vulnerable to poverty, with 36 males (97.3%) and 36 females (100.0%) in their respective age groups living below the poverty level.
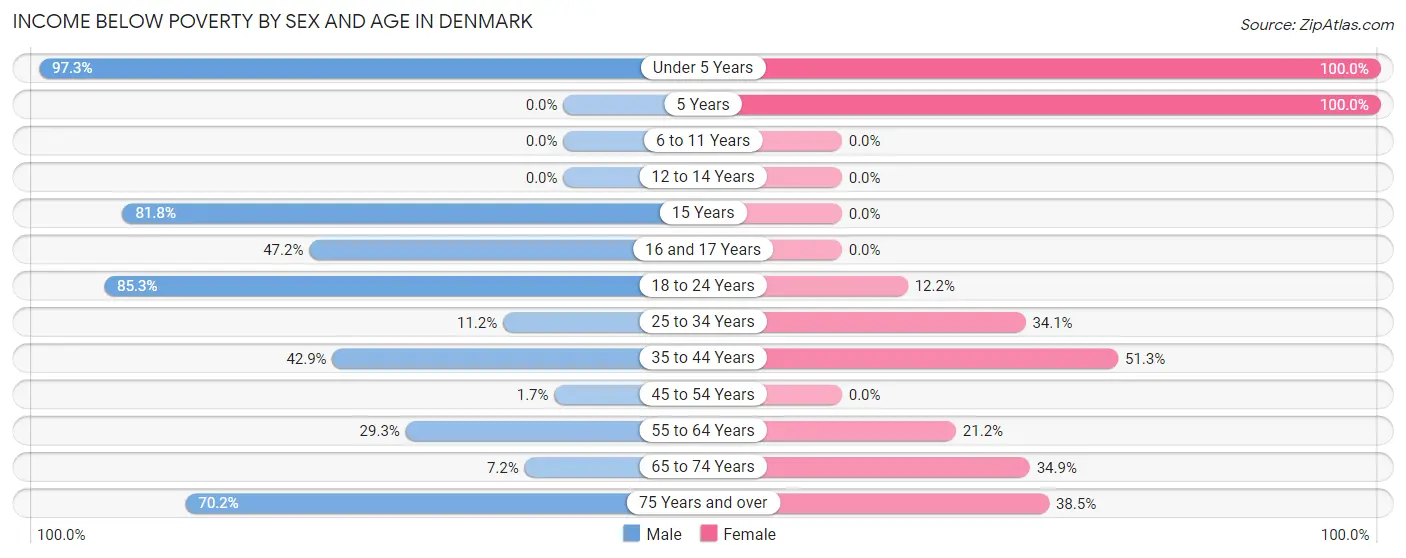
| Age Bracket | Male | Female |
| Under 5 Years | 36 (97.3%) | 36 (100.0%) |
| 5 Years | 0 (0.0%) | 57 (100.0%) |
| 6 to 11 Years | 0 (0.0%) | 0 (0.0%) |
| 12 to 14 Years | 0 (0.0%) | 0 (0.0%) |
| 15 Years | 18 (81.8%) | 0 (0.0%) |
| 16 and 17 Years | 25 (47.2%) | 0 (0.0%) |
| 18 to 24 Years | 104 (85.3%) | 41 (12.2%) |
| 25 to 34 Years | 16 (11.2%) | 45 (34.1%) |
| 35 to 44 Years | 15 (42.9%) | 40 (51.3%) |
| 45 to 54 Years | 2 (1.7%) | 0 (0.0%) |
| 55 to 64 Years | 72 (29.3%) | 43 (21.2%) |
| 65 to 74 Years | 9 (7.2%) | 45 (34.9%) |
| 75 Years and over | 47 (70.2%) | 90 (38.5%) |
| Total | 344 (29.0%) | 397 (30.0%) |
Income Above Poverty by Sex and Age in Denmark
According to the poverty statistics in Denmark, males aged 6 to 11 years and females aged 6 to 11 years are the age groups that are most secure financially, with 100.0% of males and 100.0% of females in these age groups living above the poverty line.
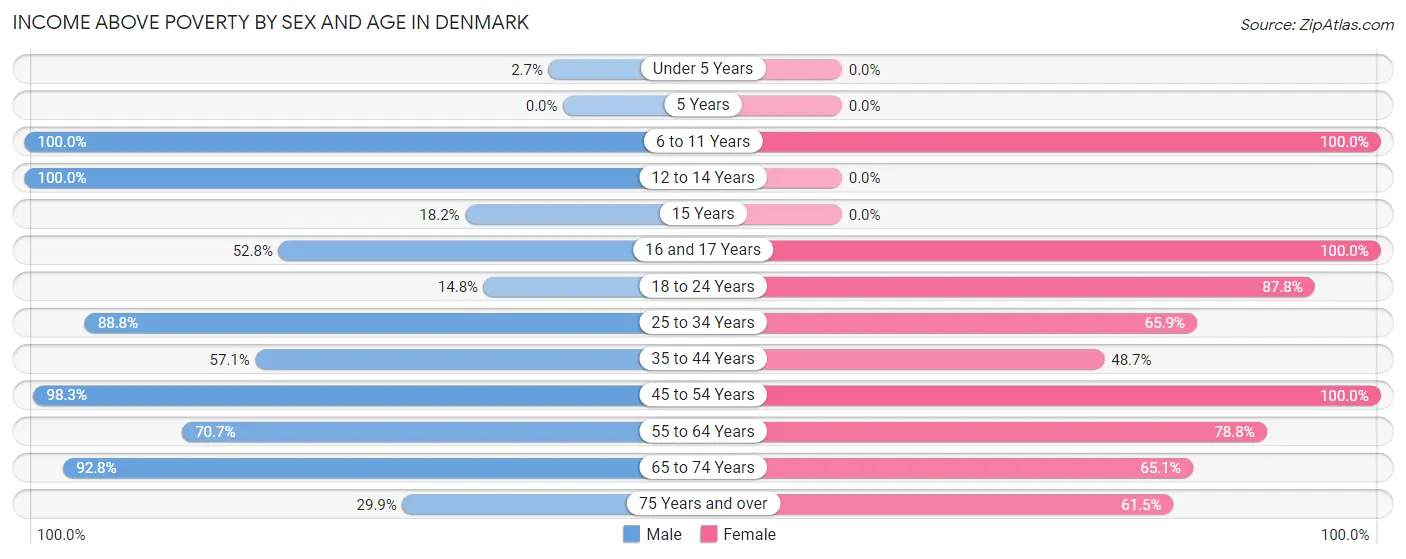
| Age Bracket | Male | Female |
| Under 5 Years | 1 (2.7%) | 0 (0.0%) |
| 5 Years | 0 (0.0%) | 0 (0.0%) |
| 6 to 11 Years | 84 (100.0%) | 13 (100.0%) |
| 12 to 14 Years | 131 (100.0%) | 0 (0.0%) |
| 15 Years | 4 (18.2%) | 0 (0.0%) |
| 16 and 17 Years | 28 (52.8%) | 13 (100.0%) |
| 18 to 24 Years | 18 (14.7%) | 294 (87.8%) |
| 25 to 34 Years | 127 (88.8%) | 87 (65.9%) |
| 35 to 44 Years | 20 (57.1%) | 38 (48.7%) |
| 45 to 54 Years | 118 (98.3%) | 92 (100.0%) |
| 55 to 64 Years | 174 (70.7%) | 160 (78.8%) |
| 65 to 74 Years | 116 (92.8%) | 84 (65.1%) |
| 75 Years and over | 20 (29.8%) | 144 (61.5%) |
| Total | 841 (71.0%) | 925 (70.0%) |
Income Below Poverty Among Married-Couple Families in Denmark
The poverty statistics for married-couple families in Denmark show that 11.8% or 21 of the total 178 families live below the poverty line. Families with no children have the highest poverty rate of 23.1%, comprising of 21 families. On the other hand, families with 1 or 2 children have the lowest poverty rate of 0.0%, which includes 0 families.
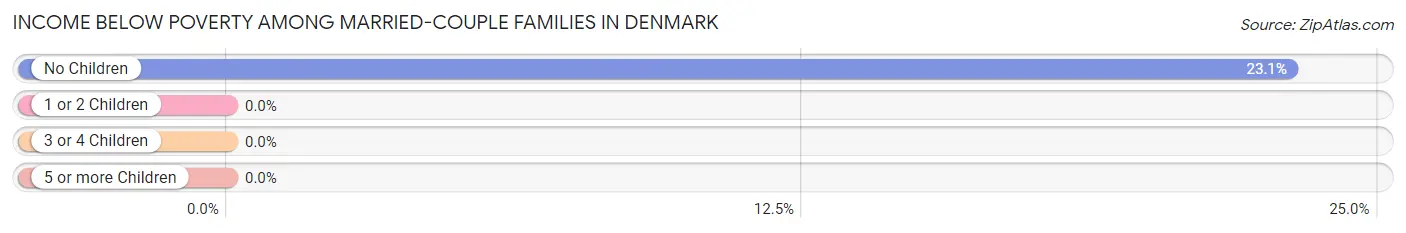
| Children | Above Poverty | Below Poverty |
| No Children | 70 (76.9%) | 21 (23.1%) |
| 1 or 2 Children | 73 (100.0%) | 0 (0.0%) |
| 3 or 4 Children | 14 (100.0%) | 0 (0.0%) |
| 5 or more Children | 0 (0.0%) | 0 (0.0%) |
| Total | 157 (88.2%) | 21 (11.8%) |
Income Below Poverty Among Single-Parent Households in Denmark
According to the poverty data in Denmark, 66.7% or 12 single-father households and 37.4% or 86 single-mother households are living below the poverty line. Among single-father households, those with no children have the highest poverty rate, with 12 households (66.7%) experiencing poverty. Likewise, among single-mother households, those with 3 or 4 children have the highest poverty rate, with 29 households (100.0%) falling below the poverty line.
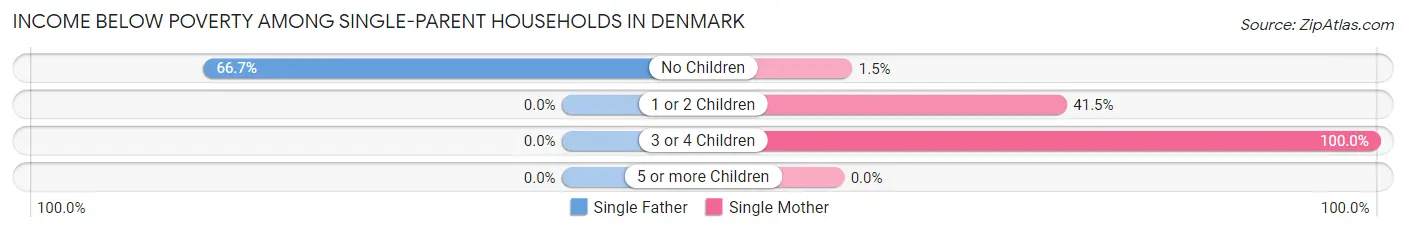
| Children | Single Father | Single Mother |
| No Children | 12 (66.7%) | 1 (1.5%) |
| 1 or 2 Children | 0 (0.0%) | 56 (41.5%) |
| 3 or 4 Children | 0 (0.0%) | 29 (100.0%) |
| 5 or more Children | 0 (0.0%) | 0 (0.0%) |
| Total | 12 (66.7%) | 86 (37.4%) |
Income Below Poverty Among Married-Couple vs Single-Parent Households in Denmark
The poverty data for Denmark shows that 21 of the married-couple family households (11.8%) and 98 of the single-parent households (39.5%) are living below the poverty level. Within the married-couple family households, those with no children have the highest poverty rate, with 21 households (23.1%) falling below the poverty line. Among the single-parent households, those with 3 or 4 children have the highest poverty rate, with 29 household (100.0%) living below poverty.
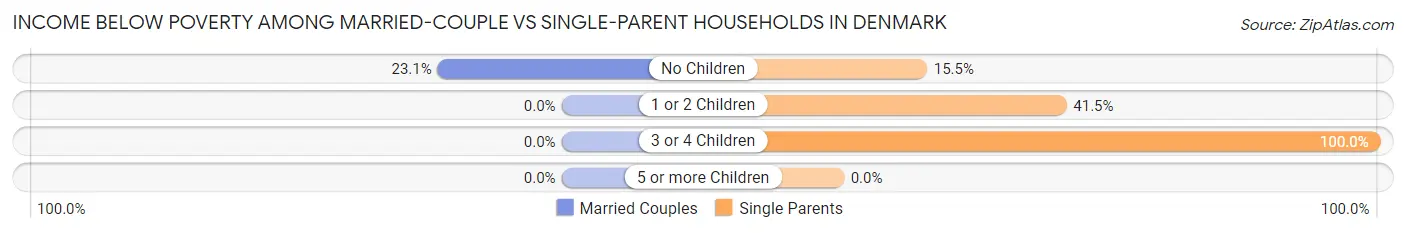
| Children | Married-Couple Families | Single-Parent Households |
| No Children | 21 (23.1%) | 13 (15.5%) |
| 1 or 2 Children | 0 (0.0%) | 56 (41.5%) |
| 3 or 4 Children | 0 (0.0%) | 29 (100.0%) |
| 5 or more Children | 0 (0.0%) | 0 (0.0%) |
| Total | 21 (11.8%) | 98 (39.5%) |
Race in Denmark
The most populous races in Denmark are Black / African American (2,659 | 84.3%), White / Caucasian (404 | 12.8%), and Two or more Races (60 | 1.9%).
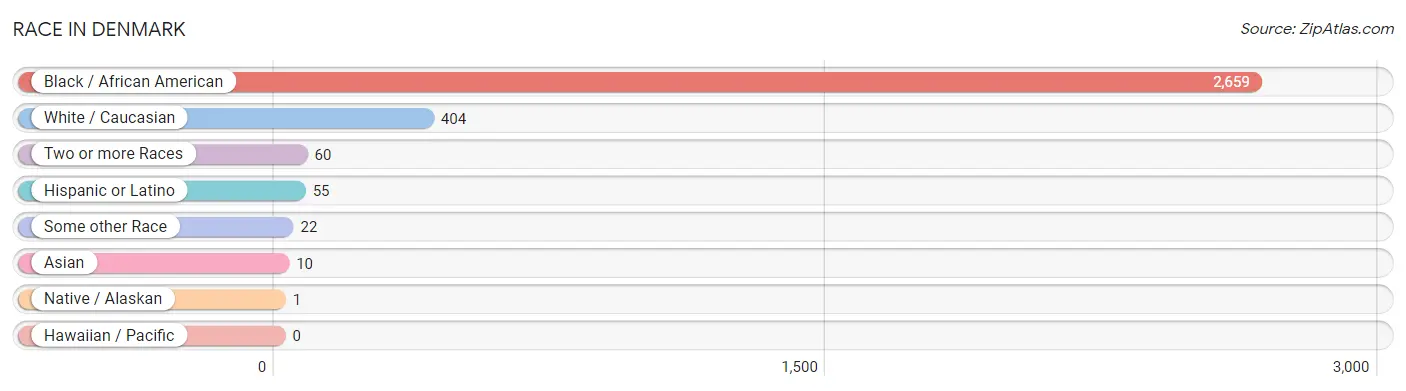
| Race | # Population | % Population |
| Asian | 10 | 0.3% |
| Black / African American | 2,659 | 84.3% |
| Hawaiian / Pacific | 0 | 0.0% |
| Hispanic or Latino | 55 | 1.7% |
| Native / Alaskan | 1 | 0.0% |
| White / Caucasian | 404 | 12.8% |
| Two or more Races | 60 | 1.9% |
| Some other Race | 22 | 0.7% |
| Total | 3,156 | 100.0% |
Ancestry in Denmark
The most populous ancestries reported in Denmark are Subsaharan African (365 | 11.6%), Liberian (352 | 11.2%), American (132 | 4.2%), Irish (54 | 1.7%), and German (51 | 1.6%), together accounting for 30.2% of all Denmark residents.
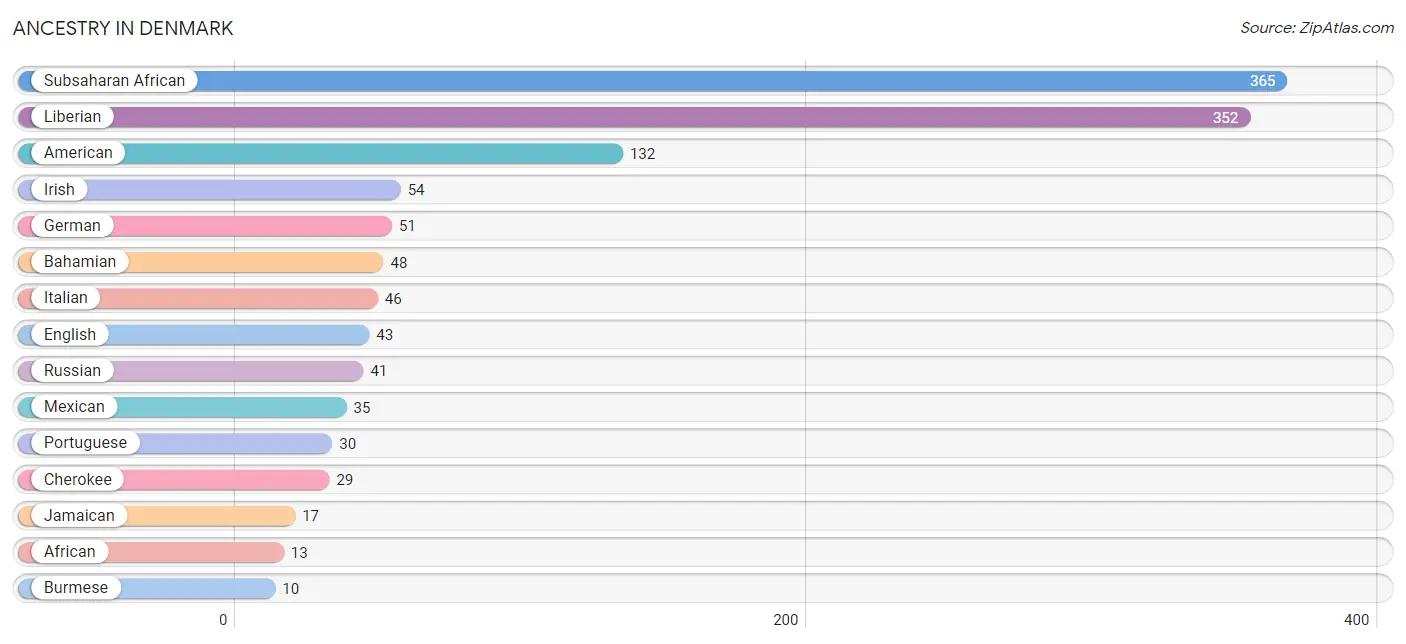
| Ancestry | # Population | % Population |
| African | 13 | 0.4% |
| American | 132 | 4.2% |
| Bahamian | 48 | 1.5% |
| Burmese | 10 | 0.3% |
| Central American | 9 | 0.3% |
| Cherokee | 29 | 0.9% |
| English | 43 | 1.4% |
| European | 10 | 0.3% |
| French | 8 | 0.3% |
| French Canadian | 7 | 0.2% |
| German | 51 | 1.6% |
| Greek | 9 | 0.3% |
| Guatemalan | 9 | 0.3% |
| Indian (Asian) | 1 | 0.0% |
| Irish | 54 | 1.7% |
| Italian | 46 | 1.5% |
| Jamaican | 17 | 0.5% |
| Korean | 1 | 0.0% |
| Liberian | 352 | 11.2% |
| Mexican | 35 | 1.1% |
| Native Hawaiian | 1 | 0.0% |
| Portuguese | 30 | 0.9% |
| Puerto Rican | 1 | 0.0% |
| Russian | 41 | 1.3% |
| Samoan | 1 | 0.0% |
| Scotch-Irish | 4 | 0.1% |
| Sri Lankan | 1 | 0.0% |
| Subsaharan African | 365 | 11.6% |
| Thai | 1 | 0.0% |
| Welsh | 7 | 0.2% | View All 30 Rows |
Immigrants in Denmark
The most numerous immigrant groups reported in Denmark came from Africa (352 | 11.2%), Liberia (352 | 11.2%), Western Africa (352 | 11.2%), Caribbean (60 | 1.9%), and Latin America (60 | 1.9%), together accounting for 37.3% of all Denmark residents.
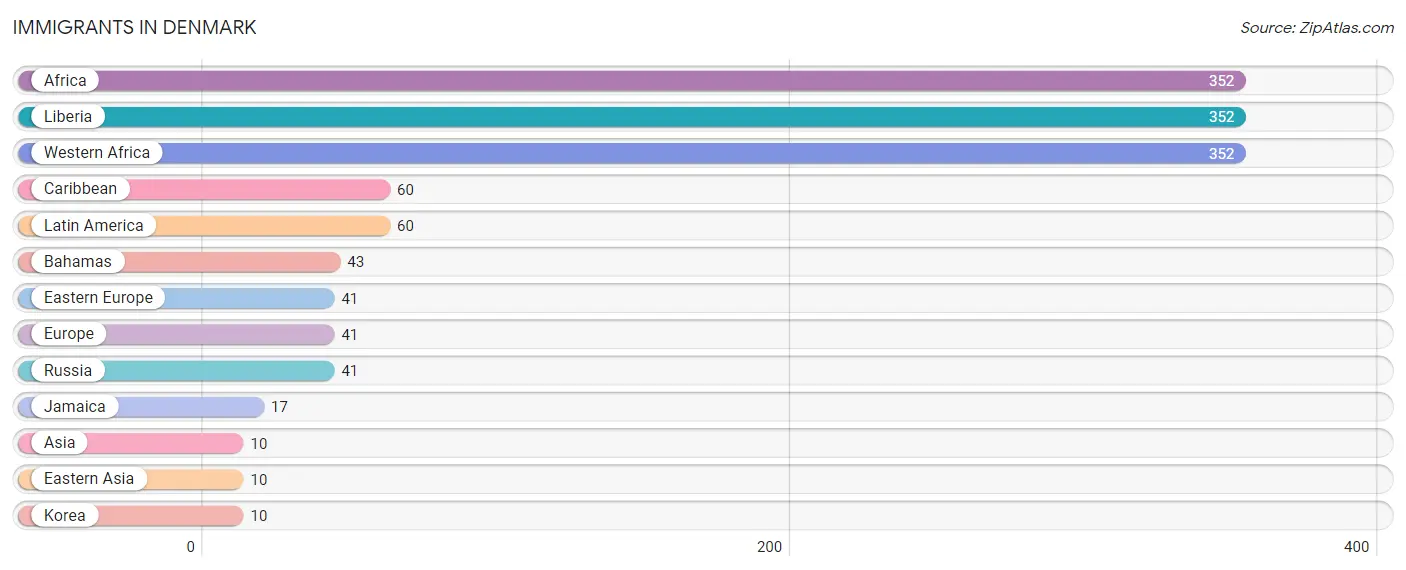
| Immigration Origin | # Population | % Population |
| Africa | 352 | 11.2% |
| Asia | 10 | 0.3% |
| Bahamas | 43 | 1.4% |
| Caribbean | 60 | 1.9% |
| Eastern Asia | 10 | 0.3% |
| Eastern Europe | 41 | 1.3% |
| Europe | 41 | 1.3% |
| Jamaica | 17 | 0.5% |
| Korea | 10 | 0.3% |
| Latin America | 60 | 1.9% |
| Liberia | 352 | 11.2% |
| Russia | 41 | 1.3% |
| Western Africa | 352 | 11.2% | View All 13 Rows |
Sex and Age in Denmark
Sex and Age in Denmark
The most populous age groups in Denmark are 15 to 19 Years (410 | 26.6%) for men and 20 to 24 Years (391 | 24.2%) for women.
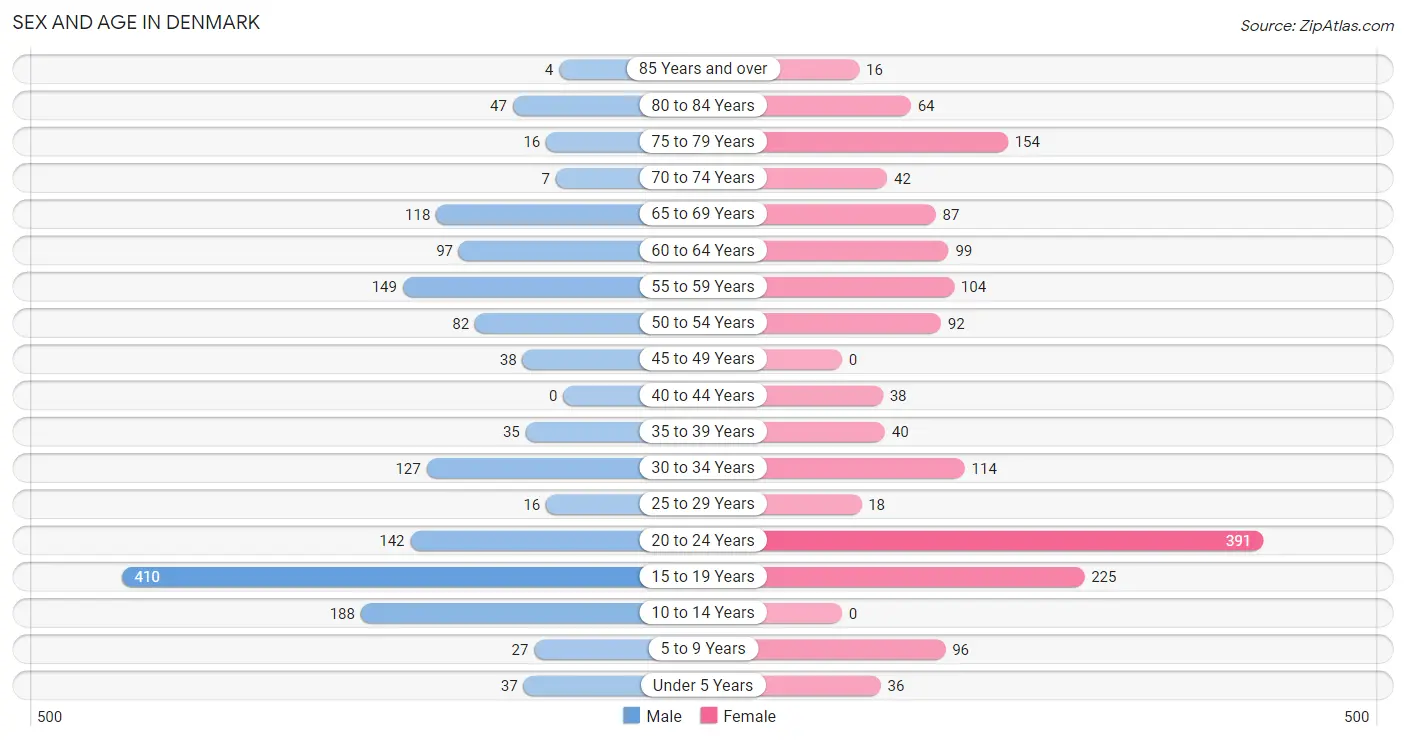
| Age Bracket | Male | Female |
| Under 5 Years | 37 (2.4%) | 36 (2.2%) |
| 5 to 9 Years | 27 (1.8%) | 96 (5.9%) |
| 10 to 14 Years | 188 (12.2%) | 0 (0.0%) |
| 15 to 19 Years | 410 (26.6%) | 225 (13.9%) |
| 20 to 24 Years | 142 (9.2%) | 391 (24.2%) |
| 25 to 29 Years | 16 (1.0%) | 18 (1.1%) |
| 30 to 34 Years | 127 (8.3%) | 114 (7.0%) |
| 35 to 39 Years | 35 (2.3%) | 40 (2.5%) |
| 40 to 44 Years | 0 (0.0%) | 38 (2.4%) |
| 45 to 49 Years | 38 (2.5%) | 0 (0.0%) |
| 50 to 54 Years | 82 (5.3%) | 92 (5.7%) |
| 55 to 59 Years | 149 (9.7%) | 104 (6.4%) |
| 60 to 64 Years | 97 (6.3%) | 99 (6.1%) |
| 65 to 69 Years | 118 (7.7%) | 87 (5.4%) |
| 70 to 74 Years | 7 (0.4%) | 42 (2.6%) |
| 75 to 79 Years | 16 (1.0%) | 154 (9.5%) |
| 80 to 84 Years | 47 (3.0%) | 64 (4.0%) |
| 85 Years and over | 4 (0.3%) | 16 (1.0%) |
| Total | 1,540 (100.0%) | 1,616 (100.0%) |
Families and Households in Denmark
Median Family Size in Denmark
The median family size in Denmark is 4.46 persons per family, with single female/mother families (230 | 54.0%) accounting for the largest median family size of 4.68 persons per family. On the other hand, single male/father families (18 | 4.2%) represent the smallest median family size with 2.83 persons per family.
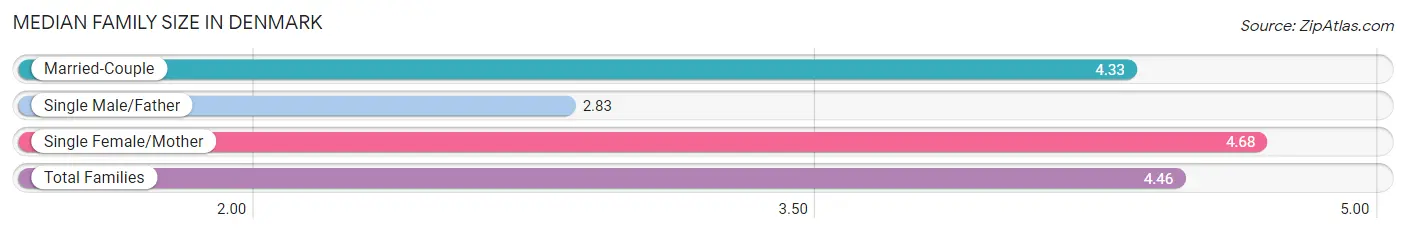
| Family Type | # Families | Family Size |
| Married-Couple | 178 (41.8%) | 4.33 |
| Single Male/Father | 18 (4.2%) | 2.83 |
| Single Female/Mother | 230 (54.0%) | 4.68 |
| Total Families | 426 (100.0%) | 4.46 |
Median Household Size in Denmark
The median household size in Denmark is 3.25 persons per household, with single female/mother households (230 | 30.2%) accounting for the largest median household size of 4.83 persons per household. non-family households (335 | 44.0%) represent the smallest median household size with 1.55 persons per household.
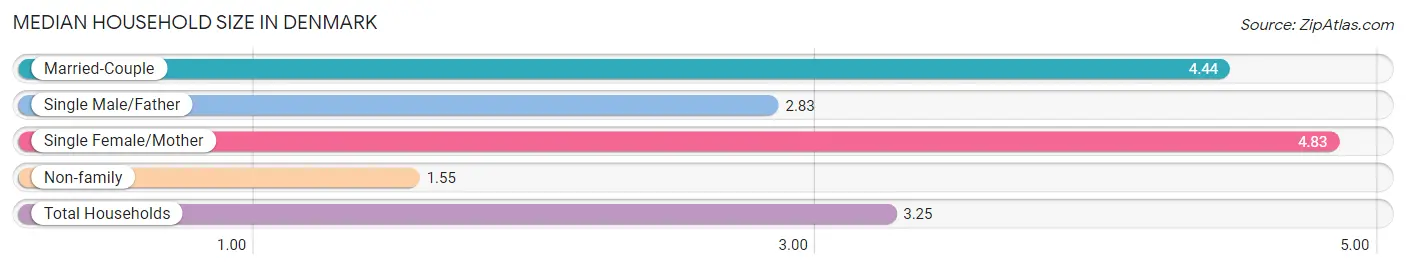
| Household Type | # Households | Household Size |
| Married-Couple | 178 (23.4%) | 4.44 |
| Single Male/Father | 18 (2.4%) | 2.83 |
| Single Female/Mother | 230 (30.2%) | 4.83 |
| Non-family | 335 (44.0%) | 1.55 |
| Total Households | 761 (100.0%) | 3.25 |
Household Size by Marriage Status in Denmark
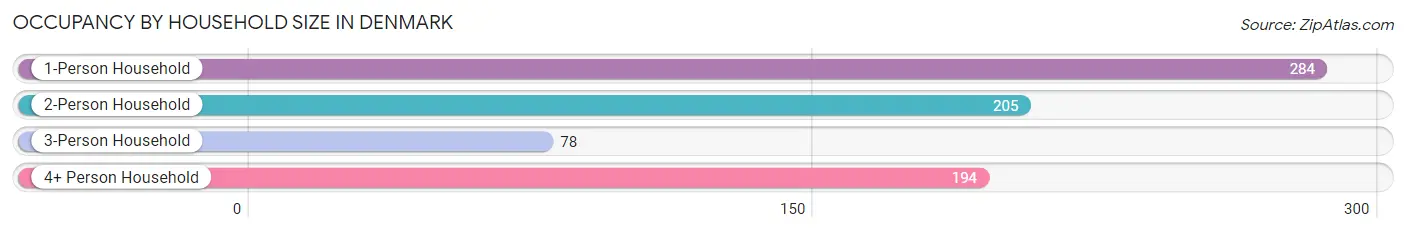
Out of a total of 761 households in Denmark, 426 (56.0%) are family households, while 335 (44.0%) are nonfamily households. The most numerous type of family households are 2-person households, comprising 164, and the most common type of nonfamily households are 1-person households, comprising 284.
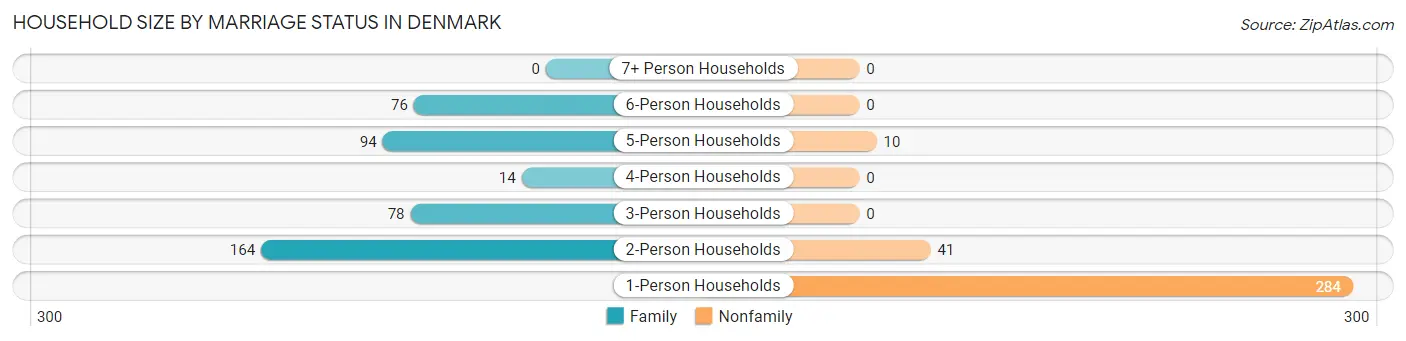
| Household Size | Family Households | Nonfamily Households |
| 1-Person Households | - | 284 (37.3%) |
| 2-Person Households | 164 (21.5%) | 41 (5.4%) |
| 3-Person Households | 78 (10.2%) | 0 (0.0%) |
| 4-Person Households | 14 (1.8%) | 0 (0.0%) |
| 5-Person Households | 94 (12.3%) | 10 (1.3%) |
| 6-Person Households | 76 (10.0%) | 0 (0.0%) |
| 7+ Person Households | 0 (0.0%) | 0 (0.0%) |
| Total | 426 (56.0%) | 335 (44.0%) |
Female Fertility in Denmark
Fertility by Age in Denmark
Average fertility rate in Denmark is 3.0 births per 1,000 women. Women in the age bracket of 20 to 34 years have the highest fertility rate with 6.0 births per 1,000 women. Women in the age bracket of 20 to 34 years acount for 100.0% of all women with births.
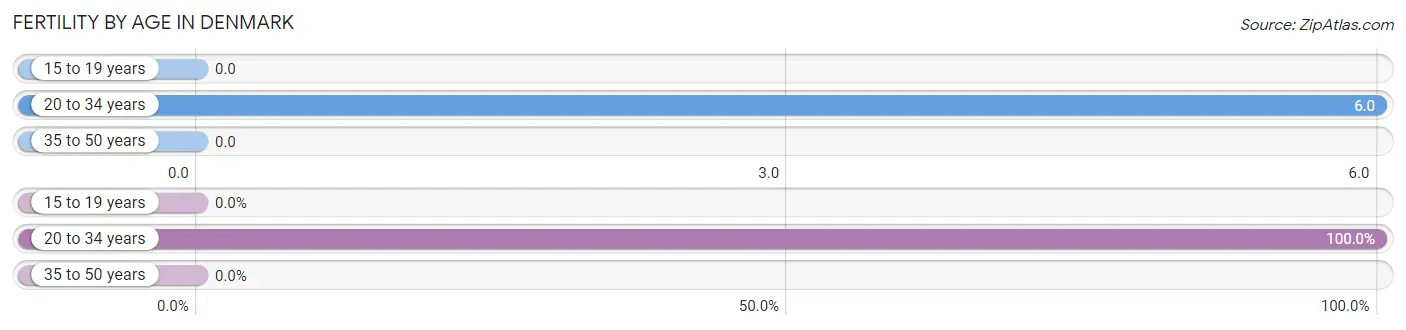
| Age Bracket | Women with Births | Births / 1,000 Women |
| 15 to 19 years | 0 (0.0%) | 0.0 |
| 20 to 34 years | 3 (100.0%) | 6.0 |
| 35 to 50 years | 0 (0.0%) | 0.0 |
| Total | 3 (100.0%) | 3.0 |
Fertility by Age by Marriage Status in Denmark
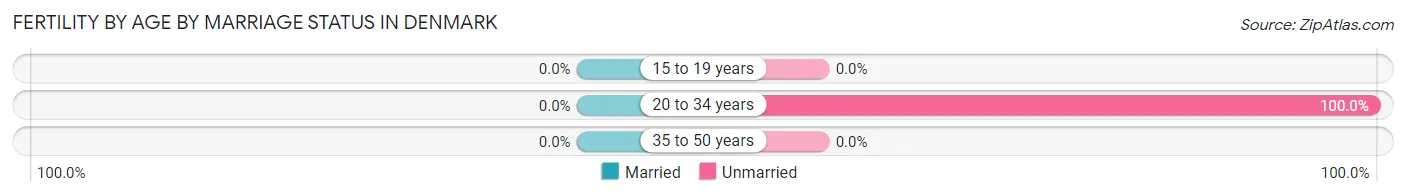
| Age Bracket | Married | Unmarried |
| 15 to 19 years | 0 (0.0%) | 0 (0.0%) |
| 20 to 34 years | 0 (0.0%) | 3 (100.0%) |
| 35 to 50 years | 0 (0.0%) | 0 (0.0%) |
| Total | 0 (0.0%) | 3 (100.0%) |
Fertility by Education in Denmark
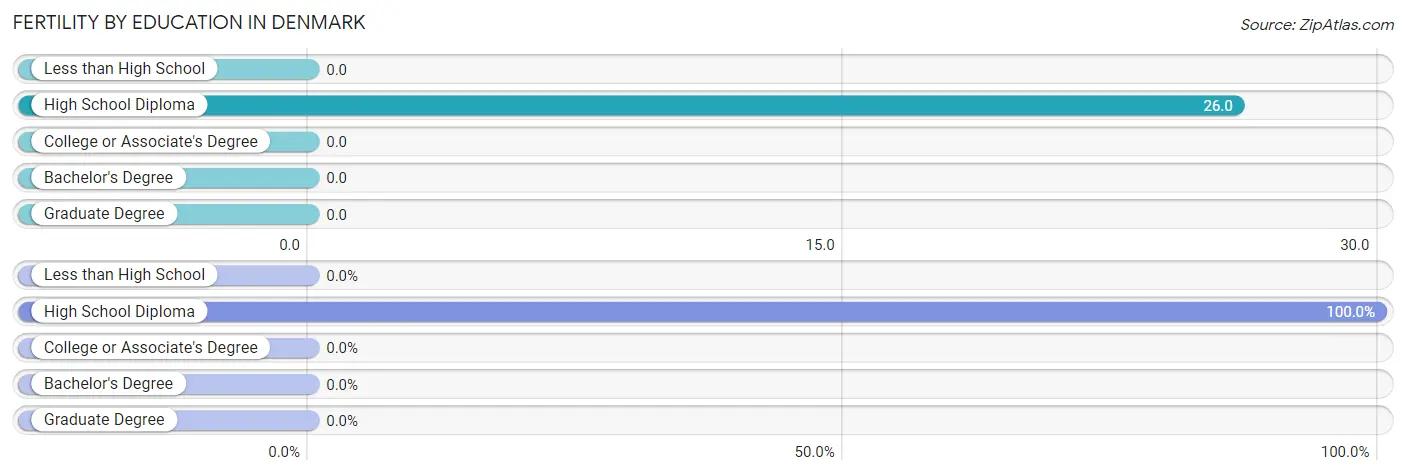
| Educational Attainment | Women with Births | Births / 1,000 Women |
| Less than High School | 0 (0.0%) | 0.0 |
| High School Diploma | 3 (100.0%) | 26.0 |
| College or Associate's Degree | 0 (0.0%) | 0.0 |
| Bachelor's Degree | 0 (0.0%) | 0.0 |
| Graduate Degree | 0 (0.0%) | 0.0 |
| Total | 3 (100.0%) | 3.0 |
Fertility by Education by Marriage Status in Denmark
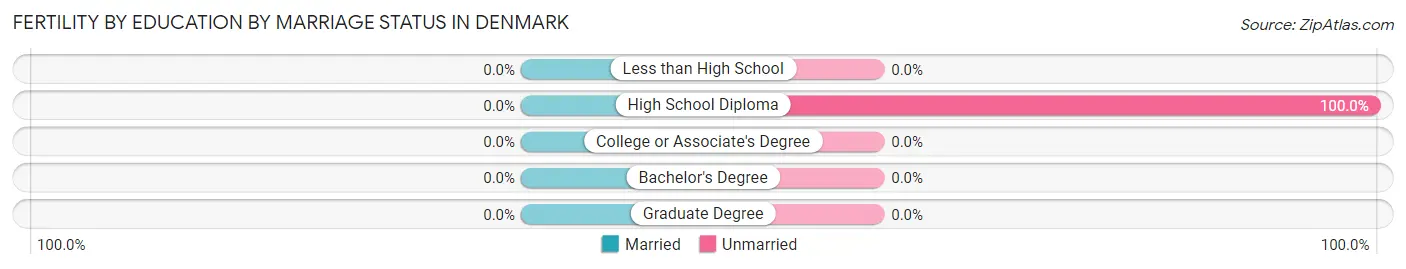
| Educational Attainment | Married | Unmarried |
| Less than High School | 0 (0.0%) | 0 (0.0%) |
| High School Diploma | 0 (0.0%) | 3 (100.0%) |
| College or Associate's Degree | 0 (0.0%) | 0 (0.0%) |
| Bachelor's Degree | 0 (0.0%) | 0 (0.0%) |
| Graduate Degree | 0 (0.0%) | 0 (0.0%) |
| Total | 0 (0.0%) | 3 (100.0%) |
Employment Characteristics in Denmark
Employment by Class of Employer in Denmark
Among the 874 employed individuals in Denmark, private company employees (586 | 67.0%), not-for-profit organizations (162 | 18.5%), and self-employed (not incorporated) (54 | 6.2%) make up the most common classes of employment.
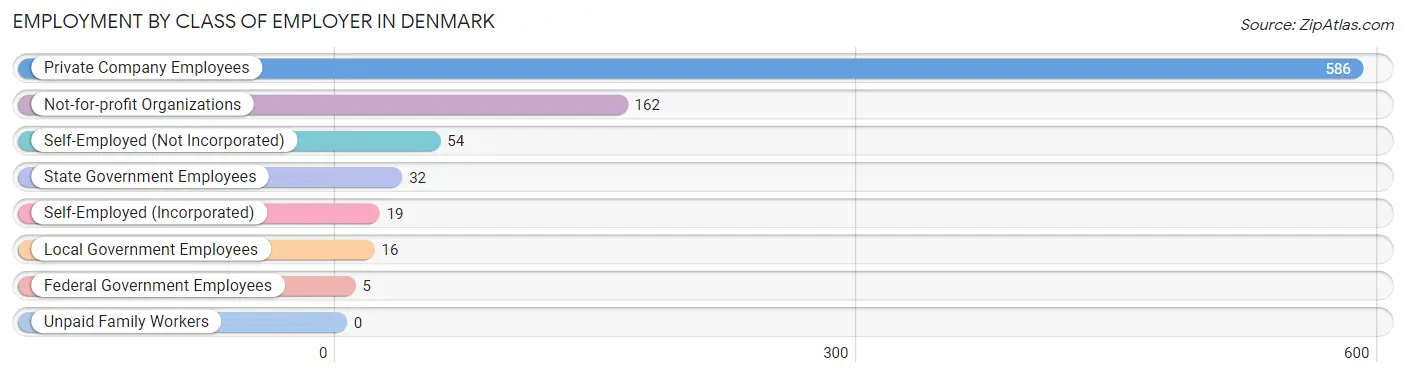
| Employer Class | # Employees | % Employees |
| Private Company Employees | 586 | 67.0% |
| Self-Employed (Incorporated) | 19 | 2.2% |
| Self-Employed (Not Incorporated) | 54 | 6.2% |
| Not-for-profit Organizations | 162 | 18.5% |
| Local Government Employees | 16 | 1.8% |
| State Government Employees | 32 | 3.7% |
| Federal Government Employees | 5 | 0.6% |
| Unpaid Family Workers | 0 | 0.0% |
| Total | 874 | 100.0% |
Employment Status by Age in Denmark
According to the labor force statistics for Denmark, out of the total population over 16 years of age (2,750), 39.5% or 1,086 individuals are in the labor force, with 16.3% or 177 of them unemployed. The age group with the highest labor force participation rate is 30 to 34 years, with 100.0% or 241 individuals in the labor force. Within the labor force, the 65 to 74 years age range has the highest percentage of unemployed individuals, with 83.3% or 25 of them being unemployed.
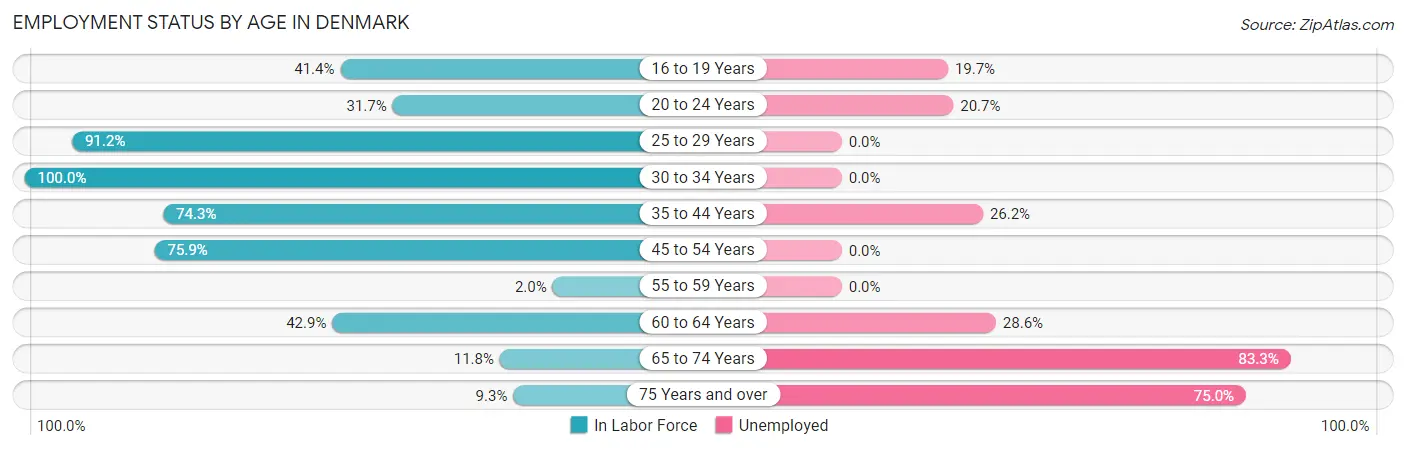
| Age Bracket | In Labor Force | Unemployed |
| 16 to 19 Years | 254 (41.4%) | 50 (19.7%) |
| 20 to 24 Years | 169 (31.7%) | 35 (20.7%) |
| 25 to 29 Years | 31 (91.2%) | 0 (0.0%) |
| 30 to 34 Years | 241 (100.0%) | 0 (0.0%) |
| 35 to 44 Years | 84 (74.3%) | 22 (26.2%) |
| 45 to 54 Years | 161 (75.9%) | 0 (0.0%) |
| 55 to 59 Years | 5 (2.0%) | 0 (0.0%) |
| 60 to 64 Years | 84 (42.9%) | 24 (28.6%) |
| 65 to 74 Years | 30 (11.8%) | 25 (83.3%) |
| 75 Years and over | 28 (9.3%) | 21 (75.0%) |
| Total | 1,086 (39.5%) | 177 (16.3%) |
Employment Status by Educational Attainment in Denmark
According to labor force statistics for Denmark, 57.8% of individuals (606) out of the total population between 25 and 64 years of age (1,049) are in the labor force, with 7.6% or 46 of them being unemployed. The group with the highest labor force participation rate are those with the educational attainment of bachelor's degree or higher, with 96.7% or 232 individuals in the labor force. Within the labor force, individuals with bachelor's degree or higher education have the highest percentage of unemployment, with 15.1% or 35 of them being unemployed.
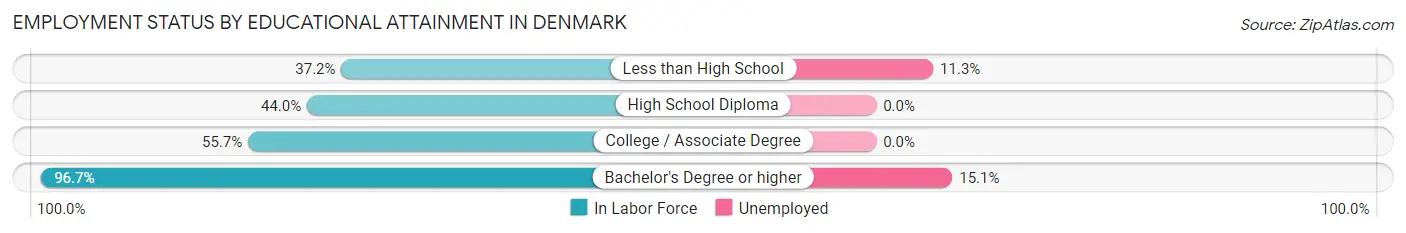
| Educational Attainment | In Labor Force | Unemployed |
| Less than High School | 97 (37.2%) | 29 (11.3%) |
| High School Diploma | 107 (44.0%) | 0 (0.0%) |
| College / Associate Degree | 170 (55.7%) | 0 (0.0%) |
| Bachelor's Degree or higher | 232 (96.7%) | 36 (15.1%) |
| Total | 606 (57.8%) | 80 (7.6%) |
Employment Occupations by Sex in Denmark
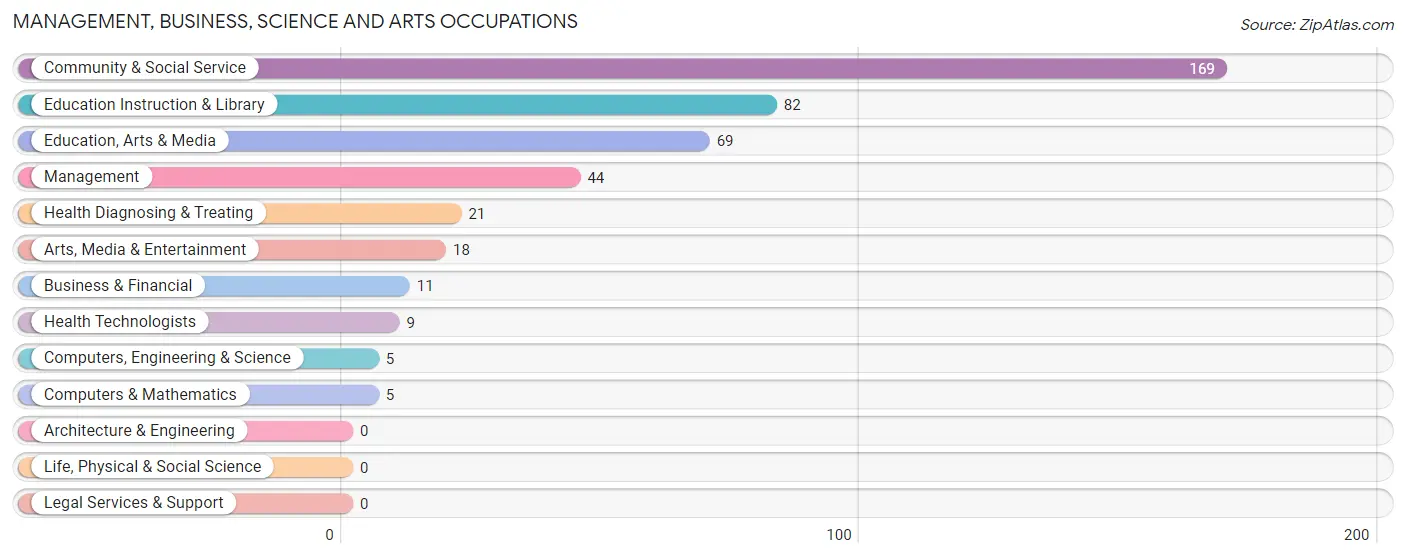
Management, Business, Science and Arts Occupations
The most common Management, Business, Science and Arts occupations in Denmark are Community & Social Service (169 | 18.6%), Education Instruction & Library (82 | 9.0%), Education, Arts & Media (69 | 7.6%), Management (44 | 4.8%), and Health Diagnosing & Treating (21 | 2.3%).
Management, Business, Science and Arts Occupations by Sex
Within the Management, Business, Science and Arts occupations in Denmark, the most male-oriented occupations are Computers, Engineering & Science (100.0%), Computers & Mathematics (100.0%), and Education, Arts & Media (100.0%), while the most female-oriented occupations are Management (100.0%), Health Diagnosing & Treating (100.0%), and Health Technologists (100.0%).
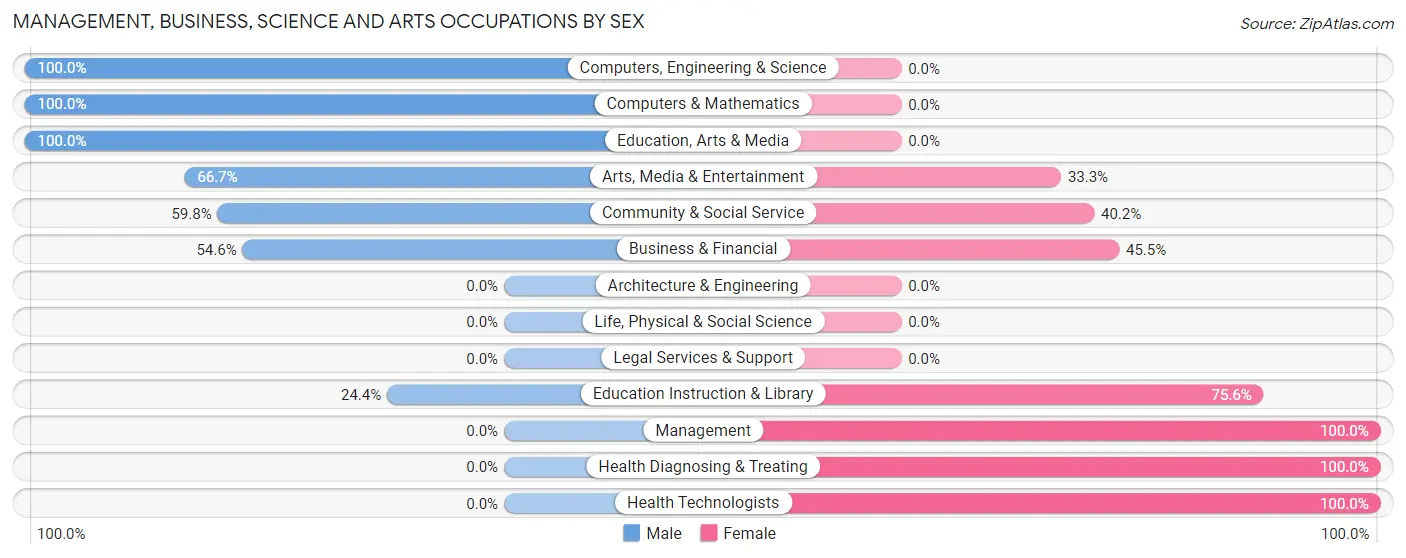
| Occupation | Male | Female |
| Management | 0 (0.0%) | 44 (100.0%) |
| Business & Financial | 6 (54.5%) | 5 (45.5%) |
| Computers, Engineering & Science | 5 (100.0%) | 0 (0.0%) |
| Computers & Mathematics | 5 (100.0%) | 0 (0.0%) |
| Architecture & Engineering | 0 (0.0%) | 0 (0.0%) |
| Life, Physical & Social Science | 0 (0.0%) | 0 (0.0%) |
| Community & Social Service | 101 (59.8%) | 68 (40.2%) |
| Education, Arts & Media | 69 (100.0%) | 0 (0.0%) |
| Legal Services & Support | 0 (0.0%) | 0 (0.0%) |
| Education Instruction & Library | 20 (24.4%) | 62 (75.6%) |
| Arts, Media & Entertainment | 12 (66.7%) | 6 (33.3%) |
| Health Diagnosing & Treating | 0 (0.0%) | 21 (100.0%) |
| Health Technologists | 0 (0.0%) | 9 (100.0%) |
| Total (Category) | 112 (44.8%) | 138 (55.2%) |
| Total (Overall) | 407 (44.7%) | 503 (55.3%) |
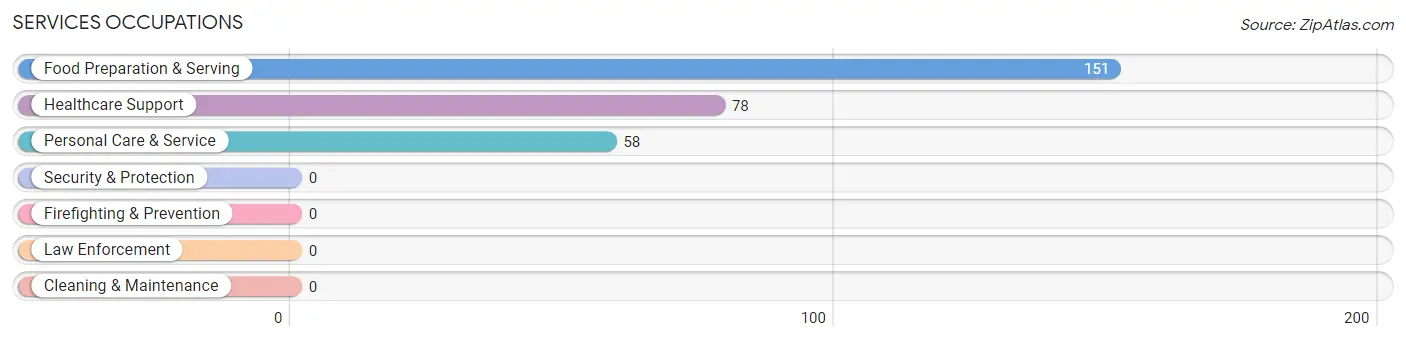
Services Occupations
The most common Services occupations in Denmark are Food Preparation & Serving (151 | 16.6%), Healthcare Support (78 | 8.6%), and Personal Care & Service (58 | 6.4%).
Services Occupations by Sex
Within the Services occupations in Denmark, the most male-oriented occupations are Food Preparation & Serving (43.0%), Personal Care & Service (24.1%), and Healthcare Support (6.4%), while the most female-oriented occupations are Healthcare Support (93.6%), Personal Care & Service (75.9%), and Food Preparation & Serving (57.0%).
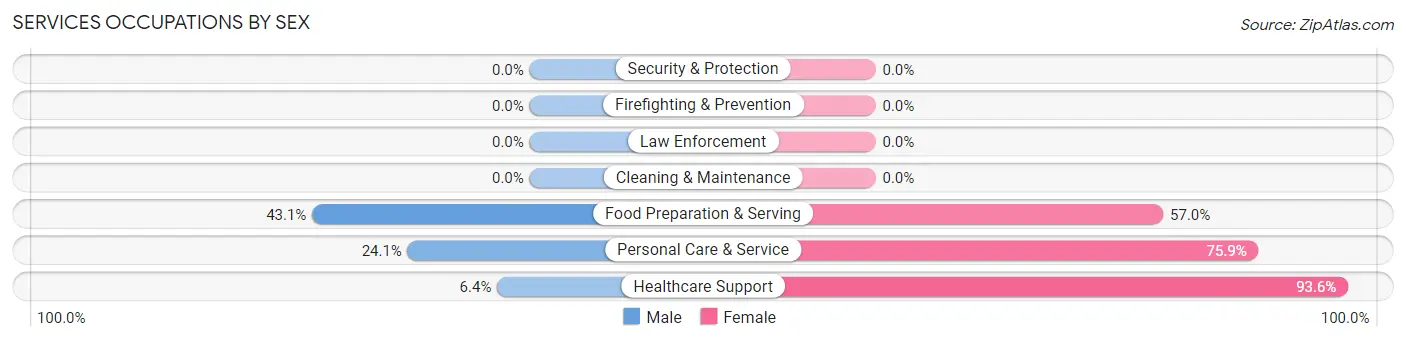
| Occupation | Male | Female |
| Healthcare Support | 5 (6.4%) | 73 (93.6%) |
| Security & Protection | 0 (0.0%) | 0 (0.0%) |
| Firefighting & Prevention | 0 (0.0%) | 0 (0.0%) |
| Law Enforcement | 0 (0.0%) | 0 (0.0%) |
| Food Preparation & Serving | 65 (43.0%) | 86 (57.0%) |
| Cleaning & Maintenance | 0 (0.0%) | 0 (0.0%) |
| Personal Care & Service | 14 (24.1%) | 44 (75.9%) |
| Total (Category) | 84 (29.3%) | 203 (70.7%) |
| Total (Overall) | 407 (44.7%) | 503 (55.3%) |
Sales and Office Occupations
The most common Sales and Office occupations in Denmark are Sales & Related (148 | 16.3%), and Office & Administration (23 | 2.5%).
Sales and Office Occupations by Sex
| Occupation | Male | Female |
| Sales & Related | 24 (16.2%) | 124 (83.8%) |
| Office & Administration | 5 (21.7%) | 18 (78.3%) |
| Total (Category) | 29 (17.0%) | 142 (83.0%) |
| Total (Overall) | 407 (44.7%) | 503 (55.3%) |
Natural Resources, Construction and Maintenance Occupations
The most common Natural Resources, Construction and Maintenance occupations in Denmark are Construction & Extraction (9 | 1.0%), and Farming, Fishing & Forestry (7 | 0.8%).
Natural Resources, Construction and Maintenance Occupations by Sex
| Occupation | Male | Female |
| Farming, Fishing & Forestry | 0 (0.0%) | 7 (100.0%) |
| Construction & Extraction | 9 (100.0%) | 0 (0.0%) |
| Installation, Maintenance & Repair | 0 (0.0%) | 0 (0.0%) |
| Total (Category) | 9 (56.2%) | 7 (43.8%) |
| Total (Overall) | 407 (44.7%) | 503 (55.3%) |
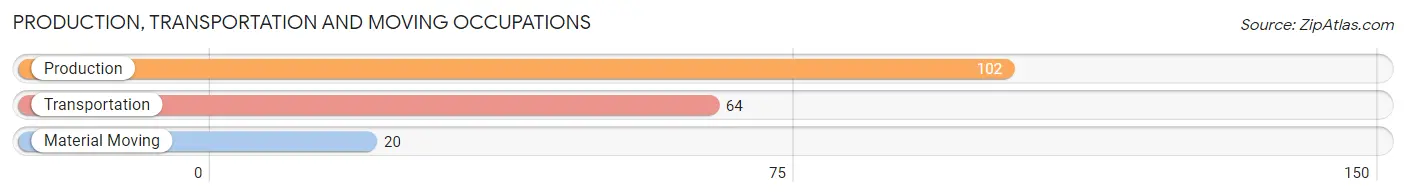
Production, Transportation and Moving Occupations
The most common Production, Transportation and Moving occupations in Denmark are Production (102 | 11.2%), Transportation (64 | 7.0%), and Material Moving (20 | 2.2%).
Production, Transportation and Moving Occupations by Sex
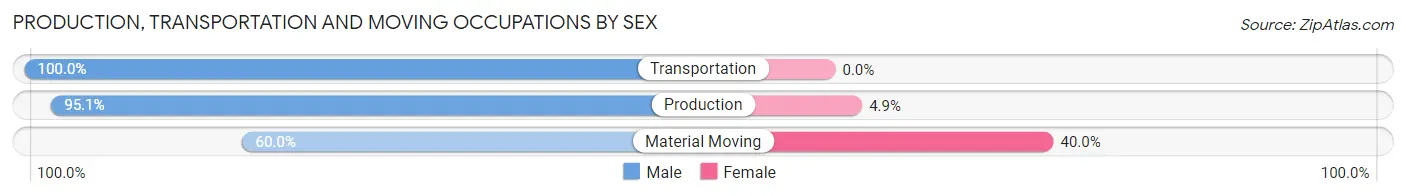
| Occupation | Male | Female |
| Production | 97 (95.1%) | 5 (4.9%) |
| Transportation | 64 (100.0%) | 0 (0.0%) |
| Material Moving | 12 (60.0%) | 8 (40.0%) |
| Total (Category) | 173 (93.0%) | 13 (7.0%) |
| Total (Overall) | 407 (44.7%) | 503 (55.3%) |
Employment Industries by Sex in Denmark
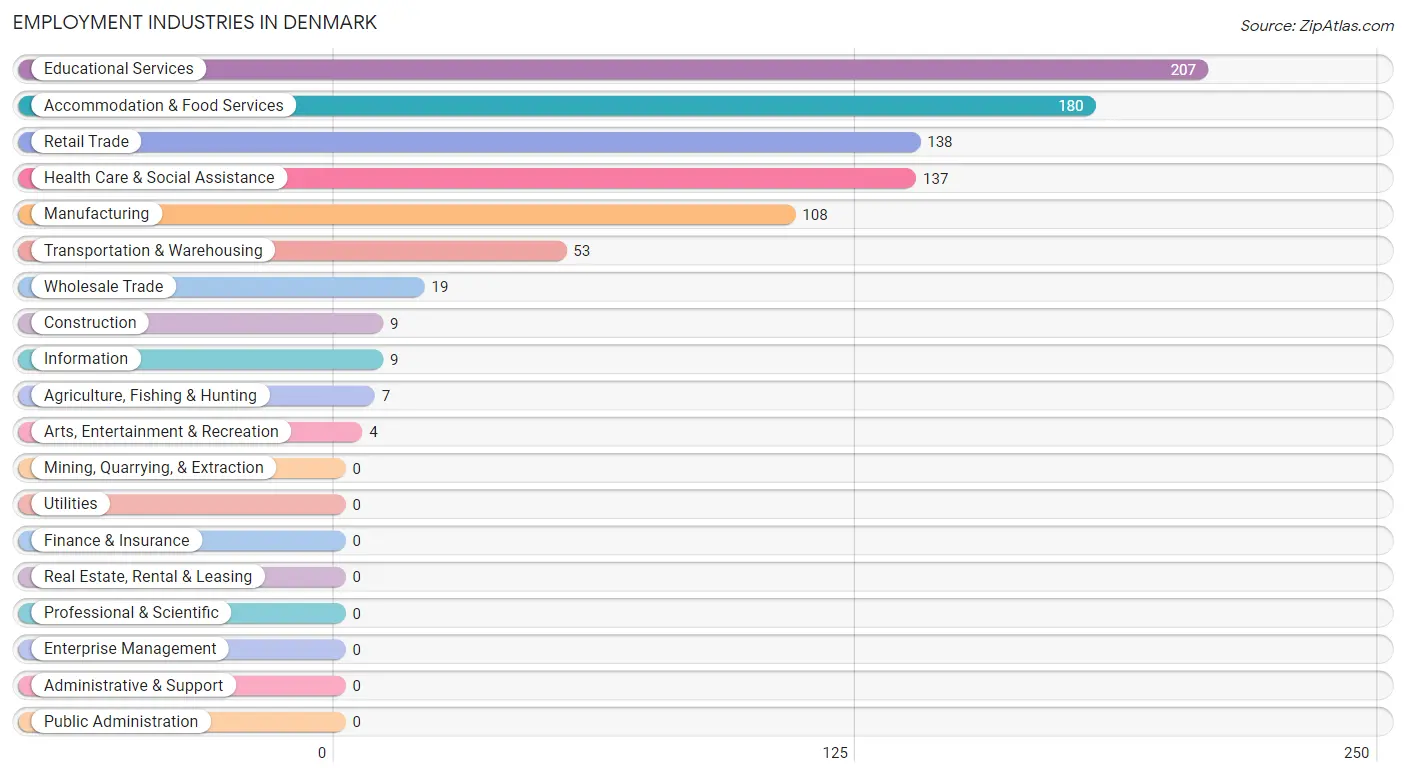
Employment Industries in Denmark
The major employment industries in Denmark include Educational Services (207 | 22.8%), Accommodation & Food Services (180 | 19.8%), Retail Trade (138 | 15.2%), Health Care & Social Assistance (137 | 15.0%), and Manufacturing (108 | 11.9%).
Employment Industries by Sex in Denmark
The Denmark industries that see more men than women are Construction (100.0%), Wholesale Trade (100.0%), and Manufacturing (95.4%), whereas the industries that tend to have a higher number of women are Agriculture, Fishing & Hunting (100.0%), Arts, Entertainment & Recreation (100.0%), and Health Care & Social Assistance (96.4%).
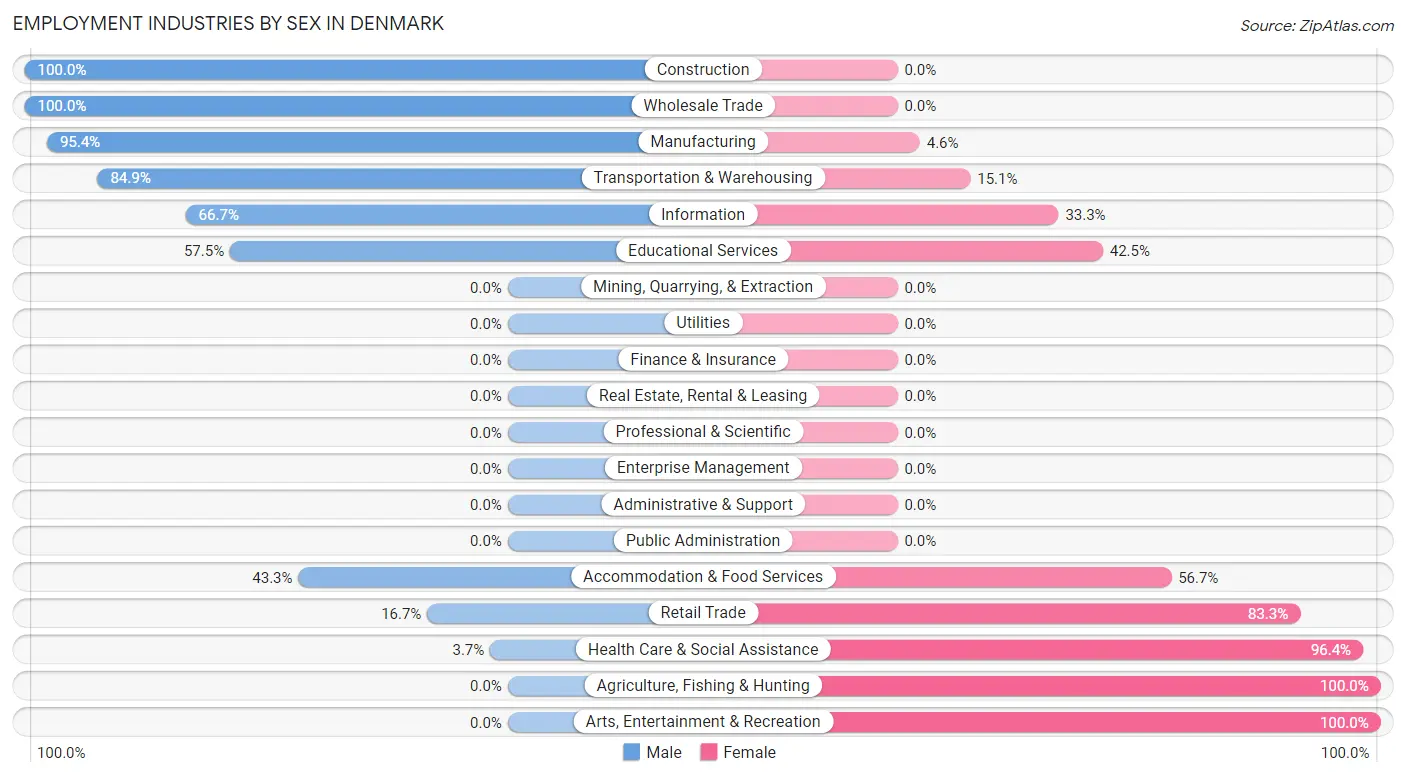
| Industry | Male | Female |
| Agriculture, Fishing & Hunting | 0 (0.0%) | 7 (100.0%) |
| Mining, Quarrying, & Extraction | 0 (0.0%) | 0 (0.0%) |
| Construction | 9 (100.0%) | 0 (0.0%) |
| Manufacturing | 103 (95.4%) | 5 (4.6%) |
| Wholesale Trade | 19 (100.0%) | 0 (0.0%) |
| Retail Trade | 23 (16.7%) | 115 (83.3%) |
| Transportation & Warehousing | 45 (84.9%) | 8 (15.1%) |
| Utilities | 0 (0.0%) | 0 (0.0%) |
| Information | 6 (66.7%) | 3 (33.3%) |
| Finance & Insurance | 0 (0.0%) | 0 (0.0%) |
| Real Estate, Rental & Leasing | 0 (0.0%) | 0 (0.0%) |
| Professional & Scientific | 0 (0.0%) | 0 (0.0%) |
| Enterprise Management | 0 (0.0%) | 0 (0.0%) |
| Administrative & Support | 0 (0.0%) | 0 (0.0%) |
| Educational Services | 119 (57.5%) | 88 (42.5%) |
| Health Care & Social Assistance | 5 (3.6%) | 132 (96.4%) |
| Arts, Entertainment & Recreation | 0 (0.0%) | 4 (100.0%) |
| Accommodation & Food Services | 78 (43.3%) | 102 (56.7%) |
| Public Administration | 0 (0.0%) | 0 (0.0%) |
| Total | 407 (44.7%) | 503 (55.3%) |
Education in Denmark
School Enrollment in Denmark
The most common levels of schooling among the 1,511 students in Denmark are college / undergraduate (952 | 63.0%), high school (218 | 14.4%), and middle school (173 | 11.5%).
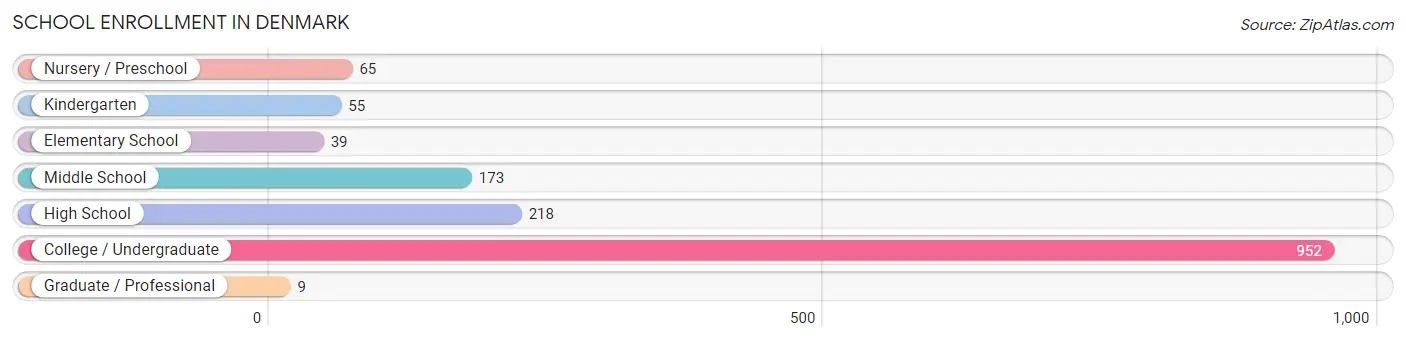
| School Level | # Students | % Students |
| Nursery / Preschool | 65 | 4.3% |
| Kindergarten | 55 | 3.6% |
| Elementary School | 39 | 2.6% |
| Middle School | 173 | 11.5% |
| High School | 218 | 14.4% |
| College / Undergraduate | 952 | 63.0% |
| Graduate / Professional | 9 | 0.6% |
| Total | 1,511 | 100.0% |
School Enrollment by Age by Funding Source in Denmark
Out of a total of 1,511 students who are enrolled in schools in Denmark, 694 (45.9%) attend a private institution, while the remaining 817 (54.1%) are enrolled in public schools. The age group of 20 to 24 year olds has the highest likelihood of being enrolled in private schools, with 390 (83.0% in the age bracket) enrolled. Conversely, the age group of 3 to 4 year olds has the lowest likelihood of being enrolled in a private school, with 36 (100.0% in the age bracket) attending a public institution.
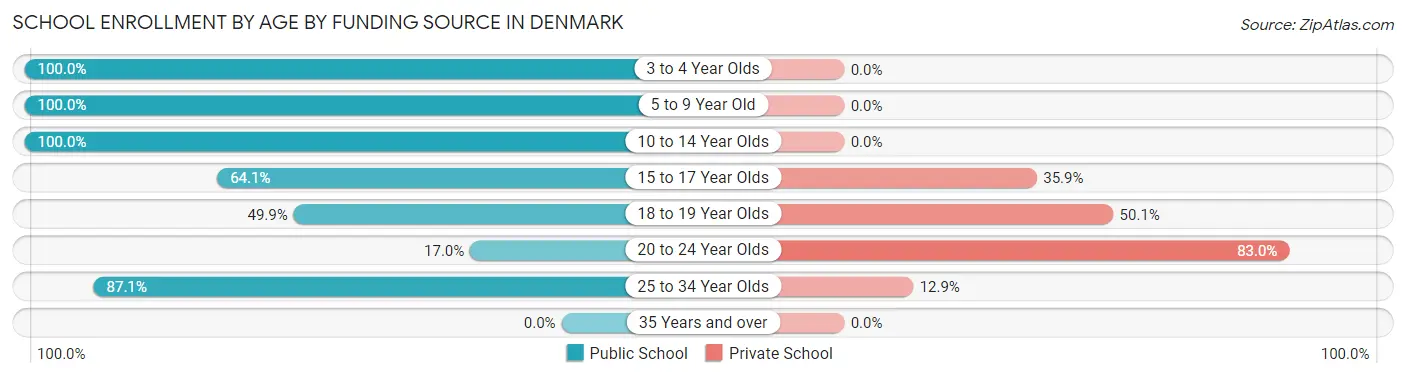
| Age Bracket | Public School | Private School |
| 3 to 4 Year Olds | 36 (100.0%) | 0 (0.0%) |
| 5 to 9 Year Old | 123 (100.0%) | 0 (0.0%) |
| 10 to 14 Year Olds | 188 (100.0%) | 0 (0.0%) |
| 15 to 17 Year Olds | 84 (64.1%) | 47 (35.9%) |
| 18 to 19 Year Olds | 246 (49.9%) | 247 (50.1%) |
| 20 to 24 Year Olds | 80 (17.0%) | 390 (83.0%) |
| 25 to 34 Year Olds | 61 (87.1%) | 9 (12.9%) |
| 35 Years and over | 0 (0.0%) | 0 (0.0%) |
| Total | 817 (54.1%) | 694 (45.9%) |
Educational Attainment by Field of Study in Denmark
Liberal arts & history (95 | 36.1%), arts & humanities (45 | 17.1%), social sciences (30 | 11.4%), bio, nature & agricultural (25 | 9.5%), and computers & mathematics (23 | 8.7%) are the most common fields of study among 263 individuals in Denmark who have obtained a bachelor's degree or higher.
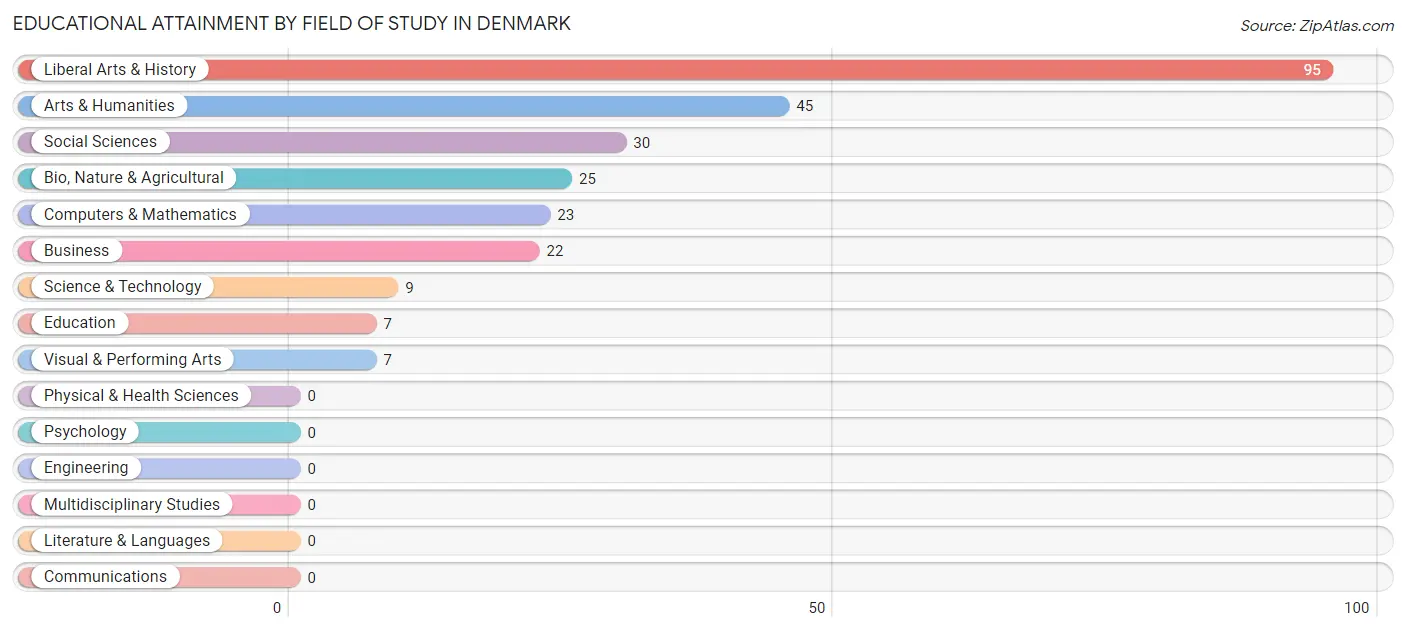
| Field of Study | # Graduates | % Graduates |
| Computers & Mathematics | 23 | 8.7% |
| Bio, Nature & Agricultural | 25 | 9.5% |
| Physical & Health Sciences | 0 | 0.0% |
| Psychology | 0 | 0.0% |
| Social Sciences | 30 | 11.4% |
| Engineering | 0 | 0.0% |
| Multidisciplinary Studies | 0 | 0.0% |
| Science & Technology | 9 | 3.4% |
| Business | 22 | 8.4% |
| Education | 7 | 2.7% |
| Literature & Languages | 0 | 0.0% |
| Liberal Arts & History | 95 | 36.1% |
| Visual & Performing Arts | 7 | 2.7% |
| Communications | 0 | 0.0% |
| Arts & Humanities | 45 | 17.1% |
| Total | 263 | 100.0% |
Transportation & Commute in Denmark
Vehicle Availability by Sex in Denmark
The most prevalent vehicle ownership categories in Denmark are males with 2 vehicles (184, accounting for 59.2%) and females with 2 vehicles (177, making up 44.9%).
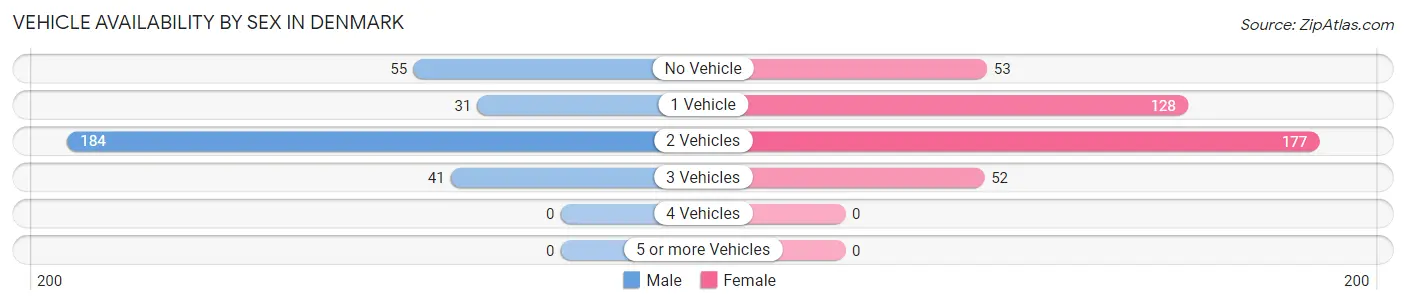
| Vehicles Available | Male | Female |
| No Vehicle | 55 (17.7%) | 53 (12.9%) |
| 1 Vehicle | 31 (10.0%) | 128 (31.2%) |
| 2 Vehicles | 184 (59.2%) | 177 (43.2%) |
| 3 Vehicles | 41 (13.2%) | 52 (12.7%) |
| 4 Vehicles | 0 (0.0%) | 0 (0.0%) |
| 5 or more Vehicles | 0 (0.0%) | 0 (0.0%) |
| Total | 311 (100.0%) | 410 (100.0%) |
Commute Time in Denmark
The most frequently occuring commute durations in Denmark are 5 to 9 minutes (209 commuters, 25.0%), 10 to 14 minutes (167 commuters, 20.0%), and less than 5 minutes (123 commuters, 14.7%).
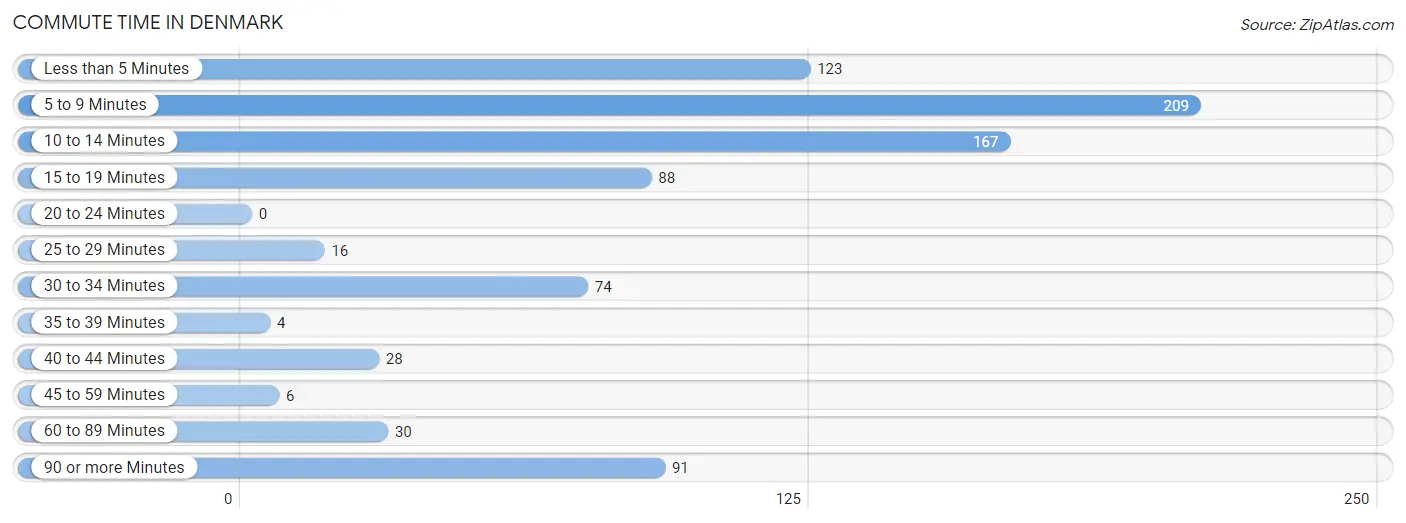
| Commute Time | # Commuters | % Commuters |
| Less than 5 Minutes | 123 | 14.7% |
| 5 to 9 Minutes | 209 | 25.0% |
| 10 to 14 Minutes | 167 | 20.0% |
| 15 to 19 Minutes | 88 | 10.5% |
| 20 to 24 Minutes | 0 | 0.0% |
| 25 to 29 Minutes | 16 | 1.9% |
| 30 to 34 Minutes | 74 | 8.8% |
| 35 to 39 Minutes | 4 | 0.5% |
| 40 to 44 Minutes | 28 | 3.4% |
| 45 to 59 Minutes | 6 | 0.7% |
| 60 to 89 Minutes | 30 | 3.6% |
| 90 or more Minutes | 91 | 10.9% |
Commute Time by Sex in Denmark
The most common commute times in Denmark are 10 to 14 minutes (108 commuters, 31.0%) for males and 5 to 9 minutes (156 commuters, 32.0%) for females.
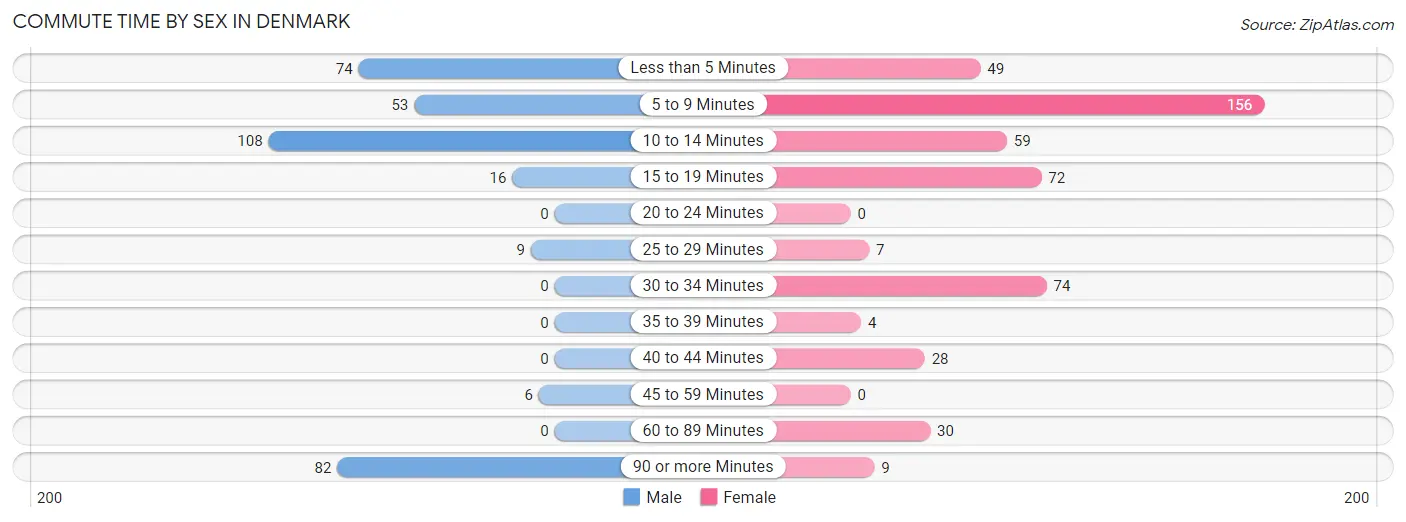
| Commute Time | Male | Female |
| Less than 5 Minutes | 74 (21.3%) | 49 (10.0%) |
| 5 to 9 Minutes | 53 (15.2%) | 156 (32.0%) |
| 10 to 14 Minutes | 108 (31.0%) | 59 (12.1%) |
| 15 to 19 Minutes | 16 (4.6%) | 72 (14.7%) |
| 20 to 24 Minutes | 0 (0.0%) | 0 (0.0%) |
| 25 to 29 Minutes | 9 (2.6%) | 7 (1.4%) |
| 30 to 34 Minutes | 0 (0.0%) | 74 (15.2%) |
| 35 to 39 Minutes | 0 (0.0%) | 4 (0.8%) |
| 40 to 44 Minutes | 0 (0.0%) | 28 (5.7%) |
| 45 to 59 Minutes | 6 (1.7%) | 0 (0.0%) |
| 60 to 89 Minutes | 0 (0.0%) | 30 (6.1%) |
| 90 or more Minutes | 82 (23.6%) | 9 (1.8%) |
Time of Departure to Work by Sex in Denmark
The most frequent times of departure to work in Denmark are 4:00 PM to 11:59 PM (82, 23.6%) for males and 10:00 AM to 10:59 AM (75, 15.4%) for females.
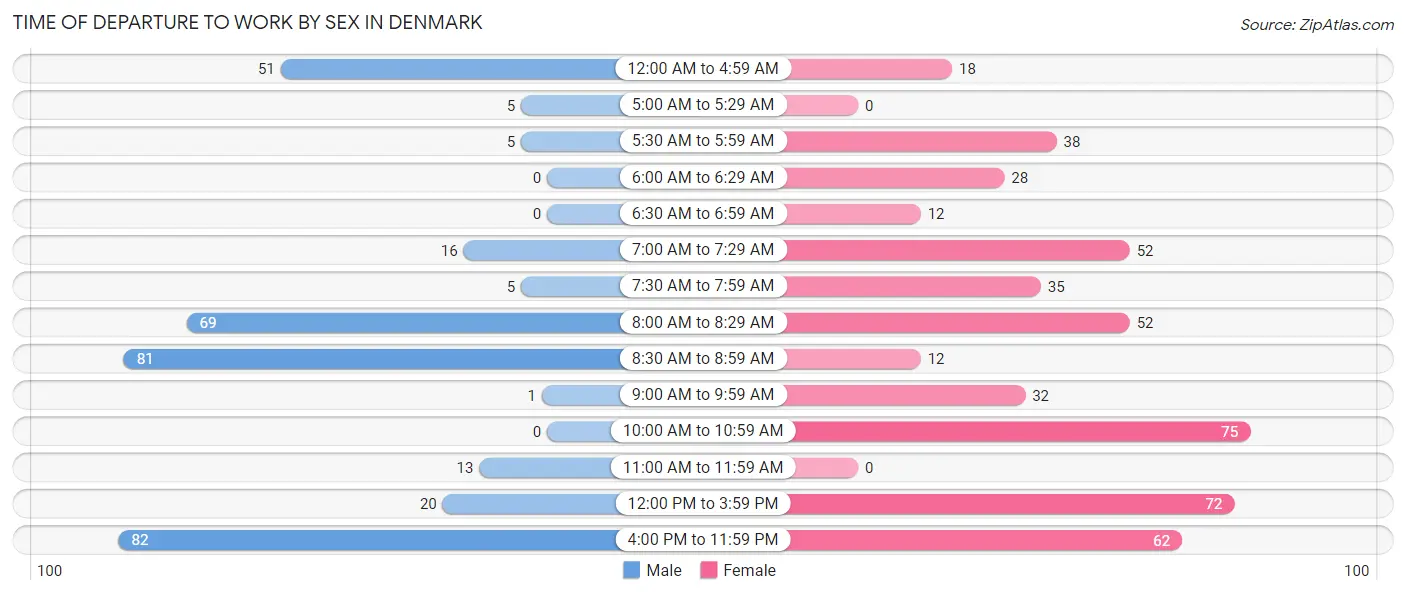
| Time of Departure | Male | Female |
| 12:00 AM to 4:59 AM | 51 (14.7%) | 18 (3.7%) |
| 5:00 AM to 5:29 AM | 5 (1.4%) | 0 (0.0%) |
| 5:30 AM to 5:59 AM | 5 (1.4%) | 38 (7.8%) |
| 6:00 AM to 6:29 AM | 0 (0.0%) | 28 (5.7%) |
| 6:30 AM to 6:59 AM | 0 (0.0%) | 12 (2.5%) |
| 7:00 AM to 7:29 AM | 16 (4.6%) | 52 (10.7%) |
| 7:30 AM to 7:59 AM | 5 (1.4%) | 35 (7.2%) |
| 8:00 AM to 8:29 AM | 69 (19.8%) | 52 (10.7%) |
| 8:30 AM to 8:59 AM | 81 (23.3%) | 12 (2.5%) |
| 9:00 AM to 9:59 AM | 1 (0.3%) | 32 (6.6%) |
| 10:00 AM to 10:59 AM | 0 (0.0%) | 75 (15.4%) |
| 11:00 AM to 11:59 AM | 13 (3.7%) | 0 (0.0%) |
| 12:00 PM to 3:59 PM | 20 (5.8%) | 72 (14.7%) |
| 4:00 PM to 11:59 PM | 82 (23.6%) | 62 (12.7%) |
| Total | 348 (100.0%) | 488 (100.0%) |
Housing Occupancy in Denmark
Occupancy by Ownership in Denmark
Of the total 761 dwellings in Denmark, owner-occupied units account for 363 (47.7%), while renter-occupied units make up 398 (52.3%).
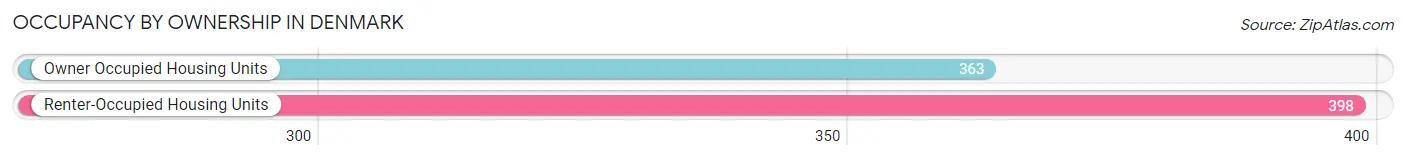
| Occupancy | # Housing Units | % Housing Units |
| Owner Occupied Housing Units | 363 | 47.7% |
| Renter-Occupied Housing Units | 398 | 52.3% |
| Total Occupied Housing Units | 761 | 100.0% |
Occupancy by Household Size in Denmark
| Household Size | # Housing Units | % Housing Units |
| 1-Person Household | 284 | 37.3% |
| 2-Person Household | 205 | 26.9% |
| 3-Person Household | 78 | 10.2% |
| 4+ Person Household | 194 | 25.5% |
| Total Housing Units | 761 | 100.0% |
Occupancy by Ownership by Household Size in Denmark
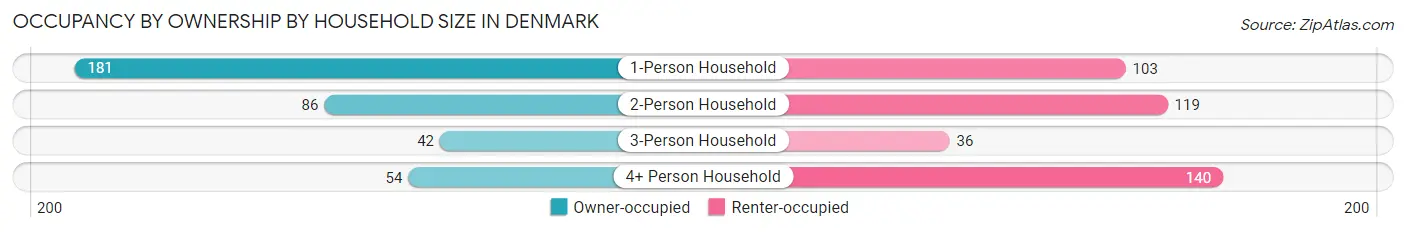
| Household Size | Owner-occupied | Renter-occupied |
| 1-Person Household | 181 (63.7%) | 103 (36.3%) |
| 2-Person Household | 86 (41.9%) | 119 (58.1%) |
| 3-Person Household | 42 (53.8%) | 36 (46.2%) |
| 4+ Person Household | 54 (27.8%) | 140 (72.2%) |
| Total Housing Units | 363 (47.7%) | 398 (52.3%) |
Occupancy by Educational Attainment in Denmark
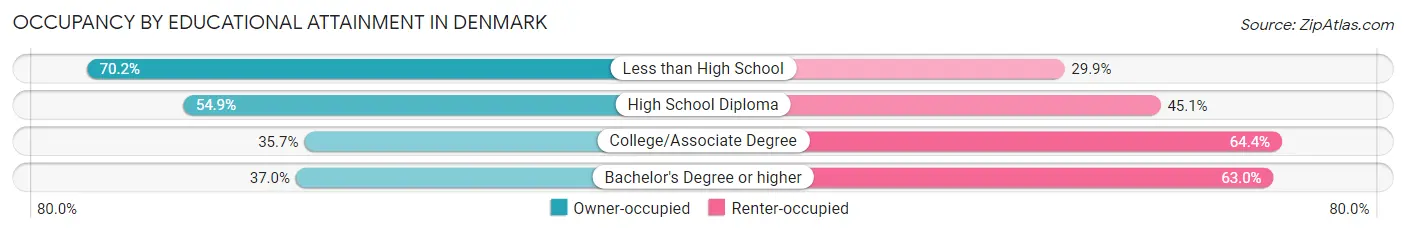
| Household Size | Owner-occupied | Renter-occupied |
| Less than High School | 94 (70.2%) | 40 (29.8%) |
| High School Diploma | 123 (54.9%) | 101 (45.1%) |
| College/Associate Degree | 82 (35.6%) | 148 (64.3%) |
| Bachelor's Degree or higher | 64 (37.0%) | 109 (63.0%) |
Occupancy by Age of Householder in Denmark
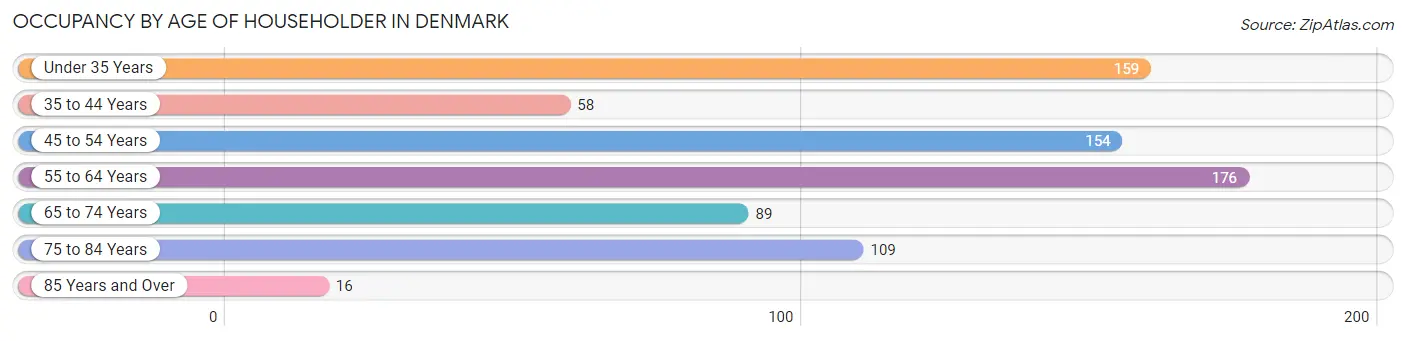
| Age Bracket | # Households | % Households |
| Under 35 Years | 159 | 20.9% |
| 35 to 44 Years | 58 | 7.6% |
| 45 to 54 Years | 154 | 20.2% |
| 55 to 64 Years | 176 | 23.1% |
| 65 to 74 Years | 89 | 11.7% |
| 75 to 84 Years | 109 | 14.3% |
| 85 Years and Over | 16 | 2.1% |
| Total | 761 | 100.0% |
Housing Finances in Denmark
Median Income by Occupancy in Denmark
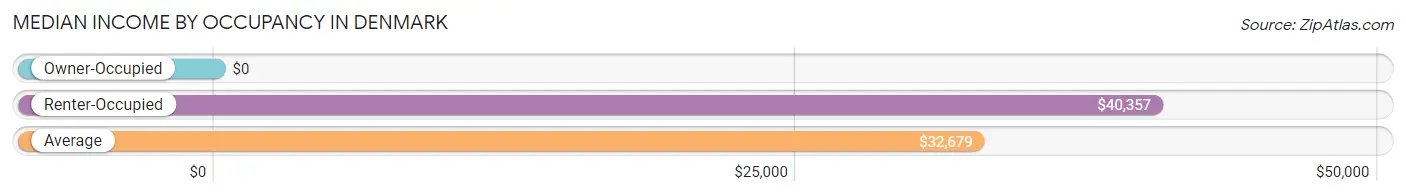
| Occupancy Type | # Households | Median Income |
| Owner-Occupied | 363 (47.7%) | $0 |
| Renter-Occupied | 398 (52.3%) | $40,357 |
| Average | 761 (100.0%) | $32,679 |
Occupancy by Householder Income Bracket in Denmark
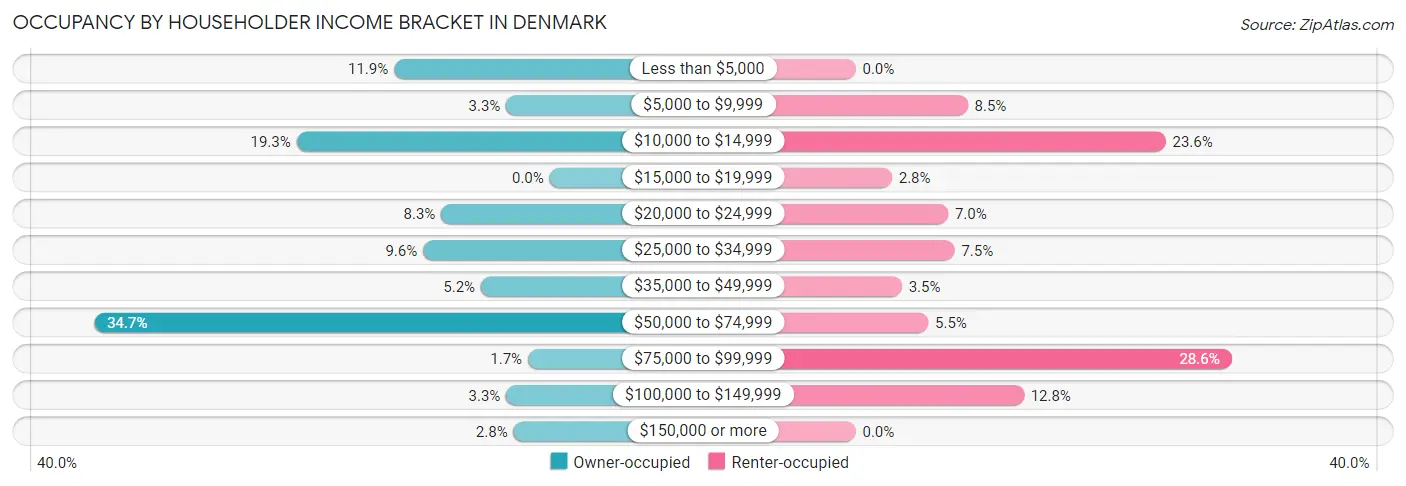
| Income Bracket | Owner-occupied | Renter-occupied |
| Less than $5,000 | 43 (11.8%) | 0 (0.0%) |
| $5,000 to $9,999 | 12 (3.3%) | 34 (8.5%) |
| $10,000 to $14,999 | 70 (19.3%) | 94 (23.6%) |
| $15,000 to $19,999 | 0 (0.0%) | 11 (2.8%) |
| $20,000 to $24,999 | 30 (8.3%) | 28 (7.0%) |
| $25,000 to $34,999 | 35 (9.6%) | 30 (7.5%) |
| $35,000 to $49,999 | 19 (5.2%) | 14 (3.5%) |
| $50,000 to $74,999 | 126 (34.7%) | 22 (5.5%) |
| $75,000 to $99,999 | 6 (1.7%) | 114 (28.6%) |
| $100,000 to $149,999 | 12 (3.3%) | 51 (12.8%) |
| $150,000 or more | 10 (2.8%) | 0 (0.0%) |
| Total | 363 (100.0%) | 398 (100.0%) |
Monthly Housing Cost Tiers in Denmark
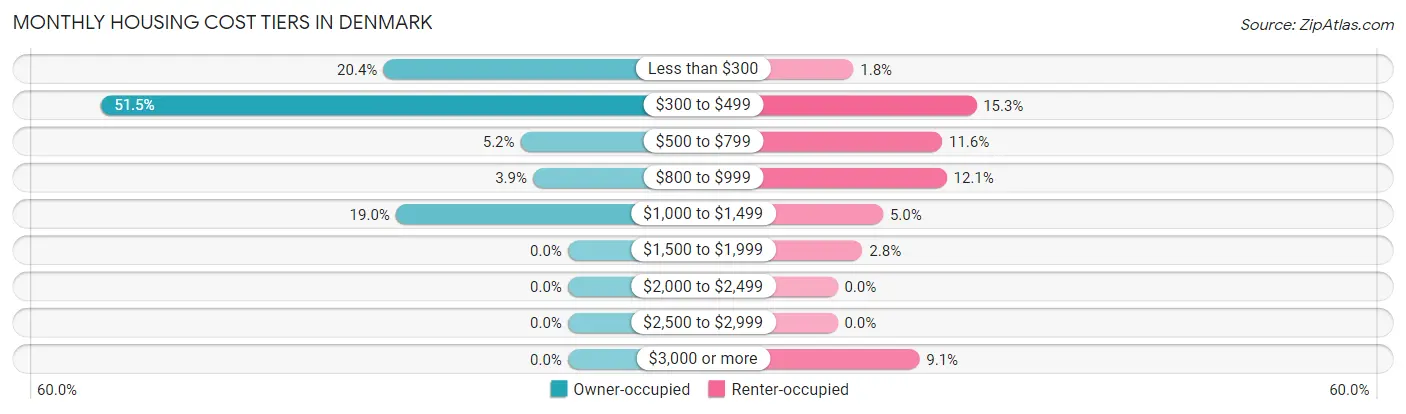
| Monthly Cost | Owner-occupied | Renter-occupied |
| Less than $300 | 74 (20.4%) | 7 (1.8%) |
| $300 to $499 | 187 (51.5%) | 61 (15.3%) |
| $500 to $799 | 19 (5.2%) | 46 (11.6%) |
| $800 to $999 | 14 (3.9%) | 48 (12.1%) |
| $1,000 to $1,499 | 69 (19.0%) | 20 (5.0%) |
| $1,500 to $1,999 | 0 (0.0%) | 11 (2.8%) |
| $2,000 to $2,499 | 0 (0.0%) | 0 (0.0%) |
| $2,500 to $2,999 | 0 (0.0%) | 0 (0.0%) |
| $3,000 or more | 0 (0.0%) | 36 (9.0%) |
| Total | 363 (100.0%) | 398 (100.0%) |
Physical Housing Characteristics in Denmark
Housing Structures in Denmark
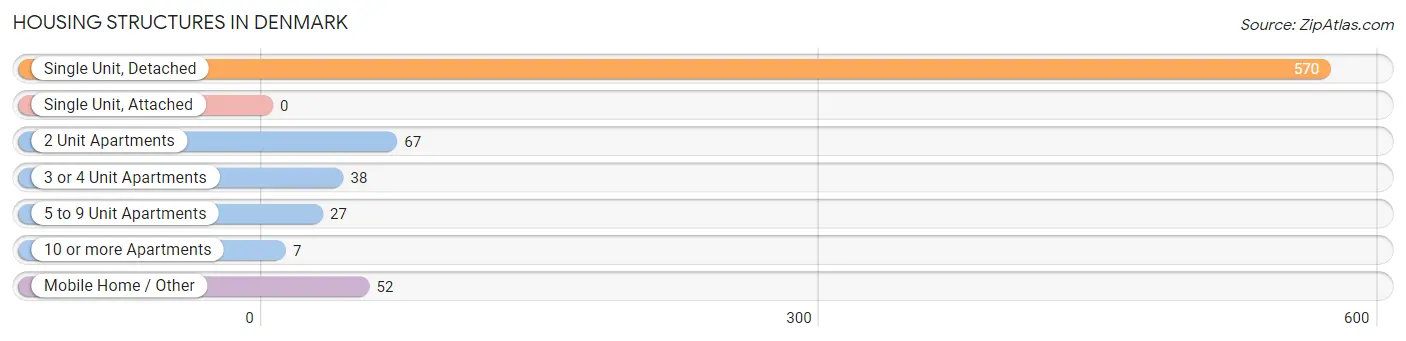
| Structure Type | # Housing Units | % Housing Units |
| Single Unit, Detached | 570 | 74.9% |
| Single Unit, Attached | 0 | 0.0% |
| 2 Unit Apartments | 67 | 8.8% |
| 3 or 4 Unit Apartments | 38 | 5.0% |
| 5 to 9 Unit Apartments | 27 | 3.5% |
| 10 or more Apartments | 7 | 0.9% |
| Mobile Home / Other | 52 | 6.8% |
| Total | 761 | 100.0% |
Housing Structures by Occupancy in Denmark
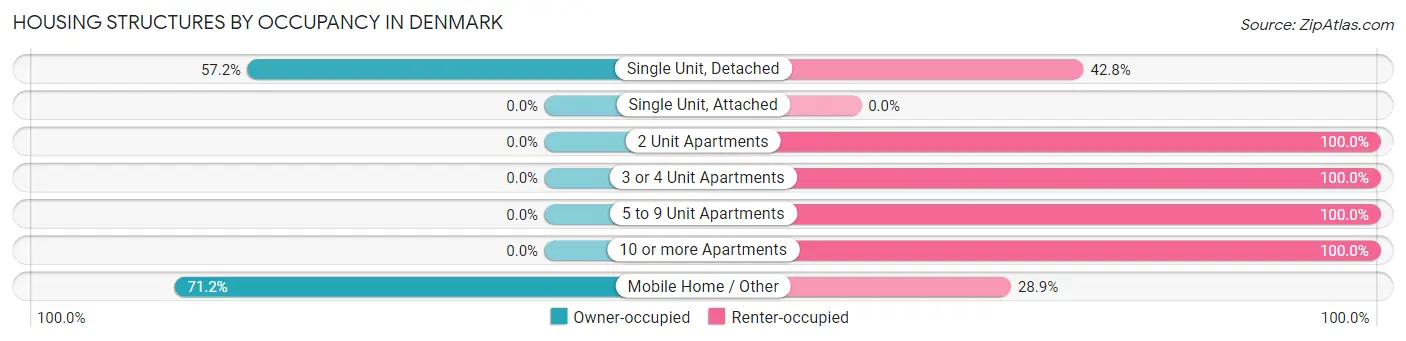
| Structure Type | Owner-occupied | Renter-occupied |
| Single Unit, Detached | 326 (57.2%) | 244 (42.8%) |
| Single Unit, Attached | 0 (0.0%) | 0 (0.0%) |
| 2 Unit Apartments | 0 (0.0%) | 67 (100.0%) |
| 3 or 4 Unit Apartments | 0 (0.0%) | 38 (100.0%) |
| 5 to 9 Unit Apartments | 0 (0.0%) | 27 (100.0%) |
| 10 or more Apartments | 0 (0.0%) | 7 (100.0%) |
| Mobile Home / Other | 37 (71.2%) | 15 (28.8%) |
| Total | 363 (47.7%) | 398 (52.3%) |
Housing Structures by Number of Rooms in Denmark
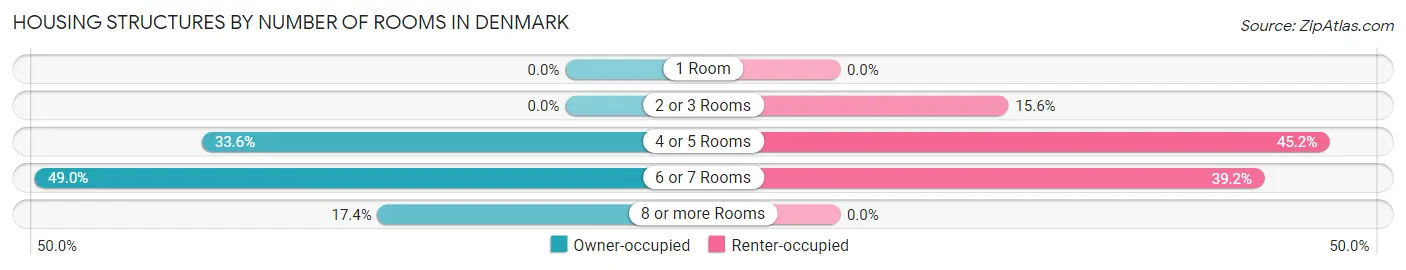
| Number of Rooms | Owner-occupied | Renter-occupied |
| 1 Room | 0 (0.0%) | 0 (0.0%) |
| 2 or 3 Rooms | 0 (0.0%) | 62 (15.6%) |
| 4 or 5 Rooms | 122 (33.6%) | 180 (45.2%) |
| 6 or 7 Rooms | 178 (49.0%) | 156 (39.2%) |
| 8 or more Rooms | 63 (17.4%) | 0 (0.0%) |
| Total | 363 (100.0%) | 398 (100.0%) |
Housing Structure by Heating Type in Denmark
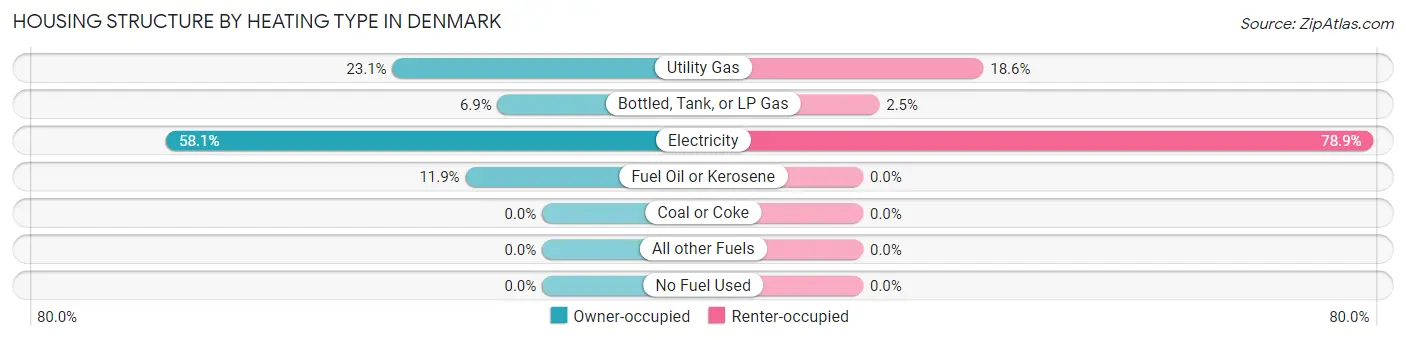
| Heating Type | Owner-occupied | Renter-occupied |
| Utility Gas | 84 (23.1%) | 74 (18.6%) |
| Bottled, Tank, or LP Gas | 25 (6.9%) | 10 (2.5%) |
| Electricity | 211 (58.1%) | 314 (78.9%) |
| Fuel Oil or Kerosene | 43 (11.8%) | 0 (0.0%) |
| Coal or Coke | 0 (0.0%) | 0 (0.0%) |
| All other Fuels | 0 (0.0%) | 0 (0.0%) |
| No Fuel Used | 0 (0.0%) | 0 (0.0%) |
| Total | 363 (100.0%) | 398 (100.0%) |
Household Vehicle Usage in Denmark
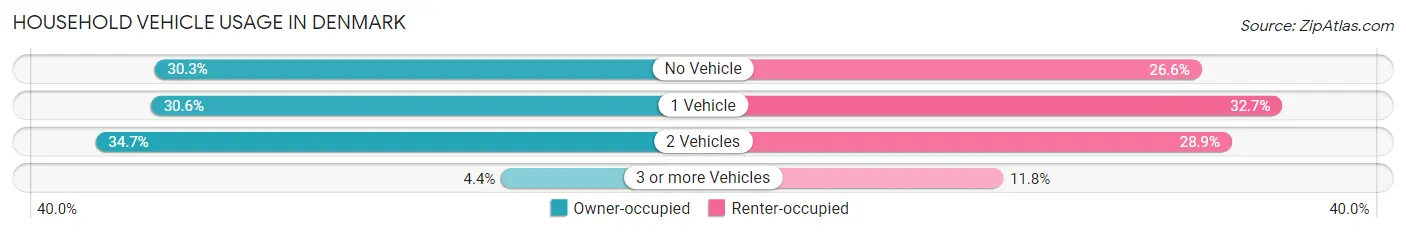
| Vehicles per Household | Owner-occupied | Renter-occupied |
| No Vehicle | 110 (30.3%) | 106 (26.6%) |
| 1 Vehicle | 111 (30.6%) | 130 (32.7%) |
| 2 Vehicles | 126 (34.7%) | 115 (28.9%) |
| 3 or more Vehicles | 16 (4.4%) | 47 (11.8%) |
| Total | 363 (100.0%) | 398 (100.0%) |
Real Estate & Mortgages in Denmark
Real Estate and Mortgage Overview in Denmark
| Characteristic | Without Mortgage | With Mortgage |
| Housing Units | 230 | 133 |
| Median Property Value | $70,000 | $154,000 |
| Median Household Income | - | - |
| Monthly Housing Costs | $321 | $0 |
| Real Estate Taxes | $442 | $0 |
Property Value by Mortgage Status in Denmark
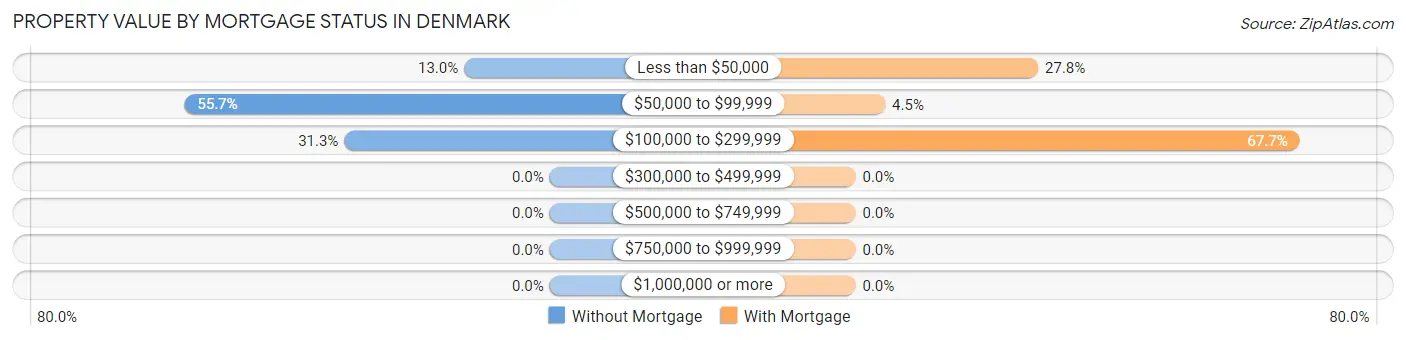
| Property Value | Without Mortgage | With Mortgage |
| Less than $50,000 | 30 (13.0%) | 37 (27.8%) |
| $50,000 to $99,999 | 128 (55.6%) | 6 (4.5%) |
| $100,000 to $299,999 | 72 (31.3%) | 90 (67.7%) |
| $300,000 to $499,999 | 0 (0.0%) | 0 (0.0%) |
| $500,000 to $749,999 | 0 (0.0%) | 0 (0.0%) |
| $750,000 to $999,999 | 0 (0.0%) | 0 (0.0%) |
| $1,000,000 or more | 0 (0.0%) | 0 (0.0%) |
| Total | 230 (100.0%) | 133 (100.0%) |
Household Income by Mortgage Status in Denmark
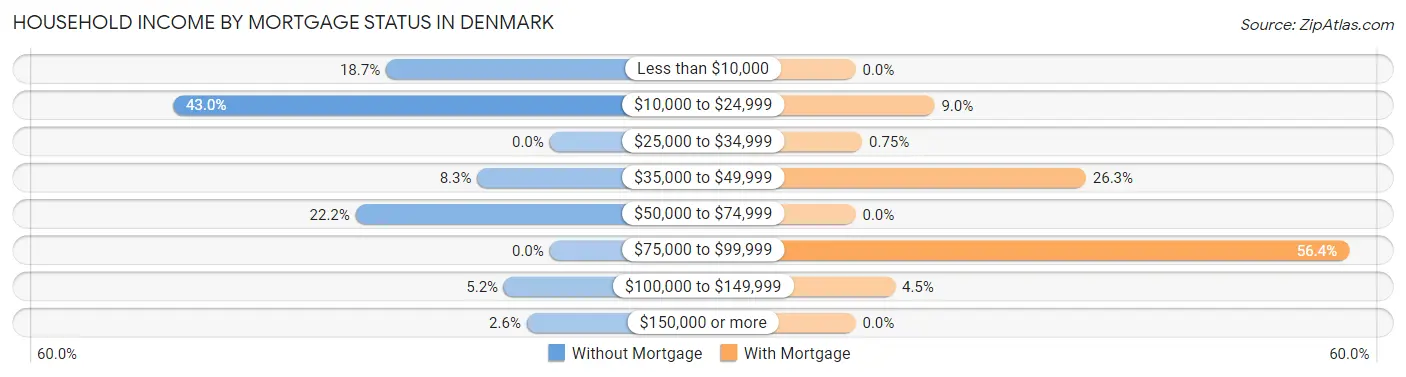
| Household Income | Without Mortgage | With Mortgage |
| Less than $10,000 | 43 (18.7%) | 0 (0.0%) |
| $10,000 to $24,999 | 99 (43.0%) | 12 (9.0%) |
| $25,000 to $34,999 | 0 (0.0%) | 1 (0.7%) |
| $35,000 to $49,999 | 19 (8.3%) | 35 (26.3%) |
| $50,000 to $74,999 | 51 (22.2%) | 0 (0.0%) |
| $75,000 to $99,999 | 0 (0.0%) | 75 (56.4%) |
| $100,000 to $149,999 | 12 (5.2%) | 6 (4.5%) |
| $150,000 or more | 6 (2.6%) | 0 (0.0%) |
| Total | 230 (100.0%) | 133 (100.0%) |
Property Value to Household Income Ratio in Denmark
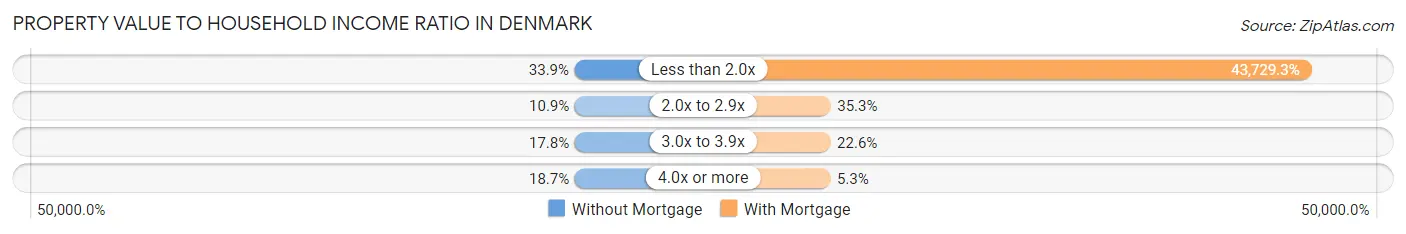
| Value-to-Income Ratio | Without Mortgage | With Mortgage |
| Less than 2.0x | 78 (33.9%) | 58,160 (43,729.3%) |
| 2.0x to 2.9x | 25 (10.9%) | 47 (35.3%) |
| 3.0x to 3.9x | 41 (17.8%) | 30 (22.6%) |
| 4.0x or more | 43 (18.7%) | 7 (5.3%) |
| Total | 230 (100.0%) | 133 (100.0%) |
Real Estate Taxes by Mortgage Status in Denmark
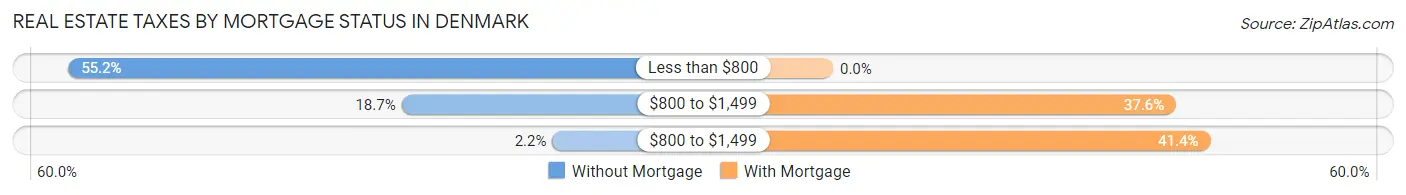
| Property Taxes | Without Mortgage | With Mortgage |
| Less than $800 | 127 (55.2%) | 0 (0.0%) |
| $800 to $1,499 | 43 (18.7%) | 50 (37.6%) |
| $800 to $1,499 | 5 (2.2%) | 55 (41.3%) |
| Total | 230 (100.0%) | 133 (100.0%) |
Health & Disability in Denmark
Health Insurance Coverage by Age in Denmark
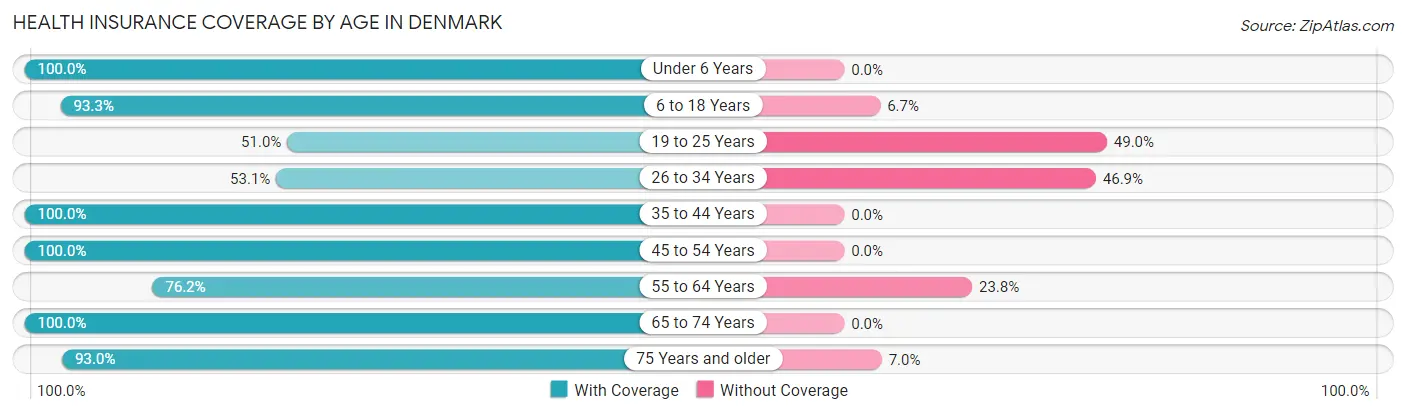
| Age Bracket | With Coverage | Without Coverage |
| Under 6 Years | 130 (100.0%) | 0 (0.0%) |
| 6 to 18 Years | 654 (93.3%) | 47 (6.7%) |
| 19 to 25 Years | 368 (51.0%) | 353 (49.0%) |
| 26 to 34 Years | 146 (53.1%) | 129 (46.9%) |
| 35 to 44 Years | 113 (100.0%) | 0 (0.0%) |
| 45 to 54 Years | 212 (100.0%) | 0 (0.0%) |
| 55 to 64 Years | 342 (76.2%) | 107 (23.8%) |
| 65 to 74 Years | 254 (100.0%) | 0 (0.0%) |
| 75 Years and older | 280 (93.0%) | 21 (7.0%) |
| Total | 2,499 (79.2%) | 657 (20.8%) |
Health Insurance Coverage by Citizenship Status in Denmark
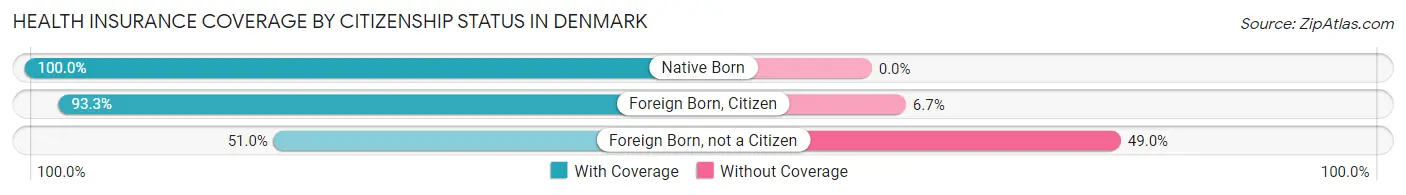
| Citizenship Status | With Coverage | Without Coverage |
| Native Born | 130 (100.0%) | 0 (0.0%) |
| Foreign Born, Citizen | 654 (93.3%) | 47 (6.7%) |
| Foreign Born, not a Citizen | 368 (51.0%) | 353 (49.0%) |
Health Insurance Coverage by Household Income in Denmark
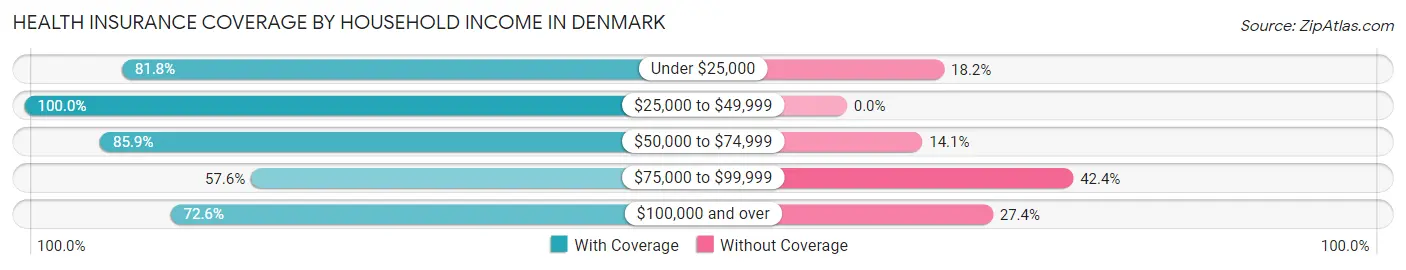
| Household Income | With Coverage | Without Coverage |
| Under $25,000 | 498 (81.8%) | 111 (18.2%) |
| $25,000 to $49,999 | 341 (100.0%) | 0 (0.0%) |
| $50,000 to $74,999 | 492 (85.9%) | 81 (14.1%) |
| $75,000 to $99,999 | 376 (57.6%) | 277 (42.4%) |
| $100,000 and over | 215 (72.6%) | 81 (27.4%) |
Public vs Private Health Insurance Coverage by Age in Denmark
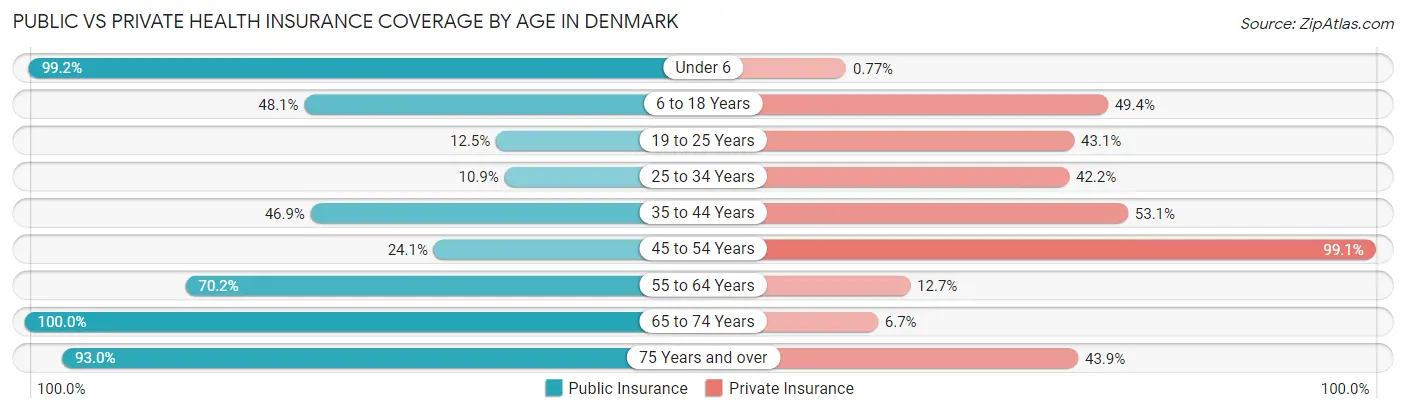
| Age Bracket | Public Insurance | Private Insurance |
| Under 6 | 129 (99.2%) | 1 (0.8%) |
| 6 to 18 Years | 337 (48.1%) | 346 (49.4%) |
| 19 to 25 Years | 90 (12.5%) | 311 (43.1%) |
| 25 to 34 Years | 30 (10.9%) | 116 (42.2%) |
| 35 to 44 Years | 53 (46.9%) | 60 (53.1%) |
| 45 to 54 Years | 51 (24.1%) | 210 (99.1%) |
| 55 to 64 Years | 315 (70.2%) | 57 (12.7%) |
| 65 to 74 Years | 254 (100.0%) | 17 (6.7%) |
| 75 Years and over | 280 (93.0%) | 132 (43.9%) |
| Total | 1,539 (48.8%) | 1,250 (39.6%) |
Disability Status by Sex by Age in Denmark
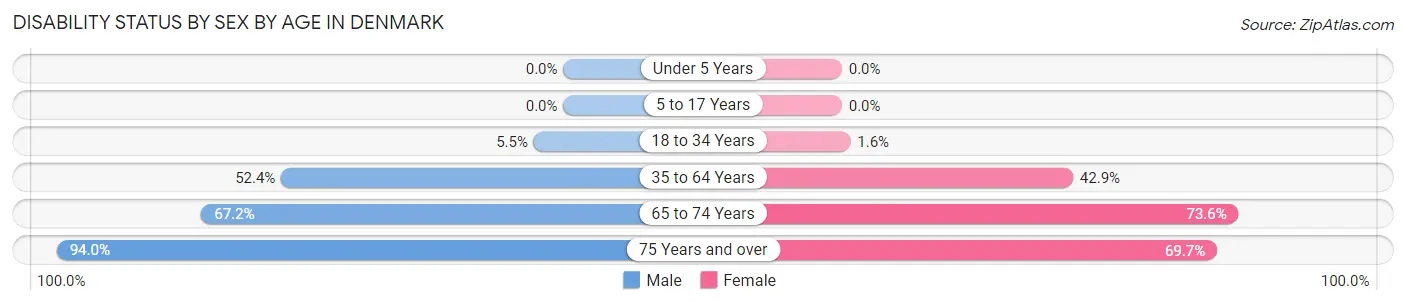
| Age Bracket | Male | Female |
| Under 5 Years | 0 (0.0%) | 0 (0.0%) |
| 5 to 17 Years | 0 (0.0%) | 0 (0.0%) |
| 18 to 34 Years | 34 (5.5%) | 11 (1.6%) |
| 35 to 64 Years | 210 (52.4%) | 160 (42.9%) |
| 65 to 74 Years | 84 (67.2%) | 95 (73.6%) |
| 75 Years and over | 63 (94.0%) | 163 (69.7%) |
Disability Class by Sex by Age in Denmark
Disability Class: Hearing Difficulty
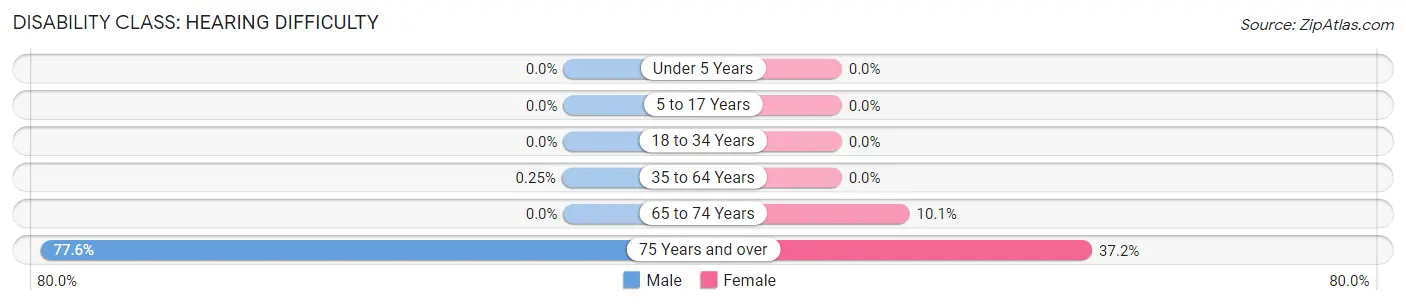
| Age Bracket | Male | Female |
| Under 5 Years | 0 (0.0%) | 0 (0.0%) |
| 5 to 17 Years | 0 (0.0%) | 0 (0.0%) |
| 18 to 34 Years | 0 (0.0%) | 0 (0.0%) |
| 35 to 64 Years | 1 (0.3%) | 0 (0.0%) |
| 65 to 74 Years | 0 (0.0%) | 13 (10.1%) |
| 75 Years and over | 52 (77.6%) | 87 (37.2%) |
Disability Class: Vision Difficulty
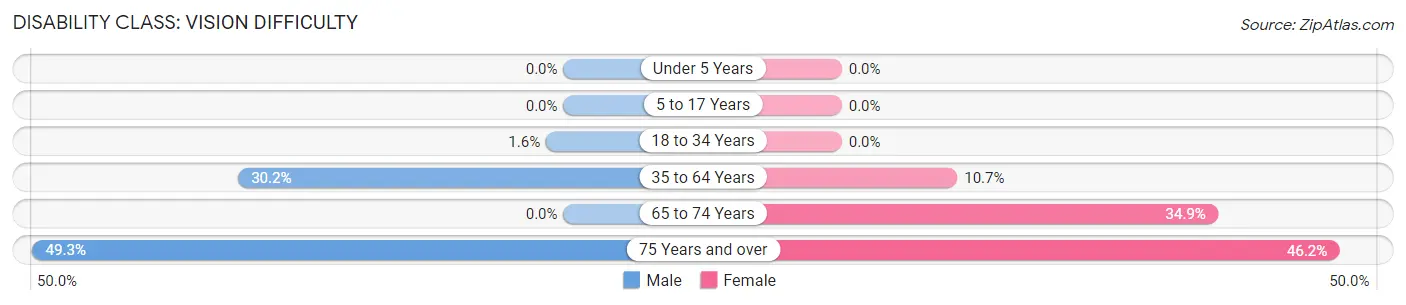
| Age Bracket | Male | Female |
| Under 5 Years | 0 (0.0%) | 0 (0.0%) |
| 5 to 17 Years | 0 (0.0%) | 0 (0.0%) |
| 18 to 34 Years | 10 (1.6%) | 0 (0.0%) |
| 35 to 64 Years | 121 (30.2%) | 40 (10.7%) |
| 65 to 74 Years | 0 (0.0%) | 45 (34.9%) |
| 75 Years and over | 33 (49.2%) | 108 (46.2%) |
Disability Class: Cognitive Difficulty
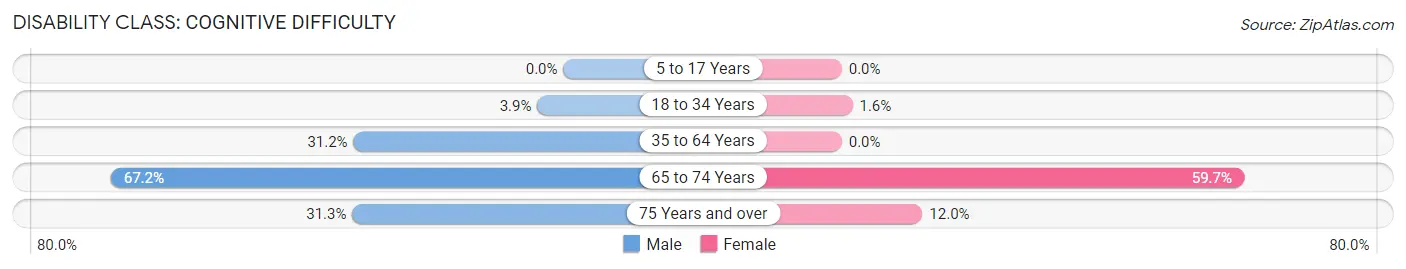
| Age Bracket | Male | Female |
| 5 to 17 Years | 0 (0.0%) | 0 (0.0%) |
| 18 to 34 Years | 24 (3.9%) | 11 (1.6%) |
| 35 to 64 Years | 125 (31.2%) | 0 (0.0%) |
| 65 to 74 Years | 84 (67.2%) | 77 (59.7%) |
| 75 Years and over | 21 (31.3%) | 28 (12.0%) |
Disability Class: Ambulatory Difficulty
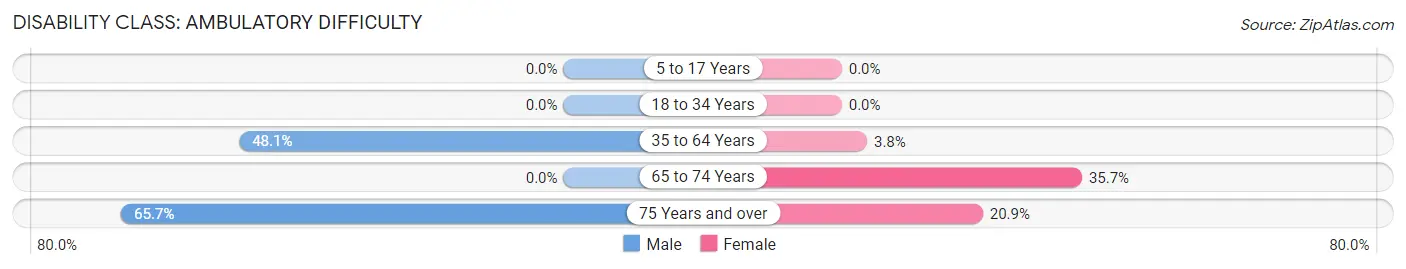
| Age Bracket | Male | Female |
| 5 to 17 Years | 0 (0.0%) | 0 (0.0%) |
| 18 to 34 Years | 0 (0.0%) | 0 (0.0%) |
| 35 to 64 Years | 193 (48.1%) | 14 (3.7%) |
| 65 to 74 Years | 0 (0.0%) | 46 (35.7%) |
| 75 Years and over | 44 (65.7%) | 49 (20.9%) |
Disability Class: Self-Care Difficulty
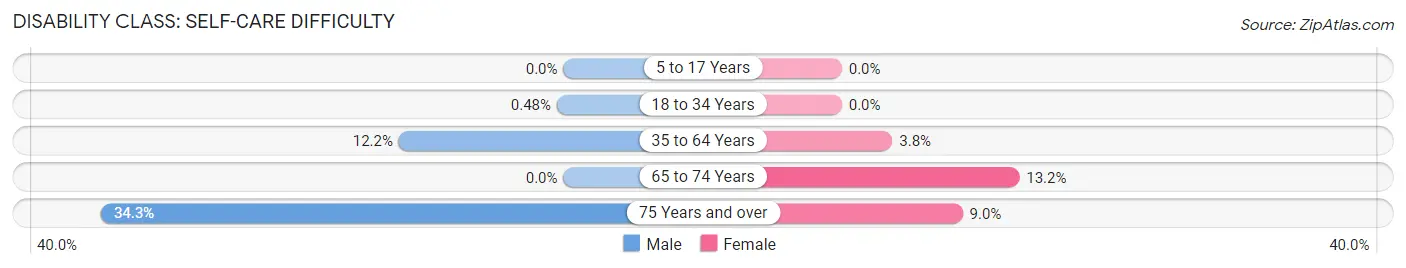
| Age Bracket | Male | Female |
| 5 to 17 Years | 0 (0.0%) | 0 (0.0%) |
| 18 to 34 Years | 3 (0.5%) | 0 (0.0%) |
| 35 to 64 Years | 49 (12.2%) | 14 (3.7%) |
| 65 to 74 Years | 0 (0.0%) | 17 (13.2%) |
| 75 Years and over | 23 (34.3%) | 21 (9.0%) |
Technology Access in Denmark
Computing Device Access in Denmark
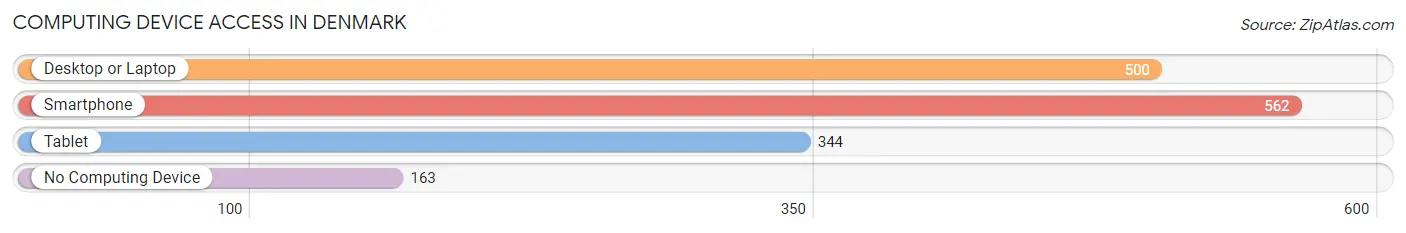
| Device Type | # Households | % Households |
| Desktop or Laptop | 500 | 65.7% |
| Smartphone | 562 | 73.9% |
| Tablet | 344 | 45.2% |
| No Computing Device | 163 | 21.4% |
| Total | 761 | 100.0% |
Internet Access in Denmark
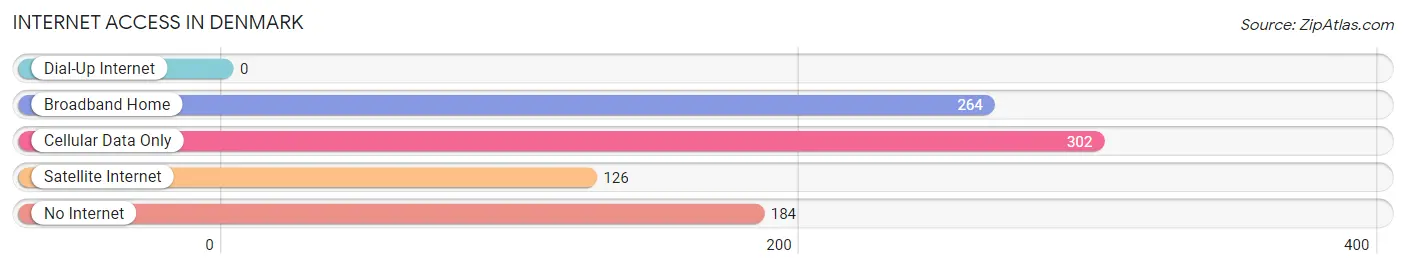
| Internet Type | # Households | % Households |
| Dial-Up Internet | 0 | 0.0% |
| Broadband Home | 264 | 34.7% |
| Cellular Data Only | 302 | 39.7% |
| Satellite Internet | 126 | 16.6% |
| No Internet | 184 | 24.2% |
| Total | 761 | 100.0% |
Denmark Summary
Denmark, South Carolina is a small town located in Bamberg County, South Carolina. It is situated on the banks of the Edisto River, approximately 30 miles northwest of Charleston. The town was founded in 1852 and is named after the country of Denmark, which was the homeland of many of the early settlers. The population of Denmark was 2,945 as of the 2010 census.
Geography
Denmark is located in the Piedmont region of South Carolina, which is characterized by rolling hills and flat plains. The town is situated on the banks of the Edisto River, which is a major tributary of the Savannah River. The town is located in the heart of the South Carolina Lowcountry, which is known for its lush vegetation and abundant wildlife. The town is located approximately 30 miles northwest of Charleston and is accessible by US Highway 78.
Climate
Denmark has a humid subtropical climate, with hot, humid summers and mild winters. The average annual temperature is around 70 degrees Fahrenheit, with temperatures reaching as high as 95 degrees in the summer and as low as 40 degrees in the winter. The town receives an average of 48 inches of precipitation per year, with most of it falling in the summer months.
Economy
Denmark’s economy is largely based on agriculture and manufacturing. The town is home to several large poultry farms, as well as a number of smaller farms that produce a variety of crops, including corn, soybeans, cotton, and peanuts. The town is also home to several manufacturing plants, including a paper mill, a furniture factory, and a plastics plant.
Demographics
As of the 2010 census, the population of Denmark was 2,945. The racial makeup of the town was 57.3% African American, 37.2% White, 1.2% Asian, 0.3% Native American, and 4.0% from other races. The median household income was $30,938, and the median family income was $37,917. The per capita income was $17,845.
Conclusion
Denmark, South Carolina is a small town located in Bamberg County, South Carolina. It is situated on the banks of the Edisto River, approximately 30 miles northwest of Charleston. The town was founded in 1852 and is named after the country of Denmark, which was the homeland of many of the early settlers. The town has a humid subtropical climate, with hot, humid summers and mild winters. The economy of Denmark is largely based on agriculture and manufacturing, and the town is home to several large poultry farms, as well as a number of smaller farms that produce a variety of crops. The population of Denmark was 2,945 as of the 2010 census, and the racial makeup of the town was 57.3% African American, 37.2% White, 1.2% Asian, 0.3% Native American, and 4.0% from other races.
Common Questions
What is Per Capita Income in Denmark?
Per Capita income in Denmark is $15,041.
What is the Median Family Income in Denmark?
Median Family Income in Denmark is $58,819.
What is the Median Household income in Denmark?
Median Household Income in Denmark is $32,679.
What is Inequality or Gini Index in Denmark?
Inequality or Gini Index in Denmark is 0.44.
What is the Total Population of Denmark?
Total Population of Denmark is 3,156.
What is the Total Male Population of Denmark?
Total Male Population of Denmark is 1,540.
What is the Total Female Population of Denmark?
Total Female Population of Denmark is 1,616.
What is the Ratio of Males per 100 Females in Denmark?
There are 95.30 Males per 100 Females in Denmark.
What is the Ratio of Females per 100 Males in Denmark?
There are 104.94 Females per 100 Males in Denmark.
What is the Median Population Age in Denmark?
Median Population Age in Denmark is 29.6 Years.
What is the Average Family Size in Denmark
Average Family Size in Denmark is 4.5 People.
What is the Average Household Size in Denmark
Average Household Size in Denmark is 3.2 People.
How Large is the Labor Force in Denmark?
There are 1,086 People in the Labor Forcein in Denmark.
What is the Percentage of People in the Labor Force in Denmark?
39.5% of People are in the Labor Force in Denmark.
What is the Unemployment Rate in Denmark?
Unemployment Rate in Denmark is 16.3%.