South Roxana, IL Map & Demographics
South Roxana Map
South Roxana Overview
$24,533
PER CAPITA INCOME
$62,632
AVG FAMILY INCOME
$59,097
AVG HOUSEHOLD INCOME
39.9%
WAGE / INCOME GAP [ % ]
60.1¢/ $1
WAGE / INCOME GAP [ $ ]
$6,895
FAMILY INCOME DEFICIT
0.35
INEQUALITY / GINI INDEX
2,121
TOTAL POPULATION
1,045
MALE POPULATION
1,076
FEMALE POPULATION
97.12
MALES / 100 FEMALES
102.97
FEMALES / 100 MALES
33.6
MEDIAN AGE
3.1
AVG FAMILY SIZE
2.8
AVG HOUSEHOLD SIZE
1,081
LABOR FORCE [ PEOPLE ]
66.0%
PERCENT IN LABOR FORCE
8.2%
UNEMPLOYMENT RATE
South Roxana Zip Codes
Income in South Roxana
Income Overview in South Roxana
Per Capita Income in South Roxana is $24,533, while median incomes of families and households are $62,632 and $59,097 respectively.
| Characteristic | Number | Measure |
| Per Capita Income | 2,121 | $24,533 |
| Median Family Income | 520 | $62,632 |
| Mean Family Income | 520 | $65,957 |
| Median Household Income | 761 | $59,097 |
| Mean Household Income | 761 | $63,531 |
| Income Deficit | 520 | $6,895 |
| Wage / Income Gap (%) | 2,121 | 39.89% |
| Wage / Income Gap ($) | 2,121 | 60.11¢ per $1 |
| Gini / Inequality Index | 2,121 | 0.35 |
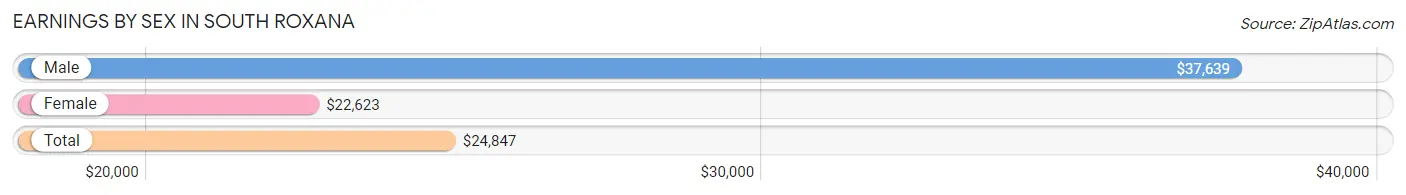
Earnings by Sex in South Roxana
Average Earnings in South Roxana are $24,847, $37,639 for men and $22,623 for women, a difference of 39.9%.
| Sex | Number | Average Earnings |
| Male | 577 (52.6%) | $37,639 |
| Female | 520 (47.4%) | $22,623 |
| Total | 1,097 (100.0%) | $24,847 |
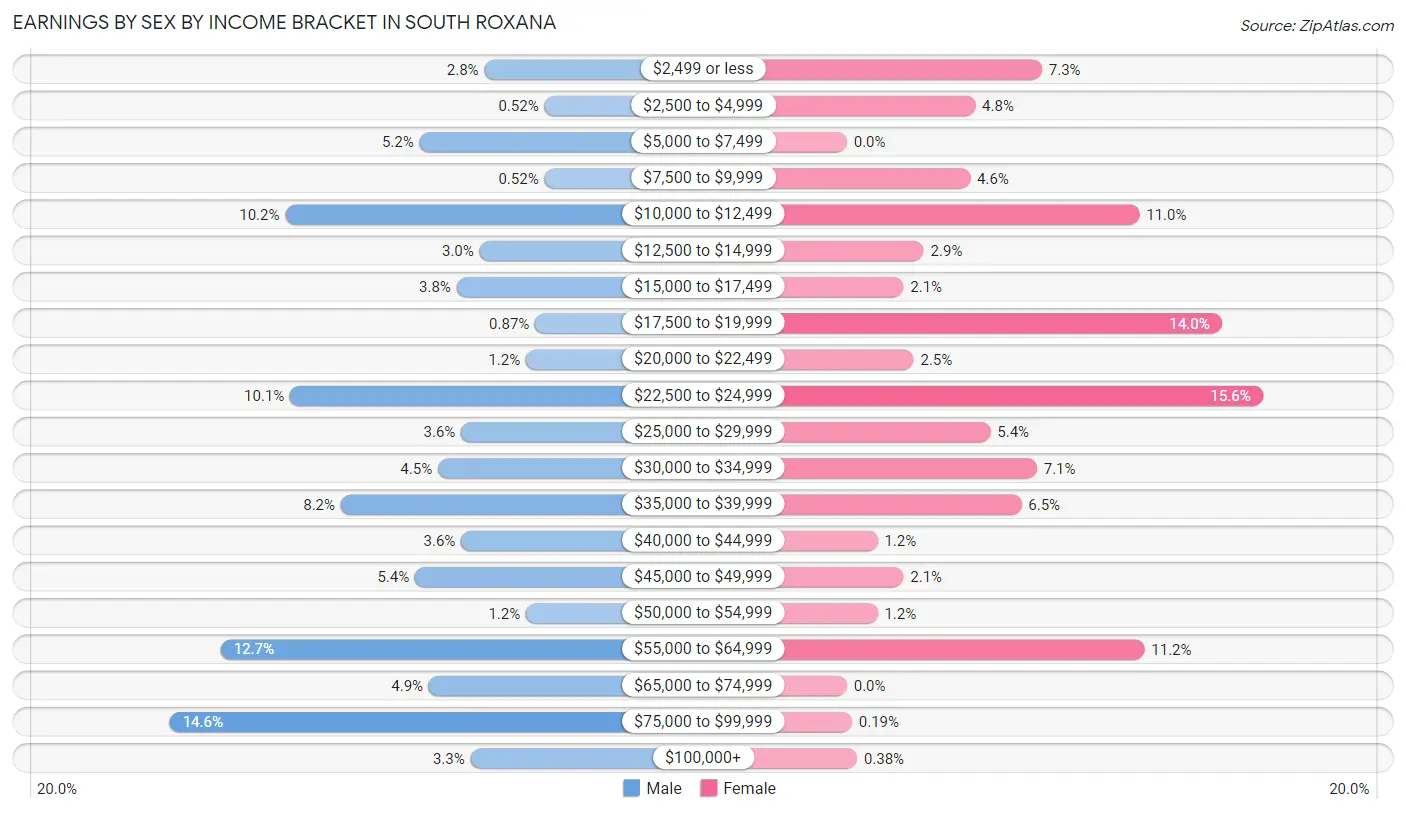
Earnings by Sex by Income Bracket in South Roxana
The most common earnings brackets in South Roxana are $75,000 to $99,999 for men (84 | 14.6%) and $22,500 to $24,999 for women (81 | 15.6%).
| Income | Male | Female |
| $2,499 or less | 16 (2.8%) | 38 (7.3%) |
| $2,500 to $4,999 | 3 (0.5%) | 25 (4.8%) |
| $5,000 to $7,499 | 30 (5.2%) | 0 (0.0%) |
| $7,500 to $9,999 | 3 (0.5%) | 24 (4.6%) |
| $10,000 to $12,499 | 59 (10.2%) | 57 (11.0%) |
| $12,500 to $14,999 | 17 (2.9%) | 15 (2.9%) |
| $15,000 to $17,499 | 22 (3.8%) | 11 (2.1%) |
| $17,500 to $19,999 | 5 (0.9%) | 73 (14.0%) |
| $20,000 to $22,499 | 7 (1.2%) | 13 (2.5%) |
| $22,500 to $24,999 | 58 (10.1%) | 81 (15.6%) |
| $25,000 to $29,999 | 21 (3.6%) | 28 (5.4%) |
| $30,000 to $34,999 | 26 (4.5%) | 37 (7.1%) |
| $35,000 to $39,999 | 47 (8.2%) | 34 (6.5%) |
| $40,000 to $44,999 | 21 (3.6%) | 6 (1.1%) |
| $45,000 to $49,999 | 31 (5.4%) | 11 (2.1%) |
| $50,000 to $54,999 | 7 (1.2%) | 6 (1.1%) |
| $55,000 to $64,999 | 73 (12.7%) | 58 (11.2%) |
| $65,000 to $74,999 | 28 (4.9%) | 0 (0.0%) |
| $75,000 to $99,999 | 84 (14.6%) | 1 (0.2%) |
| $100,000+ | 19 (3.3%) | 2 (0.4%) |
| Total | 577 (100.0%) | 520 (100.0%) |
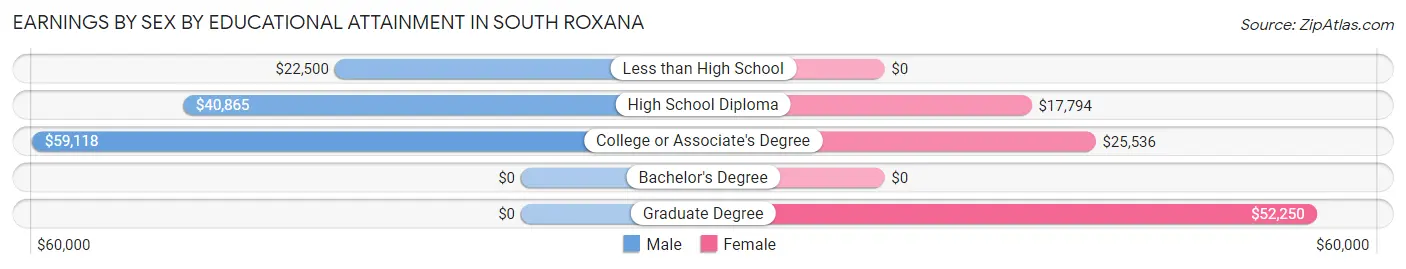
Earnings by Sex by Educational Attainment in South Roxana
Average earnings in South Roxana are $46,413 for men and $19,961 for women, a difference of 57.0%. Men with an educational attainment of college or associate's degree enjoy the highest average annual earnings of $59,118, while those with less than high school education earn the least with $22,500. Women with an educational attainment of graduate degree earn the most with the average annual earnings of $52,250, while those with high school diploma education have the smallest earnings of $17,794.
| Educational Attainment | Male Income | Female Income |
| Less than High School | $22,500 | $0 |
| High School Diploma | $40,865 | $17,794 |
| College or Associate's Degree | $59,118 | $25,536 |
| Bachelor's Degree | - | - |
| Graduate Degree | - | - |
| Total | $46,413 | $19,961 |
Family Income in South Roxana
Family Income Brackets in South Roxana
According to the South Roxana family income data, there are 140 families falling into the $50,000 to $74,999 income range, which is the most common income bracket and makes up 26.9% of all families. Conversely, the $150,000 to $199,999 income bracket is the least frequent group with only 3 families (0.6%) belonging to this category.
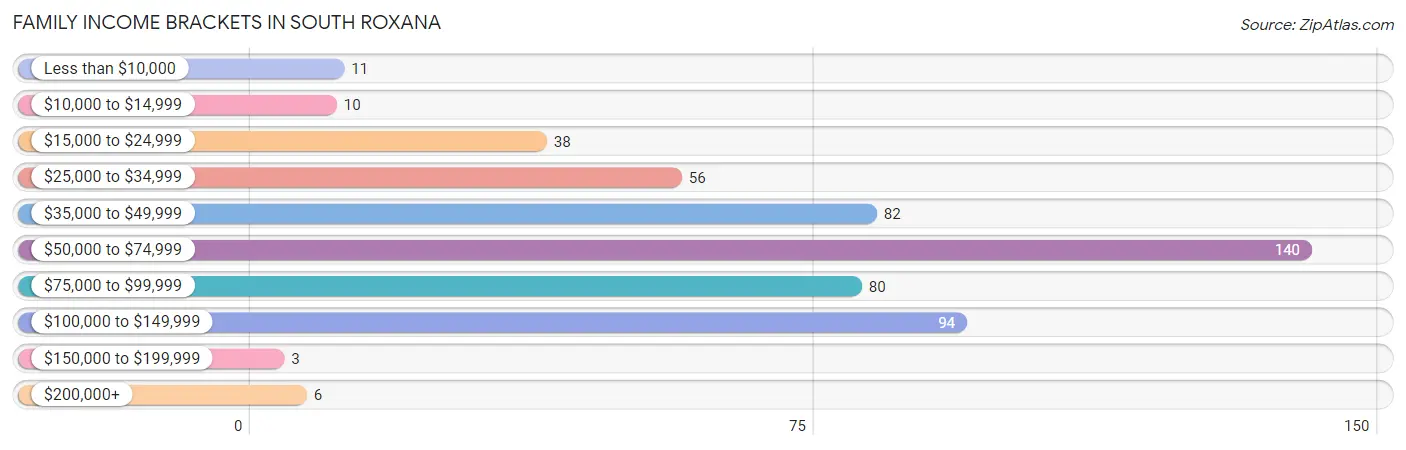
| Income Bracket | # Families | % Families |
| Less than $10,000 | 11 | 2.1% |
| $10,000 to $14,999 | 10 | 1.9% |
| $15,000 to $24,999 | 38 | 7.3% |
| $25,000 to $34,999 | 56 | 10.8% |
| $35,000 to $49,999 | 82 | 15.8% |
| $50,000 to $74,999 | 140 | 26.9% |
| $75,000 to $99,999 | 80 | 15.4% |
| $100,000 to $149,999 | 94 | 18.1% |
| $150,000 to $199,999 | 3 | 0.6% |
| $200,000+ | 6 | 1.2% |
Family Income by Famaliy Size in South Roxana
4-person families (76 | 14.6%) account for the highest median family income in South Roxana with $100,938 per family, while 2-person families (210 | 40.4%) have the highest median income of $30,268 per family member.
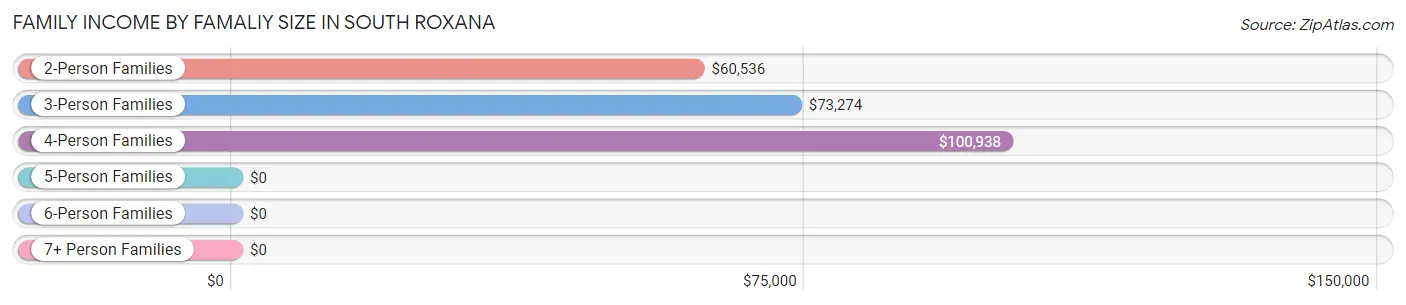
| Income Bracket | # Families | Median Income |
| 2-Person Families | 210 (40.4%) | $60,536 |
| 3-Person Families | 149 (28.6%) | $73,274 |
| 4-Person Families | 76 (14.6%) | $100,938 |
| 5-Person Families | 57 (11.0%) | $0 |
| 6-Person Families | 16 (3.1%) | $0 |
| 7+ Person Families | 12 (2.3%) | $0 |
| Total | 520 (100.0%) | $62,632 |
Family Income by Number of Earners in South Roxana
The median family income in South Roxana is $62,632, with families comprising 2 earners (154) having the highest median family income of $77,188, while families with 1 earner (218) have the lowest median family income of $53,500, accounting for 29.6% and 41.9% of families, respectively.
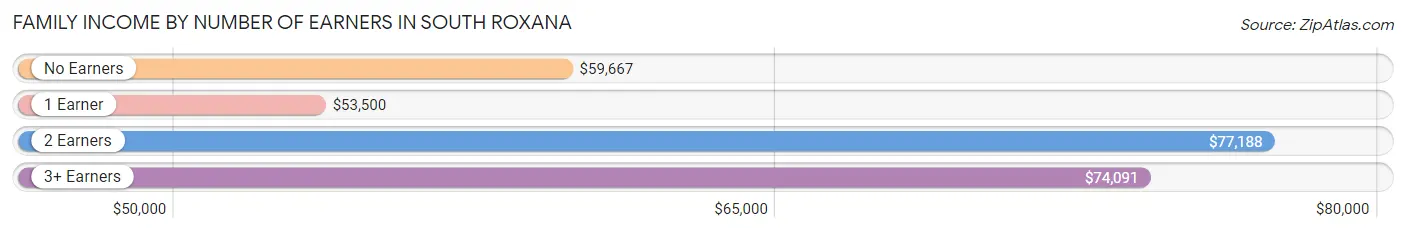
| Number of Earners | # Families | Median Income |
| No Earners | 84 (16.2%) | $59,667 |
| 1 Earner | 218 (41.9%) | $53,500 |
| 2 Earners | 154 (29.6%) | $77,188 |
| 3+ Earners | 64 (12.3%) | $74,091 |
| Total | 520 (100.0%) | $62,632 |
Household Income in South Roxana
Household Income Brackets in South Roxana
With 203 households falling in the category, the $50,000 to $74,999 income range is the most frequent in South Roxana, accounting for 26.7% of all households. In contrast, only 6 households (0.8%) fall into the $200,000+ income bracket, making it the least populous group.
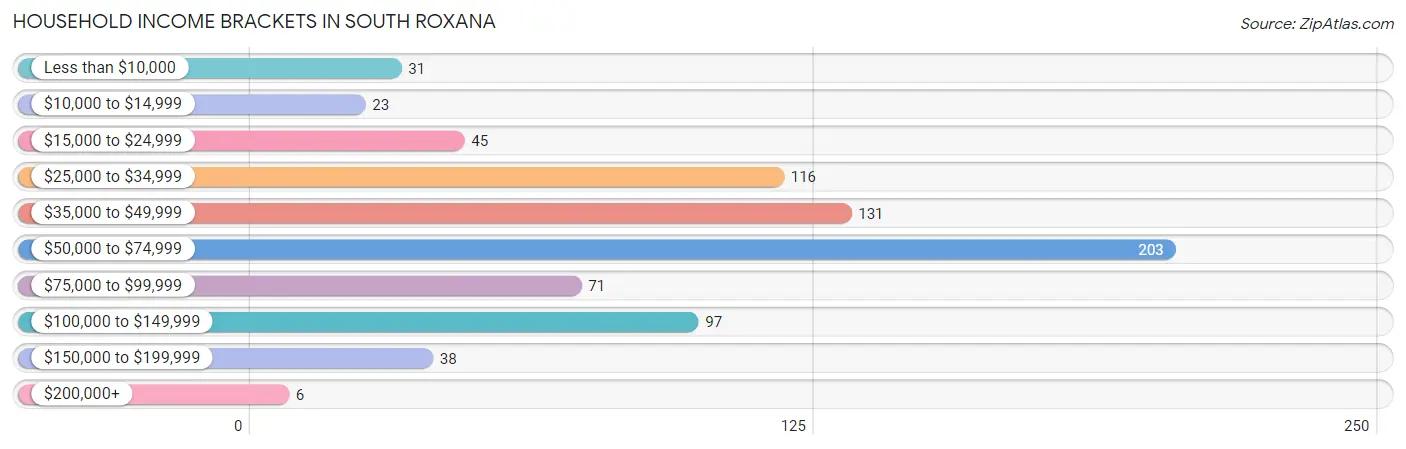
| Income Bracket | # Households | % Households |
| Less than $10,000 | 31 | 4.1% |
| $10,000 to $14,999 | 23 | 3.0% |
| $15,000 to $24,999 | 45 | 5.9% |
| $25,000 to $34,999 | 116 | 15.2% |
| $35,000 to $49,999 | 131 | 17.2% |
| $50,000 to $74,999 | 203 | 26.7% |
| $75,000 to $99,999 | 71 | 9.3% |
| $100,000 to $149,999 | 97 | 12.7% |
| $150,000 to $199,999 | 38 | 5.0% |
| $200,000+ | 6 | 0.8% |
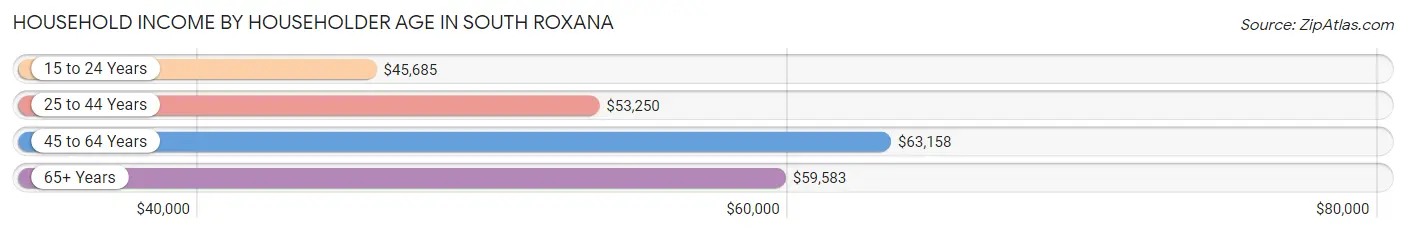
Household Income by Householder Age in South Roxana
The median household income in South Roxana is $59,097, with the highest median household income of $63,158 found in the 45 to 64 years age bracket for the primary householder. A total of 242 households (31.8%) fall into this category. Meanwhile, the 15 to 24 years age bracket for the primary householder has the lowest median household income of $45,685, with 63 households (8.3%) in this group.
| Income Bracket | # Households | Median Income |
| 15 to 24 Years | 63 (8.3%) | $45,685 |
| 25 to 44 Years | 275 (36.1%) | $53,250 |
| 45 to 64 Years | 242 (31.8%) | $63,158 |
| 65+ Years | 181 (23.8%) | $59,583 |
| Total | 761 (100.0%) | $59,097 |
Poverty in South Roxana
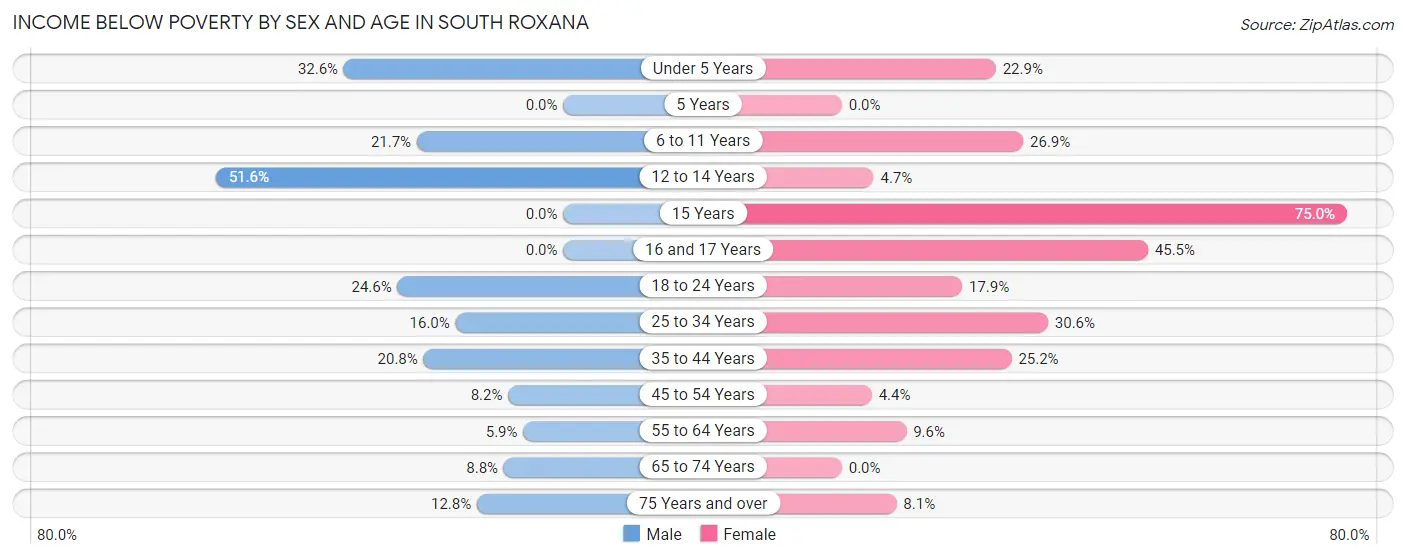
Income Below Poverty by Sex and Age in South Roxana
With 17.6% poverty level for males and 16.7% for females among the residents of South Roxana, 12 to 14 year old males and 15 year old females are the most vulnerable to poverty, with 16 males (51.6%) and 6 females (75.0%) in their respective age groups living below the poverty level.
| Age Bracket | Male | Female |
| Under 5 Years | 29 (32.6%) | 8 (22.9%) |
| 5 Years | 0 (0.0%) | 0 (0.0%) |
| 6 to 11 Years | 20 (21.7%) | 28 (26.9%) |
| 12 to 14 Years | 16 (51.6%) | 4 (4.7%) |
| 15 Years | 0 (0.0%) | 6 (75.0%) |
| 16 and 17 Years | 0 (0.0%) | 5 (45.5%) |
| 18 to 24 Years | 32 (24.6%) | 30 (17.9%) |
| 25 to 34 Years | 24 (16.0%) | 41 (30.6%) |
| 35 to 44 Years | 33 (20.7%) | 33 (25.2%) |
| 45 to 54 Years | 9 (8.2%) | 6 (4.4%) |
| 55 to 64 Years | 6 (5.9%) | 11 (9.6%) |
| 65 to 74 Years | 9 (8.8%) | 0 (0.0%) |
| 75 Years and over | 5 (12.8%) | 6 (8.1%) |
| Total | 183 (17.6%) | 178 (16.7%) |
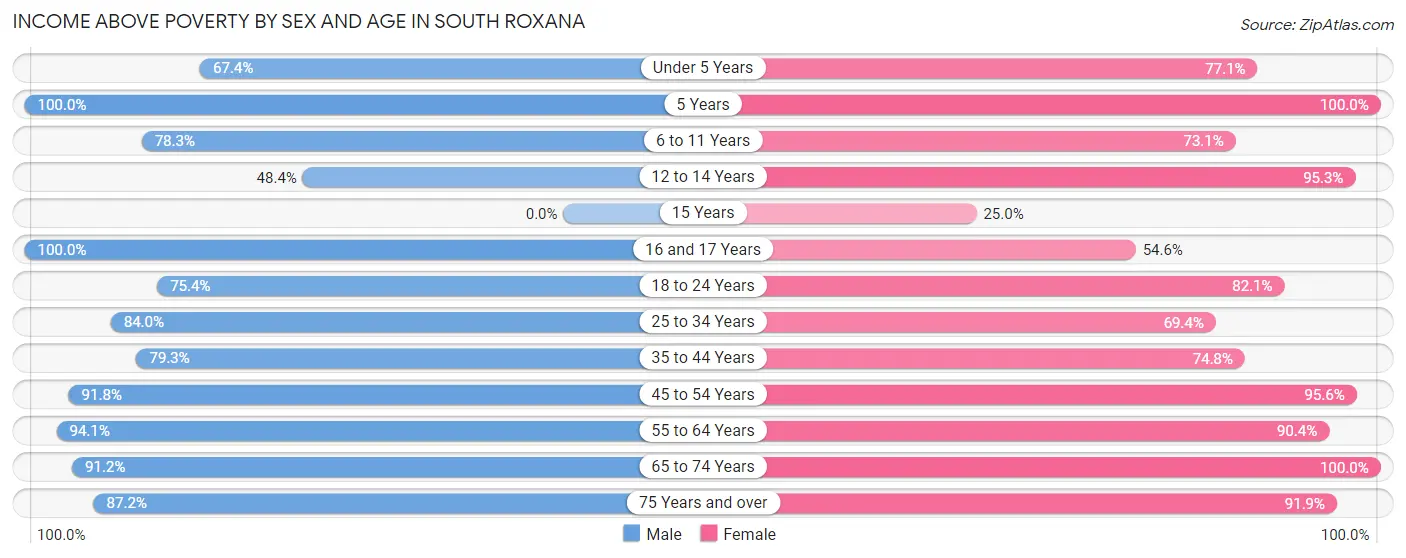
Income Above Poverty by Sex and Age in South Roxana
According to the poverty statistics in South Roxana, males aged 5 years and females aged 5 years are the age groups that are most secure financially, with 100.0% of males and 100.0% of females in these age groups living above the poverty line.
| Age Bracket | Male | Female |
| Under 5 Years | 60 (67.4%) | 27 (77.1%) |
| 5 Years | 11 (100.0%) | 8 (100.0%) |
| 6 to 11 Years | 72 (78.3%) | 76 (73.1%) |
| 12 to 14 Years | 15 (48.4%) | 81 (95.3%) |
| 15 Years | 0 (0.0%) | 2 (25.0%) |
| 16 and 17 Years | 23 (100.0%) | 6 (54.5%) |
| 18 to 24 Years | 98 (75.4%) | 138 (82.1%) |
| 25 to 34 Years | 126 (84.0%) | 93 (69.4%) |
| 35 to 44 Years | 126 (79.2%) | 98 (74.8%) |
| 45 to 54 Years | 101 (91.8%) | 129 (95.6%) |
| 55 to 64 Years | 95 (94.1%) | 104 (90.4%) |
| 65 to 74 Years | 93 (91.2%) | 56 (100.0%) |
| 75 Years and over | 34 (87.2%) | 68 (91.9%) |
| Total | 854 (82.4%) | 886 (83.3%) |
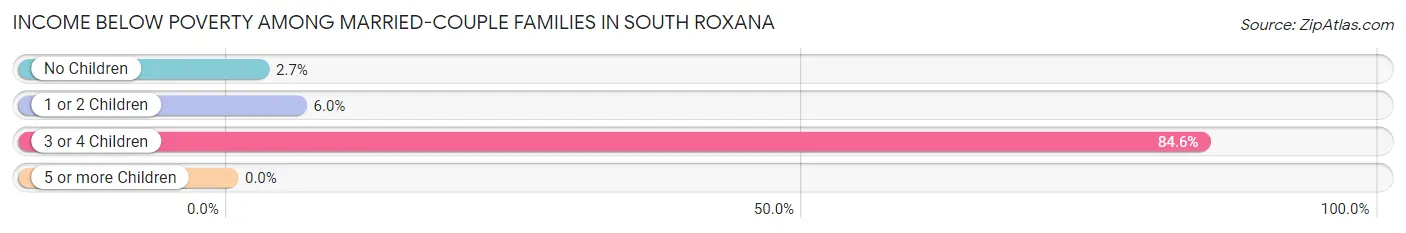
Income Below Poverty Among Married-Couple Families in South Roxana
The poverty statistics for married-couple families in South Roxana show that 14.4% or 42 of the total 291 families live below the poverty line. Families with 3 or 4 children have the highest poverty rate of 84.6%, comprising of 33 families. On the other hand, families with no children have the lowest poverty rate of 2.7%, which includes 5 families.
| Children | Above Poverty | Below Poverty |
| No Children | 180 (97.3%) | 5 (2.7%) |
| 1 or 2 Children | 63 (94.0%) | 4 (6.0%) |
| 3 or 4 Children | 6 (15.4%) | 33 (84.6%) |
| 5 or more Children | 0 (0.0%) | 0 (0.0%) |
| Total | 249 (85.6%) | 42 (14.4%) |
Income Below Poverty Among Single-Parent Households in South Roxana
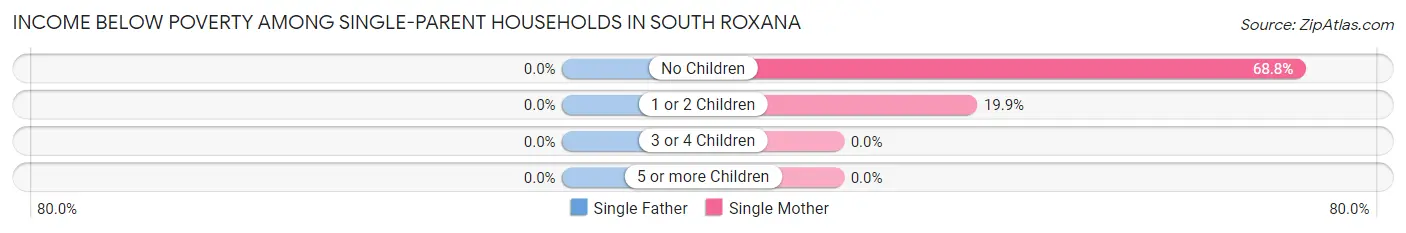
| Children | Single Father | Single Mother |
| No Children | 0 (0.0%) | 11 (68.8%) |
| 1 or 2 Children | 0 (0.0%) | 29 (19.9%) |
| 3 or 4 Children | 0 (0.0%) | 0 (0.0%) |
| 5 or more Children | 0 (0.0%) | 0 (0.0%) |
| Total | 0 (0.0%) | 40 (23.0%) |
Income Below Poverty Among Married-Couple vs Single-Parent Households in South Roxana
The poverty data for South Roxana shows that 42 of the married-couple family households (14.4%) and 40 of the single-parent households (17.5%) are living below the poverty level. Within the married-couple family households, those with 3 or 4 children have the highest poverty rate, with 33 households (84.6%) falling below the poverty line. Among the single-parent households, those with no children have the highest poverty rate, with 11 household (32.4%) living below poverty.
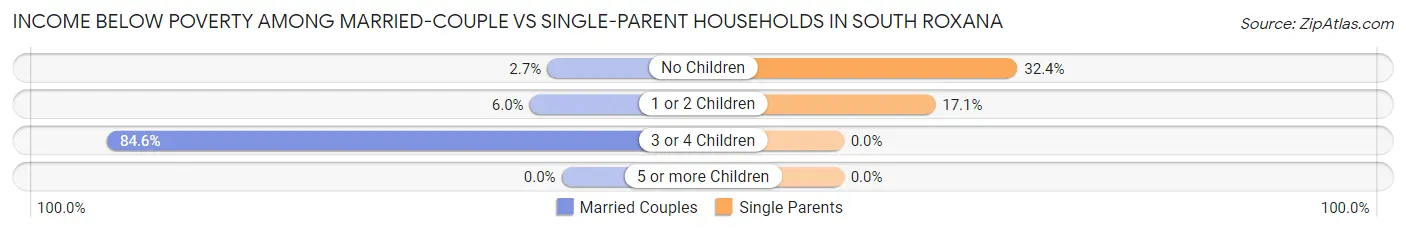
| Children | Married-Couple Families | Single-Parent Households |
| No Children | 5 (2.7%) | 11 (32.4%) |
| 1 or 2 Children | 4 (6.0%) | 29 (17.1%) |
| 3 or 4 Children | 33 (84.6%) | 0 (0.0%) |
| 5 or more Children | 0 (0.0%) | 0 (0.0%) |
| Total | 42 (14.4%) | 40 (17.5%) |
Race in South Roxana
The most populous races in South Roxana are White / Caucasian (1,880 | 88.6%), Two or more Races (171 | 8.1%), and Hispanic or Latino (90 | 4.2%).
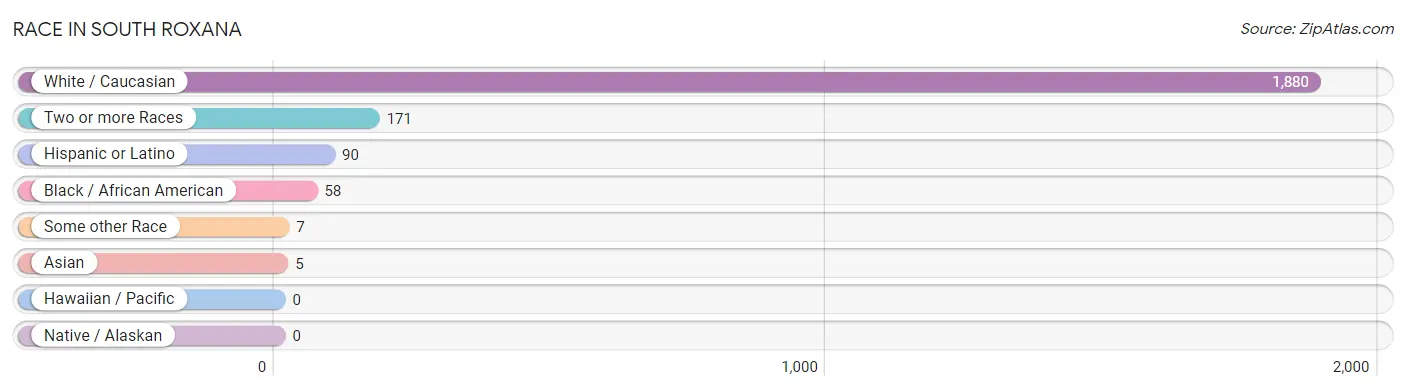
| Race | # Population | % Population |
| Asian | 5 | 0.2% |
| Black / African American | 58 | 2.7% |
| Hawaiian / Pacific | 0 | 0.0% |
| Hispanic or Latino | 90 | 4.2% |
| Native / Alaskan | 0 | 0.0% |
| White / Caucasian | 1,880 | 88.6% |
| Two or more Races | 171 | 8.1% |
| Some other Race | 7 | 0.3% |
| Total | 2,121 | 100.0% |
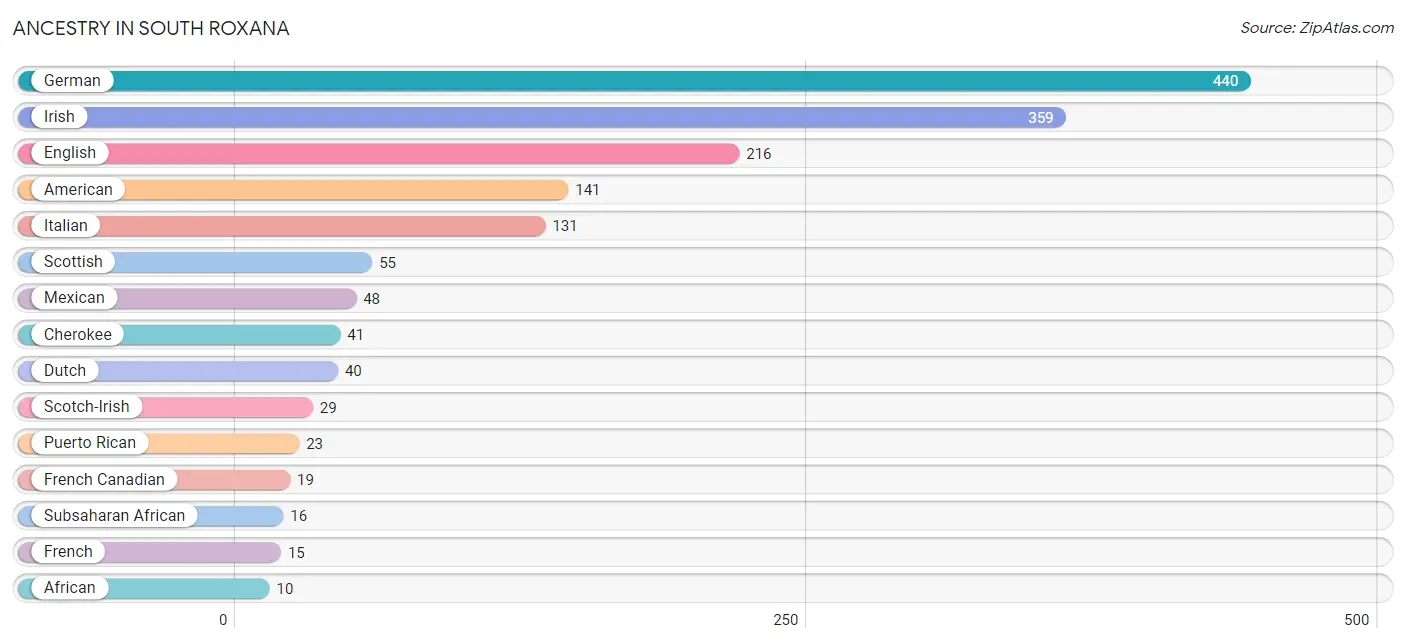
Ancestry in South Roxana
The most populous ancestries reported in South Roxana are German (440 | 20.7%), Irish (359 | 16.9%), English (216 | 10.2%), American (141 | 6.7%), and Italian (131 | 6.2%), together accounting for 60.7% of all South Roxana residents.
| Ancestry | # Population | % Population |
| African | 10 | 0.5% |
| American | 141 | 6.7% |
| Blackfeet | 1 | 0.1% |
| Central American | 7 | 0.3% |
| Cherokee | 41 | 1.9% |
| Dutch | 40 | 1.9% |
| English | 216 | 10.2% |
| European | 2 | 0.1% |
| French | 15 | 0.7% |
| French Canadian | 19 | 0.9% |
| German | 440 | 20.7% |
| Honduran | 7 | 0.3% |
| Irish | 359 | 16.9% |
| Italian | 131 | 6.2% |
| Korean | 5 | 0.2% |
| Mexican | 48 | 2.3% |
| Polish | 5 | 0.2% |
| Puerto Rican | 23 | 1.1% |
| Scotch-Irish | 29 | 1.4% |
| Scottish | 55 | 2.6% |
| Spanish | 6 | 0.3% |
| Subsaharan African | 16 | 0.7% |
| Swedish | 9 | 0.4% |
| Thai | 2 | 0.1% | View All 24 Rows |
Immigrants in South Roxana
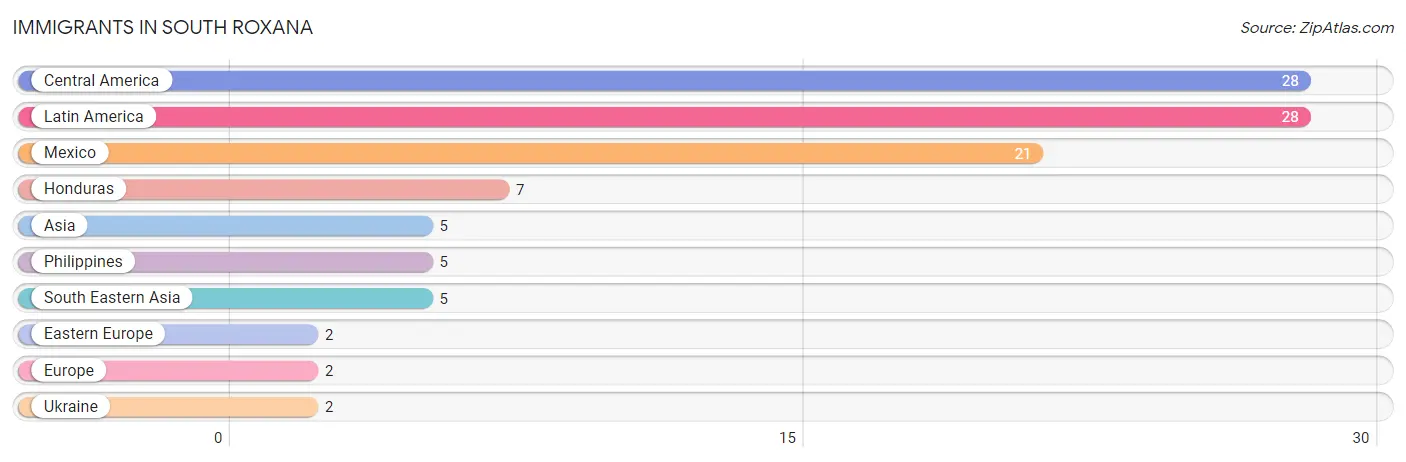
The most numerous immigrant groups reported in South Roxana came from Central America (28 | 1.3%), Latin America (28 | 1.3%), Mexico (21 | 1.0%), Honduras (7 | 0.3%), and Asia (5 | 0.2%), together accounting for 4.2% of all South Roxana residents.
| Immigration Origin | # Population | % Population |
| Asia | 5 | 0.2% |
| Central America | 28 | 1.3% |
| Eastern Europe | 2 | 0.1% |
| Europe | 2 | 0.1% |
| Honduras | 7 | 0.3% |
| Latin America | 28 | 1.3% |
| Mexico | 21 | 1.0% |
| Philippines | 5 | 0.2% |
| South Eastern Asia | 5 | 0.2% |
| Ukraine | 2 | 0.1% | View All 10 Rows |
Sex and Age in South Roxana
Sex and Age in South Roxana
The most populous age groups in South Roxana are 40 to 44 Years (94 | 9.0%) for men and 10 to 14 Years (169 | 15.7%) for women.
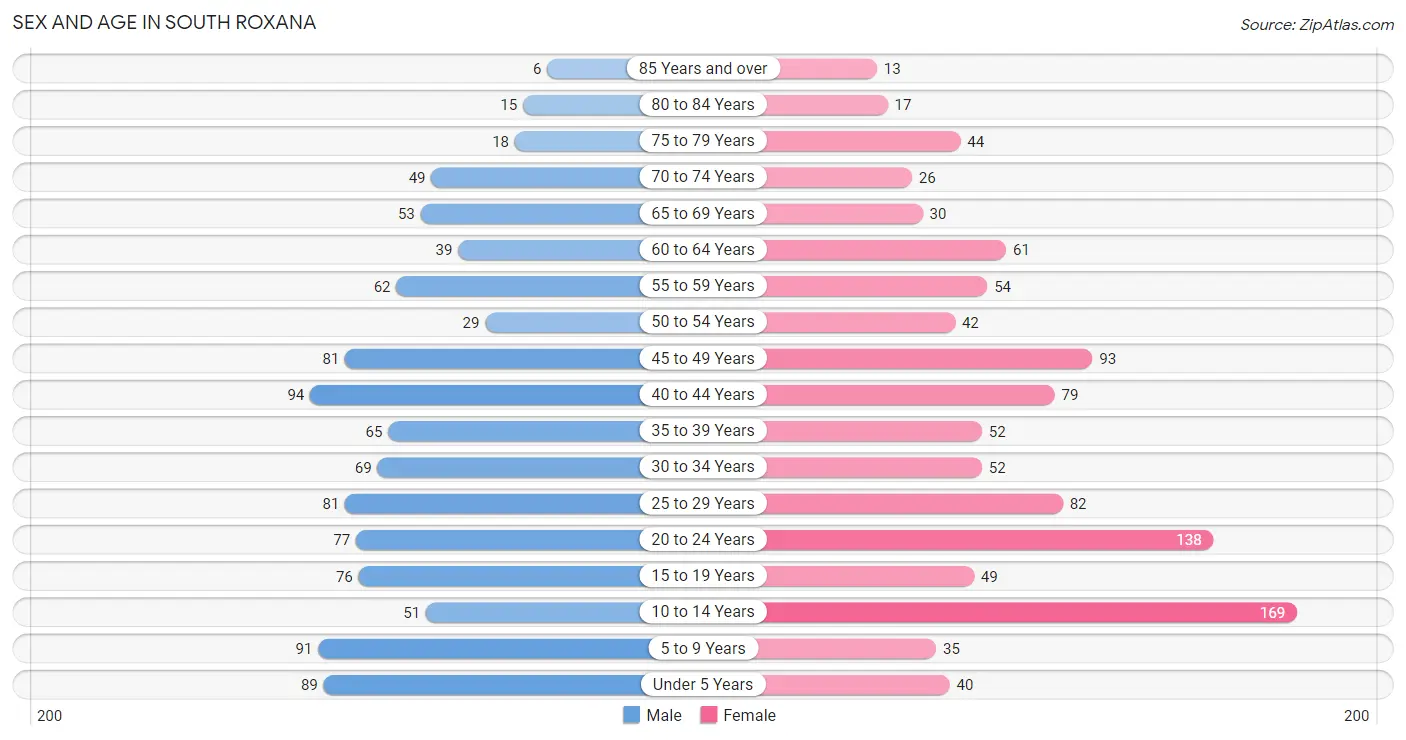
| Age Bracket | Male | Female |
| Under 5 Years | 89 (8.5%) | 40 (3.7%) |
| 5 to 9 Years | 91 (8.7%) | 35 (3.3%) |
| 10 to 14 Years | 51 (4.9%) | 169 (15.7%) |
| 15 to 19 Years | 76 (7.3%) | 49 (4.5%) |
| 20 to 24 Years | 77 (7.4%) | 138 (12.8%) |
| 25 to 29 Years | 81 (7.7%) | 82 (7.6%) |
| 30 to 34 Years | 69 (6.6%) | 52 (4.8%) |
| 35 to 39 Years | 65 (6.2%) | 52 (4.8%) |
| 40 to 44 Years | 94 (9.0%) | 79 (7.3%) |
| 45 to 49 Years | 81 (7.7%) | 93 (8.6%) |
| 50 to 54 Years | 29 (2.8%) | 42 (3.9%) |
| 55 to 59 Years | 62 (5.9%) | 54 (5.0%) |
| 60 to 64 Years | 39 (3.7%) | 61 (5.7%) |
| 65 to 69 Years | 53 (5.1%) | 30 (2.8%) |
| 70 to 74 Years | 49 (4.7%) | 26 (2.4%) |
| 75 to 79 Years | 18 (1.7%) | 44 (4.1%) |
| 80 to 84 Years | 15 (1.4%) | 17 (1.6%) |
| 85 Years and over | 6 (0.6%) | 13 (1.2%) |
| Total | 1,045 (100.0%) | 1,076 (100.0%) |
Families and Households in South Roxana
Median Family Size in South Roxana
The median family size in South Roxana is 3.09 persons per family, with single female/mother families (174 | 33.5%) accounting for the largest median family size of 3.31 persons per family. On the other hand, single male/father families (55 | 10.6%) represent the smallest median family size with 2.24 persons per family.
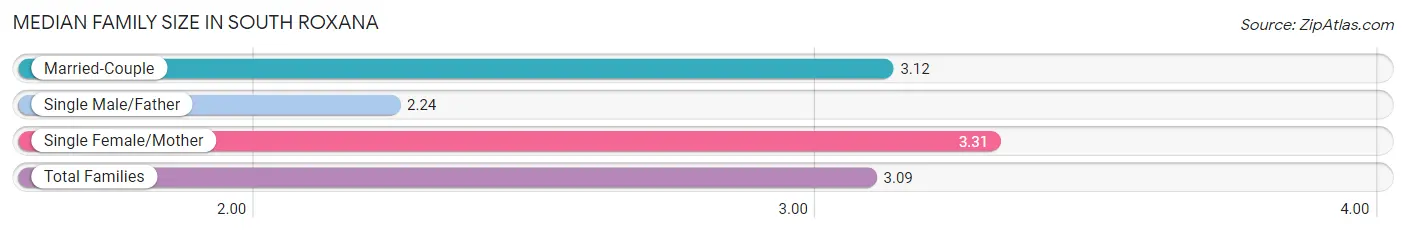
| Family Type | # Families | Family Size |
| Married-Couple | 291 (56.0%) | 3.12 |
| Single Male/Father | 55 (10.6%) | 2.24 |
| Single Female/Mother | 174 (33.5%) | 3.31 |
| Total Families | 520 (100.0%) | 3.09 |
Median Household Size in South Roxana
The median household size in South Roxana is 2.79 persons per household, with single female/mother households (174 | 22.9%) accounting for the largest median household size of 3.95 persons per household. non-family households (241 | 31.7%) represent the smallest median household size with 1.64 persons per household.
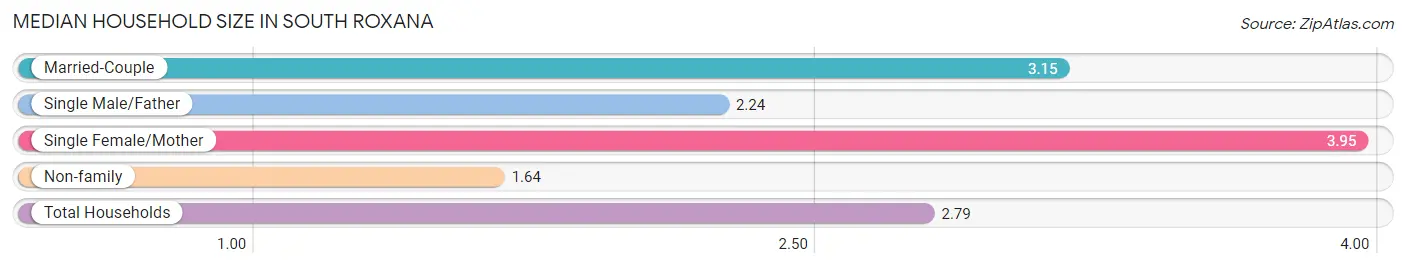
| Household Type | # Households | Household Size |
| Married-Couple | 291 (38.2%) | 3.15 |
| Single Male/Father | 55 (7.2%) | 2.24 |
| Single Female/Mother | 174 (22.9%) | 3.95 |
| Non-family | 241 (31.7%) | 1.64 |
| Total Households | 761 (100.0%) | 2.79 |
Household Size by Marriage Status in South Roxana
Out of a total of 761 households in South Roxana, 520 (68.3%) are family households, while 241 (31.7%) are nonfamily households. The most numerous type of family households are 2-person households, comprising 198, and the most common type of nonfamily households are 1-person households, comprising 133.
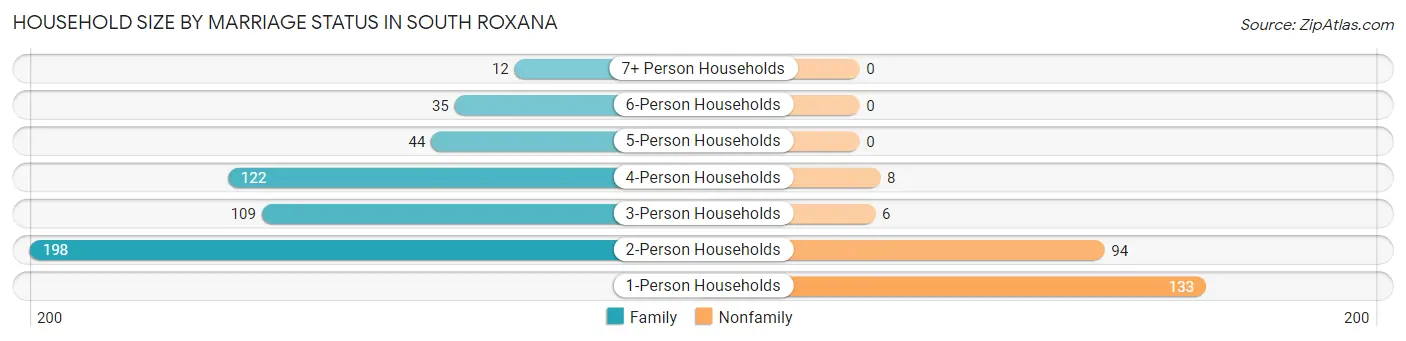
| Household Size | Family Households | Nonfamily Households |
| 1-Person Households | - | 133 (17.5%) |
| 2-Person Households | 198 (26.0%) | 94 (12.3%) |
| 3-Person Households | 109 (14.3%) | 6 (0.8%) |
| 4-Person Households | 122 (16.0%) | 8 (1.1%) |
| 5-Person Households | 44 (5.8%) | 0 (0.0%) |
| 6-Person Households | 35 (4.6%) | 0 (0.0%) |
| 7+ Person Households | 12 (1.6%) | 0 (0.0%) |
| Total | 520 (68.3%) | 241 (31.7%) |
Female Fertility in South Roxana
Fertility by Age in South Roxana
Average fertility rate in South Roxana is 4.0 births per 1,000 women. Women in the age bracket of 20 to 34 years have the highest fertility rate with 7.0 births per 1,000 women. Women in the age bracket of 20 to 34 years acount for 100.0% of all women with births.
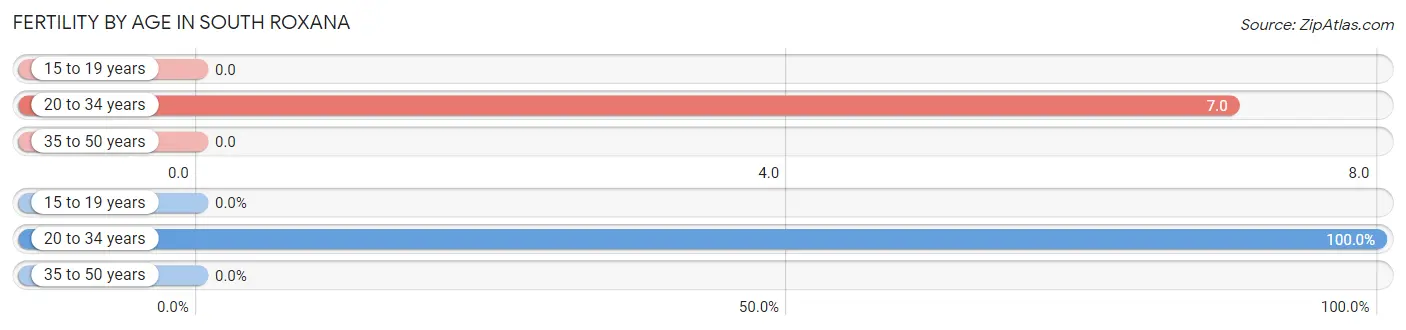
| Age Bracket | Women with Births | Births / 1,000 Women |
| 15 to 19 years | 0 (0.0%) | 0.0 |
| 20 to 34 years | 2 (100.0%) | 7.0 |
| 35 to 50 years | 0 (0.0%) | 0.0 |
| Total | 2 (100.0%) | 4.0 |
Fertility by Age by Marriage Status in South Roxana
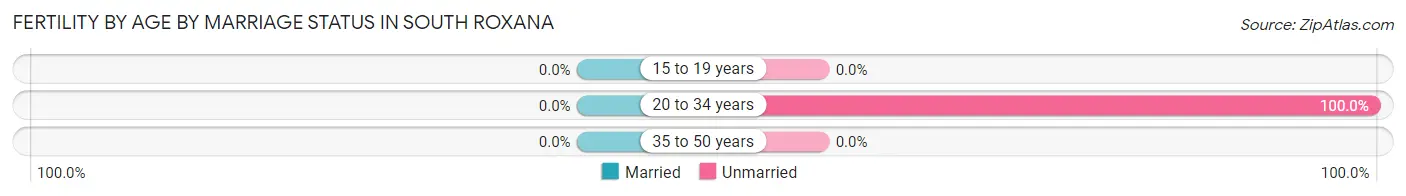
| Age Bracket | Married | Unmarried |
| 15 to 19 years | 0 (0.0%) | 0 (0.0%) |
| 20 to 34 years | 0 (0.0%) | 2 (100.0%) |
| 35 to 50 years | 0 (0.0%) | 0 (0.0%) |
| Total | 0 (0.0%) | 2 (100.0%) |
Fertility by Education in South Roxana
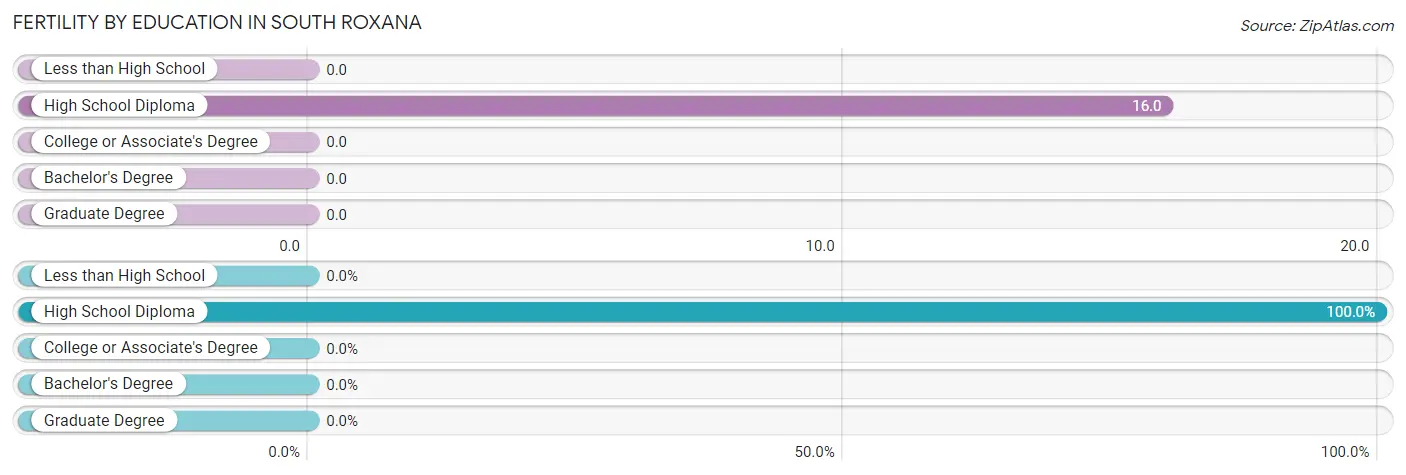
| Educational Attainment | Women with Births | Births / 1,000 Women |
| Less than High School | 0 (0.0%) | 0.0 |
| High School Diploma | 2 (100.0%) | 16.0 |
| College or Associate's Degree | 0 (0.0%) | 0.0 |
| Bachelor's Degree | 0 (0.0%) | 0.0 |
| Graduate Degree | 0 (0.0%) | 0.0 |
| Total | 2 (100.0%) | 4.0 |
Fertility by Education by Marriage Status in South Roxana
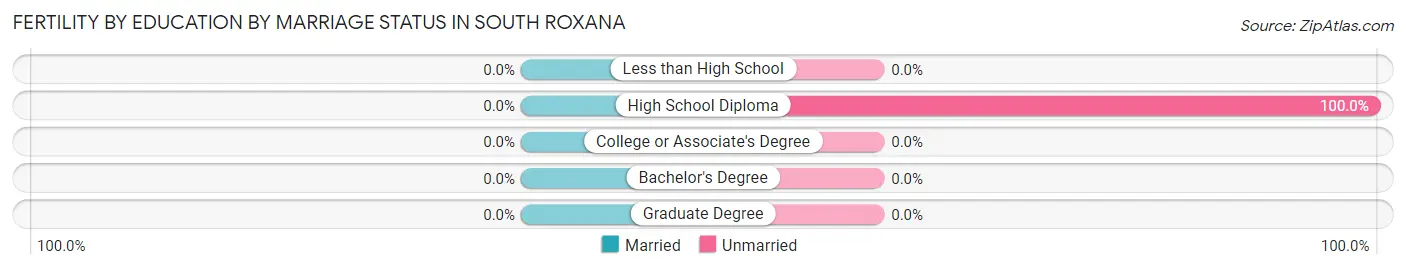
| Educational Attainment | Married | Unmarried |
| Less than High School | 0 (0.0%) | 0 (0.0%) |
| High School Diploma | 0 (0.0%) | 2 (100.0%) |
| College or Associate's Degree | 0 (0.0%) | 0 (0.0%) |
| Bachelor's Degree | 0 (0.0%) | 0 (0.0%) |
| Graduate Degree | 0 (0.0%) | 0 (0.0%) |
| Total | 0 (0.0%) | 2 (100.0%) |
Employment Characteristics in South Roxana
Employment by Class of Employer in South Roxana
Among the 963 employed individuals in South Roxana, private company employees (815 | 84.6%), local government employees (49 | 5.1%), and self-employed (not incorporated) (43 | 4.5%) make up the most common classes of employment.
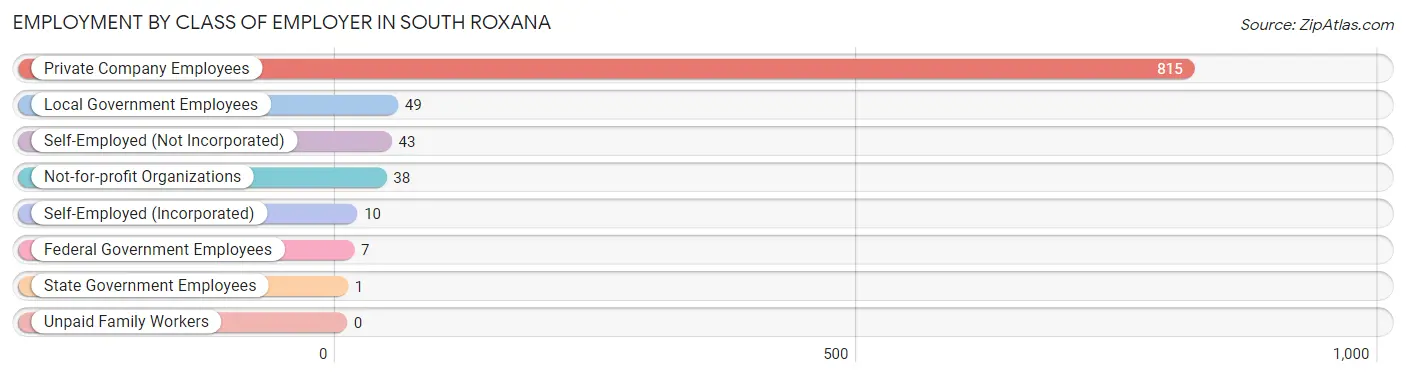
| Employer Class | # Employees | % Employees |
| Private Company Employees | 815 | 84.6% |
| Self-Employed (Incorporated) | 10 | 1.0% |
| Self-Employed (Not Incorporated) | 43 | 4.5% |
| Not-for-profit Organizations | 38 | 4.0% |
| Local Government Employees | 49 | 5.1% |
| State Government Employees | 1 | 0.1% |
| Federal Government Employees | 7 | 0.7% |
| Unpaid Family Workers | 0 | 0.0% |
| Total | 963 | 100.0% |
Employment Status by Age in South Roxana
According to the labor force statistics for South Roxana, out of the total population over 16 years of age (1,638), 66.0% or 1,081 individuals are in the labor force, with 8.2% or 89 of them unemployed. The age group with the highest labor force participation rate is 20 to 24 years, with 94.4% or 203 individuals in the labor force. Within the labor force, the 45 to 54 years age range has the highest percentage of unemployed individuals, with 28.0% or 46 of them being unemployed.
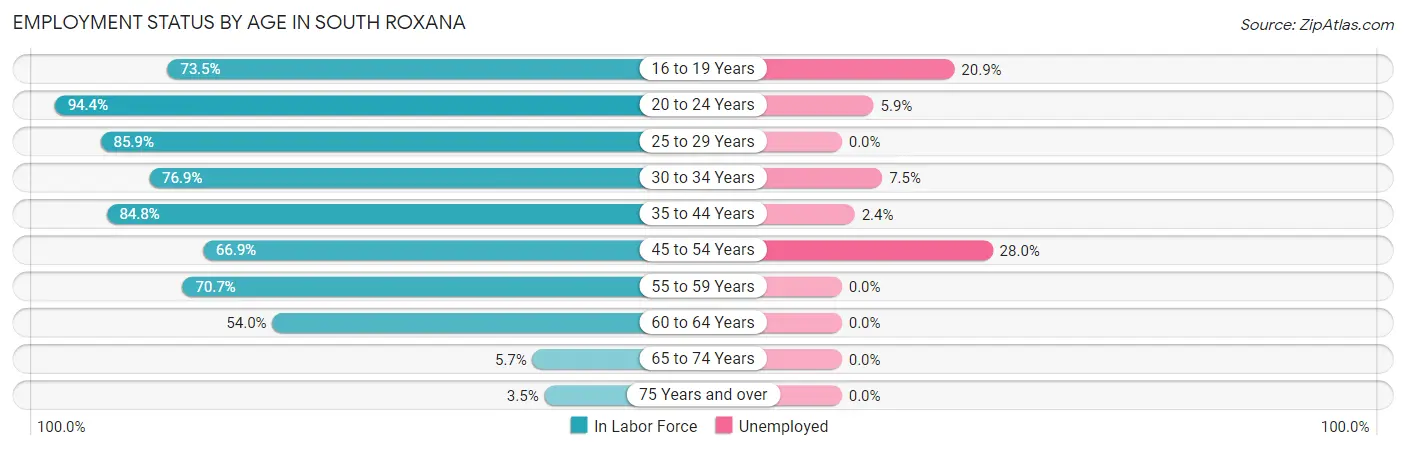
| Age Bracket | In Labor Force | Unemployed |
| 16 to 19 Years | 86 (73.5%) | 18 (20.9%) |
| 20 to 24 Years | 203 (94.4%) | 12 (5.9%) |
| 25 to 29 Years | 140 (85.9%) | 0 (0.0%) |
| 30 to 34 Years | 93 (76.9%) | 7 (7.5%) |
| 35 to 44 Years | 246 (84.8%) | 6 (2.4%) |
| 45 to 54 Years | 164 (66.9%) | 46 (28.0%) |
| 55 to 59 Years | 82 (70.7%) | 0 (0.0%) |
| 60 to 64 Years | 54 (54.0%) | 0 (0.0%) |
| 65 to 74 Years | 9 (5.7%) | 0 (0.0%) |
| 75 Years and over | 4 (3.5%) | 0 (0.0%) |
| Total | 1,081 (66.0%) | 89 (8.2%) |
Employment Status by Educational Attainment in South Roxana
According to labor force statistics for South Roxana, 75.3% of individuals (779) out of the total population between 25 and 64 years of age (1,035) are in the labor force, with 7.6% or 59 of them being unemployed. The group with the highest labor force participation rate are those with the educational attainment of college / associate degree, with 89.0% or 517 individuals in the labor force. Within the labor force, individuals with less than high school education have the highest percentage of unemployment, with 12.1% or 7 of them being unemployed.
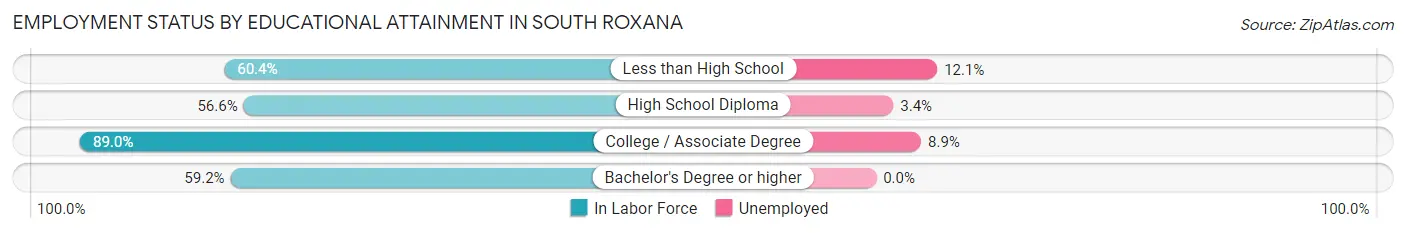
| Educational Attainment | In Labor Force | Unemployed |
| Less than High School | 58 (60.4%) | 12 (12.1%) |
| High School Diploma | 175 (56.6%) | 11 (3.4%) |
| College / Associate Degree | 517 (89.0%) | 52 (8.9%) |
| Bachelor's Degree or higher | 29 (59.2%) | 0 (0.0%) |
| Total | 779 (75.3%) | 79 (7.6%) |
Employment Occupations by Sex in South Roxana
Management, Business, Science and Arts Occupations
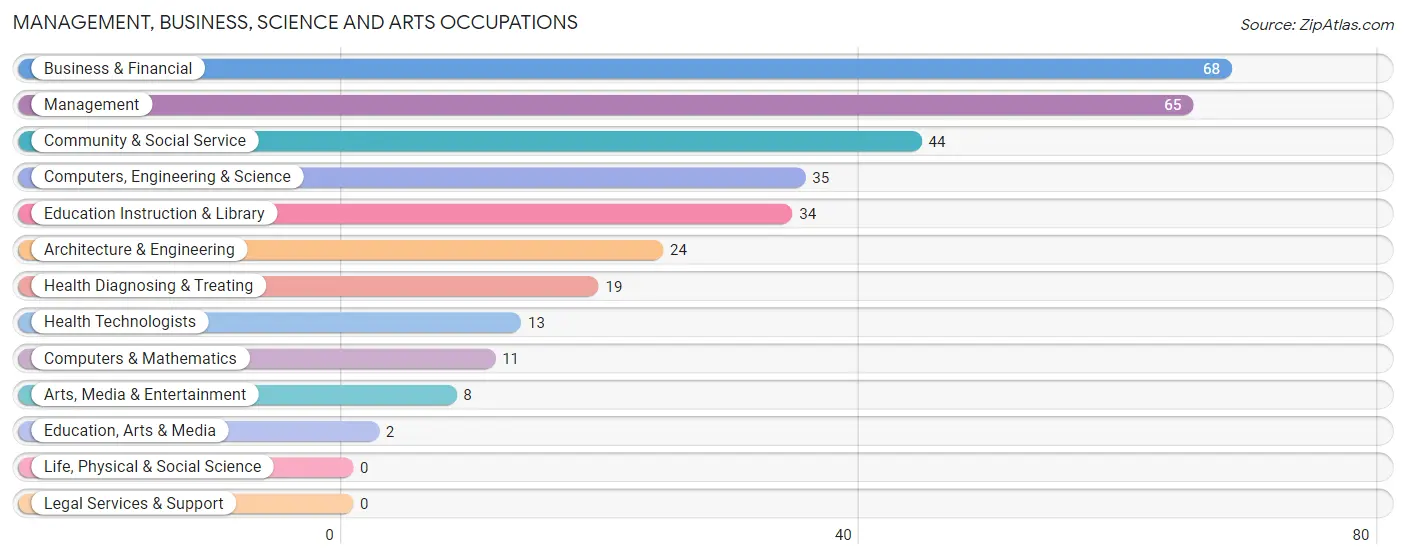
The most common Management, Business, Science and Arts occupations in South Roxana are Business & Financial (68 | 6.9%), Management (65 | 6.6%), Community & Social Service (44 | 4.4%), Computers, Engineering & Science (35 | 3.5%), and Education Instruction & Library (34 | 3.4%).
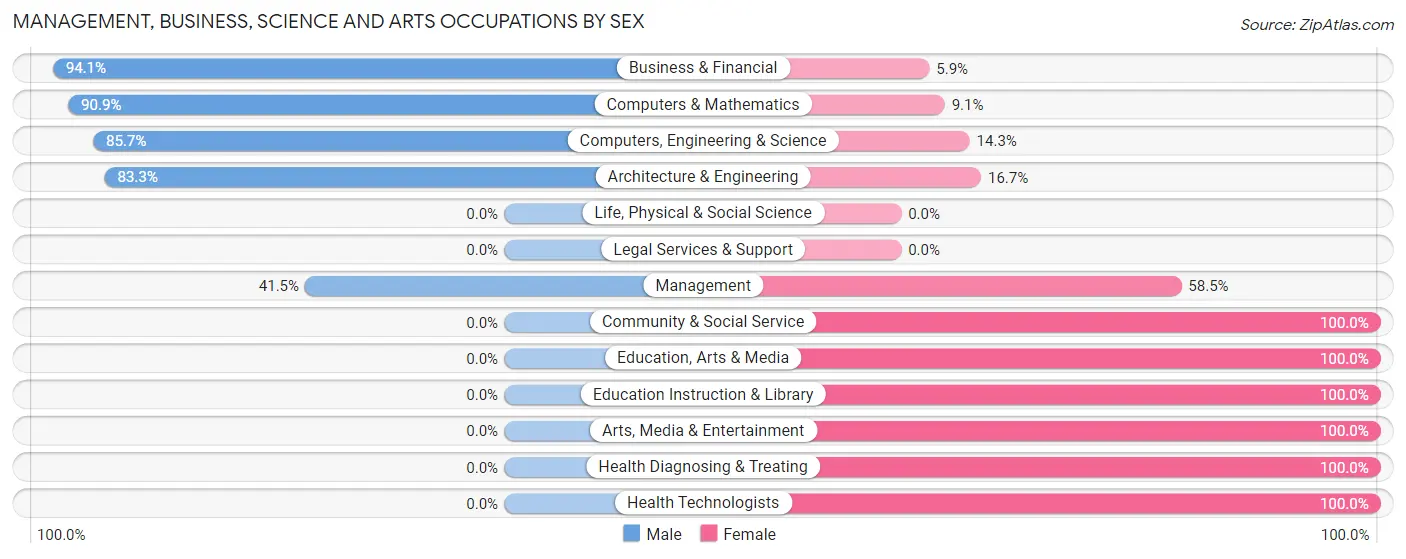
Management, Business, Science and Arts Occupations by Sex
Within the Management, Business, Science and Arts occupations in South Roxana, the most male-oriented occupations are Business & Financial (94.1%), Computers & Mathematics (90.9%), and Computers, Engineering & Science (85.7%), while the most female-oriented occupations are Community & Social Service (100.0%), Education, Arts & Media (100.0%), and Education Instruction & Library (100.0%).
| Occupation | Male | Female |
| Management | 27 (41.5%) | 38 (58.5%) |
| Business & Financial | 64 (94.1%) | 4 (5.9%) |
| Computers, Engineering & Science | 30 (85.7%) | 5 (14.3%) |
| Computers & Mathematics | 10 (90.9%) | 1 (9.1%) |
| Architecture & Engineering | 20 (83.3%) | 4 (16.7%) |
| Life, Physical & Social Science | 0 (0.0%) | 0 (0.0%) |
| Community & Social Service | 0 (0.0%) | 44 (100.0%) |
| Education, Arts & Media | 0 (0.0%) | 2 (100.0%) |
| Legal Services & Support | 0 (0.0%) | 0 (0.0%) |
| Education Instruction & Library | 0 (0.0%) | 34 (100.0%) |
| Arts, Media & Entertainment | 0 (0.0%) | 8 (100.0%) |
| Health Diagnosing & Treating | 0 (0.0%) | 19 (100.0%) |
| Health Technologists | 0 (0.0%) | 13 (100.0%) |
| Total (Category) | 121 (52.4%) | 110 (47.6%) |
| Total (Overall) | 522 (52.6%) | 470 (47.4%) |
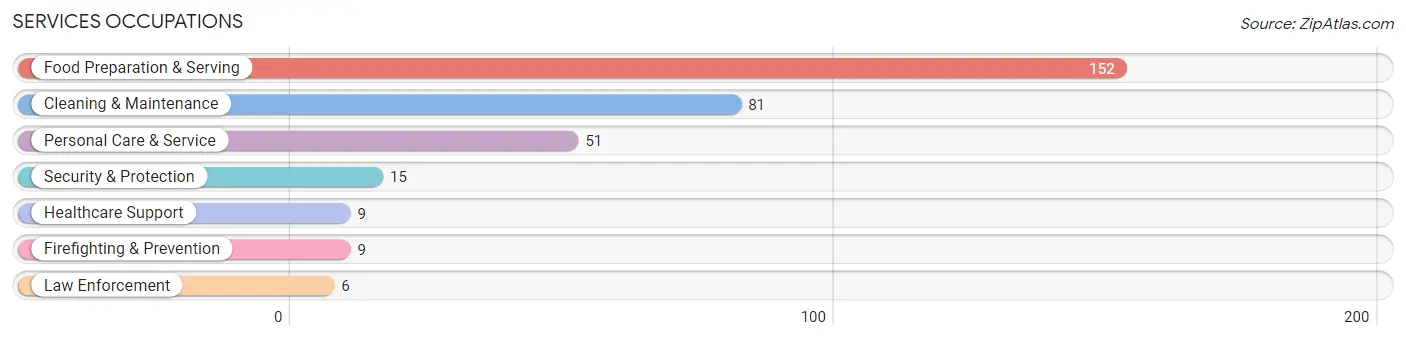
Services Occupations
The most common Services occupations in South Roxana are Food Preparation & Serving (152 | 15.3%), Cleaning & Maintenance (81 | 8.2%), Personal Care & Service (51 | 5.1%), Security & Protection (15 | 1.5%), and Healthcare Support (9 | 0.9%).
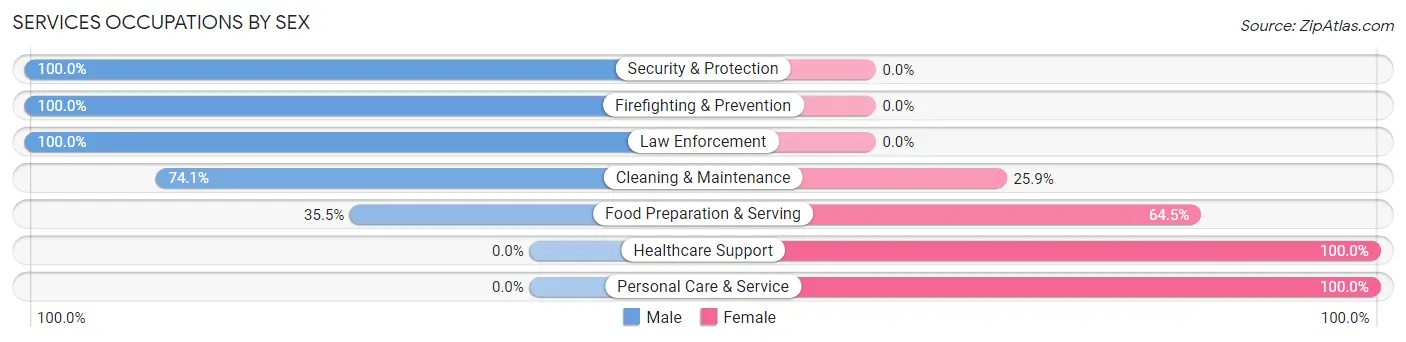
Services Occupations by Sex
Within the Services occupations in South Roxana, the most male-oriented occupations are Security & Protection (100.0%), Firefighting & Prevention (100.0%), and Law Enforcement (100.0%), while the most female-oriented occupations are Healthcare Support (100.0%), Personal Care & Service (100.0%), and Food Preparation & Serving (64.5%).
| Occupation | Male | Female |
| Healthcare Support | 0 (0.0%) | 9 (100.0%) |
| Security & Protection | 15 (100.0%) | 0 (0.0%) |
| Firefighting & Prevention | 9 (100.0%) | 0 (0.0%) |
| Law Enforcement | 6 (100.0%) | 0 (0.0%) |
| Food Preparation & Serving | 54 (35.5%) | 98 (64.5%) |
| Cleaning & Maintenance | 60 (74.1%) | 21 (25.9%) |
| Personal Care & Service | 0 (0.0%) | 51 (100.0%) |
| Total (Category) | 129 (41.9%) | 179 (58.1%) |
| Total (Overall) | 522 (52.6%) | 470 (47.4%) |
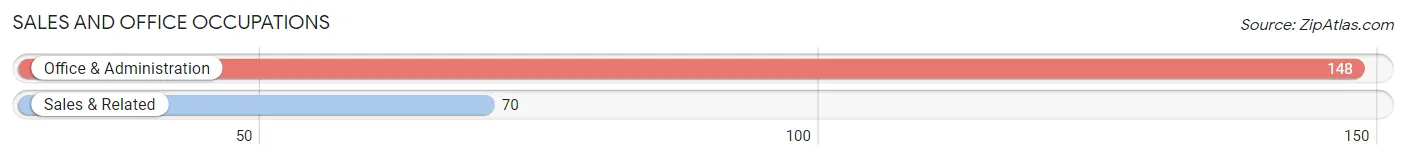
Sales and Office Occupations
The most common Sales and Office occupations in South Roxana are Office & Administration (148 | 14.9%), and Sales & Related (70 | 7.1%).
Sales and Office Occupations by Sex
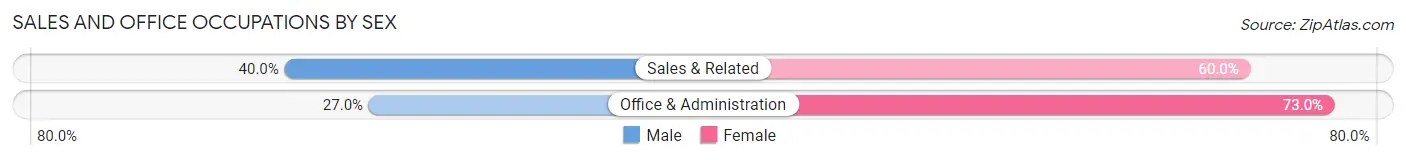
| Occupation | Male | Female |
| Sales & Related | 28 (40.0%) | 42 (60.0%) |
| Office & Administration | 40 (27.0%) | 108 (73.0%) |
| Total (Category) | 68 (31.2%) | 150 (68.8%) |
| Total (Overall) | 522 (52.6%) | 470 (47.4%) |
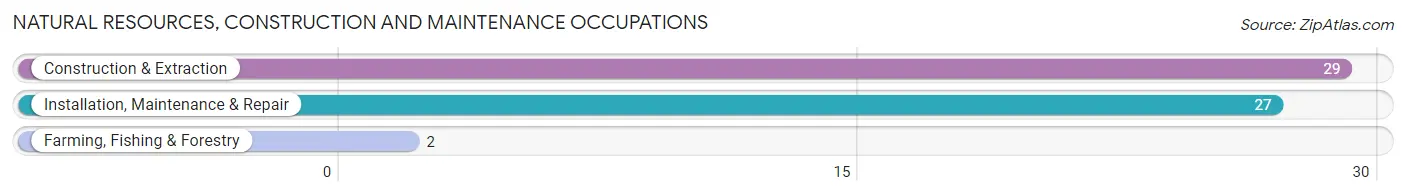
Natural Resources, Construction and Maintenance Occupations
The most common Natural Resources, Construction and Maintenance occupations in South Roxana are Construction & Extraction (29 | 2.9%), Installation, Maintenance & Repair (27 | 2.7%), and Farming, Fishing & Forestry (2 | 0.2%).
Natural Resources, Construction and Maintenance Occupations by Sex
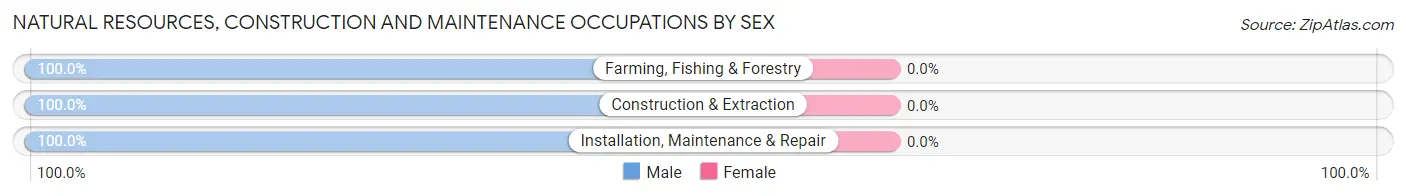
| Occupation | Male | Female |
| Farming, Fishing & Forestry | 2 (100.0%) | 0 (0.0%) |
| Construction & Extraction | 29 (100.0%) | 0 (0.0%) |
| Installation, Maintenance & Repair | 27 (100.0%) | 0 (0.0%) |
| Total (Category) | 58 (100.0%) | 0 (0.0%) |
| Total (Overall) | 522 (52.6%) | 470 (47.4%) |
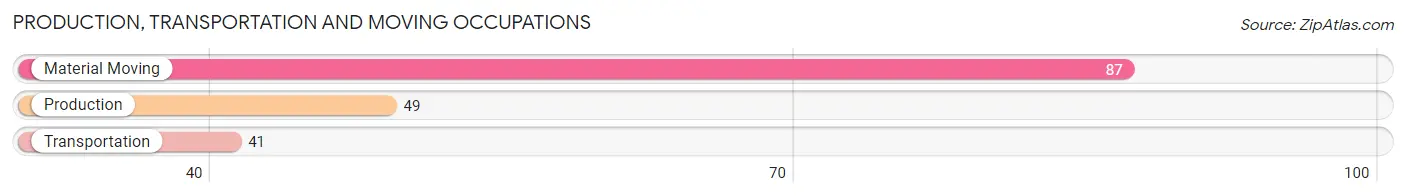
Production, Transportation and Moving Occupations
The most common Production, Transportation and Moving occupations in South Roxana are Material Moving (87 | 8.8%), Production (49 | 4.9%), and Transportation (41 | 4.1%).
Production, Transportation and Moving Occupations by Sex
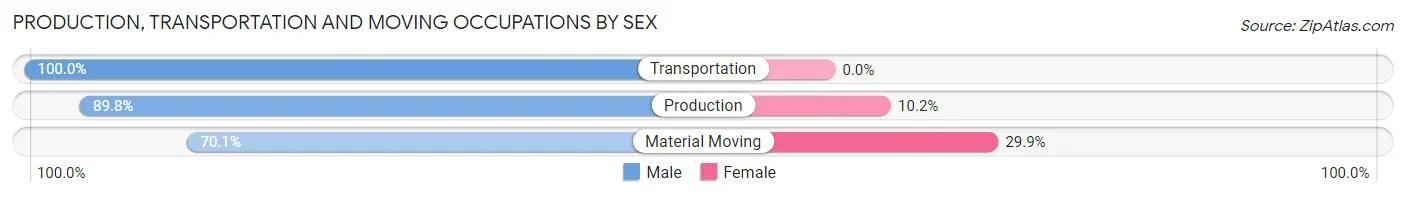
| Occupation | Male | Female |
| Production | 44 (89.8%) | 5 (10.2%) |
| Transportation | 41 (100.0%) | 0 (0.0%) |
| Material Moving | 61 (70.1%) | 26 (29.9%) |
| Total (Category) | 146 (82.5%) | 31 (17.5%) |
| Total (Overall) | 522 (52.6%) | 470 (47.4%) |
Employment Industries by Sex in South Roxana
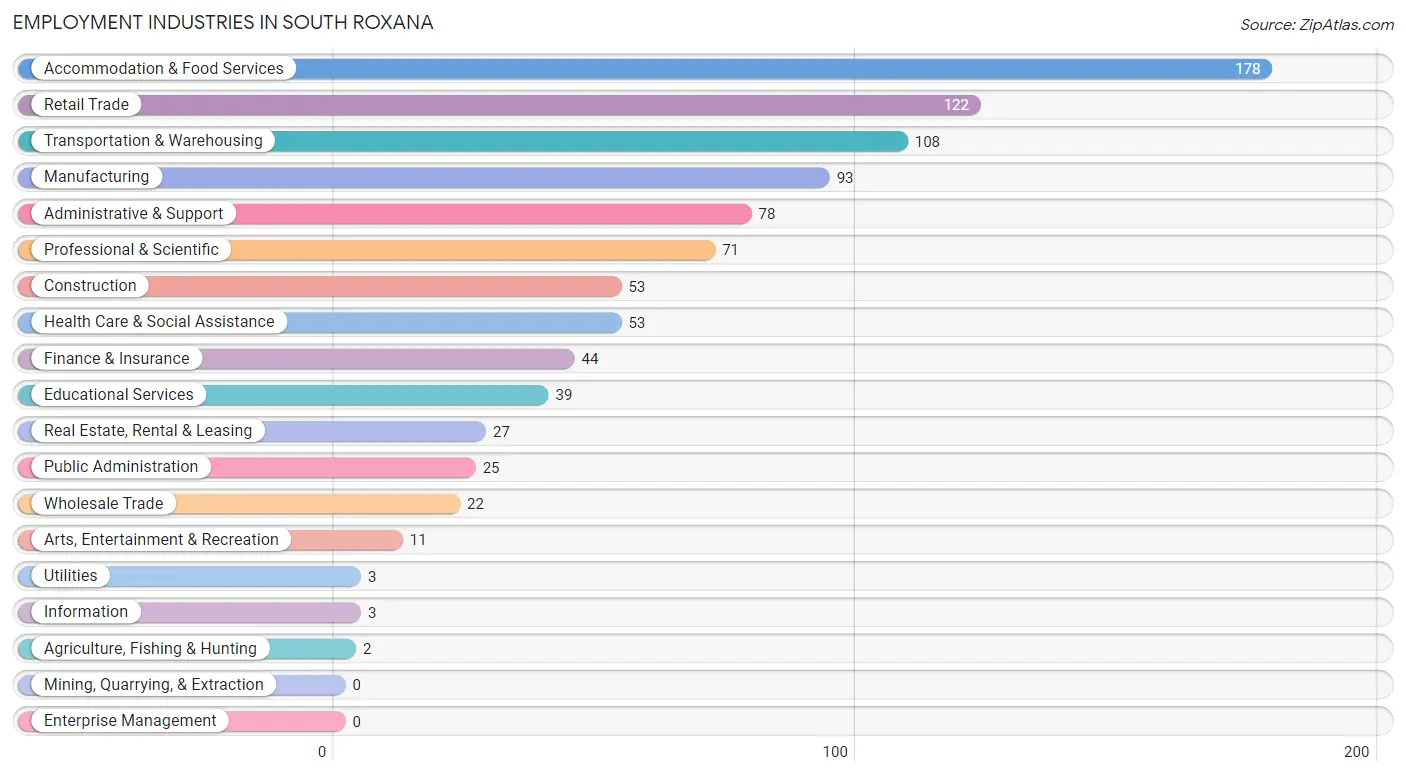
Employment Industries in South Roxana
The major employment industries in South Roxana include Accommodation & Food Services (178 | 17.9%), Retail Trade (122 | 12.3%), Transportation & Warehousing (108 | 10.9%), Manufacturing (93 | 9.4%), and Administrative & Support (78 | 7.9%).
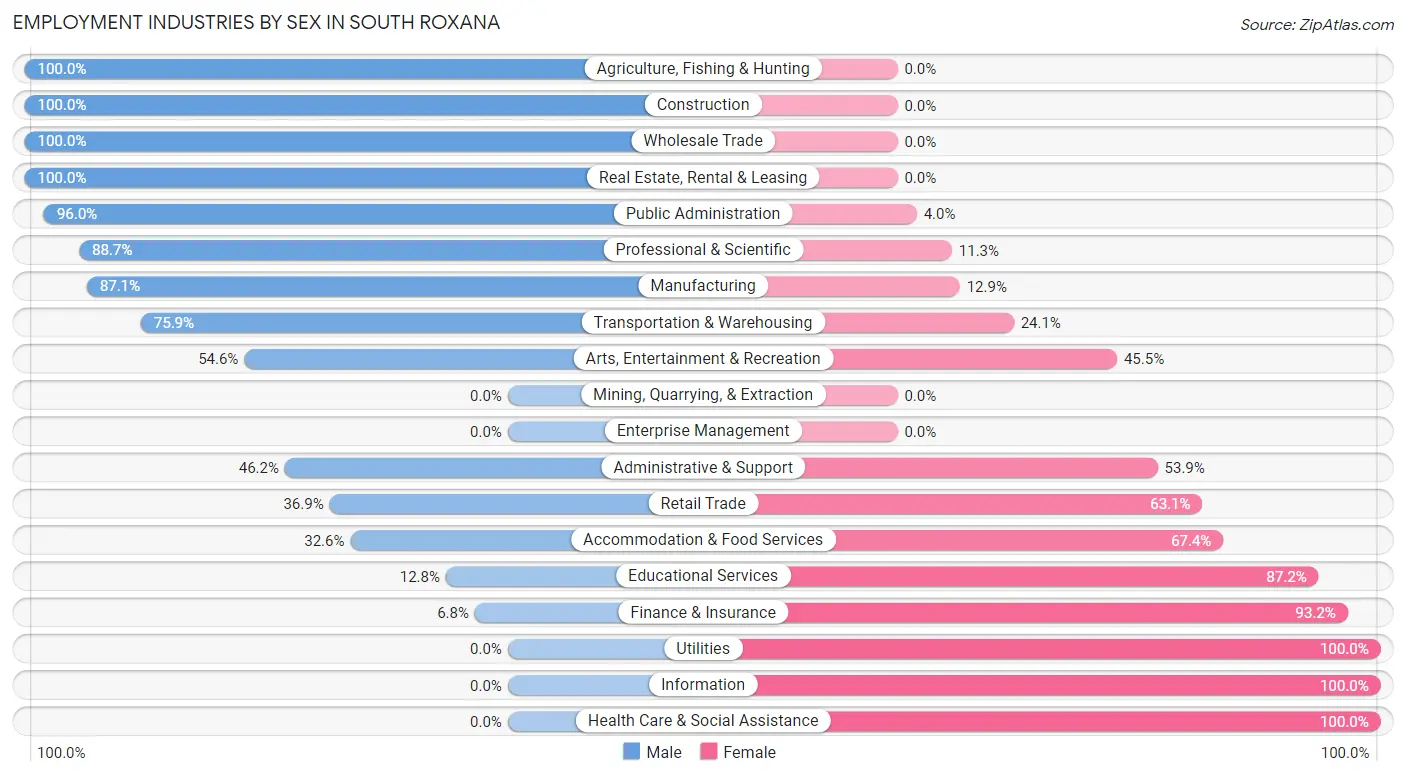
Employment Industries by Sex in South Roxana
The South Roxana industries that see more men than women are Agriculture, Fishing & Hunting (100.0%), Construction (100.0%), and Wholesale Trade (100.0%), whereas the industries that tend to have a higher number of women are Utilities (100.0%), Information (100.0%), and Health Care & Social Assistance (100.0%).
| Industry | Male | Female |
| Agriculture, Fishing & Hunting | 2 (100.0%) | 0 (0.0%) |
| Mining, Quarrying, & Extraction | 0 (0.0%) | 0 (0.0%) |
| Construction | 53 (100.0%) | 0 (0.0%) |
| Manufacturing | 81 (87.1%) | 12 (12.9%) |
| Wholesale Trade | 22 (100.0%) | 0 (0.0%) |
| Retail Trade | 45 (36.9%) | 77 (63.1%) |
| Transportation & Warehousing | 82 (75.9%) | 26 (24.1%) |
| Utilities | 0 (0.0%) | 3 (100.0%) |
| Information | 0 (0.0%) | 3 (100.0%) |
| Finance & Insurance | 3 (6.8%) | 41 (93.2%) |
| Real Estate, Rental & Leasing | 27 (100.0%) | 0 (0.0%) |
| Professional & Scientific | 63 (88.7%) | 8 (11.3%) |
| Enterprise Management | 0 (0.0%) | 0 (0.0%) |
| Administrative & Support | 36 (46.2%) | 42 (53.8%) |
| Educational Services | 5 (12.8%) | 34 (87.2%) |
| Health Care & Social Assistance | 0 (0.0%) | 53 (100.0%) |
| Arts, Entertainment & Recreation | 6 (54.5%) | 5 (45.5%) |
| Accommodation & Food Services | 58 (32.6%) | 120 (67.4%) |
| Public Administration | 24 (96.0%) | 1 (4.0%) |
| Total | 522 (52.6%) | 470 (47.4%) |
Education in South Roxana
School Enrollment in South Roxana
The most common levels of schooling among the 660 students in South Roxana are college / undergraduate (245 | 37.1%), middle school (146 | 22.1%), and elementary school (130 | 19.7%).
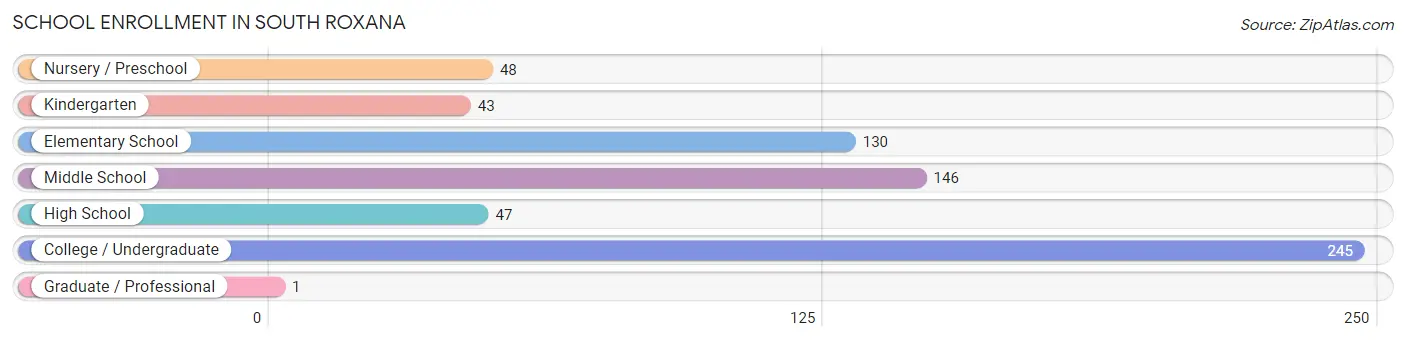
| School Level | # Students | % Students |
| Nursery / Preschool | 48 | 7.3% |
| Kindergarten | 43 | 6.5% |
| Elementary School | 130 | 19.7% |
| Middle School | 146 | 22.1% |
| High School | 47 | 7.1% |
| College / Undergraduate | 245 | 37.1% |
| Graduate / Professional | 1 | 0.2% |
| Total | 660 | 100.0% |
School Enrollment by Age by Funding Source in South Roxana
Out of a total of 660 students who are enrolled in schools in South Roxana, 107 (16.2%) attend a private institution, while the remaining 553 (83.8%) are enrolled in public schools. The age group of 5 to 9 year old has the highest likelihood of being enrolled in private schools, with 51 (42.9% in the age bracket) enrolled. Conversely, the age group of 18 to 19 year olds has the lowest likelihood of being enrolled in a private school, with 20 (100.0% in the age bracket) attending a public institution.
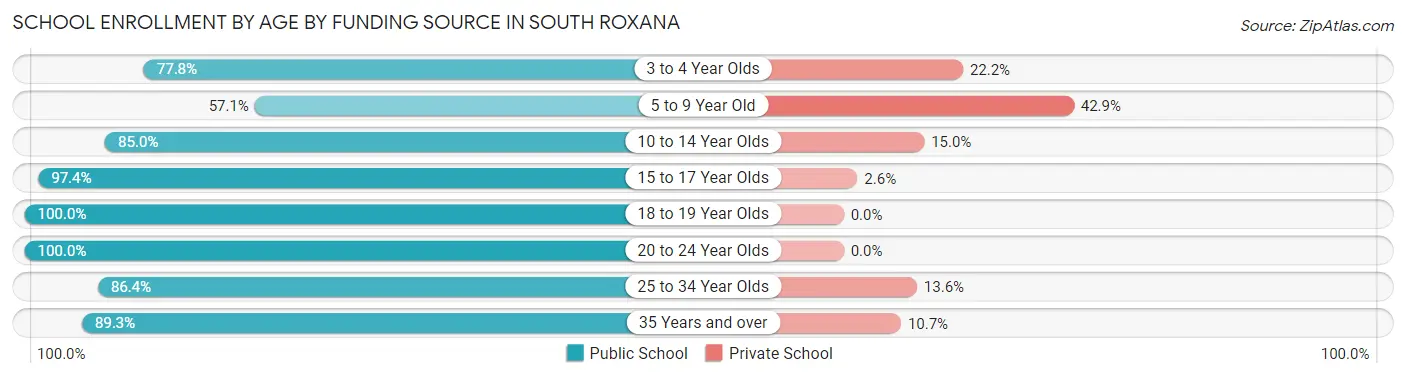
| Age Bracket | Public School | Private School |
| 3 to 4 Year Olds | 28 (77.8%) | 8 (22.2%) |
| 5 to 9 Year Old | 68 (57.1%) | 51 (42.9%) |
| 10 to 14 Year Olds | 187 (85.0%) | 33 (15.0%) |
| 15 to 17 Year Olds | 38 (97.4%) | 1 (2.6%) |
| 18 to 19 Year Olds | 20 (100.0%) | 0 (0.0%) |
| 20 to 24 Year Olds | 107 (100.0%) | 0 (0.0%) |
| 25 to 34 Year Olds | 38 (86.4%) | 6 (13.6%) |
| 35 Years and over | 67 (89.3%) | 8 (10.7%) |
| Total | 553 (83.8%) | 107 (16.2%) |
Educational Attainment by Field of Study in South Roxana
Business (33 | 52.4%), education (16 | 25.4%), arts & humanities (7 | 11.1%), engineering (3 | 4.8%), and science & technology (3 | 4.8%) are the most common fields of study among 63 individuals in South Roxana who have obtained a bachelor's degree or higher.
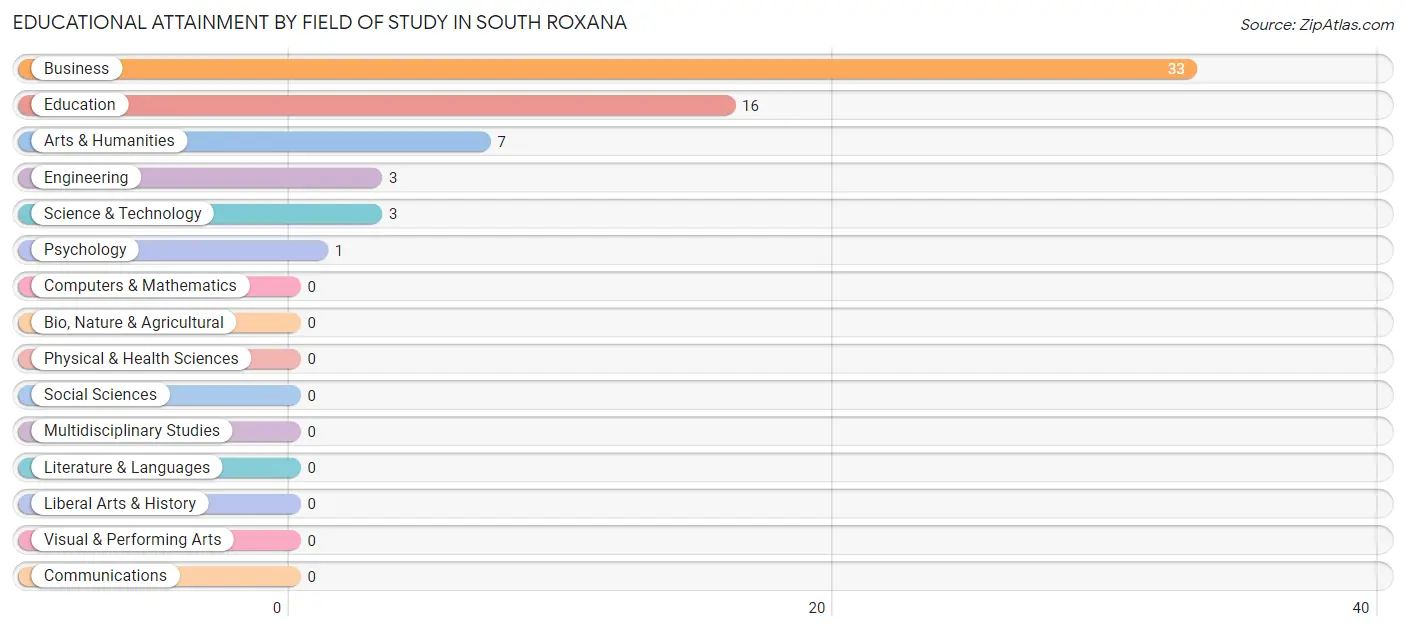
| Field of Study | # Graduates | % Graduates |
| Computers & Mathematics | 0 | 0.0% |
| Bio, Nature & Agricultural | 0 | 0.0% |
| Physical & Health Sciences | 0 | 0.0% |
| Psychology | 1 | 1.6% |
| Social Sciences | 0 | 0.0% |
| Engineering | 3 | 4.8% |
| Multidisciplinary Studies | 0 | 0.0% |
| Science & Technology | 3 | 4.8% |
| Business | 33 | 52.4% |
| Education | 16 | 25.4% |
| Literature & Languages | 0 | 0.0% |
| Liberal Arts & History | 0 | 0.0% |
| Visual & Performing Arts | 0 | 0.0% |
| Communications | 0 | 0.0% |
| Arts & Humanities | 7 | 11.1% |
| Total | 63 | 100.0% |
Transportation & Commute in South Roxana
Vehicle Availability by Sex in South Roxana
The most prevalent vehicle ownership categories in South Roxana are males with 2 vehicles (186, accounting for 37.7%) and females with 2 vehicles (197, making up 39.6%).
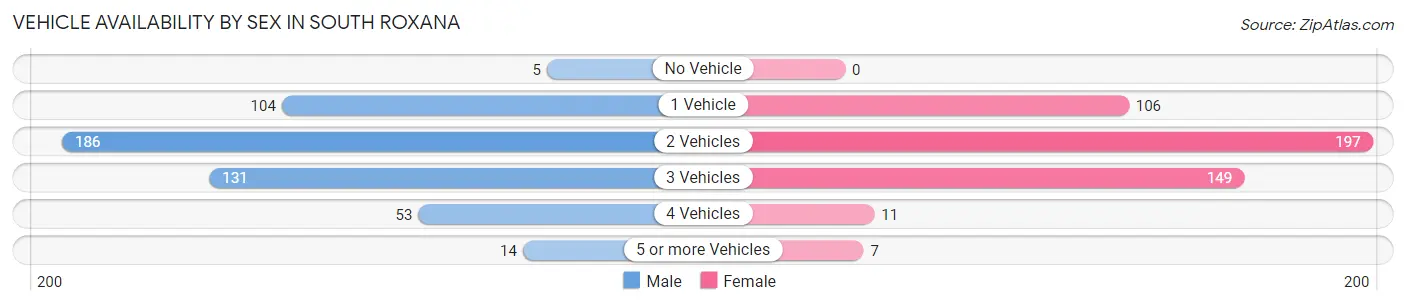
| Vehicles Available | Male | Female |
| No Vehicle | 5 (1.0%) | 0 (0.0%) |
| 1 Vehicle | 104 (21.1%) | 106 (22.6%) |
| 2 Vehicles | 186 (37.7%) | 197 (41.9%) |
| 3 Vehicles | 131 (26.6%) | 149 (31.7%) |
| 4 Vehicles | 53 (10.7%) | 11 (2.3%) |
| 5 or more Vehicles | 14 (2.8%) | 7 (1.5%) |
| Total | 493 (100.0%) | 470 (100.0%) |
Commute Time in South Roxana
The most frequently occuring commute durations in South Roxana are 15 to 19 minutes (194 commuters, 21.2%), 10 to 14 minutes (125 commuters, 13.6%), and 20 to 24 minutes (113 commuters, 12.3%).
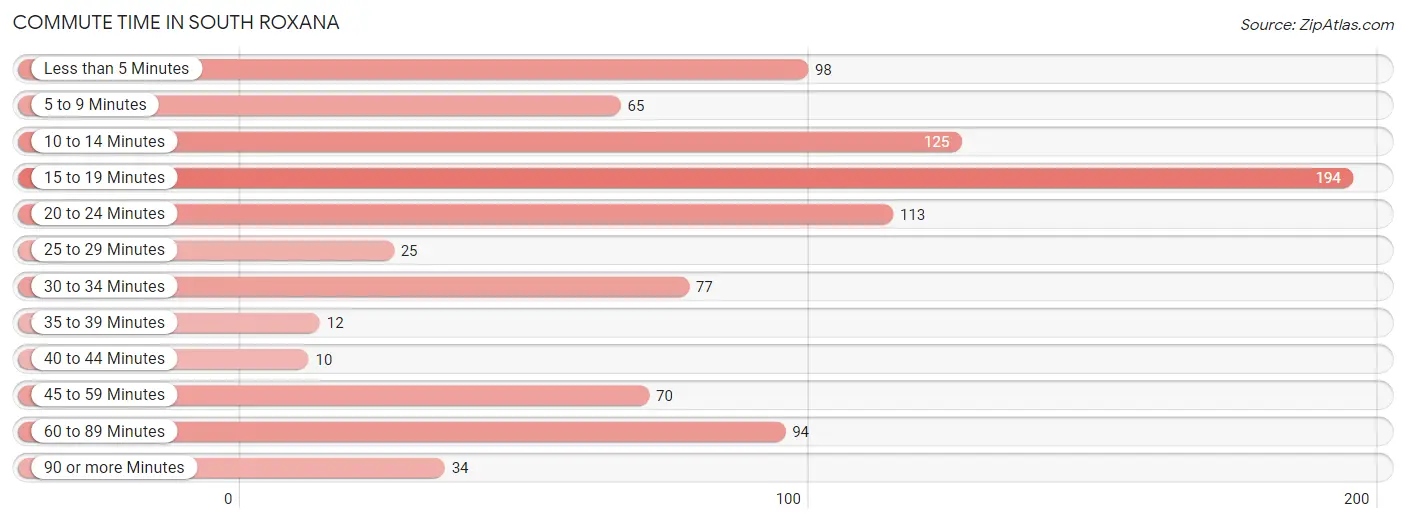
| Commute Time | # Commuters | % Commuters |
| Less than 5 Minutes | 98 | 10.7% |
| 5 to 9 Minutes | 65 | 7.1% |
| 10 to 14 Minutes | 125 | 13.6% |
| 15 to 19 Minutes | 194 | 21.2% |
| 20 to 24 Minutes | 113 | 12.3% |
| 25 to 29 Minutes | 25 | 2.7% |
| 30 to 34 Minutes | 77 | 8.4% |
| 35 to 39 Minutes | 12 | 1.3% |
| 40 to 44 Minutes | 10 | 1.1% |
| 45 to 59 Minutes | 70 | 7.6% |
| 60 to 89 Minutes | 94 | 10.2% |
| 90 or more Minutes | 34 | 3.7% |
Commute Time by Sex in South Roxana
The most common commute times in South Roxana are 60 to 89 minutes (89 commuters, 19.3%) for males and 15 to 19 minutes (138 commuters, 30.3%) for females.
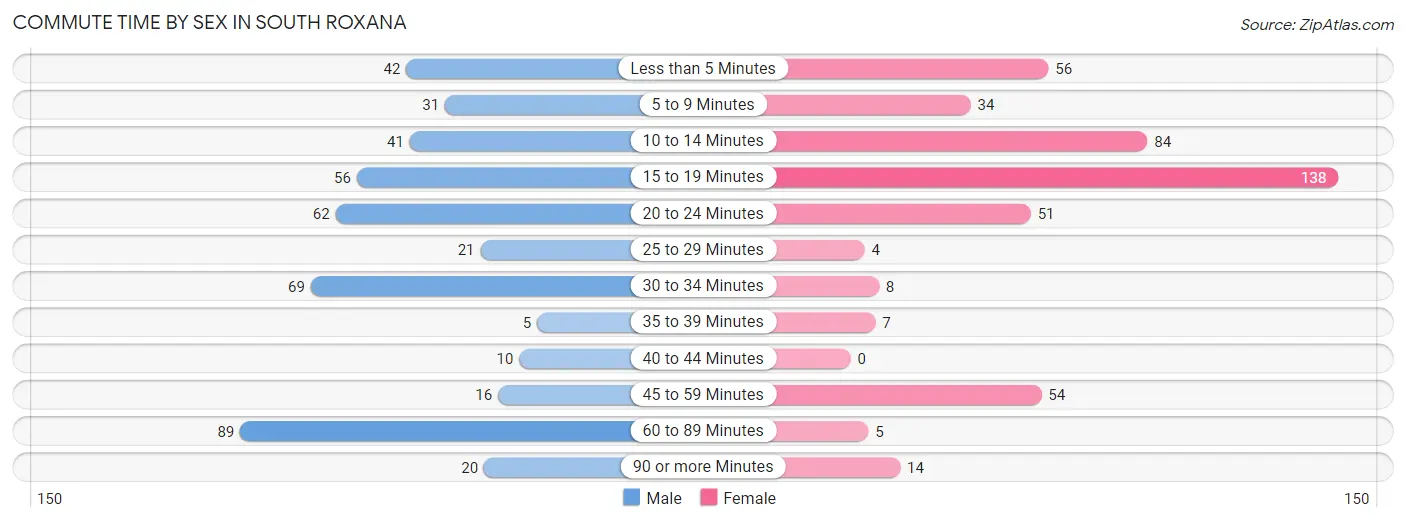
| Commute Time | Male | Female |
| Less than 5 Minutes | 42 (9.1%) | 56 (12.3%) |
| 5 to 9 Minutes | 31 (6.7%) | 34 (7.5%) |
| 10 to 14 Minutes | 41 (8.9%) | 84 (18.5%) |
| 15 to 19 Minutes | 56 (12.1%) | 138 (30.3%) |
| 20 to 24 Minutes | 62 (13.4%) | 51 (11.2%) |
| 25 to 29 Minutes | 21 (4.5%) | 4 (0.9%) |
| 30 to 34 Minutes | 69 (14.9%) | 8 (1.8%) |
| 35 to 39 Minutes | 5 (1.1%) | 7 (1.5%) |
| 40 to 44 Minutes | 10 (2.2%) | 0 (0.0%) |
| 45 to 59 Minutes | 16 (3.5%) | 54 (11.9%) |
| 60 to 89 Minutes | 89 (19.3%) | 5 (1.1%) |
| 90 or more Minutes | 20 (4.3%) | 14 (3.1%) |
Time of Departure to Work by Sex in South Roxana
The most frequent times of departure to work in South Roxana are 5:30 AM to 5:59 AM (80, 17.3%) for males and 4:00 PM to 11:59 PM (123, 27.0%) for females.
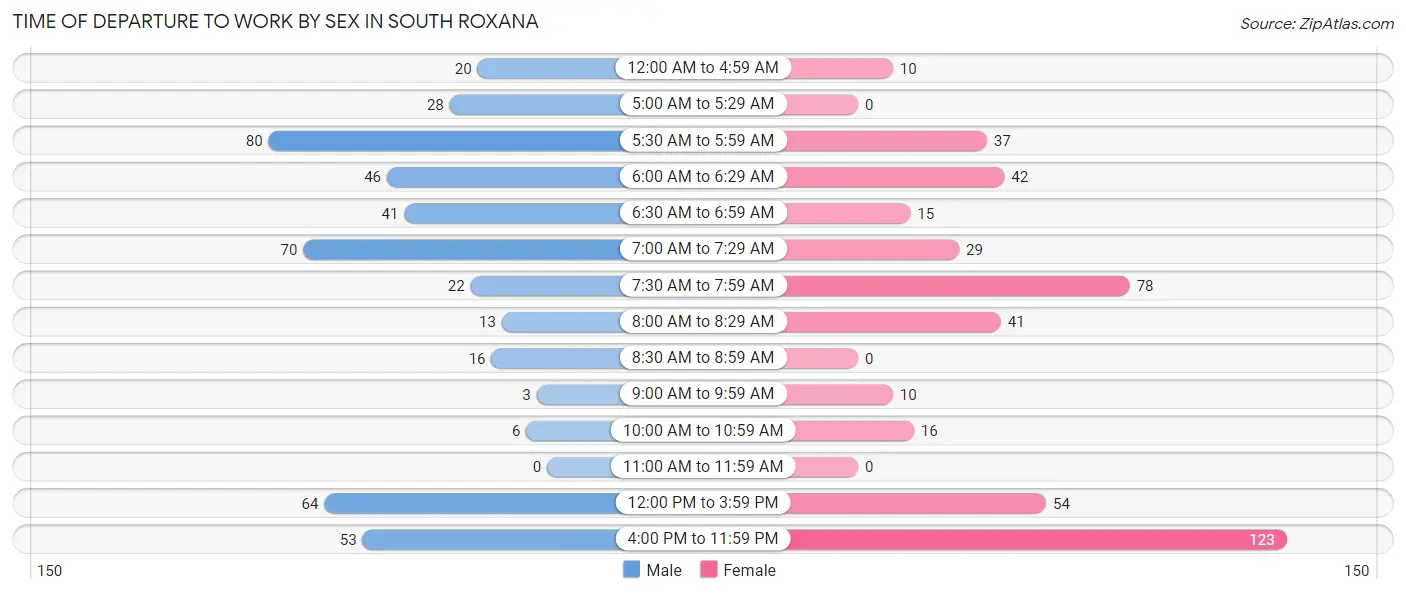
| Time of Departure | Male | Female |
| 12:00 AM to 4:59 AM | 20 (4.3%) | 10 (2.2%) |
| 5:00 AM to 5:29 AM | 28 (6.1%) | 0 (0.0%) |
| 5:30 AM to 5:59 AM | 80 (17.3%) | 37 (8.1%) |
| 6:00 AM to 6:29 AM | 46 (10.0%) | 42 (9.2%) |
| 6:30 AM to 6:59 AM | 41 (8.9%) | 15 (3.3%) |
| 7:00 AM to 7:29 AM | 70 (15.1%) | 29 (6.4%) |
| 7:30 AM to 7:59 AM | 22 (4.8%) | 78 (17.1%) |
| 8:00 AM to 8:29 AM | 13 (2.8%) | 41 (9.0%) |
| 8:30 AM to 8:59 AM | 16 (3.5%) | 0 (0.0%) |
| 9:00 AM to 9:59 AM | 3 (0.6%) | 10 (2.2%) |
| 10:00 AM to 10:59 AM | 6 (1.3%) | 16 (3.5%) |
| 11:00 AM to 11:59 AM | 0 (0.0%) | 0 (0.0%) |
| 12:00 PM to 3:59 PM | 64 (13.9%) | 54 (11.9%) |
| 4:00 PM to 11:59 PM | 53 (11.5%) | 123 (27.0%) |
| Total | 462 (100.0%) | 455 (100.0%) |
Housing Occupancy in South Roxana
Occupancy by Ownership in South Roxana
Of the total 761 dwellings in South Roxana, owner-occupied units account for 527 (69.3%), while renter-occupied units make up 234 (30.7%).
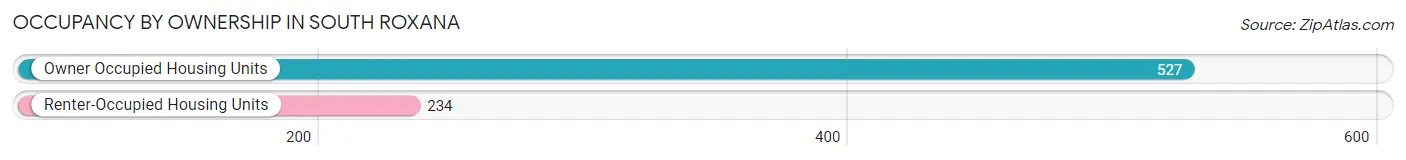
| Occupancy | # Housing Units | % Housing Units |
| Owner Occupied Housing Units | 527 | 69.3% |
| Renter-Occupied Housing Units | 234 | 30.7% |
| Total Occupied Housing Units | 761 | 100.0% |
Occupancy by Household Size in South Roxana
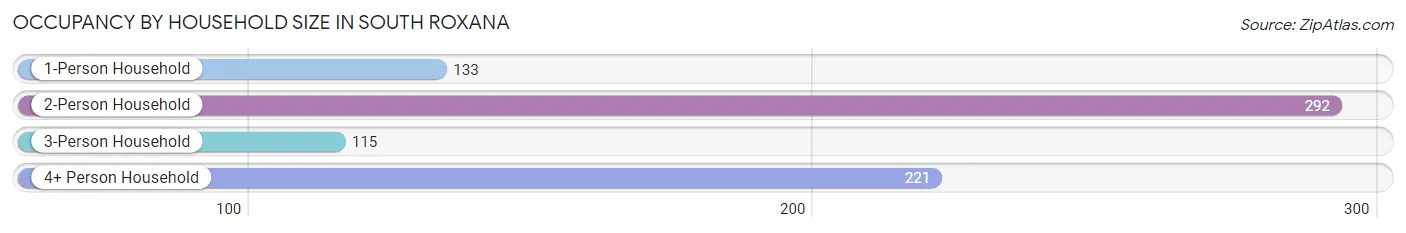
| Household Size | # Housing Units | % Housing Units |
| 1-Person Household | 133 | 17.5% |
| 2-Person Household | 292 | 38.4% |
| 3-Person Household | 115 | 15.1% |
| 4+ Person Household | 221 | 29.0% |
| Total Housing Units | 761 | 100.0% |
Occupancy by Ownership by Household Size in South Roxana
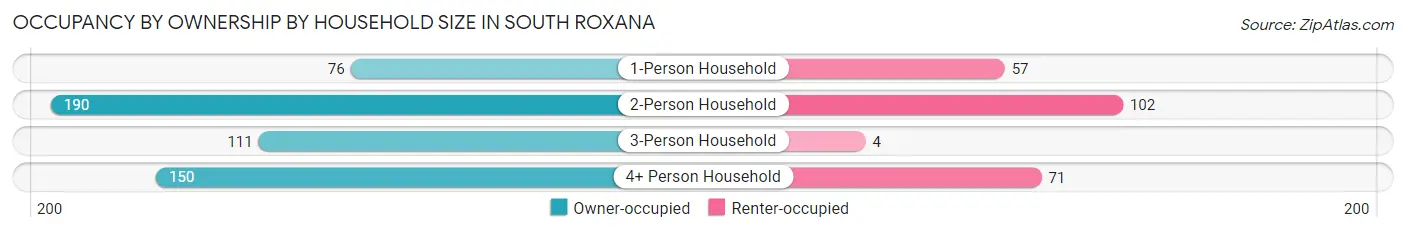
| Household Size | Owner-occupied | Renter-occupied |
| 1-Person Household | 76 (57.1%) | 57 (42.9%) |
| 2-Person Household | 190 (65.1%) | 102 (34.9%) |
| 3-Person Household | 111 (96.5%) | 4 (3.5%) |
| 4+ Person Household | 150 (67.9%) | 71 (32.1%) |
| Total Housing Units | 527 (69.3%) | 234 (30.7%) |
Occupancy by Educational Attainment in South Roxana
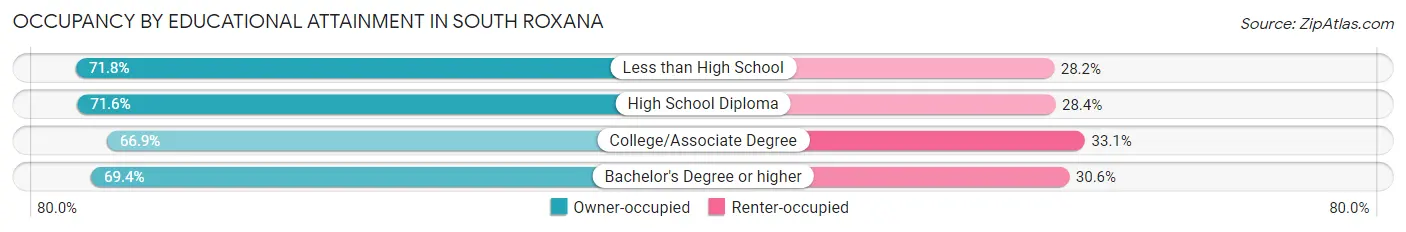
| Household Size | Owner-occupied | Renter-occupied |
| Less than High School | 51 (71.8%) | 20 (28.2%) |
| High School Diploma | 202 (71.6%) | 80 (28.4%) |
| College/Associate Degree | 249 (66.9%) | 123 (33.1%) |
| Bachelor's Degree or higher | 25 (69.4%) | 11 (30.6%) |
Occupancy by Age of Householder in South Roxana
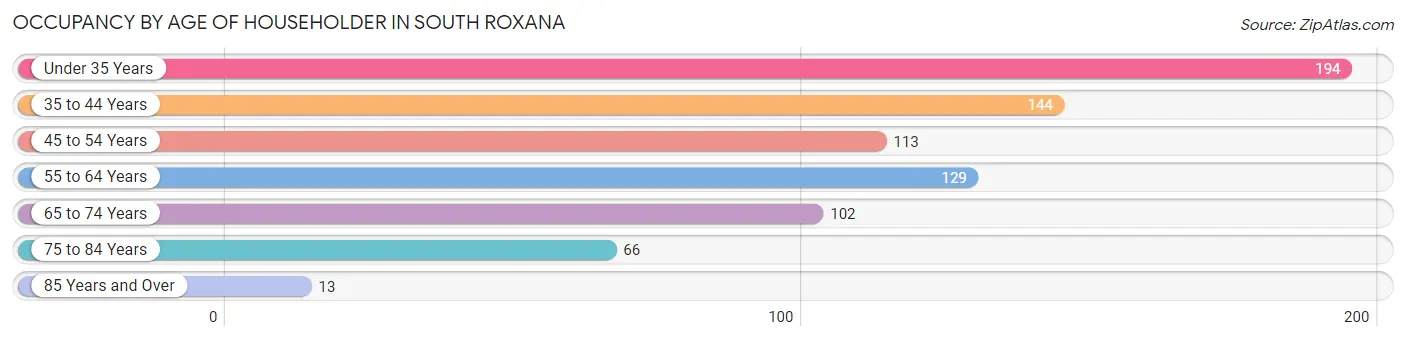
| Age Bracket | # Households | % Households |
| Under 35 Years | 194 | 25.5% |
| 35 to 44 Years | 144 | 18.9% |
| 45 to 54 Years | 113 | 14.8% |
| 55 to 64 Years | 129 | 17.0% |
| 65 to 74 Years | 102 | 13.4% |
| 75 to 84 Years | 66 | 8.7% |
| 85 Years and Over | 13 | 1.7% |
| Total | 761 | 100.0% |
Housing Finances in South Roxana
Median Income by Occupancy in South Roxana
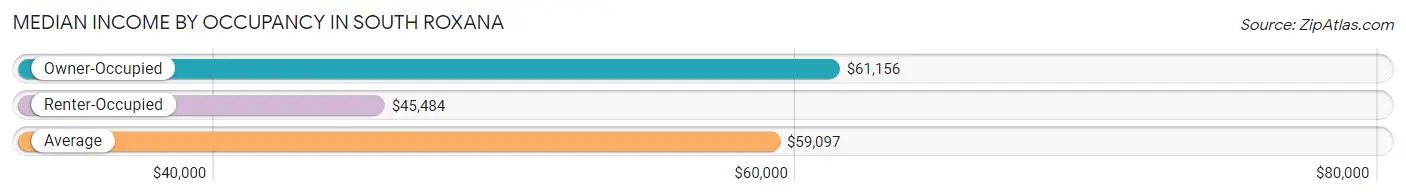
| Occupancy Type | # Households | Median Income |
| Owner-Occupied | 527 (69.3%) | $61,156 |
| Renter-Occupied | 234 (30.7%) | $45,484 |
| Average | 761 (100.0%) | $59,097 |
Occupancy by Householder Income Bracket in South Roxana
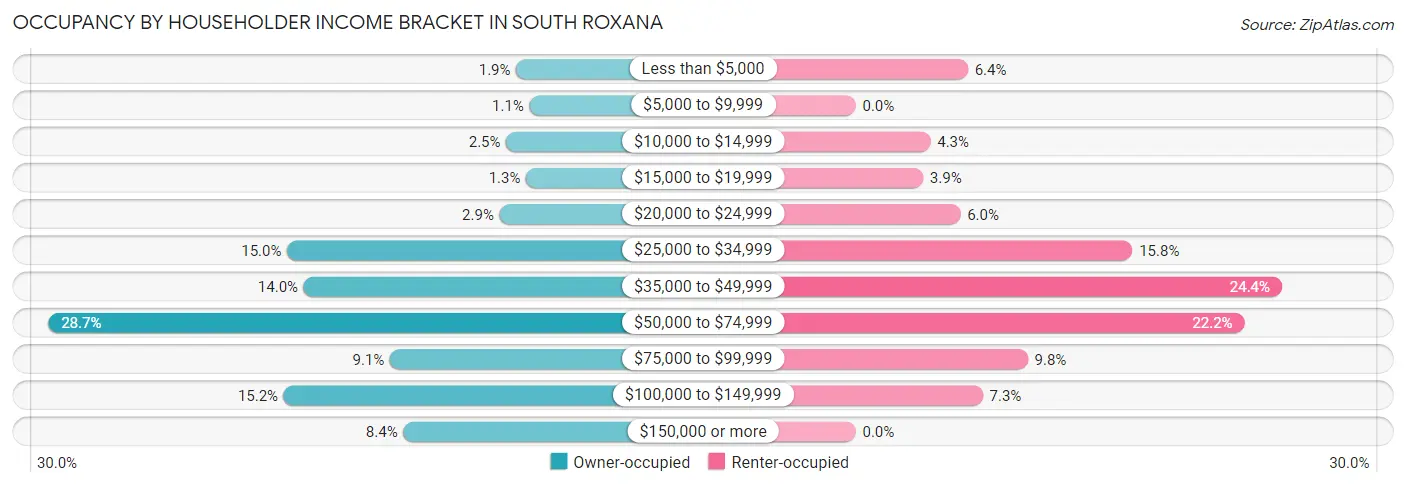
| Income Bracket | Owner-occupied | Renter-occupied |
| Less than $5,000 | 10 (1.9%) | 15 (6.4%) |
| $5,000 to $9,999 | 6 (1.1%) | 0 (0.0%) |
| $10,000 to $14,999 | 13 (2.5%) | 10 (4.3%) |
| $15,000 to $19,999 | 7 (1.3%) | 9 (3.8%) |
| $20,000 to $24,999 | 15 (2.9%) | 14 (6.0%) |
| $25,000 to $34,999 | 79 (15.0%) | 37 (15.8%) |
| $35,000 to $49,999 | 74 (14.0%) | 57 (24.4%) |
| $50,000 to $74,999 | 151 (28.6%) | 52 (22.2%) |
| $75,000 to $99,999 | 48 (9.1%) | 23 (9.8%) |
| $100,000 to $149,999 | 80 (15.2%) | 17 (7.3%) |
| $150,000 or more | 44 (8.4%) | 0 (0.0%) |
| Total | 527 (100.0%) | 234 (100.0%) |
Monthly Housing Cost Tiers in South Roxana
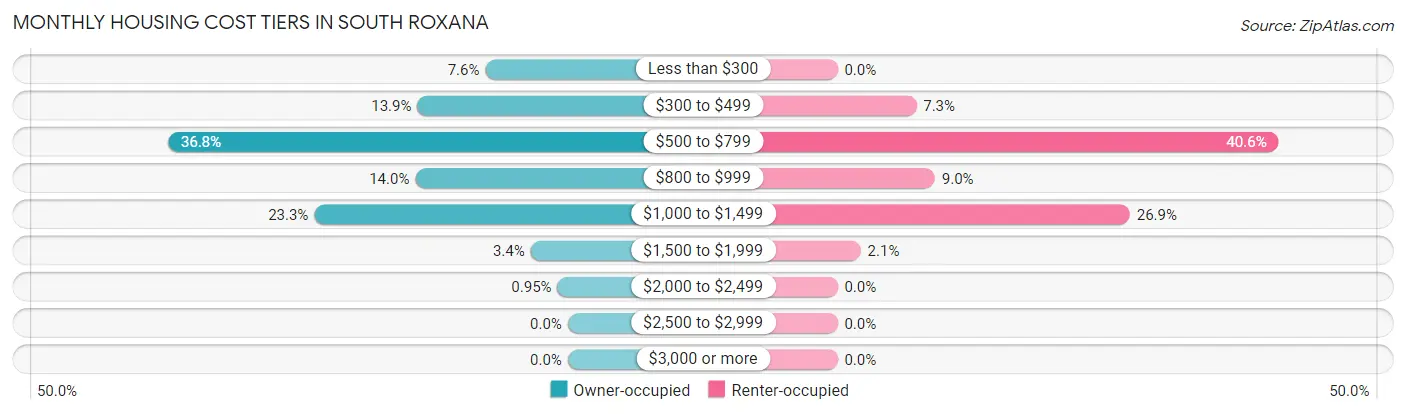
| Monthly Cost | Owner-occupied | Renter-occupied |
| Less than $300 | 40 (7.6%) | 0 (0.0%) |
| $300 to $499 | 73 (13.9%) | 17 (7.3%) |
| $500 to $799 | 194 (36.8%) | 95 (40.6%) |
| $800 to $999 | 74 (14.0%) | 21 (9.0%) |
| $1,000 to $1,499 | 123 (23.3%) | 63 (26.9%) |
| $1,500 to $1,999 | 18 (3.4%) | 5 (2.1%) |
| $2,000 to $2,499 | 5 (0.9%) | 0 (0.0%) |
| $2,500 to $2,999 | 0 (0.0%) | 0 (0.0%) |
| $3,000 or more | 0 (0.0%) | 0 (0.0%) |
| Total | 527 (100.0%) | 234 (100.0%) |
Physical Housing Characteristics in South Roxana
Housing Structures in South Roxana
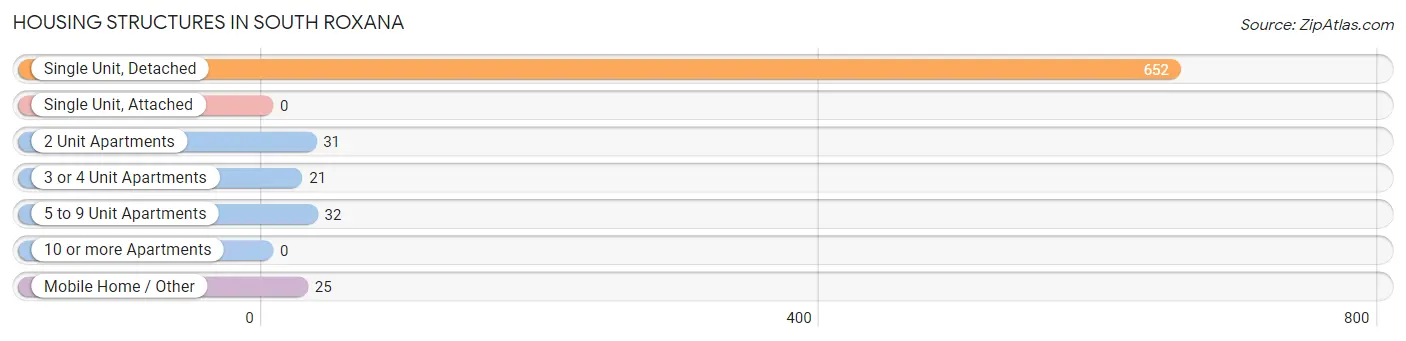
| Structure Type | # Housing Units | % Housing Units |
| Single Unit, Detached | 652 | 85.7% |
| Single Unit, Attached | 0 | 0.0% |
| 2 Unit Apartments | 31 | 4.1% |
| 3 or 4 Unit Apartments | 21 | 2.8% |
| 5 to 9 Unit Apartments | 32 | 4.2% |
| 10 or more Apartments | 0 | 0.0% |
| Mobile Home / Other | 25 | 3.3% |
| Total | 761 | 100.0% |
Housing Structures by Occupancy in South Roxana
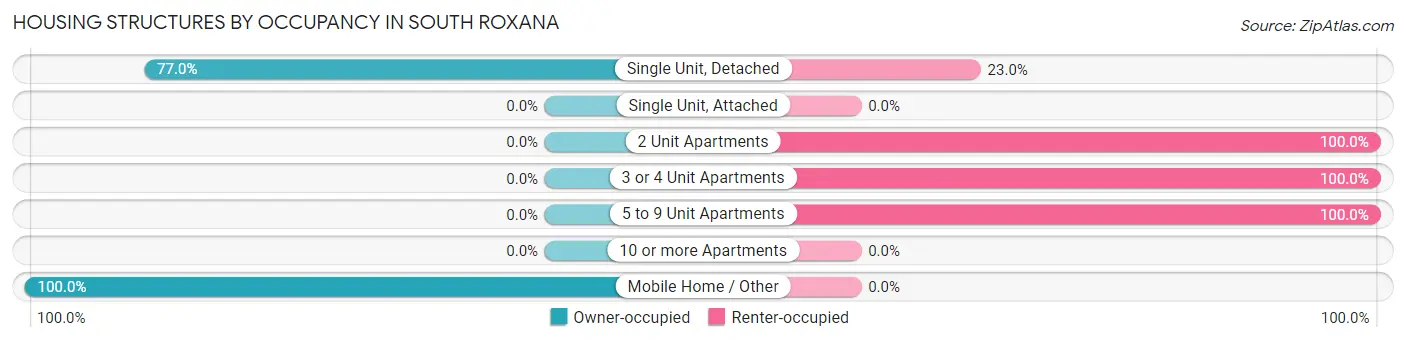
| Structure Type | Owner-occupied | Renter-occupied |
| Single Unit, Detached | 502 (77.0%) | 150 (23.0%) |
| Single Unit, Attached | 0 (0.0%) | 0 (0.0%) |
| 2 Unit Apartments | 0 (0.0%) | 31 (100.0%) |
| 3 or 4 Unit Apartments | 0 (0.0%) | 21 (100.0%) |
| 5 to 9 Unit Apartments | 0 (0.0%) | 32 (100.0%) |
| 10 or more Apartments | 0 (0.0%) | 0 (0.0%) |
| Mobile Home / Other | 25 (100.0%) | 0 (0.0%) |
| Total | 527 (69.3%) | 234 (30.7%) |
Housing Structures by Number of Rooms in South Roxana
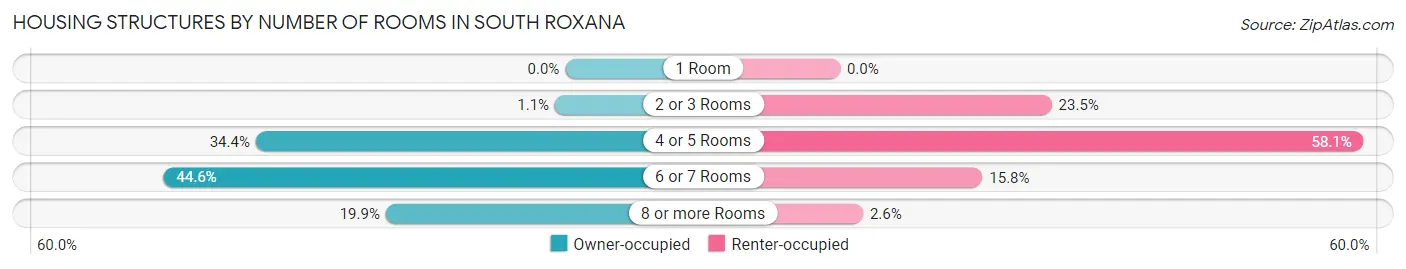
| Number of Rooms | Owner-occupied | Renter-occupied |
| 1 Room | 0 (0.0%) | 0 (0.0%) |
| 2 or 3 Rooms | 6 (1.1%) | 55 (23.5%) |
| 4 or 5 Rooms | 181 (34.4%) | 136 (58.1%) |
| 6 or 7 Rooms | 235 (44.6%) | 37 (15.8%) |
| 8 or more Rooms | 105 (19.9%) | 6 (2.6%) |
| Total | 527 (100.0%) | 234 (100.0%) |
Housing Structure by Heating Type in South Roxana
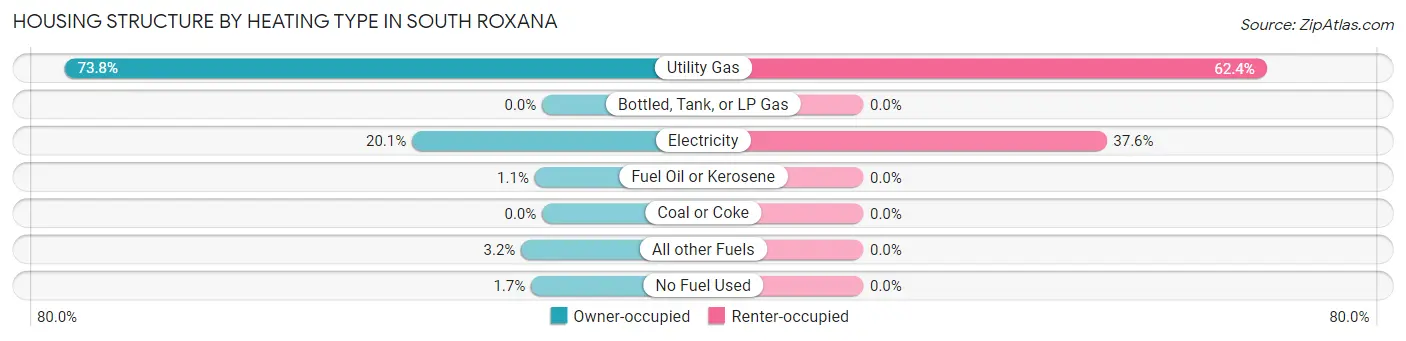
| Heating Type | Owner-occupied | Renter-occupied |
| Utility Gas | 389 (73.8%) | 146 (62.4%) |
| Bottled, Tank, or LP Gas | 0 (0.0%) | 0 (0.0%) |
| Electricity | 106 (20.1%) | 88 (37.6%) |
| Fuel Oil or Kerosene | 6 (1.1%) | 0 (0.0%) |
| Coal or Coke | 0 (0.0%) | 0 (0.0%) |
| All other Fuels | 17 (3.2%) | 0 (0.0%) |
| No Fuel Used | 9 (1.7%) | 0 (0.0%) |
| Total | 527 (100.0%) | 234 (100.0%) |
Household Vehicle Usage in South Roxana
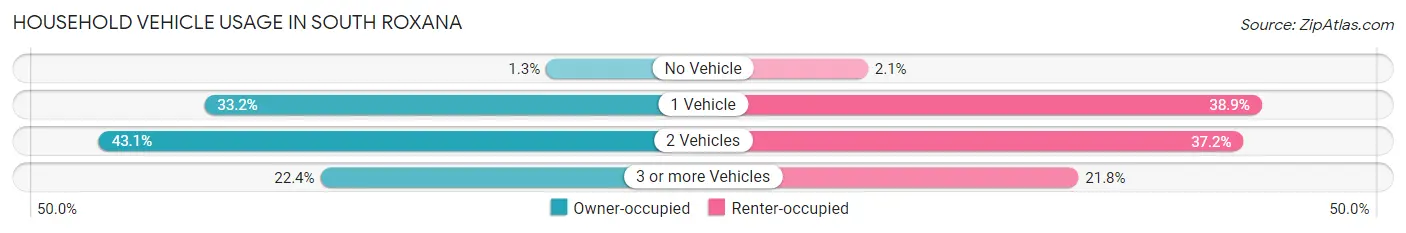
| Vehicles per Household | Owner-occupied | Renter-occupied |
| No Vehicle | 7 (1.3%) | 5 (2.1%) |
| 1 Vehicle | 175 (33.2%) | 91 (38.9%) |
| 2 Vehicles | 227 (43.1%) | 87 (37.2%) |
| 3 or more Vehicles | 118 (22.4%) | 51 (21.8%) |
| Total | 527 (100.0%) | 234 (100.0%) |
Real Estate & Mortgages in South Roxana
Real Estate and Mortgage Overview in South Roxana
| Characteristic | Without Mortgage | With Mortgage |
| Housing Units | 250 | 277 |
| Median Property Value | $77,900 | $92,300 |
| Median Household Income | $60,833 | $44 |
| Monthly Housing Costs | $579 | $0 |
| Real Estate Taxes | $1,418 | $0 |
Property Value by Mortgage Status in South Roxana
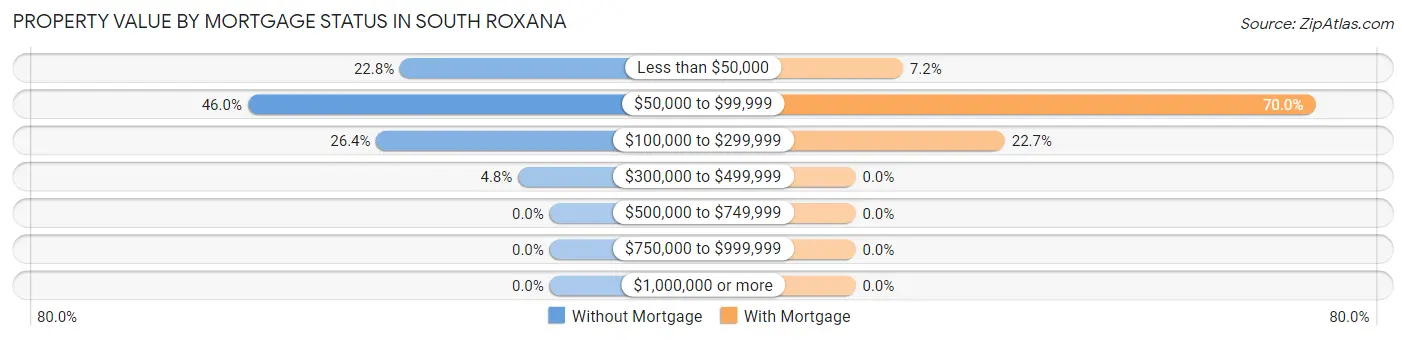
| Property Value | Without Mortgage | With Mortgage |
| Less than $50,000 | 57 (22.8%) | 20 (7.2%) |
| $50,000 to $99,999 | 115 (46.0%) | 194 (70.0%) |
| $100,000 to $299,999 | 66 (26.4%) | 63 (22.7%) |
| $300,000 to $499,999 | 12 (4.8%) | 0 (0.0%) |
| $500,000 to $749,999 | 0 (0.0%) | 0 (0.0%) |
| $750,000 to $999,999 | 0 (0.0%) | 0 (0.0%) |
| $1,000,000 or more | 0 (0.0%) | 0 (0.0%) |
| Total | 250 (100.0%) | 277 (100.0%) |
Household Income by Mortgage Status in South Roxana
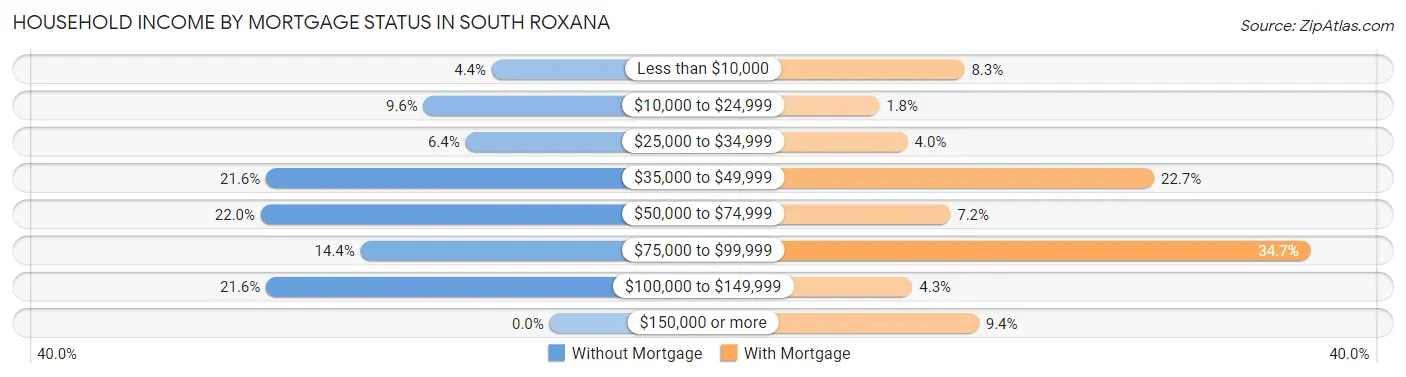
| Household Income | Without Mortgage | With Mortgage |
| Less than $10,000 | 11 (4.4%) | 23 (8.3%) |
| $10,000 to $24,999 | 24 (9.6%) | 5 (1.8%) |
| $25,000 to $34,999 | 16 (6.4%) | 11 (4.0%) |
| $35,000 to $49,999 | 54 (21.6%) | 63 (22.7%) |
| $50,000 to $74,999 | 55 (22.0%) | 20 (7.2%) |
| $75,000 to $99,999 | 36 (14.4%) | 96 (34.7%) |
| $100,000 to $149,999 | 54 (21.6%) | 12 (4.3%) |
| $150,000 or more | 0 (0.0%) | 26 (9.4%) |
| Total | 250 (100.0%) | 277 (100.0%) |
Property Value to Household Income Ratio in South Roxana
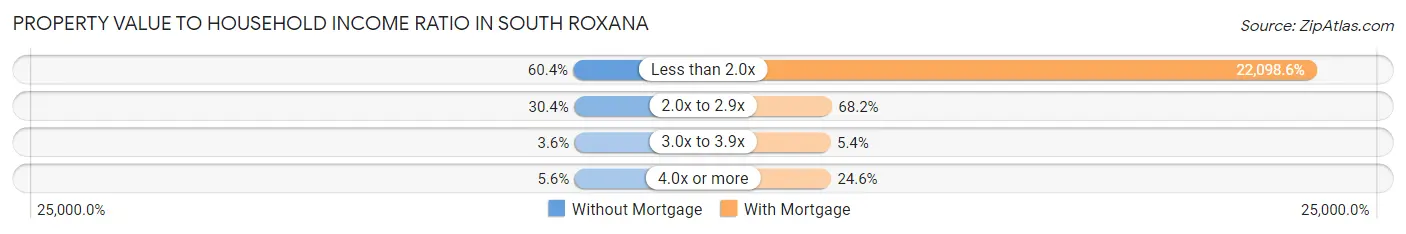
| Value-to-Income Ratio | Without Mortgage | With Mortgage |
| Less than 2.0x | 151 (60.4%) | 61,213 (22,098.6%) |
| 2.0x to 2.9x | 76 (30.4%) | 189 (68.2%) |
| 3.0x to 3.9x | 9 (3.6%) | 15 (5.4%) |
| 4.0x or more | 14 (5.6%) | 68 (24.5%) |
| Total | 250 (100.0%) | 277 (100.0%) |
Real Estate Taxes by Mortgage Status in South Roxana
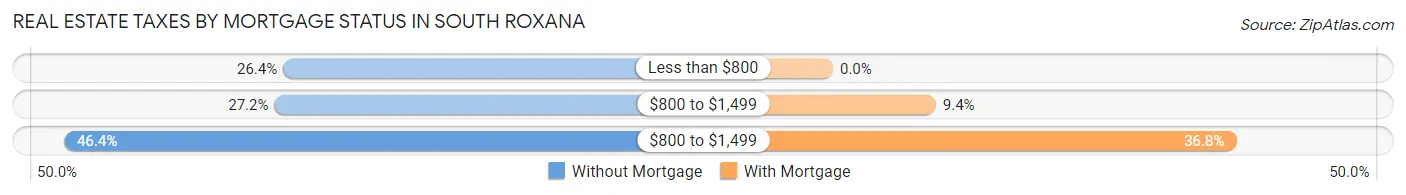
| Property Taxes | Without Mortgage | With Mortgage |
| Less than $800 | 66 (26.4%) | 0 (0.0%) |
| $800 to $1,499 | 68 (27.2%) | 26 (9.4%) |
| $800 to $1,499 | 116 (46.4%) | 102 (36.8%) |
| Total | 250 (100.0%) | 277 (100.0%) |
Health & Disability in South Roxana
Health Insurance Coverage by Age in South Roxana
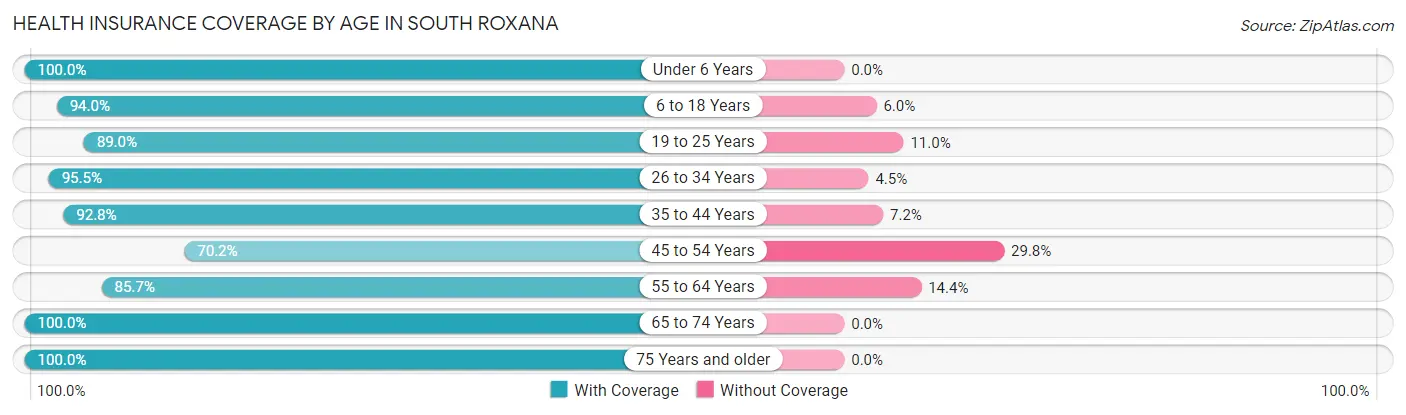
| Age Bracket | With Coverage | Without Coverage |
| Under 6 Years | 156 (100.0%) | 0 (0.0%) |
| 6 to 18 Years | 376 (94.0%) | 24 (6.0%) |
| 19 to 25 Years | 266 (89.0%) | 33 (11.0%) |
| 26 to 34 Years | 233 (95.5%) | 11 (4.5%) |
| 35 to 44 Years | 269 (92.8%) | 21 (7.2%) |
| 45 to 54 Years | 172 (70.2%) | 73 (29.8%) |
| 55 to 64 Years | 185 (85.7%) | 31 (14.3%) |
| 65 to 74 Years | 158 (100.0%) | 0 (0.0%) |
| 75 Years and older | 113 (100.0%) | 0 (0.0%) |
| Total | 1,928 (90.9%) | 193 (9.1%) |
Health Insurance Coverage by Citizenship Status in South Roxana
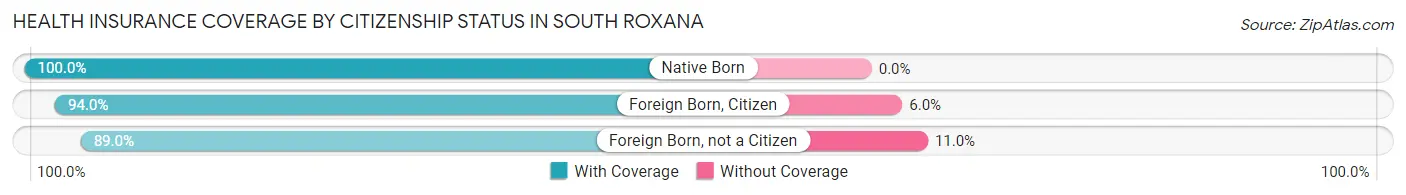
| Citizenship Status | With Coverage | Without Coverage |
| Native Born | 156 (100.0%) | 0 (0.0%) |
| Foreign Born, Citizen | 376 (94.0%) | 24 (6.0%) |
| Foreign Born, not a Citizen | 266 (89.0%) | 33 (11.0%) |
Health Insurance Coverage by Household Income in South Roxana
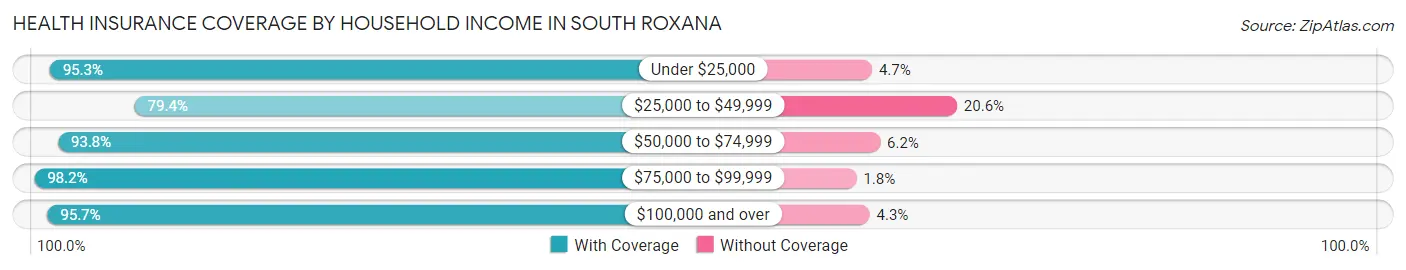
| Household Income | With Coverage | Without Coverage |
| Under $25,000 | 182 (95.3%) | 9 (4.7%) |
| $25,000 to $49,999 | 477 (79.4%) | 124 (20.6%) |
| $50,000 to $74,999 | 481 (93.8%) | 32 (6.2%) |
| $75,000 to $99,999 | 272 (98.2%) | 5 (1.8%) |
| $100,000 and over | 516 (95.7%) | 23 (4.3%) |
Public vs Private Health Insurance Coverage by Age in South Roxana
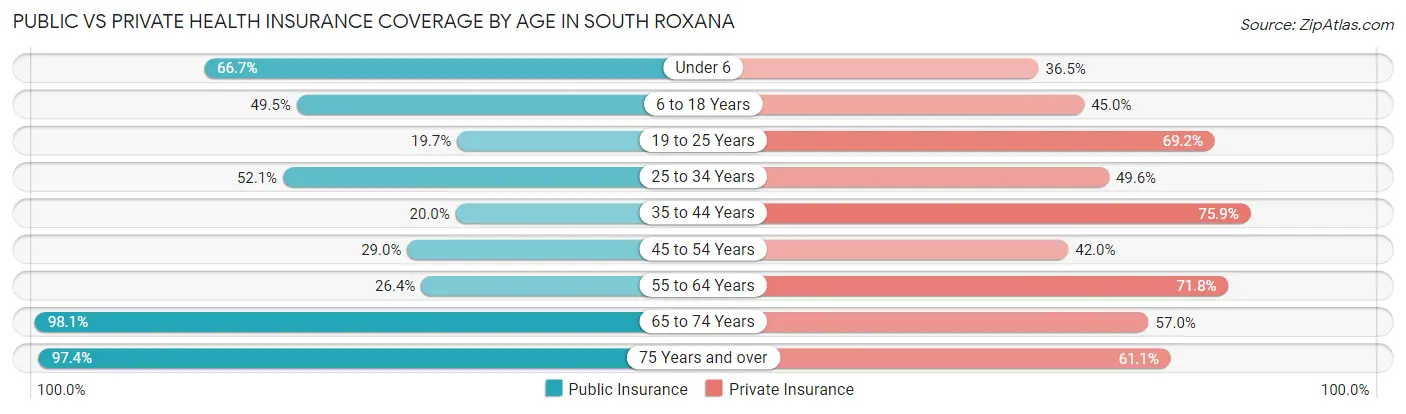
| Age Bracket | Public Insurance | Private Insurance |
| Under 6 | 104 (66.7%) | 57 (36.5%) |
| 6 to 18 Years | 198 (49.5%) | 180 (45.0%) |
| 19 to 25 Years | 59 (19.7%) | 207 (69.2%) |
| 25 to 34 Years | 127 (52.0%) | 121 (49.6%) |
| 35 to 44 Years | 58 (20.0%) | 220 (75.9%) |
| 45 to 54 Years | 71 (29.0%) | 103 (42.0%) |
| 55 to 64 Years | 57 (26.4%) | 155 (71.8%) |
| 65 to 74 Years | 155 (98.1%) | 90 (57.0%) |
| 75 Years and over | 110 (97.4%) | 69 (61.1%) |
| Total | 939 (44.3%) | 1,202 (56.7%) |
Disability Status by Sex by Age in South Roxana
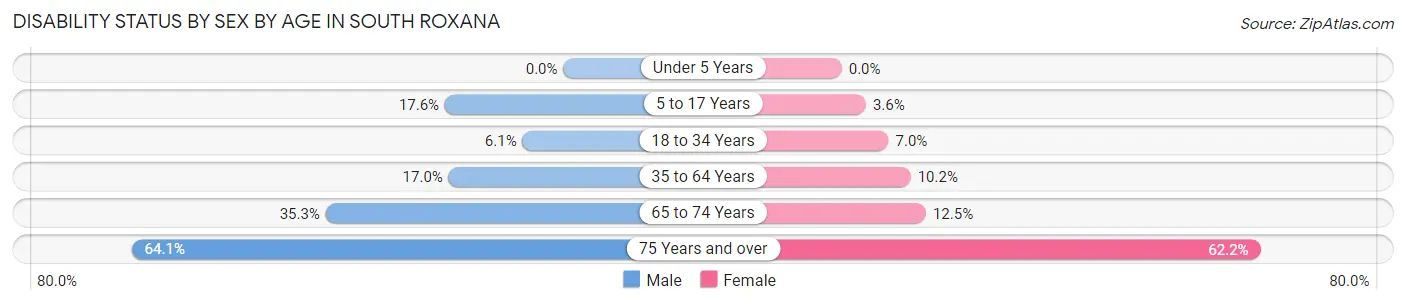
| Age Bracket | Male | Female |
| Under 5 Years | 0 (0.0%) | 0 (0.0%) |
| 5 to 17 Years | 29 (17.6%) | 8 (3.6%) |
| 18 to 34 Years | 17 (6.1%) | 21 (7.0%) |
| 35 to 64 Years | 63 (17.0%) | 39 (10.2%) |
| 65 to 74 Years | 36 (35.3%) | 7 (12.5%) |
| 75 Years and over | 25 (64.1%) | 46 (62.2%) |
Disability Class by Sex by Age in South Roxana
Disability Class: Hearing Difficulty
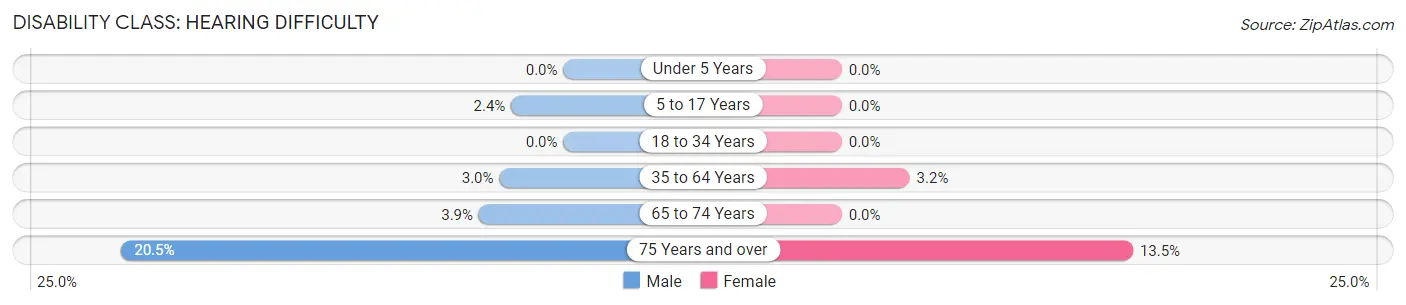
| Age Bracket | Male | Female |
| Under 5 Years | 0 (0.0%) | 0 (0.0%) |
| 5 to 17 Years | 4 (2.4%) | 0 (0.0%) |
| 18 to 34 Years | 0 (0.0%) | 0 (0.0%) |
| 35 to 64 Years | 11 (3.0%) | 12 (3.2%) |
| 65 to 74 Years | 4 (3.9%) | 0 (0.0%) |
| 75 Years and over | 8 (20.5%) | 10 (13.5%) |
Disability Class: Vision Difficulty
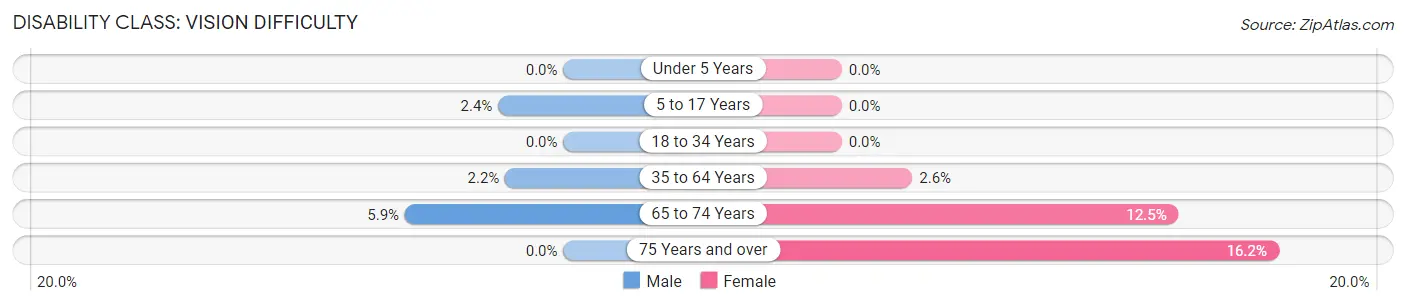
| Age Bracket | Male | Female |
| Under 5 Years | 0 (0.0%) | 0 (0.0%) |
| 5 to 17 Years | 4 (2.4%) | 0 (0.0%) |
| 18 to 34 Years | 0 (0.0%) | 0 (0.0%) |
| 35 to 64 Years | 8 (2.2%) | 10 (2.6%) |
| 65 to 74 Years | 6 (5.9%) | 7 (12.5%) |
| 75 Years and over | 0 (0.0%) | 12 (16.2%) |
Disability Class: Cognitive Difficulty
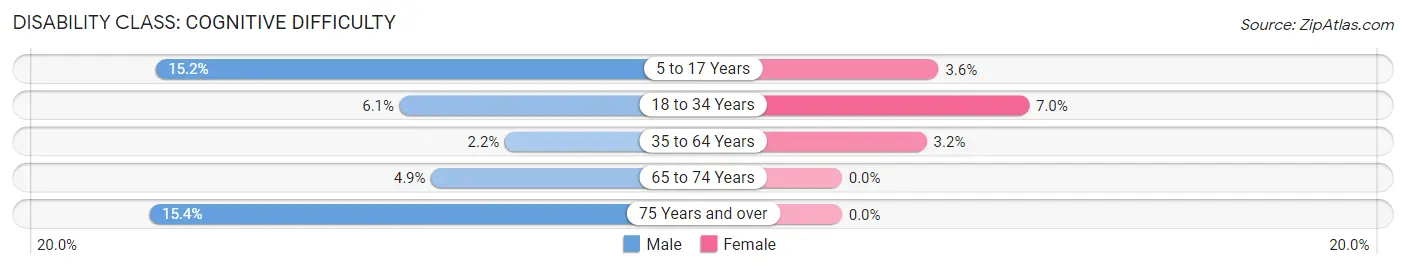
| Age Bracket | Male | Female |
| 5 to 17 Years | 25 (15.1%) | 8 (3.6%) |
| 18 to 34 Years | 17 (6.1%) | 21 (7.0%) |
| 35 to 64 Years | 8 (2.2%) | 12 (3.2%) |
| 65 to 74 Years | 5 (4.9%) | 0 (0.0%) |
| 75 Years and over | 6 (15.4%) | 0 (0.0%) |
Disability Class: Ambulatory Difficulty
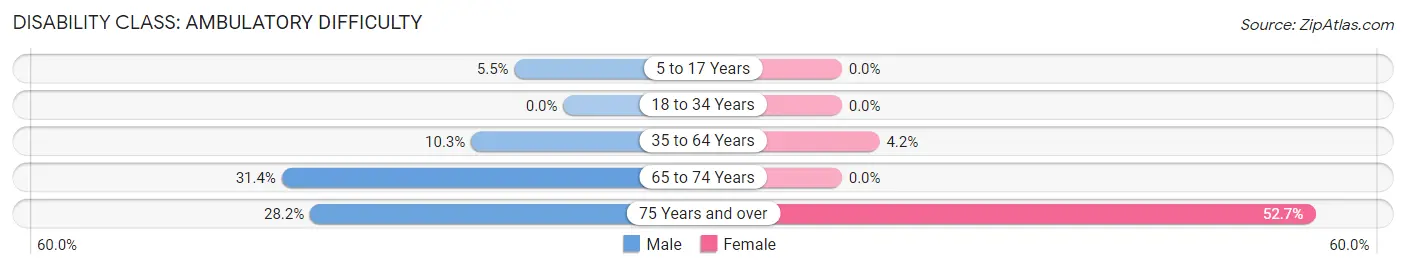
| Age Bracket | Male | Female |
| 5 to 17 Years | 9 (5.4%) | 0 (0.0%) |
| 18 to 34 Years | 0 (0.0%) | 0 (0.0%) |
| 35 to 64 Years | 38 (10.3%) | 16 (4.2%) |
| 65 to 74 Years | 32 (31.4%) | 0 (0.0%) |
| 75 Years and over | 11 (28.2%) | 39 (52.7%) |
Disability Class: Self-Care Difficulty
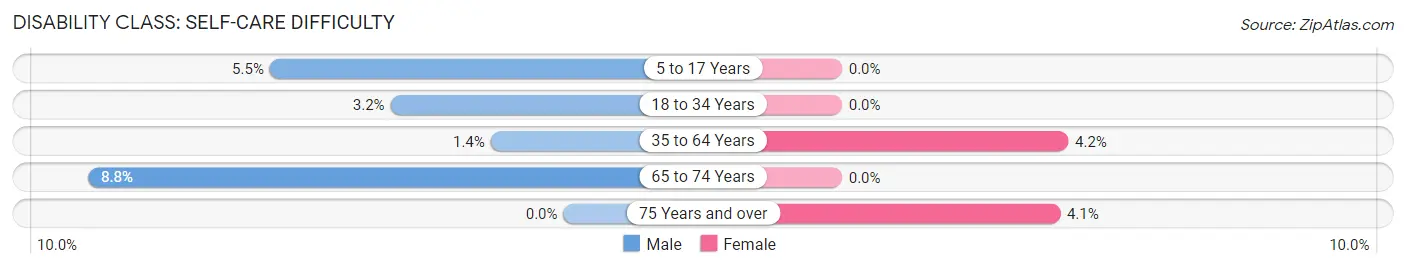
| Age Bracket | Male | Female |
| 5 to 17 Years | 9 (5.4%) | 0 (0.0%) |
| 18 to 34 Years | 9 (3.2%) | 0 (0.0%) |
| 35 to 64 Years | 5 (1.3%) | 16 (4.2%) |
| 65 to 74 Years | 9 (8.8%) | 0 (0.0%) |
| 75 Years and over | 0 (0.0%) | 3 (4.1%) |
Technology Access in South Roxana
Computing Device Access in South Roxana
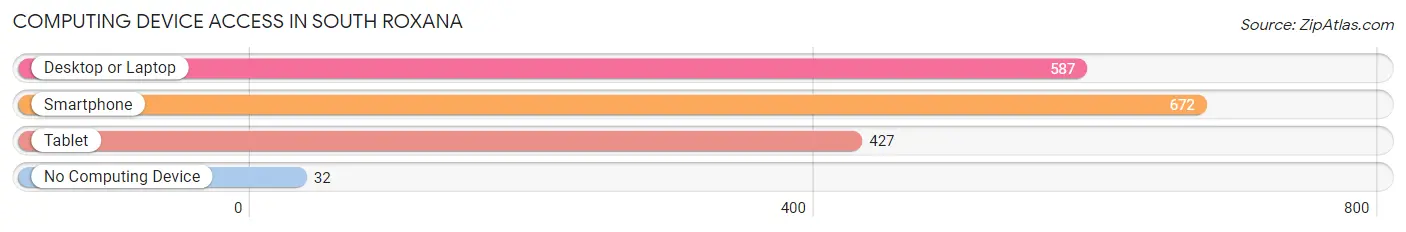
| Device Type | # Households | % Households |
| Desktop or Laptop | 587 | 77.1% |
| Smartphone | 672 | 88.3% |
| Tablet | 427 | 56.1% |
| No Computing Device | 32 | 4.2% |
| Total | 761 | 100.0% |
Internet Access in South Roxana
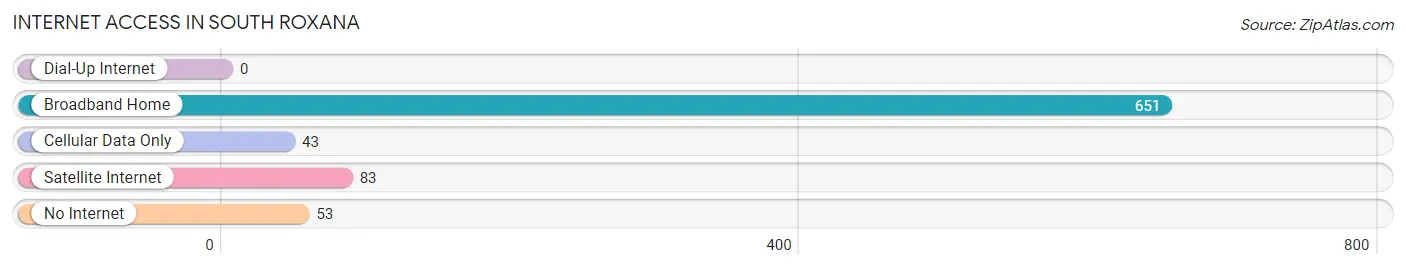
| Internet Type | # Households | % Households |
| Dial-Up Internet | 0 | 0.0% |
| Broadband Home | 651 | 85.6% |
| Cellular Data Only | 43 | 5.7% |
| Satellite Internet | 83 | 10.9% |
| No Internet | 53 | 7.0% |
| Total | 761 | 100.0% |
South Roxana Summary
History
South Roxana is a village located in Madison County, Illinois, United States. It is part of the Metro-East region of the St. Louis metropolitan area. The village was incorporated in 1921 and is located along the Mississippi River.
The area that is now South Roxana was first settled in the early 1800s by French and German immigrants. The village was originally known as “Roxana” and was named after the daughter of a local landowner. In the late 1800s, the village was divided into two parts, North Roxana and South Roxana. The two villages were separated by a railroad line and the two parts of the village were not reunited until 1921 when South Roxana was incorporated.
The village of South Roxana has a long history of industry and manufacturing. In the early 1900s, the village was home to several brickyards, coal mines, and other industries. The village was also home to a large oil refinery, which was built in the 1920s and operated until the late 1980s.
Geography
South Roxana is located in Madison County, Illinois, United States. It is part of the Metro-East region of the St. Louis metropolitan area. The village is situated along the Mississippi River and is bordered by the cities of Alton and Wood River.
The village has a total area of 1.2 square miles, all of which is land. The village is located at an elevation of 486 feet above sea level. The climate in South Roxana is characterized by hot, humid summers and cold, wet winters.
Economy
The economy of South Roxana is largely based on manufacturing and industry. The village is home to several factories and industrial plants, including a large oil refinery. The village is also home to several small businesses, including restaurants, retail stores, and service providers.
The village is also home to a large number of commuters who work in nearby cities such as Alton and St. Louis. The village is served by several major highways, including Interstate 270 and Interstate 255.
Demographics
As of the 2010 census, the village of South Roxana had a population of 2,717. The population density was 2,231.3 people per square mile. The racial makeup of the village was 94.3% White, 2.2% African American, 0.3% Native American, 0.7% Asian, 0.1% Pacific Islander, 0.7% from other races, and 1.7% from two or more races. Hispanic or Latino of any race were 2.2% of the population.
The median income for a household in the village was $41,250, and the median income for a family was $50,000. The per capita income for the village was $20,845. About 8.3% of families and 10.2% of the population were below the poverty line, including 14.2% of those under age 18 and 5.2% of those age 65 or over.
Common Questions
What is Per Capita Income in South Roxana?
Per Capita income in South Roxana is $24,533.
What is the Median Family Income in South Roxana?
Median Family Income in South Roxana is $62,632.
What is the Median Household income in South Roxana?
Median Household Income in South Roxana is $59,097.
What is Income or Wage Gap in South Roxana?
Income or Wage Gap in South Roxana is 39.9%.
Women in South Roxana earn 60.1 cents for every dollar earned by a man.
What is Family Income Deficit in South Roxana?
Family Income Deficit in South Roxana is $6,895.
Families that are below poverty line in South Roxana earn $6,895 less on average than the poverty threshold level.
What is Inequality or Gini Index in South Roxana?
Inequality or Gini Index in South Roxana is 0.35.
What is the Total Population of South Roxana?
Total Population of South Roxana is 2,121.
What is the Total Male Population of South Roxana?
Total Male Population of South Roxana is 1,045.
What is the Total Female Population of South Roxana?
Total Female Population of South Roxana is 1,076.
What is the Ratio of Males per 100 Females in South Roxana?
There are 97.12 Males per 100 Females in South Roxana.
What is the Ratio of Females per 100 Males in South Roxana?
There are 102.97 Females per 100 Males in South Roxana.
What is the Median Population Age in South Roxana?
Median Population Age in South Roxana is 33.6 Years.
What is the Average Family Size in South Roxana
Average Family Size in South Roxana is 3.1 People.
What is the Average Household Size in South Roxana
Average Household Size in South Roxana is 2.8 People.
How Large is the Labor Force in South Roxana?
There are 1,081 People in the Labor Forcein in South Roxana.
What is the Percentage of People in the Labor Force in South Roxana?
66.0% of People are in the Labor Force in South Roxana.
What is the Unemployment Rate in South Roxana?
Unemployment Rate in South Roxana is 8.2%.