Sneads Ferry, NC Map & Demographics
Sneads Ferry Map
Sneads Ferry Overview
$27,848
PER CAPITA INCOME
$79,175
AVG FAMILY INCOME
$40,278
AVG HOUSEHOLD INCOME
8.3%
WAGE / INCOME GAP [ % ]
91.7¢/ $1
WAGE / INCOME GAP [ $ ]
0.47
INEQUALITY / GINI INDEX
2,140
TOTAL POPULATION
1,100
MALE POPULATION
1,040
FEMALE POPULATION
105.77
MALES / 100 FEMALES
94.55
FEMALES / 100 MALES
50.3
MEDIAN AGE
2.8
AVG FAMILY SIZE
2.0
AVG HOUSEHOLD SIZE
1,061
LABOR FORCE [ PEOPLE ]
60.2%
PERCENT IN LABOR FORCE
Sneads Ferry Zip Codes
Sneads Ferry Area Codes
Income in Sneads Ferry
Income Overview in Sneads Ferry
Per Capita Income in Sneads Ferry is $27,848, while median incomes of families and households are $79,175 and $40,278 respectively.
| Characteristic | Number | Measure |
| Per Capita Income | 2,140 | $27,848 |
| Median Family Income | 569 | $79,175 |
| Mean Family Income | 569 | $80,847 |
| Median Household Income | 1,078 | $40,278 |
| Mean Household Income | 1,078 | $54,644 |
| Income Deficit | 569 | $0 |
| Wage / Income Gap (%) | 2,140 | 8.29% |
| Wage / Income Gap ($) | 2,140 | 91.71¢ per $1 |
| Gini / Inequality Index | 2,140 | 0.47 |
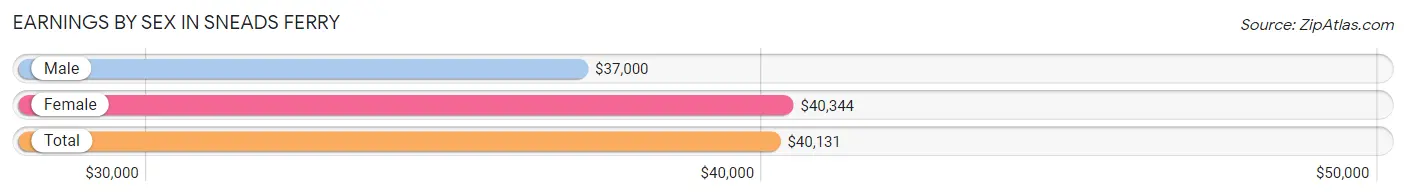
Earnings by Sex in Sneads Ferry
Average Earnings in Sneads Ferry are $40,131, $37,000 for men and $40,344 for women, a difference of 8.3%.
| Sex | Number | Average Earnings |
| Male | 668 (57.8%) | $37,000 |
| Female | 487 (42.2%) | $40,344 |
| Total | 1,155 (100.0%) | $40,131 |
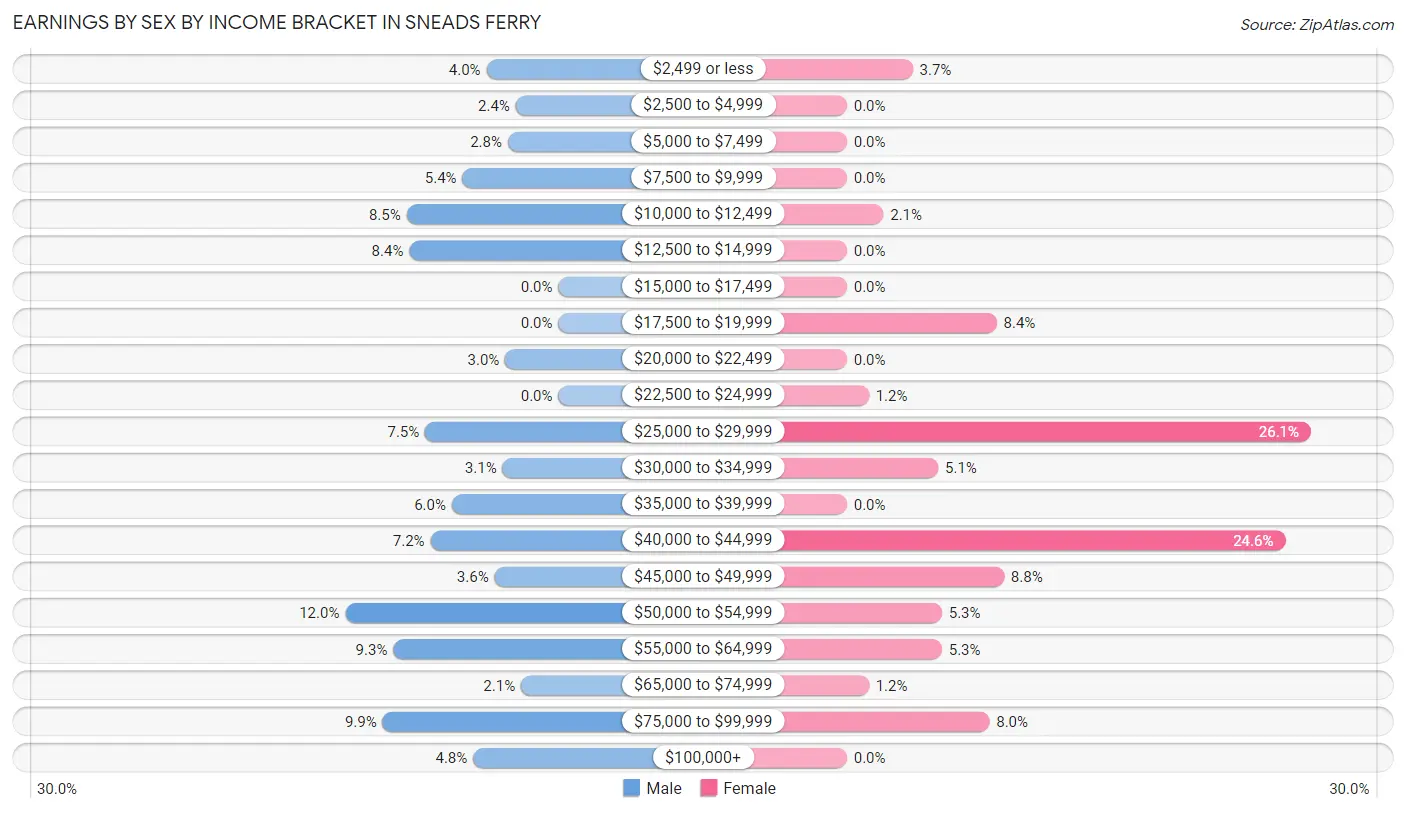
Earnings by Sex by Income Bracket in Sneads Ferry
The most common earnings brackets in Sneads Ferry are $50,000 to $54,999 for men (80 | 12.0%) and $25,000 to $29,999 for women (127 | 26.1%).
| Income | Male | Female |
| $2,499 or less | 27 (4.0%) | 18 (3.7%) |
| $2,500 to $4,999 | 16 (2.4%) | 0 (0.0%) |
| $5,000 to $7,499 | 19 (2.8%) | 0 (0.0%) |
| $7,500 to $9,999 | 36 (5.4%) | 0 (0.0%) |
| $10,000 to $12,499 | 57 (8.5%) | 10 (2.1%) |
| $12,500 to $14,999 | 56 (8.4%) | 0 (0.0%) |
| $15,000 to $17,499 | 0 (0.0%) | 0 (0.0%) |
| $17,500 to $19,999 | 0 (0.0%) | 41 (8.4%) |
| $20,000 to $22,499 | 20 (3.0%) | 0 (0.0%) |
| $22,500 to $24,999 | 0 (0.0%) | 6 (1.2%) |
| $25,000 to $29,999 | 50 (7.5%) | 127 (26.1%) |
| $30,000 to $34,999 | 21 (3.1%) | 25 (5.1%) |
| $35,000 to $39,999 | 40 (6.0%) | 0 (0.0%) |
| $40,000 to $44,999 | 48 (7.2%) | 120 (24.6%) |
| $45,000 to $49,999 | 24 (3.6%) | 43 (8.8%) |
| $50,000 to $54,999 | 80 (12.0%) | 26 (5.3%) |
| $55,000 to $64,999 | 62 (9.3%) | 26 (5.3%) |
| $65,000 to $74,999 | 14 (2.1%) | 6 (1.2%) |
| $75,000 to $99,999 | 66 (9.9%) | 39 (8.0%) |
| $100,000+ | 32 (4.8%) | 0 (0.0%) |
| Total | 668 (100.0%) | 487 (100.0%) |
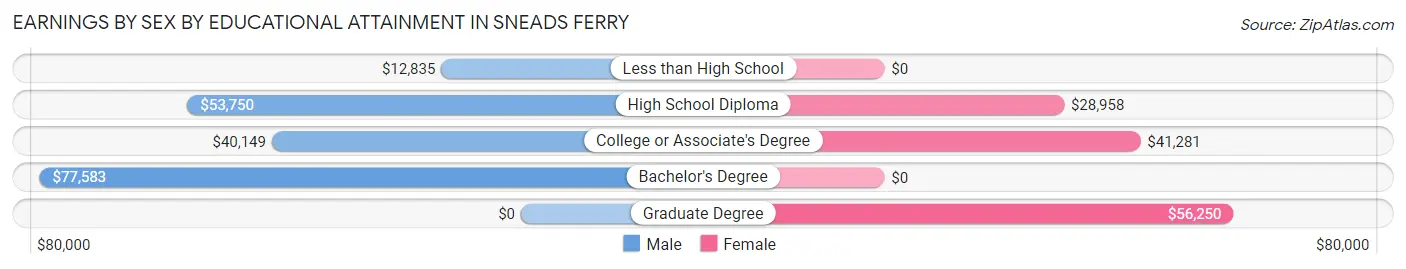
Earnings by Sex by Educational Attainment in Sneads Ferry
Average earnings in Sneads Ferry are $40,030 for men and $40,813 for women, a difference of 1.9%. Men with an educational attainment of bachelor's degree enjoy the highest average annual earnings of $77,583, while those with less than high school education earn the least with $12,835. Women with an educational attainment of graduate degree earn the most with the average annual earnings of $56,250, while those with high school diploma education have the smallest earnings of $28,958.
| Educational Attainment | Male Income | Female Income |
| Less than High School | $12,835 | $0 |
| High School Diploma | $53,750 | $28,958 |
| College or Associate's Degree | $40,149 | $41,281 |
| Bachelor's Degree | $77,583 | $0 |
| Graduate Degree | - | - |
| Total | $40,030 | $40,813 |
Family Income in Sneads Ferry
Family Income Brackets in Sneads Ferry
According to the Sneads Ferry family income data, there are 204 families falling into the $75,000 to $99,999 income range, which is the most common income bracket and makes up 35.8% of all families. Conversely, the $10,000 to $14,999 income bracket is the least frequent group with only 20 families (3.5%) belonging to this category.
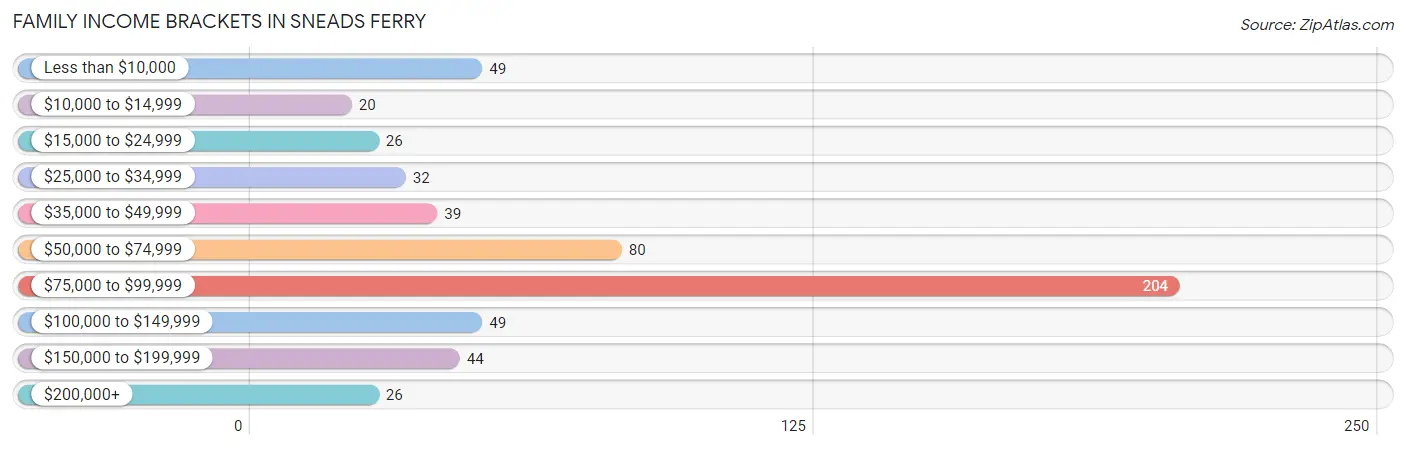
| Income Bracket | # Families | % Families |
| Less than $10,000 | 49 | 8.6% |
| $10,000 to $14,999 | 20 | 3.5% |
| $15,000 to $24,999 | 26 | 4.6% |
| $25,000 to $34,999 | 32 | 5.6% |
| $35,000 to $49,999 | 39 | 6.9% |
| $50,000 to $74,999 | 80 | 14.1% |
| $75,000 to $99,999 | 204 | 35.9% |
| $100,000 to $149,999 | 49 | 8.6% |
| $150,000 to $199,999 | 44 | 7.7% |
| $200,000+ | 26 | 4.6% |
Family Income by Famaliy Size in Sneads Ferry
3-person families (77 | 13.5%) account for the highest median family income in Sneads Ferry with $103,375 per family, while 3-person families (77 | 13.5%) have the highest median income of $34,458 per family member.
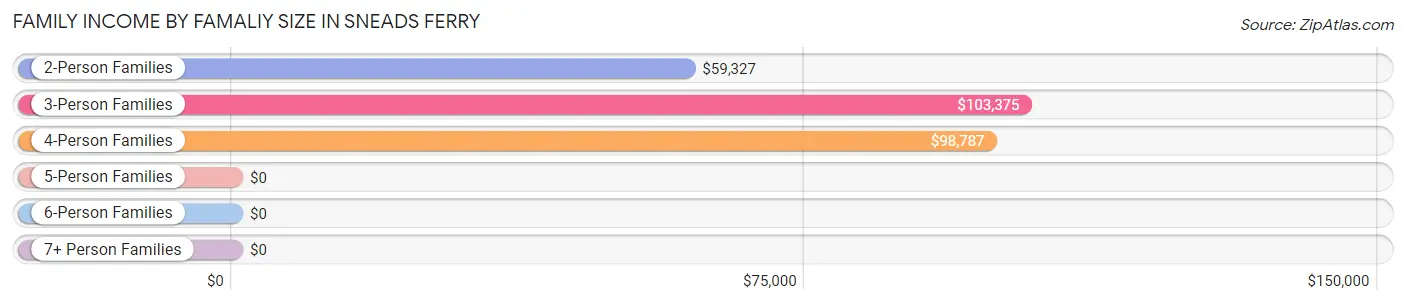
| Income Bracket | # Families | Median Income |
| 2-Person Families | 335 (58.9%) | $59,327 |
| 3-Person Families | 77 (13.5%) | $103,375 |
| 4-Person Families | 156 (27.4%) | $98,787 |
| 5-Person Families | 0 (0.0%) | $0 |
| 6-Person Families | 1 (0.2%) | $0 |
| 7+ Person Families | 0 (0.0%) | $0 |
| Total | 569 (100.0%) | $79,175 |
Family Income by Number of Earners in Sneads Ferry
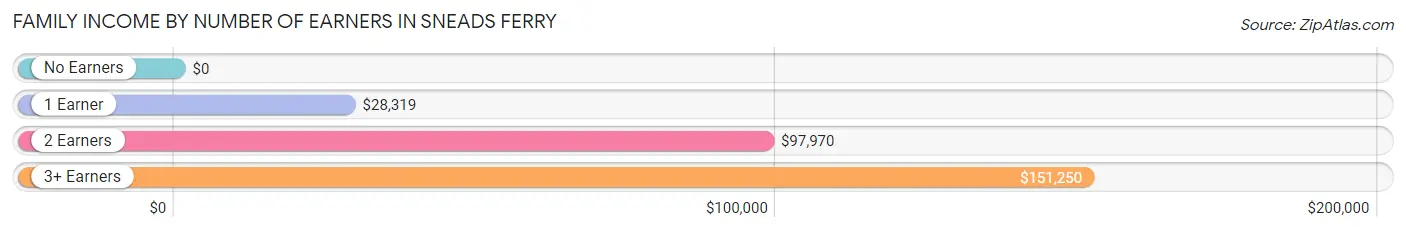
| Number of Earners | # Families | Median Income |
| No Earners | 79 (13.9%) | $0 |
| 1 Earner | 143 (25.1%) | $28,319 |
| 2 Earners | 312 (54.8%) | $97,970 |
| 3+ Earners | 35 (6.1%) | $151,250 |
| Total | 569 (100.0%) | $79,175 |
Household Income in Sneads Ferry
Household Income Brackets in Sneads Ferry
With 222 households falling in the category, the $75,000 to $99,999 income range is the most frequent in Sneads Ferry, accounting for 20.6% of all households. In contrast, only 26 households (2.4%) fall into the $200,000+ income bracket, making it the least populous group.
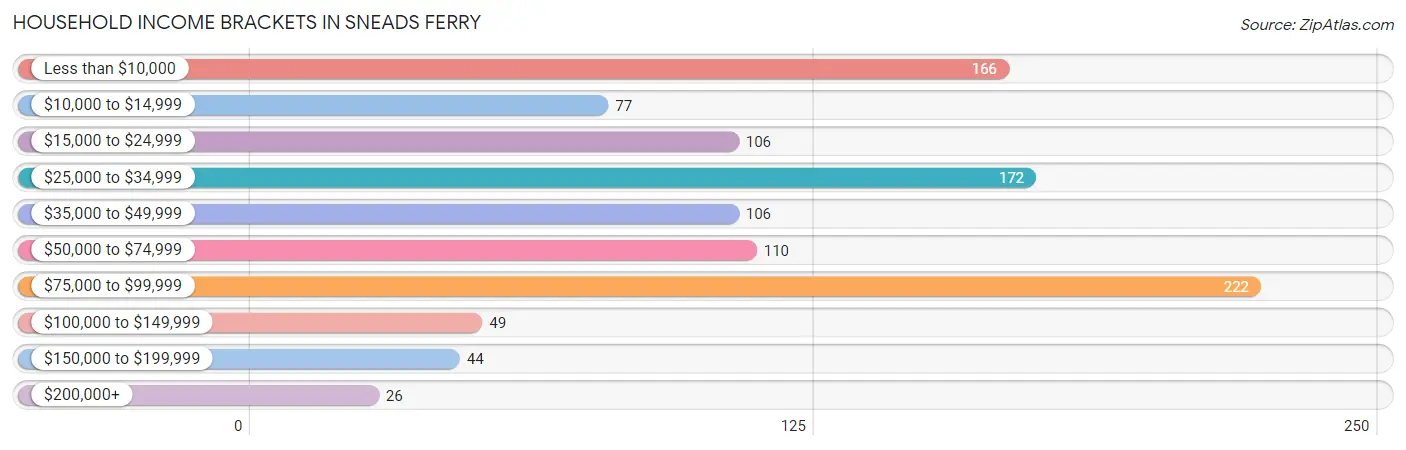
| Income Bracket | # Households | % Households |
| Less than $10,000 | 166 | 15.4% |
| $10,000 to $14,999 | 77 | 7.1% |
| $15,000 to $24,999 | 106 | 9.8% |
| $25,000 to $34,999 | 172 | 16.0% |
| $35,000 to $49,999 | 106 | 9.8% |
| $50,000 to $74,999 | 110 | 10.2% |
| $75,000 to $99,999 | 222 | 20.6% |
| $100,000 to $149,999 | 49 | 4.5% |
| $150,000 to $199,999 | 44 | 4.1% |
| $200,000+ | 26 | 2.4% |
Household Income by Householder Age in Sneads Ferry
The median household income in Sneads Ferry is $40,278, with the highest median household income of $97,611 found in the 25 to 44 years age bracket for the primary householder. A total of 255 households (23.6%) fall into this category. Meanwhile, the 45 to 64 years age bracket for the primary householder has the lowest median household income of $0, with 399 households (37.0%) in this group.
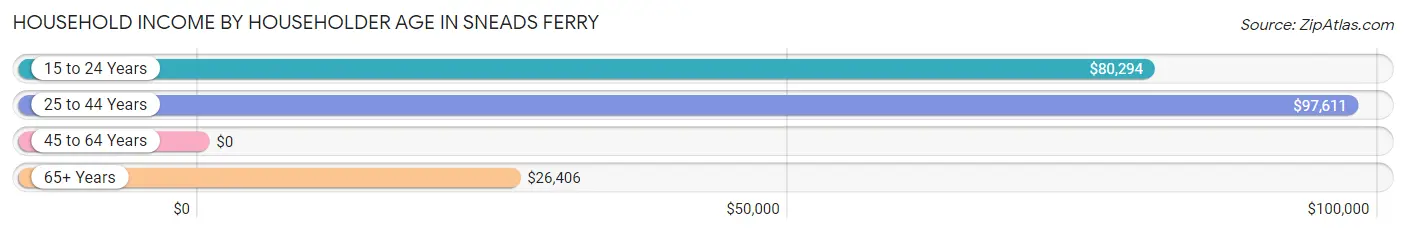
| Income Bracket | # Households | Median Income |
| 15 to 24 Years | 60 (5.6%) | $80,294 |
| 25 to 44 Years | 255 (23.6%) | $97,611 |
| 45 to 64 Years | 399 (37.0%) | $0 |
| 65+ Years | 364 (33.8%) | $26,406 |
| Total | 1,078 (100.0%) | $40,278 |
Poverty in Sneads Ferry
Income Below Poverty by Sex and Age in Sneads Ferry
With 13.8% poverty level for males and 17.9% for females among the residents of Sneads Ferry, under 5 year old males and 5 year old females are the most vulnerable to poverty, with 1 males (100.0%) and 1 females (100.0%) in their respective age groups living below the poverty level.
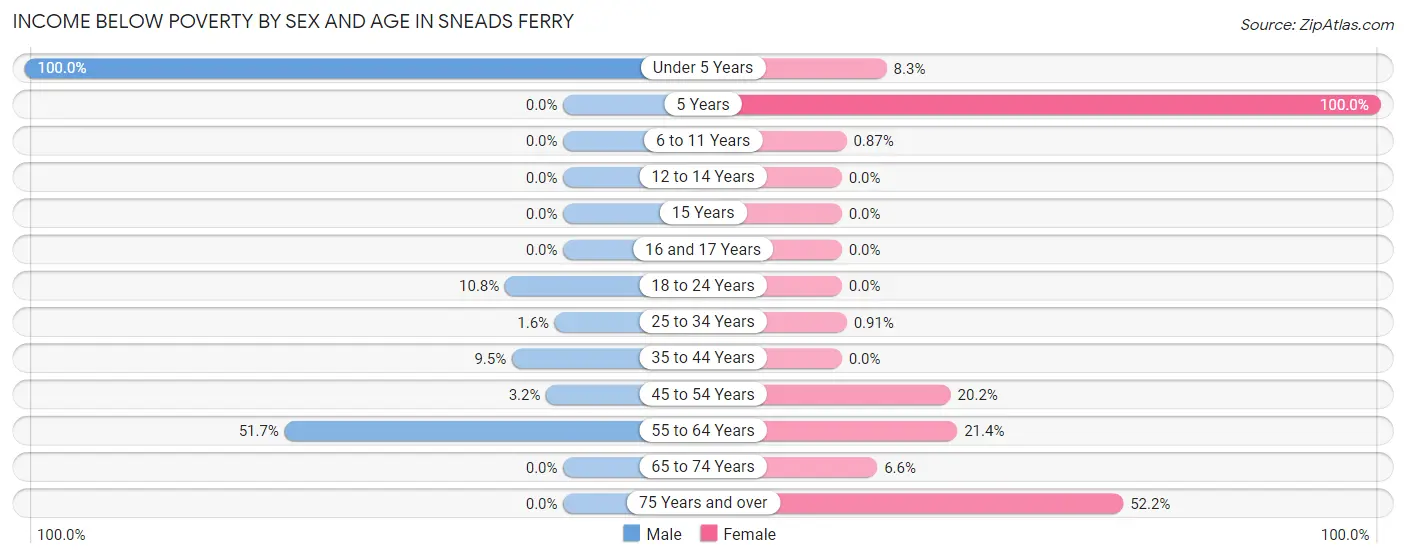
| Age Bracket | Male | Female |
| Under 5 Years | 1 (100.0%) | 1 (8.3%) |
| 5 Years | 0 (0.0%) | 1 (100.0%) |
| 6 to 11 Years | 0 (0.0%) | 1 (0.9%) |
| 12 to 14 Years | 0 (0.0%) | 0 (0.0%) |
| 15 Years | 0 (0.0%) | 0 (0.0%) |
| 16 and 17 Years | 0 (0.0%) | 0 (0.0%) |
| 18 to 24 Years | 8 (10.8%) | 0 (0.0%) |
| 25 to 34 Years | 1 (1.6%) | 1 (0.9%) |
| 35 to 44 Years | 18 (9.5%) | 0 (0.0%) |
| 45 to 54 Years | 4 (3.2%) | 39 (20.2%) |
| 55 to 64 Years | 120 (51.7%) | 21 (21.4%) |
| 65 to 74 Years | 0 (0.0%) | 5 (6.6%) |
| 75 Years and over | 0 (0.0%) | 117 (52.2%) |
| Total | 152 (13.8%) | 186 (17.9%) |
Income Above Poverty by Sex and Age in Sneads Ferry
According to the poverty statistics in Sneads Ferry, males aged 6 to 11 years and females aged 12 to 14 years are the age groups that are most secure financially, with 100.0% of males and 100.0% of females in these age groups living above the poverty line.
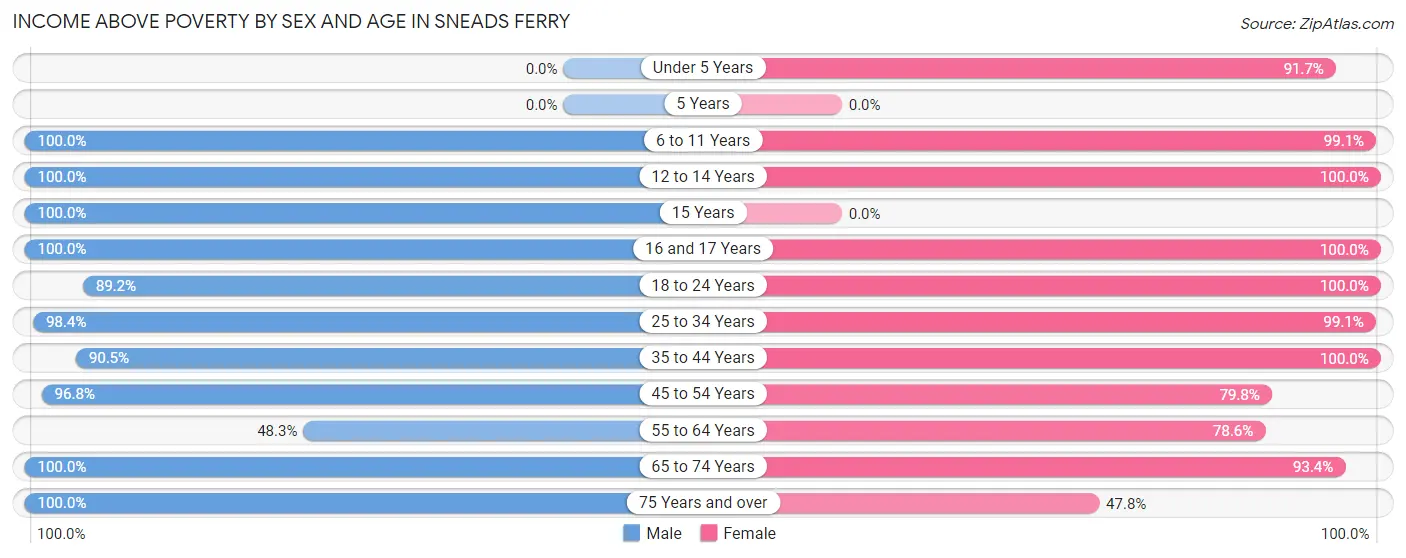
| Age Bracket | Male | Female |
| Under 5 Years | 0 (0.0%) | 11 (91.7%) |
| 5 Years | 0 (0.0%) | 0 (0.0%) |
| 6 to 11 Years | 88 (100.0%) | 114 (99.1%) |
| 12 to 14 Years | 123 (100.0%) | 25 (100.0%) |
| 15 Years | 13 (100.0%) | 0 (0.0%) |
| 16 and 17 Years | 19 (100.0%) | 10 (100.0%) |
| 18 to 24 Years | 66 (89.2%) | 45 (100.0%) |
| 25 to 34 Years | 63 (98.4%) | 109 (99.1%) |
| 35 to 44 Years | 171 (90.5%) | 131 (100.0%) |
| 45 to 54 Years | 122 (96.8%) | 154 (79.8%) |
| 55 to 64 Years | 112 (48.3%) | 77 (78.6%) |
| 65 to 74 Years | 91 (100.0%) | 71 (93.4%) |
| 75 Years and over | 80 (100.0%) | 107 (47.8%) |
| Total | 948 (86.2%) | 854 (82.1%) |
Income Below Poverty Among Married-Couple Families in Sneads Ferry
The poverty statistics for married-couple families in Sneads Ferry show that 12.5% or 65 of the total 519 families live below the poverty line. Families with 3 or 4 children have the highest poverty rate of 100.0%, comprising of 1 families. On the other hand, families with 1 or 2 children have the lowest poverty rate of 0.0%, which includes 0 families.
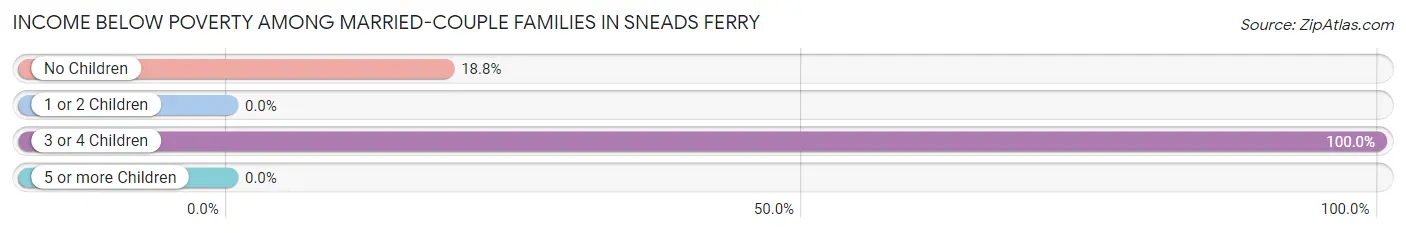
| Children | Above Poverty | Below Poverty |
| No Children | 276 (81.2%) | 64 (18.8%) |
| 1 or 2 Children | 178 (100.0%) | 0 (0.0%) |
| 3 or 4 Children | 0 (0.0%) | 1 (100.0%) |
| 5 or more Children | 0 (0.0%) | 0 (0.0%) |
| Total | 454 (87.5%) | 65 (12.5%) |
Income Below Poverty Among Single-Parent Households in Sneads Ferry
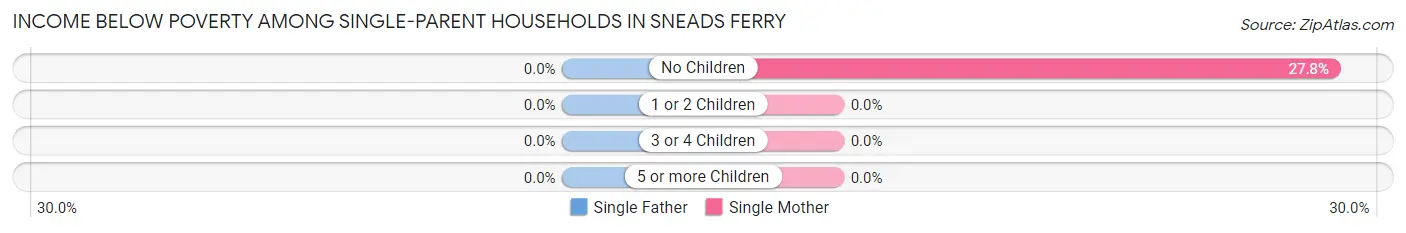
| Children | Single Father | Single Mother |
| No Children | 0 (0.0%) | 5 (27.8%) |
| 1 or 2 Children | 0 (0.0%) | 0 (0.0%) |
| 3 or 4 Children | 0 (0.0%) | 0 (0.0%) |
| 5 or more Children | 0 (0.0%) | 0 (0.0%) |
| Total | 0 (0.0%) | 5 (13.2%) |
Income Below Poverty Among Married-Couple vs Single-Parent Households in Sneads Ferry
The poverty data for Sneads Ferry shows that 65 of the married-couple family households (12.5%) and 5 of the single-parent households (10.0%) are living below the poverty level. Within the married-couple family households, those with 3 or 4 children have the highest poverty rate, with 1 households (100.0%) falling below the poverty line. Among the single-parent households, those with no children have the highest poverty rate, with 5 household (16.7%) living below poverty.
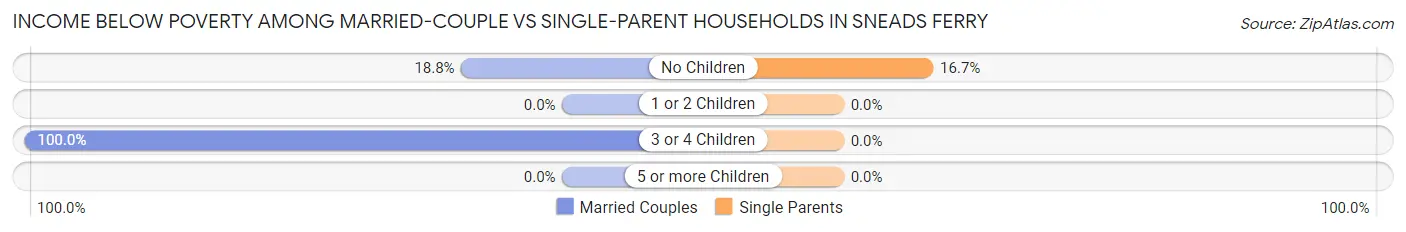
| Children | Married-Couple Families | Single-Parent Households |
| No Children | 64 (18.8%) | 5 (16.7%) |
| 1 or 2 Children | 0 (0.0%) | 0 (0.0%) |
| 3 or 4 Children | 1 (100.0%) | 0 (0.0%) |
| 5 or more Children | 0 (0.0%) | 0 (0.0%) |
| Total | 65 (12.5%) | 5 (10.0%) |
Race in Sneads Ferry
The most populous races in Sneads Ferry are White / Caucasian (2,023 | 94.5%), Hispanic or Latino (135 | 6.3%), and Asian (45 | 2.1%).
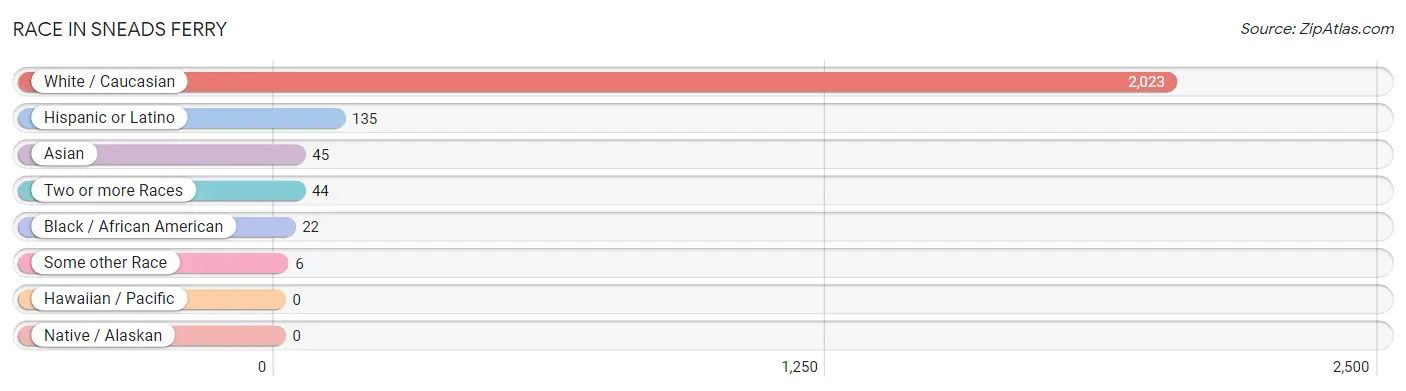
| Race | # Population | % Population |
| Asian | 45 | 2.1% |
| Black / African American | 22 | 1.0% |
| Hawaiian / Pacific | 0 | 0.0% |
| Hispanic or Latino | 135 | 6.3% |
| Native / Alaskan | 0 | 0.0% |
| White / Caucasian | 2,023 | 94.5% |
| Two or more Races | 44 | 2.1% |
| Some other Race | 6 | 0.3% |
| Total | 2,140 | 100.0% |
Ancestry in Sneads Ferry
The most populous ancestries reported in Sneads Ferry are Irish (847 | 39.6%), German (373 | 17.4%), English (273 | 12.8%), Portuguese (189 | 8.8%), and American (154 | 7.2%), together accounting for 85.8% of all Sneads Ferry residents.
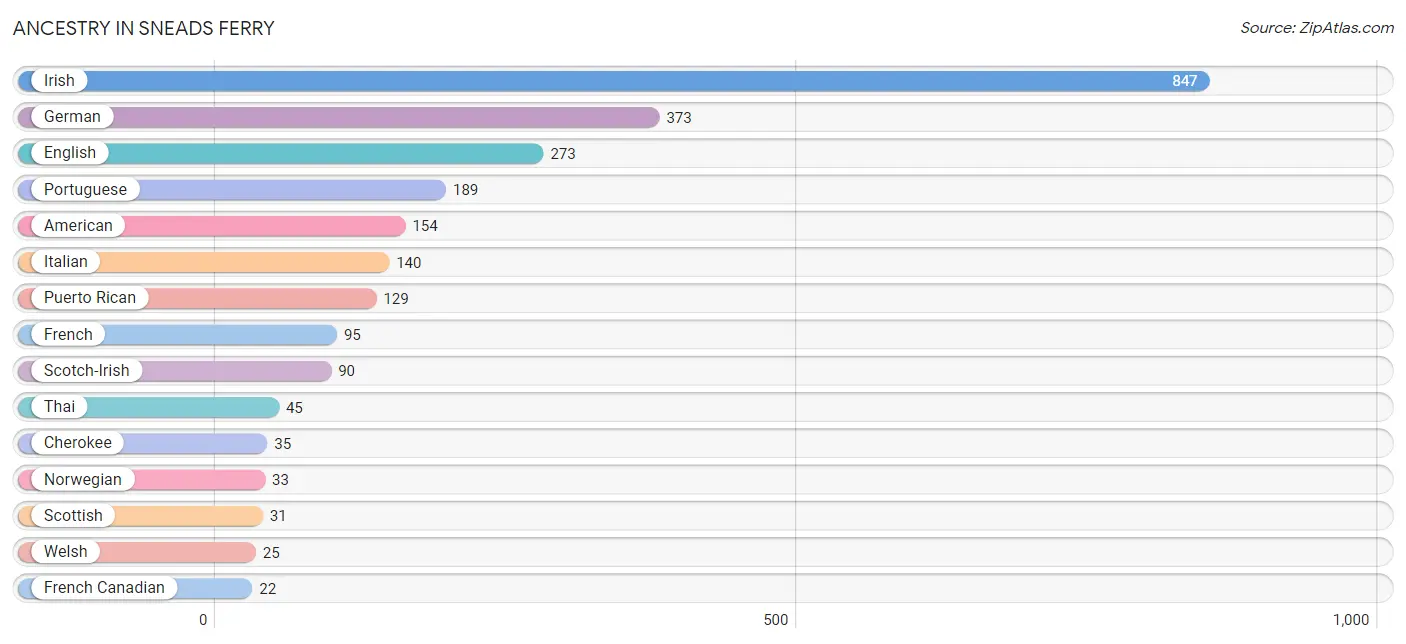
| Ancestry | # Population | % Population |
| American | 154 | 7.2% |
| Blackfeet | 18 | 0.8% |
| British | 7 | 0.3% |
| British West Indian | 7 | 0.3% |
| Cherokee | 35 | 1.6% |
| Czechoslovakian | 19 | 0.9% |
| English | 273 | 12.8% |
| French | 95 | 4.4% |
| French Canadian | 22 | 1.0% |
| German | 373 | 17.4% |
| Irish | 847 | 39.6% |
| Italian | 140 | 6.5% |
| Mexican | 6 | 0.3% |
| Norwegian | 33 | 1.5% |
| Portuguese | 189 | 8.8% |
| Puerto Rican | 129 | 6.0% |
| Scotch-Irish | 90 | 4.2% |
| Scottish | 31 | 1.5% |
| Thai | 45 | 2.1% |
| Welsh | 25 | 1.2% | View All 20 Rows |
Immigrants in Sneads Ferry
The most numerous immigrant groups reported in Sneads Ferry came from Europe (92 | 4.3%), Germany (92 | 4.3%), Western Europe (92 | 4.3%), Asia (34 | 1.6%), and India (34 | 1.6%), together accounting for 16.1% of all Sneads Ferry residents.
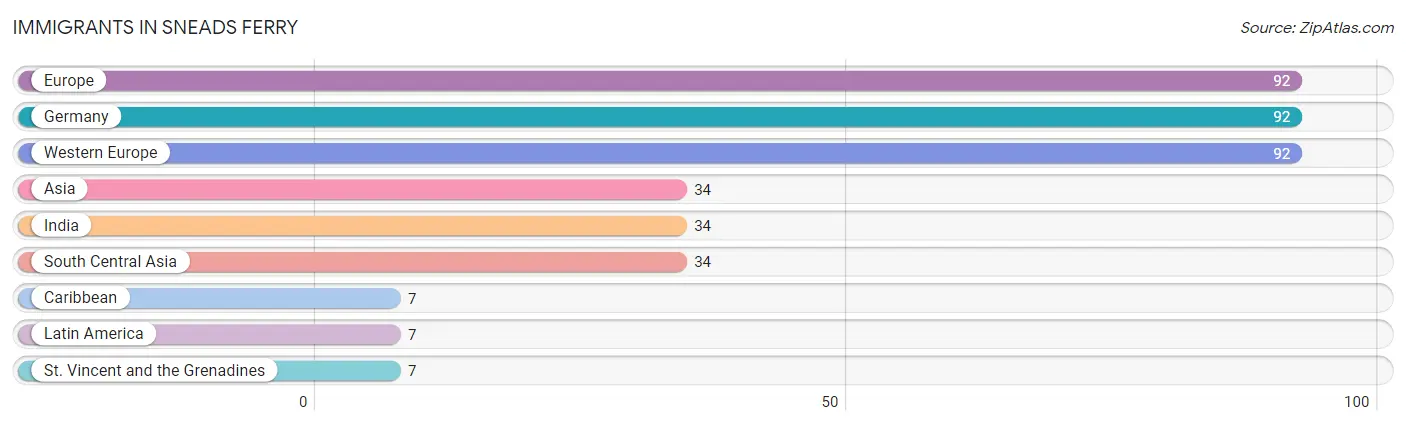
| Immigration Origin | # Population | % Population |
| Asia | 34 | 1.6% |
| Caribbean | 7 | 0.3% |
| Europe | 92 | 4.3% |
| Germany | 92 | 4.3% |
| India | 34 | 1.6% |
| Latin America | 7 | 0.3% |
| South Central Asia | 34 | 1.6% |
| St. Vincent and the Grenadines | 7 | 0.3% |
| Western Europe | 92 | 4.3% | View All 9 Rows |
Sex and Age in Sneads Ferry
Sex and Age in Sneads Ferry
The most populous age groups in Sneads Ferry are 10 to 14 Years (201 | 18.3%) for men and 50 to 54 Years (178 | 17.1%) for women.
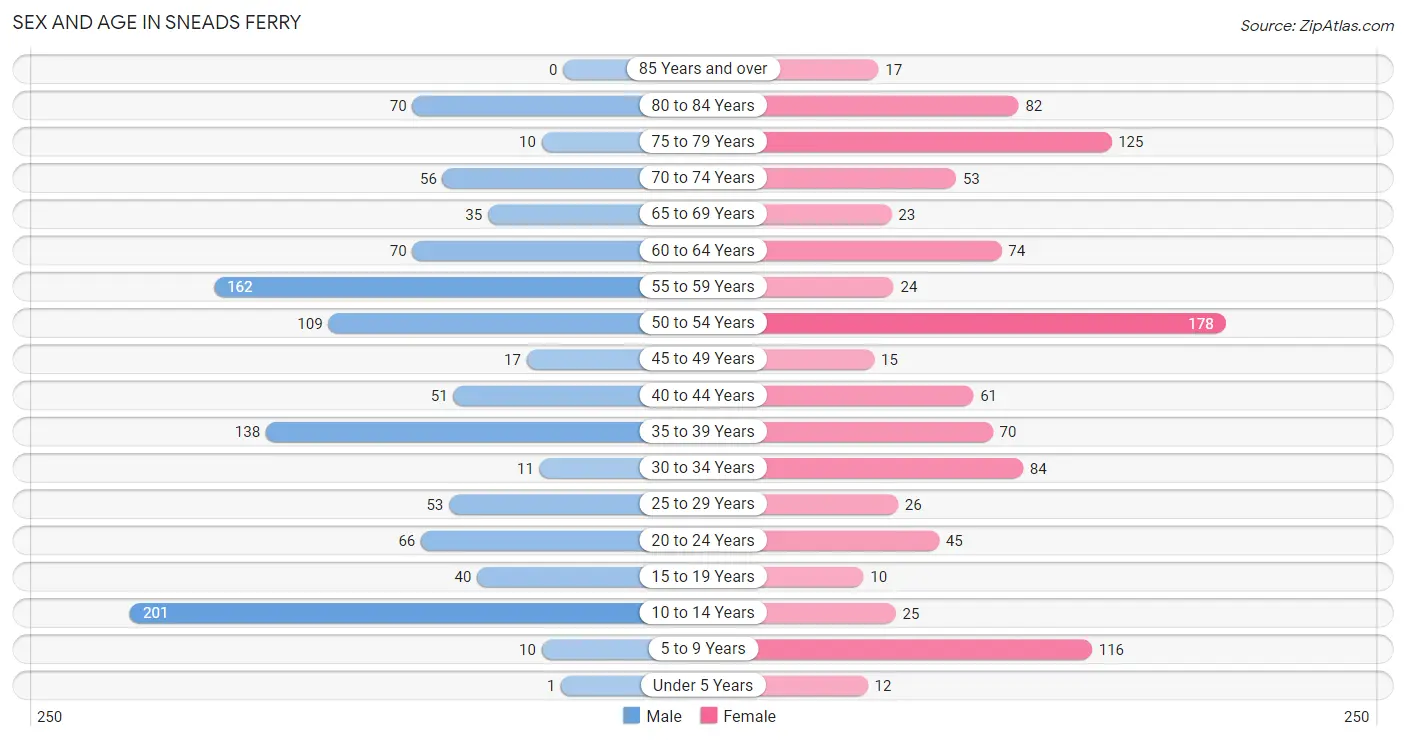
| Age Bracket | Male | Female |
| Under 5 Years | 1 (0.1%) | 12 (1.1%) |
| 5 to 9 Years | 10 (0.9%) | 116 (11.2%) |
| 10 to 14 Years | 201 (18.3%) | 25 (2.4%) |
| 15 to 19 Years | 40 (3.6%) | 10 (1.0%) |
| 20 to 24 Years | 66 (6.0%) | 45 (4.3%) |
| 25 to 29 Years | 53 (4.8%) | 26 (2.5%) |
| 30 to 34 Years | 11 (1.0%) | 84 (8.1%) |
| 35 to 39 Years | 138 (12.6%) | 70 (6.7%) |
| 40 to 44 Years | 51 (4.6%) | 61 (5.9%) |
| 45 to 49 Years | 17 (1.5%) | 15 (1.4%) |
| 50 to 54 Years | 109 (9.9%) | 178 (17.1%) |
| 55 to 59 Years | 162 (14.7%) | 24 (2.3%) |
| 60 to 64 Years | 70 (6.4%) | 74 (7.1%) |
| 65 to 69 Years | 35 (3.2%) | 23 (2.2%) |
| 70 to 74 Years | 56 (5.1%) | 53 (5.1%) |
| 75 to 79 Years | 10 (0.9%) | 125 (12.0%) |
| 80 to 84 Years | 70 (6.4%) | 82 (7.9%) |
| 85 Years and over | 0 (0.0%) | 17 (1.6%) |
| Total | 1,100 (100.0%) | 1,040 (100.0%) |
Families and Households in Sneads Ferry
Median Family Size in Sneads Ferry
The median family size in Sneads Ferry is 2.81 persons per family, with single female/mother families (38 | 6.7%) accounting for the largest median family size of 2.89 persons per family. On the other hand, single male/father families (12 | 2.1%) represent the smallest median family size with 2.17 persons per family.
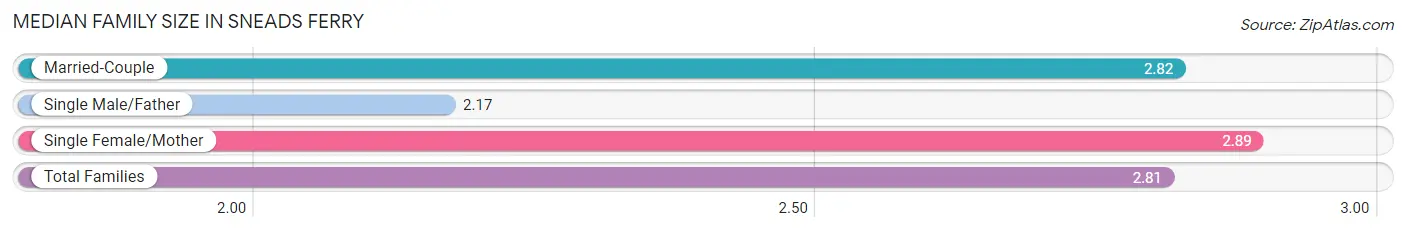
| Family Type | # Families | Family Size |
| Married-Couple | 519 (91.2%) | 2.82 |
| Single Male/Father | 12 (2.1%) | 2.17 |
| Single Female/Mother | 38 (6.7%) | 2.89 |
| Total Families | 569 (100.0%) | 2.81 |
Median Household Size in Sneads Ferry
The median household size in Sneads Ferry is 1.99 persons per household, with single female/mother households (38 | 3.5%) accounting for the largest median household size of 2.89 persons per household. non-family households (509 | 47.2%) represent the smallest median household size with 1.07 persons per household.
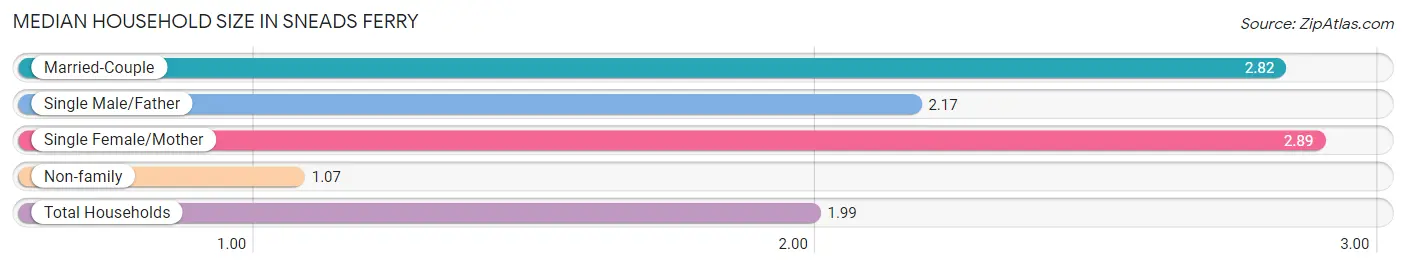
| Household Type | # Households | Household Size |
| Married-Couple | 519 (48.1%) | 2.82 |
| Single Male/Father | 12 (1.1%) | 2.17 |
| Single Female/Mother | 38 (3.5%) | 2.89 |
| Non-family | 509 (47.2%) | 1.07 |
| Total Households | 1,078 (100.0%) | 1.99 |
Household Size by Marriage Status in Sneads Ferry
Out of a total of 1,078 households in Sneads Ferry, 569 (52.8%) are family households, while 509 (47.2%) are nonfamily households. The most numerous type of family households are 2-person households, comprising 335, and the most common type of nonfamily households are 1-person households, comprising 479.
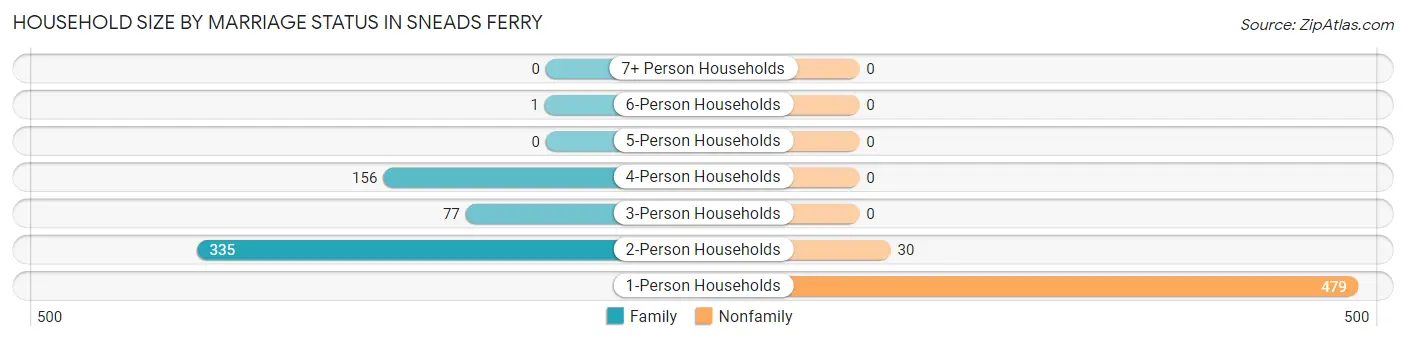
| Household Size | Family Households | Nonfamily Households |
| 1-Person Households | - | 479 (44.4%) |
| 2-Person Households | 335 (31.1%) | 30 (2.8%) |
| 3-Person Households | 77 (7.1%) | 0 (0.0%) |
| 4-Person Households | 156 (14.5%) | 0 (0.0%) |
| 5-Person Households | 0 (0.0%) | 0 (0.0%) |
| 6-Person Households | 1 (0.1%) | 0 (0.0%) |
| 7+ Person Households | 0 (0.0%) | 0 (0.0%) |
| Total | 569 (52.8%) | 509 (47.2%) |
Female Fertility in Sneads Ferry
Fertility by Age in Sneads Ferry
Average fertility rate in Sneads Ferry is 3.0 births per 1,000 women. Women in the age bracket of 20 to 34 years have the highest fertility rate with 6.0 births per 1,000 women. Women in the age bracket of 20 to 34 years acount for 100.0% of all women with births.
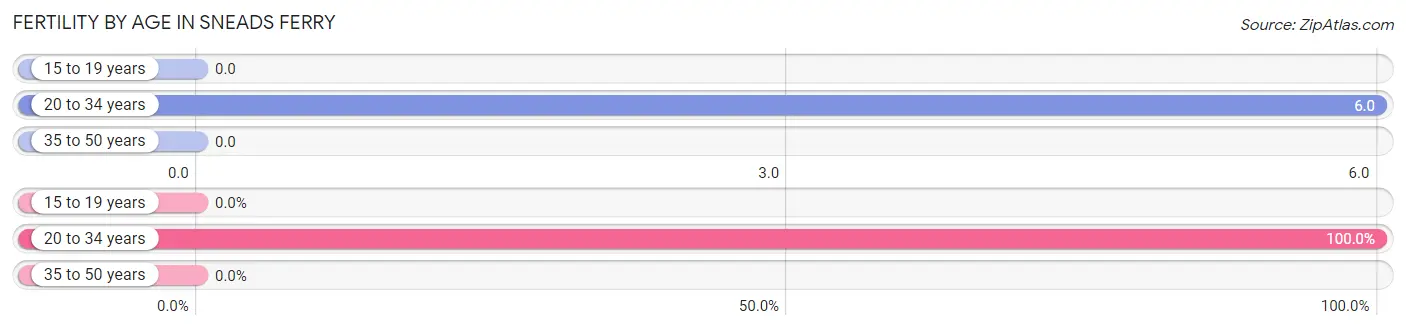
| Age Bracket | Women with Births | Births / 1,000 Women |
| 15 to 19 years | 0 (0.0%) | 0.0 |
| 20 to 34 years | 1 (100.0%) | 6.0 |
| 35 to 50 years | 0 (0.0%) | 0.0 |
| Total | 1 (100.0%) | 3.0 |
Fertility by Age by Marriage Status in Sneads Ferry
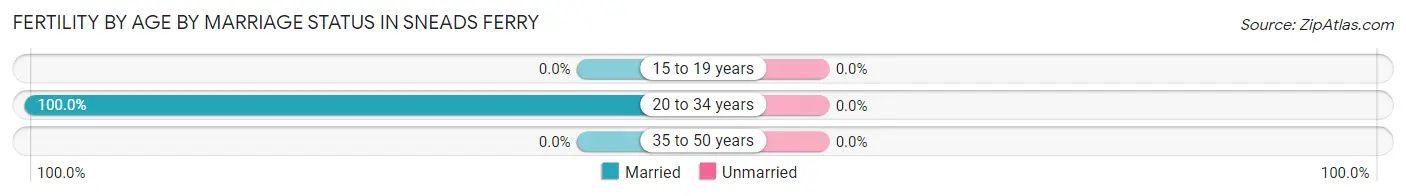
| Age Bracket | Married | Unmarried |
| 15 to 19 years | 0 (0.0%) | 0 (0.0%) |
| 20 to 34 years | 1 (100.0%) | 0 (0.0%) |
| 35 to 50 years | 0 (0.0%) | 0 (0.0%) |
| Total | 1 (100.0%) | 0 (0.0%) |
Fertility by Education in Sneads Ferry
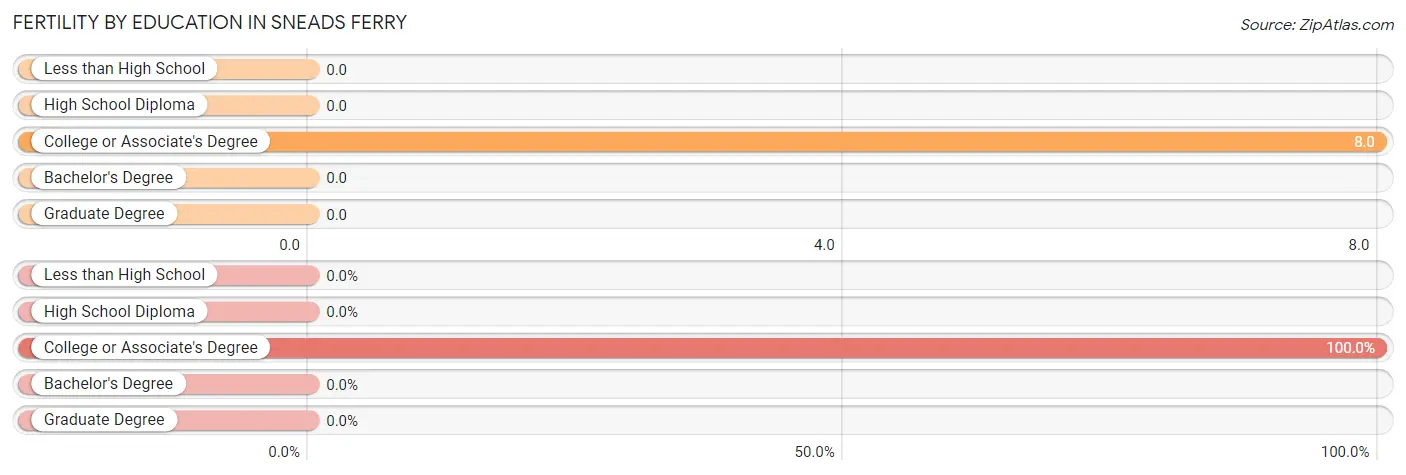
| Educational Attainment | Women with Births | Births / 1,000 Women |
| Less than High School | 0 (0.0%) | 0.0 |
| High School Diploma | 0 (0.0%) | 0.0 |
| College or Associate's Degree | 1 (100.0%) | 8.0 |
| Bachelor's Degree | 0 (0.0%) | 0.0 |
| Graduate Degree | 0 (0.0%) | 0.0 |
| Total | 1 (100.0%) | 3.0 |
Fertility by Education by Marriage Status in Sneads Ferry
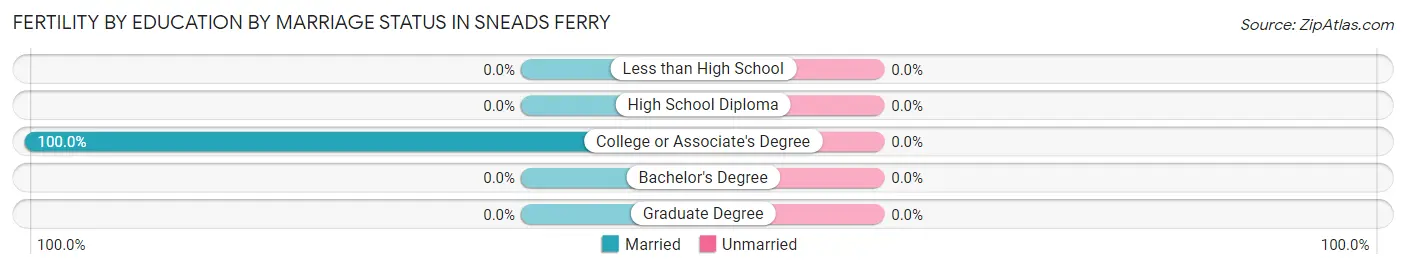
| Educational Attainment | Married | Unmarried |
| Less than High School | 0 (0.0%) | 0 (0.0%) |
| High School Diploma | 0 (0.0%) | 0 (0.0%) |
| College or Associate's Degree | 1 (100.0%) | 0 (0.0%) |
| Bachelor's Degree | 0 (0.0%) | 0 (0.0%) |
| Graduate Degree | 0 (0.0%) | 0 (0.0%) |
| Total | 1 (100.0%) | 0 (0.0%) |
Employment Characteristics in Sneads Ferry
Employment by Class of Employer in Sneads Ferry
Among the 988 employed individuals in Sneads Ferry, private company employees (444 | 44.9%), self-employed (not incorporated) (174 | 17.6%), and federal government employees (151 | 15.3%) make up the most common classes of employment.
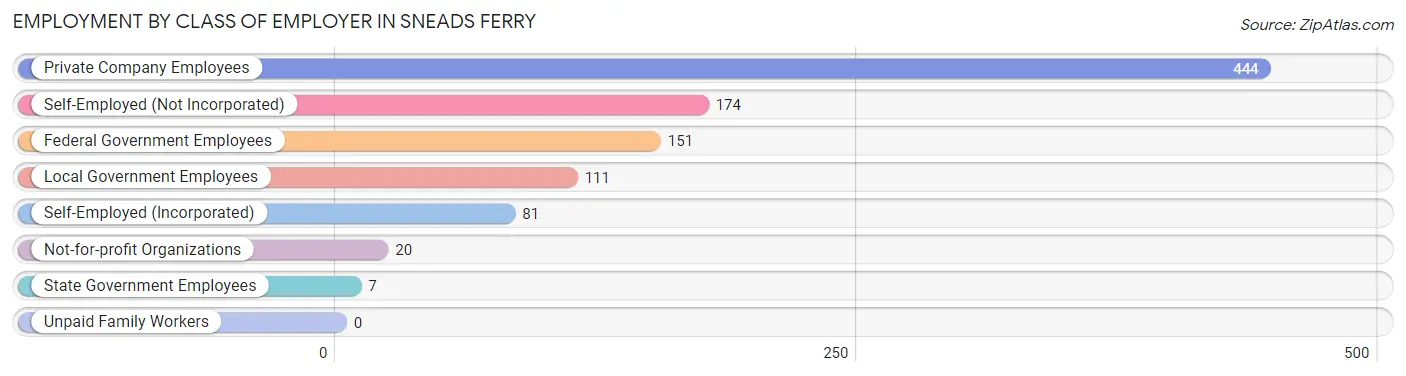
| Employer Class | # Employees | % Employees |
| Private Company Employees | 444 | 44.9% |
| Self-Employed (Incorporated) | 81 | 8.2% |
| Self-Employed (Not Incorporated) | 174 | 17.6% |
| Not-for-profit Organizations | 20 | 2.0% |
| Local Government Employees | 111 | 11.2% |
| State Government Employees | 7 | 0.7% |
| Federal Government Employees | 151 | 15.3% |
| Unpaid Family Workers | 0 | 0.0% |
| Total | 988 | 100.0% |
Employment Status by Age in Sneads Ferry
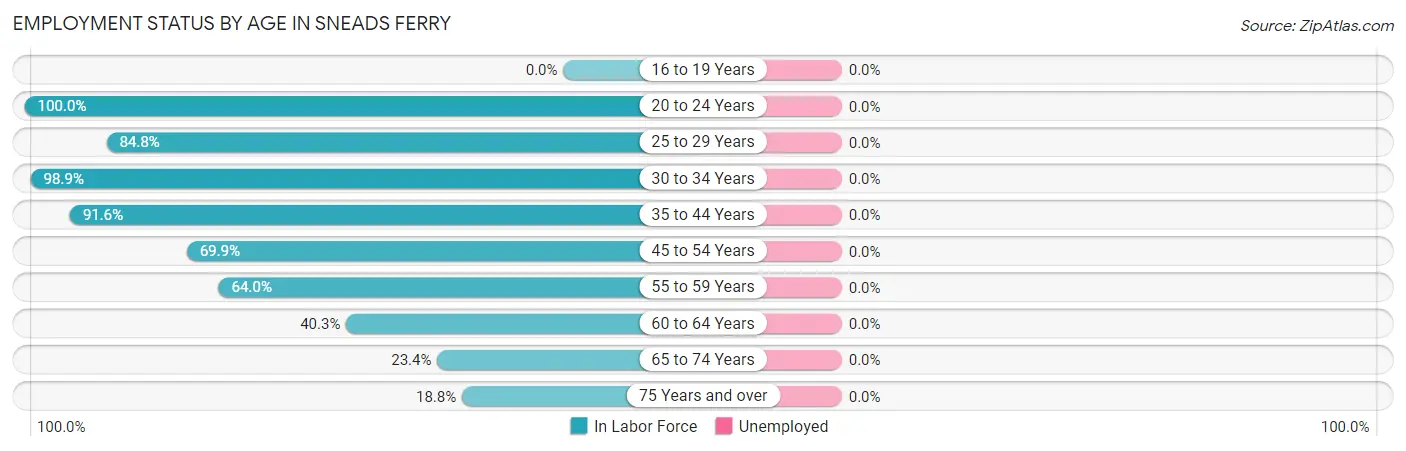
| Age Bracket | In Labor Force | Unemployed |
| 16 to 19 Years | 0 (0.0%) | 0 (0.0%) |
| 20 to 24 Years | 111 (100.0%) | 0 (0.0%) |
| 25 to 29 Years | 67 (84.8%) | 0 (0.0%) |
| 30 to 34 Years | 94 (98.9%) | 0 (0.0%) |
| 35 to 44 Years | 293 (91.6%) | 0 (0.0%) |
| 45 to 54 Years | 223 (69.9%) | 0 (0.0%) |
| 55 to 59 Years | 119 (64.0%) | 0 (0.0%) |
| 60 to 64 Years | 58 (40.3%) | 0 (0.0%) |
| 65 to 74 Years | 39 (23.4%) | 0 (0.0%) |
| 75 Years and over | 57 (18.8%) | 0 (0.0%) |
| Total | 1,061 (60.2%) | 0 (0.0%) |
Employment Status by Educational Attainment in Sneads Ferry
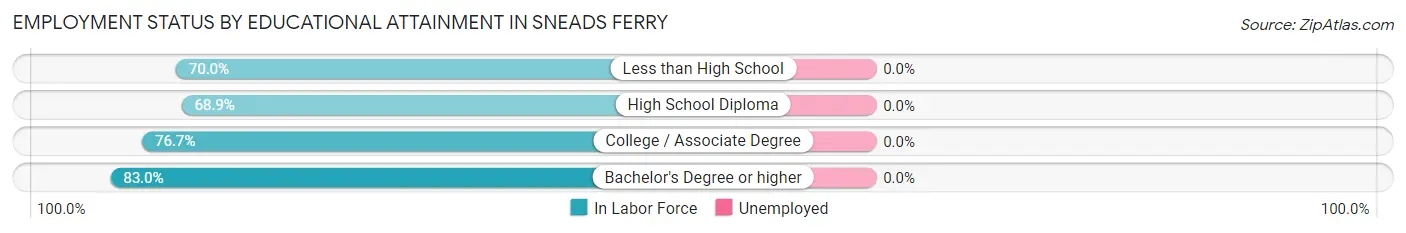
| Educational Attainment | In Labor Force | Unemployed |
| Less than High School | 84 (70.0%) | 0 (0.0%) |
| High School Diploma | 233 (68.9%) | 0 (0.0%) |
| College / Associate Degree | 386 (76.7%) | 0 (0.0%) |
| Bachelor's Degree or higher | 151 (83.0%) | 0 (0.0%) |
| Total | 854 (74.7%) | 0 (0.0%) |
Employment Occupations by Sex in Sneads Ferry
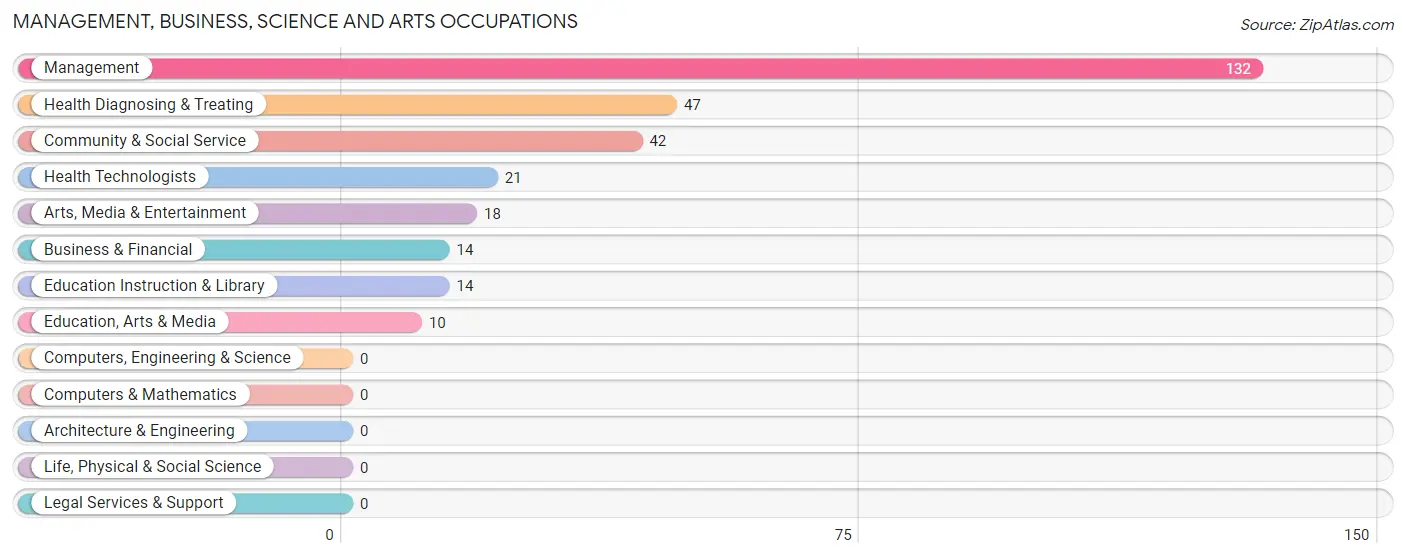
Management, Business, Science and Arts Occupations
The most common Management, Business, Science and Arts occupations in Sneads Ferry are Management (132 | 13.4%), Health Diagnosing & Treating (47 | 4.8%), Community & Social Service (42 | 4.3%), Health Technologists (21 | 2.1%), and Arts, Media & Entertainment (18 | 1.8%).
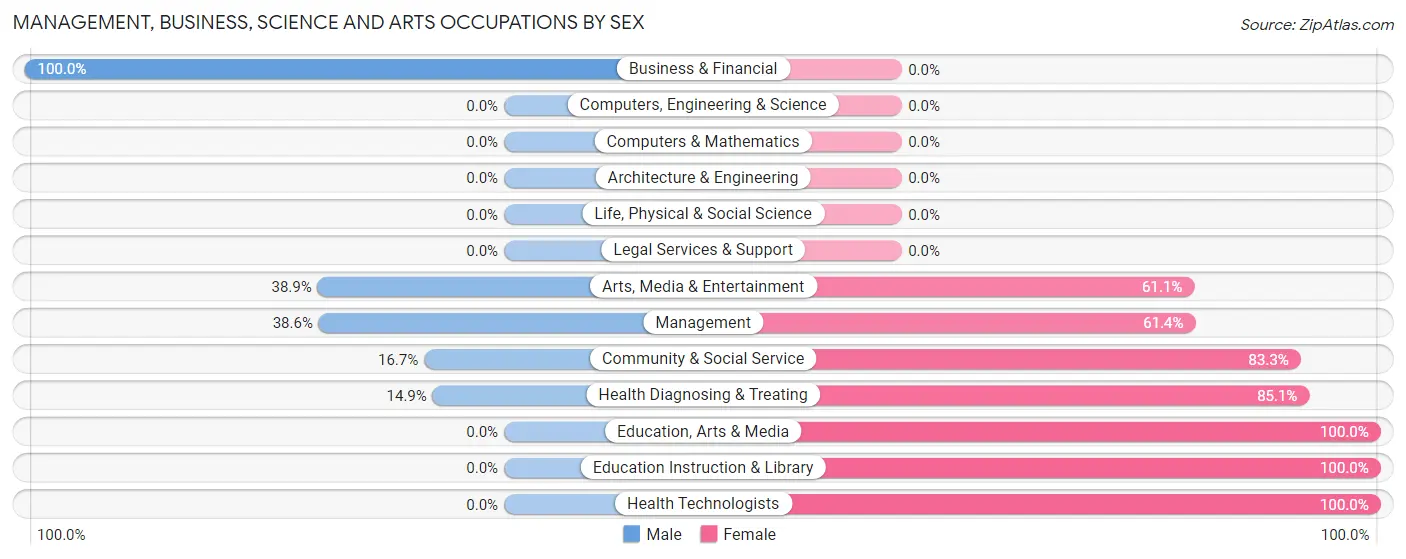
Management, Business, Science and Arts Occupations by Sex
Within the Management, Business, Science and Arts occupations in Sneads Ferry, the most male-oriented occupations are Business & Financial (100.0%), Arts, Media & Entertainment (38.9%), and Management (38.6%), while the most female-oriented occupations are Education, Arts & Media (100.0%), Education Instruction & Library (100.0%), and Health Technologists (100.0%).
| Occupation | Male | Female |
| Management | 51 (38.6%) | 81 (61.4%) |
| Business & Financial | 14 (100.0%) | 0 (0.0%) |
| Computers, Engineering & Science | 0 (0.0%) | 0 (0.0%) |
| Computers & Mathematics | 0 (0.0%) | 0 (0.0%) |
| Architecture & Engineering | 0 (0.0%) | 0 (0.0%) |
| Life, Physical & Social Science | 0 (0.0%) | 0 (0.0%) |
| Community & Social Service | 7 (16.7%) | 35 (83.3%) |
| Education, Arts & Media | 0 (0.0%) | 10 (100.0%) |
| Legal Services & Support | 0 (0.0%) | 0 (0.0%) |
| Education Instruction & Library | 0 (0.0%) | 14 (100.0%) |
| Arts, Media & Entertainment | 7 (38.9%) | 11 (61.1%) |
| Health Diagnosing & Treating | 7 (14.9%) | 40 (85.1%) |
| Health Technologists | 0 (0.0%) | 21 (100.0%) |
| Total (Category) | 79 (33.6%) | 156 (66.4%) |
| Total (Overall) | 495 (50.4%) | 487 (49.6%) |
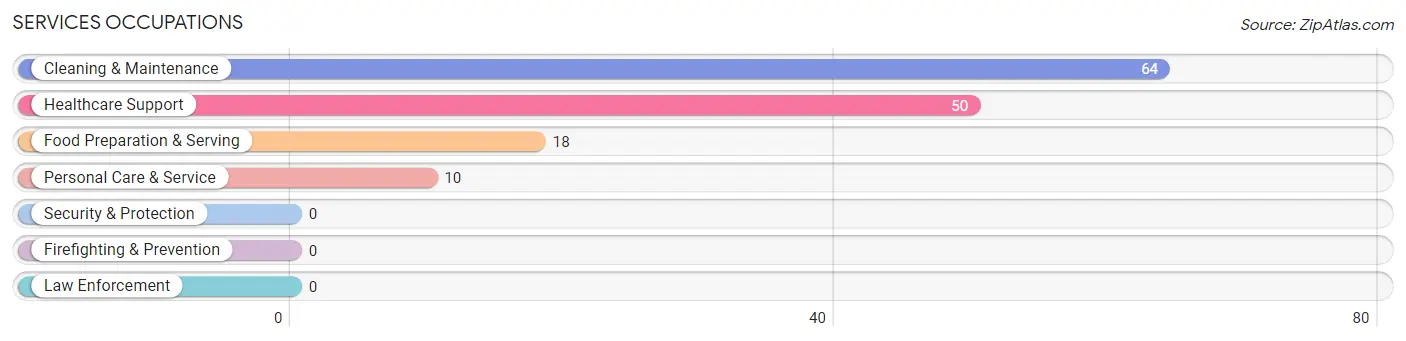
Services Occupations
The most common Services occupations in Sneads Ferry are Cleaning & Maintenance (64 | 6.5%), Healthcare Support (50 | 5.1%), Food Preparation & Serving (18 | 1.8%), and Personal Care & Service (10 | 1.0%).
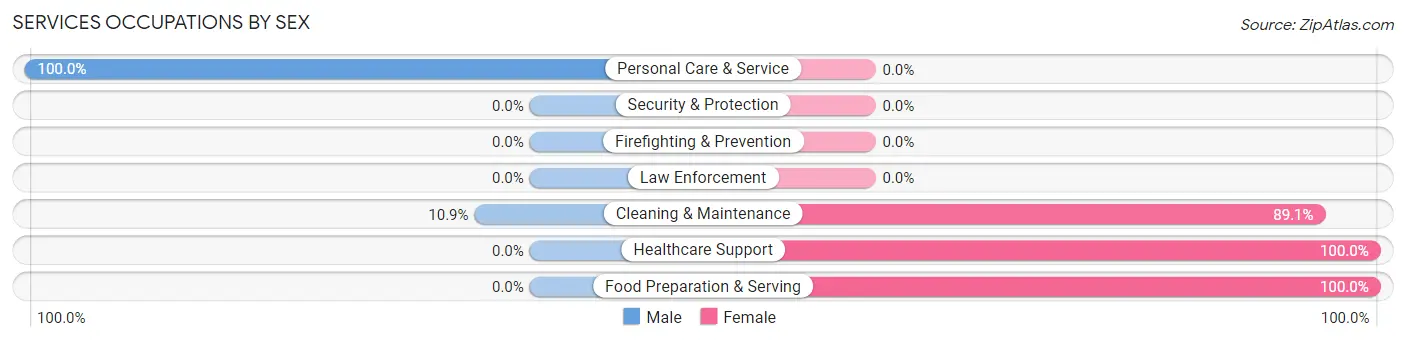
Services Occupations by Sex
Within the Services occupations in Sneads Ferry, the most male-oriented occupations are Personal Care & Service (100.0%), and Cleaning & Maintenance (10.9%), while the most female-oriented occupations are Healthcare Support (100.0%), Food Preparation & Serving (100.0%), and Cleaning & Maintenance (89.1%).
| Occupation | Male | Female |
| Healthcare Support | 0 (0.0%) | 50 (100.0%) |
| Security & Protection | 0 (0.0%) | 0 (0.0%) |
| Firefighting & Prevention | 0 (0.0%) | 0 (0.0%) |
| Law Enforcement | 0 (0.0%) | 0 (0.0%) |
| Food Preparation & Serving | 0 (0.0%) | 18 (100.0%) |
| Cleaning & Maintenance | 7 (10.9%) | 57 (89.1%) |
| Personal Care & Service | 10 (100.0%) | 0 (0.0%) |
| Total (Category) | 17 (12.0%) | 125 (88.0%) |
| Total (Overall) | 495 (50.4%) | 487 (49.6%) |
Sales and Office Occupations
The most common Sales and Office occupations in Sneads Ferry are Sales & Related (143 | 14.6%), and Office & Administration (105 | 10.7%).
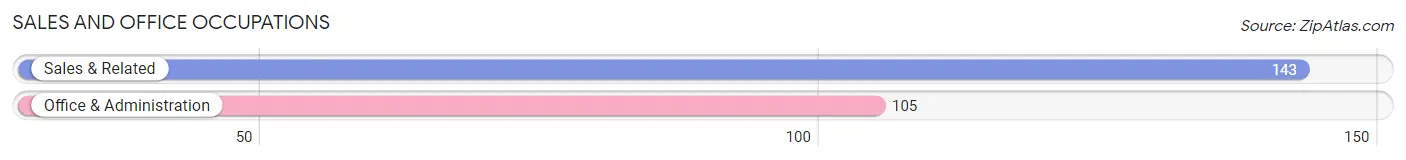
Sales and Office Occupations by Sex
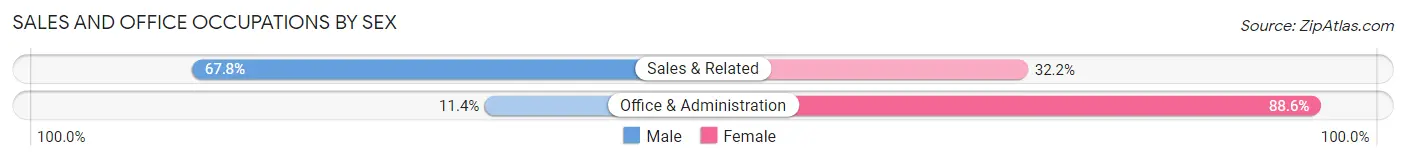
| Occupation | Male | Female |
| Sales & Related | 97 (67.8%) | 46 (32.2%) |
| Office & Administration | 12 (11.4%) | 93 (88.6%) |
| Total (Category) | 109 (44.0%) | 139 (56.0%) |
| Total (Overall) | 495 (50.4%) | 487 (49.6%) |
Natural Resources, Construction and Maintenance Occupations
The most common Natural Resources, Construction and Maintenance occupations in Sneads Ferry are Construction & Extraction (167 | 17.0%), Installation, Maintenance & Repair (46 | 4.7%), and Farming, Fishing & Forestry (12 | 1.2%).
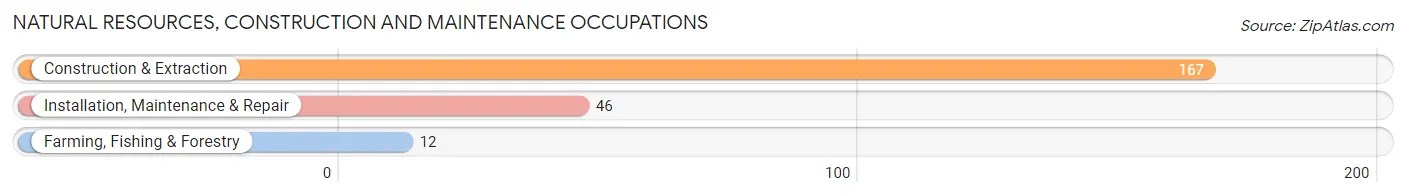
Natural Resources, Construction and Maintenance Occupations by Sex
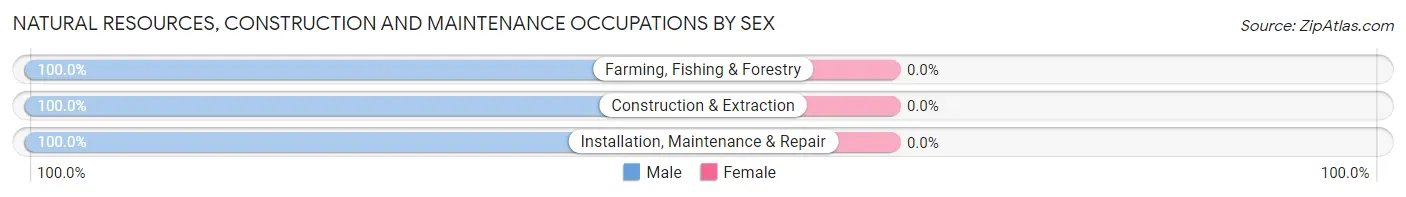
| Occupation | Male | Female |
| Farming, Fishing & Forestry | 12 (100.0%) | 0 (0.0%) |
| Construction & Extraction | 167 (100.0%) | 0 (0.0%) |
| Installation, Maintenance & Repair | 46 (100.0%) | 0 (0.0%) |
| Total (Category) | 225 (100.0%) | 0 (0.0%) |
| Total (Overall) | 495 (50.4%) | 487 (49.6%) |
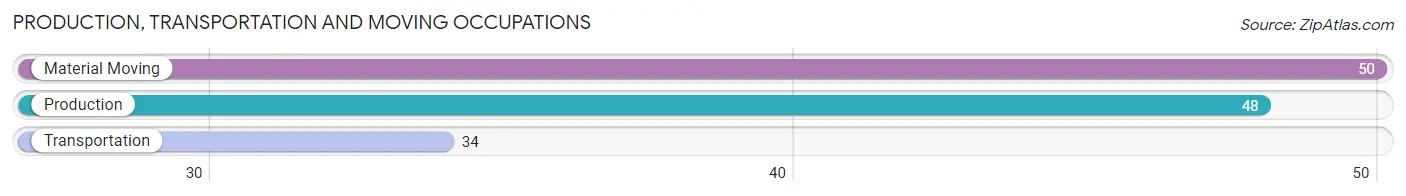
Production, Transportation and Moving Occupations
The most common Production, Transportation and Moving occupations in Sneads Ferry are Material Moving (50 | 5.1%), Production (48 | 4.9%), and Transportation (34 | 3.5%).
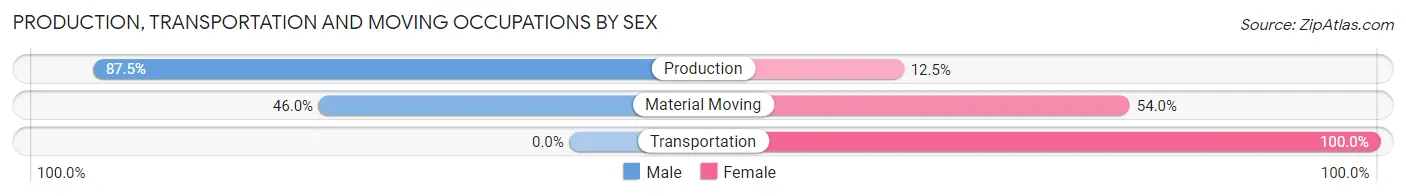
Production, Transportation and Moving Occupations by Sex
| Occupation | Male | Female |
| Production | 42 (87.5%) | 6 (12.5%) |
| Transportation | 0 (0.0%) | 34 (100.0%) |
| Material Moving | 23 (46.0%) | 27 (54.0%) |
| Total (Category) | 65 (49.2%) | 67 (50.8%) |
| Total (Overall) | 495 (50.4%) | 487 (49.6%) |
Employment Industries by Sex in Sneads Ferry
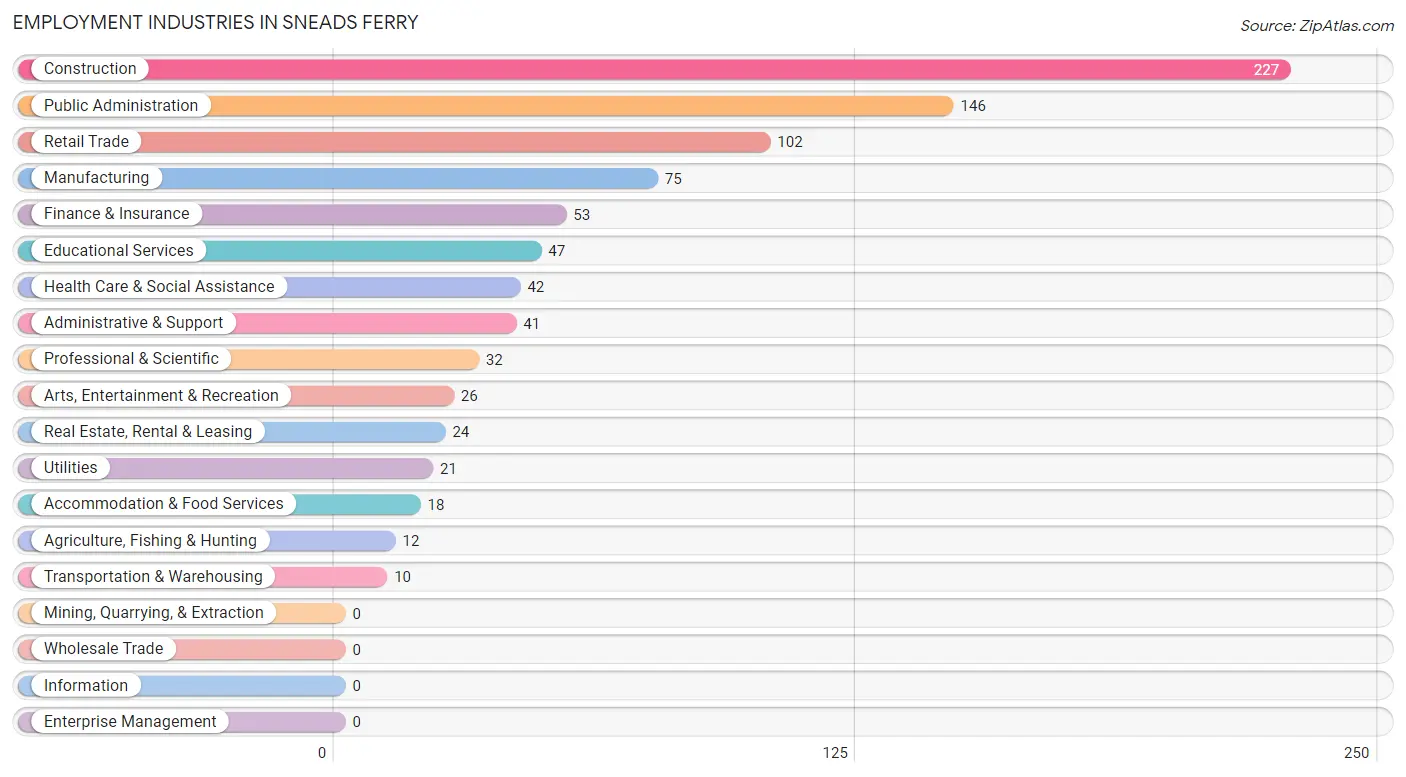
Employment Industries in Sneads Ferry
The major employment industries in Sneads Ferry include Construction (227 | 23.1%), Public Administration (146 | 14.9%), Retail Trade (102 | 10.4%), Manufacturing (75 | 7.6%), and Finance & Insurance (53 | 5.4%).
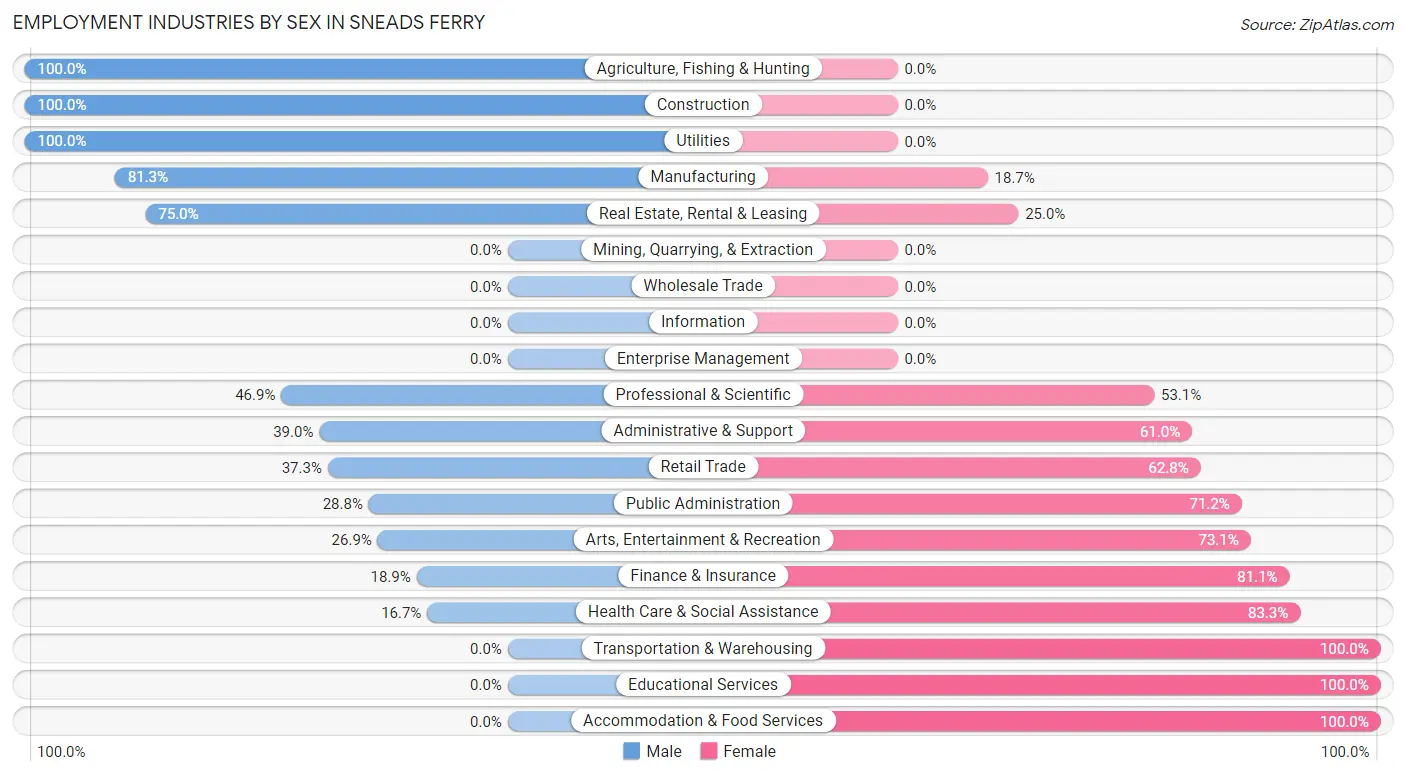
Employment Industries by Sex in Sneads Ferry
The Sneads Ferry industries that see more men than women are Agriculture, Fishing & Hunting (100.0%), Construction (100.0%), and Utilities (100.0%), whereas the industries that tend to have a higher number of women are Transportation & Warehousing (100.0%), Educational Services (100.0%), and Accommodation & Food Services (100.0%).
| Industry | Male | Female |
| Agriculture, Fishing & Hunting | 12 (100.0%) | 0 (0.0%) |
| Mining, Quarrying, & Extraction | 0 (0.0%) | 0 (0.0%) |
| Construction | 227 (100.0%) | 0 (0.0%) |
| Manufacturing | 61 (81.3%) | 14 (18.7%) |
| Wholesale Trade | 0 (0.0%) | 0 (0.0%) |
| Retail Trade | 38 (37.2%) | 64 (62.7%) |
| Transportation & Warehousing | 0 (0.0%) | 10 (100.0%) |
| Utilities | 21 (100.0%) | 0 (0.0%) |
| Information | 0 (0.0%) | 0 (0.0%) |
| Finance & Insurance | 10 (18.9%) | 43 (81.1%) |
| Real Estate, Rental & Leasing | 18 (75.0%) | 6 (25.0%) |
| Professional & Scientific | 15 (46.9%) | 17 (53.1%) |
| Enterprise Management | 0 (0.0%) | 0 (0.0%) |
| Administrative & Support | 16 (39.0%) | 25 (61.0%) |
| Educational Services | 0 (0.0%) | 47 (100.0%) |
| Health Care & Social Assistance | 7 (16.7%) | 35 (83.3%) |
| Arts, Entertainment & Recreation | 7 (26.9%) | 19 (73.1%) |
| Accommodation & Food Services | 0 (0.0%) | 18 (100.0%) |
| Public Administration | 42 (28.8%) | 104 (71.2%) |
| Total | 495 (50.4%) | 487 (49.6%) |
Education in Sneads Ferry
School Enrollment in Sneads Ferry
The most common levels of schooling among the 426 students in Sneads Ferry are middle school (147 | 34.5%), elementary school (124 | 29.1%), and high school (106 | 24.9%).
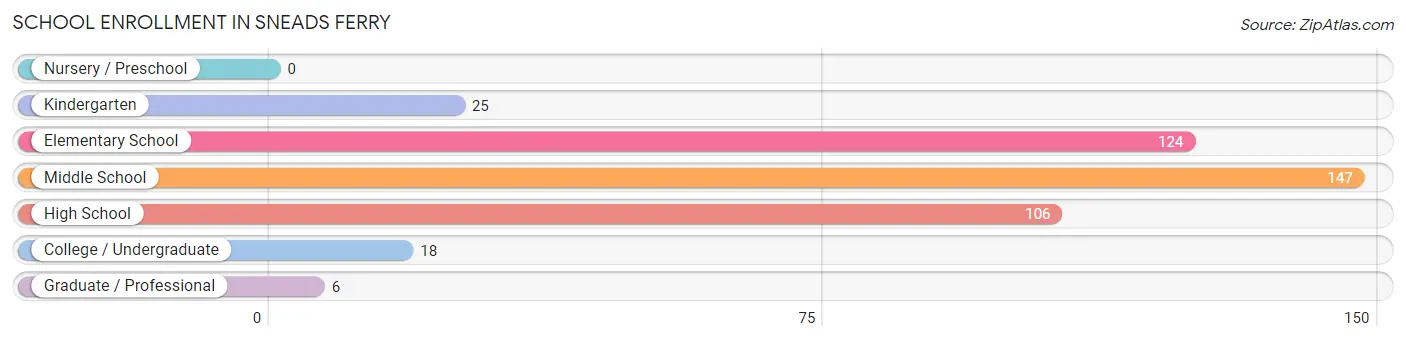
| School Level | # Students | % Students |
| Nursery / Preschool | 0 | 0.0% |
| Kindergarten | 25 | 5.9% |
| Elementary School | 124 | 29.1% |
| Middle School | 147 | 34.5% |
| High School | 106 | 24.9% |
| College / Undergraduate | 18 | 4.2% |
| Graduate / Professional | 6 | 1.4% |
| Total | 426 | 100.0% |
School Enrollment by Age by Funding Source in Sneads Ferry
Out of a total of 426 students who are enrolled in schools in Sneads Ferry, 48 (11.3%) attend a private institution, while the remaining 378 (88.7%) are enrolled in public schools. The age group of 5 to 9 year old has the highest likelihood of being enrolled in private schools, with 25 (19.8% in the age bracket) enrolled. Conversely, the age group of 15 to 17 year olds has the lowest likelihood of being enrolled in a private school, with 42 (100.0% in the age bracket) attending a public institution.
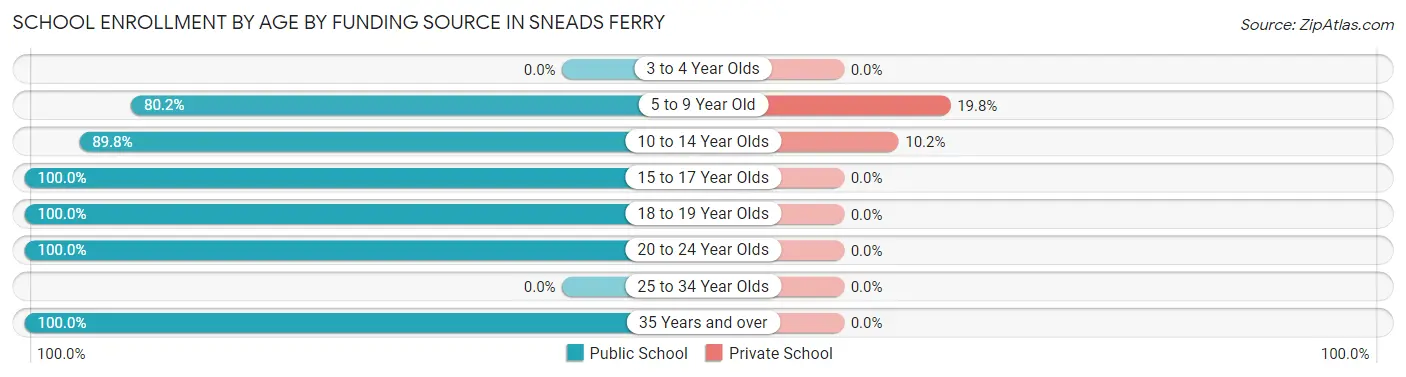
| Age Bracket | Public School | Private School |
| 3 to 4 Year Olds | 0 (0.0%) | 0 (0.0%) |
| 5 to 9 Year Old | 101 (80.2%) | 25 (19.8%) |
| 10 to 14 Year Olds | 203 (89.8%) | 23 (10.2%) |
| 15 to 17 Year Olds | 42 (100.0%) | 0 (0.0%) |
| 18 to 19 Year Olds | 8 (100.0%) | 0 (0.0%) |
| 20 to 24 Year Olds | 18 (100.0%) | 0 (0.0%) |
| 25 to 34 Year Olds | 0 (0.0%) | 0 (0.0%) |
| 35 Years and over | 6 (100.0%) | 0 (0.0%) |
| Total | 378 (88.7%) | 48 (11.3%) |
Educational Attainment by Field of Study in Sneads Ferry
Literature & languages (41 | 17.2%), arts & humanities (35 | 14.7%), bio, nature & agricultural (34 | 14.3%), business (21 | 8.8%), and visual & performing arts (21 | 8.8%) are the most common fields of study among 238 individuals in Sneads Ferry who have obtained a bachelor's degree or higher.
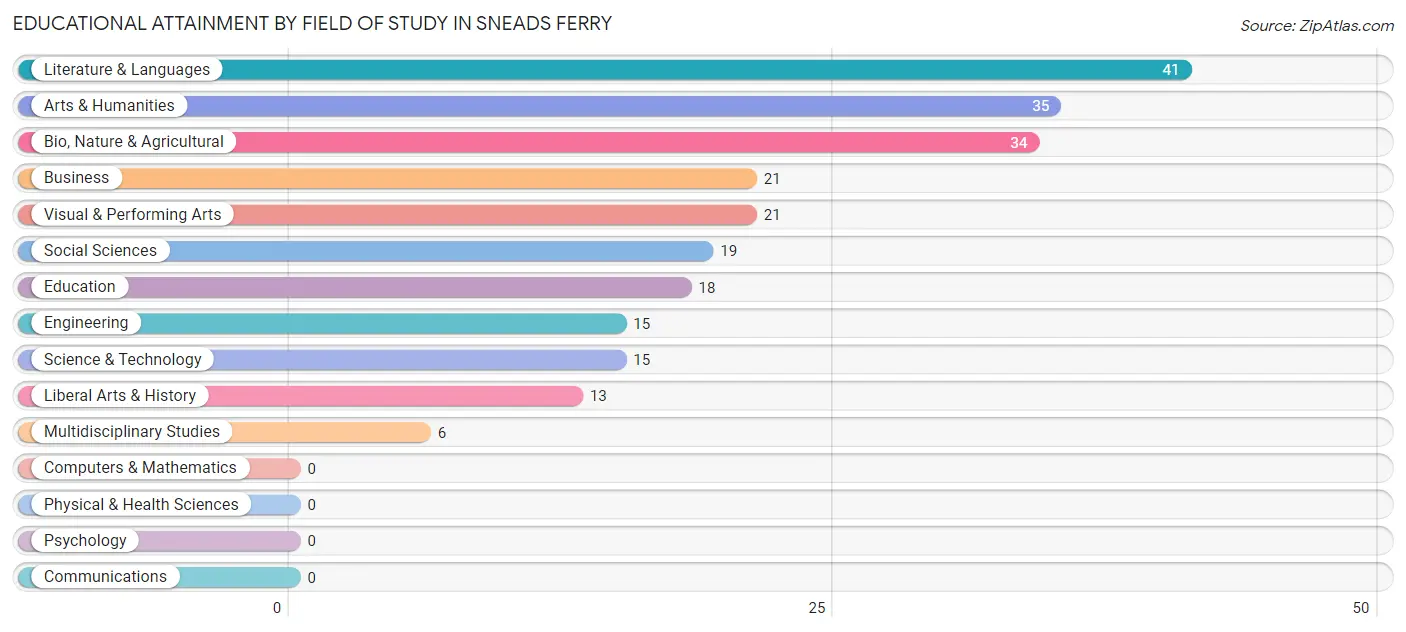
| Field of Study | # Graduates | % Graduates |
| Computers & Mathematics | 0 | 0.0% |
| Bio, Nature & Agricultural | 34 | 14.3% |
| Physical & Health Sciences | 0 | 0.0% |
| Psychology | 0 | 0.0% |
| Social Sciences | 19 | 8.0% |
| Engineering | 15 | 6.3% |
| Multidisciplinary Studies | 6 | 2.5% |
| Science & Technology | 15 | 6.3% |
| Business | 21 | 8.8% |
| Education | 18 | 7.6% |
| Literature & Languages | 41 | 17.2% |
| Liberal Arts & History | 13 | 5.5% |
| Visual & Performing Arts | 21 | 8.8% |
| Communications | 0 | 0.0% |
| Arts & Humanities | 35 | 14.7% |
| Total | 238 | 100.0% |
Transportation & Commute in Sneads Ferry
Vehicle Availability by Sex in Sneads Ferry
The most prevalent vehicle ownership categories in Sneads Ferry are males with 2 vehicles (286, accounting for 57.1%) and females with 2 vehicles (193, making up 58.7%).
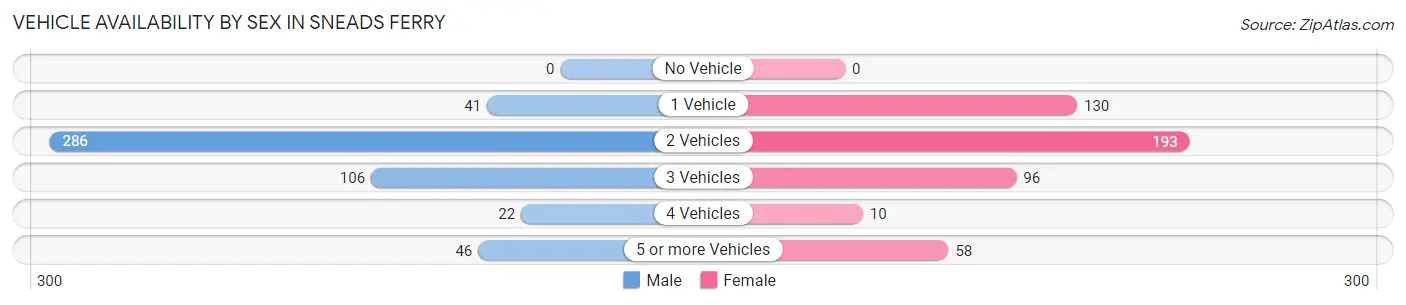
| Vehicles Available | Male | Female |
| No Vehicle | 0 (0.0%) | 0 (0.0%) |
| 1 Vehicle | 41 (8.2%) | 130 (26.7%) |
| 2 Vehicles | 286 (57.1%) | 193 (39.6%) |
| 3 Vehicles | 106 (21.2%) | 96 (19.7%) |
| 4 Vehicles | 22 (4.4%) | 10 (2.1%) |
| 5 or more Vehicles | 46 (9.2%) | 58 (11.9%) |
| Total | 501 (100.0%) | 487 (100.0%) |
Commute Time in Sneads Ferry
The most frequently occuring commute durations in Sneads Ferry are 10 to 14 minutes (258 commuters, 28.4%), 30 to 34 minutes (183 commuters, 20.2%), and 5 to 9 minutes (129 commuters, 14.2%).
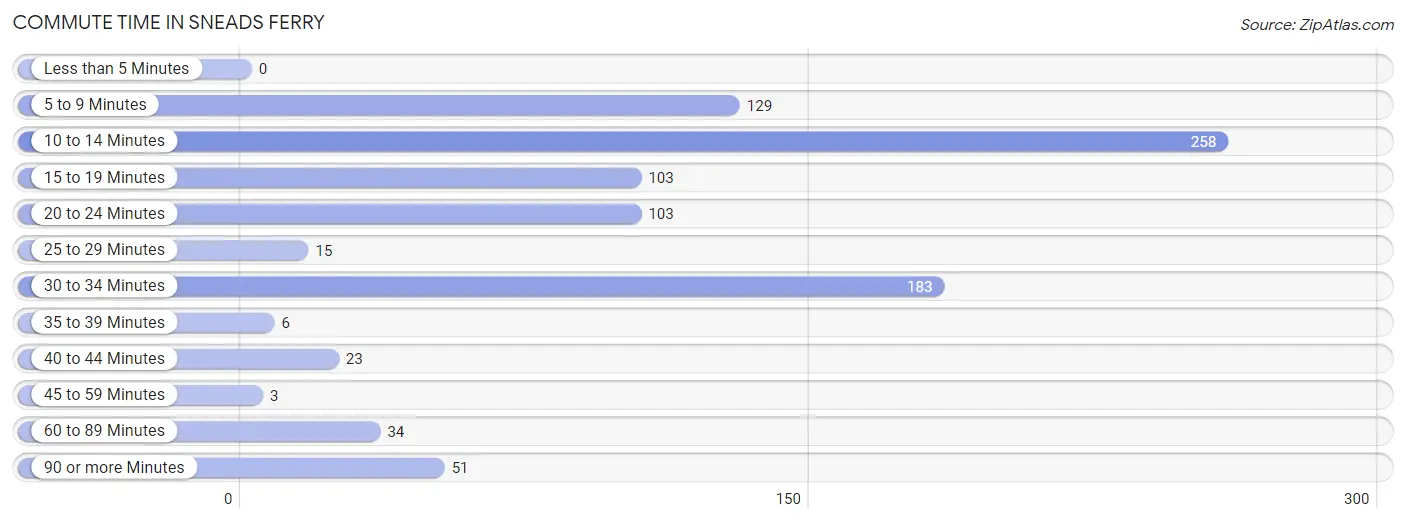
| Commute Time | # Commuters | % Commuters |
| Less than 5 Minutes | 0 | 0.0% |
| 5 to 9 Minutes | 129 | 14.2% |
| 10 to 14 Minutes | 258 | 28.4% |
| 15 to 19 Minutes | 103 | 11.3% |
| 20 to 24 Minutes | 103 | 11.3% |
| 25 to 29 Minutes | 15 | 1.7% |
| 30 to 34 Minutes | 183 | 20.2% |
| 35 to 39 Minutes | 6 | 0.7% |
| 40 to 44 Minutes | 23 | 2.5% |
| 45 to 59 Minutes | 3 | 0.3% |
| 60 to 89 Minutes | 34 | 3.7% |
| 90 or more Minutes | 51 | 5.6% |
Commute Time by Sex in Sneads Ferry
The most common commute times in Sneads Ferry are 5 to 9 minutes (121 commuters, 25.1%) for males and 10 to 14 minutes (156 commuters, 36.7%) for females.
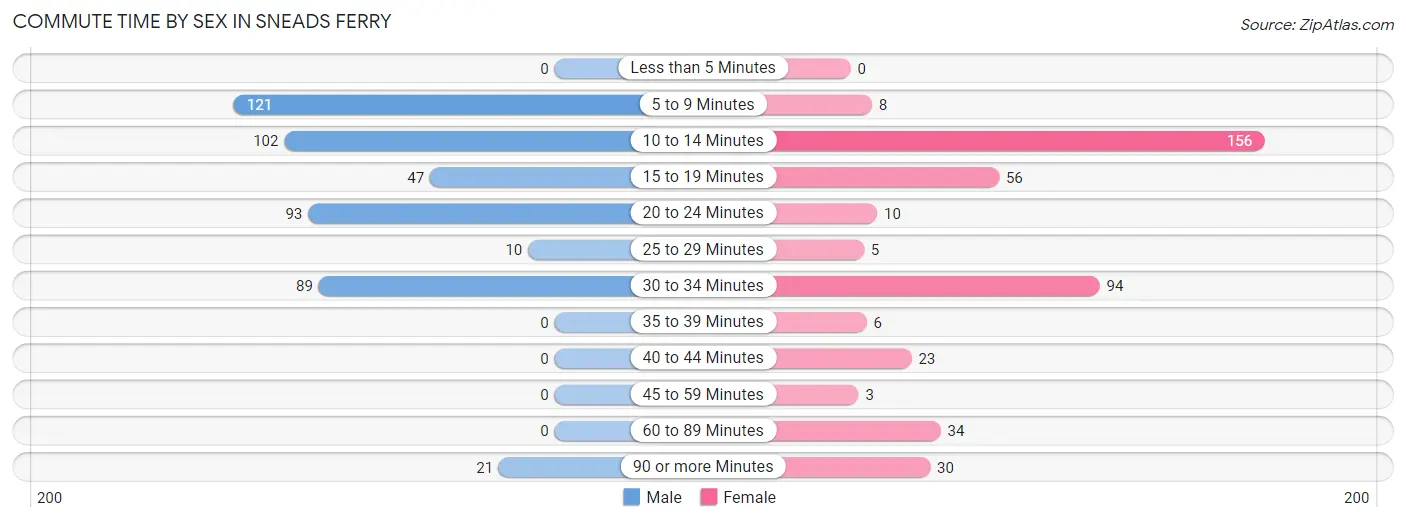
| Commute Time | Male | Female |
| Less than 5 Minutes | 0 (0.0%) | 0 (0.0%) |
| 5 to 9 Minutes | 121 (25.1%) | 8 (1.9%) |
| 10 to 14 Minutes | 102 (21.1%) | 156 (36.7%) |
| 15 to 19 Minutes | 47 (9.7%) | 56 (13.2%) |
| 20 to 24 Minutes | 93 (19.3%) | 10 (2.4%) |
| 25 to 29 Minutes | 10 (2.1%) | 5 (1.2%) |
| 30 to 34 Minutes | 89 (18.4%) | 94 (22.1%) |
| 35 to 39 Minutes | 0 (0.0%) | 6 (1.4%) |
| 40 to 44 Minutes | 0 (0.0%) | 23 (5.4%) |
| 45 to 59 Minutes | 0 (0.0%) | 3 (0.7%) |
| 60 to 89 Minutes | 0 (0.0%) | 34 (8.0%) |
| 90 or more Minutes | 21 (4.3%) | 30 (7.1%) |
Time of Departure to Work by Sex in Sneads Ferry
The most frequent times of departure to work in Sneads Ferry are 6:30 AM to 6:59 AM (140, 29.0%) for males and 7:30 AM to 7:59 AM (189, 44.5%) for females.
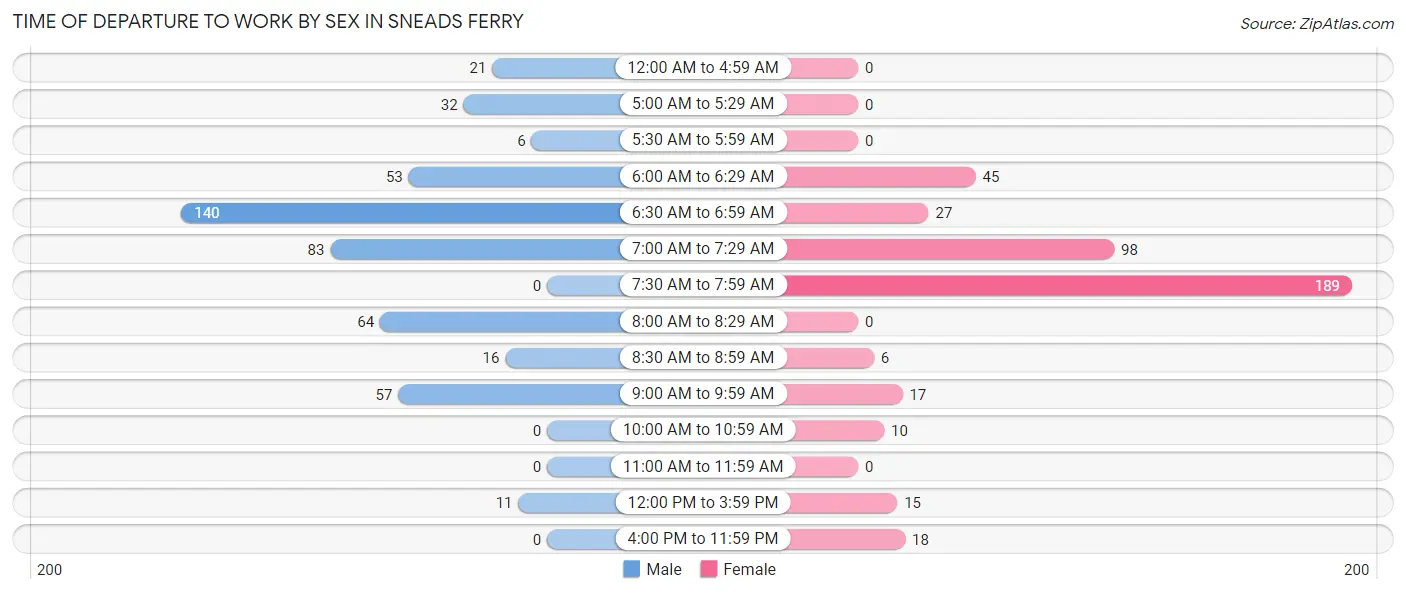
| Time of Departure | Male | Female |
| 12:00 AM to 4:59 AM | 21 (4.3%) | 0 (0.0%) |
| 5:00 AM to 5:29 AM | 32 (6.6%) | 0 (0.0%) |
| 5:30 AM to 5:59 AM | 6 (1.2%) | 0 (0.0%) |
| 6:00 AM to 6:29 AM | 53 (11.0%) | 45 (10.6%) |
| 6:30 AM to 6:59 AM | 140 (29.0%) | 27 (6.4%) |
| 7:00 AM to 7:29 AM | 83 (17.2%) | 98 (23.1%) |
| 7:30 AM to 7:59 AM | 0 (0.0%) | 189 (44.5%) |
| 8:00 AM to 8:29 AM | 64 (13.3%) | 0 (0.0%) |
| 8:30 AM to 8:59 AM | 16 (3.3%) | 6 (1.4%) |
| 9:00 AM to 9:59 AM | 57 (11.8%) | 17 (4.0%) |
| 10:00 AM to 10:59 AM | 0 (0.0%) | 10 (2.4%) |
| 11:00 AM to 11:59 AM | 0 (0.0%) | 0 (0.0%) |
| 12:00 PM to 3:59 PM | 11 (2.3%) | 15 (3.5%) |
| 4:00 PM to 11:59 PM | 0 (0.0%) | 18 (4.2%) |
| Total | 483 (100.0%) | 425 (100.0%) |
Housing Occupancy in Sneads Ferry
Occupancy by Ownership in Sneads Ferry
Of the total 1,078 dwellings in Sneads Ferry, owner-occupied units account for 832 (77.2%), while renter-occupied units make up 246 (22.8%).
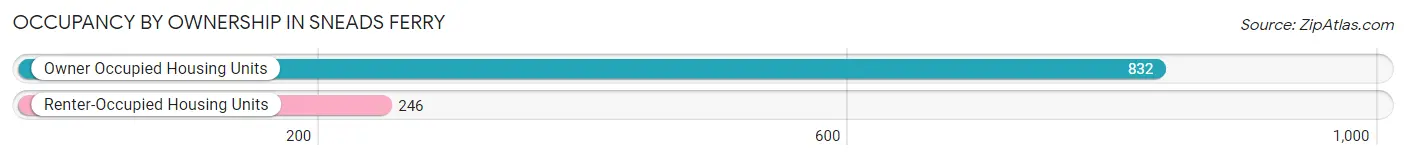
| Occupancy | # Housing Units | % Housing Units |
| Owner Occupied Housing Units | 832 | 77.2% |
| Renter-Occupied Housing Units | 246 | 22.8% |
| Total Occupied Housing Units | 1,078 | 100.0% |
Occupancy by Household Size in Sneads Ferry
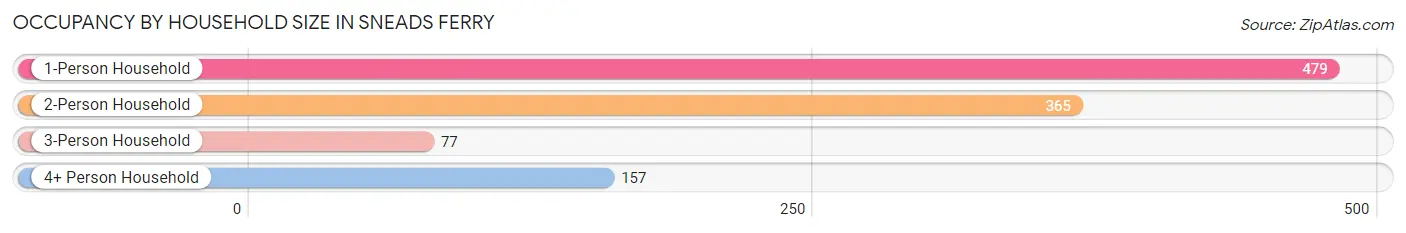
| Household Size | # Housing Units | % Housing Units |
| 1-Person Household | 479 | 44.4% |
| 2-Person Household | 365 | 33.9% |
| 3-Person Household | 77 | 7.1% |
| 4+ Person Household | 157 | 14.6% |
| Total Housing Units | 1,078 | 100.0% |
Occupancy by Ownership by Household Size in Sneads Ferry
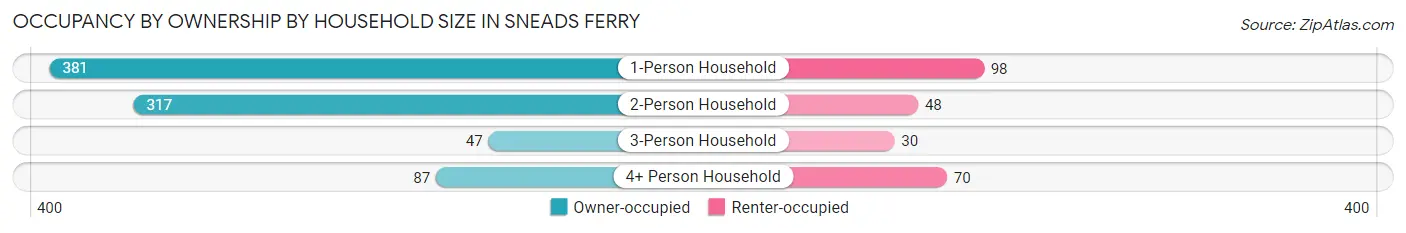
| Household Size | Owner-occupied | Renter-occupied |
| 1-Person Household | 381 (79.5%) | 98 (20.5%) |
| 2-Person Household | 317 (86.9%) | 48 (13.2%) |
| 3-Person Household | 47 (61.0%) | 30 (39.0%) |
| 4+ Person Household | 87 (55.4%) | 70 (44.6%) |
| Total Housing Units | 832 (77.2%) | 246 (22.8%) |
Occupancy by Educational Attainment in Sneads Ferry
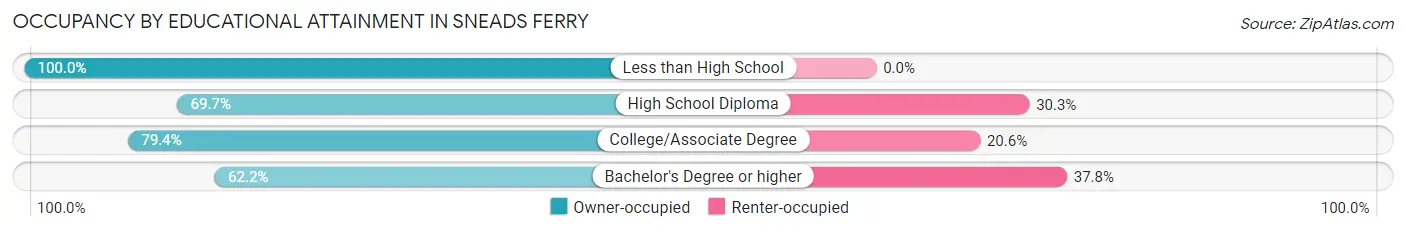
| Household Size | Owner-occupied | Renter-occupied |
| Less than High School | 164 (100.0%) | 0 (0.0%) |
| High School Diploma | 202 (69.7%) | 88 (30.3%) |
| College/Associate Degree | 359 (79.4%) | 93 (20.6%) |
| Bachelor's Degree or higher | 107 (62.2%) | 65 (37.8%) |
Occupancy by Age of Householder in Sneads Ferry
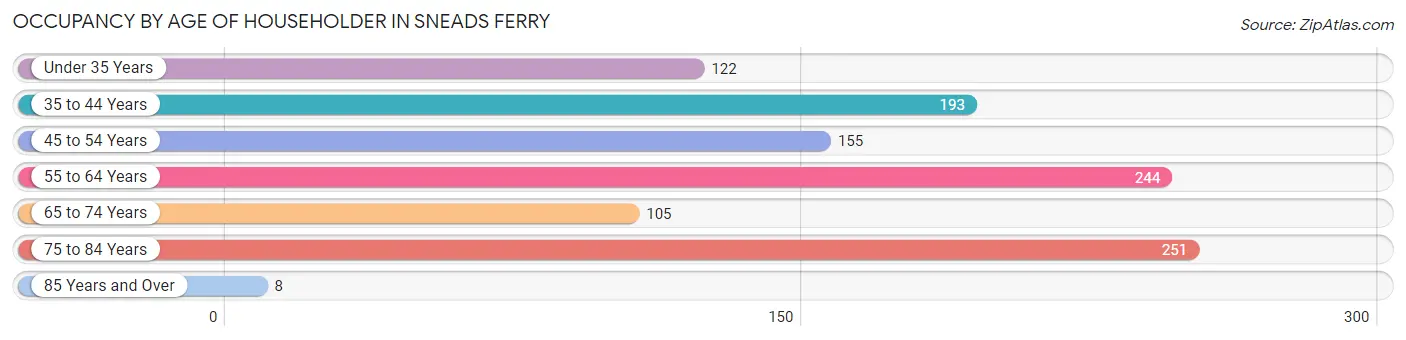
| Age Bracket | # Households | % Households |
| Under 35 Years | 122 | 11.3% |
| 35 to 44 Years | 193 | 17.9% |
| 45 to 54 Years | 155 | 14.4% |
| 55 to 64 Years | 244 | 22.6% |
| 65 to 74 Years | 105 | 9.7% |
| 75 to 84 Years | 251 | 23.3% |
| 85 Years and Over | 8 | 0.7% |
| Total | 1,078 | 100.0% |
Housing Finances in Sneads Ferry
Median Income by Occupancy in Sneads Ferry
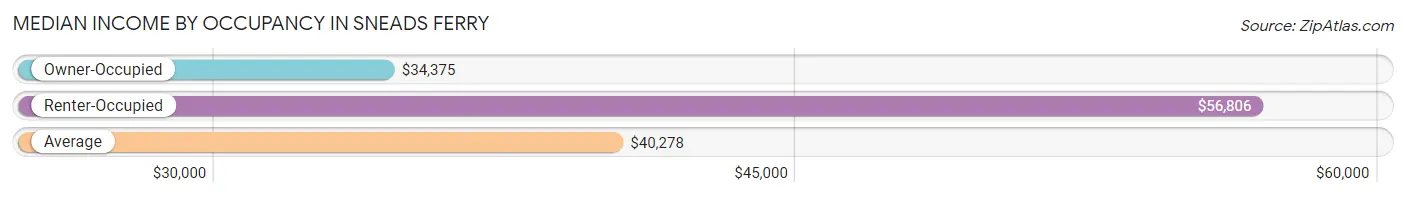
| Occupancy Type | # Households | Median Income |
| Owner-Occupied | 832 (77.2%) | $34,375 |
| Renter-Occupied | 246 (22.8%) | $56,806 |
| Average | 1,078 (100.0%) | $40,278 |
Occupancy by Householder Income Bracket in Sneads Ferry
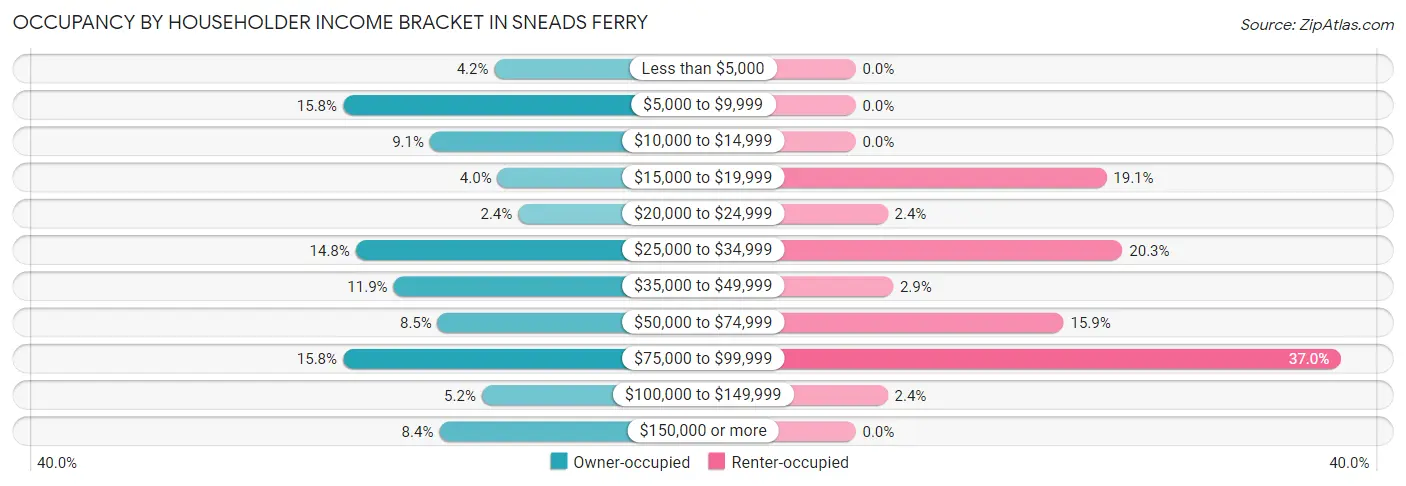
| Income Bracket | Owner-occupied | Renter-occupied |
| Less than $5,000 | 35 (4.2%) | 0 (0.0%) |
| $5,000 to $9,999 | 131 (15.8%) | 0 (0.0%) |
| $10,000 to $14,999 | 76 (9.1%) | 0 (0.0%) |
| $15,000 to $19,999 | 33 (4.0%) | 47 (19.1%) |
| $20,000 to $24,999 | 20 (2.4%) | 6 (2.4%) |
| $25,000 to $34,999 | 123 (14.8%) | 50 (20.3%) |
| $35,000 to $49,999 | 99 (11.9%) | 7 (2.9%) |
| $50,000 to $74,999 | 71 (8.5%) | 39 (15.9%) |
| $75,000 to $99,999 | 131 (15.8%) | 91 (37.0%) |
| $100,000 to $149,999 | 43 (5.2%) | 6 (2.4%) |
| $150,000 or more | 70 (8.4%) | 0 (0.0%) |
| Total | 832 (100.0%) | 246 (100.0%) |
Monthly Housing Cost Tiers in Sneads Ferry
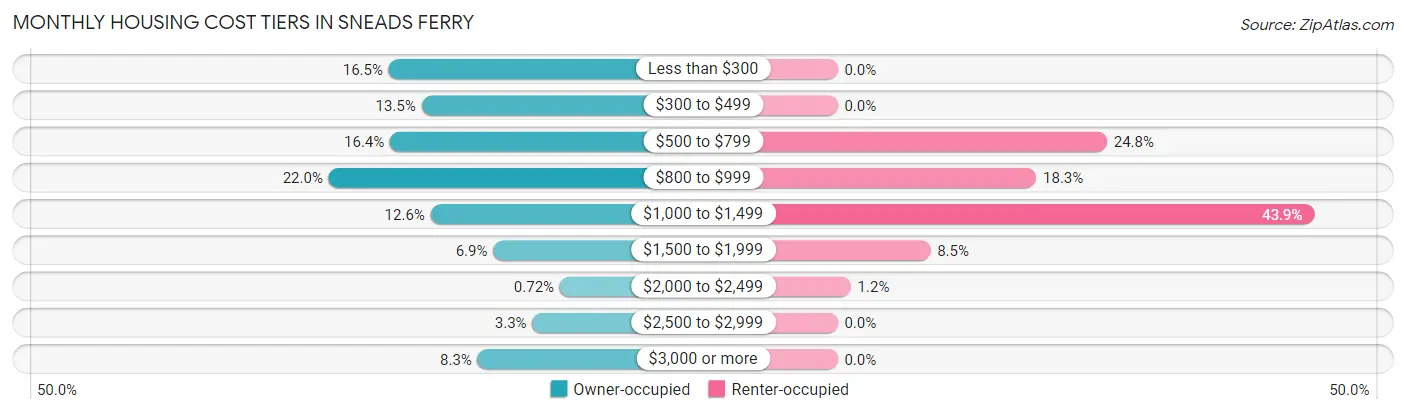
| Monthly Cost | Owner-occupied | Renter-occupied |
| Less than $300 | 137 (16.5%) | 0 (0.0%) |
| $300 to $499 | 112 (13.5%) | 0 (0.0%) |
| $500 to $799 | 136 (16.4%) | 61 (24.8%) |
| $800 to $999 | 183 (22.0%) | 45 (18.3%) |
| $1,000 to $1,499 | 105 (12.6%) | 108 (43.9%) |
| $1,500 to $1,999 | 57 (6.9%) | 21 (8.5%) |
| $2,000 to $2,499 | 6 (0.7%) | 3 (1.2%) |
| $2,500 to $2,999 | 27 (3.3%) | 0 (0.0%) |
| $3,000 or more | 69 (8.3%) | 0 (0.0%) |
| Total | 832 (100.0%) | 246 (100.0%) |
Physical Housing Characteristics in Sneads Ferry
Housing Structures in Sneads Ferry

| Structure Type | # Housing Units | % Housing Units |
| Single Unit, Detached | 690 | 64.0% |
| Single Unit, Attached | 67 | 6.2% |
| 2 Unit Apartments | 0 | 0.0% |
| 3 or 4 Unit Apartments | 18 | 1.7% |
| 5 to 9 Unit Apartments | 15 | 1.4% |
| 10 or more Apartments | 0 | 0.0% |
| Mobile Home / Other | 288 | 26.7% |
| Total | 1,078 | 100.0% |
Housing Structures by Occupancy in Sneads Ferry
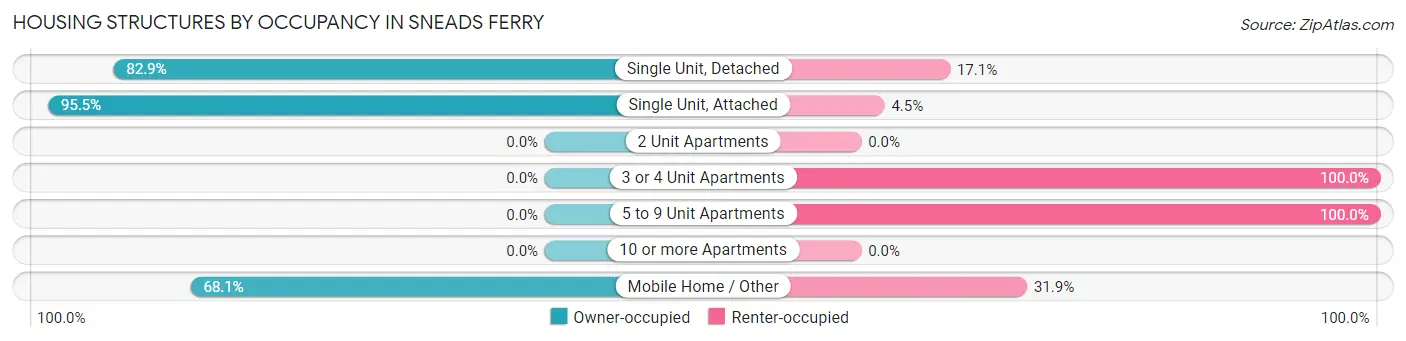
| Structure Type | Owner-occupied | Renter-occupied |
| Single Unit, Detached | 572 (82.9%) | 118 (17.1%) |
| Single Unit, Attached | 64 (95.5%) | 3 (4.5%) |
| 2 Unit Apartments | 0 (0.0%) | 0 (0.0%) |
| 3 or 4 Unit Apartments | 0 (0.0%) | 18 (100.0%) |
| 5 to 9 Unit Apartments | 0 (0.0%) | 15 (100.0%) |
| 10 or more Apartments | 0 (0.0%) | 0 (0.0%) |
| Mobile Home / Other | 196 (68.1%) | 92 (31.9%) |
| Total | 832 (77.2%) | 246 (22.8%) |
Housing Structures by Number of Rooms in Sneads Ferry
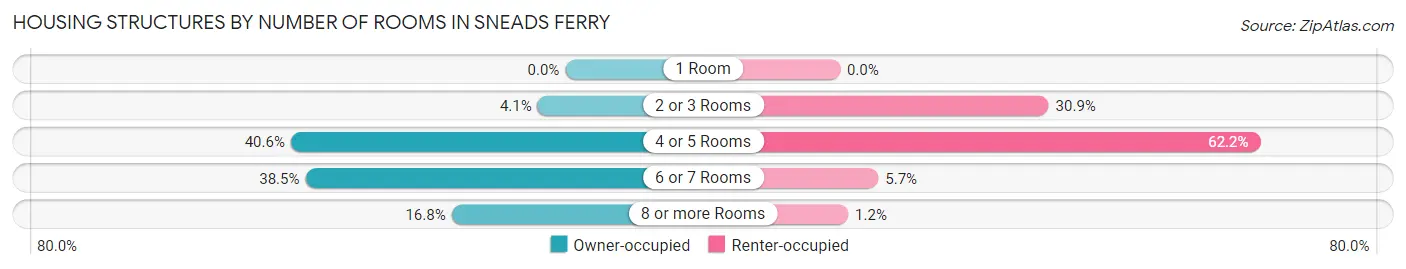
| Number of Rooms | Owner-occupied | Renter-occupied |
| 1 Room | 0 (0.0%) | 0 (0.0%) |
| 2 or 3 Rooms | 34 (4.1%) | 76 (30.9%) |
| 4 or 5 Rooms | 338 (40.6%) | 153 (62.2%) |
| 6 or 7 Rooms | 320 (38.5%) | 14 (5.7%) |
| 8 or more Rooms | 140 (16.8%) | 3 (1.2%) |
| Total | 832 (100.0%) | 246 (100.0%) |
Housing Structure by Heating Type in Sneads Ferry
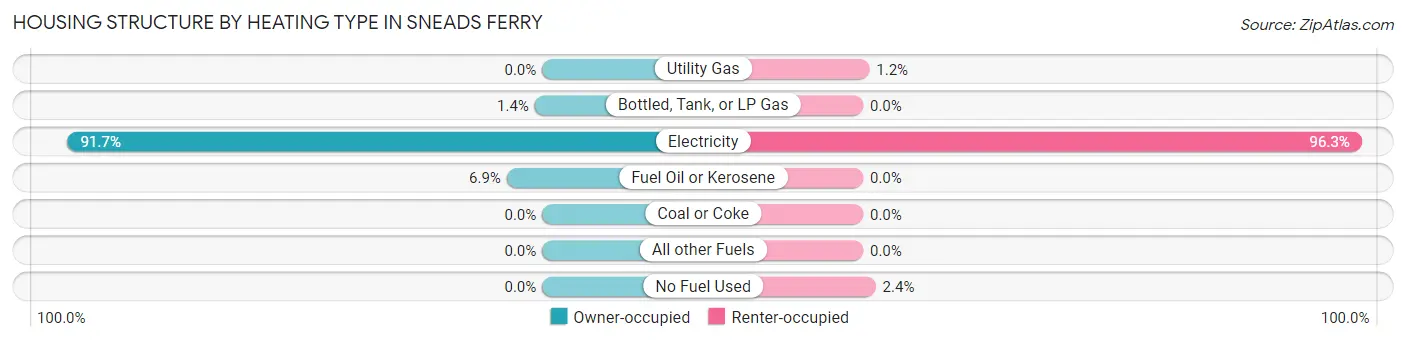
| Heating Type | Owner-occupied | Renter-occupied |
| Utility Gas | 0 (0.0%) | 3 (1.2%) |
| Bottled, Tank, or LP Gas | 12 (1.4%) | 0 (0.0%) |
| Electricity | 763 (91.7%) | 237 (96.3%) |
| Fuel Oil or Kerosene | 57 (6.9%) | 0 (0.0%) |
| Coal or Coke | 0 (0.0%) | 0 (0.0%) |
| All other Fuels | 0 (0.0%) | 0 (0.0%) |
| No Fuel Used | 0 (0.0%) | 6 (2.4%) |
| Total | 832 (100.0%) | 246 (100.0%) |
Household Vehicle Usage in Sneads Ferry
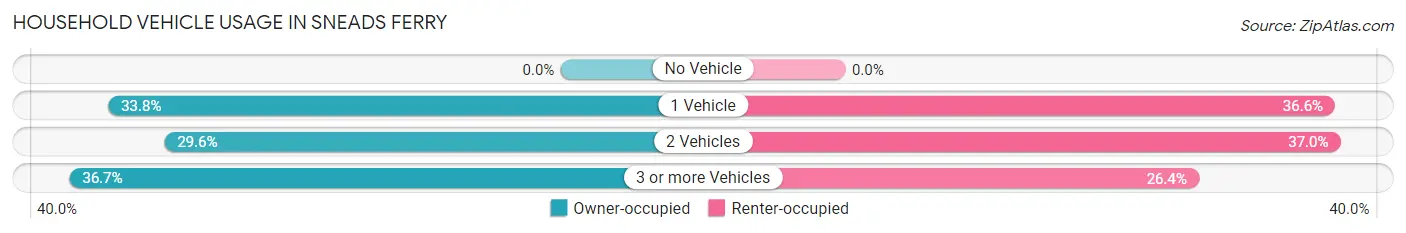
| Vehicles per Household | Owner-occupied | Renter-occupied |
| No Vehicle | 0 (0.0%) | 0 (0.0%) |
| 1 Vehicle | 281 (33.8%) | 90 (36.6%) |
| 2 Vehicles | 246 (29.6%) | 91 (37.0%) |
| 3 or more Vehicles | 305 (36.7%) | 65 (26.4%) |
| Total | 832 (100.0%) | 246 (100.0%) |
Real Estate & Mortgages in Sneads Ferry
Real Estate and Mortgage Overview in Sneads Ferry
| Characteristic | Without Mortgage | With Mortgage |
| Housing Units | 383 | 449 |
| Median Property Value | - | - |
| Median Household Income | $28,920 | $45 |
| Monthly Housing Costs | $388 | $69 |
| Real Estate Taxes | - | - |
Property Value by Mortgage Status in Sneads Ferry
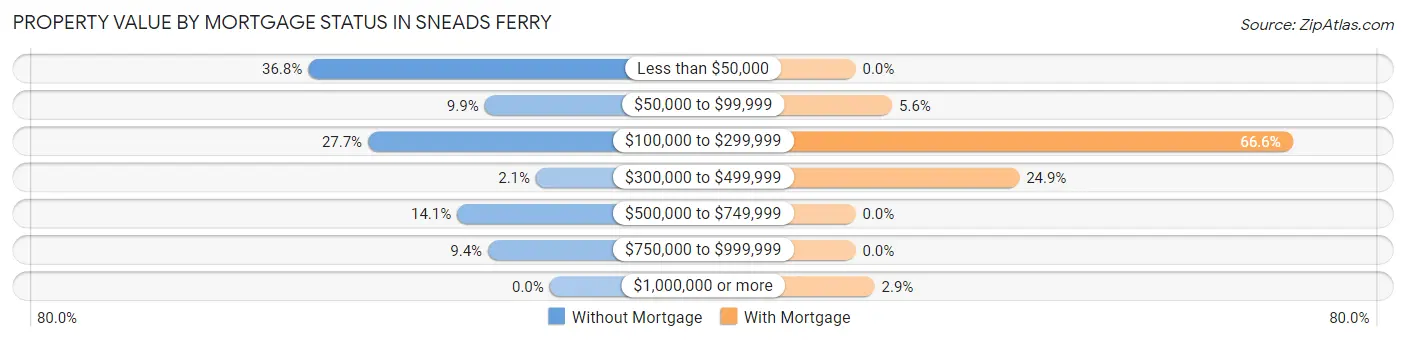
| Property Value | Without Mortgage | With Mortgage |
| Less than $50,000 | 141 (36.8%) | 0 (0.0%) |
| $50,000 to $99,999 | 38 (9.9%) | 25 (5.6%) |
| $100,000 to $299,999 | 106 (27.7%) | 299 (66.6%) |
| $300,000 to $499,999 | 8 (2.1%) | 112 (24.9%) |
| $500,000 to $749,999 | 54 (14.1%) | 0 (0.0%) |
| $750,000 to $999,999 | 36 (9.4%) | 0 (0.0%) |
| $1,000,000 or more | 0 (0.0%) | 13 (2.9%) |
| Total | 383 (100.0%) | 449 (100.0%) |
Household Income by Mortgage Status in Sneads Ferry
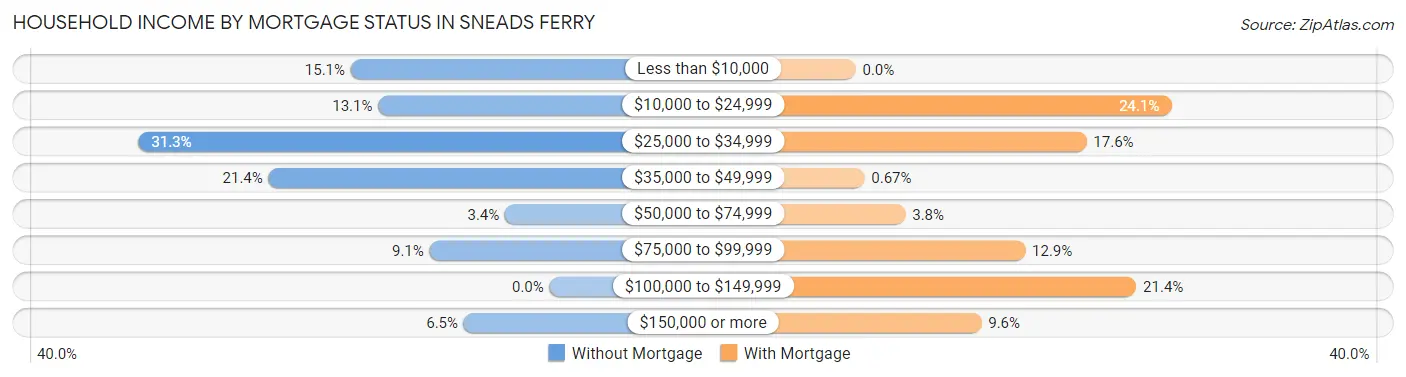
| Household Income | Without Mortgage | With Mortgage |
| Less than $10,000 | 58 (15.1%) | 0 (0.0%) |
| $10,000 to $24,999 | 50 (13.1%) | 108 (24.0%) |
| $25,000 to $34,999 | 120 (31.3%) | 79 (17.6%) |
| $35,000 to $49,999 | 82 (21.4%) | 3 (0.7%) |
| $50,000 to $74,999 | 13 (3.4%) | 17 (3.8%) |
| $75,000 to $99,999 | 35 (9.1%) | 58 (12.9%) |
| $100,000 to $149,999 | 0 (0.0%) | 96 (21.4%) |
| $150,000 or more | 25 (6.5%) | 43 (9.6%) |
| Total | 383 (100.0%) | 449 (100.0%) |
Property Value to Household Income Ratio in Sneads Ferry
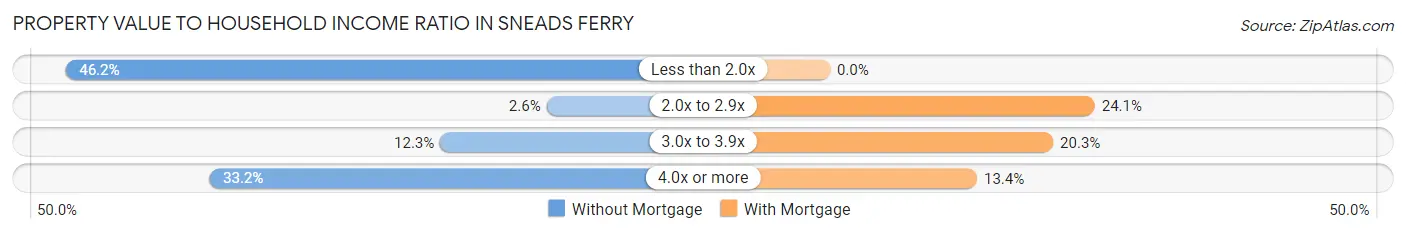
| Value-to-Income Ratio | Without Mortgage | With Mortgage |
| Less than 2.0x | 177 (46.2%) | 0 (0.0%) |
| 2.0x to 2.9x | 10 (2.6%) | 108 (24.0%) |
| 3.0x to 3.9x | 47 (12.3%) | 91 (20.3%) |
| 4.0x or more | 127 (33.2%) | 60 (13.4%) |
| Total | 383 (100.0%) | 449 (100.0%) |
Real Estate Taxes by Mortgage Status in Sneads Ferry
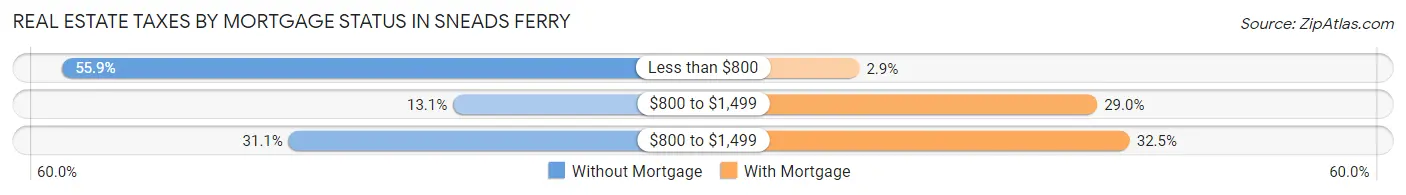
| Property Taxes | Without Mortgage | With Mortgage |
| Less than $800 | 214 (55.9%) | 13 (2.9%) |
| $800 to $1,499 | 50 (13.1%) | 130 (28.9%) |
| $800 to $1,499 | 119 (31.1%) | 146 (32.5%) |
| Total | 383 (100.0%) | 449 (100.0%) |
Health & Disability in Sneads Ferry
Health Insurance Coverage by Age in Sneads Ferry
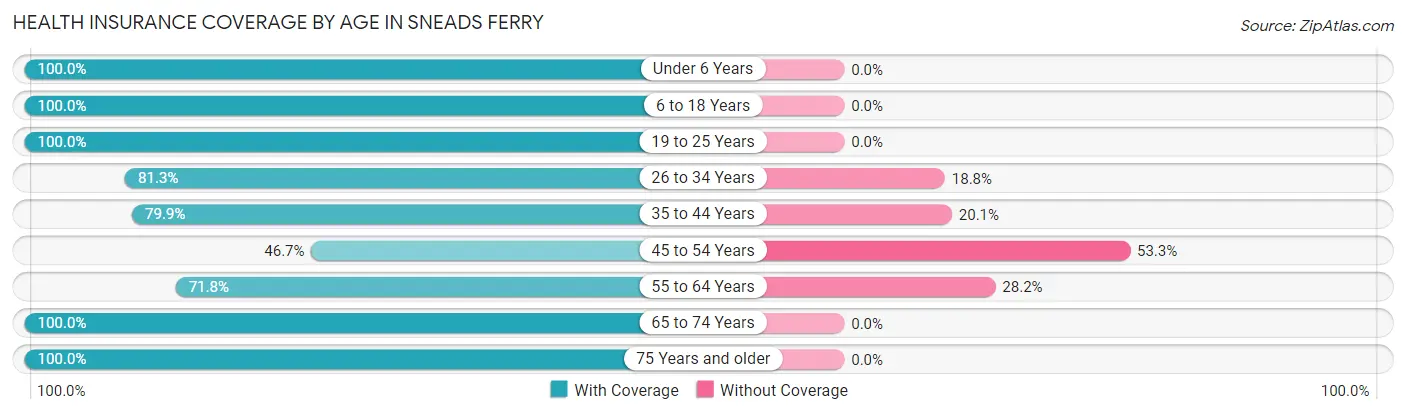
| Age Bracket | With Coverage | Without Coverage |
| Under 6 Years | 14 (100.0%) | 0 (0.0%) |
| 6 to 18 Years | 401 (100.0%) | 0 (0.0%) |
| 19 to 25 Years | 52 (100.0%) | 0 (0.0%) |
| 26 to 34 Years | 130 (81.2%) | 30 (18.8%) |
| 35 to 44 Years | 251 (79.9%) | 63 (20.1%) |
| 45 to 54 Years | 149 (46.7%) | 170 (53.3%) |
| 55 to 64 Years | 237 (71.8%) | 93 (28.2%) |
| 65 to 74 Years | 167 (100.0%) | 0 (0.0%) |
| 75 Years and older | 304 (100.0%) | 0 (0.0%) |
| Total | 1,705 (82.7%) | 356 (17.3%) |
Health Insurance Coverage by Citizenship Status in Sneads Ferry
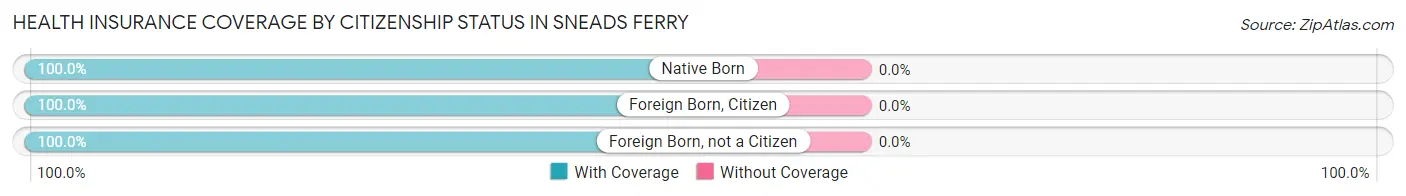
| Citizenship Status | With Coverage | Without Coverage |
| Native Born | 14 (100.0%) | 0 (0.0%) |
| Foreign Born, Citizen | 401 (100.0%) | 0 (0.0%) |
| Foreign Born, not a Citizen | 52 (100.0%) | 0 (0.0%) |
Health Insurance Coverage by Household Income in Sneads Ferry
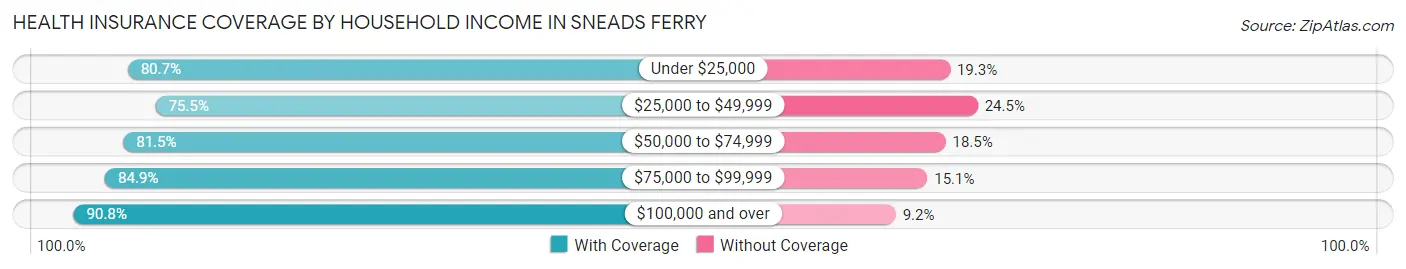
| Household Income | With Coverage | Without Coverage |
| Under $25,000 | 359 (80.7%) | 86 (19.3%) |
| $25,000 to $49,999 | 320 (75.5%) | 104 (24.5%) |
| $50,000 to $74,999 | 163 (81.5%) | 37 (18.5%) |
| $75,000 to $99,999 | 546 (84.9%) | 97 (15.1%) |
| $100,000 and over | 317 (90.8%) | 32 (9.2%) |
Public vs Private Health Insurance Coverage by Age in Sneads Ferry
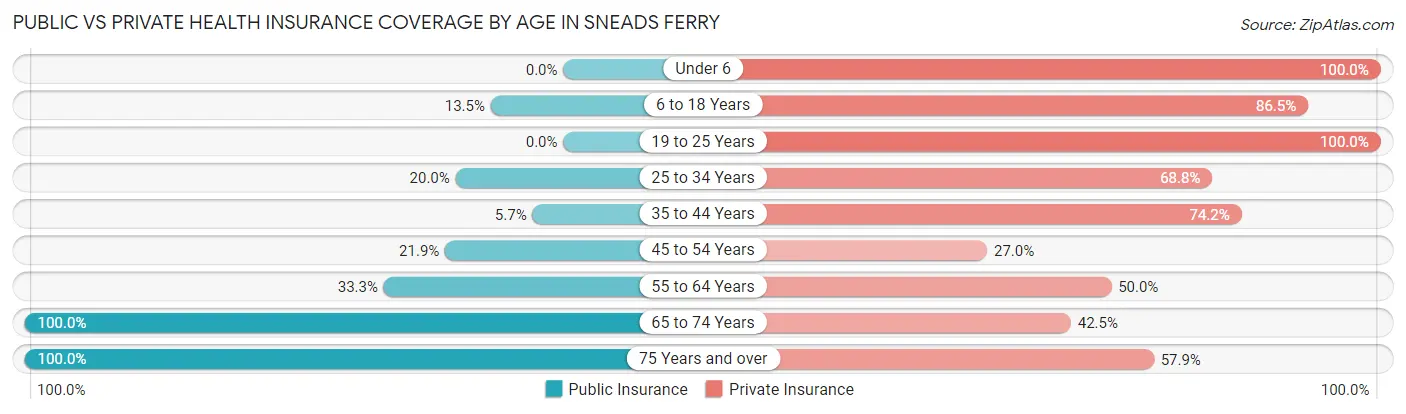
| Age Bracket | Public Insurance | Private Insurance |
| Under 6 | 0 (0.0%) | 14 (100.0%) |
| 6 to 18 Years | 54 (13.5%) | 347 (86.5%) |
| 19 to 25 Years | 0 (0.0%) | 52 (100.0%) |
| 25 to 34 Years | 32 (20.0%) | 110 (68.8%) |
| 35 to 44 Years | 18 (5.7%) | 233 (74.2%) |
| 45 to 54 Years | 70 (21.9%) | 86 (27.0%) |
| 55 to 64 Years | 110 (33.3%) | 165 (50.0%) |
| 65 to 74 Years | 167 (100.0%) | 71 (42.5%) |
| 75 Years and over | 304 (100.0%) | 176 (57.9%) |
| Total | 755 (36.6%) | 1,254 (60.8%) |
Disability Status by Sex by Age in Sneads Ferry
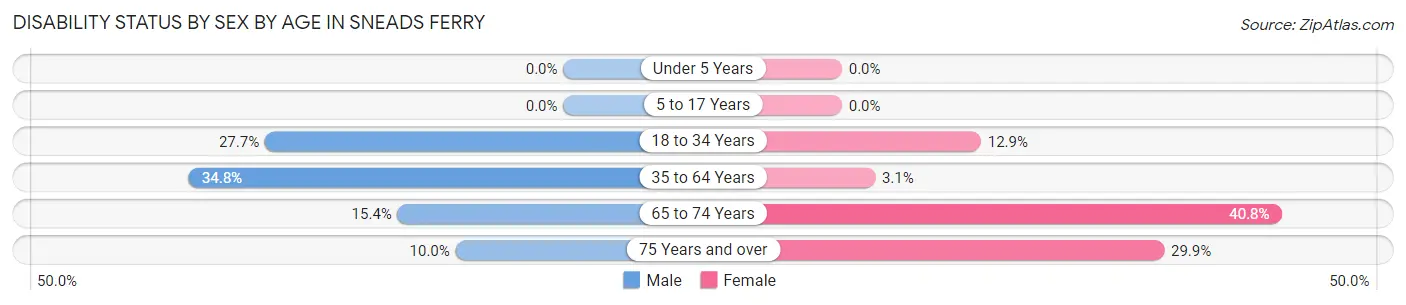
| Age Bracket | Male | Female |
| Under 5 Years | 0 (0.0%) | 0 (0.0%) |
| 5 to 17 Years | 0 (0.0%) | 0 (0.0%) |
| 18 to 34 Years | 18 (27.7%) | 20 (12.9%) |
| 35 to 64 Years | 188 (34.7%) | 13 (3.1%) |
| 65 to 74 Years | 14 (15.4%) | 31 (40.8%) |
| 75 Years and over | 8 (10.0%) | 67 (29.9%) |
Disability Class by Sex by Age in Sneads Ferry
Disability Class: Hearing Difficulty
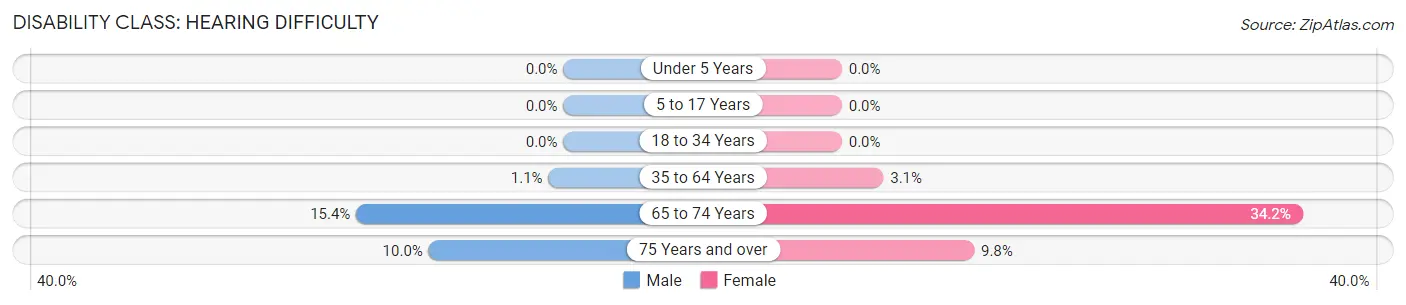
| Age Bracket | Male | Female |
| Under 5 Years | 0 (0.0%) | 0 (0.0%) |
| 5 to 17 Years | 0 (0.0%) | 0 (0.0%) |
| 18 to 34 Years | 0 (0.0%) | 0 (0.0%) |
| 35 to 64 Years | 6 (1.1%) | 13 (3.1%) |
| 65 to 74 Years | 14 (15.4%) | 26 (34.2%) |
| 75 Years and over | 8 (10.0%) | 22 (9.8%) |
Disability Class: Vision Difficulty
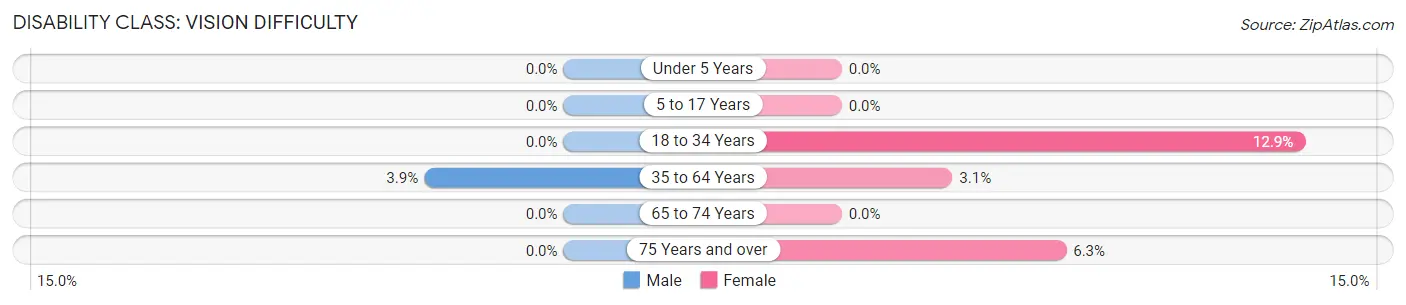
| Age Bracket | Male | Female |
| Under 5 Years | 0 (0.0%) | 0 (0.0%) |
| 5 to 17 Years | 0 (0.0%) | 0 (0.0%) |
| 18 to 34 Years | 0 (0.0%) | 20 (12.9%) |
| 35 to 64 Years | 21 (3.9%) | 13 (3.1%) |
| 65 to 74 Years | 0 (0.0%) | 0 (0.0%) |
| 75 Years and over | 0 (0.0%) | 14 (6.2%) |
Disability Class: Cognitive Difficulty

| Age Bracket | Male | Female |
| 5 to 17 Years | 0 (0.0%) | 0 (0.0%) |
| 18 to 34 Years | 18 (27.7%) | 0 (0.0%) |
| 35 to 64 Years | 46 (8.5%) | 0 (0.0%) |
| 65 to 74 Years | 0 (0.0%) | 0 (0.0%) |
| 75 Years and over | 0 (0.0%) | 14 (6.2%) |
Disability Class: Ambulatory Difficulty
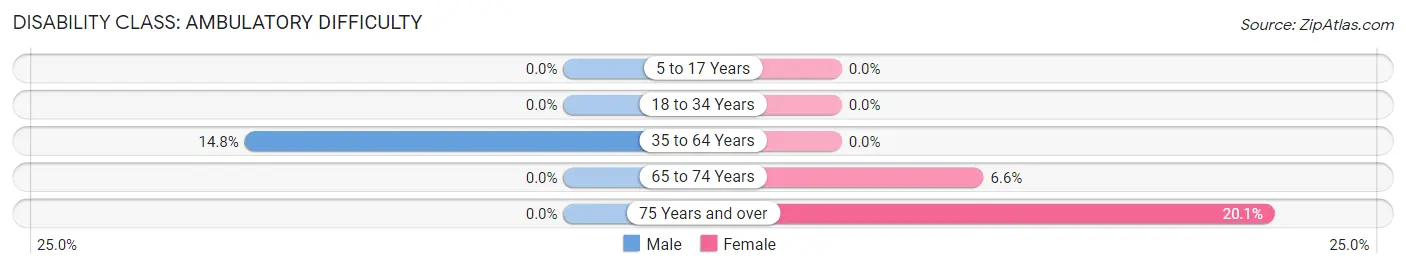
| Age Bracket | Male | Female |
| 5 to 17 Years | 0 (0.0%) | 0 (0.0%) |
| 18 to 34 Years | 0 (0.0%) | 0 (0.0%) |
| 35 to 64 Years | 80 (14.8%) | 0 (0.0%) |
| 65 to 74 Years | 0 (0.0%) | 5 (6.6%) |
| 75 Years and over | 0 (0.0%) | 45 (20.1%) |
Disability Class: Self-Care Difficulty
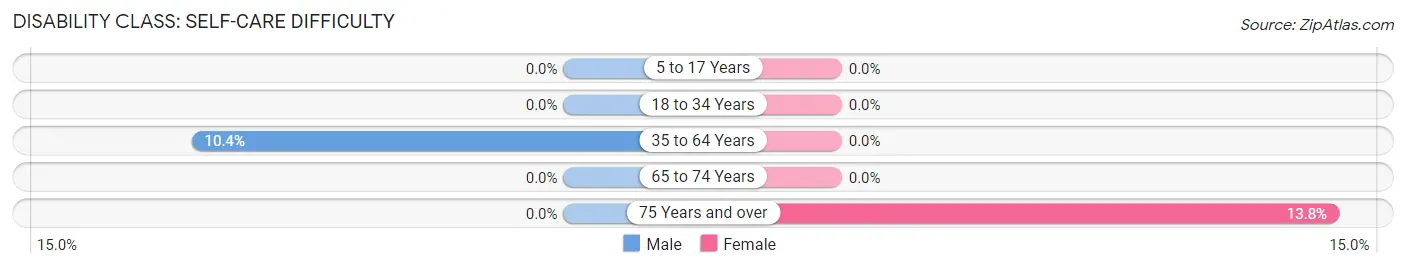
| Age Bracket | Male | Female |
| 5 to 17 Years | 0 (0.0%) | 0 (0.0%) |
| 18 to 34 Years | 0 (0.0%) | 0 (0.0%) |
| 35 to 64 Years | 56 (10.3%) | 0 (0.0%) |
| 65 to 74 Years | 0 (0.0%) | 0 (0.0%) |
| 75 Years and over | 0 (0.0%) | 31 (13.8%) |
Technology Access in Sneads Ferry
Computing Device Access in Sneads Ferry
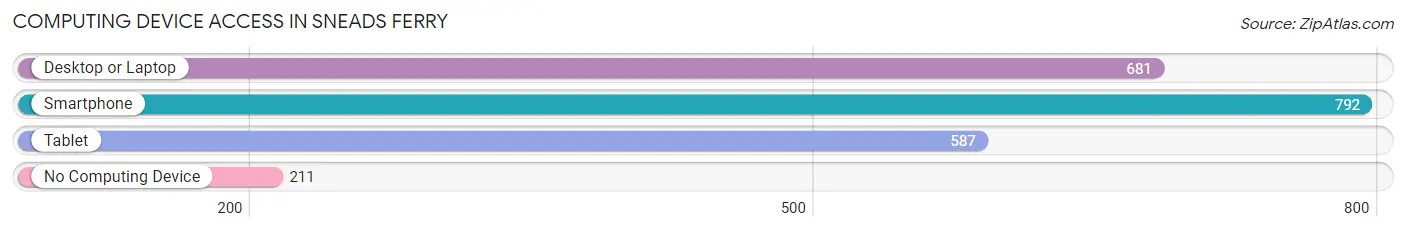
| Device Type | # Households | % Households |
| Desktop or Laptop | 681 | 63.2% |
| Smartphone | 792 | 73.5% |
| Tablet | 587 | 54.4% |
| No Computing Device | 211 | 19.6% |
| Total | 1,078 | 100.0% |
Internet Access in Sneads Ferry
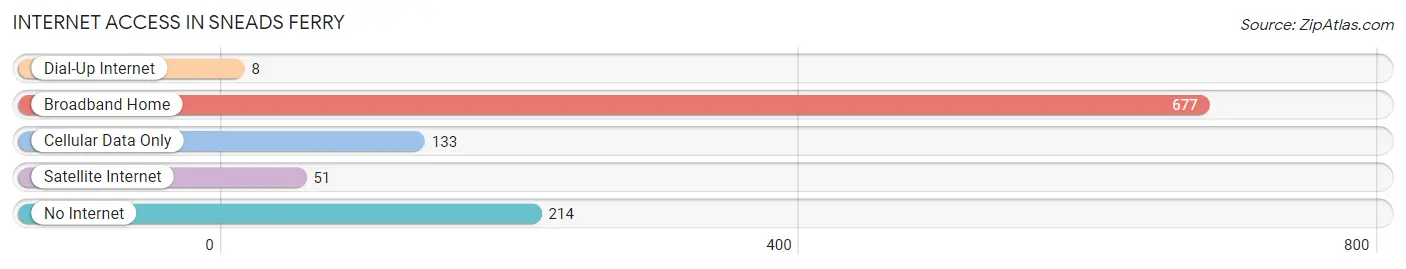
| Internet Type | # Households | % Households |
| Dial-Up Internet | 8 | 0.7% |
| Broadband Home | 677 | 62.8% |
| Cellular Data Only | 133 | 12.3% |
| Satellite Internet | 51 | 4.7% |
| No Internet | 214 | 19.9% |
| Total | 1,078 | 100.0% |
Sneads Ferry Summary
Sneads Ferry is a small town located in Onslow County, North Carolina. It is situated on the New River, which is part of the Intracoastal Waterway. The town is located approximately 30 miles north of Wilmington and is part of the Jacksonville, North Carolina metropolitan area. The population of Sneads Ferry was estimated to be 3,845 in 2019.
Geography
Sneads Ferry is located in the southeastern corner of Onslow County, North Carolina. It is situated on the New River, which is part of the Intracoastal Waterway. The town is located approximately 30 miles north of Wilmington and is part of the Jacksonville, North Carolina metropolitan area. The town is bordered by the towns of Holly Ridge to the north, North Topsail Beach to the east, and Surf City to the south. The town is located on the Atlantic Coastal Plain and is characterized by flat terrain and sandy soils. The town is located in the humid subtropical climate zone and experiences hot, humid summers and mild winters.
History
Sneads Ferry was first settled in the late 1700s by a group of settlers from Scotland. The town was named after a ferry service that operated on the New River. The ferry service was operated by a man named John Snead, who was the first settler in the area. The town was officially incorporated in 1883.
In the early 1900s, the town was a popular vacation destination for people from nearby cities. The town was known for its fishing and hunting opportunities, as well as its beautiful beaches. The town was also home to a number of resorts and hotels.
In the 1950s, the town began to experience a decline in tourism due to the development of nearby cities such as Wilmington and Jacksonville. The town also experienced a decline in its fishing and hunting industries due to overfishing and overhunting.
In the late 1970s, the town began to experience a resurgence in tourism due to the development of nearby beaches and resorts. The town also experienced a resurgence in its fishing and hunting industries due to the development of new regulations and conservation efforts.
Economy
The economy of Sneads Ferry is largely based on tourism and the fishing and hunting industries. The town is home to a number of resorts and hotels, as well as a number of restaurants and shops. The town is also home to a number of marinas and boat ramps, which provide access to the Intracoastal Waterway.
The town is also home to a number of military installations, including Camp Lejeune and the Marine Corps Air Station New River. These installations provide a significant number of jobs to the local economy.
Demographics
The population of Sneads Ferry was estimated to be 3,845 in 2019. The town has a population that is largely white (90.3%) and African American (7.2%). The median household income in the town is $45,945 and the median age is 37.3 years. The town has a poverty rate of 11.3%.
Conclusion
Sneads Ferry is a small town located in Onslow County, North Carolina. It is situated on the New River, which is part of the Intracoastal Waterway. The town is located approximately 30 miles north of Wilmington and is part of the Jacksonville, North Carolina metropolitan area. The population of Sneads Ferry was estimated to be 3,845 in 2019. The town has a largely white population and a median household income of $45,945. The economy of the town is largely based on tourism and the fishing and hunting industries. The town is also home to a number of military installations, which provide a significant number of jobs to the local economy.
Common Questions
What is Per Capita Income in Sneads Ferry?
Per Capita income in Sneads Ferry is $27,848.
What is the Median Family Income in Sneads Ferry?
Median Family Income in Sneads Ferry is $79,175.
What is the Median Household income in Sneads Ferry?
Median Household Income in Sneads Ferry is $40,278.
What is Income or Wage Gap in Sneads Ferry?
Income or Wage Gap in Sneads Ferry is 8.3%.
Women in Sneads Ferry earn 91.7 cents for every dollar earned by a man.
What is Inequality or Gini Index in Sneads Ferry?
Inequality or Gini Index in Sneads Ferry is 0.47.
What is the Total Population of Sneads Ferry?
Total Population of Sneads Ferry is 2,140.
What is the Total Male Population of Sneads Ferry?
Total Male Population of Sneads Ferry is 1,100.
What is the Total Female Population of Sneads Ferry?
Total Female Population of Sneads Ferry is 1,040.
What is the Ratio of Males per 100 Females in Sneads Ferry?
There are 105.77 Males per 100 Females in Sneads Ferry.
What is the Ratio of Females per 100 Males in Sneads Ferry?
There are 94.55 Females per 100 Males in Sneads Ferry.
What is the Median Population Age in Sneads Ferry?
Median Population Age in Sneads Ferry is 50.3 Years.
What is the Average Family Size in Sneads Ferry
Average Family Size in Sneads Ferry is 2.8 People.
What is the Average Household Size in Sneads Ferry
Average Household Size in Sneads Ferry is 2.0 People.
How Large is the Labor Force in Sneads Ferry?
There are 1,061 People in the Labor Forcein in Sneads Ferry.
What is the Percentage of People in the Labor Force in Sneads Ferry?
60.2% of People are in the Labor Force in Sneads Ferry.