Scenic Oaks, TX Map & Demographics
Scenic Oaks Map
Scenic Oaks Overview
$62,288
PER CAPITA INCOME
$189,649
AVG FAMILY INCOME
$182,063
AVG HOUSEHOLD INCOME
64.2%
WAGE / INCOME GAP [ % ]
35.8¢/ $1
WAGE / INCOME GAP [ $ ]
0.36
INEQUALITY / GINI INDEX
10,059
TOTAL POPULATION
4,652
MALE POPULATION
5,407
FEMALE POPULATION
86.04
MALES / 100 FEMALES
116.23
FEMALES / 100 MALES
40.5
MEDIAN AGE
3.1
AVG FAMILY SIZE
2.9
AVG HOUSEHOLD SIZE
4,540
LABOR FORCE [ PEOPLE ]
59.1%
PERCENT IN LABOR FORCE
3.0%
UNEMPLOYMENT RATE
Income in Scenic Oaks
Income Overview in Scenic Oaks
Per Capita Income in Scenic Oaks is $62,288, while median incomes of families and households are $189,649 and $182,063 respectively.
| Characteristic | Number | Measure |
| Per Capita Income | 10,059 | $62,288 |
| Median Family Income | 2,962 | $189,649 |
| Mean Family Income | 2,962 | $190,128 |
| Median Household Income | 3,427 | $182,063 |
| Mean Household Income | 3,427 | $180,777 |
| Income Deficit | 2,962 | $0 |
| Wage / Income Gap (%) | 10,059 | 64.17% |
| Wage / Income Gap ($) | 10,059 | 35.83¢ per $1 |
| Gini / Inequality Index | 10,059 | 0.36 |
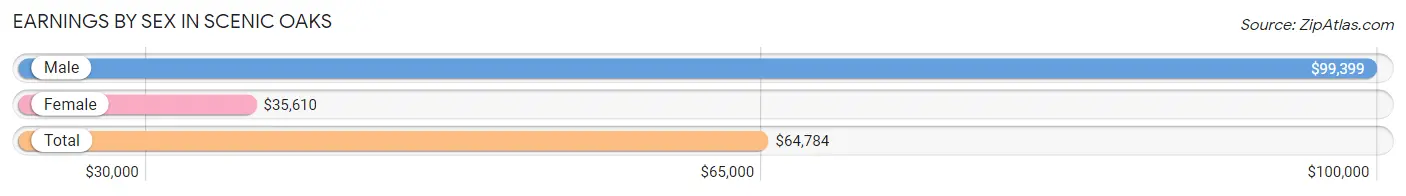
Earnings by Sex in Scenic Oaks
Average Earnings in Scenic Oaks are $64,784, $99,399 for men and $35,610 for women, a difference of 64.2%.
| Sex | Number | Average Earnings |
| Male | 2,891 (57.1%) | $99,399 |
| Female | 2,174 (42.9%) | $35,610 |
| Total | 5,065 (100.0%) | $64,784 |
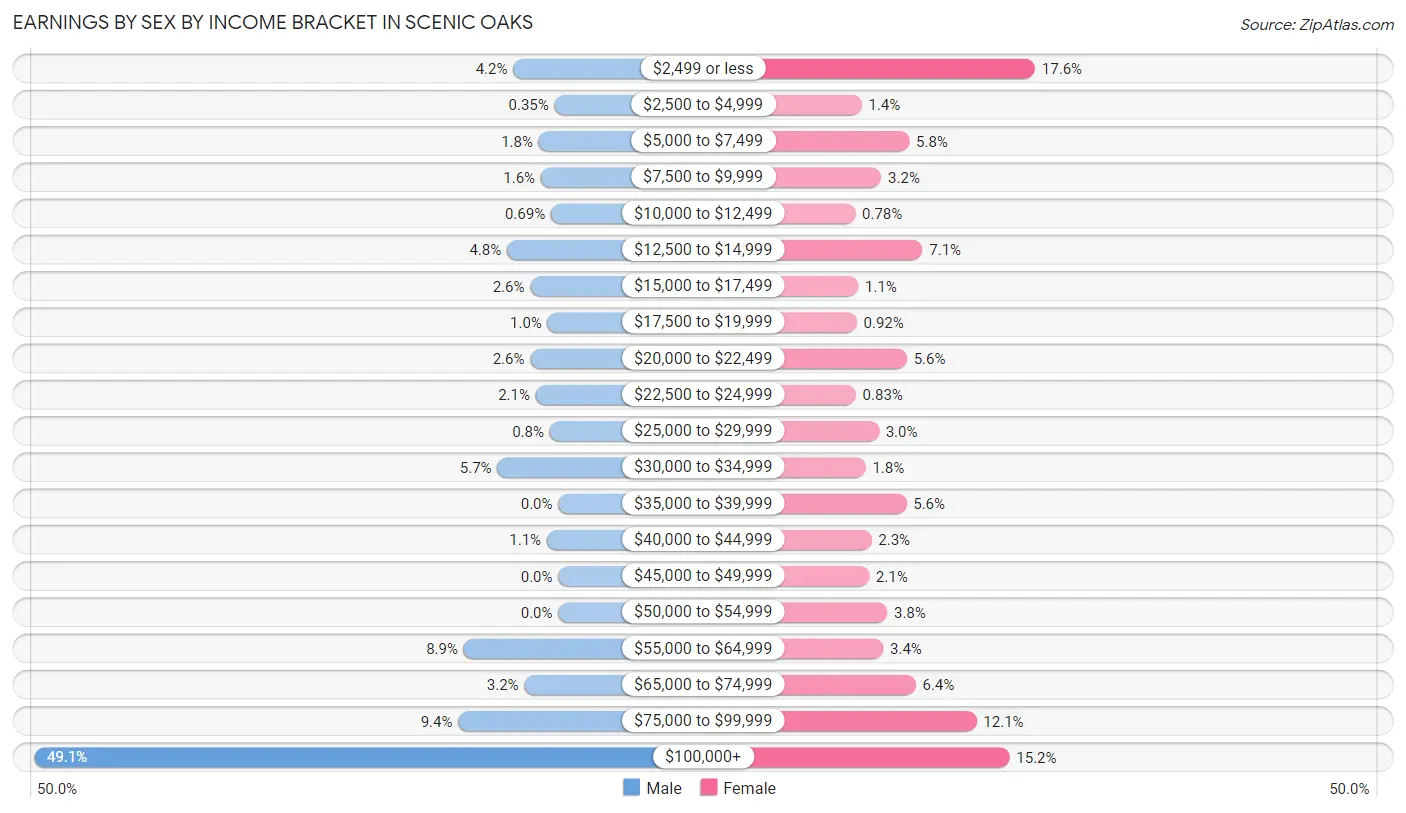
Earnings by Sex by Income Bracket in Scenic Oaks
The most common earnings brackets in Scenic Oaks are $100,000+ for men (1,420 | 49.1%) and $2,499 or less for women (383 | 17.6%).
| Income | Male | Female |
| $2,499 or less | 122 (4.2%) | 383 (17.6%) |
| $2,500 to $4,999 | 10 (0.4%) | 30 (1.4%) |
| $5,000 to $7,499 | 53 (1.8%) | 127 (5.8%) |
| $7,500 to $9,999 | 47 (1.6%) | 70 (3.2%) |
| $10,000 to $12,499 | 20 (0.7%) | 17 (0.8%) |
| $12,500 to $14,999 | 139 (4.8%) | 154 (7.1%) |
| $15,000 to $17,499 | 76 (2.6%) | 23 (1.1%) |
| $17,500 to $19,999 | 29 (1.0%) | 20 (0.9%) |
| $20,000 to $22,499 | 76 (2.6%) | 122 (5.6%) |
| $22,500 to $24,999 | 61 (2.1%) | 18 (0.8%) |
| $25,000 to $29,999 | 23 (0.8%) | 65 (3.0%) |
| $30,000 to $34,999 | 165 (5.7%) | 38 (1.8%) |
| $35,000 to $39,999 | 0 (0.0%) | 121 (5.6%) |
| $40,000 to $44,999 | 31 (1.1%) | 50 (2.3%) |
| $45,000 to $49,999 | 0 (0.0%) | 45 (2.1%) |
| $50,000 to $54,999 | 0 (0.0%) | 82 (3.8%) |
| $55,000 to $64,999 | 256 (8.9%) | 74 (3.4%) |
| $65,000 to $74,999 | 92 (3.2%) | 140 (6.4%) |
| $75,000 to $99,999 | 271 (9.4%) | 264 (12.1%) |
| $100,000+ | 1,420 (49.1%) | 331 (15.2%) |
| Total | 2,891 (100.0%) | 2,174 (100.0%) |
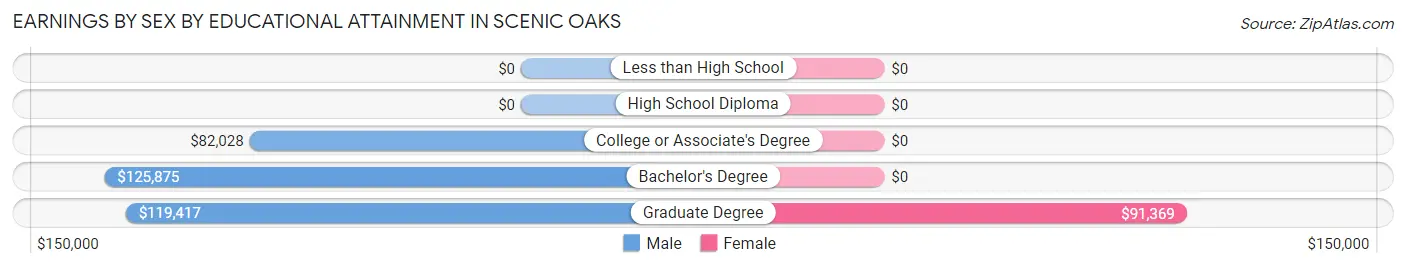
Earnings by Sex by Educational Attainment in Scenic Oaks
Average earnings in Scenic Oaks are $112,273 for men and $37,949 for women, a difference of 66.2%. Men with an educational attainment of bachelor's degree enjoy the highest average annual earnings of $125,875, while those with college or associate's degree education earn the least with $82,028. Women with an educational attainment of graduate degree earn the most with the average annual earnings of $91,369, while those with graduate degree education have the smallest earnings of $91,369.
| Educational Attainment | Male Income | Female Income |
| Less than High School | - | - |
| High School Diploma | - | - |
| College or Associate's Degree | $82,028 | $0 |
| Bachelor's Degree | $125,875 | $0 |
| Graduate Degree | $119,417 | $91,369 |
| Total | $112,273 | $37,949 |
Family Income in Scenic Oaks
Family Income Brackets in Scenic Oaks
According to the Scenic Oaks family income data, there are 1,339 families falling into the $200,000+ income range, which is the most common income bracket and makes up 45.2% of all families. Conversely, the $15,000 to $24,999 income bracket is the least frequent group with only 15 families (0.5%) belonging to this category.
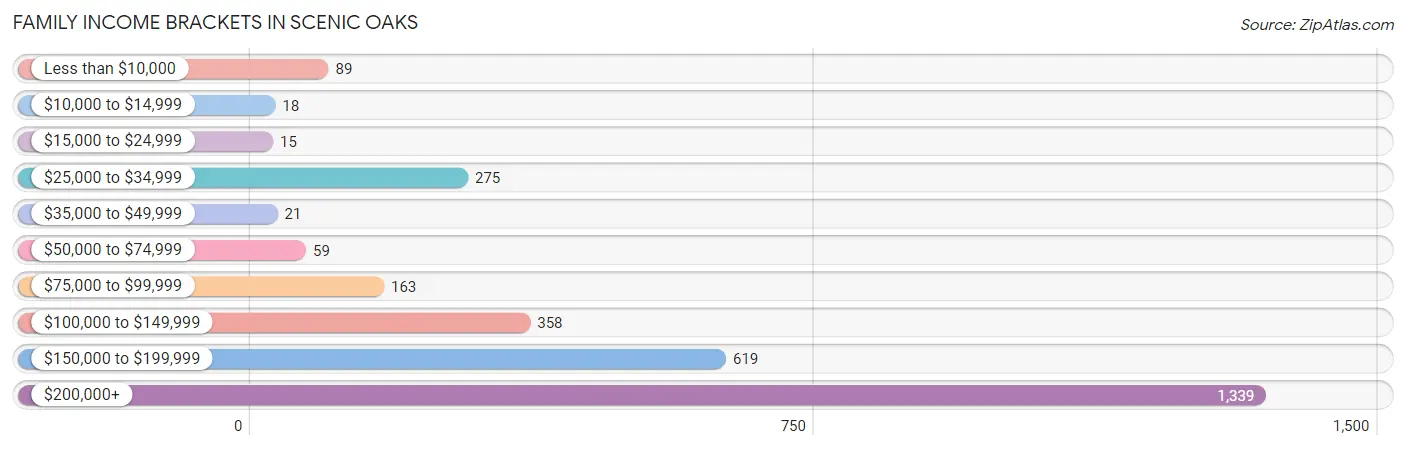
| Income Bracket | # Families | % Families |
| Less than $10,000 | 89 | 3.0% |
| $10,000 to $14,999 | 18 | 0.6% |
| $15,000 to $24,999 | 15 | 0.5% |
| $25,000 to $34,999 | 275 | 9.3% |
| $35,000 to $49,999 | 21 | 0.7% |
| $50,000 to $74,999 | 59 | 2.0% |
| $75,000 to $99,999 | 163 | 5.5% |
| $100,000 to $149,999 | 358 | 12.1% |
| $150,000 to $199,999 | 619 | 20.9% |
| $200,000+ | 1,339 | 45.2% |
Family Income by Famaliy Size in Scenic Oaks
5-person families (214 | 7.2%) account for the highest median family income in Scenic Oaks with $241,172 per family, while 2-person families (1,387 | 46.8%) have the highest median income of $98,951 per family member.
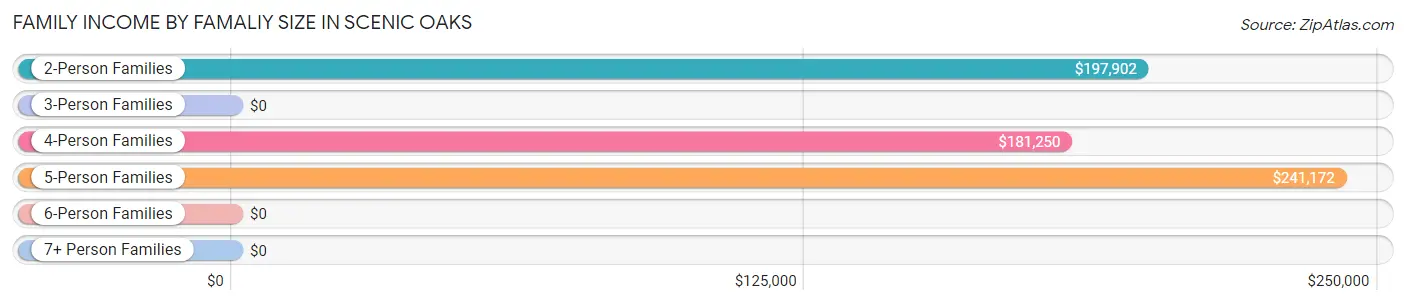
| Income Bracket | # Families | Median Income |
| 2-Person Families | 1,387 (46.8%) | $197,902 |
| 3-Person Families | 460 (15.5%) | $0 |
| 4-Person Families | 778 (26.3%) | $181,250 |
| 5-Person Families | 214 (7.2%) | $241,172 |
| 6-Person Families | 111 (3.7%) | $0 |
| 7+ Person Families | 12 (0.4%) | $0 |
| Total | 2,962 (100.0%) | $189,649 |
Family Income by Number of Earners in Scenic Oaks
The median family income in Scenic Oaks is $189,649, with families comprising 2 earners (1,505) having the highest median family income of $205,381, while families with no earners (379) have the lowest median family income of $120,910, accounting for 50.8% and 12.8% of families, respectively.
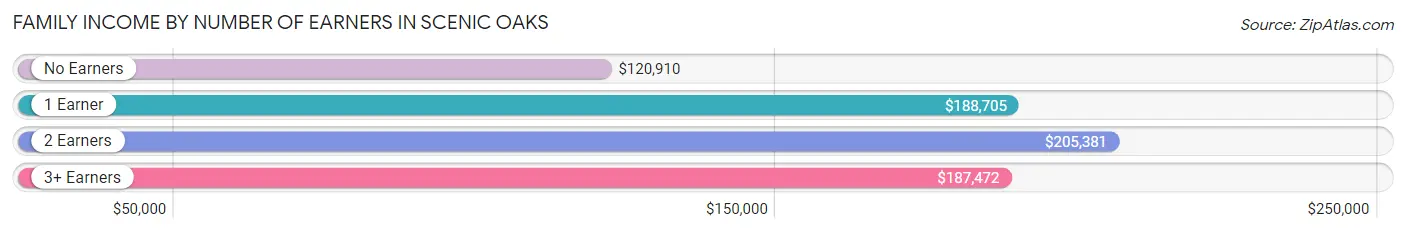
| Number of Earners | # Families | Median Income |
| No Earners | 379 (12.8%) | $120,910 |
| 1 Earner | 799 (27.0%) | $188,705 |
| 2 Earners | 1,505 (50.8%) | $205,381 |
| 3+ Earners | 279 (9.4%) | $187,472 |
| Total | 2,962 (100.0%) | $189,649 |
Household Income in Scenic Oaks
Household Income Brackets in Scenic Oaks
With 1,422 households falling in the category, the $200,000+ income range is the most frequent in Scenic Oaks, accounting for 41.5% of all households. In contrast, only 14 households (0.4%) fall into the $15,000 to $24,999 income bracket, making it the least populous group.
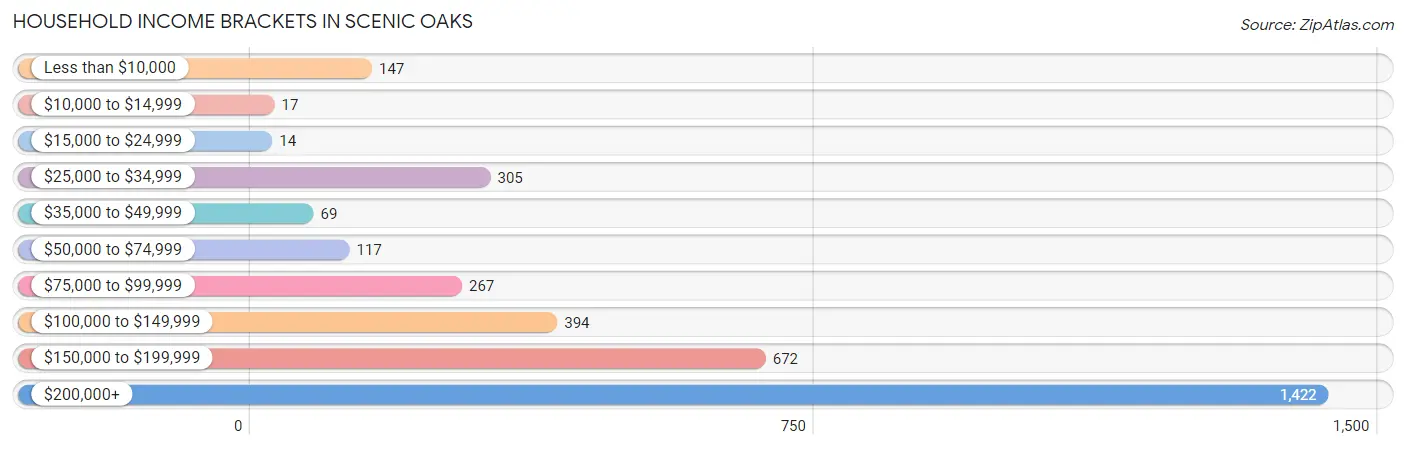
| Income Bracket | # Households | % Households |
| Less than $10,000 | 147 | 4.3% |
| $10,000 to $14,999 | 17 | 0.5% |
| $15,000 to $24,999 | 14 | 0.4% |
| $25,000 to $34,999 | 305 | 8.9% |
| $35,000 to $49,999 | 69 | 2.0% |
| $50,000 to $74,999 | 117 | 3.4% |
| $75,000 to $99,999 | 267 | 7.8% |
| $100,000 to $149,999 | 394 | 11.5% |
| $150,000 to $199,999 | 672 | 19.6% |
| $200,000+ | 1,422 | 41.5% |
Household Income by Householder Age in Scenic Oaks
The median household income in Scenic Oaks is $182,063, with the highest median household income of $198,023 found in the 45 to 64 years age bracket for the primary householder. A total of 1,421 households (41.5%) fall into this category. Meanwhile, the 15 to 24 years age bracket for the primary householder has the lowest median household income of $0, with 58 households (1.7%) in this group.
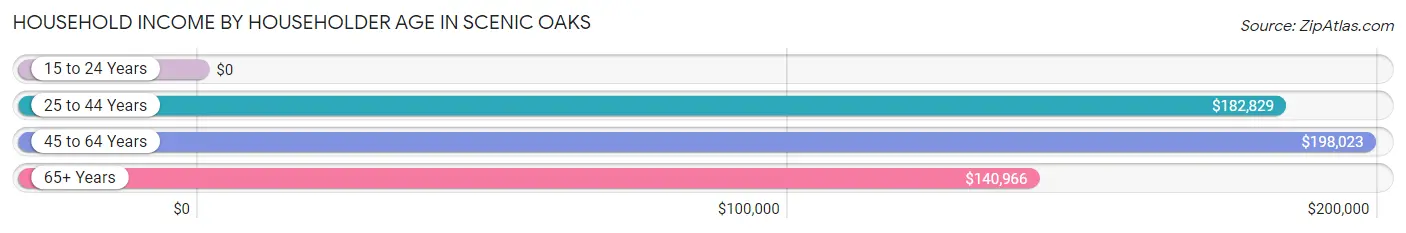
| Income Bracket | # Households | Median Income |
| 15 to 24 Years | 58 (1.7%) | $0 |
| 25 to 44 Years | 1,083 (31.6%) | $182,829 |
| 45 to 64 Years | 1,421 (41.5%) | $198,023 |
| 65+ Years | 865 (25.2%) | $140,966 |
| Total | 3,427 (100.0%) | $182,063 |
Poverty in Scenic Oaks
Income Below Poverty by Sex and Age in Scenic Oaks
With 8.3% poverty level for males and 8.8% for females among the residents of Scenic Oaks, 16 and 17 year old males and under 5 year old females are the most vulnerable to poverty, with 21 males (42.9%) and 142 females (29.0%) in their respective age groups living below the poverty level.
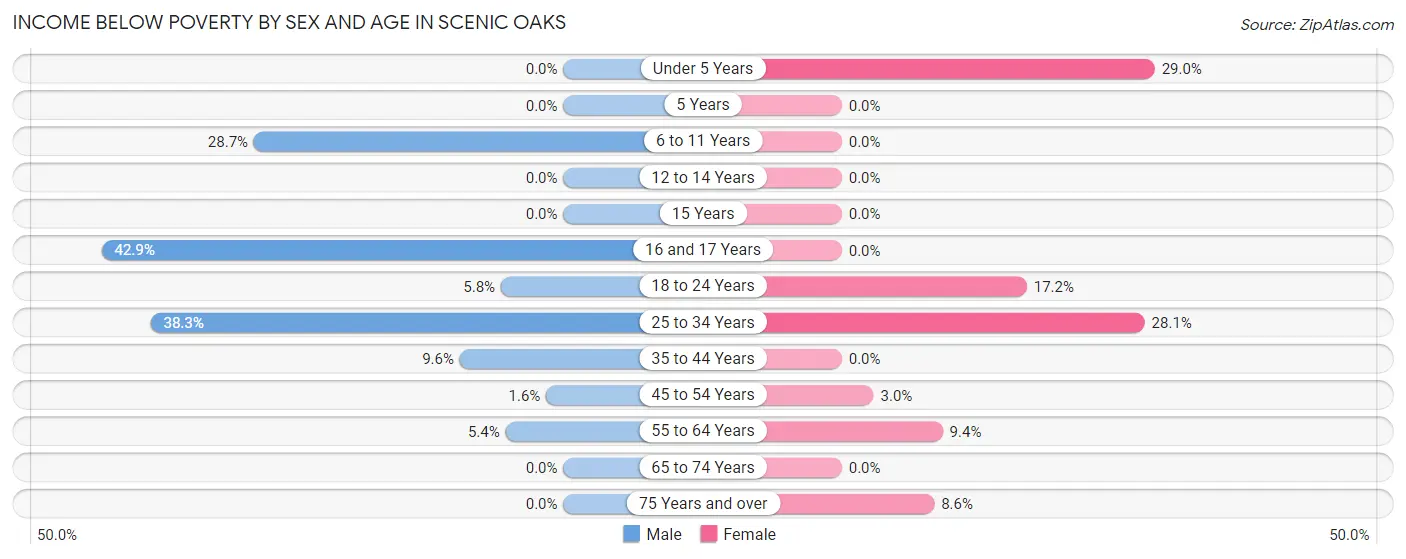
| Age Bracket | Male | Female |
| Under 5 Years | 0 (0.0%) | 142 (29.0%) |
| 5 Years | 0 (0.0%) | 0 (0.0%) |
| 6 to 11 Years | 112 (28.7%) | 0 (0.0%) |
| 12 to 14 Years | 0 (0.0%) | 0 (0.0%) |
| 15 Years | 0 (0.0%) | 0 (0.0%) |
| 16 and 17 Years | 21 (42.9%) | 0 (0.0%) |
| 18 to 24 Years | 22 (5.8%) | 68 (17.2%) |
| 25 to 34 Years | 100 (38.3%) | 138 (28.1%) |
| 35 to 44 Years | 87 (9.6%) | 0 (0.0%) |
| 45 to 54 Years | 10 (1.6%) | 18 (2.9%) |
| 55 to 64 Years | 33 (5.4%) | 72 (9.4%) |
| 65 to 74 Years | 0 (0.0%) | 0 (0.0%) |
| 75 Years and over | 0 (0.0%) | 38 (8.6%) |
| Total | 385 (8.3%) | 476 (8.8%) |
Income Above Poverty by Sex and Age in Scenic Oaks
According to the poverty statistics in Scenic Oaks, males aged under 5 years and females aged 5 years are the age groups that are most secure financially, with 100.0% of males and 100.0% of females in these age groups living above the poverty line.
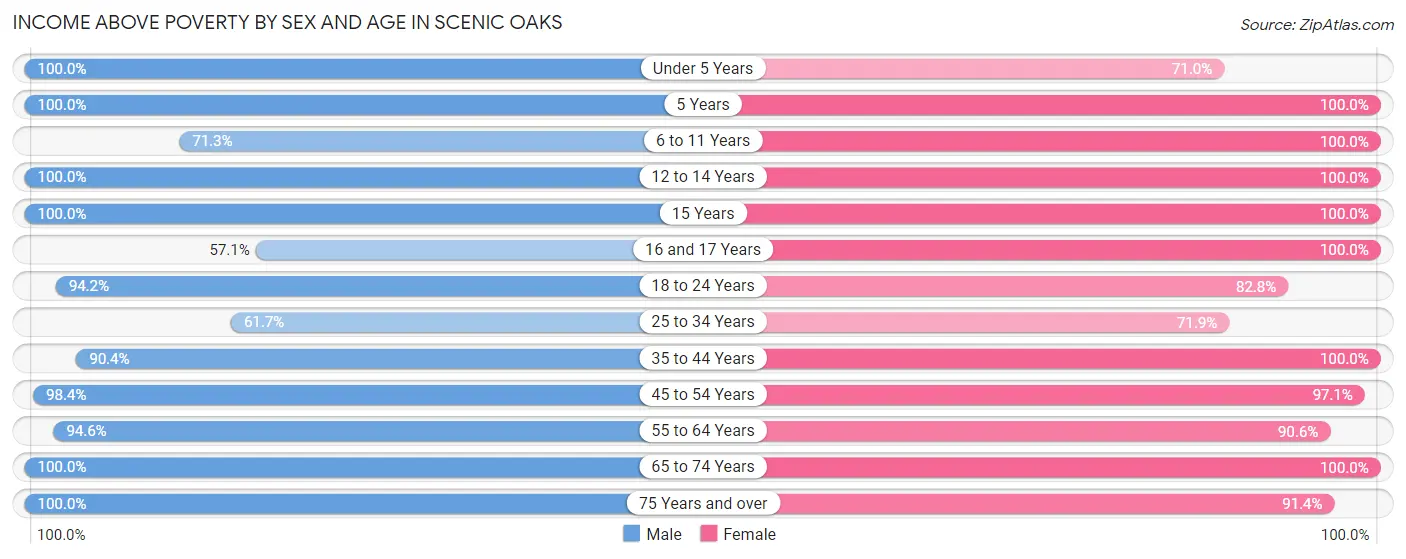
| Age Bracket | Male | Female |
| Under 5 Years | 226 (100.0%) | 347 (71.0%) |
| 5 Years | 133 (100.0%) | 85 (100.0%) |
| 6 to 11 Years | 278 (71.3%) | 703 (100.0%) |
| 12 to 14 Years | 138 (100.0%) | 71 (100.0%) |
| 15 Years | 119 (100.0%) | 23 (100.0%) |
| 16 and 17 Years | 28 (57.1%) | 170 (100.0%) |
| 18 to 24 Years | 358 (94.2%) | 328 (82.8%) |
| 25 to 34 Years | 161 (61.7%) | 353 (71.9%) |
| 35 to 44 Years | 818 (90.4%) | 695 (100.0%) |
| 45 to 54 Years | 618 (98.4%) | 592 (97.1%) |
| 55 to 64 Years | 583 (94.6%) | 697 (90.6%) |
| 65 to 74 Years | 491 (100.0%) | 462 (100.0%) |
| 75 Years and over | 316 (100.0%) | 405 (91.4%) |
| Total | 4,267 (91.7%) | 4,931 (91.2%) |
Income Below Poverty Among Married-Couple Families in Scenic Oaks
The poverty statistics for married-couple families in Scenic Oaks show that 3.4% or 85 of the total 2,484 families live below the poverty line. Families with 1 or 2 children have the highest poverty rate of 9.0%, comprising of 85 families. On the other hand, families with no children have the lowest poverty rate of 0.0%, which includes 0 families.
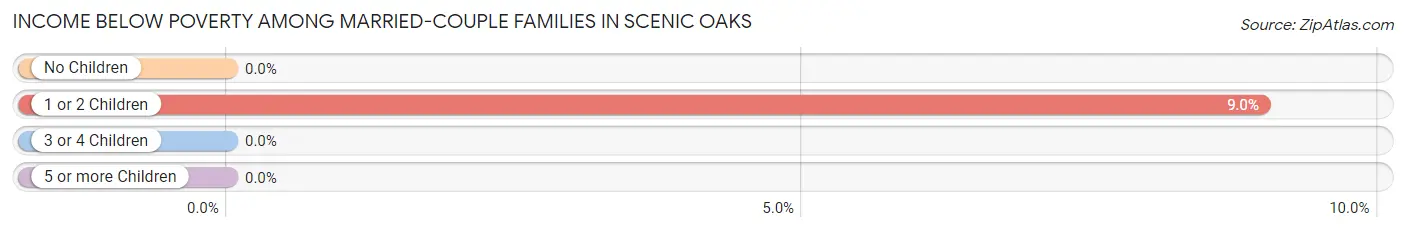
| Children | Above Poverty | Below Poverty |
| No Children | 1,343 (100.0%) | 0 (0.0%) |
| 1 or 2 Children | 861 (91.0%) | 85 (9.0%) |
| 3 or 4 Children | 194 (100.0%) | 0 (0.0%) |
| 5 or more Children | 1 (100.0%) | 0 (0.0%) |
| Total | 2,399 (96.6%) | 85 (3.4%) |
Income Below Poverty Among Single-Parent Households in Scenic Oaks
According to the poverty data in Scenic Oaks, 16.4% or 32 single-father households and 25.8% or 73 single-mother households are living below the poverty line. Among single-father households, those with 1 or 2 children have the highest poverty rate, with 32 households (48.5%) experiencing poverty. Likewise, among single-mother households, those with 1 or 2 children have the highest poverty rate, with 58 households (35.4%) falling below the poverty line.
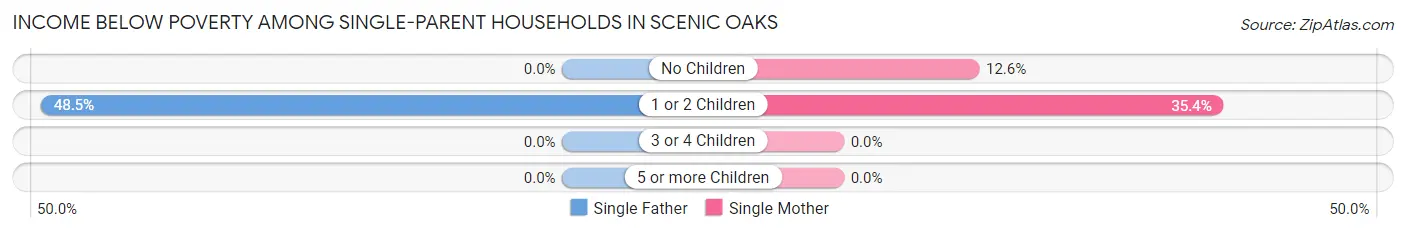
| Children | Single Father | Single Mother |
| No Children | 0 (0.0%) | 15 (12.6%) |
| 1 or 2 Children | 32 (48.5%) | 58 (35.4%) |
| 3 or 4 Children | 0 (0.0%) | 0 (0.0%) |
| 5 or more Children | 0 (0.0%) | 0 (0.0%) |
| Total | 32 (16.4%) | 73 (25.8%) |
Income Below Poverty Among Married-Couple vs Single-Parent Households in Scenic Oaks
The poverty data for Scenic Oaks shows that 85 of the married-couple family households (3.4%) and 105 of the single-parent households (22.0%) are living below the poverty level. Within the married-couple family households, those with 1 or 2 children have the highest poverty rate, with 85 households (9.0%) falling below the poverty line. Among the single-parent households, those with 1 or 2 children have the highest poverty rate, with 90 household (39.1%) living below poverty.
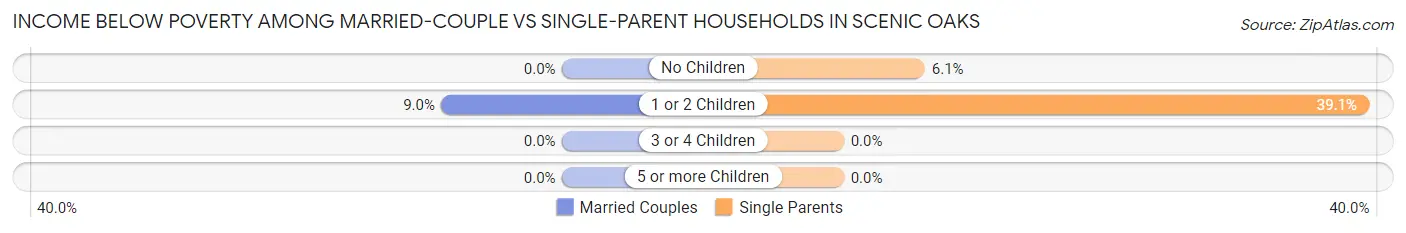
| Children | Married-Couple Families | Single-Parent Households |
| No Children | 0 (0.0%) | 15 (6.0%) |
| 1 or 2 Children | 85 (9.0%) | 90 (39.1%) |
| 3 or 4 Children | 0 (0.0%) | 0 (0.0%) |
| 5 or more Children | 0 (0.0%) | 0 (0.0%) |
| Total | 85 (3.4%) | 105 (22.0%) |
Race in Scenic Oaks
The most populous races in Scenic Oaks are White / Caucasian (7,656 | 76.1%), Hispanic or Latino (3,006 | 29.9%), and Two or more Races (1,385 | 13.8%).
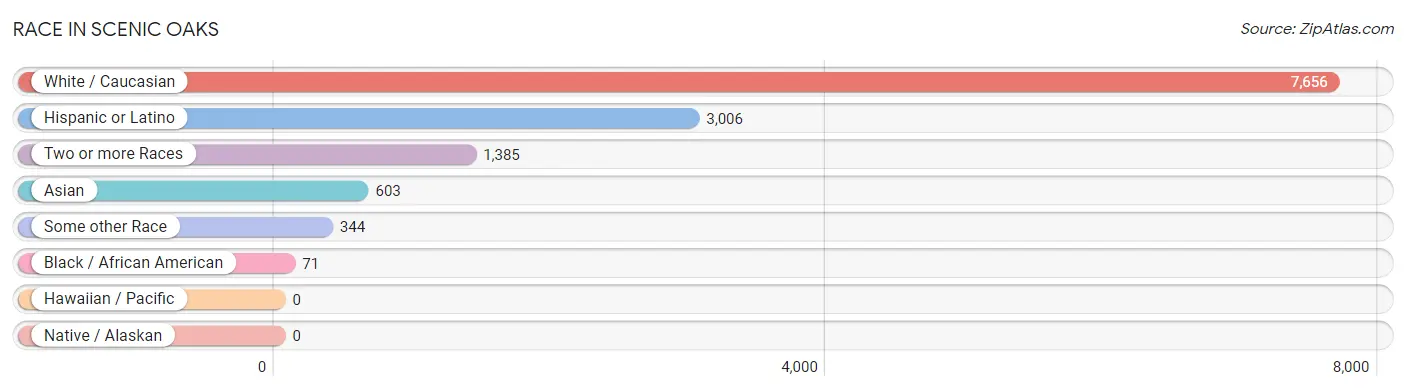
| Race | # Population | % Population |
| Asian | 603 | 6.0% |
| Black / African American | 71 | 0.7% |
| Hawaiian / Pacific | 0 | 0.0% |
| Hispanic or Latino | 3,006 | 29.9% |
| Native / Alaskan | 0 | 0.0% |
| White / Caucasian | 7,656 | 76.1% |
| Two or more Races | 1,385 | 13.8% |
| Some other Race | 344 | 3.4% |
| Total | 10,059 | 100.0% |
Ancestry in Scenic Oaks
The most populous ancestries reported in Scenic Oaks are German (2,426 | 24.1%), Mexican (2,218 | 22.1%), English (1,330 | 13.2%), Irish (1,225 | 12.2%), and American (536 | 5.3%), together accounting for 76.9% of all Scenic Oaks residents.
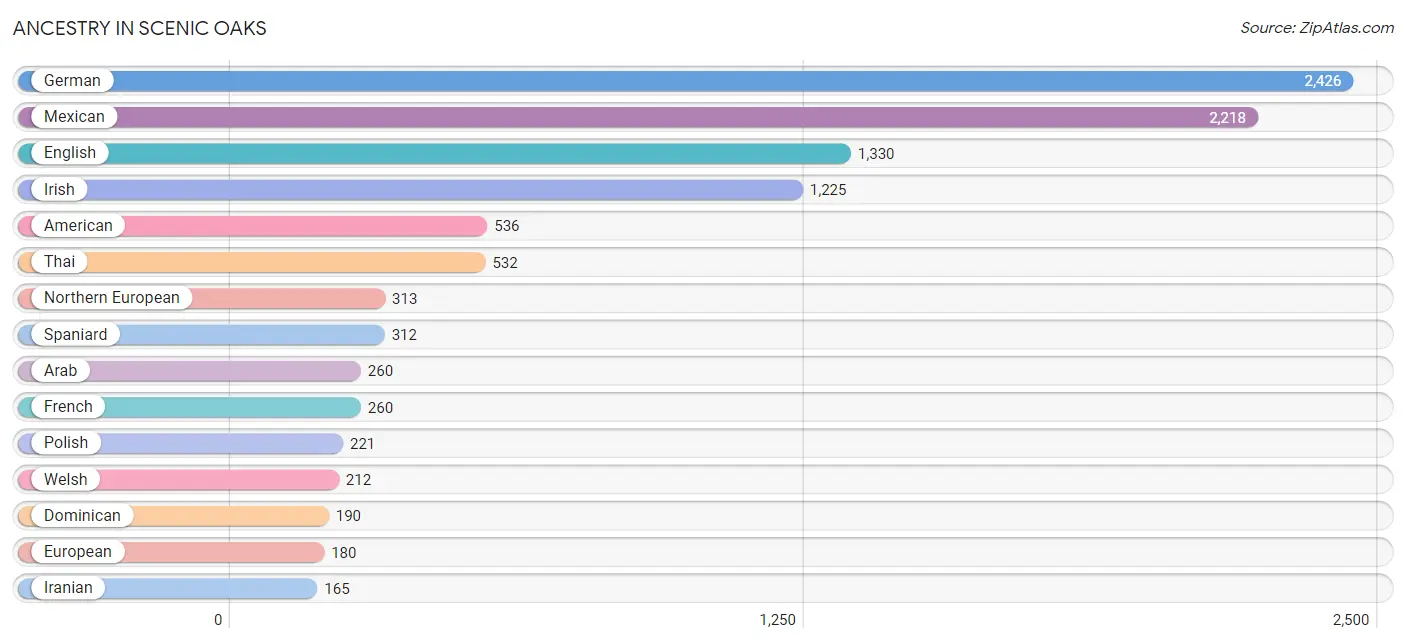
| Ancestry | # Population | % Population |
| American | 536 | 5.3% |
| Arab | 260 | 2.6% |
| Argentinean | 49 | 0.5% |
| Belgian | 10 | 0.1% |
| Brazilian | 33 | 0.3% |
| British | 66 | 0.7% |
| Burmese | 17 | 0.2% |
| Canadian | 10 | 0.1% |
| Central American | 51 | 0.5% |
| Colombian | 79 | 0.8% |
| Comanche | 76 | 0.8% |
| Czech | 68 | 0.7% |
| Danish | 75 | 0.7% |
| Dominican | 190 | 1.9% |
| Dutch | 130 | 1.3% |
| English | 1,330 | 13.2% |
| European | 180 | 1.8% |
| French | 260 | 2.6% |
| French Canadian | 40 | 0.4% |
| German | 2,426 | 24.1% |
| Guatemalan | 51 | 0.5% |
| Indian (Asian) | 33 | 0.3% |
| Iranian | 165 | 1.6% |
| Irish | 1,225 | 12.2% |
| Italian | 123 | 1.2% |
| Korean | 42 | 0.4% |
| Laotian | 15 | 0.2% |
| Lebanese | 19 | 0.2% |
| Mexican | 2,218 | 22.1% |
| Northern European | 313 | 3.1% |
| Norwegian | 79 | 0.8% |
| Pakistani | 10 | 0.1% |
| Polish | 221 | 2.2% |
| Portuguese | 96 | 0.9% |
| Russian | 29 | 0.3% |
| Scotch-Irish | 56 | 0.6% |
| Scottish | 116 | 1.1% |
| South American | 128 | 1.3% |
| Spaniard | 312 | 3.1% |
| Spanish | 35 | 0.4% |
| Swedish | 20 | 0.2% |
| Swiss | 26 | 0.3% |
| Thai | 532 | 5.3% |
| Ukrainian | 23 | 0.2% |
| Welsh | 212 | 2.1% | View All 45 Rows |
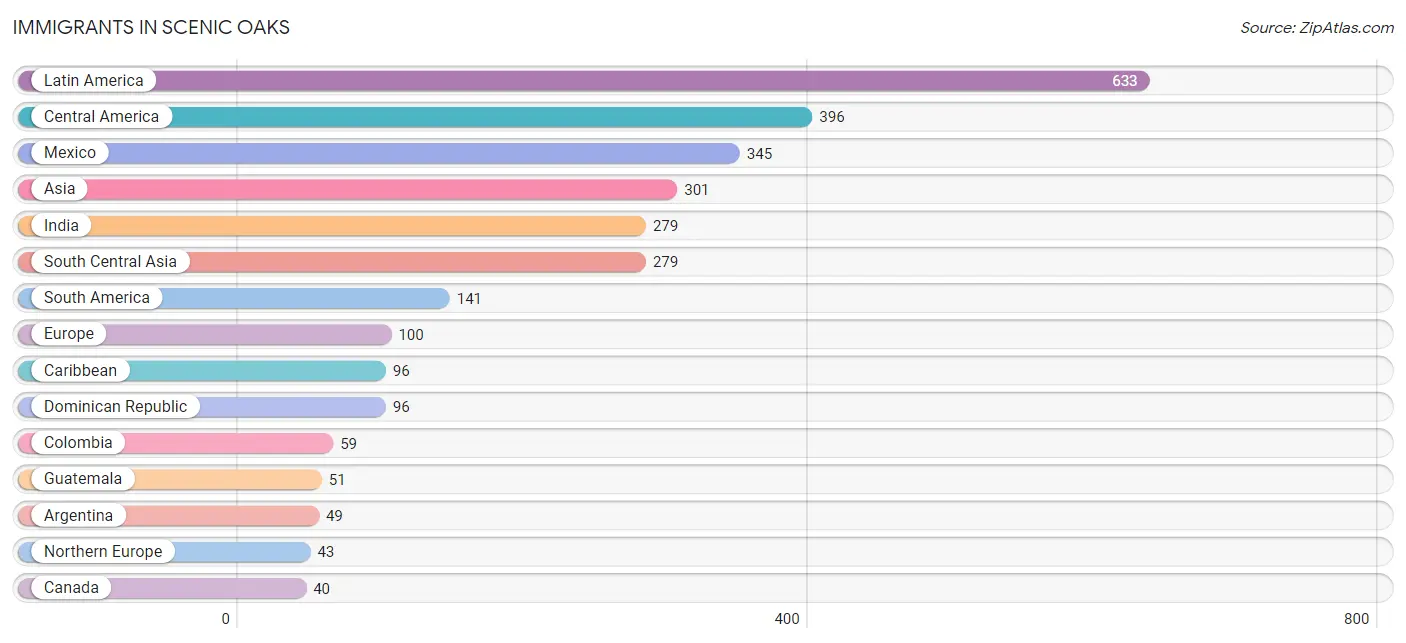
Immigrants in Scenic Oaks
The most numerous immigrant groups reported in Scenic Oaks came from Latin America (633 | 6.3%), Central America (396 | 3.9%), Mexico (345 | 3.4%), Asia (301 | 3.0%), and India (279 | 2.8%), together accounting for 19.4% of all Scenic Oaks residents.
| Immigration Origin | # Population | % Population |
| Argentina | 49 | 0.5% |
| Asia | 301 | 3.0% |
| Brazil | 33 | 0.3% |
| Canada | 40 | 0.4% |
| Caribbean | 96 | 0.9% |
| Central America | 396 | 3.9% |
| Colombia | 59 | 0.6% |
| Denmark | 22 | 0.2% |
| Dominican Republic | 96 | 0.9% |
| Eastern Asia | 7 | 0.1% |
| Eastern Europe | 29 | 0.3% |
| England | 21 | 0.2% |
| Europe | 100 | 1.0% |
| Guatemala | 51 | 0.5% |
| India | 279 | 2.8% |
| Indonesia | 15 | 0.2% |
| Korea | 7 | 0.1% |
| Latin America | 633 | 6.3% |
| Mexico | 345 | 3.4% |
| Northern Europe | 43 | 0.4% |
| Portugal | 28 | 0.3% |
| Russia | 29 | 0.3% |
| South America | 141 | 1.4% |
| South Central Asia | 279 | 2.8% |
| South Eastern Asia | 15 | 0.2% |
| Southern Europe | 28 | 0.3% | View All 26 Rows |
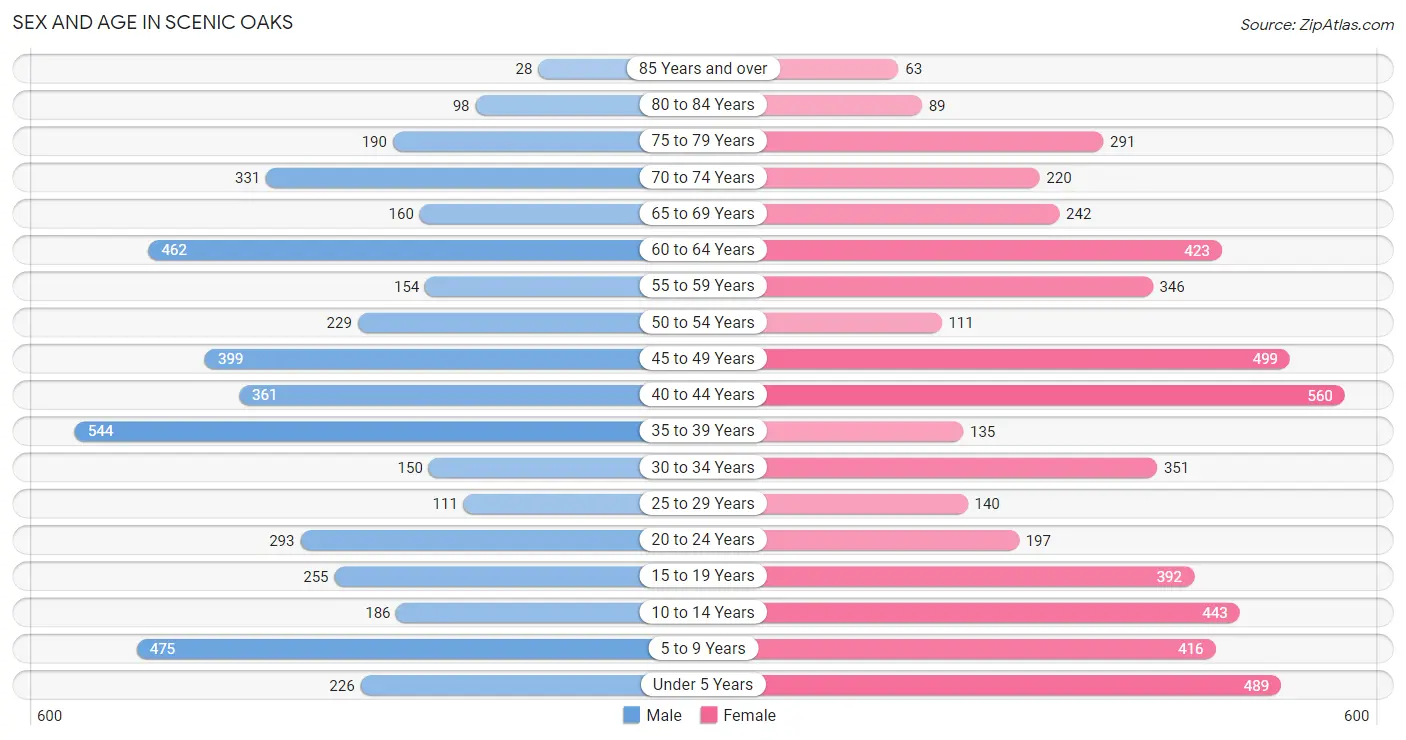
Sex and Age in Scenic Oaks
Sex and Age in Scenic Oaks
The most populous age groups in Scenic Oaks are 35 to 39 Years (544 | 11.7%) for men and 40 to 44 Years (560 | 10.4%) for women.
| Age Bracket | Male | Female |
| Under 5 Years | 226 (4.9%) | 489 (9.0%) |
| 5 to 9 Years | 475 (10.2%) | 416 (7.7%) |
| 10 to 14 Years | 186 (4.0%) | 443 (8.2%) |
| 15 to 19 Years | 255 (5.5%) | 392 (7.2%) |
| 20 to 24 Years | 293 (6.3%) | 197 (3.6%) |
| 25 to 29 Years | 111 (2.4%) | 140 (2.6%) |
| 30 to 34 Years | 150 (3.2%) | 351 (6.5%) |
| 35 to 39 Years | 544 (11.7%) | 135 (2.5%) |
| 40 to 44 Years | 361 (7.8%) | 560 (10.4%) |
| 45 to 49 Years | 399 (8.6%) | 499 (9.2%) |
| 50 to 54 Years | 229 (4.9%) | 111 (2.1%) |
| 55 to 59 Years | 154 (3.3%) | 346 (6.4%) |
| 60 to 64 Years | 462 (9.9%) | 423 (7.8%) |
| 65 to 69 Years | 160 (3.4%) | 242 (4.5%) |
| 70 to 74 Years | 331 (7.1%) | 220 (4.1%) |
| 75 to 79 Years | 190 (4.1%) | 291 (5.4%) |
| 80 to 84 Years | 98 (2.1%) | 89 (1.7%) |
| 85 Years and over | 28 (0.6%) | 63 (1.2%) |
| Total | 4,652 (100.0%) | 5,407 (100.0%) |
Families and Households in Scenic Oaks
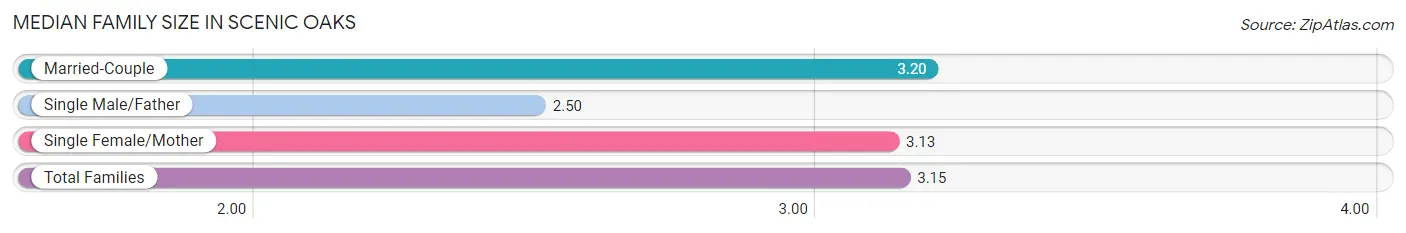
Median Family Size in Scenic Oaks
The median family size in Scenic Oaks is 3.15 persons per family, with married-couple families (2,484 | 83.9%) accounting for the largest median family size of 3.2 persons per family. On the other hand, single male/father families (195 | 6.6%) represent the smallest median family size with 2.50 persons per family.
| Family Type | # Families | Family Size |
| Married-Couple | 2,484 (83.9%) | 3.20 |
| Single Male/Father | 195 (6.6%) | 2.50 |
| Single Female/Mother | 283 (9.6%) | 3.13 |
| Total Families | 2,962 (100.0%) | 3.15 |
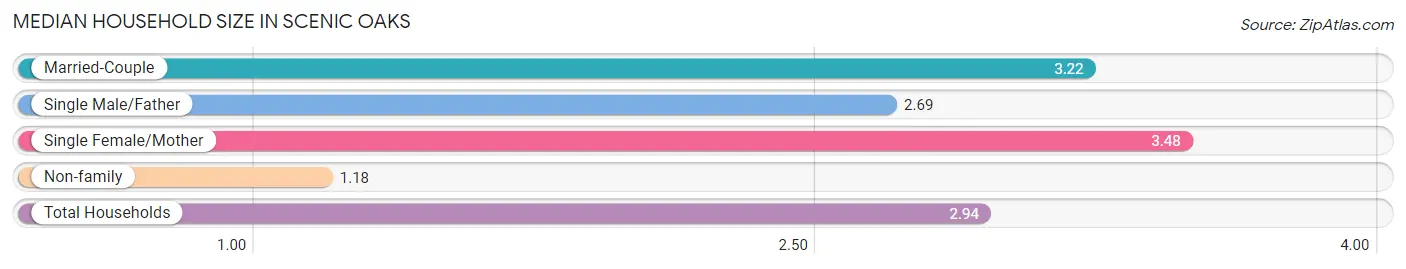
Median Household Size in Scenic Oaks
The median household size in Scenic Oaks is 2.94 persons per household, with single female/mother households (283 | 8.3%) accounting for the largest median household size of 3.48 persons per household. non-family households (465 | 13.6%) represent the smallest median household size with 1.18 persons per household.
| Household Type | # Households | Household Size |
| Married-Couple | 2,484 (72.5%) | 3.22 |
| Single Male/Father | 195 (5.7%) | 2.69 |
| Single Female/Mother | 283 (8.3%) | 3.48 |
| Non-family | 465 (13.6%) | 1.18 |
| Total Households | 3,427 (100.0%) | 2.94 |
Household Size by Marriage Status in Scenic Oaks
Out of a total of 3,427 households in Scenic Oaks, 2,962 (86.4%) are family households, while 465 (13.6%) are nonfamily households. The most numerous type of family households are 2-person households, comprising 1,274, and the most common type of nonfamily households are 1-person households, comprising 388.
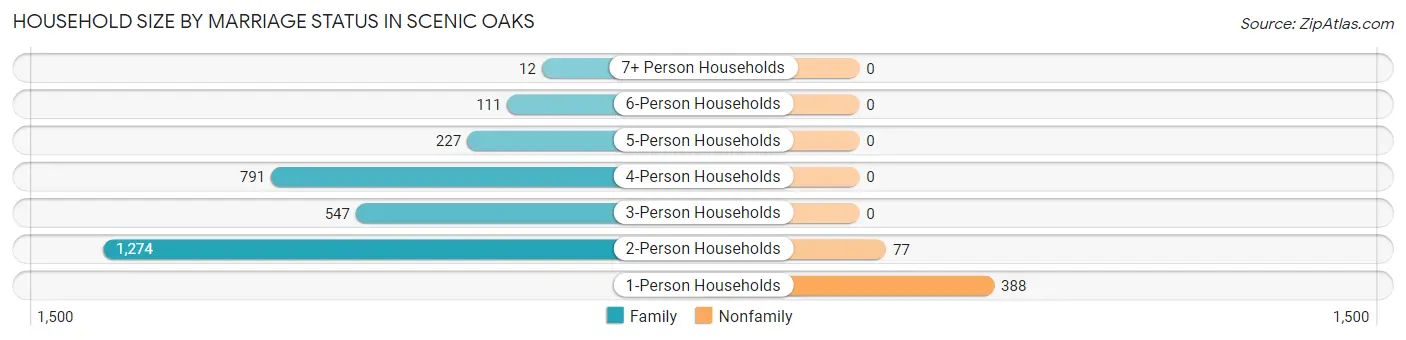
| Household Size | Family Households | Nonfamily Households |
| 1-Person Households | - | 388 (11.3%) |
| 2-Person Households | 1,274 (37.2%) | 77 (2.2%) |
| 3-Person Households | 547 (16.0%) | 0 (0.0%) |
| 4-Person Households | 791 (23.1%) | 0 (0.0%) |
| 5-Person Households | 227 (6.6%) | 0 (0.0%) |
| 6-Person Households | 111 (3.2%) | 0 (0.0%) |
| 7+ Person Households | 12 (0.4%) | 0 (0.0%) |
| Total | 2,962 (86.4%) | 465 (13.6%) |
Female Fertility in Scenic Oaks
Fertility by Age in Scenic Oaks
Average fertility rate in Scenic Oaks is 44.0 births per 1,000 women. Women in the age bracket of 15 to 19 years have the highest fertility rate with 148.0 births per 1,000 women. Women in the age bracket of 15 to 19 years acount for 57.4% of all women with births.
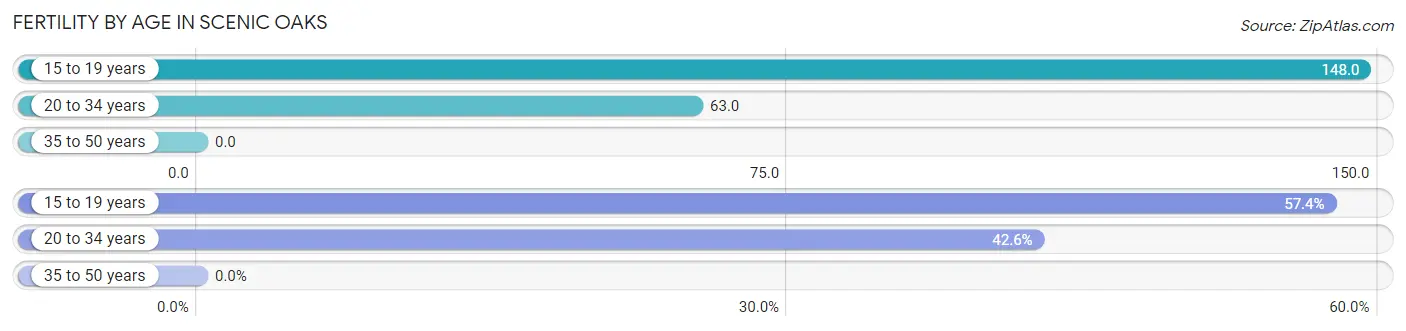
| Age Bracket | Women with Births | Births / 1,000 Women |
| 15 to 19 years | 58 (57.4%) | 148.0 |
| 20 to 34 years | 43 (42.6%) | 63.0 |
| 35 to 50 years | 0 (0.0%) | 0.0 |
| Total | 101 (100.0%) | 44.0 |
Fertility by Age by Marriage Status in Scenic Oaks
42.6% of women with births (101) in Scenic Oaks are married. The highest percentage of unmarried women with births falls into 15 to 19 years age bracket with 100.0% of them unmarried at the time of birth, while the lowest percentage of unmarried women with births belong to 20 to 34 years age bracket with 0.0% of them unmarried.
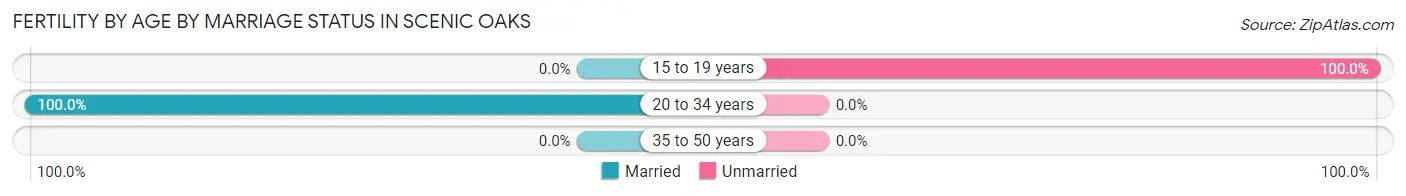
| Age Bracket | Married | Unmarried |
| 15 to 19 years | 0 (0.0%) | 58 (100.0%) |
| 20 to 34 years | 43 (100.0%) | 0 (0.0%) |
| 35 to 50 years | 0 (0.0%) | 0 (0.0%) |
| Total | 43 (42.6%) | 58 (57.4%) |
Fertility by Education in Scenic Oaks
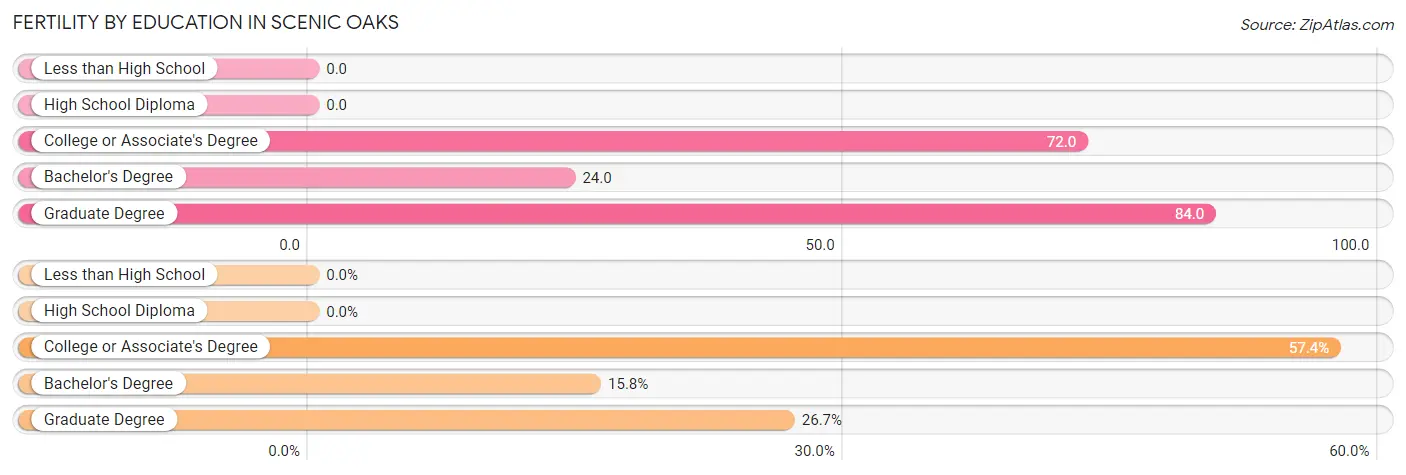
| Educational Attainment | Women with Births | Births / 1,000 Women |
| Less than High School | 0 (0.0%) | 0.0 |
| High School Diploma | 0 (0.0%) | 0.0 |
| College or Associate's Degree | 58 (57.4%) | 72.0 |
| Bachelor's Degree | 16 (15.8%) | 24.0 |
| Graduate Degree | 27 (26.7%) | 84.0 |
| Total | 101 (100.0%) | 44.0 |
Fertility by Education by Marriage Status in Scenic Oaks
57.4% of women with births in Scenic Oaks are unmarried. Women with the educational attainment of bachelor's degree are most likely to be married with 100.0% of them married at childbirth, while women with the educational attainment of college or associate's degree are least likely to be married with 100.0% of them unmarried at childbirth.
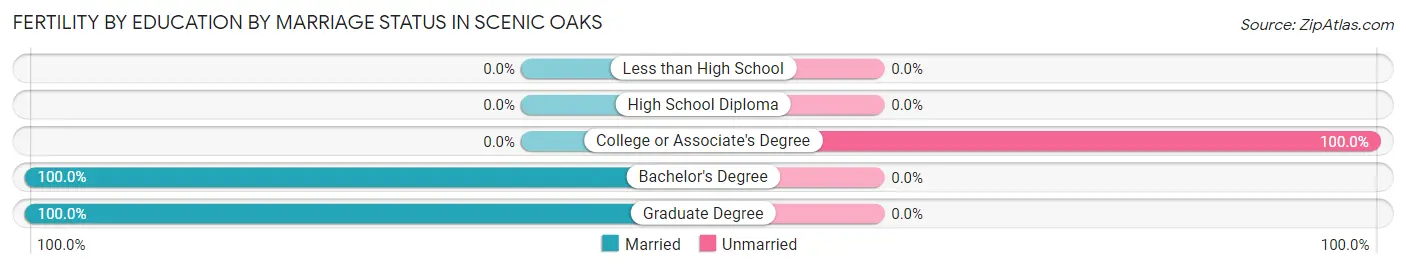
| Educational Attainment | Married | Unmarried |
| Less than High School | 0 (0.0%) | 0 (0.0%) |
| High School Diploma | 0 (0.0%) | 0 (0.0%) |
| College or Associate's Degree | 0 (0.0%) | 58 (100.0%) |
| Bachelor's Degree | 16 (100.0%) | 0 (0.0%) |
| Graduate Degree | 27 (100.0%) | 0 (0.0%) |
| Total | 43 (42.6%) | 58 (57.4%) |
Employment Characteristics in Scenic Oaks
Employment by Class of Employer in Scenic Oaks
Among the 4,311 employed individuals in Scenic Oaks, private company employees (3,053 | 70.8%), self-employed (not incorporated) (390 | 9.0%), and not-for-profit organizations (208 | 4.8%) make up the most common classes of employment.
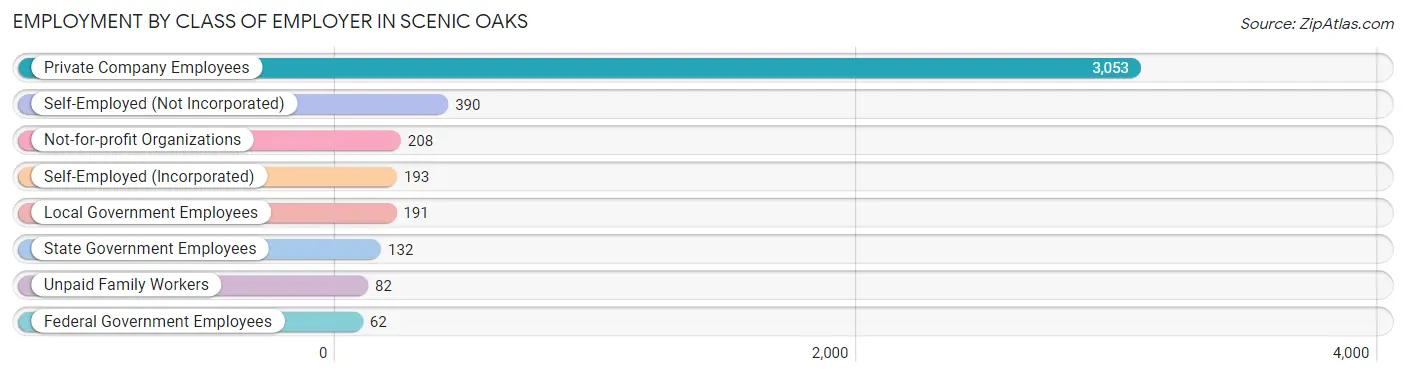
| Employer Class | # Employees | % Employees |
| Private Company Employees | 3,053 | 70.8% |
| Self-Employed (Incorporated) | 193 | 4.5% |
| Self-Employed (Not Incorporated) | 390 | 9.0% |
| Not-for-profit Organizations | 208 | 4.8% |
| Local Government Employees | 191 | 4.4% |
| State Government Employees | 132 | 3.1% |
| Federal Government Employees | 62 | 1.4% |
| Unpaid Family Workers | 82 | 1.9% |
| Total | 4,311 | 100.0% |
Employment Status by Age in Scenic Oaks
According to the labor force statistics for Scenic Oaks, out of the total population over 16 years of age (7,682), 59.1% or 4,540 individuals are in the labor force, with 3.0% or 136 of them unemployed. The age group with the highest labor force participation rate is 45 to 54 years, with 82.2% or 1,018 individuals in the labor force. Within the labor force, the 16 to 19 years age range has the highest percentage of unemployed individuals, with 41.5% or 34 of them being unemployed.
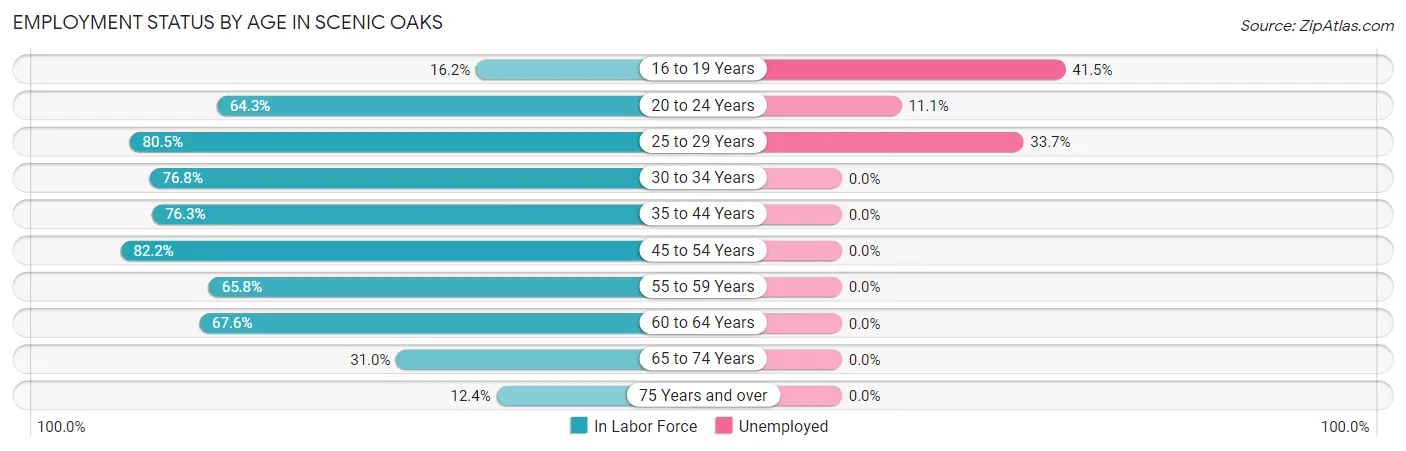
| Age Bracket | In Labor Force | Unemployed |
| 16 to 19 Years | 82 (16.2%) | 34 (41.5%) |
| 20 to 24 Years | 315 (64.3%) | 35 (11.1%) |
| 25 to 29 Years | 202 (80.5%) | 68 (33.7%) |
| 30 to 34 Years | 385 (76.8%) | 0 (0.0%) |
| 35 to 44 Years | 1,221 (76.3%) | 0 (0.0%) |
| 45 to 54 Years | 1,018 (82.2%) | 0 (0.0%) |
| 55 to 59 Years | 329 (65.8%) | 0 (0.0%) |
| 60 to 64 Years | 598 (67.6%) | 0 (0.0%) |
| 65 to 74 Years | 295 (31.0%) | 0 (0.0%) |
| 75 Years and over | 94 (12.4%) | 0 (0.0%) |
| Total | 4,540 (59.1%) | 136 (3.0%) |
Employment Status by Educational Attainment in Scenic Oaks
According to labor force statistics for Scenic Oaks, 75.4% of individuals (3,751) out of the total population between 25 and 64 years of age (4,975) are in the labor force, with 1.8% or 68 of them being unemployed. The group with the highest labor force participation rate are those with the educational attainment of high school diploma, with 81.1% or 253 individuals in the labor force. Within the labor force, individuals with college / associate degree education have the highest percentage of unemployment, with 9.2% or 68 of them being unemployed.
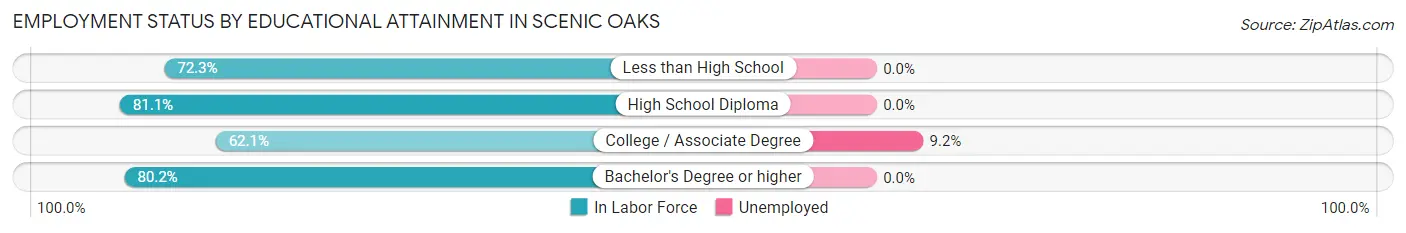
| Educational Attainment | In Labor Force | Unemployed |
| Less than High School | 214 (72.3%) | 0 (0.0%) |
| High School Diploma | 253 (81.1%) | 0 (0.0%) |
| College / Associate Degree | 739 (62.1%) | 109 (9.2%) |
| Bachelor's Degree or higher | 2,548 (80.2%) | 0 (0.0%) |
| Total | 3,751 (75.4%) | 90 (1.8%) |
Employment Occupations by Sex in Scenic Oaks
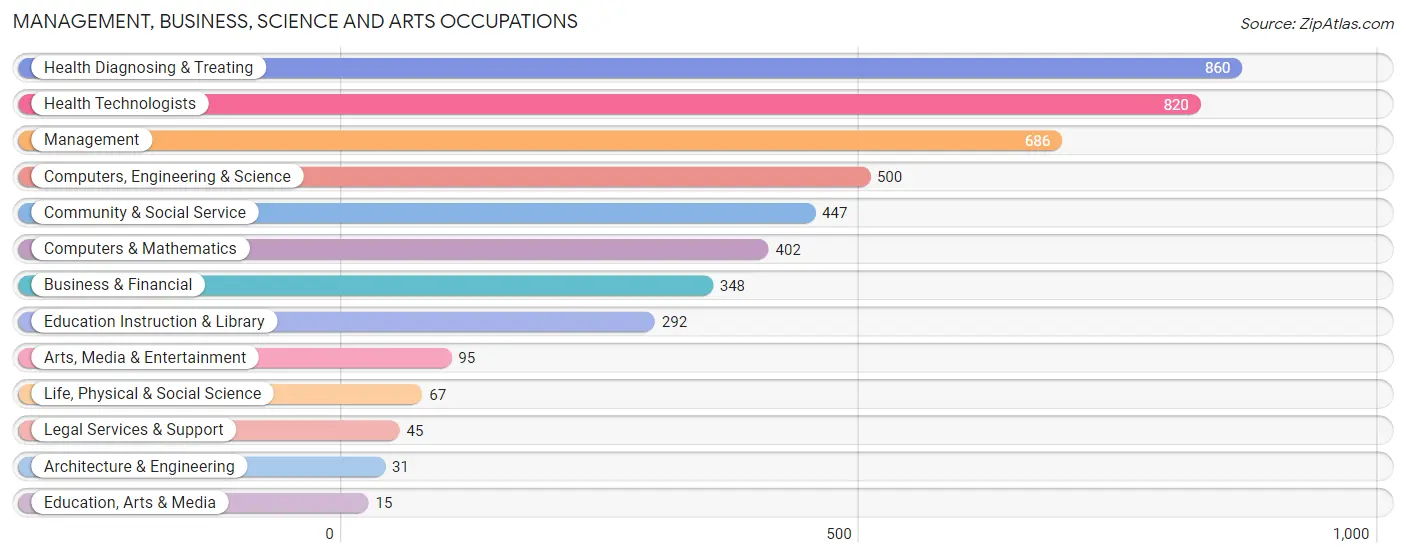
Management, Business, Science and Arts Occupations
The most common Management, Business, Science and Arts occupations in Scenic Oaks are Health Diagnosing & Treating (860 | 19.5%), Health Technologists (820 | 18.6%), Management (686 | 15.6%), Computers, Engineering & Science (500 | 11.4%), and Community & Social Service (447 | 10.2%).
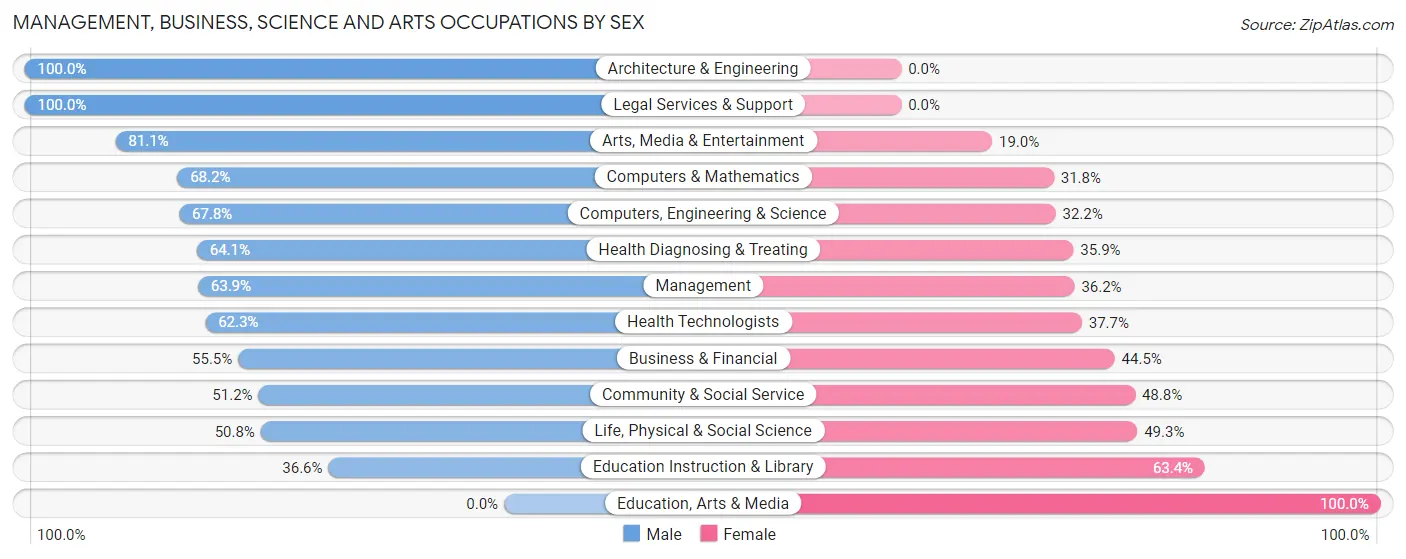
Management, Business, Science and Arts Occupations by Sex
Within the Management, Business, Science and Arts occupations in Scenic Oaks, the most male-oriented occupations are Architecture & Engineering (100.0%), Legal Services & Support (100.0%), and Arts, Media & Entertainment (81.0%), while the most female-oriented occupations are Education, Arts & Media (100.0%), Education Instruction & Library (63.4%), and Life, Physical & Social Science (49.2%).
| Occupation | Male | Female |
| Management | 438 (63.8%) | 248 (36.1%) |
| Business & Financial | 193 (55.5%) | 155 (44.5%) |
| Computers, Engineering & Science | 339 (67.8%) | 161 (32.2%) |
| Computers & Mathematics | 274 (68.2%) | 128 (31.8%) |
| Architecture & Engineering | 31 (100.0%) | 0 (0.0%) |
| Life, Physical & Social Science | 34 (50.7%) | 33 (49.2%) |
| Community & Social Service | 229 (51.2%) | 218 (48.8%) |
| Education, Arts & Media | 0 (0.0%) | 15 (100.0%) |
| Legal Services & Support | 45 (100.0%) | 0 (0.0%) |
| Education Instruction & Library | 107 (36.6%) | 185 (63.4%) |
| Arts, Media & Entertainment | 77 (81.0%) | 18 (19.0%) |
| Health Diagnosing & Treating | 551 (64.1%) | 309 (35.9%) |
| Health Technologists | 511 (62.3%) | 309 (37.7%) |
| Total (Category) | 1,750 (61.6%) | 1,091 (38.4%) |
| Total (Overall) | 2,676 (60.8%) | 1,726 (39.2%) |
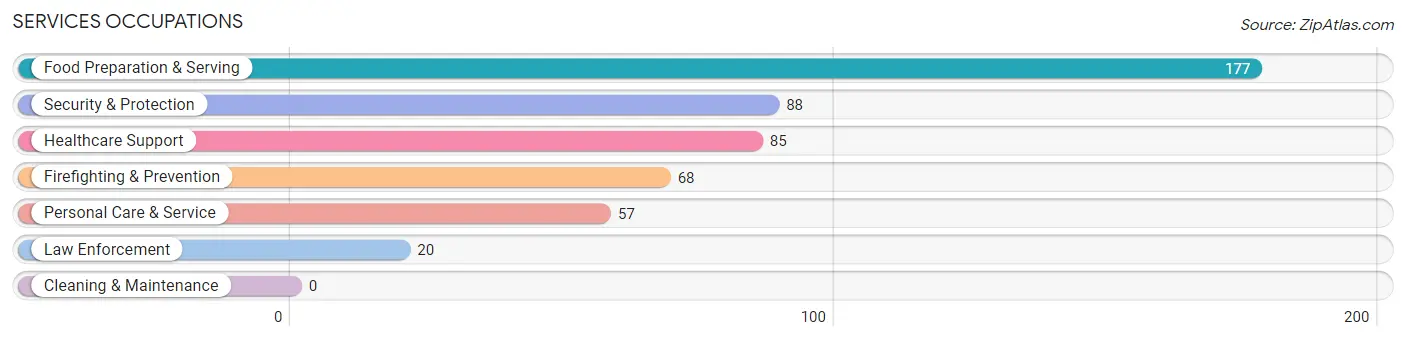
Services Occupations
The most common Services occupations in Scenic Oaks are Food Preparation & Serving (177 | 4.0%), Security & Protection (88 | 2.0%), Healthcare Support (85 | 1.9%), Firefighting & Prevention (68 | 1.5%), and Personal Care & Service (57 | 1.3%).
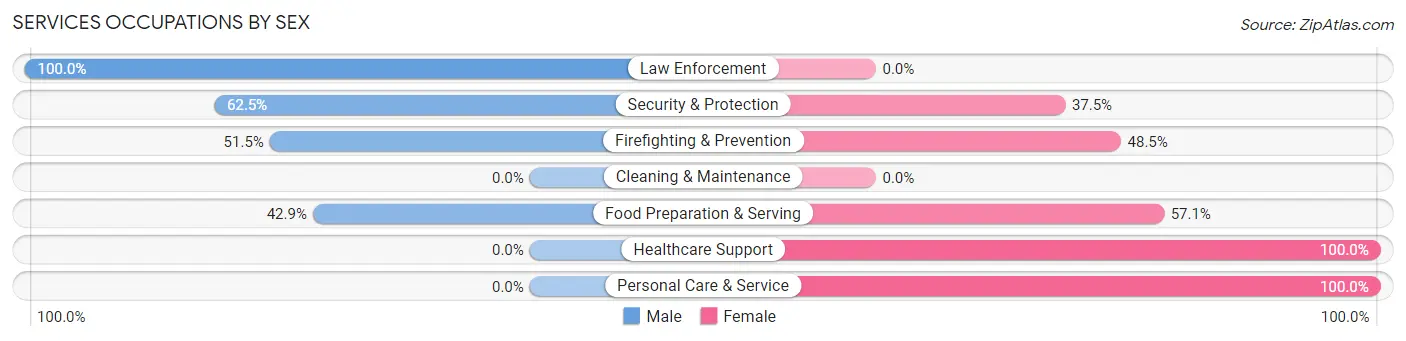
Services Occupations by Sex
Within the Services occupations in Scenic Oaks, the most male-oriented occupations are Law Enforcement (100.0%), Security & Protection (62.5%), and Firefighting & Prevention (51.5%), while the most female-oriented occupations are Healthcare Support (100.0%), Personal Care & Service (100.0%), and Food Preparation & Serving (57.1%).
| Occupation | Male | Female |
| Healthcare Support | 0 (0.0%) | 85 (100.0%) |
| Security & Protection | 55 (62.5%) | 33 (37.5%) |
| Firefighting & Prevention | 35 (51.5%) | 33 (48.5%) |
| Law Enforcement | 20 (100.0%) | 0 (0.0%) |
| Food Preparation & Serving | 76 (42.9%) | 101 (57.1%) |
| Cleaning & Maintenance | 0 (0.0%) | 0 (0.0%) |
| Personal Care & Service | 0 (0.0%) | 57 (100.0%) |
| Total (Category) | 131 (32.2%) | 276 (67.8%) |
| Total (Overall) | 2,676 (60.8%) | 1,726 (39.2%) |
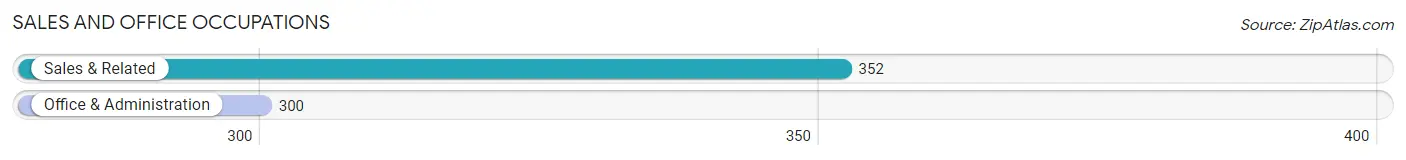
Sales and Office Occupations
The most common Sales and Office occupations in Scenic Oaks are Sales & Related (352 | 8.0%), and Office & Administration (300 | 6.8%).
Sales and Office Occupations by Sex
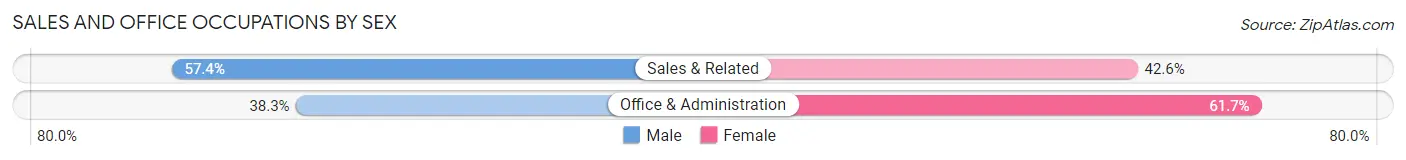
| Occupation | Male | Female |
| Sales & Related | 202 (57.4%) | 150 (42.6%) |
| Office & Administration | 115 (38.3%) | 185 (61.7%) |
| Total (Category) | 317 (48.6%) | 335 (51.4%) |
| Total (Overall) | 2,676 (60.8%) | 1,726 (39.2%) |
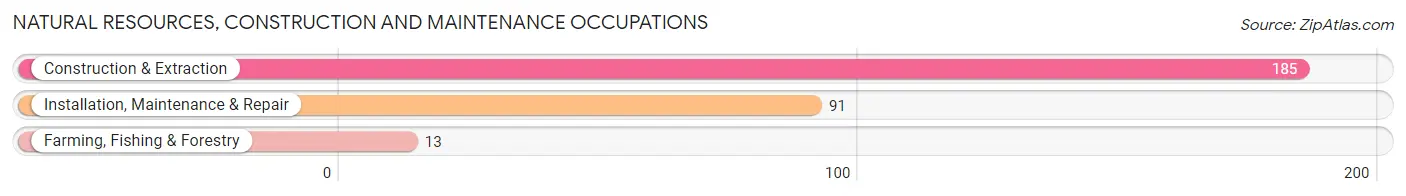
Natural Resources, Construction and Maintenance Occupations
The most common Natural Resources, Construction and Maintenance occupations in Scenic Oaks are Construction & Extraction (185 | 4.2%), Installation, Maintenance & Repair (91 | 2.1%), and Farming, Fishing & Forestry (13 | 0.3%).
Natural Resources, Construction and Maintenance Occupations by Sex
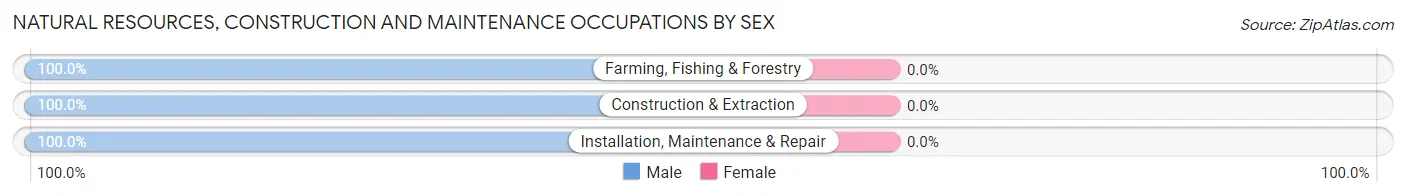
| Occupation | Male | Female |
| Farming, Fishing & Forestry | 13 (100.0%) | 0 (0.0%) |
| Construction & Extraction | 185 (100.0%) | 0 (0.0%) |
| Installation, Maintenance & Repair | 91 (100.0%) | 0 (0.0%) |
| Total (Category) | 289 (100.0%) | 0 (0.0%) |
| Total (Overall) | 2,676 (60.8%) | 1,726 (39.2%) |
Production, Transportation and Moving Occupations
The most common Production, Transportation and Moving occupations in Scenic Oaks are Transportation (113 | 2.6%), and Material Moving (100 | 2.3%).
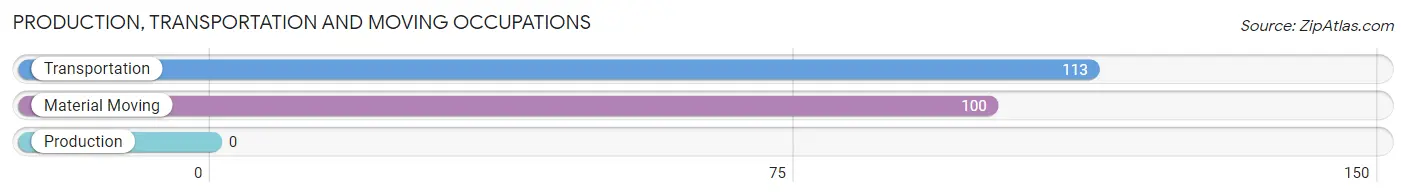
Production, Transportation and Moving Occupations by Sex
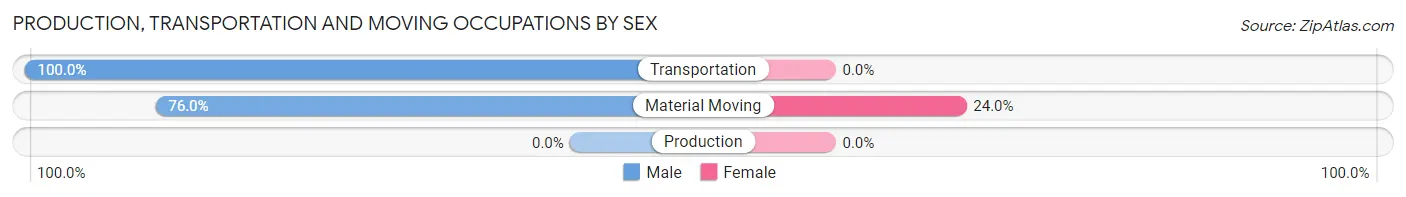
| Occupation | Male | Female |
| Production | 0 (0.0%) | 0 (0.0%) |
| Transportation | 113 (100.0%) | 0 (0.0%) |
| Material Moving | 76 (76.0%) | 24 (24.0%) |
| Total (Category) | 189 (88.7%) | 24 (11.3%) |
| Total (Overall) | 2,676 (60.8%) | 1,726 (39.2%) |
Employment Industries by Sex in Scenic Oaks
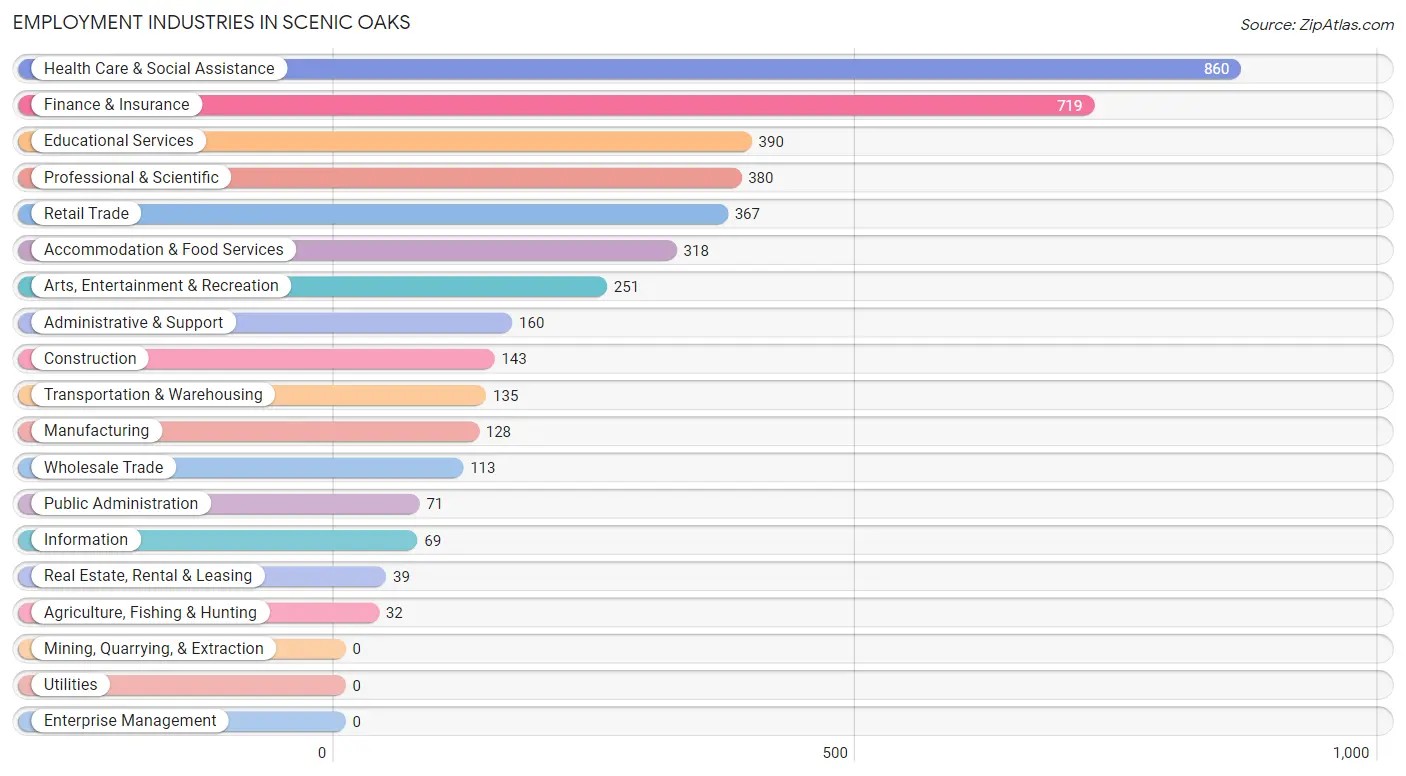
Employment Industries in Scenic Oaks
The major employment industries in Scenic Oaks include Health Care & Social Assistance (860 | 19.5%), Finance & Insurance (719 | 16.3%), Educational Services (390 | 8.9%), Professional & Scientific (380 | 8.6%), and Retail Trade (367 | 8.3%).
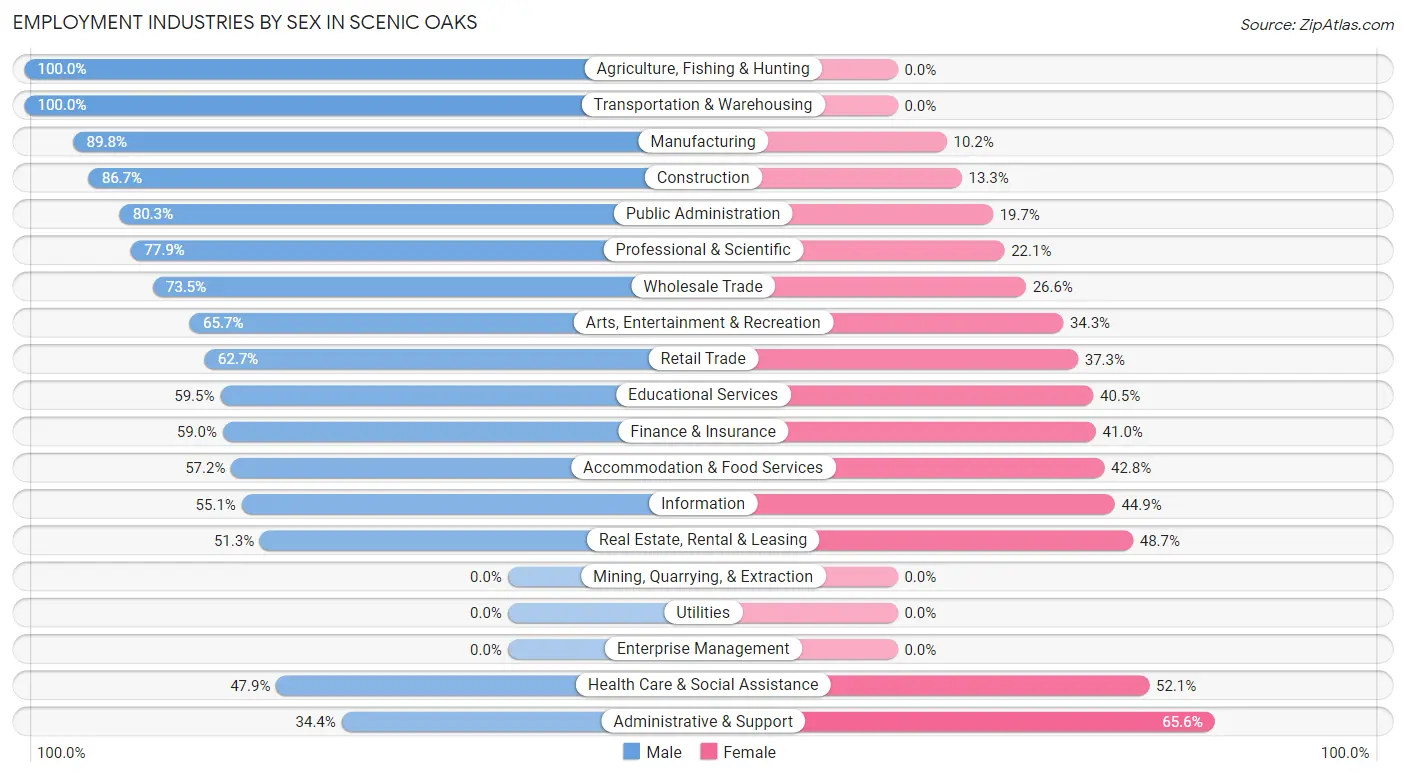
Employment Industries by Sex in Scenic Oaks
The Scenic Oaks industries that see more men than women are Agriculture, Fishing & Hunting (100.0%), Transportation & Warehousing (100.0%), and Manufacturing (89.8%), whereas the industries that tend to have a higher number of women are Administrative & Support (65.6%), Health Care & Social Assistance (52.1%), and Real Estate, Rental & Leasing (48.7%).
| Industry | Male | Female |
| Agriculture, Fishing & Hunting | 32 (100.0%) | 0 (0.0%) |
| Mining, Quarrying, & Extraction | 0 (0.0%) | 0 (0.0%) |
| Construction | 124 (86.7%) | 19 (13.3%) |
| Manufacturing | 115 (89.8%) | 13 (10.2%) |
| Wholesale Trade | 83 (73.5%) | 30 (26.6%) |
| Retail Trade | 230 (62.7%) | 137 (37.3%) |
| Transportation & Warehousing | 135 (100.0%) | 0 (0.0%) |
| Utilities | 0 (0.0%) | 0 (0.0%) |
| Information | 38 (55.1%) | 31 (44.9%) |
| Finance & Insurance | 424 (59.0%) | 295 (41.0%) |
| Real Estate, Rental & Leasing | 20 (51.3%) | 19 (48.7%) |
| Professional & Scientific | 296 (77.9%) | 84 (22.1%) |
| Enterprise Management | 0 (0.0%) | 0 (0.0%) |
| Administrative & Support | 55 (34.4%) | 105 (65.6%) |
| Educational Services | 232 (59.5%) | 158 (40.5%) |
| Health Care & Social Assistance | 412 (47.9%) | 448 (52.1%) |
| Arts, Entertainment & Recreation | 165 (65.7%) | 86 (34.3%) |
| Accommodation & Food Services | 182 (57.2%) | 136 (42.8%) |
| Public Administration | 57 (80.3%) | 14 (19.7%) |
| Total | 2,676 (60.8%) | 1,726 (39.2%) |
Education in Scenic Oaks
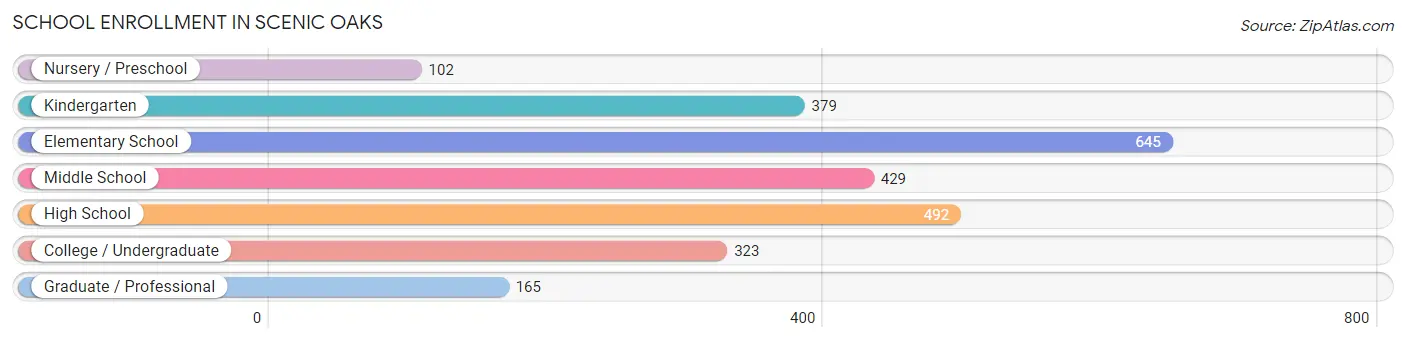
School Enrollment in Scenic Oaks
The most common levels of schooling among the 2,535 students in Scenic Oaks are elementary school (645 | 25.4%), high school (492 | 19.4%), and middle school (429 | 16.9%).
| School Level | # Students | % Students |
| Nursery / Preschool | 102 | 4.0% |
| Kindergarten | 379 | 14.9% |
| Elementary School | 645 | 25.4% |
| Middle School | 429 | 16.9% |
| High School | 492 | 19.4% |
| College / Undergraduate | 323 | 12.7% |
| Graduate / Professional | 165 | 6.5% |
| Total | 2,535 | 100.0% |
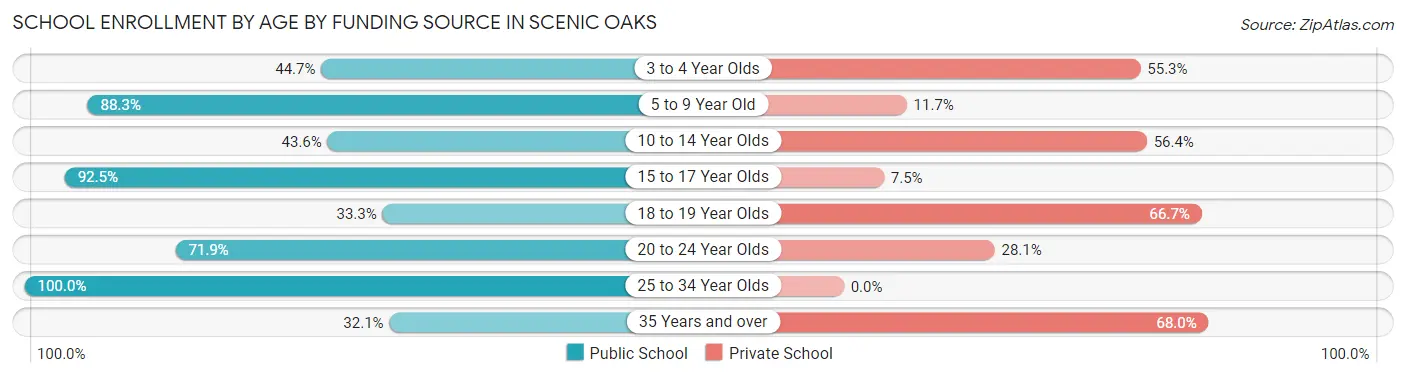
School Enrollment by Age by Funding Source in Scenic Oaks
Out of a total of 2,535 students who are enrolled in schools in Scenic Oaks, 801 (31.6%) attend a private institution, while the remaining 1,734 (68.4%) are enrolled in public schools. The age group of 35 years and over has the highest likelihood of being enrolled in private schools, with 53 (67.9% in the age bracket) enrolled. Conversely, the age group of 25 to 34 year olds has the lowest likelihood of being enrolled in a private school, with 43 (100.0% in the age bracket) attending a public institution.
| Age Bracket | Public School | Private School |
| 3 to 4 Year Olds | 34 (44.7%) | 42 (55.3%) |
| 5 to 9 Year Old | 775 (88.3%) | 103 (11.7%) |
| 10 to 14 Year Olds | 274 (43.6%) | 355 (56.4%) |
| 15 to 17 Year Olds | 334 (92.5%) | 27 (7.5%) |
| 18 to 19 Year Olds | 76 (33.3%) | 152 (66.7%) |
| 20 to 24 Year Olds | 174 (71.9%) | 68 (28.1%) |
| 25 to 34 Year Olds | 43 (100.0%) | 0 (0.0%) |
| 35 Years and over | 25 (32.1%) | 53 (67.9%) |
| Total | 1,734 (68.4%) | 801 (31.6%) |
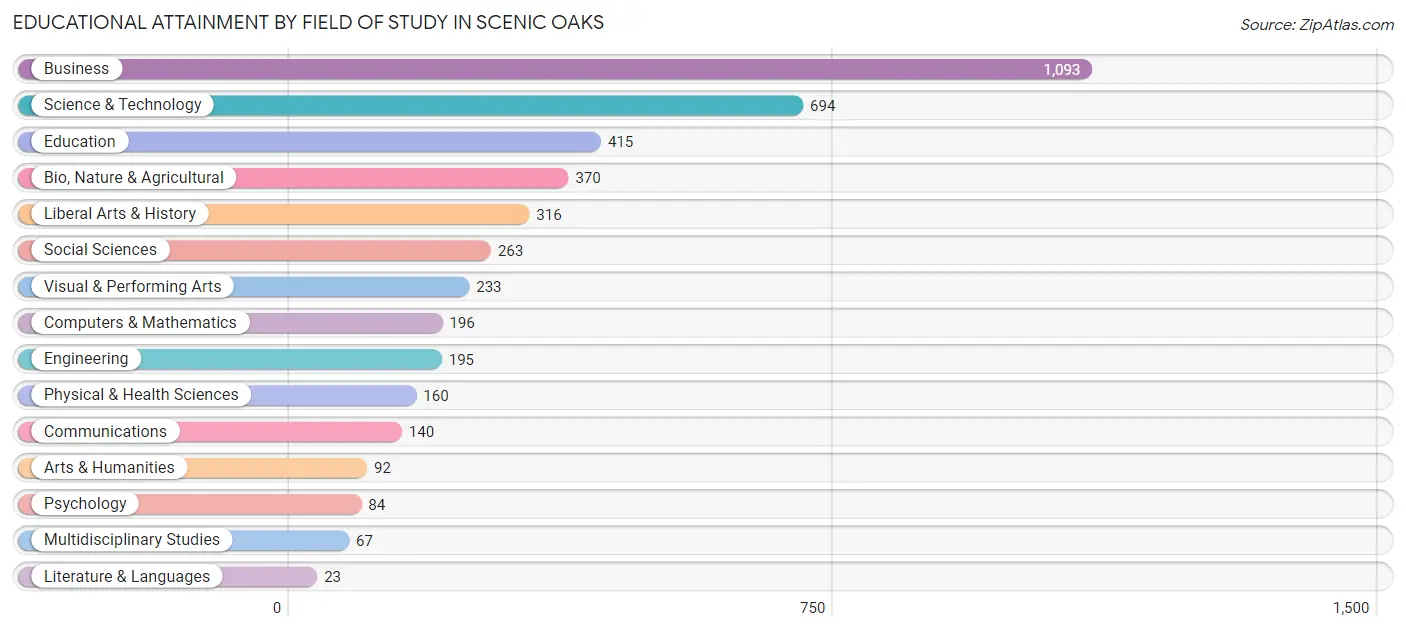
Educational Attainment by Field of Study in Scenic Oaks
Business (1,093 | 25.2%), science & technology (694 | 16.0%), education (415 | 9.6%), bio, nature & agricultural (370 | 8.5%), and liberal arts & history (316 | 7.3%) are the most common fields of study among 4,341 individuals in Scenic Oaks who have obtained a bachelor's degree or higher.
| Field of Study | # Graduates | % Graduates |
| Computers & Mathematics | 196 | 4.5% |
| Bio, Nature & Agricultural | 370 | 8.5% |
| Physical & Health Sciences | 160 | 3.7% |
| Psychology | 84 | 1.9% |
| Social Sciences | 263 | 6.1% |
| Engineering | 195 | 4.5% |
| Multidisciplinary Studies | 67 | 1.5% |
| Science & Technology | 694 | 16.0% |
| Business | 1,093 | 25.2% |
| Education | 415 | 9.6% |
| Literature & Languages | 23 | 0.5% |
| Liberal Arts & History | 316 | 7.3% |
| Visual & Performing Arts | 233 | 5.4% |
| Communications | 140 | 3.2% |
| Arts & Humanities | 92 | 2.1% |
| Total | 4,341 | 100.0% |
Transportation & Commute in Scenic Oaks
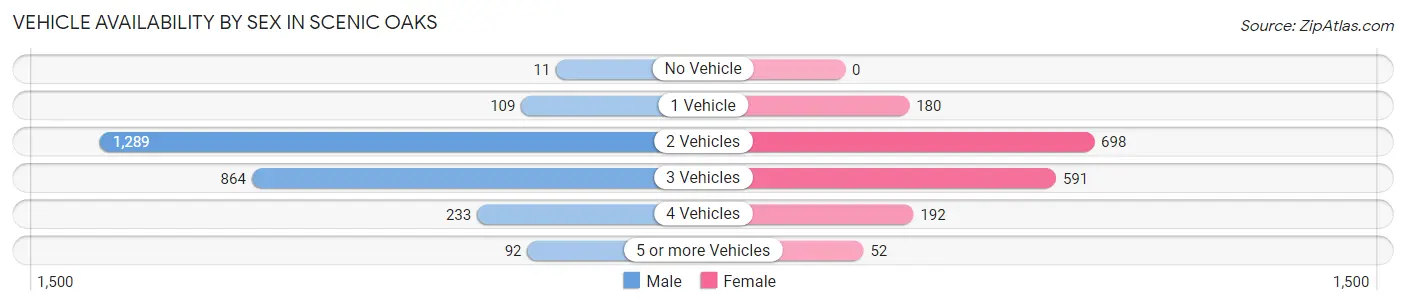
Vehicle Availability by Sex in Scenic Oaks
The most prevalent vehicle ownership categories in Scenic Oaks are males with 2 vehicles (1,289, accounting for 49.6%) and females with 2 vehicles (698, making up 75.2%).
| Vehicles Available | Male | Female |
| No Vehicle | 11 (0.4%) | 0 (0.0%) |
| 1 Vehicle | 109 (4.2%) | 180 (10.5%) |
| 2 Vehicles | 1,289 (49.6%) | 698 (40.7%) |
| 3 Vehicles | 864 (33.3%) | 591 (34.5%) |
| 4 Vehicles | 233 (9.0%) | 192 (11.2%) |
| 5 or more Vehicles | 92 (3.5%) | 52 (3.0%) |
| Total | 2,598 (100.0%) | 1,713 (100.0%) |
Commute Time in Scenic Oaks
The most frequently occuring commute durations in Scenic Oaks are 20 to 24 minutes (755 commuters, 21.7%), 30 to 34 minutes (550 commuters, 15.8%), and 15 to 19 minutes (503 commuters, 14.5%).
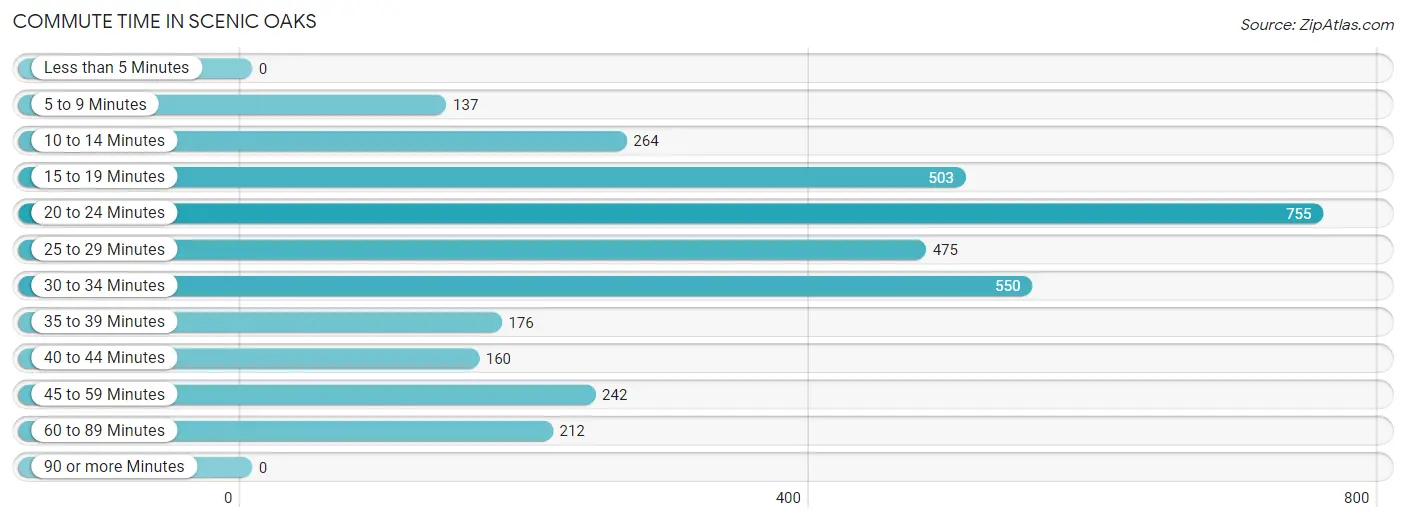
| Commute Time | # Commuters | % Commuters |
| Less than 5 Minutes | 0 | 0.0% |
| 5 to 9 Minutes | 137 | 3.9% |
| 10 to 14 Minutes | 264 | 7.6% |
| 15 to 19 Minutes | 503 | 14.5% |
| 20 to 24 Minutes | 755 | 21.7% |
| 25 to 29 Minutes | 475 | 13.7% |
| 30 to 34 Minutes | 550 | 15.8% |
| 35 to 39 Minutes | 176 | 5.1% |
| 40 to 44 Minutes | 160 | 4.6% |
| 45 to 59 Minutes | 242 | 7.0% |
| 60 to 89 Minutes | 212 | 6.1% |
| 90 or more Minutes | 0 | 0.0% |
Commute Time by Sex in Scenic Oaks
The most common commute times in Scenic Oaks are 20 to 24 minutes (481 commuters, 23.1%) for males and 30 to 34 minutes (305 commuters, 21.9%) for females.
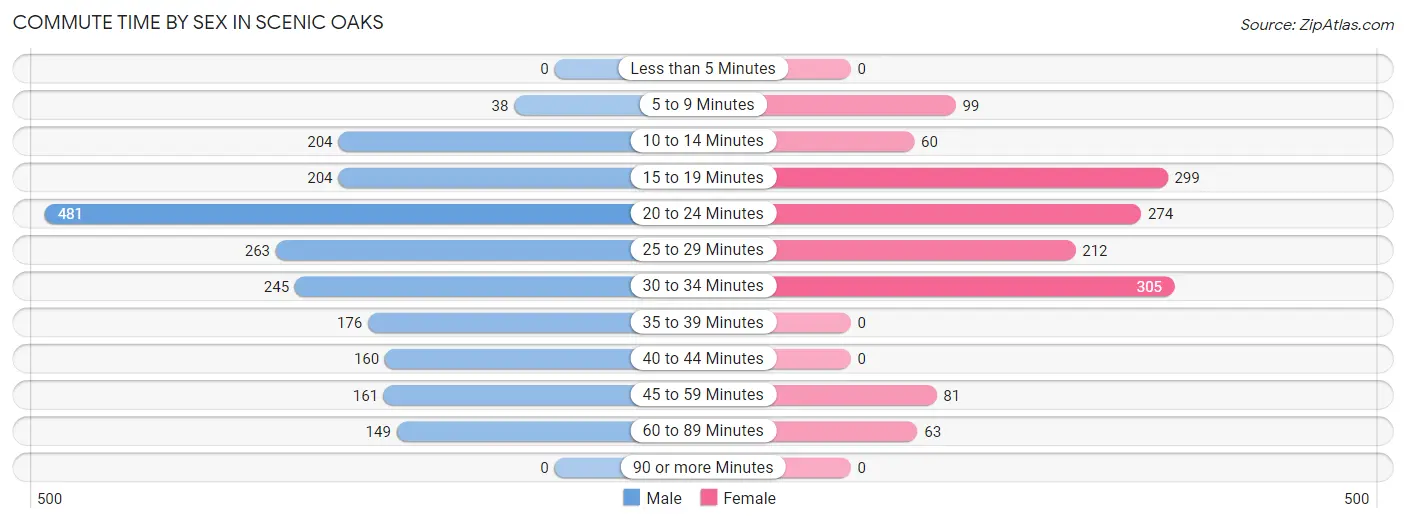
| Commute Time | Male | Female |
| Less than 5 Minutes | 0 (0.0%) | 0 (0.0%) |
| 5 to 9 Minutes | 38 (1.8%) | 99 (7.1%) |
| 10 to 14 Minutes | 204 (9.8%) | 60 (4.3%) |
| 15 to 19 Minutes | 204 (9.8%) | 299 (21.5%) |
| 20 to 24 Minutes | 481 (23.1%) | 274 (19.7%) |
| 25 to 29 Minutes | 263 (12.6%) | 212 (15.2%) |
| 30 to 34 Minutes | 245 (11.8%) | 305 (21.9%) |
| 35 to 39 Minutes | 176 (8.5%) | 0 (0.0%) |
| 40 to 44 Minutes | 160 (7.7%) | 0 (0.0%) |
| 45 to 59 Minutes | 161 (7.7%) | 81 (5.8%) |
| 60 to 89 Minutes | 149 (7.2%) | 63 (4.5%) |
| 90 or more Minutes | 0 (0.0%) | 0 (0.0%) |
Time of Departure to Work by Sex in Scenic Oaks
The most frequent times of departure to work in Scenic Oaks are 7:00 AM to 7:29 AM (367, 17.6%) for males and 6:30 AM to 6:59 AM (395, 28.4%) for females.
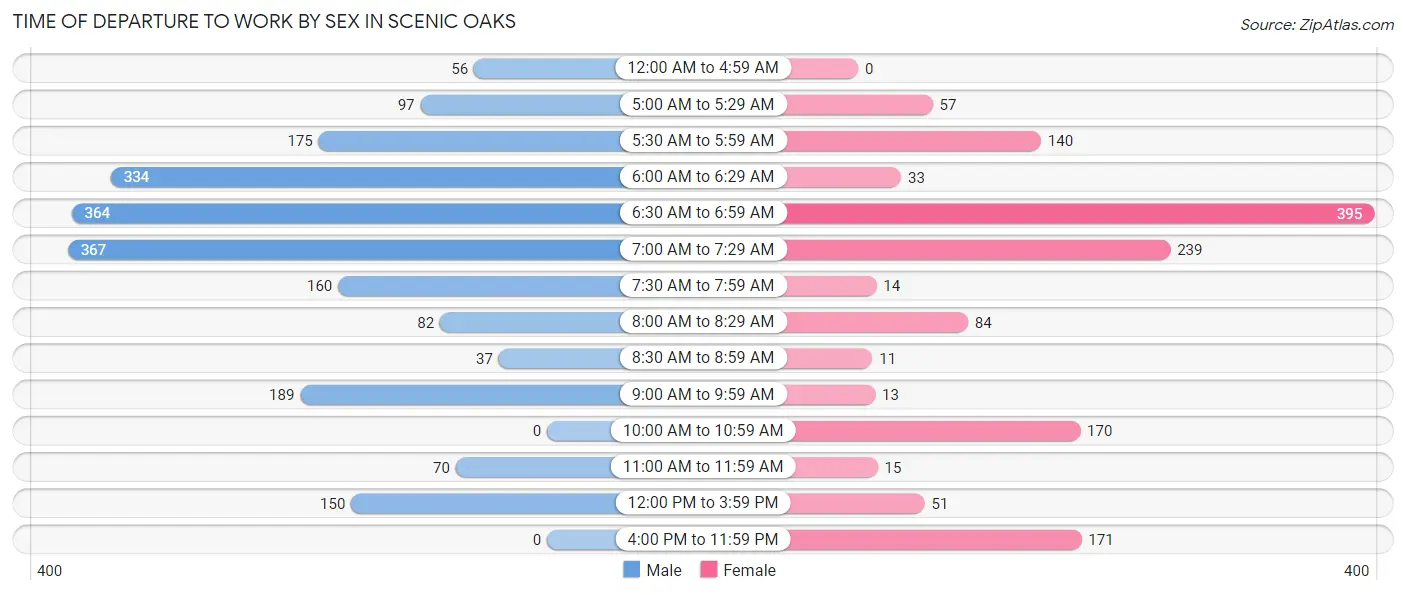
| Time of Departure | Male | Female |
| 12:00 AM to 4:59 AM | 56 (2.7%) | 0 (0.0%) |
| 5:00 AM to 5:29 AM | 97 (4.7%) | 57 (4.1%) |
| 5:30 AM to 5:59 AM | 175 (8.4%) | 140 (10.1%) |
| 6:00 AM to 6:29 AM | 334 (16.1%) | 33 (2.4%) |
| 6:30 AM to 6:59 AM | 364 (17.5%) | 395 (28.4%) |
| 7:00 AM to 7:29 AM | 367 (17.6%) | 239 (17.2%) |
| 7:30 AM to 7:59 AM | 160 (7.7%) | 14 (1.0%) |
| 8:00 AM to 8:29 AM | 82 (3.9%) | 84 (6.0%) |
| 8:30 AM to 8:59 AM | 37 (1.8%) | 11 (0.8%) |
| 9:00 AM to 9:59 AM | 189 (9.1%) | 13 (0.9%) |
| 10:00 AM to 10:59 AM | 0 (0.0%) | 170 (12.2%) |
| 11:00 AM to 11:59 AM | 70 (3.4%) | 15 (1.1%) |
| 12:00 PM to 3:59 PM | 150 (7.2%) | 51 (3.7%) |
| 4:00 PM to 11:59 PM | 0 (0.0%) | 171 (12.3%) |
| Total | 2,081 (100.0%) | 1,393 (100.0%) |
Housing Occupancy in Scenic Oaks
Occupancy by Ownership in Scenic Oaks
Of the total 3,427 dwellings in Scenic Oaks, owner-occupied units account for 2,908 (84.9%), while renter-occupied units make up 519 (15.1%).
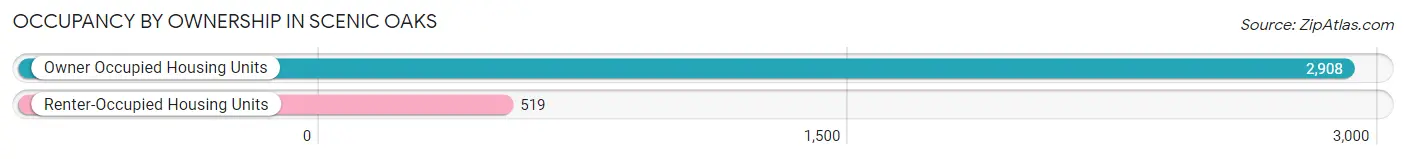
| Occupancy | # Housing Units | % Housing Units |
| Owner Occupied Housing Units | 2,908 | 84.9% |
| Renter-Occupied Housing Units | 519 | 15.1% |
| Total Occupied Housing Units | 3,427 | 100.0% |
Occupancy by Household Size in Scenic Oaks
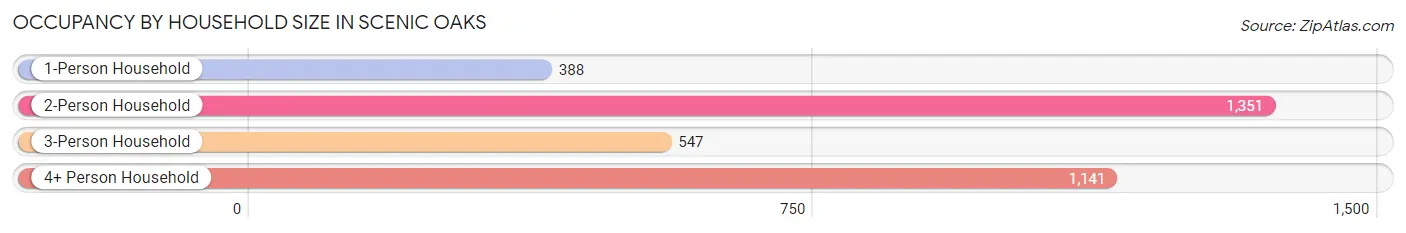
| Household Size | # Housing Units | % Housing Units |
| 1-Person Household | 388 | 11.3% |
| 2-Person Household | 1,351 | 39.4% |
| 3-Person Household | 547 | 16.0% |
| 4+ Person Household | 1,141 | 33.3% |
| Total Housing Units | 3,427 | 100.0% |
Occupancy by Ownership by Household Size in Scenic Oaks
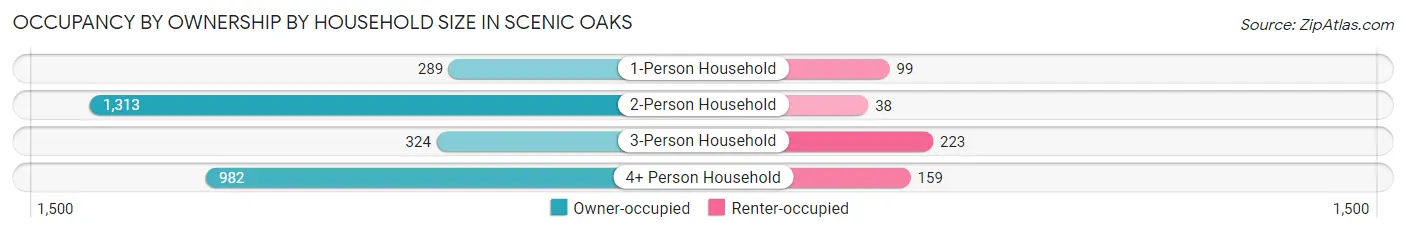
| Household Size | Owner-occupied | Renter-occupied |
| 1-Person Household | 289 (74.5%) | 99 (25.5%) |
| 2-Person Household | 1,313 (97.2%) | 38 (2.8%) |
| 3-Person Household | 324 (59.2%) | 223 (40.8%) |
| 4+ Person Household | 982 (86.1%) | 159 (13.9%) |
| Total Housing Units | 2,908 (84.9%) | 519 (15.1%) |
Occupancy by Educational Attainment in Scenic Oaks
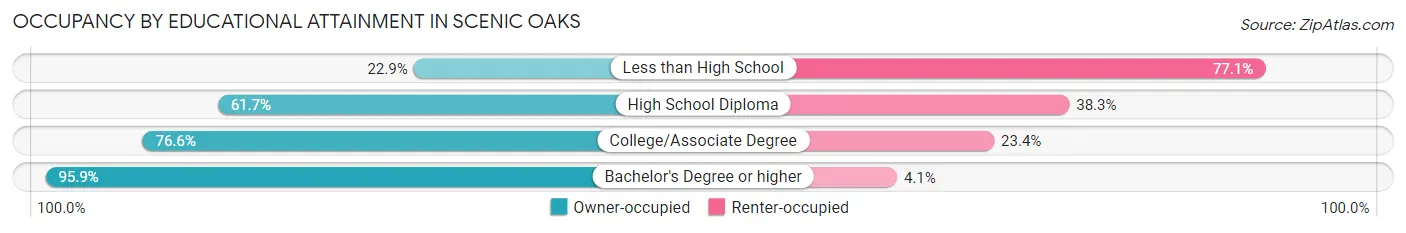
| Household Size | Owner-occupied | Renter-occupied |
| Less than High School | 49 (22.9%) | 165 (77.1%) |
| High School Diploma | 108 (61.7%) | 67 (38.3%) |
| College/Associate Degree | 642 (76.6%) | 196 (23.4%) |
| Bachelor's Degree or higher | 2,109 (95.9%) | 91 (4.1%) |
Occupancy by Age of Householder in Scenic Oaks
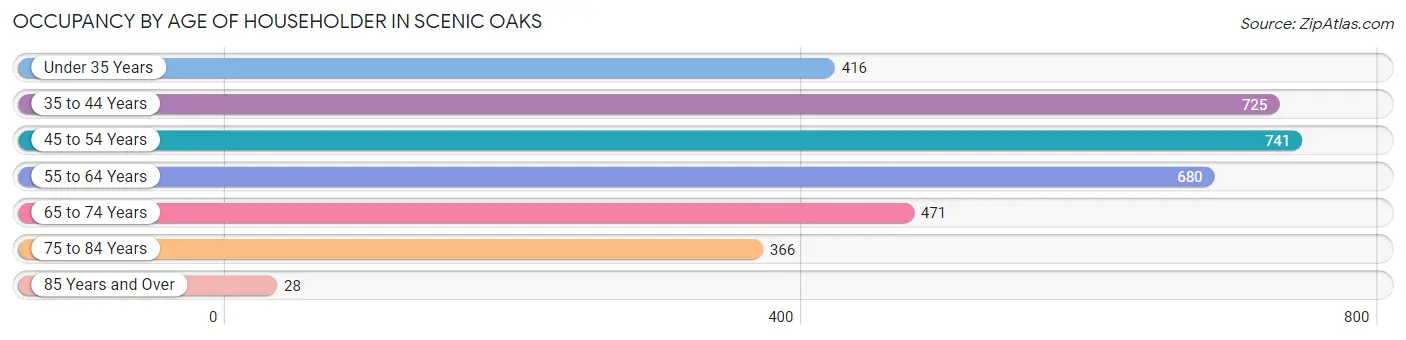
| Age Bracket | # Households | % Households |
| Under 35 Years | 416 | 12.1% |
| 35 to 44 Years | 725 | 21.2% |
| 45 to 54 Years | 741 | 21.6% |
| 55 to 64 Years | 680 | 19.8% |
| 65 to 74 Years | 471 | 13.7% |
| 75 to 84 Years | 366 | 10.7% |
| 85 Years and Over | 28 | 0.8% |
| Total | 3,427 | 100.0% |
Housing Finances in Scenic Oaks
Median Income by Occupancy in Scenic Oaks
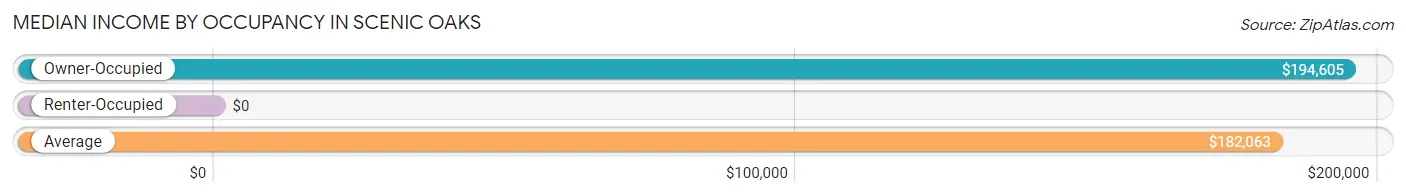
| Occupancy Type | # Households | Median Income |
| Owner-Occupied | 2,908 (84.9%) | $194,605 |
| Renter-Occupied | 519 (15.1%) | $0 |
| Average | 3,427 (100.0%) | $182,063 |
Occupancy by Householder Income Bracket in Scenic Oaks
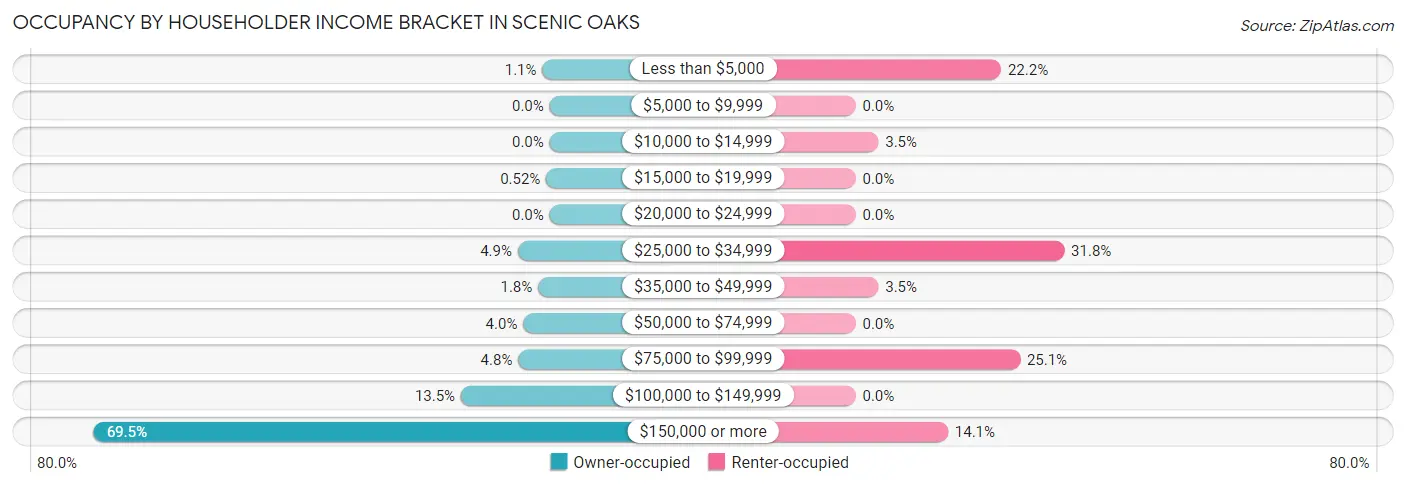
| Income Bracket | Owner-occupied | Renter-occupied |
| Less than $5,000 | 32 (1.1%) | 115 (22.2%) |
| $5,000 to $9,999 | 0 (0.0%) | 0 (0.0%) |
| $10,000 to $14,999 | 0 (0.0%) | 18 (3.5%) |
| $15,000 to $19,999 | 15 (0.5%) | 0 (0.0%) |
| $20,000 to $24,999 | 0 (0.0%) | 0 (0.0%) |
| $25,000 to $34,999 | 141 (4.9%) | 165 (31.8%) |
| $35,000 to $49,999 | 51 (1.8%) | 18 (3.5%) |
| $50,000 to $74,999 | 117 (4.0%) | 0 (0.0%) |
| $75,000 to $99,999 | 139 (4.8%) | 130 (25.1%) |
| $100,000 to $149,999 | 393 (13.5%) | 0 (0.0%) |
| $150,000 or more | 2,020 (69.5%) | 73 (14.1%) |
| Total | 2,908 (100.0%) | 519 (100.0%) |
Monthly Housing Cost Tiers in Scenic Oaks
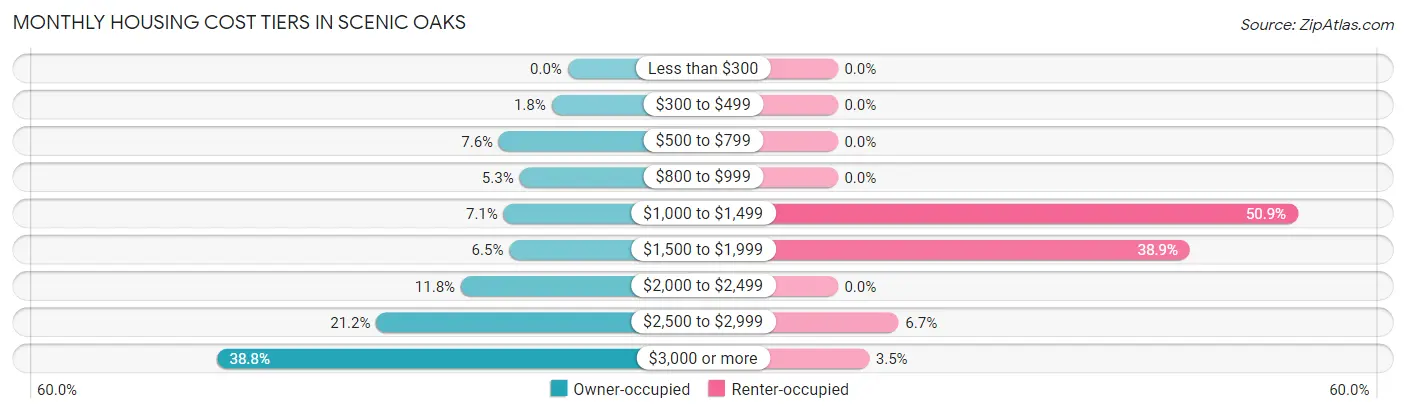
| Monthly Cost | Owner-occupied | Renter-occupied |
| Less than $300 | 0 (0.0%) | 0 (0.0%) |
| $300 to $499 | 52 (1.8%) | 0 (0.0%) |
| $500 to $799 | 221 (7.6%) | 0 (0.0%) |
| $800 to $999 | 155 (5.3%) | 0 (0.0%) |
| $1,000 to $1,499 | 206 (7.1%) | 264 (50.9%) |
| $1,500 to $1,999 | 188 (6.5%) | 202 (38.9%) |
| $2,000 to $2,499 | 343 (11.8%) | 0 (0.0%) |
| $2,500 to $2,999 | 615 (21.1%) | 35 (6.7%) |
| $3,000 or more | 1,128 (38.8%) | 18 (3.5%) |
| Total | 2,908 (100.0%) | 519 (100.0%) |
Physical Housing Characteristics in Scenic Oaks
Housing Structures in Scenic Oaks
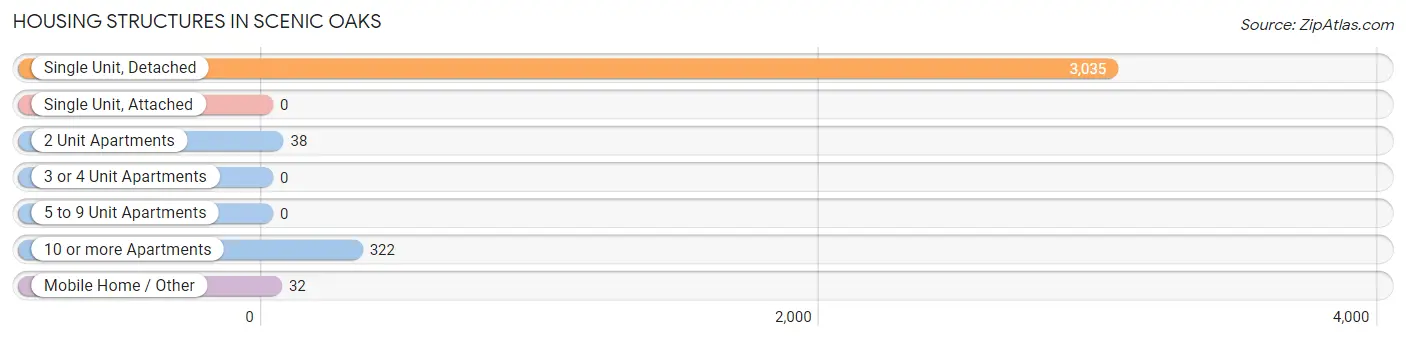
| Structure Type | # Housing Units | % Housing Units |
| Single Unit, Detached | 3,035 | 88.6% |
| Single Unit, Attached | 0 | 0.0% |
| 2 Unit Apartments | 38 | 1.1% |
| 3 or 4 Unit Apartments | 0 | 0.0% |
| 5 to 9 Unit Apartments | 0 | 0.0% |
| 10 or more Apartments | 322 | 9.4% |
| Mobile Home / Other | 32 | 0.9% |
| Total | 3,427 | 100.0% |
Housing Structures by Occupancy in Scenic Oaks
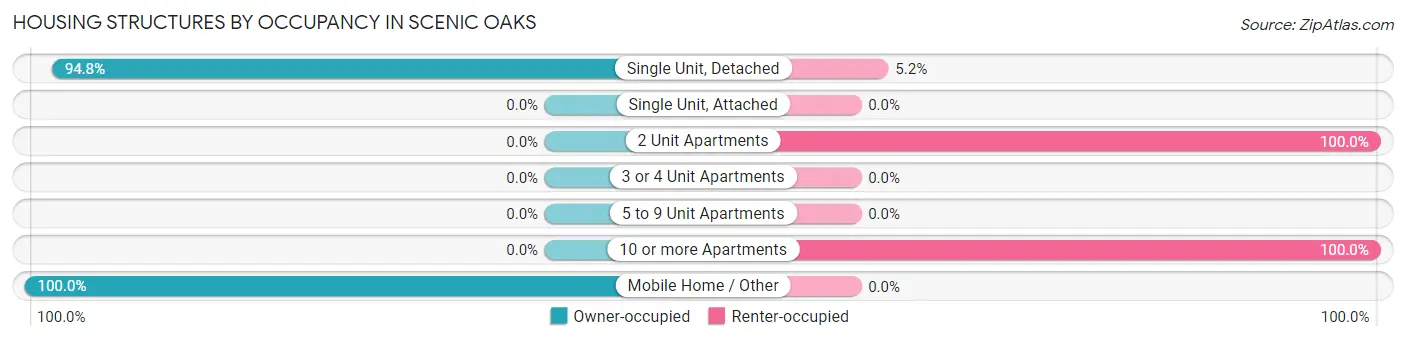
| Structure Type | Owner-occupied | Renter-occupied |
| Single Unit, Detached | 2,876 (94.8%) | 159 (5.2%) |
| Single Unit, Attached | 0 (0.0%) | 0 (0.0%) |
| 2 Unit Apartments | 0 (0.0%) | 38 (100.0%) |
| 3 or 4 Unit Apartments | 0 (0.0%) | 0 (0.0%) |
| 5 to 9 Unit Apartments | 0 (0.0%) | 0 (0.0%) |
| 10 or more Apartments | 0 (0.0%) | 322 (100.0%) |
| Mobile Home / Other | 32 (100.0%) | 0 (0.0%) |
| Total | 2,908 (84.9%) | 519 (15.1%) |
Housing Structures by Number of Rooms in Scenic Oaks
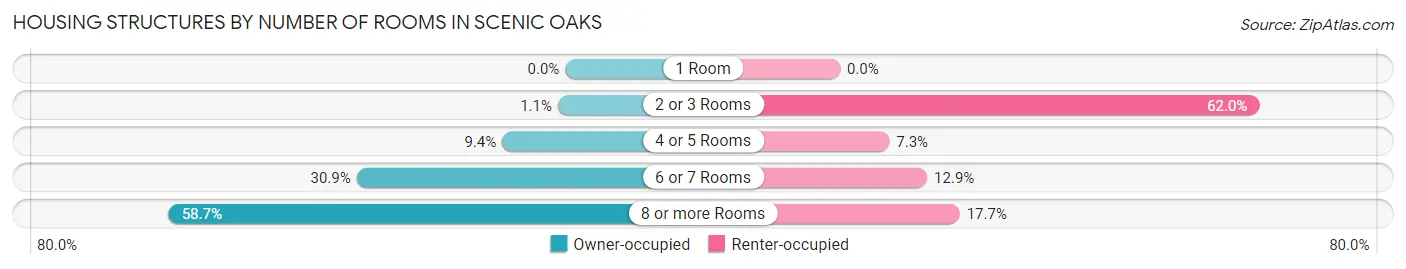
| Number of Rooms | Owner-occupied | Renter-occupied |
| 1 Room | 0 (0.0%) | 0 (0.0%) |
| 2 or 3 Rooms | 32 (1.1%) | 322 (62.0%) |
| 4 or 5 Rooms | 272 (9.3%) | 38 (7.3%) |
| 6 or 7 Rooms | 898 (30.9%) | 67 (12.9%) |
| 8 or more Rooms | 1,706 (58.7%) | 92 (17.7%) |
| Total | 2,908 (100.0%) | 519 (100.0%) |
Housing Structure by Heating Type in Scenic Oaks
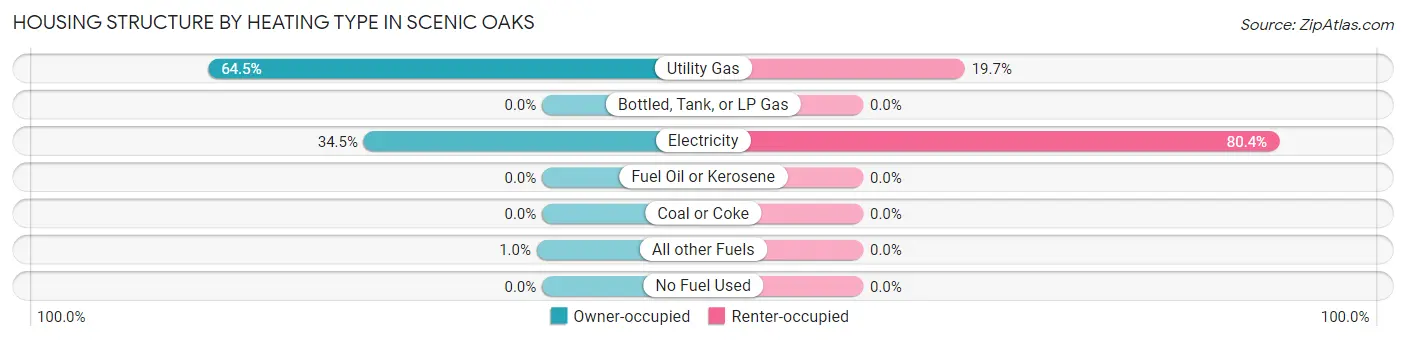
| Heating Type | Owner-occupied | Renter-occupied |
| Utility Gas | 1,876 (64.5%) | 102 (19.7%) |
| Bottled, Tank, or LP Gas | 0 (0.0%) | 0 (0.0%) |
| Electricity | 1,002 (34.5%) | 417 (80.3%) |
| Fuel Oil or Kerosene | 0 (0.0%) | 0 (0.0%) |
| Coal or Coke | 0 (0.0%) | 0 (0.0%) |
| All other Fuels | 30 (1.0%) | 0 (0.0%) |
| No Fuel Used | 0 (0.0%) | 0 (0.0%) |
| Total | 2,908 (100.0%) | 519 (100.0%) |
Household Vehicle Usage in Scenic Oaks
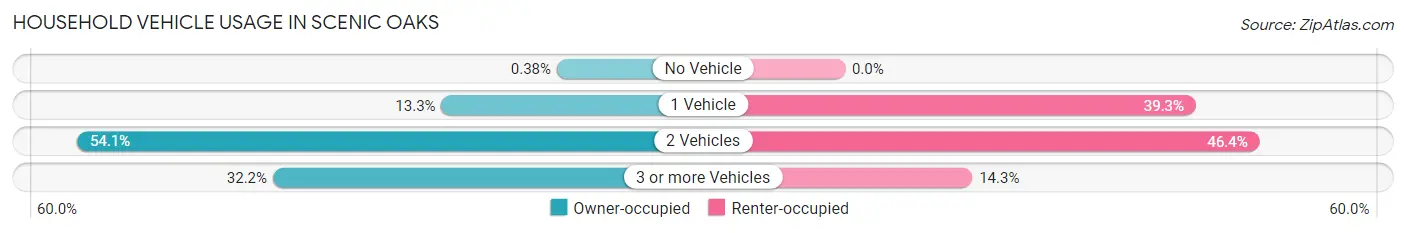
| Vehicles per Household | Owner-occupied | Renter-occupied |
| No Vehicle | 11 (0.4%) | 0 (0.0%) |
| 1 Vehicle | 387 (13.3%) | 204 (39.3%) |
| 2 Vehicles | 1,574 (54.1%) | 241 (46.4%) |
| 3 or more Vehicles | 936 (32.2%) | 74 (14.3%) |
| Total | 2,908 (100.0%) | 519 (100.0%) |
Real Estate & Mortgages in Scenic Oaks
Real Estate and Mortgage Overview in Scenic Oaks
| Characteristic | Without Mortgage | With Mortgage |
| Housing Units | 787 | 2,121 |
| Median Property Value | $463,600 | $493,700 |
| Median Household Income | $160,750 | $1,563 |
| Monthly Housing Costs | $965 | $1,128 |
| Real Estate Taxes | $6,330 | $115 |
Property Value by Mortgage Status in Scenic Oaks
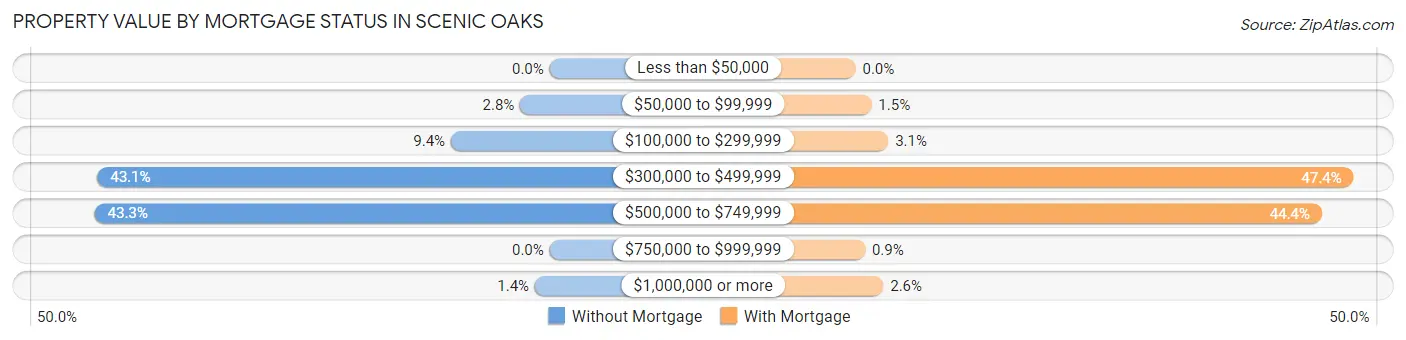
| Property Value | Without Mortgage | With Mortgage |
| Less than $50,000 | 0 (0.0%) | 0 (0.0%) |
| $50,000 to $99,999 | 22 (2.8%) | 32 (1.5%) |
| $100,000 to $299,999 | 74 (9.4%) | 66 (3.1%) |
| $300,000 to $499,999 | 339 (43.1%) | 1,006 (47.4%) |
| $500,000 to $749,999 | 341 (43.3%) | 942 (44.4%) |
| $750,000 to $999,999 | 0 (0.0%) | 19 (0.9%) |
| $1,000,000 or more | 11 (1.4%) | 56 (2.6%) |
| Total | 787 (100.0%) | 2,121 (100.0%) |
Household Income by Mortgage Status in Scenic Oaks
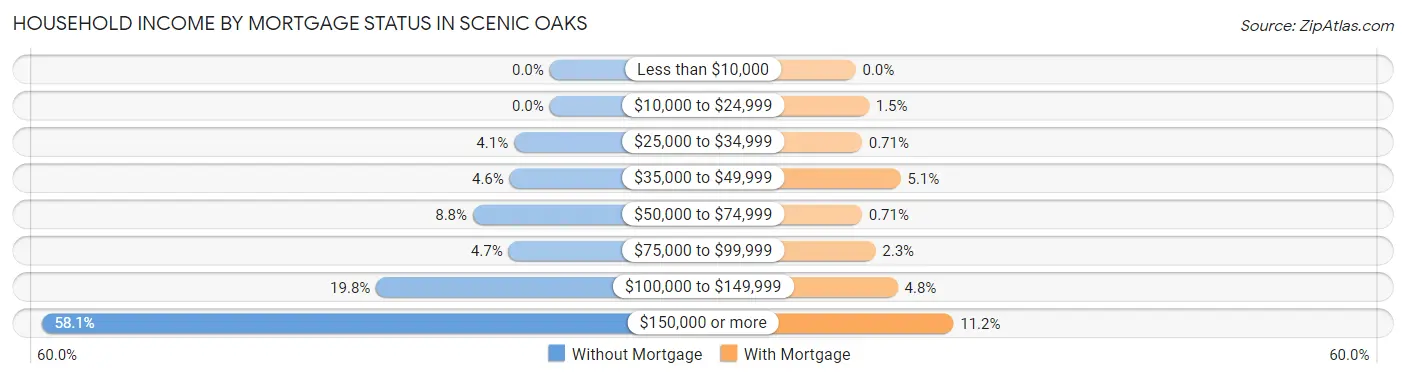
| Household Income | Without Mortgage | With Mortgage |
| Less than $10,000 | 0 (0.0%) | 0 (0.0%) |
| $10,000 to $24,999 | 0 (0.0%) | 32 (1.5%) |
| $25,000 to $34,999 | 32 (4.1%) | 15 (0.7%) |
| $35,000 to $49,999 | 36 (4.6%) | 109 (5.1%) |
| $50,000 to $74,999 | 69 (8.8%) | 15 (0.7%) |
| $75,000 to $99,999 | 37 (4.7%) | 48 (2.3%) |
| $100,000 to $149,999 | 156 (19.8%) | 102 (4.8%) |
| $150,000 or more | 457 (58.1%) | 237 (11.2%) |
| Total | 787 (100.0%) | 2,121 (100.0%) |
Property Value to Household Income Ratio in Scenic Oaks
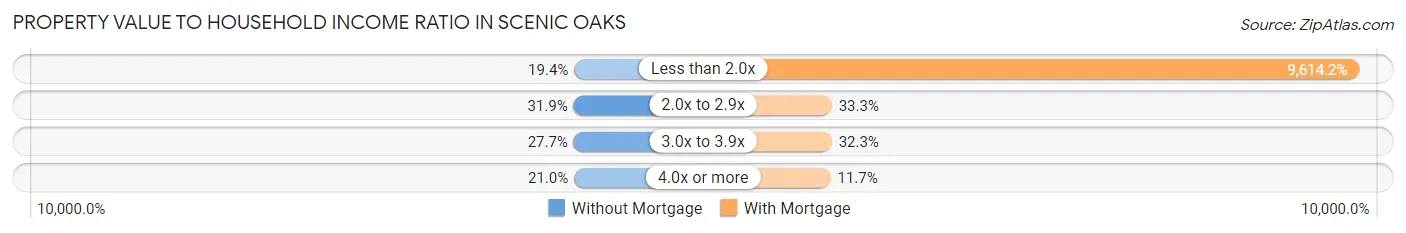
| Value-to-Income Ratio | Without Mortgage | With Mortgage |
| Less than 2.0x | 153 (19.4%) | 203,917 (9,614.2%) |
| 2.0x to 2.9x | 251 (31.9%) | 707 (33.3%) |
| 3.0x to 3.9x | 218 (27.7%) | 684 (32.3%) |
| 4.0x or more | 165 (21.0%) | 249 (11.7%) |
| Total | 787 (100.0%) | 2,121 (100.0%) |
Real Estate Taxes by Mortgage Status in Scenic Oaks
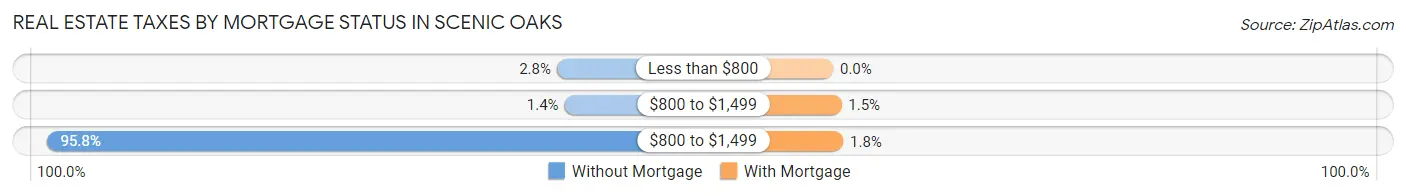
| Property Taxes | Without Mortgage | With Mortgage |
| Less than $800 | 22 (2.8%) | 0 (0.0%) |
| $800 to $1,499 | 11 (1.4%) | 32 (1.5%) |
| $800 to $1,499 | 754 (95.8%) | 39 (1.8%) |
| Total | 787 (100.0%) | 2,121 (100.0%) |
Health & Disability in Scenic Oaks
Health Insurance Coverage by Age in Scenic Oaks
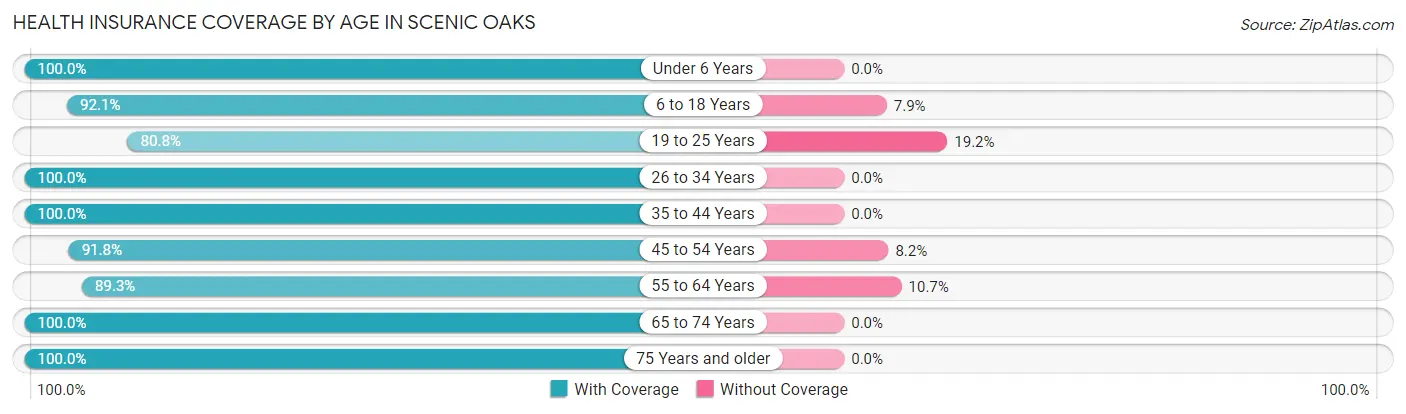
| Age Bracket | With Coverage | Without Coverage |
| Under 6 Years | 933 (100.0%) | 0 (0.0%) |
| 6 to 18 Years | 1,741 (92.1%) | 150 (7.9%) |
| 19 to 25 Years | 538 (80.8%) | 128 (19.2%) |
| 26 to 34 Years | 634 (100.0%) | 0 (0.0%) |
| 35 to 44 Years | 1,600 (100.0%) | 0 (0.0%) |
| 45 to 54 Years | 1,136 (91.8%) | 102 (8.2%) |
| 55 to 64 Years | 1,237 (89.3%) | 148 (10.7%) |
| 65 to 74 Years | 953 (100.0%) | 0 (0.0%) |
| 75 Years and older | 759 (100.0%) | 0 (0.0%) |
| Total | 9,531 (94.8%) | 528 (5.2%) |
Health Insurance Coverage by Citizenship Status in Scenic Oaks
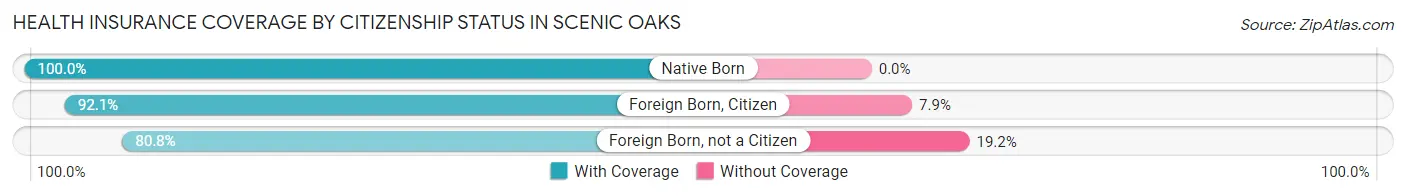
| Citizenship Status | With Coverage | Without Coverage |
| Native Born | 933 (100.0%) | 0 (0.0%) |
| Foreign Born, Citizen | 1,741 (92.1%) | 150 (7.9%) |
| Foreign Born, not a Citizen | 538 (80.8%) | 128 (19.2%) |
Health Insurance Coverage by Household Income in Scenic Oaks
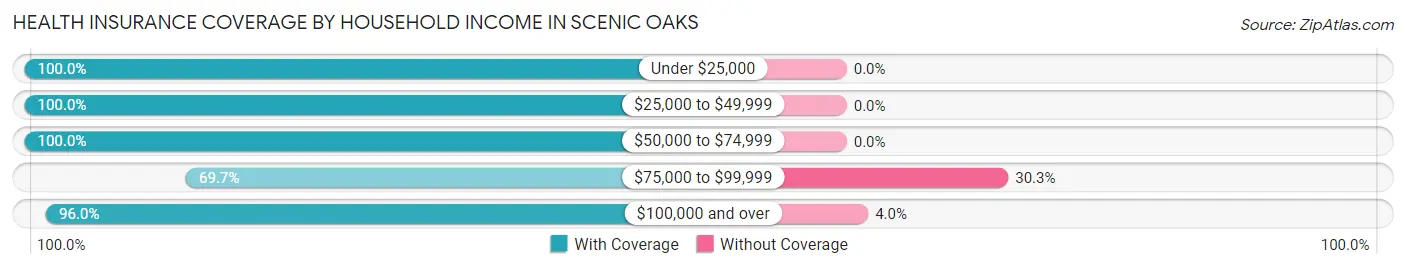
| Household Income | With Coverage | Without Coverage |
| Under $25,000 | 449 (100.0%) | 0 (0.0%) |
| $25,000 to $49,999 | 967 (100.0%) | 0 (0.0%) |
| $50,000 to $74,999 | 193 (100.0%) | 0 (0.0%) |
| $75,000 to $99,999 | 500 (69.7%) | 217 (30.3%) |
| $100,000 and over | 7,422 (96.0%) | 311 (4.0%) |
Public vs Private Health Insurance Coverage by Age in Scenic Oaks
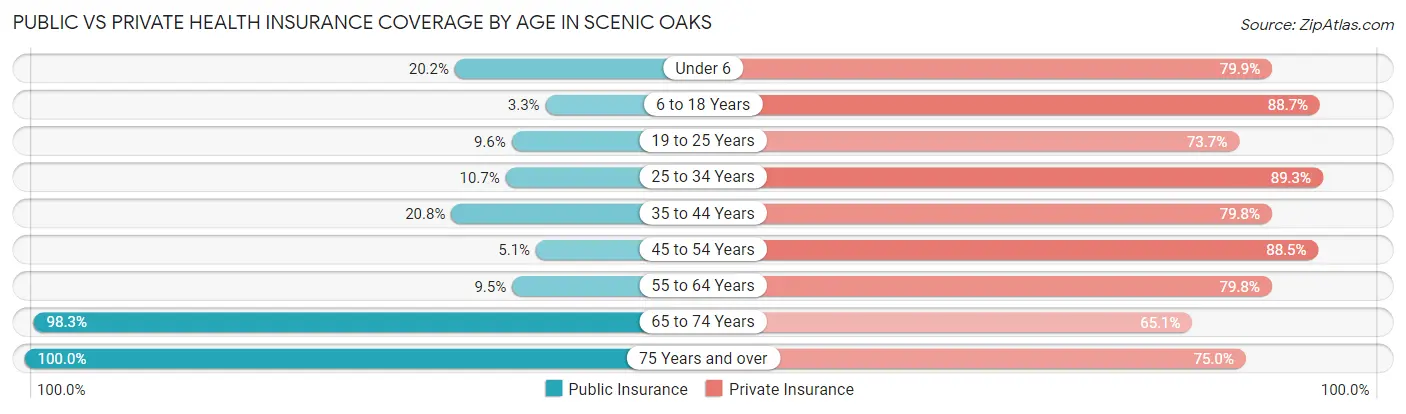
| Age Bracket | Public Insurance | Private Insurance |
| Under 6 | 188 (20.2%) | 745 (79.8%) |
| 6 to 18 Years | 63 (3.3%) | 1,678 (88.7%) |
| 19 to 25 Years | 64 (9.6%) | 491 (73.7%) |
| 25 to 34 Years | 68 (10.7%) | 566 (89.3%) |
| 35 to 44 Years | 333 (20.8%) | 1,277 (79.8%) |
| 45 to 54 Years | 63 (5.1%) | 1,095 (88.4%) |
| 55 to 64 Years | 132 (9.5%) | 1,105 (79.8%) |
| 65 to 74 Years | 937 (98.3%) | 620 (65.1%) |
| 75 Years and over | 759 (100.0%) | 569 (75.0%) |
| Total | 2,607 (25.9%) | 8,146 (81.0%) |
Disability Status by Sex by Age in Scenic Oaks
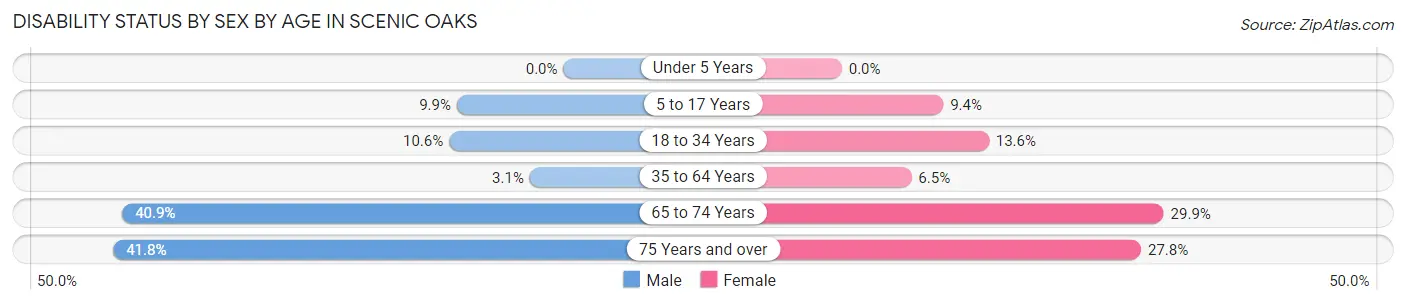
| Age Bracket | Male | Female |
| Under 5 Years | 0 (0.0%) | 0 (0.0%) |
| 5 to 17 Years | 82 (9.9%) | 99 (9.4%) |
| 18 to 34 Years | 68 (10.6%) | 121 (13.6%) |
| 35 to 64 Years | 67 (3.1%) | 134 (6.5%) |
| 65 to 74 Years | 201 (40.9%) | 138 (29.9%) |
| 75 Years and over | 132 (41.8%) | 123 (27.8%) |
Disability Class by Sex by Age in Scenic Oaks
Disability Class: Hearing Difficulty
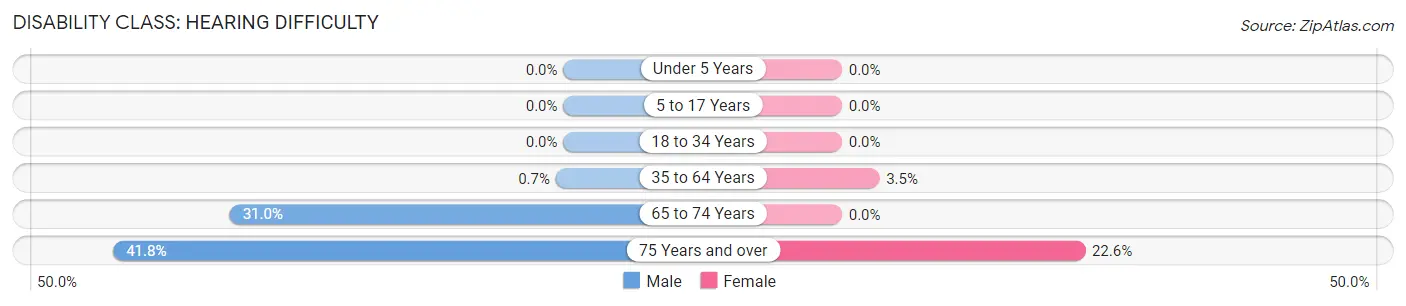
| Age Bracket | Male | Female |
| Under 5 Years | 0 (0.0%) | 0 (0.0%) |
| 5 to 17 Years | 0 (0.0%) | 0 (0.0%) |
| 18 to 34 Years | 0 (0.0%) | 0 (0.0%) |
| 35 to 64 Years | 15 (0.7%) | 72 (3.5%) |
| 65 to 74 Years | 152 (31.0%) | 0 (0.0%) |
| 75 Years and over | 132 (41.8%) | 100 (22.6%) |
Disability Class: Vision Difficulty
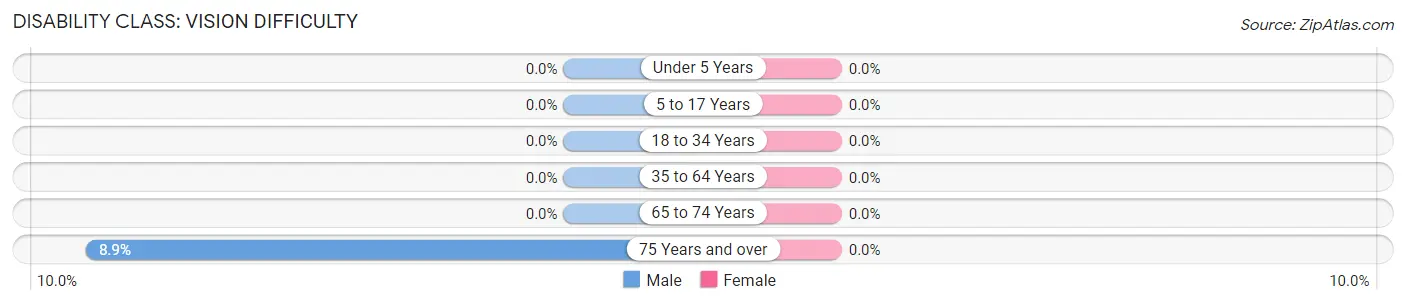
| Age Bracket | Male | Female |
| Under 5 Years | 0 (0.0%) | 0 (0.0%) |
| 5 to 17 Years | 0 (0.0%) | 0 (0.0%) |
| 18 to 34 Years | 0 (0.0%) | 0 (0.0%) |
| 35 to 64 Years | 0 (0.0%) | 0 (0.0%) |
| 65 to 74 Years | 0 (0.0%) | 0 (0.0%) |
| 75 Years and over | 28 (8.9%) | 0 (0.0%) |
Disability Class: Cognitive Difficulty
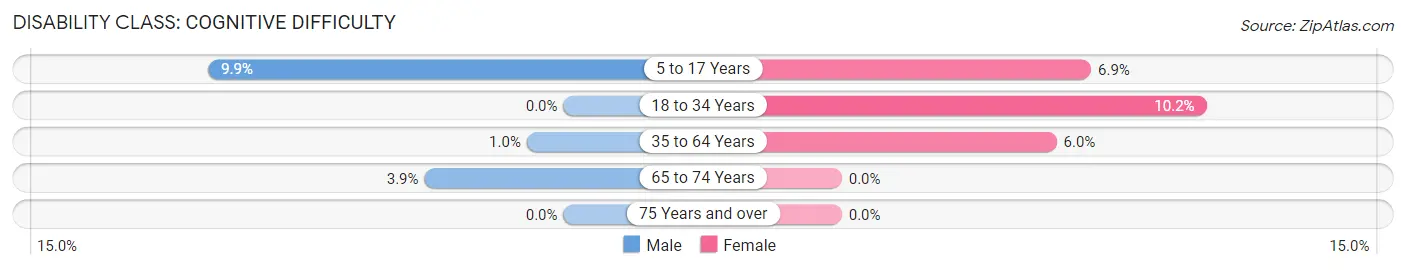
| Age Bracket | Male | Female |
| 5 to 17 Years | 82 (9.9%) | 73 (6.9%) |
| 18 to 34 Years | 0 (0.0%) | 90 (10.2%) |
| 35 to 64 Years | 22 (1.0%) | 124 (6.0%) |
| 65 to 74 Years | 19 (3.9%) | 0 (0.0%) |
| 75 Years and over | 0 (0.0%) | 0 (0.0%) |
Disability Class: Ambulatory Difficulty
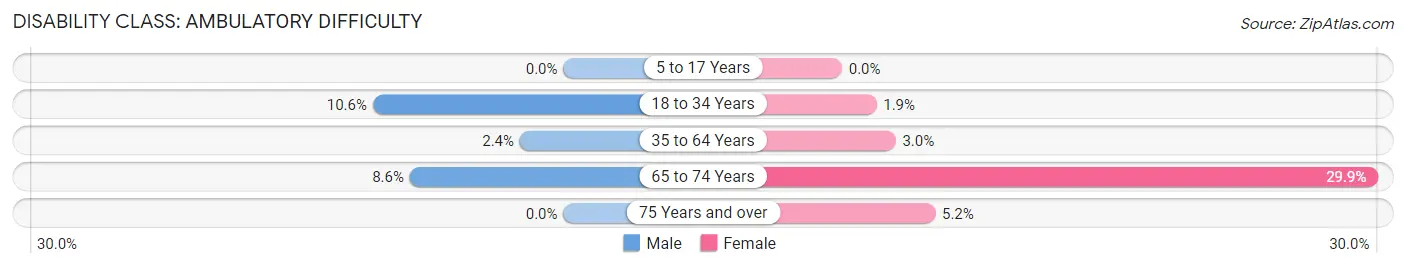
| Age Bracket | Male | Female |
| 5 to 17 Years | 0 (0.0%) | 0 (0.0%) |
| 18 to 34 Years | 68 (10.6%) | 17 (1.9%) |
| 35 to 64 Years | 52 (2.4%) | 62 (3.0%) |
| 65 to 74 Years | 42 (8.6%) | 138 (29.9%) |
| 75 Years and over | 0 (0.0%) | 23 (5.2%) |
Disability Class: Self-Care Difficulty
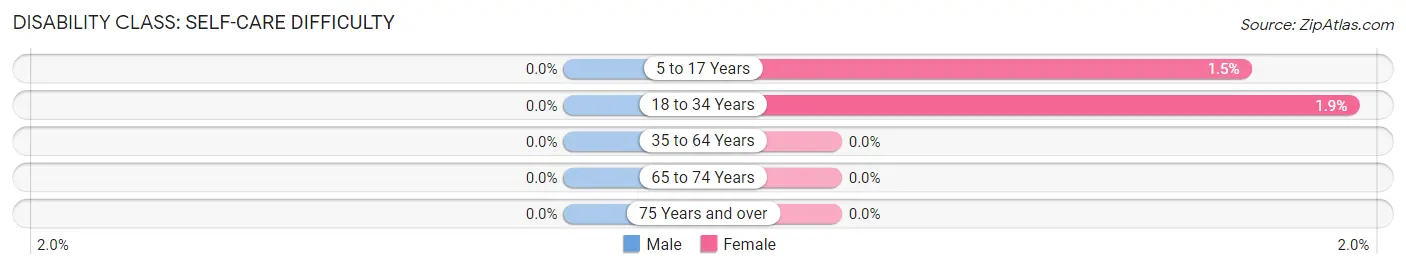
| Age Bracket | Male | Female |
| 5 to 17 Years | 0 (0.0%) | 16 (1.5%) |
| 18 to 34 Years | 0 (0.0%) | 17 (1.9%) |
| 35 to 64 Years | 0 (0.0%) | 0 (0.0%) |
| 65 to 74 Years | 0 (0.0%) | 0 (0.0%) |
| 75 Years and over | 0 (0.0%) | 0 (0.0%) |
Technology Access in Scenic Oaks
Computing Device Access in Scenic Oaks
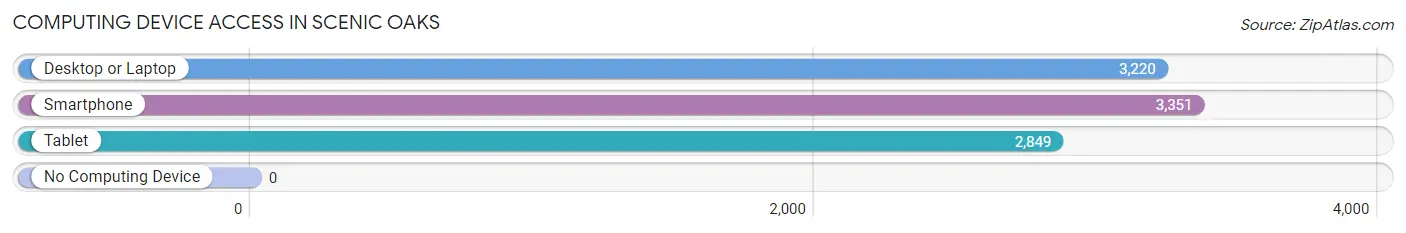
| Device Type | # Households | % Households |
| Desktop or Laptop | 3,220 | 94.0% |
| Smartphone | 3,351 | 97.8% |
| Tablet | 2,849 | 83.1% |
| No Computing Device | 0 | 0.0% |
| Total | 3,427 | 100.0% |
Internet Access in Scenic Oaks
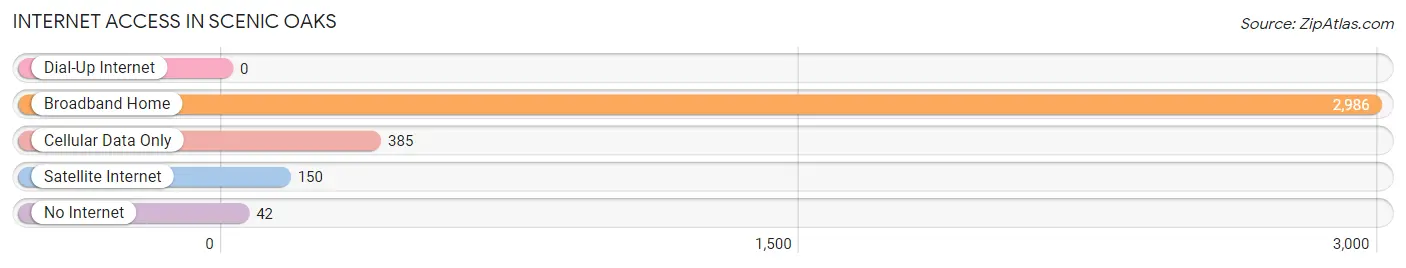
| Internet Type | # Households | % Households |
| Dial-Up Internet | 0 | 0.0% |
| Broadband Home | 2,986 | 87.1% |
| Cellular Data Only | 385 | 11.2% |
| Satellite Internet | 150 | 4.4% |
| No Internet | 42 | 1.2% |
| Total | 3,427 | 100.0% |
Scenic Oaks Summary
Scenic Oaks is a small, unincorporated community located in Bexar County, Texas. It is situated about 20 miles northwest of downtown San Antonio and is part of the San Antonio–New Braunfels metropolitan area. The community is home to a population of approximately 1,000 people, and is known for its rural atmosphere and scenic views.
History
The area that is now Scenic Oaks was first settled in the late 1800s by German immigrants. The community was originally known as “Klein”, which is German for “small”. The name was changed to Scenic Oaks in the early 1900s, when the area was developed as a residential community.
The community was largely agricultural in nature, with many of the residents growing crops such as cotton, corn, and wheat. The area also had a number of small businesses, including a general store, a blacksmith shop, and a post office.
In the 1950s, the area began to experience rapid growth as San Antonio’s population increased. This led to the development of new residential neighborhoods and the construction of a number of new homes.
Geography
Scenic Oaks is located in Bexar County, Texas, about 20 miles northwest of downtown San Antonio. The community is situated in a rural area, surrounded by rolling hills and scenic views. The area is home to a number of creeks and streams, as well as several small lakes.
The climate in Scenic Oaks is generally mild, with temperatures ranging from the mid-50s in the winter to the mid-90s in the summer. The area receives an average of 33 inches of rain per year.
Economy
The economy of Scenic Oaks is largely based on agriculture and tourism. The area is home to a number of small farms, which produce a variety of crops, including cotton, corn, and wheat. The community is also home to a number of small businesses, including restaurants, convenience stores, and gas stations.
The area is also a popular tourist destination, with many visitors coming to enjoy the scenic views and rural atmosphere. The community is home to a number of recreational activities, including fishing, camping, and hiking.
Demographics
As of the 2010 census, the population of Scenic Oaks was 1,000. The racial makeup of the community was 94.2% White, 2.2% Hispanic or Latino, 1.2% African American, 0.8% Asian, and 1.6% other.
The median household income in Scenic Oaks was $50,000, and the median home value was $150,000. The median age of the population was 37.5 years. The majority of the population (90.2%) was married, and the majority of households (76.2%) owned their own homes.
Conclusion
Scenic Oaks is a small, unincorporated community located in Bexar County, Texas. It is situated about 20 miles northwest of downtown San Antonio and is part of the San Antonio–New Braunfels metropolitan area. The community is home to a population of approximately 1,000 people, and is known for its rural atmosphere and scenic views. The economy of Scenic Oaks is largely based on agriculture and tourism, and the area is a popular tourist destination. The population of Scenic Oaks is predominantly White, with a median household income of $50,000 and a median home value of $150,000.
Common Questions
What is Per Capita Income in Scenic Oaks?
Per Capita income in Scenic Oaks is $62,288.
What is the Median Family Income in Scenic Oaks?
Median Family Income in Scenic Oaks is $189,649.
What is the Median Household income in Scenic Oaks?
Median Household Income in Scenic Oaks is $182,063.
What is Income or Wage Gap in Scenic Oaks?
Income or Wage Gap in Scenic Oaks is 64.2%.
Women in Scenic Oaks earn 35.8 cents for every dollar earned by a man.
What is Inequality or Gini Index in Scenic Oaks?
Inequality or Gini Index in Scenic Oaks is 0.36.
What is the Total Population of Scenic Oaks?
Total Population of Scenic Oaks is 10,059.
What is the Total Male Population of Scenic Oaks?
Total Male Population of Scenic Oaks is 4,652.
What is the Total Female Population of Scenic Oaks?
Total Female Population of Scenic Oaks is 5,407.
What is the Ratio of Males per 100 Females in Scenic Oaks?
There are 86.04 Males per 100 Females in Scenic Oaks.
What is the Ratio of Females per 100 Males in Scenic Oaks?
There are 116.23 Females per 100 Males in Scenic Oaks.
What is the Median Population Age in Scenic Oaks?
Median Population Age in Scenic Oaks is 40.5 Years.
What is the Average Family Size in Scenic Oaks
Average Family Size in Scenic Oaks is 3.1 People.
What is the Average Household Size in Scenic Oaks
Average Household Size in Scenic Oaks is 2.9 People.
How Large is the Labor Force in Scenic Oaks?
There are 4,540 People in the Labor Forcein in Scenic Oaks.
What is the Percentage of People in the Labor Force in Scenic Oaks?
59.1% of People are in the Labor Force in Scenic Oaks.
What is the Unemployment Rate in Scenic Oaks?
Unemployment Rate in Scenic Oaks is 3.0%.